Making Markets Work for the Poor: Market-based Approaches to Poverty Alleviation as Institutional...
345
Making Markets Work for the Poor: Market-Based Approaches to Poverty Alleviation as Institutional Leveraging and Redistribution of Social Control Kevin McKague A dissertation submitted to the Faculty of Graduate Studies in partial fulfillment of the requirements for the degree of Doctor of Philosophy Graduate Program in Business Administration Schulich School of Business York University Toronto, Ontario, Canada
Transcript of Making Markets Work for the Poor: Market-based Approaches to Poverty Alleviation as Institutional...

Making Markets Work for the Poor:
Market-Based Approaches to Poverty Alleviation as
Institutional Leveraging and Redistribution of Social Control
Kevin McKague
A dissertation submitted to the Faculty of Graduate Studies
in partial fulfillment of the requirements for the degree of
Doctor of Philosophy
Graduate Program in Business AdministrationSchulich School of Business
York UniversityToronto, Ontario, Canada

September 28, 2012
© Kevin McKague, 2012
1
Abstract
Interest in market-based approaches to reduce poverty has grown
substantially in the last decade. To date, however, explanations
in the management literature of how this can be achieved have
focused on viewing the poor as consumers at the base of the
economic pyramid, as microentrepreneurs in need of microfinance
loans, and as potential employees of local small and medium-sized
enterprises. Missing from the core of the management conversation
has been an adequate understanding of the poor as primary
producers and an explanation that situates them within their
broader market and institutional context. Drawing on an in-depth
study of market-based poverty alleviation initiatives for
smallholder farmers by a non-governmental organization in a least
developed economy, this dissertation offers the first theoretical
model to explain the process by which a non-state organization
can strategically enhance market practices in ways that reduce
poverty for poor producers and improve overall market
functioning. Findings suggest that meaningful improvements in
income can be explained by the enhancement of market practices
that redistribute social control toward poor producers in ways that
i
reduce market and government failures. In addition, data revealed
that the effectiveness of market development and poverty
alleviation strategies is moderated by the extent of institutional
leveraging to incentivize market changes in alignment with existing
norms and logics. The model offers an integrated explanation of
how market-based approaches can alleviate poverty and grow
inclusive markets for poor producers. Findings suggest a number
of business implications, including the importance of rebalancing
power relations and enhancing productivity throughout an entire
value chain. In addition, findings contribute to the literatures
on business and poverty alleviation and the literatures on
institutional change.
Epigraphs
“Market society has produced more income, wealth, goods, andservices than any other form of human social organization.”
Neil Fligstein, The Architecture of Markets
ii

“Markets can enable people to lift themselves out of poverty andtransform their lives, but in too many cases the concentration ofpower within markets prevents the benefits of growth from everreaching poor people. Redistributing power in markets at alllevels is essential to making growth work for poor people.”
Duncan Green, From Poverty to Power
“All it would take to eradicate poverty is a 1.3 percent shift inthe global income distribution.”
Aneel Karnani, Fighting Poverty Together
iii

Dedication
To my beloved wife
Rebecca Langstaff
I dedicate this dissertation
To whom much is owed
And to Isaac, Miriam and Bernadette
Their world
iv
Acknowledgements
Many people have made important contributions to bringing
this study and my PhD education to completion. I would first like
to thank my dissertation committee chair, Christine Oliver, for
her intellectual horsepower, mental energy and attention to
detail that she selflessly brought to this research project as
well as her unwavering support for my scholarly and personal
development. I would also like to thank my committee members:
Chris Bell for his enthusiasm and engagement in a promising line
of non-traditional research, and Dirk Matten for his collegial
guidance and feedback attuned to navigating the business of
scholarship in the field of global social issues in management.
Thanks to David Wheeler for creating innumerable
opportunities to pursue common interests together in social and
sustainable enterprise and development with leading researchers,
practitioners and collaborators from Africa, Asia, Latin America,
Europe and North America. Thanks also to Farouk Jiwa for his
skill in connecting people and opportunities and for a tireless
v

commitment to excellence and innovation in market-based
approaches to poverty alleviation. At CARE I would like to thank
Muhammad Siddiquee, Christian Pennotti, Toufique Ahmed, Nick
Southern, Christine Svarer, and Asif Ahmed for their intellectual
curiosity and openness to research collaboration.
The iterative feedback and ongoing support of Schulich
faculty and PhD colleagues helped this research to take shape as
did feedback and encouragement from Samer Abdelnour, Moriah
Meyskens, Lisa Jones-Christensen and Courtenay Sprague. My
dissertation would not have achieved its final form without the
design of the diagrams, editing and formatting by Rebecca
Langstaff as well as the copyediting assistance of Stephanie
Halldorson and Johanna Skelly. The art and rigor with which
Heather Krause applied her deep knowledge of statistical analysis
was invaluable in gleaning insights and answers from the
quantitative data. Financial assistance from the Social Sciences
and Humanities Research Council of Canada, the Ontario Government
and the Schulich School of Business is also gratefully
acknowledged.
vi

I would like to thank my parents for their inspiration,
openness, curiosity and love of the world which has made this
journey possible and enjoyable. And in Bangladesh, I am grateful
for the hundreds of farmers and interviewees from numerous
organizations throughout the dairy sector that generously gave
their time and insights to contribute to this study.
Member of the Jungle Khamar Dairy Producer Group and hisdaughter,
Jungle Khamar, Ullahpara, Sirajganj, Bangladesh
vii

Table of Contents
INTRODUCTION.........................................................1
Research Question and Knowledge Gap.................................2
The Poor as Producers...............................................3
LITERATURE REVIEW....................................................7
Business Approaches to Poverty Alleviation..........................7
Institutional Theory...............................................11
Institutional Change...............................................14
Varieties of Capitalism and Business Systems.......................16
Markets as Institutions............................................18
The Market in Economic Theory......................................19
Market Enhancement in Low-Income Economies.........................22
Views of Market Coordination.......................................24
Ethical Rationale for Poverty Alleviation..........................25
METHOD OF THEORY CONSTRUCTION.......................................28
Theory and Theorizing..............................................28
Qualitative Research Design........................................31Grounded Theory Method..................................................32Case Study..............................................................33Case Selection..........................................................33Single Case Design......................................................36
Empirical Setting..................................................36Bangladesh as a Least Developed Country.................................36Bangladeshi Dairy Sector................................................37Enhancing Market Practices Through a Market-Based Approach..............39
viii
Data Collection....................................................40Interviews..............................................................41Documents...............................................................42Observation.............................................................42Quantitative Data.......................................................44
Qualitative Data Analysis..........................................44Iteration...............................................................44Triangulation...........................................................45Coding..................................................................46Memoing.................................................................48Emergence of Constructs, Relationships and Theory.......................49Closure.................................................................49
Ethical Procedures.................................................49
Validity and Trustworthiness.......................................49
Quantitative Data Analysis.........................................52
FINDINGS............................................................54
How Might Success in Reducing Poverty for Poor Producers Be Explained?.........................................................54
Elements of Social Control.........................................57
Market Practice Enhancements.......................................59Collective Action.......................................................59Participation...........................................................60Capability Enhancement..................................................62Access to Inputs........................................................64Access to Markets.......................................................66Transaction Transparency................................................68
Market Structure Changes...........................................70Increased Productivity..................................................70Restructured Power......................................................71Reduced Information Asymmetries.........................................71Reduced Risk............................................................72
Reduction of Market and Government Failures........................73Market Failures.........................................................73Government Failures.....................................................75
ix

Institutional Leveraging...........................................77Provision of Evidence...................................................80Contextualization of Production Knowledge...............................82Legitimation of Transactions............................................84Expansion of Relationships..............................................87
Learning Strategies of Market Development and Institutionalization.89Needs Assessment........................................................89Performance Measurement.................................................90Continuous Impact Evaluation............................................90
DISCUSSION..........................................................92
Management Implications............................................92
Business Motivations for Inclusion of the Poor in Value Chains.....94
Potential Drawbacks to Market Enhancement..........................95
Theoretical Implications for Market-Based Approaches to Poverty Alleviation........................................................96
Theoretical Implications for Institutional and Market Perspectives105
Limitations.......................................................111
Future Research...................................................112
CONCLUSION.........................................................115
REFERENCES.........................................................117
APPENDICES.........................................................139
APPENDIX A: Bangladesh Dairy Value Chain..........................140
APPENDIX B: Geographic Study Area.................................141
APPENDIX C: Formal Sector Milk Processors.........................143
APPENDIX D: Qualitative Data Sources..............................145
x
APPENDIX E: Quantitative Data Sources.............................148
APPENDIX F: Baseline Survey.......................................192
APPENDIX G: Impact Indicators.....................................196
APPENDIX H: Milk Income and Gender................................197
APPENDIX I: Group Savings.........................................198
APPENDIX J: Milk Income and Knowledge.............................199
APPENDIX K: Milk Income and Access To Inputs......................200
APPENDIX L: Milk Income and Access To Markets.....................201
APPENDIX M: Evidence of Institutional Leveraging..................202
APPENDIX N: Performance Measurement...............................204
xi

INTRODUCTION
Markets and organizations are social innovations that have
created unprecedented wealth where the practices underpinning
them have taken root. As Fligstein (2001: 3) has noted, “Market
society has produced more income, wealth, goods, and services
than any other form of human social organization.” However, the
benefits of markets and wealth creation are not evenly
distributed, many have been left out, and calls for more
inclusive markets and business models are on the rise (Bruton,
2010; Pearce, 2005; Porter & Kramer, 2011; World Economic Forum,
2009). The typical path of market development has been for
functional nation-states to combine market forces with effective
government policy to coordinate the creation and distribution of
value (Hall, 2010). But what of contexts where markets fail and
states are unable to coordinate inclusive market development,
such as in rural areas of least developed economies where poverty
is most acute? In his book The Bottom Billion, Paul Collier (2007)
separates the world’s poor into those who are fortunate enough to
live in countries that respond to traditional approaches to
market development and the reduction of poverty and those who
1

live in countries where such approaches have failed. Despite
enormous investment to reduce global poverty in recent decades,
the number of people living on under $2 per day has increased in
every region of the world except China in the last 30 years, and
currently stands at 2.6 billion or 38 percent of the world’s
population (Karnani, 2011). Poverty severely constrains people’s
ability to afford basic human needs, participate effectively in
society and pursue a life that they value (Sen, 1999). Seventy
percent of the world’s poor live in rural areas where subsistence
methods of agricultural production and exchange persist, with
limited connections to larger national or global economies
despite the increasing price of, and demand for, food (Chen,
Ravallion & Sangraula, 2007; IFAD, 2011). Smallholder farming and
other primary production activities are by far the most prevalent
sources of income for working-age individuals earning under $2
per day, as illustrated in Figure 1.
Figure 1: Primary Occupation of the World’s Poor
2

Source: Adapted from the Bill and Melinda Gates Foundation, Financial Services for the Poor Strategy Overview, November 2010, based on data from the United Nations andthe World Bank.
Research Question and Knowledge Gap
To allow the power of markets to create wealth and reduce
poverty in bottom billion economies, market practices need to be
introduced and institutionalized, even in the absence of
government willingness or ability to do so. Surprisingly, given
studies on poor producers in development studies and
anthropology, little attention in the management literature has
been paid to how non-state organizations contribute to market
development and poverty alleviation in least developed country
contexts among poor producers. Weak states, characterized by
3

institutional voids, lack of support for market institutions,
market failures and widespread poverty are characteristic of
least-developed countries where poverty alleviation is most
challenging (Mair & Marti, 2009; Khanna & Palepu, 2005). Thus, my
research question: How is an organization able to enhance market
practices to make markets work for poor primary producers in
least developed countries?
The Poor as Producers
By poor producers, I mean individuals with incomes under $2
per day engaged in the “primary sector” (Fisher, 1939) of the
economy who make direct use of natural resources including land
for agricultural production of livestock and crops. National
economies can be divided into sectors roughly corresponding to
their relative distance from raw materials, with the primary
sector directly engaged in farming, fishing, herding and other
primary production activities, the secondary sector comprised of
manufacturing, processing and the creation of finished goods and
the tertiary sector consisting of services. Very few individuals
are categorized as primary producers in developed economies
4
whereas in least developed countries primary producers often
account for the majority of the population. Poor primary
producers include the 610 million smallholder farmers and 80
million fishermen and pastoralists who collectively comprise the
largest segment of the working age population earning under $2
per day (see Figure 1). Importantly, I believe that a close
empirical analysis of the poor as producers might provide answers
to some of the challenging problems of strategic implementation
that business, non-governmental organizations (NGOs) and other
organizations encounter in attempting to succeed by doing
business with the poor in low income economies.
Although a handful of studies on poor producers from a
market-based perspective are beginning to emerge, few have
studied the phenomena in depth from a theoretical perspective.
Ramachandran, Pant and Pani (2012: 50) produced a typology of
three substantive outcomes – access to market, access to
organization and access to ecosystem – which they found important
for the relationship between low-income handloom artisans and a
major retailing organization in India, but called for more
research on “how the value generated from such economic exchanges
5

is shared.” London, Anupindi and Sheth (2010) identified a model
of constraints to value creation and capture faced by poor
producers and the ventures that aim to serve them. The stream of
literature on subsistence marketplaces has also made important
contributions to understanding “individual, communal, and
cultural factors that influence consumers and entrepreneurs who
live at or near subsistence,” adding insights on consumer
literacy, entrepreneurial literacy and buyer and seller behavior
at the micro-level of economic transactions (Viswanathan & Rosa,
2010: 535). Karnani (2011), in addition to his primary focus on
the provision of employment to reduce poverty, has recognized the
importance of making markets more efficient for poor producers.
Peredo and Chrisman (2006) identify determinants, characteristics
and consequences of community-based enterprise. However, none of
these studies offer a broader explanatory model of the mechanisms
by which market interventions by an organization lead to the
reduction of poverty for poor producers.
Outside the management discipline, the literature on rural
development has described market-oriented poverty alleviation
initiatives by NGOs and other organizations through an inclusive
6

or pro-poor value chain approach (Altenburg, 2007; Humphrey &
Navas-Alemán, 2010; Munir, Ansari & Gregg, 2010). This value
chain approach provides guidance for “understanding how poor
people in rural areas of developing countries can engage, or
improve their terms of engagement with, domestic, regional or
international trade” (Mitchell, Keane & Coles, 2009: iv). This
approach has its roots in Porter’s (1985) emphasis on the
importance of understanding how value is created and distributed
at each step of a product’s transformation and exchange both
inside and outside a firm. A related stream of research on fair
trade has similarly focused on equitable social and economic
relations between developed country consumers and developing
country producers (Moore, 2004; Reynolds, 2000). A value chain
approach focusing on improving market opportunities and practices
for poor producers has been increasingly adopted by multilateral
organizations such as FAO (2012), ILO (Herr & Muzira, 2009) and
UNIDO (2011), major donors such as the Bill and Melinda Gates
Foundation, USAID (2012), DFID (2008), and IDRC (Kaplinsky &
Morris, 2001), and companies such as Unilever (Clay, 2005),
SABMiller (2011) and SC Johnson. The structure and enhancement of
7

a value chain for agricultural products, for example, determine
how value is created and distributed at each point in the chain.
As a result of its practical orientation, much of the literature
on the inclusive and pro-poor value chain approach to poverty
alleviation focuses less on overarching theory and more on
guidance for field workers (Kaplinsky & Morris, 2001; McVay &
Snelgrove, 2008), typologies of strategies for value chain
upgrading (Kaplinsky & Morris, 2001; Mitchell, Keane & Coles,
2009), or evaluations of existing value chain interventions
(Mitchell & Coles, 2011) and remains a field where further theory
development would be welcomed (Altenburg, 2007). My contribution
in this direction is a theoretical explanation of market
enhancement with particular attention to the uneven power
relationships embedded in value chains and the role of a focal
organization as a catalyst for increasing the power of poor
producers. I also seek to add new insight to our understanding of
institutional change by examining how institutional change may be
effected in a resource-constrained environment in ways not
explained by the current institutional literature (DiMaggio and
Powell, 1991; Greenwood, Oliver, Sahlin & Suddaby, 2008; Scott,
8

2008). In particular, I am interested in shining light on one of
the central questions of institutional change, namely the
“paradox of embedded agency” (Battilana, Leca and Boxenbaum,
2009) which asks how it is possible for actors to change the
institutional contexts within which they are constrained and
conditioned (Seo & Creed, 2002).
My work seeks to address these gaps in our understanding of
how market initiatives – at the level of execution – lead to
durable increases in income among poor producers in least
developed country contexts. I examine this gap through the in-
depth study of an NGO, CARE Bangladesh, which has succeeded in
improving the incomes of subsistence-level farmers in the
Bangladeshi dairy sector. CARE has been working in Bangladesh
since 1955 on improving the lives of the extreme poor and
marginalized and currently serves over one million beneficiaries
in the country annually. I chose an NGO as a suitable and
appropriate organization for this study because the innovations
of market-based NGOs have been successfully adopted by for-profit
companies as well as hybrid social purpose businesses and other
NGOs (Chesbrough, Ahern, Finn & Guerraz, 2006; Mendoza and
9
Thelen, 2008; Teegen, Doh, & Vachani, 2004). To anticipate the
results, I found that poverty alleviation for poor producers can
be explained by the redistribution of social control towards the poor in
ways that overcome market and government failures. I argue that
the effectiveness of enhanced market practices is moderated by
the extent of institutional leveraging which positions changes in
market practices relative to existing norms and institutions.
10
LITERATURE REVIEW
In this section I review the literatures relevant to the
interpretation of my results. Reviewed are the literatures on
business and poverty alleviation, institutional theory and
markets as social and economic phenomena. This section concludes
with a discussion of philosophical views of the role of market
coordination in society and the ethical rationale for poverty
alleviation.
Business Approaches to Poverty Alleviation
In the last ten years, the question of how organizations can
contribute to poverty reduction through market-based approaches
has been increasingly explored by management practitioners and
researchers. As a result, diverse streams of enquiry have emerged
exploring different aspects of the phenomena at different levels
of analysis with different focal organizations. This work has
included studies of subsistence marketplaces (Rosa & Viswanathan,
2007; Sridharan & Viswanathan, 2008; Viswanathan & Rosa, 2010),
cross-sector partnerships for poverty alleviation (Rivera-Santos,
11

Rufin & Kolk, 2012; Dahan et al., 2010; London & Anupindi, 2011;
Oetzel & Doh, 2009; Brugman & Prahalad, 2007; Perez-Aleman &
Sandilands, 2008; Kolk, van Tulder & Kostwinder, 2008),
community-based enterprise (Peredo & Chrisman, 2006), social
entrepreneurship focused on poverty alleviation (Seelos & Mair,
2005; Robinson, Mair & Hockerts, 2009), social business (Yunus,
2007; Humberg, 2011), sustainable local enterprise networks
(Wheeler, et al., 2005), inclusive markets (Mendoza & Thelen,
2008) and inclusive business models (Gradl, C. & Knobloch, 2010;
Gradl, Krämer & Amadigi, 2010; Jackman and Breeze, 2010). In
addition to, and substantially overlapping with, these streams of
enquiry, three main approaches have been the most prominent in
the current management conversation on business and poverty
alleviation: the base-of-the-pyramid (BoP) approach, the
microfinance approach and the small and medium sized enterprise
(SME) employment approach.
The base (or bottom) of the pyramid approach popularized the
conversation on business and development into the management
literature by offering a business case for multinationals to view
the poor as an untapped and potentially profitable market
12
opportunity (Prahalad & Hart, 2002; Prahalad, 2005). The core
logic of the base-of-the-pyramid approach is that poverty can be
reduced by companies profitably selling goods and services to the
poor in ways that are more affordable and accessible than
alternative market offerings. Subsequent research has been
conducted on the capabilities, partnerships and business
processes needed to establish new ventures in low-income markets
(Hart, 2010; London & Hart, 2004, 2010). However, recent work to
understand the causes of a number of failed ventures at the base-
of-the-pyramid suggests that more explicit research is needed to
understand the broader nature of market creation and the
relationship between market practices and poverty alleviation
(Simanis, 2010; Simanis & Hart, 2009). Calls have been made from
within this research stream for greater attention to viewing the
poor as producers given the existing focus on the poor as
consumers (London, Anupindi & Sheth, 2010; Ramachandran, Pant &
Pani, 2012). The base-of-the-pyramid literature has also been
criticized for its underlying libertarian ideology and utopian
optimism that large multinationals should play the leading role
in global poverty reduction (Karnani, 2011). Claims that it
13
romanticizes the poor (Banerjee and Duflo, 2007; Karnani, 2009),
marketizes social welfare at the expense of governments and civil
society organizations (Kamal, Ansari & Gregg, 2010) and generates
non-essential consumer needs rather than genuinely serving
essential needs (Davidson, 2009) have led to concerns that if
unchecked, base-of-the-pyramid strategies may be exploitative and
harmful to the poor (Karnani, 2007). These concerns have led to
searches for alternative approaches.
Microfinance has also become a prominent feature of the
management conversation about poverty alleviation and one of the
most readily cited examples of a market-based approach to
development. Microfinance is now undertaken by numerous NGOs and
commercial financial organizations world-wide, serving over 150
million clients (Roodman, 2012). The logic of microfinance
proposes that the provision of small loans to poor individuals
overcomes capital constraints and allows people to start or grow
a microenterprise business that will allow them to work their way
out of poverty (Yunus, 2003; Robinson, 2001). This logic is
focused on reducing particular market failures – missing credit
markets, the lack of information that lenders may possess about
14

borrowers, the high transaction costs of small loans – and
addressing these with a group-lending approach where loans are
guaranteed by social capital and group joint liability rather
than physical collateral. However, as the microfinance industry
has matured and more rigorous randomized controlled studies have
attempted to concretely establish a link between microfinance
provision and poverty reduction, a more mixed picture has begun
to emerge (Banerjee and Duflo, 2011). Most microfinance loans are
taken for purposes of consumption, rather than growing a
business, and most microenterprise businesses run by the poor
lack the differentiation, economies of scale and capacity to
provide a reliable route above the poverty line (Bateman, 2011).
If microfinance is based on a model of entrepreneurship, it may
be limited in its ability to create scale and reduce poverty for
poor producers with low entrepreneurial capacity, market
information or ability to assume significant additional risks.
The third prominent explanation in the management literature
of how organizations can reduce poverty through a market-based
approach focuses on reducing poverty through employment by local
SMEs (Karnani, 2011). The logic of this approach suggests that
15

poverty can best be reduced by SMEs if they can create employment
opportunities for low-skilled, low-income workers, especially in
least developed countries, because local SMEs are more labor-
intensive, less capital-intensive, more flexible and more
geographically dispersed within a country than large businesses
(Karnani, 2011). At the same time, local SMEs are more productive
and competitive than microenterprises. Aneel Karnani has written
extensively on this approach and has frequently emphasized the
importance of viewing the poor as producers, primarily, but not
exclusively, in order to contrast reducing poverty through SME
employment with other approaches focused on selling goods to the
poor. Karnani most commonly equates being a producer with being a
potential employee, arguing that productive employment is the
solution to poverty reduction. And the best way to create
employment opportunities for the poor, he argues, is through
local SMEs. However, this approach tends to assume that
governments will take up their responsibilities to create a
business-enabling environment for SMEs and work to counteract
market failures and enforce necessary regulations. Unfortunately,
this may be unlikely in many least developed countries where
16
poverty is most severe and where the majority of people living on
under $2 per day are likely to be smallholder farmers.
Taken together, the dominant managerial approaches to
poverty reduction in least- developed countries – the base-of-
the-pyramid approach, microfinance, and the SME employment
approach – primarily emphasize the role of the poor as consumers,
microentrepreneurs, and employees, respectively. Notwithstanding
considerable research in related work on development among the
poor (Bebbington, 1999; Chambers, 1983; Nussbaum, 2011; Scoones,
1998), what is missing from the center of the management
conversation is a model that explains how poverty can be
alleviated for the poor as producers by an organization adopting
a comprehensive market-based approach.
Institutional Theory
Institutional theory has been immensely valuable in
conceptualizing markets and market practices as institutions. In
the context of a least developed country where patterns of
production and exchange are often shaped by social forces such as
tradition, informal rules, and social expectations as well as
17
economic incentives, institutional theory offers helpful insights
into the process of market creation and enhancement.
The origins of new institutional theory in management
studies date from the 1970s. By the mid-1970s, by far the
dominant account of social and organizational behavior in the
management literature was one where rational actors in full
control of their actions strategically and freely chose the most
efficient means to meet instrumental organizational objectives
(Scott, 2008). Then, in the late 1970s and early 1980s, Meyer and
Rowan (1977), Zucker (1977), DiMaggio and Powell (1983) and Meyer
and Scott (1983) successfully introduced an institutional
approach into management theory as a challenge to the dominant
rational agency view.
Institutional theory recognizes the various layers of
meaning and logics that individuals and organizations are
embedded in and draw upon and which shape interests, motivations,
strategies, identities and assumptions about markets and market
practices (Scott, 2008). When market practices and market changes
are seen through an institutional lens, the way in which they
derive their legitimacy is highlighted (Barley & Tolbert 1997;
18
Jepperson & Meyer 1991). Institutions in this sense are not types
of organizations (schools, businesses, hospitals) nor broad
social categories (families, religion, the state) but are the
“more-or-less taken-for-granted repetitive social behavior that
is underpinned by normative systems and cognitive understandings
that give meaning to social exchange and thus enable self-
reproducing social order” (Greenwood, Oliver, Sahlin & Suddaby,
2008: 5). Metaphors and images of institutions include logics,
rule systems, social structures, frameworks, orders, patterns and
templates for action. An institution denotes the logics or rule
systems themselves and institutionalization is the process by
which the logics or rules become established and more or less
taken-for-granted (Jepperson, 1991).
From an institutional perspective, behaviors and practices
have both practical and symbolic content. Activities such as
group meetings, certifications, branding, financial accounts, and
contracts involve both real social relationships, through which
instrumental economic ends are accomplished, as well as a
dimension of symbolism and meaning beyond their instrumental
value (Friedland and Alford, 1991). Relationships and symbolic
19

meanings are mutually constituted as illustrated in Fligstein’s
(2001: 48) definition of institutions as the “rules and shared
meanings… that define social relationships.”
Scott’s (2008: 48) integration of the institutional
literature in organization studies produced his often cited
distinction that institutions are comprised of “regulative,
normative and cultural-cognitive elements that, together with
associated activities and resources, provide stability and
meaning to social life.” Institutions can exist at multiple
levels (individual, group, organization, institutional field,
market, society) and their scope can be narrow (covering the
activities of an individual or group) or broad (covering large
portions of a national or global population) (Barley, 2008;
Greenwood, Oliver, Sahlin & Suddaby, 2008). Within institutional
approaches to explaining behavior, various accounts give
differing emphases on different levels of analyses (from micro to
macro), the importance of regulative, normative and cultural-
cognitive elements of institutions, and the accommodation of
individual agency (DiMaggio & Powell, 1991; Scott, 2008).
20

Institutional practices and behaviors can also vary in their
level of institutionalization. The more an activity is
institutionalized, the greater it takes on rule-like status
(Meyer & Rowan, 1977), the more objective and exterior it is seen
to be (Zucker, 1977), the greater the depth and spread of its
acceptance across space and over time (Barley & Tolbert, 1997)
with the greater chance it will be perpetuated, reproduced and
sustained through taken-for-granted activities whose social
origin is ignored (Jepperson, 1991). Taken-for-granted
institutions are perceived to have no appropriate alternatives
(DiMaggio & Powell, 1991) and have widely shared rationales or
explanations that account for them as functional fixtures of
their environment (Jepperson, 1991). Although in some accounts
institutions have been portrayed as totalizing and monolithic,
more often they are viewed as multiple, fragmented and
overlapping (Friedland and Alford, 1991). These multiple
institutional logics are available for individuals and
organizations to draw upon as bases for action (Friedland &
Alford 1991; Thornton & Ocasio, 2008). Institutions arise, are
maintained, and are challenged through ongoing human interaction
21
(Lawrence & Suddaby, 2006) and are in this sense “collective
enterprises” jointly produced and reproduced through ongoing
action and interaction (Barley, 2008: 496).
In summary, an institutional view of social and economic
phenomena extends beyond reductionist assumptions of rational
actor models and offers a purportedly more nuanced treatment of
individuals, markets and organizations as more than utility-
satisfying production machines (Lawrence, Suddaby & Leca, 2009).
An institutional approach examines how interests, identities and
choices are shaped by social forces in the environment such as
meanings, culture, social rules and beliefs. An institutional
approach highlights the interdependent and mutually constituting
nature of social contexts and individual action (Barley &
Tolbert, 1997; Giddens, 1984).
Within institutional theory are several streams of
literature with potential relevance to market enhancement for
poor producers in a least developed country. These literature
streams on institutional change, varieties of capitalism and
markets as institutions are considered next.
22

Institutional Change
Meyer (2008) argues that the institutional perspective is
much better positioned than other organizational theories to
capture and understand societal changes, such as those associated
with the introduction of new market practices. Greenwood and
Hinings’ (1996) framework for understanding institutional change
considers the processes by which organizations adopt or discard
templates for organizing, but does not focus on how actors change
their institutional context. Similarly, in their study of
professional associations, Greenwood, Suddaby and Hinings (2002)
develop a model of institutional change that focuses on the
stages of change, but not on the work of the actors to change
them. In Barley and Tolbert’s (1997) recursive model of change
based on Giddens (1984) concept of structuration, the authors
acknowledge that actors make conscious choices within the options
offered by their institutional context, but do not elaborate on
how actors identify and carry out the changes they pursue. Seo
and Creed’s (2002) dialectical perspective focuses on how
contradictions within institutional fields open up “reflective
23

shifts” in actor consciousness to motivate change processes, but
does not specify how actors go about achieving them.
Lawrence and Suddaby (2006) introduced the concept of
institutional work to explicitly focus greater theoretical and
empirical attention on how actors create institutions. Lawrence
and Suddaby (2006) define institutional work as “the purposive
action of individuals and organizations aimed at creating,
maintaining and disrupting institutions.” This approach extended
beyond the tendency of institutional entrepreneurship studies to
focus primarily on the creation of new institutions to instead
embrace all aspects of institutional change including how
institutions are disrupted or maintained, as well as created.
Although actors’ embeddedness within the institutionally-defined
logics of their fields is recognized, the emphasis in
institutional work studies is placed on how the practical actions
taken from within their context can change aspects of
institutions around them. In this way, the institutional work
approach “suggests culturally competent actors with strong
practical skills and sensibility who creatively navigate within
their organizational fields” (Lawrence & Suddaby, 2006: 219).
24

The emphasis of the institutional work approach therefore
brings to the fore the actions of organizations and individuals
and positions them within the ongoing recursive interaction
between institutions and action which Seo and Creed (2002: 223)
have called “the mutually constituted nature of structure and
agency.” In this view, institutions are simultaneously sources of
prohibitions and constraint as well as practices which can be
maintained and changed through purposive action (Barley &
Tolbert, 1997; Giddens, 1984). From this perspective,
institutions are not uniform, totalistic, homogeneous and
permanent but are heterogeneous and overlapping, dynamically
competing, conflicting and complementing each other (Friedland &
Alford, 1991).
Although institutional theory has begun to consider the role
of power in various institutional practices and changes, DiMaggio
and Powell (1991: 30) have noted that: “Power and interests have
been slighted topics in organizational analysis.” Where power and
control have been considered more generally, studies often focus
on field-level interventions by powerful central actors (with the
state or professions often playing lead roles) and describe
25

conflicts and competition between institutional practices. Little
work from an institutional perspective has looked at the
processes by which actors work with issues of power or control to
enhance market practices, especially in contexts of market
failure associated with least developed countries.
However, given the promise of the institutional work
approach to contributing to understanding how new market
practices emerge and gain traction, Lawrence, Suddaby and Leca
(2009: 10) emphasize, “relatively little is still known about the
concrete practices employed by actors in relation to
institutions.” Where studies have considered the activities and
work of actors to bring about institutional change and the
adoption of new practices, findings are typically presented in
lists such as Fligstein’s (1997) 15 types of social skills or
Aldrich and Fiol’s (1994) eight entrepreneurial strategies to
promote new industry development. Similarly, Lawrence and Suddaby
(2006) identified 17 forms of institutional work which have
subsequently been reconceptualized into seven categories by
Kraatz (2009) and into three overarching types of institutional
work by Lawrence and Suddaby (2006), with Perkmann and Spicer
26

(2008) proposing modifications. To date, a more theoretical
explanation of how purposive actors change institutions by
introducing new market practices remains underdeveloped. At the
same time, although institutional theory has begun to consider
the role of power in various institutional practices and changes,
very little work from an institutional perspective has applied
issues of power or control to market changes and, more
specifically, in contexts of market failure.
Varieties of Capitalism and Business Systems
Related literatures on varieties of capitalism and business
systems (Hall & Soskice, 2001; Whitley, 1999) also focus on how
organizations adapt to their institutional contexts. However,
whereas institutional theory in organization studies has studied
the diffusion of new practices across organizational fields and
national boundaries, the business systems approach pays special
attention to how the adoption of new practices are influenced by
national institutional frameworks (Tempel & Walgenbach, 2007).
The varieties of capitalism and business systems approach make
comparisons between countries because nation-states play an
27

important formal and informal role in influencing the relative
strength of markets and government coordination within their
borders (Morgan, Campbell, Crouch, Pedersen & Whitley, 2010;
Morgan, Whitley & Moen, 2005). National capitalisms are
structured according to the relative balance of power between
capitalists, workers and governments at the time of entry into
modern industrialization to establish and enforce market
institutions such as property rights, rules of exchange,
governance structures and conceptions of control (Fligstein,
2001). Where organizational institutionalism has traditionally
tended to focus on isomorphism and the convergence of practices
(DiMaggio & Powell, 1983), the business systems approach pays
attention to the continued persistence of differences in
practices across countries (Whitley, 1999). The more the
particular national patterns of economic coordination are closely
integrated with other elements of society, such as educational
systems and social norms, the more that new practices introduced
into that context will be affected and shaped by them (Whitley,
1999). The varieties of capitalism approach also tends to
distinguish between two types of national economic coordination:
28

liberal market economies (such as the United States) and more
coordinated market economies (such as Germany) (Djelic, 1998;
Hall & Soskice, 2001). Most advanced capitalist countries combine
the two to a certain extent; however the particular mix
determines a country’s place on a continuum between the two ideal
types (Hall & Gingerich, 2009). The national business system
approach has been successfully used to explain differences in
corporate social responsibility practices across countries
(Matten & Moon, 2008). However, to date, the business system
approach has tended to focus on developed OECD economies rather
than least developed countries. In addition, some have argued
that the business system approach does not adequately account for
the social and political dimensions of institutional change (Hall
& Thelen, 2009). As Hall and Soskice (2001) indicate, the type of
coordination within a country depends on the institutions within
a country to support them. Where market coordination and
coordination by governments or strong private sector actors are
lacking, such as in least developed country contexts, the task of
initial market coordination may fall to non-state intermediary
actors, an under-explained area in the literature.
29
Markets as Institutions
That markets are socially structured, characterized by
social relationships, and infused with social norms is a starting
point for institutional theory and sociological approaches to
understanding markets (Aspers, 2011; Biggart & Beamish, 2003;
Biggart & Delbridge, 2004; Burt, 1992; Fligstein & Dauter, 2007;
Fourcade, 2007; Granovetter, 1985; Swedberg, 2005; Uzzi, 1997;
Uzzi & Lancaster, 2004). Market norms, practices and
relationships include what and how things are done, the scripts
for price setting, and the rules of exchange, cooperation and
competition (Aspers, 2011). My understanding of markets as
institutions is consistent with Coase’s (1988: 8) definition of a
market as a “social institution which facilitates exchange” and
White’s (2002: xiii) understanding of markets as “interactive
social constructions.” I define markets as “not simply an
allocative mechanism but also an institutionally specific
cultural system for generating and measuring value” (Friedland &
Alford, 1991: 234).
30

With an institutional view, even highly instrumental,
efficiency-focused economic interactions and changes are
“enmeshed in and freighted with” the expectations of social
relationships and pressures (Owen-Smith & Powell, 2008: 603).
From an institutional perspective, it is not possible to fully
understand individual, organizational and market practices
without attention to how they are shaped by social and
institutional forces. An extended quote from Thornton & Ocasio
(2008: 119) with reference to the important work of Fligstein
(1996) further captures the concept of markets as institutions:
While markets are economic structures – they are also institutions. They function because of a set of formal laws and normative expectations about them and these normative expectations have changed through time and space. A market in one historical and cultural context is not the same as a market in another (Fligstein, 1996).
The institutional account of market practices argues that
institutionalized rules and logics become social facts which
shape interests and choices by assigning levels of legitimacy or
appropriateness to various options (Meyer & Rowan, 1977; Zucker,
1977). A widespread and deeply held institutional practice within
31

an area of influence will tend to elicit similar responses
leading to isomorphism or similarity (DiMaggio & Powell, 1983).
The Market in Economic Theory
Modern economic theory usually implicitly assumes the market
to be a price-making and resource-allocating mechanism central to
coordinating production and distribution in society. A frequently
cited economic definition of the market that was prevalent in the
19th century and continues to be referenced today is:
“Economists understand by the term Market, not any particular market place in which things are bought and sold,but the whole region in which buyers and sellers are in suchfree intercourse with one another that the prices of the same goods tend to equality easily and quickly.” Cournot (1838/1927) cited by Marshall (1920/1961) cited by Swedberg (1994: 259).
However, around the end of the nineteenth century,
mainstream economic theory rejected social, historical and more
empirical approaches to understanding markets in favor of the
analytical power that was perceived in the study of abstract
exchange markets that were characterized by having perfect
information and perfect competition (Swedberg, 1994). Although
32
this classic economic view is attractive for its reductionist
simplicity, a more sociological approach to markets cautions that
this elegance comes at too high a cost to adequately explain the
reality of complex market and organizational phenomena as it is
empirically observed and experienced (DiMaggio & Powell, 1991).
Similarly, Aspers (2011) argues that economic theory has been too
reductionist, resulting in a theory that is distorted and focused
on modeling. This explanation may account for observations by a
number of contemporary scholars examining the role of markets in
economic theory. For example, economic historian Douglass North
(1977: 710) has noted a common shortcoming regarding more fully-
developed understandings of the market’s role in the economy and
society, stating “it is a peculiar fact that the literature on
economics… contains so little discussion of the central
institution that underlies neo-classical economics – the market.”
Ronald Coase (1988: 7) has made similar observations, stating
that “Although economists claim to study the market… in modern
economic theory the market itself has an even more shadowy role
than the firm.” Similarly, Biggart and Delbridge (2004: 29) have
observed, “modern economists view the market as a price-setting
33
mechanism and have left its workings implied rather than
explicitly discussed.” Since economics tends to take markets as a
given, it overlooks how market transactions are shaped,
structured and influenced by social and institutional contexts,
norms and expectations. As noted by White (2002: 9): “Because the
market is a tangible social construction opaque to tools familiar
to economists… the market has remained a mystification” from the
perspective of mainstream economics.
Theories of social action, such as those based in economics,
accord explanatory primacy to individuals who are endogenously
motivated by utility-maximizing self-interest. These individuals
make rational choices from a wide range of informed options. This
view leaves unexamined the power of social and institutional
forces in shaping interests, rationality and utility in the first
place. Instead, the motivations for action are assumed to be
universal and ahistorical and aligned with modern economic
society. From the rational economic choice perspective,
unconstrained and unquestioned individual choice is the primary
cause of social arrangements; institutions are merely the sum of
34

individual interactions (DiMaggio & Powell, 1991; Friedland &
Alford, 1991).
Economic theory takes markets as natural phenomena that
emerge spontaneously and order themselves to create equilibrium
as an unintended result of individual self-interest within rules
of law, property and contract (Aspers, 2011). Markets from the
perspective of economic theory are taken for granted “givens”,
(Sarasvathy & Dew, 2005) and therefore a starting point “used to
explain other phenomena rather than considered as objects in need
of explanation” (Aspers, 2011: 40). In this view neither the
state nor organizations participate in the making of markets;
indeed, from the perspective of much economic theory,
intervention by the state or other actors is often seen as
inherently reducing the natural ability of markets to reach
equilibrium.
However, in less developed countries, obstacles to the
“natural” formation of markets have been well documented (Datta-
Chaudhuri, 1990; Stiglitz, 1989) and in developed economies,
market failures resulting in economic recession have led to
greater questioning of the assumptions underlying mainstream
35

economic theory (Stiglitz, 2010). Many national economies exist
with badly distorted productive and distributive efforts
(Heilbroner & Milberg, 2008). So it is unusually striking that
markets – for all of their centrality to the promise and
challenges of current prosperity and future development and their
place at the heart of the discourse on economic development –
remain so relatively under-explained from the view of economics.
This is even more so in a world where social arrangements are
becoming more complex, where economic and ecological crises have
called into question the underlying power of rational choice
market models, where individuals and organizations from
developing and emerging economies with diverse institutional
histories are increasingly playing a role in national and global
markets, and where poverty alleviation through market development
is a high priority for many organizations.
To summarize, although economic perspectives have
contributed important insights to understanding markets, there is
still much to be learned about how they work and how their
functioning is enhanced. I have therefore adopted an
institutional view which is particularly appropriate in
36

understanding markets in the different institutional context of
low-income subsistence marketplaces.
Market Enhancement in Low-Income Economies
The process of market development or market creation refers
to expanding and formalizing a “nascent” but potentially viable
market by institutionalizing market practices. “Nascent markets
constitute unstructured settings with extreme ambiguity…ambiguity
arises from unknown cause-effect relations and lack of recurrent,
institutionalized patterns of relations and actions” (Santos &
Eisenhardt, 2009: 644). Institutionalized beliefs about what is a
viable market define the meaning of acceptable economic exchange
and dictate the extent to which local actors will even entertain
the possibility of market transaction (Oliver, 1996). I share
Biggart and Beamish’s (2003: 448) assumption that
“‘institutionalized’ understandings and arrangements facilitate
economic action by providing agreed-upon, often tacit, ways of
conducting business” and that markets tend to be socially
constructed by those most influenced by and engaged in them.
37
Essential prerequisites for market order are rules governing
what to do and what not to do in the market, encompassing the
beliefs, norms, culture and appropriate practices relating to
production, competition and exchange (Aspers, 2011). Objects of
trade and the rules for exchange of property rights must be
morally legitimate. Market exchange must be voluntary, with
actors getting something in return for that which they give up. A
viable market is one that possesses a product (or service),
demand for and supply of that product and the potential for
efficient exchange. Markets need institutions to enhance trust,
information, certainty, shared cognitive frameworks, rules,
competition and a balance of power. We can also gauge the
viability of a market by what it is not. If the terms of exchange
are involuntary, unclear, and unpredictable or exclude openness
to new market participants, if property rights, transaction
transparency and rule of law are lacking, and if market and price
information is unattainable, too costly or unreliable, these
exchange forums are generally classified as non-viable markets
(Menard, 1995). Nascent markets are characterized by
significantly compromised efficiency between buyers and sellers
38
and low levels of productivity by producers. For a market to
function properly, the institutions underpinning them have to be
created or enhanced. However, as Aspers (2011: 63) reinforces,
“there are few recipes” for the process of market creation.
Questions about the emergence of collective enterprises such as
markets and organizations are generally understudied. Even more
so, insufficient research has been conducted on market creation
or on how intermediary organizations navigate the subtleties of
institutionalized beliefs and values in establishing new markets
in least developed country contexts.
Traditionally, questions about market development have been
focused at the macro level of analysis in the disciplines of
economics, sociology and political science. These approaches have
emphasized the importance of the state in regulating and creating
the enabling environment for markets and how new market practices
emerge as a result of political or regulatory changes (Sarasvathy
& Dew, 2005). The emergence of new market practices has also been
explained by opportunities opening up as a result of new
technologies or scientific discoveries (Fligstein & Dauter,
2007). However, these lines of inquiry have shed little light on
39

the emergence of market practices as a result of organizational
actions in the absence of functioning or effective governments in
some of the least developed countries. My study therefore looks
at how an organization can take action to enhance and develop a
market for the benefit of poor producers.
Views of Market Coordination
In addition to the specific question about organizational-
level approaches to enhancing market practices in a specific
industry, more abstract theoretical questions could be raised
about how the growth of market systems and coordination by market
mechanisms impact a society in broader terms. If smallholder
farmers are transitioning from more traditional subsistence
methods of production and exchange to a more formalized and
efficient market, how are markets (and the assumptions that go
along with them) likely to impact communities and society more
generally? What are the implications of a greater presence of
markets in rural Bangladeshi society?
An evaluation of the moral and cultural implications of
market-based methods of coordination, production and exchange
usually depends on whom a market is seen to benefit and how
40

inequalities are distributed. Longstanding debates about the
positive and negative role of markets in society have been
ongoing for at least the last 300 years (Fourcade & Healy, 2007;
Muller, 2002). Critics of markets emphasize their potential
negative effects such as alienation and exploitation of workers
and producers (Marx, 1867), conspicuous consumption (Veblen,
1899), inequality (Polanyi, 1944) and the fostering of negative
virtues such as greed, self-interest and competitiveness
(Bordieu, 1984). On the other hand, however, equally persuasive
arguments have been put forward for the positive influences of
markets on society such as satisfying individual needs (Smith,
1776), the efficient allocation of resources (Walras, 1874),
nurturing the virtues of honesty, integrity and cooperation
(Smith, 1776), enhancing individual and political freedom (Hayek,
1944) and supporting creativity and innovation (Schumpeter,
1944). Contributing to this longstanding philosophical debate is
beyond the scope of the current study. However, a series of
recent experiments in 15 small-scale societies around the world –
primarily agricultural, fishing and nomadic peoples – found that
the more that markets played a role in their lives, the greater
41

those communities developed a sense of fairness with respect to
their interactions with others (Henrich et al., 2010).
Ethical Rationale for Poverty Alleviation
The ethical rationale for poverty alleviation recognizes
“the essential needs of the world’s poor, to which overriding
priority should be given” (Bruntdland, 1987: 43). The normative
imperative for poverty alleviation rests on a number of ethical
foundations. One foundation is Kant’s (1785/1993: 30) categorical
imperative to: “Act only according to that maxim whereby you can
at the same time will that it should become a universal law.”
This principle calls for the duty that all individuals have as
moral individuals to take action to benefit others as they
themselves would hope to receive assistance if in need. In this
way, Kant’s categorical imperative is consistent with “the golden
rule” principle found in many religions such as Christianity,
Islam, Buddhism, Hinduism, Judaism, Confucianism and First
Nations spirituality amongst others (Crane & Matten, 2010). The
difference between Kant’s categorical imperative and religious
principles is that religion grounds the golden rule in the
42

supreme authority of an ultimate eternal divinity, whereas Kant’s
approach is based on his assumption that humans are capable of
understanding what would be morally right and wrong in a given
situation without recourse to divine authority (Crane & Matten,
2010).
The ethical rationale for poverty alleviation also rests on
Rawls’ (1971: 302) theory of justice, especially as set out in
his second principle to determine if an action can be understood
as just: “Social and economic inequalities are to be arranged so
that they are… to the greatest benefit of the least advantaged.”
Rawls’ theory of justice acknowledges that in a free and
competitive society, inequality can be acceptable as it allows
effort, merit and capability to be compensated and incentivized
given equal opportunities for all, but also ensures that any
inequalities take special consideration to benefit the least
advantaged (Hahn, 2009).
Consistent with Rawls theory of justice, the UN’s Universal
Declaration of Human Rights (1948) enshrines basic fundamental
human rights as “natural rights” (Locke, 1690): unalienable
entitlements that should be upheld and protected in all
43
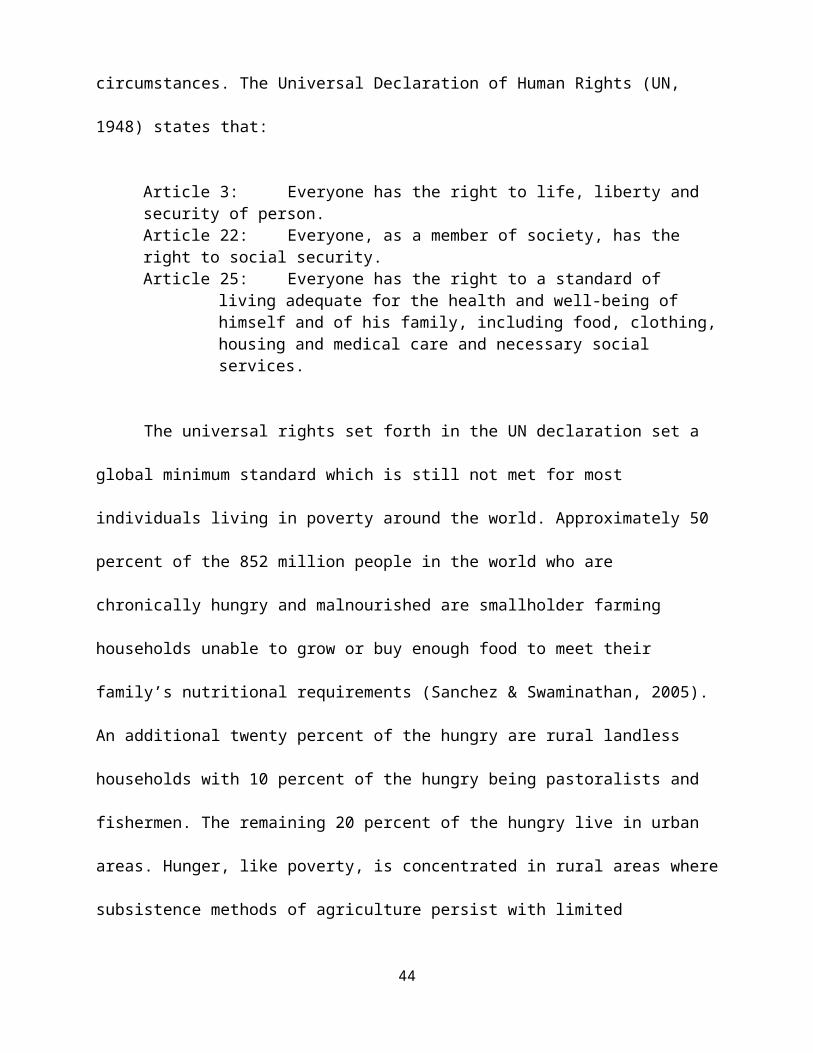
circumstances. The Universal Declaration of Human Rights (UN,
1948) states that:
Article 3: Everyone has the right to life, liberty and security of person.Article 22: Everyone, as a member of society, has the right to social security.Article 25: Everyone has the right to a standard of
living adequate for the health and well-being of himself and of his family, including food, clothing,housing and medical care and necessary social services.
The universal rights set forth in the UN declaration set a
global minimum standard which is still not met for most
individuals living in poverty around the world. Approximately 50
percent of the 852 million people in the world who are
chronically hungry and malnourished are smallholder farming
households unable to grow or buy enough food to meet their
family’s nutritional requirements (Sanchez & Swaminathan, 2005).
An additional twenty percent of the hungry are rural landless
households with 10 percent of the hungry being pastoralists and
fishermen. The remaining 20 percent of the hungry live in urban
areas. Hunger, like poverty, is concentrated in rural areas where
subsistence methods of agriculture persist with limited
44
opportunities for increased access to productivity and market
opportunities (IFAD, 2010). Poverty is a multidimensional
concept, encompassing material incomes and assets as well as
social factors such as marginalization, vulnerability,
insecurity, lack of opportunity and disempowerment (Bourguignon &
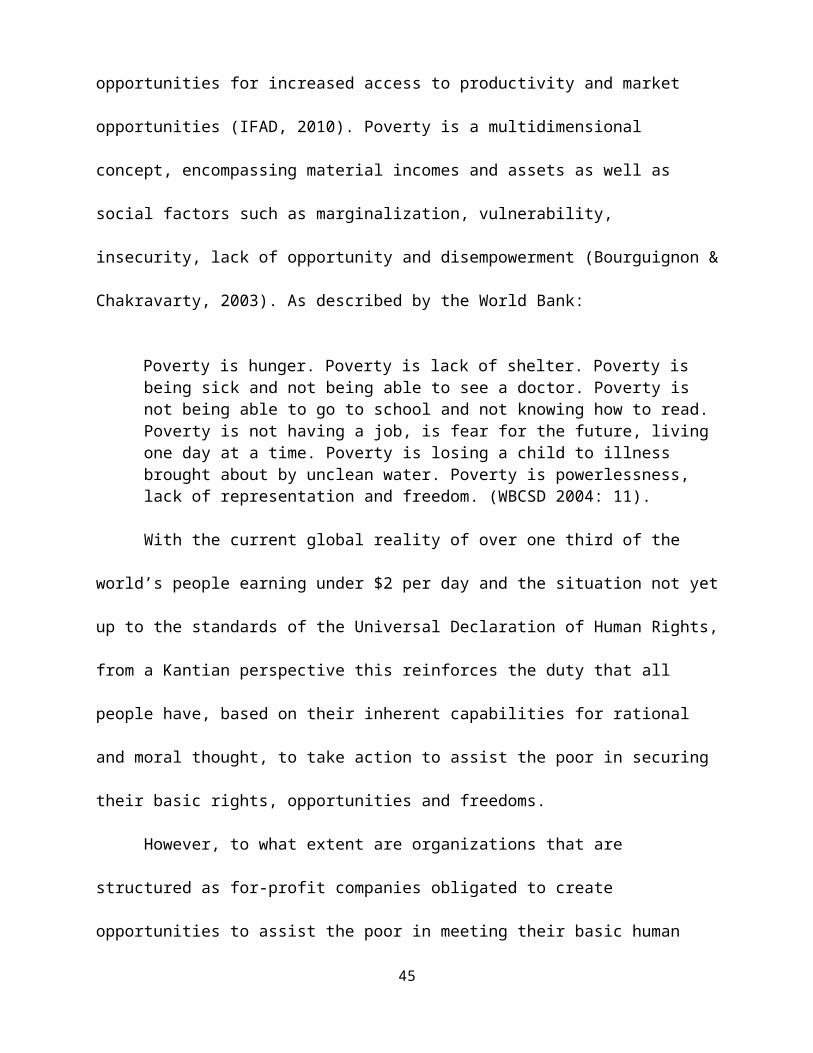
Chakravarty, 2003). As described by the World Bank:
Poverty is hunger. Poverty is lack of shelter. Poverty is being sick and not being able to see a doctor. Poverty is not being able to go to school and not knowing how to read. Poverty is not having a job, is fear for the future, living one day at a time. Poverty is losing a child to illness brought about by unclean water. Poverty is powerlessness, lack of representation and freedom. (WBCSD 2004: 11).
With the current global reality of over one third of the
world’s people earning under $2 per day and the situation not yet
up to the standards of the Universal Declaration of Human Rights,
from a Kantian perspective this reinforces the duty that all
people have, based on their inherent capabilities for rational
and moral thought, to take action to assist the poor in securing
their basic rights, opportunities and freedoms.
However, to what extent are organizations that are
structured as for-profit companies obligated to create
opportunities to assist the poor in meeting their basic human
45

needs? The preamble to the Universal Declaration of Human Rights
calls on “every organ of society… to promote respect for these
rights and freedoms” thus including private sector organizations.
Indeed, companies may have greater obligations to see that basic
human rights and freedoms are realized for the poor within their
sphere of influence due to their growing power in regions where
poverty is prevalent, growing social expectations on companies to
demonstrate corporate citizenship and sustainability and
instances of governments unable or unwilling to uphold their
obligations to improve the lives of their poorest citizens (Crane
& Matten, 2010; Hahn, 2009; Matten & Crane, 2005).
46

METHOD OF THEORY CONSTRUCTION
Theory and Theorizing
Theories arise from our human need to order and make sense
of our complex world (Dubin, 1969; Weick, 1989). A theory informs
and aids judgement. Theories are developed so we don’t have to
start from scratch in answering questions. A theory answers
questions about how something unfolds (Langley, 1999) or why
something is (Sutton & Staw, 1995). Theories are “the base for
knowledge and understanding of important relationships” and
constructs (Hitt & Smith, 2005a: 1). Theories are explanations.
They help us understand phenomena. Theories explain relationships
and offer meaning, cohesion and stability in the face of
ambiguity (Czarniawska, 1997). Theories create and reflect our
expectations of the world and its myriad phenomena and therefore
provide practical guidelines for thought and action (Van de Ven,
1989). Making a theoretical contribution clarifies or enhances
current explanations and answers to questions. New explanations
that are interesting challenge our conventional ways of thinking
47

and add value to existing ideas (Weick, 1989). Good theory should
allow someone to see the world with new eyes (DiMaggio, 1995).
The occasion for theorizing can be a problem, a gap in
knowledge, an unanswered question, a puzzle, a paradox, a
contradiction, an anomaly, or something that does not make sense
given current assumptions (Weick, 1989). Theories are
“approximations” (Weick, 1995). They are approximations of the
world around us wherever we may fall on the ontological continuum
between believing that an objective external reality is knowable
or believing it is socially constructed (Morgan & Smircich,
1980). Theories are abstractions – the pictures we paint or the
maps we draw to represent the world that we experience from our
particular frame of reference (Burrell & Morgan, 1979).
Although a substantive review of the perspectives of leading
management theorists concluded that “there is a substantial
amount of variation in viewpoints among scholars about what good
theory is and how it should be developed” (Hitt & Smith, 2005b:
587), a number of distinctions have been made. Distinctions can
be drawn between description – answering the question of what is
happening – and explanation – answering the question of how or
48

why something is happening. Most often, description is not
considered the focus of theory (Bacharach, 1989; Sutton & Staw,
1995). However, description can aid in understanding a phenomenon
by reducing it to its component parts (Bernard, 1988) and can
combine with explanation to form a theory (Whetten, 1989). Theory
then provides an answer to how and why the parts fit together and
are interrelated (Miles & Huberman, 1994). Distinctions can also
be made between theorizing at the level of grand theory, such as
the work of Marx, Smith, Darwin or Freud, and theorizing at the
mid-range level which would encompass many of the more modest
theories of management and organizations (Miles & Huberman,
1994).
In organization and management studies, various approaches
to understanding the process of theorizing have been put forward.
Drawing on Weber’s (1949) concept of ideal types, it is possible
to outline two general approaches to theorizing summarized in
Table 1 below.
Table 1: Two Stylized Ideal Types of Approaches to Theorizing
Strategy of Developing Predictions in Closed Systems
Strategy of Developing Generalizations in Open Systems
Source of Distinction
49

Variance Process Mohr, 1982Problem solving Sensemaking Weick, 1989Covering laws Narrative DiMaggio, 1995Analytical Synthetic Werner & Schoepfle, 1987Variable-oriented Case-oriented Ragin, 1987Cause Pattern Weick, 1999Matrix display Network display Miles & Huberman, 1994Deductive Inductive Weick, 1989
Although these two types are necessarily and perhaps overly
simplified, the first column represents what Weick (1989: 518)
describes as “a strategy of developing predictions in
hypothetical or artificial closed systems” with the second column
a “strategy of developing generalizations in open systems through
the use of inductive abstraction.” The first approach is often
associated with testing and confirming existing theory, while the
second can be employed to explore emerging phenomenon and develop
new theory (Miles & Huberman, 1994). Hitt and Smith (2005b)
suggest that the first column may be more suitable for
theoretical concepts that are more easily measured, while the
second column may be more applicable when theoretical concepts
are harder to measure. The second column assumes a world of
complexity and ambiguity. The first column tends to assume a
50

world of pre-existing and universal scientific laws of social
phenomena that represent an independent external reality. The
second column reflects an ontological assumption of reality as
subjectively constructed by individuals engaged in a common
project of interpretation and sensemaking. Although these
generalized ideal types of theory-building can be distinguished,
they are often usefully combined in the theory development
process (DiMaggio, 1995; Miles & Huberman, 1994).
Any theory, however, has to necessarily balance trade-offs
between generalizability, accuracy and simplicity (Weick, 1999).
A theory that satisfies any two of these characteristics is least
able to satisfy the third. And, it may be helpful to note that
theory construction is not the only way to develop new knowledge.
“Thick and rich description, case analysis, bringing about change
in a difficult situation, and telling a story are all valid
reasons for doing research” (Corbin and Strauss, 2008: ix).
Theory can serve multiple purposes including serving as an
intermediate step to another theory (Mintzberg, 2005) or serving
as a generator of debate and discussion (Barney, 2005). Karl
Weick reminds us that theory is a dimension rather than a
51
category – that the more an explanation satisfies the criteria of
a theory, the more it deserves the label (Weick, 1989; 2005).
My motivation for theorizing is to generate concepts and an
explanatory model that can further the conversation about market-
based approaches to poverty alleviation and explain the key
concepts and their interrelationships to advance knowledge in
both organization studies and the practice of management (Simon,
1967; Van de Ven, 1989).
Qualitative Research Design
To answer my research question about how an organization is
able to enhance market practices to make markets work for poor
primary producers in least developed countries, I chose an in-
depth qualitative research design, suitable for understanding
patterns and relationships in complex market settings. Although
the research question focused on the organizational level of
analysis, a qualitative approach allowed a close examination of
interrelationships among actors in the dairy value chain and how
they were embedded within multiple levels of their social,
economic and institutional context, a consideration important for
52

capturing and drawing out explanations from inter-related social
and market dynamics (Weick, 2005). The research was phenomena-
and problem-driven (Mintzberg, 2005), focused on explaining
events in the world, which was appropriate for research in a
complex, changing environment (Pfeffer, 2005; Locke, 2001). My
research approach was mostly inductive, especially during the
earlier stages of data gathering and analysis, but also included
deduction, as I consulted literatures associated with emergent
patterns and analysed quantitative data. Data were gathered
between October 2009 and June 2012.
Grounded Theory Method
I drew substantially from the grounded theory building
approach for my research design due to its suitability for
studying emergent phenomena not fully explained in the existing
literature (Corbin and Strauss, 2008). The grounded theory method
is a systematic inductive approach to constructing theory
(Charmaz, 2006) and is currently the most widely used qualitative
research method across a range of disciplines (Bryant & Charmaz,
53

2007). Induction is a type of reasoning that extrapolates from
specific instances to more general constructs or patterns
(Charmaz, 2006). The method includes procedures such as continual
iteration between data collection and data analysis and
considering alternative explanations to ensure that findings are
firmly rooted in data and that they generate useful analytic
explanations (Glaser & Strauss, 1967). Although there are
variations in the application of the method and cautions about
adopting an overly prescriptive approach to essential elements
that make up grounded theory building, Wiener (2007) has
identified the following representative elements to the grounded
theory method:
Data gathering, analysis and theory construction proceed concurrently
Coding and memo writing start with first interview and/orfield notes
Theoretical sampling Memoing Reaching theoretical saturation Identifying a basic process that accounts for most of the
observed behavior
One of the advantages of the grounded theory method of
qualitative research is that its procedures are visible,
comprehensive and replicable (Bryant & Charmaz, 2007). The
54

section on data analysis, below, details how these elements of
grounded theory-building were undertaken.
Case Study
Case studies can be used with a grounded theory building
method to investigate complex social phenomena. A case study can
allow examination of phenomena “in depth and within its real-life
context, especially when the boundaries between phenomenon and
context are not clearly evident” (Yin, 2008: 18). A case study
can be used when “how” or “why” questions are being asked about
contemporary events over which the investigator has little or no
control (Yin, 2008). A comparison of the relevant situations
appropriate for different research methods is given in Table 2
which considers the form of research question, the requirement
for behavioral control and whether the focus is on contemporary
events.
55

Table 2: Relevant Situations for Various Research Methods (after Yin,
2008)
MethodForm of ResearchQuestion
Control ofEvents Required?
Focus onContemporary
Events?Experiment How, why? Yes YesSurvey Who, what,
where, how many,how much?
No Yes
Archival Analysis
Who, what, where, how many,how much?
No Yes/No
History How, why? No NoCase Study How, why? No Yes
Because my research question focused on contemporary events, did
not require strict control of events, and was interested in the
question of “how”, a case study methodology was appropriate.
Case Selection
To examine poverty alleviation from a managerial
perspective, I needed an organization that had adopted a market-
oriented approach to a challenging poverty situation for poor
primary producers within a least developed country. From an
initial database of 900 market-based approaches to poverty
alleviation, I identified a short list of 20 that were of larger
56

scale and globally significant. After considering a number of
possible options of both for-profit and not-for-profit
organizations, I selected an initiative in the Bangladeshi dairy
industry by the NGO CARE Bangladesh. The initiative to strengthen
the dairy value chain was funded with US $5.25 million from the
Bill and Melinda Gates Foundation over the period 2008 to 2012
and sought to double the dairy-related incomes of 35,000
smallholder farmers in the northwest of the country who earned,
on average, $1 per day. CARE worked as a facilitator,
intermediary and catalyst with farmers, dairy companies, and
other enterprises throughout the value chain to identify
commercially viable and financially sustainable enhancements to
market practices for the benefit of farmers as well as other
actors in the value chain.
I chose this particular initiative for four reasons. First,
CARE was explicitly taking a market-based approach to poverty
alleviation focused on economic viability and commercial
sustainability. CARE worked closely with private sector companies
and employed business principles and strategies that would be
familiar to, and were being productively utilized by, private
57
sector companies. In their study of innovations to make markets
more inclusive for the poor, Mendoza and Thelen (2008) equally
considered initiatives by NGOs and companies as relevant
organizations of study. Another advantage that the CARE case had
over other potential research sites was that their work was also
informed by the long tradition of rural development approaches
which focus on poor primary producers. In this way, the CARE case
provided a potentially robust channel for the translation of
useful insights from rural development practices into the
management literature.
Second, researchers and practitioners using base-of-the-
pyramid, microfinance, and SME employment approaches to
development have attained insights from studying NGOs that were
later adapted by other organizations, including private sector
companies (Chesbrough, Ahern, Finn & Guerraz, 2006). Examples of
innovative NGOs include those that have helped lay the foundation
for the current commercial microfinance industry (Chu, 2007),
enterprises such as Aravind Eye Care, which has shown the
potential for future health care applications (Mehta & Shenoy,
2011), and Grameen's family of NGO enterprises which has
58
pioneered profitable business models, including solar home
systems and rural telecommunications (Yunus, Moingeon & Lehmann-
Ortega, 2010).
Third, the CARE dairy initiative represented a significant
global example of the phenomenon under study funded by one of the
most prominent investors in market-based approaches to
development. The initiative was being implemented by one of the
largest NGOs in Bangladesh, a country known for its innovative
market-based approaches to development including the enterprises
of BRAC and Grameen’s business ventures with Danone, Adidas,
Telenor, BASF, Uniqlo, GE Healthcare, Veolia and Pfizer (Yunus,
Moingeon & Lehmann-Ortega, 2010).
Fourth, although CARE is an NGO and is not itself buying and
selling products in the marketplace, this potentially non-
traditional research site offered a distinct advantage over more
traditional choices of for-profit companies because, as Weick
(1974: 487) argues, it is in these uncommon cases that phenomena
relevant to companies are made more visible and available for
theory development, thus helping researchers “improve theories
and discover something besides the obvious.” As Scott (1995: 151)
59

similarly argues, research is more likely to offer novel
management insights when researchers seek out “the frame-breaking
experiences that only come from examining and comprehending
organizations operating in other places and times.”
60

Single Case Design
The CARE case was a specific, unique, bounded, purposive and
integrated system that would be suitable for a case study (Yin,
2008). The trade-off between studying a single case or multiple
cases revolves around the depth of understanding of an
organization within its context achievable with a single case
versus the comparative insights of multiple cases. Because the
organizational context – the Bangladeshi dairy sector – was an
essential element of the research question, a single case study
design was chosen. This design therefore aimed to maximize
insights of the organization working in its market and
institutional context, a strategy that allows for the capturing
of deeper social dynamics (Van Maanen, 1979), and the surfacing
of more tacit and less obvious dynamics of a phenomenon which can
therefore generate more accurate theoretical insights (Dyer &
Wilkins, 1991). Weick (2005) has argued that attention to social
context is essential to both sensemaking and theory-development
because of the complexity of social phenomena. A single case was
therefore selected to maximize understandings of deeper
structures and contextual relationships.
61

Empirical Setting
Bangladesh as a Least Developed Country
The major market development initiative being implemented by
CARE in the Bangladeshi dairy sector was appropriate because it
was located in a least developed country exhibiting high rates of
poverty and weak state and market governance. Bangladesh is among
the poorest countries in the world with an estimated 40 percent
of the country’s 150 million people living below the national
poverty line of $1.25 per day (Narayan & Zaman, 2009). Forty-
eight per cent of children under five in Bangladesh are
chronically malnourished and 30 percent of the total population
is below the minimum level of dietary energy consumption (WHO,
2005, 2009). These poverty-related challenges for families are
particularly acute in rural areas, which offer few opportunities
for employment or increased income generation to meet nutritional
needs. Weak state governance and market failure are significant
issues in the country, with the state having little positive
influence on dairy sector development as a result of over-
bureaucratization and a high incidence of public service
62

inefficiency, waste, and underfunding (Parnini, 2009). While the
Bangladeshi livestock sector accounts for 3 percent of
Bangladesh’s GDP, it receives only 0.27 percent of government
expenditures (Jabbar, 2010). Resources that are allocated to the
dairy sector have been ineffective at reducing poverty for poor
producers (Jabbar, 2010). Overall, governance has been rated low,
not only in terms of regulatory quality, rule of law, and control
of corruption (Azmat & Coghill, 2005), but also because of “a
lack of political consensus, weak legislative authority,
unhealthy model of political competition, undemocratic political
party structures, political and administrative patronage, and
weak local governance” (Zafarullah & Rahman, 2002: 1013). A
recent assessment of the investment climate in Bangladesh
identified poor infrastructure, unreliable electricity,
corruption, and limited regulatory governance as major
impediments to investment and development (Mahmood, 2009). In
these ways, the case was situated in a least developed country
exhibiting significant poverty challenges and weak state and
market governance.
63
Bangladeshi Dairy Sector
Smallholder dairy farming accounts for 90 percent of the
country’s annual milk production of 2.8 million metric tons, but
despite strong domestic demand only nine percent reaches the
formal market comprised primarily of three large dairy processing
companies (Jabbar, 2010). Bangladesh is thus forced to import 30
percent of the country’s milk requirements in the form of
powdered milk (Jabbar, 2010). Bangladesh’s formal dairy sector
has been described by policy analysts as “nascent,” fragmented in
terms of its development and “characterized by extremely weak
value chains” (Ahmed et al., 2009: 18). The fragmented nature of
the dairy sector means that milk production remains a mostly
subsistence practice with transactions highly localized,
uncoordinated, and lacking in predictability and transparency.
Knowledge of productivity and income-enhancing dairy
practices is typically limited to traditional subsistence farming
techniques. Fifty-seven percent of CARE’s target farmers are
functionally landless, which means that they own less than half
an acre of land, including the land on which their bamboo and
straw houses are built and around which they keep any livestock
64
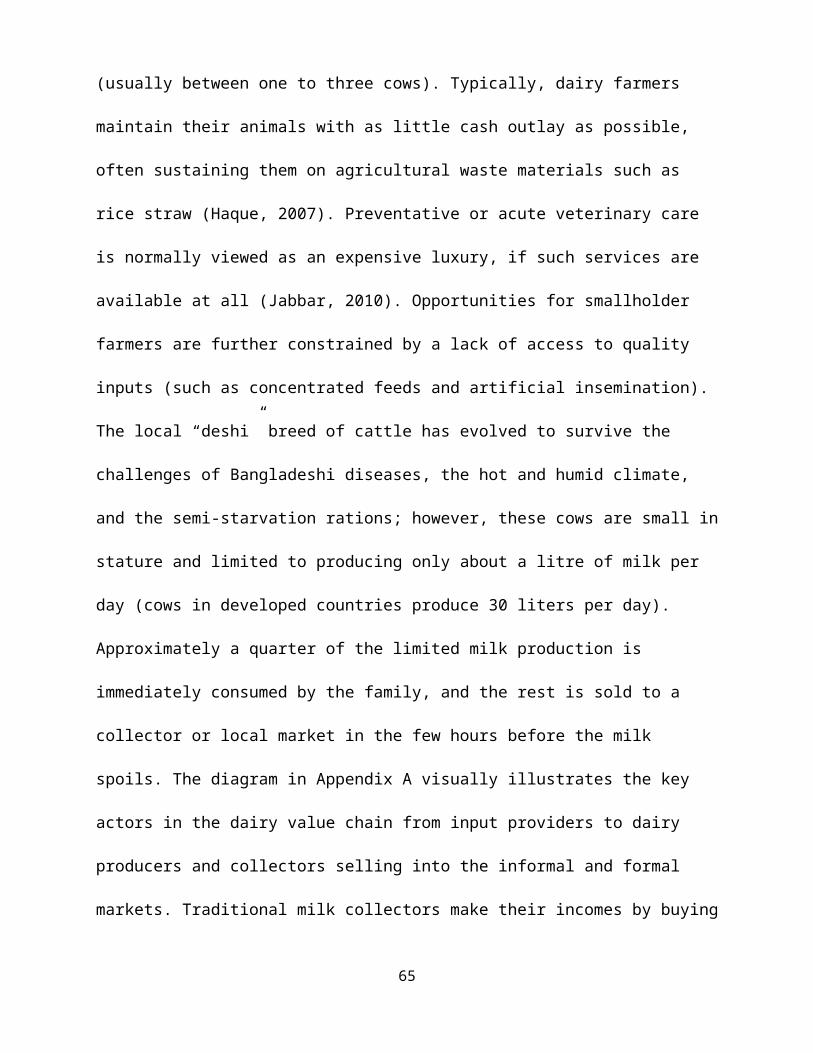
(usually between one to three cows). Typically, dairy farmers
maintain their animals with as little cash outlay as possible,
often sustaining them on agricultural waste materials such as
rice straw (Haque, 2007). Preventative or acute veterinary care
is normally viewed as an expensive luxury, if such services are
available at all (Jabbar, 2010). Opportunities for smallholder
farmers are further constrained by a lack of access to quality
inputs (such as concentrated feeds and artificial insemination).
The local “deshi” breed of cattle has evolved to survive the
challenges of Bangladeshi diseases, the hot and humid climate,
and the semi-starvation rations; however, these cows are small in
stature and limited to producing only about a litre of milk per
day (cows in developed countries produce 30 liters per day).
Approximately a quarter of the limited milk production is
immediately consumed by the family, and the rest is sold to a
collector or local market in the few hours before the milk
spoils. The diagram in Appendix A visually illustrates the key
actors in the dairy value chain from input providers to dairy
producers and collectors selling into the informal and formal
markets. Traditional milk collectors make their incomes by buying
65
from farmers at the lowest possible price and selling at the
highest price. In this traditional context of market risks,
uncertain buyers, disaggregated production, limited knowledge of
dairy productivity, and limited access to improved feed,
veterinarian advice, and breeding services, Bangladeshi
smallholder farmers face significant obstacles to increasing
their incomes through milk production.
Enhancing Market Practices Through a Market-Based Approach
These challenges were targeted by the initiative developed
by CARE Bangladesh, which explicitly sought to enhance market
practices in the dairy sector for the benefit of poor producers.
By market practices, I mean the strategic initiatives executed by
an organization that alter market structure and shape market
relationships and actions (Ullah and Routray, 2007). Market
practices tend to bring order and consistency to production and
exchange through the provision of more predictable incentives and
sanctions. Markets and value chains in which poor producers are
often embedded are typically characterized by institutional voids
and informal practices that impede market coordination and
66

contribute to low-level equilibria and poverty traps (Azariadis &
Stachurski, 2005; Bowles, Durlauf & Hoff, 2006). Sub-optimal
equilibria can be established and persist because poor
individuals adopt practices for survival and minimization of
risks which may not be particularly optimized for the efficiency
and effectiveness of the overall market system. Low-income
contexts can also “configure exclusionary markets” when the
autonomy and property rights of individuals are constrained
(Mair, Marti and Ventresca, 2012). CARE recognized that in order
to improve the overall functioning of the dairy value chain for
the benefit of smallholder farmers, other stakeholders such as
processors, collectors, and animal health workers would need to
be incentivized and benefit as well. CARE sought to enhance or
introduce new market practices at various points throughout the
value chain, providing additional significant strategic insights
into the use of a market-based approach to poverty reduction by a
variety of different types of organizations.
67

Data Collection
Because I was interested in grounded theory building, I
collected multiple forms of qualitative data which included three
two-week field visits to remote rural communities and 299 face-
to-face interviews with farmers and CARE staff as well as
representatives from organizations from all points in the value
chain. All aspects of dairy production, marketing and sales were
observed in the field and explored through meetings with CARE
staff and dairy processors, farmers, collectors, informal market
buyers and input sellers in the dairy sector (see Appendix D). In
addition, I had access to extensive quantitative monitoring and
evaluation data on the project, farmers, and the dairy sector in
the northwest of the country (see Appendix E).
My data sources included interviews, written and electronic
archival documents, participant observation, and quantitative
household baseline and project evaluation data. I took an
iterative approach to the collection and analysis of data and
used triangulation among the various informants and various types
of data sources to enhance the reliability and trustworthiness of
my findings (Corbin & Strauss, 2008; Eisenhardt, 1989; Miles &
68

Huberman, 1994). This systematic approach was aimed at
discovering behavioral and outcome patterns in the data and how
emergent constructs and categories interrelated to form a
coherent explanatory model. I relied on interviews, observations,
and archival documents as the primary sources of data for theory
building and relied on other data for the triangulation of
findings, the generation of interview questions, and as evidence
that CARE’s activities were reducing poverty. The data were
collected between October 2009 and June 2012 which allowed for
sufficient time to become familiar with key organizations,
individuals and events.
Interviews
I interviewed 299 individuals including CARE staff, dairy
economists, industry experts, agriculture and dairy scientists,
International Finance Corporation employees, and multiple
representatives of the dairy value chain, including input
providers (e.g., cattle feed suppliers, animal health service
69

workers), producers, milk collectors, chilling plant managers,
small and medium-sized formal and informal sector processors and
retailers, and senior representatives from the three largest milk
processors in Bangladesh.
I also gathered data on the country’s three largest dairy
processors, BRAC Dairy, Milk Vita and PRAN Dairy (see Appendix
C). Of the 299 interviews, 59 were semi-structured, face-to-face,
in-depth and focused individual interviews and 240 were part of
eight focus groups of milk producers and collectors. Of the
total, one focus group of 30 farmers and face to face interviews
with 28 value chain actors independent of CARE’s intervention
were also conducted for control and contrast purposes. To elicit
the highest quality interview data, interviews tended to be
balanced between gathering information on predetermined questions
and embracing deviations signalled or initiated by the
interviewee. Every effort was taken to be fully present with
interviewees, to be attentive to verbal and non-verbal cues, and
to be aware of cultural norms in conversation. I made special
efforts to establish a relaxed and comfortable setting for the
interviews, to encourage openness, spontaneity, reflection and
70
free flow of conversation (Gubrium & Holstein, 2003; McCracken,
1988; Weiss, 1994). I purposefully selected interviewees guided
by gaps in the data and questions arising from on-going analysis.
I asked questions of informants from every role in the dairy
sector to understand the existing state of practices in the
sector, power dynamics and interests, obstacles to changing
existing practices, and CARE’s influence and effectiveness in the
sector. Reaching saturation in my understanding of sector
structure and dynamics, I focused on the specific activities of
CARE’s project. During this process, interviews became
increasingly more structured as themes began to emerge from the
data. Interviews were generally between 30 minutes to one hour,
with some lasting as long as three hours. Interviews were
recorded and transcribed. When interviews were conducted in
Bengali through an interpreter, two bilingual translators (one a
business faculty member at the University of Dhaka and one an
undergraduate student in Canada) translated and transcribed the
recordings. The two translations were compared and consensus was
achieved to ensure accuracy of the data.
71
Documents
I collected an extensive set of documents and archival data,
consisting of CARE project data and dairy sector data (see
Appendix D). A comprehensive set of project documents was
obtained from CARE, including proposals, memoranda of
understanding, internal communications, commissioned reports,
training materials, and semi-annual progress reports. I also
collected documents and industry assessments undertaken by the
larger dairy processor organizations (Milk Vita, BRAC, and PRAN),
newspaper articles related to the Bangladeshi dairy sector, and
key sector reference materials recommended by my informants, such
as Livestock Resources in Bangladesh (Alam, 1995) and Studies on Agricultural
and Rural Development (Alam, 2008). These materials were helpful in
triangulating with other sources of data, as they provided
information about the history and evolution of market practices
in the dairy sector as well as in-depth information on CARE’s
strategies to enhance market functioning.
Observation
72

Direct observation was a valuable source of data in this
study. Because it is not uncommon for people to behave in
unconscious ways or for there to be discrepancies between their
words and actions, observation is an important means of data
gathering and triangulation with other data sources (Corbin &
Strauss, 2008; Lofland, et al., 2006; Patton, 2002). Observation
can help distinguish between individual and organizational
espoused or formal statements and their actual activities and
practices, if the two differ. I observed activities associated
with all aspects of value chain operations and communications.
Extensive field visits to remote northwest Bangladesh villages
were undertaken to observe farmer milk aggregation, animal
husbandry practices, feed distribution, milk collection, milk
testing, and meetings between CARE staff and villagers. I
observed the daily activities of CARE staff and witnessed
informal discussions that arose between staff members; I was also
invited to attend three confidential meetings between senior CARE
staff members, the International Finance Corporation, and senior
executives of one of the large private sector dairy companies.
Because a cross-cultural context can increase the complexity of
73

interpreting field observations, I made a continuous effort to
cross-check assumptions and impressions with multiple informants,
including with the individuals themselves as well as with
Bangladeshis very familiar with the day to day lives of farmers
and equally familiar with life in Western countries (Green, et
al., 2007). Field notes and photographs were taken during
observation periods to capture information about market practices
in the field and CARE’s organizational culture, structure, and
priorities. Observation was an important source of spontaneous
and everyday “operational data” with which to triangulate the
sometimes “presentational data” offered by informants in
interviews (Van Maanen, 1979). Attendance at an important
national two-day dairy conference at Bangladesh Agricultural
University in Mymensingh resulted in significant additional
information on the dairy sector and its practices. For further
details on the qualitative data gathered through interviews,
documents and observation see Appendix D.
Quantitative Data
74
As part of its activities, CARE conducted a comprehensive
baseline assessment of smallholder dairy producers in its project
region (for more details, see Appendix F). CARE also collected
data on 350 variables relating to 35,000 farmers, 1,163 producer
groups, 308 milk collectors, 201 livestock health workers and
milk buyers as well as market prices for milk and cattle feed
(see Appendix E). Different types of quantitative data were
gathered on a monthly, quarterly, semi-annual and annual basis.
As my research and analysis progressed, I was able to add
specific additional questions to the quantitative surveys in
order to further understand or provide evidence for emerging
constructs and relationships in my theoretical model. All of the
raw quantitative data were made available to me on an on-going
basis throughout the study and were comprehensively analysed for
a total of 475 hours by a statistician associated with the York
Center for Social Research for further insight into the
production and exchange relationships in the dairy sector and for
indicators of progress in CARE’s efforts to increase the incomes
of smallholder farmers. For further details on the quantitative
75
data gathered and analysed throughout the project, see Appendix
E.
Qualitative Data Analysis
Consistent with a grounded theory building approach, the
analysis of qualitative data was iterative and relied on
triangulation, coding and memoing to develop categories and their
interrelationships that would serve as an explanatory model.
Iteration
Data collection and theory building were an iterative and
incremental rather than a pre-planned linear process. I applied a
recursive process of constant comparison between data collected
and the themes and theoretical points that emerged from the
analysis (Corbin & Strauss, 2008). Analysis and collection
proceeded iteratively from the first round of data collection and
became progressively more focused until the theoretical model was
finalized at the conclusion of the study. During the first half
of the study period, emphasis was placed on understanding the
market context of the dairy sector and CARE’s activities within
76

it. Data collection and analysis during this phase were open-
ended and exploratory. Analyses revealed gaps and missing data
and helped to continually focus subsequent rounds of data
collection and refine the theoretical model. Previous interviews,
field notes, documents and memos were analysed before the next
trip to the field.
Triangulation
During the data gathering and analysis process, I cross-
checked emerging categories and relationships with comparisons
between different pieces of data from various sources to enhance
the reliability and validity of the findings. The multiple
sources of data allowed for triangulation and corroboration in
data collection and analysis processes which served a similar
function to providing multiple measures of the same phenomena
thus enhancing validity of data and findings (Yin, 2008). I
developed a 38,000 word (77-page) case description of CARE’s
efforts to enhance market practices in the dairy sector and
shared it with key managers at CARE to confirm the accuracy of my
understanding of the facts. In addition, I presented an overview
77

of my understanding of the dairy sector at the Bangladesh
Agricultural University national two-day dairy conference in
Mymensingh in April 2010, and gathered feedback from a diverse
academic and practitioner audience of the most knowledgeable
individuals in the country. These efforts allowed me to become
intimately familiar with the details of the case, helped ensure
the accuracy of the data I had collected, and assisted in
guarding against premature or false conclusions as a result of
human information-processing biases (Eisenhardt, 1989).
Coding
As part of the systematic analysis of data, all interview
transcripts, key project documents, and memos were consolidated
in a single database and ATLAS.ti software was used to assist in
structuring and coding the data. The creation of a comprehensive
database of all case study data was organized so it could be
accessible and auditable by a third party (Yin, 2008). The
initial coding was guided by concepts that appeared in the data.
Data were coded at various levels of theoretical abstraction. An
on-going tension had to be managed between developing a
78
theoretical model at an appropriate level of abstraction and
remaining grounded in the data (Bryant & Charmaz, 2007). Through
constant comparison and ongoing inductive analysis, codes were
split or consolidated and patterns and relationships pertaining
to market practices and reduced poverty emerged. Codes were
grouped into second-order constructs and these were grouped into
higher-order theoretical concepts while remaining open to avoid
early closure or premature conclusions (Corbin & Struass, 2008).
Figure 2 includes a visual map of how data was coded to induce
higher order theoretical concepts.
79
Figure 2: A Visual Map of the Analytical Coding Process Used To Induce Higher-Order
Theoretical Concepts
80

81

With the aid of the coding software, all sections of text marked
with particular codes were reviewed to ensure that the essence of
the construct was adequately captured. Frequencies of various
codes were also noted. This process resulted in the ongoing
reinterpretation and refinement of categories and concepts and
their structuring into a model that captured interrelationships
as well as a hierarchy of more abstract theoretical concepts and
their supporting second order constructs. To maximize the
reliability of coding, minimize the possibility of idiosyncratic
interpretations, and ensure that rare themes were adequately
captured, I repeatedly tested my coding interpretations with
various diagrams, flowcharts, visual maps and other forms of
graphical representations to help eliminate alternative
conceptualizations of the relationships and categories in the
data (Langley, 1999; Miles & Huberman, 1994).
Memoing
During and after field visits, as well as during coding and
analysis, brief (1-2 page) memos were written to identify,
conceptualize and connect emerging concepts with each other
82
(Goulding, 2002). Memos in the earlier research stages were
written freely and openly to capture a wide diversity of ideas
and guide theoretical sampling of subsequent data. Later, memos
also began reflecting on and enfolding related literatures as
they were reviewed (Corbin & Strauss, 2008). Memoing was an
integral part of data analysis that helped capture insights and
epiphanies, refine concepts and relationships, lift data to
theory and build an overarching answer to the research question
(Miles & Huberman, 1994). In a related exercise, reflective
remarks were noted on the margins of transcripts and documents to
capture emerging thoughts and ideas.
83
Emergence of Constructs, Relationships and Theory
During the iterative process of coming to the final version
of the explanatory framework, alternative logical pathways and
rival constructs and relationships were considered and
progressively eliminated. Ultimately, I searched for what I
believed was, on balance, the model and explanation that best fit
the data (Miles & Huberman, 1994; Lincoln & Guba, 1985). The
grounded theory method, like other qualitative research methods,
recognizes that the researcher is an important part of the data
analysis process and that the patterns and relationships
identified in the data arise from an inherently human process of
meaning-making and interpretation.
Closure
Data collection, analysis, and theoretical refinement
continued until the categorization and overall model became
stabilized and new data and analysis no longer resulted in
refinements or changes. At this point, theoretical saturation was
reached.
84
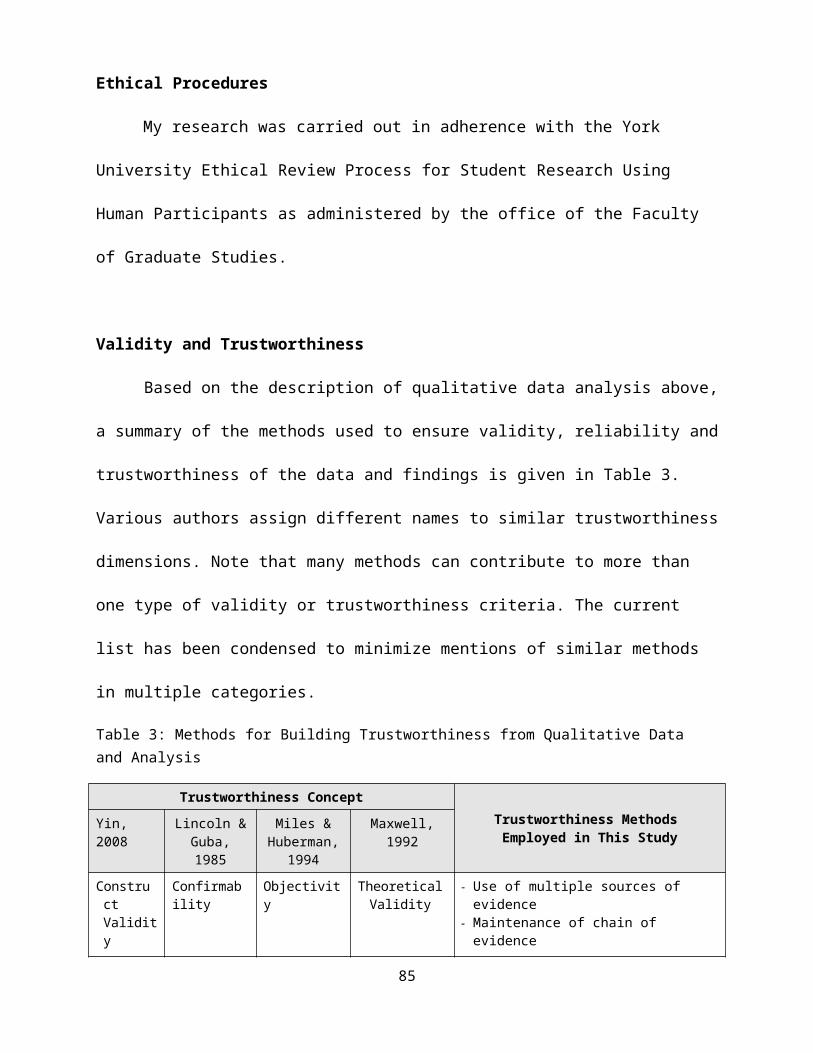
Ethical Procedures
My research was carried out in adherence with the York
University Ethical Review Process for Student Research Using
Human Participants as administered by the office of the Faculty
of Graduate Studies.
Validity and Trustworthiness
Based on the description of qualitative data analysis above,
a summary of the methods used to ensure validity, reliability and
trustworthiness of the data and findings is given in Table 3.
Various authors assign different names to similar trustworthiness
dimensions. Note that many methods can contribute to more than
one type of validity or trustworthiness criteria. The current
list has been condensed to minimize mentions of similar methods
in multiple categories.
Table 3: Methods for Building Trustworthiness from Qualitative Data and Analysis
Trustworthiness ConceptTrustworthiness Methods Employed in This Study
Yin, 2008
Lincoln &Guba,1985
Miles &Huberman,
1994
Maxwell,1992
Construct Validity
Confirmability
Objectivity
TheoreticalValidity
Use of multiple sources of evidence
Maintenance of chain of evidence
85
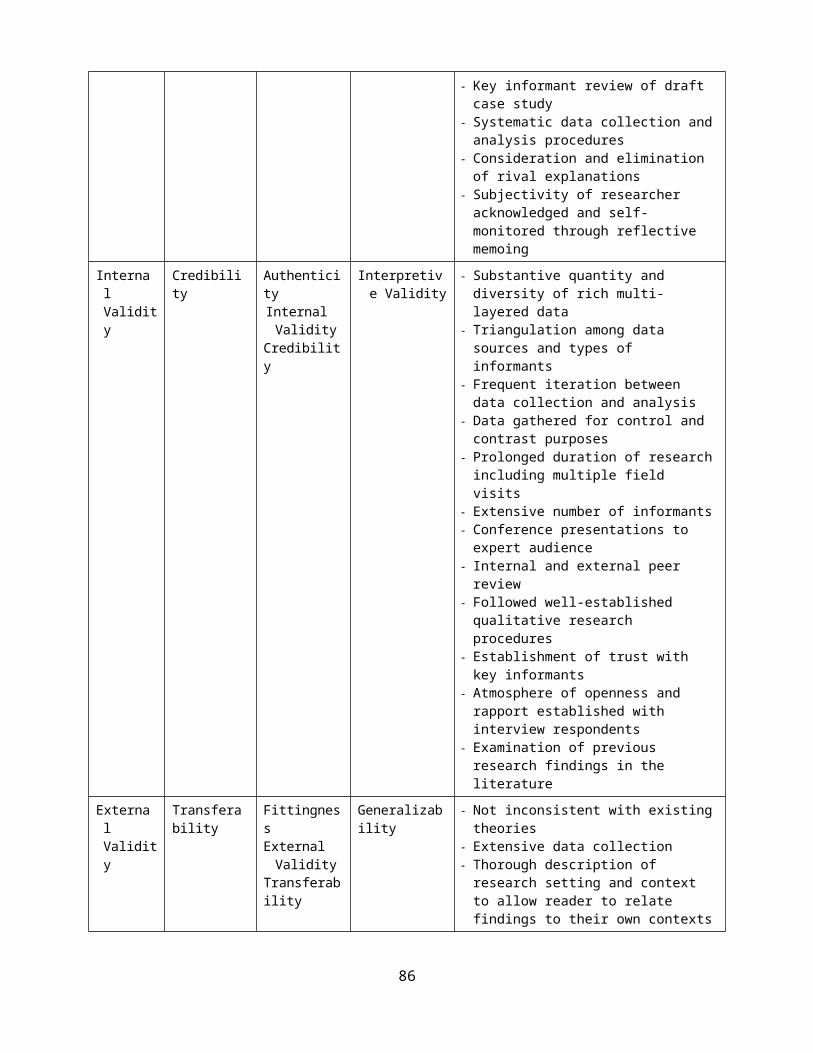
Key informant review of draft case study
Systematic data collection andanalysis procedures
Consideration and elimination of rival explanations
Subjectivity of researcher acknowledged and self-monitored through reflective memoing
Internal Validity
Credibility
Authenticity Internal Validity
Credibility
Interpretive Validity
Substantive quantity and diversity of rich multi-layered data
Triangulation among data sources and types of informants
Frequent iteration between data collection and analysis
Data gathered for control and contrast purposes
Prolonged duration of researchincluding multiple field visits
Extensive number of informants Conference presentations to expert audience
Internal and external peer review
Followed well-established qualitative research procedures
Establishment of trust with key informants
Atmosphere of openness and rapport established with interview respondents
Examination of previous research findings in the literature
External Validity
Transferability
Fittingness External Validity
Transferability
Generalizability
Not inconsistent with existingtheories
Extensive data collection Thorough description of research setting and context to allow reader to relate findings to their own contexts
86

Reliability
Dependability
Auditability ReliabilityDependability
DescriptiveValidity
Data comprehensively collectedand organized in case study database creating an auditablepaper trail
Attention paid to factual accuracy and precision of datagathered
Analysis conducted with diligence
Data collection and analysis methods documented in detail
Overlapping data collection methods
From a subjectivist (Morgan & Smirchich, 1980) or pragmatist
(Dewey, 1938) perspective, it is impossible to separate ourselves
and our identities from the research and analysis that we do.
Therefore, the trustworthiness in the findings can be increased
with explicit descriptions of what I did to be as self-reflective
and aware as possible of my personal assumptions, biases and
values and the role that they may have played during data
collection and analysis (Miles & Huberman, 1994; Corbin &
Strauss, 2008). These reflections, as noted earlier, were
captured in memos written during data collection and analysis and
included my experiences, for example, in interviewing smallholder
farmers – people with some of the fewest material possessions in
the world, exposed to natural and political risks with few social
or economic safety nets. These same individuals, many of whom
87
were women, did not lack for willingness to learn, work hard, and
take advantage of opportunities to improve their lives and those
of their families. In these memos I reflected on how
understanding their stories, their constraints and their
resourcefulness, like previous research studies in Africa and
India with low-income individuals, provided on-going motivation
to pursue research that could have the possibility of
contributing to knowledge that could allow for more effective or
more sustainable opportunities. In my notes I was conscious of
the importance of not exaggerating their situations as a form of
rhetorical dramatization. Instead I wrote of my interest to
respect their stories and challenges in order to maximize any
contribution that my analysis might have to theory and practice.
This self-reflective knowledge was cultivated as part of the
overall practice of being sensitive to signals, signs and
patterns in other types of data, and was fed into the iterative
process of data collection and analysis. The practice of self-
reflexivity helps avoid forcing data into interpretations that
are overly predetermined by the researcher (Glaser, 1992).
88

Quantitative Data Analysis
Although the primary data used in this study was drawn from
qualitative sources, I also gathered and analyzed quantitative
data to inform my understanding and theorizing. Quantitative data
was analyzed from the raw survey data gathered by CARE or third
party organizations on farmers, farmer groups, collectors,
livestock health workers, processors, feed and medicine sellers,
and agricultural input supply shops (see Appendix E). In many
cases I was able to add questions to the surveys as my research
progressed. The quantitative survey data was analyzed for
evidence on how CARE interventions were working and the impacts
of CARE’s market practice enhancements on farmers and other value
chain actors. Since the data had been collected at the household
level, the static group level, and the dynamic group level (which
changes over time) over eight waves from 2009-2012, advanced
statistical methods were required to produce accurate results. In
order to analyze the data in detail to look for trends and
effects, I had a statistician build statistical models that
controlled for the farmers’ context and many mediating variables
89

including geographic variables, group effects (i.e. group number
and group contextual variables), and household differences (i.e.
family size, number and breed of cows). R software was used to
build mixed-effects regression models with both fixed and random
effects. This was important for accuracy as this data had both
nested effects (such as households within groups within regions)
and crossed effects (such as groups that had been involved with
CARE for different lengths of time). Due to the complex nature of
the raw quantitative data, all of the models were created using
generalized linear mixed-effect models (Faraway, 2006).
Generalized linear mixed-effect models are a class of models
designed for the analysis of clustered and longitudinal data with
non-normal dependent variables. The models were constructed using
a binomial link function and a penalized quasi-likelihood method
(Faraway, 2006). All the models included both a random intercept
and a random slope. Each model included fixed effects such as
size of cow herd, time of data collection and length of time that
the farmer group had been involved with the CARE project. Each
model also included a series of random effects including which
group individual farmers are associated with and time. This
90

method properly controlled for the fact that each farmer group
was measured repeatedly in the data collection process. This
method also properly controlled for the fact that the data was
clustered in several dimensions (ie. time periods and geography).
The acceptable significance level for all of the models was alpha
= 0.05.
91
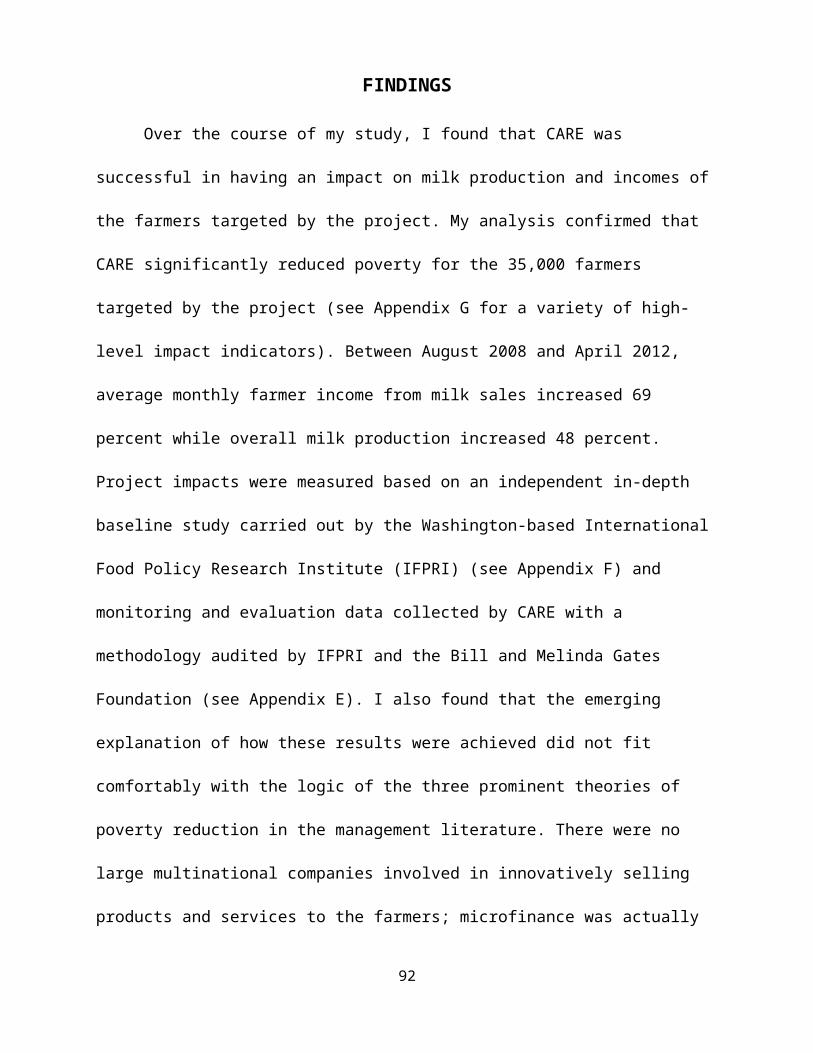
FINDINGS
Over the course of my study, I found that CARE was
successful in having an impact on milk production and incomes of
the farmers targeted by the project. My analysis confirmed that
CARE significantly reduced poverty for the 35,000 farmers
targeted by the project (see Appendix G for a variety of high-
level impact indicators). Between August 2008 and April 2012,
average monthly farmer income from milk sales increased 69
percent while overall milk production increased 48 percent.
Project impacts were measured based on an independent in-depth
baseline study carried out by the Washington-based International
Food Policy Research Institute (IFPRI) (see Appendix F) and
monitoring and evaluation data collected by CARE with a
methodology audited by IFPRI and the Bill and Melinda Gates
Foundation (see Appendix E). I also found that the emerging
explanation of how these results were achieved did not fit
comfortably with the logic of the three prominent theories of
poverty reduction in the management literature. There were no
large multinational companies involved in innovatively selling
products and services to the farmers; microfinance was actually
92

readily available but did not have any influence in reducing
poverty; and in the subsistence rural economy there was no
prospect for the growth of small and medium-sized enterprise
employment in the near future. Certainly, some elements of each
of the three approaches could be recognized in CARE's activities
and in the marketplace, but the overall logic of existing
approaches in the management literature could not explain CARE’s
apparent success in reducing poverty.
How Might Success in Reducing Poverty for Poor Producers Be
Explained?
I found instead that CARE’s success in reducing poverty was
the result of its ability to enhance market practices and change
market structures in ways that redistributed social control for the benefit of
poor producers within their embedded market constraints. I define
social control in an economic context as a condition in which an
individual in society is able to assume the attitudes and actions
necessary to increase his or her self-sufficiency or decision-
making power over his or her economic assets, inputs, production,
outputs or transactions. Social control includes both economic
93

dimensions (such as increased productivity and market access) as
well as social dimensions (such as greater capabilities and
power) which are both ends in themselves as well as the means to
the ends of greater economic incomes and reduced poverty. The
redistribution of social control combines both practical market
practice enhancements and market structural changes. My view of
enhanced social control for the benefit of poor producers
resonates with Amartya Sen’s notion of the means by which an
individual acquires capabilities and resources “in pursuit of
whatever goals or values he or she regards as important” (Sen,
1985: 203). My concept of social control also recognizes the
relational aspect of control – that it is a condition, similar to
that of power and agency, which is necessarily relative to others
in society. This definition of social control incorporates the
concepts of empowerment and agency, but situates them within the
context of market and economic control (Pardo del Vol & Lloyd,
2003). Within the broader discourses on power in the social
sciences, the present concept of social control is consistent
with structuration theory which defines power as the capacity to
achieve outcomes within institutional constraints due to the
94

interdependence of structure (e.g. value chain development) and
agency (e.g. empowerment of individual farmers) (Giddens, 1984).
Within the long history of literature on power and poverty, the
concept of social control builds on the logic that markets can
enable people to lift themselves out of poverty, but in many
instances the distribution of power within market institutions
and practices constrains the benefits of growth from reaching
poor producers (Green, 2008).
CARE recognized the relative lack of individual market,
economic and social power that poor producers possessed relative
to other value chain actors and was astute in its understanding
of the structures and relationships within markets that
perpetuated unequal relations. I found that CARE’s facilitative
role in the reallocation of social control toward poor producers
worked to reduce their poverty through two mutually reinforcing
mechanisms: reducing the market failures that particularly
affected poor producers and reducing the failure of government to
provide basic services and uphold basic rights. Figure 3
summarizes the explanatory model that emerged from the data.
95

Figure 3: Poverty Alleviation as the Redistribution of Social Control
96
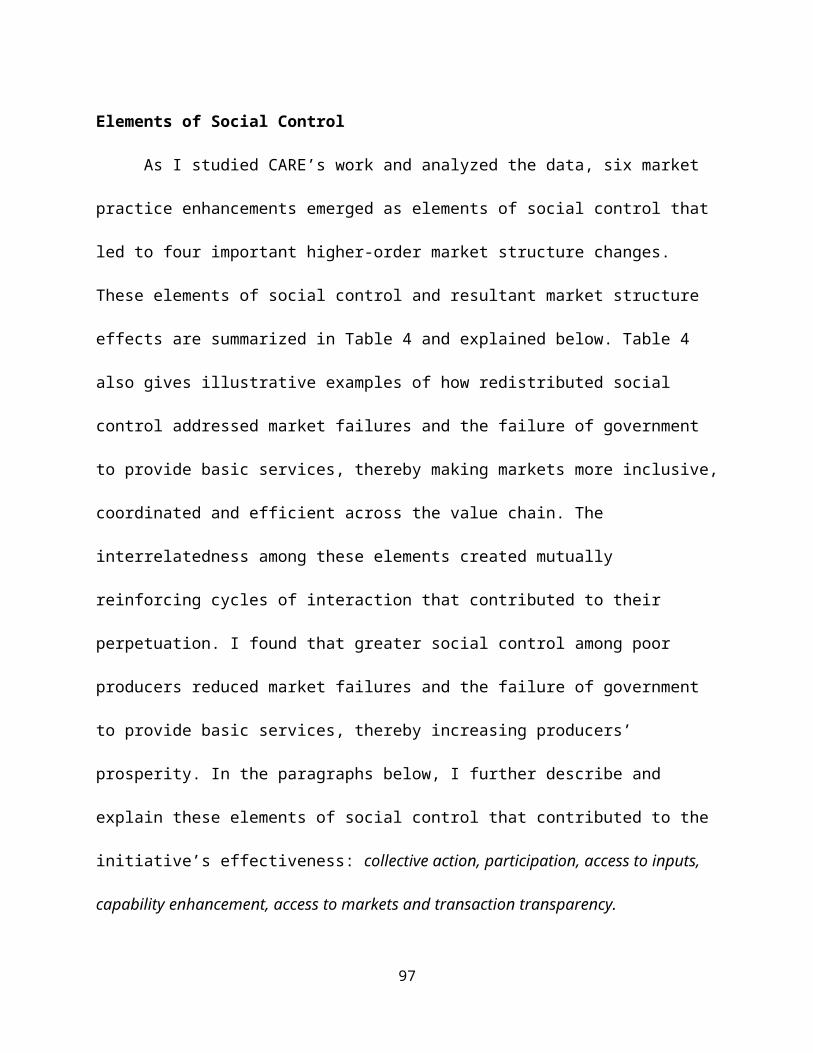
Elements of Social Control
As I studied CARE’s work and analyzed the data, six market
practice enhancements emerged as elements of social control that
led to four important higher-order market structure changes.
These elements of social control and resultant market structure
effects are summarized in Table 4 and explained below. Table 4
also gives illustrative examples of how redistributed social
control addressed market failures and the failure of government
to provide basic services, thereby making markets more inclusive,
coordinated and efficient across the value chain. The
interrelatedness among these elements created mutually
reinforcing cycles of interaction that contributed to their
perpetuation. I found that greater social control among poor
producers reduced market failures and the failure of government
to provide basic services, thereby increasing producers’
prosperity. In the paragraphs below, I further describe and
explain these elements of social control that contributed to the
initiative’s effectiveness: collective action, participation, access to inputs,
capability enhancement, access to markets and transaction transparency.
97
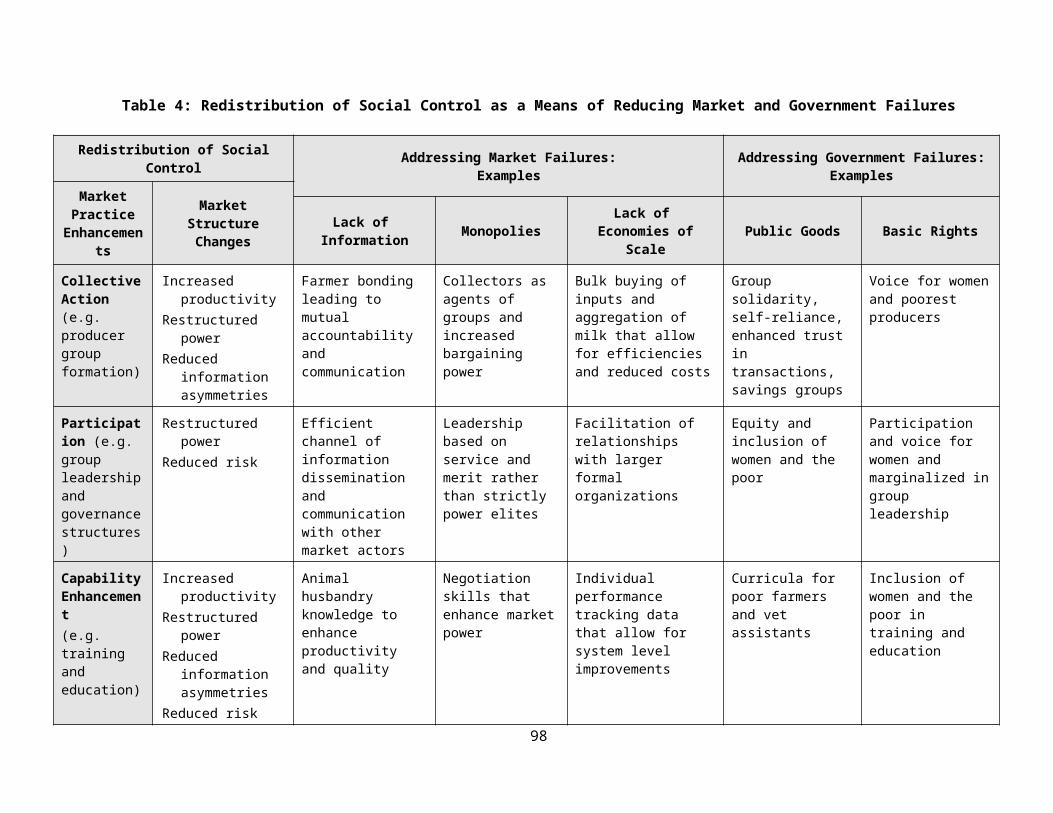
Table 4: Redistribution of Social Control as a Means of Reducing Market and Government Failures
Redistribution of SocialControl Addressing Market Failures:
ExamplesAddressing Government Failures:
ExamplesMarketPracticeEnhancemen
ts
Market Structure Changes
Lack of Information Monopolies
Lack of Economies of
ScalePublic Goods Basic Rights
CollectiveAction (e.g. producer group formation)
Increased productivity
Restructured power
Reduced information asymmetries
Farmer bonding leading to mutual accountability and communication
Collectors as agents of groups and increased bargaining power
Bulk buying of inputs and aggregation of milk that allow for efficiencies and reduced costs
Group solidarity, self-reliance, enhanced trust in transactions, savings groups
Voice for womenand poorest producers
Participation (e.g. group leadershipand governancestructures)
Restructured power
Reduced risk
Efficient channel of information dissemination and communication with other market actors
Leadership based on service and merit rather than strictly power elites
Facilitation of relationships with larger formal organizations
Equity and inclusion of women and the poor
Participation and voice for women and marginalized ingroup leadership
CapabilityEnhancement (e.g. training and education)
Increased productivity
Restructured power
Reduced information asymmetries
Reduced risk
Animal husbandry knowledge to enhance productivity and quality
Negotiation skills that enhance marketpower
Individual performance tracking data that allow for system level improvements
Curricula for poor farmers and vet assistants
Inclusion of women and the poor in training and education
98

Access to Inputs (e.g. input market linkages and technologies)
Increased productivity
Reduced information asymmetries
Quality testing, optimal feed mixes, and relationships between farmersand suppliers
New and multiple choices and points of access for inputs
Enhancement of village demand and microfranchising systems for inputsellers that create sustainable access
Quality monitoring of commercial feedand microfranchising standards
Women as vet assistants and feed sellers; customized bicycles for women
Access to Markets (e.g. output market linkages)
Increased productivity
Reduced information asymmetries
Reduced risk
Relationship building between farmersand milk buyers
Milk supply contracts thatenhance control and power over monopoly buyers
Reduction of transaction costsfor buyers, collectors, and farmers through milk aggregation
Enhanced milk quality and trust in the dairy value chain
Women as collectors
Transaction Transparency (e.g. rules of exchange)
Restructured power
Reduced information asymmetries
Reduced risk
Lactometers anddigital fat testing meters
Transparent digital fat testing that overcomes processor monopoly
Increases in returns to investment and scale by rewarding farmersfor improved milkquality
Establishment of fat testing practices in the absence of government standards
Fairness in transactions regardless of social status and market power
99
Market Practice Enhancements
Collective Action
An important element in redistributing social control toward
poor producers was organizing farmers into producer groups
(Sarker, 2005). Group formation as a form of collective structure
gave farmers greater individual and market power through
achieving economies of scale and reducing transaction costs.
Group purchases reduced costs of inputs through bulk buying of
feed and veterinary medicines, thus improving productivity. The
formation of groups also strengthened the voice of the farmers’
interests in local decision-making processes. Concurrently,
groups allowed for the aggregation or “bulking” of milk into
larger volumes, reducing the transaction costs of milk collection
and transportation and improving farmers’ bargaining power with
formal or informal sector buyers. Aggregating milk into larger
volumes also made it easier and more profitable for collectors to
provide service to producers rather than relying on independent
collectors who were otherwise incentivized to maximize their own
incomes at the expense of the farmers. Groups gave producers the
100
power to elect milk collectors to act as agents of the group in
transporting and selling the group’s milk, which in turn
increased accountability in transactions within the group and
provided greater access to information from the marketplace.
CARE’s organization of poor dairy producers into 1,163
groups also created efficient channels for information
dissemination and training. As a group began to build shared
experiences through joint problem-solving and information
exchange, members developed an increasing sense of mutual
accountability, solidarity and self-reliance (what one
interviewee called “farmer bonding”). Farmer groups also provided
the basis for more formal relationships with other value chain
actors, improving communication and trust in exchange
relationships. A male farmer who had previously lost his land to
river erosion concurred: “I used to spend a lot of time and money
selling milk personally. Milk selling in a group is saving me
time and money. I can now spend more time with my cows and
crops.” Therefore, by means of collective action, the farmers
were able to augment their autonomy, decision-making power,
101

productivity and access to information in responding to
potentially acute market constraints.
Participation
CARE not only helped producer groups form but paid
particular attention to the potential for reducing individual
powerlessness through participation and improvements in the
quality of group leadership and governance. A CARE employee
described the process of group formation:
So what we would do in an initial meeting is lay out what we’re planning to do in the project. Advise them on why we think a group of 25 to 35 is optimal. And help them to beginunderstanding the key characteristics of what we think the group leader should have in terms of the skills, the competence, the reading and writing skills, management skills, etc. But the selection of those leaders is done by them.
Rather than allowing producer groups to be captured by local
elites or men at the expense of women or more marginalized
members, CARE ensured that rules and norms of group meetings
operated to include women and the poorest or least vocal members.
This was achieved based on CARE’s reputation as being a neutral
102

third party and the competencies of CARE field facilitators who
were skilled in group work and familiar with the dynamics of
village politics. Ensuring the participation of women in farmer
groups created spaces of empowerment for unobtrusive expansion of
otherwise institutionalized gender roles (Natajaran, 2005).
CARE’s market initiatives also redistributed social control
by supporting the training and self-employment of 28 women milk
collectors and 42 women veterinary assistants (local animal
health care workers), both jobs traditionally carried out by men.
Although this process of enabling greater gender equity and
opportunities for women was not always lacking in pushback from
community members, CARE’s localized knowledge of the contours of
institutionalized beliefs about gender norms and roles enabled
them to pursue promising opportunities with minimal community
backlash. As a female milk collector who had lived in extreme
poverty stated:
Previously I had no idea about hygienic milk collection, hadno linkage with a market, had very limited social contact and degraded status, had limited knowledge about cow management and balanced feeding; but now I have started
103

believing in my aptitude… that I have the power and capacityto change my way of life.
The International Food Policy Research Institute evaluated CARE’s
dairy-related work in Bangladesh and indicated that “the project
is having positive impacts on women’s asset ownership (physical
and natural capital); decision making power; and human, social
and political capital” (CARE, 2011: 19). A female paravet
(veterinarian practitioner) who had been trained by CARE
concurred that the initiative had been successful, stating: “my
acceptance level in the community and in my family is growing up.
I don’t feel helpless any more. Now I am self-dependent and
confident.” My access to CARE’s raw quantitative data on group
composition and governance allowed independent statistical
analysis which showed that milk income increased as the
percentage of women in the farmer group increased. In addition,
groups with women leaders earned more income from milk sales than
groups with male leaders (see Appendix H).
These shifts in social control through increased
participation of women also triggered accompanying empowerment
104

beyond dairy-related activities. One example was group income
savings activities as illustrated by a CARE manager (and further
documented in Appendix I):
…the fact that they have a common pool of savings they can rely on, especially given the households we are working with,some of whom are landless, that does give them an opportunity, gives them a bit of a safety net in some ways. And I think it’s not just the money, it’s also the fact that they have these relationships, which we think is tremendouslyimportant for them.
CARE’s initiative to effect incremental changes in
hierarchical power and create inclusiveness through participatory
improvement gave farmers greater self-sufficiency in managing
their assets and production processes. It enabled them to
mobilize savings and overcome liquidity constraints that often
act as barriers for small farmers to invest in the health and
nutrition of their livestock.
Capability Enhancement
Chronically poor producers engage in social and economic
life on highly adverse terms (Cleaver, 2005). Capability
105

enhancement is a means of social control that emerges from
increases in the capacity of people to satisfy their own needs
(Nussbaum, 2011; Sen, 1999). Specifically, CARE drew on a
repertoire of actions to enhance training and education for
smallholder farmers in ways that increased relevant competencies.
The need for capability enhancement was highlighted by a CARE
manager who stated that poor farmers have “no access to anybody
else who is providing training to them, either from government or
from the private sector; somebody needs to make the investment in
the training.” Education and training provided dairy farmers with
the knowledge and skills to improve their market power and the
returns on investment in their cows.
The poor producers that CARE worked with had an average of
only one and a half years of formal schooling and often possessed
limited knowledge of productivity-enhancing animal husbandry
concepts such as immunization, parasite treatment, animal
nutrition and feed storage methods (Ahmed, et al., 2009).
Typically, however, farmers were eager to acquire knowledge. As
one woman farmer with no formal education stated, “I know the
106

value of education. I could not get it, but I am sending my
daughters to school.” CARE’s training practices included a
standardized curriculum tailored to the producers’ limited
material resources and literacy levels. The curriculum relied on
pictures, prioritized the most essential elements to improve
animal productivity (e.g. feeding green grass to lactating cows)
and included training on their rights as well as market
negotiation skills. CARE’s complement of 55 field staff were
intentionally drawn from the regions where they worked, ensuring
as close a match as possible to regional dialects and customs and
understanding of local market constraints and opportunities.
After initial training sessions, farmers were enabled to
sustain improvements in their dairy production. To achieve this,
group members tracked their performance in adopting ten primary
dairying practices that could be attained within the resource
constraints of their institutional setting (e.g., keeping records
on cattle health). This self-evaluation process, termed
“participatory performance tracking,” consisted of meetings every
few months where farmers would place pictures representing each
107

practice they had successfully implemented in a column by their
name on a large 10 (practices) x 30 (group members) matrix. This
created an opportunity for members themselves to take the
initiative in identifying obstacles to further adoption of
practices and enhanced their abilities to improve their own
performance. Independent statistical analysis of quantitative
data showed that the greater farmers’ knowledge of animal feeding
and health practices, the greater their milk-related incomes (see
Appendix J).
CARE’s implementation of capability training and education
on essential animal husbandry practices and market opportunities
therefore imparted greater control over farmers’ assets (i.e.
reliably increased milk productivity and quality), inputs
(immunizations and feed) and transactions (market information and
negotiation skills). In offering training in hygiene and other
practices, this also reduced the risk of farmers’ milk becoming
contaminated or spoiled. By building capacity, CARE thus improved
the level of self-sufficiency and decision-making power of
108

producers and increased their social control relative to both
upstream and downstream value chain actors.
Access to Inputs
Increasing access to markets for productivity-enhancing
inputs (like improved feed, vet services and medicines) and
technologies (like artificial insemination with improved animal
genetics) was revealed by this study as a central element in
redistributing social control toward poor producers. To increase
opportunities for farmers to use productivity-enhancing inputs
and technologies, CARE worked with various value chain actors to
enhance their accessibility and affordability.
For example, CARE worked with feed companies to encourage
them to package rations in 10kg bags (rather than 40kg). These
quantities were more useful and affordable to farmers and
increased feed companies’ overall sales. Another example is the
customized three-wheeled bicycle developed by CARE for use by
women milk collectors that could also be used to transport feed
for sale in the villages. Simple village-level technologies for
109
feed preparation and storage also ensured that animals received
the maximum nutritional value from their diet. In these ways, the
inputs and technologies introduced through CARE’s facilitation of
market interactions gave smallholder farmers, especially women,
more social control over resource use and increased ownership of
input processes in ways that increased their incomes and ease of
transaction with upstream suppliers.
CARE also facilitated distribution channels for inputs such
as green grass, concentrate feeds, medicines, and artificial
insemination services that gave farmers much greater self-
sufficiency and control than they had previously possessed with
existing channels. In many cases, the smaller and remote villages
where CARE’s target farmers lived lacked markets or shops that
carried the products and services they needed. Most of these
villages, along with approximately 30 percent of the rural
population, were often beyond the “last mile” of formal
commercial distribution channels (McKague and Tinsley, 2012;
Vachani and Smith, 2008). CARE facilitated the piloting of
multiple alternative market practices simultaneously to see which
110
approach might be most viable in the creation of sustained input
market linkages. Examples included assisting individuals to
establish small dairy input shops in their villages and
supporting milk collectors, veterinary assistants, and rural
sales women in the sale of feed and medicines along with their
regular goods and services. CARE partnered with large private-
sector processors to extend input provisions to smallholder
farmers. CARE also initiated efforts to improve the quality of
inputs through enhanced quality testing and microfranchising
(Kistruck, Webb, Sutter & Ireland, 2011) of emerging village
input shops. Over time, the distribution channels with the
greatest potential for farmer benefit and commercial
sustainability in a particular region emerged. Statistical
analysis showed that farmer access to improved feeds, medicines
and artificial insemination were associated with increased
incomes (see Appendix K). All of these activities generated
greater input and output selection and greater power and
productivity for the farmers.
111
Access to Markets
The fifth important market practice enhancement that
redistributed social control to poor producers was increased
accessibility to product markets. CARE facilitated farmers’
ability to create new output market linkages and relationships.
Dairy farmers have a unique need in that they not only must
connect their supply to the strong and growing sources of demand
for milk products in larger population centers, but they must
have the opportunity to sell what they produce quickly. Thus,
small farmers face the perishability of milk produced in a hot
climate with no village-level refridgeration infrastructure. They
also confront market challenges, including varying seasonal
demand, lack of transportation infrastructure, lack of basic
information about market opportunities, and inadequate milk
collection practices. To address these market access challenges,
CARE created disincentives for less than transparent output
market actors to remain in the market and improved opportunities
for honest market actors who could share in the benefits as
112
farmers increased their incomes. As a female farmer living in
extreme poverty recounted:
Two years ago the price of milk was very low. There were very few collectors available and we had no other way but tosell to the collectors. They took advantage of this and paida low price for the milk we used to sell.
Traditionally, independent milk collectors travelling door-to-
door to buy milk were tempted to add water to the milk to
increase milk volume and maximize their own incomes. Farmers were
also tempted to do this. From CARE’s perspective, this not only
created product quality issues and consumer health concerns but
also reduced trust in the value chain. To address this, CARE
helped educate farmers in the importance of keeping milk free of
water and contamination and encouraged farmer groups to nominate
a milk collector from their own village and pay them a
competitive daily flat rate (made possible by milk aggregation).
With these new arrangements, losses due to spoilage by collectors
were reduced to zero. Local collectors, effectively acting as
agents of the group, increased opportunities for accountability
and trust in the value chain and allowed the collector to be a
113

reliable conduit for reporting information about market
opportunities and prices back to the group.
Statistical analysis of quantitative data showed that
producer households that selected their own collector had
significantly higher total household income from dairy sales than
households that did not choose their own collector (see Appendix
L). As noted earlier, CARE also supported opportunities for women
to become milk collectors. As one CARE interviewee described:
We had a situation where a widow in a community or someone from a minority religious community has been appointed to bea collector. I think what we’ve done there is provide them with a little bit more training, a little bit more support. And in some cases, we may decide to help them with access toa bicycle which we might fund or partly finance in order forthem to have the traditional support to be able to do this, to interact with the market. But a lot of it relies really on the groups. This is not something that CARE would come inand intervene in and expect to work if the group didn’t havebuy-in to assist them. So I think we’ve never gone out and identified a woman collector and said, oh, you should make her a collector. It’s been a process in which the community would say to us, we’ve identified someone here we think could be a good collector. She’s a woman. These are the constraints that she’s facing. How could you help us to resolve this?
114
This continued strengthening of market linkages, in turn, led to
the implementation of more value-added strategies as well. Market
practices such as packaging liquid milk, making cheese curd, or
separating the cream from the milk allowed farmers to diversify
their portfolio of products for sale and broaden their market
opportunities. Value addition strategies helped farmers turn
their labor into increased income and reduced risk by creating
less perishable and more easily transported products.
CARE also served as a temporary broker to expand farmers’
market opportunities by helping establish longer-term relations
between the farmers and both formal sector buyers (chilling
plants of large dairy processors) and informal sector buyers
(local restaurants, tea shops, hotels, yogurt makers and sweet
shops). These relationships served to inform farmers of quality
and volume demands and buyer expectations. By developing trust
through direct relationships along the value chain between
sellers and buyers, poor producers also gained market power
through enhanced knowledge of prevailing market prices and access
to a wider choice of trading partners. Regardless of whether milk
115

was sold to the formal or informal sector, CARE helped to
construct paths towards greater market opportunities for the poor
that gave them more information, power and control over the terms
of trade for the milk they produced.
Transaction Transparency
Results revealed that increasing transaction transparency
was a critical mechanism in the reallocation of social control to
the smallholder dairy producers. Increasing transparency helps
markets work as coordination devices (Aspers, 2011). Transparency
in exchange relationships increases self-sufficiency and
decision-making power for poor producers by improving
accountability, trust, methods of product or service assessment,
and equitable market development. A key issue for dairy farmers
is how milk fat is tested, which in turn determines the price
that farmers are paid per liter of milk. CARE reported that fat
testing evaluations had shown a marked discrepancy between fat
content as measured when collected from farmers and when measured
at the chilling plant. Under prevailing practices, milk was often
116
not tested, or was tested away from the observation of farmers or
their collectors, a strategy that exacerbated information
asymmetries between producers and buyers and compromised the
quality of information necessary to establish fair prices. In
some instances, milk was tested by buyers simply plunging their
hands into the milk to subjectively estimate its fat content. As
a CARE employee described the situation:
If you are an honest farmer, who has a high fat percentage, you are going to end up getting a lower price than you should. And one of your neighbours, who may be adding water to their milk, actually has a benefit. So we just think it’sthe complete misalignment of incentives.
To enhance transparency, CARE facilitated the introduction of
lactometers (simple milk quality testing devices) and digital fat
testing meters (more advanced devices) into the dairy value chain
and trained both producers and collectors in their use.
Evaluations of the introduction of digital fat testing meters at
chilling plants showed that the increased transparency they
provided was responsible for a 20 percent increase in the price
of milk paid to farmers. These significant improvements in
117
transparency led to much greater market price accuracy, more
equitable milk prices and tangible incentives for farmers to
produce higher quality milk.
Another dimension of the milk production market is the
occasional buying and selling of a cow at regional “haats” or
markets. In order to increase the transparency of this
transaction, CARE introduced a cattle health card (a new practice
in Bangladesh) in which the animal’s immunizations and deworming
and other health treatments were explicitly and clearly
documented by a vet or veterinary assistant along with known
breed information. This cattle health card transparently
communicated information which could reduce buyer uncertainty
about the health risks and the genetic status of the animal and
allowed for an exchange price that reflected the investments a
farming household had made in their cattle. These improvements
were particularly valuable in this context, given the absence of
government standards and enforcement of basic transparency in
commercial transactions.
118

Market Structure Changes
Apparent in the foregoing explanation of the six enhanced
market practices are the resulting broader market structure
exchanges that led to positive social and market outcomes and
reduced poverty (see Figure 3). These higher-order elements of
the redistribution of social control are increased productivity,
redistributed power, reduced information asymmetries and reduced
risk.
Increased Productivity
Enhanced farmer productivity permits greater efficiency in
converting inputs (labor, assets, resources) into outputs (milk,
profit), thus enabling greater incomes that allow poor producers
to live lives that they value. Enhanced market practices
contributed to increased productivity through greater farmer
knowledge of animal feeding, health care, record keeping, and
hygienic practices. Value addition strategies and access to
technologies such as improved animal genetics and artificial
insemination also increased farmer productivity. Farmer groups
119
reduced costs of inputs through bulk purchases and aggregated
their milk output, thus reducing their own costs as well as those
of milk buyers and input sellers. Therefore, collective action,
capability enhancement, access to inputs and transaction
transparency all contributed to increased farmer productivity.
Restructured Power
CARE’s enhanced market practices worked to rebalance power
relations in the value chain toward poor producers. Mosedale
(2005: 250) writes that “the greater and more asymmetrical are
the social limits that define what is possible with a given power
relation, then the closer that relation approximates a state of
domination.” In groups of 30, farmers had greater negotiating
power and choice among buyers and could enter into contracts with
larger milk buyers and input sellers. Group formation also
empowered producers by providing a workable platform for mutual
problem solving and solidarity. Group governance structures based
on principles of equity rather than social stratification helped
120

women and poorer village members participate equally in decisions
that affected their incomes. Capability enhancement, increased
personal empowerment and access to inputs and markets increased
market power leading to structural changes in the market that
benefited poor producers.
Reduced Information Asymmetries
When poor individuals have little formal education and
limited literacy and numeracy skills, information asymmetries
that benefit more powerful market actors are a significant
obstacle to reducing market failure and allowing poor producers
to improve their incomes. CARE’s market practice enhancements
helped to create structural changes in the marketplace to reduce
information asymmetries for poor producers. Introducing digital
fat testing systems and cattle health cards reduced product
quality information asymmetries. Group-nominated milk collectors
also helped bring back information to the group from the
marketplace, reducing market information asymmetries. In
addition, when village-level agricultural input shops began to
121
open, CARE ameliorated transaction information asymmetries by
working with the shop owners to establish standards for the
provision of greater information to producers. In these ways,
collective action, capability enhancement, access to inputs and
markets and transaction transparency all contributed to a
structural change in the market that increased access to
information for poor producers.
Reduced Risk
Due to the nature of poverty and the fragmented and
underdeveloped nature of the dairy sector, farmers were exposed
to diverse risks and possessed few instruments on their own to
deal with these risks (Banerjee and Duflo, 2007; Duflo, 2006; Jha
& Dang, 2009). Farmers were understandably risk averse “because
they have to secure their household needs from their current
production or face starvation. There is no room for aiming at
higher income levels by taking risky decisions” (Mendola, 2007:
55). Because farmers were vulnerable to risks due to weather,
diseases, natural disasters, price fluctuations, illness and
122
unreliable roads and other infrastructure, they often
intentionally chose “low-risk, low return activities” binding
them to the reproduction of traditional economic practices which
were often sub-optimal (World Bank, 2001: 142). CARE helped
farmers reduce risk by pooling risks across time and
contingencies (e.g. grouping farmers’ savings), temporarily
transferring start-up risk to wealthier actors (like CARE) and
providing more predictable sources of inputs, outputs and
exchange. Virtually all of the initiatives undertaken by CARE had
the effect of lowering marginalized actors’ risk burdens and
therefore this element of the redistribution of social control
was an especially important inducement for the poor to embrace
enhanced market practices that led to market structure changes.
To summarize, the data in this study revealed that the
redistribution of social control was a key explanatory factor in
CARE’s ability to reduce poverty for poor producers. The
redistribution of social control, in turn, is comprised of lower-
order market practice enhancements and higher-order market
structural changes. Further, I found that the redistribution of
123

social control reduced poverty by addressing market and
government failures, which are discussed in the next section.
Reduction of Market and Government Failures
Having analyzed the core elements of social control that led
to CARE’s success, I continue the analysis of my model by
explaining how the redistribution of social control led to
poverty alleviation through the mutually reinforcing mechanisms
of reducing market and government failure in the producers’ local
context. Table 4 summarizes how these reductions in failure were
the result of redistributed social control.
Market Failures
Poor producers often face institutionalized patterns of
marginalization that manifest in an inequitable distribution of
information, tendencies toward monopoly power and economic
exclusion, and the inability to reach economies of scale (Mendoza
& Thelen, 2008; Banerjee & Dufflo, 2011; Karnani, 2011). Poor
people living on less than $2 per day are often less educated,
124
less literate and less informed than other members of society
making them vulnerable to exploitation. Because poor people often
live in rural areas with limited infrastructure, competition for
the provision of goods and services, when they are available at
all, is often extremely limited and the poor are often forced to
turn to providers with monopoly power. Further, the productive
activities of poor households are often restricted to initiatives
and technologies that do not allow for increasing returns to
scale, leaving little opportunity for growth or improvement.
CARE’s redistribution of social control toward poor producers
through the enhancement of market practices addressed each of the
three types of market failures that disproportionately affect the
poor: information asymmetries, monopolies and lack of economies
of scale (Banerjee & Dufflo, 2011; Karnani, 2011).
First, the redistribution of social control gave farmers
greater control over and access to information and knowledge.
Farmer training in safe milk handling practices and animal
nutrition allowed farmers to increase the quality and volumes of
milk produced per unit of input. Demonstrations of appropriate
125

technologies for farmers to package or process their milk before
sale gave them valuable knowledge about how they could leverage
their time and technology to increase their revenues. The
introduction of cattle health cards documenting vaccinations and
deworming treatments reduced uncertainty for potential buyers
when farmers sold their animals. Greater access to and control
over information allowed farmers to increase their incomes
through enhancing the productivity of their cows, reducing the
costs of inputs, avoiding losses due to milk spoilage, earning
greater returns from adding value to their milk, selling their
animals at a premium, and avoiding exploitation.
Second, CARE’s tactical market interventions gave poor
farmers greater control over existing monopolies by introducing
greater choice and competition and by facilitating pre-agreed
terms of exchange. When farmer groups chose to have one of their
own members trained and employed as a milk collector, when they
aggregated their milk to provide volumes that made for a viable
livelihood, and when the collectors were paid a flat rate to act
as the group’s agent, they freed themselves from reliance on
126
collectors with monopoly power who lacked incentives to act in
the best interests of the group. CARE encouraged the provision of
inputs through multiple sources, including large processors,
local shops, collectors, and vets, thus reducing reliance on any
single input provider. CARE also helped farmers identify options
for multiple buyers of their milk. Where there remained only a
single milk buyer or provider of input services available to a
farmer group, CARE helped the groups agree on a Memorandum of
Understanding for terms of trade that acted to limit opportunism
by more powerful market actors. These tactical market practices
introduced by CARE addressed market failures that attenuated
local monopolies, enhanced predictability, and gave farmers
greater choice and control over production and exchange.
Third, CARE redistributed social control in a way that
allowed poor farmers, collectors and veterinary assistants to
achieve greater economies of scale and thus overcome a key market
failure for smallholder farmers. Farmers organized into groups
could achieve scale economies by aggregating the purchase of
feeds and medicines. Larger demand made the provision of inputs
127

more attractive to shop owners and service providers and
occasionally bulk purchasing discounts could be negotiated. The
aggregation of outputs also incentivized milk collectors to
provide greater service to farmers (i.e. twice a day milk
collection), allowed animal health workers and shop owners to
make a viable living, and reduced transaction costs for buyers
who preferred fewer numbers of higher-volume milk deliveries.
Government Failures
Analysis of my data revealed that the redistribution of
social control achieved by CARE’s set of enhanced market
practices moved beyond the realm of market failures to address
government failures. As noted in the literature on pro-poor and
inclusive value chains, “it is not unusual for the main
impediment to poor people engaging with value chains to be the
state which purports to represent them” (Mitchell, Keane & Coles,
2009). Government failures refer to the “cases where, not as a
result of individual errors of judgment or lack of expertise but
for fundamental, structural or other reasons, government
128

intervention cannot produce the results at which it is aimed”
(O’Dowd, 1978: 360; see also Wallace & Dollery, 1999). Poverty is
multifaceted and its reduction requires not only increased
incomes, but also equitable access to basic public services and
support for universal human rights and freedoms (Sen, 1999).
Equitable access to basic public services or public goods, such
as education and standards for weights and measures, are
necessary to allow poor households to work their way out of
poverty. The continued marginalization of individuals based on
their gender or other social or cultural characteristics
entrenches discrimination that undermines equal rights and
opportunities for the poor to fully participate in society. The
portfolio of practices that CARE enhanced addressed issues of
income, but also supported the rights of the poor as agentic
individuals with equal access to public services. Indeed, my data
suggest that the provision of public services and support for
basic rights were closely linked to success in reducing market
failures or government failures.
129
First, the lack of access to basic public services such as
education and regulated standards of commercial practice was
addressed by CARE in a number of ways. Most directly, CARE’s
introduction of standardized training curricula customized for
rural animal health care workers and farmers with low literacy
levels led to improved knowledge and capabilities in the absence
of adequate public education. CARE also supported a
microfranchising approach (Jones-Christensen, Parsons, &
Fairbourne, 2010; Kistruck, Webb, Sutter & Ireland, 2011) to
organizing veterinary assistants and dairy input shops that could
set fair expectations for their pricing, levels of service,
quality of products, and weights and measures in the absence of
government regulation and enforcement mechanisms to protect the
interests of farmers. Also, in the absence of public goods such
as adequate transportation and electricity infrastructure to
support milk refridgeration, CARE trained farmers in hygienic
milk handling practices to reduce losses due to spoilage. These
market practices addressed the failure of governments to provide
130
basic public services such as education, infrastructure and
standards of commercial practice.
Second, weak or absent governments may fail to uphold basic
human rights or address discrimination. CARE’s practice of
supporting women as group leaders and milk collectors directly
increased women’s capabilities and empowerment. Thus CARE’s
market practices addressed governance failures by increasing the
capabilities, freedoms and power of the country’s most
marginalized market participants. This not only acted to reduce
poverty, but also simultaneously worked to expand human rights
and economic opportunities.
To summarize, the analysis of my data demonstrated that
increases in social control of poor producers by means of
practical, incremental and non-confrontational market practice
enhancements reduced poverty through two mechanisms: reducing the
market failures that disproportionately affect the poor through
enhanced knowledge, increased scale economies, and the provision
of alternatives to monopolies, as well as compensating for
government failures by upholding the rights of the poor and
131

offering basic services that improved their welfare and
capabilities.
Institutional Leveraging
The data also revealed that the relationship between
redistribution of social control and effective poverty
alleviation was moderated by the extent of CARE’s institutional
leveraging (see Figure 3). Institutional leveraging is the process
of stimulating market change by meticulously framing and
implementing new market practices within the existing
institutional logics and incentives of value chain actors.
Institutional leveraging gave local actors a way to make sense of
new market practices within the cognitive structure of their own
logics about markets and to reduce their experienced uncertainty
in implementing new market initiatives. The various market-making
strategies that I identified during my research were implicit to
CARE’s behaviors rather than explicitly recognized or articulated
by the organization. Institutionalization of market practices is
the perception by market participants that they are likely to
132
endure as a legitimate aspect of production and exchange. I argue
that markets cannot be created independently of their social
enactment. Creating and enhancing market practices in ways that
are aligned with local institutionalized understandings of what
constitutes a socially appropriate and economically viable market
is crucial to successful market creation. This study found that
creating market practices that are carefully aligned with local
institutionalized understandings of what constitutes a socially
appropriate and economically viable market is a crucial
moderating variable to successful market enhancement for poverty
alleviation. I propose that CARE customized incentives around the
institutionalized logics of market participants by applying four
institutional leveraging mechanisms: provision of evidence,
contextualization of knowledge, legitimation of transactions, and expansion of
relationships. These mechanisms are summarized in Table 5.
133

Table 5: Institutional Leveraging Mechanisms of Market Creation
Dimension ofMechanisms
Institutionalizing Mechanisms of Market Creation
Provision ofEvidence
Contextualization of
Knowledge
Legitimationof
Transactions
Expansion ofRelationships
Definition Perceived incontrovertible proof that a product, technique or market has enduring value for themarket participant
Training and technical assistance embedded and contextualizedwithin the institutional values of the community
Cultural support for markets and market participation within local institutionalized norms and values
Relationship-building directed toward community and political actors to affect the allocation of material resourcesand collective cultural support for the market
Example Pilot projectthat demonstrates better outcome quality and volume from improved inputs
Training locally selected community leaders to translate and diffuse knowledge
Legitimating quality testing through accessto socially accepted measurement methods
Matchmaking meetings; multi-stakeholder working groups; international dairy conference
Basis for need
Risk minimization
Knowledge internalization
Social endorsement
Political and social approval and trust
Source of momentum forinstitutionalizing the market
Proof of utility
Local leadership andknowledge buy-in
Alignment of expectations about market transactions
Regulatory, social, and community support
Perceived value
Assurances ofreturn on investment
More effectiveknowledge transfer and diffusion
Faster, easierimplementationthat is sustainable
Sustainability of market developmentinitiatives
Role of Demonstrator Knowledge Legitimacy Advocate for poor
134
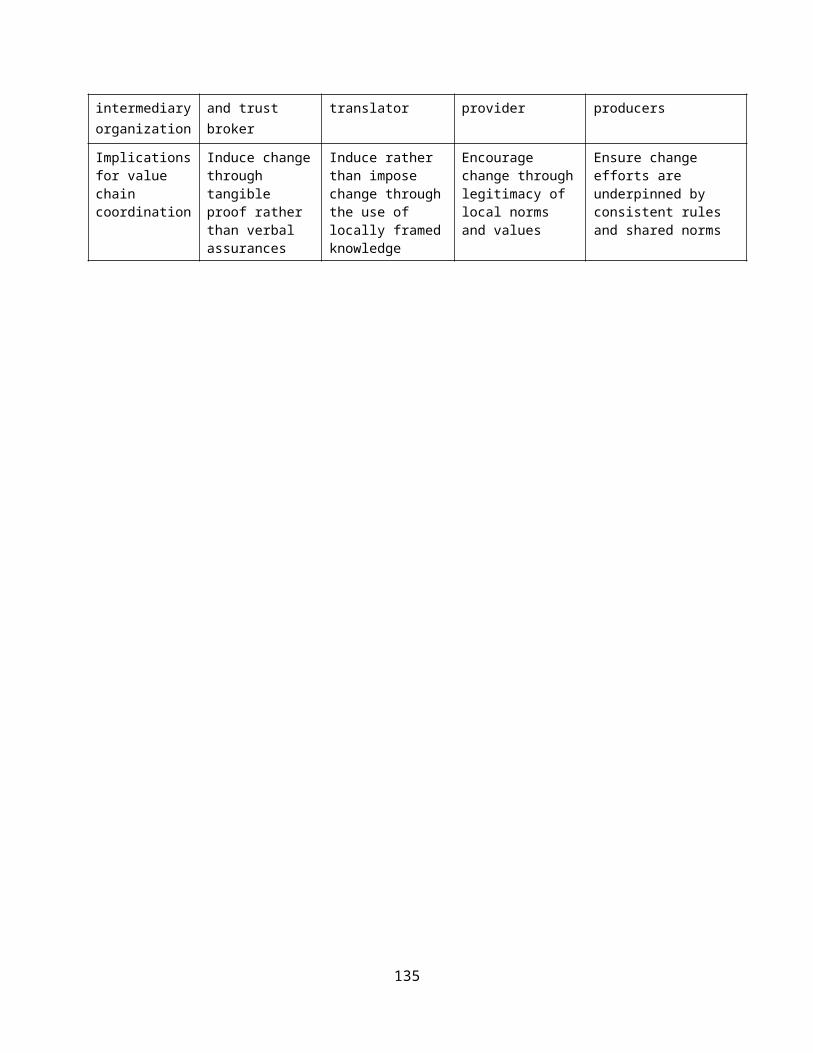
intermediaryorganization
and trust broker
translator provider producers
Implicationsfor value chain coordination
Induce changethrough tangible proof rather than verbal assurances
Induce rather than impose change throughthe use of locally framedknowledge
Encourage change throughlegitimacy of local norms and values
Ensure change efforts are underpinned by consistent rules and shared norms
135

Institutional leveraging is a strategic intervention that
secures a maximum cognitive fit between existing localized
institutionalized logics or beliefs and proposed change
initiatives and then builds off this congruence to incentivize
and propagate change. Institutional leveraging achieves this fit,
first, by reconstructing institutional understandings of new
knowledge and initiatives within the frame of current local
beliefs, rather than by imposing different belief systems on a
given collectivity. As Lee and Paruchuri (2008: 1173) noted,
“integration of new logics under the umbrella of preexisting
institutional logics creates ‘facticity’ (the state of being a
fact) for the new logic.” Institutional leveraging then propels
change forward by working off this integration to incentivize
participants to embrace new initiatives as core components of
their beliefs. I elaborate the logic and evidence for the four
institutional leveraging mechanisms below.
Provision of Evidence
Institutionalized understandings are “shared templates for
interpreting situations and planning courses of action in
136

mutually comprehensible ways that involve social accountability”
(Biggart & Beamish, 2003: 444). My interviews and observations
uncovered consistent findings that local producer logics and
expectations were highly institutionalized around the value of
what I call proof of utility. Proof of utility refers here to
perceived incontrovertible evidence that a given object or
technique possesses high economic value for the recipient. In the
context of market exchange, the key institutionalizing mechanism
that generated momentum in developing a dairy market among
producers was the provision of evidence by CARE that adoption of
enhanced market practices possessed utility, that it was
economically and socially beneficial for the potential market
participant. One CARE technical advisor noted that “farmers don’t
do something till they see it, they are very risk averse.” The
reasons for the importance of proof of utility are obvious: the
risks associated with failure for actors in less developed
countries are extremely high (e.g. insufficient sustenance or
loss of the few assets that are owned); access to valid evidence
is often difficult to acquire in these contexts, making its
acquisition valuable; and a low level of rule of law and
137
relatively high level of state and private sector corruption
(e.g. Bangladesh ranked 134th out of 178 countries on
Transparency International’s Perceived Corruption Index in 2010)
seriously compromises the usefulness of unconfirmed evidence for
economic decision making. As a consequence, proof of utility as a
core logic of exchange was highly institutionalized among dairy
producers.
As an example of providing evidence to create momentum in
institutionalizing market exchange, CARE initiated a pilot
project to give farmers and their exchange partners (in this case
a dairy processor) proof that changes in the use of feed would
provide tangible concrete improvements to profits for both
parties. In a controlled experiment, farmers were given
measurable amounts of improved feed over a number of months and
were able to observe the increase in milk volume and
profitability of their cows as a result of higher quality inputs.
Therefore, by adopting a strategy of structured experimentation,
CARE was able to design a market initiative that leveraged core
institutional beliefs (proof of utility) to incentivize change
and grow the market.
138

A second example was the introduction of lactometers (milk
quality testing devices) into the value chain. CARE initiated the
distribution of milk-quality testing devices in villages as a
means of providing a tangible evidence-based means of measuring
milk quality, thereby improving market price accuracy. Leveraging
producers’ strong belief in the provision of evidence, the feed
experiment and introduction of testing devices rapidly
accelerated improvements in market transparency and efficiency,
generating strong incentives and momentum for market development.
Contextualization of Production Knowledge
CARE is among many NGOs worldwide that seek to provide
training and technical assistance to the disadvantaged to
generate sustainable improvements to their income. In CARE’s
case, however, I propose that the success of the organization’s
approach was attributable to its unvarying contextualization of
novel production knowledge and information within the meaning
systems of those whom it was attempting to assist, and its use of
this contextualization to leverage social modeling processes,
139
knowledge codification, and role modification to incentivize
market development.
Institutional theory suggests that individuals are more
likely to act in conformity with those whom they consider similar
in values and beliefs, particularly if those referents are also
of higher status. Research on social modeling and institutional
imitation also shows that individuals’ behavior is affected more
by those whom they consider relevant comparisons for their own
choices about whether to undertake new economic activities
(D’Aunno et al., 2000: 679). Smallholder farmers accustomed to
subsistence mixed farming methods often possessed little
knowledge of many productivity-enhancing concepts of dairy cattle
rearing, including limited understanding of immunization and
parasite treatment, animal nutrition, high yielding fodder, and
feed storage methods (Ahmed et al., 2009: 15). CARE applied
institutional leverage by embedding production knowledge and
training within the respected local leadership of the community.
CARE worked within the existing social structure to leverage the
value of local leaders as plausible referents of socially
acceptable economic behavior, thereby accelerating the
140

translation, implementation and diffusion of novel production
knowledge. CARE’s success in contextualizing production knowledge
within an institutionalized frame of reference was also leveraged
by ensuring that all 88 project staff were Bangladeshi nationals
rather than foreigners and by drawing the 55 field-level group
facilitators from the regions of the villages in which CARE was
developing the dairy market. By using familiar social referents
exclusively to institute market change, CARE was able to
formalize and institutionalize market development more quickly
and efficiently.
CARE also used institutional leverage to develop the dairy
market by seeking means to codify new knowledge within the local
context. A senior CARE worker observed that “farmers don’t see it
[milk production] from a commercial perspective.” Working to help
farmers instantiate a commercialization logic of milk production,
CARE assisted farmers to envision their cattle as productive
economic assets and to evaluate those assets more in terms of
increasing returns on investment rather than exclusively on
minimizing costs. CARE introduced a Cattle Health Card for
recording and codifying production knowledge, creating an
141
incentive feedback loop where farmers learned more about the
financial rewards of improved animal husbandry practices and
increased milk production, thus reinforcing and incentivizing a
commercialization logic of asset production and market
participation.
CARE also used its process strategy of participation to
leverage the institutional framework of existing gender roles for
purposes of promoting training, equity, and education for women.
Gendered division of labor tends to be highly institutionalized
in rural communities in Bangladesh with women involved in the
care of cattle and other livestock around the house and men
responsible for working in the fields and any off-farm activities
such as buying inputs or selling milk in local markets. In
addition to facilitating group meetings which both men and women
attended, CARE field facilitators conducted small group
discussions with women and
identified any women who may be having difficulty in participating in such a group and through home visits, staffbuilt rapport with the male householders to help them understand the important role that women can play in dairy production and marketing (Annual Report, 2009).
142
CARE’s engagement with the local community in discussing gender
roles helped to build women’s confidence in business activities
and to persuade men of the value of gender role modification
through the cognitive rationale of economic benefit.
Thus, embedding knowledge within the local institutionalized
framework augmented and accelerated market creation by building
off social modeling processes, local engagement, knowledge
codification, and role modification to give institutional meaning
to the value of new production knowledge and market growth.
Legitimation of Transactions
The third institutional leveraging mechanism of market
creation was legitimation of market transactions. Markets are
created on the basis of material interests and shared values that
legitimate economic arrangements (Biggart & Beamish, 2004). “The
first condition of any form of coordination is that it is
legitimate among those taking part, as well as in its
environment” (Aspers, 2011: 35). Legitimacy refers here to “a
generalized perception or assumption that the actions of an
143
entity are desirable, proper or appropriate within some socially
constructed system of norms, values, beliefs and definitions”
(Suchman, 1995: 574). Nascent markets, by definition, lack
established legitimacy, which is an obstacle to effective market
functioning. Legitimizing market transactions helps overcome the
resistance of market actors who prefer traditional arrangements
(Aldrich & Fiol, 1994). CARE leveraged market legitimacy in a
number of ways to incentivize and promote market development.
Core to initial institutionalization of the dairy market was
the process of bricolage, which refers to “applying combinations
of the resources at hand to new problems and opportunities”
(Baker & Nelson, 2005: 333). Simply stated, CARE leveraged an
already-existing asset among rural households – milk-producing
cows – to develop the dairy market. Cows were traditionally
raised for multiple purposes, including draught power and the
production of calves, dung and meat, rather than solely for
income generation through milk production. Bricolage is the
process of using “whatever is at hand” (Levi-Strauss, 1967: 17)
for a new purpose, a process that is particularly applicable in
resource-constrained environments (Baker & Nelson, 2005; Garud &
144

Karnoe, 2003; Mair & Marti, 2009; Rao et al., 2005). By
demonstrating the economic value of cattle for milk production to
farmers, CARE leveraged an existing asset to legitimate the value
of transacting in a dairy market.
Second, CARE served as an institutional trust broker between
exchange partners to legitimate the market. This was achieved
through various strategies including communication with producers
and downstream processors to persuade them of the feasibility of
regularizing exchanges with one another, and facilitating
interactions between farmers and milk collectors, through
meetings, to build mutual trust.
CARE also helped to legitimate the role of poor farmers as
market participants in the formal value chain. Downstream formal
value chain actors were cautious in their assessment of poor
farmers as viable value chain participants due to issues of low
productivity and milk quality. As a manager from a large
processor stated, “The farmers need constant support and pushing
and motivation because they… do not understand the potential
benefits available to them.” In response to these beliefs, CARE
appealed to processors’ existing business logic by creating
145

incentives for processors to work with small-scale producers to
reduce transaction costs, improve milk quality and improve the
reliability of milk delivery.
Fourth, CARE leveraged cultural and material support for the
market by working with input service providers to make production
viable, high quality and scalable. CARE focused some of its
energies toward input service access as a means of improving milk
production quality and efficiency. This generated higher income
for farmers and better met the capacity and quality- control
requirements of downstream processors, thereby increasing the
legitimacy of the value chain as a means of economic production.
For example, CARE experimented with a model where they partnered
with a veterinary association to become an informational and
transactional intermediary between farmers and chilling plants.
In this way, CARE leveraged the experience of the association to
legitimate market transactions among the farmers, collectors,
input providers, and chilling plant managers, and, in turn,
improved actors’ motivation to participate in market growth.
Finally, institutional research has suggested that current
institutionalized practices constrain actors’ capacity to imagine
146

an alternative to existing economic arrangements. A critical
obstacle to developing legitimacy and momentum on behalf of a
nascent market in many less developed economies is actor
habituation to charitable and aid-based development approaches.
NGO interventions that rely excessively and continuously on
subsidies create market distortions and dependency conditions
that can accustom project recipients to free benefits. An
attractive and humane solution in the short term, aid-based
development approaches often create the unintended consequence of
constraining opportunities for self-sustaining markets in the
long term. CARE’s success in legitimating the dairy market was
partially attributable to its self-perceived role as a transient
mode of intermediation to be ultimately supplanted by self-
organized, incentivized markets and economic arrangements. As a
CARE report indicated,
[CARE] has been conducting extensive awareness [sic] and discussions during its capacity building sessions with farmer groups such that they understand, accept and internalize the market development approach and its benefits, as opposed to the subsidy driven approach.
147

By adopting this approach, CARE sought to ensure that the
developing market was self-sustaining and durable in the long
run.
Expansion of Relationships
Scott (1991) argues that local relationships tend to be more
horizontal and informally structured whereas extralocal
relationships tend to be more formally structured, hierarchical,
and subject to authority relations. Social relationships shape
economic activity (Granovetter, 1985) where different kinds of
market relationships exist: “market relationships are embedded in
both economic (contract) and non-economic (friendship, familial)
institutions” (Owen-Smith & Powell, 2008: 603). Under conditions
of weak state and market governance, markets are unable to depend
on favorable state policies or effective political centralization
to stimulate market growth or solve coordination failures. An
independent study commissioned by CARE on the effects of state
policy on the dairy sector in Bangladesh showed that the dairy
sector “receives very little out of the government’s huge subsidy
bill” and “nearly all the policy related variables – both dairy
148

policy and macro-economic policy – had no significant association
with growth in the dairy sector” (Jabbar, 2010: 52, 57).
Understanding the need for institutional support within the
market context of dairy production, CARE drew on its
relationship-building strategy to incentivize other actors in the
producers’ market context to promote market growth.
CARE used a number of techniques to expand relationships
that supported the development of a milk market to benefit small-
scale farmers. For example, CARE leveraged its position as the
co-organizer of a national dairy conference to present research
data on policy-related obstacles to dairy sector growth to five
government ministers. CARE also worked to convene multi-
stakeholder working groups (including government, processors,
NGOs, and multilateral institutions) around key policy priorities
for the sector such as tariffs, genetics, extension services and
certification of local animal health workers. CARE’s
participation in the working groups also helped to frame the
relevant issues from the perspective of smallholder farmers, who
were otherwise absent from policy discussions, even though they
accounted for 90 percent of the country’s milk production. By
149

cultivating and expanding these relationships to help frame
market development in terms of each of the participants’ own
interests, CARE was able to motivate these and other
institutional constituents to participate more actively in policy
reform and market development. In addition to the data presented
above, Appendix M provides additional illustrative evidence for
institutional leveraging from the data.
To summarize, institutional leveraging was found to be an
important variable that moderated the effect of redistributing
social control on poverty alleviation. Institutional leveraging
can be understood as consisting of four mechanisms, provision of
evidence, contextualization of knowledge, legitimation of
transactions and expansion of relationships. When new or enhanced
market practices are aligned with local institutionalized
understandings of what constitutes a viable market, then poverty
alleviation is more likely to be successful.
150
Learning Strategies of Market Development and
Institutionalization
The final element of the explanatory model illustrated in
Figure 3 is the role that learning strategies played in
moderating the relationship between the redistribution of social
control and measurable poverty alleviation. To gather and
effectively integrate the knowledge generated from the
redistribution of social control and institutional leveraging,
CARE utilized three critical learning strategies to facilitate
effective information feedback loops: needs assessment, performance
measurement, and continuous impact evaluation. These three learning
strategies provided a continuous systems-level stream of
information for dealing with complexity and guarded CARE from
adhering to initiatives that might become quickly outmoded in the
rapidly changing and fragile market environment that it
confronted. The intent of these learning strategies was to obtain
detailed feedback on the outcomes of their activities. These
learning strategies were measurement-based assessments that
brought timely and continuous insights to CARE’s strategic
decisions.
151

Needs Assessment
The first learning strategy was needs assessment. CARE’s first
step in working with the milk-producing households in a
particular village was to organize a general community meeting to
share the objectives of the project, learn if the community would
be interested in participating, and engage in a tailored needs
assessment research methodology to facilitate the participation
and input of all community stakeholders. Conversations were
focused on the needs of smallholder dairy producers in the
community and opinions on the obstacles to increased incomes and
participation in the dairy value chain. Having identified the
needs of each individual village and the patterns of needs that
emerged from working with hundreds of villages, CARE was able to
establish a baseline against which to determine and gauge its
individual and community-level solutions to problems of market
development.
Performance Measurement
152

The second learning strategy was performance measurement. This
refers to the measurement and tracking of practices at the level
of each value chain actor as strategic market interventions were
implemented. An example of a specific change in practice at the
farmer level was the development of what CARE termed a
participatory performance tracking matrix, as noted earlier. This
process measured the performance of individual producers on ten
indicators related to the adoption of improved animal husbandry
and dairy productivity practices. Progress targets were set
collectively by each farmer group, and individual and group
progress was measured in sessions facilitated by farmer leaders
with support from CARE field staff as needed.
Continuous Impact Evaluation
The third learning strategy was continuous impact evaluation.
Following an exhaustive baseline assessment of the dairy industry
(see Appendix E), CARE implemented a project-wide monitoring and
evaluation system supported by the Gates Foundation’s funding
model (see Appendix F). CARE assessed performance improvements
against 120 tangible and measurable milestones on a continuing
153

basis (See Appendix N) and reported progress on these milestones
in semi-annual and annual reports to the donor agency.
Performance measurement of value chain actors’ practices also
served as input to CARE’s continuous impact evaluation.
Continuous impact evaluation against tangible milestones created
an overarching framework within which to experiment with multiple
iterations of both planned and speculative initiatives, which in
turn increased continuous learning and adaptation.
To summarize, needs assessment, performance measurement, and
continuous impact evaluation, while not core to the explanation
of successful market enhancement, were nonetheless important
moderating influences on the successful redistribution of social
control to reduce poverty for poor producers in a least developed
country context.
154

DISCUSSION
Management Implications
Whether they like it or not, for-profit companies are often
asked to make investments in social and public goods. The debate
around business’ role in society is an old one to which new
energy has been added in the last decade as the separation
between business and poverty alleviation has broken down. Some
firms are finding new ways to create business benefits by
incorporating poor producers into their value chain. This study’s
implications for for-profit companies currently working with, or
considering greater engagement with, poor producers pertain to
augmenting the productivity and reach of low-income producers as
viable business partners.
First, for-profit firms are more likely to be successful to
the extent that they select markets in poor countries where
demand for a given product is irrefutably high and where the poor
are both producers and consumers of the product (like the dairy
industry in Bangladesh). Both conditions tend to accelerate
market growth and generate a stable market for for-profit input
providers.
155

Second, for-profit businesses should tie their supply chain
to producers with the capacity to aggregate their products,
thereby leveraging scale economies and knowledge-sharing as a
basis for sustaining and growing production. Among low-income
producers in rural areas, the optimum for-profit supplier model
is not necessarily to build ties to centralized production, but
to producers who can centralize the outputs of their production
through farmer groups or cooperatives that forward integrate into
product distribution (to large wholesalers or local businesses
and consumers), excluding the necessity for independent
intermediaries.
Third, my results suggest that businesses which can develop
input linkages to low-income producers should use field
demonstrations of the productive value of their product to
establish and sustain such linkages. This study suggests that
demonstrations that provide tangible evidence of production and
income improvement are the most compelling means of building
economic relations with producers in low-income contexts.
Fourth, business might be advised to focus on increasing the
productivity of the client producers whom they can serve through
156
low-cost technological and scientific applications. These
applications (e.g. higher yielding feed or medicines for
livestock), which are often common in advanced economies, may be
missing from rural areas in less developed countries, and their
introduction into these markets can serve the needs of both the
supplier and the producer simultaneously to stimulate increased
profitability.
Fifth, modest upfront investments in training or educating
producer clients on the means of improving efficiency are likely
to generate sustainable increases in the volume of suppliers’
sales. Producers can then disseminate knowledge themselves to
other local producers through farmer groups or cooperatives.
Sixth, as this study shows, businesses operating in these
contexts tend to benefit greatly from retaining staff that are
indigenous to the local area because they facilitate economic
exchange and significantly increase receptivity to new inputs and
information.
Finally, my findings suggest that companies seeking to
profitably reduce poverty for poor producers would be well
advised to understand the workings of the entire value chain and
157

to attend to issues of power and risk for disadvantaged and risk-
adverse producers throughout the chain. Companies should also
assess their own capabilities as well as the capabilities of
potential NGO partners to implement market enhancing practices
that can be mutually beneficial to both the firm and low-income
producers and input suppliers.
Business Motivations for Inclusion of the Poor in Value Chains
If for-profit firms choose to play the role of market
coordinator and facilitator or if they collaborate with a market-
based NGO to make markets more inclusive for poor producers,
several business benefits are attainable. Specific benefits
presented here from the Bangladeshi context are illustrative of
the potential for business growth, innovation, reliability and
quality of inputs, reduced corruption, access to financial
resources and enhanced reputation and social legitimacy.
First, by working with poor producers, business can benefit
from market growth opportunities. The three large Bangladeshi
dairy processors have access to less than 10 percent of milk
produced in Bangladesh, reducing their opportunity to capitalize
158

on rapidly growing demand for milk and other high value-added
dairy products in urban areas. Through new linkages between
smallholder farmer groups and dairy processing companies, farmers
can increase milk delivered to private sector processors thus
allowing them to expand their operations considerably to meet
consumer demand.
Second, by seeking solutions to new challenges presented by
working with poor producers, companies can develop their
capabilities for innovation (Hart and Sharma, 2004). Bangladeshi
dairy companies are beginning to benefit from innovative models
for working with farmers to generate mutual benefits for the
companies and dairy producers. These models included a one-stop-
shop dairy hub and an intermediary organization model that
improved economic transactions between dairy processing companies
and smallholder farmers.
Third, companies can benefit from greater reliability and
quality of product inputs. This stability is especially important
during any seasonal fluctuations when expensive plants and
capital assets can operate well below capacity.
159
Fourth, when markets are enhanced for the benefit of poor
producers, companies also can benefit from fewer, higher-volume
transactions and reduced costs and complexities of procurement.
In addition, the potential for corruption associated with lack of
transparency can be reduced through greater transaction
transparency. At the same time, companies can benefit from
enhanced reputation and social legitimacy in the eyes of a number
of firm stakeholder groups.
Fifth, working with poor producers can unlock access to
financial resources. The International Finance Corporation and
the regional development banks have public interest mandates to
reduce poverty and achieve sustainable development and have
collectively provided more than $100 billion in loans to
companies that can demonstrate that their activities are
contributing to poverty alleviation.
Although this study focused on a non-governmental
organization, I suspect that other types of organizations,
including small and medium-sized enterprises, MNCs, and social-
purpose businesses can also serve as market-facilitating
intermediaries for the benefit of all market actors. The benefits
160
for companies reveal a variety of incentives relevant for other
types of enterprises to facilitate market practice enhancement in
ways that also benefit their own market interests.
Potential Drawbacks to Market Enhancement
Although CARE was successful in working with large dairy
processors and other value chain actors to achieve its intended
outcome of poverty alleviation for poor producers, any
substantial changes in the way a market system operates will
inevitably result in potential downsides for certain value chain
actors. In the present case, CARE’s activities had potential
downsides for some value chain actors including traditional milk
collectors, chilling plant managers who took advantage of
information asymmetries, importers of powdered milk, and
individuals or groups opposed to greater capabilities and agency
for women. The power and influence of these individuals or groups
could be compromised by market enhancement practices. CARE staff
understood the potential downsides to its activities and, where
possible, gave support to ease transitions to new practices, such
as giving traditional milk collectors the same training provided
161

to group-nominated collectors and helping communities to address
any resistance to women taking on more non-traditional roles.
Overall, there were significant Pareto improvements (changes that
generate benefits to some without disadvantaging others) to be
gained in the dairy value chain and CARE’s market enhancement
interventions generated net benefits to the vast majority of
value chain actors. The value chain actors who saw potential
drawbacks to market enhancing activities typically had a less
legitimate claim to the maintenance of their advantages which
generally accrued at the expense of others, and especially at the
expense of those who were the least advantaged.
Theoretical Implications for Market-Based Approaches to Poverty
Alleviation
Strategic organization-level approaches to poverty
alleviation in least developed economies confront formidable
challenges to market creation. This study sought new insights
into the causes of poverty reduction among poor producers in the
primary sector of a least developed economy by investigating the
hands-on market practices of a successful initiative that
162
delivered tangible economic and social benefits throughout a
fledgling value chain. I found that making markets more inclusive
for poor producers requires a comprehensive and interrelated
approach at the level of execution that recognizes the importance
of social control and institutional leveraging. I argued that
CARE’s ability to enhance market practices in ways that
reallocated social control and leveraged existing institutional
norms was successful because it overcame the most relevant
factors in market and government failure.
While no single intervention can solve the structural,
political and economic problems of poverty, the findings of this
imply that the means by which actors, including NGOs, MNCs,
donors, policy makers and financial investors intercede in
stimulating market and income growth may be more important than
researchers have acknowledged to date. In the present case,
neither global (e.g. MNC) capabilities, state policies nor
multilateral institution programs explained market development
and poverty alleviation. Far more critical to success was the
redistribution of social control and institutional leveraging
processes used by a facilitating organization to mobilize and
163
motivate local buy-in to an identified economic opportunity. This
study makes several contributions to the existing theoretical and
practitioner conversations about the role of market-based
approaches to reducing poverty in least developed countries.
First, although calls for greater attention to viewing the
poor as producers have been voiced since the emergence of the
base-of-the-pyramid approach (Karnani, 2005) as well as more
recently (Ramachandran, Pant and Pani, 2012) this current study
is among the first in the management literature to examine the
implications of this poor-as-producers approach with an in-depth
empirical study of practical strategic initiatives. A focus on
the poor as producers in the present study uncovered a detailed
model and comprehensive set of mechanisms that were able to
explain poverty reduction as the outcome of strategic
interventions to alter entrenched patterns of limited social
control among producers in ways that overcame the constraints of
market and government failure. Rather than focus on the poor
primarily as individual consumers, microentrepreneurs, or
employees in the immediate market environment, the current study
considered the relation of poor producers to the entire value
164

chain to reveal important dimensions of social control that are
relevant considerations for the ultimate enhancement of an entire
industry. My results imply that future management studies of
poverty could benefit from additional study of NGOs facilitating
inclusive value chains for the poor.
Second, this study brings a more detailed analysis of power
into the management literature on poverty alleviation. This study
extends the concept of empowerment by illustrating that
empowerment is only one, albeit important, mechanism in the
process of alleviating poverty. Greater empowerment or
participation in decision-making is of little strategic relevance
if the exercise of empowerment is rendered moot by market and
governance factors, such as limited transparency, higher risks,
and constraints on resource acquisition – factors which make the
application of greater empowerment highly challenging.
Empowerment thus needs to be considered more broadly within the
economic context in which it is applied just as economic factors
need to be considered concurrently with social factors. CARE’s
approach to inclusive market development was not just about
getting prices right and maximizing economic efficiencies, but
165
was also grounded in attending to social relations, risks and
power relations that disproportionately affect the poor.
Third, the effectiveness of a process-based strategic
orientation also calls into question the feasibility of
interventions in less developed economies based on traditional
top-down planning models because these contexts tend to be highly
idiosyncratic and unpredictable. Future research in low-income
economies might be advised to place considerably more emphasis on
strategy process and the chains of causality that constitute a more
dynamic theory of strategy in development contexts (London &
Hart, 2010; Pettigrew, 1992), in particular, how strategies are
interpreted and locally enacted (Wheeler et al., 2005), as was
evidenced in this study.
Fourth, my focus on enhanced market practices among poor
producers provides a complement to the three predominant
approaches to poverty alleviation in the management literature.
Table 6 summarizes the differences in focus and mechanisms of
poverty reduction among these approaches and the approach
uncovered in the present study.
166
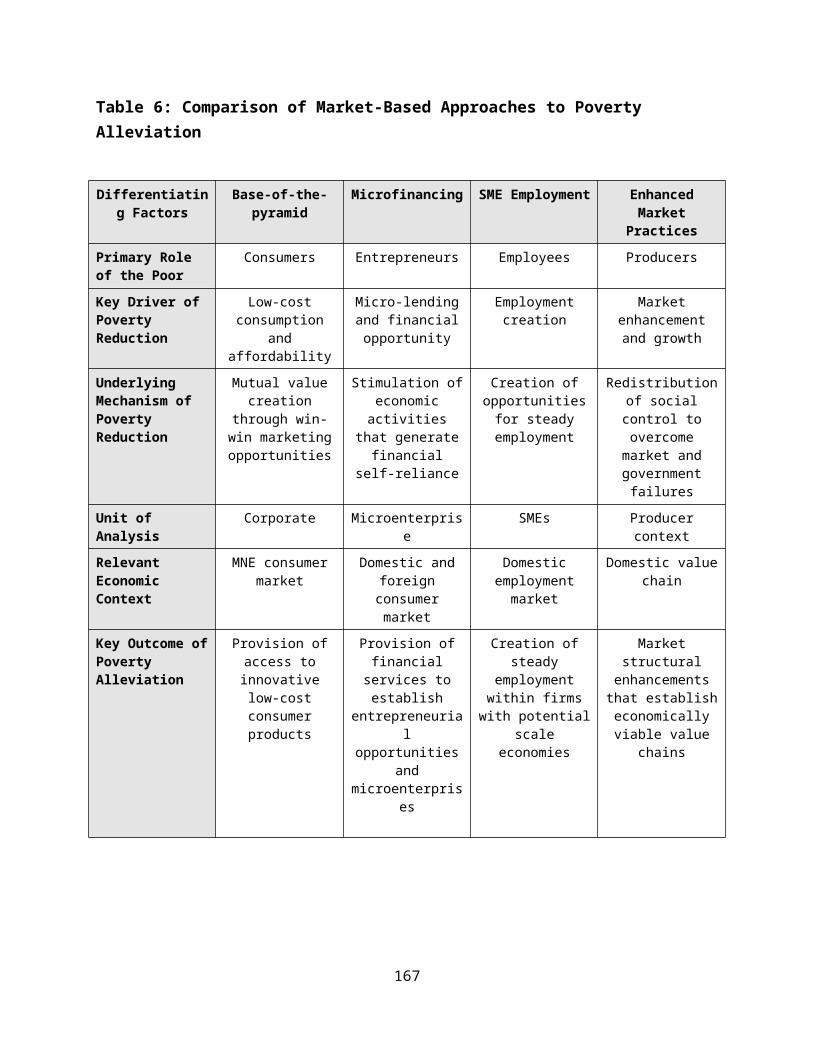
Table 6: Comparison of Market-Based Approaches to Poverty Alleviation
Differentiating Factors
Base-of-the-pyramid
Microfinancing SME Employment EnhancedMarket
PracticesPrimary Role of the Poor
Consumers Entrepreneurs Employees Producers
Key Driver of Poverty Reduction
Low-costconsumption
andaffordability
Micro-lendingand financialopportunity
Employmentcreation
Marketenhancementand growth
Underlying Mechanism of Poverty Reduction
Mutual valuecreation
through win-win marketingopportunities
Stimulation ofeconomicactivities
that generatefinancial
self-reliance
Creation ofopportunitiesfor steadyemployment
Redistributionof socialcontrol toovercomemarket andgovernmentfailures
Unit of Analysis
Corporate Microenterprise
SMEs Producercontext
Relevant Economic Context
MNE consumermarket
Domestic andforeignconsumermarket
Domesticemploymentmarket
Domestic valuechain
Key Outcome ofPoverty Alleviation
Provision ofaccess toinnovativelow-costconsumerproducts
Provision offinancialservices toestablish
entrepreneurial
opportunitiesand
microenterprises
Creation ofsteady
employmentwithin firmswith potential
scaleeconomies
Marketstructuralenhancementsthat establisheconomicallyviable value
chains
167
The model may help to extend and complement base-of-the-
pyramid, microfinance and SME employment approaches in a number
of ways.
All market-based approaches to poverty alleviation can be
understood as part of the broader global shift in views on the
role of markets in international development. From the end of the
Second World War to 1980, governments and multilateral
organizations such as the World Bank, IMF and the United Nations
Development Program were assigned the lead roles in global
poverty reduction. But with the continuation of poverty on a
large scale despite massive investments in these state-lead
approaches, an ideological shift took place in the 1980s which
emphasized free markets as a solution to poverty. Known as the
Washington Consensus and structural adjustment, the prescription
for developing country governments was to open their markets and
reduce government expenditures. This approach, especially in its
more libertarian ideological form, was also limited in its
impact, and called for a middle path and a balanced approach to
the complex challenges of poverty alleviation for people living
168
in countries where existing approaches had failed. These debates
on development and poverty alleviation took place at the macro
level of analysis. In the last 10 years, however, with the rise
of microfinance and the publication of Prahalad and Hart’s base
(or bottom) of the pyramid approach (Prahalad, 2005; Prahalad and
Hart, 2002), the conversation on approaches to poverty
alleviation has also entered the management literature at the
organizational level of analysis.
Critics of the base-of-the-pyramid approach argue that it is
underlying beliefs that are rooted in the libertarian free-market
ideology of recent decades (Karnani, 2011; Munir, Ansari, &
Gregg, 2010) which assume that corporations are best suited to
play the leading role in global poverty alleviation. Uncritical
acceptance of the premise that poverty can be reduced by the
presence of multinational companies profitably selling to the
poor is, they argue, at significant risk of doing more harm than
good (Karnani, 2007). Without recognition of the complexity of
poverty issues, an understanding of the power differences and
inequalities embedded in market practices (Mair, Martí, &
Ventresca, 2012) or a sensitivity to the actual poverty-related
169

impacts of business activities, the base-of-the-pyramid approach
remains limited in its ability to achieve its espoused poverty
reduction impacts.
Providing greater access to productivity-enhancing goods,
services and inputs to the poor in ways that may be more
affordable and appropriate to their needs is an important element
of the redistribution of social control and poverty alleviation
as the current study has shown. However, without considering how
the introduction of new products and services into low-income
marketplaces may potentially affect power relations or risks for
the poor (e.g. where consumer protection and advertising
regulations and enforcement may be lacking), the access to
certain products may actually work against reducing poverty.
Without these more nuanced understandings, the base-of-the-
pyramid approach has been susceptible to criticism for creating
nonessential consumer needs (Davidson, 2009), undermining the
important roles and responsibilities of the state and
overemphasizing the potential business opportunities for selling
to low-income consumers (Karnani, 2011), romanticizing the poor
(Banerjee & Duflo, 2007), and leading to even greater strains on
170

the ecological carrying capacity of the earth through unmindfully
increased consumption (Hahn, 2009).
With this in mind, recent calls in the base-of-the-pyramid
literature have been made to go beyond the product “market entry”
approach to understand “market creation,” including the broader
social and institutional context within which low-income
individuals are embedded (Simanis, 2010; Simanis and Hart, 2009).
The current study therefore provides a potential contribution in
this direction, offering a model which relates enhanced market
practices to poverty alleviation through elements of social
control as a means of reducing the constraints of under-
functioning markets and governments. Further base-of-the-pyramid
studies of market creation may benefit from greater attention to
power relationships across the entire value chain to identify the
obstacles to both consumption and production in low-income
economies.
From the perspective of the microfinance approach, great
emphasis is placed on the participation of individuals in
microfinance groups. Organizing borrowers into groups and
building solidarity among group members in order to secure loans
171

through social capital is an innovation that allows poor
individuals to be more personally empowered, obtain greater
access to financial services and build financial institutions
which reduce risk. However, in order for the provision of
microfinance to effectively reduce poverty, a number of other
important factors identified in the present study may need to be
in place. For example, to move beyond a subsistence-based
entrepreneurship of necessity with small undifferentiated
businesses, microentrepreneurs may need additional capacity-
building and access to market information to increase their
productivity and overcome the barriers of limited economies of
scale and scope. For microfinance to contribute to poverty
alleviation, additional attention may also need to be paid to the
broader market structure within which microentrepreneurs are
operating and the accessibility of inputs and markets for outputs
as well as transaction transparency.
Considering the strength of the SME employment-based
approach to poverty alleviation, its considerable appeal is the
reduced risk and uncertainty that comes with a formal-sector
salaried job which is partly a function of the greater
172

productivity of SMEs relative to microenterprises. This is an
important approach to poverty alleviation where a functional
government is able to create the necessary enabling environment
for SME growth and development. I extend this approach by
exploring practical initiatives where governments are ineffective
and by considering how poverty can be reduced in rural areas
where the creation of a significant number of jobs by SMEs may
not be possible in the short term. If, as in Bangladesh, the
state lacks the capacity to address market failures, provide
basic public services for the poor and uphold their basic rights,
other organizations can play an intermediary role in filling this
institutional void. A focus on the redistribution of social
control highlights access to power as an important element of
poverty alleviation along with enhanced productivity and risk
mitigation. Therefore, SME employment approaches may be able to
further enhance their impact on poverty alleviation if they
ensure that jobs created for the poor do not come at the expense
of modes of disempowerment such as reduced opportunities for
capability enhancement, participation or workplace safety.
173

A fifth contribution of this study is increasing awareness
of the importance of organization-led changes in market
structure. Given that CARE played the role of a market-
facilitating intermediary organization and did not buy or sell
products in the marketplace itself, raises the important question
of how an NGO-led initiative may compare with other types of
market-based approaches led by profit-making enterprises.
Certainly, an NGO operating with a market-based approach is
attuned to the incentives of markets and business, and CARE was
subject to its own form of market pressures, in that access to
further funding depended on improved profitability and market
growth in the value chain it targeted. Moreover, in Bangladesh in
particular, and in market-based approaches to poverty alleviation
in general, hybrid organizational forms that mix elements of for-
profit businesses and non-profit ventures (Battilana and Dorado,
2010) appear to be the norm, rather than the exception. A wide
variety of organization forms – large commercial firms, social
enterprise businesses, state owned firms, and NGO business
ventures – commonly operate commercially and sustainably on their
own or in partnership with other actors (Wheeler, et al., 2005).
174

Therefore, hybrid forms of governance may be especially
serviceable in low-income markets.
However, if one wanted to begin from the perspective of a
large for-profit firm and consider how the firm might go about
integrating or replicating the market-enhancing activities of an
NGO-led initiative, a number of general approaches may be
possible. First, a company could aim to copy the work of an NGO
through its own corporate foundation, similar to Danone’s
approach in Senegal and Bangladesh (Rangan & Lee, 2010). Many
corporate foundations have financial resources that are orders of
magnitude larger than most NGO budgets. Second, a company could
partner with an NGO taking a market-based approach to gain access
to its capabilities, knowledge and resources, such as Telenor has
done to create Grameen Phone (Seelos & Mair, 2005). Third, a
commercial firm could decide to replicate the market-enhancing
initiatives described in this study by drawing on its own in-
house resources and expanding its capabilities to focus on the
broader issue of market creation, as Unilever has done in India
(Rangan, Sehgal & Rajan, 2007) and CEMEX has done in Latin
America (Segel, Meghji & García-Cuéllar, 2007). In these ways, a
175
for-profit commercial firm would have numerous options to
undertake activities related to changing market structure and
institutions for the benefit of both the company and the poor.
The market-facilitation activities of CARE reported in this study
are therefore not limited to NGOs exclusively. Recent findings
from the literature on commercial value chains suggest that
dominant for-profit companies or “lead firms” in the value chain
have an even greater ability than NGOs to coordinate and change
practices within their more considerable spheres of influence
because of their greater power to offer financial incentives and
impose economic sanctions on suppliers and other market actors
(Gereffi, Humphrey & Sturgeon, 2005).
The ultimate sustainability and durability of CARE’s market
enhancements will only be conclusively determined following the
conclusion of CARE’s activities. However, CARE’s management,
having come from business backgrounds, has been well aware of the
traditional limitations and lack of financial sustainability of
aid-based development projects. As a result, CARE’s market
enhancements were designed up-front with financial sustainability
in mind, avoiding dependency, building capacity and working
176

through private sector companies and other value chain actors to
introduce mutually beneficial enhancements and efficiencies that
would have the best chance of being profitably maintained by
farmers and other market actors after CARE’s involvement
concluded. With CARE’s activities in the dairy sector in its
fifth year at time of writing, there were already farmer groups
trained early in the project period that were operating
independently on a sustainable basis. Thus, preliminary evidence
for the independent long-term sustainability of market and income
improvements is promising.
Theoretical Implications for Institutional and Market
Perspectives
The findings of this study provide new insights into the
processes of how organizations change institutionalized market
practices. First, the current study helps to provide fresh
insight into how agency is enabled in institutionalized settings.
Embedded agency, a central issue in the current institutional
literature (Barley & Tolbert, 1997; Battilana, 2006; Battilana et
al., 2009) refers to the means by which actors are able to change
177
within the embedded constraints of their environment (Zietsma &
Lawrence, 2010). As institutionalized patterns of production and
exchange, market practices in low income contexts tend to be
deeply embedded, as they have often been reproduced by tradition
and are closely linked to highly constraining rules and beliefs
that are central to the social order (Jepperson, 1991). These
deeply embedded market practices can persist even if they are
collectively suboptimal and serve no one’s best interests
(Akerlof, 1976; Bowles, Durlauf & Hoff, 2006; Dorward et al.,
2005). If institutional contexts are by definition constraining
environments resistant to change, then a central question is “how
embedded agency is possible” (Zietsma & Lawrence, 2010: 189). Few
environments are more constraining than those of impoverished
individuals in least developed countries. Although some
institutional scholars have expressed concern that accounts of
institutional change based on the agency, purposive actions,
skills and strategies of actors diverges from the core social-
influence emphasis of institutional theory (i.e. Thornton &
Ocasio, 2008), others welcome the new and practical contributions
that can be made from recognizing the importance of individual
178
and organizational action in understanding institutional change
and the emergence of new market practices (DiMaggio, 1988;
Lawrence & Suddaby, 2006; Lawrence, Suddaby & Leca, 2009; Oliver,
1991, 1992).
My study revealed agency within embeddedness to be the
result of neither an exogenous shock, nor a social movement, nor
a political or ideological clash of contradictory logics
(Battilana, Leca & Boxenbaum, 2009). Instead, it was the result
of targeted reallocations of social control and institutional
leveraging based on non-confrontational market interventions and
a shift in risk-bearing burdens. The findings of this study
provide a partial answer to the question of embedded agency by
privileging action or praxis over ideology and logics in
institutional environments as the most legitimate mechanism for
increasing social control for the poor in least developed
countries. This positions my theoretical perspective in strategic
choice perspectives of agency (Oliver, 1991; Greenwood & Suddaby,
2006) that explain institutional change through intentional
action or praxis (Barley & Tolbert, 1997; Giddens, 1984; Seo &
Creed, 2002). Benson (1977: 5) defines praxis as “the free and
179

creative reconstruction of social arrangements on the basis of a
reasoned analysis of both the limits and the potentials of
present social forms.” In emphasizing agency, however, I have
sought an explanatory balance between structure and agency,
seeking to avoid over-stylized accounts of too much determinism
or agency (Barley & Tolbert, 1997; Barley, 2008).
From this I draw the conclusion that the explanation for the
success of poverty alleviation through redistribution of social
control in least developed economies is attributable to two
factors that created spaces of empowerment and opportunity for
exercising greater agency: the unobtrusive use of power and a
shift in the risk-bearing burdens of the market’s most vulnerable
actors. “Unobtrusive forms of power” (Garud, Hardy & Maguire,
2007: 962) are uses of power that minimize opposition from state
political interests. Hardy (1985: 389) observes, “unobtrusive
power refers to the ability to secure preferred outcomes by
preventing conflict from arising.” Further, Hardy (1985: 388)
states that, “this unobtrusive use of power…is a viable strategy
for specific groups and individuals who wish to avoid conflict
over political issues.” As the present study demonstrated, power
180

is more likely to be unobtrusive if it is incremental, small-
scale, and incentivized to satisfy all participants affected by
changes in social control. It is also less obtrusive to the
extent that it is not explicitly subversive or political. NGOs in
Bangladesh tend to be oriented toward economic action rather than
direct advocacy due to the entrenched political interests of
local and national governments (Blair, 2005). In the context of
its work in the Bangladeshi dairy sector, CARE did not take an
overtly political approach to change to achieve greater power for
the poor. Researchers have noted that “Bangladesh has a domestic
environment inimical to political activism” (Rahman, 2006: 451).
CARE assessed the potential effectiveness of a confrontational
strategy that called for radical change in government policy and
determined that it would not likely be feasible. Thus, CARE’s
reliance on unobtrusive power changes was effective because it
minimized resistance to expansions in producers’ agency by
creating “win/win” outcomes for all participants affected by
changes in market practices and by “embedding calls for change
within accepted models of social conduct” (Englund & Gerdin,
2011: 587). The deeply embedded nature of market and social
181

practices in low-income contexts also explains why CARE avoided a
strategy of confrontational political advocacy in order to
redistribute social control. In these contexts, CARE needed to
play the role of intermediary and neutral third-party broker.
Opportunity spaces for the very poor are more easily created if
market actors perceive that CARE is acting economically rather
than politically for the common good and promoting freedom
through unobtrusive redistributions of power and control rather
than explicitly subversive partisan politics. My study shows how
incremental, iterative modifications over time to
institutionalized patterns of social control expand the agency
exercised by the poor for the mutual benefit of market
participants. In this way, the current study helps provide fresh
insight into how agency is enabled and channeled in deeply
institutionalized settings.
Highly embedded actors such as poor dairy producers were
also able to increase their agency through a shift in risk
bearing burdens from the farmers to other actors. The high levels
of vulnerability and risk associated with poverty constrains
individual options and agency (Duflo, 2006). The risks borne by
182

the poor tend to reinforce low level equilibria and poverty
traps, therefore keeping people poor (Azariadis & Stachurski,
2005; Bowles, Durlauf & Hoff, 2006). Reducing the risk burdens of
the poor therefore increased their agency and gave them greater
ability to influence and change market practices, institutions
and norms.
Secondly, the results of this study also imply that it is
not necessary to graft on Western institutional conventions in
contexts of market and governance failures. As challenging as it
may be for some outside observers who find domestic policies and
local customs anathema to traditional models of social justice or
business success, the means by which institutional change is
achieved, I believe, is through even deeper grounding in local
institutionalized beliefs to uncover what motivates local actors
and communities to seek market engagement and what conditions are
necessary to incentivize change. My proposed theoretical model
suggests that incipient markets are personal and value-laden,
possessing an underlying cognitive fabric from which economic
actors take their cue. Therefore, approaches to economic
development and poverty alleviation need to be supplemented by
183
operational approaches of the type studied here that frame market
development in terms of building upon locally perceived needs.
These operational approaches improve the chances of success when
they freely accept guidance for their actions from localized
logics to gain traction in solving problems of market growth.
Third, another theoretical implication of my study is that
conceptualizations of markets as utility-based modes of human
interaction (Callon & Muniesa, 2005) are not necessarily
contradictory to notions of markets as institutionalized and
highly normative belief systems (Fligstein & Dauter, 2007).
Knowledge and expectations of market behavior were highly
calculative and sophisticated among local producers in the
present study – not surprisingly in light of the risks (such as
severe personal privation) associated with market failure. A
rational, calculative mental model of market exchange was also
buttressed by a pragmatically justified vigilance and sense of
caution in conducting economic transactions due to the tangible
limitations of the formal market mechanism as a vehicle for
income generation given persisting challenges of information and
power asymmetries. My findings provide evidence that a rational
184
calculative model of exchange may be constitutive of
institutional belief systems themselves: that is, calculative,
rational mental models of market behavior can be the belief
systems within which other beliefs about economic exchange are
necessarily nested. More research is needed on rational
calculative models of markets as the basis for institutional
beliefs and as inducements for reliance on kinship or local
leadership for conducting exchange (Callon & Muniesa, 2005;
Miller et al., 2009).
Fourth, my findings also extend work on institutional voids
(Khanna & Palepu, 2005) by suggesting that these voids, lacking
as they are for state and private sector support, are nonetheless
opportunities for potential development (Mair, Marti & Ganly,
2007; Mair, Marti & Ventresca, 2012), particularly if potential
markets can be identified within the void by institutionally
astute firms or NGOs. Thus I find support for framing
institutional voids as “opportunity spaces” (Mair & Marti, 2009:
430) and “analytical spaces” (Mahoney & Thelen, 2010) that need
to be better understood in low-income market contexts. A
promising direction for future inquiry to achieve this
185

understanding is the concept of bricolage – the creative use of a
resource for purposes other than those originally intended (Baker
& Nelson, 2005; Rao et al., 2005) also known as “jugaad” in
India, “zizhu chuangxin” in China, “gambiarra” in Brazil and “jua
kali” in Kenya (Radjou, Prabhu & Ahuja, 2012). Bricolage was a
conspicuous element of opportunity recognition and implementation
in this study. Though cattle are typically raised for mixed uses
and for sale in rural Bangladesh, increasing their production of
milk promoted an enhanced income stream for farmers and opened
market opportunities. My study therefore finds preliminary
support for claims about the effectiveness of bricolage as a
means of improving conditions in highly resource-constrained
environments (Baker & Nelson, 2005; Mair & Marti, 2009).
Fifth, this study is also among the first to explain how
market development requires normative justification. These
findings support Greenwood, Suddaby, and Hinings’ (2002) emphasis
on the justification of solutions as an important antecedent of
institutional diffusion. The crucial role of evidence in
determining successful implementation of market change
initiatives is strongly indicative of the need to focus future
186

research in less developed countries on individuals’ processes of
validation in seeking assurances of economic benefit. The poor in
these economies are by definition “frustrated…at almost every
turn by the poor quality – above all low reliability – of the
instruments that they use to manage their meager incomes”
(Collins et al., 2009: 3). The earnings of the poor face “a
‘triple whammy’: low incomes; irregularity and unpredictability;
and lack of tools” (p. 16), conditions made even more uncertain
by typically unreliable health, judicial and education services.
Yet despite, or perhaps because of, these conditions, recent
research in less developed countries, including Bangladesh,
indicates that “money management is, for the poor, a fundamental
and well-understood part of everyday life” (Collins et al., 2009:
3). Poor households’ necessary caution combined with the
centrality of money management to their lives account for the
fundamentally critical role of evidence and validation for the
poor when they are considering market participation. Therefore,
future research needs to examine the role of validation and risk
perceptions in engagement with local economies and the tools
187
available to the poor to help them minimize the very palpable and
consequential risks of market failure.
Limitations
A limitation of this study is its examination of poor
primary producers in a single sector in a single country.
Although this single case study allowed for deeper, on-the-
ground, multi-year insights into the economic initiatives, value
chain relationships, and power dynamics of business activities in
situ, further studies in multiple market contexts and countries
with varying levels of market and governance failure would allow
for confirmation, refinement or extension of the findings
presented here. In particular, the limited impact of access to
financing as a distinct element of enhanced social control in the
present study (due partially to inappropriate repayment schedules
for investing in dairy cows) could be explored in more detail in
contexts where access to finance plays a more significant role in
poverty alleviation. Another limitation of this study is that,
since the research question was focused at the organizational
level of analysis, much data gathering was focused on CARE staff
188

and management. This limitation was addressed as much as possible
through triangulation and supplemental data gathering from other
value chain actors and farmers and collectors not involved with
CARE.
Future Research
The question can be asked as to how the model uncovered by
this study can contribute to poverty alleviation. Is this
something that can save the bottom billion? Although a number of
arguments have been made that the only sustainable way to reduce
poverty is to raise incomes and capabilities (Anderson, Markides
and Kupp, 2010; Nussbaum, 2011; Karnani, 2011) this obvious
approach to poverty alleviation has been surprisingly absent from
the management literature, perhaps due to some of the educational
and cultural constraints of existing research that has focused on
instrumental value creation for a focal firm (Prahalad, 2005)
which has taken a liberal market ideology as given. A
contribution of my study is that it explicitly focuses on
building inclusive markets (McKague, et al., 2011) and takes a
value chain approach that goes beyond the boundaries of a focal
189

firm. This study also philosophically situates poor producers
neither as passive recipients of assistance nor as heroic free-
market entrepreneurs. Instead, this study has taken an in-depth
grounded approach which has revealed a more nuanced and less
abstract view of low-income market actors and market creation.
Given the findings of my research that explained poverty
alleviation for poor producers as enhanced market practices that
redistributed social control in ways that overcame market and
governance failures, there are several important additional
implications for future research.
First, more research is needed on the unique contexts of
market and governance failures in bottom billion markets. Most
base-of-the-pyramid and other market-based approaches to
development have focused on the middle of the economic pyramid
and the growing middle class consumers in emerging market
countries (Jaiswal, 2008). Taken-for-granted assumptions about
institutions to support markets can be more effectively surfaced
when studying enterprise activity in low-income contexts which
can lead to greater theoretical and practical insights (Scott,
1995; Weick, 1974).
190

Second, further research is needed to understand
institutional concepts of fairness, trust and justice in value
chain relationships in low-income contexts. This is especially
true for independent entrepreneurs such as milk collectors which
are an essential link in the value chain. These brokers and
middlemen offer an essential service but are often ignored or
maligned by other value chain actors. Studies of these
independent entrepreneurs have looked at economic aspects of
marketplace transactions but have not to date sufficiently
explored issues of trust, relationships, justice and fairness in
the value chain. More research on these intangible dimensions of
market transactions is essential to understand how markets and
value chains work and how they can be restructured to be more
inclusive. This focus on relationships is especially important in
emerging markets and with poor entrepreneurs because they face
higher risks and power differences (Duflo, 2006).
Third, further research is needed on the social skills
(Fligstein, 1997) and dynamic capabilities (Teece, 2007; Teece,
Pisano & Shuen, 1997) of an intermediary organization like CARE
which is balancing financial sustainability with social impact.
191

This research could compare the differences in capabilities and
skills for pursuing a BoP approach, a microfinance approach, a
SME employment approach and an approach focused on redistribution
of social control in a value chain. This research could also
explore under what conditions an intermediary organization like
CARE should become directly involved in buying and selling
products in the value chain to maximize its social impact. It
could also articulate a model of cross-subsidization or blending
of various resources to achieve financial self-sufficiency and
growth while benefiting harder to reach poor producers.
Fourth, further research could focus on the importance of
collective action, pooling resources, bricolage and ecosystems of
development and enterprise to discern the dynamics of the way
various types of resources (economic, social, cultural,
ecological) are mobilized and transformed to benefit smallholder
farmers and other low-income individuals.
Fifth, further research could focus on understanding the
motivations, advantages and disadvantages of for-profit firms who
include poor producers in their value chains in different
industry and country contexts (McKague and Oliver, 2012).
192

193

CONCLUSION
In developed markets, we take so many aspects of market
institutions for granted that they become invisible (de Soto,
2000). But in the Bangladeshi context, characterized by market
and government failures, markets have to be explicitly enhanced
and structurally changed in order to function more effectively,
especially for the most marginalized market actors. This study
has revealed that making markets work for the poor requires
simultaneous attention to practical elements of social control
that create increased productivity, access to power, reduced
information asymmetries and reduced risk. I found that
reallocating social control toward marginalized market
participants is the overarching mechanism through which market
and governance failures that affect the poor can be sufficiently
alleviated to cause significant poverty reduction. This
relationship is moderated by the extent of institutional
leveraging – the ability to ground changes in local norms and
worldviews – and the effectiveness of systematic learning
strategies.
194
Markets have been able to create wealth in developing and
emerging economies, although it is often disproportionately
captured by those with power and access to capital and
technology, exacerbating inequality (Firebaugh, 2003). It would
take only a 1.3 percent shift in global income distribution to
lift every person in the world above the $2 per day poverty line
(Karnani, 2011). Addressing the global disparity between opulence
and deprivation has attracted many competing and contrasting
management approaches and propositions including approaches that
have focused on the poor as consumers, entrepreneurs and
employees. This study, however, is the first to substantially
examine the mechanisms by which poverty can be reduced for poor
primary producers in least developed countries despite the fact
that smallholder farming is the single largest occupation amongst
people living on less than $2 per day. The findings of this study
suggest that the redistribution of social control that overcomes
market and government failures may be a key explanation that will
engage a range of market-oriented organizations to strive to
further enhance their enterprise ventures and improve the
prosperity of the poor.
195

196

REFERENCES
Ahmed, A.U., Minten, B., Quisumbing, A.R. & Roy, D. 2009. Evaluating the Dairy Value Chain Project in Bangladesh: Baseline Report. Washington, DC: International Food Policy Research Institute.
Akerlof, G. 1976. The Economics of caste and of the rat race and other woeful tales. The Quarterly Journal of Economics, 90(4), 599-617.
Akula, V. 2008. Business basics at the base of the pyramid. Harvard Business Review, 86(6), 53-57.
Alam, J. 1995. Livestock Resources in Bangladesh. Dhaka, Bangladesh: University Press Ltd.
Alam, J. 2008. Studies on Agricultural and Rural Development. Dhaka, Bangladesh: Palok Publishers.
Aldrich, H. E. & Fiol, C. M. 1994. Fools rush in? The institutionalcontext of industry creation. Academy of Management Review, 19(4): 645-670.
Altenburg, T. 2007. Donor Approaches to Supporting Pro-Poor Value Chains. Bonn: German Development Institute.
Altman, D. G., Rego, L. & Ross, P. 2009. Expanding opportunity at the base of the pyramid. People and Strategy, 32(2), 46-51.
Anderson, J. & Billou, N. 2007. Serving the world’s poor: Innovation at the base of the pyramid. Journal of Business Strategy, 28(2), 14-21.
Anderson, J. & Markides, C. 2007. Strategic innovation at the base of the pyramid. MIT/Sloan Management Review, 49(1), 83-88.
Anderson, J. L., Markides, C. & Kupp, M. 2010. The last frontier: Market creation in conflict zones, deep rural areas, and urban slums. California Management Review, 52(4), 6-28.
197
Arnold, D. J. & Quelch, J. A. 1998. New strategies in emerging markets. MIT Sloan Management Review, 40(1), 7-20.
Aspers, P. 2011. Markets. Malden, MA: Polity Press.
Azariadis, C. & Stachurski, J. 2005. Poverty traps. In P. Aghion &S. N. Durlauf (Eds.). Handbook of Economic Growth Volume 1A: 295-384. San Diego, CA: Elsevier.
Azmat, F. & Coghill, K. 2005. Good governance and market-based reforms: A study of Bangladesh. International Review of Administrative Sciences, 71, 625-638.
Bacharach, S. B. 1989. Organizational theories: Some criteria for evaluation. Academy of Management Review, 14(4), 496-515.
Baker, T. & Nelson, R. E. 2005. Creating something from nothing: Resource construction through entrepreneurial bricolage. Administrative Science Quarterly, 50, 329-366.
Banerjee, A. V. & Duflo, E. 2007. The economic lives of the poor. Journal of Economic Perspectives, 21(1), 141-167.
Banerjee, A. V. & Duflo, E. 2011. Poor Economics: A Radical Rethinking of the Way to Fight Global Poverty. New York: Public Affairs.
Barley, S. R. & Tolbert, P. S. 1997. Institutionalization and structuration: Studying the links between action and institution. Organization Studies, 18(1), 93-117.
Barley, S. R. 2008. Coalface institutionalism. In R. Greenwood, C. Oliver, K. Sahlin & R. Suddaby (Eds.), The Sage Handbook of Organizational Institutionalism: 491-518. Thousand Oaks, CA: Sage Publications.
Bateman, M. 2011. Confronting Microfinance: Undermining Sustainable Development.Sterling, VA: Kumarian Press.
Battilana, J. 2006. Agency and institutions: The enabling role of individuals’ social position. Organization, 13(5), 653-676.
198

Battilana, J. Leca, B. & Boxenbaum, E. 2009. How actors change institutions: Towards a theory of institutional entrepreneurship. Academy of Management Annals, 3(1), 65-107.
Battilana, J. & Dorado, S. 2010. Building sustainable hybrid organizations: The case of commercial microfinance organizations. The Academy of Management Journal, 53(6), 1419–1440.
Bebbington, A. 1999. Capitals and capabilities: A framework for analyzing peasant viability, rural livelihoods and poverty. WorldDevelopment, 27(12), 2021-2044.
Benson, J. K. 1977. Organizations: A dialectic view. Administrative Science Quarterly, 22, 1–21.
Bernard, H. R. 1988. Research Methods in Cultural Anthropology. Sage.
Bernstein, A. 2010. The Case for Business in Developing Economies. Johannesburg: Penguin Books.
Biggart, N.W. & Beamish, T.D. 2003. The economic sociology of conventions: Habit, custom, practice and routine in market order. Annual Review of Sociology, 29, 443-464.
Biggart, N.W. & Delbridge, R. 2004. Systems of exchange. Academy of Management Review, 29, 28-49.
Bill and Melinda Gates Foundation, 2010. Financial Services for the Poor Strategy Overview. Seattle, WA: Bill and Melinda Gates Foundation.
Blair, H. W. 2005. Civil society and pro-poor initiatives in rural Bangladesh: Finding a workable strategy. World Development, 33, 921-936.
Bordieu, P. 1984. Distinction: A Social Critique of the Judgment of Taste. Cambridge, MA: Harvard University Press.
Bourguignon, F. & Chakravarty, S. R. 2003. The measurement of multidimensional poverty. Journal of Economic Inequality, 1(1), 23-33.
199

Bowles, S., Durlauf, S. N. & Hoff, K. (Eds.). 2006. Poverty Traps. Princeton University Press.
Boxenbaum, E. 2006. Lost in translation: The making of Danish diversity management. American Behavioral Scientist, 49(7), 939-948.
Brugman, J. & Prahalad, C. K. 2007. Cocreating business’s new social compact. Harvard Business Review, 85(2), 80-90.
Bruntdland, G. H. 1987. Our Common Future. World Commission on Environment and Development and Oxford University Press.
Bruton, G. D. 2010. Business and the world’s poorest billion: The need for an expanded examination by management scholars. Academy of Management Perspectives, 24(3), 6-10.
Bryant, A. & Charmaz, K. 2007. Introduction: Grounded theory research: Methods and practices. In A. Bryant & K. Charmaz (Eds.), The SAGE Handbook of Grounded Theory: 1-28. Thousand Oaks, CA:Sage.
Burrell, G. & Morgan, G. 1979. Sociological Paradigms and Organizational Analysis. Heinemann.
Burt, R.S. 1992. Structural Holes: The Social Structure of Competition. Cambridge,MA: Harvard University Press.
Caliendo, M. & Kopeinig, S. 2008. Some practical guidance for the implementation of propensity score matching. Journal of Economic Surveys, 22(1), 31-72.
Callon, M. & Muniesa, F. 2005. Peripheral vision: Economic markets as calculative collective devices. Organization Studies, 26(8), 1229-1250.
CARE. 2011. Strengthening the Dairy Value Chain Semi-Annual Report. Dhaka: CAREBangladesh.
Chambers, R. 1983. Rural Development: Putting the Last First. New York: Longman.
200
Charmaz, K. 2006. Constructing Grounded Theory: A Practical Guide Through Qualitative Analysis. Thousand Oaks: Sage.
Chen, S., Ravallion, M. & Sangraula, P. 2007. New evidence on the urbanization of global poverty, World Bank Policy Research Working PaperNo. 4199. Washington, DC: World Bank.
Chesbrough, H. W., Ahern, S., Finn, M. & Guerraz, S. 2006. Business models for technology in the developing world. California ManagementReview, 48(3), 42-67.
Chu, M. 2007. Commercial returns at the base of the pyramid. Innovations, 2(1-2), 115-146.
Clay, J. 2005. Exploring the Links between International Business and Poverty Reduction: A Case Study of Unilever in Indonesia. Oxfam and Unilever.
Cleaver, F. 2005. The inequality of social capital and the reproduction of chronic poverty. World Development, 33, 893-906.
Coase, R. H. 1988. The firm, the market and the law. In R. H. Coase(Ed.), The Firm, the Market and the Law: 1-31. Chicago: University of Chicago Press.
Collier, P. 2007. The Bottom Billion. Oxford: Oxford University Press. Collins, D., Morduch, J., Rutherford, S. & Ruthven, O. 2009.
Portfolios of the Poor: How the World’s Poor Live On $2 A Day. Princeton, NJ: Princeton University Press.
Corbin, J. & Strauss, A. 2008. Basics of Qualitative Research. Thousand Oaks: Sage.
Cournot, A. 1927[1838]. Researches into the Mathematical Principles of the Theory of Wealth. Translated by N. T. Bacon. New York: Macmillan.
Crane, A. & Matten, D. 2010. Business Ethics. New York: Oxford University Press.
Czarniawska, B. 1997. Narrating the Organization: Dramas of Institutional Identity. Chicago: University of Chicago Press.
201
Dacin, T., Goodstein, J. & Scott, W. R. 2002. Institutional theory
and institutional change: Introduction to the special research forum. Academy of Management Journal, 45(1), 45-56.
Dahan, N. M., Doh, J. P., Oetzel, J. & Yaziji, M. 2010. Corporate-NGO collaboration: Co-creating new business models for developing markets. Long Range Planning, 43, 326-342.
Datta-Chaudhuri, M. 1990. Market failure and government failure. Journal of Economic Perspectives, 4(3): 25-39.
D’Aunno, T., Succi, M. & Alexander, J. A. 2000. The role of institutional and market forces in divergent organizational change. Administrative Science Quarterly, 45(4), 679-703.
Davidson, D. K. 2009. Ethical concerns at the bottom of the pyramid: Where CSR meets BOP. Journal of International Business Ethics, 2(1), 22-32.
Davis, G. F., Dikemann, K. A., & Tinsley, C. H. 1994. The decline and fall of the conglomerate firm in the 1980s: The deinstitutionalization of an organizational form. American Sociological Review, 59(4), 547-570.
De Soto, H. (2000). The Mystery Of Capital: Why Capitalism Triumphs in the West and Fails Everywhere Else. New York: Basic Books.
Dehegia, R. H. & Wahba, S. 2002. Propensity score-matching methods for nonexperimental causal studies. The Review of Economics and Statistics, 84(1), 151-161.
Dewey, J. 1997[1938]. Experience & Education. New York: Touchstone.
DFID. 2008. Making Value Chains Work Better For the Poor. London: UK Department for International Development.
DiMaggio, P. J. 1988. Interest and agency in institutional theory. In L.G. Zucker (Ed.), Institutional Patterns and Organizations: Culture and Environment: 3-22. Cambridge, MA: Ballinger.
202

DiMaggio, P. J. 1995. Comments on “What theory is not”. Administrative Science Quarterly, 40(3), 391-397.
DiMaggio, P. J., & Powell, W. W. 1983. The iron cage revisited: Institutional isomorphism and collective rationality in organizational fields. American Sociological Review, 48, 147–160.
DiMaggio, P. J., & Powell, W. W. 1991. Introduction. In W. W. Powell & P. J. DiMaggio (Eds.), The New Institutionalism in Organizational Analysis: 1-38. Chicago: University of Chicago Press.
Djelic, M. L. 1998. Exporting the American Model: The Postwar Transformation of European Business. Oxford University Press.
Donald, S. & Lang, K. 2007. Inference with difference-in-differenceand other panel data. The Review of Economics and Statistics, 89(2), 221-233.
Dorward, A., Kydd, J, Morrison, J. & Poulton, C. 2005. Institutions, markets and economic co-ordination: Linking development policy to theory and praxis. Development and Change, 36,1-25.
Dubin, R. 1969. Theory Building. New York: The Free Press.
Duflo, E. 2006. Poor but rational? In A. V. Banerjee, R. Benabou & D. Mookherjee (Eds.), Understanding Poverty: 367-378. New York: Oxford University Press.
Dyer, W. G. & Wilkins, A. L. 1991. Better stories, not better constructs, to generate better theory: A rejoinder to Eisenhardt. Academy of Management Review, 16(3), 613-619.
Eisenhardt, K. 1989. Building theories from case study research. Academy of Management Review, 14, 532-550.
Emirbayer, M. & Mische, A. 1998. What is agency? American Journal of Sociology, 103(4), 962-1023.
203

Englund, H. & Gerdin, J. 2011. Agency and structure in management accounting research: Reflections and extensions of Kilfoyle and Richardson. Critical Perspectives on Accounting, 22, 581-92.
FAO. 2012. Inclusive Value Chains. Food and Agriculture Organization of the United Nations, retrieved from http://www.fao.org/ag/ags/ivc/en/, February 7, 2012.
Faraway, J. J. 2006. Extending the Linear Model With R: Generalized Linear, Mixed Effects and Nonparametric Regression Models. Boca Raton, FL: Taylor and Francis.
Firebaugh, G. 2003. The New Geography of Global Income Inequality. Cambridge: Harvard University Press.
Fisher, A. G. B. 1939. Production, primary, secondary and tertiary.Economic Record, 15, 24-38.
Fligstein, N. 1996. Markets as politics: A political-cultural approach to market Institutions. American Sociological Review, 61, 656-673.
Fligstein, N. 1997. Social skill and institutional theory. American Behavioral Scientist, 40(4), 397-405.
Fligstein, N. 2001. The Architecture of Markets. Princeton, NJ: Princeton University Press.
Fligstein, N. & Dauter, L. 2007. The sociology of markets. Annual Reviewof Sociology, 33, 105-28.
Fourcade, M. 2007. Theories of markets and theories of society. American Behavioral Scientist, 50, 1015-1034.
Fourcade M. & Healy, K. 2007. Moral views of market society, Annual Review of Sociology 33, 285-311.
Friedland, R. & Alford, R. R. 1991. Bringing society back in: Symbols, practices, and institutional contradictions. In W. W. Powell & P. J. DiMaggio (Eds.), The New Institutionalism in Organizational Analysis: 232-263. Chicago: University of Chicago Pres.
204

Garud, R., Jain, S., & Kumaraswamy, A. 2002. Institutional entrepreneurship in the sponsorship of common technological standards: The case of Sun Microsystems and Java. Academy of Management Journal, 45(1), 196-214.
Garud, R. & Karnøe, P. 2003. Bricolage versus breakthrough: Distributed agency in technology entrepreneurship. Research Policy, 32, 277-300.
Garud, R., Hardy, C. & Maguire, S. 2007. Institutional entrepreneurship as embedded agency: An introduction to the special issue. Organization Studies, 28(7), 957-969.
Gereffi, G., Humphrey, J. & Sturgeon T. 2005. Governance of global value chains. Review of International Political Economy, 12(1), 78-104.
Giddens, A. 1984. The Constitution of Society: Outline of the Theory of Structuration. Berkeley: University of California Press.
Glaser B. & Strauss, A. L. 1967. The Discovery of Grounded Theory: Strategies for Qualitative Research. Chicago: Aldine.
Glaser, B. G. 1992. Basics of Grounded Theory Analysis. Mill Valley, CA: Sociology Press.
Goulding, C. 2002. Grounded Theory: A Practical Guide for Management, Business and Market Researchers. Thousand Oaks, CA: Sage.
Gradl, C., Krämer, A. & Amadigi, F. 2010. Partner selection for inclusive business models. Greener Management International, 56, 25-42.
Gradl, C. & Knobloch, C. 2010. Inclusive Business Guide. Berlin: Endeva.
Granovetter, M. 1985. Economic action and social structure: The problem of embeddedness. American Journal of Sociology, 91, 481-510.
Green, D. 2008. From Poverty to Power. Oxford: Oxfam International.
205

Green, D. O., Creswell, J. W., Shope R. J. & Plano, C. 2007. Grounded theory and racial/ethnic diversity. In A. Bryant and K.Charmaz (Eds.), The Sage Handbook of Grounded Theory: 472-492. Thousand Oaks, CA: Sage.
Greenwood, R. & Hinings, C. R. 1996. Understanding radical organizational change: Bringing together the old and the new institutionalism. Academy of Management Review, 21(4), 1022-1054.
Greenwood, R., Oliver, C., Sahlin, K. & Suddaby, R. 2008. Introduction. In R. Greenwood, C. Oliver, K. Sahlin & R. Suddaby(Eds.), The Sage Handbook of Organizational Institutionalism: 1-46. ThousandOaks, CA: Sage.
Greenwood, R. & Suddaby, R. 2006. Institutional entrepreneurship inmature fields: The big five accounting firms. Academy of Management Journal, 49, 27-48.
Greenwood, R., Suddaby, R. & Hinings, C.R. 2002. Theorizing change:The role of professional associations in the transformation of institutionalized fields. Academy of Management Journal, 45, 58-80.
Goulding, C. 2002. Grounded Theory. Thousand Oaks, CA: Sage.
Gubrium, J. F. & Holstein, J. A. (Eds.). 2003. Postmodern Interviewing. Thousand Oaks, CA: Sage.
Hahn, R. 2009. The ethical rationale of business for the poor: Integrating the concepts of bottom of the pyramid, sustainable development, and corporate citizenship. Journal of Business Ethics, 84(3), 313-324.
Halder, S. R. & Baruda, P. (2003). Dairy Production, Consumption and Marketing in Bangladesh. Dhaka, Bangladesh: BRAC Research and Evaluation Division.
Hall, J. A. 2010. State Failure, In G. Morgan et al. (Eds.), The Oxford Handbook Of Comparative Institutional Analysis. New York: Oxford University Press.
206

Hall, P. A. & Soskice, D. (Eds.) 2001. Varieties of Capitalism. Oxford University Press.
Hall, P. A. & Thelen, K. 2009. Institutional change in varieties ofcapitalism. Socio-Economic Review, 7, 7-34.
Hall, P. A. & Gingerich, D. W. 2009. Varieties of capitalism and institutional complementarities in the political economy: An empirical analysis. British Journal of Political Science, 39, 449-482.
Haque, S. A. M. A. (2007). Improved Market Access and Smallholder Dairy FarmerParticipation for Sustainable Dairy Development: Lessons Learned Study Bangladesh. Bangkok: Food and Agriculture Organization Regional Office for Asia and the Pacific.
Hargadon, A. B. & Douglas, Y. 2001. When innovations meet institutions: Edison and the design of the electric light. Administrative Science Quarterly, 46(3), 476-501.
Hart S. L. 2010. Capitalism at the Crossroads: The Unlimited Business Opportunities in Solving the World’s Most Difficult Problems. New Jersey: Wharton School Publishing.
Hart, S. L. & Christensen, C. 2002. The great leap: Driving innovation from the base of the pyramid. MIT/Sloan Management Review, 44(1), 51-56.
Hart, S. L. & London, T. 2005. Developing native capability: What multinational corporations can learn from the base of the pyramid. Stanford Social Innovation Review, 3(2), 28-33.
Hart, S. L. & Milstein, M. B. 2003. Creating sustainable value. Academy of Management Executive, 17(20), 56-69.
Hart, S. L. & Sharma, S. 2004. Engaging fringe stakeholders for competitive imagination. Academy of Management Executive, 18(1), 7-18.
Hayek, F. A. 1944. The Road to Serfdom. Chicago, University of Chicago Press.
207
Heilbroner, R. L. & Milberg, W. 2008. The Making of Economic Society. Prentice Hall.
Henrich, J. et al. 2010. Markets, religion, community size and the evolution of fairness and punishment. Science, 327, 1480-1484.
Herr, M. L. & Muzira, T. J. 2009. Value Chain Development for Decent Work. Geneva: International Labour Organization.
Hitt, M. A. & Smith, K. G. 2005a. Introduction: The process of developing management theory. In K. G. Smith & M. A. Hitt (Eds.), Great Minds in Management: The Process of Theory Development: 1-6. Oxford University Press.
Hitt, M. A. & Smith, K. G. 2005b. Epilogue: Learning how to develop theory from the masters. In K. G. Smith & M. A. Hitt (Eds.), Great Minds in Management: The Process of Theory Development: 572-588. Oxford University Press.
Humberg, K. M. 2011. Poverty Reduction through Social Business? Munich: Oekom.
Humphrey, J. & Navas-Alemán, L. 2010. Value Chains, Donor Interventions and Poverty Reduction: A Review of Donor Practice. Brighton: Institute of Development Studies.
IFAD, 2010. Rural Poverty Report 2011. Rome: International Fund for Agricultural Development.
Jackman, D. & Breeze, J. 2010. A Guide to Inclusive Business. London: International Business Leaders Forum.
Jabbar, M. A. 2010. Policy Barriers for Dairy Value Chain Development in North WestBangladesh. Dhaka, Bangladesh: Unnayan Shamunnay.
Jaiswal, A.K. 2008. The fortune at the bottom or the middle of the pyramid? Innovations, 3(1): 85-100.
Jepperson, R. L. 1991. Institutions, institutional effects, and institutionalism. In W. W. Powell & P. J. DiMaggio (Eds.), The New Institutionalism in Organizational Analysis: 143-163. Chicago: University of Chicago Pres.
208
Jha, R. & Dang, T. 2009. Vulnerability to poverty in select centralAsian countries. The European Journal of Comparative Economics, 6, 17-50.
Jones-Christensen, L.J., Parsons, H. & Fairbourne, J. 2010. Building Entrepreneurship in Subsistence Markets: Microfranchising as an Employment Incubator. Journal of Business Research, 63, 595-601.
Kacou, E. 2011. Entrepreneurial Solutions for Prosperity in BoP Markets. Upper Saddle River, NJ: Wharton School Publishing.
Kandachar, P. & Halme, M., (Eds.). 2008. Sustainability Challenges and Solutions at the Base of the Pyramid. Sheffield, UK: Greenleaf.
Kant, I. 1993[1785]. Translated by J. W. Ellington, Grounding for the Metaphysics of Morals 3rd Ed., Indianapolis, IN: Hackett Publishing Company.
Kaplinsky, R. & Morris, M. 2001. A Handbook for Value Chain Research. Ottawa: International Development Research Centre.
Karamchandani, A., Kubzansky, M. & Frandano, P. 2009. Emerging Markets, Emerging Models. Cambridge, MA: Monitor Group.
Karamchandani, A., Kubzansky, M. & Lalwani, N. 2011. Is the bottom of the pyramid really for you? Harvard Business Review, 89(3), 107-111.
Karlan, D. & Appel, J. 2011. More than Good Intentions: How a New Economics is Helping to Solve Global Poverty. New York: Dutton.
Karnani, A. 2005. Misfortune at the bottom of the pyramid, Greener Management International, 51, 99-110.
Karnani, A. 2007. The mirage of marketing to the bottom of the pyramid. California Management Review, 49(4), 90-111.
Karnani, A. 2009. Romanticizing the poor. Stanford Social Innovation Review, 7(1), 38-43.
209

Karnani, A. 2011. Fighting Poverty Together. Palgrave Macmillan.
Khanna, T. & Palepu, K. 2005. Strategies that fit emerging markets,Harvard Business Review, 83, 63-74, 76, 148.
Kistruck, G. M., Webb, J. W., Sutter, C. J. & Ireland, R. D. 2011. Microfranchising in base of the pyramid markets: Institutional challenges and adaptations to the franchise model. Entrepreneurship Theory & Practice, 35(3), 503-531.
Kolk, A., Van Tulder, R. & Kostwinder, E. 2008. Business and partnerships for development. European Management Journal, 26(4), 262-274.
Kraatz, M. S. 2009. Leadership as institutional work: A bridge to the other side. In T. B. Lawrence, R. Suddaby & B. Leca, (Eds.),Institutional Work: 59-91. New York: Cambridge University Press.
Kubzansky, M. Cooper, A. & Barbary, V. 2011. Promise and Progress: Market-Based Solutions to Poverty in Africa. Cambridge, MA: Monitor Group.
Langley, A. 1999. Strategies for theorizing from process data. Academy of Management Review. 24(4), 691-710.
Lawrence, T. B. 1999. Institutional strategy. Journal of Management, 25, 161-187.
Lawrence, T. B. & Suddaby, R. 2006. Institutions and institutional work. In S. R. Clegg, C. Hardy, T. B. Lawrence & W. R. Nord (Eds.), Handbook of Organization Studies, 2nd Edition: 215-254. London: Sage.
Lawrence, T. B., Suddaby, R. & Leca, B. 2009. Introduction: Theorizing and studying institutional work. In T. B. Lawrence, R. Suddaby & B. Leca, (Eds.), Institutional Work: 1-27. New York: Cambridge University Press.
Leblebici, H., Salancik, G. R., Copay, A. & King, T. 1991. Institutional change and the transformation of interorganizational fields: An organizational history of the
210
U.S. radio broadcasting industry. Administrative Science Quarterly, 36(3), 333-363.
Lee, G. K. & Paruchuri, S. 2008. Entry into emergent and uncertain product-markets: The role of associative rhetoric. Academy of Management Journal, 51, 1171-1188.
Levi-Strauss, C. 1967. The Savage Mind. Chicago: University of ChicagoPress.
Lincoln, Y. S. & Guba, E. G. 1985. Naturalistic Inquiry. Newbury Park, CA:Sage.
Locke, J. 1960[1690]. Two Treatises on Government. Edited by P. Laslett.Cambridge University Press.
Locke, K. 2001. Grounded Theory in Management Research. Thousand Oaks, CA:Sage.
Lofland, J., Snow, D. A., Anderson, L. & Lofland, L. H. 2006. Analyzing Social Settings: A Guide to Qualitative Observation and Analysis. WadsworthPublishing.
London, T. 2009. Making better investments at the base of the pyramid. Harvard Business Review, 87(5), 106-113.
London, T. & Anupindi, R. 2012. Using the base-of-the-pyramid perspective to catalyze interdependence-based collaborations. Proceedings of the National Academy of Sciences, 109(31), 12338-12343.
London, T., Anupindi, R. & Sheth, S. 2010. Creating mutual value: Lessons learned from ventures serving base of the pyramid producers. Journal of Business Research, 63(6), 582-594.
London, T. & Hart, S.L. 2004. Reinventing strategies for emerging markets: beyond the transnational model. Journal of International Business Studies, 35, 350-370.
London, T. & Hart, S.L. 2010. Next Generation Business Strategies for the Base ofthe Pyramid. Upper Saddle River, NJ: FT Press.
211

Lounsbury, M. & Crumley, E. T. 2007. New practice creation: An institutional perspective on innovation. Organization Studiies, 28(7),993-1012.
Maguire, S., Hardy, C. & Lawrence, T. B. 2004. Institutional entrepreneurship in emerging fields: HIV/AIDS treatment advocacyin Canada. Academy of Management Journal, 47(5), 657-679.
Mahmood, S. A. 2009. Entrepreneurship, productivity and investment climate: Issues for Bangladesh. In S. Ahmed & W. Mahmud (Eds.), Growth and Poverty: The Development Experience of Bangladesh:149-166. Dhaka,Bangladesh: University Press Limited.
Mahoney, J. & Thelen, K. A. 2010. A theory of gradual institutionalchange. In J. Mahoney & K. A. Thelen (Eds.), Explaining Institutional Change: 1-37. Cambridge, UK: Cambridge University Press.
Mair, J. & Martí, I. 2009. Entrepreneurship in and around institutional voids: A case study from Bangladesh. Journal of Business Venturing, 24, 419-435.
Mair, J., Martí, I. & Ganly, K. 2007. Institutional voids as spacesof opportunity. European Business Forum, 31, 34-39.
Mair, J., Martí, I. & Ventresca, M. J. 2012 Building inclusive markets in rural Bangladesh: How intermediaries work institutional voids. Academy of Management Journal, 55(4).
Mair, J. & Schoen, O. 2007. Successful social entrepreneurial business models in the context of developing economies: An explorative study. International Journal of Emerging Markets, 2, 54-68.
Marshall, A. 1961[1920]. Principles of economics. London: Macmillan.
Martí, I. & Mair, J. 2009. Bringing change into the lives of the poor: Entrepreneurship outside traditional boundaries. In T. Lawrence, R. Suddaby & B. Leca (Eds.), Institutional Work: 92-119. Cambridge, UK: Cambridge University Press.
Martinez, J. L. & Carbonell, M. 2007. Value at the bottom of the pyramid. Business Strategy Review, 18(3), 50-55.
212

Marx, K. 1976[1867], Capital. New York, Penguin Classics.
Matten, D. & Crane, A. 2005. Corporate citizenship: Toward and extended theoretical conceptualization. Academy of Management Review, 30(1), 166-179.
Matten, D. & Moon, J. 2008. “Implicit” and “explicit” CSR: A conceptual framework for a comparative understanding of corporate social responsibility. Academy of Management Review, 33(2), 404-424.
Maxwell, J. A. 1992. Understanding validity in qualitative research. Harvard Educational Review, 62(3), 279-300.
McCracken, G. 1988. The Long Interview. Newbury Park, CA: Sage.
McKague, K. 2011. Dynamic capabilities of institutional entrepreneurship. Journal of Enterprising Communities: People and Places in the Global Economy, 5(1), 11-28.
McKague, K. & Oliver, C. 2012. Enhanced market practices as redistribution of social control. California Management Review, (in press).
McKague, K. & Tinsley, S. 2012. Bangladesh’s rural sales program: Towards a scalable rural sales agent model for distributing socially beneficial goods to the poor. Social Enterprise Journal, 8(1),16-30.
McKague, K., Wheeler, D., Cash, C., Comeault, J. & Ray, E. 2011. Introduction to the Special Issue on Growing Inclusive Markets. Journal of Enterprising Communities, 5(1), 5-10.
McVay, M. & Snelgrove, A. 2008. Program Design for Value Chain Initiatives. Waterloo, ON: MEDA.
Mehta, P. K. & Shenoy, S. 2011. Infinite Vision: How Aravind Became the World’s Greatest Business Case for Compassion. San Francisco, CA: Berrett-Koehler.
213

Menard, C. 1995. Markets as institutions versus organizations as markets? Disentangling some fundamental concepts. Journal of Economic Behavior and Organization, 28, 161-182.
Mendola, M. 2007. Farm household production theories: a review of ‘institutional’ and ‘behavioral’ responses, Asian Development Review,24, 49-68.
Mendoza, R. U. & Thelen, N. 2008. Innovations to make markets more inclusive for the poor. Development Policy Review, 26, 427-458.
Meyer, R. E. 2008. New sociology of knowledge: Historical legacy and contributions to current debates in institutional research. In R. Greenwood, C. Oliver, K. Sahlin & R. Suddaby (Eds.), The Sage Handbook of Organizational Institutionalism:519-538. London: Sage Publications.
Meyer, J. W., & Rowan, B. 1977. Institutionalized organizations: Formal structure as myth and ceremony. American Journal of Sociology, 8,: 440-463.
Meyer, J. W. & Scott, W. R. 1983. Organizational environments. Beverley Hills, CA: Sage Publications.
Miles M. B. & Huberman, A. M. 1994. Qualitative Data Analysis. Sage.
Miller, D., Lee, J., Chang, S. & Le Breton-Miller, I. 2009. Fillingthe institutional void: The social behavior and performance of family vs non-family technology firms in emerging markets. Journalof International Business Studies, 40, 802-817.
Mintzberg, H. 2005. Developing theory about the development of theory. In K. G. Smith & M. A. Hitt (Eds.), Great Minds in Management: The Process of Theory Development, 355-372. Oxford University Press.
Mitchell, J. & Coles, C. 2011. Markets and Rural Poverty. Washington, DC:Earthscan.
214
Mitchell, J., Keane, J. & Coles, C. 2009. Trading Up: How a Value Chain Approach Can Benefit the Rural Poor. London: Overseas Development Institute.
Mohr, L. B. 1982. Explaining Organizational Behavior. San Francisco: Jossey-Bass.
Moore, G. 2004. The Fair Trade Movement: Parameters, Issues and Future Research. Journal of Business Ethics, 53(1-2): 73-86.
Morgan, G. & Smirchich, L. 1980. The case for qualitative research.Academy of Management Review, 5(4), 491-500.
Morgan, G., Campbell, J. L., Crouch, C., Pedersen, O. K. & Whitley,R. 2010. Introduction. In G. Morgan, J. L. Campbell, C. Crouch, O. K. Pedersen & R. Whitley (Eds.), The Oxford Handbook of Comparative Institutional Analysis: 1-11. Oxford University Press.
Morgan, G., Whitley, R. & Moen, E. (Eds.) 2005. Changing Capitalisms? Oxford University Press.
Mosdale, S. 2005. Assessing women’s empowerment: Towards a conceptual framework. Journal of International Development, 17(2), 243-257.
Muller, J. Z. 2002. The Mind and the Market. New York: Anchor Books.
Munir, K., Ansari, S. & Gregg, T. 2010. Beyond the hype: Taking business strategy to the ‘bottom of the pyramid’. In J. A. C. Baum and J. Lampel (Eds.), The Globalization of Strategy Research: 247-276. Advances in Strategic Management, Vol. 27, Emerald Group Publishing Limited.
Munir, K. A. & Phillips, N. 2005. The birth of the Kodak moment: Institutional entrepreneurship and the adoption of new technologies. Organization Studies, 26(11), 1665-1687.
Narayan, D., Chambers, R., Shah, M. K. & Petesch, P. 2000. Voices of the Poor: Crying Out for Change. New York: Oxford University Press.
215

Narayan, A., Yoshida, N. & Zaman, H. 2009. Trends and patterns of poverty in Bangladesh in recent years. In Narayan, A. & Zaman, H. (Eds.), Breaking Down Poverty in Bangladesh: 1-40. Dhaka, Bangladesh:University Press Limited.
Narayan, A. & Zaman, H. (Eds.) 2009. Breaking Down Poverty in Bangladesh. Dhaka, Bangladesh: University Press Limited.
Natarajan, T. 2005. Agency of development and agents of change: localization, resistance, and empowerment, Journal of Economic Issues 39, 409-418.
North, D. C. 1977. Markets and other allocation systems in history:The challenge of Karl Polanyi. Journal of European Economic History, 6(3), 703-716.
Nussbaum, M. C. 2011. Creating Capabilities: The Human Development Approach. Boston: Harvard University Press.
O’Dowd, M. C. 1978. The problem of ‘government failure’ in mixed economies. South African Journal of Economics 46(4), 242-247.
Oetzel, J. & Doh, J. P. 2009. MNEs and development: A review and reconceptualization. Journal of World Business, 44, 108-120.
Oliver, C. 1991. Strategic responses to institutional processes. Academy of Management Review, 16(1), 145-179.
Oliver, C. 1992. The antecedents of deinstitutionalization. Organization Studies, 13(4), 563-588.
Oliver, C. 1996. The institutional embeddedness of economic activity. Advances in Strategic Management, 13, 163-186.
Olsen, M. & Boxenbaum, E. 2009. Bottom of the pyramid: Organizational barriers to implementation. California Management Review, 51(4), 100-125.
Owen-Smith, J. & Powell, W. W. 2008. Networks and institutions. In R. Greenwood, C. Oliver, K. Sahlin & R. Suddaby (Eds.), The Sage
216
Handbook of Organizational Institutionalism: 596-623. Thousand Oaks, CA: Sage Publications.
Pardo del Val, M. & Lloyd, B. 2003. Measuring empowerment. Leadership and Organization Development Journal, 24, 102-108.
Parnini, S.N. 2009. Public sector reform and good governance: The impact of foreign aid on Bangladesh. Journal of Asian and African Studies,44, 553-575.
Patton, M. Q. 2002. Qualitative Research and Evaluation Methods. Thousand Oaks, CA: Sage.
Pearce, J. 2005. Organizational scholarship and the eradication of global poverty. Academy of Management Journal, 48(6), 970-972.
Peredo, A. M. & Chrisman, J. J. 2006. Toward a theory of community based enterprise. Academy of Management Review, 31, 309-328.
Perez-Aleman, P. & Sandilands, M. 2008. Building value at the top and the bottom of the supply chain: MNC-NGO partnerships. California Management Review, 51(1), 24-49.
Perkmann, M. & Spicer, A. 2008. How are management fashions institutionalized? The role of institutional work. Human Relations,61(6): 811-814.
Pettigrew, A. 1992. The character and significance of strategy process research. Strategic Management Journal, 13, 5-16.
Pfeffer, J. 2005. Developing resource dependence theory: How theoryis affected by its environment. In K. G. Smith & M. A. Hitt (Eds.), Great Minds in Management: The Process of Theory Development, 436-459. Oxford University Press.
Polanyi, K. 2001 [1944]. The Great Transformation. Boston, Beacon Press.
Porter, M. E. 1985. Competitive Advantage: Creating and Sustaining Superior Performance. Free Press: New York.
217

Porter, M. E. & Kramer, M. 2011. Creating shared value. Harvard Business Review, 89 (1/2), 62-77.
Poulton, C., Kydd, J. & Dorward, A. 2006. Overcoming market constraints on pro-poor agricultural growth in sub-Saharan Africa. Development Policy Review, 24(3) 243-277.
Powell, W. W. 1991. Expanding the scope of institutional analysis. In W. W. Powell & P. J. DiMaggio (Eds.), The New Institutionalism in Organizational Analysis: 183-203, Chicago: University of Chicago Press.
Prahalad, C.K. 2005. The Fortune at the Bottom of the Pyramid. Upper Saddle River, NJ: Wharton Publishing.
Prahalad, C.K. & Hammond, A. 2002. Serving the world’s poor profitably. Harvard Business Review, 80(9): 48-57.
Prahalad, C. K. & Hart S. L. 2002. The Fortune at the Bottom of the Pyramid. Strategy + Business, 26(1), 54-67.
Radjou, N., Prabhu, J. & Ahuja, S. 2012. Jugaad Innovation: Think Frugal, BeFlexible, Generate Breakthrough Growth. San Francisco, CA: Jossey-Bass.
Ragin, C. C. 1987. The Comparative Method: Moving Beyond Qualitative and Quantitative Strategies. Berkeley: University of California Press.
Rahman, S. 2006. Development, democracy and the NGO sector: Theory and evidence from Bangladesh. Journal of Developing Societies, 22(4), 451-473.
Ramachandran, J., Pant, A, & Pani, K. 2012. Building the BoP producer ecosystem. Journal of Product Innovation Management, 29(1), 33-51.
Ramamurti, R. 2004. Developing countries and MNEs: Extending and enriching the research Agenda. Journal of International Business Studies, 35, 277-283.
Rangan, V. K. & Lee, K. 2010. Grameen Danone Foods Ltd. A Social Business. Cambridge, MA, Harvard Business School case study.
218
Rangan, V. K., Quelch, J. A., Herrero, G. & Barton, B. (Eds.) 2007. Business Solutions for the Global Poor: Creating Social And Economic Value. San Francisco, CA: John Wiley & Sons.
Rangan, V. K., Sehgal, D. and Rajan, R. 2007. The complex business of serving the poor: Insights from Unilever’s project Shakti in India. In V. K. Rangan, J. A. Quelch, G. Herrero and B. Barton (Eds.), Business Solutions for the Global Poor: 144-154. San Francisco, CA:Jossey-Bass.
Rao, H., Monin, P. & Durand, R. 2005. Border crossing: Bricolage and the erosion of categorical boundaries in French gastronomy. American Sociological Review, 70, 968-991.
Rao, J.N.K. & Vijayan, K. 1977. On estimating the variance in sampling with probability proportional to aggregate size. Journalof the American Statistical Association, 72 (359), 579-584.
Rawls, J. (1971). A Theory of Justice. Cambridge, MA: Belknap Press.
Reynolds, L. T. 2000. Re-embedding Global Agriculture: The International Organic and Fair Trade Movements. Agriculture and Human Values 17(3): 279-309.
Rivera-Santos, M., Rufin, C. & Kolk, A. 2012. Bridging the institutional divide: Partnerships in subsistence markets. Journalof Business Research (in press).
Rivera-Santos, M. & Rufin, C. 2010. Odd couples: Understanding the governance of firm-NGO alliances. Journal of Business Ethics, 94, 55-70.
Robinson, J. A., Mair, J. & Hockerts, K. (Eds.). 2009. International Perspectives on Social Entrepreneurship. New York, NY: Palgrave Macmillan.
Robinson, M. 2001. The Microfinance Revolution: Sustainable Finance for the Poor. Washington: World Bank.
Roodman, D. 2012. Due Diligence: An Impertinent Inquiry Into Microfinance. Washington: Center for Global Development.
219

Rosa, J. A. & Viswanathan, M. (Eds.). 2007. Product and market development for subsistence marketplaces. Advances in International Management, Volume 20. San Diego, CA: JAI Press.
Rosenbaum, P. R. & Rubin, D. B. 1983. The central role of the propensity score in observational studies for causal effects. Biometrika, 70(1), 41-45.
Rugman, A. M. & Doh, J. P. 2008. Multinationals & Development. New Haven: Yale University Press.
SABMiller. 2011. Exploring the links between international businessand poverty reduction , Coca-Cola, SABMiller and Oxfam America, retrieved from www.thecoca-colacompany.com/citizenship/pdf/poverty_footprint_report.pdf, February 7, 2012.
Sachs, J. 2005. The End of Poverty. New York: Penguin.
Sanchez, P. A. & Swaminathan, M. S. 2005. Cutting world hunger in half. Science, 307(5708), 357-359.
Sánchez, P., Ricart, J. & Rodríguez, M. 2007. Influential factors in becoming socially embedded in low-income markets. Greener Management International, 51, 19-38.
Santos, F. M. & Eisenhardt, K. M. 2009. Constructing markets and shaping boundaries: Entrepreneurial power in nascent fields. Academy of Management Journal, 52, 643-671.
Sarasvathy, S. D. & Dew, N. 2005. New market creation through transformation. Journal of Evolutionary Economics, 15, 533-565.
Sarker, A. E. 2005. New public management, service provision and non-governmental organizations in Bangladesh. Public Organization Review, 5, 249-271.
Sarker, A.E. & Rahman, M.H. 2006. The emerging perspective of governance and poverty alleviation: A case of Bangladesh. Public Organization Review, 7, 93-112.
220
Schumpeter, J. 2006 [1944]. Capitalism, Socialism and Democracy. Oxon, UK: Routledge.
Scoones, I. 1998. Sustainable Rural Livelihoods: A Framework for Analysis. Brighton: Institute of Development Studies at the University of Sussex.
Scott, W. R. 1991. Unpacking institutional arguments. In W. W. Powell & P. J. DiMaggio (Eds.), The New Institutionalism in Organizational Analysis: 164-182. Chicago: University of Chicago Pres.
Scott, W. R. 1995. Institutions and Organizations. 1st Edition. Thousand Oaks, CA: Sage.
Scott, W. R. 2008. Institutions and Organizations. 3rd Edition. Thousand Oaks, CA: Sage.
Seelos, C. & Mair, J. 2005. Social entrepreneurship: Creating new business models to serve the poor. Business Horizons, 48, 241-246.
Seelos, C. & Mair, J. 2007. Profitable business models and market creation in the context of deep poverty: a strategic view. Academy of Management Perspectives, 21(4), 49-63.
Segel, A. I., Meghji, N. & García-Cuéllar, R. 2007. Patrimonio Hoy:A groundbreaking corporate program to alleviate Mexico’s housingcrisis. In V. K. Rangan, J. A. Quelch, G. Herrero and B. Barton (Eds.), Business Solutions for the Global Poor: 155-172. San Francisco, CA:Jossey-Bass.
Sehgal, V., Dehoff, K. & Panneer, G. 2010. The importance of frugalengineering. Strategy+Business, 59, 1–5.
Sen, A. 1985. Well-being, agency and freedom. Journal of Philosophy, 82, 169-221.
Sen, 1999. A. Development as Freedom. New York, NY: Anchor Books.
221

Seo, M. G. & Creed, W. E. D. 2002. Institutional contradictions, praxis, and institutional change: A dialectical perspective. Academy of Management Review, 27(2), 222-247.
Sharma, S., Vredenburg, H. & Westley, F. 1994. Strategic bridging: A role for the multinational corporation in Third World Development. Journal of Applied Behavioral Science, 30(4), 458-476.
Simanis, E. 2012. Reality Check at the Bottom of the Pyramid. Harvard Business Review, 90(6), 120-125.
Simanis, E. 2010. Needs, needs, everywhere, but not a BoP market totap. In T. London & S. L. Hart (Eds.), Next Generation Business Strategies for the Base of the Pyramid: 103-126. Upper Saddle River, NJ: FT Press.
Simanis, E. & Hart, S. L. 2009. Innovation from the inside out. MIT/Sloan Management Review, 50, 77-86.
Simon, H. A. 1967. The business school: A problem in organizationaldesign. Journal of Management Studies, 4, 1-16.
Smith, A. 1994[1776].The Wealth of Nations. New York, Random House.
Sridharan, S. & Viswanathan, M. 2008. Marketing in subsistence marketplaces: consumption and entrepreneurship in a South Indiancontext. Journal of Consumer Marketing, 25(7), 455-462.
Stiglitz, J. E. 1989. Markets, market failures and development. The American Economic Review, 79, 197-203.
Stiglitz, J. E. 2010. Freefall: America, Free Markets and the Sinking of the World Economy. New York: W. W. Norton.
Suchman, M. C. 1995. Managing legitimacy: Strategic and institutional approaches. Academy of Management Review, 20, 571-610.
Suddaby, R. 2006. What grounded theory is not. Academy of Management Journal, 49(4), 633-642.
222

Suddaby, R. & Greenwood, R. 2005. Rhetorical strategies of legitimacy. Administrative Science Quarterly, 50(1), 35-67.
Sutton, R. I. & Staw, B. M. 1995. What theory is not. Administrative Science Quarterly, 40, 371-384.
Swedberg, R. 1994. Markets as social structures. In N. Smelser & R.Swedberg (Eds.), The Handbook of Economic Sociology: 255-282. Princeton, NJ: Princeton University Press.
Swedberg, R. 2005. Markets in Society. In N. Smelser & R. Swedberg (Eds.), The Handbook of Economic Sociology: 233-253. Princeton, NJ: Princeton University Press.
Teece, D.J. 2007. Explicating dynamic capabilities: The nature and microfoundations of (sustainable) enterprise performance. StrategicManagement Journal, 28(13), 1319-1350.
Teece, D.J. Pisano, G. & Shuen, A. 1997. Dynamic capabilities and strategic management. Strategic Management Journal, 18(7), 509-533.
Teegen, H., Doh, P. & Vachani, S. 2004. The importance of nongovernmental organizations (NGOs) in global governance and value creation: An international business research agenda. Journalof International Business Studies, 35, 463-4583.
Tempel, A. & Walgenbach, P. 2007. Global standardization of organizational forms and management practices? What new institutionalism and the business-systems approach can learn from each other. Journal of Management Studies, 44(1), 1-24.
Thornton, P. & Ocasio, W. 1999. Contingency of power in organizations: Executive succession in the higher education publishing industry, 1958-1990. American Journal of Sociology, 105(3), 801-843.
Thornton, P. & Ocasio, W. 2008. Institutional logics. In R. Greenwood, C. Oliver, K. Sahlin & R. Suddaby (Eds.), The Sage Handbook of Organizational Institutionalism: 99-129. Thousand Oaks, CA: Sage Publications.
223

Ullah, A. K. M. & Routray, J. K. 2007. Rural poverty alleviation through NGO interventions in Bangladesh: How far is the achievement? International Journal of Social Economics, 34, 237-248.
UN, 1948. Universal Declaration of Human Rights. New York, United Nations General Assembly.
UNDP. 2004. Unleashing Entrepreneurship: Making Business Work for the Poor. New York: United Nations Development Program.
UNDP. 2008. Creating Value for All: Strategies for Doing Business with the Poor. New York: United Nations Development Program.
UNDP. 2010. The MDGs: Everyone’s Business. New York: United Nations Development Program.
UNIDO. 2011. Pro-Poor Value Chain Development. Vienna: United Nations Industrial Development Organization.
USAID. 2012. Value Chain Development Wiki, United States Agency for International Development, retrieved from http://microlinks.kdid.org/good-practice-center/value-chain-wiki, February 7, 2012.
Uzzi, B. 1997. Social structure and competition in interfirm networks: The paradox of embeddedness. Administrative Science Quarterly,42, 35-67.
Uzzi, B. & Lancaster, R. 2004. Embeddedness and price formation in the corporate law market. American Sociological Review, 69, 319-344.
Vachani, S. & Smith, N. C. 2008. Socially responsible distribution:Distribution strategies for reaching the bottom of the pyramid. California Management Review, 50, 52-84.
Van de Ven, A. 1989. Nothing is quite so practical as a good theory. Academy of Management Review, 14(4), 486-489.
Van Maanen, J. 1979. The fact of fiction in organizational ethnography. Administrative Science Quarterly, 24(4), 539-550.
224
Veblen, T. 1994[1899]. The Theory of the Leisure Class. New York, Penguin.
Viswanathan, M. & Rosa, J. A. 2010. Understanding subsistence marketplaces: Toward sustainable consumption and commerce for a better world. Journal of Business Research 63, 253-257.
Wallace J. & Dollery, B. 1999. Market Failure, Government Failure, Leadership and Public Policy. New York: St. Martin’s Press
Walras, L. 2010[1874]. Elements of Pure Economics. New York, Routledge.
WBCSD. 2004. Business Guide to Development Actors. Geneva: World Business Council for Sustainable Development.
Webb, J., Tihanyi, L., Ireland, D. & Simon, D. 2009. You say illegal, I say legitimate: Entrepreneurship in the informal economy. Academy of Management Review, 34, 492-510.
Weber, M. 1949. Objectivity in social science and social policy. InE. A. Shils and H. A. Finch (Eds./Trans.), Methodology of the Social Sciences. New York: Free Press.
Weick, K. E. 1974. Amendments to organizational theorizing, Academy of Management Journal 17, 487-502.
Weick, K. E. 1989. Theory construction as disciplined imagination. Academy of Management Review, 14(4), 516-531.
Weick, K. E. 1995. What theory is not, theorizing is. Administrative Science Quarterly, 40(3), 385-390.
Weick, K. E. 1999. Theory construction as disciplined reflexivity: Tradeoffs in the 1990s. Academy of Management Review, 24(4), 797-806.
Weick, K. E. 2005. The experience of theorizing. In K. G. Smith & M. A. Hitt (Eds.), Great Minds in Management: 394-413. Oxford University Press.
Weiss, R. S. 1994. Learning from Strangers: The Art and Method of Qualitative Interview Studies. New York: Free Press.
225
Werner, O. & Schoepfle, G. M. 1987. Systematic Fieldwork: Vol. 2. Ethnographic Analysis and Data Management. Newbury Park, CA: Sage.
Wheeler, D. & McKague, K. 2002. The Role of Business in Development. World Bank Annual Bank Conference on Development Economics “Towards Pro-Poor Policies”, June 24-26, Oslo.
Wheeler, D., McKague, K., Thomson, J., Davies, R., Medalye, J., & Prada, M. 2005. Creating sustainable local enterprise networks. MIT/Sloan Management Review, 47, 33-40.
Whetten, D. A. 1989. What contributes a theoretical contribution? Academy of Management Review, 14(4), 490-495.
White, H. C. 2002. Markets from Networks. Princeton University Press.
Whitley, R. 1999. Divergent Capitalisms: The Social Structuring and Change of Business Systems. Oxford University Press.
WHO. 2005. Regional Health Situation: Bangladesh. Geneva: World Health Organization.
WHO. 2009. Health Action in Crisis: Bangladesh. Geneva: World Health Organization.
Wiener, C. 2007. Making teams work in conducting grounded theory. In A Bryant & K. Charmaz (Eds.), The SAGE Handbook of Grounded Theory:1-28. Thousand Oaks, CA: Sage.
World Bank, 2001. World Development Report 2000 / 2001: Attacking Poverty. The World Bank and Oxford University Press.
World Bank. 2002. World Development Report 2002: Building Institutions for Markets.New York: Oxford University Press.
World Economic Forum, 2009. The Next Billions: Unleashing Business Potential in Untapped Markets. Geneva: World Economic Forum.
Yin, R. K. 2008. Case Study Research: Design and methods. Newbury Park: Sage.
226
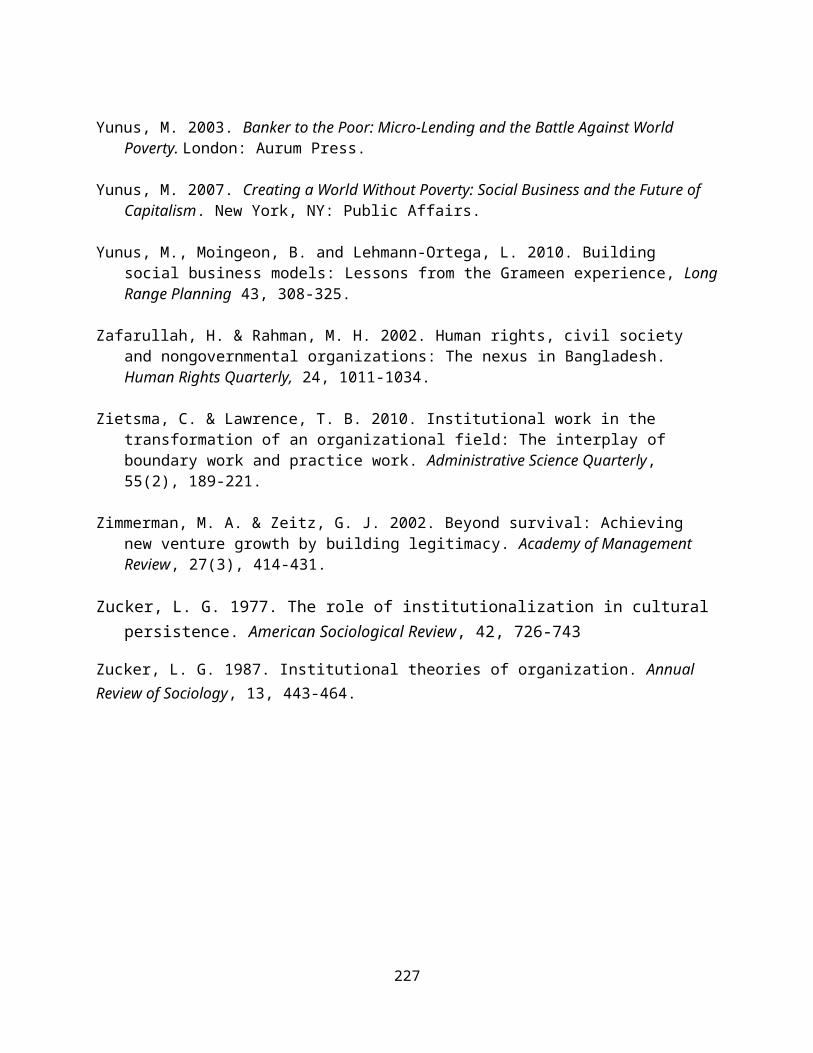
Yunus, M. 2003. Banker to the Poor: Micro-Lending and the Battle Against World Poverty. London: Aurum Press.
Yunus, M. 2007. Creating a World Without Poverty: Social Business and the Future of Capitalism. New York, NY: Public Affairs.
Yunus, M., Moingeon, B. and Lehmann-Ortega, L. 2010. Building social business models: Lessons from the Grameen experience, LongRange Planning 43, 308-325.
Zafarullah, H. & Rahman, M. H. 2002. Human rights, civil society and nongovernmental organizations: The nexus in Bangladesh. Human Rights Quarterly, 24, 1011-1034.
Zietsma, C. & Lawrence, T. B. 2010. Institutional work in the transformation of an organizational field: The interplay of boundary work and practice work. Administrative Science Quarterly, 55(2), 189-221.
Zimmerman, M. A. & Zeitz, G. J. 2002. Beyond survival: Achieving new venture growth by building legitimacy. Academy of Management Review, 27(3), 414-431.
Zucker, L. G. 1977. The role of institutionalization in cultural persistence. American Sociological Review, 42, 726-743
Zucker, L. G. 1987. Institutional theories of organization. Annual Review of Sociology, 13, 443-464.
227

APPENDICES
228
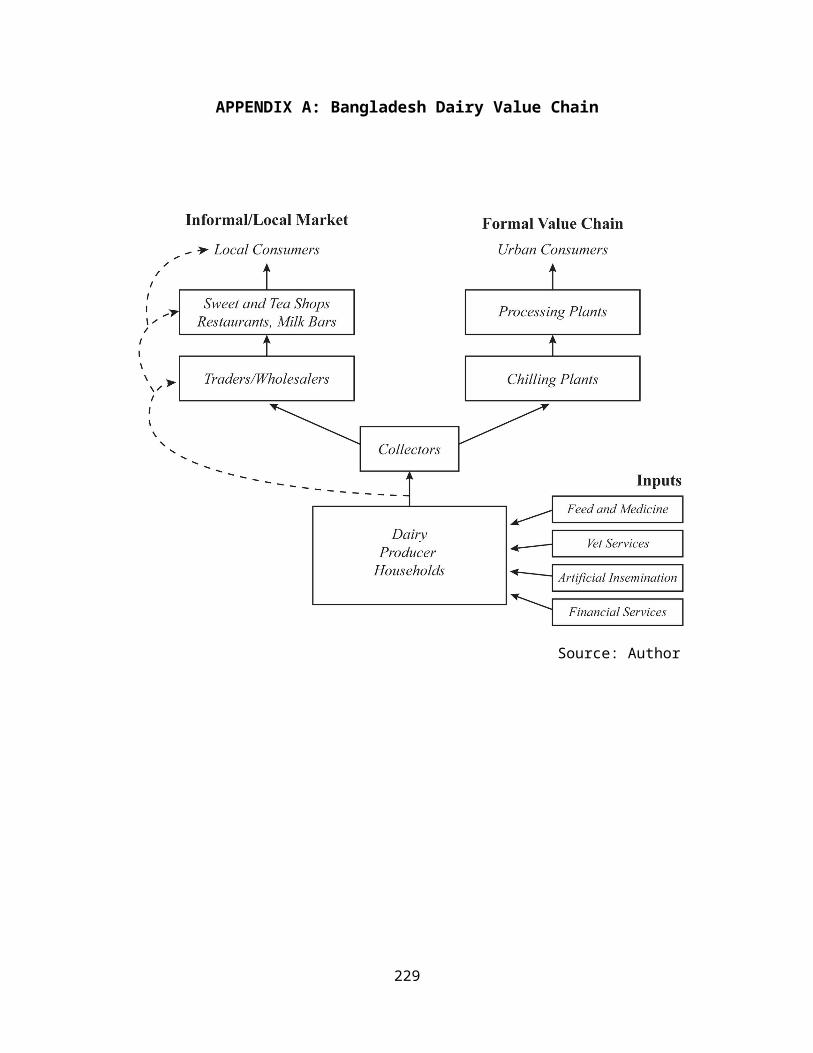
APPENDIX A: Bangladesh Dairy Value Chain
Source: Author
229

APPENDIX B: Geographic Study Area
CARE Bangladesh’s Strengthening the Dairy Value Chain Initiative
Source: CARE Bangladesh.
230

APPENDIX B: Geographic Study Area (Continued)
CARE Bangladesh’s Strengthening the Dairy Value Chain Initiative
Regions Districts Upazilas Unions Villages
Bogra
Sirajganj
Kazipur,Royganj,
Ulla Para,Tarash,
Shahjadpur
19 87
Bogra Sariakandi,Gabtali 8 37
Naogaon Manda,Badalgahi 6 40
JoypurhatPanchbibi,
Kalai,Khetlal
10 47
Rangpur
Gaibandha Sadullapur,Palashbari 11 45
Rangpur
MithaPukur,RangpurSadar,Kaunia,
Badarganj,Taraganj
28 101
Kurigram Ulipur,Rajarhat 14 77
NilphamariSaidpur,
Kishorenganj
7 17
Dinajpur Parbatipur 5 20
Total2
Regions9
Districts 24 Upazilas 108 Unions 471Villages
231

Source: CARE Bangladesh.
232
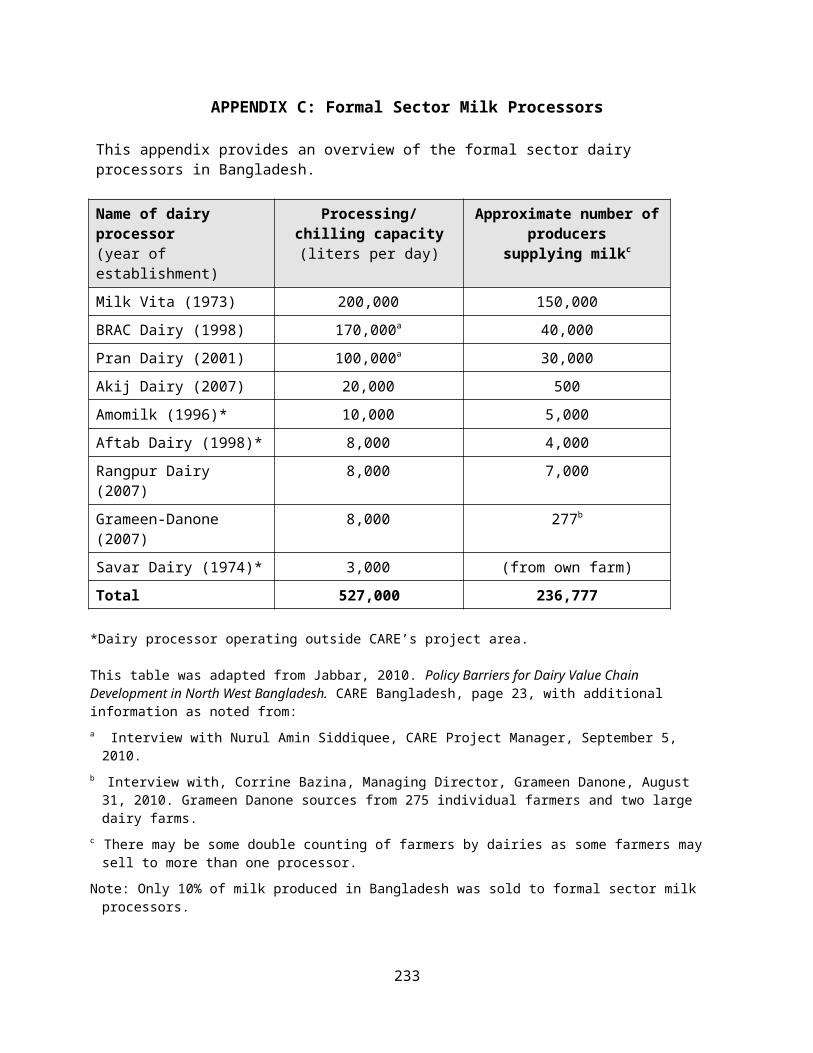
APPENDIX C: Formal Sector Milk Processors
This appendix provides an overview of the formal sector dairy processors in Bangladesh.
Name of dairy processor (year of establishment)
Processing/chilling capacity (liters per day)
Approximate number ofproducers
supplying milkc
Milk Vita (1973) 200,000 150,000BRAC Dairy (1998) 170,000a 40,000Pran Dairy (2001) 100,000a 30,000Akij Dairy (2007) 20,000 500Amomilk (1996)* 10,000 5,000Aftab Dairy (1998)* 8,000 4,000Rangpur Dairy (2007)
8,000 7,000
Grameen-Danone (2007)
8,000 277b
Savar Dairy (1974)* 3,000 (from own farm)Total 527,000 236,777
*Dairy processor operating outside CARE’s project area.
This table was adapted from Jabbar, 2010. Policy Barriers for Dairy Value Chain Development in North West Bangladesh. CARE Bangladesh, page 23, with additional information as noted from:a Interview with Nurul Amin Siddiquee, CARE Project Manager, September 5, 2010.
b Interview with, Corrine Bazina, Managing Director, Grameen Danone, August 31, 2010. Grameen Danone sources from 275 individual farmers and two large dairy farms.
c There may be some double counting of farmers by dairies as some farmers may sell to more than one processor.
Note: Only 10% of milk produced in Bangladesh was sold to formal sector milk processors.
233

234
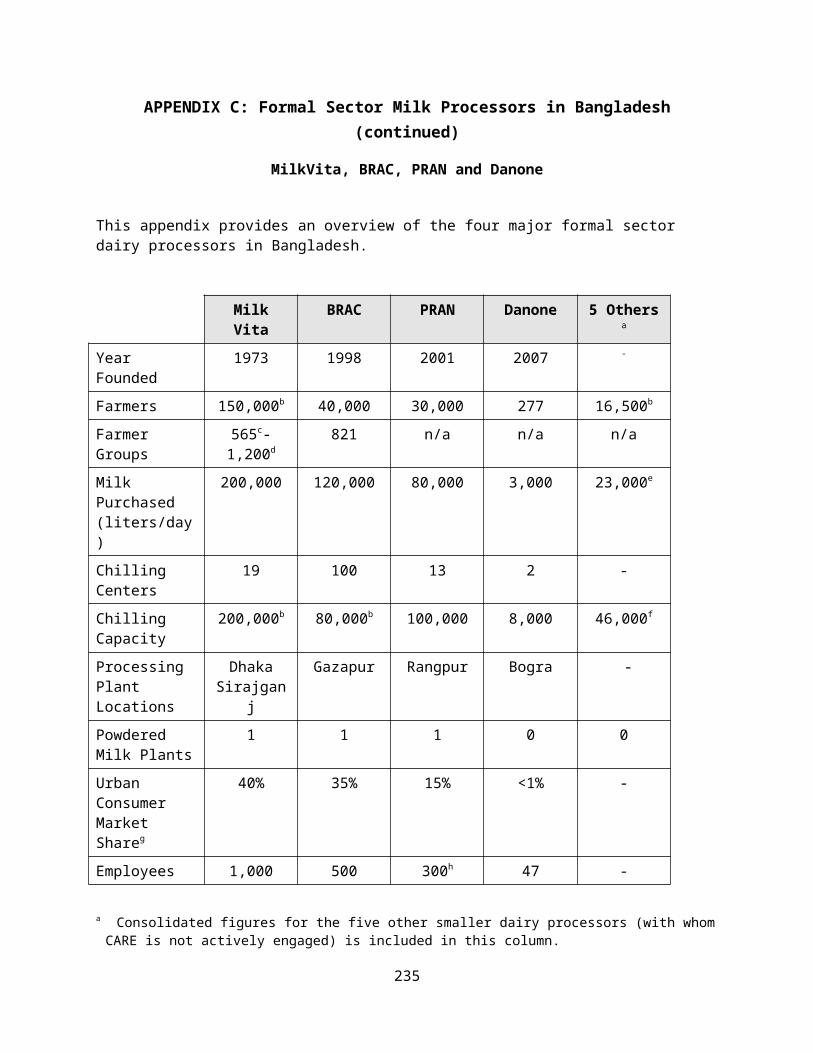
APPENDIX C: Formal Sector Milk Processors in Bangladesh(continued)
MilkVita, BRAC, PRAN and Danone
This appendix provides an overview of the four major formal sector dairy processors in Bangladesh.
MilkVita
BRAC PRAN Danone 5 Othersa
Year Founded
1973 1998 2001 2007 -
Farmers 150,000b 40,000 30,000 277 16,500b
Farmer Groups
565c-1,200d
821 n/a n/a n/a
Milk Purchased (liters/day)
200,000 120,000 80,000 3,000 23,000e
Chilling Centers
19 100 13 2 -
Chilling Capacity
200,000b 80,000b 100,000 8,000 46,000f
Processing Plant Locations
DhakaSirajgan
j
Gazapur Rangpur Bogra -
Powdered Milk Plants
1 1 1 0 0
Urban Consumer Market Shareg
40% 35% 15% <1% -
Employees 1,000 500 300h 47 -
a Consolidated figures for the five other smaller dairy processors (with whomCARE is not actively engaged) is included in this column.
235
b Jabbar, M. A. 2010. Policy Barriers for Dairy Value Chain Development in North West Bangladesh. Dhaka, Bangladesh: Unnayan Shamunnay, page 23.
c Halder, S. R. & Baruda, P. 2003. Dairy Production, Consumption and Marketing in Bangladesh. Dhaka, Bangladesh: BRAC Research and Evaluation Division, page 15.
d Ahmed, A.U., Minten, B., Quisumbing, A.R. & Roy, D. 2009. Evaluating the Dairy Value Chain Project in Bangladesh: Baseline Report. Washington, DC: International Food Policy Research Institute.
e Estimate assuming these dairies are buying milk at 50% of their chilling capacities.
f See previous page.g BRAC’s 35% market share in 2007 cited in Jonker, K. 2009. In the Black withBRAC. Stanford Social Innovation Review, 7(1): 74-79. Market share figures for MilkVita, PRAN and Danone are estimates based on personal interviews with various industry analysts.
h The number of PRAN employees dedicated to dairy was estimated at 10% of PRAN’s 3,000 full-time employees.
236
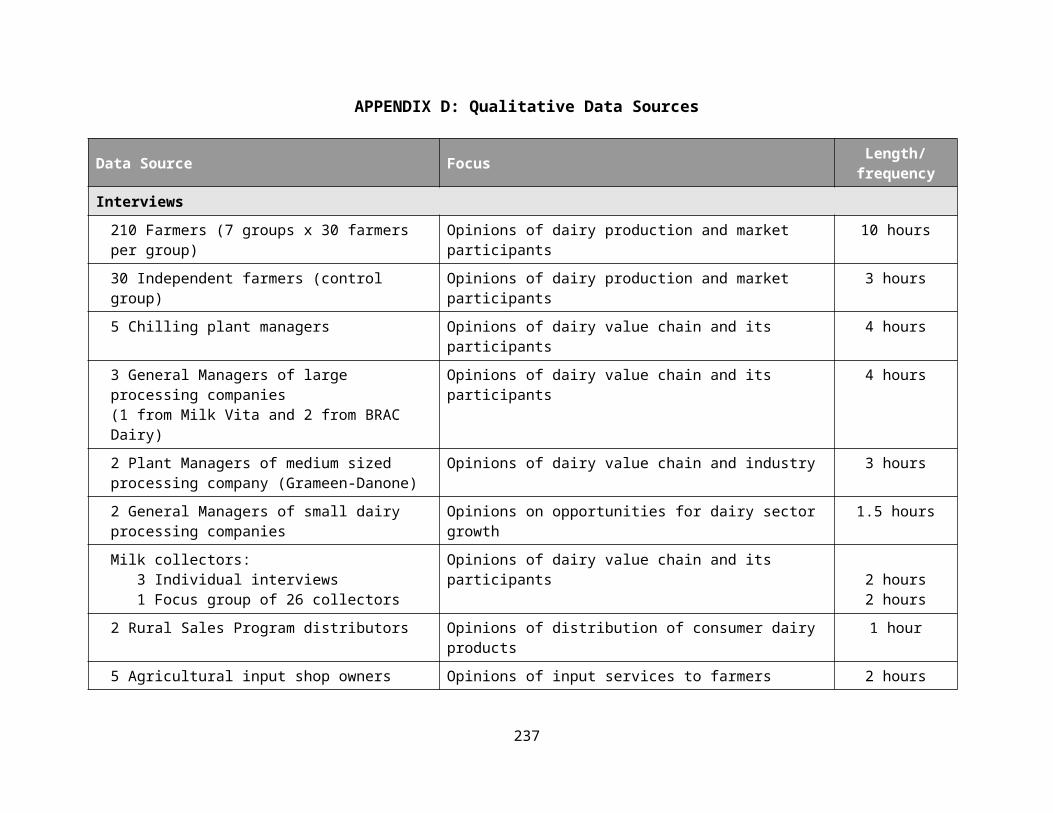
APPENDIX D: Qualitative Data Sources
Data Source Focus Length/frequency
Interviews210 Farmers (7 groups x 30 farmers per group)
Opinions of dairy production and market participants
10 hours
30 Independent farmers (control group)
Opinions of dairy production and market participants
3 hours
5 Chilling plant managers Opinions of dairy value chain and its participants
4 hours
3 General Managers of large processing companies (1 from Milk Vita and 2 from BRAC Dairy)
Opinions of dairy value chain and its participants
4 hours
2 Plant Managers of medium sized processing company (Grameen-Danone)
Opinions of dairy value chain and industry 3 hours
2 General Managers of small dairy processing companies
Opinions on opportunities for dairy sector growth
1.5 hours
Milk collectors: 3 Individual interviews 1 Focus group of 26 collectors
Opinions of dairy value chain and its participants 2 hours
2 hours2 Rural Sales Program distributors Opinions of distribution of consumer dairy
products1 hour
5 Agricultural input shop owners Opinions of input services to farmers 2 hours
237

Data Source Focus Length/frequency
1 Artificial insemination service provider
Opinions of input services to farmers 0.5 hours
2 Livestock health workers Opinions of animal health services to farmers
0.5 hours
1 Head of the Community Dairy Veterinary Foundation
Opinions of input services to farmers 1.5 hours
1 Senior Agriculture Economist, International Livestock Research Institute
Opinion on dairy industry and policy 0.5 hours
1 Dairy industry financial services expert
Opinion on current and potential financial services for smallholder dairy farmers
1 hour
3 Dairy packaging company executives Opinion of dairy industry growth potential 1 hour2 Senior executives of feed and medicine companies
Rural markets, distribution, products and business models
1.5 hours
1 CEO of a company partnering with CARE
Benefits and evolution of NGO partnership 3 hours
2 Company mangers partnering with CARE
Working with CARE and other NGOs 1 hour
3 Executives of non-governmental organizations working to support smallholder dairy farmers
Opinion of constraints and opportunities for farmer participation in dairy
1 hour
2 Milk bar owners Customer preferences and demand 0.5 hours3 Agriculture and dairy scientists Technical aspects of dairy production 1 hour
238
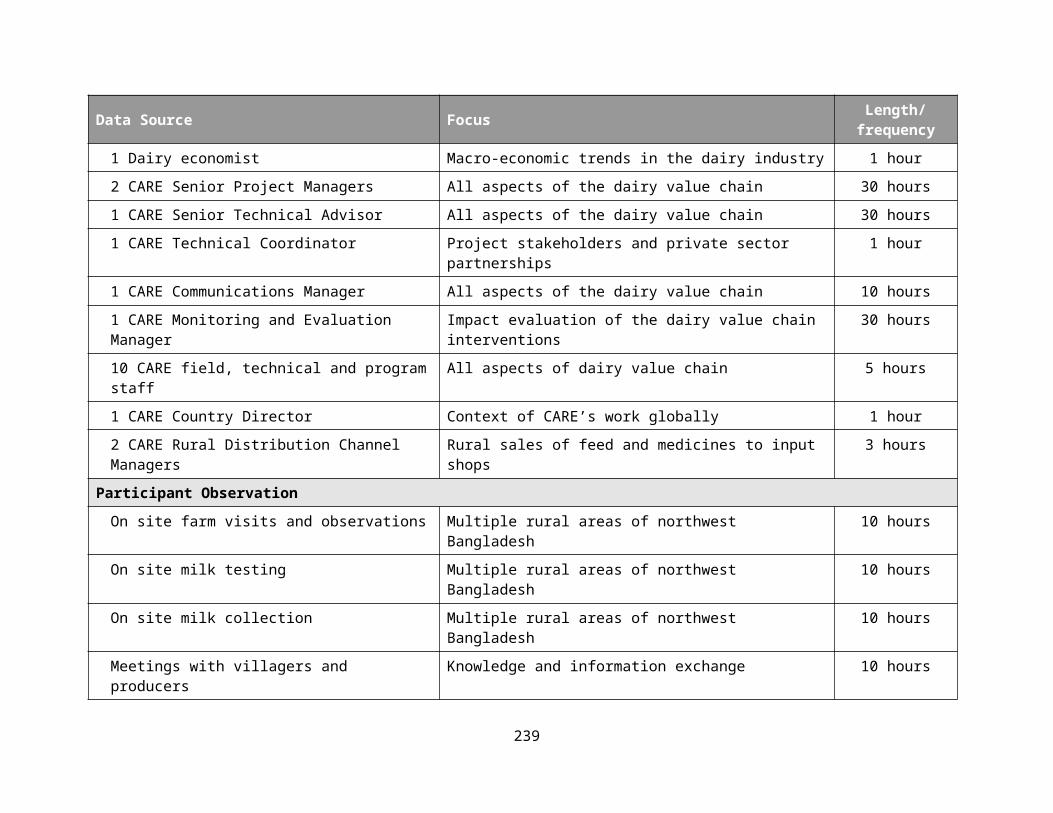
Data Source Focus Length/frequency
1 Dairy economist Macro-economic trends in the dairy industry 1 hour2 CARE Senior Project Managers All aspects of the dairy value chain 30 hours1 CARE Senior Technical Advisor All aspects of the dairy value chain 30 hours1 CARE Technical Coordinator Project stakeholders and private sector
partnerships1 hour
1 CARE Communications Manager All aspects of the dairy value chain 10 hours1 CARE Monitoring and Evaluation Manager
Impact evaluation of the dairy value chain interventions
30 hours
10 CARE field, technical and programstaff
All aspects of dairy value chain 5 hours
1 CARE Country Director Context of CARE’s work globally 1 hour2 CARE Rural Distribution Channel Managers
Rural sales of feed and medicines to input shops
3 hours
Participant ObservationOn site farm visits and observations Multiple rural areas of northwest
Bangladesh10 hours
On site milk testing Multiple rural areas of northwest Bangladesh
10 hours
On site milk collection Multiple rural areas of northwest Bangladesh
10 hours
Meetings with villagers and producers
Knowledge and information exchange 10 hours
239

Data Source Focus Length/frequency
Informal milk markets Milk handling, trading and prices 1 hourMeeting between senior CARE and IFC staff
Government policy and competitiveness in the dairy industry
2 hours
Meeting between senior CARE staff and 11 senior executives at BRAC dairy
Potential of dairy industry collaboration 2 hours
Meeting between senior CARE staff and three TetraPak (dairy packaging company) executives
Dairy industry collaboration 6 hours
Attendance at Major Dairy ConferenceAt Bangladesh Agricultural University (24 paper and plenary presentations)
Wide range of issues in dairy sector development and animal husbandry
16 hours
Archival DataMonitoring and evaluation reports Documentation of project impact evaluation
of: Farmer incomes, productivity improvements, animal health, animal health worker performance, market prices of milk and feed; collector performance
Monthly andbimonthlyreports
8 Progress reports (2008-2012) to donor
Progress toward project objectives Semi-annually (90pgs eachavg.)
240
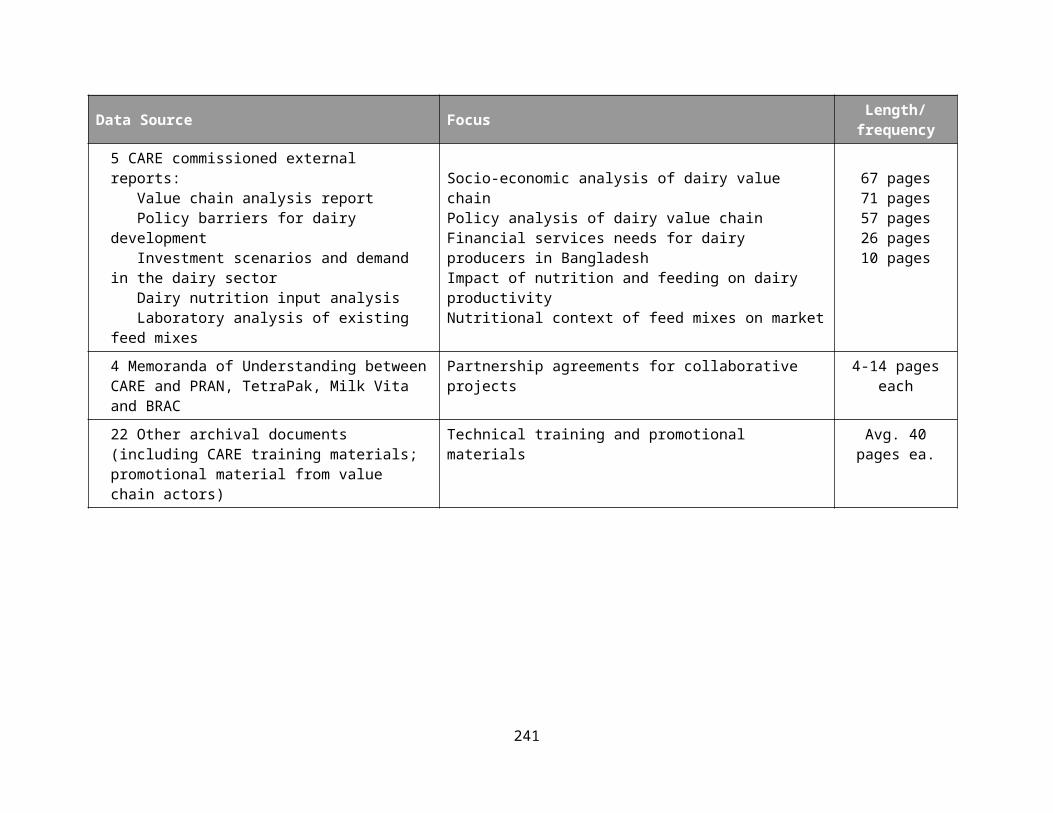
Data Source Focus Length/frequency
5 CARE commissioned external reports: Value chain analysis report Policy barriers for dairy development Investment scenarios and demand in the dairy sector Dairy nutrition input analysis Laboratory analysis of existing feed mixes
Socio-economic analysis of dairy value chainPolicy analysis of dairy value chain Financial services needs for dairy producers in BangladeshImpact of nutrition and feeding on dairy productivityNutritional context of feed mixes on market
67 pages71 pages57 pages26 pages10 pages
4 Memoranda of Understanding betweenCARE and PRAN, TetraPak, Milk Vita and BRAC
Partnership agreements for collaborative projects
4-14 pageseach
22 Other archival documents (including CARE training materials; promotional material from value chain actors)
Technical training and promotional materials
Avg. 40pages ea.
241

APPENDIX E: Quantitative Data Sources
Information on 350 variables related to animal husbandry, farmer productivity, group performance, milk collectors, animal health workers, milk buyers (formal sector processors and informal sector processors), milk and feed prices, and feed and medicine sellers were collected through regular surveys throughout the project. As my research progressed and my theoretical model began to take shape, I was able to add questions to some of the regular stakeholder surveys in order to gather additional targeted information on some of my constructs and relationships of interest. The data collection items for each target group or phenomena are summarized in the table below. In the pages following this table further detail is given on the information collected by each of the surveys.
Target Survey Name Date/Frequency
Conducted By Sample Size(most recent
sample)
DataGathered
(seeAppendices)
DairyProducers
andProducerGroups
Household Baseline Beginning(Sept 2008)
and end(Dec 2012)of project
InternationalFood PolicyResearchInstitute(IFPRI)
1,509 Households(658 CARE
Beneficiaries and851 ControlHouseholds)
Appendix F
Farmer Surveys /Group MemberProgress
Semi-annually
Surveyors hiredby CARE
848 Individualsin 271 Groups
Appendix E1
ParticipatoryPerformanceTracking
Semi-annually
Farmers withCARE FieldFacilitators
519 CARE Farmers Appendix E2
Milk Collector Progress Quarterly CARE 308 Milk Appendix E3
242

Target Survey Name Date/Frequency
Conducted By Sample Size(most recent
sample)
DataGathered
(seeAppendices)
Collectors CollectorsLivestock
HealthWorkers
Livestock HealthWorker Progress
Monthly CAREVeterinarian
201 LivestockHealth Workers
Appendix E4
DairyProcessors
FormalSectorProcessors
HeadOffice
Management
December2009
CARE SeniorManagers
5 Managers ofLarge Processors
Appendix E5
ChillingPlants
December2009
IFPRI 50 Plant Managers Appendix E6
Informal SectorProcessors
December2009
IFPRI 50 InformalProcessors
Appendix E7
Feed andMedicineSellers
Feed and MedicineSellers and
Agricultural InputShops
June 2009 CARE 178 Feed ShopOwners
Appendix E8
CattleBreed
Breed andArtificialInseminationAssessment
March 2010 MymensinghUniversity
15,148 Cattle Appendix E9
CARE Staff Team Progress Format
Monthly CARE Field Staff
55 CARE Field Staff
Appendix E10
Overall Gates Foundation Semi- Data drawn from 120 Indicators Appendix N
243

Target Survey Name Date/Frequency
Conducted By Sample Size(most recent
sample)
DataGathered
(seeAppendices)
Initiative Performance
Semi-Annual Reports Annually above surveys drawn from above surveys
244

APPENDIX E1: Quantitative Data Gathered - Farmer Surveys
Twice a year, CARE conducted quantitative surveys of the smallholder farmers they worked with. In 2012, 2,125 farmers were randomly sampledto complete the survey. These surveys measured milk production, consumption and sales, farmers’ knowledge of animal husbandry practices, farmers’ perceptions of women’s roles in the value chain and farmers’ perceptions of collectors, animal health workers and other service providers. The methodology for these surveys was co-developed and audited by the International Food Policy Research Institute and the Bill and Melinda Gates Foundation to ensure validityand reliability of the data. I had access to all of the raw data and used it to triangulate findings from qualitative data. I also used this data to understand the impact of CARE’s work in the dairy value chain, to test explicit and implicit assumptions that guided CARE’s activities, and to inform my theorizing about the mechanisms at work to reduce poverty for poor producers. Questions from the farmer surveys are reproduced below in an edited form to indicate the types of data gathered.
Farmer Survey Data Gathered
1. Respondent Identification 1.1. Name1.2. Sex 1.3. Position in group (Member, Leader) 1.4. Occupation 1.5. Age 1.6. Number of family members 1.7. Group code number 1.8. SDVC group name
2. Cattle Inventory and Milk Production (yesterday’s status)2.1. Cattle type (local breed /cross breed)2.2. Total milk production2.3. Total cow value (Tk)2.4. Cow identification numbers
245

3. Milk Consumption and Distribution (yesterday’s status)3.1. Total milk consumption (Liters)3.2. Total free distribution (Liters)3.3. Yesterday’s total milk sale (Liters)3.4. Yesterday’s total spoilage (Liters)3.5. Yesterday’s total receipts from milk sales (Tk) to:
- Neighbors- Group selling point- Gowala/Collector- Open market- Sweetmeat maker/ Tea stall- Direct to major private sector processor
3.6. Generally, who gets priority for milk consumption in your family? - Male child- Female child- Son- Daughter- Husband- Wife- Old man- Old woman- All members - Not applicable
3.7. Why?3.8. Who consumed milk yesterday?
- Male child- Female child- Son- Daughter- Husband- Wife- Old man- Old woman- All members - Not applicable
3.9. Do you know where the milk of your group is sold? 246

3.10. If known, where is it sold? - Milk Vita - Rangpur Dairy - PRAN - BRAC - Akij Dairy- Danone- Sweetmeat Shop - Other (Specify)
3.11. Do you know the price of milk? 3.12. If yes what is the price (Tk/Liter)
4. Knowledge and Practice Information about Cow Rearing (In the Last 3 Months)4.1. Are you cultivating fodder?
- Yes - No - Do not know how to cultivate - Have no land/scope to cultivate
4.2. If yes, how many decimals of land are you cultivating for fodder?
4.3. Which type of fodder are you cultivating?- Napier grass- Sorghum - Maize - Para - German - Jamboo - Kheshari/Mati Kalai - Triticale - Other
4.4. Do you feed green grass to your cow? 4.5. Source of green grass?
- Own production - Purchased - Collected from the road side
247
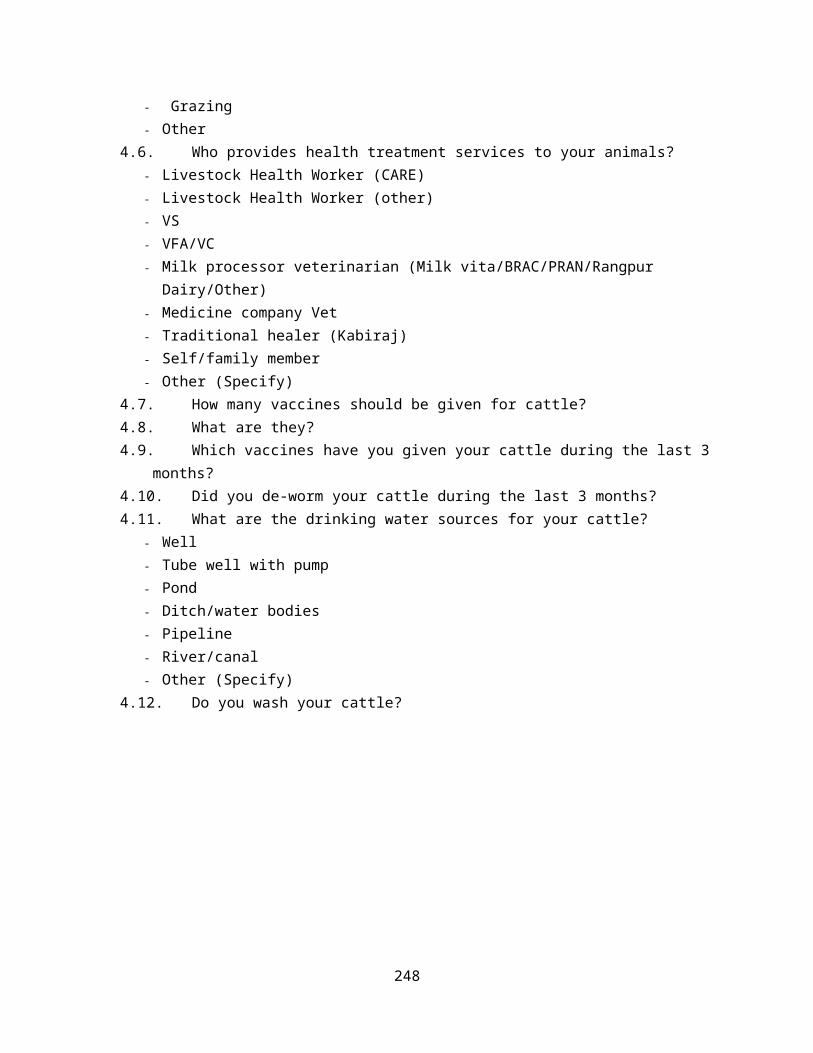
- Grazing - Other
4.6. Who provides health treatment services to your animals? - Livestock Health Worker (CARE)- Livestock Health Worker (other) - VS- VFA/VC - Milk processor veterinarian (Milk vita/BRAC/PRAN/Rangpur
Dairy/Other)- Medicine company Vet- Traditional healer (Kabiraj)- Self/family member - Other (Specify)
4.7. How many vaccines should be given for cattle? 4.8. What are they? 4.9. Which vaccines have you given your cattle during the last 3
months?4.10. Did you de-worm your cattle during the last 3 months?4.11. What are the drinking water sources for your cattle?
- Well- Tube well with pump- Pond- Ditch/water bodies- Pipeline- River/canal- Other (Specify)
4.12. Do you wash your cattle?
248

4.13. If yes, in which interval? - Daily- Each second day- Twice a week- Once a week- Once per two weeks- Other (Specify)
4.14. What measures have you taken against flying insects?- Mosquito net- Mosquito coil- Smoke- Nothing- Finish insect killer powder/liquid- Others
4.15. Who milks the cows? - Self- Husband/wife- Other family member- Gowala/Collector- Other (Specify)
4.16. If you don't milk the cows yourself, why not? 4.17. Sex of family member who milks? 4.18. Do you wash your hands before and after milking?4.19. If yes, how?
- Water- Warm water- Water and soap/detergent- Other (Specify)- Not applicable
4.20. Do you wash your milking pot? 4.21. If yes, how?
- Water- Warm water- Water and soap/detergent- Warm water and soap/detergent- Water and sand/ash- Other(Specify)
249

- Not applicable4.22. Do you wash the udder and teats before milking? 4.23. If yes, how?
- Water- Warm water- Water and disinfectant- Warm water and disinfectant - Other (Specify)
4.24. Do you use anything on the udder and teats during milking? 4.25. If yes, what?
- Oil- Ghee- Disinfectant- Milk- Other (Specify)
4.26. Where do you dispose of cow dung? - In open hole - In closed hole - Kept in specific place- Dump in open place- Sold as raw dung- Other (Specify)
4.27. What do you do with your cow dung? - Use as fertilizer- Use for yard cleaning- Use as fuel- Sold as fuel (Ghuta)- Uses in own bio-gas plant- Supply to other bio-gas plants- Other (Specify)
4.28. How do you sell your cow dung? - Raw dung- Sold as fuel (Ghuta)- Sold as fertilizer- Other (Specify)
4.29. Income from cow dung sold during last 3 months (Tk)
250

5. Farmer Knowledge (Questions to evaluate farmer knowledge. Correct answers in parentheses.) 5.1. What types of cattle feeds are there? (Two types. Roughage
and concentrate)5.2. What are some types of hybrid fodder? (Napier grass, Para,
German, Jamboo, Maize, Cowpea, Kheshari, Triticale, Sorghum)5.3. What are some types of concentrate feed? (Rice polish, Wheat
bran, Oil cake, Pulse husk, Broken maize) 5.4. What should be the condition of a cow shed? (Comparatively
high, well ventilated, floor should be mud free, proper drainagefacilities, adequate free space)
5.5. Which type of cattle should be vaccinated? (Healthy and disease free)
5.6. What are the symptoms of worm-affected cattle? (Cow becomes lean and thin, rough hair, decreased appetite, frequent dysentery, decreased milk production)
5.7. In which interval should de-worming be done? (Every 3-4 months)
5.8. After heat detection, what is the best time for artificial insemination? (12-18 hours)
5.9. In which interval does the cow come in heat? (21 day intervals)
5.10. What are the advantages of artificial insemination? (Breed development, possible to inseminate many cows with the semen of one bull, semen can be stored for a long time, possibility to evaluate the quality of semen)
6. Cow Shed6.1. Is proper ventilation available in the cow shed?6.2. Is the floor of the cow shed clean?6.3. Is there proper sloping of the floor to the drain?
6.4. Is there a disposal place for cow dung?6.5. Is the milking place clean?
7. Women’s Empowerment and Property Ownership Information (Questions for female group members)7.1. Do you own any cattle?
251

7.2. Did you inherit any cattle/cow (from father/husband/others)7.3. Did you get ownership of cattle after joining SDVC? 7.4. Have you had any income from those cattle during the last 3
months? 7.5. Did you have any other income during the last 3 months? 7.6. Who makes decisions for the use of your income?
- Self- Husband- Jointly- Other male member- Other female member- No income
7.7. Who makes decisions for the use of the milk sales income? - Self- Husband- Jointly- Other male member- Other female member- No income
7.8. Sex of the person who is engaged with cow rearing? (Women/Men/Both)
7.9. Sex of the person who is engaged with cattle feed purchase? (Women/Men/Both)
7.10. Sex of the person who is engaged with milk selling? (Women/Men/Both)
7.11. Who makes the cattle purchase decision? - Self- Husband- Jointly- Other male member- Other female member
7.12. Who makes the cattle sales decision?- Self- Husband- Jointly- Other male member- Other female member
7.13. Do you have to get permission to attend group meetings?252

7.14. If yes, from whom? - Husband- Father-in-law- Mother-in-law- Other family member
7.15. Do you have to get permission to attend meetings at distant places?
7.16. If yes, from whom? - Husband- Father-in-law- Mother-in-law- Other family member
7.17. Does your husband help you in your day-to-day household activities?
7.18. If yes, in which activities? - Cattle rearing- Child care- Other household activity- Cattle feeding- Cattle washing- Grass collection- Cooking- House cleaning
7.19. How happy are you with the service of women livestock healthworkers / collectors and feed sellers in comparison to men?
- Very good- Good- Moderate- Poor
7.20. Are you permitted to purchase cattle feed yourself? 7.21. Are you permitted to sell milk at a marketplace yourself? 7.22. Do you face any obstructions from your family to spend your
own money or make decisions affecting you?7.23. If yes, where do the obstacles come from?
- Husband- Father-in-law- Mother-in-law - Son
253

- Other male group member- Other female group member
8. Expenditure on Fodder and Concentrate Feed for Cattle (In the last 7Days) 8.1. Rice bran8.2. Wheat bran8.3. Pulse husk8.4. Brocken rice8.5. Molasses8.6. Brocken maize8.7. Oil cake8.8. Mustard oil cake8.9. Mineral mix8.10. DCP8.11. Straw8.12. Green grass8.13. Ready feed
9. Disease Instance and Treatments (In the last 3 Months) 9.1. Did your cows have disease or health issues? 9.2. If yes, what did you do?
- Provided Treatment- Did Nothing
10. Other Progress Information10.1. Did you purchase any cattle during the last 3 months? 10.2. If yes, how many? 10.3. What type of cattle did you purchase?
- In-milk cow- In-milk cow with calf- Heifer- Male calf- Bull/bullock
10.4. Breed type254

- Local breed- Cross breed
10.5. Did you sell any cattle during the last 3 months? 10.6. How many?10.7. What type of cattle?
- In-milk cow- In-milk cow with calf- Heifer- Male calf - Bull/bullock
10.8. If yes, why?- Improve breed - Need money - Less production- Disease instance- Other (Specify)
10.9. Did you sell any calves during last 3 months? 10.10. If yes, how many? 10.11. Did you have any cattle die during the last 3 months? 10.12. If yes, how many? 10.13. Type of dead cattle?
- In-milk cow- Heifer- Male calf- Bull/bullock
10.14. Reason for death?10.15. What did you do with the dead Cattle?
- Buried - Dumped in river/cannel- Dumped in open place- Gave to cobbler- Other (Specify)
10.16. Did you receive any loan during last 3 months for cow rearing?
10.17. If yes, how much (Tk)? 10.18. Loan Source?
- Friend/Relatives- NGO
255

- Commercial bank- Money lender/Dadan- Government Institution (Youth Development, DLS, Social Service,
Women’s Affairs)- Milk Processor (Milk Vita/BRAC/PRAN/Rangpur Dairy)- Milk Production and Marketing Society- Other society (Specify)
10.19. Explain the terms and conditions of the loan
11. Livestock Health Worker (LHW) Performance Evaluation11.1. What is the name of the LHW that serves your group? 11.2. How many times has the LHW visited your farm during the last
3 months? 11.3. What is the knowledge level of your LHW?
- Very good- Good- Moderate- Poor
11.4. What is the skill level of your LHW?- Very Good- Good- Moderate- Poor
11.5. How responsive is your LHW when you call?- Instant response- Response with occasional delay- Response required frequent follow up- Rarely responded- Never responded
11.6. What is your view of the fees charged?- Very high- High- Reasonable- Comparatively low- Very low
11.7. Does the LHW provide prescriptions?- Always
256
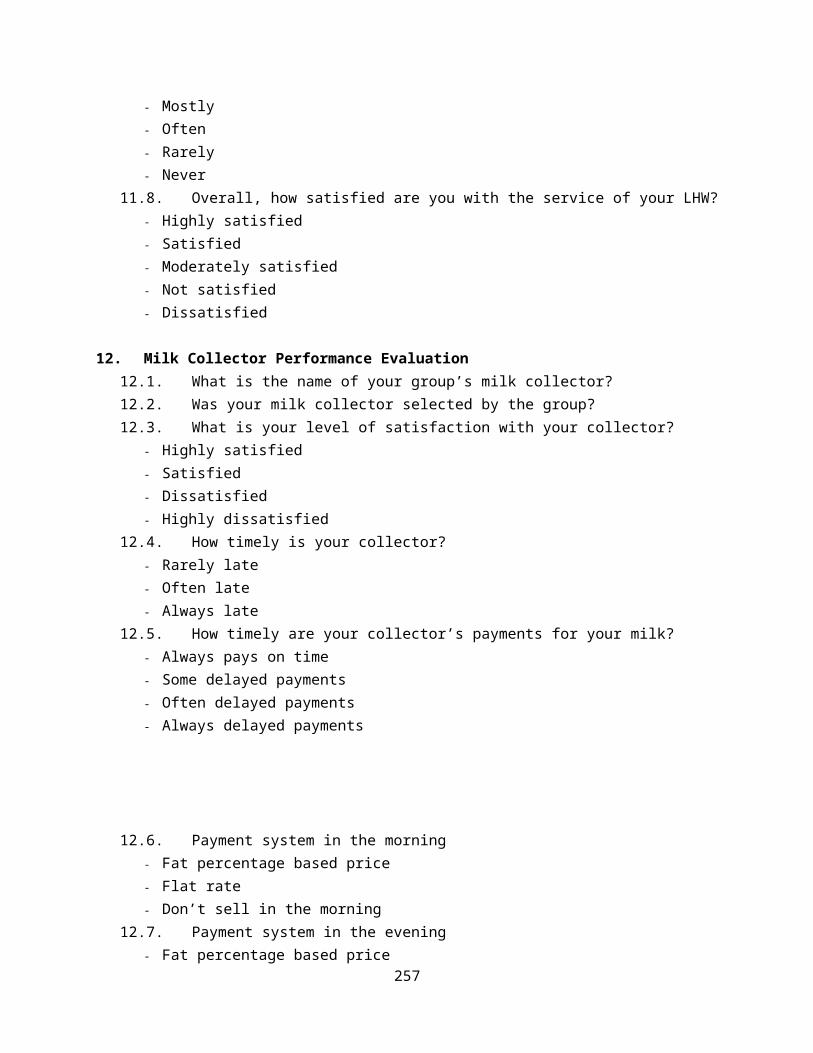
- Mostly- Often- Rarely- Never
11.8. Overall, how satisfied are you with the service of your LHW?- Highly satisfied- Satisfied- Moderately satisfied- Not satisfied- Dissatisfied
12. Milk Collector Performance Evaluation12.1. What is the name of your group’s milk collector?12.2. Was your milk collector selected by the group?12.3. What is your level of satisfaction with your collector?
- Highly satisfied- Satisfied- Dissatisfied- Highly dissatisfied
12.4. How timely is your collector?- Rarely late- Often late- Always late
12.5. How timely are your collector’s payments for your milk?- Always pays on time- Some delayed payments- Often delayed payments- Always delayed payments
12.6. Payment system in the morning- Fat percentage based price- Flat rate- Don’t sell in the morning
12.7. Payment system in the evening - Fat percentage based price
257
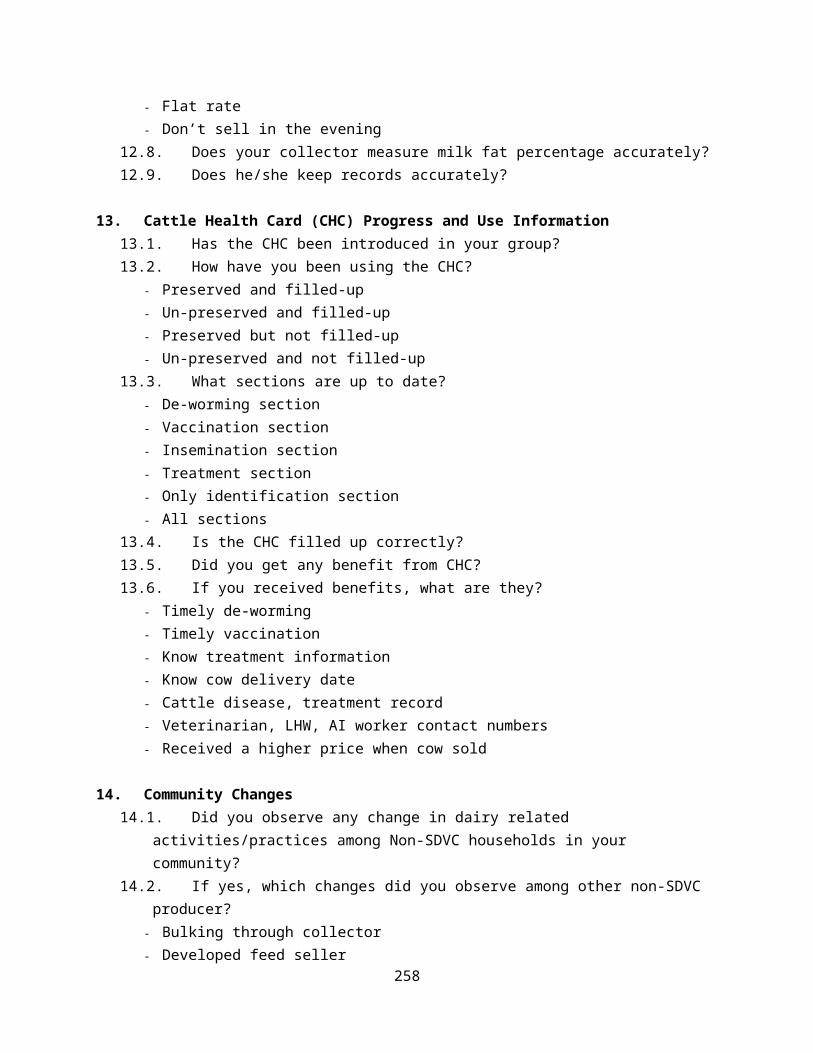
- Flat rate- Don’t sell in the evening
12.8. Does your collector measure milk fat percentage accurately? 12.9. Does he/she keep records accurately?
13. Cattle Health Card (CHC) Progress and Use Information13.1. Has the CHC been introduced in your group?13.2. How have you been using the CHC?
- Preserved and filled-up- Un-preserved and filled-up- Preserved but not filled-up- Un-preserved and not filled-up
13.3. What sections are up to date? - De-worming section- Vaccination section- Insemination section- Treatment section- Only identification section- All sections
13.4. Is the CHC filled up correctly? 13.5. Did you get any benefit from CHC? 13.6. If you received benefits, what are they?
- Timely de-worming- Timely vaccination- Know treatment information - Know cow delivery date- Cattle disease, treatment record- Veterinarian, LHW, AI worker contact numbers- Received a higher price when cow sold
14. Community Changes14.1. Did you observe any change in dairy related
activities/practices among Non-SDVC households in your community?
14.2. If yes, which changes did you observe among other non-SDVC producer?
- Bulking through collector - Developed feed seller
258
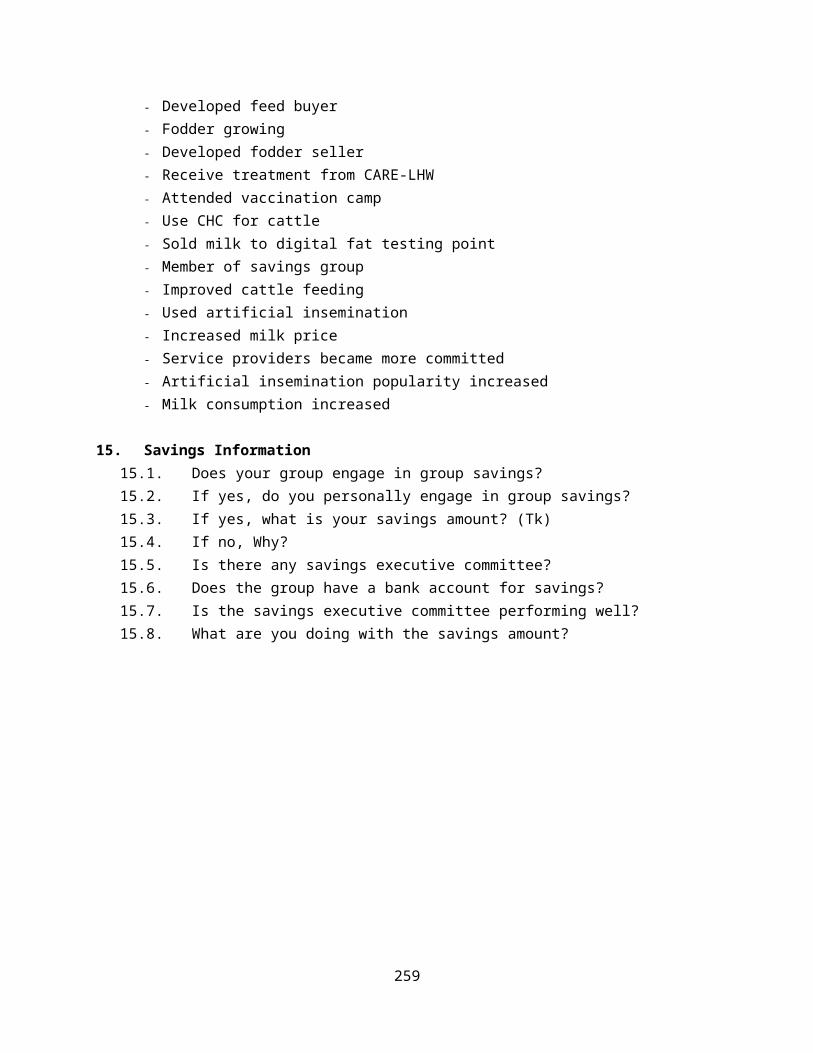
- Developed feed buyer - Fodder growing- Developed fodder seller - Receive treatment from CARE-LHW - Attended vaccination camp- Use CHC for cattle - Sold milk to digital fat testing point - Member of savings group- Improved cattle feeding- Used artificial insemination - Increased milk price- Service providers became more committed- Artificial insemination popularity increased- Milk consumption increased
15. Savings Information15.1. Does your group engage in group savings? 15.2. If yes, do you personally engage in group savings? 15.3. If yes, what is your savings amount? (Tk)15.4. If no, Why? 15.5. Is there any savings executive committee? 15.6. Does the group have a bank account for savings? 15.7. Is the savings executive committee performing well? 15.8. What are you doing with the savings amount?
259
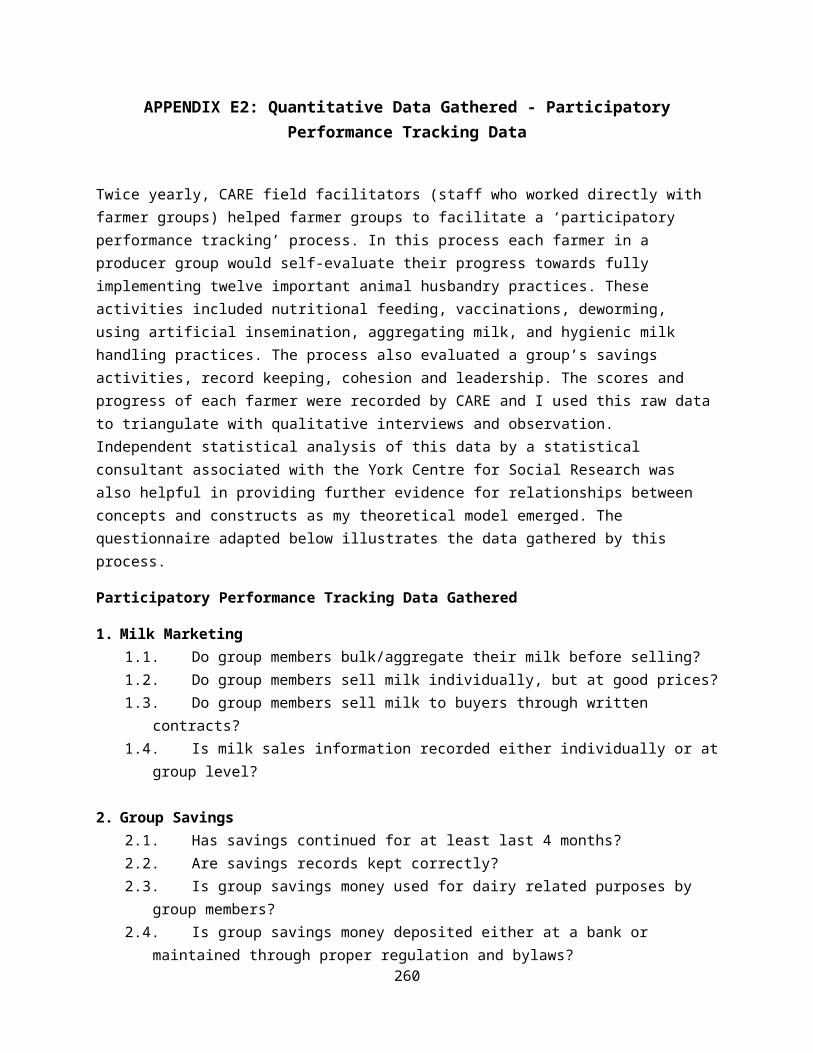
APPENDIX E2: Quantitative Data Gathered - ParticipatoryPerformance Tracking Data
Twice yearly, CARE field facilitators (staff who worked directly with farmer groups) helped farmer groups to facilitate a ‘participatory performance tracking’ process. In this process each farmer in a producer group would self-evaluate their progress towards fully implementing twelve important animal husbandry practices. These activities included nutritional feeding, vaccinations, deworming, using artificial insemination, aggregating milk, and hygienic milk handling practices. The process also evaluated a group’s savings activities, record keeping, cohesion and leadership. The scores and progress of each farmer were recorded by CARE and I used this raw datato triangulate with qualitative interviews and observation. Independent statistical analysis of this data by a statistical consultant associated with the York Centre for Social Research was also helpful in providing further evidence for relationships between concepts and constructs as my theoretical model emerged. The questionnaire adapted below illustrates the data gathered by this process.
Participatory Performance Tracking Data Gathered
1. Milk Marketing1.1. Do group members bulk/aggregate their milk before selling?1.2. Do group members sell milk individually, but at good prices?1.3. Do group members sell milk to buyers through written
contracts?1.4. Is milk sales information recorded either individually or at
group level?
2. Group Savings2.1. Has savings continued for at least last 4 months?2.2. Are savings records kept correctly?2.3. Is group savings money used for dairy related purposes by
group members?2.4. Is group savings money deposited either at a bank or
maintained through proper regulation and bylaws?260

3. Feed Access and Adoption Status3.1. Has a feed seller been developed at the group level?3.2. Do at least 30 percent of members have access to feed? 3.3. Do at least 50 percent of members have access to feed?
4. Artificial Insemination Access and Adoption
4.1. Have at least 30 percent of members’ cows received artificial insemination service?
4.2. Do at least 10 percent of members have crossbred calves (so far)?
4.3. Do at least 20 percent of members have crossbred calves (so far)?
4.4. Is artificial insemination related information recorded in the CHC by at least 50% of producers?
5. Group Fodder Cultivation & Adoption5.1. Is grass feeding being done by at least 50 percent of group
members?5.2. Do group members have access to fodder cutting or seeds?5.3. Has a fodder selling/fodder cutting/fodder seed selling
entrepreneur been developed?
6. Vaccination Status & Record Deeping6.1. Have at least 1 dose of 2 types of vaccines been given by
group members so far? 6.2. Have at least 2 doses of 2 types of vaccines been given by
group members so far? 6.3. Are vaccination records kept in the member’s cattle health
card?
7. Deworming status & record keeping7.1. Have at least 50 percent of members’ cows been dewormed so
far?7.2. Have at least 70 percent of members’ cows been dewormed so
far?
261

7.3. De-worming camp was arranged at least 2 times or 70% of members’ cows came under de-worming (as per schedule so far)
7.4. Are deworming records kept in the members’ cattle health card?
8. Cattle Treatment Service Access & Record Keeping8.1. Do group members take regular services from CARE trained
LHWs?8.2. Are treatment services given to members properly ? (fee,
service quality etc.)8.3. Are LHWs engaged in conducting learning sessions with
groups?8.4. Is treatment information recorded in the CHCs?
9. Group Cohesion and Leadership9.1. Are group records maintained properly, transparently and
systematically?9.2. Does the group have evidence of benefits or competitive
services by negotiating with other value chain actors?9.3. Does the group leader have organizing capacities that
members have confidence in?
262
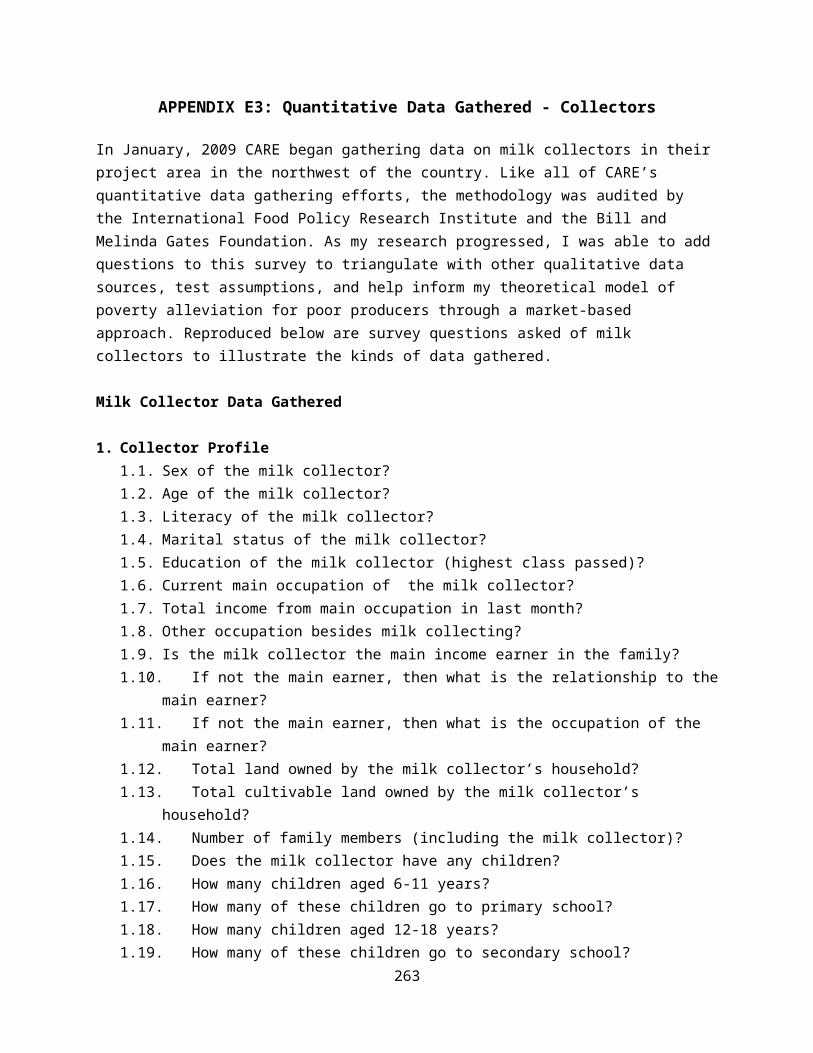
APPENDIX E3: Quantitative Data Gathered - Collectors
In January, 2009 CARE began gathering data on milk collectors in theirproject area in the northwest of the country. Like all of CARE’s quantitative data gathering efforts, the methodology was audited by the International Food Policy Research Institute and the Bill and Melinda Gates Foundation. As my research progressed, I was able to addquestions to this survey to triangulate with other qualitative data sources, test assumptions, and help inform my theoretical model of poverty alleviation for poor producers through a market-based approach. Reproduced below are survey questions asked of milk collectors to illustrate the kinds of data gathered.
Milk Collector Data Gathered
1. Collector Profile1.1. Sex of the milk collector?1.2. Age of the milk collector? 1.3. Literacy of the milk collector?1.4. Marital status of the milk collector?1.5. Education of the milk collector (highest class passed)? 1.6. Current main occupation of the milk collector? 1.7. Total income from main occupation in last month?1.8. Other occupation besides milk collecting?1.9. Is the milk collector the main income earner in the family?1.10. If not the main earner, then what is the relationship to the
main earner?1.11. If not the main earner, then what is the occupation of the
main earner?1.12. Total land owned by the milk collector’s household? 1.13. Total cultivable land owned by the milk collector’s
household?1.14. Number of family members (including the milk collector)?1.15. Does the milk collector have any children?1.16. How many children aged 6-11 years?1.17. How many of these children go to primary school?1.18. How many children aged 12-18 years?1.19. How many of these children go to secondary school?
263

2. Milk Collection Business and Assets 2.1. How was the milk collection business started/acquired?2.2. What was the source of any initial financing?2.3. Amount of initial capital to set up the business/activity? 2.4. Did you take a loan to enhance your collector business?2.5. If yes, what was the loan amount?2.6. What was the source of the loan?2.7. What was the interest rate?2.8. Number of family members involved full-time in this business
excluding yourself?2.9. Number of family members involved part-time in this business
excluding yourself?2.10. Number of hired laborers involved in this business?2.11. Did you receive any training in milk handling and marketing?2.12. If training received, who provided it?2.13. Do you have a lactometer?2.14. Do you have a vehicle for transporting milk?2.15. Do you have milk handling cans?
3. Information on Milk Collection3.1. How many producers sell milk to you? (currently)3.2. How many producers sell milk to you? (Before CARE)3.3. How large is your milk collecting area? 3.4. How many groups do you collect from?3.5. Do you have any formal/written agreement with the groups? 3.6. If yes, how many groups do you have agreements with?3.7. Do you collect milk in the morning?3.8. Total quantity of morning milk collection?3.9. Average fat percentage in the morning?3.10. Price paid per liter (Tk)?3.11. Total price paid by buyer (Tk)?3.12. Do you collect milk in the afternoon?3.13. Total quantity of afternoon collection?3.14. Average fat percentage in the afternoon?3.15. Price paid per liter (Tk)?3.16. How are milk prices established? 3.17. What is your mode of usual payment to farmers?
264

3.18. What hygenic milk handling measures do you practice?3.19. What type of milk handling pots do you use? 3.20. How many pots do you have?3.21. Distance traveled daily?3.22. What is your mode of transport?3.23. What is your daily cost of transport (self + milk)?3.24. Type of road ? 3.25. Do you also provide input supplies to farmers at least once
a month?3.26. How do you guarantee that farmers will not shift to other
collectors to buy their milk? 3.27. Do you give cash advances (deposit/security) to farmers? 3.28. How many producers have received cash advances from you?3.29. What characteristics do you look for in good quality milk?3.30. Have you had any spoilage of milk in the past 3 months?3.31. If yes, how many times?3.32. What was the total quantity of milk spoiled? 3.33. Did any of the milk collected from CARE groups spoil? 3.34. What did you do with the spoiled milk?3.35. If sold, then to whom?3.36. If sold, then at what price on average?3.37. What measures have you taken to prevent spoilage?
4. Milk Handling4.1. How do you bulk milk after purchase? 4.2. What is your method of transferring milk from supplier
containers to bulking containers? 4.3. What type of containers and utensils do you use for bulking
purchased milk? 4.4. When did you wash the containers before receiving milk?4.5. What is your water source for washing containers and utensils? 4.6. What is your mode of cleaning milk containers and utensils?
5. Information on Milk Sales5.1. Type of milk test performed by the buyer ? (At chilling
plant there are numerous tests done simultaneously: Alcohol
265

test, Lactometer test, Fat test, Adulteration test, Formalin test)
5.2. Price paid by the buyer for the milk sold?5.3. Commission paid by the buyer for the milk sold?5.4. Transport allowance paid by the buyer for the milk sold?5.5. When did you receive the payment for the milk sold?5.6. How was milk price determined?5.7. If pricing was based on fat percentage, then average fat
percentage of the milk sold?5.8. Equipment used by the buyer for measuring fat percentage?5.9. Did you observe the process of measuring fat percentage?5.10. If you did not observe the process, why not?5.11. Type of container used to transport milk to selling point?5.12. Did the buyer provide the container to you?5.13. Distance traveled from the first collection point to selling
point (km)?5.14. Travel time from the first collection point to the selling
point (minutes)?5.15. Cost of transport to the selling point (self + milk)? 5.16. Type of road?5.17. Do you have a contract with any buyer?5.18. If you have a contract, then with which buyer? 5.19. Is the contract written?5.20. How long is the contract period ?5.21. In the past 3 months, did any buyer refuse to buy milk (part
or full quantity) from you after you brought the milk to the buyer?
5.22. If refused to buy, then how many times has it happened in the past 3 months?
5.23. Which buyer refused to buy? 5.24. Why did the buyer(s) refuse to buy milk from you?
6. Female Milk Collectors6.1. Did you receive any loan as a female milk collector? 6.2. If yes, from which organization or individual? 6.3. Did you get training as a woman collector?6.4. If yes, from which organization?
266

6.5. As a woman, did you get any assistance for transporting milk?
6.6. If yes, describe.6.7. What is your expereance as a awomen seller to get a good
price for your milk?6.8. Do they insult you as a awomen when you are selling milk?6.9. As a woman did you receive any advice to develop your
business?6.10. As a women when you collect milk do you face any obstacles?6.11. If yes, what are they?6.12. Do you get adequate support from your family?
7. Income from Milk Sales in the Past Month7.1. Total quantity of milk purchased?7.2. Total amount paid to farmers for the quantity purchased?7.3. Total transport cost incurred to procure milk?7.4. Total hired labor cost incurred to procure milk?7.5. Any other cost to procure milk (specify)?7.6. Loss due to milk spoilage (if any)?7.7. Any other cost to sell milk (bribe, tips, etc)?7.8. Total cost?7.9. Cost per liter?7.10. Total quantity of milk sold?7.11. Total amount received from buyers for the milk sold?7.12. Total amount received from buyers as commission?7.13. Total amount received from buyers as transport allowance?7.14. Total amount received from selling spoiled milk?7.15. Total revenue?7.16. Revenue per liter ?7.17. Total profit (loss) per liter?
8. Perceptions8.1. Do you think that the price you are paid for collecting milk
is fair?8.2. Do you think that the processes used to determine the price
you are paid for collecting milk are fair?8.3. On a daily basis, do you know whether what you are paid for
collecting milk differs from what you could get from another 267

buyer (for instance selling to the local sweet maker or tea shopor to another large milk company)?
8.4. What type of behavior/ practices do you expect from farmers?8.5. How important are the following farmer behaviors to you:
- Selling/supplying to you predictably and reliably?- Selling at a price that allows you to make a profit? - Selling/supplying greater volumes of milk?- Selling/supplying milk with high fat content?- Selling/supplying milk without any added water or chemicals?- Other
8.6. Do you think the farmers are fair and honest when it comes to selling/supplying milk to you?
8.7. Do you think the farmers care about your welfare and livelihood?
8.8. Do you trust the farmers?8.9. What are your expectations from farmers?8.10. From your perspective, how important do you think the
following are to farmers:- Timely payment?- Timely collection?- Transaction transparency?- Other
8.11. Do you think the local milk buyers (sweet makers, tea shops,etc.) are fair and honest when it comes to buying milk from collectors?
8.12. Do you think the local milk buyers (sweet makers, tea shops,etc.) care about the welfare and livelihood of milk collectors?
8.13. Do you trust the local milk buyers (sweet makers, tea shops,etc.)?
8.14. What type of behavior/practices do you expect from chilling plant operators?
8.15. How important are the following chilling plant operator behaviors to you:
- Transparency of milk testing?- Offering a good price?- Prompt payment?- Other
268
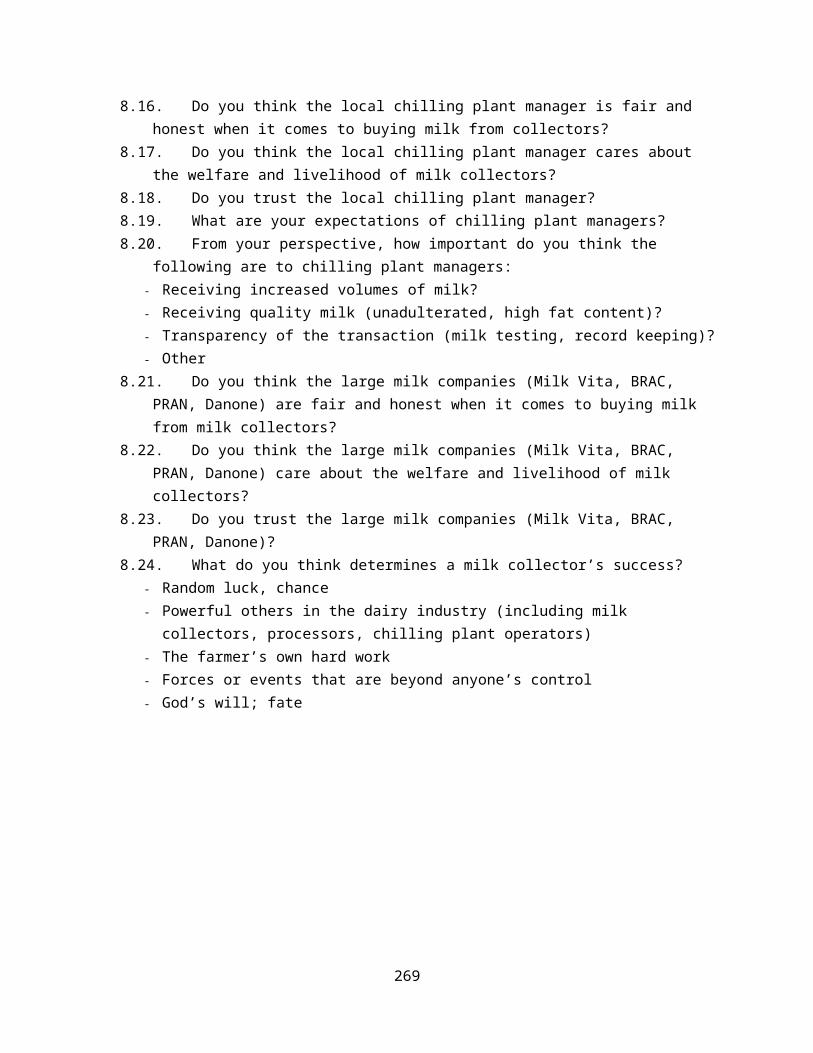
8.16. Do you think the local chilling plant manager is fair and honest when it comes to buying milk from collectors?
8.17. Do you think the local chilling plant manager cares about the welfare and livelihood of milk collectors?
8.18. Do you trust the local chilling plant manager?8.19. What are your expectations of chilling plant managers?8.20. From your perspective, how important do you think the
following are to chilling plant managers:- Receiving increased volumes of milk?- Receiving quality milk (unadulterated, high fat content)?- Transparency of the transaction (milk testing, record keeping)?- Other
8.21. Do you think the large milk companies (Milk Vita, BRAC, PRAN, Danone) are fair and honest when it comes to buying milk from milk collectors?
8.22. Do you think the large milk companies (Milk Vita, BRAC, PRAN, Danone) care about the welfare and livelihood of milk collectors?
8.23. Do you trust the large milk companies (Milk Vita, BRAC, PRAN, Danone)?
8.24. What do you think determines a milk collector’s success? - Random luck, chance - Powerful others in the dairy industry (including milk
collectors, processors, chilling plant operators) - The farmer’s own hard work - Forces or events that are beyond anyone’s control - God’s will; fate
269

APPENDIX E4: Quantitative Data Gathered - Livestock HealthWorkers
CARE regularly surveyed all of the livestock health workers (also known as paravets) that it had trained. By 2012, CARE had trained 201 livestock health workers. These individuals provided basic animal health care services such as immunization, deworming, basic disease diagnosis, artificial insemination advice and other animal health careadvice to farmers with limited access to a veterinarian. Data gatheredon livestock health workers included their training, business capital and equipment, services, knowledge, costs, revenues and profit, and their perceptions of other actors in the dairy value chain. My access to all of the raw data collected by these surveys was helpful in triangulating with qualitative data and in helping inform my theoretical model. As my research progressed, I was able to add questions to the questionnaire to gather additional focused data. An edited version of the survey administered to livestock health workers is given below to illustrate the kinds of data gathered.
Livestock Health Worker Data Gathered
1. Profile Information1.1. Age 1.2. Sex 1.3. Literacy level 1.4. Marital status 1.5. Education (highest class passed)1.6. Current main occupation1.7. Other occupation besides livestock health work?1.8. Are you the main earner in the household?1.9. If not the main earner, then what is the occupation of the
main earner?1.10. Total land owned by your household?1.11. Total cultivable land owned by your household?1.12. Number of family members?1.13. Do have any children?1.14. How many children aged 6-11 years old?1.15. How many of these children go to primary school?
270
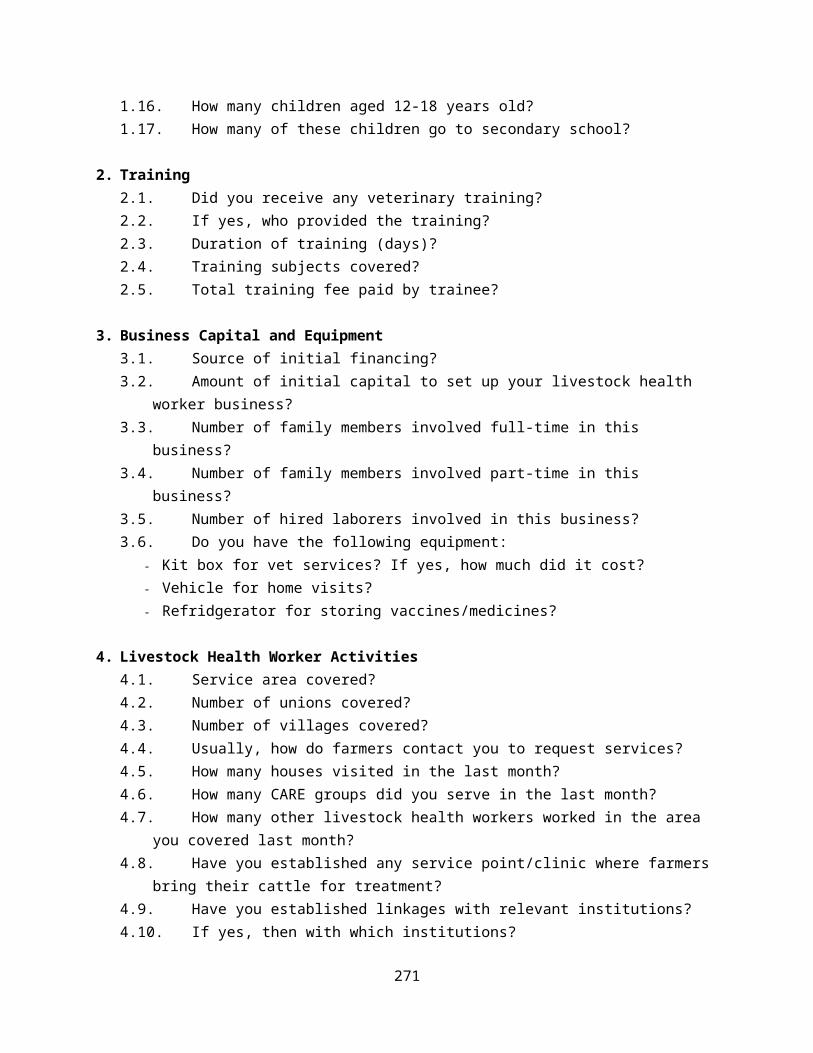
1.16. How many children aged 12-18 years old?1.17. How many of these children go to secondary school?
2. Training2.1. Did you receive any veterinary training?2.2. If yes, who provided the training?2.3. Duration of training (days)? 2.4. Training subjects covered?2.5. Total training fee paid by trainee?
3. Business Capital and Equipment3.1. Source of initial financing?3.2. Amount of initial capital to set up your livestock health
worker business?3.3. Number of family members involved full-time in this
business?3.4. Number of family members involved part-time in this
business?3.5. Number of hired laborers involved in this business?3.6. Do you have the following equipment:
- Kit box for vet services? If yes, how much did it cost? - Vehicle for home visits?- Refridgerator for storing vaccines/medicines?
4. Livestock Health Worker Activities4.1. Service area covered? 4.2. Number of unions covered?4.3. Number of villages covered? 4.4. Usually, how do farmers contact you to request services?4.5. How many houses visited in the last month?4.6. How many CARE groups did you serve in the last month?4.7. How many other livestock health workers worked in the area
you covered last month?4.8. Have you established any service point/clinic where farmers
bring their cattle for treatment?4.9. Have you established linkages with relevant institutions? 4.10. If yes, then with which institutions?
271
4.11. Did you maintain a cold chain for vaccines and/or semen straws?
5. Livestock Health Worker Knowledge and Practices5.1. Do you how to prepare a cow shed?5.2. Do you know which diseases need vaccines?
- Foot and Mouth Disease- Hemorrhagic Septicemia - Anthrax- Black Quarters
5.3. How do you identify those cattle attacked by worms?5.4. Do you differentiate between tumor and pustules?5.5. Do you know what is the primary treatment of FMD?5.6. How do you control cattle lice, mite and attali?5.7. What type of precautions should be taken before cattle
vaccinations?5.8. What is the reason for belly distended diseases?5.9. What is the medication for belly distended diseases?5.10. How many households of SDVC farmers obtain treatment/service
from you?5.11. Do you refer someone else when you face complex diseases?5.12. Where do you refer?5.13. What type of training would you like in the future? 5.14. At present do you face any barriers? 5.15. If so, what are they?
6. Costs6.1. Total cost of medicines used to treat dairy cows?6.2. Total cost of vaccines used for dairy cows?6.3. Total cost of Anthelmentics (Deworming tab/Injections) for
dairy cows?6.4. Total cost of semen used for AI?6.5. Total cost of medicines used to treat other animals?6.6. Total cost of vaccines used for other animals?6.7. Total cost of Anthelmentics (Deworming tab/Injections) for
other cattle?6.8. Total transport cost incurred for farmers’ home visits?
272
6.9. Cost of running the clinic, if any (rent, electricity & water bill, etc.)?
6.10. Any other costs incurred for providing livestock health worker services?
6.11. Total costs
7. Revenues 7.1. Total payments received for treating dairy cows (including
medicines)?7.2. Total payments received for vaccinating dairy cows
(including vaccine)?7.3. Total payments received for providing AI services (including
semen)?7.4. Total payments received for treating other animals
(including medicines)?7.5. Total payments received for vaccinating other animals
(including vaccine)?7.6. This business related any other income? 7.7. Total revenue
8. Total profit
9. Networks9.1. Do you have any connection with any organizations?
- Government- NGO - Private sector- Others
9.2. What type of /communication or linkage do you have?
10. Perceptions10.1. Do you think your remuneration for your services is correct?10.2. What is most important to you when you provide services to
farmers?10.3. How friendly are farmers when you provide services for their
animals? 10.4. Has the government’s livestock division provided any
assistance to you? 273

APPENDIX E5: Quantitative Data Gathered - Formal SectorProcessors
A survey of formal sector dairy processors, which gathered both quantitative and qualitative data, was undertaken by CARE in December,2009. I worked with CARE to add questions to the survey relevant to myresearch. With access to the raw data gathered and with analysis provided by a professional statistician associated with the York Centre for Social Research, I was able to use this information to triangulate with other data points and inform my theorizing efforts about the process by which CARE enhanced market practices for the benefit of poor producers. The edited questionnaire reproduced below illustrates the data gathered by this survey.
Formal Sector Dairy Processor Data Gathered
1. Dairy Processor Profile1.1. Year firm established? 1.2. Type of ownership of business? 1.3. Source of initial financing?1.4. Amount of initial capital to set up the business? 1.5. Number of milk processing plants?1.6. Total daily milk processing capacity? 1.7. Total milk chilling capacity in the processing plants? 1.8. How many chilling plants outside the main processing plants?1.9. What is the total milk chilling capacity of the chilling
plants? 1.10. How many milk tankers are owned for transporting milk? 1.11. Total carrying capacity of the tankers?1.12. What dairy-related products do you make?1.13. Number of total employees in the firm (including management-
level staff)?1.14. Number of female employees in the firm? 1.15. What percentage of your milk supply is sourced from
collectors? 1.16. What price do you pay for milk?1.17. What services do you offer farmers?
274

2. Firm Employees (numbers)2.1. Management level staff?2.2. Graduate engineers?2.3. Other technical staff?2.4. Administrative staff?2.5. Milk packaging/sorting staff?2.6. Other staff (cleaners, guards, etc.)?
3. Firm Practices3.1. What kind of behaviors, practices or actions do you expect
from chilling plant operators?3.2. How important are the following chilling plant operator
behaviors to you?:- Meeting volume targets?- Treating collectors and farmers fairly?- Supplying unadulterated milk?- Others?
3.3. Do you think the chilling plant operator cares about your business?
3.4. From your perspective, how important do you think the following are to chilling plant operators?
- Maximizing their incomes?- Treating collectors and farmers fairly?- Meeting their targets?- Transaction transparency (milk testing, record keeping)?
3.5. Do you think the chilling plant managers perform their jobs in a fair and honest manner?
3.6. Do you think the chilling plant managers care about the welfare of your company?
3.7. Do you trust the chilling plant managers?3.8. What kind of behaviors, practices or actions do you expect
from small-scale farmers that supply your organization with milk?
3.9. How important are the following small-scale farmer behaviorsto you?
- Supplying unadulterated milk?- Supplying increased volumes of milk?- Supplying milk with high fat content?
275

- Other?3.10. If the behavior of the small-scale farmers doesn’t meet your
expectations, how likely is it that you can address and resolve the issues?
3.11. What do you feel are your obligations to the small-scale farmers that supply your organization with milk?
3.12. From your perspective, how important do you think the following are to small-scale farmers?:
- Improved productivity of their cows?- Price for their milk?- Maximizing their incomes?- Being treated fairly by collectors and chilling plant
operators?- Transparency of transactions (milk testing, record keeping)?- Animal health related services?- Other
3.13. Do you think the farmers are fair and honest when it comes to selling/supplying milk to you?
3.14. Do you think the farmers care about your welfare and livelihood?
3.15. Do you trust the farmers?3.16. Do you think the milk collectors are fair and honest when it
comes to selling milk to you?3.17. Do you think the milk collectors care about the welfare of
your company?3.18. Do you trust the milk collectors?
4. Plant Capacity4.1. Pasteurized, UHT milk in packets (liters)?4.2. Pasteurized, non-UHT milk in packets (liters)?4.3. Non pasteurized, UHT milk in packets (liters)?4.4. Powdered milk (kg)?4.5. Butter (kg)?4.6. Ghee (kg)?4.7. Yogurt (kg)?4.8. Sweet (kg)?4.9. Candy (kg)?
276
5. Market Information
6. Sales Promotion Activites
7. Expansion Plans
8. Business Challenges
9. Stakeholder Relationships
277
APPENDIX E6: Quantitative Data Gathered - Chilling Plant Managers
A survey of fifty chilling plant managers was undertaken by CARE in December, 2009. Chilling plants are small collection centers with refrigerated milk storage capacity owned by the large dairy processors. Chilling plant managers are responsible for buying milk from collectors and farmers which is then transported by tanker truck to urban centers for pasteurization and processing. With access to theraw data gathered and with analysis provided by a professional statistician associated with the York Centre for Social Research, I was able to use this information to triangulate with other data pointsand inform my theorizing efforts about the process by which CARE enhanced market practices for the benefit of poor producers. The edited questionnaire reproduced below illustrates the data gathered by this survey.
Chilling Plant Manager Data Gathered
1. Profile Information on Chilling Plant Manager1.1. Sex?1.2. Age?1.3. Education?1.4. Monthly salary?1.5. Other monetary benefits received (specify the benefits)?1.6. Date of joining the chilling plant as manager?1.7. Did you receive any training in milk handling?
2. Profile of Chilling Plant2.1. Year chilling plant was established?2.2. Is the plant building owned by the processing company or
rented?2.3. Number of employees in the plant (including the manager)?2.4. Total milk chilling capacity (liters)?2.5. Type of fat testing equipment used? 2.6. Does the chilling plant have any cream separators?2.7. If yes, how many cream separators?2.8. Does the chilling plant provide milk collection containers
to milk suppliers?278

2.9. If yes, how many milk collection containers does the plant have?
2.10. How many times has the price chart been changed in the last 6 months?
2.11. How and when do you notify collectors and farmers of price changes?
3. Chilling Plant Employees (numbers)3.1. Managers3.2. Plant operators3.3. Mechanics3.4. Accountants3.5. Other administrative staff3.6. Cleaner/janitor3.7. Guard 3.8. Veterinary Doctor3.9. Artificial insemination provider
4. Milk Collection Information4.1. Does the chilling plant work with organized producer groups?4.2. If yes, how many?4.3. Does the chilling plant have any support programs for their
producers groups?4.4. If yes, what type of services does the chilling plant offer?4.5. Total quantity of daily morning milk purchased (liters)?4.6. Average fat percentage of the morning milk purchased? 4.7. Average price paid per liter for the morning milk (Tk)?4.8. Total quantity of daily afternoon purchase (liters)?4.9. Average fat percentage of the afternoon milk purchased? 4.10. Average price paid per liter for the afternoon milk (Tk)? 4.11. How are your milk prices determined? 4.12. Does the chilling plant provide a transport bonus to milk
suppliers?4.13. If yes, how is the transport bonus determined?4.14. What is the average transport bonus?4.15. What types of quality tests are done before receiving the
milk?4.16. Do you measure the fat percentage in front of the collectors
or milk suppliers? 279

4.17. Does the chilling plant have contracts with any milk suppliers?
4.18. If it has contracts, with how many suppliers?4.19. In the past 3 months, did the chilling plant refuse to buy
milk (part or full quantity) from any suppliers after they brought the milk to the plant?
4.20. If you refused to buy, how many suppliers did this affect inthe past 3 months?
4.21. What was the reason for refusing to buy milk from a supplier?
4.22. Do you give cash advances to your milk suppliers?4.23. If not, how do you guarantee that the supplier will not
shift to other chilling plants? 4.24. Has there been any milk spoilage in the past 3 months?4.25. If yes, then how many times?4.26. Total quantity of spoiled milk in 3 months?4.27. Did any of the milk collected from SDVC group spoil? 4.28. What did you do with the spoiled milk?4.29. What measures have you taken to prevent spoilage?
5. Patterns of Milk Collection and Plant Capacity (Past 12 Months)5.1. What has been your highest quantity of milk purchased in a
day?5.2. What date was it?5.3. What was the average price paid for milk on the day of the
highest purchase? 5.4. What was your lowest quantity of milk purchased in a day?5.5. What date was it?5.6. What was the average price paid for milk on the day of the
lowest purchase?
280

APPENDIX E7: Quantitative Data Gathered - Informal Sector MilkProcessors
A survey of fifty informal sector milk processors and milk buyers was undertaken by CARE in June, 2009. Examples of informal sector milk processors include sweet shops, yogurt makers, milk bars, tea shops, restaurants and hotels. Processing in the informal sector traditionally occurs without pasteurization and often without refridgeration. CARE initially identified 198 significant informal sector milk buyers and processors in their area of operations and surveyed fifty of them to understand their capacity, size, demand for milk, future growth plans and perceptions of other value chain actors.I was able to include questions in the questionnaire below and analyzethe findings to triangulate with other data points and inform my theorizing. The edited questionnaire below illustrates the data gathered by this survey.
Informal Sector Milk Processors Quantitative Data Gathered
1. Organizational Profile1.1. What year was your business founded? 1.2. How was the business established?1.3. Source of initial financing?1.4. Amount of initial capital to set up the business? 1.5. Number of milk processing plants?1.6. Total daily milk processing capacity (liters)? 1.7. List the dairy-related items that you produce.1.8. Number of total employees in the firm? 1.9. Number of female employees in the firm?
2. Employees (number)2.1. Management level staff2.2. Administrative staff2.3. Milk packaging/sorting staff
3. Production Capacity3.1. Pasteurized, UHT milk in packets (liters)?
281

3.2. Pasteurized, non-UHT milk in packets (liters)?3.3. Non pasteurized, UHT milk in packets (liters)?3.4. Powdered milk (kg)?3.5. Butter (kg)?3.6. Ghee (kg)?3.7. Yogurt (kg)?3.8. Sweet (kg)?3.9. Candy (kg)?
4. Market Information
5. Sales Promotion
6. Expansion Plans
7. Business Challenges
8. Stakeholder Relationships
9. Perceptions9.1. What kind of behaviors, practices or actions do you expect
from small-scale farmers that supply your organization with milk?
9.2. How important are the following small-scale farmer behaviorsto you?- Supplying unadulterated milk?- Supplying increased volumes of milk?- Supplying milk with high fat content?
9.3. If the behavior of the small-scale farmers doesn’t meet yourexpectations, how likely is it that you can address and resolve the issues?
9.4. What do you feel are your obligations to the small-scale farmers that supply your organization with milk?
9.5. From your perspective, how important do you think the following are to small-scale farmers:- Improved productivity of their cows?- Price for their milk?- Maximizing their incomes?
282

- Being treated fairly by collectors and chilling plant operators?
- Transparency of transactions? - Animal health related services?- Other
9.6. Do you think the farmers are fair and honest when it comes to selling/supplying milk to you?
9.7. Do you think the farmers care about your welfare and livelihood?
9.8. Do you trust the farmers?9.9. Do you think the milk collectors are fair and honest when it
comes to selling milk to you?9.10. Do you think the milk collectors care about the welfare of
your company?9.11. Do you trust the milk collectors?
283

APPENDIX E8: Quantitative Data Gathered - Feed and MedicineSellers and Agricultural Input Shops
A survey of 178 feed and medicine sellers and informal agricultural input shops in CARE’s geographic area of operations was undertaken in June 2009. These small-scale sellers and shops provide access to important productivity enhancing feeds, medicines and other agricultural inputs for poor dairy producers. Information collected from these entrepreneurs included their feed and medicine procurement and sales and other aspects of the size and scope of their business. An edited version of the questionnaire is reproduced below to illustrate the type of data gathered. With access to this raw data, I was able to analyze it with a statistician and use the data and analysis to triangluate with qualitative data and inform the development of my grounded theory model.
Feed and Medicine Sellers and Agricultural Input Shop Data Gathered
1. Profile1.1. Sex 1.2. Age 1.3. Number of family members 1.4. Literacy level1.5. Marital status 1.6. Education 1.7. Current main occupation of Feed/Medicine Seller
2. Business Operations2.1. Type of ownership of business?2.2. Date of start of this business?2.3. How was the business acquired?2.4. Source of initial financing?2.5. Amount of initial capital to set up the business? 2.6. Number of family members involved full-time in this business
(including the owner)?2.7. Number of hired employees involved full-time in this
business?
284
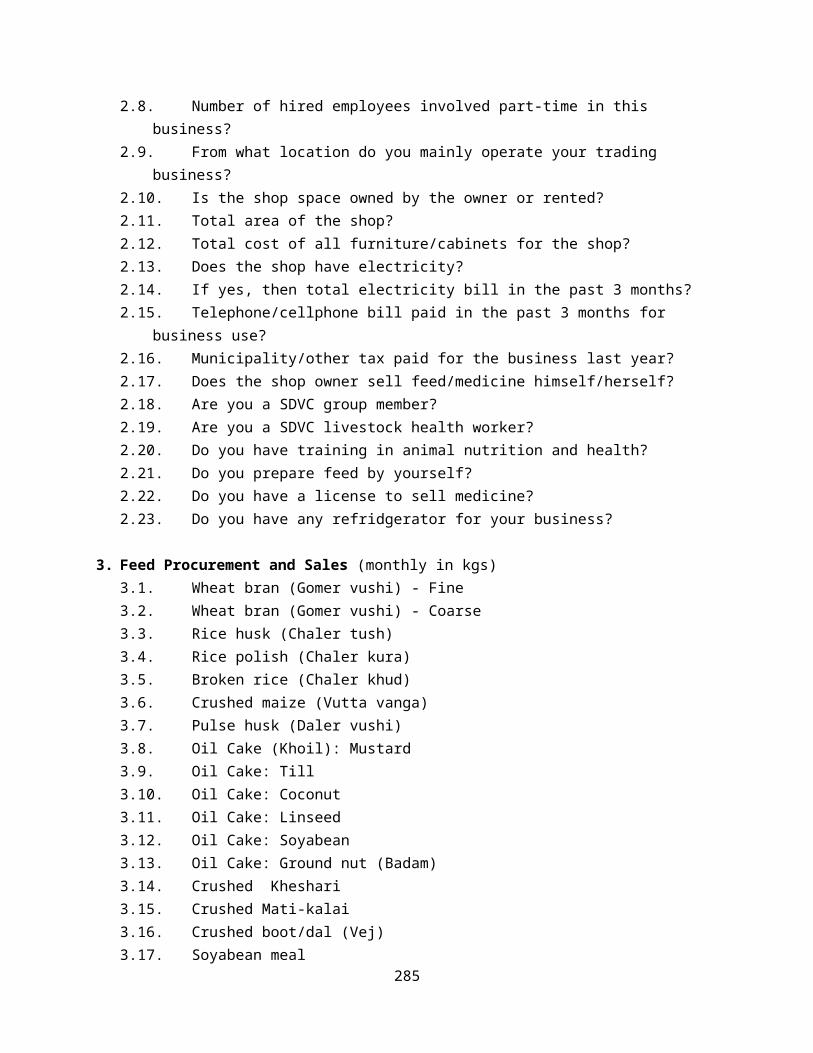
2.8. Number of hired employees involved part-time in this business?
2.9. From what location do you mainly operate your trading business?
2.10. Is the shop space owned by the owner or rented?2.11. Total area of the shop?2.12. Total cost of all furniture/cabinets for the shop?2.13. Does the shop have electricity?2.14. If yes, then total electricity bill in the past 3 months?2.15. Telephone/cellphone bill paid in the past 3 months for
business use? 2.16. Municipality/other tax paid for the business last year?2.17. Does the shop owner sell feed/medicine himself/herself?2.18. Are you a SDVC group member? 2.19. Are you a SDVC livestock health worker?2.20. Do you have training in animal nutrition and health?2.21. Do you prepare feed by yourself? 2.22. Do you have a license to sell medicine?2.23. Do you have any refridgerator for your business?
3. Feed Procurement and Sales (monthly in kgs)3.1. Wheat bran (Gomer vushi) - Fine3.2. Wheat bran (Gomer vushi) - Coarse3.3. Rice husk (Chaler tush)3.4. Rice polish (Chaler kura)3.5. Broken rice (Chaler khud)3.6. Crushed maize (Vutta vanga)3.7. Pulse husk (Daler vushi)3.8. Oil Cake (Khoil): Mustard3.9. Oil Cake: Till3.10. Oil Cake: Coconut3.11. Oil Cake: Linseed3.12. Oil Cake: Soyabean3.13. Oil Cake: Ground nut (Badam)3.14. Crushed Kheshari3.15. Crushed Mati-kalai3.16. Crushed boot/dal (Vej)3.17. Soyabean meal
285

3.18. Fish meal3.19. Urea 3.20. Molasses (Cheeta gur)3.21. Salt3.22. DCP+DB3.23. Vitamin-mineral mix3.24. Ready feed
4. Medicine And Vaccine Procurement And Sales (units per month)4.1. Renamycin/Oxytet/Gentamycin/SP vet/
Acipilline/penbacllin/Neomastipra4.2. Procain penicillin/combipen-vet/acigent/strepto-p/
Mastilex/Masticare/ Salidone/Temptin-S/Diadin/Sulpha-plus4.3. Endex/LT
vet/Facinex/Helmex/Nitronex/Antiworm/Acimac/Acinex/Endokil4.4. Astavet/Histavet4.5. Difen/Fevasole/Longosona/A-fenac-vet/pyro vet4.6. Digimix/Digitop/Zymovet4.7. Calfostonic/ayumin/calcivit/DCP/megavitDB4.8. Aminovit/barenil/Atrovet/Vermic
5. Feed5.1. From where do you procure feed? 5.2. Total transportation cost incurred to procure feed in the
last month?5.3. Do you have contracts with any feed suppliers?5.4. If you have contracts, then with how many feed suppliers?5.5. Type of contract?5.6. Do you give cash advances (deposit/security) to your
suppliers?
6. Veterinary Medicine6.1. From where do you procure veterinary medicines?6.2. If you buy medicines from company agents, then list the
names of medicine companies.6.3. Total transportation cost incurred to procure medicines in
the last month?6.4. Do you have contracts with any medicine suppliers?
286
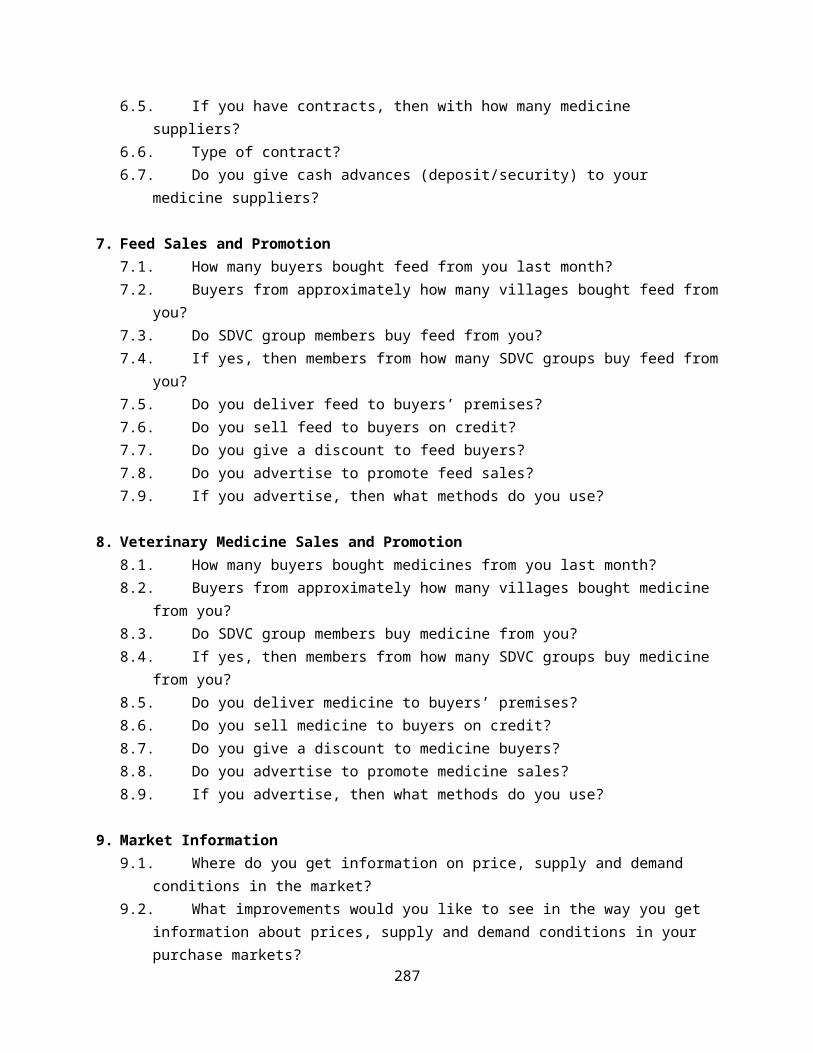
6.5. If you have contracts, then with how many medicine suppliers?
6.6. Type of contract?6.7. Do you give cash advances (deposit/security) to your
medicine suppliers?
7. Feed Sales and Promotion7.1. How many buyers bought feed from you last month? 7.2. Buyers from approximately how many villages bought feed from
you? 7.3. Do SDVC group members buy feed from you?7.4. If yes, then members from how many SDVC groups buy feed from
you? 7.5. Do you deliver feed to buyers’ premises? 7.6. Do you sell feed to buyers on credit?7.7. Do you give a discount to feed buyers?7.8. Do you advertise to promote feed sales?7.9. If you advertise, then what methods do you use?
8. Veterinary Medicine Sales and Promotion8.1. How many buyers bought medicines from you last month? 8.2. Buyers from approximately how many villages bought medicine
from you? 8.3. Do SDVC group members buy medicine from you?8.4. If yes, then members from how many SDVC groups buy medicine
from you? 8.5. Do you deliver medicine to buyers’ premises? 8.6. Do you sell medicine to buyers on credit?8.7. Do you give a discount to medicine buyers?8.8. Do you advertise to promote medicine sales?8.9. If you advertise, then what methods do you use?
9. Market Information9.1. Where do you get information on price, supply and demand
conditions in the market? 9.2. What improvements would you like to see in the way you get
information about prices, supply and demand conditions in your purchase markets?
287

10. Business Plans10.1. What are your future plans for business improvement?
288

Appendix E9: Quantitative Data Gathered - Breed and PhenotypeAssessment
To identify and determine the breed (genotype) and body characteristics (phenotype) of existing dairy cows in CARE’s project area, a survey was conducted in 2010 with a sample size of 15,148 CAREfarmers. The breed or genotype of a cow combined with its environment (feed, housing, animal husbandry practices) determines its phenotype (observable characteristics). The survey sought to gain a deeper understanding into the animal genetics and artificial insemination options and practices that could make the greatest impact on milk productivity for smallholder dairy farmers in the country. The survey included questions on milk production, feeding and nutrition, milk handling, calving, heath care and breeding practices which are shown in greater detail below. I used this raw data to triangulate with other data sources and inform my understanding of the project context and my own theory-building process.
Cattle Breed Data Gathered
1. Farmer Information1.1. Name1.2. Father’s/Husband’s Name1.3. Group Number1.4. Village1.5. Union1.6. Thana/Upazilla1.7. District
2. Level of Education of the Farmer 2.1. Illiterate2.2. Up to Primary2.3. Up to High school2.4. Up to HSC2.5. Up to Graduate2.6. Above graduate
289

3. Main Source of Farmer Income 3.1. Crop production3.2. Livestock production3.3. Business3.4. Service3.5. Other
4. Second Main Source of Income 4.1. Crop production4.2. Livestock production4.3. Business4.4. Service4.5. Other
5. Total Amount of Owned Land5.1. Homestead (acres)5.2. Crop (acres)5.3. Pond (acres)5.4. Other (acres)
6. Total Number of Livestock 6.1. Dairy cattle
- Cow- Heifer- Bull
6.2. Draft cattle - Male - Female - Castrated bull
6.3. If cows are used for draft, do they give milk?- No- Yes- If yes, how much? (liters/day)
6.4. Goats - Males- Females
6.5. Sheep- Males- Females
290
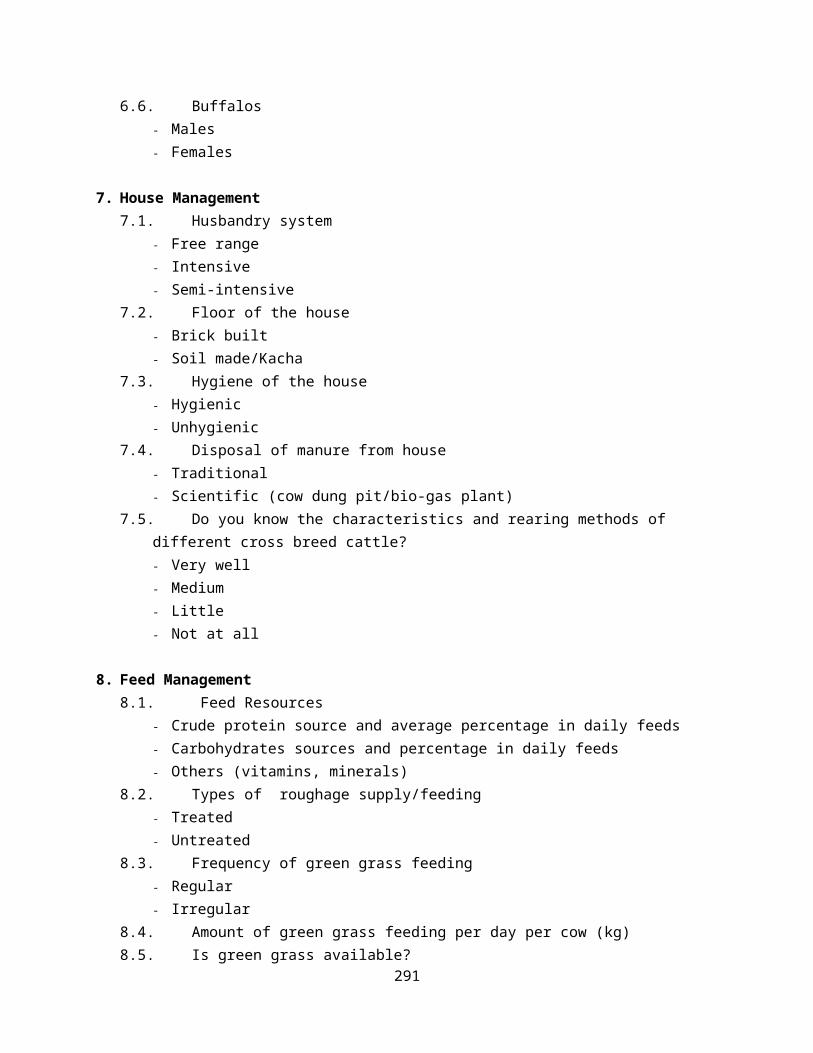
6.6. Buffalos- Males- Females
7. House Management7.1. Husbandry system
- Free range- Intensive- Semi-intensive
7.2. Floor of the house- Brick built- Soil made/Kacha
7.3. Hygiene of the house- Hygienic - Unhygienic
7.4. Disposal of manure from house- Traditional- Scientific (cow dung pit/bio-gas plant)
7.5. Do you know the characteristics and rearing methods of different cross breed cattle?- Very well- Medium- Little- Not at all
8. Feed Management8.1. Feed Resources
- Crude protein source and average percentage in daily feeds- Carbohydrates sources and percentage in daily feeds- Others (vitamins, minerals)
8.2. Types of roughage supply/feeding- Treated- Untreated
8.3. Frequency of green grass feeding- Regular- Irregular
8.4. Amount of green grass feeding per day per cow (kg)8.5. Is green grass available?
291
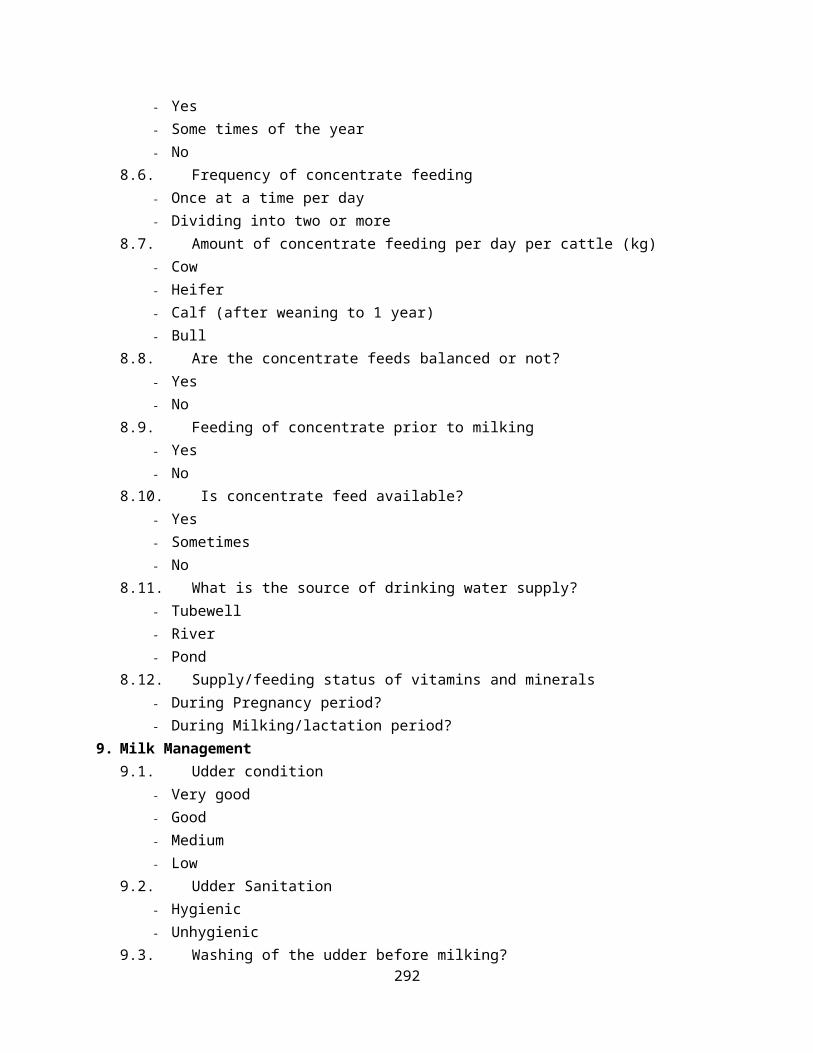
- Yes- Some times of the year- No
8.6. Frequency of concentrate feeding - Once at a time per day- Dividing into two or more
8.7. Amount of concentrate feeding per day per cattle (kg)- Cow- Heifer- Calf (after weaning to 1 year)- Bull
8.8. Are the concentrate feeds balanced or not?- Yes- No
8.9. Feeding of concentrate prior to milking - Yes- No
8.10. Is concentrate feed available?- Yes- Sometimes- No
8.11. What is the source of drinking water supply?- Tubewell- River- Pond
8.12. Supply/feeding status of vitamins and minerals- During Pregnancy period? - During Milking/lactation period?
9. Milk Management9.1. Udder condition
- Very good- Good- Medium- Low
9.2. Udder Sanitation- Hygienic- Unhygienic
9.3. Washing of the udder before milking? 292

9.4. Washing of the udder after milking?9.5. Use of cold water?9.6. Milking method
- Knot method- Two finger method- Full hand method
9.7. Milking by- Family- Milking man/Gowala- Milking machine
9.8. Milking frequency - Once/day- Twice/day- More than twice/day
9.9. Milking intervals - Regular- Irregular
9.10. Present milking cow/heifer information- Breed Name- Pedigree of cattle- Age of the cow (year)- Body weight of the cow (kg)- Color of the cow- Age of puberty (month)- Age of 1st calving (month)- Calving interval (month)- Number of Calves- Average milk yield/ day (liter)- Lactation period (in days)- Dry period (in days)
10. Calf Management10.1. Feeding of colostrum after calf birth
293
- Yes- No
10.2. Average amount of colostrum feed to the calf daily- 0 to 0.5 liter- 0.5 to 1 liter- 1 to 2 liters
10.3. Calf weaning system- Ideal method- Traditional method
10.4. Calf survival status (from birth to 6 month of age)- Alive- Died
10.5. Calf pedigree status- Calf number- Breed name- Pedigree of the calf- Age of the calf (months)- Sex of the calf- Color of the calf- Father- Mother- Male- Female
11. Health Management11.1. What is the vaccination program of the household cattle?
- Routine program- Irregular
11.2. What is the deworming program?- Routine program- Irregular
11.3. Any previous/present history of mastits that affect the cow?11.4. Any previous/present history of milk fever that affect the
cow?11.5. Any cows affected by disease within the last six months? If
yes then disease name:11.6. Health treatments of cows done by:
- Veterinarian294

- Livestock health worker (LHW)- By both of them
11.7. How many times the cow may be sick/ill in a year? - 0-1 time/year- 1-3 times/year- 4-6 times/year
11.8. Have you had calving difficulty?12. Breeding Management/Status
12.1. What is your system of cow breeding?- Natural- AI- Both (Natural & AI)
12.2. Do you know/understand the heat detection sign of a cow?- Yes- No
13. In Case of Natural Breeding13.1. What is the source of natural breeding?
- Local/indigenous bull- Cross breed bull
13.2. How many services needed for conception of the cow by natural breeding?- One time service- Two time service- Three times service- Four times service
13.3. What is the success rate/conception rate of natural breeding?- 25%- 50%- 75%- 100%
13.4. What is the cost per service for natural breeding?- 30-50 Tk- 50-80 Tk- 80-100 Tk- 100-150 Tk
13.5. Any previous or present history of abortion by the cow?295

13.6. If the answer is Yes, then when- Within 1-3 months of pregnancy- Within 4-6 months of pregnancy- Within 7-9 months of pregnancy
13.7. What do you think was the cause of abortion?- Accidental/injury cause- Poisonous cause- Drug reaction- Other
14. In Case of Artificial Insemination (AI):14.1. Have you ever used AI in your cow breeding ?14.2. Which year did you use AI in your cows? 14.3. Have you used AI regularly in your cow since the first use ?
14.4. If you didn’t use AI regularly what is the main reason? - It is costly/expensive- Need 2 or more services- Not available- Suspect problems arise for cows in future- Calves did not survive
14.5. Which breed of cows have you used for AI before?- Local- Cross breed- Both local & cross breed
14.6. Why did you choose AI? - Get a good calf/cow- Get more milk in future- Unavailable breeding bull- Easy to breed the cow
14.7. How far is the AI service center/point from your home? (km)14.8. Do you ask the AI worker for a specific breed of semen to
breed your cow?14.9. If the answer is yes, then which breed of semen did you
choose? (The semen of Hariana, Tharparker, Pabna breed are not used in the field by AI)- Holstein Friesian
296

- Jersey- Sahiwal- Red Sindhi
14.10. Do you get the semen that you prefer from the AI worker/center?
14.11. If you have no choice or do not ask the AI worker for preferable semen, why not?
- Have no idea- Have no interest- It is not necessary
14.12. What is your source for Artificial Insemination?- DLS- BRAC- Milk Vita- Ejab Aliences
14.13. How many services are needed for the cow to conceive by Artificial Insemination?
- One time service- Two times service- Three times service- Four times service
14.14. What is the success rate for your Artificial Insemination?- 25%- 50%- 75%- 100%
14.15. What is the cost per service of Artificial Insemination?- 50-100 Tk- 100-150 Tk- 150-200 Tk- 200-300 Tk
14.16. Are you interested in producing a milk cow or beef cattle?- Milk Cow- Beef Cattle- Both
297

15. Economics and Profitability15.1. Price of milk/liter
- Highest rate (Tk)- Lowest rate (Tk)
15.2. Rearing cost of per cattle/month (feed,medicine,treatment) (Tk)
15.3. Production cost of per liter milk yield (calculating all expenses) (Tk)
15.4. Labor cost per cattle/month (Tk)15.5. Treatment cost per cattle/year (Tk)15.6. Are you interested in taking training to know better health,
breeding cattle management practices?15.7. Are you interested in taking a loan for cattle rearing or to
improve your cattle?15.8. Do you think cow rearing is a profitable business?
298

APPENDIX E10: Quantitative Data Gathered – CARE Staff Performance
On a monthly basis, CARE field facilitators (staff who worked in the field with farmer groups) gathered data on farmer group participation,the performance of livestock health workers, artificial insemination service providers, collectors and chilling plant managers. An edited summary of the survey is given below to indicate the types of data gathered.
CARE Staff Performance Data Gathered
1. Data Related to Group Organizing1.1. Number of learning sessions conducted in the past month?
1.2. Number of learning sessions planned?
1.3. Average farmer attendance in learning sessions? (percentage attended)
1.4. Number of farmer groups engaged in aggregating milk for collection and sale?
1.5. Number of collection points active in aggregated milk collection?
1.6. Number of written agreements between groups and collectors?
1.7. Number of verbal agreements between groups and collectors?
1.8. Number of farmer groups engaged in group savings?
1.9. Total savings per group? (Tk)
1.10. Number of farmer groups with access to improved feed supply?1.11. Number of farmer groups with access to balanced feed
rations?1.12. Number of local feed suppliers developed?1.13. Number of Female:
- Collectors- Livestock Health Workers- Farmer Leaders
299

- Other
1.14. Number of farmer groups that are using the Cattle Health Cards?
1.15. Number of producers dropped out of groups? 1.16. Number of new farmers enrolled in existing groups?
2. Data Related to Livestock Health Workers and Artificial Insemination2.1. Number of livestock health workers servicing farmer groups
this month?2.2. Number of milking cows, calves, heifers, bulls, etc. of CARE
farmers died this month?2.3. Number of livestock health workers dropped-out this month?
Reasons?2.4. Number of farmer groups receiving artificial insemination
service?2.5. Artificial insemination service providers operating with
farmer groups (BRAC, Milk Vita, DLS)?
3. Data Related to Collectors
3.1. Number of collectors engaged in milk bulking?
3.2. Number of collectors engaged in milk collection from CARE farmers?
3.3. Number of collectors conducting joint planning meetings with farmer groups?
3.4. Number of collectors training farmer groups on lactometer usage, fat percentage pricing, and milk hygiene?
3.5. Number of collectors dropped-out so far?
4. Data Related to Chilling Plants
4.1. Chilling plant name and location4.2. Chilling capacity (liters/day)4.3. Total CARE farmer group collection (liters/day)
300

4.4. What is the ration of local chilling plant collection to CARE farmer group supply?
4.5. Are the milk prices publicly posted at the chilling plant?
5. Other Data
5.1. Number of feed, medicine and agricultral input shops established so far?
5.2. Number of stakeholder coordination meetings held this month?
5.3. Number of times women reported barriers this month?
5.4. Number of times actions were taken to overcome barriers reported by women?
301

APPENDIX F: Baseline Survey
To determine the impact of their work with a high degree of statistical accuracy, CARE commissioned the Washington-based International Policy Research Institute to conduct a detailed baselinesurvey (completed in September 2009) and follow-up survey (to be completed in December 2012).
MethodologyThe methodology sought to compare outcomes for CARE farmers to what those outcomes would have been if CARE’s interventions had not taken place. A purely randomized approach to sampling for the baseline studywas not feasable because CARE farmers would be partially purposively selected based on their proximity to milk chilling infrastructure. Instead, a longitudinal difference-in-differences (or double-differences) method was used to develop a before and after comparison (Donald & Lang, 2007). This was combined with data gathered on CARE farmer households along with the control housholds that were not associated with the CARE initiative. Difference-in-differences impact estimates typically have lower bias than estimates based on cross-sectional data (Donald & Lang, 2007). Central to the application of the difference-in-differences method is the allocation of households to be either in treatment (CARE project farmers) or comparison (non-participant) groups. The approach used for constructing comparison groups was propensity score matching (Caliendo & Kopeinig, 2008). During the follow-up survey, participant and non-participant households (consisting of two control groups) will be matched using the propensity score matching method (Dehejia & Wahba, 2002; Rosenbaum& Rubin, 1983) to assess the impact of CARE’s intervention. Two control groups were used to capture potential spillover effects from CARE’s initiative.
Sample SizeSince CARE’s primary objective was to increase income from dairy activities for its target farmers, per capital total monthy household expenditure was used as a proxy for income to estimate the sample sizeof the treatment and two control groups for the baseline survey. Threeparameters necessary for sample size estimates – mean, standard deviation and interclass correlation coefficient – were estimated for this outcome indicator (Ahmed et al., 2009). The minimum sample size necessary to detect a statistically significant change of 12 percent is given in the table below.
302

Minimum Sample Size Required for Detecting a Change of 12% in theOutcome Indicator
Indicator Minimumimpact
Totalnumberof
villages
Ratio ofsample
(treatment:
control)
Minimum sample size
Treatment Control
Total
Per capita household expenditure / month
Anincreaseof 12%
60 1.5:1 466 312 x 2 =624
1,090
Source: Ahmed, A.U., Minten, B., Quisumbing, A.R. & Roy, D. 2009. Evaluating the Dairy Value Chain Project in Bangladesh: Baseline Report. Washington, DC:International Food Policy Research Institute.
To detect a 12 percent difference between treatment and control groups, a minimum sample size of 1,090 households was needed. Budget resources allowed 1,500 housholds to be surveyed; therefore changes of12 percent between treatment and control households could be detected.The total sample of 1,500 households included 60 villages. Within villages, 25 households were randomly sampled of both beneficiary farmers and control households as described below.
Beneficiary Household Selection MethodFrom CARE’s list of project beneficiary households and their village, 26 villages were randomly selected based on the probability proportional to size sampling method (Rao & Vijayan, 1977). From each of the 26 villages, 25 project beneficiary households were randomly selected.
Control Household Selection MethodTo capture potential spillover effects from CARE’s work, two control groups of households were created: control group one and control grouptwo.
Control group one was selected from villages where CARE was not operating that were within the same union (a geographic district with
303

approximatly 10 villages) as a CARE beneficiary village. Control groupone households were selected randomly from within their village based on a previous list of all households in the village.
Control group two households were selected randomly from upazilas (a geographic district similar to a county in many Western countries) where CARE was not operating. Seventeen unions were randomly selected from nine upazilas without CARE beneficiaries and one village was randomly selected from each union. Within each selected village, 25 households were randomly selected from a list of households.
Baseline Survey QuestionnaireThe baseline survey questionnaire was designed to collect information on multiple topics including household demographics, level of education, assets and expenditures, economic shocks, cattle ownership and dairy farming practices. An overview of survey items is included below. The baseline survey was conducted between July and August 2008 with trained surveyors under the supervision of the International FoodPolicy Research Institute to ensure quality control.
Overview of Survey Items for Baseline SurveyThe CARE baseline survey covered the categories of information listed below:
1. Household Characteristics1.1. Characteristics of survey households1.2. Demography and dependency ratio
2. Budget Shares and Food Consumption2.1. Budget share2.2. Food budget share2.3. Quantity of daily per capita consumption of food items2.4. Calorie consumption and composition2.5. Cost of calories by food groups
3. Nutritional Status of Children and Women3.1. Prevalence of malnutrition among preschool children aged 6
to 60 months3.2. Prevalence of malnutrition among preschool children aged 6
to 60 months: By income3.3. BMI of childbearing-age women aged 15–50 years (non-pregnant
and non-lactating women)
304

4. Incidence of Illness and Disability4.1. Incidence of illness of household members, during 30 days
preceding the survey4.2. Physical disabilities of household members
5. Schooling of Children5.1. Primary and secondary school enrolment5.2. Types of primary school attended
6. Ownership of Household Assets6.1. Selected household asset ownership6.2. Value of selected assets owned, by gender
7. Ownership and Tenancy of Land7.1. Ownership and Tenancy of Land
8. Dwelling Characteristics8.1. Electricity and structure of dwelling8.2. Types of latrine
9. Employment and Labor Force Participation9.1. Labor force participation of household members aged 15 and
over
10. Participation in Public Intervention Programs10.1. Households receiving public assistance
11. Private Transfers and Remittances11.1. Private transfers and remittances received
12. Access to Credit12.1. Importance of credit sources, as a proportion of total loan
amount12.2. Use of loans12.3. Interest rates by loan source
13. Patterns of Savings13.1. Incidence of savings, as a proportion of total amount saved
13.2. Planned use of savings13.3. Planned use of savings
305

14. Shocks and Coping Mechanisms14.1. Incidence of shocks in the past five years14.2. Coping mechanisms (multiple response)
15. Gender-Related Issues15.1. Decisions to work and to spend income from work15.2. Factors negatively affecting women's decisions to work
outside the home
16. Indicators of Women’s Decision-making and Control of Resources16.1. Decisions to take loans from NGOs and to spend loan proceeds16.2. Spending decisions16.3. Women's control of money to make purchases16.4. Primary decision-maker on livestock and dairy-related items
17. Correlates of Women’s Status within the Household17.1. Indicators of women’s mobility17.2. Assets at marriage of husband and wife, matched couples17.3. Cattle ownership per dairy farmer17.4. Cattle ownership distribution (for participant group)
18. Profile of the CARE Dairy Farmers18.1. Characteristics of dairy farmers18.2. Dairy-related assets
19. Characteristics of Cows, Milk Productivity, and Feeding Practices19.1. Characteristics of cows19.2. Use of fodder and concentrate markets19.3. Feeding and labor inputs in dairy production19.4. Average household milk production and milk use of all dairy
farmers19.5. Distribution of milk production and milk sales among dairy
farmers
20. Milk Use and Marketing20.1. Milk sales practices by dairy farmers20.2. Milk marketing practices during the week prior to the survey20.3. Milk transactions20.4. Cattle transactions20.5. Determinants of milk and cattle prices
21. Cattle Diseases and Treatment Providers21.1. Animal health problems
306
21.2. Animal treatment practices21.3. Incidence of cattle death
22. Milk Quality and Safety22.1. Food safety measures22.2. Milk storage and preservation practices22.3. General hygiene22.4. Information requirements on milk quality and safety
307

APPENDIX G: Impact Indicators
Comparing the initial baseline quantitative study of CARE farmers fromAugust 2008 (N=658) with the farmer survey from April 2012 (N=2,125) shows significant increases in milk productivity for the cattle of CARE farmers. In addition, farmer incomes from milk sales increased 37% even though the average milk prices decreased slightly during thattime. As described previously, the methodologies for these surveys have been audited by the Bill and Melinda Gates Foundation and the Washington-Based International Food Policy Research Institute.
CARE Impact Indicators
Baseline (Aug2008)
Farmer GroupSurvey (April
2012)
N=658 N=2,125 Change(%)
Average local breed milking cow productivity (liters/day) 1.13 1.39 23%Average cross breed milking cow productivity (liters/day) 3.99 5.45 37%Average daily household milk production(liters/day) 1.20 1.77 48%Daily household milk sales (liters/day) 0.91 1.35 48%Average monthly income from milk sales ($/month) 9.64 16.27 69%Average household milk consumption (liters/day) 0.28 0.42 50%Average milk price (Tk/liter) 24.88 15.34 (38%)
Source: Independent statistical analysis of raw farmer group surveydata collected April 2012.
308
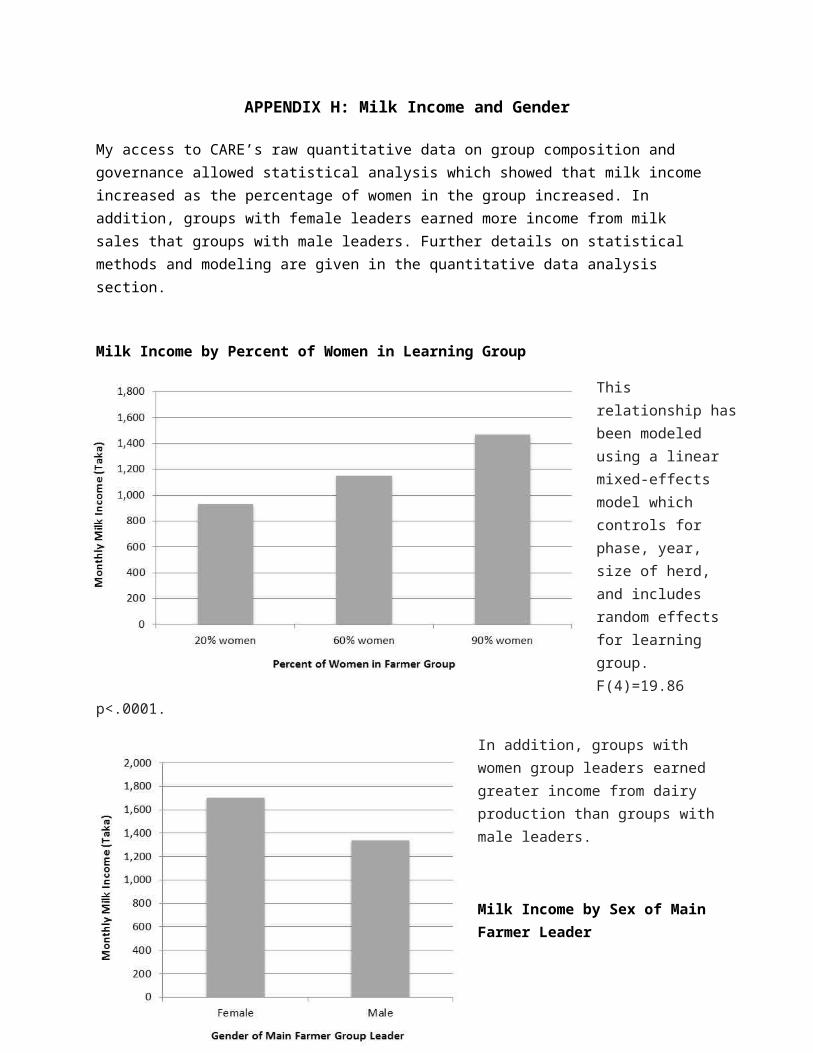
APPENDIX H: Milk Income and Gender
My access to CARE’s raw quantitative data on group composition and governance allowed statistical analysis which showed that milk income increased as the percentage of women in the group increased. In addition, groups with female leaders earned more income from milk sales that groups with male leaders. Further details on statistical methods and modeling are given in the quantitative data analysis section.
Milk Income by Percent of Women in Learning Group
This relationship hasbeen modeled using a linear mixed-effects model which controls for phase, year, size of herd, and includes random effects for learning group. F(4)=19.86
p<.0001.
In addition, groups with women group leaders earned greater income from dairy production than groups with male leaders.
Milk Income by Sex of Main Farmer Leader
309

This relationship has been modeled using a linear mixed-effects model which controls for phase, year, size of herd, and includes random effects for learning group. F(2)=5.78 p=.003.
310

APPENDIX I: Group Savings
Group savings have been established as a strong financial back up source for project participants to access dairy related inputs, vet medicines, vaccinations and other livestock services. Therefore, increasing numbers of groups are becoming interested in savings groupsas a way to attain better opportunities and minimize the risk of paying interest that they are used to paying to traditional microfinance services. As of September, 2011, 66 percent of year 1, 2 and 3 groups are actively involved in savings groups and the average savings per group has reached $116.
Savings Activities Among CARE Farmer Groups
Year
Numberof
GroupsEngaged
inSavings
TotalSavings
Amount
($)
Spenton
InputPurchase ($)
Spent onInputSeller
Development
($)
Spenton
CattlePurcha
se($)
Spenton
DairyRelate
dPurposes ($)
Spenton Non-DairyRelatedPurpose
s($)
Cashin
Hand/
Bank($)
Year1 120
23,812 3,081 469 3,720 5,832 3,552
7,158
Year2 180
26,217 3,960 312 1,161 5,101 3,158
12,526
Year3 268
20,415 1,952 89 122 3,118 3,002
12,132
Total 568
70,444 8,993 870 5,003 14,051 9,712
31,816
Source: October 2011 CARE Bangladesh Annual Report to the Bill and Melinda Gates Foundation.
311

APPENDIX J: Milk Income and Knowledge
Statistical analysis of quantitative data showed that the greater farmers’ knowledge score on animal feeding and health practices, the greater their milk-related incomes. Further details on statistical methods and modeling are given in the quantitative data analysis section of the dissertation.
Milk Income by Knowledge Score
This
relationship has been modeled using a linear mixed-effects model whichcontrols for phase, year, size of herd, and includes random effects for learning group. F(1)=6.67 p=.009.
312
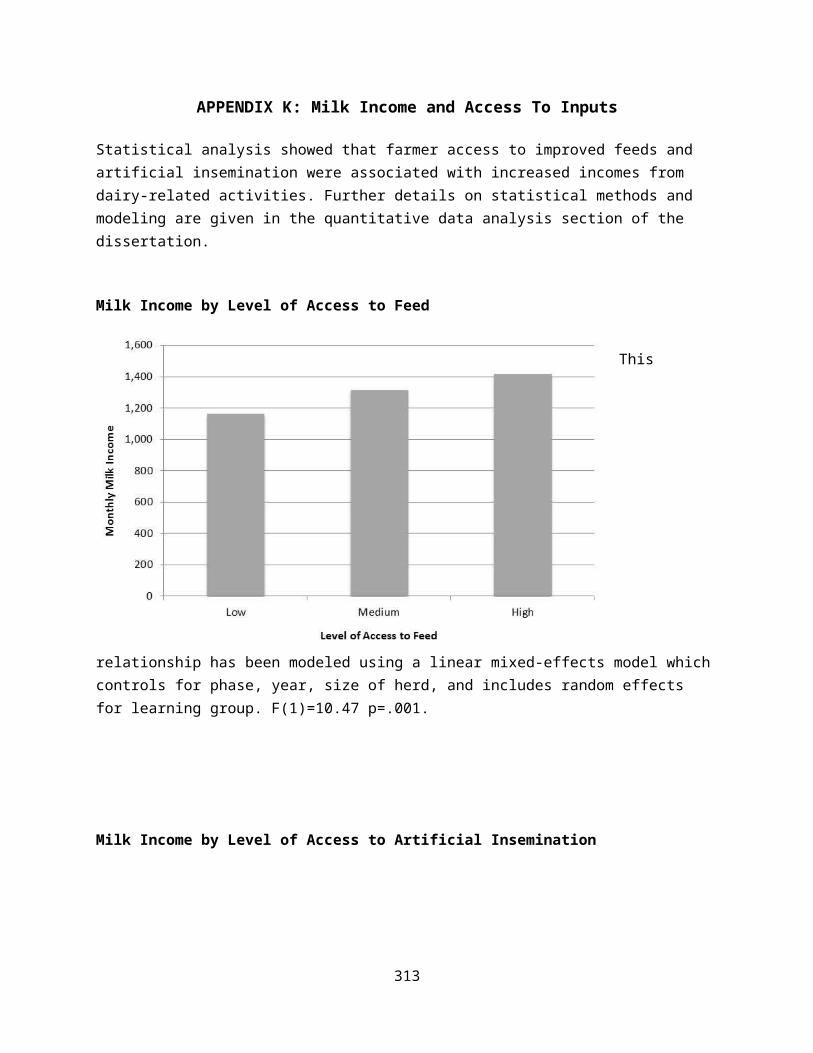
APPENDIX K: Milk Income and Access To Inputs
Statistical analysis showed that farmer access to improved feeds and artificial insemination were associated with increased incomes from dairy-related activities. Further details on statistical methods and modeling are given in the quantitative data analysis section of the dissertation.
Milk Income by Level of Access to Feed
This
relationship has been modeled using a linear mixed-effects model whichcontrols for phase, year, size of herd, and includes random effects for learning group. F(1)=10.47 p=.001.
Milk Income by Level of Access to Artificial Insemination
313

This
relationship has been modeled using a linear mixed-effects model whichcontrols for phase, year, size of herd, and includes random effects for learning group. F(1)=76.63 p<.0001.
314
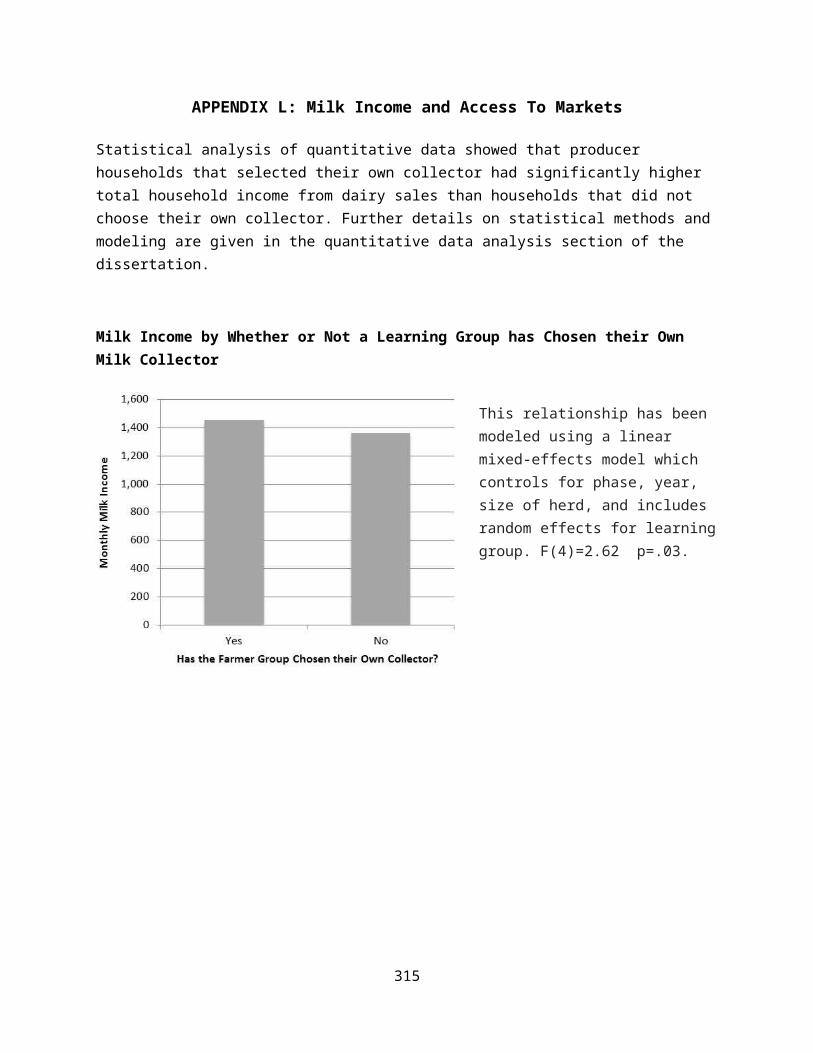
APPENDIX L: Milk Income and Access To Markets
Statistical analysis of quantitative data showed that producer households that selected their own collector had significantly higher total household income from dairy sales than households that did not choose their own collector. Further details on statistical methods andmodeling are given in the quantitative data analysis section of the dissertation.
Milk Income by Whether or Not a Learning Group has Chosen their Own Milk Collector
This relationship has been modeled using a linear mixed-effects model which controls for phase, year, size of herd, and includes random effects for learninggroup. F(4)=2.62 p=.03.
315

APPENDIX M: Evidence of Institutional Leveraging
Provisionof Evidence
“[F]armers don't do something until they see it; I mean they need to see it very clearly.”(CARE Technical Advisor)
“The main objective of our pilot program is to prove to the dairy farmers that by changingtheir feed composition, and provide proper vaccines and parasite control for their cows this will increase their daily cow milk production. Each dairy farmer will be introduced to the estimated increase in their economic return from each cow if their current practices are changed. (MOU with PRAN)
[I]f I can show what a digital lacto scanner can bring farmers in terms of fair prices, this can be evidence for how this whole industry operates.” (CARE Manager)
“Each dairy farmer will be introduced to the estimated increase in their economic return from each cow if their current practices are changed.” (Annual Report)
316

Contextualization
of ProductionKnowledge
“[T]o understand what the underlining causes of poverty are, and to develop interventions around that, is only possible when you really know from the people what their thoughts arearound that… [W]e learn from them.” (CARE Manager)
“2,860 learning sessions have been conducted at the producer level by the trained FL [farmer leader] to educate them on animal husbandry and management. The producers are getting information and increased knowledge on fodder preservation (silage and hay making)mentored by FL.” (Annual Report)
“[Training modules included] specific sessions in marketing, collective bargaining, leadership, facilitation skills, decision making and problem solving etc. 1269 women farmer leaders has [sic] been trained on these topics so that they can negotiate with relevant institutions for getting services and fair price of milk.” (Annual Report)
“The combined effort of basic and advanced capacity building (e.g. basic and refresher training on farm management, learning sessions conducted by farmer leader and livestock health worker, information and services provided by information service centers, etc.) hashad a greater impact on the farm management capacities of organized producer groups.” (Progress Report)
317

APPENDIX M: Evidence of Institutional Leveraging (continued)
Legitimationof Market
Transactions
“Price differences for milk based on its fat content are very significant and the difference this would have on poor dairy farmers’ income is equally significant. This warrants the investment of time, effort and resources to bring more transparency to the process and ensure the transaction is fair.” (Annual Report) “How do you reconfigure the market so that the service providers understand that if you are in dairy, your client is a woman, and she lives at home?... How do you think about themarket in a different way?... The transaction needs to move down to household level. That's where the documentation is done, that's where the fat testing is done, that's wherethe cash transaction takes place.” (CARE Technical Advisor)
“SDVC [CARE] is very much concerned about women’s issues. For giving more attention to this we have developed a women’s barrier checklist. Every team office has discussed the issue with groups or individuals and maintained a record of the women’s barrier checklist and also recorded the steps to overcome the barrier” (Gender and Empowerment Report)
“One of the biggest risks for the project is that if private sector processors do not remain in close contact with milk producers a big void in understanding may develop…Since inception SDVC [CARE] has been trying to address this issue through increased engagement with the private processors [and] a relationship of mutual respect and understanding has been slowly but surely developing.” (Progress Report)
318
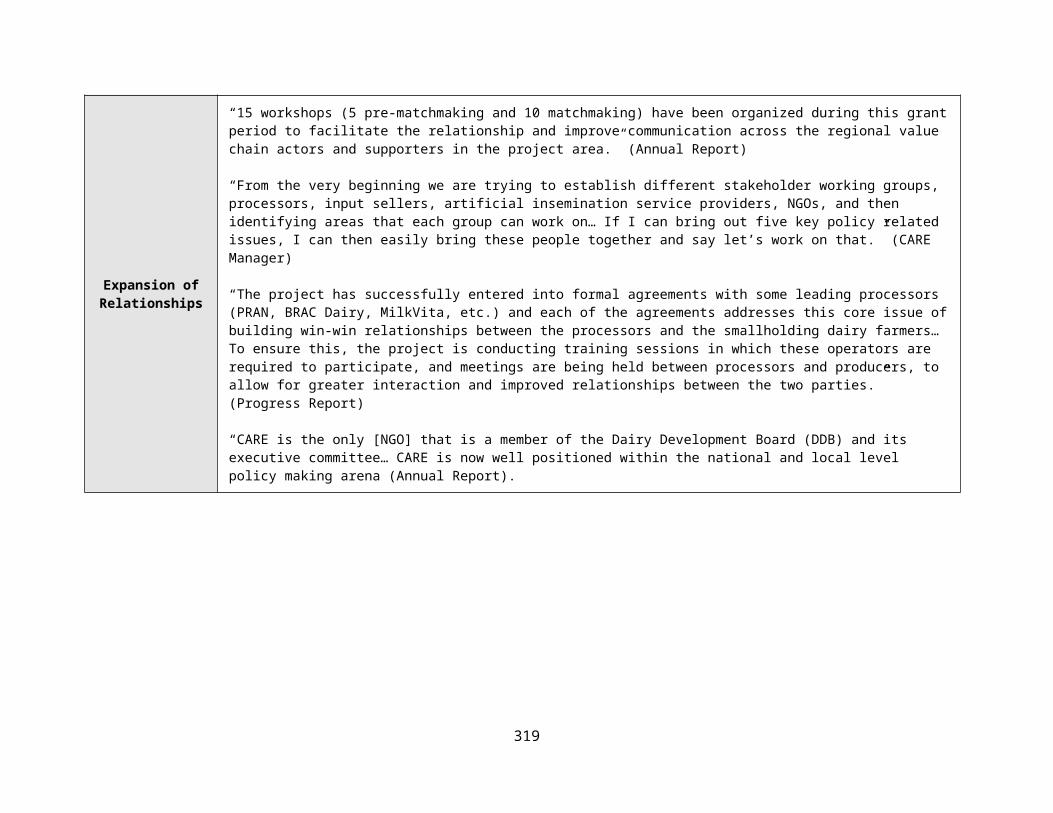
Expansion ofRelationships
“15 workshops (5 pre-matchmaking and 10 matchmaking) have been organized during this grantperiod to facilitate the relationship and improve communication across the regional value chain actors and supporters in the project area.” (Annual Report)
“From the very beginning we are trying to establish different stakeholder working groups, processors, input sellers, artificial insemination service providers, NGOs, and then identifying areas that each group can work on… If I can bring out five key policy related issues, I can then easily bring these people together and say let’s work on that.” (CARE Manager)
“The project has successfully entered into formal agreements with some leading processors (PRAN, BRAC Dairy, MilkVita, etc.) and each of the agreements addresses this core issue ofbuilding win-win relationships between the processors and the smallholding dairy farmers… To ensure this, the project is conducting training sessions in which these operators are required to participate, and meetings are being held between processors and producers, to allow for greater interaction and improved relationships between the two parties.” (Progress Report)
“CARE is the only [NGO] that is a member of the Dairy Development Board (DDB) and its executive committee… CARE is now well positioned within the national and local level policy making arena (Annual Report).
319
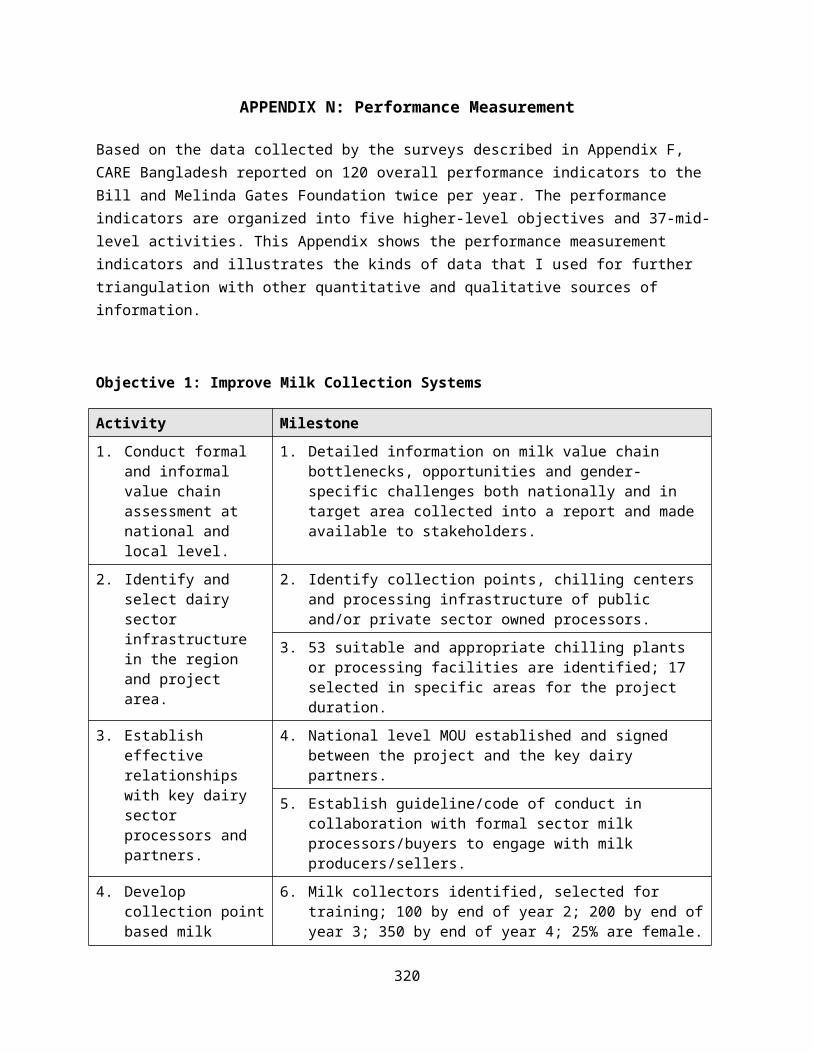
APPENDIX N: Performance Measurement
Based on the data collected by the surveys described in Appendix F, CARE Bangladesh reported on 120 overall performance indicators to the Bill and Melinda Gates Foundation twice per year. The performance indicators are organized into five higher-level objectives and 37-mid-level activities. This Appendix shows the performance measurement indicators and illustrates the kinds of data that I used for further triangulation with other quantitative and qualitative sources of information.
Objective 1: Improve Milk Collection Systems
Activity Milestone1. Conduct formal
and informal value chain assessment at national and local level.
1. Detailed information on milk value chain bottlenecks, opportunities and gender-specific challenges both nationally and in target area collected into a report and made available to stakeholders.
2. Identify and select dairy sector infrastructure in the region and project area.
2. Identify collection points, chilling centers and processing infrastructure of public and/or private sector owned processors.
3. 53 suitable and appropriate chilling plants or processing facilities are identified; 17 selected in specific areas for the project duration.
3. Establish effective relationships with key dairy sector processors and partners.
4. National level MOU established and signed between the project and the key dairy partners.
5. Establish guideline/code of conduct in collaboration with formal sector milk processors/buyers to engage with milk producers/sellers.
4. Develop collection pointbased milk
6. Milk collectors identified, selected for training; 100 by end of year 2; 200 by end ofyear 3; 350 by end of year 4; 25% are female.
320
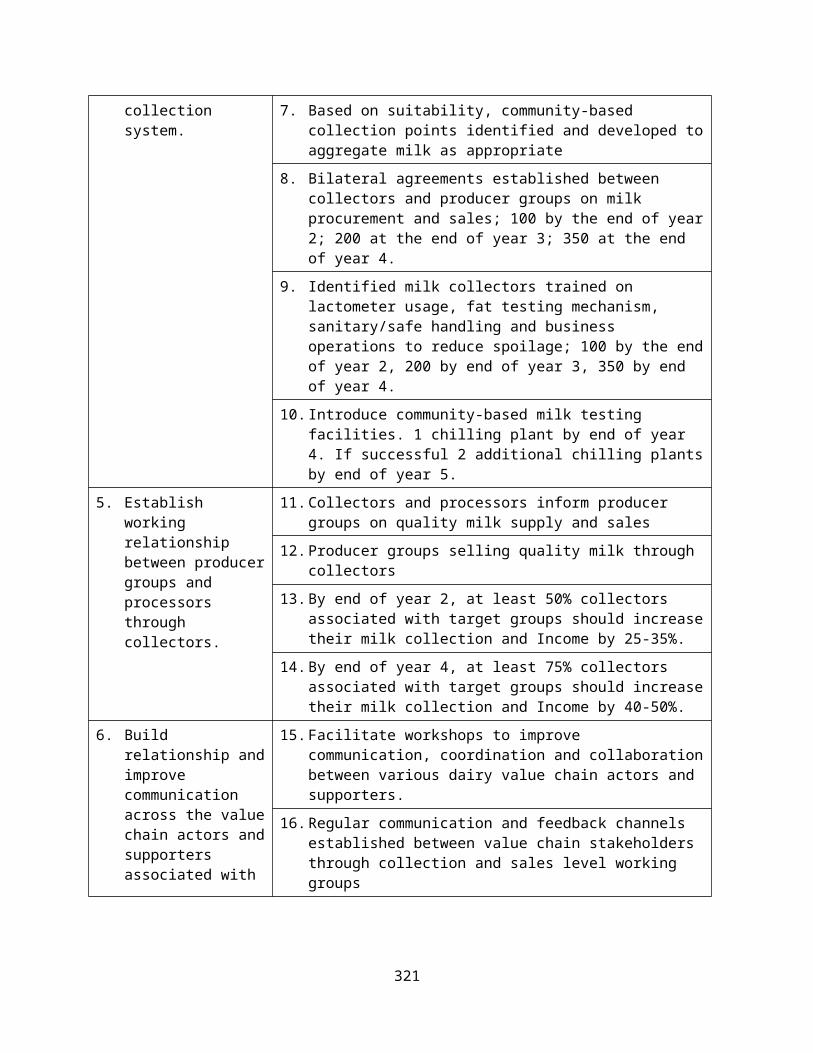
collection system.
7. Based on suitability, community-based collection points identified and developed toaggregate milk as appropriate
8. Bilateral agreements established between collectors and producer groups on milk procurement and sales; 100 by the end of year2; 200 at the end of year 3; 350 at the end of year 4.
9. Identified milk collectors trained on lactometer usage, fat testing mechanism, sanitary/safe handling and business operations to reduce spoilage; 100 by the endof year 2, 200 by end of year 3, 350 by end of year 4.
10.Introduce community-based milk testing facilities. 1 chilling plant by end of year 4. If successful 2 additional chilling plantsby end of year 5.
5. Establish working relationship between producergroups and processors through collectors.
11.Collectors and processors inform producer groups on quality milk supply and sales
12.Producer groups selling quality milk through collectors
13.By end of year 2, at least 50% collectors associated with target groups should increasetheir milk collection and Income by 25-35%.
14.By end of year 4, at least 75% collectors associated with target groups should increasetheir milk collection and Income by 40-50%.
6. Build relationship andimprove communication across the valuechain actors andsupporters associated with
15.Facilitate workshops to improve communication, coordination and collaborationbetween various dairy value chain actors and supporters.
16.Regular communication and feedback channels established between value chain stakeholders through collection and sales level working groups
321
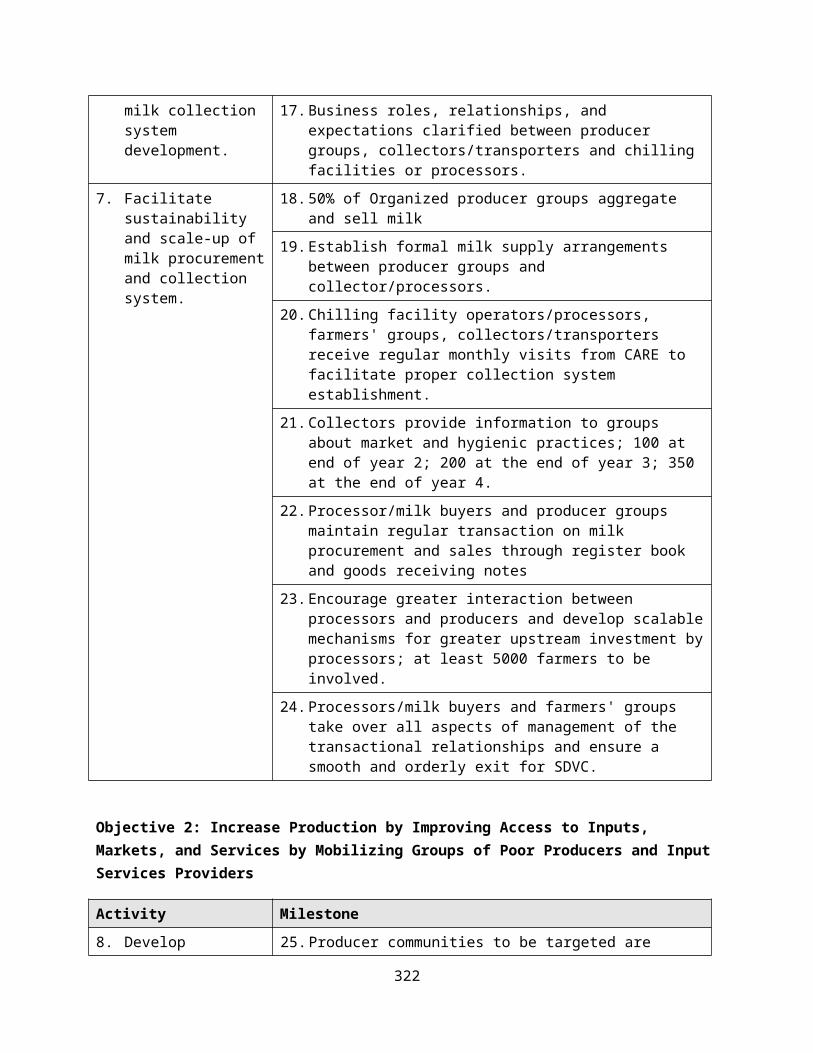
milk collection system development.
17.Business roles, relationships, and expectations clarified between producer groups, collectors/transporters and chilling facilities or processors.
7. Facilitate sustainability and scale-up of milk procurementand collection system.
18.50% of Organized producer groups aggregate and sell milk
19.Establish formal milk supply arrangements between producer groups and collector/processors.
20.Chilling facility operators/processors, farmers' groups, collectors/transporters receive regular monthly visits from CARE to facilitate proper collection system establishment.
21.Collectors provide information to groups about market and hygienic practices; 100 at end of year 2; 200 at the end of year 3; 350 at the end of year 4.
22.Processor/milk buyers and producer groups maintain regular transaction on milk procurement and sales through register book and goods receiving notes
23.Encourage greater interaction between processors and producers and develop scalablemechanisms for greater upstream investment byprocessors; at least 5000 farmers to be involved.
24.Processors/milk buyers and farmers' groups take over all aspects of management of the transactional relationships and ensure a smooth and orderly exit for SDVC.
Objective 2: Increase Production by Improving Access to Inputs, Markets, and Services by Mobilizing Groups of Poor Producers and InputServices Providers
Activity Milestone8. Develop 25.Producer communities to be targeted are
322

community-based milk producer / marketing groups.
identified.26.Groups of small-scale and landless producers
in targeted communities are mobilized, with strong female participation.
27.Factors impeding women’s participation discussed with producer groups and communities and specific actions needed to include women in planning and service delivery are undertaken.
28.By the end of year 1, at least 8000 farmers have been organized into groups; 15000 at theend of year 2; 30000 at the end of year 3; and 35000 at the end of year 4; on average 30producer per group.
9. Enhance farm management capacity of organized producer groups.
29.Farmer training curriculum developed to include management; book keeping; animal registration; feed and fodder; improving milkquality; fat testing; animal housing and husbandry.
30.3,000 farmers' group leaders trained: 500 by midpoint of year 2; 1,500 by end of year 2; 3,000 by end of year 3.
31.Farmers mentored in adopting improved animal husbandry and business practices through trained group leaders and under direct guidance of CARE staff; 15000 by end of year 2; 30000 by end of year 3; 35000 by end of year 4.
10.Adoption of feed& fodder practices.
32.Analysis of existing animal feeding practicesof dairy producers in the project area undertaken to understand the nutrient requirement/areas of improvement needed.
33.Proper fodder, silage, hays and concentrate practices are identified & promoted to all organized producer groups.
11.Establish animalregistry system / health
34.Set up of animal health registry system / health card.
35.Paravets conduct training sessions with all
323

card. farmers' groups in their catchment areas on how to use an animal health registry system to track vaccinations and other health measures.
36.Farmers report adoption and use of the animalhealth card to improve their animal husbandrypractices.
37.Health registry cards capture information on regularly scheduled vaccination and de-worming services received by producers.
12.Facilitate better access toinputs and microfinance.
38.Specific inputs required by farmers to improve milk production and animal husbandry identified through various assessments.
39.Sources, accessibility, and costs of inputs identified and shared with producer groups, paravets, collectors and processors.
40.Negotiations reported between farmers’ groupsand input suppliers, allowing farmers to obtain required inputs at lower, bulk cost.
41.CARE staff identifies farmers' finance needs through group discussions, including needs specific to women farmers.
42.CARE links farmers' groups with finance sources and facilitates group savings for interested groups
43.Assess financial service market and disseminate information to financial institutions interested in dairy value chain financing.
13.Promote environment and health-friendly practices.
44.Establish baseline indicators on existing practices that are environment and health friendly.
45.Environment and nutritional impact assessmentof project intervention on the targeted community and stakeholders including milk quality standards and measurement conducted.
46.From assessment, develop materials and tools supporting environment, nutrition and health
324

friendly practices.47.Dissemination of published materials to
private sector partners and government agencies and also incorporated into farmer training.
48.Develop billboards, leaflets, dramas, calendars and posters to promote the use of milk to improve women's and children's nutrition.
49.Promote increased milk consumption among women and children.
14.Develop marketing, collective bargaining, and leadership skills.
50.Existing training material identified and adapted to train farmers in marketing, collective bargaining, and leadership.
51.3,000 farmers' group leaders are trained: 500 by midpoint of year 2; 1,500 by the end of year 2; 3,000 by the end of year 3.
52.At least 900 women farmers and milk collectors receive training aimed at buildingtheir self-confidence and increasing their bargaining, marketing and leadership skills.
15.Organized producers increased milk production.
53.By the end of year 2, at least 10,000 farmershave increased their average milk production by 50%.
54.By the end of year 3, at least 20,000 farmershave increased their average milk production by 50%.
55.Organized farmers increased their average milk production by 75% at the end of project period.
16.Build relationships and improve communication across the valuechain actors andsupporters at
56.Workshops held to connect various dairy valuechain actors and supporters - especially producers and different input service providers.
57.Regular communication and feedback channels established between producers, collector, paravet and input service providers.
325

various levels and promote integration.
58.Business roles, relationships, and expectations clarified between producer groups, collectors, and paravets and input sellers.
17.Facilitate sustainability and scale-up on the access of different service provision mechanism.
59.Facilitate the development of at least 50 community level dairy input outlets. 25 by end of year 4, 50 by end of year 5.
60.Facilitate group savings and loans schemes with interested producer groups to enable regular purchase of dairy inputs
61.Facilitate the development of linkages between producer groups and input supply outlets.
62.Share milk producer group development and capacity building skills/materials to partnerNGOs.
326
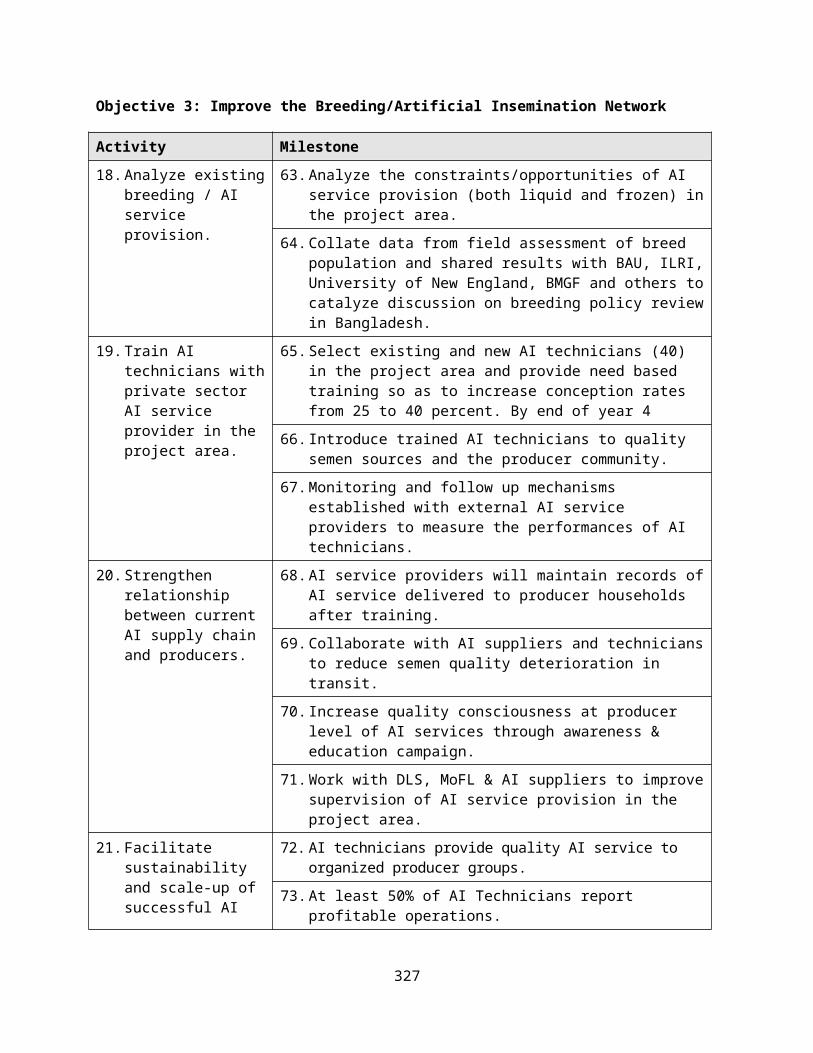
Objective 3: Improve the Breeding/Artificial Insemination Network
Activity Milestone18.Analyze existing
breeding / AI service provision.
63.Analyze the constraints/opportunities of AI service provision (both liquid and frozen) inthe project area.
64.Collate data from field assessment of breed population and shared results with BAU, ILRI,University of New England, BMGF and others tocatalyze discussion on breeding policy reviewin Bangladesh.
19.Train AI technicians withprivate sector AI service provider in the project area.
65.Select existing and new AI technicians (40) in the project area and provide need based training so as to increase conception rates from 25 to 40 percent. By end of year 4
66.Introduce trained AI technicians to quality semen sources and the producer community.
67.Monitoring and follow up mechanisms established with external AI service providers to measure the performances of AI technicians.
20.Strengthen relationship between current AI supply chain and producers.
68.AI service providers will maintain records ofAI service delivered to producer households after training.
69.Collaborate with AI suppliers and techniciansto reduce semen quality deterioration in transit.
70.Increase quality consciousness at producer level of AI services through awareness & education campaign.
71.Work with DLS, MoFL & AI suppliers to improvesupervision of AI service provision in the project area.
21.Facilitate sustainability and scale-up of successful AI
72. AI technicians provide quality AI service to organized producer groups.
73.At least 50% of AI Technicians report profitable operations.
327
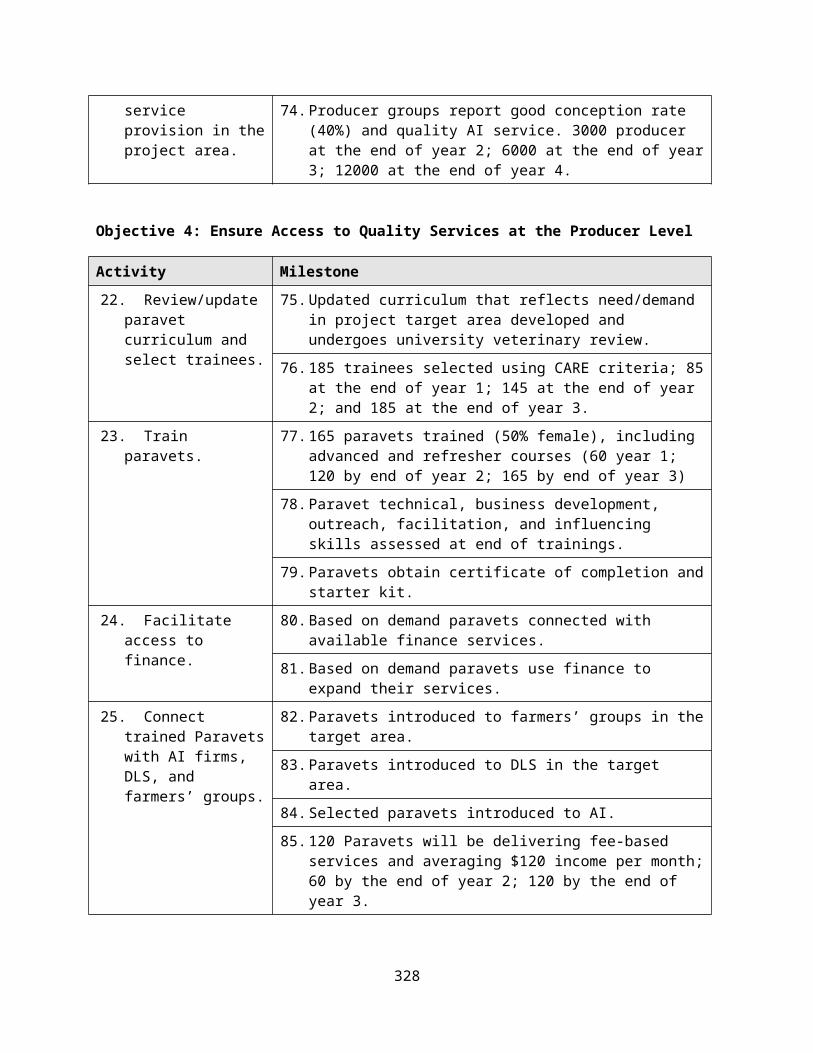
service provision in theproject area.
74.Producer groups report good conception rate (40%) and quality AI service. 3000 producer at the end of year 2; 6000 at the end of year3; 12000 at the end of year 4.
Objective 4: Ensure Access to Quality Services at the Producer Level
Activity Milestone22. Review/update
paravet curriculum and select trainees.
75.Updated curriculum that reflects need/demand in project target area developed and undergoes university veterinary review.
76.185 trainees selected using CARE criteria; 85at the end of year 1; 145 at the end of year 2; and 185 at the end of year 3.
23. Train paravets.
77.165 paravets trained (50% female), including advanced and refresher courses (60 year 1; 120 by end of year 2; 165 by end of year 3)
78.Paravet technical, business development, outreach, facilitation, and influencing skills assessed at end of trainings.
79.Paravets obtain certificate of completion andstarter kit.
24. Facilitate access to finance.
80.Based on demand paravets connected with available finance services.
81.Based on demand paravets use finance to expand their services.
25. Connect trained Paravetswith AI firms, DLS, and farmers’ groups.
82.Paravets introduced to farmers’ groups in thetarget area.
83.Paravets introduced to DLS in the target area.
84.Selected paravets introduced to AI. 85.120 Paravets will be delivering fee-based
services and averaging $120 income per month;60 by the end of year 2; 120 by the end of year 3.
328

26. Supervise thedevelopment and use of the animal health register.
86.Paravets introduced to the use of CHC and trained to train farmers' groups as well.
87.Paravets train and monitor all farmers' groups in their catchment areas to use the registry system and record farmer compliance.
27. Facilitate use and improvement of dairy inputs.
88.Selected paravets establish links with dairy input outlets; 65 in year 1; 120 in year 2; 165 in year 3.
89.Paravets recommend to farmers' groups improvements on dairy input use.
90.75% of farmers' groups report at least two improvements / new practice adoptions relatedto dairy input use.
28. Promotion of quality & cost effective feeding practices to increase milk productivity
91.Encourage private investors to promote development of improved concentrate feed.
92.Identify and develop feed mixes and ratios inpartnership with private sector.
93.Promote developed concentrate feed in partnership with private sector.
29. Facilitate development of demand-driven Paravet serviceson a commercial basis.
94.3 knowledge sharing workshops held with vet medicine producers.
95.40 knowledge sharing workshops held with the private sector.
96.Paravets providing regular services to farmers.
30. Monitor (Paravet) service effectiveness and satisfaction.
97.Monitoring system in place.98.Usage and service satisfaction rates measured
regularly.99.Usage and service satisfaction rates used by
CARE to mentor paravets and drive service improvements.
31. Facilitate sustainability and scale-up.
100. Work with DLS to develop and promote improved paravet training.
101. Promote paravet training through media.
329

102. Establish community-based dairy veterinaryservice on a pilot basis and scale up reaching 2000 farmers during the pilot phase.
330
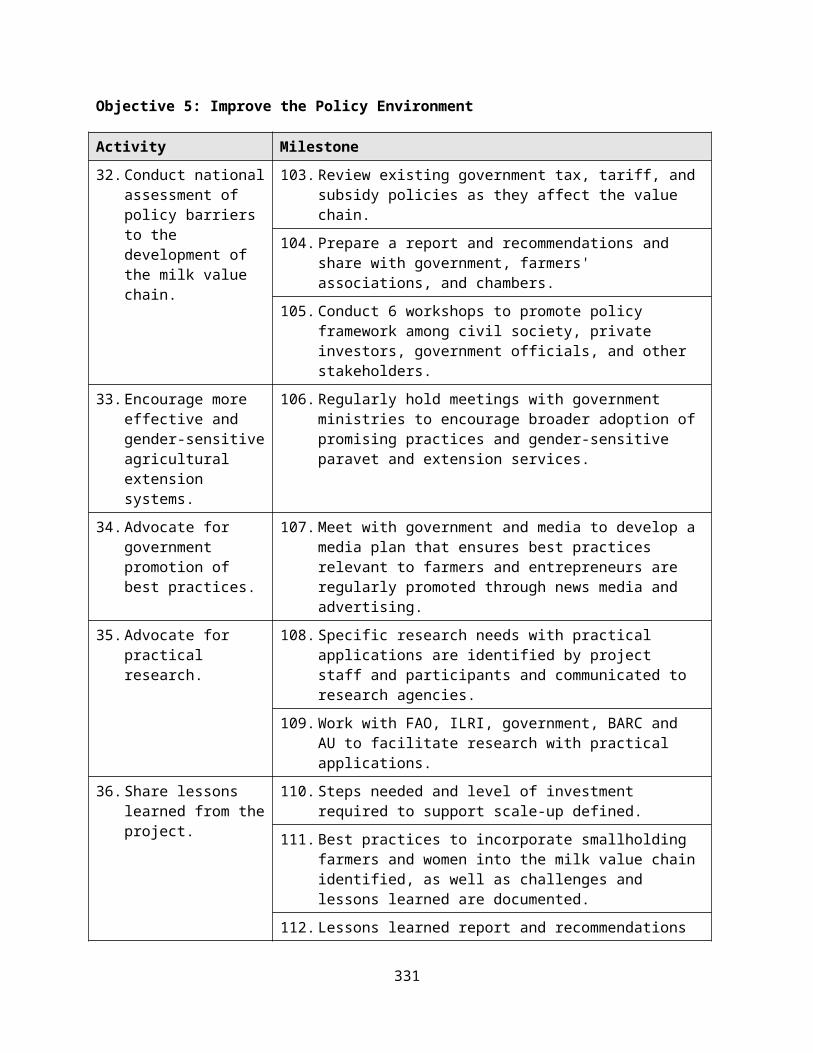
Objective 5: Improve the Policy Environment
Activity Milestone32.Conduct national
assessment of policy barriers to the development of the milk value chain.
103.Review existing government tax, tariff, andsubsidy policies as they affect the value chain.
104.Prepare a report and recommendations and share with government, farmers' associations, and chambers.
105.Conduct 6 workshops to promote policy framework among civil society, private investors, government officials, and other stakeholders.
33.Encourage more effective and gender-sensitiveagricultural extension systems.
106.Regularly hold meetings with government ministries to encourage broader adoption ofpromising practices and gender-sensitive paravet and extension services.
34.Advocate for government promotion of best practices.
107.Meet with government and media to develop amedia plan that ensures best practices relevant to farmers and entrepreneurs are regularly promoted through news media and advertising.
35.Advocate for practical research.
108.Specific research needs with practical applications are identified by project staff and participants and communicated to research agencies.
109.Work with FAO, ILRI, government, BARC and AU to facilitate research with practical applications.
36.Share lessons learned from theproject.
110.Steps needed and level of investment required to support scale-up defined.
111.Best practices to incorporate smallholding farmers and women into the milk value chainidentified, as well as challenges and lessons learned are documented.
112.Lessons learned report and recommendations
331

written, presented, and disseminated. 113.Cross sharing with other similar dairy
sector development project actively pursuedand promoted.
37.M&E Activities 114.Baseline assessment completed115.M&E system developed and agreed upon by
stakeholders116.M&E system in place in the field117.M&E quarterly reports produced118.Mid-term evaluation conducted119.Final Impact Assessment conducted120.Program evaluation conducted and report
produced
332