More applicable environmental scanning systems leveraging ...
34
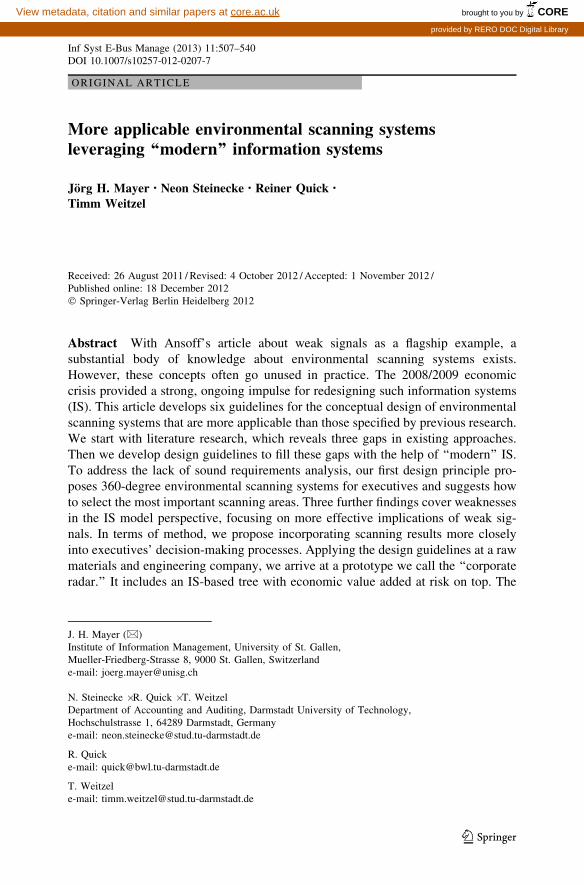
ORIGINAL ARTICLE More applicable environmental scanning systems leveraging ‘‘modern’’ information systems Jo ¨rg H. Mayer • Neon Steinecke • Reiner Quick • Timm Weitzel Received: 26 August 2011 / Revised: 4 October 2012 / Accepted: 1 November 2012 / Published online: 18 December 2012 Ó Springer-Verlag Berlin Heidelberg 2012 Abstract With Ansoff’s article about weak signals as a flagship example, a substantial body of knowledge about environmental scanning systems exists. However, these concepts often go unused in practice. The 2008/2009 economic crisis provided a strong, ongoing impulse for redesigning such information systems (IS). This article develops six guidelines for the conceptual design of environmental scanning systems that are more applicable than those specified by previous research. We start with literature research, which reveals three gaps in existing approaches. Then we develop design guidelines to fill these gaps with the help of ‘‘modern’’ IS. To address the lack of sound requirements analysis, our first design principle pro- poses 360-degree environmental scanning systems for executives and suggests how to select the most important scanning areas. Three further findings cover weaknesses in the IS model perspective, focusing on more effective implications of weak sig- nals. In terms of method, we propose incorporating scanning results more closely into executives’ decision-making processes. Applying the design guidelines at a raw materials and engineering company, we arrive at a prototype we call the ‘‘corporate radar.’’ It includes an IS-based tree with economic value added at risk on top. The J. H. Mayer (&) Institute of Information Management, University of St. Gallen, Mueller-Friedberg-Strasse 8, 9000 St. Gallen, Switzerland e-mail: [email protected] N. Steinecke Á R. Quick Á T. Weitzel Department of Accounting and Auditing, Darmstadt University of Technology, Hochschulstrasse 1, 64289 Darmstadt, Germany e-mail: [email protected] R. Quick e-mail: [email protected] T. Weitzel e-mail: [email protected] 123 Inf Syst E-Bus Manage (2013) 11:507–540 DOI 10.1007/s10257-012-0207-7 brought to you by CORE View metadata, citation and similar papers at core.ac.uk provided by RERO DOC Digital Library
-
Upload
khangminh22 -
Category
Documents
-
view
2 -
download
0
Transcript of More applicable environmental scanning systems leveraging ...
ORI GIN AL ARTICLE
More applicable environmental scanning systemsleveraging ‘‘modern’’ information systems
Jorg H. Mayer • Neon Steinecke • Reiner Quick •
Timm Weitzel
Received: 26 August 2011 / Revised: 4 October 2012 / Accepted: 1 November 2012 /
Published online: 18 December 2012
� Springer-Verlag Berlin Heidelberg 2012
Abstract With Ansoff’s article about weak signals as a flagship example, a
substantial body of knowledge about environmental scanning systems exists.
However, these concepts often go unused in practice. The 2008/2009 economic
crisis provided a strong, ongoing impulse for redesigning such information systems
(IS). This article develops six guidelines for the conceptual design of environmental
scanning systems that are more applicable than those specified by previous research.
We start with literature research, which reveals three gaps in existing approaches.
Then we develop design guidelines to fill these gaps with the help of ‘‘modern’’ IS.
To address the lack of sound requirements analysis, our first design principle pro-
poses 360-degree environmental scanning systems for executives and suggests how
to select the most important scanning areas. Three further findings cover weaknesses
in the IS model perspective, focusing on more effective implications of weak sig-
nals. In terms of method, we propose incorporating scanning results more closely
into executives’ decision-making processes. Applying the design guidelines at a raw
materials and engineering company, we arrive at a prototype we call the ‘‘corporate
radar.’’ It includes an IS-based tree with economic value added at risk on top. The
J. H. Mayer (&)
Institute of Information Management, University of St. Gallen,
Mueller-Friedberg-Strasse 8, 9000 St. Gallen, Switzerland
e-mail: [email protected]
N. Steinecke � R. Quick � T. Weitzel
Department of Accounting and Auditing, Darmstadt University of Technology,
Hochschulstrasse 1, 64289 Darmstadt, Germany
e-mail: [email protected]
R. Quick
e-mail: [email protected]
T. Weitzel
e-mail: [email protected]
123
Inf Syst E-Bus Manage (2013) 11:507–540
DOI 10.1007/s10257-012-0207-7
brought to you by COREView metadata, citation and similar papers at core.ac.uk
provided by RERO DOC Digital Library

resulting lessons learned help to evaluate our findings and the research method
presented here, as well provide concrete starting points for future research.
Keywords Corporate management �Balanced threat and opportunity management �‘‘Modern’’ information system technology � Information systems (IS) design
1 Introduction
The increasing volatility of company environments is a growing concern for
executives. In particular, they worry about not being prepared for environmental
shifts or—even worse—not being able to parry them.
The 2008/2009 economic crisis provided a strong, ongoing impulse for focusing
earlier on emerging threats and opportunities (Hopwood 2009; Makridakis et al.
2010) and the volatile environment in 2011/2012 ensures that this topic stays relevant
(Cinar and Gulgun 2010). Environmental scanning—ideally, based on information
systems (IS)—can help to manage this challenge. The functions of such scanning
systems are to gather, interpret, and use pertinent information about events, trends,
and relationships in an organization’s environment to assist management in planning
the organization’s future course of action (Aguilar 1967). Because environmental
scanning leads to a fact-driven decision-making process and additional time for
proactive corporate management (Rohrbeck 2011), companies that use these IS will
have brighter prospects than those that do not (Ansoff 1980).1
With Ansoff’s (1975) article ‘‘Managing Strategic Surprise by Response to Weak
Signals’’ as a flagship example, a substantial body of knowledge exists, but these
concepts often go unused in practice (Krystek and Herzhoff 2006; Day and
Schoemaker 2005). Practitioners perceive the task as a difficult one per se (Lesca
and Caron-Fasan 2008), and some may not even know how to start (Albright 2004).
Increasing acceptance of IS among today’s executives (Vodanovich et al. 2010)
and the technological advances of the Internet era (Cheung and Babin 2006) make
the present moment favorable for an environmental scanning redesign. Focusing on
the role of ‘‘modern’’ IS, this article develops guidelines for the conceptual design
of environmental scanning systems that are more applicable than those specified by
previous research.
We follow the tenets of design science research (DSR) in IS, which aims to create
useful artifacts that solve relevant design problems in organizations (Hevner and
Chatterjee 2010). Focusing on ‘‘build’’ and ‘‘evaluate’’ activities (March and Smith
1995), we apply the six-step research process model outlined by Peffers et al. (2006).
The first step is to identify a problem and motivate the research. The 2008/2009
economic crisis showed that environmental scanning could help executives to focus
earlier on emerging threats and opportunities. The next step is to define objectives for
an (IS) solution. After revisiting foundations (Sect. 2) and the need for improving
1 Some may argue that improvisation could be an alternative approach (Ciborra 1999). However, in light
of the homo oeconomicus theory (Menard and Shirley 2008), we believe the best way to tackle the
increasingly volatile environment is to reason with cause-effect chains based on a sound framework
consisting of the most important scanning areas (in detail, Sect. 4.4).
508 J. H. Mayer et al.
123
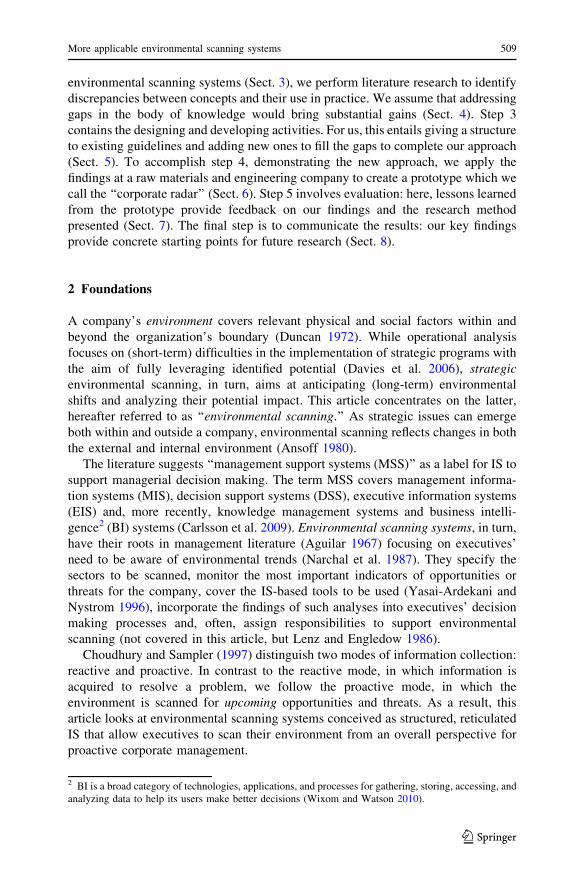
environmental scanning systems (Sect. 3), we perform literature research to identify
discrepancies between concepts and their use in practice. We assume that addressing
gaps in the body of knowledge would bring substantial gains (Sect. 4). Step 3
contains the designing and developing activities. For us, this entails giving a structure
to existing guidelines and adding new ones to fill the gaps to complete our approach
(Sect. 5). To accomplish step 4, demonstrating the new approach, we apply the
findings at a raw materials and engineering company to create a prototype which we
call the ‘‘corporate radar’’ (Sect. 6). Step 5 involves evaluation: here, lessons learned
from the prototype provide feedback on our findings and the research method
presented (Sect. 7). The final step is to communicate the results: our key findings
provide concrete starting points for future research (Sect. 8).
2 Foundations
A company’s environment covers relevant physical and social factors within and
beyond the organization’s boundary (Duncan 1972). While operational analysis
focuses on (short-term) difficulties in the implementation of strategic programs with
the aim of fully leveraging identified potential (Davies et al. 2006), strategic
environmental scanning, in turn, aims at anticipating (long-term) environmental
shifts and analyzing their potential impact. This article concentrates on the latter,
hereafter referred to as ‘‘environmental scanning.’’ As strategic issues can emerge
both within and outside a company, environmental scanning reflects changes in both
the external and internal environment (Ansoff 1980).
The literature suggests ‘‘management support systems (MSS)’’ as a label for IS to
support managerial decision making. The term MSS covers management informa-
tion systems (MIS), decision support systems (DSS), executive information systems
(EIS) and, more recently, knowledge management systems and business intelli-
gence2 (BI) systems (Carlsson et al. 2009). Environmental scanning systems, in turn,
have their roots in management literature (Aguilar 1967) focusing on executives’
need to be aware of environmental trends (Narchal et al. 1987). They specify the
sectors to be scanned, monitor the most important indicators of opportunities or
threats for the company, cover the IS-based tools to be used (Yasai-Ardekani and
Nystrom 1996), incorporate the findings of such analyses into executives’ decision
making processes and, often, assign responsibilities to support environmental
scanning (not covered in this article, but Lenz and Engledow 1986).
Choudhury and Sampler (1997) distinguish two modes of information collection:
reactive and proactive. In contrast to the reactive mode, in which information is
acquired to resolve a problem, we follow the proactive mode, in which the
environment is scanned for upcoming opportunities and threats. As a result, this
article looks at environmental scanning systems conceived as structured, reticulated
IS that allow executives to scan their environment from an overall perspective for
proactive corporate management.
2 BI is a broad category of technologies, applications, and processes for gathering, storing, accessing, and
analyzing data to help its users make better decisions (Wixom and Watson 2010).
More applicable environmental scanning systems 509
123

3 Improving environmental scanning systems
3.1 Regulatory needs
Environmental scanning is not just ‘‘nice to have,’’ as Kajuter (2004) shows in his
multicountry comparison. In the wake of several cases of fraud around the turn of
the millennium that were neither detected by internal controls nor by auditors,
legislators expressed a need for a more detailed approach to risk management. The
best known example is the U.S. Sarbanes–Oxley Act. In particular, Section 404
requires companies listed on the New York Stock Exchange to extensively establish,
document, and maintain internal controls; establish independent audit committees;
and conduct mandatory audits of internal controls’ effectiveness (Sherman and
Chambers 2009). Furthermore, financial statements are normally prepared on the
assumption that a company will continue operating for the foreseeable future (IASB
Framework 4.1; ISA 1.25). This requires forecasts of at least 1 year (Choo 2009). In
the wake of the 2008/2009 economic crisis, such ‘‘going concern’’ assessments have
gained increased importance.
3.2 Empirical evidence
Fuld (2003) exposed that 97 percent of 140 corporate strategist surveyed said their
companies have no early warning system in place. Furthermore two-thirds of them
had been surprised by as many as three high-impact events in the past 5 years.
According to findings from a survey by Krystek and Herzhoff (2006), 30 percent of
European chemical companies do not have environmental scanning systems in
place. 15 percent said the instruments available are not accepted for practical use.
Day and Schoemaker’s (2005) survey of managers found that 81 percent
considered their need for scanning capabilities to exceed their current capacity.
Other statements come from companies listed in the FT ‘‘Europe 500’’ report
(Mayer 2010): executives consider environmental-scanning concepts to be too
complex and even too difficult to implement. Therefore, we propose that findings of
environmental scanning play no substantial role in executives’ decision-making
processes in most cases.
4 State of the art
4.1 Framework for literature systematization
Following Webster and Watson (2002) a literature review should be concept-
centric. Looking at elements of IS design theories in combination with their
research method used offer a rigorous framework for structuring the literature
(Fig. 1). The framework is taken from prior work (Mayer et al. 2011) and the
findings are based on Mayer (2011), expanded with another five publications
(Mayer 2012).
510 J. H. Mayer et al.
123
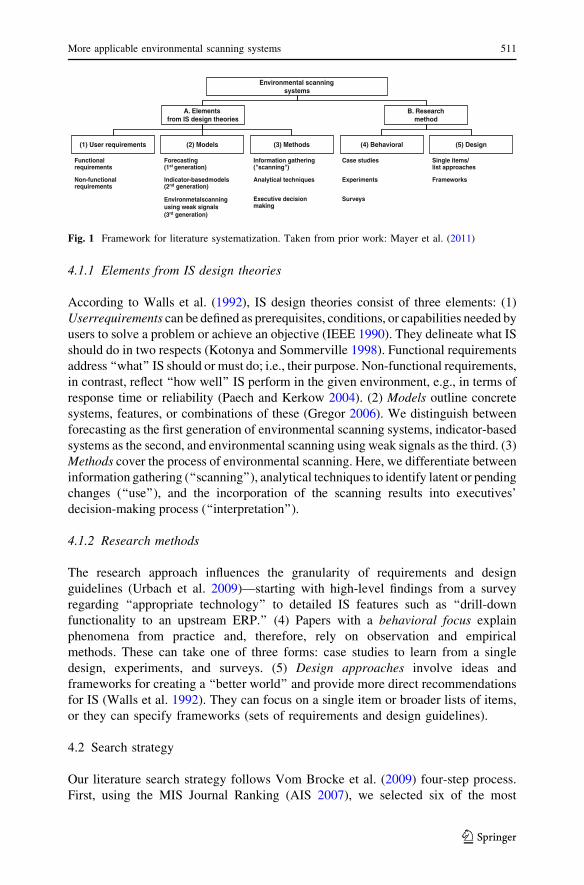
4.1.1 Elements from IS design theories
According to Walls et al. (1992), IS design theories consist of three elements: (1)
Userrequirements can be defined as prerequisites, conditions, or capabilities needed by
users to solve a problem or achieve an objective (IEEE 1990). They delineate what IS
should do in two respects (Kotonya and Sommerville 1998). Functional requirements
address ‘‘what’’ IS should or must do; i.e., their purpose. Non-functional requirements,
in contrast, reflect ‘‘how well’’ IS perform in the given environment, e.g., in terms of
response time or reliability (Paech and Kerkow 2004). (2) Models outline concrete
systems, features, or combinations of these (Gregor 2006). We distinguish between
forecasting as the first generation of environmental scanning systems, indicator-based
systems as the second, and environmental scanning using weak signals as the third. (3)
Methods cover the process of environmental scanning. Here, we differentiate between
information gathering (‘‘scanning’’), analytical techniques to identify latent or pending
changes (‘‘use’’), and the incorporation of the scanning results into executives’
decision-making process (‘‘interpretation’’).
4.1.2 Research methods
The research approach influences the granularity of requirements and design
guidelines (Urbach et al. 2009)—starting with high-level findings from a survey
regarding ‘‘appropriate technology’’ to detailed IS features such as ‘‘drill-down
functionality to an upstream ERP.’’ (4) Papers with a behavioral focus explain
phenomena from practice and, therefore, rely on observation and empirical
methods. These can take one of three forms: case studies to learn from a single
design, experiments, and surveys. (5) Design approaches involve ideas and
frameworks for creating a ‘‘better world’’ and provide more direct recommendations
for IS (Walls et al. 1992). They can focus on a single item or broader lists of items,
or they can specify frameworks (sets of requirements and design guidelines).
4.2 Search strategy
Our literature search strategy follows Vom Brocke et al. (2009) four-step process.
First, using the MIS Journal Ranking (AIS 2007), we selected six of the most
Environmental scanning systems
(3) Methods(1) User requirements
A. Elements from IS design theories
Functional requirements
Non-functionalrequirements
(2) Models
Forecasting(1st generation)
Environmetalscanning using weak signals (3rd generation)
Indicator-basedmodels (2nd generation)
Information gathering("scanning")
Executive decision making
Analytical techniques
(4) Behavioral (5) Design
B. Researchmethod
Case studies
Experiments
Surveys
Single items/list approaches
Frameworks
Fig. 1 Framework for literature systematization. Taken from prior work: Mayer et al. (2011)
More applicable environmental scanning systems 511
123
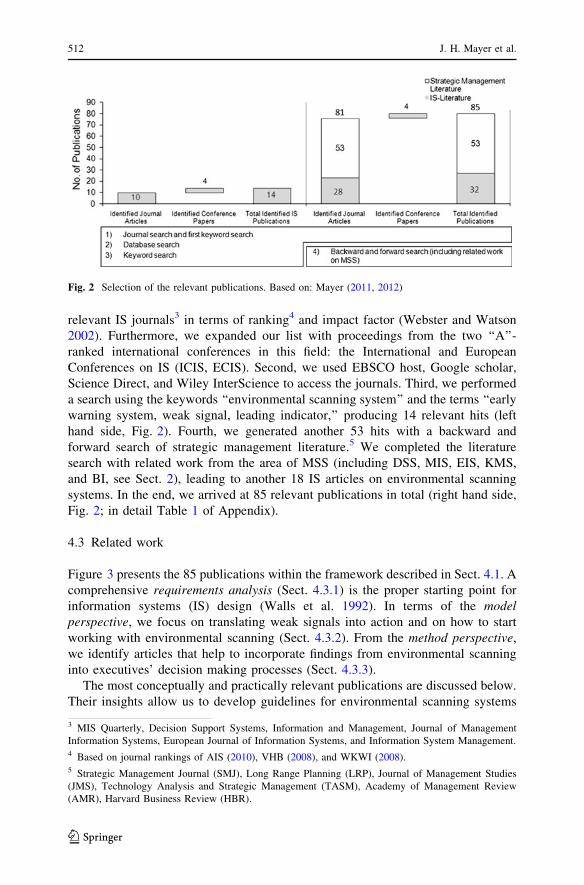
relevant IS journals3 in terms of ranking4 and impact factor (Webster and Watson
2002). Furthermore, we expanded our list with proceedings from the two ‘‘A’’-
ranked international conferences in this field: the International and European
Conferences on IS (ICIS, ECIS). Second, we used EBSCO host, Google scholar,
Science Direct, and Wiley InterScience to access the journals. Third, we performed
a search using the keywords ‘‘environmental scanning system’’ and the terms ‘‘early
warning system, weak signal, leading indicator,’’ producing 14 relevant hits (left
hand side, Fig. 2). Fourth, we generated another 53 hits with a backward and
forward search of strategic management literature.5 We completed the literature
search with related work from the area of MSS (including DSS, MIS, EIS, KMS,
and BI, see Sect. 2), leading to another 18 IS articles on environmental scanning
systems. In the end, we arrived at 85 relevant publications in total (right hand side,
Fig. 2; in detail Table 1 of Appendix).
4.3 Related work
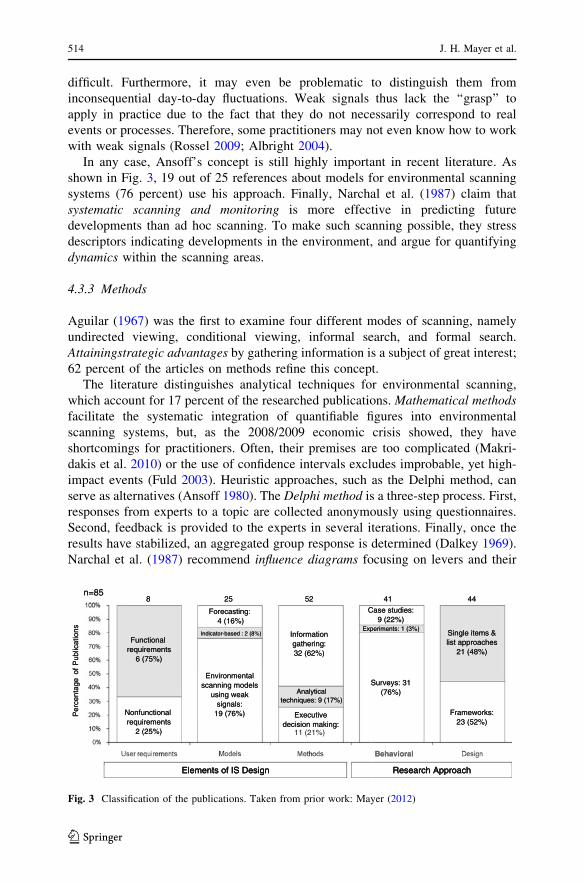
Figure 3 presents the 85 publications within the framework described in Sect. 4.1. A
comprehensive requirements analysis (Sect. 4.3.1) is the proper starting point for
information systems (IS) design (Walls et al. 1992). In terms of the model
perspective, we focus on translating weak signals into action and on how to start
working with environmental scanning (Sect. 4.3.2). From the method perspective,
we identify articles that help to incorporate findings from environmental scanning
into executives’ decision making processes (Sect. 4.3.3).
The most conceptually and practically relevant publications are discussed below.
Their insights allow us to develop guidelines for environmental scanning systems
Fig. 2 Selection of the relevant publications. Based on: Mayer (2011, 2012)
3 MIS Quarterly, Decision Support Systems, Information and Management, Journal of Management
Information Systems, European Journal of Information Systems, and Information System Management.4 Based on journal rankings of AIS (2010), VHB (2008), and WKWI (2008).5 Strategic Management Journal (SMJ), Long Range Planning (LRP), Journal of Management Studies
(JMS), Technology Analysis and Strategic Management (TASM), Academy of Management Review
(AMR), Harvard Business Review (HBR).
512 J. H. Mayer et al.
123

(Sect. 5) that are more applicable than the state of the art (Sect. 7). In doing so, we
focus on the elements of IS design they cover, because this matters more for
developing design guidelines than the way the findings were generated.
4.3.1 User requirements
Just six out of 85 publications focus on functional requirements. Of particular
relevance is Xu et al. (2003). To develop a corporate radar, these authors conducted
a cross-industry study and found that task-related environmental areas are
perceived to be more important than more distant, general environmental
information. For example, in the computer and electronics industry, the supplier
sector was assessed as a fundamental area for environmental scanning. The
remaining five studies reviewed executives’ functional requirements in terms of
their scanning practices. For example, Yasai-Ardekani and Nystrom (1996)
emphasize a link between scanning areas and strategy. Especially in volatile
industries, environmental scanning should consider the ‘‘periphery’’—a metaphor
describing latent changes due to, e.g., political movements (Day and Schoemaker
2004). As described in Daft et al. (1988), at the minimum this periphery should
cover science, politics, law and justice, and international relationships.
Just two references focus on the non-functional perspective. El Sawy (1985), for
example, deals with executive scanning requirements and suggests that solutions
should cover a limited number of scanning areas and sources.
4.3.2 Models
Of our 85 articles, 25 publications cover models for environmental scanning. Early
warning systems were first mentioned in the late 1960s by Cohen and Zinsbarg
(1967). These key-figure-oriented approaches are based on thresholds that define the
range of tolerance. If a critical value is exceeded, an alert is triggered. Forecasting
advances this technique using time series, not only for plan and actual data, but also
plan and extrapolated as-is data.
Second-generation environmental scanning systems identify latent threats and
opportunities. Such an indicator-based model is described by Davies et al. (2006).
Their Key Risk Indicators (KRI) are standardized indicators that focus on potential
problems, e.g., high staff turnover could signal inadequate performance by Human
Resources. Since random or natural fluctuations occur, the authors recommend
reference values and ranges of tolerance to avoid overreactions.
After companies failed to act proactively on the oil crisis, Ansoff (1975)
introduced the concept of strategic surprises and weak signals. The spread of carbon
fiber offers an example. Use of this material has increased steadily in recent years,
and its potential to serve as a substitute for steel represents a strategic issue for
steelmakers. If not monitored, this situation could create serious difficulties in
adopting production capacity to changes in the environment. In the 1990s,
Rockfellow (1994) identified the passage of ‘‘green taxes’’ which could have been
an indicator of an imminent no-carbon economy. As the latter example illustrates,
weak signals can turn out to be overvalued. Generally, their implications may be
More applicable environmental scanning systems 513
123
difficult. Furthermore, it may even be problematic to distinguish them from
inconsequential day-to-day fluctuations. Weak signals thus lack the ‘‘grasp’’ to
apply in practice due to the fact that they do not necessarily correspond to real
events or processes. Therefore, some practitioners may not even know how to work
with weak signals (Rossel 2009; Albright 2004).
In any case, Ansoff’s concept is still highly important in recent literature. As
shown in Fig. 3, 19 out of 25 references about models for environmental scanning
systems (76 percent) use his approach. Finally, Narchal et al. (1987) claim that
systematic scanning and monitoring is more effective in predicting future
developments than ad hoc scanning. To make such scanning possible, they stress
descriptors indicating developments in the environment, and argue for quantifying
dynamics within the scanning areas.
4.3.3 Methods
Aguilar (1967) was the first to examine four different modes of scanning, namely
undirected viewing, conditional viewing, informal search, and formal search.
Attainingstrategic advantages by gathering information is a subject of great interest;
62 percent of the articles on methods refine this concept.
The literature distinguishes analytical techniques for environmental scanning,
which account for 17 percent of the researched publications. Mathematical methods
facilitate the systematic integration of quantifiable figures into environmental
scanning systems, but, as the 2008/2009 economic crisis showed, they have
shortcomings for practitioners. Often, their premises are too complicated (Makri-
dakis et al. 2010) or the use of confidence intervals excludes improbable, yet high-
impact events (Fuld 2003). Heuristic approaches, such as the Delphi method, can
serve as alternatives (Ansoff 1980). The Delphi method is a three-step process. First,
responses from experts to a topic are collected anonymously using questionnaires.
Second, feedback is provided to the experts in several iterations. Finally, once the
results have stabilized, an aggregated group response is determined (Dalkey 1969).
Narchal et al. (1987) recommend influence diagrams focusing on levers and their
Executive decision making:
Environmental scanning models
using weak signals:
19 (76%)Nonfunctional requirements
2 (25%)
Forecasting: 4 (16%)
Indicator-based : 2 (8%) Informationgathering: 32 (62%)
Analytical techniques: 9 (17%)
Functional requirements
6 (75%)
Experiments: 1 (3%)
Case studies: 9 (22%)
Single items &list approaches
21 (48%)
Frameworks: 23 (52%)
Surveys: 31 (76%)
8 25 52 41 44n=85
Per
cent
age
of P
ublic
atio
ns
Elements of IS Design Research Approach
Behavioral
Executive decision making:
11 (21%)
Environmental scanning models
using weak signals:
19 (76%)Nonfunctional requirements
2 (25%)
Forecasting: 4 (16%)
Indicator-based : 2 (8%) Informationgathering: 32 (62%)
Analytical techniques: 9 (17%)
Functional requirements
6 (75%)
Experiments: 1 (3%)
Case studies: 9 (22%)
Single items &list approaches
21 (48%)
Frameworks: 23 (52%)
Surveys: 31 (76%)
8 25 52 41 44n=85
Per
cent
age
of P
ublic
atio
ns
Elements of IS Design Research ApproachElements of IS Design Research Approach
Behavioral
Fig. 3 Classification of the publications. Taken from prior work: Mayer (2012)
514 J. H. Mayer et al.
123

impact on environmental indicators. In order to model dependencies between
separate items, cross-impact matrices evolved (Fontela 1976). Some researchers
also argue that such matrices can contribute to finding the most probable future
scenario.
One-dimensional performance measurement systems often do not meet a
company’s complete information needs. More importantly, Fuld (2003) showed
that companies often fail to act on information generated by environmental
scanning, either by measuring the impact of identified opportunities and threats on
(financial) performance indicators or incorporating the results of environmental
scanning systems in executives’ decision making processes per se. Frolick et al.
(1997) argue for embedding EIS into the environmental scanning process at
different stages: when identifying issues, establishing the means of scanning,
delineating sources of external information, and making decisions. Finally, EIS can
help to incorporate anticipated changes into planning and reporting.
Value at risk (VaR) is a common indicator for monitoring market risks (Young
et al. 2011). However, Makridakis and Taleb (2009) argue against the application of
mathematical methods, because even though these methods’ assumptions, such as
Gaussian distributions, may fit historical data, such models are not suitable for
predicting events with unknown probability and impact. Furthermore, users often do
not understand limitations and blindly follow their recommendations. Taleb et al.
(2009) criticize these models because even small errors in the assumptions can be
devastating. In particular, over-reliance on measures such as VaR to assess risk
contributed to the financial crisis (Kim et al. 2011). Furthermore, different
assumptions about return distributions and historical time periods can produce
different values for VaR (Hull 2010), since any measure of VaR is a function of the
time period over which the historical data is collected. Nocera (2009) argues that
VaR could be a useful indicator for corporate management, but only if combined
with judgement. For example, managers that performed well during the 2008/2009
crisis monitored the VaR numbers of their mortgage-backed securities and other risk
models, but also relied on their ‘‘experience and gut feeling’’ when deciding to get
rid of the securities before the market collapsed (Nocera 2009).
4.3.4 IS support for environmental scanning
Gleißner and Fuser (2000) propose artificial neural networks to support information
gathering. These networks are not limited by psychological barriers, can deal with
many different variables simultaneously, and are robust. Although widely used for
fraud detection (Ngai et al. 2011), they are not common in environmental scanning.
However, Qi (2001) predicts recessions with leading indicators via neural network
models.
Recent developments in the World Wide Web, namely Web 2.0 and social
networking, provide useful information on customers and competitors that can be
gathered for environmental scanning. For example, customers who evaluate goods
they have purchased could offer useful information on product quality and future
offers (Chen et al. 2011). However, such analyses can only be performed for time
More applicable environmental scanning systems 515
123

sequences (Zhou et al. 2011), based on analysis of the ‘‘right’’ subset with the
highest impact (Nohuddin et al. 2012).
Besides the Internet, capital markets provide information on customers,
suppliers, competitors, and economic development (Plambeck and Weber 2010).
Because they are influenced by demand and supply, share prices can indicate
perspectives on growth rates or net sales, and, if aggregated, for a complete sector or
economy.
Understanding BI in a broader sense, Goul and Corral (2007) call for data
warehouses (DWH) to better include information about external issues, such as
competitors or regulations, and to make measuring strategic advantages possible.
Lonnqvist and Pirttimaki (2006) perform a literature review to evaluate methods for
determining the value of BI within the organization, such as measuring user
satisfaction. Finally, in light of the approaching information overload, Cecchini
et al. (2010) propose semantic search as way to predict upcoming events.
4.4 Synthesis
The literature systematization in Sect. 4.3 reveals three major gaps to overcome in
order to make environmental scanning systems more applicable. (1) User
requirements: lack of sound requirements analysis. Just six out of 80 publications
focus on functional requirements, and an even smaller number—two—on non-
functional requirements. As a comprehensive requirements analysis is the proper
starting point for IS design (Walls et al. 1992) and just eight of 85 researched
references focus on such an analysis, we define this issue as a first gap in current
environmental scanning system design. Following the homo oeconomicus theory
(footnote 1) and the bounded rationality concept—taking account of human
limitations in memory and processing capabilities (Simon 1959; Besnard et al.
2004)—we believe the best way to tackle the increasingly volatile environment is to
reason with cause-effect chains based on a framework consisting of the most
important scanning areas (Rohrbeck 2011). In other words, it is possible to collect a
series of indicators that reveal threats and opportunities and thus allow proactive
corporate management.
(2) Models: because the ‘‘grasp’’ of their implications is insufficient, weak
signals cannot be applied in practice. The weak signals approach still is the most
widespread way to find indicators for proactive decision making (Fig. 3). However,
it is often difficult to determine which changes in an organization’s environment are
weak signals of significant turbulence and to distinguish them from inconsequential
day-to-day fluctuations. We therefore employ this concept, while aiming to improve
their ‘‘grasp’’ by deriving criteria to determine the relevance of weak signals
(Fig. 7). Thereby, we will contribute to a more effective differentiation between
weak signals and ordinary deviations.
(3) Methods: approaches are needed to more closely incorporate environmental
scanning results into executive decision making. While 32 references cover
information gathering, just eleven out of 85 publications focus on how to integrate
scanning results into executive decision making processes. We define this issue as a
third and final gap, because environmental scanning is useless as long as its findings
516 J. H. Mayer et al.
123
are not integrated into executives’ decision-making processes. Our research
uncovered two interrelated issues. First, only a few references argue for such
integration and show how to accomplish it (Frolick et al. 1997). Second, managers
are not used to work with mathematical models such as VaR in their day-today work
(Sect. 4.3.3). We are looking towards a hybrid approach complementing
mathematical models with gut feeling and experience of experts.
5 Design guidelines
To perform a sound requirements analysis, we propose 360-degree environmental
scanning systems for executives and suggest how to select the most important
scanning areas (Sect. 5.1). Then, in a hybrid approach, we complement a
mathematical model with a heuristic method to build scenarios on environmental
development and better ‘‘grasp’’ the implications of weak signals (Sects. 5.2–5.4).
To better integrate scanning results into executives’ decision-making processes, we
propose more applicable IS support (Sects. 5.5, 5.6). We start with ideas for a
corporate radar from Narchal et al. (1987) and Wurl and Mayer (2012).
5.1 Take a 360-degree approach, but select only the most important scanning
areas to maintain focus
In light of the environment’s increasing diversity and complexity, we recommend
starting with the widespread conceptual design of Xu et al. (2003) and prioritizing
environmental areas that have the greatest impact on the company (Sect. 4.4).
Environmental scanning for executives should provide a 360-degree framework
(Fig. 4) that reflects the company’s vision and strategic program (internal
perspective, Yasai-Ardekani and Nystrom 1996). Following Ontrup et al. (2009),
it is important to concentrate on the most relevant topics. In the industrial sector, for
example, the value chain along procurement, production, and sales can serve as a
starting point for selecting the ‘‘right’’ scanning areas (Day and Schoemaker 2005).
Following El Sawy (1985), we recommend capital supply, research and develop-
ment, and human resources as supporting areas to be scanned as well, since they
generate indicators such as employee satisfaction or the innovation rate (the number
of new products based on new technologies as a share of all products, Ansoff 1980).
The external environment comprises the task environment,6 sectors that directly
interact with the company such as customers, suppliers, and competitors, and the
general environment, which affects companies more indirectly and on a long-term
basis (Yasai-Ardekani and Nystrom 1996). In the PESTL scheme (Daft et al. 1988),
peripheral areas for environmental scanning include changes in social or political
behavior, shifts in legal and compliance issues or the economy, and the emergence
of new technology.
This first activity of setting up a corporate radar requires no IS support. But the
more volatile the company’s environment becomes (Chang et al. 2006)—i.e., as
6 A more complex model is presented in Porter (1985).
More applicable environmental scanning systems 517
123

customers change their behavior more often, competitors launch new products faster
or leverage new production technologies more often (Fig. 4)—the more we
recommend collaboration technologies to share information from the most
important scanning areas, both inside a company and among the partners in the
company’s network. Tele-, video-, and web-conferencing, electronic meeting
systems, or other web-based tools (Bajwa et al. 2008) can speed up information-
gathering about the latest trends and become increasingly important as partners
become more dispersed (Volberda et al. 2010; Malhorta et al. 2005).
5.2 Define concrete indicators and use IS to proactively identify relevant cause-
effect chains
Once they have determined the scanning areas, companies should monitor them to
anticipate future discontinuities. Within our strategic perspective on environmental
scanning (Sect. 2), extrapolating past data is a suitable forecasting method for the short
run (Ansoff 1975) as long as no discontinuities occur. As the monitoring method, we
adopt the idea by Davies et al. (2006), defining indicators as measures of how risky or
promising an activity is, and thus, its potential for future adverse or beneficial impact.
Thus, indicators are not only quantitative measures, such as the number of customer
complaints, but also vaguer information, such as tendencies in political decision making.
Two levers make it possible to better ‘‘grasp’’ the implications of the indicators
used. First, we propose looking at the lead time, clarity, and cost/impact ratio of
potential indicators to identify tangible indicators from the bulk of data available
(Davies et al. 2006; Narchal et al. 1987).7 Ontrup et al. (2009) propose using
Capital Supply
Research & Development
Human Ressources
Procurement
Production
Sales
Internal Environment: visionand strategicprogram
TaskEnvironment
sremotsuCsreilppuS
Overall issues
Competitors
General Environment
Political/ legal (com-pliance)
Technological
Social(sustaina-bility)
Capital Supply
Research & Development
Human Ressources
Procurement
Production
Sales
Internal Environment: vision and strategic program
Task Environment
sremotsuCsreilppuS
Overall issues
Competitors
General Environment
Economic – including capital markets
Political/ legal (com-pliance)
Technological
Social(sustaina-bility)
Fig. 4 Scanning areas for reworked environmental scanning systems (example for the industrial sector).Following Xu et al. (2003), scanning sectors can be diversified according to company characteristics andare selected here as a starting point
7 Many indicators already exist, i.e. for the economic situation, but often they are not reviewed. For
example, if sales is a scanning area, composite indicators for each country provided by the Organisation
for Economic Cooperation and Development (OECD) can indicate turnover.
518 J. H. Mayer et al.
123

self-organizing maps to assess the relevance of scanning topics, their most important
indicators, and associated cause-effect chains.
The second lever to improve the ‘‘grasp’’ of indicators’ implications is using IS to
overcome barriers that prevent people from identifying and processing indicators (Hand
2009). Mental models are useful because assumptions and beliefs they hold enable us to
make inferences and predictions even under low levels of predictability (Niu et al. 2008).
However, these models result from individual’s past experiences. As a result, adopting
such perspectives when making a decision can be biased (Rossel 2009).8 A thinking
module for creative processes could enlarge mental models and provide past experiences
from different perspectives (Niu et al. 2008) and even more important challenge
dominant mental models that may restrict the view of decision makers (Rohrbeck 2011).
Such a module could combine a base of experiences from past decisions with a base of
models to deliver strong cause-effect chains (Sterman 2001).9
To identify indicators, IS can support environmental scanning with data mining
and semantic search (Elofson and Konsynski 1999). Data mining entails database
management, data preprocessing, model and inference considerations, ‘‘interesting-
ness’’ metrics, complexity considerations, post-processing of found structures,
visualization, and online updating (ACM SIGKDD 2012). As a prerequisite for
effective data mining in environmental scanning, internal and external information
is typically integrated into a corporate data warehousing architecture (March and
Hevner 2007). Furthermore, IS researchers should focus on techniques to extract
non-trivial, previously unknown, and potentially useful patterns. Most currently,
keyword text search has been used to scan for future events (Cecchini et al. 2010).
Following Qi (2001), we also propose using neural networks to generate signals
of economic recession and expansion. Neural networks are mathematical or
computational models used to show complex relationships between input and output
or find patterns in data. IS-based Bayesian causal maps provide a framework for
representing the causal knowledge of experts in terms of the uncertainty of variables
in the map, as well as the effect of variables that the map does not include
(Nadkarnia and Shenoy 2004).
Following Narchal et al. (1987) to select just the most important indicators for
each scanning area, we propose using a cost/benefit matrix (Mayer 1999) that groups
the indicators in terms of how experts assess their value in representing a company’s
success and the cost of gathering the information they require. Environmental
scanning systems should incorporate A information, which is highly indicative of
company success and costs little to gather. B information, which is highly
representative of company success but entails high costs to gather, should be
considered on a case-by-case basis. C information, which offers little benefit for
understanding company success yet is expensive to gather, should typically not
taken into account.
8 For example, forecasts tend to be anchored in plans and scenarios for success rather than on past
company results, and thus might be considered too optimistic (Kahneman and Lovallo 1993).9 Cause-effect chains provide an image of reality. They do not describe reality in every detail, however,
they can offer guidance on how a company’s world functions and what interlinkages need to be managed.
Following system dynamics theory, cause-effect chains do not anticipate every side effect. Feedback
loops are needed for a continuous learning process (Forrester 1977).
More applicable environmental scanning systems 519
123

5.3 Leverage IS to automate day-to-day routines and to follow indicators’
movements
The third step involves determining sources for the indicators, as well as how often they
should be collected. A trade-off is necessary between the cost of data collection (e.g.,
license fees, additional employees) and the indicator’s ability to signal opportunities
and threats. As data sources, we emphasize the Internet (Day and Schoemaker 2005)
and capital markets (Plambeck and Weber 2010, in detail Sect. 4.3), as both can provide
useful, condensed information on competitors, suppliers, and customers at a good cost/
benefit ratio.
For automating day-to-day routines, news monitoring systems and scanners are
useful (Ma et al. 2009). For example, Wei and Lee (2004) have developed a
technique for detecting events based on information extraction and proven its
effectiveness in an empirical evaluation.
The vector space model offers a suitable method for scanning the World Wide Web
(Aasheim and Koehler 2006). It converts text-based information into numerical vectors
that are then used for discriminant analysis. For example, it is possible to scan articles
and determine whether stock returns will probably increase or decrease. Furthermore,
to avoid information overload filtering and synthesizing information is becoming more
important. We propose leveraging artificial intelligence techniques to explore the
impact of the most significant indicator movements on the cause-effect chains in
question (Sect. 5.2). Supporting predefined, simple interfaces for accessing data or
common IS languages such as XBRL (eXtensible Business Reporting Language) make
it easy for automated routines to access these information sources and, if possible,
systematically monitor the movements of indicators (XBRL International 2012).
5.4 Use an impact matrix to translate indicator outcomes into a balanced
opportunity-and-threat portfolio
Once indicators and their data sources have been defined, it is necessary to model their
impact on company performance. Following Taleb’s and Makridakis’ criticism of
mathematical models (Taleb et al. 2009),10 we argue for not relying on these models
exclusively. In line with Nocera (2009), we propose complementing mathematical
models with experts’ experience and gut feeling, e.g., by using a heuristic approach
such as the Delphi method described in Sect. 4.3.3. Two arguments support this hybrid
approach. First, some indicators comprise qualitative information, which requires
transformation before it can be used in quantitative analyses. Second, instilling a
company’s employees with a basic understanding of opportunities and threats and their
implications for company performance is as important as exact statistical calculations.
In the Delphi method, experts first qualify the impact of various indicators on
assumptions used in strategic planning. For rating purposes, we propose that the
experts use a scale of -2 (strongly negative) to 2 (strongly positive) as correlation
10 Taleb’s ‘‘The Black Swan: The impact of the highly improbable’’ (2010) has been strongly criticized.
For example, Aldous (2011) argued that ‘‘Taleb is sensible in his discussion of financial markets and in
some of his philosophical thought, but tends toward irrelevance or ridiculous exaggeration otherwise.’’
520 J. H. Mayer et al.
123

measures. An impact matrix can be used to summarize the findings (Fontela 1976;
Fig. 5). This matrix then goes back to the experts so they can compare their
assessments with the overall results. This process is reiterated until the assessments
converge or remain stable.
The impact matrix should cover the assessment of both the indicators themselves
and their impact on strategic planning assumptions (see Fig. 5). The assessments
appear in the row ‘‘critical’’ and their impact is reflected in the matrix below. The
‘‘sum’’ column measures the overall impact of all the indicators examined on the
critical assumptions. If a particular indicator, such as the number of suppliers,
exceeds or falls below a critical value, it is given a score of ‘‘above’’ or ‘‘below,’’ as
appropriate. The columns ‘‘opportunity alert/threat alert’’ are then calculated based
on the number of positively or negatively assessed indicators compared to the total
number affecting an assumption.11 The opportunity alert is the ratio of all positive
critical indicators times their heuristic correlation measures (1 9 1 for competitive
situation), divided by the total number of indicators with impact (e.g. 4)—for a
result of, e.g., 25 percent. Substantial deviations in the values of single indicators or
in the assumptions are treated as ‘‘breaking news’’ that refute prior assumptions.
Using the portfolio technique, an indicator map then quantifies threats and
opportunities (Fig. 6, left hand side). The x-axis shows the scores for each
indicator’s impact on strategic planning assumptions, while the y-axis shows their
estimated lead time. Indicators are then bundled according to the extent changes to
their value signal opportunities or threats. In order to coordinate the experts’
perspectives, we again propose using collaboration functions (Sect. 5.1). Rajaniemi
(2007) describes an example from patent analysis. IS tools search for new patents,
which are then provided in a common database. Experts receive a notification when
a patent is registered and can provide an assessment of its relevance and impact.
Bundling indicators reveals the most important opportunities and threats for the
company (Fig. 6, right hand side). This procedure involves a second Delphi
analysis. To incorporate the findings into the executives’ decision-making process,
we transfer the bundled indicators into a balanced opportunity and threat portfolio.
The indicators, along with their scores and lead times, help to quantify the
likelihood that these important opportunities and threats will occur, as well as their
potential impact (Fontela 1976). Visualizing this information as a portfolio has two
advantages: it is comprehensive in terms of content, but still offers a condensed
presentation of important opportunities and threats for the organization.
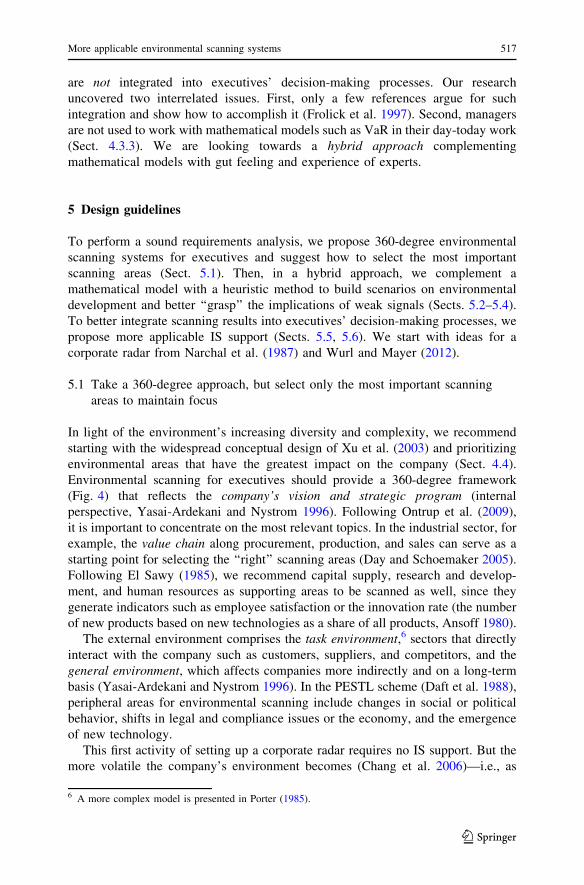
5.5 Generate scenarios to incorporate scanning results into executive decision-
making processes
To ensure that executives receive these findings in an amount and form that
facilitate decision making (Singh et al. 2002, in detail Fig. 7), we propose linking
the opportunities and threats with the company’s approach to management control
11 For example, in Fig. 5 the number of suppliers and the assumption of the competitive situation are
correlated. The number of suppliers is above its critical value. This has a positive impact on the
competitive situation, as the firm’s position in the supplier market improves. Therefore, it is scored with
‘‘1.’’ No negatively correlated indicators are critical. Thus, the threat alert is ‘‘0.’’
More applicable environmental scanning systems 521
123

(Frolick et al. 1997). We liked the idea of aggregating different risks into a single
number (Sect. 4.3.3, Young et al. 2011). In doing so, we go forward with risk-
adjusted KPIs (Linsmeier and Pearson 2000) in our instantiation (Sect. 6) following
a value-driver tree representing economic value added (EVA) at risk on top (Fig. 8).
The balanced opportunity and threat portfolio is the basis for three scenarios:
worst, most probable, and best (Narchal et al. 1987). Unlike statistical VaR models,
however, our approach uses the heuristic Delphi method described in Sect. 5.4,
which involves assessment by various experts. This procedure should be supported
Fig. 5 Impact matrix
Fig. 6 Incorporating the results of environmental scanning into executive decision making with thescenario technique (first instantiation)
AvailibilityCompletenessReliability
ClarityLead timeCost effectiveness
Prior criteria in the selection process based on our literature analysis
Complementing criteria from the case study
1 2
AvailibilityCompletenessReliability
ClarityLead timeCost effectiveness
Prior criteria in the selection process based on our literature analysis
Complementing criteria from the case study
1 2Fig. 7 (Expanded) structure todetermine the relevance ofindicators for environmentalscanning
522 J. H. Mayer et al.
123

by a data warehouse which consolidates decision-relevant information into a single
database (March and Hevner 2007). New business applications and user-friendly
interfaces (‘‘frontend’’) should make it possible to switch between visualizations of
the scenarios (Fig. 8, left). The best and worst case scenarios define the range of the
most important value drivers, such as net sales and costs. Mathematical connections
between them define the (lagging) financial performance indicators EBIT, ROCE
and EVA (Fig. 8, right). The slider is originally set to the position corresponding to
the most probable scenario. All drivers can be moved to the right or to the left to
simulate changes and show their direct impact on the financial KPI of the value-
driver tree, no matter which scenario is selected. Furthermore, ‘‘breaking news’’ and
‘‘turning points’’ that refute prior assumptions can be provided on an ad hoc basis.
5.6 Use retrospective controls to update the is and collaborate to share findings
day to day
The findings from the scenarios can be used to verify assumptions and check
whether the methods used need modification. To monitor the need for new
indicators, it is helpful to check the totals for the absolute values of each line and
column in the impact matrix (Fig. 5). Assumptions linked to only a few indicators
will have to be monitored to a better extent. From the IS perspective, automated
time series analysis can be used to evaluate indicators (Veloce 1996). In particular,
the disappearance of opportunities or threats can trigger changes to the set of
indicators for the next strategic planning and reporting session. In day-to-day work,
collaboration or groupwaretools allows e-mailing and other forms of collaboration
(Salmeron 2002).
Fig. 8 Incorporating the results of environmental scanning systems into interactive scenarios forexecutives’ decision making (screen shot)
More applicable environmental scanning systems 523
123

6 Demonstration
An instantiation at a large, international company in the raw materials and
engineering sector (Europe, sales: USD 56 bn; employees: 174,000) helped us to
evaluate these design guidelines and make our findings more concrete.
During the 2008/2009 economic crisis, both the business side and IT department
recognized that they could better contribute to executives’ decision making about
potential opportunities and threats. A 360-degree environmental scanning system
was required that met two main objectives:
• Enhanced analysis should provide more information on company’s environment,
going beyond standard business parameters to analyze trends that could radically
alter the company’s future.
• For executives, an integration of the scanning findings into corporate reporting
with EVA was mandatory.
6.1 Results
We applied our method from July 2010 to March 2011. The first step was to
delineate areas for environmental scanning (Sect. 5.1). An early lesson learned was
that scanning areas differed more than expected between the company’s strategic
business units (SBU). Not only were there regional differences in terms of content,
but the importance of scanning areas diverged as well.
When we selected the indicators, we added another three aspects to the proposed
evaluation criteria of clarity, lead time, and cost effectiveness (Sect. 5.2). The first
was availability: Indicators that cannot be monitored on time do not help in the
decision making process. Completeness: Opportunities and threats from the
scanning areas should be described without any gaps. Reliability: Indicators that
lead to ‘‘alerts’’ more than once for no reason place the integrity of the whole
environmental scanning system at risk. These additions produce the following
expanded guidelines for determining which indicators are relevant (Fig. 7).
Then, data sources were identified and their update frequency was determined
(Sect. 5.3). The resulting demands on the SBUs were not excessive. Furthermore,
tolerance limits were defined to avoid overreactions (Sect. 5.4). The next lesson
learned was the importance of presenting the results visually. As shown in Fig. 6,
the balanced opportunity-and-threat portfolio quantifies the impact of each indicator
on the most important threats and opportunities facing the company.
To provide executives with the environmental scanning results, we linked the
opportunities and threats in the portfolio with the client’s EVA tree (Sect. 5.5) to
produce the ‘‘worst-case,’’ ‘‘most probable,’’ and ‘‘best-case’’ scenarios (Fig. 8).
The end product, the corporate radar, culminates in an IS-based value-driver tree
showing EVA at risk on top. A SAP BO business application ‘‘dashboard’’ provides
a visualization of EVA at risk.
New IS capabilities can leverage the corporate radar in day-to-day work in a
number of ways (Sect. 5.6). For example, paper-based reports still define how
decisions are made in executive boardrooms. Instead, managers could use the
524 J. H. Mayer et al.
123

system’s user interface to examine EVA at risk, and companies could even turn their
boardrooms into ‘‘management centers’’ with interactive screens to help executives
stay up to date and get the big picture. Second, new end-user devices for mobile
computing can make information available to executives not only at their desks, but
in mobile situations as well. Third, in-memory technology should enable ‘‘drill-
throughs’’ into opportunities and threats via deep dives in transaction systems
(ERP), the most important source systems for generating information.
6.2 Lessons learned from the CIO’s perspective
The instantiation showed that one factor determining the success of such IS design
methods is direct interaction with executives to align their overwhelming business
requirements with existing IS capabilities. Practitioners can better pursue modular
guidelines that focus on tangible ‘‘hands-on’’ outcomes than the hypotheses
provided by structural models, with which they are often unfamiliar.
(1) The design of environmental scanning systems is a top-down business project,
and should be communicated that way. One challenge arising at the beginning of the
project was aligning executives’ individual perspectives with the company’s vision
and strategic program (Sect. 4.1). Our information-needs analysis thus involved
jointly rethinking the company’s strategic program, as well as how indicators can
make an actionable, proactive contribution toward meeting its goals. A range of
forward-looking information was available that needed to be streamlined.
(2) Project managers can establish a role in environmental scanning system
design if they act as mediators between business requirements and IS capabilities.
The most important analyses were useful in achieving a second type of alignment:
one between business requirements and IS capabilities. By connecting the right
parties across the company, the CIO brought in an interdisciplinary business/IT
perspective that makes him the ideal mediator.
(3) Executives must champion the complete IS development process, devoting time
not just to the analysis of their information needs, but to reviewing the prototype as well.
Besides participating in the information-needs analysis, executives must take an active
role in challenging the prototype as well—an area in which they are, for the most part,
unfamiliar. They are best served by providing them with hands-on ‘‘clickable’’
prototypes and then making enhancements step by step.
7 Evaluation
To evaluate our findings, we compared them to relevant contributions of
quantitative research, action research, and other combined approaches from the
body of knowledge. In terms of quantitative research, we relied on the IS success
(Davis 1989) and technology acceptance model (TAM, DeLone and McLean 2003)
in the absence of structural equation models for environmental scanning systems.
Following the objective of this article, we evaluate the approach’s practical
utility, selecting evaluation criteria based on Bischoff et al. (2012) and use a five-
More applicable environmental scanning systems 525
123

step rating scale from ‘‘very bad,’’ to ‘‘very good.’’ The results are shown in Fig. 9
and can be detailed as follows.
7.1 Completeness
Taking a literature analysis as a starting point not only makes it feasible to identify
current design gaps, but to leverage the body of knowledge for future developments.
Thus, combined methods—Calori (1989); Frolick et al. (1997); Narchal et al.
(1987); and the approach presented here (2012)—offer greater compatibility with
the body of knowledge and, thus completeness than action research such as Fink
et al. (2005, ‘‘somewhat’’ evaluation, Fig. 9). Furthermore, the continuous learning
specified in Sect. 5.6 leads to greater completeness. Incorporating publications from
practitioners would further expand the combined methods with insights from day-
to-day operations. Their ‘‘completeness’’ in reflecting the body of knowledge is thus
evaluated as ‘‘good.’’ We consider quantitative research models to be as good as the
combined methods. We base this evaluation on the history of the IS success model
(DeLone and McLean 1992) and TAM (Davis 1989), their refinement over time,
and the fact that alternative versions such as TAM 2 and 3 (Venkatesh and Bala
2008) lead to a multifacted body of knowledge. Furthermore, both approaches have
been applied and evaluated in a number of situations (Venkatesh et al. 2003).
7.2 Distinctiveness
A literature review, which is essential to a combined approach, produces a set of
facts that, in comparison to action research, provides a rich basis for different
very bad bad somewhat good very good
Evaluation criteria
Action research: Fink et al. (2005)
Combined approaches,for example:
Quantitative research: Davis 1989, DeLone & McLean 2003
Calori (1989)
Frolick et al. (1997)
Narchal et al. (1987)
Approach here (2012)
Completeness
Distinctiveness
Bias prevention (intersubjectivity)
Traceability and applicability of the findings (especiallyfor practitioners)
Handling and direct use of findings− Grasp of weak
signals' implications− Incorporating
scanning results into executives' decision-making process
Fig. 9 Combined research methods for environmental scanning systems in between action research andquantitative research
526 J. H. Mayer et al.
123

aspects of distinct design work. We therefore assess the capability of combined
approaches to arrive at distinct design guidelines between ‘‘somewhat’’ and ‘‘good.’’
More specifically: Narchal et al. (1987) propose connecting environmental scanning
systems and strategic planning. Frolick et al. (1997), in turn, aim to leverage cost-
reduction potential by integrating EIS and environmental scanning. The corporate
radar described here can be integrated into a BI architecture and requires standard
software only. Furthermore, a rigorous framework to structure the literature review
(Fig. 1) aids orientation. For these reasons, our approach receives a ‘‘good’’
evaluation. Only structural equation models using statistical approaches produce
more distinct findings and, thus, are rated ‘‘very good.’’ Because action research
employs individual case examples, its findings are typically not very distinct (‘‘bad’’
evaluation).
7.3 Bias prevention (intersubjectivity)
Because they typically test hypotheses with a broad sample, qualitative research
methods are both rigorous and intersubjective. Thus, we evaluate them as ‘‘good’’ at
preventing bias. Combined approaches offer more rigorous environmental scanning
system design than action research does (Fig. 9). Compared to structural equation
models, however, the approach described here involves some subjectivity—as a
consequence of not using broad samples to generate findings. We evaluate
combined research methods as ‘‘somewhat’’ capable of preventing bias. Even if well
conducted, documented, and reported, action research is most often driven by single
issues regarding a companies’ objectives and usually fails to generalize the case
results (‘‘bad’’).
7.4 Traceability and applicability of the findings (especially for practitioners)
Combining results from a literature research with ‘‘build and evaluate’’ activities
provides rigor without losing the DSR objective of building new artifacts.
Furthermore, the lessons learned from the case example (Sect. 6.2) show that
practitioners can better pursue modular guidelines than the hypotheses generated by
structural models. Thus, the former are evaluated as ‘‘good,’’ while the latter receive
a rating of ‘‘somewhat.’’ Practitioners are not used to handling complex structural
models and, thus, from their perspective, the findings of such models often remain
questionable and theoretical. Action research, in turn, typically focuses on a single
company only. The findings are thus often easy to follow, but because general
findings may be missing, the results are often not directly applicable to or even
incompatible with other companies’ situations. We therefore evaluate their
traceability and applicability as ‘‘somewhat.’’ Other combined research methods
do not evaluate their findings in such a straightforward way. Using an example from
the solar industry, Calori (1989) introduces the topic, but does not explain how he
derives his method (‘‘somewhat’’). Narchal et al. (1987) use weak signals without
explaining their nature (‘‘somewhat’’). Only Frolick et al. (1997) give concrete
examples of how to integrate environmental scanning systems into EIS (‘‘good’’).
More applicable environmental scanning systems 527
123

7.5 Handling and direct use of findings
Here, action research is evaluated as ‘‘good’’ because it provides recommendations from
a practitioner perspective. The guidelines developed in combined approaches should be
easier to directly work with than hypotheses generated by structural equation models
(‘‘bad’’). For example, guidelines can be applied one by one to not only specify how IS
should be reworked, but to evaluate existing IS. Fink et al. (2005) earn a ‘‘good’’
evaluation by proposing the ‘‘future’’ scorecard, a reporting tool enhancing balanced
scorecards with forward-looking information. This approach ensures that environmental
scanning results are integrated into group reporting, just as they are in the corporate radar
with its balanced opportunity-and-threat portfolio (Sect. 5.5) and depiction of EVA at risk
(Fig. 8). To inform executives about the external environment and future developments,
Frolick et al. (1997) combine environmental scanning with EIS, but they leave the EIS
black-boxed (‘‘somewhat’’). Calori (1989) is the only that quantifies costs for scanning
systems, assuming 60 man days, and Narchal et al. (1987) set up organizational units
within the company. While they aggregate their results, they do not make it possible to
present them. Both approaches therefore receive a score of ‘‘somewhat’’ for this area.
7.6 Overall classification
Action research has the practitioner vote, thanks to the applicable information it
produces on single cases if it is well conducted, documented, and reported. However,
we assessed such approaches negatively in terms of their overall completeness,
traceability, and applicability. Combined approaches offer greater rigor than action
research (Fig. 9), but the guidelines they produce are more subjective than structural
equation models. Overall, we classify the quantitative methods as good research
methods for environmental scanning systems design. However, their application faces
obstacles, and combined approaches offer a solution that balances these extremes.
Over the last 20 years, the ‘‘business scanning systems’’ proposed by Calori (1989)
and Narchal et al. (1987) have not achieved acceptance. One problem with the latter
might have been the difficulty in focusing only on weak signals. In any case, no further
integration of EIS into environmental scanning systems has occurred in practice. In
contrast, the approach here, while initially based on ideas from Narchal et al. (1987),
arrived at six guidelines for leveraging IS to create environmental scanning systems
that are more applicable than the state of the art. Using this business-to-IT approach, the
company implementing our prototype achieved a more fact-driven decision-making
process while gaining time for proactive corporate management.
8 Outlook and future research
Much work has been done on environmental scanning systems since Aguilar (1967)
and Ansoff (1975). Focusing on how ‘‘modern’’ IS can contribute to environmental
scanning, this article specified several ways to redesign environmental scanning
systems. We examined three gaps identified in our literature research and developed
six design guidelines to address them.
528 J. H. Mayer et al.
123

Addressing the lack of a sound requirements analysis (1), our first design guideline
proposes 360-degree environmental scanning systems for executives and presents how
to select the most important scanning areas. Three further guidelines cover the IS model
perspective (2), focusing on getting a better ‘‘grasp’’ of the implications of weak signals
by a hybrid approach: define concrete indicators and use IS to identify relevant cause-
effect chains; leverage IS to automate day-to-day routines and monitor the variety of
indicators’ movements; and leverage expert experience with an impact matrix,
translating the results into a balanced opportunity-and-threat portfolio. In terms of
methods (3), we propose to more closely incorporate scanning results into executives’
decision-making process by generating scenarios from a set of environmental
assumptions, using retrospective controls to continuously update the environmental
scanning system and collaborating to share the scanning findings day to day.
Applying the design guidelines at a raw materials and engineering company, we
arrived at a prototype we call the ‘‘corporate radar.’’ Capabilities to simulate scenarios
and their impact on the most important financial KPIs complete the results.
For practitioners this article offers concrete advice to improve their existing
environmental scanning systems or even a starting point to set up such IS. As Ansoff
(1980) shows, companies that do so have brighter prospects than those that do not.
Researchers receive a comprehensive overview about the body of knowledge, as
well as three major gaps to overcome in order to make environmental scanning
systems more applicable. Furthermore, our design guidelines provide a literature-
based starting point for future discussion.
Our research opens several avenues for future work. The literature review should
be expanded with practitioner publications to illustrate additional environmental
scanning systems and identify issues in day-to-day business. However, this should
be a secondary issue. More urgently, additional cases are needed to determine the
generalizability of our findings. Furthermore, a survey could provide direct insights
about executives’ perspectives on requirements for environmental scanning
systems. Also, a behaviorally motivated paper should follow to test our findings.
From the content perspective, future research should identify ways to better handle
strategic surprises. One approach could be to incorporate more forward-looking
expert focus groups in the information gathering process.
Finally, if the researched body of knowledge seems more like wishful thinking
than a sound basis for applicable design guidelines, it would be interesting to define
a set of evaluation criteria, choose four or five successful implementations, evaluate
them, ascertain what they have in common, and compare these findings with the
design guidelines presented here.
These shortcomings and the subjectivity inherent in our evaluation (Sect. 7) mean
that, so far, it is not possible to determine for sure whether our guidelines lead to
more applicable environmental scanning systems. However, the guidelines provide
practical starting points for future research.
Appendix
See Table 1.
More applicable environmental scanning systems 529
123

Ta
ble
1F
ull
list
of
rese
arch
edar
ticl
es
No
.A
uth
or(
s)Y
ears
Tit
leP
ub
lica
tio
nE
lem
ents
of
ISd
esig
nR
esea
rch
app
roac
h
1A
ash
eim
,C
.an
dK
oeh
ler,
G.
J.2
00
6S
can
nin
gth
eW
orl
dW
ide
Web
do
cum
ents
wit
hth
ev
ecto
rsp
ace
mo
del
Dec
isio
nS
up
po
rtS
yst
ems
Info
rmat
ion
gat
her
ing
Cas
est
ud
y
2A
gu
ilar
,F
.1
96
7S
can
nin
gth
eb
usi
nes
sen
vir
on
men
tM
acm
ilia
nIn
form
atio
ng
ath
erin
gS
urv
ey
3A
hit
uv
,N
.et
al.
19
98
En
vir
on
men
tal
scan
nin
gan
din
form
atio
nsy
stem
sin
rela
tio
nto
succ
ess
inin
tro
du
cin
gn
ewp
rod
uct
sIn
form
atio
n&
Man
agem
ent
Info
rmat
ion
gat
her
ing
Su
rvey
4A
lbri
gh
t,K
.2
00
4E
nv
iro
nm
enta
lsc
ann
ing
:ra
dar
for
succ
ess
Th
eIn
form
atio
nM
anag
emen
tJo
urn
alIn
form
atio
ng
ath
erin
gS
ing
le/l
ist
app
roac
hes
5A
nd
erso
n,
M.
H.
and
Nic
ho
ls,
M.
L.
20
07
Info
rmat
ion
gat
her
ing
and
chan
ges
inth
reat
and
op
po
rtu
nit
yp
erce
pti
on
sJo
urn
alo
fM
anag
emen
tS
tud
ies
Info
rmat
ion
gat
her
ing
Ex
per
imen
t
6A
nso
ff,
H.
I.1
97
5M
anag
ing
stra
teg
icsu
rpri
seb
yre
spo
nse
tow
eak
sig
nal
sC
alif
orn
iaM
anag
emen
tR
evie
w3
rdg
ener
atio
nIS
Fra
mew
ork
7A
nso
ff,
H.
I.1
98
0S
trat
egic
issu
em
anag
emen
tS
trat
egic
Man
agem
ent
Jou
rnal
3rd
gen
erat
ion
ISF
ram
ewo
rk
8A
rno
tt,
D.
and
Per
van
,G
.2
00
8E
igh
tk
eyis
sues
for
the
dec
isio
nsu
pp
ort
syst
ems
dis
cip
lin
eD
ecis
ion
Su
pp
ort
Sy
stem
sIn
form
atio
ng
ath
erin
gS
ing
le/l
ist
app
roac
hes
9B
oy
d,
B.
and
Fu
lk,
J.1
99
6E
xec
uti
ve
scan
nin
gan
dp
erce
ived
un
cert
ain
ty:
am
ult
idim
ensi
on
alm
od
elJo
urn
alo
fM
anag
emen
tIn
form
atio
ng
ath
erin
gS
urv
ey
10
Cal
ori
,R
.1
98
9D
esig
nin
ga
bu
sin
ess
scan
nin
gsy
stem
Lo
ng
Ran
ge
Pla
nn
ing
3rd
gen
erat
ion
ISF
ram
ewo
rk
11
Ch
en,
H.
etal
.2
01
1E
nte
rpri
seri
skan
dse
curi
tym
anag
emen
t:d
ata,
tex
tan
dw
ebm
inin
gD
ecis
ion
Su
pp
ort
Sy
stem
sIn
form
atio
ng
ath
erin
gS
ing
le/l
ist
app
roac
hes
12
Ch
o,
T.
20
06
Th
eef
fect
so
fex
ecu
tiv
etu
rno
ver
on
top
man
agem
ent
team
s:en
vir
on
men
tal
scan
nin
gb
ehav
iou
raf
ter
anen
vir
on
men
tal
chan
ge
Jou
rnal
of
Bu
sin
ess
Res
earc
hIn
form
atio
ng
ath
erin
gS
urv
ey
13
Ch
oo
,C
.W
.1
99
9T
he
art
of
scan
nin
gth
een
vir
on
men
tB
ull
etin
of
the
Am
eric
anS
oci
ety
for
Info
rmat
ion
Sci
ence
Info
rmat
ion
gat
her
ing
Fra
mew
ork
530 J. H. Mayer et al.
123

Ta
ble
1co
nti
nu
ed
No
.A
uth
or(
s)Y
ears
Tit
leP
ub
lica
tio
nE
lem
ents
of
ISd
esig
nR
esea
rch
app
roac
h
14
Ch
oo
,C
.W
.2
00
1T
he
kn
ow
ing
org
aniz
atio
nas
lear
nin
go
rgan
izat
ion
Ed
uca
tio
n?
Tra
inin
g3
rdg
ener
atio
nIS
Fra
mew
ork
15
Co
hen
,J.
B.
and
Zin
sbar
g,
E.
D.
19
67
Inv
estm
ent
anal
ysi
san
dp
ort
foli
om
anag
emen
tH
om
ewo
od
1st
gen
erat
ion
ISS
ing
le/l
ist
app
roac
hes
16
Daf
t,R
.an
dW
eick
,K
.1
98
4T
ow
ard
am
od
elo
fo
rgan
izat
ion
sas
inte
rpre
tati
on
syst
ems
Aca
dem
yo
fM
anag
emen
tR
evie
wIn
form
atio
ng
ath
erin
gF
ram
ewo
rk
17
Daf
t,R
.L.
etal
.1
98
8C
hie
fex
ecu
tiv
esc
ann
ing
,en
vir
on
men
tal
char
acte
rist
ics
and
com
pan
yp
erfo
rman
ce:
anem
pir
ical
stu
dy
Str
ateg
icM
anag
emen
tJo
urn
alF
un
ctio
nal
req
uir
emen
tsS
urv
ey
18
Dah
eim
,C
.an
dU
erz,
G.
20
08
Co
rpo
rate
fore
sig
ht
inE
uro
pe:
fro
mtr
end
bas
edlo
gic
sto
op
enfo
resi
gh
tT
ech
no
log
yA
nal
ysi
s&
Str
ateg
icM
anag
emen
t3
rdg
ener
atio
nIS
Su
rvey
19
Dav
ies,
J.et
al.
20
06
Key
risk
ind
icat
ors
—th
eir
role
ino
per
atio
nal
risk
man
agem
ent
Ris
kB
usi
nes
sIn
tern
atio
nal
Lim
ited
2n
dg
ener
atio
nIS
Fra
mew
ork
20
Day
,G
.S
.an
dS
cho
emak
er,
P.
J.H
.
20
04
Dri
vin
gth
rou
gh
the
fog
:m
anag
ing
atth
eed
ge
Lo
ng
Ran
ge
Pla
nn
ing
Info
rmat
ion
gat
her
ing
Sin
gle
/lis
tap
pro
ach
es
21
Day
,G
.S
.an
dS
cho
emak
er,
P.
J.H
.
20
05
Sca
nn
ing
the
per
iph
ery
Har
var
dB
usi
nes
sR
evie
wF
un
ctio
nal
req
uir
emen
tsS
ing
le/l
ist
app
roac
hes
22
El
Saw
y,
O.
19
85
Per
son
alin
form
atio
nsy
stem
sfo
rst
rate
gic
scan
nin
gin
turb
ule
nt
env
iro
nm
ents
:ca
nth
eC
EO
go
on
lin
e?M
ISQ
uar
terl
yN
on
fun
ctio
nal
req
uir
emen
tsS
urv
ey
23
Elo
fso
n,
G.
and
Ko
nsy
nsk
i,B
.1
99
1D
eleg
atio
nte
chn
olo
gie
s:en
vir
on
men
tal
scan
nin
gw
ith
inte
llig
ent
agen
tsJo
urn
alo
fM
anag
emen
tIn
form
atio
nS
yst
ems
Info
rmat
ion
gat
her
ing
Cas
est
ud
y
24
Elo
fso
n,
G.
and
Ko
nsy
nsk
i,B
.1
99
3P
erfo
rmin
go
rgan
izat
ion
alle
arn
ing
wit
hm
ach
ine
app
ren
tice
sD
ecis
ion
Su
pp
ort
Sy
stem
s3
rdg
ener
atio
nIS
Fra
mew
ork
25
Fin
k,
A.
et.
al.
20
05
Th
efu
ture
sco
reca
rd:
com
bin
ing
exte
rnal
and
inte
rnal
scen
ario
sto
crea
test
rate
gic
fore
sig
ht
Man
agem
ent
Dec
isio
n3
rdg
ener
atio
nIS
Fra
mew
ork
26
Fo
nte
la,
E.
19
76
Ind
ust
rial
app
lica
tio
ns
of
cro
ss-i
mp
act
anal
ysi
sL
on
gR
ang
eP
lan
nin
gA
nal
yti
cal
tech
niq
ues
Sin
gle
/lis
tap
pro
ach
es
More applicable environmental scanning systems 531
123

Ta
ble
1co
nti
nu
ed
No
.A
uth
or(
s)Y
ears
Tit
leP
ub
lica
tio
nE
lem
ents
of
ISd
esig
nR
esea
rch
app
roac
h
27
Fro
lick
,M
.et
al.
19
97
Usi
ng
EIS
sfo
ren
vir
on
men
tal
scan
nin
gIn
form
atio
nS
yst
ems
Man
agem
ent
3rd
gen
erat
ion
ISF
ram
ewo
rk
28
Fu
ld,
L.
20
03
Be
pre
par
edH
arv
ard
Bu
sin
ess
Rev
iew
3rd
gen
erat
ion
ISS
urv
ey
29
Gar
g,
V.
etal
.2
00
0C
hie
fex
ecu
tiv
essc
ann
ing
emp
has
is,
env
iro
nm
enta
ld
yn
amis
man
dm
anu
fact
uri
ng
firm
per
form
ance
Str
ateg
icM
anag
emen
tJo
urn
alIn
form
atio
ng
ath
erin
gS
urv
ey
30
Gel
leE
.an
dK
arh
uK
.2
00
3In
form
atio
nq
ual
ity
for
stra
teg
icte
chn
olo
gy
pla
nn
ing
Ind
ust
rial
Man
agem
ent
and
dat
asy
stem
sIn
form
atio
ng
ath
erin
gC
ase
stu
dy
31
Gla
ssey
,O
.2
00
8E
xp
lori
ng
the
wea
ksi
gn
als
of
star
t-u
ps
asa
folk
son
om
icsy
stem
Tec
hn
olo
gy
An
aly
sis
&S
trat
egic
Man
agem
ent
3rd
gen
erat
ion
ISF
ram
ewo
rk
33
Gle
ißn
er,
W.
and
Fuse
r,K
.2
00
0M
od
ern
eF
ruh
war
n-
un
dP
rog
no
sesy
stem
efu
rU
nte
rneh
men
spla
nu
ng
un
dR
isik
om
anag
emen
tD
erB
etri
ebA
nal
yti
cal
tech
niq
ues
Sin
gle
/lis
tap
pro
ach
es
34
Go
ul,
M.
and
Co
rral
,K
.2
00
7E
nte
rpri
sem
od
elm
anag
emen
tan
dn
ext
gen
erat
ion
dec
isio
nsu
pp
ort
Dec
isio
nS
up
po
rtS
yst
ems
Info
rmat
ion
gat
her
ing
Sin
gle
/lis
tap
pro
ach
es
35
Gra
y,
P.
20
08
Fro
mh
ind
sig
ht
tofo
resi
gh
t:ap
ply
ing
futu
res
rese
arch
tech
niq
ues
inin
form
atio
nsy
stem
sC
om
mu
nic
atio
ns
of
the
Ass
oci
atio
nfo
rIn
form
atio
nS
yst
ems
An
aly
tica
lte
chn
iqu
esS
ing
le/l
ist
app
roac
hes
36
Hah
n,
D.
and
Kry
stek
,U
.1
97
9B
etri
ebli
che
un
du
ber
bet
rieb
lich
eF
ruh
war
nsy
stem
efu
rd
ieIn
du
stri
eZ
eits
chri
ftfu
rb
etri
ebsw
irts
chaf
tlic
he
Fo
rsch
un
g
2n
dg
ener
atio
nIS
Fra
mew
ork
37
Ham
bri
ck,
D.
C.
19
81
Sp
ecia
liza
tio
no
fen
vir
on
men
tal
scan
nin
gac
tiv
itie
sam
on
gu
pp
erle
vel
exec
uti
ves
Jou
rnal
of
Man
agem
ent
Stu
die
sIn
form
atio
ng
ath
erin
gS
urv
ey
38
Han
d,
D.
20
09
Min
ing
the
pas
tto
det
erm
ine
the
futu
reIn
tern
atio
nal
Jou
rnal
of
Fo
reca
stin
gA
nal
yti
cal
tech
niq
ues
Sin
gle
/lis
tap
pro
ach
es
39
Ho
ug
h,
J.an
dW
hit
e,M
.2
00
4S
can
nin
gac
tio
ns
and
env
iro
nm
enta
ld
yn
amis
mM
anag
emen
tD
ecis
ion
Info
rmat
ion
gat
her
ing
Su
rvey
40
Jain
,S
.C
.1
98
4E
nv
iro
nm
enta
lS
can
nin
gin
US
Co
rpo
rati
on
sL
on
gR
ang
eP
lan
nin
gIn
form
atio
ng
ath
erin
gS
urv
ey
532 J. H. Mayer et al.
123

Ta
ble
1co
nti
nu
ed
No
.A
uth
or(
s)Y
ears
Tit
leP
ub
lica
tio
nE
lem
ents
of
ISd
esig
nR
esea
rch
app
roac
h
41
Jou
rdan
,Z
.et
al.
20
08
Bu
sin
ess
inte
llig
ence
:an
anal
ysi
so
fth
eli
tera
ture
Info
rmat
ion
Sy
stem
sM
anag
emen
tIn
form
atio
ng
ath
erin
gS
ing
le/l
ist
app
roac
hes
42
Kry
stek
,U
.1
99
3F
ruh
aufk
laru
ng
fur
Un
tern
ehm
en:
Iden
tifi
kat
ion
un
dH
and
hab
un
gzu
ku
nft
iger
Ch
ance
nu
nd
Bed
roh
un
gen
Sch
afer
-Po
esch
el3
rdg
ener
atio
nIS
Fra
mew
ork
43
Ku
vaa
s,B
.2
00
2A
nex
plo
rati
on
of
two
com
pet
ing
per
spec
tiv
eso
nin
form
atio
nal
con
tex
tsin
top
man
agem
ent
stra
teg
icis
sue
inte
rpre
tati
on
Jou
rnal
of
Man
agem
ent
Stu
die
sE
xec
uti
ve
dec
isio
nm
akin
g
Su
rvey
44
Lau
zen
,M
.1
99
5T
ow
ard
am
od
elo
fen
vir
on
men
tal
scan
nin
gJo
urn
alo
fp
ub
lic
Rel
atio
ns
Res
earc
h3
rdg
ener
atio
nIS
Su
rvey
45
Len
z,R
.an
dE
ng
led
ow
,J.
19
86
En
vir
on
men
tal
anal
ysi
su
nit
san
dst
rate
gic
dec
isio
n-
mak
ing
:a
fiel
dst
ud
yo
fse
lect
edle
adin
ged
ge
com
pan
ies
Str
ateg
icM
anag
emen
tJo
urn
al3
rdg
ener
atio
nIS
Su
rvey
46
Len
z,R
.an
dE
ng
led
ow
,J.
19
86
En
vir
on
men
tal
anal
ysi
s:th
eap
pli
cab
ilit
yo
fcu
rren
tth
eory
Str
ateg
icM
anag
emen
tJo
urn
al3
rdg
ener
atio
nIS
Fra
mew
ork
47
Les
ca,
N.
and
Car
on
-F
aso
n,
M.-
L.
20
08
Str
ateg
icsc
ann
ing
pro
ject
fail
ure
and
aban
do
nm
ent
fact
ors
:le
sso
ns
lear
ned
Eu
rop
ean
Jou
rnal
of
Info
rmat
ion
Sy
stem
sIn
form
atio
ng
ath
erin
gS
urv
ey
48
Liu
,S
.1
99
8D
ata
war
eho
usi
ng
agen
t:in
seek
ing
of
imp
rov
edsu
pp
ort
for
env
iro
nm
enta
lsc
ann
ing
and
stra
teg
icm
anag
emen
tE
CIS
-Pro
ceed
ing
sIn
form
atio
ng
ath
erin
gC
ase
stu
dy
49
Liu
,S
.2
00
0A
gen
tb
ased
env
iro
nm
enta
lsc
ann
ing
syst
em:
imp
acts
on
man
ager
san
dth
eir
stra
teg
icsc
ann
ing
acti
vit
ies
AM
CIS
-Pro
ceed
ing
sIn
form
atio
ng
ath
erin
gC
ase
stu
dy
50
Lo
nn
qv
ist,
A.
and
Pir
ttim
aki,
V.
20
06
Th
em
easu
rem
ent
of
bu
sin
ess
inte
llig
ence
Info
rmat
ion
Sy
stem
sM
anag
emen
tF
un
ctio
nal
req
uir
emen
tsS
ing
le/l
ist
app
roac
hes
51
Mak
rid
akis
,S
.2
01
0W
hy
fore
cast
sfa
il.
wh
atto
do
inst
ead
MIT
Slo
anM
anag
emen
tR
evie
w1
stg
ener
atio
nIS
Sin
gle
/lis
tap
pro
ach
es
52
Mal
ho
rta
A.,
Go
sain
S.,
El
Saw
y,
O.
A.
20
05
Ab
sorp
tiv
eca
pac
ity
con
fig
ura
tio
ns
insu
pp
lych
ain
s:g
eari
ng
for
par
tner
enab
led
mar
ket
kn
ow
led
ge
crea
tio
nM
ISQ
uar
terl
yA
nal
yti
cal
tech
niq
ues
Cas
est
ud
y
53
McM
ull
en,
J.et
al.
20
09
Man
ager
ial
(in
)at
ten
tio
nto
com
pet
itiv
eth
reat
sJo
urn
alo
fM
anag
emen
tS
tud
ies
Ex
ecu
tiv
ed
ecis
ion
mak
ing
Su
rvey
More applicable environmental scanning systems 533
123

Ta
ble
1co
nti
nu
ed
No
.A
uth
or(
s)Y
ears
Tit
leP
ub
lica
tio
nE
lem
ents
of
ISd
esig
nR
esea
rch
app
roac
h
54
Men
on
,A
.an
dT
om
kin
s,A
.2
00
4L
earn
ing
abo
ut
the
mar
ket
sp
erip
her
y:
IBM
’sw
ebfo
un
tain
Lo
ng
Ran
ge
Pla
nn
ing
Info
rmat
ion
gat
her
ing
Cas
est
ud
y
55
Mu
ller
,R
.M
.2
01
0B
usi
nes
sin
tell
igen
cean
dse
rvic
e-o
rien
ted
arch
itec
ture
:a
del
ph
ist
ud
yIn
form
atio
nS
yst
ems
Man
agem
ent
Info
rmat
ion
gat
her
ing
Su
rvey
56
Nan
us,
B.
19
82
QU
ES
T—
qu
ick
env
iro
nm
enta
lsc
ann
ing
tech
niq
ue
Lo
ng
Ran
ge
Pla
nn
ing
Ex
ecu
tiv
ed
ecis
ion
mak
ing
Fra
mew
ork
57
Nar
chal
,R
.M
.et
al.
19
87
An
env
iro
nm
enta
lsc
ann
ing
syst
emfo
rb
usi
nes
sp
lan
nin
gL
on
gR
ang
eP
lan
nin
g3
rdg
ener
atio
nIS
Fra
mew
ork
58
Nas
tan
ski,
M.
20
03
Th
ev
alu
eo
fac
tiv
esc
ann
ing
tose
nio
rex
ecu
tiv
esJo
urn
alo
fM
anag
emen
tD
evel
op
men
tIn
form
atio
ng
ath
erin
gS
urv
ey
59
Nem
ati,
H.
etal
.2
00
0A
mu
lti-
agen
tfr
amew
ork
for
web
bas
edin
form
atio
nre
trie
val
and
filt
erin
gA
MC
IS-P
roce
edin
gs
An
aly
tica
lte
chn
iqu
esS
ing
le/l
ist
app
roac
hes
60
Ng
ai,
E.
W.
T.
etal
.2
01
1T
he
app
lica
tio
no
fd
ata
min
ing
tech
niq
ues
infi
nan
cial
frau
dd
etec
tio
n:
acl
assi
fica
tio
nfr
amew
ork
and
anac
adem
icre
vie
wo
fli
tera
ture
Dec
isio
nS
up
po
rtS
yst
ems
Info
rmat
ion
gat
her
ing
Fra
mew
ork
61
Nic
k,
A.
20
09
Wir
ksa
mk
eit
stra
teg
isch
erF
ruh
erk
enn
un
gG
able
r3
rdg
ener
atio
nIS
Cas
est
ud
y
62
On
tru
p,
J.,
Rit
ter,
H.,
Sch
olz
,S
.W
.,W
agn
er,
R.
20
09
Det
ecti
ng
,as
sess
ing
,an
dm
on
ito
rin
gre
lev
ant
top
ics
inv
irtu
alin
form
atio
nen
vir
on
men
tsIE
EE
Tra
nsa
ctio
ns
on
Kn
ow
led
ge
and
Dat
aE
ng
inee
rin
g
Info
rmat
ion
gat
her
ing
Su
rvey
63
Pla
mb
eck
,N
.an
dW
eber
,K
.2
01
0W
hen
the
gla
ssis
hal
fem
pty
and
hal
ffu
ll:
Ceo
inte
rpre
tati
on
Str
ateg
icM
anag
emen
tJo
urn
alE
xec
uti
ve
dec
isio
nm
akin
g
Su
rvey
64
Pra
hal
ad,
C.
K.
20
04
Th
eb
lin
der
so
fd
om
inan
tlo
gic
Lo
ng
Ran
ge
Pla
nn
ing
Info
rmat
ion
gat
her
ing
Sin
gle
/lis
tap
pro
ach
es
65
Qi,
M.
20
01
Pre
dic
tin
gU
Sre
cess
ion
sw
ith
lead
ing
ind
icat
ors
via
neu
ral
net
wo
rkm
od
els
Inte
rnat
ion
alJo
urn
alo
fF
ore
cast
ing
Ex
ecu
tiv
ed
ecis
ion
mak
ing
Su
rvey
534 J. H. Mayer et al.
123
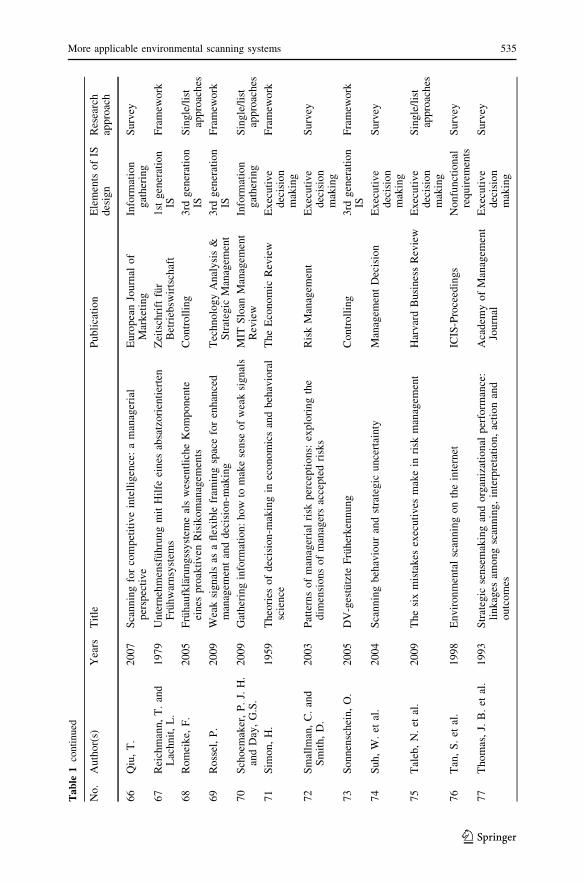
Ta
ble
1co
nti
nu
ed
No
.A
uth
or(
s)Y
ears
Tit
leP
ub
lica
tio
nE
lem
ents
of
ISd
esig
nR
esea
rch
app
roac
h
66
Qiu
,T
.2
00
7S
can
nin
gfo
rco
mp
etit
ive
inte
llig
ence
:a
man
ager
ial
per
spec
tiv
eE
uro
pea
nJo
urn
alo
fM
ark
etin
gIn
form
atio
ng
ath
erin
gS
urv
ey
67
Rei
chm
ann
,T
.an
dL
ach
nit
,L
.1
97
9U
nte
rneh
men
sfu
hru
ng
mit
Hil
feei
nes
absa
tzo
rien
tier
ten
Fru
hw
arn
syst
ems
Zei
tsch
rift
fur
Bet
rieb
swir
tsch
aft
1st
gen
erat
ion
ISF
ram
ewo
rk
68
Ro
mei
ke,
F.
20
05
Fru
hau
fkla
run
gss
yst
eme
als
wes
entl
ich
eK
om
po
nen
teei
nes
pro
akti
ven
Ris
iko
man
agem
ents
Co
ntr
oll
ing
3rd
gen
erat
ion
ISS
ing
le/l
ist
app
roac
hes
69
Ro
ssel
,P
.2
00
9W
eak
sig
nal
sas
afl
exib
lefr
amin
gsp
ace
for
enh
ance
dm
anag
emen
tan
dd
ecis
ion
-mak
ing
Tec
hn
olo
gy
An
aly
sis
&S
trat
egic
Man
agem
ent
3rd
gen
erat
ion
ISF
ram
ewo
rk
70
Sch
oem
aker
,P
.J.
H.
and
Day
,G
.S.
20
09
Gat
her
ing
info
rmat
ion
:h
ow
tom
ake
sen
seo
fw
eak
sig
nal
sM
ITS
loan
Man
agem
ent
Rev
iew
Info
rmat
ion
gat
her
ing
Sin
gle
/lis
tap
pro
ach
es
71
Sim
on
,H
.1
95
9T
heo
ries
of
dec
isio
n-m
akin
gin
eco
no
mic
san
db
ehav
iora
lsc
ien
ceT
he
Eco
no
mic
Rev
iew
Ex
ecu
tiv
ed
ecis
ion
mak
ing
Fra
mew
ork
72
Sm
allm
an,
C.
and
Sm
ith
,D
.2
00
3P
atte
rns
of
man
ager
ial
risk
per
cep
tio
ns:
exp
lori
ng
the
dim
ensi
on
so
fm
anag
ers
acce
pte
dri
sks
Ris
kM
anag
emen
tE
xec
uti
ve
dec
isio
nm
akin
g
Su
rvey
73
So
nn
ensc
hei
n,
O.
20
05
DV
-ges
tutz
teF
ruh
erk
enn
un
gC
on
tro
llin
g3
rdg
ener
atio
nIS
Fra
mew
ork
74
Su
h,
W.
etal
.2
00
4S
can
nin
gb
ehav
iou
ran
dst
rate
gic
un
cert
ain
tyM
anag
emen
tD
ecis
ion
Ex
ecu
tiv
ed
ecis
ion
mak
ing
Su
rvey
75
Tal
eb,
N.
etal
.2
00
9T
he
six
mis
tak
esex
ecu
tiv
esm
ake
inri
skm
anag
emen
tH
arv
ard
Bu
sin
ess
Rev
iew
Ex
ecu
tiv
ed
ecis
ion
mak
ing
Sin
gle
/lis
tap
pro
ach
es
76
Tan
,S
.et
al.
19
98
En
vir
on
men
tal
scan
nin
go
nth
ein
tern
etIC
IS-P
roce
edin
gs
No
nfu
nct
ion
alre
qu
irem
ents
Su
rvey
77
Th
om
as,
J.B
.et
al.
19
93
Str
ateg
icse
nse
mak
ing
and
org
aniz
atio
nal
per
form
ance
:li
nk
ages
amo
ng
scan
nin
g,
inte
rpre
tati
on
,ac
tio
nan
do
utc
om
es
Aca
dem
yo
fM
anag
emen
tJo
urn
alE
xec
uti
ve
dec
isio
nm
akin
g
Su
rvey
More applicable environmental scanning systems 535
123

Ta
ble
1co
nti
nu
ed
No
.A
uth
or(
s)Y
ears
Tit
leP
ub
lica
tio
nE
lem
ents
of
ISd
esig
nR
esea
rch
app
roac
h
78
Tse
ng
,F
.S
.C
.an
dC
ho
u,
A.
Y.
H.
20
06
Th
eco
nce
pt
of
do
cum
ent
war
eho
usi
ng
for
mu
lti-
dim
ensi
on
alm
od
elin
go
fte
xtu
al-b
ased
bu
sin
ess
inte
llig
ence
Dec
isio
nS
up
po
rtS
yst
ems
An
aly
tica
lte
chn
iqu
esF
ram
ewo
rk
79
Van
den
bo
sch
,B
.an
dH
uff
,S
.L
.1
99
7S
earc
hin
gan
dsc
ann
ing
:h
ow
exec
uti
ves
ob
tain
info
rmat
ion
fro
mex
ecu
tiv
ein
form
atio
nsy
stem
sM
ISQ
uar
terl
yE
xec
uti
ve
dec
isio
nm
akin
g
Su
rvey
80
Wal
ters
,B
.et
al.
20
03
Str
ateg
icin
form
atio
nan
dst
rate
gic
dec
isio
nm
akin
g:
the
EIS
-CE
Oin
terf
ace
insm
alle
rm
anu
fact
uri
ng
com
pan
ies
Info
rmat
ion
&M
anag
emen
tF
un
ctio
nal
req
uir
emen
tsS
urv
ey
81
Wei
,C
.-P
.an
dL
ee,
Y.-
H.
20
04
Ev
ent
det
ecti
on
fro
mo
nli
ne
new
sd
ocu
men
tsfo
rsu
pp
ort
ing
env
iro
nm
enta
lsc
ann
ing
Dec
isio
nS
up
po
rtS
yst
ems
An
aly
tica
lte
chn
iqu
esS
ing
leIt
em
82
Wh
eelw
rig
ht,
S.
and
Cla
rke,
D.
19
76
Pro
bin
go
pin
ion
sH
arv
ard
Bu
sin
ess
Rev
iew
1st
gen
erat
ion
ISS
ing
le/l
ist
app
roac
hes
83
Wix
om
,B
.H
.et
al.
20
08
Co
nti
nen
tal
airl
ines
con
tin
ues
toso
arw
ith
bu
sin
ess
inte
llig
ence
Info
rmat
ion
Sy
stem
sM
anag
emen
tIn
form
atio
ng
ath
erin
gC
ase
stu
dy
84
Xu
,K
.et
al.
20
11
Min
ing
com
par
ativ
eo
pin
ion
sfr
om
cust
om
erre
vie
ws
for
com
pet
itiv
ein
tell
igen
ceD
ecis
ion
Su
pp
ort
Sy
stem
sA
nal
yti
cal
tech
niq
ues
Fra
mew
ork
85
Xu
,X
.et
al.
20
03
UK
exec
uti
ves
vis
ion
on
bu
sin
ess
env
iro
nm
ent
for
info
rmat
ion
scan
nin
g.
Acr
oss
ind
ust
ryst
ud
yIn
form
atio
n&
Man
agem
ent
Fu
nct
ion
alre
qu
irem
ents
Su
rvey
86
Yas
ai-A
rden
aki,
M.
and
Ny
stro
m,
P.
19
96
Des
ign
sfo
ren
vir
on
men
tal
scan
nin
gsy
stem
s:te
sts
of
aco
nti
ng
ency
theo
ryM
anag
emen
tS
cien
ceF
un
ctio
nal
req
uir
emen
tsS
urv
ey
536 J. H. Mayer et al.
123

References
Aasheim C, Koehler GJ (2006) Scanning World Wide Web documents with the vector space model.
Decis Support Syst 42(4):690–699
ACM SIGKDD (2012) Data mining curriculum. http://www.sigkdd.org/curriculum.php. Accessed 20 Feb
2012
AIS (2007) MIS Journal Ranking (Senior Scholars, Basket of Journals). http://home.aisnet.
org/displaycommon.cfm?an=1&subarticlenbr=346. Accessed 15 Nov 2012
AIS (2010) MIS Journal Rankings. http://ais.affiniscape.com/displaycommon.cfm?an=1&subarticlenbr=
432. Accessed 20 Nov 2010
Aguilar FJ (1967) Scanning the business environment, vol 1. Macmillan, New York
Albright KS (2004) Environmental scanning: radar for success. Inf Manag J 38(3):38–45
Aldous D (2011) A critical review of Taleb, Nassim Nicholas. The Black Swan: the impact of the highly
improbable, A.M.S. Notices, March 2011, pp 427–413
Ansoff HI (1975) Managing strategic surprise by response to weak signals. Calif Manag Rev 18(2):21–32
Ansoff HI (1980) Strategic issue management. Strateg Manag J 1(2):131–148
Bajwa DS, Floyd Lewis L, Pervan G, Lai VS, Munkvold BE, Schwabe G (2008) Factors in the global
assimilation of collaborative information technologies: an exploratory investigation in five regions.
J Manag Inf Syst 25(1):131–165
Besnard D, Greathead D, Baxter G (2004) When mental models go wrong: co-occurrences in dynamic,
critical systems. Int J Hum Comput Stud 60(2):117–128
Bischoff S, Weitzel T, Mayer JH (2012) Requirements Criteria for Applicable Environmental Scanning
Systems: Model Development and First Demonstration. In: Mattfeld DC, Robra-Bissantz S (Hrsg.):
Proceedings der Multikonferenz Wirtschaftsinformatik (MKWI), Braunschweig, Deutschland,
pp 945–957
Calori R (1989) Designing a business scanning system. Long Range Plan 22(1):69–82
Carlsson SA, Henningsson S, Hrastinski S, Keller C (2009) An approach for designing management
support systems: the design science research process and its outcomes. In: Vaishanvi V, Baskerville
R, Purao S (eds) Proceedings of the fourth international conference on design science research in
information systems and technology (DESRIST). Malvern, USA, pp 1-10
Cecchini M, Aytug M, Koehler GJ, Pathak P (2010) Making words work: using financial text as a
predictor of financial events. Decis Support Syst 50(1):164–175
Chang P-C, Lai C-Y, Lai K-R (2006) Hybrid system by evolving case-based reasoning with genetic
algorithm in wholesaler’s returning book forecasting. Decis Support Syst 42(6):1715–1729
Chen H, Chau M, Li S-H (2011) Enterprise risk and security management: data, text and Web mining.
Decis Support Syst 50(4):649–650
Cheung W, Babin G (2006) A metadatabase-enabled executive information system (Part A): a flexible
and adaptable architecture. Decis Support Syst 42(4):1589–1598
Choo CW (2009) Information use and early warning effectiveness: perspectives and prospects. J Am Soc
Inform Sci Technol 60(5):1071–1082
Choudhury V, Sampler JL (1997) Information specificity and environmental scanning: an economic
perspective. MIS Q 21(1):25–53
Ciborra C (1999) Notes in improvisation and time in organizations. Account Manag Inf Technol
9(2):132–164
Cinar D, Gulgun K (2010) Scenario analysis using bayesian networks: a case study in energy sector.
Knowl Based Syst 23(3):267–276
Cohen JB, Zinsbarg ED (1967) Investment analysis and portfolio management, vol 1. Dow Jones-Irwing
Inc., Homewood
Daft RL, Sormunen J, Parks D (1988) Chief executive scanning, environmental characteristics, and
company performance: an empirical study. Strateg Manag J 9(2):123–139
Dalkey NC (1969) The Delphi method: an experimental study of group opinion. Rand, Santa Monica
Davies J, Finlay M, McLenaghen T, Wilson D (2006) Key risk indicators—their role in operational risk
management and measurement. ARM and Risk Business International, Prague, pp 1–32
Davis FD (1989) Perceived usefulness, perceived ease of use, and user acceptance of information
technology. MIS Q 13(3):318–340
Day GS, Schoemaker PJH (2004) Driving through the fog: managing at the edge. Long Range Plan
37(2):127–142
More applicable environmental scanning systems 537
123

Day GS, Schoemaker PJH (2005) Scanning the periphery. Harv Bus Rev 83(11):135–148
DeLone WH, McLean ER (1992) Information systems success—the quest for the dependent variable. Inf
Syst Res 3(1):60–95
DeLone WH, McLean ER (2003) The DeLone and McLean model of information systems success: a ten-
year update. J Manag Inf Syst 19(4):9–30
Duncan RB (1972) Characteristics of organizational environments and perceived environmental
uncertainty. Adm Sci Q 17(3):313–327
El Sawy OA (1985) Personal information systems for strategic scanning in turbulent environments: can
the CEO go on-line? MIS Q 9(1):53–60
Elofson G, Konsynski B (1999) Delegation technologies: environmental scanning with intelligent agents.
J Manag Inf Syst 8(1):37–62
Fink A, Marr B, Siebe A, Kuhle J-P (2005) The future scorecard: combining external and internal
scenarios to create strategic foresight. Manag Decis 43(3):360–381
Fontela E (1976) Industrial applications of cross-impact analysis. Long Range Plan 9(4):29–33
Forrester JW (1977) Industrial dynamics, 9th edn. Cambridge press, Cambridge
Frolick MN, Parzinger MJ, Rainer RK Jr, Ramarapu NK (1997) Using EISs for environmental scanning.
Inf Syst Manag 14(1):35–40
Fuld L (2003) Be Prepared. Harv Bus Rev 81(11):20–21
Gleißner W, Fuser K (2000) Moderne Fruhwarn- und Prognosesysteme fur Unternehmensplanung und
Risikomanagement Der Betrieb 2000(19):933-941
Goul M, Corral K (2007) Enterprise model management and next generation decision support. Decision
Support Systems 43(3):915–932
Gregor S (2006) The nature of theory in information systems. MIS Q 30(3):611–642
Hand D J (2009) Mining the past to determine the future: problems and possibilities. International journal
of Forecasting 25(5):441-451
Hevner AR, Chatterjee S (2010) Design research in information systems: theory and practice. Springer,
Berlin
Hopwood AG (2009) The economic crisis and accounting: implications for the research community. Acc
Organ Soc 34(6/7):797–802
Hull JC (2010) Risk management and financial institutions, 2nd edn. Pearson Education, Inc., Toronto
IEEE (1990) The Institute of Electrical and Electronics Engineers, Inc.—Standard glossary of software
engineering terminology. IEEE Computer Society, New York
Kahneman D, Lovallo D (1993) Timid choices and bold forecasts: a cognitive perspective on risk taking.
Manag Sci 39(1):17–31
Kajuter P (2004) Die Regulierung des Risikomanagements im internationalen Vergleich. Zeitschrift fur
Controlling und Management 47(Sonderheft 3):12–25
Kim YS, Rachev ST, Bianchi ML, Mitov I, Fabozzi FJ (2011) Time series analysis for financial market
meltdowns. J Bank Finance 35(8):1879–1891
Kotonya G, Sommerville I (1998) Requirements Engineering Processes and Techniques. Wiley, Hoboken
Krystek U, Herzhoff M (2006) Szenario-Technik und Fruhaufklarung: anwendungsstand und Integra-
tionspotential. Zeitschrift fur Controlling und Management 50(5):305–310
Lenz RT, Engledow JL (1986) Environmental analysis units and strategic decision-making: a field study
of selected ‘‘leading-edge’’ corporations. Strateg Manag J 7(1):69–89
Lesca N, Caron-Fasan M-L (2008) Strategic scanning project failure and abandonment factors: lessons
learned. Eur J Inf Syst 17(4):371–386
Linsmeier TJ, Pearson ND (2000) Value at risk. Financial Anal J 56:47–67
Lonnqvist A, Pirttimaki V (2006) The measurement of business Intelligence. Information Systems
Management 23(1):385-401
Ma Z, Sheng ORL, Pant G (2009) Discovering company revenue relations from news: a network
approach. Decis Support Syst 47(2):408–414
Makridakis S, Taleb N (2009) Decision making and planning under low levels of predictability. Int J
Forecast 25(3):716–733
Makridakis S, Hogarth RM, Gaba A (2010) Why forecasts fail. What to do instead. MIT Sloan Manag
Rev 51(2):83–90
Malhorta A, Gosain S, El Sawy OA (2005) Absorptive capacity configurations in supply chains: gearing
for partnerenabled market knowledge creation. MISQ 29(1):145–187
March ST, Hevner A (2007) Integrated decision support systems: a data warehousing perspective. Decis
Support Syst 43(4):1031–1043
538 J. H. Mayer et al.
123
March ST, Smith GF (1995) Design and natural science research on information technology. Decis
Support Syst 15(4):251–266
Mayer JH (1999) Fuhrungsinformationssysteme fur die internationale Management-Holding. Vahlen,
Wiesbaden
Mayer JH (2011) Managing the future – six guidelines for designing environmental scanning systems. In:
Jain H, Sinha AP, Vitharana P (eds.) Proceedings of the sixth international conference on design
science research in information systems and technology (DESRIST), Milwaukee, USA, pp 276–290
Mayer JH (2010): Organisatorische Veranderungen durch die aktuelle Wirtschaftskrise - Best-
andsaufnahme und Implikationen fur Unternehmenssteuerungssysteme. Reichmann T. (Hrsg.):
Proceedings des 25. Deutschen Controlling Congress (DCC), Dortmund, Deutschland, pp 211–228
Mayer JH (2012) Powering up companies‘ crystal balls: analysis of a multicase study towards more
applicable environmental scanning systems. Proceedings of the 20th european conference on
information systems (ECIS). Barcelona, Spain (ACC-2: 360), pp 56–67
Mayer JH, Steinecke N, Quick R (2011) Improving the applicability of environmental scanning systems:
state of the art and future research. In: Nuettgens M, Gadatsch A, Kautz K, Schirmer I, Blinn N (eds)
governance and sustainability in information systems – managing the transfer and diffusion of IT.
Proceedings of IFIP WG8.6 international working conference. Hamburg, Germany, pp 207–223
Menard C, Shirley M (eds) (2008) Handbook of new institutional economics, vol 13. Springer, Berlin
Nadkarnia S, Shenoy PP (2004) A causal mapping approach to constructing Bayesian networks. Decis
Support Syst 38(3):259–281
Narchal RM, Kittappa K, Bhattacharya P (1987) An environmental scanning system for business
planning. Long Range Plan 20(6):96–105
Ngai EWT, Hu Y, Wong YH, Chen Y, Sun X (2011) The application of data mining techniques in
financial fraud detection: A classification framework and an academic review of literature. Decision
Support Systems 50(3):559–569
Niu L, Lu J, Zhang G (2008) Cognitive orientation in business intelligence systems. Stud Comput Intell
117(2):95–106
Nocera J (2009) Risk mismanagement. The New York Times. http://www.nytimes.com/2009/
01/04/magazine/04risk-t.html?_r=1&emc=eta1&pagewanted=print. Accessed 20 Feb 2012
Nohuddin PNE, Coenen F, Christley R, Setzkorn C, Patel Y, Williams S (2012) Finding ‘‘interesting’’
trends in social networks using frequent pattern mining and self organizing maps. Knowl Based Syst
(29)2:104–113
Ontrup J, Ritter H, Scholz SW, Wagner R (2009) Detecting, assessing, and monitoring relevant topics in
virtual information environments. IEEE Trans Knowl Data Eng 21(3):415–427
Paech B, Kerkow D (2004) Non-functional requirements engineering—quality is essential. In: 10th
anniversary international workshop on requirements engineering: foundation for software quality
(REFSQ’04), Riga, Latvia, 2004, pp 27–40
Peffers K, Tuunanen T, Gengler CE, Rossi M, Hui W, Virtanen V, Bragge J (2006) The design science
research process: a model for producing and presenting information systems research. DESRIST,
Claremont, pp 83–106
Plambeck N, Weber K (2010) When the glass is half full and half empty: CEO’s ambivalent
interpretations of strategic issues. Strateg Manag J 31(7):698–710
Porter ME (1985) Competitive advantage: creating and sustaining superior performance, vol 1. Free
Press, New York
Qi M (2001) Predicting US recessions with leading indicators via neural network models. Int J Forecast
17(3):383–401
Rajaniemi K (2007) Internet-based scanning of the competitive environment. Benchmarking: An
International Journal 14(4). Online at emerald: www.emeraldinsight.com/1463-5771.htm:465-481
Rockfellow JD (1994) Wild cards preparing for ‘‘The Big One’’. Futurist 28(1):14–19
Rohrbeck R (2011) Exploring value creation from corporate-foresight activities. Futures 44(5):440–452
Rossel P (2009) Weak signals as a flexible framing space for enhanced management and decision-
making. Technol Anal Strateg Manag 21(3):307–320
Salmeron JL (2002) EIS evolution in large Spanish businesses. Inf Manag 40(1):31–40
Sherman WS, Chambers V (2009) SOX as safeguard and signal: the impact of the Sarbanes-Oxley act of
2002 on US Corporations’ choice to list abroad. Multinatl Bus Rev 17(3):163–179
Simon HA (1959) Theories of decision-making in economics and behavioral science. Am Econ Rev
49(3):253–283
More applicable environmental scanning systems 539
123

Singh SK, Watson HJ, Watson RT (2002) EIS support for the strategic management process. Decis
Support Syst 33(1):71–85
Sterman JD (2001) Systems dynamics modeling: tools for learning in a complex world. Calif Manag Rev
43(4):8–25
Taleb NN (2010) The Black Swan: the impact of the highly improbable, 2nd edn. Random House, New
York
Taleb NN, Goldstein DG, Spitznagel MW (2009) The six mistakes executives make in risk management.
Harv Bus Rev 87(10):78–81
Urbach N, Smolnik S, Riempp G (2009) The state of research on information systems success—a review
of existing multidimensional approaches. Bus Inf Syst Eng (BISE) 1(4):315–325
Veloce W (1996) An evaluation of the leading indicators for the Canadian economy using time series
analysis. Int J Forecast 12(3):403–416
Venkatesh V, Bala H (2008) Technology acceptance model 3 and a research agenda on interventions.
Decis Sci 39(4):273–315
Venkatesh V, Morris MG, Davis GB, Davis FD (2003) User acceptance of information technology:
toward a unified view. MIS Q 27(4):425–478
VHB (2008) Teilranking Wirtschaftsinformatik und Informationsmanagement. http://vhbonline.org/
service/jourqual/jq2/teilranking-wirtschaftsinformatik-und-informationsmanagement/. Accessed 25
Nov 2010
Vodanovich S, Sundaram D, Myers M (2010) Digital natives and ubiquitous information systems. Inf
Syst Res 21(3):711–723
Volberda HW, Foss NJ, Lyles MA (2010) Absorbing the concept of absorptive capacity: how to realize its
potential in the organizational field. Organ Sci 21(4):931–951
Vom Brocke J, Simons A, Niehaves B, Riemer K, Plattfaut R, Cleven A (2009) Reconstructing the Giant:
on the importance of rigour in documenting the literature search process. In: Newell S, Whitley E,
Pouloudi N (eds) 17th European conference on information systems (ECIS), Verona, pp 2206–2217
Walls JG, Widmeyer GR, El Sawy OA (1992) Building an information system design theory for vigilant
EIS. Inf Syst Res 3(1):36–59
Webster J, Watson RT (2002) Analyzing the past to prepare for the future: writing a literature review.
MIS Q 26(2):xiii–xxiii
Wei C-P, Lee Y-H (2004) Event detection from online news documents for supporting environmental
scanning. Decision Support Systems 36(4):385–401
Wixom BH, Watson HJ (2010) The BI-based organization. Int J Bus Intell 1(1):13–28
WKWI (2008) WI-Liste der Konferenzen. Wirtschaftsinformatik 50(2):155–163
XBRL International (2012) http://www.xbrl.org. Accessed 25 July 2012
Xu XM, Kaye GR, Duan Y (2003) UK executives’ vision on business environment for information
scanning A cross industry study. Inf Manag 40(5):381–389
Wurl H-J, Mayer JH (2012) Strategische Fruherkennung in industriellen Konzernen – ein pragmatischer
Gestaltungsansatz. Controlling, Zeitschrift fur erfolgsorientierte Unternehmenssteuerung (ZfC) 10
(6):529–536
Yasai-Ardekani M, Nystrom PC (1996) Designs for environmental scanning systems: tests of a
contingency theory. Manag Sci 42(2):187–204
Young KS, Rachev ST, Bianchi ML, Mitov I, Fabozzi FJ (2011) Time series analysis for financial market
meltdowns. J Bank Finance 35(8):1879–1891
Zhou L, Ding L, Finin T (2011) How is the semantic web evolving? A dynamic social network
perspective. Comput Hum Behav 27(5):1294–1302
540 J. H. Mayer et al.
123