Leveraging disjoint communities for detecting overlapping ...
Upload
khangminh22Category
view
1download
0
April 2005
Document of the World BankR
eport N
o. 3
1267-IN
India
India an
d th
e Know
ledge Eco
nom
y Leveragin
g Sterngth
s and
Op
po
rtun
ities
Report No. 31267-IN
IndiaIndia and the Knowledge EconomyLeveraging Strengths and Opportunities
World Bank Finance and Private Sector Development UnitSouth Asia Region and the World Bank Institute
Pub
lic D
iscl
osur
e A
utho
rized
Pub
lic D
iscl
osur
e A
utho
rized
Pub
lic D
iscl
osur
e A
utho
rized
Pub
lic D
iscl
osur
e A
utho
rized
Pub
lic D
iscl
osur
e A
utho
rized
Pub
lic D
iscl
osur
e A
utho
rized
Pub
lic D
iscl
osur
e A
utho
rized
Pub
lic D
iscl
osur
e A
utho
rized


KAM KE KEI MDG M N C NASSCOM NIIT NGO NITS NRI OECD PC PPP R&D REC RSE S&T SA S M E TFP TNC TRAI UGC UNDP USPTO VSNL WEF WTO
Knowledge Assessment Methodology knowledge economy Knowledge Economy Index Millennium Development Goal multinational corporation National Association o f Software and Services Companies National Institutes o f Information Technology nongovernmental organization National Institutes o f Technology Networked Readiness Index Organisation for Economic Cooperation and Development personal computer purchasing power parity research and development regional engineering college research scientists and engineers science and technology South Asia Region small and medium enterprise total factor productivity transnational company Telecoms Regulatory Authority o f India University Grants Commission United Nations Development Programme United States Patent and Trademark Office Videsh Sanchar Nigam Limited World Economic Forum World Trade Organization
Country Director: Michael F. Carter Sector Director: Sector Manager: Simon C. Bel l
Joseph Del Mar Pemia
11


Table of Contents
ACKNOWLEDGMENTS ........................................................................................................................................ vii
EXECUTIVE SUMMARY ...................................................................................................................................... viii
1.
2.
3.
4.
5.
6.
INDIA AND THE KNOWLEDGE ECONOMY: OPPORTUNITIES AND CHALLENGES .................... 1
The Current Economic Context ..................................................................... ......... 1 Knowledge i s Key in an Increasingly Dynamic and Competitive Global Environment ...................................... 7 Assessing India’s Opportunities and Challenges in the Knowledge Economy ................ Other Global Comparisons with India ...................
.......
.................................. Road Map for the Report: Strengthening the Four nowledge Economy ..
ECONOMIC AND INSTITUTIONAL REGIME, INCLUDING GOVERNANCE .................................. 18 Benchmarking the Economic and Institutional Regime . Benchmarking Governance ............ .................................. 20 Issues and Recent Developments in the Economic and Institutio Measures to Strengthen the Economic and Institutional Regime .............................
............................................................................. 18 ..........................................................
egime .................................. ............................. 32 ............................. 40 .............................................................. Summary of Issues and Recommendations
EDUCATION AND HUMAN RESOURCES ................................................................................................ 42
Issues and Recent Developments in Education and Human Resource Development.. ...................................... .44 Measures to Strengthen Education and Human Resources ................................................................................ 57
Benchmarking Education ................................................................................................................................... 42
Summary of Issues and Recommendations ........................................................................................................ 66
INNOVATION SYSTEM ................................................................................................................................ 68 ............................................................................................ Benchmarking Innovation. ...................... 69
Measures to Strengthen the Innovation System ....................... 82 Issues and Recent Developments in the Innovation System
Summary o f Issues and Recommendations
........................................................... ................................................................
........................................................................
INFORMATION INFRASTRUCTURE ........................................................................................................ 93
Benchmarking Information Infrastructure.. ......................................................................... India’s Global Standing on Information Communications Technology .......................................... Issues and Recent Developments in the Telecommunication and I T sectors Measures to Strengthen the Information Infrastructure .........................................................
..................................... 101
....................................................... 117 ................................ Summary o f Issues and Recommendations
MOVING AHEAD WITH THE KNOWLEDGE ECONOMY IN INDIA ............................................... 118 ............................................................ Indian Initiatives on the Knowledge Economy ..................... 118
................................................... Looking Ahead ................................................. Taking Action ........................................................................................ .................................................. 123 Launching a Process ......... .............................................................. A Final Note .................................................... ..............................................
Annex I: India’s Total Factor Productivity Construction: Theoretical Framework ............................................ 126
Annex 2: Knowledge Assessment Methodology .................................................................................................... 127
Annex 3: Knowledge Economy Index for India and Comparator Countries, 1995 and Most Recent Period ....... 128
... 111
Annex 4: Overall Knowledge Economy Scorecards for Brazil, China, Korea, Poland, and Russia, Selected Variables, 1995 and Most Recent Period ..... 129
Annex 5: Data for the Scorecards for India, Brazil, and China, 1995 and Most Recent Period .......................... 130
Annex 6: Economic and Institutional Regime: Scorecards for Comparator Countries, Selected Variables, Most Recent Period ............................................................................................................................................... Annex 7: Governance Data for India .............................................................................................................. 132
Annex 8: Various Costs of Doing Business in India, 2004.. ............................................. 133
Annex 9: Education: Scorecards for Comparator Countries, Selected Variables, Most Recent Period .............. 136
Annex 10: Innovation: Scorecards for Comparator Countries, Selected Variables, Scaled by Population, Most Recent Period ........................ ..................................... ...... ................................................... 137
Annex 11: Information Infrastructure: Scorecards for Comparator Countries, Selected Variables, Most Recent Period.. ......................................................................................................................................................... Annex 12: ICT Indicators for India and China, Various Years ............................................................................ 139
References.. ...................................................................................................................... ................................ 140
.....................................................................
iv

Figures
Figure A: India: Real Gross Domestic Product Per Worker, Alternative Projections, 1995-2020 ............................ v i i i Figure B: India: Percentage Share o f Global Gross Domestic Product, Years 0-1998 Figure 1-1: India: Real Gross Domestic Product Per Worker, Alternative Projections, 1995-2020 ............................ 3
Figure 1-3: Growth in Per Capita Income for Korea and Ghana, 1960-2000
.............. xx
Figure 1-2: Gross Domestic Product Per Capita (Purchasing Power Parity), India and Comparators, 1990-2003 ...... 6 ........ 7
Figure 1-4: Knowledge Economy Index, India, Comparators, and the World, 1995 and Most Recent Period ........... 10 Figure 1-5: Cross-country Comparison on the Four Pillars o f a Knowledge Economy, India and Comparators,
Figure 1-6: India’s Knowledge Economy Scorecard on Selected Variables, 1995 and Most R Figure 1-7: Progress on the Human Development Index, India and Comparators, 1975-2002 Figure 1-8: Knowledge Economy Scorecards on Selected Variables for Brazil, China, and India,
Most Recent Period.. ............................................................................... 14 Figure 1-9: Gross State Domestic Pro .................. 15 Figure 2-1: India and the World: Positions in the Economic Incentive Regime, 1995 and Most Recent Period ........ 19 Figure 2-2: India’s Scorecard on the Economic Incentive Regime, Selected Variables, Most Recent Period ............ 19 Figure 2-3: Governance Comparisons: India (1998 and 2002), with South Asia (2002), and with Low-Income
Countries (2002). ................. .............................................................................. 21 Figure 2-4: Eliminating Barriers for Faster Growth in India Figure 2-5: Share o f World Merchandise Exports, India and Comparators, 199
Figure 2-7: Service Exports, India and China, 1982, 1995, and 2002 Figure 2-8: Gross Foreign Direct Investment as Percentage o f Gross Domestic
and the World, 1980-2002 ....................................................... Figure 3- 1 : Benchmarking Education: India, Comparators, and the Wo Figure 3-2: India’s Scorecard on Education, Selected Variables, Most Recent
Figure 3-4: Gross Secondary Enrollment Rates, India and Comparators, 1990-2001 ................................................ 47 Figure 3-5: Gross Tertiary Enrollment Rates, India and Comparators, 1990-2000 .................................................... 52 Figure 4-1: Innovation by Population and Absolute Size, India and the World, 1995 and Most Recent Period ........ 70 Figure 4-2: India’s Scorecard on Innovation, Selected Variables, Most Recent Period ..................................... Figure 4-3: Patents Granted by the United States Patent and Trademark Office to Brazil, China, and India,
...............................
1995 and Most Recent Period .........................................................................................
............ r Indian States, 1999-2000
............................. ............................. 23
Figure 2-6: Merchandise and Service Exports, India and Comparators, 2002 ............................. ................... ................... 26
Figure 3-3: Gross Primary Enrollment Rates, India and Comparators, 1990-2001 .................................................... 46
1997-2003 .................................................................................................................................................... 73 Figure 4-4: Patents Granted to Indian Subsidiaries ................... .................................... Figure 5-1: Percentage o f Total Teleph
Figure 5-2: Benchmarking Informatio
Figure 5-3: India’s Scorecard on Information and Communications Technologies, Selected Variables, Most Recent
Service (Fixed and Mobile) Provided by Priv 2000-04 ............................... .......................................................................
Communications Technologies, India and the Wor Most Recent Period ................... 95
............................................................................... ............................................. 96 002.. ................. 96
Figure 5-5: Growth o f Telephony in India: Numbers of Landline and Mobile Subscribers, 1996-2004 ................. 101 .......................... 102
...............................................................................
es, Computers, and the Internet: India and Compa
...................................................................... Figure 5-6: Teledensity in India, 1995-2004 Figure 5-7: Employment in the Indian Information Technology Sector, 2000-03 .........................................
Figure 5-9: Gains from Offshoring $1 o f Services from the United States (Source) to India (Host) .......... Figure 5-8: India’s Projected Information Technology Industry, Export and Domestic Markets, 2008 .....
Figure 6-1: India: Percentage Share o f Global Gross Domestic Product, Years 0-1998 .............................
Tables
Table 1-1: India’s Gross Domestic Product by Sector, 1997-2 Table 2-1: Custom Duty Rates in India and Other Developing
Table 3-2: Percentage of Schools under Different Types of Management in India, Various Years ........................... 48 ..................................... 50
........................................................ ies, Various Years
Table 3-1: Enrollment by Educational Stages in India, 1990-91 and 2001-02 ...........................................
Table 3-3: Spending on Education, India and Comparators, 2001 ..................
V

Table 3-4: Scientific and Technical Personnel from Indian Universities by Level o f Qualification, 1979, 1989, and
Table 3-5: Educ Table 3-6: Characteristics o f Traditional and Lifelong Learning
1995 ... ............................................................ ........................... 55
............................................................ 63 ............. 72
.......................................................... 108
ttainment o f the Total Population A g
Table 4-1: Selected Innovation Variables, India and Comparators, Various Years .......... Table 5- 1 : Digital Access Index, Various Countries, 2002 ......................................................................................... 99 Table 5-2: Internet Usage Pattern in India in 2002 ........
Boxes
Box 1-1: Assessing India’s Progress on Millennium Development Goals in the 1990s.
Box 1-3: Four Pillars o f the Knowledge Economy ...
Box 2-2: Foreign Direct Investment Policies in India and China ............................................................
Box 2-4: Investment Climate Improvement: Lessons from China and India ..................................................
Box 2-6: Tapping Entrepreneurial Ca Box 2-7: Building on Success: Attracting Foreign Investment in India ...................................................................... 38
............... 2 Box 1-2: India Undergoes a Services
Box 2-1: Foreign Direct Investment: A Tale o f Two
Box 2-3: Moving Up the Value Chain: India’s Automobile Industry
Box 2-5: Role o f Investment Climate: ........................ 37
......................... 45
................................................................................ 51 ......................... 58
Box 3-5: General Electric Actively Promotes Organizational Learning, Including in India ...................................... 62 Box 3-6: Reaping the Potential o f Private Higher Education in India ..... 65 Box 3-7: Transforming Established Systems: The Monterrey Institute o f Technology .............................................. 66 Box 4-1: India in the Context o f Global Trends in Research and Development Investment ...................................... 74
Box 4-3: How Wel l Does India Promote Innovation in the Manufacturing Sector? ................................................... 76 .......................................................... 77
Box 3-1: Reducing Illiteracy: The Computer-Based Functional Literacy Program ..................... Box 3-2: Community-Government Partnership Helps Get Millions into School:
............... The Case o f Madhya Pradesh Box 3-3: Increasing Transparency in Indian Higher Education ............................................ Box 3-4: Expanding Distance Education in India ....................................................................................................... 59
.........................................................
Box 4-2: Industrial Research and Development in India: Recent Trends .......................................
Box 4-4: China’s “Jumping into the Sea” Strategy Box 4-5: Evolution o f Bangalore as an Innovative Cluster ........................................................... Box 4-6: Highlights of International Corporate Research and Development in India ......... Box 4-7: Globalization of Innovation: High-End Research and Development in India ....... Box 4-8: Outsourcing Chemistry and Biology Research and Development in India ........... Box 4-9: Indian Pharmaceuticals: Responding to Changes in the New Patent Regime ....... Box 4-10: Indian Pharmaceuticals Have Global Ambitions ...................................................................... Box 4-1 1: The Evolving Innovation Landscape: Research and Development in the Corporate World ...................... 86 Box 4-12: Leveraging Traditional Knowledge with Modern Science and Exploiting
Public-Private Partnerships for Drug Development in India ........................................................................ 87 .................................................... 89
.................................................................. 110
..................
Box 4-13: A Snapshot o f the Indian Diaspora in the United States
Box 5-2: Information Technology Training Initiatives in I Box 5-1: Snapshot o f the Indian Information Technology
Box 5-3: Can China Compete in Information Technology Box 5-4: Bridging the Digital Divide: Village Internet Box 5-5: Three E-Government Initiatives Hold Promis Box 5-6: Information Communications Technology Efforts Expand in India .... Box 5-7: Ushering in Rural Development through Connectivity: The PURA an
Box 6-2: Key Drivers for the Indian Know1 Box 6-3: India’s New Opportunity: 2020
............................ 114
................................................. 119 ...................
............................... Box 6-1: Indian Knowledge Society Society ..............................................
... ............................................................................................ Box 6-4: Implementing the Republic o f KO Box 6-5: India Inc.: Moving to Action
Knowledge Strategy .... ................................................................... ................... 124
vi
ACKNOWLEDGMENTS
This report was developed by Carl Dahlman and Anuja Utz o f the Knowledge for Development Program, World Bank Institute (WBI). I t was prepared at the request o f the World Bank’s India Country Department, which, along with WBI, cofinanced this work.
The report was reviewed by the India Management Team on March 11,2004. World Bank peer reviewers included Priya Basu, Karen Lashman, Peter Smith, and Krishna Challa, as well as Ronald F. Perkinson from the International Finance Corporation.
An earlier draft o f this report was shared with the Government o f India. We would l ike to thank Dr. Ranjit Bannerji and the team at the Department o f Economic Affairs, Ministry o f Finance, for their support and cooperation. The report was also discussed at a workshop in New Delhi, India on November 9, 2004, which was cosponsored by the Confederation o f Indian Industry (CII) and included high-level policy makers from the central and selected state governments; representatives of industry, academia, think tanks, and consulting f i rms ; and staff o f the World Bank. We gratefully acknowledge the comments and insights offered workshop participants. We thank the C I I and, in particular, Rajiv Kumar, Arun Maira, and Harsh Shrivastava for their intellectual as well as logistical contributions to the workshop.
We are grateful to Michael Carter, World Bank‘s Country Director for India, for his continued support, and to Priya Basu for her helpful inputs and advice. We would like to thank the following staff who provided information and comments for the report, including Robert Beschel, Geetanjali S. Chopra, Amit Dar, K. Migara 0. D e Silva, Inderbir Singh Dhingra, John Didier, Mark Dutz, Lata Ganesh, Stephen Howes, Bala Bhaskar Naidu Kalimili, Varsha Marathe, Taye Alemu Mengistae, Deepak K. Mishra, Shashank Ojha, Deepa Sankar, Rashmi Sharma, Shashi Shrivastava, Peter Smith, Lynne Sunderland, Eliza Winters, and Kin Bing Wu. Aimilios Chatzinikolaou and Derek Chen o f WBI’s Knowledge for Development program and Reuben Abraham o f Columbia University provided valuable data and analysis.
v i i


INDIA AND THE KNOWLEDGE ECONOMY
LEVERAGING STRENGTHS AND OPPORTUNITIES
EXECUTIVE SUMMARY
One o f the world’s largest economies, India has made tremendous strides in its economic and social development in the past two decades and i s poised to realize even faster growth in the years to come. After growing at about 3.5 percent from the 1950s to the 1970s, India’s economy expanded during the 1980s to reach an annual growth rate o f about 5.5 percent at the end o f the period. I t increased i t s rate o f growth to 6.7 percent between 1992-93 and 1996-97, as a result o f the far-reaching reforms embarked on in 1991 and opening up o f the economy to more global competition. I t s growth dropped to 5.5 percent from 1997-98 to 2001-02 and to 4.4 percent in 2002-03, due to the impact o f poor rains on agricultural output. But, thanks to a lavish monsoon that led to a tumaround in the agriculture sector, India’s economy surged ahead to reach a growth rate o f 8.2 percent in 2003-04. This i s very much in line with growth projections cited in India’s Tenth Five-Year Plan, which calls for increasing growth to an average o f 8 percent between 2002-03 and 2006-07 (India, Planning Commission, 2002e). Such sustained acceleration i s needed to provide opportunities for India’s growing population and i t s even faster-growing workforce.
Embarking on a new growth path. India has a rich choice set in determining i t s future growth path. Figure A shows what India can achieve by the year 2020, based on different assumptions about i t s ability to use knowledge, even without any increase in the investment rate. Here, total factor productivity (TFP) i s taken to be a proxy for a nation’s learning capability.
Figure A: India: Real Gross Domestic Product Per Worker, Alternative Projections, 1995-2020 1995 US$
3,090
2,500
2,wo
1,500
1,wo
500
0
-Actual
+Projection 1 : 2.09 YO TFP Growth (Actual)
+Projection 2: 1% TFP Growth (India 1961-70)
+Projection 3: 3% TFP Growth (India 1981-90)
actual TFP growth rate for 1991-2000)
I
1995 2000 2005 2010 201 5 2020 Year
Note: For all four projections, capital, labor, and human capital are assumed to grow at their 1991-2000 average annual growth rates for India, that i s , 5.41, 2.23, and 0.58 percent, respectively. For the growth-TFP decomposition to be more precise, labor
... V l l l
force figures rather than total population are used as a measure o f the amount o f “labor” available for use as a factor o f production in the Indian economy. According to World Bank databases, in 2001 India’s GDP (in 1995 U.S. dollars) was $495 billion and its population was 1.03 billion, o f which only 461 million were in the labor force. As such, India’s GDP per capita in 2001 was approximately $480, whereas GDP per worker was around $1,070. Annex 1 provides the theoretical framework for these TFP projections. Source: Knowledge for Development Program.
Projections 1, 2, 3, and 4 plot real gross domestic product (GDP) per worker (1995 U.S . dollars) for India assuming different TFP growth rates f rom 2002 to 2020. Projection 4 i s an optimistic scenario which i s based on the actual TFP growth rate in Ireland in 1991-2000. Ireland i s an example o f a country that has been using knowledge effectively to enhance i t s growth. All things being equal, the projected GDP per worker for India in scenario 4 in 2020 i s about 50 percent greater than in scenario 1. Knowledge can make a difference between poverty and wealth.
Which growth path India embarks on in the future will depend on how wel l the government, private sector, and c iv i l society can work together to create a common understanding o f where the economy should be headed and what it needs to get there. India can no doubt reap tremendous economic gains by developing policies and strategies that focus on making more effective use o f knowledge to increase the overall productivity o f the economy and the welfare o f i t s population. In so doing, India wi l l be able to improve i t s international competitiveness and j o i n the ranks o f countries that are making a successful transition to the knowledge economy.
Embracing the knowledge economy: The time i s very opportune for India to make i t s transition to the knowledge economy-an economy that creates, disseminates, and uses knowledge to enhance i t s growth and development. The knowledge economy i s often taken to mean only high-technology industries or information and communication technologies (ICTs). I t would be more appropriate, however, to use the concept more broadly to cover how any economy harnesses and uses new and existing knowledge to improve the productivity o f agriculture, industry, and services and increase overall welfare. In India, great potential exists for increasing productivity by shifting labor from l o w productivity and subsistence activities in agriculture, informal industry, and informal service activities to more productive modern sectors, as wel l as to new knowledge-based activities-and in so doing, to reduce poverty and touch every member o f society. India should continue to leverage i t s strengths to become a leader in knowledge creation and use. T o get the greatest benefits f rom the knowledge revolution, the country needs to press on with the economic reform agenda that it put into motion more than a decade ago and continue to implement the various policy and institutional changes needed to accelerate growth.
Advantage India. India has many o f the key ingredients for making this transition. It has a critical mass o f skilled, English-speaking knowledge workers, especially in the sciences. It has a well-functioning democracy. I t s domestic market i s one o f the world’s largest. It has a large and impressive Diaspora, creating valuable knowledge linkages and networks. The l i s t goes on: macroeconomic stability, a dynamic private sector, institutions o f a free market economy, a well-developed financial sector, and a broad and diversified science and technology (S&T) infrastructure. In addition, the development o f the I C T sector in recent years has been remarkable. India has created profitable niches in information technology (IT) and i s becoming a global provider o f software services. Building o n these Strengths, India can harness the benefits o f the knowledge revolution to improve i t s economic performance and boost the welfare o f i t s people.
This report provides a “big picture” assessment o f India’s readiness to embrace the knowledge economy and highlights some o f the key constraints and emerging possibilities confronting India on four crit ical pillars o f the knowledge economy:
ix

0
0
0
0
Strengthening the economic and institutional regime Developing educated and skilled workers Creating an efficient innovation system Building a dynamic information infrastructure.
The report highlights that to be competitive in the global knowledge economy o f the twenty-first century, India should continue to focus i t s efforts on further reforming i t s overall economic and institutional environment and improve its overall trade and investment climate. Addressing issues in th i s domain w i l l be key, because it sets the overall incentive framework needed to improve performance across the economy. The report further underlines that for India to leverage i t s strengths and opportunities on a global scale, it needs to undertake significant reforms and investments in building education and ski l ls , strengthening i t s innovation system, and further bolstering its information infrastructure. To create and sustain an effective knowledge economy, India must undertake systemic integration o f reforms in the above four domains to strengthen i t s competitive advantage.
The following are some o f the key issues that India needs to address in each o f the four pillars to spur growth and innovation and, in so doing, increase economic and social welfare.
Strengthening the Economic and Institutional Regime
Taking advantage o f the knowledge revolution’s potential hinges on effective economic incentives and institutions that promote and facilitate the redeployment of resources from less efficient to more efficient uses. This fundamental pillar o f the knowledge economy provides the overall framework for directing the economy. Important elements o f the economic and institutional regime include macroeconomic stability, competition, good regulatory policies, and legal rules and procedures conducive to entrepreneurship and risk taking. A key feature i s the extent to which the legal system supports basic rules and property rights.
India’s economic and institutional regime has several strengths: flourishing entrepreneurship and free enterprise; a strong infrastructure for supporting private enterprise; capital markets that operate with greater efficiency and transparency than, for example, those in China; an advanced legal system; and an independent judiciary. Property rights are fairly secure, and the protection of private ownership i s strong. The rule of law generally prevails. Corporate governance has also improved dramatically.
India has other intrinsic advantages, such as macroeconomic stability, a large domestic market, and a large and relatively low-cost and skilled workforce. I t also has a critical mass of well-educated workers in engineering and science and, unlike China, abundant raw materials. All this should allow the country to emerge as a major hub for manufacturing and service industries.
Despite India’s recent economic growth, a number of barriers exist, such as the multiplicity o f regulations governing product markets, distortions in the market for land, and widespread government ownership o f businesses that have been inhibiting GDP growth, according to some estimates by about 4 percent a year. Removing these barriers and fostering a stronger investment climate would allow India’s economy to grow as fast as China’s-10 percent a year-and create some 75 mill ion new jobs outside agriculture.
India i s s t i l l a relatively closed economy compared with other Asian economies, in which exports account for a much larger share o f GDP (33 percent in China and 38 percent in Korea, compared with only 15 percent in India in 2003). Although this means that India i s somewhat protected from global trends, the downside i s that i t does not benefit from stronger foreign competitive pressures to improve performance or from the ability to draw on more cost-effective foreign inputs, such as capital goods, components, products, or foreign investment, which embody more advanced knowledge. As a result, India i s losing market share to its major competitors, especially China, where reforms have moved ahead much more
X

rapidly; therefore, to speed up trade reform and be able to export, Indian f i r m s need to be allowed to import the materials and technology they need.
India also needs to boost foreign direct investment (FDI), which can be a facilitator o f rapid and efficient transfer and cross-border adoption o f new knowledge and technology. FDI flows to India rose by 24 percent between 2002 and 2003, due to i t s strong growth and improved economic performance, continued liberalization, i t s market potential, and the growing competitiveness of Indian IT industries. Even so, in 2003, India received $4.26 bil l ion in FDI, compared with $53.5 bil l ion for China! But India’s stock i s rapidly rising: the 2004 Foreign Direct Investment Confidence Index by A. T. Keamey (2004) shows that China and India dominate the top two positions in the world for most positive investor outlook and likely first-time investments, and are also the most preferred offshore investment locations for business process outsourcing (BPO) functions and IT services.
Successful economic development i s a process o f continual economic upgrading in which the business environment in a country evolves to support and encourage increasingly sophisticated ways o f competing. A good investment climate provides opportunities and incentives for firms-from microenterprises to multinationals-to invest productively, create jobs, and expand. As a result o f investment climate improvements in the 1980s and 1990s, private investment as a share o f GDP nearly doubled in China and India. But, India needs to continue to foster a good investment climate that encourages f i r m s to invest by removing unjustified costs, risks, and barriers to competition. One reason for India’s less competitive markets i s excessive regulation o f the entry and exit o f f m s , which face stiffer requirements for obtaining permits and take much longer to get under way than do the f i r m s in many other countries. Restrictions on the hiring and fring o f workers are also a major obstacle to doing business in India. In addition, enforcing contracts i s a major problem: for example, i t takes more than a year to resolve a payment dispute.
So, to strengthen i t s overall economic and institutional regime, India should continue to address the following related to its product and factor markets and improving its overall infrastructure:
e
e
e
e
e
e e
e e
e
Speeding up trade reform by reducing tariff protection and phasing out tariff exemptions. This w i l l help Indian f i r m s gain access to imports at world prices and would also help to encourage exports further. Encouraging FDI and increasing i t s contribution to economic growth by phasing out remaining FDI restrictions and increasing positive linkages with the rest o f the economy. Stimulating growth o f manufactured and service exports. In so doing, India could drive down global costs in services, just as China drove down global costs in manufacturing. Strengthening intellectual property rights (PRs) and their enforcement. India has passed a series o f IPR laws in the past few years, and their enforcement w i l l be key to i t s success in the knowledge economy. Simplifying and expediting all procedures for the entry and exit o f f i rms , for example, through “single window” clearances. Reducing inefficiencies in factor markets by easing restrictions on hiring and firing o f workers. Improving access to credit for small and medium enterprises. Addressing problems in the use and transfer o f land and updating bankruptcy procedures. Ensuring access to reliable power at reasonable cost by rationalizing power tariffs and improving the financial and operational performance of state electricity boards. Addressing capacity and quality constraints in transport by improving public sector performance and developing speedy, reliable door-to-door transport services (roads, rail, and ports) to enhance India’s competitiveness.
x i
0
0
Improving governance and the efficiency o f government, and encouraging the use of ICTs to increase government’s transparency and accountability. Using ICTs for more effective delivery o f social services, especially in health and education, empowering India’s citizens to contribute to and benefit from faster economic growth.
Developing Educated and Skilled Workers
Education i s the fundamental enabler of the knowledge economy. Well-educated and skilled people are essential for creating, sharing, disseminating, and using knowledge effectively. The knowledge economy of the twenty-first century demands a new set o f new competencies, which includes not only ICT sk i l l s , but also such soft s k i l l s as problem solving, analytical sk i l l s , group learning, working in a team-based environment, and effective communication. Once required only o f managers, these s k i l l s are now important for all workers. Fostering such s k i l l s requires an education system that i s flexible; basic education should provide the foundation for learning, and secondary and tertiary education should develop core s k i l l s that encourage creative and critical thinking. In addition, i t i s necessary to develop an effective lifelong learning system to provide continuing education and s k i l l upgrading to persons after they have left formal education in order to provide the changing s k i l l s necessary to be competitive in the new global economy.
A strong basic education system i s a necessary precondition to underpinning India’s efforts to enhance further the productivity and efficiency o f its economy. China’s experience in t h i s area i s instructive as i t s emphasis on secondary education has provided it with a firm basis for expansion o f manufacturing activities on a global scale. Investments in basic education are thus fundamental for countries to improve the productivity and the quality o f labor and deliver the manpower needed for their development efforts. India has made substantial progress in increasing literacy and increasing primary and secondary enrollments. But the country s t i l l accounts for one-quarter of the world’s 104 mill ion children out of school. The participation of girls in the 6- to 14-year-old age group in elementary education i s low. And considerable gaps exist in access to secondary education, particularly for girls. But, the Indian leadership i s very committed to increasing educational attainment. The national program for universal elementary education, Sarva Shiksha Abhiyan or Education for All, was initiated in 2001, and the constitution was amended in 2002 to make elementary education a fundamental right of every child.
India also possesses a large pool of highly educated and vocationally qualified people who are making their mark, domestically and globally, in science, engineering, IT, and research and development (R&D). But they make up only a small fraction of the population. To create a sustained cadre o f “knowledge workers,” India w i l l need to develop a more relevant educational system and reorient classroom teaching and learning objectives, starting from primary school. The new system would focus on learning, rather than on schooling, and promote creativity. I t would also improve the quality o f tertiary education and provide opportunities for lifelong learning.
Tertiary education i s critical for the construction o f knowledge economies. India currently produces a solid core of knowledge workers in tertiary and scientific and technical education, although the country needs to do more to create a larger cadre o f educated and agile workers who can adapt and use knowledge. Efforts have been put into establishing a top-quality university system that includes many world-class institutions o f higher learning that are competitive and meritocratic, such as Indian Institutes of Technology [IITs], Indian Institutes of Management, Indian Institute o f Science, and the Regional Engineering Colleges [RECs]). Despite these efforts, not all publicly funded universities or other educational institutions in India have been able to maintain high-quality standards or keep pace with developments in knowledge and technology. Major steps are thus needed to ensure that India’s institutions meet high-quality national (and if such services are exported, international) standards.
x i i

Measures are also needed to enhance the quality and relevance o f higher education so that the education system i s more demand driven, quality conscious, and forward looking, especially to retain highly qualified people and meet the new and emerging needs o f the economy.
In the area o f scientific and technical education, even though India produces almost 200,000 scientists, engineers, and technicians a year, i t has not been obtaining the full economic benefit from this s k i l l base, because of the mismatch between education and the labor market. The professional workforce that i s emerging from India’s higher education system often cannot find suitable employment due to a growing gap between their knowledge and real practice and to limited job opportunities in their fields, coupled with low salaries. Many professionals also leave the country in search of better opportunities, which leads to brain drain. This calls for an urgent effort to promote policy and institutional reforms in scientific and technical education for both public and private institutions to improve the quality and sk i l l s o f India’s current and future pool o f technical manpower.
Sk i l ls matter more than ever in today’s more competitive global market. In large countries such as India and Brazil, where the vast majority o f people are unskilled and uneducated, the capabilities of the majority of the population must be enhanced for the economy to show substantial improvements. Firms and farmers alike must be able to learn and develop new s k i l l s . While not losing sight o f the need for secondary and tertiary education, governments should improve the s k i l l and education levels of the mass of people through primary and vocational education. The success o f countries such as China in achieving higher growth reveals the importance of a workforce with a basic education that can be trained. This leads to the issue o f s k i l l s development and training. When technology i s changing, enterprises must invest in worker training to remain competitive. India too w i l l also need to develop various job training programs to be globally competitive. These programs must be flexible, cost-effective, and able to adapt quickly to new s k i l l demands generated by changing markets and technologies.
In addition, India should develop a system of lifelong learning, which encompasses learning from early childhood through retirement and includes formal learning (schools, training institutions, and universities), nonformal learning (structured on-the-job training), and informal learning ( s k i l l s learned from family members or people in the community). In the lifelong learning model, people are motivated to learn on a continuing basis, are equipped with the s k i l l s to engage in self-directed learning, given access to opportunities for learning throughout their lives, and offered financial and cultural incentives to participate in lifelong learning.
Some o f the main issues in strengthening India’s education system, therefore, include the following:
Improving the efficiency in the use o f public resources in the education system, and making the education system as a whole more responsive to market needs, as well as ensuring expanded access to education that fosters critical thinking and learning s k i l l s for all, not just the elites. Enhancing the quality o f primary and secondary education, including tackling issues related to quality and relevance, with special emphasis on ameliorating teacher vacancies and absenteeism, reversing high dropout rates, and correcting inadequate teaching and learning materials and uneven levels o f learning achievement. This i s especially important for India to meet the goal o f providing eight years of schooling for all children by 2010. Ensuring consistency between the sk i l l s taught in primary and secondary education and the needs o f the knowledge economy, introducing materials and methods to teach students “how to learn,” rather than stressing occupation-specific knowledge. Reforming the curriculum o f tertiary education institutions to include s k i l l s and competencies for the knowledge economy (communication ski l ls , problem-solving sk i l ls , creativity, and teamwork) that also meet the needs o f the private sector.
... X l l l
Raising the quality of all higher educational institutions, not just a few world-class ones (such as the IITs). Improving the operating environment for education, especially higher education, which calls for a shift in the role o f the govemment from managing the administrative aspects o f higher education institutions to becoming an architect of education standards and regulations, including improving and monitoring the quality o f academic programs, establishing accreditation standards and procedures, ensuring equity, and coordinating a system with multiple players and multiple pathways to learning. Embracing the contribution o f the private sector in education and training by relaxing bureaucratic hurdles and putting in place better accreditation systems for private providers of education and training. Establishing partnerships between Indian and foreign universities to attract and retain high-quality staff and provide opportunities for students to receive internationally recognized credentials. Increasing university-industry partnerships to ensure consistency between research and the needs o f the economy. This wil l include reforming the university curriculum to include the development o f s k i l l s and competencies that better meet the needs of the private sector. Using ICTs to meet the double goals o f expanding access and improving the quality o f education. Investing in flexible, cost-effective job training programs that are able to adapt quickly to new s k i l l demands generated by changing markets and technologies, aligned with the needs o f f i r m s . Develop a framework for lifelong learning, including programs intended to meet the learning needs o f all, both within and outside the school system. This w i l l also require greater coordination across the different govemment bodies responsible for various components of the education and training system and development of procedures for recognition o f what i s learned in different parts o f the system. Making effective use of distance learning technologies to expand access and the quality o f formal education and lifelong training.
Creating an Efficient Innovation System
The innovation system in any country consists of institutions, rules, and procedures that affect how i t acquires, creates, disseminates, and uses knowledge. Innovation in a developing country concerns not just the domestic development o f frontier-based knowledge. I t relates also to the application and use o f new and existing knowledge in the local context. Innovation requires a climate favorable to entrepreneurs, one that i s free from bureaucratic, regulatory, and other obstacles and fosters interactions between the local and outside business world and, with different sources o f knowledge, including private f m s , universities, research institutes, think tanks, consulting f i rms , and other sources. Tapping global knowledge i s another powerful way to facilitate technological change through channels such as FDI, technology transfer, trade, and technology licensing.
In India, with i t s relatively small formal sector, a very important part o f i t s innovation system relates to how modem and more efficient practices can be diffused to the greatest number o f users. This applies both to domestic and foreign knowledge. India has done a remarkable job o f diffusing knowledge and technology, especially in agriculture. As a result o f the “green revolution,” India has transformed itself from a net importer to a net exporter of food grains. India’s “white revolution” in the production of milk has helped it to achieve the twin goals of raising incomes o f rural poor families and raising the nutrition status of the population. India should continue to build on i t s innovative domestic strengths and undertake efforts to improve the productivity o f agriculture, industry, and services even further. This includes strengthening technology diffusion institutions, such as those related to agricultural extension and industrial extension, productivity-enhancing organizations, and technical information agencies. In India, where large disparity exists between the most and least efficient producers in any sector, considerable economic gains can also be hamessed from moving the average domestic practice to the best domestic practice, not to mention best international practice. This w i l l require a host o f efforts, including improving
xiv

the system for technical norms and standards-such as product quality, work safety, and environmental protection-that can facilitate the proper diffusion of know-how. Efforts also need to be made to improve the dissemination o f technology by strengthening competition so that the most efficient firms expand and improve performance, establishing and enforcing appropriate laws, encouraging more trade among Indian states, allowing for economies o f scale and scope, and facilitating the diffusion o f best products through price- and quality-based competition.
India also needs to increase its efforts to tap into the rapidly growing stock o f global knowledge through channels such as FDI, technology licensing, importation of capital good that embody knowledge, as well as advanced products, components, and services. Compared with countries such as Brazil and China, India i s particularly weak at making effective use o f these resources. These channels are important given the rapid expansion of the global knowledge. Even large advanced economies such as the United States are increasingly acquiring knowledge from beyond i t s borders.
To its credit, India has been taking bold steps to strengthen its R&D infrastructure, developing technological innovations and altering the mind set of its people toward better creation, acquisition and use of technology. I t i s endowed with a critical mass o f scientists, engineers, and technicians in R&D and i s home to dynamic hubs o f innovation, such as Bangalore and Hyderabad. I t also has vast and diversified publicly funded R&D institutions, as well as world-class institutions of higher learning, all o f which provide critical human capital.
India i s also emerging as a major global R&D platform; about 100 multinational companies (MNCs) have already set up R&D centers in the country, leading to the deepening o f technological and innovative capabilities among Indian f i r m s . Several Indian companies, such as Ranbaxy and Dr. Reddy’s Laboratories have also started forming R&D alliances with global f m s . Such collaboration presents several benefits for Indian industry, because the linkages among local f i rms , universities, and research institutes and the worldwide R&D network o f multinationals further integrate India into global technology development. Such R&D activities have also been useful in inculcating a commercial culture among scientists, helping them to apply knowledge for productive ends. The outsourcing o f high-end R&D to India i s yet another new trend that i s evident from the large number o f established R&D outsourcing centers in India, from IT and telecom to automotive and pharmaceuticals sectors. India i s also developing public-private partnerships to harness the potential o f traditional knowledge to meet health and welfare needs and to reduce poverty.
Despite these accomplishments, India spends only a small fraction of i t s GDP on R&D. It gets very little in worldwide royalty and license fee receipts. Regarding scientific and technical articles in mainstream journals (per mill ion people), India matches the performance o f China, but the contributions o f both countries are very low compared with developed countries. FDI, although increasing, i s also rather low by global standards. The majority o f the R&D-related inward FDI in India materialized only after the economy had been liberalized. This FDI, however small, has been creating a new competitive advantage for the country, especially in the IT domain and in industries, such as automotive. Availability o f venture capital i s also rather limited in India, but some signs o f vibrancy are evident, and a notable venture capital investment market i s emerging.
In addition, India’s share o f global patenting i s small; therefore, despite having a strong R&D infrastructure, India i s weak on turning i t s research into profitable applications. But, an increasing trend i s discernible in the number o f patents granted to companies by the Indian Patent Office, indicating greater awareness o f the importance o f knowledge and the value o f protecting i t through patents. Among Indian patents, it i s the drugs and electronics industry that has shown a sharp increase in patenting in recent years. In addition, several Indian f i r m s have registered their innovations with the United States Patent and Trademark Office (USPTO). The number o f U.S. patent grants to the Council for Scientific and Industrial
xv

Research (CSIR), for example, increased fromjust six in 1990-91 to 196 in 2003-04. This shows that the focus o f research i s shifting to patentable innovations, indicating better conceptualization of research. The recent amendments to the Indian Patent Act adopted in a move toward adhering to the intellectual property norms under Trade-Related Aspects o f Intellectual Property Rights (TRIPS) has also boosted confidence among international players.
In India, some 70 percent of R&D i s performed by the central and state governments, an additional 27 percent by enterprises (both public and private sector industries), and less than 3 percent by universities and other higher education institutions. In contrast, in most countries in the Organisation for Economic Cooperation and Development (OECD), the private sector finances 50-60 percent o f R&D, because it increasingly has the finance, knowledge, and personnel needed for technological innovation. Firms play an even bigger role in R&D in Ireland, Japan, Korea, and Sweden. Universities also undertake research to a much larger extent in developed countries and have stronger linkages with the corporate world.
India should thus take steps to improve i t s innovation system further, not only by taking advantage o f new knowledge created at home, but also by tapping knowledge from abroad and disseminating it for greater economic and social development. I t should also improve the efficiency o f public R&D and increase private R&D, as well as encourage greater university-industry linkages.
Some o f the key issues to address in this domain include:
Tapping into the growing stock o f global knowledge more effectively and providing incentives for international technology transfer through trade, FDI, licensing, and personnel movements, along with informal means through imitation, reverse engineering, and spillovers. Attracting FDI more effectively, given the importance o f FDI in the generation and dissemination of global knowledge and the role that they can have in domestic R&D. This should include removing regulations on foreign investment and encouraging FDI R&D into the country. Encouraging members o f the Diaspora and renowned expatriates to contribute further to innovative activities by appointing them to the management boards o f national research institutes, universities, and so on to facilitate the design o f university programs that better suit corporate requirements. Motivating scientists and engineers from India working in the United States and other developed countries to enter into alliances with multinational companies and establish f i r m s or labs to undertake R&D on a contract basis in India. Auditing and monitoring S&T efforts and institutional performance to identify what works well and then redeploying resources to programs that have a proven track record o f success. Using the savings to strengthen university-industry programs by means o f matching grants and other initiatives, including encouraging academics to spend sabbaticals in relevant industries so that their research meets the needs o f the productive sector. Finding alternative sources o f funding for R&D, especially as the government reduces i t s budgetary support for research programs. In some countries such as China, academic institutions are launching commercial ventures o f their own or in collaboration with the corporate sector. Allowing national research institutes to collaborate with domestic and foreign f m s to forge closer links with industry. One way of encouraging scientists to work closely with industry and in so doing improving linkages between technology development and application would be to provide incentives such as bonuses and a share o f royalties from products created through their research. Paying adequate salaries and creating a proper working environment for scientists and engineers that provides them with access to capital equipment, instruments, and other infrastructure needed for R&D. Failure to compensate researchers adequately and lack o f a supportive environment w i l l only exacerbate the problem o f brain drain.
xv i
0
0
0
0
0
0
0
0
0
e
0
Restructuring and modernizing universities and publicly funded R&D institutions by giving them flexibility, freedom o f operation, and financial autonomy. Increasing the intake o f students into science and engineering, given the competition for recruitment o f trained personnel; this may require adding colleges and universities (such as IITs or others modeled after them). Developing entrepreneurial s k i l l s and management training for S&T professionals to encourage them to undertake business activities. Encouraging the private sector to invest in R&D. Strengthening R&D by companies so that they can have a more demand-driven and market-oriented approach with closer collaboration among researchers, partners, and customers in developing new products and services that can be speedily brought to the market. Developing communication and other infrastructure for R&D, and creating an attractive environment to motivate R&D investments, including favorable tax, and other incentives. Establishing science and technology parks to encourage industry-university collaboration. Such parks might attract R&D work from both foreign and domestic f i r m s if the parks are situated close to reputable academic institutions. Encouraging venture capital, which can also be used as an incentive for commercialization o f research. Effectively enforcing and implementing P R to create confidence among domestic and foreign innovators on protection of their innovations in the country. Promoting a national fund to support grassroots innovators, with the aim o f building a national register o f innovators, converting innovations into viable business plans, and disseminating knowledge of indigenous innovations, especially for job creation. Strengthening the emerging new model o f reverse drug design to produce innovations in a more cost- effective way based on leveraging traditional knowledge with modem science and exploiting public- private partnerships.
Building a Dynamic Information Infrastructure
Rapid advances in ICTs are dramatically affecting economic and social activities, as well as the acquisition, creation, dissemination, and use o f knowledge. The use o f ICTs i s reducing transaction costs and lowering the barriers o f time and space, allowing the mass production o f customized goods and services. With ICT use becoming all-pervasive and i t s impacts transformational, i t has become an essential backbone of the knowledge economy. The information infrastructure in a country consists o f telecommunications networks, strategic information systems, policy and legal frameworks affecting their deployment, and skilled human resources needed to develop and use it.
India’s telecommunications sector has registered rapid growth in recent years, spurred by reforms to open markets, and introduced more competition. Many domestic and international private sector entrants are now providing consumers with high-quality services at low prices. As a result, some spectacular successes have resulted: more than 47 mill ion people had mobile phones at the end o f 2004! Fierce price competition has resulted in Indian mobile telephony becoming one o f the cheapest in the world. This has been a boon, especially to people in India’s 600,000 rural villages, which have had no access to communication through traditional means, such as fixed lines. But now, from fishermen at sea and brokers ashore in Kerala to farmers in Punjab-people in industry and farming are embracing wireless technology for economic activity and to do business and increase their profit margins. The Indian government, in keeping pace with up-to-date technological advancements, announced i t s Broadband Policy in 2004 to provide an impetus to broadband and Internet penetration in the country.
xv i i

India can also boast o f remarkable and impressive global achievements in the IT sector. According to the National Association o f Software and Services Companies (NASSCOM), the Indian IT market has grown from $1.73 bil l ion in 1994-95 to $19.9 bil l ion in 2003-04, accounting for about 3.82 percent o f India’s GDP in 2003-04 and providing employment for almost a mill ion people. India’s IT services are moving up the value chain, and India i s now undertaking new and innovative work, such as the management for clients o f IT-related business processes. It i s making an impact also in IT consulting, in which companies such as Wipro, Infosys, and Tata are managing IT networks in the United States and re-engineering business processes. In fact, Infosys was ranked the ninth most respectable IT company in the world in 2004, behind Hewlett Packard, IBM, Dell, Microsoft,’ AP, Cisco, Intel, and Oracle. In chip design, In te l and Texas Instruments are using India as an R&D hub for microprocessors and multimedia chips. The success o f the IT industry on the whole influenced competitiveness in other sectors as well by building confidence in Indian industry, enhancing the country’s brand equity in the world, and offering entrepreneurial opportunities on a global scale. In the future, i t i s expected that India w i l l make inroads in areas such as financial analysis, industrial engineering, analytics, and drug research.
Several factors have contributed to India’s success in the IT industry including the existence o f a highly skilled, English-speaking workforce corning out o f India’s engineering schools and earning lower wages than European and U.S. counterparts, low dependence o f IT on physical infrastructure, the Indian Diaspora, and the introduction of current account convertibility and easing o f controls and regulations in the early 1990s.
Various forecasts have also been made on where the IT industry i s heading. According to WEF’s Global Information Technology Report 2002-03 (2003), India’s IT industry i s expected to grow at a compounded annual rate o f 38 percent to reach $77 bil l ion by 2008-contributing to 20 percent o f India’s anticipated GDP growth in this period and 30 percent o f its foreign exchange earnings. B y that year, i t i s also expected to employ more than 2 mill ion people and indirectly create another 2 mill ion jobs! But one o f the key inputs to achieving sustained growth and exports in the IT sector w i l l be the availability o f high- quality professionals in adequate numbers. India needs to maintain and enhance i t s competitive advantage o f having abundant, high-quality, and cost-effective human resources. The country must ensure the right mix o f technical, business, and functional s k i l l s in the workforce to meet the needs o f individual business segments and customer markets. This requires harmonization of the demands o f industry with the supply o f trained manpower coming from Indian educational and training institutions.
As a result o f the IT explosion and impressive progress in the telecommunications and ICT sector, i t i s no surprise that usage of ICTs has been growing in the country. But explosive growth o f ICTs has mainly been concentrated in urban areas. As the telecommunications sector moves to a more commercial and competitive environment, the government should implement practical policies to enhance the reach o f IT to groups not well served by the market. The real challenge i s to promote the effective application and use of ICTs throughout the economy to raise productivity and growth, not just in a few pockets. Ensuring that the benefits o f ICTs are shared by all requires an enabling environment for ICTs. Critical elements include increasing access to ICTs through widespread availability o f telephones, increasingly including mobile phones, computers, and connectivity to the Internet; enhancing ICT literacy and s k i l l s among the population, more so in the rural areas; and developing ICT applications that can provide much-needed social, economic, and government services to citizens.
Some steps in enhancing India’s information infrastructure in the country include the following:
0 Enhancing regulatory certainty and efficiency to facilitate new services that w i l l enable India to reap the benefits of the convergence o f existing and new technologies and enable the sector to contribute more to economic growth.
xvi i i

0
0
e
0
e
e
0
0
0
e
e
e
Boosting ICT penetration by resolving regulatory issues in communications and reducing and rationalizing tariff structures on hardware and software. Increasing the use o f ICTs as a competitive tool to improve the efficiency of production and marketing in areas such as supply chain management, logistics, information sharing on what goods are selling in the markets, responding to rapidly changing market needs, and so on. Moving up the value chain in IT by developing high-value products through R&D, improving the quality o f products and services, marketing products and building brand equity to position the “India” brand name further, including by strengthening marketing channels with strategic global links, expanding the focus outside the United States to emerging markets in Asia, Pacific, Japan, and so on. Providing suitable incentives to promote IT applications for the domestic economy, as the focus currently seems to be mainly on IT services exports. This includes developing local language content and applications. Putting in place suitable human resource development and training initiatives, starting at the primary school and moving on to the tertiary levels to meet the expected growth of IT and other productive sectors o f the economy. Updating syllabuses in computer engineering, electronics, and IT in various technical institutions to meet the demands o f industry (curriculum in other branches o f engineering should also be broadly based to include IT subjects) Massively enhancing ICT literacy and s k i l l s among the population at large through conventional and nonconventional means, so that people can begin to use ICTs to derive benefits, both economically and socially. Creating opportunities for local communities to benefit from ICTs by providing support (seed money for local innovation on low-cost and appropriate technologies), enhancing private investment in ICT infrastructure, and promoting national and international support for rural community-based access. Strengthening partnerships among government agencies, research and academic institutions, private companies, and nongovernmental organizations (NGOs) to ramp up the ICT infrastructure and achieve faster penetration of ICTs. Further developing and scaling up (in joint public-private initiatives where feasible) ICT applications, such as community radio, fixedmobile phones, smart cards, Internet, and satellite television, to bring the benefits of connectivity to rural communities all across the country and improve the delivery o f services to rural populations. Sharing successful applications o f ICT, for example, in e-government among different Indian states. This also requires scaling up successful ICT initiatives to bring the benefits o f connectivity to rural communities all across the country. Creating a suitable environment for the effective use o f ICTs to permeate the entire economy and lead to flourishing competition and business growth. This calls for the government to continue with the economic reform agenda put in place in the past decade.
Looking Ahead
The notion o f a knowledge economy i s not new or foreign to India. India’s past achievements in science, philosophy, mathematics, and astronomy reinforce the notion that the country has for millennia been a leading “knowledge society.” In economic terms, India was the world’s largest economy in the f i r s t millennium, producing a third of global GDP (see Figure B). B y 1500 i t s share had declined to 25 percent, as China overtook i t and Western Europe’s share began to expand rapidly. India’s share continued to fall after 1700 due to the collapse o f the Moghul Empire, the costs o f adjusting to British governance, and the rapid increase in the share o f Western Europe, followed by the spectacular rise o f the United States. India was a latecomer to the industrial revolution. I t cannot afford to m i s s the knowledge revolution !
xix

Figure B: India: Percentage Share of Global Gross Domestic Product, Years 0-1998 (percent)
40
35
30
25
20
15
10
5
0
-e W estern Europe -a- United States -A- Japan +China -m- India
Source: Maddison (2001).
Today, Indian policy makers are keenly aware o f the challenges and opportunities that India faces in different sectors and are already starting to implement some o f the key actions that are necessary to bolster India’s effective transformation to the knowledge economy. Various reports, including the Indian Planning Commission’s reports on India as Knowledge Superpower: Strategy for Transformation (2001a) and Zndia Vision 2020(2002a); the President’s (Dr. A. P. J. Abdul Kalam’s) 2002 strategy India 2020: A Vision for the New Millennium (Kalam and Rajan 2002); and the High-Level Strategic Group’s India’s New Opportunity, 2020 (AIMA 2003) underline ways to address India’s transition to the knowledge economy.
India, thus, has already developed a vision and strategies to address i t s transition to the knowledge economy. In the main, i t s initiatives have, however, largely been developed around the three functional pillars o f the knowledge economy (education, innovation, and ICTs). But to get the maximum benefits from investments in these areas, these initiatives must be part of a broader reform agenda, because some elements o f India’s current economic and institutional regime are constraining full realization o f India’s potential. India will, for example, not reap the full benefits of i t s investments in increasing education, ramping up ICTs, or even doing more R&D, unless its broader institutional and incentive regime stimulates the most effective use o f resources in these areas, permits their deployment to the most productive uses, and allows entrepreneurial activity to flourish to contribute better to India’s growth and overall development.
I t i s hoped that th i s report w i l l help stimulate, through a consultative process, a greater sense o f the importance o f the emerging policy agenda on the knowledge economy in India. India’s effective transformation to a knowledge economy calls for i t to act in many different policy domains, deepening, complementing, or reorienting ongoing reforms to use knowledge efficiently and sustaining development in the long term to achieve inclusive growth. India needs to recognize that many policy reforms leading to a knowledge-based economy wi l l not yield results overnight. I t w i l l thus need to make some tough choices in the short term; yet, other reforms w i l l be o f a medium- to long-term nature.
xx
I t i s clear, however, that going ahead with such an ambitious agenda in India first and foremost requires raising massive awareness and consultation among all interested stakeholders in government, the private sector, and civil society on the need and plans for such a transformation. Creating a shared vision among all parties on ways to accelerate India’s progress toward the knowledge economy i s thus important, as well as commitment on the part o f all stakeholders to stay the course in order to manage such a transition effectively. Effective leadership w i l l be key to articulating this vision, through the involvement o f all stakeholders. I t also requires that the country develop a “virtuous” cycle between growth and the reform process.
Moving to a knowledge economy, however, i s not only about stimulating such a reform agenda from the top. What w i l l be needed i s trial-and-error experimentation on what works in a bottom-up fashion and what does not work in the Indian context as well as scaling up successful bottom-up initiatives. The process requires that India constantly monitor i t s achievements and adjust i t s strategy in light of changing conditions.
Launching a Process
To make this agenda even more action oriented, an important signal needs to be given, as i s amply demonstrated by the experience o f other countries highlighted above. A concrete way to begin this process would be to designate a national “knowledge” champion to advance the knowledge economy agenda in India by integrating the economic reform agenda with initiatives already taking place in more functional areas.
A very appropriate national champion to coordinate and orchestrate the necessary knowledge-related actions across the various domains would be the Prime Minister’s office. In fact, recently, the Prime Minister has proposed the setting up o f a Knowledge Commission to leverage various knowledge networks to make India a knowledge engine o f the world. This function could, for example, organize a Knowledge Economy Task Force, headed by the Prime Minister and comprising stakeholders from government, the private sector, academia, think tanks, research organizations, and NGOs. The main objective o f the task force would be to determine ways o f coordinating action involving diverse stakeholders to tackle key reforms in the four pillars o f the knowledge economy and sequence the investments necessary to move India successfully into the knowledge economy o f the twenty-first century. Some examples o f cross-cutting knowledge economy issues that the task force could address include:
In the past decade, India has undertaken major economic reforms; as a result, i t s growth rate has increased from 3.5 percent in the 1950s to 1970s to approximately 6 percent between the 1980s and 2002. During much o f this period, however, China has been growing at about 10 percent. What are the fundamental reforms needed to unleash India’s tremendous entrepreneurial potential and benefit from more active participation in the global knowledge economy to achieve this higher rate of growth sustainably? What actions are necessary to bring in a much larger proportion o f the population into the modem sector? What special initiatives have to be undertaken to marshal1 knowledge to improve the livelihoods o f the poor? India has the advantage o f a highly skilled human resource base, which has gained world renown. It also has world-class institutions that train this world-class manpower, but on a limited scale. What would i t take to ramp up such institutions even further so that India can become a leader in education and training, not only in IT and software, but also more generally in high-skill areas that can provide greater outsourcing services to the world? An increasing number o f multinational corporations are currently working with Indian f i i s to contract and subcontract high-end R&D. How can India become a global leader in innovation in i t s
xxi
own right, not only in IT-related areas in which i t has carved out a global niche, but also in other knowledge-intensive industries, such as pharmaceuticals and biotechnology? India i s a leading exporter o f IT services and software, but has not yet fully harnessed the potential o f ICTs at home to reduce transaction costs and improve efficiency. As it has a large local market and many needs, what wi l l i t take for India to exploit this capability on a larger scale domestically and help the country leapfrog even more rapidly into the knowledge economy of the twenty-first century?
e
Dealing with the kinds o f illustrative issues highlighted above requires prioritization and working with many different interest groups, which i s not an easy task; thus, some guiding principles for the Knowledge Economy Task Force would include the following:
e Defining priorities and establishing budgets e Adopting systemic, integrated approaches for the different policy planks at all levels of government e Mobilizing state governments, which are key to the Indian economy and its modernization e Multiplying experiments and publicizing concrete initiatives that clearly exemplify the move to a
knowledge-based economy. The role o f the Prime Minister’s office would be to put in place a robust mechanism to facilitate, monitor, and scale up successful initiatives.
In sum, India i s well positioned to take advantage o f the knowledge revolution to accelerate growth and competitiveness and improve the welfare of i t s citizens and should continue to leverage its strengths to become a leader in knowledge creation and use. In the twenty-first century, India w i l l be judged by the extent to which it lays down the appropriate “rules o f the game” that w i l l enable i t to marshal i t s human resources, strengths in innovation, and global niches in IT to improve overall economic and social development and transform i tsel f into a knowledge-driven economy. Sustained and integrated implementation o f the various policy measures in these domains would help to reposition India as a significant global economic power, so that i t can rightfully take i t s place among the ranks o f countries that are harnessing knowledge and technology for their overall economic development and social well-being.
A Final Note
This report presents an outside view o f India’s position on the global scale, recognizes India’s achievements, but sees a tremendous potential that i s yet to be unleashed. What i s needed i s an India-led process o f coordination and integration o f the different reforms, combining those in the economic and institutional regime with the many initiatives that are actually being undertaken in more functional areas, as covered in many Indian strategy reports. Consolidating and launching these can only be done through a domestic process of consultation, stakeholder awareness, and buy-in to get backing for the necessary reforms to implement the various actions needed to leverage India’s potential. It i s hoped that this perspective serves as an additional vote o f confidence to help catalyze such an integrated and well- grounded process.
xx i i


1. INDIA AND THE KNOWLEDGE ECONOMY: OPPORTUNITIES AND CHALLENGES
One of the world’s largest economies, India has made tremendous strides in i t s economic and social development in the past two decades. After growing at about 3.5 percent from the 1950s to the 1970s, the country’s economy expanded during the 1980s to reach an annual growth rate o f about 5.5 percent by the end o f the decade. In 1991 India embarked on a new development strategy and introduced policies designed to improve i t s growth prospects and increase i t s integration into the global economy. Recognizing that comparative advantage in the new economy wi l l shift to those who have the ability to create, adapt, and use knowledge to spur growth and innovation, India went forward with a series o f reforms in the 1990s: opening up more sectors to private investment, encouraging foreign direct investment (FDI), significantly reducing red tape, further liberalizing trade policy and the exchange rate regime, and reforming capital markets, leading to an improved investment climate. As central controls have receded, states have also acquired more freedom to maneuver, and some, such as Andhra Pradesh, Karnataka, and Maharashtra, have shown progress in encouraging private investment.
India i s now poised to realize even faster growth. The time is, therefore, opportune for the country to make further progress toward a knowledge economy-one that create, disseminates, and uses knowledge to enhance i t s growth and development. To t h i s end, i t i s important for India’s leaders and interested stakeholders to assess India’s overall knowledge readiness. How well i s it addressing key issues in making effective use o f knowledge for development? How does India compare with the rest of the world on what can be called four pillars of the knowledge economy: the economic and institutional regime (including governance), education and human resources, the innovation system, and information infrastructure? This chapter reviews India’s current economic context, the importance of knowledge in an increasingly dynamic and competitive global environment, and the opportunities and challenges India faces in becoming even more knowledge based.
The Current Economic Context
Under India’s revised development strategy, the country has continued to make good progress in increasing incomes and improving l iving standards. The poverty incidence decreased from 44.5 percent in the 1980s to 26 percent in 2000,’ and the overall literacy rate increased from 44 percent to 65 percent in the same period. FDI inflows rose from virtually nothing in the 1990s to $4.26 bil l ion in 2003, although they are s t i l l low compared with China, which attracted $53.5 bil l ion in the same year. In the 1990s India also made progress on the Millennium Development Goals (MDGs)~ o f eradicating poverty and hunger, increasing primary enrollment, promoting gender equality, reducing child mortality, and improving access to water and sanitation (UNDP 2003) (Box 1-1).
’ T h i s i s based on an intemational poverty line of $1 per day, wi th adjustments for purchasing power across countries. The Foverty incidence of 26 percent i s based on estimates o f the Govemment o f India (World Bank 2003d).
The MDGs commit the intemational community to an expanded vision o f development and have been commonly accepted as a framework for measuring development progress. The goals are to (a) eradicate extreme poverty and hunger, (b) achieve universal primary education, (c) promote gender equality and empower women, (d) reduce child mortality, (e) improve matemal health, (fl combat HIV/AIDS, malaria, and other diseases, (g) ensure environmental sustainability, and (h) develop a global partnership for development. For more information, go to http://www.developmentgoals.org/.
1

Box 1-1: Assessing India’s Progress on Millennium Development Goals in the 1990s Significant reduction in poverty and improvements in literacy and school enrollments were achieved in India in the 1990s. Poverty fe l l by 1.2 percentage points a year and the enrollment rate among primary-aged children grew by 1 percentage point a year. Forecasting the likelihood of India achieving the MDGs by their target dates i s difficult, because the desired outcomes wi l l require coordinated interventions across many sectors. Nevertheless, a comparison between actual progress in the 1990s and needed progress to achieve MDGs i s useful. Targeted reductions in poverty wi l l be achieved if poverty levels continue to fall by at least 0.7 percentage points a year. Progress in primary school enrollment rates, however, must accelerate to 1.5 percentage points a year to achieve the relevant MDGs. Compared with poverty and education, progress in health indicators was slower in the 1990s; rapid acceleration i s necessary if India i s to reach the stated goals by 2015.
I t i s worth noting that a l l 15 o f the largest states (accounting for more than 90 percent o f India’s population), including the three large and poor states-Uttar Pradesh, Bihar, and Madhya Pradesh-showed progress in reducing poverty (including rural poverty) and by and large improving social indicators. As better-performing states have made faster progress, however, poverty and illiteracy have become more concentrated in India’s large and poor states. Although Uttar Pradesh, Bihar, and Madhya Pradesh accounted for 41 percent of India‘s poor in the early 199Os, this figure had r isen to nearly 50 percent by the end o f the 1990s. India cannot achieve the MDGs without widening economic opportunities and overcoming barriers to more rapid poverty reduction and better human outcomes in these poorer states.
Source: World Bank (2004a).
Embarking on a new growth path. After significant economic expansion in the 1980s, India increased i t s rate o f growth to 6.7 percent between 1992-93 and 1996-97; this dropped to 5.5 percent f rom 1997-98 to 2001-02, and 4.4 percent in 2002-03, due to the impact o f poor rains on agricultural output. But, thanks to a lavish monsoon that led to a turnaround in the agriculture sector, in 2003-04, India’s economy surged ahead to a growth rate o f 8.2 percent. This rate i s very much in line with growth projections cited in India’s Tenth Five-Year Plan (India, Planning Commission 2002e), which calls for increasing growth to an average o f 8 percent between 2002-03 and 2006-07.3 Such sustained acceleration will be needed to provide opportunities for India’s growing population and i t s even faster-growing ~ o r k f o r c e . ~
India could experience continued high growth in the future. Figure 1-1 shows what India can achieve by the year 2020, based on different assumptions about i t s abil i ty to use knowledge. Here, total factor productivity (TFP) i s taken to be a proxy for a nation’s learning capability.
India’s Tenth Five-Year Plan i s available at http://planningcommission.nic,in/plans/planrel/fiveyr/weIcome. html. The investment bank Goldman Sachs forecasts that, although growth in the next 50 years wil l slow sharply in the world‘s six big, rich countries (United States, Japan, United Kingdom, Germany, France, and Italy) and in Brazil, Russia, and China, India wi l l continue to have an average annual growth of more than 5 percent throughout this period. By 2032 its GDP wi l l be bigger than Japan’s! By 2050 India has the potential o f raising its national income per capita in dollar terms by 35 times the current level (Wilson and Purushothaman 2003).
(including China‘s) taken together (The Economist 2004d). During the present decade, one estimate suggests that India’s labor force wil l expand by 50 percent more than all o f East Asia‘s
2
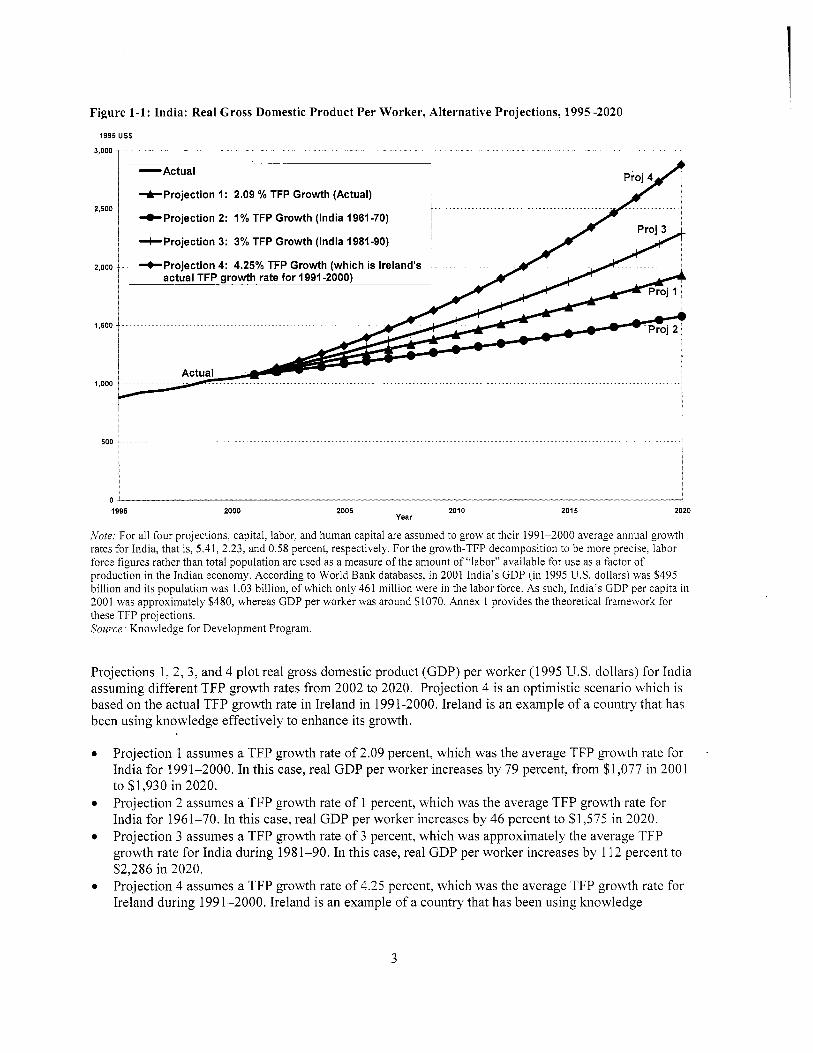
Figure 1-1: India: Real Gross Domestic Product Per Worker, Alternative Projections, 1995-2020
1995 US$
3,000
2,500
2,000
1,500
1,000
500
0 1995
.,... , . ... . . ” . . .,... ., . , , , , . , ^ . . . .. , . . . , , . , . ,
I 1 -Actual Proj 4
I +Projection 1: 2.09 % TFP Growth (Actual)
4-Proiection 2: 1 % TFP Growth (India 1961 -70)
+Projection 3: 3% TFP Growth (India 1981-90)
+Projection 4: 4.25% TFP Growth (which is Ireland‘s actual TFP growth rate for 1991 -2000)
1 $
2000 2005 2010 Year
2015 2020
f i o te : For all four projections, capital, labor, and human capital are assumed to grow at their 1991-2000 average annual growth rates for India, that is, 5.41, 2.23, and 0.58 percent, respectively. For the growth-TFP decomposition to be more precise. labor force figures rather than total population are used as a measure o f the amount o f ‘‘labor’’ available for use as a factor o f production in the Indian economy. According to World Bank databases, in 2001 India’s GDP (in 1995 U.S. dollars) was $495 billion and its population was 1.03 billion, o f which only 461 million were in the labor force. As such, India‘s GDP per capita in 2001 was approximately $480, whereas GDP per worker was around $1070. Annex 1 provides the theoretical framework for these TFP projections. Source. Knowledge for Development Program.
Projections 1,2, 3, and 4 plot real gross domestic product (GDP) per worker (1995 U.S. dollars) for India assuming different TFP growth rates f rom 2002 to 2020. Projection 4 i s an optimistic scenario which i s based on the actual TFP growth rate in Ireland in 1991-2000. Ireland i s an example o f a country that has been using knowledge effectively to enhance i t s growth.
Projection 1 assumes a TFP growth rate o f 2.09 percent, which was the average TFP growth rate for India for 1991-2000. In this case, real GDP per worker increases by 79 percent, f rom $1,077 in 2001 to $1,930 in 2020. Projection 2 assumes a TFP growth rate o f 1 percent, which was the average TFP growth rate for India for 1961-70. In this case, real GDP per worker increases by 46 percent to $1,575 in 2020. Projection 3 assumes a TFP growth rate o f 3 percent, which was approximately the average TFP growth rate for India during 1981-90. In this case, real GDP per worker increases by 112 percent to $2,286 in 2020. Projection 4 assumes a TFP growth rate o f 4.25 percent, which was the average TFP growth rate for Ireland during 1991-2000. Ireland i s an example o f a country that has been using knowledge
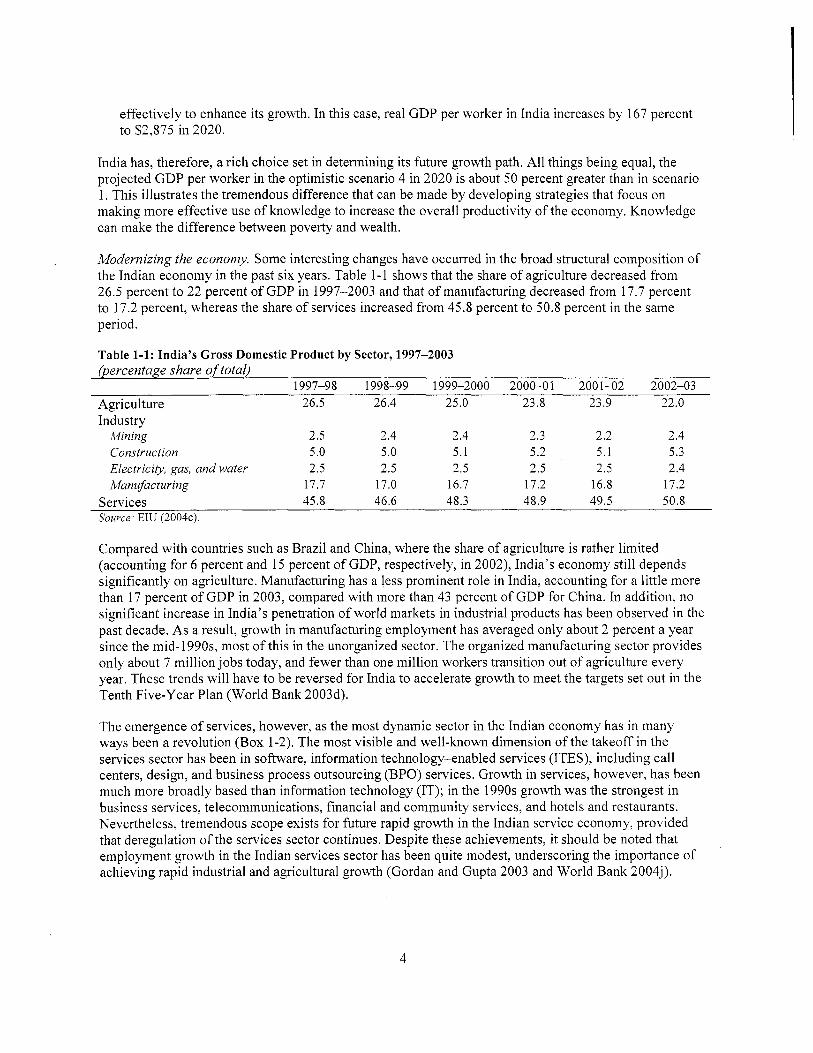
effectively to enhance i t s growth. In this case, real GDP per worker in India increases by 167 percent to $2,875 in 2020.
India has, therefore, a r ich choice set in determining i t s future growth path. All things being equal, the projected GDP per worker in the optimistic scenario 4 in 2020 i s about 50 percent greater than in scenario 1. This illustrates the tremendous difference that can be made by developing strategies that focus on making more effective use o f knowledge to increase the overall productivity o f the economy. Knowledge can make the difference between poverty and wealth.
Modernizing the economy. Some interesting changes have occurred in the broad structural composition o f the Indian economy in the past six years. Table 1-1 shows that the share o f agriculture decreased from 26.5 percent t o 22 percent o f GDP in 1997-2003 and that o f manufacturing decreased from 17.7 percent to 17.2 percent, whereas the share o f services increased from 45.8 percent to 50.8 percent in the same period.
Table 1-1: India’s Gross Domestic Product by Sector, 1997-2003 (percentage share of total)
1997-98 1998-99 1999-2000 2000-01 2001-02 2002-03 Agriculture 26.5 26.4 25.0 23.8 23.9 22.0 Industry
Mining 2.5 2.4 2.4 2.3 2.2 2.4 Construction 5 .O 5.0 5.1 5.2 5.1 5.3 Electricity, gas, and water 2.5 2.5 2.5 2.5 2.5 2.4 Manufacturing 17.7 17.0 16.7 17.2 16.8 17.2
Services 45.8 46.6 48.3 48.9 49.5 50.8 Source: EIU (2004~).
Compared with countries such as Brazil and China, where the share o f agriculture i s rather limited (accounting for 6 percent and 15 percent o f GDP, respectively, in 2002), India’s economy s t i l l depends significantly on agriculture. Manufacturing has a less prominent role in India, accounting for a l itt le more than 17 percent o f GDP in 2003, compared with more than 43 percent o f GDP for China. In addition, no significant increase in India’s penetration o f wor ld markets in industrial products has been observed in the past decade. As a result, growth in manufacturing employment has averaged only about 2 percent a year since the mid-l990s, most o f this in the unorganized sector. The organized manufacturing sector provides only about 7 mi l l ion jobs today, and fewer than one mi l l ion workers transition out o f agriculture every year. These trends will have to be reversed for India to accelerate growth to meet the targets set out in the Tenth Five-Year Plan (World Bank 2003d).
The emergence o f services, however, as the most dynamic sector in the Indian economy has in many ways been a revolution (Box 1-2). The most visible and well-known dimension o f the takeoff in the services sector has been in software, information technology-enabled services (ITES), including cal l centers, design, and business process outsourcing (BPO) services. Growth in services, however, has been much more broadly based than information technology (IT); in the 1990s growth was the strongest in business services, telecommunications, financial and community services, and hotels and restaurants. Nevertheless, tremendous scope exists for future rapid growth in the Indian service economy, provided that deregulation o f the services sector continues. Despite these achievements, it should be noted that employment growth in the Indian services sector has been quite modest, underscoring the importance o f achieving rapid industrial and agricultural growth (Gordan and Gupta 2003 and Wor ld Bank 2004j).
4

Box 1-2: India Undergoes a Services Revolution India’s exports o f services grew by 17 percent a year throughout the 1990s-almost twice the 9 percent growth rate o f the services sector as a whole, which itself accounted for nearly 60 percent o f India’s overall economic growth. I t i s estimated that, if the growth trend in services from 1995-2000 persists, by 2009-10 India’s exports o f services would not only exceed exports o f goods, but the country would export more services than China, South Korea, Brazil, and Singapore combined!
A large part o f the dynamism in the services sector i s due to factors such as the high income elasticity o f demand for services, cost-reducing and variety-enhancing technological advances, and changes in the method o f organizing production favoring increased outsourcing. Access to a growing external market for services and the gradual, although partial, liberalization o f the domestic economy has also played a significant role. Trade liberalization in services, both in India and internationally, has provided access to a growing external market for services for Indian firms, while also attracting FDI in services to India. FDI in services grew by 36 percent in 2001, almost twice the rate of growth in India’s nonservices FDI. IT-related services accounted for 34 percent o f India’s services exports in 2001-02, up from 19 percent in 1997-98.
Going forward, securing the gains delivered by India’s “services revolution” demands deeper reforms at home, combined with a more aggressively outward-looking negotiating stance in international trade talks. India must address on the external front the problem o f actual and potential protectionism and domestically the persistence o f restrictions on trade and investment and weaknesses in the regulatory framework. Liberalized services such as I T and telecommunications have attracted significant investment and have grown faster and created more jobs than the protected services sectors. The current round o f World Trade Organization (WTO) negotiations also offers India a remarkable opportunity to eliminate existing barriers to i t s services exports and prevent introduction o f new ones. But, liberalization must also deliver benefits to the poor and weak sections o f society to give them access to the improved opportunities offered by India’s services revolution. One model i s the universal service fund already set up in the telecommunications sector, in which part o f the revenue i s set aside to finance service provision in more remote areas without undermining overall efficiency. The following steps would help India sustain its services revolution and build a more competitive domestic economy, both o f which underpin the country’s prospects for continued economic growth and poverty reduction:
e Take a far more aggressive position in international negotiations on the General Agreement on Trade in Services (GATS), and seek to lock in the current open international trade regime for cross-border trade in services. Seek liberal access for the strictly temporary movement o f skilled professionals as employees o f trans- border companies or to fulfil1 services contracts. Creation o f a service provider visa with streamlined and transparent procedures would facilitate movement for these provider classes. Open professional services, such as accountancy and legal services, and retail distribution to international competition, and eliminate restrictions on trade in financial and telecommunications. Reduce discretion in issuing o f licenses and permits, and eliminate unnecessary red tape that inhibits efficient operation o f firms, capital movement, and productivity. Reduce restrictions on the operation o f domestic firms in road transport, financial, accountancy, and construction services. Improve regulation in health and education to protect the interests o f Indian consumers and help Indian service providers secure access to foreign markets.
e
Source: World Bank (2004j).
Comparing Zndia globally. B y global measures, India’s economy i s s t i l l relatively small: with 17 percent of the world’s people, India accounts for less than 2 percent o f global GDP and 1 percent o f world trade. Impressive as i t s growth performance has been, i t has lagged behind China’s, which had an average annual GDP growth rate o f 9.8 percent in 1991-2003 (and 9.2 percent between 1980-1990). Figure 1-2 shows that India’s GDP per capita has been increasing, albeit at a much lower rate than in China or Brazil.
5
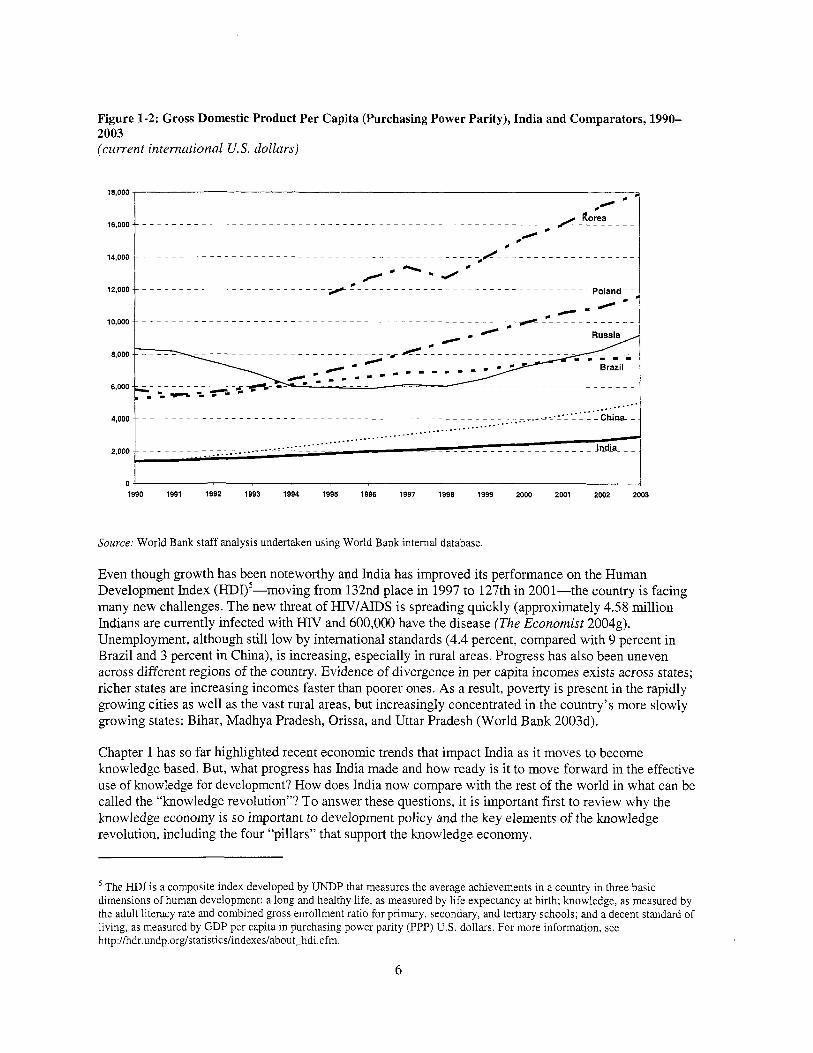
Figure 1-2: Gross Domestic Product Per Capita (Purchasing Power Parity), India and Comparators, 1990- 2003 (current international U.S. dollars)
0 4 4 1 1990 1991 1992 1993 1994 1995 1996 1997 1998 1999 2000 2001 2002 2003
Source: World Bank staff analysis undertaken using World Bank internal database.
Even though growth has been noteworthy and India has improved its performance on the Human Development Index (HDI)5-moving from 132nd place in 1997 to 127th in 2001-the country i s facing many new challenges. The new threat o f HIV/AIDS i s spreading quickly (approximately 4.58 mil l ion Indians are currently infected with HIV and 600,000 have the disease (The Economist 2004g). Unemployment, although s t i l l low by international standards (4.4 percent, compared with 9 percent in Brazil and 3 percent in China), i s increasing, especially in rural areas. Progress has also been uneven across different regions of the country. Evidence o f divergence in per capita incomes exists across states; richer states are increasing incomes faster than poorer ones. As a result, poverty i s present in the rapidly growing cities as well as the vast rural areas, but increasingly concentrated in the country’s more slowly growing states: Bihar, Madhya Pradesh, Orissa, and Uttar Pradesh (World Bank 2003d).
Chapter 1 has so far highlighted recent economic trends that impact India as i t moves to become knowledge based. But, what progress has India made and how ready i s i t to move forward in the effective use of knowledge for development? How does India now compare with the rest of the world in what can be called the “knowledge revolution”? To answer these questions, it i s important first to review why the knowledge economy i s so important to development policy and the key elements o f the knowledge revolution, including the four “pillars” that support the knowledge economy.
The HDI i s a composite index developed by UNDP that measures the average achievements in a country in three basic dimensions o f human development: a long and healthy life, as measured by l i fe expectancy at birth; knowledge, as measured by the adult literacy rate and combined gross enrollment ratio for primary, secondary, and tertiary schools; and a decent standard o f living, as measured by GDP per capita in Purchasing power parity (PPP) US. dollars. For more information, see http://hdr.undp.org/statistics/indexes/about-hdi.cfm.
6

Knowledge i s Key in an Increasingly Dynamic and Competitive Global Environment
In the global knowledge economy o f the twenty-first century, India’s development policy challenges w i l l require it to use knowledge more effectively to raise the productivity of agriculture, industry, and services and reduce poverty. This i s because the application o f knowledge, as manifested in areas such as entrepreneurship and innovation, research and development (R&D), and people’s education and s k i l l levels, i s now recognized as one o f the key sources o f growth and competitiveness in the global economy. Although knowledge has always been at the core o f any country’s development process, increased speed in the creation and dissemination o f knowledge i s making i t even more important in development strategy. Figure 1-3 illustrates the importance o f effective use o f knowledge in Ghana and Korea. Nearly 40 years ago their per capita incomes were almost the same; since then, Korea has increased i t s per capita income by a factor o f 8.9 in real terms, due mainly to more effective use o f policy and technical knowledge, whereas Ghana has decreased i t s per capita income by almost a factor o f 0.1.
Figure 1-3: Growth in Per Capita Income for Korea and Ghana, 1960-2000 (per capita income, in thousands)
14
12
10
8
Difference I attributed to
knowledge
1960 1965 1970 1975 1980 1985 1990 1995 2000
Source: World Bank (1999).
Knowledge i s more important today than ever, as the twin forces o f globalization and technological advances are spurring an ongoing knowledge revolution. This revolution manifests i tsel f in many ways: closer links between science and technology (S&T), greater importance o f innovation for economic growth and competitiveness, increased importance o f education and lifelong learning, and more investment in intangibles (R&D, software, and education); the latter i s even greater than investments in fixed capital. At the same time, o f course, a revolution in information and communications technology (ICT) i s increasing worldwide interdependency and connectivity. These trends have led to increased globalization and competition: although trade represented 38 percent o f world GDP in 1990, th is ratio had risen to 57 percent in 2001.
This dynamic process i s creating constant restructuring at the global, country, sector, and firm levels, raising tremendous possibilities for enhancing growth and competitiveness, but also carrying the risk that countries or f i r m s and organizations w i l l fall behind if they cannot keep up with the pace o f rapid change. Consequently, countries’ competitiveness depends more than ever on their ability to access, adapt, utilize, and create knowledge.
7

The term “knowledge economy” has been coined to reflect this increased importance of knowledge for economic development. Despite the hype that has surrounded the concept, the idea o f a knowledge economy i s not in i tse l f entirely new. Use o f knowledge has always been a critical ingredient o f economic success; however, i t s importance has increased in recent times to the point that knowledge has become the key driver of economic competitiveness and success. Improved knowledge has led to increasing productivity, and the creation and application of new technologies has increased the range o f products and services and brought revolutionary change to virtually all markets and sectors.
The knowledge economy i s often taken to mean only high-technology industries or ICTs, but the more important question i s how economies are using appropriate knowledge to improve productivity and increase welfare. Creation o f new knowledge and use o f existing knowledge can be relevant in a variety o f circumstances, manifesting not just as leading-edge scientific discoveries, but, more generally on how to do things better. For example, application o f new techniques to subsistence farming can significantly increase yields and use o f information and logistical services can allow traditional craft sectors to serve much wider markets than before.
Embracing the knowledge economy. In short, a knowledge economy i s one that creates, disseminates, and uses knowledge to enhance i t s growth and competitiveness. Successful transition to a knowledge economy i s founded on four essential pillars (Box 1-3).
Box 1-3: Four Pillars of the Knowledge Economy 1.
2. 3.
An economic and institutional regime that provides incentives for the efficient creation, dissemination, and use o f existing knowledge An educated and skilled population that can create and use knowledge An eficient innovation system o f firms, research centers, universities, consultants, and other organizations that can tap into the growing stock o f global knowledge and assimilate and adapt i t to local needs, as well as to create relevant new knowledge Dynamic information infrastructure that can facilitate the effective communication, dissemination, and processing o f information.
4.
Source: Knowledge for Development Program.
Making effective use of knowledge in any country requires developing appropriate policies, institutions, and investments and coordination across these four pillars, because o f the strong interdependencies that exist among them. The economic and institutional regime i s in a sense the most critical pillar o f the knowledge economy, because i t provides the context for the effectiveness o f the other three functionally focused pillars (education, innovation, and ICTs).
Advantage India. India can count on a number o f strengths as i t strives to transform itself into a knowledge-based economy: i t has a good base of skilled human capital, especially in the sciences; a democratic system; widespread use o f English; macroeconomic stability; a dynamic private sector; institutions of a free market economy; a local market that i s one o f the largest in the world; a well- developed financial sector; and a broad and diversified S&T infrastructure. In addition, development o f the ICT sector in recent years has been remarkable. India has created profitable niches in IT and i s becoming a global provider o f software services. I t i s a sought-after venue for services in global production chains, all the way from call centers, financial accounting, and database production to international f i r m s that are using India in banking, insurance, technology and telecoms, engineering, and business services. As a result, India’s software and service exports totaled an impressive $12.5 bil l ion in 2003-04 and the IT industry contributed an estimated 3.82 percent o f India’s GDP in 2003-04. In terms of state-led efforts, the state o f Andhra Pradesh i s developing Hyderabad into a “cybercity” and establishing an impressive “e-governance” infrastructure.
8
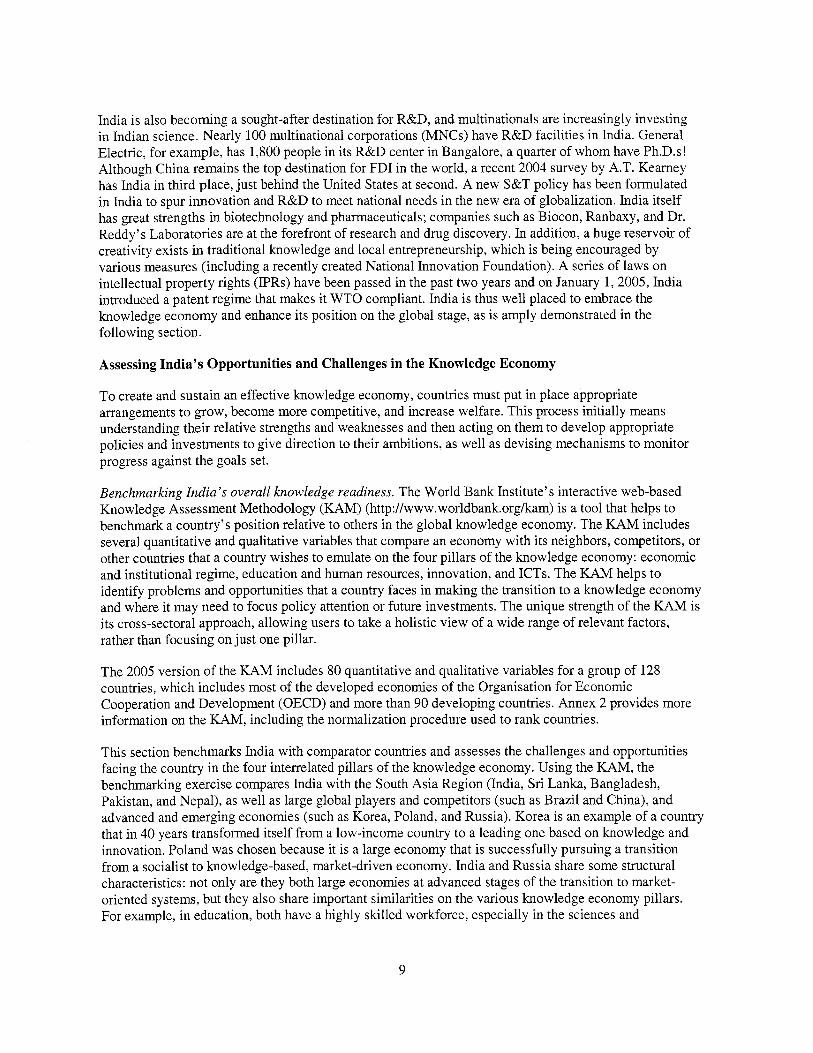
India i s also becoming a sought-after destination for R&D, and multinationals are increasingly investing in Indian science. Nearly 100 multinational corporations (MNCs) have R&D facilities in India. General Electric, for example, has 1,800 people in i t s R&D center in Bangalore, a quarter o f whom have Ph.D.s! Although China remains the top destination for FDI in the world, a recent 2004 survey by A.T. Kearney has India in third place, just behind the United States at second. A new S&T policy has been formulated in India to spur innovation and R&D to meet national needs in the new era o f globalization. India itself has great strengths in biotechnology and pharmaceuticals; companies such as Biocon, Ranbaxy, and Dr. Reddy’s Laboratories are at the forefront o f research and drug discovery. In addition, a huge reservoir o f creativity exists in traditional knowledge and local entrepreneurship, which i s being encouraged by various measures (including a recently created National Innovation Foundation). A series of laws on intellectual property rights (IPRs) have been passed in the past two years and on January 1,2005, India introduced a patent regime that makes it WTO compliant. India i s thus well placed to embrace the knowledge economy and enhance i t s position on the global stage, as i s amply demonstrated in the following section.
Assessing India’s Opportunities and Challenges in the Knowledge Economy
To create and sustain an effective knowledge economy, countries must put in place appropriate arrangements to grow, become more competitive, and increase welfare. This process initially means understanding their relative strengths and weaknesses and then acting on them to develop appropriate policies and investments to give direction to their ambitions, as well as devising mechanisms to monitor progress against the goals set.
Benchmarking India’s overall knowledge readiness. The World Bank Institute’s interactive web-based Knowledge Assessment Methodology (KAM) (http://www.worldbank.org/kam) i s a tool that helps to benchmark a country’s position relative to others in the global knowledge economy. The KAM includes several quantitative and qualitative variables that compare an economy with i t s neighbors, competitors, or other countries that a country wishes to emulate on the four pillars of the knowledge economy: economic and institutional regime, education and human resources, innovation, and ICTs. The KAM helps to identify problems and opportunities that a country faces in making the transition to a knowledge economy and where i t may need to focus policy attention or future investments. The unique strength o f the KAM i s i t s cross-sectoral approach, allowing users to take a holistic view o f a wide range o f relevant factors, rather than focusing on just one pillar.
The 2005 version o f the KAM includes 80 quantitative and qualitative variables for a group o f 128 countries, which includes most o f the developed economies o f the Organisation for Economic Cooperation and Development (OECD) and more than 90 developing countries. Annex 2 provides more information on the KAM, including the normalization procedure used to rank countries.
This section benchmarks India with comparator countries and assesses the challenges and opportunities facing the country in the four interrelated pillars o f the knowledge economy. Using the KAM, the benchmarking exercise compares India with the South Asia Region (India, Sri Lanka, Bangladesh, Pakistan, and Nepal), as well as large global players and competitors (such as Brazil and China), and advanced and emerging economies (such as Korea, Poland, and Russia). Korea i s an example of a country that in 40 years transformed itself from a low-income country to a leading one based on knowledge and innovation. Poland was chosen because it i s a large economy that i s successfully pursuing a transition from a socialist to knowledge-based, market-driven economy. India and Russia share some structural characteristics: not only are they both large economies at advanced stages o f the transition to market- oriented systems, but they also share important similarities on the various knowledge economy pillars. For example, in education, both have a highly skilled workforce, especially in the sciences and
9
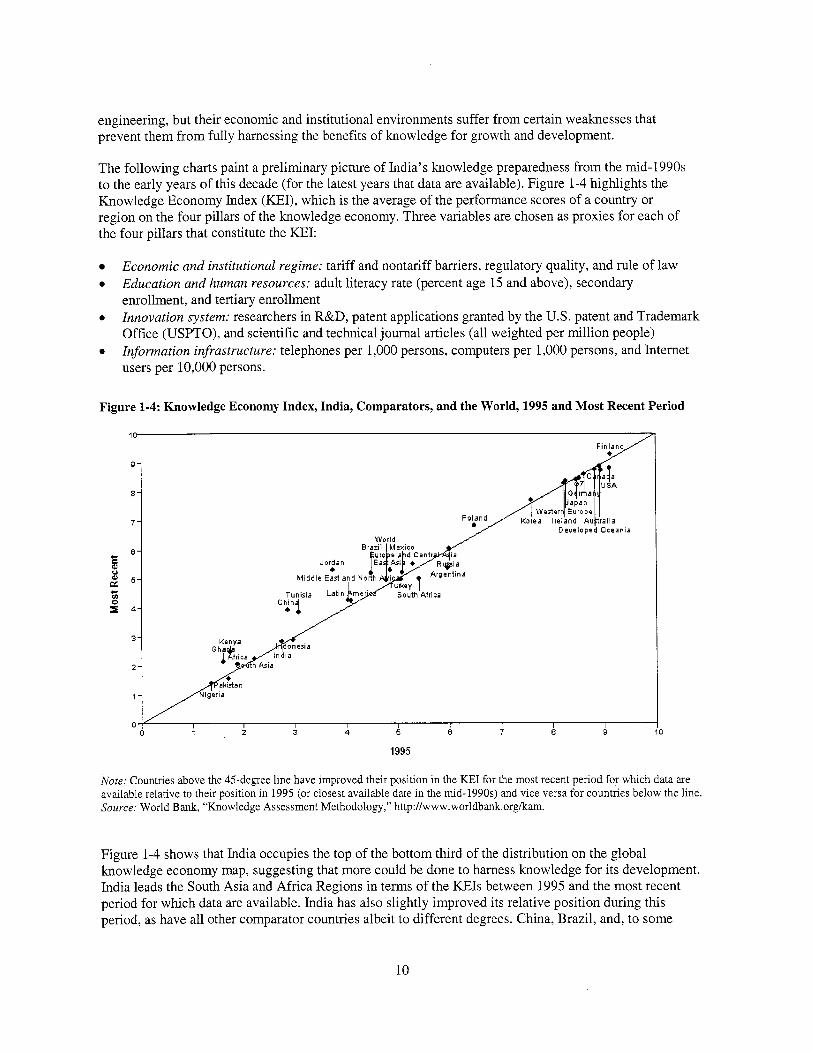
engineering, but their economic and institutional environments suffer from certain weaknesses that prevent them from fully hamessing the benefits o f knowledge for growth and development.
The following charts paint a preliminary picture o f India’s knowledge preparedness from the mid-1990s to the early years o f this decade (for the latest years that data are available). Figure 1-4 highlights the Knowledge Economy Index (KEI), which i s the average o f the performance scores o f a country or region on the four pillars o f the knowledge economy. Three variables are chosen as proxies for each o f the four pillars that constitute the KEI:
0
0
0
Economic and institutional regime: tariff and nontariff barriers, regulatory quality, and rule o f law Education and human resources: adult literacy rate (percent age 15 and above), secondary enrollment, and tertiary enrollment Innovation system: researchers in R&D, patent applications granted by the U.S. patent and Trademark Office (USPTO), and scientific and technical journal articles (all weighted per mil l ion people) Information infrastructure: telephones per 1,000 persons, computers per 1,000 persons, and Internet users per 10,000 persons.
Figure 1-4: Knowledge Economy Index, India, Comparators, and the World, 1995 and Most Recent Period
0 1 2 3 4 5 7 8 Q
1995
Note: Countries above the 45-degree l ine have improved their position in the KEI for the most recent period for which data are available relative to their position in 1995 (or closest available date in the mid-1990s) and vice versa for countries below the line. Source: World Bank, “Knowledge Assessment Methodology,” http://www.worldbank.orgkam.
Figure 1-4 shows that India occupies the top o f the bottom third of the distribution on the global knowledge economy map, suggesting that more could be done to harness knowledge for i t s development. India leads the South Asia and Africa Regions in terms o f the K E I s between 1995 and the most recent period for which data are available. India has also slightly improved i t s relative position during this period, as have all other comparator countries albeit to different degrees. China, Brazil, and, to some
10

extent, Poland have improved their positions relative to 1995 by far greater margins than have Russia or Korea.
Rating India’s pe$ormance. Using the KAM, it i s also possible to see how India has performed on the four individual pillars of the knowledge economy, using the KEI in relation to chosen comparators. In Figure 1-5, the two bars represent the aggregate KEI score for a selected country for the most recent years for which data are available and for 1995, split into the four pillars (see legend at the bottom o f Figure 1-5). Each colored band represents the contribution of a particular pillar to a country’s overall knowledge readiness. Annex 3 presents overall K E I s as well as those for each pillar for India and comparators.
Figure 1-5: Cross-Country Comparison on the Four Pillars of a Knowledge Economy, India and Comparators, 1995 and Most Recent Period
Korea 1995
Poland 1995
RLssia 1995
Brazil 1995
China 1995
India 1995
1
i i I I 0.0 2.0 4.0 6.0 8.0 1 .o
0 Econ Incentive Regime 0 Innovation E Education Information Infrastructure 1 Source World Bank, “Knowledge Assessment Methodology,” http //www worldbank orgkam
Figure 1-5 shows the dramatic improvements made by countries on their overall preparedness for the knowledge economy during this period. Korea leads the pack, which i s not surprising, as it i s one o f the leading countries in the world making progress in i t s transition to the knowledge economy, followed by Poland, Russia, Brazil, China, and India. All countries, except Korea and India, have improved their most recent performance since 1995. India has slightly worsened i t s most recent overall KEI score compared with 1995 due to slightly declining performance in the education pillar, but more so due to weak performance in the information infrastructure pillar. India contrasts strongly with China on the latter, as China has succeeded remarkably in improving i t s information infrastructure in the past half decade or so.
The scorecard in Figure 1-6 i s yet another way to look at India’s performance relative to the 128 countries included in the KAh4 between 1995 and the most recent period for which data are available. (See annex 4 for scorecards for Brazil, China, Korea, Poland, and Russia.) The scorecard includes three variables for each of the four pillars of the knowledge economy, as well as two variables relating to performance: GDP growth and the HDI.
11
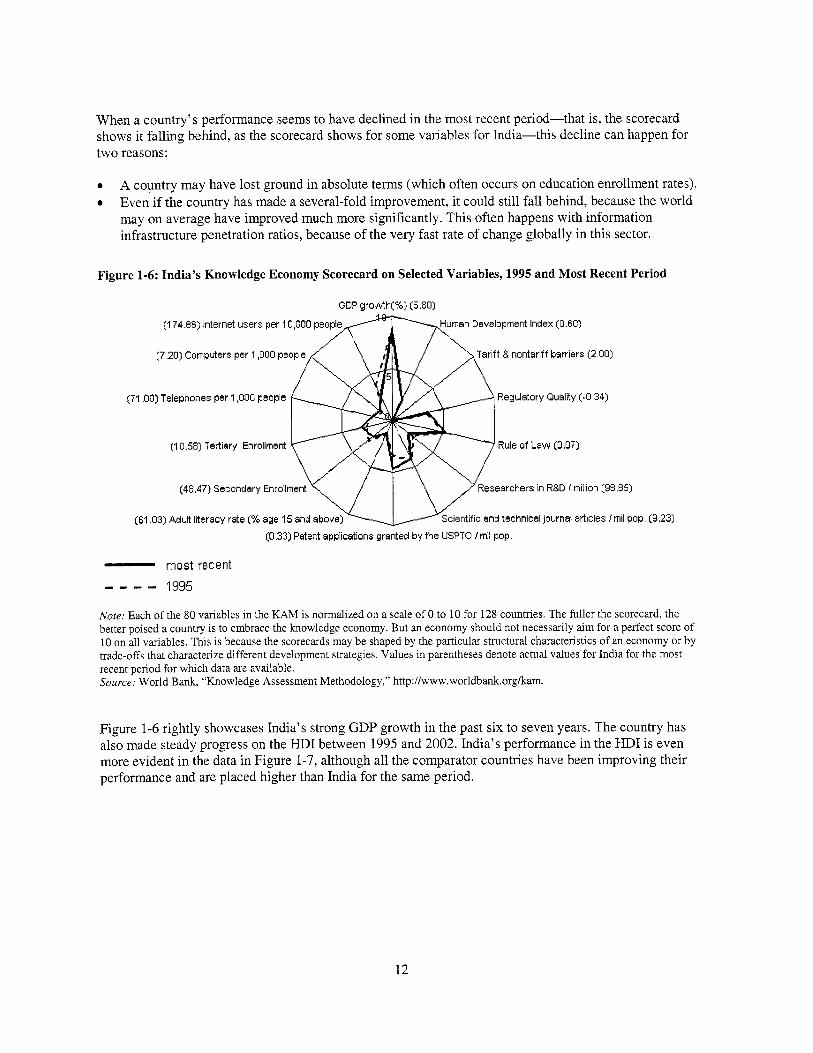
When a country’s performance seems to have declined in the most recent period-that is, the scorecard shows i t falling behind, as the scorecard shows for some variables for India-this decline can happen for two reasons:
0
0
A country may have lost ground in absolute terms (which often occurs on education enrollment rates). Even if the country has made a several-fold improvement, i t could s t i l l fal l behind, because the world may on average have improved much more significantly. This often happens with information infrastructure penetration ratios, because o f the very fast rate of change globally in this sector.
Figure 1-6: India’s Knowledge Economy Scorecard on Selected Variables, 1995 and Most Recent Period
GDP growth(%) (5.80)
(1 74.86) Internet users per 10,000 pew man Development Index (0.60)
(7.20) Computers per 1,000 people ariff S nontariff barriers (2.00)
(71 .OO) Telephones per 1,000 people Regulatory Qualay (-0 34)
(I 0.58) Tertiary Enrollment Rule of Law (0.07)
(48.47) Secondary Enrollment
(61.03) Adult literacy rate (% age 15 and above) w Scientific and technical journal articles I mil pop.
Researchers in RBD I million (98.85)
(0.33) Patent applications granted by the USPTO /mil pop. (9.23)
- most recent - - - - 1995
Note: Each o f the 80 variables in the KAM i s normalized on a scale o f 0 to 10 for 128 countries. The fu l ler the scorecard, the better poised a country i s to embrace the knowledge economy. But an economy should not necessarily aim for a perfect score o f 10 on all variables. T h i s i s because the scorecards may be shaped by the particular structural characteristics o f an economy or by trade-offs that characterize different development strategies. Values in parentheses denote actual values for India for the most recent period for which data are available. Source: World Bank, “Knowledge Assessment Methodology,” http://www.worldbank,org/kam.
Figure 1-6 rightly showcases India’s strong GDP growth in the past six to seven years. The country has also made steady progress on the HDI between 1995 and 2002. India’s performance in the HDI i s even more evident in the data in Figure 1-7, although all the comparator countries have been improving their performance and are placed higher than India for the same period.
12

Figure 1-7: Progress on the Human Development Index, India and Comparators, 1975-2002
Human Development Index 1 ,
0.2 -
1975 1980 1985 1990 1995 2001 2002
Source: World Bank intemal database.
The scorecard in Figure 1-6 and the underlying data presented in annex 5 for Brazil, China, and India show that India’s overall development pattern does has not appear to have changed much in terms o f the knowledge economy during the past half decade. Looking at the four pillars o f the knowledge economy at two points in time-1995 and the most recent date for which data are availablereveals the following key points:
In India’s economic and institutional regime, the country has not demonstrated significant changes, as evidenced by the unchanged scores on tariff and nontariff barriers. The rule o f law has improved slightly, but regulatory quality has witnessed a slight decline in the past half decade or so. In education, India has improved i t s adult literacy, but slightly worsened i t s most recent performance in secondary enrollments due to stagnation o f these ratios in this period, while many other countries, notably Brazil, more than doubled their secondary enrollments. India, however, has made noteworthy strides in increasing i t s tertiary enrollment ratio. India led China in terms o f i t s gross enrollment ratio (GER) for tertiary education until 1999, after which China surpassed India. In 2001 India had a tertiary GER of 11.6 percent, compared with 12.7 percent for China. India’s innovation system does not show great improvement; in fact, India has seen a small deterioration in terms o f researchers in R&D per mill ion people as well as scientific and technical journal articles per mill ion people; however, in terms o f patent applications granted by USPTO per mill ion people, India has seen a notable improvement. I t must be noted, however, that the three variables shown in Figure 1-6 are all scaled by population, and India does have significant innovation competencies in terms o f absolute size (see chapter 4 for more detail). In the knowledge economy, size does matter and large countries such as India do have a critical mass in research capacity that i s essential for spurring innovation. Regarding information infrastructure, India has made impressive advances in ICTs due to considerable improvements in telephones (fixed plus mobile, in which India has experienced a boom in mobile telephony), computer penetration, and, most laudably, Internet users. Yet, the scorecard in Figure 1-6 shows deteriorating performance for this pillar. Why? Even though India has made a
13

several-fold improvement in i t s information infrastructure penetration ratios in absolute terms in the past few years, i t has fallen behind in relative terms, because the wor ld on average has moved faster and improved much more significantly. The contrast i s even more strikmg b y overlaying India’s most recent performance wi th those o f i t s two closest competitors, Brazi l and China (Figure 1-8). Both Brazi l and China have made much stronger leaps in enhancing their information infrastructures than India, as evidenced by the variables for telephones, computers, and the Internet; they have also improved on the other pillars.
Figure 1-8: Knowledge Economy Scorecards on Selected Variables for Brazil, China, and India, Most Recent Period
GDP growth[%) (5.80)
(1 74.86) Internet users per 10,000 p n Development Index (0.60)
(7.20) Computers per 1,000 peopl ariff 8 nontariff barriers (2.00)
[T I .00) Telephones per 1,000 people Regulatory Quality (-0.34)
(1 0.58) Tertiary Enrollment Rule of Law (0.07)
(48.47) Secondary Enrollment esearchers in R8D I million (98.85)
(61.03) Aduk literacy rate (% age 15 and abov ientific and technical journal articles I mil pop. (9.23) (0.33) Patent applications granted by the USPTO I mil pop.
Note: Values in parentheses denote actual values for India for the most recent period for which data are available. Each o f the 80 variables in the KAM i s normalized on a scale o f 0 to 10. The fuller the scorecard, the better poised a country i s to embrace the knowledge economy. But an economy should not necessarily aim for a perfect score o f 10 on all variables. T h ~ s i s because the scorecards may be shaped by the particular structural characteristics o f an economy or by trade-offs that characterize different development strategies. Source: World Bank, “Knowledge Assessment Methodology,” http://www.worldbank.org/kam.
Acknowledging knowledge disparities among Indian states. So far, the chapter has focused on India’s position as a whole on the global knowledge economy. But, India i s a country o f great diversity with many states leading the way in embracing the knowledge economy and others lagging behind. At this stage, disaggregated data related to overall knowledge readiness o f various Indian states are unfortunately not available. A rough idea o f the diversity that exists among states can be gleaned f rom Figure 1-9, which provides a snapshot o f the performance o f selected Indian states based on two proxy variables: gross state domestic product per capita and literacy rates. The figure shows that some states, such as Maharashtra and Punjab, have almost one and a hal f times the per capita income of India and others such as Kerala have very high literacy rates, comparable to those in some middle-income countries. Yet others, such as Bihar have less than hal f the average per capita income o f India and very l o w literacy rates. Moreover, great diversity exists wi th in states.
14
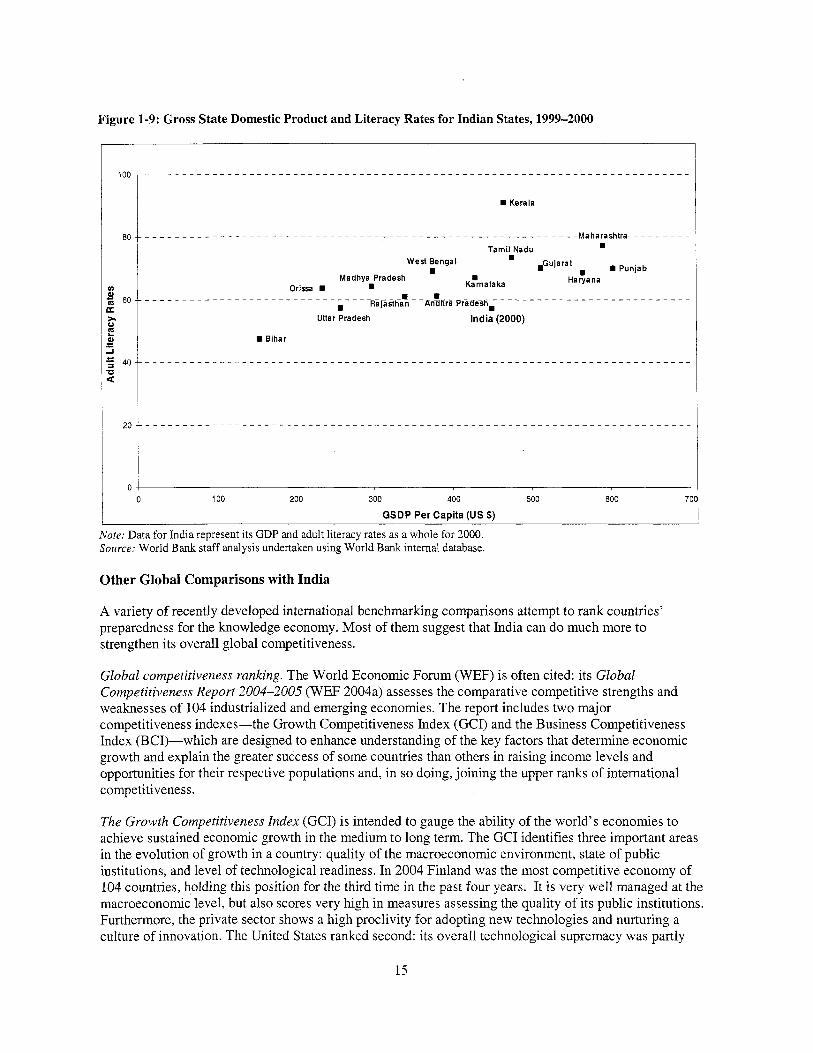
Figure 1-9: Gross State Domestic Product and Literacy Rates for Indian States, 1999-2000
Bihar
I 1 I 100 zoo 300 400 500 600
GSDP Per Capita (US $)
Note: Data for India represent i t s GDP and adult literacy rates as a whole for 2000. Source: World Bank staff analysis undertaken using World Bank internal database.
Other Global Comparisons with India
A variety o f recently developed international benchmarking comparisons attempt to rank countries’ preparedness for the knowledge economy. Most o f them suggest that India can do much more to strengthen i t s overall global competitiveness.
Global competitiveness ranking. The World Economic Forum (WEF) i s often cited: i t s Global Competitiveness Report 2004-2005 (WEF 2004a) assesses the comparative competitive strengths and weaknesses o f 104 industrialized and emerging economies. The report includes two major competitiveness indexes-the Growth Competitiveness Index (GCI) and the Business Competitiveness Index (BC1)-which are designed to enhance understanding o f the key factors that determine economic growth and explain the greater success o f some countries than others in raising income levels and opportunities for their respective populations and, in so doing, joining the upper ranks o f international competitiveness.
The Growth Competitiveness Index (GCI) i s intended to gauge the ability o f the world’s economies to achieve sustained economic growth in the medium to long term. The GCI identifies three important areas in the evolution o f growth in a country: quality o f the macroeconomic environment, state o f public institutions, and level of technological readiness. In 2004 Finland was the most competitive economy o f 104 countries, holding t h i s position for the third time in the past four years. I t i s very well managed at the macroeconomic level, but also scores very high in measures assessing the quality o f i t s public institutions. Furthermore, the private sector shows a high proclivity for adopting new technologies and nurturing a culture o f innovation. The United States ranked second: i t s overall technological supremacy was partly
15

offset by weaker performance in areas that capture the quality o f i t s public institutions and the stability o f i t s macroeconomic environment. In terms o f other countries, in 2004 Korea ranked 29th and China 46th. India came in at 55th, mainly because it has outperformed many countries in terms o f i t s strong economic growth in recent years, followed by Brazil at 57th and Poland at 60th. India also ranked 55th (of 102 countries) in 2003.
Delving into the reasons for India’s ranking shows that its macroeconomic environment and quality o f public institutions (two o f the three components measured by the index), for which India i s ranked 52nd and 53rd, respectively, are slightly stronger than i t s average ranking. These overall ranks are boosted by several strong areas in the macroeconomic environment, such as the facility o f obtaining access to credit (for which India ranked 2nd) and low expectations o f a recession (also ranked 2nd). In terms o f the quality o f public institutions, judicial independence and property rights (where India ranked 32nd and 34th, respectively) are also considered competitive advantages for India.
In the technology component o f the GCI, India ranked 63rd o f 104 countries. Although India fared well in prevalence of foreign technology licensing (where i t ranked 8th) and government prioritization o f ICT (ranked 9th), it s t i l l held a comparatively lower position in terms o f ICT, for which it i s disadvantaged by the number of cellular telephones (ranked 94th) and Internet hosts (ranked 91st) (WEF 2004b). Again, this fact underscores the point that, even though India has been making tremendous strides in improving i t s information infrastructure, the world as a whole has moved ahead much faster, so that in relative terms, India has fallen behind.
The Business Competitiveness Index (BCI) emphasizes a range o f company-specific factors that are conducive to improved efficiency and productivity at the micro level. The B C I complements the medium- term, macroeconomic approach o f the GCI and evaluates the underlying microeconomic conditions defining the current sustainable level o f productivity in each o f the countries covered. The underlying concept i s that, although macroeconomic and institutional factors are critical for national competitiveness, they are necessary but not sufficient factors for creating wealth (which i s created at the micro level by companies). The B C I comprises two subindexes: one focuses on company operations and strategy ranking and the other on the quality o f the business environment in which a nation’s f i r m s compete.
India has greatly improved i t s performance on the B C I in the latest WEF 2004-05 report. India ranked 30th in 2004, compared with 37th in both 2002 and 2003 and 36th in 2001. In the 2004 rankings, India did better than Brazil (38th), China (47th), Poland (57th), and Russia (61st). In the subindexes, India ranked 30th in company operations and strategy and 32nd in the quality of the national business environment; thus, despite marked improvement in India’s overall B C I ranking, the subindexes show that India has more to do in business environment and company sophistication, public administration effectiveness, and marketing to enhance its overall business competitiveness.
Globalization ranking. Globalization also adds to the pressures for economies to strengthen their international competitiveness. Debate continues on whether countries should globalize and whether globalization can be a positive force for development. Whatever the stance, i t seems that globalization i s here to stay. Many countries, including China, have decided that opening up their economies to trade in goods and services i s one way to l i f t their people out o f poverty. These countries are now focusing their efforts on how to globalize in the most stable and advantageous manner; some prefer to go faster, and some more slowly.
16

The Globalization Index,’ developed by A. T. Keamey and Foreign Policy magazine, uses several indicators spanning IT, finance, trade, personal communications, politics, and travel to determine a country’s ranking. The 2004 Globalization Index ranked 62 countries for 14 variables grouped in four baskets:
0
0
0
Economic integration: trade, foreign direct investment, portfolio capital flows, and investment income Technological connectivity: Internet users, Internet hosts, and secure servers Personal contact: international travel and tourism, international telephone traffic, and remittances and personal transfers (including worker remittances, compensation to employees, and other person-to- person and nongovernmental transfers) Political engagement: memberships in international organizations, personnel and financial contributions to U.N. Security Council missions, international treaties ratified, and governmental transfers.
0
The 62 countries ranked account for 96 percent o f the world’s GDP and 84 percent o f the world’s population. Ireland ranked as the most global nation followed by Singapore in the 2004 rankings. The 2003 index (among 62 countries) placed Zndia at 56th place, behind China at 51st, but just ahead of Brazil at 57th, indicating that India was opting for a rather gradual approach in terms o f i t s integration into the global economy. But the 2004 survey shows Zndia slippingfurther to 61stplace, behind Brazil at 53rd and China at 57th.
In terms o f the four subcategories that comprise the Globalization Index, India ranked 5 1st in the economic ranking, 53rd in the personal ranking, 55th in the technological ranking, and 57th in the political ranking. Other comparator countries ranked as follows in the 2004 Globalization Index: Poland (31st), Korea (32nd), and Russia (44th).
Road M a p for the Report: Strengthening the Four Pillars of the Knowledge Economy
This chapter has highlighted recent economic trends that w i l l impact India’s economy, the importance o f the knowledge economy in development, and overall opportunities and challenges India faces as it moves toward becoming knowledge based. The next four chapters (2-5) delve into specific challenges India faces in strengthening each pillar o f the knowledge economy, identifying relative strengths and weaknesses in each and capturing factors that can contribute to India’s effective transition to a knowledge economy. Each chapter includes a benchmarking assessment, comparing India’s current position with those o f relevant comparator countries, issues and recent developments relating to each pillar, measures to strengthen that pillar, and a summary of issues and recommendations.
Following this review of the four pillars, chapter 6 summarizes several Indian initiatives on the knowledge economy and looks at ways o f developing a consultative process to stimulate a greater sense of the importance o f the emerging policy agenda on the knowledge economy in India to enhance i t s growth and competitiveness. The chapter highlights the need for coordination among government (both central and state), the private sector, and civi l society for India to harness knowledge and expertise for the benefit o f all.
The 2004 Globalization Index i s available at http://www.foreignpolicy.com/story/files/story2493 .php?PHPSESSID=Ol90al349088fbc 190e4e2475333399d.
17


2. ECONOMIC AND INSTITUTIONAL REGIME, INCLUDING GOVERNANCE
Taking advantage o f the potential offered by the knowledge revolution hinges on having an effective economic incentive regime and institutions that promote and facilitate the redeployment o f resources from less efficient to more efficient uses. The economic and institutional regime allows organizations, people, and institutions to adjust to changing opportunities and demands in flexible and innovative ways. This i s the f i r s t and, in a sense, fundamental pillar o f the knowledge economy, because in the absence of a strong economic incentive and institutional regime that deploys resources to productive uses, i t i s possible to have a strong educational base, highly developed R&D infrastructure, or global niches in IT, but m i s s out on the full benefits o f these achievements.
Key elements o f the economic and institutional regime include macroeconomic stability, competition, regulatory policies, and legal rules and procedures that are conducive to entrepreneurship and risk taking. A key feature i s the quality o f government, because i t s integrity and effectiveness determine the basic rules of a society. Another important element i s the extent to which the legal system supports basic rules and property rights. An effective economic and institutional regime includes having a competitive environment that stimulates improved economic performance, a financial system that mobilizes and allocates capital to i t s most productive uses, flexible labor markets including support for improving the s k i l l s o f the labor force, and effective safety nets to facilitate adjustment to constant restructuring. This chapter looks at key elements o f the economic and institutional regime for India, including governance issues.
Benchmarking the Economic and Institutional Regime
Compared with the rest o f the world, India has improved i t s relative position on t h i s pillar (Figure 2-1). India leads the South Asia and Africa Regions, as well as China on i t s economic and institutional regime between 1995 and the most recent period for which data are available. Huang and Khanna (2003) cite several strengths o f India’s economic and institutional regime compared with China: democracy; a tradition o f entrepreneurship; a much stronger infrastructure supporting private enterprise; capital markets that operate with greater efficiency and transparency than in China; a legal system, although not without substantial flaws, that i s considerably more advanced; flourishing entrepreneurship and free enterprise; and an independent judiciary. Property rights are not fully secure, but the protection o f private ownership i s certainly far stronger than in China; the rule o f law, a legacy o f British rule, generally prevails; and corporate governance has improved dramatically.
18
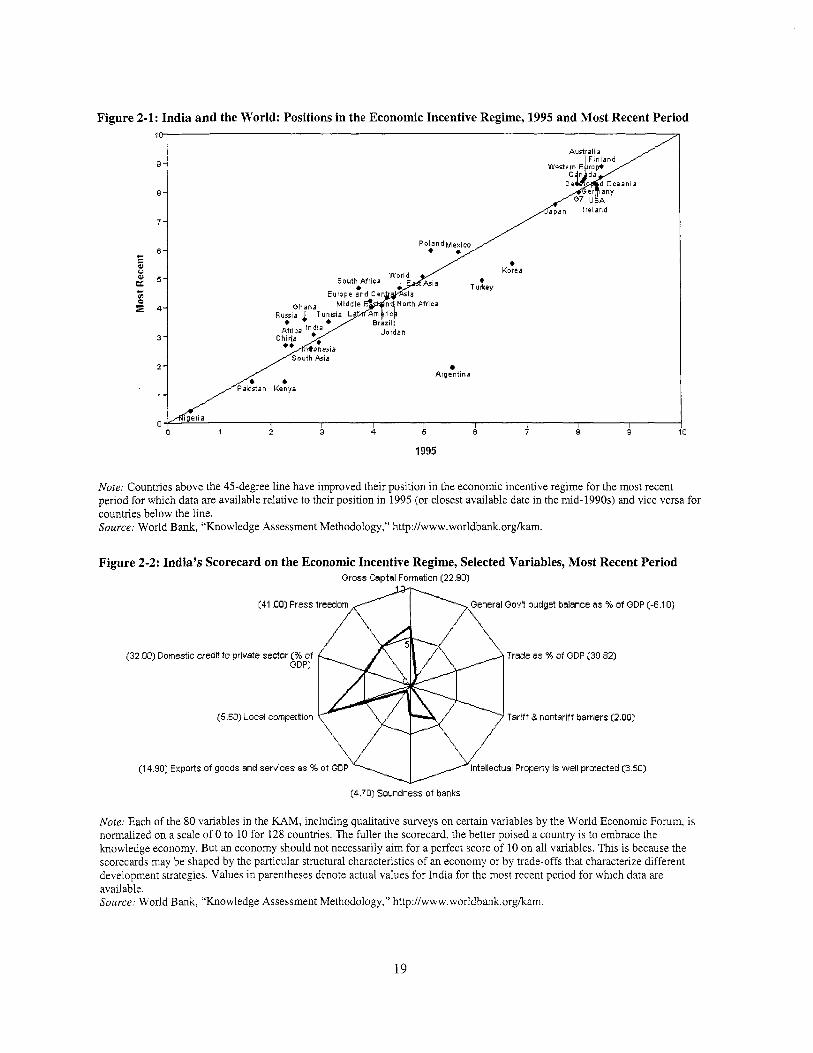
Figure 2-1: India and the World: Positions in the Economic Incentive Regime, 1995 and Most Recent Period 10
g -
a -
7 -
6 -
u 2 5 - c
3 -
2 - Argentina
0 1 2 3 4 5 6 7 8
1995
0
Note: Countries above the 45-degree line have improved their position in the economic incentive regime for the most recent period for which data are available relative to their position in 1995 (or closest available date in the mid-1990s) and vice versa for countries below the line. Source: World Bank, “Knowledge Assessment Methodology,” http://www.worldbank,org/kam.
Figure 2-2: India’s Scorecard on the Economic Incentive Regime, Selected Variables, Most Recent Period Gross Capital Formation (22.90) . .
(41 .On) Press freedo neral Gov’t budget balance as % of GDP (-6.1 0)
(32.00) Domestic credit to private sector (% of GDP)
Trade as % of GDP (30.82)
(5.60) Local competition Tariff 8; nontariff barriers (2.00)
(14.90) Exports of goods and services as % of G ellectual Property is well protected (3.50)
(4.70) Soundness of banks
Note: Each o f the 80 variables in the KAM, including qualitative surveys on certain variables by the Wor ld Economic Forum, i s normalized on a scale of 0 to 10 for 128 countries. The fuller the scorecard, the better poised a country i s to embrace the knowledge economy. But an economy should not necessarily aim for a perfect score of 10 on all variables. T h i s i s because the scorecards may be shaped by the particular structural characteristics o f an economy or by trade-offs that characterize different development strategies. Values in parentheses denote actual values for India for the most recent period for which data are available. Source: World Bank, “Knowledge Assessment Methodology,” http://www.worldbank.or&am.
19
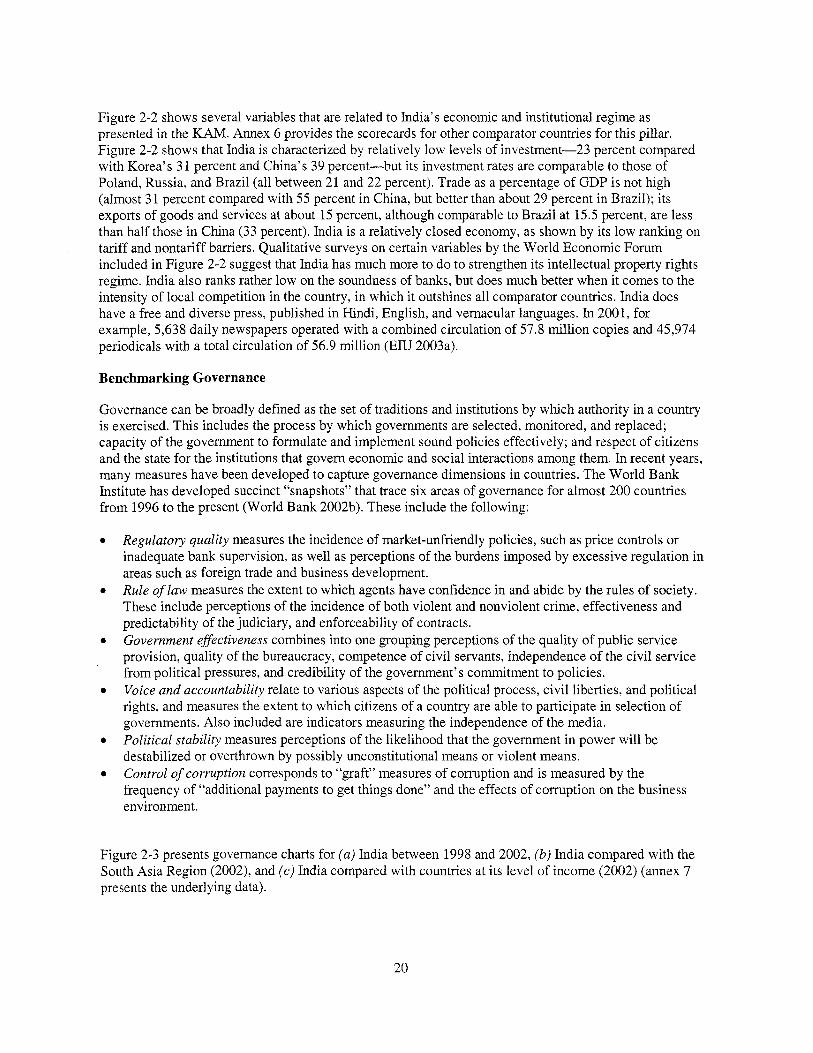
Figure 2-2 shows several variables that are related to India’s economic and institutional regime as presented in the KAM. Annex 6 provides the scorecards for other comparator countries for this pillar. Figure 2-2 shows that India i s characterized by relatively low levels of investment-23 percent compared with Korea’s 3 1 percent and China’s 39 percent-but i t s investment rates are comparable to those o f Poland, Russia, and Brazil (all between 21 and 22 percent). Trade as a percentage o f GDP i s not high (almost 3 1 percent compared with 55 percent in China, but better than about 29 percent in Brazil); i t s exports of goods and services at about 15 percent, although comparable to Brazil at 15.5 percent, are less than half those in China (33 percent). India i s a relatively closed economy, as shown by i t s low ranking on tariff and nontariff barriers. Qualitative surveys on certain variables by the World Economic Forum included in Figure 2-2 suggest that India has much more to do to strengthen i t s intellectual property rights regime. India also ranks rather low on the soundness of banks, but does much better when i t comes to the intensity o f local competition in the country, in which it outshines all comparator countries. India does have a free and diverse press, published in Hindi, English, and vernacular languages. In 2001, for example, 5,638 daily newspapers operated with a combined circulation of 57.8 mill ion copies and 45,974 periodicals with a total circulation o f 56.9 mill ion (EIU 2003a).
Benchmarking Governance
Governance can be broadly defined as the set o f traditions and institutions by which authority in a country i s exercised. This includes the process by which governments are selected, monitored, and replaced; capacity o f the government to formulate and implement sound policies effectively; and respect o f citizens and the state for the institutions that govern economic and social interactions among them. In recent years, many measures have been developed to capture governance dimensions in countries. The World Bank Institute has developed succinct “snapshots” that trace six areas of governance for almost 200 countries from 1996 to the present (World Bank 2002b). These include the following:
Regulatory quality measures the incidence o f market-unfriendly policies, such as price controls or inadequate bank supervision, as well as perceptions o f the burdens imposed by excessive regulation in areas such as foreign trade and business development. Rule oflaw measures the extent to which agents have confidence in and abide by the rules o f society. These include perceptions o f the incidence o f both violent and nonviolent crime, effectiveness and predictability o f the judiciary, and enforceability o f contracts. Government eflectiveness combines into one grouping perceptions o f the quality o f public service provision, quality o f the bureaucracy, competence o f civi l servants, independence o f the civi l service from political pressures, and credibility o f the government’s commitment to policies. Voice and accountability relate to various aspects o f the political process, c iv i l liberties, and political rights, and measures the extent to which citizens o f a country are able to participate in selection o f governments. Also included are indicators measuring the independence o f the media. Political stability measures perceptions o f the likelihood that the government in power w i l l be destabilized or overthrown by possibly unconstitutional means or violent means. Control of corruption corresponds to “graft” measures o f corruption and i s measured by the frequency o f “additional payments to get things done” and the effects o f corruption on the business environment.
Figure 2-3 presents governance charts for (a) India between 1998 and 2002, (b) India compared with the South Asia Region (2002), and (c) India compared with countries at i t s level o f income (2002) (annex 7 presents the underlying data).
20
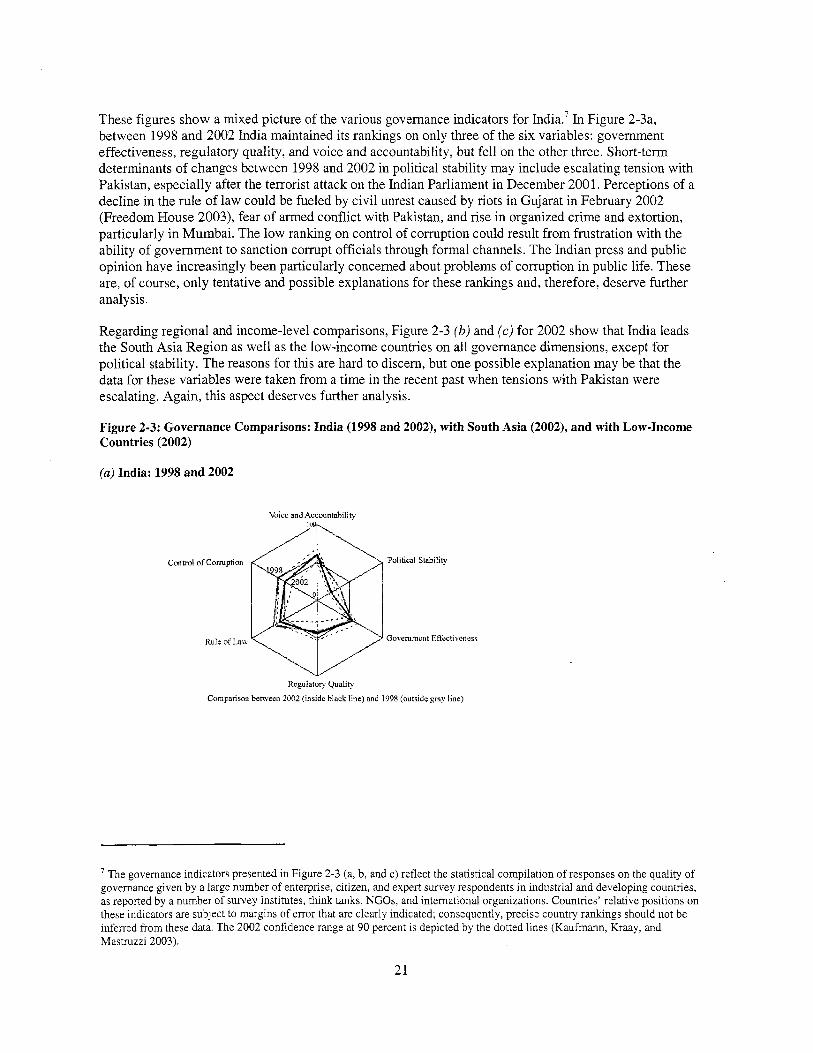
These figures show a mixed picture of the various governance indicators for India.7 In Figure 2-3a, between 1998 and 2002 India maintained i t s rankmgs on only three of the six variables: government effectiveness, regulatory quality, and voice and accountability, but fe l l on the other three. Short-term determinants o f changes between 1998 and 2002 in political stability may include escalating tension with Pakistan, especially after the terrorist attack on the Indian Parliament in December 2001. Perceptions of a decline in the rule of law could be fueled by civi l unrest caused by riots in Gujarat in February 2002 (Freedom House 2003), fear o f armed conflict with Pakistan, and rise in organized crime and extortion, particularly in Mumbai. The low ranking on control of corruption could result from frustration with the ability o f government to sanction corrupt officials through formal channels. The Indian press and public opinion have increasingly been particularly concerned about problems o f corruption in public l i fe. These are, of course, only tentative and possible explanations for these rankings and, therefore, deserve further analysis.
Regarding regional and income-level comparisons, Figure 2-3 (b) and (c) for 2002 show that India leads the South Asia Region as well as the low-income countries on all governance dimensions, except for political stability. The reasons for th is are hard to discern, but one possible explanation may be that the data for these variables were taken from a time in the recent past when tensions with Palustan were escalating. Again, t h i s aspect deserves further analysis.
Figure 2-3: Governance Comparisons: India (1998 and 2002), with South Asia (2002), and with Low-Income Countries (2002)
(a) India: 1998 and 2002
Regulator) @lalit).
Comparison b e t w e n 2002 (inside black line) and 1998 (outside gray line)
The govemance indicators presented in Figure 2-3 (a, b, and c) reflect the statistical compilation o f responses on the quality o f govemance given by a large number o f enterprise, citizen, and expert survey respondents in industrial and developing countries, as reported by a number o f survey institutes, think tanks, NGOs, and international organizations. Countries’ relative positions on these indicators are subject to margins o f error that are clearly indicated; consequently, precise country rankings should not be inferred from these data. The 2002 confidence range at 90 percent i s depicted by the dotted lines (Kaufmann, Kraay, and Mastmzzi 2003).
21

(b) India and South Asia, 2002
Voice and accountitbility I ill1
Regulal& quality
Compariso~l o f India (outside black linc) with rcgional average (South Asia. inside gray line) and country’s pcrccnlilc rank (0-100)
(c) India and Low-Income Countries, 2002
Voice and accounta.bilit)i too
Regulatot?; qualit?
Compnrismi of India (outside black line) nith income category average (low income, inside gray line) and country’s perconrile rank (0-100)
Source: Kaufmann, Kraay, and Mastruzzi (2003).
Issues and Recent Developments in the Economic and Institutional Regime
India has tremendous possibilities for increased economic growth. The country i s endowed with several intrinsic advantages: macroeconomic stability, a large domestic market, a large and relatively low-cost and skilled workforce that should allow the country to emerge as a major hub for manufacturing and service industries, a critical mass o f well-educated workers in engineering and science, and abundant raw materials. India’s growth, however, i s hampered by several factors: declining productivity o f the public sector, relatively low integration into the global economy, limited levels o f FDI, an investment climate that needs strengthening, and weak infrastructure. Whether India can achieve the ambitious target o f increasing i t s growth rate to an average o f 8 percent between 2002 and 2007, as set out in i t s Tenth Five-
22

Year Plan (India, Planning Commission 2002e), i s crucially dependent on progress it can make in each of these areas.
Given the importance o f the economic and institutional regime for the functioning o f the economy as a whole, this section reviews issues and recent developments related to this pillar that are critical to India’s progress toward becoming a knowledge economy.
Dismantling barriers to growth. For the past decade, India’s GDP has been growing at approximately 6 percent a year, compared with 10 percent in China. Keeping t h i s in mind, in 2001 the McKinsey Global Institute examined India’s economy to see what was holding i t back and which policy changes would accelerate i t s growth to match that o f China (Di Lodovico and others 2001). The study found three main barriers to faster growth in India: multiplicity o f regulations governing product markets, distortions in the market for land, and widespread government ownership o f businesses (Figure 2-4).8
Figure 2-4: Eliminating Barriers for Faster Growth in India (percent)
Current growth rate 5.5
Regulations goveming product markets
Distortions in land market 1 3 4 ‘ 1.3
~
0.7 Govemment ownership of businesses
Other, incl. transportation, infrastructure, and labor laws
POTENTIAL GROWTH RATE 10.1
Source: Based on a chart in Di Lodovico and others (2001)
The authors contend that these three barriers have a depressing effect, because they protect Indian companies from competition and thus from pressures to raise productivity. The authors calculate that these three barriers together inhibit GDP growth by more than 4 percent a year. Removing them would free India’s economy to grow as fast as China’s, that is, at 10 percent a year. Some 75 mil l ion new jobs would be created outside agriculture, enough not only to absorb the rapidly growing workforce, but also to reabsorb the majority o f workers displaced by productivity improvements. In addition, if each Indian
* For the study, the authors examined 13 sectors in detail: two in agriculture, five in manufacturing, and six in services, which taken together, accounted for 26 percent o f India’s GDP and 24 percent o f i t s employment. T h e study notes the following points: (a) Product market barriers include unfaimess and ambiguity o f policies; uneven enforcement; a number o f products that are reserved for small enterprises; restrictions on FDI in certain sectors o f the economy such as retailing, which closes o f f fruitful sources o f technology and sk i l l s ; and licensing requirements that stifle competition. These rules and policies goveming different sectors o f the country’s economy impede GDP growth by 2.3 percent a year. (b) Close to 1.3 percent o f lost growth a year results from distortions in the land market, which include unclear ownership; counterproductive taxation; and inflexible zoning, rent, and tenancy laws. (c) Govemment ownership o f businesses i s yet another barrier, as govemment-controlled entities s t i l l account for around 43 percent o f India’s capital stock and 15 percent o f employment outside agriculture. Their labor and capital productivity levels are well below those o f their private competitors, because public-sector managers experience litt le performance pressure. India’s electricity sector i s an example o f inefficient govemment control. The study estimates that privatizing state electricity boards would save govemment subsidies amounting to almost 1.5 percent o f GDP and oblige managers to improve their financial and thus operational performance (Di Lodovico and others 2001).
23
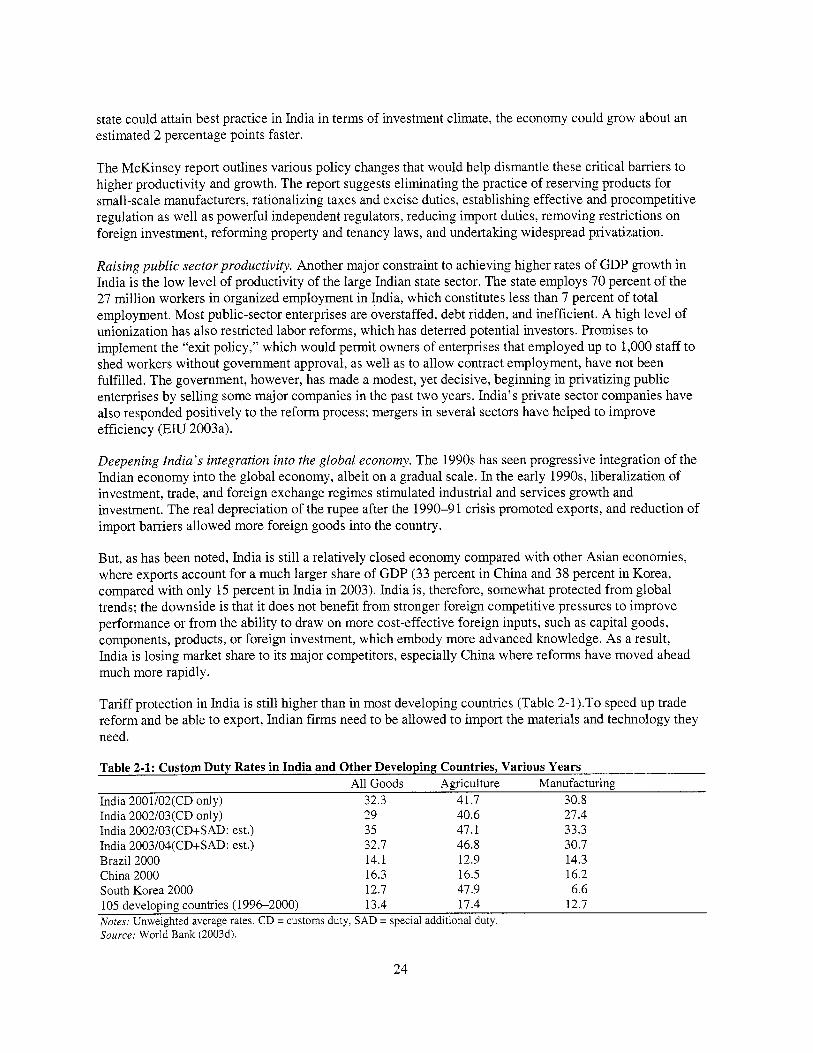
state could attain best practice in India in terms o f investment climate, the economy could grow about an estimated 2 percentage points faster.
The McKinsey report outlines various policy changes that would help dismantle these critical barriers to higher productivity and growth. The report suggests eliminating the practice of reserving products for small-scale manufacturers, rationalizing taxes and excise duties, establishing effective and procompetitive regulation as well as powerful independent regulators, reducing import duties, removing restrictions on foreign investment, reforming property and tenancy laws, and undertaking widespread privatization.
Raising public sector productivity. Another major constraint to achieving higher rates o f GDP growth in India i s the low level o f productivity o f the large Indian state sector. The state employs 70 percent o f the 27 mill ion workers in organized employment in India, which constitutes less than 7 percent o f total employment. Most public-sector enterprises are overstaffed, debt ridden, and inefficient. A high level o f unionization has also restricted labor reforms, which has deterred potential investors. Promises to implement the “exit policy,” which would permit owners o f enterprises that employed up to 1,000 staff to shed workers without government approval, as well as to allow contract employment, have not been fulfilled. The government, however, has made a modest, yet decisive, beginning in privatizing public enterprises by selling some major companies in the past two years. India’s private sector companies have also responded positively to the reform process; mergers in several sectors have helped to improve efficiency (EIU 2003a).
Deepening India’s integration into the global economy. The 1990s has seen progressive integration o f the Indian economy into the global economy, albeit on a gradual scale. In the early 1990s, liberalization o f investment, trade, and foreign exchange regimes stimulated industrial and services growth and investment. The real depreciation o f the rupee after the 1990-91 crisis promoted exports, and reduction o f import barriers allowed more foreign goods into the country.
But, as has been noted, India i s s t i l l a relatively closed economy compared with other Asian economies, where exports account for a much larger share o f GDP (33 percent in China and 38 percent in Korea, compared with only 15 percent in India in 2003). India is, therefore, somewhat protected from global trends; the downside i s that i t does not benefit from stronger foreign competitive pressures to improve performance or from the ability to draw on more cost-effective foreign inputs, such as capital goods, components, products, or foreign investment, which embody more advanced knowledge. As a result, India i s losing market share to i t s major competitors, especially China where reforms have moved ahead much more rapidly.
Tariff protection in India i s s t i l l higher than in most developing countries (Table 2-1).To speed up trade reform and be able to export, Indian f i r m s need to be allowed to import the materials and technology they need.
Table 2-1: Custom Duty Rates in India and Other Developing Countries, Various Years
India 2001/02(CD only) 32.3 41.7 30.8 All Goods Agriculture Manufacturing
India 2002/03(CD only) India 2002/03(CD+SAD: est.) India 2003/04(CD+SAD: est.) Brazi l 2000 China 2000 South Korea 2000
29 40.6 27.4 35 47.1 33.3 32.7 46.8 30.7 14.1 12.9 14.3 16.3 16.5 16.2 12.7 47.9 6.6
105 developing countries (1996-2000) 13.4 17.4 12.7 Notes: Unweighted average rates. CD = customs duty, SAD = special additional duty. Source: World Bank (2003d).
24
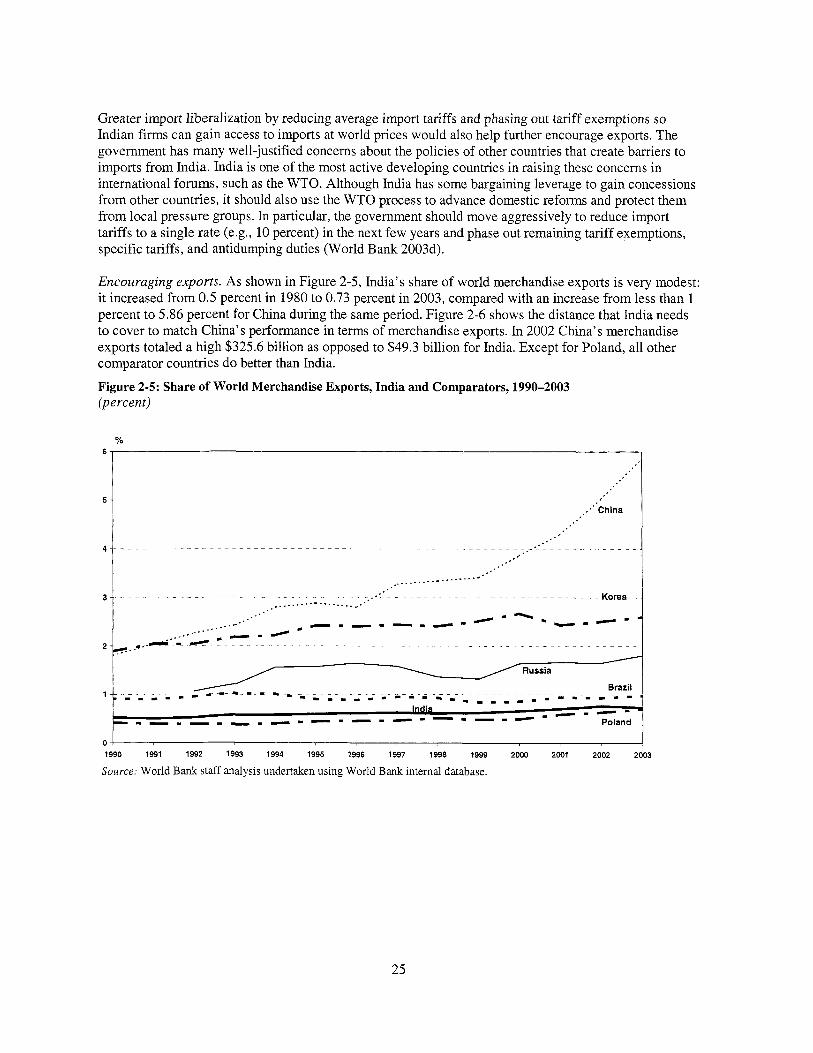
Greater import liberalization by reducing average import tariffs and phasing out tariff exemptions so Indian f i r m s can gain access to imports at world prices would also help further encourage exports. The government has many well-justified concems about the policies o f other countries that create barriers to imports from India. India i s one of the most active developing countries in raising these concerns in international forums, such as the WTO. Although India has some bargaining leverage to gain concessions from other countries, i t should also use the WTO process to advance domestic reforms and protect them from local pressure groups. In particular, the government should move aggressively to reduce import tariffs to a single rate (e.g., 10 percent) in the next few years and phase out remaining tariff exemptions, specific tariffs, and antidumping duties (World Bank 2003d).
5 -
Encouraging exports. As shown in Figure 2-5, India's share o f world merchandise exports i s very modest: i t increased from 0.5 percent in 1980 to 0.73 percent in 2003, compared with an increase from less than 1 percent to 5.86 percent for China during the same period. Figure 2-6 shows the distance that India needs to cover to match China's performance in terms o f merchandise exports. In 2002 China's merchandise exports totaled a high $325.6 bil l ion as opposed to $49.3 bil l ion for India. Except for Poland, all other comparator countries do better than India.
Figure 2-5: Share of World Merchandise Exports, India and Comparators, 1990-2003 (percent)
% 6
- - Korea _. - . ~ . - . . . . . . . ... 3 1 . ~~. . . . . .. .. . .. . . . -._.._... -.... ...._.'
O ! 1990 1991 1992 1993 1994 1995 1996 1997 1998 1999 2000 2001 2002 2003
Source: World Bank staff analysis undertaken using World Bank internal database.
25

Figure 2-6: Merchandise and Service Exports, India and Comparators, 2002 Billions of US$
0 Merchandise
250
200
India China Brazil Korea, Rep Mexico Poland Russian Federation
Source World Bank SIMA Database.
In terms o f service exports, even though the gap exists, it i s comparatively not as large between India and China, as in the case o f merchandise exports. This i s borne out in Figure 2-7, which shows the evolution o f India’s service exports among 1982, 1995, and 2002. India has been making rapid strides recently, especially in the communications and computer sector, as amply evident f rom the 2002 data. China, on the other hand, has been making rapid progress in recent years in ramping up i t s services exports, in particular, in the travel services sector.
Figure 2-7: Service Exports, India and China, 1982,1995, and 2002
Billions of US$ 40 -
~~ ___
I I
.Insurance and financial services 1 1 OCommunications, computer, etc
oTransport sewices OTravel sewices 351 -
30
25 ’
20 ....
15 4
10 +
l l
India 1982 India 1995 lndla 2002 China 1982 China 1995 China 2002
Source; World Bank SIMA Database.
26

Stimulating foreign direct investment. FDI i s a proven facilitator o f rapid and efficient transfer and cross- border adoption o f new knowledge and technology. Their complementary and catalytic role in a world o f increased competition and rapid technological change can be valuable for spumng g r ~ w t h . ~ If size o f the market and growth potential are two important factors in attracting FDI investments into an economy, India’s potential i s quite promising. But, even though FDI has increased several times compared wi th before liberalization o f the economy, the numbers are s t i l l fairly small on a global scale. After reaching a high o f 1 percent of GDP in 2001, gross FDI in India as a share o f GDP fe l l to 0.7 percent in 2002, much lower than in China (4.7 percent) or Brazi l (4.4 percent) (Figure 2-8).
The recently released World Znvestment Report 2004 (UNCTAD 2004) indicates that FDI flows to India rose b y 24 percent between 2002 and 2003, due to i t s strong growth and improved economic performance, continued liberalization, market potential, and growing competitiveness or Indian IT industries. In 2003 India received $4.26 bi l l ion in FDI, compared with $53.5 bi l l ion for China.” China’s FDI flows are primarily capital intensive, whereas Indian FDI flows are smaller and s k i l l intensive, concentrated in IT areas.
UNCTAD has also developed an Inward FDZ Pe$onnance Index, which ranks countries b y the FDI they receive relative to their economic size, calculated as the ratio o f a country’s share in global FDI inf lows to i t s share in global GDP (UNCTAD 2004).l’ Among the major developing countries, China i s ranked 37th-an improvement f rom i t s previous rank o f 50th, and India i s ranked 114th-a gradual improvement compared wi th 121st in the previous year.
Although i t i s true that FDI may transfer production capabilities quickly and efficiently, i t may not necessarily transfer design or innovation capability, particularly when the parent company uses affiliates to exploit the local market in the host country. I t i s thus very important for a country to not just attract foreign investment, but develop policies that can encourage significant positive spillovers to the economy in terms o f training local personnel, developing backward and forward linkages, improving quality, and contributing to access to global technology, management, markets, and distribution systems. lo For all of Chna’s success in attracting FDI, the way China’s FDI i s measured raises some concems. Many analysts have pointed to the possibility of “round tripping”: much of what i s counted as FDI in China i s actually Chinese investment that goes to Hong Kong and Singapore and comes back as FDI, to take advantage of more preferential treatment given to foreign investments. According to a recent article in ?-he Economist (ZOOS), besides FDI, India attracts several billion dollars a year in portfolio investment ($9 billion in 2004. I t also draws in billions of dollars in deposits from nonresident Indians ($33.3 billion in 2004). Adding t h s up, India i s not SO far behind China-especially i f one allows for Chinese domestic investors “round tripping,” that i s , using foreign vehicles to take advantage of tax breaks.
These index rankings are, of course, quite different from those given by the values of FDI inflows. For instance, despite being the largest recipient of FDI, the United States has always ranked comparatively low relative to i t s GDP. In 2003 i t ranked 112th, a sharp deterioration compared with the previous period when i t ranked 92nd. The decline reflects a sharp drop in inward mergers and acquisitions, whereas GDP remained relatively steady.
27

Figure 2-8: Gross Foreign Direct Investment as Percentage of Gross Domestic Product for India, Comparators, and the World, 1980-2002
%
_ _ _ _ _ _ _ _ _ _ _ _ _
-I - - * - - . - - - - - - - -
, - - - - -
1980 1982 1984 1986 1988 1990 1992 1994 1996 1998 2000 2002
Note. The spike expenenced by the world in 2000 was due to a peak in mergers and acquisitions in many developed countnes Source. World Bank SIMA Database
The 2004 Foreign Direct Investment Conjdence Index by A. T. Keamey (see http://www.atkearney.com/shared~res/pdf/FDICIOct_2004_S.pdf ) also highlights China’s continued attractiveness for FDI. But India’s stock i s rapidly rising: i t i s ranked third in t h i s most recent survey (up from sixth a year ago), just behind the United States. According to the survey, China and India dominate the top two positions for most positive investor outlook, likely first-time investments, and most preferred offshore investment locations for BPO functions and IT services. Compared with other large emerging markets, China and India are cited by chief executive officers (CEOs) as the most attractive FDI destinations in the short term (next three years) and well into the future, beating markets such as Brazil, Mexico, and Poland for medium-term attractiveness ten years out; however, according to the survey, global investors view these two destinations as distinctly different markets: China as the world’s leading manufacturer and fastest growing consumer market and India as the world’s business process and IT services provider with longer-term market potential. In terms o f the kinds o f activities that w i l l be moved offshore to China and India, investors indicated that China leads in manufacturing, whereas India leads in IT, business processing, and R&D investments. Investors favor China over India for i t s market size, access to export markets, government incentives, favorable cost structure, infrastructure, and macroeconomic climate. These same investors, however, cite India’s highly educated workforce, management talent, rule of law, transparency, cultural affinity, and regulatory environment as more favorable than China’s.
Several plausible reasons exist for the FDI gap between China and India. China’s total and per capita GDP are higher, making i t more attractive for market-seeking FDI. I t s higher literacy and education rates also suggest that i t s labor i s more skilled, making i t more attractive to efficiency-seeking investors. I t also has a large domestic market and an environment from which i t i s easy to export. China also has an advantage in terms o f i t s infrastructure. Compared with India, China has ten times as much o f expressway
28

(30,000 lulometers or 19,000 miles) and six times as many mobile and fixed-line telephones per 1,000 people. The cost o f power i s also about 39 percent lower in China than in India (The Economist 2005).
China’s success in attracting FDI i s no doubt also partly attributable to the fact that it has a wealthy Diaspora. From 1985 to 1996, two-thirds of China’s FDI came from Hong Kong, Macau, and Taiwan. India also has an impressive Diaspora, which seems to be growing more important. Box 2-1 highlights this fact and notes that India’s conducive economic and institutional regime should allow i t to attract greater FDI by tapping the Diaspora in the future. India also has an advantage in technical manpower, particularly in IT. I t s better English language s k i l l s serve as an attraction for FDI, and India has a vibrant domestic enterprise sector. In addition, the Indian government i s planning to open some more industries for FDI and further relax the foreign equity ownership ceilings.
Box 2-1: Foreign Direct Investment: A Tale of Two Countries [ndia has not attracted anywhere near the amount o f FDI that China has. Huang and Khanna (2003) note that this iisparity reflects in part the confidence international investors have in China’s prospects and their skepticism about [ndia’s commitment to free market reforms. But the FDI gap i s also a tale o f two Diasporas. China has a large and wealthy Diaspora that has long been eager to help; in contrast, the Indian Diaspora has been much less willing to invest back home. India, however, has managed to spawn a number o f firms in the most cutting-edge, knowledge- based industries (in software, Infosys and Wipro and, in pharmaceuticals and biotechnology, Ranbaxy and Dr. Reddy’s Laboratories). In 2002, the Forbes 200, an annual ranking o f the world’s best small companies, included 13 Indian firms, but just four from mainland China.
China has been far bolder with external reforms, but has imposed substantial legal and regulatory constraints on indigenous, private firms, mainly to prevent private domestic businesses from challenging China’s state-owned enterprises. India has developed much stronger infrastructure to support private enterprise. I t s capital markets operate with greater efficiency and transparency than do China’s. I t s legal system, although not without substantial flaws, i s considerably more advanced. I t i s true that privatization i s proceeding at a glacial pace, but the government has ceded its monopoly on long-distance phone service, some tariffs have been cut, bureaucracy has been trimmed a bit, and a number o f industries have been opened to private investment, including investment from abroad. As a consequence, entrepreneurship and free enterprise are flourishing. In a survey o f leading Asian companies by the Far Eastern Economic Review, India registered a higher average score than any other country in the region, including China. (The survey polled more than 2,500 executives and professionals in a dozen countries, who were asked to rate companies on a scale o f one to seven for overall leadership performance.) Only two Chinese firms had scores high enough to match India’s top ten list. All o f the Indian firms were wholly private initiatives, whereas most o f the Chinese companies had significant state involvement.
According to the authors, democracy, a tradition o f entrepreneurship, and a decent legal system have given India the underpinnings necessary for free enterprise to flourish. Although India’s courts are notoriously inefficient, they at least comprise a functioning independent judiciary. Property rights are not fully secure, but the protection o f private ownership i s certainly far stronger than in China. The rule o f law, a legacy o f British rule, generally prevails. These traditions and institutions have proved an excellent springboard for the emergence and evolution o f India’s capital markets. In their article, the authors refer to World Bank data that showed that only 52 percent o f the Indian firms surveyed reported problems in obtaining capital, compared with 80 percent o f the Chinese companies polled. As a result, Indian firms relied much less on internally generated finances: only 27 percent o f funding came through operating profits, compared with 57 percent for the Chinese firms.
Corporate governance has improved dramatically. In a survey o f 25 emerging market economies conducted in 2000 by Credit Lyonnais Securities Asia, India ranked sixth in corporate governance and China 19th. The advent o f an investor class, coupled with the fact that capital providers, such as development banks, are themselves increasingly subject to market forces, has bolstered the efficiency and credibility o f India’s markets. Apart f rom providing the regulatory framework, the Indian government has taken a back seat to the private sector in credit allocation. In China, in contrast, bureaucrats remain the gatekeepers, tightly controlling capital allocation and severely restricting the ability o f private companies to obtain stock market listings and access the money they need to grow. These policies have produced enormous distortions, while preventing China’s markets from gaining depth and maturity.
29
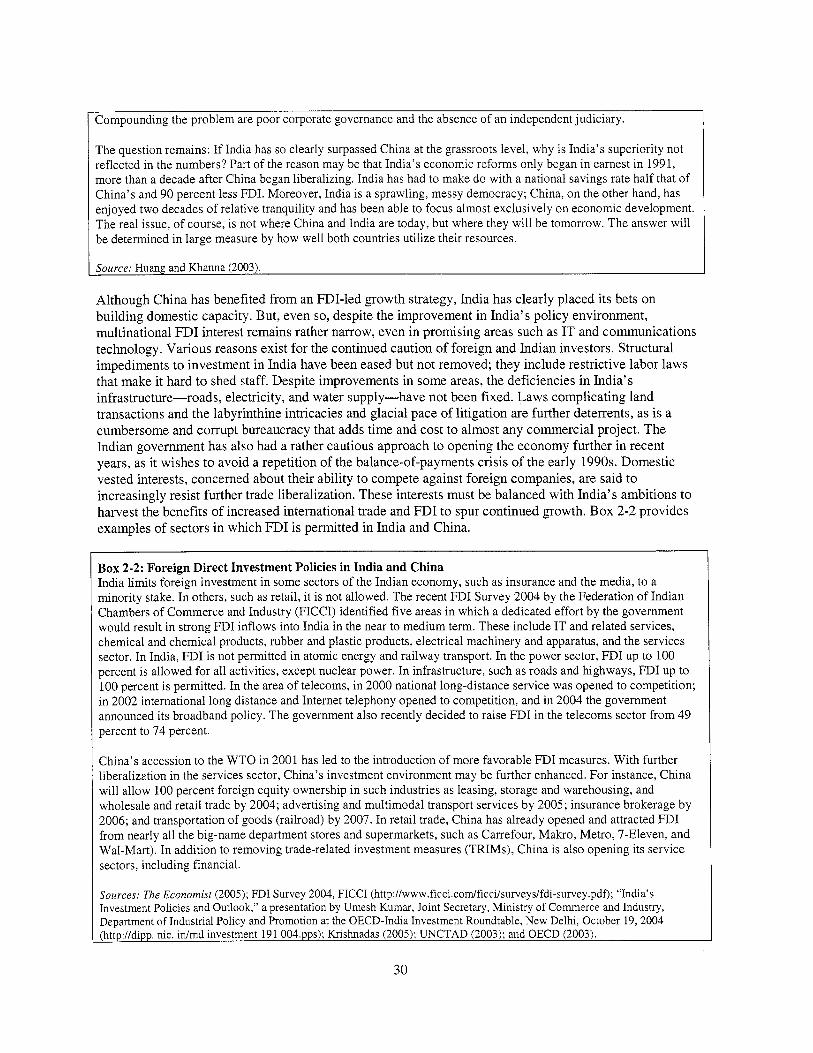
Compounding the problem are poor corporate governance and the absence o f an independent judiciary.
The question remains: If India has so clearly surpassed China at the grassroots level, why i s India’s superiority not reflected in the numbers? Part o f the reason may be that India’s economic reforms only began in earnest in 1991, more than a decade after China began liberalizing. India has had to make do with a national savings rate half that o f China’s and 90 percent less FDI. Moreover, India i s a sprawling, messy democracy; China, on the other hand, has enjoyed two decades o f relative tranquility and has been able to focus almost exclusively on economic development. The real issue, of course, i s not where China and India are today, but where they w i l l be tomorrow. The answer w i l l be determined in large measure by how well both countries utilize their resources.
I Source: Huang and Khanna (2003).
Although China has benefited f rom an FDI-led growth strategy, India has clearly placed i t s bets on building domestic capacity. But, even so, despite the improvement in India’s policy environment, multinational FDI interest remains rather narrow, even in promising areas such as I T and communications technology. Various reasons exist for the continued caution o f foreign and Indian investors. Structural impediments to investment in India have been eased but not removed; they include restrictive labor laws that make i t hard to shed staff. Despite improvements in some areas, the deficiencies in India’s infrastructure-roads, electricity, and water supply-have not been fixed. Laws complicating land transactions and the labyrinthine intricacies and glacial pace o f litigation are further deterrents, as i s a cumbersome and corrupt bureaucracy that adds time and cost to almost any commercial project. The Indian government has also had a rather cautious approach to opening the economy further in recent years, as it wishes to avoid a repetition o f the balance-of-payments crisis o f the early 1990s. Domestic vested interests, concerned about their ability to compete against foreign companies, are said to increasingly resist further trade liberalization. These interests must be balanced wi th India’s ambitions to harvest the benefits o f increased international trade and FDI to spur continued growth. B o x 2-2 provides examples o f sectors in which FDI i s permitted in India and China.
Box 2-2: Foreign Direct Investment Policies in India and China India l i m i t s foreign investment in some sectors o f the Indian economy, such as insurance and the media, to a minority stake. In others, such as retail, i t i s not allowed. The recent FDI Survey 2004 by the Federation o f Indian Chambers o f Commerce and Industry (FICCI) identified five areas in which a dedicated effort by the government would result in strong FDI inflows into India in the near to medium term. These include I T and related services, chemical and chemical products, rubber and plastic products, electrical machinery and apparatus, and the services sector. In India, FDI i s not permitted in atomic energy and railway transport. In the power sector, FDI up to 100 percent i s allowed for all activities, except nuclear power. In infrastructure, such as roads and highways, FDI up to 100 percent i s permitted. In the area of telecoms, in 2000 national long-distance service was opened to competition; in 2002 international long distance and Internet telephony opened to competition, and in 2004 the government announced its broadband policy. The government also recently decided to raise FDI in the telecoms sector from 49 percent to 74 percent.
China’s accession to the W T O in 2001 has led to the introduction o f more favorable FDI measures. With further liberalization in the services sector, China’s investment environment may be further enhanced. For instance, China w i l l allow 100 percent foreign equity ownership in such industries as leasing, storage and warehousing, and wholesale and retail trade by 2004; advertising and multimodal transport services by 2005; insurance brokerage b y 2006; and transportation o f goods (railroad) by 2007. In retail trade, China has already opened and attracted FDI from nearly all the big-name department stores and supermarkets, such as Carrefour, Makro, Metro, 7-Eleven, and Wal-Mart). In addition to removing trade-related investment measures (TRIMS), China i s also opening i t s service sectors, including financial.
Sources: The Economist (2005); FDI Survey 2004, FICCI (http://www.ficci.codficci/surveys/fdi-survey.pdf); “India’s Investment Policies and Outlook,” a presentation by Umesh Kumar, Joint Secretary, Ministry o f Commerce and Industry, Department of Industrial Policy and Promotion at the OECD-India Investment Roundtable, New Delhi, October 19,2004 (http://dipp. nic. idmd investment 191 004.pps); Krishnadas (2005); UNCTAD (2003); and OECD (2003).
30

Harnessing the benefits of FDI. Research b y the McKinsey Global Institute (Farrell and Zainulbhai 2004) indicates that the F D I in India has had a positive impact on the economy. The introduction o f foreign competition in IT, business-process outsourcing, and the automotive industry has prompted Indian companies to revamp their operations and boost productivity, leading some o f them to be globally competitive and, in the process, contributing to j o b creation. The World Znvestment Report 2004 noted, for example, that GE Capital was saving $300 mi l l ion annually b y outsourcing services f rom India, while giving employment to 12,000 people. Consumers in India have also benefited f rom lower prices, better quality, and a wider selection o f products and services, while domestic demand has increased in response to lower prices, for example, in the automotive industry (Box 2-3). India needs to build on the momentum in the automobile industry and replicate this success across the economy. The challenge i s t o increase competition in the economy, focus on creating jobs that add higher value, and replacing less productive companies wi th lower-value-added activities wi th more productive ones.
Box 2-3: Moving Up the Value Chain: India’s Automobile Industry According to the McKinsey Global Institute, instead o f spending tax money to offer financial incentives to foreign investors, governments should use funds to improve transportation networks, power grids, and telecommunications lines. Policy makers must boost competition in the broader economy so companies are compelled to improve their operations, adopt best practices, innovate, and move up the economic value chain. Too often, developing countries concentrate on special economic zones or preferred export industries, while competition languishes in the remaining sectors. Price controls, tariffs, licensing requirements, and other product regulations limit market entry and reduce competition.
As India’s $5 bi l l ion auto industry demonstrates, the gains from removing these stifling regulations can be dramatic. Twenty years ago, two state-owned carmakers-Hindustan Motors and Premier Automobiles Limited (PAL)-dominated the market and offered few choices. In 1983 the government allowed Suzuki Motor to take a minority stake in a joint venture with the small state-owned automaker Maruti Udyog, and in 1992 nine more foreign automakers were allowed to invest in India. This infusion o f new capital and technology created serious competition for the two incumbents, eventually forcing PAL out. The industry, one o f the fastest growing in the world, now produces 13 times more cars than i t did 20 years ago. Tata Motors hit a milestone in 2004 by exporting 20,000 cars to the United Kingdom, to be sold under the MG Rover brand. Meanwhile, prices for consumers in India have fallen by 8 to 10 percent annually, unleashing a burst o f demand and allowing steady employment despite rapidly rising productivity. In view o f the greater competitive intensity in the market, India may be better positioned than China to become a low-cost auto-manufacturing base. None o f this would have been possible had India’s carmakers remained isolated from the world.
Source: Farrell, Puron, and Remes (2005) and Fmell and Zainulbhai (2004).
Customizing market entry strategies. According Jain, Manson, and Sankhe (2005), multinational companies are often successful, precisely because they can replicate products and processes and even market-entry strategies across multiple markets. In India, however, the performance of the multinationals has been mixed. Many o f the M N C s notable for their strong performance elsewhere have yet to achieve significant market positions (or even average industry profitability) in India, despite a significant investment of time and capital in i t s industries. The reason i s that the market entry strategies that have worked wel l for these companies elsewhere-bringing in tried and tested products and business models f rom other countries, leveraging capabilities and s lu l l s f r om core markets, and forming joint ventures t o tap into local expertise and share start-up costs-are less successful in India.
According to the authors, the most successful multinationals in India have been those that did not merely tailor their existing strategy to an intriguing local market, but instead customized their products and practices to the Indian market. In short, they have resisted the instinct t o transplant to India the best o f what they do elsewhere, even going so far as to treat the country as a bottom-up development opportunity. With less o f a focus on init ial entry and wi th a long-term view o f what a thriving Indian business would
31
look like, the more successful companies have been investing time and resources to understand local consumers and business conditions: (a) tailoring product offers to the entire market from high-end to middle and lower-end segments, (b) localizing product offerings to meet Indian consumer preferences, (c) reengineering supply chains, for example, by buying components from cheaper Indian suppliers, rather than importing more expensive ones from their usual suppliers elsewhere, (d) even skipping the joint- venture route, because many times, the local partner has not been in a position to invest enough resources to enlarge the business as quickly as desired by the MNC, and (e) including an Indian CEO in their local operations who i s capable of tailoring products, supply chains, and distribution systems to the local markets. These companies have also been flexible and participated in the evolving regulatory process in India as, for example, has happened several times to regulations governing the mobile-telephony sector in India. Many companies have reaped rewards. O f the 50-plus multinational companies with a significant presence in India, the nine market leaders who have taken this customized approach, including British- American Tobacco, Hyundai Motor, Suzuki Motor, and Unilever, have an average return on capital employed o f around 48 percent. Even the next 26 have an average return on capital employed o f 36 percent.
Measures to Strengthen the Economic and Institutional Regime
The above discussion has described a number o f strengths and weaknesses in India’s evolving economic and institutional regime. Areas in which policy reform could address some o f the barriers to faster economic growth are discussed below, including improving the efficiency of government, encouraging a more conducive investment climate; improving competitiveness by strengthening IPRs and their enforcement; raising access to venture capital; encouraging the private sector to invest, not only to promote growth, but also expand opportunities for the poor; attracting greater FDI; and tackling infrastructure i s sues.
Improve the ej’iciency of government. As mentioned, the public sector in India i s quite large and rather unproductive. I t i s important to reduce the role of government in publicly owned productive enterprises and to improve the efficiency o f government in i t s core functions. The latter requires administrative and procedural reforms. One possibility i s also to use ICTs more efficiently in carrying out government functions, including for the delivery of social services such as education and health (see Chapter 5).
India currently stands at the threshold o f a unique opportunity regarding governance and public management reform. l2 It has recently approved a “National Action Plan for E-Governance (2003-07),” which addresses key governance issues at both central and state levels (see http://www.mit.gov.in/actionplan/about.asp). The plan lays the foundation and provides the impetus for long-term growth of e-governance in the country. I t seeks to create the right governance and institutional mechanisms, set up the core policies and infrastructure, and implement a number o f projects at the center and state levels to create a “citizen-centric’’ and “business-centric’’ environment for governance.
Documents such as the Report o f the Conference of Chief Ministers (1997), the Report o f the Fifth Central Pay Commission (1997), the Second Report o f the Expenditure Reforms Commission on Optimizing Govemment Staff Strength; and the Draft Approach Paper to the Tenth Five-Year Plan (2001) articulate a fairly integrated and coherent vision for change. Similar principles are endorsed by various state commissions, in such documents as Andhra Pradesh’s “Vision 2020,” the report o f Karnataka’s Administrative Reforms Commission and Govemance Strategy and Action Plan, and Uttar Pradesh’s policy papers on governance and civ i l service reforms, as well as b y Maharashtra’s One-Man Committee on Good Govemance. Taken together, such documents envision change along several general themes, which are related and mutually reinforcing, including efforts to l imi t the size, scope, and orientation of government; streamlining organizational structures and decision-making processes; reforming human resource management practices; improving transparency; enhancing responsiveness and accountability; promoting integrity; and improving service delivery. A n effective program o f c iv i l service reform also includes measures to improve citizens’ access to information, strengthen accountability, and reduce political interference (Excerpted from Robert Beschel, unpublished manuscript).
32

Many Indian states are also tackling core governance issues such as public expenditure management, civi l service reform, anticorruption, transparency and right to information, and enhanced accountability. The government o f Uttaranchal, for example, i s beginning to implement an e-governance program, which w i l l involve business process reengineering of various departments and government services to ensure better delivery o f development services to the people (State of Uttaranchal2003). Wholehearted implementation of these reforms, including sharing o f successful experiences across states, could lead to a sea change in the performance o f the Indian public service, making it more eff icient and effective in delivering public services to citizens.
Encourage a more conducive investment climate. A crucial ingredient for economic growth i s creation o f productive jobs and new businesses that can generate wealth, while expanding opportunities for poor people. The discussion above has demonstrated that companies must be able to adjust to new market conditions and seize opportunities for growth. Cumbersome regulations frequently take this flexibility away (as amply highlighted below on the costs o f doing business in India). Productive businesses thrive where government focuses on the definition and protection o f property rights, but when the government heavily regulates every aspect of business activity, businesses operate in the informal economy. Regulatory intervention i s particularly damaging in countries where i t s enforcement i s subject to abuse and corruption.
Successful economic development i s a process o f successive economic upgrading in which the business environment in a country evolves to support and encourage increasingly sophisticated ways o f competing. According to the World Bank (20041), a good investment climate provides opportunities and incentives for fms-from microenterprises to multinationals-to invest productively, create jobs, and expand and, thus, plays a central role in growth and poverty reduction. Such an investment climate encourages f i r m s to invest by removing unjustified costs, r i sks , and barriers to competition. Investment climate improvements in the 1980s and 1990s helped to nearly double private investment as a share of GDP in China and India (BOX 2-4).
Box 2-4: Investment Climate Improvement: Lessons from China and India China and India illustrate some simple lessons about strategies for making investment climate improvements and the importance o f even modest initial reforms. China and India have both grown impressively in recent years, greatly reducing poverty. China’s growth i s officially reported at an average o f 8 percent a year for the past 20 years, and the share o f i t s population l iving on less than $1 a day fel l from 64 percent in 1981 to less than 17 percent in 2001. India’s growth has increased from an average o f 2.9 percent a year in the 1970s to 6.7 percent by the mid-l990s, and the share o f its population l iving on less than $1 a day fell from 54 percent in 1980 to 26 percent in 2000.
Yet neither country has an ideal investment climate. China only recently gave constitutional recognition to private property, and i t s banking sector i s plagued by nonperforming loans. And India has problems in its power sector. Both countries unleashed growth and reduced poverty through what appeared to be fairly modest initial reforms. China began with a rudimentary system o f property rights that created new incentives for a substantial part o f i t s economy. India began with early efforts to reduce trade barriers and other distortions that covered a significant part of its economy. In both cases the reforms addressed important constraints and were implemented in ways that gave firms confidence to invest. And the initial reforms have been followed by ongoing improvements that addressed constraints that were less binding initially and also reinforced confidence in the future path o f government policy.
Source: Excerpted from World Bank (20041). T h e poverty incidence of 26 percent i s based on estimates of the Government o f India. More details are available in World Bank (2003d).
Private sector companies in India point to a variety o f burdens that weigh more heavily on them than their competitors: the cost of power, which i s two to three times higher than elsewhere; the cost o f borrowing; red tape and the corruption that goes with it; onerous sales and local taxes; slow and expensive transport;
33
and inflexible labor markets (The Economist 2000). Correcting these weaknesses constitutes much o f the government’s reform program. Some progress has been made (especially in telecommunications infrastructure), but more needs to be done to make the environment more stable and attractive to, in turn, make companies more competitive.
Efforts are needed to improve India’s overall investment climate “writ large.”I3 In India the potential gains to growth from removing key investment climate bottlenecks range from an estimated 2 to 4 percent a year. In addition, as mentioned earlier, India’s Tenth Five-Year Plan (India, Planning Commission 2002e) has set ambitious targets for GDP growth (an average o f 8 percent per year in the next decade) and employment creation (100 mill ion new jobs) to reduce poverty substantially. This requires a step up in domestic investment, particularly in private investment, coupled with improved productivity. To sustain an 8 percent growth rate in the long term, while reducing poverty, India must raise its investment rate to about 30 percent from the current 23 percent. This r ise would, in turn, require steep increases in the ratio of private sector investment to GDP and particularly in the industrial and service sectors, which have the greatest potential to provide high-wage employment for the labor force now working in agriculture. This w i l l have much to do with the quality o f India’s investment climate at the national and subnational levels and w i l l also be influenced by how investors rate India’s investment climate with other investment destinations in Asia.14
Another recent report by the World Bank and International Finance Corporation (IFC) Doing Business in 2005: Removing Obstacles to Growth (2004b) looks at the regulation o f businesses in depth and investigates the effect o f regulation on economic outcomes. The analysis i s done on starting a business, hiring and firing of workers, registering property, getting credit, protecting investors, enforcing contracts, and closing a business-all critical ingredients o f an effective investment climate. These indicators are used to analyze economic and social outcomes, such as productivity, investment, informality, corruption, unemployment, and poverty, and identify what reforms have worked, where, and why.
The Doing Business in 2005 report and related databa~e’~ show that in China the average time taken to secure the necessary clearances for a startup or complete a bankruptcy procedure i s much smaller than in India. In India, entrepreneurs go through 11 steps to launch a business within 89 days on average, at a cost
l3 For India and other developing countries to do well, a host o f other institutional factors and policies classified under the broad heading “investment climate” must complement good macro and trade policies. The quantity and quality o f investment flowing into any country depends on investor expectations and uncertainties on retums. Three broad and interrelated components can shape these expectations:
A set o f macro or country-level issues concems economic and political stability and national policy on foreign trade and investment and refers to macroeconomic, fiscal, monetary, and exchange rate policies as well as political stability. The issue o f efficacy o f a country’s regulatory framework, as far as firms are concemed, relates to the issues o f entry or starting a business, labor relations and flexibility in labor use, efficiency and transparency o f financing and taxation, and efficiency o f regulations conceming the environment, safety, health, and other legitimate public interests. T h e question i s not whether to regulate, but whether such regulations are designed in incentive-compatible ways, avoid adverse selection and moral hazard, serve the public interest, are implemented expeditiously without harassment and corruption, and facilitate efficient outcomes. The quality and quantity o f available physical and financial infrastructure (such as power, transport, telecommunications, and banking) and finance. When one surveys entrepreneurs about their problems and bottlenecks, they w i l l often cite infrastructure issues such as power reliability, transport time and cost, and access and efficiency o f finance as key determinants o f competitiveness and profitability (World Bank 2002~).
l4 The Wor ld Bank i s conducting investment climate surveys (ICSs) for various Indian states. In 2003 ICSs were conducted in 12 states: Andhra Pradesh, Delhi, Gujarat, Haryana, Karnataka, Kerala, Maharashtra, Madhya Pradesh, Punjab, Tamil Nadu, Uttar Pradesh, and West Bengal. I t should be noted, however, that employment in the formal sector in India i s very small (as mentioned, there are 27 mi l l ion workers in organized employment in India) and most business surveys are based on the responses of industries in the formal sector, which constitute only the tip o f the iceberg. India i s still largely an agricultural economy wi th a large section o f the population in rural areas: this important structural fact must be taken into account in designing these surveys. l5 Data are available at http://nu.worldbank.org/DoingBusiness/.
34
equal to 49.5 percent of gross national income (GNI) per capita. Starting a business in India requires about the same number o f permits as in China (12), but in China it takes less than half the time (41 days) on average to take care o f all procedures and at a much lower cost (14.5 percent o f GNI per capita). India also has one of the more regulated labor markets in the world, and restrictions on the hiring and firing o f workers greatly impede doing business. India’s overall Rigidity o f Employment Index i s 48, higher than in China (30), but lower than in Brazil (72). In a World Bank-Confederation o f Indian Industry (CII) survey (World Bank 2002c), the typical firm reported i t had 17 percent more workers than desired and could not adjust i t s workforce to a preferred level due mainly to labor laws and regulations. These regulations are a key reason why f i r m s are reluctant to take on new employees. In addition, in both India and Brazil, it takes more than 10 years to go through bankruptcy proceedings, in contrast to less than six months in Ireland and Japan and 2.4 years in China. Furthermore, Indian labor laws allow f i r m s far less latitude with their employees than labor code does in China, Brazil, Mexico, or Russia. On the positive side, India’s manufacturing f i rms face fewer tax and regulatory inspections than f m s in China and Brazil, and it takes fewer days in India to clear customs. Annex 8 provides a detailed snapshot o f the business climate in India by identifying specific regulations and policies that encourage or discourage investment, productivity, and growth.
Various indicators o f investment climate also show substantial improvement in India between 2000 and 2003. A comparison of key investment climate indicators (the investment climate survey [ICs] o f 2000 with the ICs o f 2003) shows the reported overstaffing rate in Indian f i r m s decreased from 16.8 percent to 10.9 percent, indicating more flexible labor markets. Inspections per year declined from 11.7 in 2000 to 7.4 in 2003; in the same period, senior management time spent on business regulations and inspectors f e l l from 16 to 14.2, reflecting fewer day-to-day bureaucratic hassles. The average number of days to clear customs fell from 10.3 in 2000 to 7.3 in 2003. Critical infrastructure indicators have also shown notable improvements. For example, 69 percent o f the f i r m s surveyed in 2000 reported using their own generators, because they could not rely on power from the public grid. B y 2003 this number had fallen to 61 percent (World Bank 2004d). Box 2-5 delves into more detail on the views o f the private sector in Brazil, China, and India on certain aspects o f the investment climate that have an impact on productivity and growth.16
l6 Based on investment climate surveys jointly carried out by the World Bank and the Confederation of Indian Industry (CII) during March to July 2003, covering a random selection of 1860 manufacturing establishments sampled from 40 cities in 12 Indian states, namely, Andhra Pradesh, Delhi, Gujarat, Haryana, Kerala, Kamataka, Madhya Pradesh, Maharashtra, Punjab, Tamil Nadu, Uttar Pradesh, and West Bengal. Based on shares in aggregate sectoral output, the bulk of the sample was drawn mainly from eight industries: garments, textiles, leather, drugs and pharmaceutical, electronic goods and equipment, electrical white goods, auto parts, food processing. T h e survey instrument was a written questionnaire, which shared key modules with ICs that the World Bank has sponsored in other countries including China and Brazil, the countries used as comparators to India in this report. For more information, see World Bank (2004d).
35
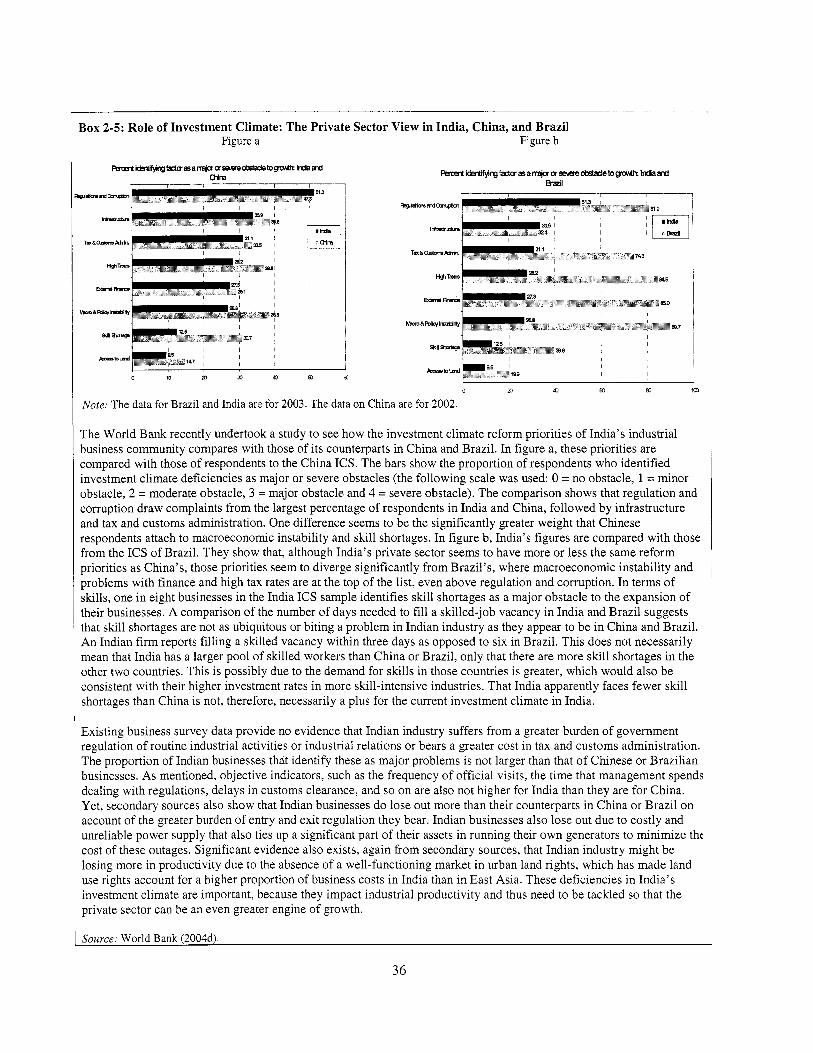
Box 2-5: Role of Investment Climate: The Private Sector View in India, China, and Brazil Figure a Figure b
I
0 a, a m m im
Note: The data for Brazil and India are for 2003. The data on China are for 2002.
The World Bank recently undertook a study to see how the investment climate reform priorities o f India’s industrial business community compares with those o f its counterparts in China and Brazil. In figure a, these priorities are compared with those o f respondents to the China ICs. The bars show the proportion o f respondents who identified investment climate deficiencies as major or severe obstacles (the following scale was used: 0 = no obstacle, 1 = minor obstacle, 2 = moderate obstacle, 3 = major obstacle and 4 = severe obstacle). The comparison shows that regulation and corruption draw complaints from the largest percentage o f respondents in India and China, followed by infrastructure and tax and customs administration. One difference seems to be the significantly greater weight that Chinese respondents attach to macroeconomic instability and skill shortages. In figure b, India’s figures are compared with those from the I C s o f Brazil. They show that, although India’s private sector seems to have more or less the same reform priorities as China’s, those priorities seem to diverge significantly from Brazil’s, where macroeconomic instability and problems with finance and high tax rates are at the top o f the list, even above regulation and corruption. In terms o f skills, one in eight businesses in the India I C s sample identifies skill shortages as a major obstacle to the expansion o f their businesses. A comparison o f the number o f days needed to fill a skilled-job vacancy in India and Brazil suggests that s k i l l shortages are not as ubiquitous or biting a problem in Indian industry as they appear to be in China and Brazil. An Indian firm reports f i l l ing a skilled vacancy within three days as opposed to six in Brazil. This does not necessarily mean that India has a larger pool o f skilled workers than China or Brazil, only that there are more skill shortages in the other two countries. This i s possibly due to the demand for sk i l l s in those countries i s greater, which would also be consistent with their higher investment rates in more skill-intensive industries. That India apparently faces fewer s k i l l shortages than China i s not, therefore, necessarily a plus for the current investment climate in India.
Existing business survey data provide no evidence that Indian industry suffers from a greater burden o f government regulation o f routine industrial activities or industrial relations or bears a greater cost in tax and customs administration. The proportion o f Indian businesses that identify these as major problems i s not larger than that o f Chinese or Brazilian businesses. As mentioned, objective indicators, such as the frequency o f official visits, the time that management spends dealing with regulations, delays in customs clearance, and so on are also not higher for India than they are for China. Yet, secondary sources also show that Indian businesses do lose out more than their counterparts in China or Brazi l on account o f the greater burden o f entry and exit regulation they bear. Indian businesses also lose out due to costly and unreliable power supply that also ties up a significant part o f their assets in running their own generators to minimize the cost o f these outages. Significant evidence also exists, again from secondary sources, that Indian industry might be losing more in productivity due to the absence o f a well-functioning market in urban land rights, which has made land use rights account for a higher proportion o f business costs in India than in East Asia. These deficiencies in India’s investment climate are important, because they impact industrial productivity and thus need to be tackled so that the private sector can be an even greater engine o f growth.
I Source: World Bank (2004d).
36

Improve competitiveness in other ways. The productivity dispersion of firms in India demonstrates the need to continue the process of regulatory reform, easing the ability of f m s to enter, expand, and exit as they adjust to a more competitive environment. As India moves from creating, acquiring, and adapting knowledge to becoming a generator and user o f new knowledge and technologies, it needs to take care o f some special issues that are becoming particularly important in terms o f the broader business environment:
Strengthen intellectual property rights and their enforcement. This issue i s becoming increasingly important in knowledge-based economies and being driven by the mounting costs o f R&D for new products or processes, shortening o f product l i fe cycle, rapid growth in international trade in high- tech products, and internationalization o f the research process. India has passed a series o f intellectual property rights laws in the past two years, whose enforcement wi l l be key. In the World Competitiveness Index 2004, produced annually by IMD International, India ranks 47th o f 60 countries and regions in terms o f patent and copyright protection.” Improve access to venture capital. Such access i s important to the success o f knowledge-based businesses. India has a burgeoning venture capital industry: in fact, in the same World Competitiveness Index, India ranks 24th (again, o f 60 countries and regions) in terms of availability o f venture capital for business development. Encourage the private sector to invest, create jobs, and improve productivity, not.only to promote growth, but also expand opportunities for poor people. The private sector can be a real engine o f jobs and services for the poor. C. K. Prahalad (2004) argues that companies must revolutionize how they do business in developing countries such as India if both sides of that economic equation are to prosper. H e offers insights on consumer needs in poor societies and opportunities that exist for the private sector to serve important public purposes, while enhancing i t s bottom line (Box 2-6).
Box 2-6: Tapping Entrepreneurial Capabilities and Buying Power of the Poor C. K. Prahalad (2004) writes that the real source o f market promise i s not the wealthy few in the developing world or even the emerging middle-income consumers: it i s the billions o f aspiring poor who are joining the market economy for the first time. H e exhorts large companies to use their resources, scale, and scope to cocreate solutions to problems that lie at the bottom o f the pyramid (BOP)-those 4 bi l l ion people who l ive on less than $2 a day. This requires mobilizing the investment capacity o f large firms, the knowledge and commitment o f nongovernmental organizations (NGOs), and the communities that need help to cocreate unique solutions to help the BOP. To sustain energy, resource, and innovation, the BOP must become a key element o f the central mission for large private-sector firms. The poor must also become active, informed, and involved consumers. Cocreating a market around the needs o f the poor can help to reduce poverty.
To do this, all players-NGOs, large domestic firms, MNCs, government agencies, and most important, the poor- must come together to solve problems. The focus should be on the active, underserved consumer community, as the four to five billion poor people become part o f the system o f inclusive capitalism, an economic opportunity valued globally at $13 trillion a year. The process must start with respect for BOP consumers as individuals and assume that consumers are equally important joint problem solvers. This sets the basis for a profitable win-win situation. In being served by big business, the poor “win” by being empowered to choose and are freed from paying the currently widespread “poverty penalty.” In shanty towns near Mumbai, for example, the poor pay a premium on everything from rice to credit, often five to 25 times what the rich pay for the same services. Prahalad provides 12 cases in a wide variety o f businesses in which the BOP i s becoming an active market, bringing benefits to consumers. The cases represent a variety of industries: from retail in Brazil and health and financial services in India, to housing in Mexico.
To be profitable, firms must reengineer products to reflect the very different economics o f the BOP: small unit
l7 IMD Intemational’s World Competitiveness Yearbook 2004 includes 5 1 countries and nine regional economies for a total o f 60 countries and regions.
37

packages, low margin per unit, and high volume. B ig businesses need to swap their usual incremental approach for an entrepreneurial mind set, because BOP markets need to be built, not simply entered. Products must be available in affordable units. Most sales o f shampoo in India, for example, are o f single sachets. Rethinking distribution networks may be necessary to, among others, involve entrepreneurs from among the poor. Despite skeptics, leading firms are now grappling with how to serve the BOP on a big enough scale and how to transfer what works from one part o f the world to another.
Source: Adapted from The Economist (2004f) and Prahalad (2005).
Attract greater FDZ. A recent study b y Farrell and Zainulbhai (2004) highlighted steps the Indian government could take to encourage foreign investment (Box 2-7). The Indian government should ideally try to attract those types o f investments that can contribute strongly to the Indian economy.
Box 2-7: Building on Success: Attracting Foreign Investment in India 4 McKinsey Global Institute (MGI) report by Farrell and Zainulbhai highlights that India’s economy has made real xogress, but further liberalization w i l l be needed to sustain its growth. The country now has 40 mil l ion people ooking for work, and an additional 35 mil l ion w i l l jo in the labor force in the next three years. Creating jobs for :hese people w i l l require more dynamic and competitive industries across the economy, as well as opening up to foreign competition; thus, to build on its successes, the Indian government must lower trade and foreign investment Darriers s t i l l further in the following ways:
Tariff levels should be cut to an average o f 10 percent, matching those o f India’s neighbors in the ASEAN. Although progress has been made on tariffs, the government still prohibits imports o f many goods and protects inefficient companies from foreign competition. To provide incentives to companies to improve their operations, the government should first lower duties on capital goods and inputs, and then, in several years, reduce them on finished goods. Foreign-ownership restrictions should also be lifted throughout the economy as well, except in strategic areas, notably defense. At present, foreign ownership i s not only prohibited in industries such as agriculture, real estate, and retailing, but also limited to minority stakes in many others, such as banking, insurance, and telecommunications. India’s government should reconsider the expensive but often ineffective incentives i t offers foreign companies to attract foreign investment. These resources would be put to better use improving the country’s roads, telecom infrastructure, power supply, and logistics. MGI’s research found that the government often gives away substantial sums o f money for investments that would have been made anyway. For example, it has waived the 35 percent tax on corporate profits for foreign companies that move business-process operations to India, even though the country dominates the global industry. Moreover, state governments often conduct unproductive bidding wars with one another and give away an assortment o f tax holidays, import duty exemptions, and subsidized land and power. MGI surveys show that foreign executives place relatively little value on these incentives and would rather that the government invest resources in developing infrastructure. Interviews with foreign executives showed that India’s labor laws deter foreign investment in some industries. For example, software and business-outsourcing companies are exempt from many labor regulations, such as those regarding hours and overtime. Without these exemptions, i t would be impossible to perform back-office operations in India. To attract foreign investment in labor intensive industries, the government should therefore consider making labor laws more flexible.
Source: Excerpted from Farrell and Zainulbhai (2004).
Tackle infrastructure issues. A critical part o f the overall investment climate in any country relates to the state o f i t s infrastructure. The poor condition o f India’s infrastructure has often been cited as a major hindrance to economic growth.
38
Transportation i s clearly an area in which India’s infrastructure does not meet that o f i t s regional neighbors. Only 56 percent o f roads are paved in India, compared with an average o f 88 percent in most East Asian countries. The total container volume handled at all the Indian ports combined i s lower than that passing through Shanghai! A comparison o f the freight traffic of Indian and Chinese railways shows India lagging way behind. Rail freight as a percent o f traffic units i s only 5 percent in India, compared with 79 percent in China. The transportation costs associated with shipping a container of textiles to the United States are more than 20 percent higher for India compared with Thailand and 35 percent higher compared with China. Variations in maritime distances explain only a small part o f the gap. Delays and inefficiencies in the ports, in particular, in customs, account for a higher share o f the difference in port productivity. These international comparisons demonstrate the clear need for India to focus on improving i t s physical infrastructure and port efficiency.
Access to reliable power at reasonable cost i s another prime concern for most Indian businesses. Industry surveys have found that acute power shortfalls, unscheduled power cuts, the erratic quality o f power supply (low voltage coupled with fluctuations), delays, informal payments required to obtain new connections, and very high industrial energy costs seriously constrain Indian industry and have serious implications for overall industry performance and competitiveness. Across India, the shortfall in 2001-02 was estimated at 7.5 percent for energy and 13 percent for peak demand with substantial variations across states in the availability and reliability o f supply. Not only does industry receive irregular and low-quality power, but must pay tariffs much above the cost o f supply. Much of this i s due to cross-subsidization o f power tariffs by state governments and widespread power theft (commonly referred to as “transmission and distribution losses”). Industry ends up paying an average tariff o f Rs. 3.81 per kilowatt-hour, whereas the average cost o f public power supply i s Rs. 3.50 per kilowatt-hour. Industrial tari f fs for high-tension industries are 8-9 cents per kilowatt-hour, among the highest in the world, compared with 6 cents in Brazil and Thailand and 3 4 cents in China. Typical rates in Western Europe range from 6 to 7 cents a kilowatt-hour.
In addition, the 2003 ICs found that, on average, manufacturers in India face nearly 17 significant power outages per month, compared with one per month in Malaysia and fewer than five in China. About 9 percent of the total value of fm output i s lost due to power breakdowns-compared with 2.6 percent in Malaysia and 2.0 percent in China. The frequency and average duration o f outages are such that generators are standard industrial equipment in India, accounting for as much as 30 percent o f a business’s power consumption in many cases. Moreover, India’s combined real cost o f power i s 74 percent higher than Malaysia’s and 39 percent higher than China’s.
The paucity, unreliability, and poor quality o f power from the public grids has also forced a greater proportion o f Indian f i r m s to operate their own (captive) generators, further increasing the cost o f power bome by industry and reducing fm- leve l competitiveness. Some 69 percent o f the manufacturing f i r m s surveyed across India in 2000 had their own power generator; even though this number had fallen to 61 percent by 2003, it was s t i l l higher than in Malaysia (20 percent), China (27 percent), and Brazil (17 percent). Although large f i r m s can bear such costs, small and medium enterprises (SMEs) suffer severely. The typical Indian SME has i t s own generator, tying up one-sixth o f i t s capital. This stunts the growth o f the S M E sector.
For all these reasons, power sector reform i s now widely accepted as fundamental to improving business performance in India. Urgent priorities include rationalizing power tariffs, establishing statutory
39
regulatory authorities, and implementing a phased reduction in cross-subsidies that operate against industrial consumers.18
India has made considerable progress in the telecommunications sector in the past few years. Most business surveys report that Indian f i r m s are reasonably satisfied wi th the state o f the country’s telecommunications infrastructure. As discussed in chapter 5, India’s performance has been improving in this area, although India lags globally behind China and other comparators on many ICT-type indicators.
Summary of Issues and Recommendations
The above discussion has highlighted a host o f policy reforms in India’s economic and institutional regime so the country can embrace knowledge better to enhance growth and competitiveness. Key areas include improving the efficiency o f government b y reducing i t s role in publicly owned productive enterprises and using ICTs more efficiently for carrying out government functions, including for the delivery o f social services such as education and health. In addition, three specific interrelated sets o f regulatory and institutional reforms are important in improving India’s investment climate:
1. Remove product market distortions and for the startup and exit offirms. Tariff protection in India i s s t i l l substantially high. T o create a level playing f ie ld for investment, both domestic and foreign, India needs to put in place trade policy reforms to enhance industrial sector performance. I t should thus speed up trade reform by undertaking the following:
Reduce average import tariffs, and phase out tariff exemptions, specific tariffs, and antidumping duties Reform customs administration to reduce clearance times Reduce the role o f government ownership in the economy, and increase competition in product and service markets Eliminate preferential policies for small-scale players Implement a full and uni form value-added tax Reduce entry and exit barriers to manufacturing industries Phase out remaining l i m i t s on FDI, including the ban on FDI in the retail sector Streamline regulation o f business startups and bankruptcy procedures Improve overall protection and enforcement o f PRs.
2. Improve factor markets. For f i r m s t o be able to innovate and take advantage o f new opportunities, i t i s important that the smooth working o f factor markets complement entry and exit procedures. The movement o f labor and capital f rom less to more productive activities i s central t o realizing the benefits o f greater competition and openness. Improving the efficiency o f factor markets includes the following:
Ease restrictions on hiring and firing o f workers Reform labor regulations, for example, extending the flexibil i ty to adjust labor use to f i r m s in the 100-1,000 employee range Improve S M E access to credit (large creditworthy borrowers have benefited f r o m the recent decline in interest rates, but the lack o f access to adequate, timely credit o n competitive terms continues to constrain SMEs development)
For more information on issues discussed in th is section, see World Bank (2002c and 2004d)
40

0
0
0
0
Make finance more affordable by undertaking financial sector reforms to improve access and reduce the spread between deposit and lending rates Improve the venture capital market by reducing restrictions on capital funds, and open up to full participation o f foreign investors Update the bankruptcy framework and procedures to improve the allocation o f resources and access to credit Ease restrictions and reduce taxes and extreme regulatory burdens on the use and transfer o f land, because (as argued in the McKinsey report) land market distortions account for approximately 1.3 percent o f lost growth per year.
3. Alleviate key infrastructure bottlenecks, including the following:
0
0
0
0
Reform the power sector, rationalize power tariffs, and implement a phased reduction in cross- subsidies that operate against industrial consumers Introduce time-of-day tariffs for industries with peak and off-peak rates Improve the financial and operational performance o f power utilities by unbundling and commercializing state electricity boards, independent regulation, and improved sector governance Address capacity and quality constraints in the transport sector by improving public sector performance (for roads and rail), mobilizing private sector investment (including better cost recovery for roads), phasing out price distortions (for rail), and improving the efficiency o f existing capacity (for ports).
In sum, even though India has been reforming i t s overall economic and institutional regime in the past decade, i t s growth in the future wi l l need to be more productivity based by increasing the efficiency o f investments in physical capital and in knowledge. Although this chapter has mainly focused on the modem sector, a gigantic part of the Indian economy requires overall upgrading. Tremendous benefits can be achieved in terms o f overall growth if India can put in place the appropriate mechanisms to use and diffuse modem and new technologies throughout the economy, while tapping global knowledge to raise the overall technological performance o f the economy.
Economic incentives and institutions are extremely critical, because they set the overall ru les o f the game for an economy to progress in response to the rapidly changing challenges and opportunities brought about by the knowledge economy. Further strengthening o f this pillar o f the knowledge economy in India w i l l not only free the economy to take full advantage o f the rapid advances in global knowledge and technology and continually redeploy resources to the most productive uses, but w i l l also allow the country to obtain higher returns on the resources that are being invested in education, innovation, and the information infrastructure. Achieving these higher returns w i l l depend on redefining the role o f the Indian government and in constantly reorienting i t s overall development strategy to meet the new challenges.
41
3. EDUCATION AND HUMAN RESOURCES
Education i s the fundamental enabler o f the knowledge economy. Well-educated and skilled people are key to creating, sharing, disseminating, and using knowledge effectively. The knowledge economy o f the twenty-first century demands, in addition to traditional “hard” s k i l l s such as literacy (the “3Rs”) and, more recently, ICT competencies, a new set o f s k i l l s that includes “soft” s k i l l s such as communication sk i l l s , problem-solving sk i l l s , creativity, and teamwork. Although soft sk i l l s were previously required o f persons in managerial positions, they are increasingly important for all workers in the emerging knowledge economy, This i s because, although at the center of the knowledge economy are what Peter Drucker refers to as “knowledge workers”-people with considerable theoretical knowledge and learning, such as doctors, lawyers, teachers, accountants, and engineers-the most striking growth w i l l be in knowledge technologists. They include computer technicians, software designers, analysts in clinical labs, manufacturing technologists, and paralegals, who spend far more time working with their hands than with their brains, but this manual work i s based on a substantial amount of theoretical knowledge that only can be acquired through formal education, not apprenticeship. Just as unskilled manual workers in manufacturing were the dominant social and political force in the twentieth century, knowledge technologists are likely to become the dominant social and perhaps political force in the next decades (Drucker 2001b).
The development o f a knowledge economy requires a flexible education system. It begins with basic education that provides the foundation for learning; continues with secondary and tertiary education that develops core, including technical, sk i l l s , and encourages creative and critical thinking that i s key to problem solving and innovation; and extends into a system o f lifelong learning. A lifelong learning system i s one that encompasses learning from early childhood to retirement and includes formal training (schools, training institutions, and universities) and nonformal learning (on-the-job training, and s k i l l s learned from family members or people in the community). The basic elements o f such a system are comprehensiveness, new basic s k i l l s (acting autonomously, using tools interactively, and functioning in socially heterogeneous groups), multiple pathways, and multiple providers.
A large pool o f highly educated and vocationally qualified people in India are making their mark at home and abroad in science, engineering, IT, and R&D, but they make up only a small fraction o f India’s population. To become a knowledge economy, India needs to keep developing its human capital base and creating knowledge workers to contribute to i t s growth, development, and competitiveness in the global economy. Holistic reforms w i l l be necessary to reorient classroom teaching and learning objectives, starting as early as primary school and extending through secondary and tertiary education. India must make i t s education system more attuned to the characteristics o f the new global environment, by focusing on learning rather than schooling, and creating an enabling environment that promotes creativity, improves the quality of basic and tertiary education, and provides opportunities for lifelong learning.
Benchmarking Education
Figure 3-1 shows that India has marginally improved its position relative to other countries on the education pillar during the past half decade. I t leads the South Asia and Africa Regions, but lags behind Brazil and China. India also significantly trails behind Poland, Russia, as well as Korea, which has a formidable record in education, especially tertiary, in which it outperforms many OECD countries.
42
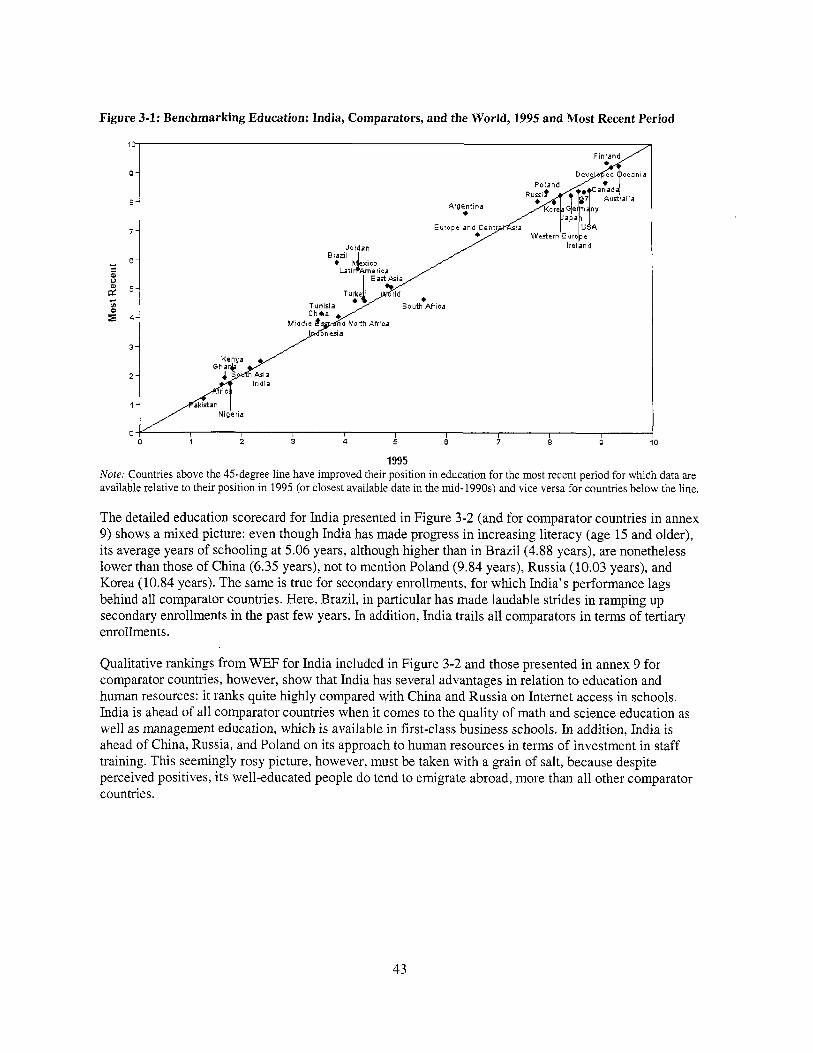
Figure 3-1: Benchmarking Education: India, Comparators, and the World, 1995 and Most Recent Period
0 1 2 3 4 5 6 7 8 Q
1995
0
Note: Countries above the 45-degree line have improved their position in education for the most recent period for which data are available relative to their position in 1995 (or closest available date in the mid-1990s) and vice versa for countries below the line.
The detailed education scorecard for India presented in Figure 3-2 (and for comparator countries in annex 9) shows a mixed picture: even though India has made progress in increasing literacy (age 15 and older), its average years o f schooling at 5.06 years, although higher than in Brazil (4.88 years), are nonetheless lower than those o f China (6.35 years), not to mention Poland (9.84 years), Russia (10.03 years), and Korea (10.84 years). The same i s true for secondary enrollments, for which India’s performance lags behind all comparator countries. Here, Brazil, in particular has made laudable strides in ramping up secondary enrollments in the past few years. In addition, India trails all comparators in terms o f tertiary enrollments.
Qualitative rankings from WEF for India included in Figure 3-2 and those presented in annex 9 for comparator countries, however, show that India has several advantages in relation to education and human resources: i t ranks quite highly compared with China and Russia on Internet access in schools. India i s ahead o f all comparator countries when it comes to the quality o f math and science education as well as management education, which i s available in first-class business schools. In addition, India i s ahead o f China, Russia, and Poland on i t s approach to human resources in terms o f investment in staff training. This seemingly rosy picture, however, must be taken with a grain o f salt, because despite perceived positives, i t s well-educated people do tend to emigrate abroad, more than all other comparator countries.
43

Figure 3-2: India’s Scorecard on Education, Selected Variables, Most Recent Period AduC Meracy rate (% age 15 and above) (61 03)
(2 83) Well educated people do not emigrde abro years of schooling (5 U6)
(5 TO) Availabilrty of management education Secondary Enrollment (48 47)
(3 80) Extent of Staff Training Tertiary Enrollment (1 0 58)
(5 50) Qualrty af science and math educeti e expectancy at birth, years (63 201
(4 10) Public spending on education as % of access in schools (3.80)
i\‘ote; Each o f the 80 variables in the KAM i s normalized on a scale o f 0 to 10 for 128 countries. The fuller the scorecard, the better poised a country i s to embrace the knowledge economy. But an economy should not necessarily aim for a perfect score of 10 on all variables. This i s because the scorecards may be shaped by the particular structural characteristics of an economy or by trade-offs that characterize different development strategies. Values in parentheses denote actual values for India for the most recent period for which data are available. Source: World Bank, “Knowledge Assessment Methodology,” http://www.worldbank.org/kam.
Issues and Recent Developments in Education and Human Resource Development
India’s transition to the knowledge economy will be determined by whether i t s people can create, share, and use knowledge effectively. In moving forward, India needs to combine educational reforms oriented to raising participation, equity, and quality at the school and higher education levels with lifelong learning and training programs that can provide the labor force with the necessary sk i l ls t o be fully engaged in the knowledge economy. This section reviews some important trends in education and human resource development in India and highlights some important issues related to strengthening India’s overall educational system.
Enhancing literacy. Rates o f literacy among the population (aged seven years and older) have risen considerably in India in the past ten years. The 2001 census recorded literacy rates o f 65.4 percent, up from 52.2 percent in 1991. The male literacy rate i s 75.9 percent (up from 56 percent in 1981), compared with 54.2 percent for women (30 percent in 1981). The gap between male and female rates has therefore narrowed from 28.8 percent in 1991 to 21.7 percent in 2001. Considerable regional variations exist, however: Kerala has a literacy rate o f 91 percent, whereas Bihar’s i s only 48 percent (EIU 2003a).
The constraints in the country’s path to reducing adult il l iteracy are many: the size and diversity o f i t s population, the time it takes by conventional methods to teach a person to read and write, high dropout rates, lack o f trained teachers, and inadequate infrastructure. Some innovative new ways exist, however, in which ill iteracy i s being tackled in India at l o w cost using ICTs, as i s illustrated by the computer-based functional literacy program initiated by the Tata Group (Box 3-1). Initiatives such as these wil l need replication on a massive scale throughout India to contribute significantly to reducing ill iteracy in the country.
44

Box 3-1: Reducing Illiteracy: The Computer-Based Functional Literacy Program The computer-based functional literacy (CBFL) program initiated by Tata Consultancy Services (TCS) o f the Tata Group tries to overcome illiteracy through the innovative use o f IT. I t has the potential to help resolve India’s adult illiteracy problem and to make 90 percent o f India functionally literate in three to five years. The CBFL project uses a mixture o f methods-teaching software, multimedia presentations, and printed materials-to teach an uneducated person to read in a fraction o f the time i t takes to do this by conventional means. I t employs animated graphics and a voiceover to explain how individual alphabets combine to give structure and meaning to various words. The project focuses exclusively on reading and teaches a person to read within a span o f 30 to 45 hours spread across 10 to 12 weeks. The emphasis i s on words, rather than alphabets, and the process i s styled to suit the learner. Because the program i s multimedia driven, it does not need trained teachers. This also reduces the cost o f eradicating illiteracy. The TCS course uses puppets as the motif in the teaching process and has been designed from material developed by the National Literacy Mission, established by the Indian government in 1988 to help eradicate adult illiteracy and i s tailored to f i t different languages and even dialects.
In terms o f results, those coming through the program can acquire a 300-500 word vocabulary in their own language and dialect. This i s enough for everyday requirements, such as reading destination signs on buses, straightforward documents, and even newspapers. The program sets people on the path to acquiring other literacy skil ls, including writing and arithmetic ability. Such infrastructure could also make similar material available, for example, concerning healthcare or agriculture.
The program’s potential in India can be gauged by its success in Andhra Pradesh, where i t i s now operational in 415 centers and has helped at least 8,500 people. Looking ahead, setting up a network to monitor the project and i t s growth and to share information and get feedback i s important. The project should also expand throughout the country, because no one organization can solve India’s illiteracy problem by itself. I t requires participation o f multiple actors, including the government, private sector companies, and NGOs.
Source: The Tata Group (2005).
Raising school enrollments. A strong basic education system i s a necessary precondition to underpin India’s efforts to enhance further the productivity and efficiency o f its economy. China’s experience in this area i s instructive: i t s emphasis on secondary education has provided a firm basis for global expansion o f the country’s manufacturing activities. Investments in basic education are thus fundamental for countries to improve the productivity and quality o f labor and deliver manpower needed for development.
Table 3-1 shows the enrollment o f students in primary, secondary, and tertiary education and illustrates the large expansion in student intake that has taken place at all levels in India. The rate o f enrollment in primary schools in India has increased in the past decade, from 97 percent o f the eligible age group in 1990 to 99 percent in 2001 (Figure 3-3). The corresponding rate for secondary schools
45

Figure 3-4) rose from 44 percent in 1990 to 50 percent in 2001, but i s s t i l l lower than other comparators, such as China (67 percent in 2001) and Brazil, which has made tremendous improvements in the past decade and reached 107 percent o f the eligible age group in 2001.
Stages 1990-91
Primary (grades 1-5) 91.4
Upper Primary (grades 6-8) 34.0
Secondary (grades 9-12) 19.1
Tertiary d a
2001-02
113.9
44.8
30.5
9.2"
Figure 3-3: Gross Primary Enrollment Rates, India and Comparators, 1990-2001 (percent)
YO 160
150
140
130
120
110
100
90
I m Brazil - - _ - . China
-India - Korea
- Russia - Poland
1990 1991 1992 1993 1994 1995 1996 1997 1998 1999 2000 2001
Note: Discontinuous l ines are due to unavailability o f data for certain years. Source: World Bank intemal databases.
46

Figure 3-4: Gross Secondary Enrollment Rates, India and Comparators, 1990-2001 (percent)
70t 60 -
30 4
Note: Discontinuous lines are due to unavailability of data for certain years. Source: Wor ld Bank intemal databases.
Despite the accomplishments, India s t i l l accounts for one-quarter o f the world’s 104 mill ion out-of-school children. The quality o f education-widespread teacher vacancies and teacher absenteeism, high dropout rates, inadequate teaching and learning materials, and uneven levels o f learning achievement-is o f great concern. I t i s important to note, for the education MDGs, girls in the 6- to 14-year-old group s t i l l exhibit relatively low participation in elementary education. Beyond this age group, considerable gaps exist in provision and access to secondary education, again particularly for girls. But, the Indian government’s leadership and commitment to increasing educational attainment has been strong. In 2002 an amendment to the Indian Constitution made elementary education a fundamental right of every child. The national program for universal elementary education, Sarva Shiksha Abhiyan (Education for All), began in 2001. This program i s intended to provide eight years o f schooling for children in the 6- to 14-year-old group by 2010 and pays special attention to gender and social equity and inclusive education. The program, which the government wholly owns, i s designed for a large federal system, with a decentralized framework for service delivery and a built-in accountability mechanism at the school and community levels. The emphasis on quality reinforces the drive to improve access, efficiency, and equity. Achieving the program’s goals would not only realize the Indian government’s development objectives, but also help to meet the global MDG for education by enrolling one-quarter o f the world’s out-of-school children.
47
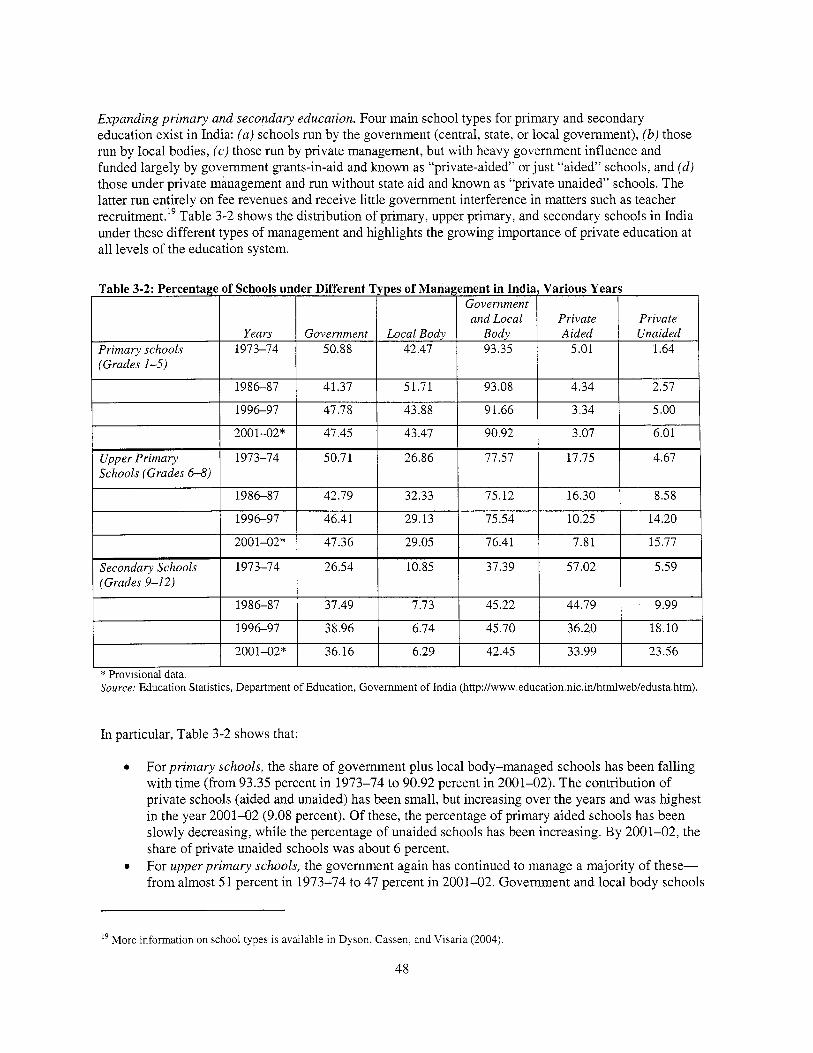
Expanding primary and secondary education. Four main school types for primary and secondary education exist in India: (a) schools run b y the government (central, state, or local government), (b) those run b y local bodies, (c) those run by private management, but wi th heavy government influence and funded largely b y government grants-in-aid and known as “private-aided” or just “aided” schools, and (d) those under private management and run without state aid and known as “private unaided” schools. The latter run entirely o n fee revenues and receive l itt le government interference in matters such as teacher recruitment.” Table 3-2 shows the distribution o f primary, upper primary, and secondary schools in India under these different types o f management and highlights the growing importance o f private education at a l l levels o f the education system.
* Provisional data. Source: Education Statistics, Department o f Education, Government o f India (http://www.education.nic.in/htmlweb/edusta.htm).
In particular, Table 3-2 shows that:
0 For primary schools, the share o f government plus local body-managed schools has been fall ing w i th time (from 93.35 percent in 1973-74 to 90.92 percent in 2001-02). The contribution o f private schools (aided and unaided) has been small, but increasing over the years and was highest in the year 2001-02 (9.08 percent). Of these, the percentage o f primary aided schools has been slowly decreasing, while the percentage o f unaided schools has been increasing. B y 200 1-02, the share o f private unaided schools was about 6 percent. For upper primary schools, the government again has continued to manage a majority of these- f rom almost 5 1 percent in 1973-74 to 47 percent in 2001-02. Government and local body schools
0
l 9 More information on school types i s available in Dyson, Cassen, and Visaria (2004).
48

together account for about 77 percent of all upper primary schools in 2001-02. The private sector (aided and unaided) schools also remained more or less stable from 22.42 percent in 1973-74 to 23.58 percent in 2001-02; however, the share of private aided schools fe l l by almost half, whereas that of private unaided schools more than tripled to 15.77 percent between 1973-74 and 2001-02! For secondary schools, during 1973-74 to 2001-02, the maximum number of these schools were under private management; however, a declining trend in private-aided schools has been observed, while the percentage o f private unaided schools has been increasing. B y 2001-02, they had increased their share by more than four times to reach 23.56 percent o f secondary schools.
0
I t seems that accelerated educational progress in the 1990s was partly due to the contribution made by the rapidly growing private school sector, which represents increased private expenditure on education by households. Analysts suggest various reasons for why households increasingly bypass free public schools to send their children to private fee-charging schools. Reasons given rarely include the lack of a government-funded school in the vicinity, but more frequently the perceived better quality o f private schooling. In addition, unlike government primary schools, private schools provide active teaching: when investigators visit these schools, teachers are almost always in class and teaching. I f the fiscal squeeze in state budgets continues in the future, parents who can afford it w i l l turn increasingly to private schools to educate their children. The private sector i s thus likely to continue to grow relative to the public education sector (for more information, see Dyson, Cassen, and Visaria 2004).
To meet the challenge raised by private education providers, some state governments are trying to improve the relevance and quality o f education provided in government schools. For example, one promising experiment relating to provision of IT training in high schools i s taking place in Andhra Pradesh: the government has contracted with the National Institutes o f Information Technology (NIIT) to provide training in computers to more than 300,000 high school students in 663 government schools. This has involved setting up modem computer classrooms in each o f these schools, for a total o f more than 8,000 computers, and rolling out computer education classes. NIIT i s also working to enhance the s k i l l base of people at large in Andhra Pradesh by using these schools to provide state-of-the-art computer education to local citizens after school hours. NIIT’s computer training engagement has now spread to more than 2,000 government schools covering more than 750,000 students in India, including 371 schools in Tamil Nadu, 700 schools in Kamataka, and about 100 schools each in Punjab and West Bengal (NIIT 2002).
Spending on education. Table 3-3 highlights that expenditure composition i s skewed toward the secondary level and to an even higher extent toward tertiary education in India and also in China. It i s important to note that unit costs rise progressively and significantly among primary, secondary, and tertiary education levels across all education systems. This variation reflects in large part higher salaries and more sophisticated infrastructure, that is, laboratories, technologies, and so on, required to deliver education at these levels.
49

Table 3-3: Spending on Education, India and
dollars. 7.003 GDP per capita, U.S.
Country
India (2000) 563 Brazil (2001) 2,788 China (1998) 1,094
Poland (2000) 5,487 3,022 Russian Federation 2001
Korea (2000) 12,634
Note: The abbreviation “n.a.” means not available. Data for tertiary expenditure for Korea are for 2001. Source: Wor ld Bank internal database.
Com3arators, 2001 Public expenditure per student (as uercent o f GDP per capita)
a q Tertiary Primary Second
13.71 23.01 85.76 10.75 9.98 48.49 6.58 12.56 89.13 18.38 16.84 7.37 28.81 11.82 16.10 n.a. n.a. 9.60
Given a distinctive feature o f India-where a sophisticated academic tradition coexists with mass poverty-it i s perhaps not surprising that tertiary education i s expensive in terms o f GDP. This does not mean, however, that tertiary education i s a high priority use o f public money. University fees have generally been on the low side, and universities should evaluate the extent to which they can hike fees, at the same time taking into account of the needs o f poorer students. Private sources should be encouraged to contribute to a greater extent to higher education, and more public resources should be allotted for primary and secondary education. Some measures to improve use o f public resources in primary and secondary education include the following:
Involve communities and parents to monitor and evaluate school performance to a much greater degree. Making schools more accountable i s critical, even to the extent o f giving parents, through local school committees, the right to hire and fire teachers. Box 3-2 highlights the experience o f community-government partnership for education in Madhya Pradesh. Encourage competition in education. In Kerala, for example, substantial subsidies are given for transportation for students. Parents can shop around for better schools, which fosters competition among schools for enrollments, providing critical revenue. Give more autonomy to schools to attract teachers and students. Higher levels o f government can help by establishing more regular measurement o f attendance, learning outcomes, and other information needed to evaluate student progress. Use distance education technologies to improve and increase access to primary and secondary and vocational education. Given the paucity o f adequately trained and qualified teaching staff in semi- urban and rural areas, these technologies could be a cost-effective mechanism to providing educational opportunities to more students (World Bank 2003d).
50

Box 3-2: Community-Government Partnership Helps Get Millions into School: The Case of Madhya Pradesh In the past decade, Madhya Pradesh’s Education Guarantee Scheme (EGS) dramatically improved access to primary education, especially for children from very poor households and in scattered settlements. The program i s built on community demand and participation and guarantees a fast-track approach to basic education by linking i t with local self-government institutions.
The EGS was designed specifically to address the issue o f access. Between July 1997 and July 2000,26,571 EGS schools were created (42 percent of them in tribal areas) catering to 1,233,052 children (47 percent girls and 44 percent tribal children), o f which 91 percent were from “scheduled caste,” “scheduled tribe,” and other socially disadvantaged communities. As o f June 2003 the program appointed a total o f 31,815 Gurujis (teachers), who were identified by the community and trained by the education department o f the government. The most significant impact o f EGS has been a sharp reduction in the absolute numbers o f out-of-school children: from 1,315,000 (boys) and 1,604,000 (girls) in 1996 to 346,000 (boys) and 428,000 (girls) in 2002-03. Female literacy increased b y 20.93 percent in the decade.
This program was based on community demand and managed by local self-government institutions. The Government o f Madhya Pradesh ensured continuation o f the program through a motivated team o f officials for the decade starting in 1993-94. From i t s outset, the EGS was positioned as a large-scale program, not just a small innovation. The Government o f Madhya Pradesh allocated adequate financial resources on elementary education. Other innovative sources o f funding included the “Fund a School” program in 2000, in which anyone could log on to the Web site and adopt a school; funds were directly credited into the bank account o f the school concerned. The EGS created institutional structures for including poor rural children by providing a forum for articulation o f demand for education through the Panchayat, a mechanism to forward that demand through local self-government structures, public commitment by the government to establish EGS primary schools, and mechanisms for continued participation o f the community and the Panchayat in management and supervision. Another innovation was the government’s pledge to meet its obligation o f providing an EGS school within 90 days and provide training and academic support to the teacher identified by the community. The EGS program demonstrates that when poor people are confident that their voice w i l l be heard and they can exert a positive influence, their enthusiasm to participate in local governance goes up.
I Source: Ramachandran (2004).
In sum, ensuring consistency between the s k i l l s being taught in primary and secondary education and the needs o f the knowledge economy wi l l only help to strengthen India’s human resource base further. This requires that materials and methods also be introduced to teach students “how to learn” instead o f stressing occupation-specific knowledge. India could do well to learn from the experiences o f other countries, such as Brazil, that have made rapid progress in increasing secondary enrollments and improving the quality of their secondary education systems.
Boosting tertiary and technical education. Tertiary education i s critical for the construction o f knowledge economies. Tertiary education i s a broader notion than i t used to be, incorporating most forms and levels o f education beyond secondary schooling and including both conventional university and nonuniversity types o f institutions and programs. Tertiary education also means new kinds o f institutions, work-based settings, distance learning, and other arrangements and now puts the focus as much on demand as it does on supply. In other words, i t i s more student led than in the past and has new implications for stakeholders, institutions, and resource planning (Wagner 1998). A recent World Bank report states that “tertiary education i s necessary for the effective creation, dissemination, and application o f knowledge for building technical and professional capacity. Developing countries are at risk o f being further marginalized in a highly competitive world economy, because their tertiary education systems are not adequately prepared to capitalize on the creation and use o f knowledge” (World Bank 2002a).
India currently produces a solid core o f knowledge workers in tertiary and technical education, although the country needs to do more to create a larger cadre of educated and agile workers who can adapt and use
51

knowledge. Figure 3-5 shows that until 1999 India led China in terms o f i t s gross enrollment ratio (GER) for tertiary education, after which China surpassed India. In 2001 India had a tertiary GER o f 1 1.4 percent compared wi th 12.7 percent for China. According to recent sources, China’s gross enrollments were in the range o f 13-15 percent in 2003,20 and some estimates suggest that they have increased even further to about 20 percent by 2004. Whatever the estimates, i t i s clear that, in the past few years, China has surpassed India in this domain and i s continuing to make rapid progress. But even so, India and China are n o match for Poland and Korea, which had impressive tertiary GERs o f 59 percent and 82 percent, respectively, in 200 1.
Figure 3-5: Gross Tertiary Enrollment Rates, India and Comparators, 1990-2000 (percent)
% 90
I 1
e
e / c
/
BredC -
O ! I 1990 1991 1992 1993 1994 1995 1996 1997 1998 1999 2000 2001
Note: Discontinuous l ines are due to unavailability o f data for certain years. Source: World Bank internal databases.
*’ According to China’s National Statistics Bureau (2003), gross enrollment in Chna’s higher education system was 13 percent for 2002-03. In a recent paper, Levin and Xu (2003) indicate that increased govemment investment, diversified resources, and improved efficiency have produced rapid expansion in terms o f both teaching and research in the past several years. For a long time, the college entrance examination was the most ferocious battlefield for Chnese students and the GER was consistently below 7 percent. I t was especially diff icult to get into key national universities, where the ratio o f admissions to acceptances i s even more selective. Within six years (1996-2002), however, this ratio has more than doubled. T h e authors cite the latest numbers from a January 2003 report from the Chinese Ministry o f Education showing that the ratio reached more than 15 percent of the corresponding age group (18-22 years old) in the past year.
In India, according to India’s Planning Commission (2001b), the university system in India provides access to only 5.75 percent o f the estimated population in the 18-24 age group. In 1999-2000, o f a total estimated population o f 134 mi l l ion in the 18-24 age group, only 7.73 mi l l ion were enrolled in colleges and universities. T h e nonformal system (distance and open learning) accounts for only a small percentage o f the total enrollment in hgher education. O f the 7.73 mi l l ion students enrolled in colleges and universities, distance education and correspondence courses covered only about 1 mi l l ion students.
52

The numbers, however, belie some laudable achievements in the field o f tertiary education in India. The country has some 272 universities, 58 “deemed” universities, 12,600 colleges, and many world-class institutions o f higher learning that are competitive and meritocratic (such as Indian Institutes of Technology [IITs], Indian Institutes of Management, Indian Institute o f Science, and the regional engineering colleges [RECSI).~~
Alleviating constraints in tertiary education. Despite the efforts put into establishing a top-quality university system, not all publicly funded universities or other educational institutions in India have been able to maintain high-quality standards or keep pace with developments in knowledge and technology. Even within tertiary institutions, such as the University o f New Delhi, the quality varies significantly across i t s multiple colleges. Subsidies for tertiary education and a system o f positive discrimination have skewed the education system; a great number o f students are accepted on the basis of caste or religion rather than ability. A key challenge i s addressing the academic needs of students o f much more mixed abilities than was the case in the past when only the best prepared students (generally from the upper classes) had access. This has important internal efficiency implications. Poor prior academic preparation of many students contributes to often high repetition and dropout rates. This situation exacts a high cost on the system, not only raising average outlays per student graduating, but further circumscribing places available for other students who wish to pursue higher-level studies. One approach meriting consideration i s widening the choices o f institutions available to meet tertiary education demands and needs. O f special note i s potential development o f a community college system, including possible conversion o f some lower-quality, lower-performing university-affiliated colleges. This approach holds substantial promise for helping students from poorer academic backgrounds to get remedial support and build study s k i l l s to enable them to transfer into bona fide universities.
Today, many tertiary education institutions in India are constrained by an explosion in enrollments, poor and inadequate academic and physical infrastructure, limited financial support from the government, the struggle between quality and quantity, and, most important, an overall bureaucratic regulatory and management framework built on numerous controls. Over the years, the Indian education system as been heavily subjected to government regulation. Government intervention has generated a range o f regulations on provision o f educational services, rendering the system inflexible in meeting market needs. In the tertiary education sector, universities lack autonomy in management and academic affairs, student enrollments and admissions, fee levels, and so on. In addition, poor remuneration and infrastructure mean that most tertiary educational institutions are not able to attract or retain high-quality faculty members. Many tertiary-level institutions are faced with faculty shortages due to noncompetitive pay packages and mediocre faculty quality. Only half the faculty in professional institutions have a postgraduate degree, and few have a doctoral degree. Another major weakness o f India’s tertiary education system i s the existing tenure system, which “guarantees” lifetime employment opportunities and provides adverse incentives for those who would like to engage in innovative research. The current system also makes the existing talent pool in academia less mobile and competitive, which, in turn, affects the quality o f education delivered, ability o f these institutions to attract high-quality students, and potential o f students to attain the high learning outcomes required in a knowledge economy.
In the area of quality assurance and accreditation, major steps are needed to ensure that India’s institutions meet high-quality national (and if such services are exported, international) standards. The heavy centralization o f the accreditation process by the National Accreditation Board currently leads to long wait l i s t s and a very bureaucratic process, with one chance to pass or fail. The best accreditation systems worldwide emphasize the need for institutions to undertake continual self-evaluation and
*’ The number of universities (in 2000) i s from http://www.Indiastat.com. The number of colleges (in 2002) i s from the University Grants Commission (http://www.ugc.ac.in).
53
monitoring and view the process as ongoing; recommendations ensuing from various phases serve as valuable guides for institution strengthening. Private universities in India are also not accredited, a situation that needs remedying, because these institutions are increasingly becoming providers o f highly skilled personnel and knowledge workers. A stronger competitive environment for all universities thus needs to be cultivated, because this w i l l help to create greater diversification and responsiveness to student needs, as well as meet the competitive needs o f the economy.
Steps to enhance the quality and relevance o f higher education also need to taken. This i s especially important, because according to the University Grants Commission (UGC), some 9.3 mill ion students in India are currently pursuing undergraduate and graduate degrees and 85 percent o f these only receive a general degree, which i s not enough to convert these students into effective knowledge workers; thus, to make education more attuned to the needs o f the marketplace, recent plans have been announced to have “clubbed education,” in which students would not only get a general degree, but also utility-oriented education. The plan i s to increase the duration o f undergraduate education from three to four years (3+1 structure), in which the last year would be spent in an allied professional subject, and a student would get two degrees at the end of four years.”
Another area that holds promise for attaining desired quality improvements i s that o f establishing partnerships among Indian universities to optimize available resources and between Indian universities and foreign ones. This holds potential not only for upgrading by pooling library and other resources and attracting and retaining high-quality faculty via interpartner exchange programs, but also affords the opportunity for students to receive widely sought internationally recognized credentials. The Indian School o f Business in Hyderabad, established and operating jointly with two outstanding U.S. business schools-the Kellogg School o f Management and Wharton School-and with the London Business School in the United Kingdom, i s a prime example.
The Indian government i s also quite concerned about the rapidly increasing establishment o f real and virtual campuses o f foreign universities in the country. Many foreign universities are clearly widely perceived to offer (although not necessarily the case) a higher-quality education and-not unimportant- externally recognized credentials than Indian institutions. Such competition may serve as a powerful catalyst to effect needed quality-enhancing tertiary education reforms throughout India’s own system. This trade also presents India with substantial, as yet not fully or well-exploited, opportunities to export i t s own tertiary education as well as attract many more foreign (well-paying) students into i t s system.
Improving science and technology education. India has one o f the world’s largest systems o f postsecondary technical science and engineering education. As a result, i t has one of the largest stocks o f scientists, engineers, and technicians in the world. But a study by the World Bank (2000) detailed several major deficiencies in India’s scientific and technical manpower development system that urgently need to be addressed if India i s to fulfill i t s huge potential for economic prosperity. These include overcentralization and lack o f autonomy and accountability o f institutions, as most have little authority on faculty appointments, student admissions, structure and contents o f programs, student performance evaluation, and financial management. In terms o f physical infrastructure, technology and infrastructure support i s poor in many tertiary education institutions, especially in laboratories, communication lines, computer and IT, as well as in library linkages. In addition, resource constraints prevent attracting the best to academic careers, the quality and relevance o f the curriculum i s in general poor, and quality assurance mechanisms are weak.
22 From a presentation made by Arun Nigavekar, chairman, University Grants Commission at the workshop on “India and the Knowledge Economy: Leveraging Strengths and Opportunities,” November 9,2004, New Delhi (http://www. worldbank.org.in/WBSITE/EXTERNAWCOUNTRIES/SOUTHASIAEXT/INDIAEXTN/O,,contentMDK:20279055 -menuPK:295602-pagePK: 141 137-piPK: 141 127-theSitePK:295584,00.html).
54

Although the Indian system includes a few well-known and world-class institutions o f international standing, such as IITs and the Indian Institute of Science, it thus has hundreds o f newly established engineering colleges that are yet to meet quality norms and standards. At the apex of the technical education institutions in the country are the IITs. India also has some front-ranking universities and institutions for engineering and applied sciences education, such as the Indian Institute o f Science, University o f Roorkee, Jadavpur University, and Anna University. The government has also established, in partnership with states, 17 RECs with a primary focus on high-quality engineering practice. These colleges along with about 30 well-established state colleges and government-aided private colleges form the second tier o f leading technical institutions. The RECs are followed by some 500 government/govemment-aided and self-financing engineering colleges offering only degree programs and some 1,100 polytechnics offering diploma programs. Most of these institutions operate under strict control o f the State Directorates o f Technical Education and the affiliating universities or State Boards of Technical Education. Although I I T s and a few other first-tier institutions offer world-class education and training in engineering and technology incorporating “best practices,” a large number o f institutions offer rather outdated programs (prescribed by their affiliating universityhoard) with inflexible structures and content. Within each category o f public, privately aided, and private unaided institutions, wide variation in quality exists. Quality assurance mechanisms are weak, and programs in less than 15 percent of institutions are accredited by the National Accreditation Board. IT i s not used significantly for teaching. N o more than 6 percent o f institutions have any noteworthy research activity. Institutions are essentially unconnected to the industries and sectors in which their graduates find employment (World Bank 2000).
Matching education with labor market needs. Even though India produces almost 200,000 scientists, engineers, and technicians a year (Table 3-4), i t has not been obtaining the full economic benefit from this s k i l l base because o f the mismatch between education and the labor market. The professional workforce emerging from India’s higher education system often cannot find suitable employment due to a growing gap between knowledge and real practice and to limited job opportunities in professional fields, coupled with low salaries. Many o f them also leave the country in search o f better opportunities, which leads to brain drain.
Table 3-4: Scientific and Technical Personnel from Indian Universities by Level o f Qualification, and 1995
Source: Research and Development Statistics 2000-01, Ministry of Science and Technology, Government of India
1979, 1989,
Reversing brain drain. One of the indicators o f international mobility i s the number o f Indian students entering the United States. This number has increased considerably, from around 15,000 Indian students in 1990 to almost 50,000 in 2001. Almost 80 percent of the Indian students who enrolled in tertiary education in various OECD countries in 2001 went to the United States. In 1999, 165,000 Indian residents in the United States had science and engineering as their highest degree. They accounted for 13 percent o f the total number of foreign-born U.S. residents with science and engineering as their highest degrees,
55

more than any other country. India also accounted for a high share of foreign-born residents residing in the United States in 1999 with a science and engineering doctorate: 16 percent or 30,000 people, which i s second only to China. Moreover, Indians comprised almost 7 percent o f people granted entry as permanent residents in the United States in 2001 (Khadria 2004a).
So not only does India have to deal with the problem o f the high outflow o f the tertiary educated workforce, but those who leave also tend to be the best of their cohort. Vast outflows o f highly skil led health professionals are among the prime examples: 49 percent o f graduates o f the All-India Institute for Medical Sciences, the country’s best medical school, emigrated in the 1990s. But there are some positive signs are evident of a reverse brain drain from the United States back to India. According to the U.S. National Science Foundation, after peaking in the mid-l990s, the number o f doctoral students from India, China, and Taiwan with plans to stay in the United States has begun to fal l (Broad 2004).
I t i s important to differentiate between the “virtuous” and vicious cycles o f human capital flows. Recent developments have shown that India has become a major international center for the recruitment o f high- quality IT staff. Many IT workers leave, but many return, and both flows generally lead directly and indirectly to significant knowledge transfers and linkages across business entities that benefit Indian society as well as individuals. A recent OECD paper also describes the results o f two specific surveys targeting highly skilled Indians: one of IT professionals in Bangalore and the second o f health professionals (doctors and nurses) in New Delhi on their motivations for emigrating, experiences abroad, reasons for corning back to India, and perception o f their current situation. The findings o f both case studies show that young IT professionals as well as medical professionals want to go abroad mainly to gain professional experience, which they think wi l l be highly valued in India when they come back. In addition, they are encouraged by higher earnings, perks, and high quality o f l i f e in the host country. Unlike the IT professionals as well as most doctors, however, the majority o f prospective nurses want to settle down abroad permanently, because they do not perceive their career prospects to be bright in India. Only some o f the doctors are prepared to settle abroad permanently if they get a chance. The fact that none of the respondent professionals in Bangalore gave priority to the idea o f settling abroad highlights a unique aspect o f Bangalore becoming a “corridor” for migration (outward and inward) of Indian human resources in science and technology, which i s not the case for health professionals from New Delhi. IT professionals in Bangalore believe they have growing opportunities for career growth in India in general and Bangalore in particular (Khadria 2004b).
With time, the above developments have no doubt exacted costs. Many o f the highly skilled people who migrate from India have been educated at publicly financed tertiary institutions. Their migration means public resources have subsidized high-level human capital formation for developed countries. The United Nations Development Programme’s (UNDP’s) Human Development Report 2001 estimates a loss o f $2 bil l ion a year in resources due to emigration o f computer professionals to the United States alone. The report states that each year about 100,000 Indians are expected to emigrate to the United States, when India has invested between $15,000 and $20,000 in educating each one of them; the Indian government’s investments in education are thus subsidizing industrial country economies, particularly the United States! Many questions arise: how can India be compensated for this fiscal cost, and i s i t possible to demand compensation from host country governments? According to the UNDP report, the simplest administrative mechanism would be to impose a flat tax-an exit fee paid by the employee or the firm at the time the visa i s granted. The tax could be equivalent to the fees charged by headhunters, which generally run about two months’ salary. Assuming annual earnings o f $60,000, t h i s would amount to a flat exit tax o f $10,000, or approximately $1 bil l ion annually. The report also cites several alternatives for taxing flows o f human capital:
e Requirement for loan repayment. Each student in tertiary education i s given a loan (equivalent to the subsidy provided by the state), which must be repaid if the student leaves the country.
56

0
0
0
A f lat tax. Overseas nationals pay a small fraction o f their income annually, for example, 1 percent. U.S. mode2. Individuals are taxed on the basis of nationality, not residence (this would require negotiating bilateral tax treaties). Cooperative model. A multilateral regime allows automatic intergovernmental transfers of payroll taxes or income taxes paid by nationals o f other countries.
Country Year Population Highest level attained over No First level Second Level Post-Secondary
age 15 Schooling Total Complete Total Complete Total Complete ( 1000s) (Percentage of the population aged 15 and over)
India 1980 423306 66.6 12.6 4.1 18.5 5.4 2.4 0.7 1990 542391 55.8 20.5 7.6 20.5 5.6 3.3 1.7 2000 680072 43.9 28.2 10.5 23.8 6.5 4.1 2.2
China 1980 642693 34.0 31.3 11.8 33.7 9.9 0.9 0.6 1990 837940 22.2 34.6 13.0 41.3 13.5 1.9 1.4 2000 958997 18.0 33.9 12.8 45.3 14.8 2.8 2.1
As with all taxes, each o f the above involves trade-offs between administrative and political feasibility, and the revenue potential that can be garnered as a result o f these measures.
Average Years
of School 3.27 4.10 5.06
4.76 5.85 6.35
Measures to Strengthen Education and Human Resources
Although India has significant areas o f strength in i t s educational system and human resource development, the country must still address key areas of reform so education w i l l support the new knowledge economy. These include enhancing basic education, overhauling tertiary education, remedying weaknesses in science and technology education, promoting policy and institutional reforms for scientific R&D, strengthening sk i l l s development and training, encouraging lifelong learning, enhancing the role o f government, and involving the private sector in education, training, and human resource development.
Enhance basic education. Ski l ls matter more than ever in today’s competitive global market. In large countries such as India and Brazil, where the vast majority o f people are unskilled and uneducated, the capabilities o f the majority of the population must be enhanced for the economy to show substantial improvements. Firms and farmers alike must be able to learn and develop new s k i l l s . While not losing sight o f the need for secondary and tertiary education, governments should improve the s k i l l and education levels of the mass o f people through primary and vocational education. The success of countries such as China in achieving higher growth reveals the importance o f a workforce that has a basic education and can be trained.
Table 3-5 highlights the educational attainment o f the population in China and India in 1980-2000.
Source: Barro and Lee (2001)
I t shows that in 1980, China already had a higher share o f population with schooling than India: 66.6 percent compared with 34 percent. So, it i s not surprising that China had a higher average educational attainment level in 2000 o f 6.35 years compared with 5.06 years in India. In the past 20 years, i t i s impressive that India was able to more than double the share o f population with completed primary education from 4.7 percent to 10.5 percent. China, however, was able to increase the share of population with completed secondary education by 50 percent from 9.9 percent in 1980 to 14.8 percent in 2000, compared with an increase from 5.4 percent in 1980 to 6.5 percent in 2000 in India.
57

India, therefore, faces a big challenge in extending secondary education and providing s l u l l s to the population at large so they are able to contribute to the economy. In addition, as India’s population continues to grow, to turn the potential o f this very young population into an asset, India needs to provide people not only w i th primary education, but increasingly secondary and even tertiary education, as wel l as requisite s k i l l s so they are able to participate effectively in the knowledge economy.
Overhaul tertiary education. The Indian tertiary education system needs to become more demand driven, quality conscious, and forward looking to retain highly qualified people and meet the new and emerging needs o f the economy. Some actions that can help to develop a vibrant tertiary education sector in the country include the following:
Empower higher education institutions in academic, administrative, financial, and managerial matters, and expand and develop more high-quality institutions (such as IITs) to satisfy the demand for postsecondary technical and engineering education. Create a rating mechanism for tracking a l l higher education institutions, based o n a transparent set o f parameters related to education delivered and infrastructure available. Such rating information would be useful in evaluating the performance and progress to date o f these institutions and should be freely available to any student desiring i t (see B o x 3-3 for a recent U G C initiative in this area).
0
Box 3-3: Increasing Transparency in Indian Higher Education The University Grants Commission began the Higher Education Information Systems Project to develop a transparent and comprehensive information system on the following:
Monitoring o f grants
Research project management
Collection o f relevant data from various institutions for statistical analysis consistent with international standards Recognition and management o f institutions and programs based on their level o f competence and performance Management o f university and college admissions to bring transparency into the process
Expertise and facilities database to improve the interface between academia and society.
The UGC project wi l l also, particularly with industry, monitor the relevance o f various curricula offered by universities to industry and develop a Graduates Registration and Information System (Gratis), a labor market information system. Gratis would assign a unique number to each student who enters the Indian higher education system, link such numbers with subsequent qualifications acquired, and develop and establish a qualification-skill- competency card integrated with the multipurpose cards.
Source: University Grants Commission (http:llwww.ugc.ac.in/new-initiativesfhisp.html),
0
Reduce generic subsidies and introduce scholarships and aid schemes targeted to meritorious and economically weaker students. Orient the curricula o f Indian universities (which remain academic and rather rigid) toward developing the “knowledge technicians” required b y industry. Curricula should also emphasize development o f soft sk i l l s , such as teamwork, networking, language, and knowledge-sharing s k i l l s at higher education institutions. Provide Intranet and Internet connectivity to universities and colleges to enable free f l ow o f knowledge and information to help enhance access as wel l as the quality o f higher education. In this direction, India has developed an Education and Research Network (ERNET) to connect and provide Internet service provider (ISP) services to educational institutions a l l across the country for academic and research purposes and create a backbone for the f low o f teaching and learning support materials. The network architecture consists o f campuswide local area networks at universities, a terrestrial
58

backbone linking universities, and a broadband satellite network. In addition, the UGC-INFONET has a communications backbone o f 8 Mbps, which wi l l be upgraded to 1 GbpsZ3 Varied bandwidth w i l l be given to universities: from 528 Kbps to 2 Mbps. Campus local area networks (LANs) w i l l be set up that w i l l provide free access to students and teachers.24 Use distance learning technologies to expand access and quality o f formal education and also of post- formal education and training (Box 3-4).
Box 3-4: Expanding Distance Education in India During the Ninth Five-Year Plan (1997-2002), the Indira Gandhi National Open University (IGNOU) expanded i t s Regional Centers and Study Centers Network, increasing enrollment of distance learners in open and distance education. IGNOU has 1.2 million students on i t s rolls and offers 72 programs. The emphasis in the Tenth Plan (2002-07) i s on increasing access to disadvantaged groups and underdeveloped regions and setting up open universities in Indian states that do not yet have them. IGNOU offers education, training, and extension programs and also acts as the national nodal agency for the maintenance of standards in distance education in the country. I t has established a Distance Education Council that acts as nodal agency for the distance education system at the tertiary level. I t has also adopted an integrated multimedia instruction strategy consisting o f print materials and audiovisual programs, and supported by counseling sessions at i t s study centers throughout the country. In January 2000 i t launched a 24-hour educational TV channel called Gyan Darshan, which telecasts educational programs from the primary school to the tertiary level. The Tenth Five- Year Plan proposed expansion o f the activities of Gyan Darshan (TV channel) and Gyan Vani (radio broadcast) to include 40 FM radio stations.
Source: India, Planning Commission (2001b).
Harness ICTs for teacher training and content development at all levels. For example, the IBM Knowledge Factory in Bangalore and UGC are working on developing five educational multimedia resource centers for content development. Intel and Microsoft are also working with UGC on teacher training and the development of electronic ~ontent. ’~ Develop programs that are flexible and in line with the needs o f the market and communities, including through the recent UGC initiative to increase undergraduate education from three to four years, in which the last year i s spent mastering professional subjects that meet the new needs o f the economy. Encourage foreign investment in establishing higher educational institutions. For instance, Motorola i s collaborating with the Pune Institute o f Advanced Technologies and i s offering a postgraduate degree in advanced telecommunication engineering with a software focus. Such new colleges can help to introduce specia.lized subjects as demanded by the market.
Remedy weaknesses in science and technology education. A consensus i s developing on the need for a major systemic education reform strategy in India for science and technology. The strategy involves the following sequential interdependent elements: empowering institutions (with full accountability); utilizing resources optimally; mobilizing additional financial resources; establishing effective quality assurance mechanisms; networking o f institutions to enhance capacity, improve quality, and promote excellence;
23 Mbps stands for millions of bits per second or megabits per second and i s a measure of bandwidth (the total information flow for a given time). Depending on the medium and the transmission method, bandwidth i s also sometimes measured in the Kbps (thousands of bits or lulobits per second) range or the Gbps (billions of bits or gigabits per second) range. 24 From a presentation by Arun Nigavekar, chairman, University Grants Commission at a workshop on “India and the Knowledge Economy: Leveraging Strengths and Opportunities,” November 9, 2004, New Delhi. (http://www. worldbank.org.inlWBSITE/EXTERNAUCOUNTRIES/SOUTHASIAEXT/INDIAEXTN/O,,contentMDK:20279055 -menuPK:295602-pagePK: 141 137-piPK: 141 127-theSitePK:295584,OO.html). 25 bid. Arun Nigavekar, November 9, 2004, New Delhi.
59
establishing better and closer linkages with industry and community; and increasing access and reducing regional imbalances (for more information, see World Bank 2005a).
Several reforms have been undertaken to date in this direction. In an effort to upgrade further the large number o f science and engineering colleges in the country to quality standards closer to those o f India’s world-class IITs, the government in i t s Tenth Five-Year Plan (India, Planning Commission 2002e) decided, as part of ongoing restructuring o f engineering education in India, that 17 RECs with great potential w i l l be expanded, modernized, given full academic and administrative autonomy, and converted to National Institutes of Technology (NITs), with a “deemed-to-be-university’’ status in most cases or as colleges with full academic autonomy, each with powers to award its own degrees.26 Several State Colleges o f Engineering have also been given greater autonomy, some also with “deemed-to-be- university” status.
S t i l l bolder steps can be taken. According to a recent article by Prof. M. A. Pai (2004), given the great demand for science, engineering, and technology studies, the number o f four-year engineering colleges has grown since 1980 from 158 to 1,208, partly as a consequence of the demand for engineers in various sectors o f the economy including IT, but also due to the limited expansion o f the IIT system (India currently has seven IITs), and mushrooming of capitation fee (self-financing) colleges. The intake in the four-year, engineering degree-granting institutions i s now 350,000 per year. Each year, o f a pool o f more than 150,000 applicants appearing for the Joint Entrance Examination, approximately 3,500 are typically absorbed into the seven I I T s ; thus, IITs barely account for 2.3 percent o f the total applicants that apply through the Joint Entrance Examination. Those who do not get into the IIT system participate in quite a few entrance exams in places all across the country to get into engineering colleges, the quality o f which are rather poor compared with an IIT.
So, given such pent-up demand and an immense pool of students with high aptitudes, expansion o f high- caliber institutions, such as the I I T s i s warranted, so they can become the hubs o f national education chains. For a start, several NITs and front-ranking universities/institutions for engineering and applied sciences education such as the University o f Roorkee, Jadavpur University, and Anna University can readily impart IIT-type education with minor adjustments to their curricula. Institutions such as the Bir la Institute o f Technology and Sciences, for example, have already accomplished this and are now considered on par with the IITs; therefore, many N I T s can be elevated to IIT status by giving them full autonomy as well as financial resources. With involvement o f I ITs , the curricula of NITs must o f course be brought in line with those o f the I I T s as a mandatory step before giving them IIT status. This raises several issues for IITs. On the one hand, they could be concerned about diluting their brand name. This need not be the case: the state o f California, for example, has ten universities under the University o f California banner; although all of them have comparable undergraduate programs in engineering, they are distinct in terms of their research and thus get calibrated and ranked. In Mexico, the Tec de Monterrey (in MIT o f Mexico) has expanded from one campus in northern Mexico to 32 campuses around the country today, while maintaining very high-quality standards throughout the system. The IITs themselves are making international forays to take advantage o f interest from foreign universities looking to link wi th world-class Indian institutions. IIT-Bombay has linked with the National University o f Singapore, which paves the way for the former to offer master’s degrees in technology-level courses to students in Singapore. In the same vein, the Indian Institute o f Management-Bangalore has also made plans to set up an international campus in Singapore (Iype 2005). The IITs thus have great potential to become important players in the international higher education market.
26 For more information, see the Higher and Technical Education Section of India’s Tenth Five-Year Plan at http://planningco”ission.nic.in/plans/p1anrel/fiveyr/l Oth/volume2/v2-ch2-5 .pdf.
60

Promote policy and institutional reforms for scientific R&D. The above discussion i s also relevant to the ability o f India’s universities to produce enough high-quality scientists and technologists to meet the country’s demand for scientific R&D. This calls for urgent efforts to promote policy and institutional reforms in scientific and technical education for both public and private institutions to improve the quality and s k i l l s of India’s current and future pool of technical manpower. The reasons to do t h i s are especially compelling, because India has witnessed a spurt in opening o f R&D establishments by MNCs in the high- tech areas o f IT, information sciences, software engineering, biotechnology, telecommunication, and power management. In addition, an increasing number o f call centers that need to cater to international customer satisfaction have opened up, and large international business houses are establishing increasing numbers o f manufacturing units in such areas as automotive industries, entertainment electronics, power control equipment, and so on. These developments rest on the assumption that high-level skilled manpower i s either available or can be generated or trained to the required levels at relatively low cost by the Indian educational system. Although India does have such manpower, more needs to be done to foster the development o f such sk i l ls .
In an effort to meet th is need, in 2002, India initiated a Technical and Engineering Education Quality Improvement Program with World Bank assistance to support production o f high-quality technical professionals through reforms in the technicavengineering education system to raise productivity and competitiveness in the Indian economy (for more details, see World Bank 2002d). The program’s objective i s to implement several reforms in the existing education system focusing on governance and financing o f institutions, promotion o f excellence through competitive funding, networking o f institutions for better utilization o f resources, closer interaction with the local community and economy, and improved capacity o f education system management. The program has now gone into effect in 13 states, which have agreed to implement major systemic and institutional reforms. Only institutions that have agreed to implement reforms are eligible to compete for financial support, and a total o f 130 eligible institutions have been selected to date on a competitive basis for such support.
Strengthen skills development and training. When technology i s changing, enterprises must invest in worker training to remain competitive. They are more likely to do so when their workers are better educated to start with, because that lowers the cost o f acquiring new s k i l l s . Despite the demonstrated gains in productivity from training, not all employers provide it. Training involves costs: in materials, time, and foregone production. Weak management, high training costs, inability to exploit scale economies in training, poor information on benefits o f training, market imperfections, and the absence o f competitive pressures are all reasons that f i r m s provide too little training (UNDP 2001).
India w i l l also need to develop various job training programs to be globally competitive. These programs must be flexible, cost-effective, and quickly adaptable to new s k i l l demands generated by changing markets and technologies. India could learn from the experiences o f some MNCs, such as GE, that have set up training programs for their large pool of talented scientific and technical talent in India. According to GE, investing in learning and training enables it to hire and retain talent and expertise, and the company invests nearly $1 bil l ion each year worldwide in career development o f i t s employees (Box 3-5).
61
Box 3-5: General Electric Actively Promotes Organizational Learning, Including in India Intellectual capital i s considered GE’s most valuable asset. Investment in career development i s key for professionals to improve significantly their on-the-job performance, enhance their personal and professional development, and, in turn, accelerate the growth o f the company. Every year, GE invests worldwide nearly $1 billion-about the size o f GE-India’s gross revenues from domestic operations-in career development, both on the job and through leadership programs. This i s a three-step process that rests on infrastructure, systems and processes, and, most important, culture. Some highlights follow:
In 2002 faculty from Crotonville (GE’s US. training center) and senior GE leaders delivered more than 3,500 training man-days to more than 1,500 GE leaders in India. To meet other training needs, GE has a separate training delivery organization, which serves all the 25 GE business entities in India. Training focuses on specific competencies such as Six Sigma and communication sk i l l s among others. Added to this, individual businesses host their own training functions, focused on developing competencies and enhancing ski l ls specific to that business. GE has also invested substantially in digitizing and leveraging the capabilities o f the Internet to support its learning needs. Launched in September 2002, the e-Learning initiative provides courses in areas such as leadership, communication, customer relationships, and personal finance planning among others. More than 2,000 man-days o f learning have been delivered every month to employees in India through e-Learning. “Inside GE,” the corporate Intranet, i s used to access information, projects, tools, resources, and best practices instantly from any GE business located in any part o f the world. To share knowledge, learning, and global initiatives with Indian professionals in other organizations and to learn from them, GE India has launched an Internet portal (http://www.gecareersindia.com) that features best practices and an interactive forum for raising queries with experts in GE. On the systems and processes side, the company has set up councils, such as the finance, human resources, sourcing, and IT councils, in which employees from different GE businesses meet regularly and exchange ideas.
Considering that GE India comprises 30 legal entities, representing 16 different businesses in India, across practically every segment o f industry, these forums are the glue that binds the company together. GE also has a robust mechanism for cross-business moves o f talented employees. In the past 12 months alone, more than 140 managers have moved across GE businesses in India. But at the heart o f this diversified organization i s a culture that actively promotes and demands organizational learning, from other businesses, functions, and employees.
Source: Zachariahs (2003).
Encourage lifelong learning. The importance o f knowledge and innovation in economies i s increasing, as i s demand for new competencies. The formal and nonformal education and training systems need, therefore, to evolve into lifelong learning systems. People now need access to learning on an ongoing, continuous basis; this requires a stronger alignment o f institutions and policies with the new demands o f the economy to create a high-performance, learner-driven system o f education and to promote lifelong earning.^'
According to a World Bank report (2003g), a lifelong learning framework encompasses learning throughout life, from early childhood through retirement. I t includes formal learning (schools, training institutions, and universities), nonformal learning (structured on-the-job training), and informal learning ( s k i l l s learned from family members or people in the community). I t allows people to access learning opportunities as they need them. In this model, people are motivated to learn on a continuing basis, equipped with the s k i l l s to engage in self-directed learning, given access to opportunities for learning throughout their lives, and offered financial and cultural incentives to participate in lifelong learning. The approach i s based on the centrality o f the learner, defined to include both the individual and collective
27 See http://www.congress-lifelonglearning.org/frameset.htm.
62

entities, such as the enterprise, the economy, and society at large. Table 3-6 provides a summary o f the differences between lifelong learning and traditional education systems.
Table 3-6: Characteristics of Traditional and Lifelong Learning Models Traditional Learning Lifelong Learning
~
The teacher i s the source o f knowledge.
Learners receive knowledge from the teacher.
Learners work by themselves.
Tests prevent progress until students have completely mastered a set o f sk i l l s and to ration access to further learning.
All learners do the same thing.
Teachers receive initial plus ad hoc in-service training.
“Good” learners are identified and permitted to continue their education. their lives.
Source: World Bank (2003g).
Educators are guides to sources o f knowledge.
People learn by doing.
People learn in groups and from each other.
Assessment i s used to guide learning strategies and identify pathways for future learning.
Educators develop individualized learning plans.
Educators are lifelong learners. Initial training and ongoing professional development are linked.
People have access to learning opportunities throughout
Developing countries such as India face specific challenges in developing such systems. These include expanding coverage to achieve universal access to basic education as well as increased access to secondary and tertiary provision; improving the linkages between formal and informal education systems and the labor market; raising the quality o f learning; and expanding access to learning opportunities beyond initial formal schooling. Policies are needed to ensure that education and training systems together respond to the needs o f the knowledge economy and facilitate lifelong learning.
In India, several policy statements have been made on the need to create adult and lifelong learning opportunities (UNESCO 2002), but not many concrete policy actions have been undertaken. In addition, several ministries, such as the Ministries o f Education, Human Resource Development, and Labor, are involved in providing education, learning, and training opportunities, ‘leading to fragmentation o f the system; thus, a coherent picture i s needed o f the division of responsibilities to move the lifelong system forward in a systematic way. India should, thus, work to put in place programs intended to meet the learning needs o f all, both within and outside the school system, in a variety o f settings and using new technologies such as ICTs, so that people have the means and incentives to learn throughout their lifetimes.
China has already recognized the need to develop i t s lifelong learning system. I t i s grappling with the challenges of providing massive training to i t s large labor force, which has relatively low educational attainment, and at the same time upgrading the quality of i t s educational system to impart to students the necessary s k i l l s to compete in the knowledge economy. India could do well to learn from China and the experiences o f other advanced countries (such as the United Kingdom28) to develop an architecture and framework for lifelong learning.
Enhance the role of the govemment. The above discussion highlights the key role o f government in the education system, not as a controller, but as the architect of systemwide education standards and regulations. The government should address equity issues for poor and needy students through the use o f
28 The UK’s National Grid for Learning (http://www.ngfl.gov.uk/) provides educational resources on the Internet for a l l types of learners.
63
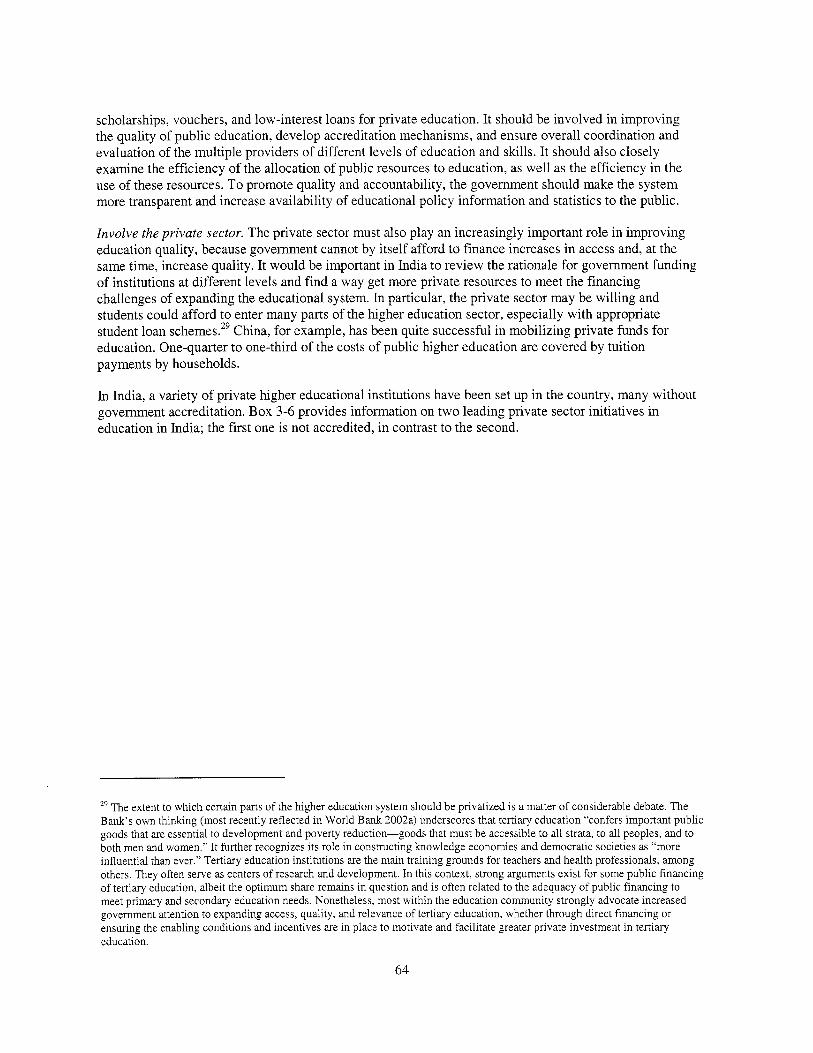
scholarships, vouchers, and low-interest loans for private education. I t should be involved in improving the quality o f public education, develop accreditation mechanisms, and ensure overall coordination and evaluation o f the multiple providers o f different levels o f education and ski l ls . I t should also closely examine the efficiency o f the allocation o f public resources to education, as wel l as the efficiency in the use o f these resources. To promote quality and accountability, the government should make the system more transparent and increase availability o f educational policy information and statistics to the public.
Involve the private sector. The private sector must also play an increasingly important role in improving education quality, because government cannot by itself afford to finance increases in access and, at the same time, increase quality. I t would be important in India to review the rationale for government funding of institutions at different levels and find a way get more private resources to meet the financing challenges o f expanding the educational system. In particular, the private sector may be wi l l ing and students could afford to enter many parts o f the higher education sector, especially wi th appropriate student loan schemes.29 China, for example, has been quite successful in mobil izing private funds for education. One-quarter t o one-third o f the costs o f public higher education are covered b y tuit ion payments b y households.
In India, a variety o f private higher educational institutions have been set up in the country, many without government accreditation. B o x 3-6 provides information on two leading private sector initiatives in education in India; the f i r s t one i s not accredited, in contrast t o the second.
29 The extent to which certain parts o f the higher education system should be privatized i s a matter o f considerable debate. The Bank’s own thinking (most recently reflected in World Bank 2002a) underscores that tertiary education “confers important public goods that are essential to development and poverty reduction-goods that must be accessible to all strata, to all peoples, and to both men and women.” I t further recognizes i t s role in constructing knowledge economies and democratic societies as “more influential than ever.” Tertiary education institutions are the main training grounds for teachers and health professionals, among others. They often serve as centers o f research and development. In this context, strong arguments exist for some public financing of tertiary education, albeit the optimum share remains in question and i s often related to the adequacy o f public financing to meet primary and secondary education needs. Nonetheless, most within the education community strongly advocate increased government attention to expanding access, quality, and relevance o f tertiary education, whether through direct financing or ensuring the enabling conditions and incentives are in place to motivate and facilitate greater private investment in tertiary education.
64

Box 3-6: Reaping the Potential of Private Higher Education in India
rnternational Institute of Information Technology (I’IT}. This institution, located in Pune was conceived as having a Zlobal perspective in bringing to the fore innovation and leadership in advanced IT education and research. The nstitution i s designed to foster innovation and an entrepreneurial way o f thinking and attracts students not only from [ndia, but Korea, Russia, Indonesia, and Thailand. I’IT offers full-time master’s degree programs in advanced Information technology and management. Its courses have been designed and developed under the guidance o f an internationally acclaimed panel o f leaders and innovators leading the IT industry and advanced I T research and are jelivered by active practitioners o f IT . I’IT has also embarked on worldwide collaborations with universities, research laboratories, and industries, including the Russian-Indian Centre for Advanced Computing Research in Moscow, Korea University and Sahmyook University in Korea, University o f South Florida and Dominican University in the United States, Groupe ESSCA in France and Hungary, University o f Padjadjaran in Indonesia, and Mae Fah Luang University in Thailand.
kfanipal. Tucked away in the Malabar Coast o f Southwest India, Manipal i s the nucleus o f 53 educational institutes, including two universities, 27 professional colleges, affiliated institutes, and numerous primary and high schools. Thousands o f students also study in Manipal institutions situated in India in Sikkim and Mangalore, as well as in Nepal, Malaysia, and Dubai. Manipal has graduated more than 20,000 students and has an ever-increasing enrollment number o f more than 30,000 students. The Manipal Academy o f Higher Education was born when i t s professional colleges were granted university status in July 1993. The academy was the first institute in the private sector to be recognized as a “deemed university” by the Government o f India.
Manipal’s affiliation with other centers o f learning across the globe has facilitated the exchange o f knowledge and culture through student and faculty exchange programs. Students from more than 32 countries worldwide seek education at culturally diverse Manipal. Degrees from Manipal are recognized in more than 40 countries. Twinning programs, in which a student completes the first two years o f education at Manipal and then completes the course at a US., Australian, or other university, which confers the degree, are also extremely popular. An example i s the Melaka-Manipal Medical College, set up in Malaysia. This was the first Indo-Malaysian joint venture in private medical education. I t has a five-year twinning program that leads to a medical degree. The first phase, lasting two and a half years i s conducted at the Manipal campus in India. The second phase, o f the same length, i s conducted at Melaka. Since 2003, more than 200 Malaysian doctors have graduated from the college.
Sources: “Intemational Institute of Information Technology,” http://www.isquareit.ac.in; “Manipal Academy of Higher Education,” http://www.manipal.eddindex.htm, and a presentation by J. S. Nagra entitled “Public Private Partnershp: Melaka- Manipal Medical College” at the “Higher Education Summit: Roadmap for the Future,” December 1-2,2004, New Delhi, http://www .ficci.comlficcilmedia-roomJspeeches-presentations/2004/dec~agra.ppt.
India thus needs to have a more integrated and coordinated approach with the private sector, where appropriate. The government should encourage private financing o f education and training and should help to leverage India’s strengths in private education. I t should put in place accreditation systems for private education and training providers and should develop an effective system for assessing and certifying vocational qualifications. The agenda i s large, but some positive steps have been made in this direction. For example, to diversify funding sources for higher education, the fee structure has been enhanced for some professional disciplines (medicine, engineering, and so on), combined with subsidies for poorer students. In technical education, 50 percent of institutions are privately funded, a trend that should be encouraged. Box 3-7 shows the experience of the Monterrey Institute o f Technology, which i s partnering with the private sector in Mexico to develop curricuIa that better meet the needs o f the private sector and i s also trying to reach students with low financial resources.
65

Box 3-7: Transforming Established Systems: T h e Monterrey Institute o f Technology The Monterrey Institute o f Technology (Tec de Monterrey) in Monterrey, Mexico, i s a premier private education organization comprising a network o f 33 campuses all across the country. I t i s a franchise system o f local campuses, each financed and governed by local private sector leaders. I t s Virtual University i s a worldwide leader in distance learning, championing a continuing education agenda al l across the Spanish- speaking world and making inroads into such giant markets as China.
To reach students with limited financial resources, the institute launched a spin-off, Millennium University (Universidad TecMilenio), which was designed to combine the high quality associated with the Tec de Monterrey brand o f education with dramatically lower costs. B y May 2004 approximately 6,500 students were enrolled; per student costs are approximately three times lower than in the parent organization. B y 2010 TecMilenio plans to enroll 100,000 students. What are the main factors that allowed the institution to reduce costs dramatically without compromising quality?
The curriculum i s designed and often delivered through the management o f private sector firms. TecMilenio shares offices with some o f these firms, so students and teachers often work, learn, and teach in the same location. Distance education i s highly utilized to offer the best professors and courses. Pedagogy i s based on problem-solving and conceptual tests; yet, testing i s standardized and centralized. Remuneration for teaching depends on testing results o f students. A small management structure draws on carefully selected professors from Tec de Monterrey staff and translates industry needs into pragmatic curricula. In this way, vested interests o f professors, who sometime use the same teaching materials for decades, are curbed: content i s determined by industry needs.
Source: Staff of World Bank’s Knowledge for Development Program and Universidad TecMilenio (http:l/www.tecmilenio.edu.mx/).
Summary of Issues and Recommendations
India must keep on building a cadre of technicians, professionals, and knowledge workers who w i l l be the backbone o f the knowledge-based economy. Some actions to improve the quality and relevance o f the education system, especially higher education, but also harness human resources at al l levels include the following:
0 Improve the efficiency in the use of public resources in the education system, and make the education system as a whole more responsive to market needs, as well as ensure expanded access to education that fosters critical thinking and learning sk i l l s for all, not just the elites. Enhance the quality o f primary and secondary education, including tackling issues related to quality and relevance, with special emphasis on ameliorating teacher vacancies and absenteeism, reversing high dropout rates, and correcting inadequate teaching and learning materials and uneven levels of learning achievement. This i s especially important for India to meet the goal o f providing eight years of schooling for all children by 2010. Ensure consistency between the s k i l l s taught in primary and secondary education and the needs of the knowledge economy, introduce materials and methods to teach students “how to learn,” rather than stressing occupation-specific knowledge. Reform the curriculum o f tertiary education institutions to include s k i l l s and competencies for the knowledge economy (communication s k i l l s , problem-solving sk i l l s , creativity, and teamwork) that also meet the needs o f the private sector. Raise the quality of all higher educational institutions, not just a few world-class ones (such as the IITs).
0
0
0
0
66

Improve the operating environment for education, especially higher education, which calls for a shift in the role o f the government f rom managing the administrative aspects o f higher education institutions to becoming an architect o f education standards and regulations, including improving and monitoring the quality o f academic programs, establishing accreditation standards and procedures, ensuring equity, and coordinating a system w i th multiple players and multiple pathways to learning. Embrace the contribution o f the private sector in education and training b y relaxing bureaucratic hurdles and put in place better accreditation systems for private providers o f education and training. Establish partnerships between Indian and foreign universities to attract and retain high-quality staff and provide opportunities for students to receive internationally recognized credentials. Increase university-industry partnerships to ensure consistency between research and the needs o f the economy. This w i l l include reforming the university curriculum to include the development o f sk i l l s and competencies that better meet the needs o f the private sector. Use ICTs to meet the double goals o f expanding access and improving the quality o f education. Invest in flexible, cost-effective job training programs that are able to adapt quickly to new s k i l l demands generated by changing markets and technologies, aligned with the needs of f i r m s . Develop a framework for l i felong learning, including programs intended to meet the learning needs o f all, both within and outside the school system. This w i l l also require greater coordination across the different government bodies responsible for various components o f the education and training system and development o f procedures for recognition o f what i s learned in different parts o f the system. Make effective use of distance learning technologies to expand access and the quality o f formal education and lifelong training.
67

4. INNOVATION SYSTEM
The innovation system plays an important role in acquiring, creating, adapting, and disseminating knowledge, which i s crucial for success in the knowledge economy. The innovation system in any country consists o f the network o f institutions, rules, and procedures that affect how the country acquires, creates, disseminates, and uses knowledge. Innovation in a developing country does not just concern domestic development o f knowledge on the global “frontier.” I t also concerns the application and use o f existing knowledge to the local context. For countries such as India that are s t i l l far behind the global frontier in many sectors, tapping into and making effective use of existing global knowledge w i l l have a greater economic impact than developing frontier knowledge.
It merits attention that the concept of “innovation” encompasses not only “technological innovation,” that is, diffusion o f new products and services of a technological nature into the economy, but equally includes nontechnological forms o f innovation, such as “organizational” innovations. The latter include the introduction o f new management or marketing techniques, adoption of new supply or logistic arrangements, and improved approaches to internal and external communications and positioning.
The concept o f a national innovation system rests on the premise that understanding the linkages among the various actors involved in innovation are key to improving a country’s technology performance. These actors include private enterprises, universities, research institutes, think tanks, consulting f i rms, and others. The innovative performance o f a country depends to a large extent on how these actors relate to each other as elements o f a broader system. Linkages can take the form o f joint research, personnel exchanges, cross-patenting, licensing o f technology, purchase of equipment, and a variety o f other channels.
In the context o f developing countries, innovation should be understood as something new to a local context. Three major forms o f innovation exist (Aubert 2005):
i
0
0
0
Local improvements based on adoption o f technologies that are more or less available worldwide or locally (“technology adoption” from a global perspective) Buildup o f competitive activities with some adaptation to existing technologies (“technology adaptation”) Design and production o f technologies of worldwide significance (“technology creation” from a global perspective).
In a developing country such as India, where the formal sector i s relatively small, an important part o f i t s innovation system concerns the diffusion of modem and more eff icient practices to the greatest number o f users. This applies to both domestic and foreign knowledge. India has done a remarkable job o f diffusing knowledge and technology, especially in agriculture. As a result o f the “green revolution,” India has transformed i tsel f from a net importer to net exporter o f food grains. India’s “white revolution” in the production o f milk has helped i t achieve the twin goals o f raising incomes o f rural poor families as well as the nutrition status o f the population. India now needs to continue to undertake efforts to improve the productivity o f agriculture, industry, and services even further. Such efforts must include strengthening technology diffusion institutions, such as agricultural and industrial extension agencies, productivity- enhancing organizations, and technical information agencies, as well as expansion of more efficient f i rms , specialized suppliers of capital goods and inputs, and consulting and technology services.
In any sector in developing countries such as India, a large disparity usually exists between the most and least efficient producers; therefore, considerable economic gains can be harnessed from moving the average domestic practice to the best domestic practice, not to mention best international practice. A host o f efforts would be required:
68

0
0
0
0
0
Improving the system for technical norms and standards-such as product quality, work safety, and environmental protection-to facilitate proper diffusion o f know-how Increasing dissemination o f technology b y strengthening competition so that the most efficient f i r m s expand and improve performance, and establishing and enforcing appropriate laws Encouraging more trade among Indian states Al lowing for economies o f scale and scope Facilitating diffusion o f best products through price- and quality-based competition.
This chapter focuses on the more formal R&D and innovation efforts in India, beginning w i th benchmarking o f India’s innovation system.
Benchmarking Innovation
India generally has great strengths in R&D, scientists and engineers, and technical publications, but weaknesses in patents that can be spun o f f into commercialization; therefore, despite a strong R&D infrastructure, India i s weak on turning i t s research into profitable applications. Figure 4 - l a shows that, when scaled by population, India does better than the Africa, South Asia and the Lat in America Regions, but lags behind Brazil, China, and other comparators in the innovation area. In terms o f absolute size, however, India i s placed in a far more advantageous position, because the country i s endowed wi th a large critical mass in i t s research and innovative capacity. Figure 4 - l b thus shows that, in terms o f absolute size, India’s R&D personnel inputs not surprisingly are considerably higher than even those o f Western Europe. More broadly, India’s stock o f scientific and technical personnel increased b y 59 percent f rom 4.8 mi l l ion in 1991 to 7.7 mi l l ion in 2000.30
30 Based on a presentation by Vijay Kelkar entitled “India: The Coming Golden Age” at the World Bank on October 28,2003.
69
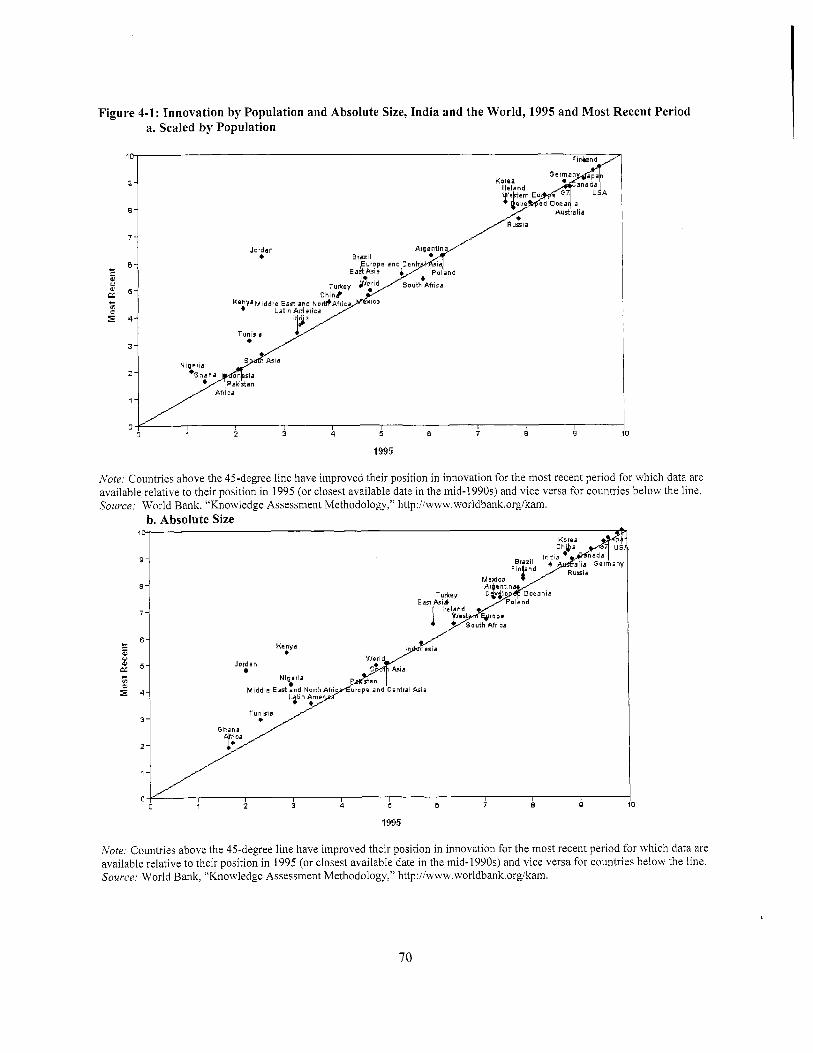
Figure 4-1: Innovation by Population and Absolute Size, India and the World, 1995 and Most Recent Period a. Scaled by Population
0 2 3 4 5 a 7 a Q
1995
0
Note: Countries above the 45-degree line have improved their position in innovation for the most recent period for which data are available relative to their position in 1995 (or closest available date in the mid-1990s) and vice versa for countries below the line. Source:
L - CI
K
0 e
E
World Bank, “Knowledge Assessment Methodology,” http://www,worldbank.org/kam. b. Absolute Size
Kenya
Jordan
Nigeria Middle East and N o i i h l
I I I I I I 2 3 4 5 B ? 8 Q
1995
A’ote: Countries above the 45-degree line have improved their position in innovation for the most recent period for which data are available relative to their position in 1995 (or closest available date in the mid-1990s) and vice versa for countries below the line. Source: World Bank, “Knowledge Assessment Methodology,” http://www.worldbank,org/kam.
70

In 2001 UNDP developed a Technology Achievement Zndex that focuses on three dimensions of innovation at the country level: creation of new products and processes through R&D; use o f new technologies and o ld in production and consumption; and availability o f s k i l l s for technological learning and i n n ~ v a t i o n . ~ ~ Countries are ranked in four categories in the index: leaders, potential leaders, dynamic adopters, and the marginalized. India i s home to Bangalore, one of the most dynamic global innovation hubs (rated 1 lth among 46 hubs by Wired Magazine). Yet, India ranks 63rd on the Technology Achievement Index (of 72 countries) and i s placed within the lower end of dynamic technology adopters, mainly because o f huge variations in technological achievement among Indian states. Other reasons also exist. Even though the country has one o f the world’s largest pools o f scientists and engineers, in 2001, as mentioned in chapter 3, i t s average years o f schooling were just more than five years and the adult literacy rate was about 35 percent. These indicators matter, because they impact the ability o f a country to harness technology and innovation for its development. To i t s credit, India has recently been making notable progress in terms of strengthening R&D infrastructure, developing technological innovations, and altering the mind set of i t s people toward better technology absorption.
Figure 4-2 presents the detailed innovation scorecard for India, and annex 10 presents the scorecards for the other comparator countries. I t highlights that India has been weak in tapping into the rapidly growing stock of global knowledge. Notice the low FDI in India: a mere 0.6 percent of GDP in 1993-2002, as well as low payments for technology licensing as well low share of manufactured exports and imports in GDP. Availability o f venture capital i s also rather limited in India (Figure 4-2), but some signs o f vibrancy are evident. A notable venture capital investment market i s emerging; venture capital increased from $3 mill ion in 1995 to $342 mill ion in 2000 (UNDP 2001).
Figure 4-2: India’s Scorecard on Innovation, Selected Variables, Most Recent Period
Gross Foreign Direct Investment as % of GDP [0.60) I3.50) Private sector spending on ky and license fees payments Imil. pop. (0.33)
(5.00) High-Tech exports as % of manuf. expo yaky and license fees receipts I mil. pop. (0.01)
ce 8: engineering enrolment ratio [% of y level students) (25.00)
(4.1 01 State of cluster developme
(0.33) Patent applications granted by the USPTO I mil pop.
esearchers in R8:D I million (98.85)
(3.80) Availability of Venture Capita al expenditure for R8;D as % of GDP IO.78)
(4.00) Admin. Burden for Start-up anuf . Trade as % of GDP [I 3.02)
[9.23) Scientific and technical journal articles I mil (95.00) Cost to enforce a contract (96 of G
sity-company research collaboration (3.20) r a business (% of GNI per capita) (49.80)
Note: Each o f the 80 variables in the KAM i s normalized on a scale o f 0 to 10 for 128 countries. T h e fuller the scorecard, the better poised a country i s to embrace the knowledge economy. But an economy should not necessarily aim for a perfect score o f 10 on all variables. T h i s i s because the scorecards may be shaped by the particular structural characteristics o f an economy or by trade-offs that characterize different development strategies. Values in parentheses denote actual values for India for the most recent period for which data are available. Source: World Bank, “Knowledge Assessment Methodology,” http://www.worldbank.org/kam.
31 For the Technology Achievement Index, technology creation includes patents granted to residents and receipts o f royalties and license fees; diffusion o f recent innovations includes Intemet hosts and high and medium technology exports; diffusion o f o ld innovations includes telephones and electricity consumption; and human ski l ls includes mean years o f schooling and gross tertiary science enrollment ratio (UNDP 2001).
71

In addition, Table 4-1 presents data on the following five innovation variables in terms o f absolute size (these same five variables are scaled by population in Figure 4-2): royalty and license fee payments, royalty and license fee receipts, researchers in R&D, scientific and technical joumal articles, and patent applications granted by the USPTO, all for the most recent year for which data are available. Table 4-1 shows that India has notable strengths in i t s innovation capacity, particularly when viewed in terms o f absolute size, as does China!
Royalties and License fees Payments ($ mil) (2002) Royalties and License fees Receipts ($ mil) (2002)
Researchers in R&D (2001)
Table 4-1: Selected Innovation Variables, India and Comparators, Various Years
Absolute size Scaled by Population (Per Million Persons) India Brazil China Korea Poland Russia India Brazil China Korea Poland Russia
350 1,229 3,114 2,979 557 338 0.33 7.04 2.43 62.58 14.58 2.35
12 100 133 826 34 147 0.01 0.57 0.10 17.35 0.89 1.02
95,428 55,103 742,700 136,337 56,919 505,778 98.85 323.94 583.88 2,882.39 1,474.59 3,492.94
Scientific and technical journal articles (1999)
9,217 5,144 11,675 6,675 4,523 15,654 9.23 30.61 9.31 143.19 117.00 106.99
IlJSPTO Patents Granted (2003) 1 355 180 424 4,132 19 202 I 0.33 1.02 0.33 86.25 0.50 1.41
Note: Data for researchers in R&D in Ind ia are fo r the year 1997, whereas those for Brazil are for 2000. Source: Knowledge Assessment Methodology (KAM) (http://www.worldbank.org/kam).
Comparing India’s performance in R&D. In terms o f inputs into the innovation system, India spends only a small fraction o f its GDP on R&D: 0.78 percent of GDP in 2001 (Figure 4-2), which i s more than Poland (0.67 percent of GDP), but less than Brazil (1.05 percent of GDP), China (1.09 percent of GDP), and Russia (1.16 percent of GDP) and much lower than Korea (2.96 percent o f GDP) (annex lo), whose expenditures on R&D are on par with top OECD countries. India at 25 percent has the lowest science and engineering ratio in terms of percentage of tertiary-level students among all comparator countries. I t also has the lowest number o f researchers in R&D (per million) among all countries chosen. India does, however, have a critical mass of scientists and engineers and technicians in R&D in terms o f absolute numbers (Table 4-1).
Qualitative surveys by WEF show that the country stands in the middle range relative to comparator countries on private sector spending on R&D. According to a UNESCO report (Westholm, Tchatchoua, and Tindemans 2003), spending on R&D in India by enterprises (both public and private) currently stands at about 27 percent o f total R&D. In most OECD countries, the private sector finances 5@-60 percent o f R&D, as i t increasingly has the finance, knowledge, and personnel needed for technological innovation. Firms play an even bigger role in R&D in Ireland, Japan, Korea, and Sweden. Universities also undertake research to a much larger extent in developed countries and have stronger linkages with the corporate world .
India’s performance in R&D outputs relative to comparator countries i s less than stellar. When scaled by population, India receives little in terms o f worldwide royalty and license fees (Figure 4-2). Not surprisingly, i t does much better in terms of absolute size (Table 4-1). For scientific and technical articles in mainstream journals (per mill ion people), India matches the performance o f China, but the contributions of both countries are very low compared with developed c~untr ies.~’ OECD countries
32 I t i s not surprising that India does no t score w e l l in terms of the number of technical and scientific joumal articles (per million people) appearing in mainstream joumals. I t cou ld b e argued that a per capita index m a y not b e the r i gh t one to use. A more
72

accounted for 85 percent of 437,900 scientific and technical joumal articles published worldwide in 1998 (UNDP 2001).
oBrazil oChina
Lagging peformance on U.S. patents. Figure 4-2 shows that India i s on par wi th China in terms o f patent applications granted b y the USPTO (per mi l l ion people), but s t i l l has a way to go in this regard. Although India (at 5 percent) surpasses Poland (at 3 percent) on high-tech exports as a percentage of manufactured exports, India again has some distance to cover to match the performance o f China (23 percent) or Korea (32 percent) in t h i s area.
Figure 4-3 shows that, even though the number o f patents granted to India b y the USPTO steadily increased in 1997-2003-India even surpassed Brazil and China in 1998 and 1999-China surged ahead of India after 2000. The figure shows that, during 1997-2003, the United States granted a total of only 1,188 patents to India (while China gamered 1,495), which accounts for only 1 percent of the total number of patents granted worldwide by the United States in this period! Japan, Taiwan, and Korea now account for more than a quarter o f a l l American industrial patents (Broad and Glanz 2003).
1997 1998 1999 2000 2001 2002 2003
67 88 98 113 125 112 180 66 88 99 163 265 390 424
Figure 4-3: Patents Granted by the United States Patent and Trademark Office to Brazil, China, and India,
(number} 1997-2003
mlndia I 48
~ 500
400 n n
94 114 131 179 267 355
Brazil 0 China L India
300
200
100
n
Source: US. Patent and Trademark Office (http://www.uspto.gov/web/offices/ac/ido/oeip/taf/cst_all.pdf).
But India has recently made some progress in this area. For example, the number o f U.S. patent grants to the Council o f Scientific and Industrial Research (CSIR) increased f rom just six in 1990-91 to 196 in 2003-04.33 Several new Indian f i r m s have registered their innovations with the USPTO. This shows that the focus o f research i s shifting to patentable innovations, indicating better conceptualization o f research.
Emerging global trends in scientific R&D. A recent study b y UNESCO identifies some emerging global trends in scientific R&D (Westholm, Tchatchoua, and Tindemans 2003). The report finds that Asia today
appropriate index (if data were available) would measure the number of articles as a percentage o f graduates with research degrees (master’s and Ph.D. degrees) in science and engineering. 33 Presentation made by Dr. R. A. Mashelkar on ‘Seizing Opportunities to Leverage India’s Potential in Education and Innovation” at a workshop on “India and the Knowledge Economy,” New Delhi, November 9, 2004 (http://www.worldbank.org.inlWBSITE/EXTERNAL/COUNTRIES/SOUTHASIAEXT/INDIAEXTN/O,,contentMDK:20279055 -menuPK:295602-pagePK: 141 137-piPK: 141 127-theSitePK:295584,OO.html).
73

Issues and Recent Developments in the Innovation System
In a world in which trade, investment, and production are becoming increasingly globalized, the capacity of countries to develop, acquire, diffuse, and commercialize knowledge i s becoming a major source o f competitiveness and growth. As a result of the 1991 liberalization o f the Indian economy, several changes have taken place in India’s innovation landscape. This section reviews important trends in innovation and R&D in India, highlighting issues related to strengthening India’s overall innovation system.
Increasing limited RBD expenditures. India’s R&D spending increased from $2.5 bil l ion in 1994-95 to $3.15 bil l ion in 1999-2000. The share of government expenditures increased from $1.92 bil l ion to $2.5 bil l ion during the same period. Some estimates suggest that the government now spends about $6 bil l ion on research. But, even so, India’s R&D budget i s less than the amount spent by many individual multinational^.^^ The strategic sectors o f defense, space, and atomic energy take up a significant chunk o f government R&D expenditure (52 percent in 1999-2000) (Chandrashekhar and Basvarajappa 2001). But, the government has been increasing i t s allocation to various scientific agencies during the past decade. The CSIR, for example, has started a new initiative on emerging technologies through targeted consortia research. Box 4-2 presents trends in industrial R&D in India.
Box 4-2: Industrial Research and Development in India: Recent Trends 4 recent study on innovation provides some interesting insights on industrial R&D trends in India, including the Tollowing highlights:
Much o f the investment in industrial R&D now comes from the Indian private sector. Only 15 percent o f central government companies report R&D investments, and this figure i s just 7 percent for state government commercial enterprises. To put this in perspective, in 2002, R&D spending was Rs. 4,426 mil l ion for central government enterprises and only Rs. 115.5 mil l ion for state government commercial enterprises. Indian private sector companies on the other hand increased their R&D spending from Rs. 198 mil l ion in 1991 to Rs. 14,503 mil l ion in 2002. Developing new products and exploiting new markets has become the focus o f industrial R&D, especially for large firms. R&D expenditures of the top 20 firms in India included thirteen from the private sector. This i s a major change, because before 1991, R&D was mostly a public sector activity. A majority o f firms in the top 20 are from the high-growth sectors such as automobiles, electronics, and pharmaceuticals. R&D intensity by these firms also reflects this trend. Petrochemicals, electrical machinery and software companies make up the rest. Firms such as BHEL, BEL, Dr. Reddy’s Laboratories, Ranbaxy, Tata Motors, Wockhardt, and IOC are focusing on commercializing innovations. R&D investments b y the pharmaceutical, transport, and electronics industries were in the top three in 2002. Pharmaceuticals spent Rs. 5,770 mil l ion in R&D, and spending by transport and electronics was Rs. 3,942 mil l ion and Rs. 2,883 million, respectively, in 2002. This change i s noticeably different from the priorities in 1991, when nonelectrical machinery, base metals, and transport equipment were in the top three. In terms o f R&D intensity, in 2002, the major automobile players spent around 1 percent o f their turnover on R&D. Tata Motors, and Mahindra and Mahindra are the leading firms in this segment. The pharmaceuticals sector also registered an overall increase in R&D intensity from 0.74 percent to 1.89 percent in this period. Top f i r m s in this sector such as Ranbaxy, Dr. Reddy’s Laboratories, and Wockhardt invested more than 5 percent o f their turnover on R&D in 2002. Indian software firms are also increasing their R&D: Hughes software systems registered a high o f 28.64 percent o f R&D intensity in 2002. R&D spending on food and textiles, however, has registered a steady decline during the past decade. The Indian food processing industry i s planning a major export thrust, but current levels o f R&D spending in the industry are insufficient to make i t globally competitive, because this i s a highly competitive industry. Analysis o f trends in R&D spending for the manufacturing and service sectors shows that firms in the service
34 For example, in 2004, the actual R&D spending by a single company such as Pfizer was $7.7 billion. For more information, see http://www.pfizer.co”n_about-company.html.
75

represents 30.5 percent of wor ld R&D expenditures, making i t the only region in the world t o have increased i t s share between 1997 and 2000. M u c h o f the credit fo r this progress goes to China, wh ich i s edging ahead of the newly industrialized economies in Asia in terms of R&D expenditures. I t increased i t s world share of R&D expenditure f r o m 3.9 percent to 6.7 percent between 1997 and 2000, thanks to a combination o f strong economic growth and rising R&D expenditure. India, however, should ramp up i t s R&D investments if i t i s t o take i t s place among countries that are rapidly harnessing science and technology fo r g rowth and development. B o x 4-1 presents additional details f r o m the UNESCO study.
Box 4-1: India in the Context of Global Trends in Research and Development Investment In 1997 nearly 85 percent of all R&D performed around the world could be credited to OECD member countries. This share had dropped to about 80 percent by 2000, a decline explained by the retreating shares o f North America, the European Union, and Japan. India’s world share o f gross expenditures on R&D (GERD) dropped between 1997 and 2000 from 2.0 percent to 1.6 percent. National investment in R&D failed to keep pace with healthy growth in GDP during this period. But, the government has since augmented research spending and plans further increases. India has set itself a target that would place i t among the nations o f the world that devote the greatest share o f GDP to R&D: i t plans to hoist research spending to 2 percent o f GDP by 2007, according to its 2003 S&T policy (see section below on India’s new innovation policy). Indicative o f India’s commitment, GERD had already climbed to 1.08 percent o f GDP by 2002.
In 2000, about 1.7 percent o f world GDP was devoted to R&D, compared with 1.6 percent in 1997. Even though the all-OECD GERD/GDP ratio for 2000 was approximately 2.4 percent and that o f the European Union approximately 1.9 percent, the great majority o f countries in the world still spend only a tiny fraction o f GDP on R&D. For example, India’s ratio was 0.5 percent and China’s was 1 percent.
Although GERD as a percentage of GDP i s the better indicator for reflecting the share o f income invested in R&D, the GERD per capita indicator has the virtue o f showing how far a country still has to go to rival the world’s most prosperous states. For example, despite the fact that India has been making substantial investments in R&D, it w i l l need to make a huge effort to narrow the gap with Brazil and China, not to mention advanced countries such as the United States. India spends just $PPPl2 (purchasing power parity) on R&D per capita, compared with $PPP40 per capita in China, $PPP62 per capita in Brazil, and $PPP953 per capita in the United States.
In terms o f scientists and engineers, statistics show that nearly 5.3 mil l ion full-time-equivalent research scientists and engineers were engaged in R&D around the world in 2000. North America and the European Union contribute a larger share o f world expenditure than they do world personnel. This situation i s reversed in the case o f China, which contributes 13.2 percent of all researchers, but only 6.7 percent o f world GERD. Similarly, India represents 2.7 percent o f all researchers, but only 1.6 percent o f world GERD.
Data on who performs and who finances R&D reflect the structure o f the R&D system in a given country. Although differences exist among countries, almost al l OECD countries, increasingly China, most o f the Asian dragons, the Russian Federation, Brazil, and South Africa are moving toward a model in which the enterprise sector (private or public) both performs and finances more than 50 percent (and up to 75 percent) o f R&D. In 2000,70 percent o f all OECD R&D was performed by the enterprise sector (although the median value for member countries was closer to 60 percent), 10 percent of R&D was performed by the government sector, and 17 percent in the higher education sector. The remaining 3 percent was carried out by private nonprofit institutes. In India, on the other hand, only 27 percent o f R&D was done by enterprises.
Source: Westholm, Tchatchoua, ahd Tindemans (2003).
74
sector spend relatively less on R&D. More than 14 percent o f firms in the manufacturing sector have R&D activities, compared with only 1.66 percent in services. If India i s to become a service hub, this resolve needs to be reflected in R&D efforts.
Source: Bowonder, Kelkar, and Satish (2004).
Finding innovative sources of R&D funding. In many developing countries, the govemment and/or university sectors play a dominant role in performing R&D and the financing for R&D mainly comes out of the public purse. For example, about one-third o f Chinese and one-quarter o f Russian R&D i s performed by the govemment sector. In India, some 70.5 percent o f R&D i s performed b y the central and state governments, an additional 27 percent by enterprises (both public and private sector industries), and less than 3 percent b y universities and other higher education institutions (Westholm, Tchatchoua, and Tindemans 2003 and India, Ministry of Science and Technology data).35 In terms o f promoting innovation, the government has had mixed experience, for example, in the manufacturing sector (Box 4-3).
~~
Box 4-3: How Well Does India Promote Innovation in the Manufacturing Sector? Mani and Kumar (2001) analyzed the role o f the Indian government in promoting innovations in the manufacturing sector, which accounted for 16.8 percent o f GDP in 2001-02. The study revealed that the country’s manufacturing sector i s dominated by the chemicals and pharmaceutical sector, which also accounts for the largest share in R&D investments and in the number o f patents granted. The authors found that the broad external environment within which innovative activities o f firms are encouraged consists o f a series o f policies that lack specificity in targets, time dimension, and budgets. Four dimensions o f the innovation system are considered: (a) policies with respect to the supply o f technically trained human resources for R&D, (b) physical technological infrastructure, (c) fiscal incentives for encouraging innovation, and (d) promotion o f technology-based ventures through venture capital funds. The authors found that:
India suffers from a chronic shortage of research scientists and engineers o f the type required for R&D, caused basically by the quality o f science and engineering education in the country and the ever-increasing brain drain. A network o f government research institutes, some o f which have been undergoing major restructuring since 1996, dominates the physical technological infrastructure. These institutes continue, however, to depend on government grants and projects for their sustenance, and their interaction with the domestic manufacturing sector i s limited. India does not have any major research grant schemes; even the one it has i s directed largely at public sector enterprises. Most o f the schemes are research loan schemes. In other words, the extent o f public subsidies for private sector R&D i s quite low in the country. India has a variety o f direct and indirect tax incentives for R&D; however, both a macro and micro exercise revealed that most enterprises do not perceive these incentives as important. In most cases, the level o f R&D performed would be the same, even in the absence o f direct tax incentives. Venture capital funds in operation conform to the ideal model o f by and large providing equity support to technology-based ventures in their early stages.
India would do well b y learning f rom other countries’ experiences, such as Brazi l and China in finding innovative sources o f R&D financing. The Brazilian Agricultural Research Corporation’s (EMBRAPA’s) research system i s a successful case of using public funding and a large network of partners to conduct
35 Data from the Department of Science and Technology, Research and Development Statistics, 2000-2001, available at http:llwww.nstmis-dst.org/.
76

R&D a ~ t i v i t i e s . ~ ~ China’s “Jumping into the Sea” strategy i s a unique management innovation t o strengthen linkages between R&D and the market (Box 4-4).
Box 4-4: China’s “Jumping into the Sea” Strategy The major deficiency o f the innovation system in China was once the separation o f R&D from production. True to the Soviet model, most public research institutes (PRIs), including the research institutes o f the Chinese Academy of Sciences, operated in isolation from production activities. Funded by an annual budget from the central or local governments, the PRIs conducted research projects guided by five-year national plans or other central or local plans. Industrial managers were rarely consulted about such plans. Scientific and technological knowledge was perceived as a free public good, leaving little incentive for researchers in PRIs and universities to transfer their research results to commercial applications. As a result, transfers from PRIs and universities to industry were left mostly to serendipity.
To respond to these problems and force research and development organizations to “jump into the sea,” the government initiated major changes in funding and managing research organizations and in technology markets. For example, government appropriations as a share o f PRI income decreased by an average o f 5 percent each year from 1986 to 1993. After more than a decade, the country’s innovation system has indeed changed. B y 1993 only 28 percent o f the income o f PRIs came from direct government appropriations, compared with 64 percent in 1986. PRIs were able to generate close to 60 percent o f their income from nongovernmental sources-half from technical services rendered to industrial enterprises. Similar changes took place in universities.
Source: Dahlman and Aubert (2001).
Innovative India. Despite the challenges, the overal l Ind ian innovat ion system presents some remarkable and impressive features. Ind ia i s home to several dynamic hubs of innovation: Bangalore, with i t s 150,000-strong army of software engineers, has developed a strong innovation “cluster” in IT, characterized by corporate offices, venture capitalists, business startups, and university and research labs (BOX 4-5).
Box 4-5: Evolution of Bangalore as an Innovative Cluster An innovative cluster emerges due to three elements, namely, labor market pooling, presence o f specialist suppliers, and development o f technological knowledge spillovers. One o f the major clusters that has grown rapidly in India has been in Bangalore. Some authors have even named i t the “Silicon Valley o f the South.” Bangalore started as a local cluster focused on aeronautics. I t slowly expanded into I T and then into biotechnology. B y the end o f the 1990s, many multinational companies had established R&D centers in the city. Bangalore has acquired many o f the necessary ingredients to gain such status: good educational institutions, critical mass o f innovative companies, an entrepreneurial culture, and the presence o f venture capital.
As they evolve, the focus o f clusters moves from production to innovation. This transformation occurs when a threshold number o f innovative entrepreneurs exists. The continuous entry o f new players makes a cluster dynamic and fast growing. Availability o f venture capital has been a catalyst for this change. The growth o f software exports from Bangalore i s positively correlated with the growth o f venture capital activity. As global competition increases, local clusters are becoming crucial for enhancing competitiveness. Clustering and dense interfirm networks provide advantages for firms o f all sizes. Two elements are becoming the drivers o f cluster development: the presence o f experienced entrepreneurs and specialized knowledge.
Clusters represent a new way o f thinking about national, state, and local economies, and they necessitate new roles for companies, government, and other institutions in enhancing competitiveness. The evolution o f Bangalore indicates that public policy must focus on designing a set o f enabling instruments that must be implemented at the
36 EMBRAPA’s mission i s to provide feasible solutions for the sustainable development o f Brazilian agribusiness through knowledge and technology generation and transfer. For more information, see http://www.embrapa.br/.
77

regional and local levels. Focus on policy initiatives that fall outside the jurisdiction o f traditional regulatory agencies has been increasing, which for clusters becomes important. In the early phases o f a cluster, the policy focus has to be on supplying manpower and improving infrastructure. In the growth phase, the focus must be on supporting entrepreneurship, networking, and innovation. In later phases, availability o f venture capital i s crucial. Local institutions and government must play an increasing role in a cluster, if i t i s to become truly innovation based.
Bangalore i s now at a crossroads. Many factors are pushing the city forward in terms o f S&T development: a relatively mild climate, a proactive government, a large number o f quality educational institutions in and around the city, the need for large companies to develop products on a global scale, and so on. But several factors are pulling the city backward as well: poor infrastructure, corruption, rapidly increasing pollution, and competition from hubs elsewhere in the world. In the long run, the first set o f factors i s l ikely to lead to positive outcomes, but in the short run, the negative factors could take the city through an unsteady period.
Source: Bowonder (2002) and ATIP (2003b).
India also has vast and diversified publicly funded R&D institutions: strategic, such as the Indian Space Research Organization, and others, such as CSIR, Indian Council o f Medical Research, Indian Council of Agricultural Research, and world-class higher education institutions (IITs and RECs), which provide i t with the critical human capital needed to forge ahead in the innovation area.
Emerging global R&D platform. India has recently been very successful in attracting R&D investments. About 100 MNCs have set up R&D centers in India, for example, GE, McDonald’s, General Motors, Delphi, Eli Lil ly, Hewlett-Packard, Heinz, Honeywell, and Daimler Chrysler (Basu 2003). GE’ s R&D center in Bangalore alone boasts a staff of 2,300 engineers, 60 percent o f whom have master’s or Ph.D. degrees! Since this center opened in 2000, engineers in Bangalore have filed for 95 patents in the United States (Kripalani and Engardio 2003). Large companies are corning to India not only to take advantage o f India’s human resource potential-its high-quality engineers, scientists, and designers-but also to reap cost advantages, because the cost o f doing R&D in India i s a fraction of that in the developed world. Not all M N C research labs in India, however, work at the cutting edge o f technology. Most o f them do developmental research, which develops or improves existing products.
The main motivation for India’s emergence as a preferred destination i s the low cost of its technical workforce and a large pool o f technically qualified people (Basu 2003). Although some have expressed concern that the trend to MNC R&D investments in India i s exploiting the country’s most valuable human resources, i t also has important benefits for Indian industry. Linkages in R&D between, on the one hand, local universities, research institutes, and f i r m s and, on the other, the multinationals’ worldwide R&D network help to integrate India further into global technology development activities. Such R&D activities are also useful to inculcate a “commercial culture” among scientists, helping them to apply knowledge for tangible and productive ends; many o f them may leave their jobs with foreign companies to start their own technology-based f i r m s or to work with Indian f i r m s . People working in foreign f i r m s also acquire new insights and s k i l l s that they would not otherwise be able to, and new scientific knowledge i s a powerful engine for the economy and technical innovation. According to Dr. R. A. Mashelkar, director-general, CSIR, “just as globalization of trade i s growing at a rapid pace, there i s a globalization of research and technology too, which has brought a silent revolution in the country. The challenge i s how to continue to tap the incredible dynamism o f global R&D so that Indian institutions and companies can assume leadership in creating high-wage jobs and building new industries” (PTI 2004a). Box 4-6 provides more information on intemational corporate R&D in India.
78

Box 4-6: Highlights of International Corporate Research and Development in India Several transnational companies (TNCs) have established strategic R&D units in India. Survey results from 32 R&D units-16 from companies dealing with conventional technologies (chemicals, pesticides, fertilizers, pharmaceuticals, engineering, hygiene, healthcare products, and branded consumer goods) and 16 in new technologies (electronics, including ICT and software; biotechnology; and solar energy)-show that:
A primary factor behind location o f R&D in India i s access to R&D personnel, especially in sciences and engineering. Other factors include a favorable climate for foreign investment and common use o f English in education, government, and industry. Another primary factor has been the cost o f carrying out R&D in India, which i s a fraction o f that in the industrialized world, mainly due to the lower wages o f R&D personnel. For example, according to 1994 estimates, the annual net income o f engineers and department managers in India (Mumbai) are $2,100 and $4,300 respectively, compared with $51,400 and $76,800 for Japan (Tokyo), $34,600 and $55,900 for the United States (Chicago), $20,100 and $23,600 for Korea (Seoul), and $11,600 and $16,000 for Brazil ( S o Paulo). B y establishing linkages between local innovation systems (mainly local universities and research institutes) and TNCs’ worldwide R&D network, such R&D helps to integrate India into global technology development activities. TNCs’ R&D activities are inculcating a “commercial culture” among scientists in host countries. In India, one o f the main reasons for not reaping the benefits o f i t s scientific capacity has been the lack o f application o f its knowledge for tangible purposes. TNCs, through their R&D activities, are contributing to the diffusion o f application ski l ls to researchers and encouraging them to go beyond just proving principles.
In general, TNCs are able to recruit and retain the cream o f available talent, due to higher salaries, advanced training, and other career growth opportunities. Domestic firms cannot match TNCs in these aspects, so they must make do with the talent available to them, which in turn, may affect the enhancement o f technological cap- abilities in domestic firms. Other effects on innovation capability o f the host country include diffusion o f knowledge related to patents and other intellectual property rights. Indian firms and scientists are realizing the importance o f patenting and acquiring knowledge related to it with the collaboration o f TNCs. With TNC R&D investments in the country increasing, even academic institutions realize the importance o f teaching the IPR aspect to students, for example, the Indian Institute o f Science has started a course on IPR.
Source: Reddy (1997).
Despite India’s advantages in attracting M N C R&D, however, some threats are looming: China, Russia, and Malaysia, which have at least one or both o f India’s strategic advantages-a cheaper workforce and talent pool-are making preemptive bids to grab a slice o f the MNCs’ global R&D investments. Others such as Canada and Singapore through govemment-initiated programs to invite foreign investment into R&D are also emerging as serious competitors to India (Basu 2003).
Increasirig outsourcing of high-end R&D to India. This new trend i s evident from the large number o f established R&D outsourcing centers in India, from IT and telecom to automotive and pharmaceutical sectors (Box 4-7). According to a recent report by the Ireland-based leading market research resource, Research & Markets, the R&D outsourcing market for IT itself in India i s expected to grow from $1.3 billion in 2003 to more than $8 bil l ion by 2010 (PTI 2004~). Outsourcing in new areas by companies from developed countries i s gradually leading to the development o f many critical s k i l l s and technologies needed in the country, thus helping to raise India’s technological capability with relatively modest investments. Box 4-8 highlights another example o f India’s potential in becoming the destination for outsourced R&D in such areas as chemistry and biology.
79

~~
Box 4-7: Globalization of Innovation: High-End Research and Development in India A great deal o f high-end R&D i s being outsourced to India. International firms are increasingly unwilling to keep expensive teams together between projects. Wipro provides such firms with an alternative to R&D by permanent in- house teams; this has become a big business for Wipro, accounting for one-third o f its $1 bi l l ion in annual revenues and employing 6,500 people. Wipro i s probably the world’s biggest R&D services firm. I t s smallest commitment to any o f these clients i s 300 people. On the one hand, elaborate procedures protect the customer’s intellectual property, including mandatory “cooling-off’ periods for engineers between clients, and sometimes a right o f veto on their redeployment. On the other hand, the breadth o f Wipro’s industry knowledge i s part o f i t s sales pitch. The approach varies from micromanagement by the customer, who takes on Wipro engineers virtually as staff members, to “total product ownership,” that is, handing a mature product and all its global development and maintenance requirements, such as adaptation for a particular market, to Wipro, allowing the customer to redeploy its own engineers to the next big project.
This i s called “globalization o f innovation,” which continues the erosion o f the old model o f corporate R&D, which was dominated by b ig firms with big budgets able to erect b ig barriers to entry to their markets. This erosion i s part of a broader trend, prompted partly by a rising number o f entrepreneurial innovators and growing amounts o f venture capital to finance them, toward a more “dispersed” model o f R&D. The Internet has removed geographic barriers to using far-flung talent, and the popping o f the “dotcom bubble” has spread innovation “offshore.” This dispersal i s becoming global, but it differs from the outsourcing of IT and other “back-office’’ processes; I T business comes from cost centers, driven by price and efficiency. R&D clients, however, are looking for innovation and a shorter time to market; they hope to be profit centers. Many firms s t i l l see untapped potential in using the wealth o f Indian talent for R&D, not just in IT-related areas but in other industries such as drugs and biotech.
Source: Excerpted from The Economist (2004e).
I Box 4-8: Outsourcing Chemistry and Biology Research and Development in India Outsourced chemistry and biology R&D in India has not received as much attention in the United States as IT outsourcing. The chemistry and biology outsourcing market i s small-pharmaceutical R&D outsourcing represents no more than $3-4 billion-but i t i s growing rapidly. India has a large number o f contract research companies in chemistry, biology, and the new field o f drug discovery services. These companies are becoming part o f the global pharmaceutical and chemical R&D network. The increase in R&D outsourcing in the pharmaceutical and biotechnology sectors represents a significant development. Pharmaceutical and biotechnology companies are now convinced that networked R&D i s the way to reduce costs and increase productivity. The trend i s here to stay and i s spreading to other related businesses, including the chemical industry, agriculture, and environmental engineering. Outsourcing in chemistry and biology i s thus likely to grow rapidly.
I Source: ATIP (2003a).
Protecting knowledge through patents. Recent amendments to the Indian Patent Ac t adopted in a move toward adhering to the intellectual property norms under Trade-Related Aspects o f Intellectual Property Rights (TRIPS) has also boosted confidence among international players. This has resulted in the clustering o f R&D centers in new cities such as Hyderabad, Lucknow, and Pune. An increasing trend i s also discernible in the number o f patents granted to companies b y the Indian Patent Office. Among Indian patents, it i s the drugs and electronics industry that has shown a sharp increase in patenting in recent years (Bowonder, Kelkar, and Satish 2004).
The number o f patents granted to residents and nonresidents in India has also been increasing over the years, although the patents granted to nonresidents have been about three to four times greater than those
80
granted to Indians.37 Another interesting side to patenting exists in India: patents earned b y Indian subsidiaries o f multinational f i r m s . Here, India i s doing rather well; note the increasing number o f patents by Indian entities o f foreign f i r m s (Figure 4-4).
Figure 4-4: Patents Granted to Indian Subsidiaries (number)
Texas Instruments
Intel - Oracle -
cisco Systems - GE - IC1 - IBM -
Whirlpool
SAP
0 50 100 150 200 250
Source: Based on a chart in The Economist (2004e).
Indians are acquiring a greater awareness of the importance o f knowledge and the value o f protecting it through patents. For example, in 1995 a U.S. patent on turmeric was awarded to the University of Mississippi Medical Center in the United States, specifically for the use o f turmeric in wound healing, which has been used medicinally in India for thousands o f years! India’s CSlR f i led a complaint in 1997, challenging the novelty o f the university’s “discovery,” arguing that the patent “stole” India’s traditional knowledge. The patent was subsequently cancelled in 1997. India has since also successfully challenged patents on neem and basmati rice.
Unveiling a new innovationpolicy. Keeping in mind these new developments, in 2003 India announced a new S&T policy. The policy recognizes that India has a sound innovation infrastructure including research laboratories, higher educational institutions, slulled human resources, and basic research strengths in agriculture, healthcare, chemicals and pharmaceuticals, nuclear energy, astronomy and astrophysics, space technology and applications, defense research, biotechnology, electronics, IT, and oceanography. The a im of the policy i s to infuse the S&T system wi th new vitality so i t can play a decisive and beneficial role in advancing the well-being o f a l l sections o f Indian society.
India’s new innovation policy report outlines a number o f policy objectives relating to S&T governance and investment, strengthening of infrastructure for science in academic institutions, finding new funding mechanisms for basic research, developing human resources, increasing industry and scientific R&D, encouraging indigenous resources and traditional knowledge, and strengthening generation and management o f intellectual property (India, Department o f Science and Technology 2003). The report does not, however, offer many specific details on implementation o f these objectives. For example, even
37 Patent data are available at WIPO at: http://www.wipo.int/ipstats/en/statistics/patents/index.html.
81
though the plan envisages, in partnership with industry, raising investments in S&T to at least 2 percent o f GDP by the end o f the Tenth Five-Year Plan, it does not provide any road map for doing so. Considering that more than 50 percent o f the R&D allocation i s accounted for by atomic energy, space, and defense research establishments, the actual sum available for civilian R&D i s rather low and thinly spread across a wide spectrum o f areas. The report also does not specify the types o f fiscal policies that can enhance the contribution o f the private sector to the overall R&D effort. In addition, i t does not say much about the coupling o f S&T with the market and industry.38 The report also does not elaborate on how human resources for S&T can be strengthened in the country. Organizational and institutional mechanisms need to be developed to foster mobility o f personnel among different segments o f the national system o f innovation. Litt le or no mobility currently exists, for example, between the CSIR and university system and between these two and industry.
Measures to Strengthen the Innovation System
India has been making steady progress in improving i t s overall innovation system. In moving forward, India should further energize i t s innovation system by increasing linkages with academia and industry; strengthening intellectual property rights and the patent regime; enhancing venture capital; promoting R&D by companies; encouraging new R&D niches, as for example in pharmaceuticals; increasing innovation in agriculture; conducting R&D to promote welfare and encourage grassroots innovations; and tapping the Indian Diaspora, which i s so important in creating knowledge linkages critical for catalyzing India’s future growth.
Increase linkages between academia and industry. Improving linkages between research and industry i s an important aspect o f good innovation practices worldwide and a goal of India’s S&T policy. For educational institutions, effective labor market feedback mechanisms and regular consultations with employers and alumni are indispensable for adjusting curricula. In Denmark, for example, industry representatives, including presidents of large companies, regularly s i t on the boards o f academic departments at universities to advise them on training and research priorities. Industry representatives also s i t on the boards o f Mexico’s new technological institutions.
Not much progress has been made to date, however, in this area in India, where a gulf exists between the academic world and industry. Lackluster partnership arrangements between industry and academia, even between high-caliber institutions such as IITs and industry, are a major cause for concern. N o well- developed mechanisms exist for systematic feedback from the private sector to indicate the kind of knowledge and s k i l l s that are needed by the economy.
Because integrating the demands o f the market into the education system wi l l be important for India’s transformation to a knowledge economy, special initiatives should be launched to increase the flow o f information between the university and enterprise sectors. A notable example i s the National S&T Entrepreneurial Development Board (NSTEDB) in India, which has recently developed an Entrepreneurship Development Cell to help inculcate an entrepreneurial culture and foster better linkages among academic institutions, industries, and R&D institutions. The goal i s to develop 40 knowledge- based enterprises through such cells in college campuses in 2004-05.
Strengthen intellectual property rights and the patent regime. The protection o f IPRs i s becoming increasingly important in knowledge-based economies. This i s being driven by the mounting costs o f
’* For a good discussion of how the interface among industry, R&D institutions, and academia can be strengthened, see India, Planning Commission (n.d.).
82
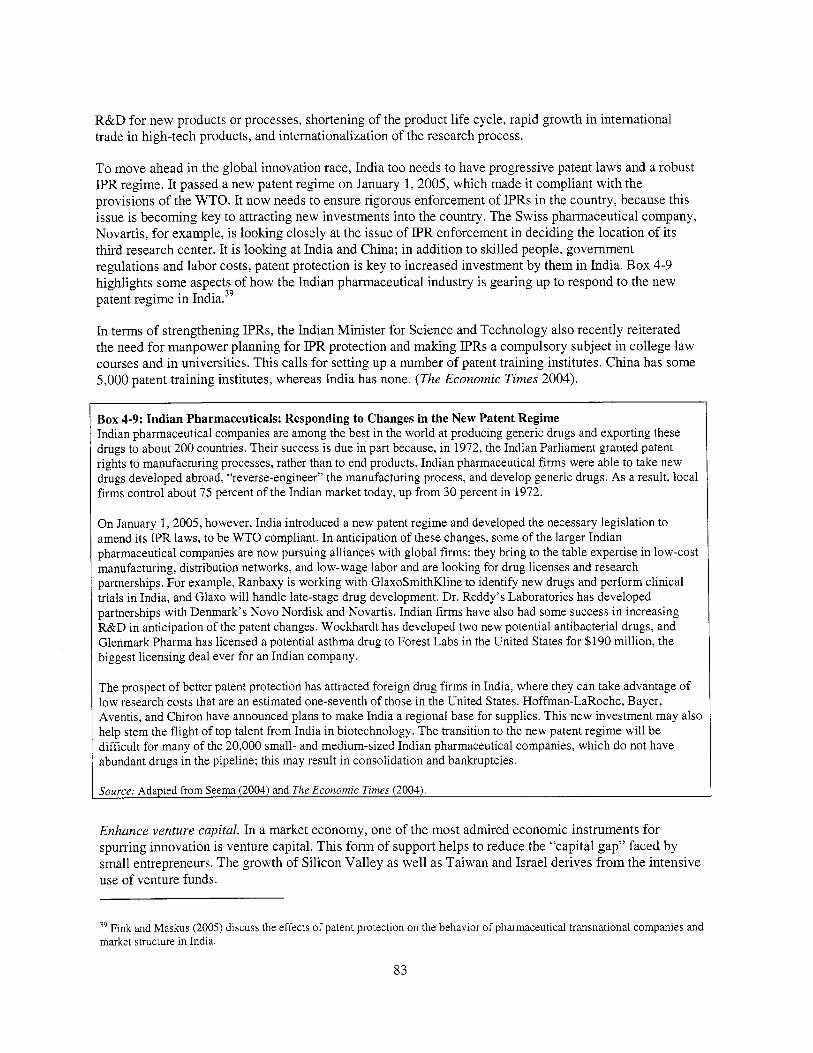
R&D for n e w products or processes, shortening o f the product l i f e cycle, rap id growth in intemational trade in high-tech products, and internationalization of the research process.
To move ahead in the global innovation race, India too needs t o have progressive patent laws and a robust IPR regime. I t passed a new patent regime o n January 1,2005, wh ich made i t compliant with the provisions of the WTO. It n o w needs t o ensure rigorous enforcement o f IPRs in the country, because this issue i s becoming key t o attracting new investments in to the country. The Swiss pharmaceutical company, Novartis, for example, i s look ing closely at the issue o f IPR enforcement in deciding the location of i t s third research center. I t i s look ing at Ind ia and China; in addit ion t o ski l led people, government regulations and labor costs, patent protection i s key to increased investment by them in India. B o x 4-9 highlights some aspects of h o w the Ind ian pharmaceutical industry i s gearing up t o respond to the new patent regime in India.39
In terms of strengthening IPRs, the Ind ian Min is te r fo r Science and Technology also recently reiterated the need for manpower planning fo r IPR protection and mak ing PRs a compulsory subject in college l a w courses and in universities. This calls f o r setting up a number of patent training institutes. China has some 5,000 patent training institutes, whereas Ind ia has none. (The Economic Times 2004).
Box 4-9: Indian Pharmaceuticals: Responding to Changes in the New Patent Regime Indian pharmaceutical companies are among the best in the world at producing generic drugs and exporting these drugs to about 200 countries. Their success i s due in part because, in 1972, the Indian Parliament granted patent rights to manufacturing processes, rather than to end products. Indian pharmaceutical firms were able to take new drugs developed abroad, “reverse-engineer’’ the manufacturing process, and develop generic drugs. As a result, local firms control about 75 percent o f the Indian market today, up from 30 percent in 1972.
On January 1,2005, however, India introduced a new patent regime and developed the necessary legislation to amend i t s IPR laws, to be WTO compliant. In anticipation o f these changes, some o f the larger Indian pharmaceutical companies are now pursuing alliances with global firms: they bring to the table expertise in low-cost manufacturing, distribution networks, and low-wage labor and are looking for drug licenses and research partnerships. For example, Ranbaxy i s working with GlaxoSmithKline to identify new drugs and perform clinical trials in India, and Glaxo w i l l handle late-stage drug development. Dr. Reddy’s Laboratories has developed partnerships with Denmark’s Novo Nordisk and Novartis. Indian firms have also had some success in increasing R&D in anticipation of the patent changes. Wockhardt has developed two new potential antibacterial drugs, and Glenmark Pharma has licensed a potential asthma drug to Forest Labs in the United States for $190 million, the biggest licensing deal ever for an Indian company.
The prospect o f better patent protection has attracted foreign drug firms in India, where they can take advantage o f low research costs that are an estimated one-seventh o f those in the United States. Hoffman-LaRoche, Bayer, Aventis, and Chiron have announced plans to make India a regional base for supplies. This new investment may also help stem the flight o f top talent from India in biotechnology. The transition to the new patent regime w i l l be difficult for many o f the 20,000 small- and medium-sized Indian pharmaceutical companies, which do not have abundant drugs in the pipeline; this may result in consolidation and bankruptcies.
Source: Adapted from Seema (2004) and The Economic Times (2004).
Enhance venture capital. In a market economy, one of the most admired economic instruments for spurring innovation i s venture capital. This form of support helps to reduce the “capital gap” faced by small entrepreneurs. The growth o f Si l icon Va l ley as w e l l as Ta iwan and Israel derives from the intensive use o f venture funds.
39 Fink and Maskus (2005) discuss the effects of patent protection on the behavior of pharmaceutical transnational companies and market structure in India.
83
In recent years, the venture capital industry has started creating innovative and entrepreneurial f i r m s and inducing the growth o f new and technology-based ventures in India. The IT industry has also helped to catalyze venture capital growth. After Japan, India has become one o f the most preferred destinations o f offshore venture funds. Venture capital i s thus becoming a major mechanism for stimulating innovation and entrepreneurial growth in India. In the past five years alone many new entrepreneurial f i r m s have ventured into new product development and contract research for global f i rms . Avesthagen, Strand Genomics, Bharat Biotech, Shantha Biotechnics, Ittiam, Tejas Networks, Ishoni Networks, Mitoken, Impulsesoft, to name a few, are some o f the new venture-assisted f i r m s that have innovated new products or services. Some f i r m s such as Impulsesoft, Tejas Networks, Reva, and I t t iam have also become product developers for the global market. Mindtree and Kshema Technologies have grown rapidly b y focusing on new high-technology business segments.
The government-supported quasi-venture fund, the Technology Development Board has also been effective in stimulating innovations in India (for more information, see http://www.tdbindia.org). The board’s main a im i s to accelerate development and commercialization o f indigenous technology or adaptation o f imported technology for wider domestic application. The board provides financial assistance in the fo rm o f equity capital, soft loans, or grants to industrial concerns and R&D institutions. With a proactive stance, the board thus helps to facilitate interaction among industry, scientists, technocrats and specialists; fosters an innovation culture through contract and cooperative research between industry and institutions; provides an interface w i th financial institutions and commercial banks for leveraging funds; facilitates creation o f a new generation o f entrepreneurs; assists partnerships w i th similar technology-financing bodies; provides opportunities for venturing into high-tech areas; and creates new job opportunities. In the past f ive years, Technology Development Board support for 103 entrepreneurial ventures has resulted in a variety o f innovative products, including statins (by Biocon), electric cars (by Reva Electric Car), hepatitis-B vaccine (by Shantha Biotechnics), rotavirus vaccine (by Bharat Biotech), lithium i o n batteries (by 21st Century Batteries), and high-strength alloys (by AV Alloys) (Bowonder, Kelkar, and Satish 2004).
Encourage new R&D niches, such as in pharmaceuticals. Indian pharmaceutical companies such as Ranbaxy and Dr. Reddy’s Laboratories are also increasingly investing in R&D and are making their mark on the global stage (Box 4-10). For example, in 2004 Nicholas Piramal India inaugurated i t s research center in Mumbai, at which 250 scientists wi l l research a wide range o f areas, such as cancer, diabetes, inflammation, and infectious diseases. In a reverse brain drain, 30 scientists f rom the United Kingdom, United States, and Canada either f rom MNCs or academia have relocated to this center in India to work on novel drug development (Krishnan and Kamath 2004).
Indian pharmaceutical companies are working on a variety o f new drugs with a variety o f partners, sometimes in response to specific new demands. For example, the Wor ld Bank, in partnership wi th the Global Fund to Fight AIDS, Tuberculosis, and Malaria; UNICEF; and the Clinton Foundation, has announced agreements enabling developing countries to purchase high-quality A I D S medicines at the lowest available prices. In many cases the medicines and diagnostics would cost 50 percent less than their current prices. Cipla, Hetero Drugs Limited, Ranbaxy Laboratories, and Matr ix Laboratories are four Indian pharmaceutical manufacturers tapped to provide the drugs in these agreements (Altman 2003 and an internal Wor ld Bank document).
84

Box 4-10: Indian Pharmaceuticals Have Global Ambitions The success o f Indian pharmaceuticals i s already drawing comparisons with its I T prowess. Ranbaxy derives nearly half o f i t s business from the United States and i s looking for acquisitions in France, Germany, and Italy. Ranbaxy and Dr. Reddy’s Laboratories both aspire to become “research-based” (Ranbaxy), “discovery-led” (Dr. Reddy’s Laboratories) originators. Both firms plan to boost spending on R&D to 10 percent o f revenues. But this needs to be put in context: Pfizer, for example, has an R&D budget for 2003 o f $7.1 billion! So far, much o f Indian firms’ R&D has gone into the reverse engineering o f existing drugs and the development o f new tweaks on them: a new “delivery system,” say, such as an inhaler. But both Ranbaxy and Dr. Reddy’s Laboratories are also spending heavily on research into new drugs.
Source: Excerpted from The Economist (2003e).
Promote R&D for new product development. The above discussion points to the importance of promoting R&D in companies to generate new innovations and products and, in so doing, remain at the cutting edge of innovation worldwide. New products are considered the competitive lifeblood o f companies, and the marketplace-in the developed and, more and more, in the developing world-is becoming increasingly unforgiving o f delay and deficiencies in product development. Asked to identify the drivers of R&D activity, respondents in a recent global survey o f senior executives rated the most significant forces as more demanding customers, market pressures to keep up with competitors, development o f new technologies, and shorter product l i fe cycles (EIU 2004b). With the stakes so high-traditional R&D budgets amount to 5-10 percent of companies’ annual sales and market-organizations and companies throughout the world are working hard to get their choices o f research directions right (see Box 4-1 1 for more details on this survey).
Increase innovation in agriculture. Given the importance o f agriculture in India’s economy, increased emphasis on innovations that can enhance productivity w i l l be critical to raising agricultural growth. Such efforts include connecting India’s fa rms to the world by diversifying into agricultural commodities in demand by consumers all around the world. For example, India produces about 14 percent o f the world’s f ru i t s and vegetables, but only 1 percent i s exported due to lack o f processing facilities. The government i s making concerted efforts to increase fruit and vegetable production in India and has set up a National Horticultural Board to promote production o f these commodities. It has also identified horticultural crops as a way to diversify agriculture and make i t more profitable and create skilled employment for rural people. These efforts have met with recent success. The grapes sector in India i s now able to compete in the quality-conscious European Union market and i s moving into value-added products, such as wine. The Indian telecoms company Bharti has recently moved into the global fruit and vegetable market in a joint venture with the United Kingdom’s finance group Rothschild. A farm and research facility in the northern state o f Punjab w i l l source produce from all across the country, and cold storage, processing plants, and refrigerated transport facilities w i l l be established. The plan i s to sell apples, mangoes, grapes, cherries, tomatoes, baby corn, okra, and iceberg lettuce to the European Union, Southeast Asia, the Gulf states, and Central Asia (Ridding 2005 and WorldisGreen.Com 2004).
India’s public agricultural research and extension system i s one o f the largest in the world, but i t s efficiency and effectiveness has been increasingly called into question. A more regionally differentiated R&D strategy i s needed for agriculture. The top-down, narrow, crop-focused approach to agricultural extension has also become outmoded and ineffective in meeting the needs o f farmers. In the future, the public extension system must become more demand driven, with stronger synergies between public and private extension efforts (World Bank 2003d).
85
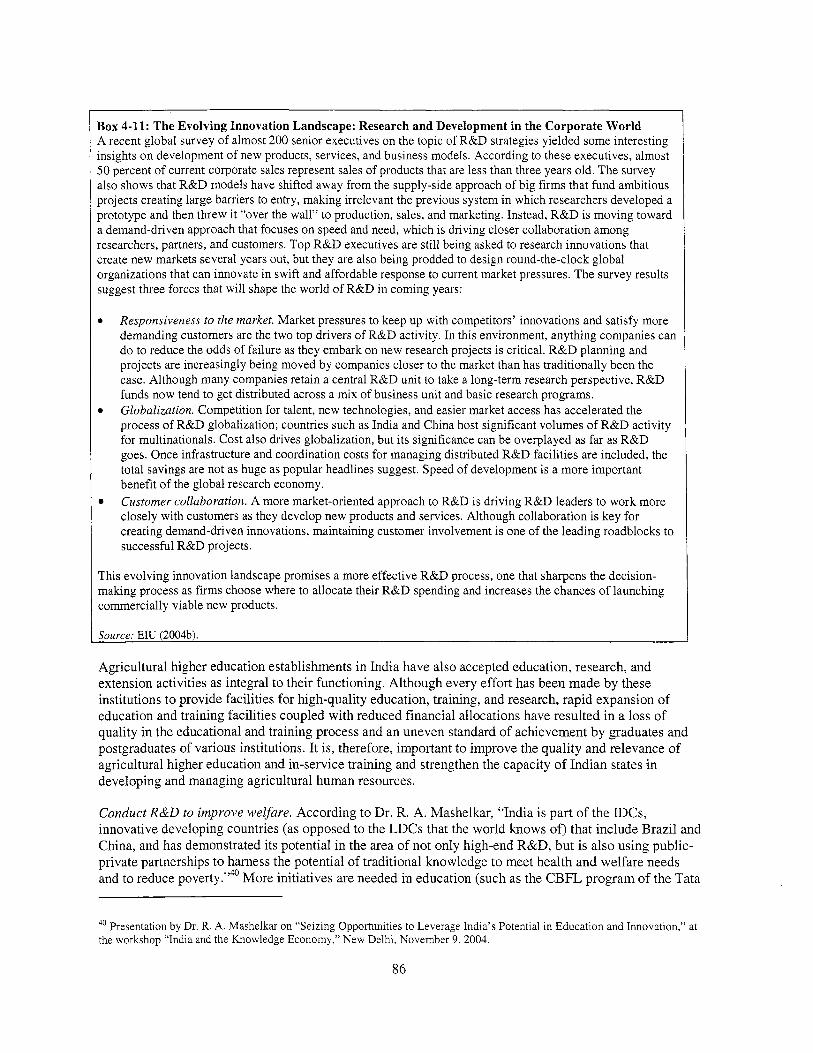
Box 4-11: The Evolving Innovation Landscape: Research and Development in the Corporate World A recent global survey of almost 200 senior executives on the topic of R&D strategies yielded some interesting insights on development of new products, services, and business models. According to these executives, almost 50 percent o f current corporate sales represent sales o f products that are less than three years old. The survey also shows that R&D models have shifted away from the supply-side approach of big firms that fund ambitious projects creating large barriers to entry, making irrelevant the previous system in which researchers developed a prototype and then threw it “over the wall” to production, sales, and marketing. Instead, R&D i s moving toward a demand-driven approach that focuses on speed and need, which i s driving closer collaboration among researchers, partners, and customers. Top R&D executives are still being asked to research innovations that create new markets several years out, but they are also being prodded to design round-the-clock global organizations that can innovate in swift and affordable response to current market pressures. The survey results suggest three forces that wi l l shape the world o f R&D in coming years:
Responsiveness to the market. Market pressures to keep up with competitors’ innovations and satisfy more demanding customers are the two top drivers o f R&D activity. In this environment, anything companies can do to reduce the odds o f failure as they embark on new research projects i s critical. R&D planning and projects are increasingly being moved by companies closer to the market than has traditionally been the case. Although many companies retain a central R&D unit to take a long-term research perspective, R&D funds now tend to get distributed across a mix o f business unit and basic research programs. Globalization. Competition for talent, new technologies, and easier market access has accelerated the process o f R&D globalization; countries such as India and China host significant volumes o f R&D activity for multinationals. Cost also drives globalization, but its significance can be overplayed as far as R&D goes. Once infrastructure and coordination costs for managing distributed R&D facilities are included, the total savings are not as huge as popular headlines suggest. Speed o f development i s a more important benefit o f the global research economy. Customer collaboration. A more market-oriented approach to R&D i s driving R&D leaders to work more closely with customers as they develop new products and services. Although collaboration i s key for creating demand-driven innovations, maintaining customer involvement i s one o f the leading roadblocks to successful R&D projects.
This evolving innovation landscape promises a more effective R&D process, one that sharpens the decision- making process as firms choose where to allocate their R&D spending and increases the chances o f launching commercially viable new products.
Source: EIU (2004b).
Agricultural higher education establishments in India have also accepted education, research, and extension activities as integral to their functioning. Although every effort has been made by these institutions to provide facilities for high-quality education, training, and research, rapid expansion o f education and training facilities coupled with reduced financial allocations have resulted in a loss o f quality in the educational and training process and an uneven standard of achievement by graduates and postgraduates of various institutions. I t is, therefore, important to improve the quality and relevance o f agricultural higher education and in-service training and strengthen the capacity o f Indian states in developing and managing agricultural human resources.
Conduct RBD to improve welfare. According to Dr. R. A. Mashelkar, “India i s part o f the IDCs, innovative developing countries (as opposed to the LDCs that the world knows of) that include Brazil and China, and has demonstrated i t s potential in the area o f not only high-end R&D, but i s also using public- private partnerships to harness the potential o f traditional knowledge to meet health and welfare needs and to reduce poverty.”40 More initiatives are needed in education (such as the CBFL program o f the Tata
40 Presentation by Dr. R. A. Mashelkar on “Seizing Opportunities to Leverage India’s Potential in Education and Innovation,” at the workshop “India and the Knowledge Economy,” New Delhi, November 9, 2004.
86

Group described in chapter 3), healthcare, and connectivity to meet the needs o f the poor. T o move forward in these areas, it i s important to use existing capacity in public institutions in lDCs in the discovery and development o f new innovations and to move f rom “beaten paths” to alternative innovative paths for R&D.
One example i s the triangulation o f traditional medicine wi th modem science and modem medicine in the drug discovery and development process in India. T o take a new drug to the market i s an expensive and time-consuming venture wi th numerous bottlenecks. I t now takes an estimated $1.7 b i l l ion for a pharmaceutical company to place a molecule in the market. Through “reverse pharmacology,” however, India has shown how a drug can be taken to the market for a fraction o f that cost (Box 4-12). For example, an Indian drug company took three years to develop a drug based on a traditional medicine for the treatment o f psoriasis at a cost of only $4 million, with a resulting cost o f treatment o f $50, compared wi th a reported cost of treatment (Amgen) o f $20,000 in the United States!
This example shows that alternative paths to R&D can make a difference, and this process requires rethinking the discovery and development process. New global public-private partnerships are needed to make this a reality, especially so the poor of the wor ld can purchase medicines at affordable prices. India’s N e w Mi l lennium Indian Technology Leadership Initiative i s one example in this vein. The initiative gives government funding to projects in which universities, government labs, and companies work together to make world-class products. The initiative has led to the development of two drugs in clinical trials, for psoriasis, as above, and tuberculosis, and a software package called Bio-Suite that can analyze DNA and manipulate molecules in three dimensions. Several institutions, including the Indian Institute o f Science in Bangalore and the Institute o f Genomics in Delh i developed Bio-Suite, which Tata Consultancy Services launched in June 2004 (Webb 2005).
Box 4-12: Leveraging Traditional Knowledge with Modern Science and Exploiting Public-Private Partnerships for Drug Development in India In India, a new drug against a chronic and incurable skin disease called psoriasis i s now under development through an industry-research laboratory partnership. The new drug, a purified extract from the leaves o f a plant long used in traditional medicine, i s now awaiting approval for clinical trials in patients with psoriasis after successful completion o f toxicity trials in healthy volunteers. Lupin, a major drug company, and the CSIR are working to transform this herbal extract into a scientifically validated modern drug against psoriasis. I t i s estimated that the global market size for drugs against psoriasis i s about $3 billion.
The candidate drug against psoriasis i s part o f an effort to develop new drugs from traditional knowledge through “reverse pharmacology.” The conventional approach in seeking out new drugs involves identifying new molecules, testing their efficacy on laboratory animals, and then moving to humans. “Drug discovery around the world has focused on moving drugs from molecules to mice to men. In reverse pharmacology, we’re going the other way- from men to mice to men,” according to Dr. R. A. Mashelkar, director, CSIR. Traditional medicine has long used herbal extracts on patients. Reverse pharmacology i s aimed at validating such extracts through rigorous science.
The psoriasis initiative took o f f three years ago when Lupin decided to investigate a herbal extract used by a practitioner o f traditional medicine against psoriasis. The company first conducted a proof-of-concept study in a hospital in Mumbai where i t evaluated the extract in a group o f 21 patients. Twenty patients responded to the treatment-the severity o f their psoriasis decreased and no serious side effects were observed in any o f the patients. The encouraging results prompted Lupin to approach the CSIR for funding to carry the study forward. The first phase o f the project received Rs. 60 mil l ion funding under the New Millennium Technology Leadership Initiative, a program managed by the CSIR aimed at nurturing industry-research partnerships to generate new technologies that are exDected to have global imDacts. Over the Dast two vears, scientists at LuDin’s R&D center and CSIR’s Central
http://www. worldbank.org.inlWBSITE/EXTERNAWCOUNTRIES/SOUTHASIAEXT/INDIAEXTN/O,,contentMDK:20279055 -menuPK:295602-pagePK: 141 137-piPK: 141 127-theSitePK:295584,00.html).
87

Drug Research Inst i tute have studied the constituents of the herbal extract in detail, identified the “active molecule” that i s believed to act on the psoriasis, and worked out standardized techniques to extract it from the plant. In September 2004, the drug went through phase I clinical trials in healthy volunteers designed to evaluate i t s side effects. The company has now sought phase I1 clinical trials to formally test i t s efficacy through a rigorous scientific trial. The CSIR wi l l also fund a second phase o f the project through the New Millennium Initiative. If all goes well, a new drug against psoriasis may be in the market in two years. If that happens, the time to develop a new drug would have shrunk from 10 years to less than 5 years.
Source: Excerpted from Mudur (2005).
Encourage grassroots innovation. The above underlines the importance o f harnessing grassroots innovations for development. India has made some laudable efforts in this area. The Society for Research and Initiatives for Sustainable Technologies and Institutions (SRISTI), for example, supports the Honey Bee network o f grassroots innovators engaged in developing sustainable alternatives for natural resource management (for more information, see http://www.sristi.org/honeybee.html). This society has documented innovations and traditional practices and collected outstanding examples o f contemporary knowledge to form a 10,000-item database. Such initiatives should continue to be encouraged, because grassroots innovations can be a positive source o f j o b creation, especially in rural areas. The National Innovation Foundation, established to help India become an inventive and creative society and a global leader in sustainable technologies, also supports grassroots innovations in India (for more information, see http://www.nifindia.org/). It i s nonetheless important that intellectual property be protected in these cases so that people can increase their earnings from their own innovation, knowledge, and creative skil ls.41
Tap the Indian Diaspora. India has a large and well-educated Diaspora that it should tap to enhance growth and compe t i t i ~eness .~~ According to Huang and Khanna (2003):
. , . after decades o f keeping the Indian Diaspora at arm’s length, the country i s now embracing it. . . , Until now, the Indian Diaspora has accounted for less than 10 percent o f the foreign money flowing to India. With the welcome mat now laid out, direct investment from nonresident Indians i s likely to increase. The Indian Diaspora has famously distinguished i t s e l f in knowledge-based industries, nowhere more so than in Silicon Valley. Now, India’s brightening prospects, as well as the changing attitude vis-a-vis those who have gone abroad, are luring many nonresident Indian engineers and scientists home and are enticing many expatriate business people to open their wallets. With the help o f its Diaspora, China has won the race to be the world’s factory. With the help o f its Diaspora, India could become the world’s technology lab.
In a major initiative, the Indian government set up a high-level committee on the Indian Diaspora in September 2000 to prepare a comprehensive report highlighting ways to create a more conducive environment for leveraging these invaluable human resources. The report includes a detailed examination and recommendations o n major Diaspora issues in the fields o f consular and related matters, culture, economic development, investment, international trade, industry, tourism, education, health, media, science and technology, and philanthropy (India, Ministry o f External Affairs 2000). B o x 4-1 3 showcases the achievements o f the Indian Diaspora in the United States.
4’ For more information, see Finger and Schuler (2004). 42 In addition to specific citations, information in this section was also drawn from Panagariya (2001) and World Bank (2003f and 20040.
88
Box 4-13: A Snapshot of the Indian Diaspora in the United States The world i s increasingly becoming one globally integrated market, and highly educated and trained people are key elements o f competitiveness. Each year 2-3 million people emigrate due to higher salaries and complementary aspects: research centers, access to finance, and the ease o f setting up businesses. Weaknesses in home countries include low salaries and weak complementary aspects: little funding for R&D; underequipped research centers; difficult access to capital, especially to start up new high-tech businesses; access to finance; and an overregulated business environment for starting and running new businesses. The majority o f emigrants go to just four host countries: the United States, Germany, Canada, and Australia.
Although this migration has several positive effects on host countries by increasing the stock o f high-level personnel and stimulating innovative activity, the negative effects on home countries include loss o f highly trained personnel and fiscal costs, because many receive education that i s publicly financed. Offsetting effects to home countries include remittances, return o f migrants with greater international experience, and potential to use this Diaspora to access capital knowledge and markets. Remittances to developing countries have soared from $17.7 bi l l ion in 1980 to $30.6 billion in 1990 to nearly $80 billion in 2000 (Kapur and McHale 2003). In India, between 1990 and 2000, remittances from abroad grew sixfold from $2.1 bi l l ion to $12.3 billion. The destination o f these remittances shifted significantly from Kerala and Gujarat to Karnataka and Andhra Pradesh, which are becoming centers o f IT .
According to the US. Census o f 2000, the Indian Diaspora in the United States i s growing rapidly and very wealthy. The Indian-American community now boasts 1.68 mil l ion people compared with 0.81 mil l ion in 1990-a growth of 106 percent! Their average per capita income i s $60,093 (compared with a U.S. average o f $38,885 in the 2000 census). They have a high level o f education: more than 87 percent o f Indo-Americans have completed high school and 62 percent have some college education (compared with just more than 20 percent for the U.S. population). They are represented in virtually all professions, including agriculture, biotechnology, business, economics, finance, IT, journalism, management, medicine, and various sciences. In 1997-98,4,092 Indian professors were teaching in US. universities. In the same year, 33,818 students born in India were registered in 2,579 US. universities. In 1997 Indian students obtained 3.2 percent o f the total number o f doctorates granted by US. universities. The Diaspora i s also very entrepreneurial, and Indians have come to enjoy a dominant position in the US. IT industry: approximately 300,000 Indian-Americans work in Silicon Valley, account for more than 15 percent o f startups in the United States, and have an average annual income o f about $200,000.
The launch o f economic reforms in India in 1991 opened up new business opportunities for the Indian community in the United States. They have had an important role to play in high-tech development in India, focused primarily on the software industry. Many I T professionals rely heavily on strengths back home-the huge pool o f skilled computer experts and software professionals-to subcontract work to their country o f origin, thus creating a “virtuous” cycle for the Indian IT sector and economy. As an example, in the software industry and IT-enabled services, investments o f Diaspora members are quite limited (about 3 percent o f FDI), but their contribution i s mostly in the form of knowledge linkages, that is, with foreign markets, helping Indian firms to absorb technical and managerial knowledge. The initial impetus for outsourcing to India many times comes from employees o f Indian origin. The success o f the Indian Diaspora has also attracted the attention o f major MNCs to India’s potential in the I T sector. India has attracted investment in many R&D centers wholly funded and established by GE, Cisco, Sun Microsystems, Microsoft, IBM, and Hughes Software. Intel’s R&D centers in Delhi, Bangalore, and Mumbai service i t s global operations. Oracle Corporation has two development centers in Bangalore and Hyderabad. Phoenix Technologies, ABB Group, IBM, America Online, and J.P. Morgan Chase are in the process of setting up new R&D centers, and Lucent Technologies i s also making inroads into India.
I Source: Author’s research. J
Indian professionals abroad have been able to create networks that are working for the benefit o f the country, for example, Indians set up the Indus Entrepreneurs (TIE) (see http://www.tie.org/), a professional and social network in Silicon Valley, which now has 42 chapters in nine countries (Kripalani and Engardio 2003). These networks have mostly contributed knowledge linkages among countries and links with foreign markets. They are helping Indian f i r m s to absorb technical and managerial knowledge
89

and have been providing the impetus for outsourcing to India (in IT and R&D). An increasing number o f f i r m s have their “front offices” in the United States and the “manufacturing facility” in India, generating more jobs. The deeper, more symbiotic relationship developing between Silicon Valley and India, thus, goes far beyond the “body shopping” o f the 1990s when U.S. companies mainly wanted low-wage software-code writers. Now the brain drain from India i s turning into a so-called “brain circulation,” nourishing the technology scenes in both nations (Hof and Kripalani 2003).
As reforms progress in India and bureaucratic barriers come down, the Indian Diaspora w i l l increasingly look for investment opportunities in their country o f birth. The Indian government has also taken some positive steps to encourage the Diaspora:
0 In December 2003 the government instituted the right to dual citizenship to people o f Indian origin with the hope that the measure would enable the Diaspora to contribute more to the cause o f national development. It launched an initiative (and Web site) to harness the talent o f the globally mobile professional S&T Diaspora working in industries, research laboratories, universities, and scientific departments, as well as successful entrepreneurs in technology-intensive businesses and venture capitalists to encourage their collaboration on strengthening Indian education, research, and human resource capabilities in basic sciences and cutting-edge techn~ log ies .~~ Other aims include enhancing India’s competencies in technology entrepreneurship, utilizing venture financing and mentoring the younger generation, connecting alumni abroad with their alma mater for purposeful and sustainable relationships, and catalyzing participation o f Indian scientists as well as institutions in major international science projects and advanced research facilities abroad. I t i s hoped that these efforts w i l l help to promote India as a global R&D platform and a preferred R&D outsourcing destination.
0
Summary of Issues and Recommendations
Moving forward, India should take steps to improve its overall innovation system further by taking advantage o f new knowledge created at home and disseminating i t for increased economic and social development. To gain maximum benefits, India needs to approach i t s innovation policy systematically by supporting innovators and entrepreneurs, removing regulatory and bureaucratic obstacles to innovation, and cooperating with the private sector and industry to engage in mutually beneficial activities; an illustration i s the experience o f the United States and Finland,44 which have been remarkably successful in establishing an innovative climate. Strategies are needed to change the Indian mind set, that is, “the I in India, should not stand for imitation and inhibition, but for innovation.” Strategies are also needed to develop innovative and “pro-risk” organizations that “leam to dare and dare to learn” and create channels of innovative financing and innovative management.45
As mentioned, an important part o f India’s innovation system relates to how modem and more eff icient practices can be diffused to the greatest number o f users. This chapter, however, has focused mostly on India’s formal R&D efforts. In this context, some policies that can help to energize the Indian innovation system include the following:
43 See India, Ministry o f External Affairs (n.d.). For a discussion o f increasing S&T capacity throughout the world, see InterAcademy Council (2004).
For example, Tekes-the National Innovation Agency o f Finland-is the main public funding organization for R&D in Finland. Tekes funds industrial projects as well as projects in research institutes and especially promotes innovative, risk- intensive projects. More information i s available at http://www.tekes.fdeng/. 45 J. R. D. Tata Corporate Leadership Award Lecture by Dr. R. A. Mashelkar, director general, Council of Scientific and Industrial Research in New Delhi at the 1999 All-India Management Association meeting, February 21, 1999, available at http://www.nifindia.org/jrd%20lecture.htm.
90
0
0
0
0
0
0
0
0
0
0
0
0
0
0
0
0
Tap into the growing stock o f global knowledge more effectively and provide incentives for intemational technology transfer through trade, FDI, licensing, and personnel movements, along with informal means through imitation, reverse engineering, and spillovers. Attract FDI more effectively, given the importance o f FDI in the generation and dissemination o f global knowledge and the role that they can have in domestic R&D. This should include removing regulations on foreign investment and encouraging FDI R&D into the country. Encourage members o f the Diaspora and renowned expatriates to contribute further to innovative activities by appointing them to the management boards o f national research institutes, universities, and so on to facilitate the design o f university programs that better suit corporate requirements. Motivate scientists and engineers from India working in the United States and other developed countries to enter into alliances with multinational companies and establish f i r m s or labs to undertake R&D on a contract basis in India. Audit and monitor S&T efforts and institutional performance to identify what works well and then redeploy resources to programs that have a proven track record of success. Use the savings to strengthen university-industry programs by means o f matching grants and other initiatives, including encouraging academics to spend sabbaticals in relevant industries so that their research meets the needs o f the productive sector. Find alternative sources o f funding for R&D, especially as the government reduces i t s budgetary support for research programs. In some countries such as China, academic institutions are launching commercial ventures o f their own or in collaboration with the corporate sector. Allow national research institutes to collaborate with domestic and foreign f i r m s to forge closer links with industry. In recent years, strong criticism has been expressed on S&T institutions in India pursuing research of l i t t le relevance to the private sector and the needs o f the economy. One way o f encouraging scientists to work closely with industry and in so doing improving linkages between technology development and application would be to provide incentives such as bonuses and a share of royalties from products created through their research. Pay adequate salaries and create a proper working environment for scientists and engineers that provides them with access to capital equipment, instruments, and other infrastructure needed for R&D. Failure to compensate researchers adequately and lack o f a supportive environment w i l l only exacerbate the problem o f brain drain. Restructure and modernize universities and publicly funded R&D institutions by giving them flexibility, freedom o f operation, and financial autonomy. Increase the intake of students into science and engineering, given the competition for recruitment o f trained personnel; this may require adding colleges and universities (such as I l T s or others modeled after them). Develop entrepreneurial s k i l l s and management training for S&T professionals to encourage them to undertake business activities. Encourage the private sector to invest in R&D. Strengthen R&D by companies so that they can have a more demand-driven and market-oriented approach with closer collaboration among researchers, partners, and customers in developing new products and services that can be speedily brought to the market. Develop communication and other infrastructure for R&D, and create an attractive environment to motivate R&D investments, including favorable tax, and other incentives. Establish science and technology parks to encourage industry-university collaboration. Such parks might attract R&D work from both foreign and domestic f i r m s if the parks are situated close to reputable academic institutions. Encourage venture capital, which can also be used as an incentive for commercialization of research. Effectively enforce and implement IPR to create confidence among domestic and foreign innovators on protection of their innovations in the country.
91

0 Promote a national fund to support grassroots innovators, with the aim o f building a national register o f innovators, converting innovations into viable business plans, and disseminating knowledge of indigenous innovations, especially for job creation. Strengthen the emerging new model o f reverse drug design to produce innovations in a more cost- effective way based on leveraging traditional knowledge with modem science and exploiting public- private partnerships.
0
92

5. INFORMATION INFRASTRUCTURE
Rapid advances in ICTs are dramatically affecting the acquisition, creation, dissemination, and use o f knowledge, which in turn affects economic and social activities, including how manufacturers, service providers, and governments are organized and how they perform their functions. Applications o f ICT are improving the efficiency o f existing services and creating new opportunities in trade, governance, education, business connectivity, health care delivery, and environmental and natural resource development. As knowledge becomes an increasingly important element o f competitiveness, the use o f ICTs i s thus reducing transaction cost, time, and space barriers, allowing the mass production of customized goods and services and substituting for limited factors of production. With ICT use becoming all-pervasive and i t s impacts transformational, i t has become an essential backbone of the knowledge economy. This means that countries need to harness the full potential o f ICTs for al l sectors o f the economy: for education, innovation, and learning; public sector management; private sector competitiveness; and capacity building. They not only need to address the “digital divide,” but must also take advantage o f the emerging opportunities to leapfrog and participate in new knowledge industries.
The information infrastructure in a country consists of telecommunications networks, strategic information systems, policy and legal frameworks affecting their deployment, as well as skilled human resources needed to develop and use it. To develop a strong information infrastructure, it i s necessary to mobilize the many stakeholders that are involved in i t s deployment and use: government, business, individual users, the telecommunication and information service providers, and so on.
Turning to India, although the country’s IT industry and IT professionals have recently been on the cutting edge o f technological evolution, i t i s also true that the vast majority o f people have neither the access nor the awareness and education to derive benefits from advancing technology. Provision o f basic telephone services, long distance telephony, and data communications services was, until recently, the monopoly o f government agencies. Private players were not allowed to provide these services, and public sector enterprises had no incentive to extend the reach, enhance the quality, or reduce the cost o f services delivered to customers. Regulation and centralization o f communications development, restrictions on hardware imports until the mid-1980s, scant progress in meeting infrastructure needs, and the inability to scale up good quality higher education constrained India’s overall information infrastructure.
The enabling conditions for increased ICT penetration and use, however, are slowly, but surely being created in the country. India’s telecoms sector has registered rapid growth in recent years, spurred by reforms to open up the market and introduce greater competition to the sector. Many domestic and international private sector entrants are now providing consumers with high-quality services at low prices. Figure 5-1 shows the increasing percentage o f total (fixed plus mobile) telephone service provided by private operators in India.
93
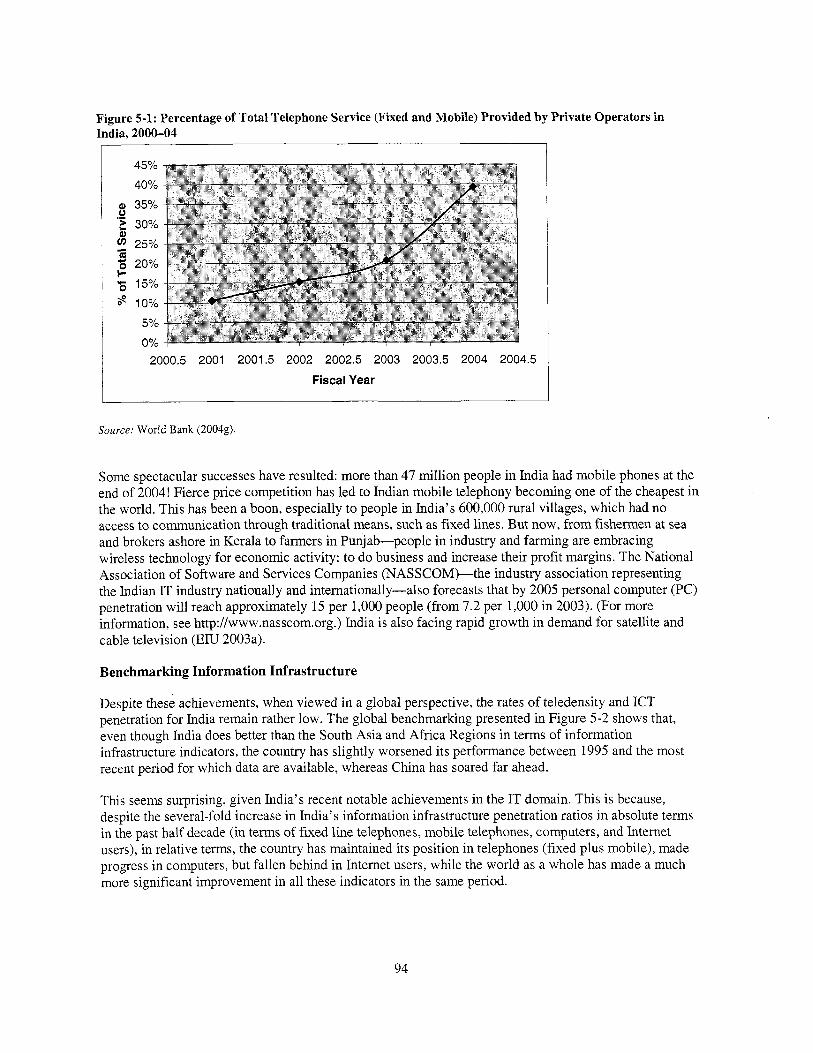
Figure 5-1: Percentage of Total Telephone Service (Fixed and Mobile) Provided b y Private Operators in India, 2000-04
45% 40% 35% 30% 25% 20% 15% 10%
5% 0%
2000.5 2001 2001.5 2002 2002.5 2003 2003.5 2004 2004.5
Fiscal Year __
Source: World Bank (2004g).
Some spectacular successes have resulted: more than 47 mill ion people in India had mobile phones at the end of 2004! Fierce price competition has led to Indian mobile telephony becoming one o f the cheapest in the world. This has been a boon, especially to people in India’s 600,000 rural villages, which had no access to communication through traditional means, such as fixed lines. But now, from fishermen at sea and brokers ashore in Kerala to farmers in Punjab-people in industry and farming are embracing wireless technology for economic activity: to do business and increase their profit margins. The National Association o f Software and Services Companies (NASSC0M)-the industry association representing the Indian IT industry nationally and internationally-also forecasts that by 2005 personal computer (PC) penetration w i l l reach approximately 15 per 1,000 people (from 7.2 per 1,000 in 2003). (For more information, see http://www.nasscom.org.) India i s also facing rapid growth in demand for satellite and cable television (EIU 2003a).
Benchmarking Information Infrastructure
Despite these achievements, when viewed in a global perspective, the rates o f teledensity and ICT penetration for India remain rather low. The global benchmarking presented in Figure 5-2 shows that, even though India does better than the South Asia and Africa Regions in terms of information infrastructure indicators, the country has slightly worsened i t s performance between 1995 and the most recent period for which data are available, whereas China has soared far ahead.
This seems surprising, given India’s recent notable achievements in the IT domain. This i s because, despite the several-fold increase in India’s information infrastructure penetration ratios in absolute terms in the past half decade (in terms o f fixed line telephones, mobile telephones, computers, and Internet users), in relative terms, the country has maintained i t s position in telephones (fixed plus mobile), made progress in computers, but fallen behind in Internet users, while the world as a whole has made a much more significant improvement in all these indicators in the same period.
94

Figure 5-2: Benchmarking Information and Communications Technologies, India and the World, 1995 and Most Recent Period
10
9-
8 -
7 - Middle East and North Africa
6 -
v d 5 - China
0 Mexico I 4-
; -
3 -
2 -
1-
0 , I I I I I I I I I 3 1 2 3 4 5 6 7 8 Q
1995
0
Note: Countries above the 45-degree line have improved their position in the information infrastructure for the most recent period for which data are available relative to their position in 1995 (or closest available date in the mid-1990s) and vice versa for countries below the line. Source: Wor ld Bank, “Knowledge Assessment Methodology,” http://www.worldbank.org/kam.
India’s ICT scorecard in Figure 5-3 and the data presented in Figure 5-4 (a, b, and c) and annex 11 for India and comparator countries on telephones (both fixed lines and mobile), computers, and Internet hosts again highlight the fact that although some progress has been made, India’s information infrastructure as a whole wi l l need to be much further strengthened if India i s truly to transform itself in to a knowledge- based economy, especially as compared to China, which has made remarkable progress in enhancing i t s overall infrastructure (annex 12 presents the I C T indicators for India and China, based on the KAM). T o take an example of just one indicator: total I C T expenditures in India in 2001 were 2.8 percent o f GDP, compared wi th more than double at 5.8 percent in China and 8.3 percent in Brazil. The l o w level o f spending in India has been due to a high-level o f regulations, lack o f local applications (most IT applications have been servicing the global market), and high tariffs on hardware, among others. More investment i s clearly required so India can make greater strides in strengthening i t s information infrastructure.
95

Figure 5-3: India’s Scorecard on Information and Communications Technologies, Selected Variables, Most Recent Period
Telnphones per 1,000 people (71 00)
(2 78) ICT Expendrture as $h of GD am Telephone lines per 1,000 (46 3U)
(5 18) E-Government Mobile phone per 1,000 (24 70)
(3 201 Internetional telecommunications, cost of call
Computers per 1,000 people (7 20)
(1 74 66) Internet users per 10,000 people \v’ Sets per 1 ,ail0 (83 00)
(0 821 Internet hosts per 10,O adios per 1,000 11 20 00)
(60 001 Daily newspapers per 1 ,ail0
Note: Each o f the 80 variables in the KAM i s normalized on a scale o f 0 to 10 for 128 countries. The fuller the scorecard, the better poised a country i s to embrace the knowledge economy. But an economy should not necessarily aim for a perfect score o f 10 on all variables. This i s because the scorecards may be shaped by the particular structural characteristics o f an economy or by trade-offs that characterize different development strategies. Values in parentheses denote actual values for India for the most recent period for which data are available. Source: World Bank, “Knowledge Assessment Methodology,” http://www.worldbank.org/kam
Figure 5-4: Telephones, Computers, and the Internet: India and Comparators, 1995-2002 a. Telephones (fixed and mobile per 1,000 people), 1995-2002
1200 , I
1000 1 800 i
600
400
200
#
*( I
i
t- L-
c 0
z ..... .......... z
,/ 0
e
Poland
L o c
0 ’ - - Korea
Bra& , #
China
India I
O J 1
1995 1996 1997 1998 1999 2000 2001 2002
Source, World Bank internal database.
96

b. Personal Computers per 1,000 people, 1995-2002
T
500
400
300
c 0
+ # Korea
c 0
I
, / I .
I
200
100
0 1995 1996 2001 2002 1999 2000 1997 1998
Source; World Bank intemal database.
c. Internet Hosts per 10,000 people, 1995-2000
. . I
100 1 / I
Korea ,
1
I
, # I c
c c c 4ol:"d
0 c c
1995 1996 1997 1998
Source; World Bank intemal database. 1999 2000
,
97
India’s Global Standing on Information Communications Technology
A variety o f indexes have been developed to rank countries’ performance on ICTs. This section reviews some of these to see where India stands on ICTs on the global stage. The indexes provide a variety of rankings on where India stands in a global perspective and differ with regard to their context and specific informational functions. One possible explanation for the differences in India’s rankings i s the way the different indexes are calculated; all of them use different methodologies and differ in the scope in terms of the number o f countries and indicators covered.
As a result, India seems to do better than some countries on some indexes and not much better on others. This i s certainly true when comparing India with China. On average, China seems to do better as an economy than India on using ICTs for its overall development, whereas India has some noteworthy pockets o f excellence and needs to do more to use and apply ICTs to meet domestic needs.
In this context, i t i s also worth noting that the global IT indexes presented here also provide a more somber picture o f India’s readiness than i s perhaps apparent from looking at the progress made by some o f the major Indian cities, such as Chennai, Bangalore, Delhi, Mumbai, Kolkata, Hyderabad, and so on. Several indexes have placed Denmark, Finland, Sweden, and Singapore in the top spots. These countries are rather small in size and population, compared with India. Given that India i s such a large country with major metropolises the size of some European countries, an interesting exercise would be to compare the progress made by some major Indian cities with the performance of the top-ranking countries.
Networked Readiness Index. The World Economic F0I-I.” s Global Information Technology Report of 2004-2005, the fourth in the series, highlights its Networked Readiness hdex (NRI) o f 104 countries (WEF 2004d). The NRI measures the degree o f preparation a nation or community has to participate in and benefit from ICT developments. The NRI i s composed of three component indexes, which assess the following:
0
0
0
Environment for ICT offered by a given country or community Readiness of the community’s key stakeholders (individuals, businesses, and governments) Usage of ICT among these stakeholders.
The NRI for 2004-05 places Singapore as the best performer worldwide in a number o f categories, including the quality of math and science education, affordability o f telephone connection charges, and government prioritization and procurement o f ICTs; i t also gets extremely high scores in other areas, such as affordability o f Internet access. Singapore i s followed by Iceland, Finland, and Denmark, and the United States occupies f i f th spot on the 2004-05 NRI. In terms o f India and i t s comparators, Korea tops the l i s t and holds 24th place, but India i s next on the l i s t at 39th, surpassing China at 41st, Brazil at 46th, and Russia at 62nd. India and China have both moved up the ranks in 2004-05 and have shown significant improvements on the rankings in 2003-04, when India ranked 45th and China ranked 5 1st.
E-readiness rankings. The Economic Intelligence Unit’s 2004 “e-readiness’’ ranhngs (EIU 2004a) provide another interesting benchmark for countries in comparing and assessing their ICT-related environments, related to e-readiness. E-readiness or the extent to which a market i s conducive to Internet- based opportunities takes into account a wide range o f factors-from the quality o f IT infrastructure to the ambition o f govemment initiatives and the degree to which the Internet i s creating real commercial efficiencies. The rankings cover the world’s 64 largest economies. In the 2004 rankings, several countries have improved their scores since 2003, thanks to continued rollout o f broadband services, uptake o f mobile telephony, and a spate of Internet-related legislation and government programs. Four tiers o f e- readiness have emerged in the 2004 ranking:
98

Denmark holds the top spot, and Korea i s ranked 14th. Korea has the densest broadband market in the world today. The countries in the second tier includes countries, for example, Brazi l (35th) and Poland (36th), that do not yet have dense communications and Internet infrastructure or have less well-coordinated “e- government” policies, but do have significant and quickly growing “e-service’’ industries. The third tier includes large and increasingly “e-ready’’ economic powerhouses: India (46th), China (52nd), and Russia (55th). In 2003 India was also at 46th place, above Russia (48th) and China (50th). If it were not for the entry o f four new countries in the 2004 rankings, India would have moved up four places! In the fourth tier (56th through 64th places) i s a cluster o f markets in which Internet services are struggling. The occasional bright star does arise, as i s evidenced b y the success o f Vietnam’s software development industry.
Digital Access Index. The International Telecommunication Union (ITU) unveiled the Digi ta l Access Index (DAI) (ITU 2003), which ranks ICT access for 178 countries. The DAI distinguishes itself f r om other indexes by including a number o f new variables, such as education and affordability. Countries are classified into four digital access categories in the DAI: high, upper, medium, and low.
Table 5-1 shows the following: Table 5-1: Digital Access Index, Various
0 Sweden leads the DAI, and Korea comes in fourth. Countries, 2o02 1. Sweden 0.85
0.83 Apart f rom Canada, which i s ranked tenth, the top 2, Denmark 3. Iceland 0.82 ten are al l Asian and European countries. The
United States holds eleventh place. All these 4. Korea 0.82 countries are placed in the “high-access” category. 5. Norway 0.79
0 Brazil, Poland, and Russia are classified in the 6. Netherlands 0.79 “upper-access’’ category. Other countries in t h i s 7. Hong Kong, China 0.79 category include those that have been using ICTs as 8. Finland 0.79 development enablers. Positive government policies 9. Taiwan, China 0.79 have helped them reach an impressive level of ICT 10. Canada 0.78
11. United States 0.78 access; th i s has been the case for Dubai Internet 12. United Kingdom 0.77 City in the United Arab Emirates (the highest-
ranked Arab nation), the Multimedia Super Corridor Note: On a scale Of’ to ‘ 1 for which ’ = bhest access.
in Malaysia (the highest-ranked developing Asian Source: ITU (2003), nation), and Cyber City in Maurit ius (along w i th Seychelles, the highest-ranked Afr ican nation). India is classijied in the “middle access” category and lags behind China, showing that it needs to do more to j o in the ranks o f countries that have been using IT as a lever for enhancing overall development, not just in a few pockets o f development.
0
Information Society Index: The Information Society Index (ISI) in 2004 measures the abilities o f 53 nations to participate in the information revolution (see http://www.idc.com/groups/isi/main.html). The IS1 combines 15 variables in four infrastructure “pillars” to calculate and rank each nation’s ability to access and utilize information and I T . In much the same way that GDP measures a country’s economic wealth, the IS1 measures i t s information capacity and wealth. The four pillars are: 0 Computers. This pil lar looks at the basic building blocks o f information society by measuring the
number of PC households, IT spending as a percentage o f GDP, software spending as a percentage o f total IT spending, and IT services spending weighted against GDP.
99

0 Intemet. The Internet i s a key factor in development o f an advanced information society. This pil lar factors in the number o f Internet users within a country, percentage o f users wi th Internet access at home, number o f mobile Internet users, and e-commerce spending. Telecoms. To understand better how each society accesses information, this pil lar measures variables related to broadband adoption, wireless services, and mobile handset shipments. Social. Social factors provide the glue that enables society to f i x onto advantages offered b y innovation. This pillar evaluates a society’s ability to utilize information technology b y measuring education, c i v i l liberties, and government corruption.
0
0
In the 2004 rankings, Denmark was in first place, followed by Sweden. The United States, Switzerland, and Canada rounded out the top five. The top Asian country i s Korea, in eighth place. Brazi l took 38th place, Russia 41st, China 44th, and India 51st. In terms o f the component rankings, India ranked 51st on computers, 53rd o n telecoms, 43rd o n the Internet, and 5 1st on social indicators. In contrast, the component rankings for China were 46th for computers, 39th for telecoms, 38thfor the Internet, and 48th for social indicators.
E-readiness assessment of Indian states. The above indexes provide a glimpse o f India’s ranking on the global stage. The recently released report India: E-Readiness Assessment Report 2004 for States/Union Territories46 differs f rom the others by looking at the level o f e-readiness o f various Indian states. The report classifies Indian states into the following categories:
0
0
0
0
0
0
Leaders. Kamataka, Tamil Nadu, Andhra Pradesh, Maharashtra, and Chandigarh. Aspiring leaders. Kerala, Gujarat, Goam Delhi, Punjab, and Haryana. Expectants. West Bengal, Pondicheny, and Madhya Pradesh. Average achievers. Uttar Pradesh, Chattisgarh, Orissa, Sikkim, Himachal Pradesh, and Rajasthan. Below average achievers. Mizoram, Jammu and Kashmir, Assam, Meghalaya, Uttaranchal, and Jharkhand. Least Achievers. Lakshadweep, Manipur, Tripura, Arunachal Pradesh, Andaman and Nicobar Islands, Bihar, Daman and Diu, Dadra and Nagar Haveli, and Nagaland.
ICT infrastructure and ability to use it i s clearly strongly dispersed across Indian states. Some states in India, such as Andhra Pradesh, have made notable strides in using ICTs for their development. Among the leaders, Tamil Nadu has improved i t s e-readiness in the past year b y consciously working on the environment, especially involving the private sector in development of ICT infrastructure and introducing ICTs in state-level policies. Among aspiring leaders, Kerala has used the competitive advantages of the state (high proportion of literacy, and awareness of citizens) to “pole vault” in the usage segment, and Gujarat has tried to replicate i t s success in industry segments, such as petrochemicals and chemicals in the ICT sector. Among the expectant category, Madhya Pradesh’s ascent i s notable and largely due to private sector involvement in developmental activities (for example, in e-Choupal). In all cases, these Indian states have made the progress due to leadership, connectivity, availability of skilled manpower, increased private sector development, and creation o f institutional mechanisms wi th sustainable impact.
46 For more information, including the methodology, refer to India, Ministry of Communications and Information Technology, and NCAER (2004b).
100

Issues and Recent Developments in the Telecommunication and I T sectors
I t i s clear that developing countries must invest in building their information infrastructure. This includes not only developing the basic telephone and telecommunications services, but also ensuring that these services are provided at the lowest cost, as well as promoting the application o f ICTs to facilitate improvements in the efficiency o f the delivery o f economic and social activities. Furthermore, as the application o f ICTs becomes even more important for economic growth and increased social welfare, special attention must be given to new investments in upgrading the s k i l l s and competencies o f workforces to use ICTs.
Even though this chapter has so far shown that India has a way to go in developing i t s information infrastructure to reach advanced country standards, the country nonetheless has recently had some impressive achievements. This section reviews recent developments in the India’s telecommunications and IT sectors.
Scaling up telecommunications. The number o f f ixed and mobile subscribers in India has increased greatly, especially in the past four years (Figure 5-5). In fact, the number o f mobile subscribers has now surpassed the number o f fixed lines (or landlines). F rom 1998 to 2004, mobile subscribers increased f rom 1.2 mi l l ion to 47.3 million, and fixed l ine (or landline) subscribers f rom 21.5 mi l l ion to about 44 million.47 This growth has resulted in a total teledensity in India f rom 10.7 per 1,000 people in 1995 to 7 1 per 1,000 people in 2003 and 87 per 1,000 people in 2004 (Figure 5-6). The growth in the mobile market i s l ikely to be sustained in the next few years as the number o f subscribers i s expected to top 100 mill ion, whereas the market for landlines continues to grow at a more conservative pace.
Figure 5-5: Growth of Telephony in India: Numbers of Landline and Mobile Subscribers, 1996-2004
I 1996 1998 2000 2002 2004
Source: Abraham (2005)
47 For more information, see http://sify.com/finance/fullstory.php?id=l3645428; http://news.bbc.co.uW2/hiA~usiness/3994761 .stm; and ITU at http://www.itu.int/ITU-D/ict/statistics/.
101

Figure 5-6: Teledensity in India, 1995-2004
100
8 90
0 80 2 % 70
60
50
," 40
5 30 E
e a
(1.
0
a
.- e
c
0
; 20
.$ 10
$ 0
v
E
1995 1999 2001 2003 Oct-04 I Source: Abraham (2005).
Developing a new broadband policy. The Indian government, in keeping pace with up-to-date technological advancements, announced i t s Broadband Policy in 2004, to give impetus to broadband and Internet penetration in the country. Prime considerations guiding the policy include affordability and reliability o f broadband services, incentives for creation o f additional infrastructure and employment opportunities, introduction o f the latest technologies, and encouragement o f a competitive environment in order to reduce regulatory interventions. The policy sets a goal of three mill ion broadband subscribers and six mill ion Internet subscribers by December 2005 and 20 mil l ion broadband subscribers and 40 mill ion Internet subscribers by the end of year 2010. The new policy encourages creation and growth o f infrastructure through various coexisting access technologies, such as optical fiber technologies, digital subscriber l ines on copper loop, cable T V network, satellite, and terrestrial wireless techn~ log ies .~~
Reforming telecommunications. In spite o f impressive progress in the telecommunications landscape in India, the reform agenda i s s t i l l unfinished. Important areas that continue to need attention include the following:
0
0
0
Completion offull un$ed licensing. This involves development and implementation o f a second stage o f the unified licensing regime, which would extend to all telecom services. Tariffs and network interconnection. Tariff rebalancing and terms o f network interconnection need continued attention. Rural connectivity digital divide. As the telecommunications sector moves quickly to a more commercial and competitive environment, the government needs to review and develop policies regarding service needs o f rural areas o f India, including those groups who are not well served by the market. This issue wi l l be discussed in some length later in t h i s chapter. Strategy to accelerate Intemet and broadband use. This strategy i s in line with the government's broadband policy highlighted above to accelerate growth o f the Internet and broadband penetration in the country (World Bank 2004g).
0
48 For more information, see India, Ministry of Communications and Information Technology (2004a).
102

Creating global niches in IT. India’s I T sector can boast of remarkable and impressive global achievements. The prediction that India wi l l dominate IT work in the developed world, just as China and other East Asian countries commandeered manufacturing, i s becoming a reality. Companies such as TCS, Wipro, Infosys, HCL Tech, and Satyam topped the l i s t o f India’s IT services f i r m s in 2004 in terms o f total revenues (The Economist 2004b). In 2004 Infosys ranked as the ninth most respectable IT company in the world, behind Hewlett Packard, IBM, Dell, Microsoft, SAP, Cisco, Intel, and Oracle (Merchant 2004). As a result, Bangalore4’ and, more recently, Hyderabad, Chennai, Mumbai, and Pune are emerging as competitive IT hubs in the country.
According to NASSCOM, the Indian IT market overall has grown from $1.73 bil l ion in 1994-95 to $19.9 bil l ion in 2003-04, accounting for more than 3 percent o f India’s GDP in 2003-04. India’s IT software and services exports recorded revenues o f $12.5 bil l ion in 2003-04. The domestic market, on the other hand, accounted only for $3.4 bil l ion in 2003-04.
Several factors have contributed to India’s success in the IT industry, including the existence o f a highly skilled, English-speaking workforce graduating from India’s engineering schools and eaming lower wages than European and U.S. counterparts, low dependence o f IT on physical infrastructure, the Indian Diaspora, and introduction o f current account convertibility and easing o f controls and regulations in the early 1990s. The IT industry in India has looser labor regulations and less corruption and bureaucracy, arguably, because i t developed without government intervention!
Box 5-1 provides information on the recent status o f India’s IT market and the software and services industry. Software and services exports continue to remain on top of the IT industry’s revenue table. Major long-term projects in the export-driven software sector have come into India, and Indian companies have been taking on an increasingly larger share o f the global outsourced business. In terms o f software services delivery, in 2002-03, offshore project revenues grew by 49 percent compared with on-site revenues. In terms o f geography, Indian ICT companies have begun tapping into regions outside the U.S. market, which remains the largest user of software solutions from India. Revenue contributions by the U.S. market continued to rise due to the large number o f RES/ BPO projects outsourced to India. Looking ahead, some o f the key service lines for Indian companies continue to be custom application development and maintenance, applications outsourcing, ITES, and R&D services.
Although, on the one hand, India i s reaping tremendous revenues from continuing to expand provision o f distance services globally, on the other hand, the high fees gamered from providing foreign IT services preempts Indian companies from developing ICT applications to meet domestic needs. Domestic demand accounts for less than one-fifth o f the IT turnover, which highlights the potential and urgent need for developing IT applications for the domestic market. This i s a major issue for India, as it strives to transform i tse l f into a knowledge-based economy.
49 For more information, see the official Web site o f the Department o f IT and Biotechnology, Govemment of Kamataka at http://www.bangaloreit.cod.
103

Box 5-1: Snapshot of the Indian Information Technology Market and Software and Service Industry Figure a: Indian I T Market, 1997-2003 Figure b: Indian Software and Service Industry, 2002-04
Figure a shows the evolution o f the Indian IT market in 1997-2003. The market has been increasing by leaps and bounds, and the IT industry i s estimated to contribute to 3.82 percent o f India’s GDP in 2003-04, compared with 1.22 percent in 1997-98. Thus, India’s I T sector has defied predictions that i t would never outgrow “body shopping”-simple, low-cost software fixes done at the client’s site. Indian software companies have proven themselves and gone on to win bigger, longer-term, and more demanding contracts that they have fulfil led on time, on cost, and with high quality, thus reinforcing and cementing their dominant position in the world.
Figure b shows total revenues o f the Indian software and services industry in 2003-04 o f $15.9 billion, including domestic revenues o f $3.4 billion. The Indian software and service industry i s likely to grow to $20.5 bi l l ion in 2004-05, with domestic market revenues o f $4.2 billion. Indian software and services exports registered a growth o f 30.5 percent in 2003104, clocking revenues of $12.5 billion, and are likely to witness a 30-32 percent increase to reach revenues o f $16.3 bi l l ion in 2004-05. North America, which accounts for more than 55 percent o f global IT spending, represented approximately 70 percent o f Indian software exports in 2003-04; Europe ranked second at 22.25 percent o f total exports. North America remains the dominant market for ITES-BPO services, accounting for more than 80 percent of ITES-BPO business in India.
Some initiatives to make India a sustainable hub for ITES should include instituting single window clearances for the ITES industry, such as call centers, tele-education, telemedicine, and telemarketing; ensuring ease o f operations and start-up assistance for ITES units through support from local authorities and state governments; setting up degree-level courses for ITES industry as well as ITES training infrastructure, and involving industrial training institutes and polytechnics for call center management; creating an “India Brand” marketing fund for promoting India as a preferred destination for the ITES sector; and establishing a suitable venture capital fund and developing special incentives to promote entrepreneurship and teleworking, especially for women in this sector.
Sources: NASSCOM (http:l/www.nasscom.org), NASSCOM’s IT Industry Factsheet 2004 (http://www.nasscom.org/download/IndianITIndustryFactsheet.doc), and India, Planning Commission (2002~).
Moving up the value chain. India’s I T services are moving up the value chain, and India i s undertaking new and innovative work, such as management for clients o f IT-related business processes. At present, call services and IT-enabled services (back-office operations, remote maintenance, accounting, public call centers, insurance claims processing, medical transcriptions, insurance claims, legal databases, digital content development, online education, data digitizatiodGIS, payroWhuman resource services, and other bulk standards processing), which use cheap labor and do not require knowledge for software engineering, are expanding rapidly in India, and have substantial potential to generate wealth and create
104

employment opportunities. As an example, Indian companies are offering back-office services to f i r m s that do not want to set up their own Indian operations. Daksh.com near Delhi answers questions from customers of Amazon, the biggest online retailer, mainly by e-mail. One o f the f i rst big online travel agencies, e-bookers, uses a call center in Delhi to provide round-the-clock service for offices in Europe. Large global systems integration companies, such as IBM Global Services, are also relocating work and expanding their presence in India to take advantage o f the country’s cost and manpower strengths.
In addition, India i s also increasingly making an impact in IT consulting: companies such as Wipro, Infosys, and Tata are managing US. IT networks and reengineering business processes. In chip design, Intel and Texas Instruments, for example, are using India as R&D hubs for microprocessors and multimedia chips (Kripalani and Engardio 2003). Indians themselves are also investing abroad. According to NASSCOM, the Indian software industry has recently made cumulative investments o f $350 mill ion abroad, most o f i t in the United States (The Economist 2003b). The success o f the I T industry on the whole influenced competitiveness in other sectors as well by building confidence in Indian industry, enhancing the country’s brand equity in the world and offering entrepreneurial opportunities on a global scale. In the future, i t i s expected that India w i l l make inroads in financial analysis, industrial engineering, analytics, and drug research.
Expanding employment in the IT industry. The IT industry in 2000-03 created employment opportunities for almost 700,000 people in India (
Figure 5-7). NASSCOM more recently estimates that by the end of fiscal 2005, the number o f people employed in India’s outsourcing industry w i l l have reached one mill ion (Associated Press 2005). Some o f the biggest U.S. employers in India in 2003 were GE Capital Services (conducts back-office work with 16,000 people), GE’s John Welch Technology Center (conducts product R&D with 1,800 people), IBM Global Services (provides IT services and software with 10,000 people), Oracle (provides software and services with 6,000 people), Electronic Data Systems (provides IT services with 3,500 people), Texas Instruments (designs chips with 900 people), In te l (designs chips and software with 1,700 people), and J. P. Morgan Chase (conducts back-office work and analysis with 1,200 people) (Kripalani and Engardio 2003).
Figure 5-7: Employment in the Indian Information Technology Sector, 2000-03 (thousands)
590
400
300
200
100
0
Note: Years shown end in March. Source: Based on chart in The Economist (2003~).
Contributing to economic growth. Various forecasts have been given on where India’s IT industry i s heading. According to WEF’ s Global Information Technology Report 2002-2003 (WEF 2003), India’s IT industry i s expected to grow at a compounded annual rate o f 38 percent to reach $77 bil l ion by 2008,
105
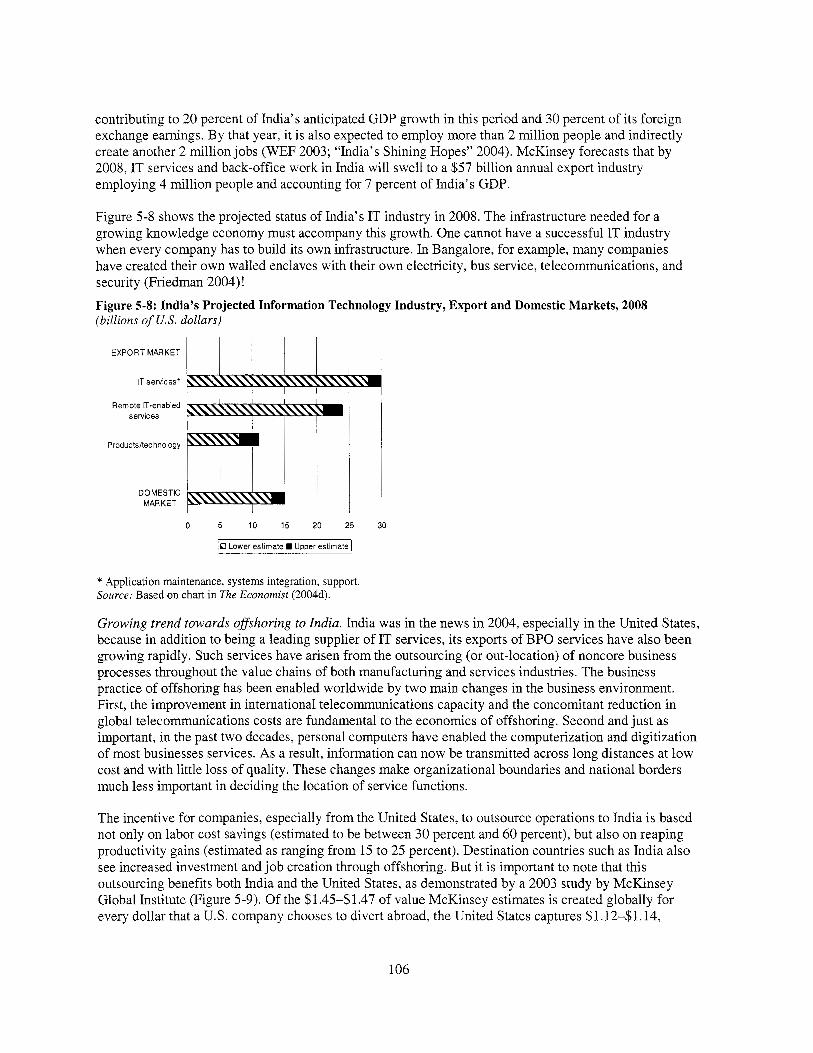
contributing to 20 percent of India’s anticipated GDP growth in this period and 30 percent of i t s foreign exchange earnings. B y that year, i t i s also expected to employ more than 2 mill ion people and indirectly create another 2 mil l ion jobs (WEF 2003; “India’s Shining Hopes” 2004). McKinsey forecasts that by 2008, IT services and back-office work in India w i l l swell to a $57 bil l ion annual export industry employing 4 mil l ion people and accounting for 7 percent o f India’s GDP.
Figure 5-8 shows the projected status o f India’s IT industry in 2008. The infrastructure needed for a growing knowledge economy must accompany this growth. One cannot have a successful IT industry when every company has to build i t s own infrastructure. In Bangalore, for example, many companies have created their own walled enclaves with their own electricity, bus service, telecommunications, and security (Friedman 2004) ! Figure 5-8: India’s Projected Information Technology Industry, Export and Domestic Markets, 2008 (billions of U.S. dollars)
EXPORT MARKET
IT services.
Remote IT-enabled services
P roductsltec hnology
DOMESTIC MARKET
R
! O Lower estimate UDDer estimate 1
* Application maintenance, systems integration, support Source: Based on chart in The Economist (2004d).
Growing trend towards ofshoring to India. India was in the news in 2004, especially in the United States, because in addition to being a leading supplier o f IT services, i t s exports o f BPO services have also been growing rapidly. Such services have arisen from the outsourcing (or out-location) o f noncore business processes throughout the value chains o f both manufacturing and services industries. The business practice o f offshoring has been enabled worldwide by two main changes in the business environment. First, the improvement in international telecommunications capacity and the concomitant reduction in global telecommunications costs are fundamental to the economics of offshoring. Second and just as important, in the past two decades, personal computers have enabled the computerization and digitization of most businesses services. As a result, information can now be transmitted across long distances at low cost and with little loss o f quality. These changes make organizational boundaries and national borders much less important in deciding the location of service functions.
’
The incentive for companies, especially from the United States, to outsource operations to India i s based not only on labor cost savings (estimated to be between 30 percent and 60 percent), but also on reaping productivity gains (estimated as ranging from 15 to 25 percent). Destination countries such as India also see increased investment and job creation through offshoring. But i t i s important to note that this outsourcing benefits both India and the United States, as demonstrated by a 2003 study by McKinsey Global Institute (Figure 5-9). O f the $1.45-$1.47 o f value McKinsey estimates i s created globally for every dollar that a U.S. company chooses to divert abroad, the United States captures $1.12-$1.14,
106
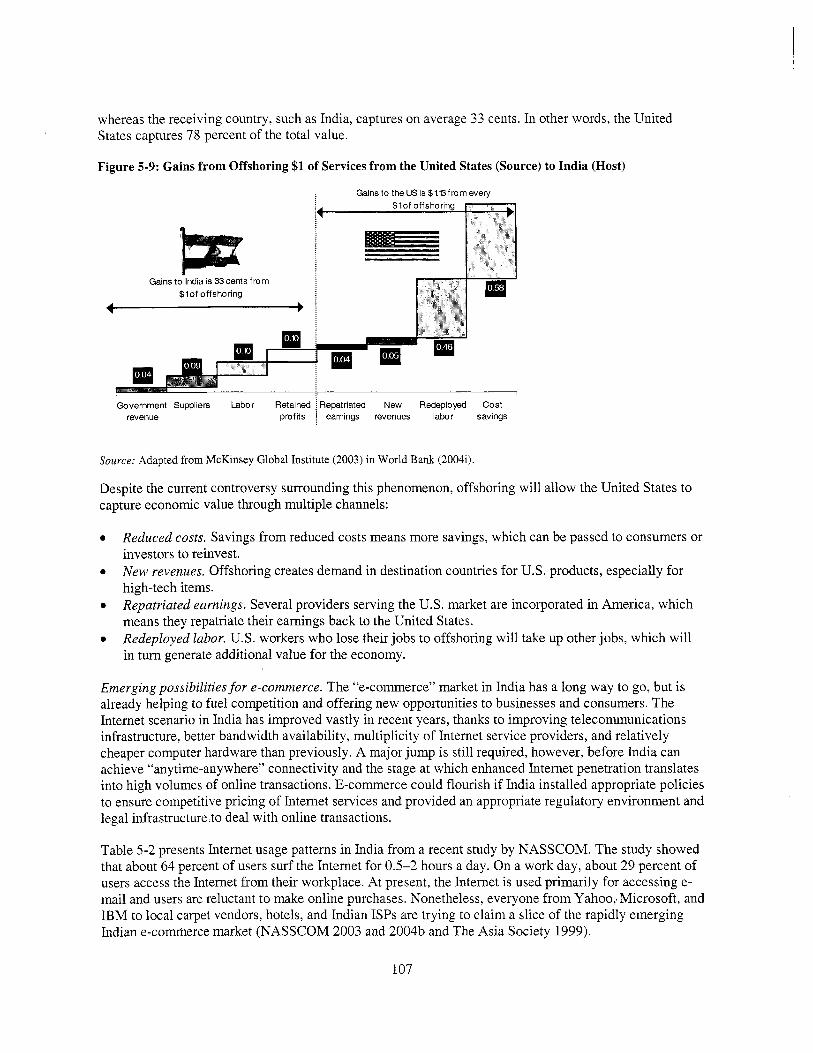
whereas the receiving country, such as India, captures on average 33 cents. In other words, the United States captures 78 percent of the total value.
Figure 5-9: Gains f r o m Offshoring $1 o f Services f r o m the United States (Source) to India (Host)
Gains to’lndia is 33 cents from $ lo f offsho ring
1 h
Government Suppliers Labor Retained revenue profits
Gains to the US is $l.O from every
Repatriated New Redeployed Cost earnings revenues labor savings
Source: Adapted from McKinsey Global Institute (2003) in World Bank (2004i).
Despite the current controversy surrounding th i s phenomenon, offshoring w i l l allow the United States to capture economic value through multiple channels:
0
0
0
Reduced costs. Savings from reduced costs means more savings, which can be passed to consumers or investors to reinvest. New revenues. Offshoring creates demand in destination countries for U.S. products, especially for high-tech items. Repatriated earnings. Several providers serving the U.S. market are incorporated in America, which means they repatriate their earnings back to the United States. Redeployed labor. U.S. workers who lose their jobs to offshoring w i l l take up other jobs, which w i l l in turn generate additional value for the economy.
Emerging possibilities for e-commerce. The “e-commerce’’ market in India has a long way to go, but i s already helping to fuel competition and offering new opportunities to businesses and consumers. The Internet scenario in India has improved vastly in recent years, thanks to improving telecommunications infrastructure, better bandwidth availability, multiplicity o f Internet service providers, and relatively cheaper computer hardware than previously. A major jump i s s t i l l required, however, before India can achieve “anytime-anywhere” connectivity and the stage at which enhanced Internet penetration translates into high volumes of online transactions. E-commerce could flourish if India installed appropriate policies to ensure competitive pricing o f Internet services and provided an appropriate regulatory environment and legal infrastructure to deal with online transactions.
Table 5-2 presents Internet usage patterns in India from a recent study by NASSCOM. The study showed that about 64 percent o f users surf the Internet for 0.5-2 hours a day. On a work day, about 29 percent o f users access the Internet from their workplace. At present, the Internet i s used primarily for accessing e- mail and users are reluctant to make online purchases. Nonetheless, everyone from Yahoo, Microsoft, and IBM to local carpet vendors, hotels, and Indian ISPs are trying to claim a slice of the rapidly emerging Indian e-commerce market (NASSCOM 2003 and 2004b and The Asia Society 1999).
107

Uses E-ma i l In fo rmat ion Chat Educat iodacademic in fo rmat ion Downloads Music/movies/entertainment Jobs
As borne out by NASSCOM’s Strategic Review 2004 (2004b), e-commerce activity in India i s thus currently at a very nascent stage. The speed at which e-commerce can be adopted by various industries in India w i l l depend on the current industry structure, supply chain characteristics of the industry, and current IT adoption within the industry. Among Indian industries, automotive and consumer goods are expected to lead e-commerce activity. India i s expected to have an Internet user base of 52 mill ion by 2005. Despite this, the Internet i s unlikely to become a key sales channel in the near future due to cultural factors and current convenience in offline trading. According to NASSCOM’ s Strategic Review 2003, Indian business-to-consumer spending in 2002 i s estimated at about Rs. 380 million. Travel i s emerging as the fastest-growing category for business-to-consumer transactions and accounted for about 23 percent of transactions during 2002. Indian Railways and domestic airlines are launching the online sale of tickets; t h i s segment i s expected to account for a large proportion o f business-to-consumer transactions in the near future. Wi th a large base o f mobile phone users, the potential for mobile applications-also called m-commerce-is huge.50 Business-to-business transactions are increasingly expected to dominate total transaction volumes in the near future. This will, however, require greater investing in the telecommunications infrastructure as well as addressing issues related to intellectual property rights and legal protections for commerce via the Internet.
Users Time 90 35 50 9 43 9 41 11 38 6 21 4 23 4
E-commerce faces a number of challenges in India. India i s s t i l l in the main plagued by low PC penetration, high cost o f Internet access, lack of hardware, and low telephone penetration. As far as e- commerce i s concerned, a big problem relates to the use of credit cards and resulting security issues. The relatively small credit card population and lack o f uniform credit agencies create a variety o f payment challenges unknown in advanced countries such as the United States. Although the cyber-environment in India has improved thanks to the IT Act 2000, which regulates e-commerce on the Internet and makes e- commerce, online transactions, and digital signatures legally valid, more needs to be done to create a
50 “M-commerce” includes application services that can be accessed by a user on a mobile phone (such as checking bank accounts, paying bills, and transferring funds). According to Memll Lynch, short message service (SMS) could bring in as much as $75 mi l l ion in revenues for Indian GSM (Global System for Mobi le Communications) operators by 2005. An emerging trend in the Indian m-commerce market i s integration o f service providers wi th web portals. For instance, Hutch has a tie-up with Yahoo, which allows Hutch users to check their e-mail on Yahoo through their mobile phones; thus, W A P (wireless access protocol)-enabled applications are beginning to pick up their pace in the Indian market.
which involve credit and debit transfers, point-of-sale terminals, merchant terminals, and so on have not found widespread application in India. One o f the major hurdles facing growth o f m-commerce applications i s the lack o f steadiness in terms o f technology and security. Two competing standards, namely W A P and S I M (subscriber identity module) are being used for mobile data applications. No commerce-capable cellular networks exist that can guarantee secure transactions in real time. T h i s requires a considerable amount o f coordination among the different parties involved in the entire m-commerce value chain, such as wireless infrastructure providers, service providers, certifying authorities, application or software providers, equipment manufacturers, credit card companies, and banks. Furthermore, m-commerce applications w i l l not proliferate until high- bandwidth networks are deployed and wireless service providers cooperate wi th each other.
The m-commerce market in India i s s t i l l in i t s infancy compared w i th the United States and Europe. High-value transactions,
108

conducive environment for online business. Other factors that impede the growth of e-commerce in India include the following:
0
0
0
0
0
Poor telecommunications infrastructure, including cost of hardware and unreliable Internet connection High telecom costs on dial-up charges as a barrier to growth Limited Internet access among customers and small businesses Lack o f payment gateways for secure transactions on the Internet I T systems and processes unprepared for e-commerce activities Logistical difficulties, such as insufficient transport networks representing a serious hurdle to business-to-business development, because they make i t difficult for companies to realize potential gains o f increased efficiency in their supply chain Uncertainty o f return on investments, for example, some Indian companies find returns on investments in e-commerce initiatives hard to justify, and many do not see any urgency to entering this area due to lack o f competitive pressures.
0
Measures to Strengthen the Information Infrastructure
The above discussion has underlined the ways in which the Indian telecommunications sector has been quickly moving to a more commercial and competitive environment and the IT industry i s moving on to greater heights. As this happens, the government also needs to establish and implement practical policies to develop IT s k i l l s in the workforce, reorient strategies in the IT industry to sustain growth, enhance the reach o f IT to groups that are not well served by the market (Le., bridging the “digital divide”), increase ICT applications throughout the economy, and usher in rural development through connectivity.
Develop IT skills in the workforce. One o f the key inputs to achieving sustained growth and exports in the IT sector i s the availability of adequate numbers o f high-quality professionals. For continuous growth in this sector, India needs to maintain and enhance its competitive advantage o f abundant, high-quality, and cost-effective human resources. The country needs to ensure the right mix o f technical, business, and functional s k i l l s in the workforce to meet the needs o f individual business segments and customer markets, which requires harmonization between the demand o f the industry and the supply o f trained manpower by Indian educational and training institutions.
India produces some 120,000 graduates in IT a year, from a variety o f institutions, such as the newly launched Indian Institute of Information Technology in Bangalore, a new-generation graduate school focusing on all aspects o f IT. Even though around one mill ion people are employed in India’s IT sector, the country could face an estimated shortage o f anywhere between 65,000 to 530,000 IT professionals by 2005, depending on market conditions. Indian software companies are also increasingly concerned with the risk o f brain drain, as worldwide competition for knowledge workers intensifies and India r i sks losing i t s best and brightest. For the f i r s t time, India i s looking over i t s shoulder at China, which could become a competitor, initially at the low end o f the market. India has an edge in English and experience, but the Chinese are learning quickly. Despite the slowdown, India may not produce enough good engineers and IT professionals to meet the expected growth in I T in coming years. The need exists, therefore, for rapid expansion o f suitable training opportunities at home. Given the extent of demand for IT ski l ls , many private IT training institutes offering IT-focused training have sprung up in India, such as NIIT and the Internet Training Centre Initiative for Developing Countries, developed by the ITU and Cisco systems (Box 5-2). Many large companies, such as Infosys, have also developed their own training infrastructure to ensure that they deliver good quality services to their clients.
109

Box 5-2: Information Technology Training Initiatives in India N I I T offers the gamut o f computer training for individuals and organizations from entry-level IT literacy programs to advanced courses on state-of-the-art technologies. According to i t s Web site, in the past 20 years, NIIT has trained 2 million students throughout the world in IT . N I IT provides on-site, “anytime-anywhere’’ training to customers across India through its extensive network o f centers. I t s training facilities are equipped with state-of-the- art infrastructure. NIIT provides on-the-job or project-based training, in which a mentor assists specific participants, while they use the technology on a sample N I IT project. NIIT thus customizes training programs to suit the requirements o f different customers, enabling achievement o f higher productivity in the workplace. N I IT has worked to date with major public and private sector organizations, such as the Indian Directorate o f Income Tax, Indian Army, and Indian Navy. Private and IT companies include Hindustan Levers, Ranbaxy, Tata Steel, Pfizer, Maruti Udyog, Ericsson, and Coke India. Banks and insurance companies include the Reserve Bank o f India, State Bank of India, and the L i fe Insurance Corporation.
ITU and Cisco Systems have developed an Internet Training Centre Initiative for Developing Countries. The initiative, a model for public-private partnership to bridge the “digital divide,” now has more than 26 centers worldwide. The 800-plus students currently enrolled in this initiative are now armed with sk i l l s to face the challenge of the new economy. In Asia, eight centers exist in China, India, Indonesia, Malaysia, Maldives, Philippines, and Samoa. The centers provide affordable and relevant training and education to students in developing countries using both face-to-face and web-based curricula. Through the Cisco Networking Academy Program, Cisco Systems provides all I T U Internet Training Centers with hands-on coursework designed to teach students the s k i l l s needed to design, build, and maintain small- to medium-sized IP-based networks
Source: NIIT (http://www.niit.com) and Cisco Systems (2002).
India thus needs to put in place suitable human resource development initiatives, starting at the primary school and moving on to tertiary levels to meet the needs o f the IT and other productive sectors o f the economy. This includes the following:
0
0
Continuously upgrading o f basic standards of education at the secondary school level with enhanced emphasis on physics, mathematics, and English Updating syllabuses in computer engineering, electronics, and IT in various technical institutions to meet the demands o f industry (curricula in other branches of engineering should also be broadly based to include IT subjects) Upgrading the s k i l l s o f teaching faculties and introducing teaching aids, such as computers, videos, access to the Internet, videos, and so on Strengthening postgraduate education and innovative research in IT to maintain quality standards to face new challenges in this dynamic sector Augmenting RECs (now to become NITS) and other notable engineering colleges under deemed universities to the level o f I I T s , so the country has a critical mass of such institutions by the end o f the Tenth Five-Year Plan to meet the requirements o f quality manpower.
0
0
0
Reorient strategies in the IT industry. Although India has earned well-deserved recognition in the international sphere in the IT and software development area, to have sustained growth, strategies must be reoriented, especially as the industry i s being threatened by emerging competitors, such as China, Philippines, Korea, and the Commonwealth of Independent States countries. A recent McKinsey study o f China’s software sector, however, shows that China needs to work on several fronts before i t can truly compete with India (Box 5-3).
110

Box 5-3: C a n China Compete in Information Technology Services? Chinese revenues f rom I T services are barely half of India’s $12.6 bi l l ion a year. A recent study by De Filippo, Hou and Ip (2005) notes that, to move forward in this domain and compete with India, China must first consolidate its highly fragmented industry to gain the size and expertise needed to capture large international projects. Growth i s driven mainly by domestic demand, and most customers are small and mid-sized Chinese enterprises. China’s nascent foreign software-outsourcing business accounts for just 10 percent o f the industry’s total revenue, compared with around 70 percent for India. In addition, despite lower costs, operating margins in Chinese software services companies average only 7 percent, compared with 11 percent at similar companies around the world, because many projects are below optimal scale, suppliers often compete on price and collecting payments can be problematic.
To compete effectively in global outsourcing, therefore, China’s software industry must consolidate.’ The top ten I T - services companies have only about a 20 percent share o f the market, compared with the 45 percent commanded by India’s top ten. Furthermore, China has about 8,000 software services providers; almost three-quarters o f them have fewer than 50 employees, and only five have more than 2,000 employees. India, on the other hand, has fewer than 3,000 software services companies. O f these, at least’ 15 have more than 2,000 workers, and some-including Infosys, Tata Consultancy Services, and Wipro-now have international recognition and global clientele. Fragmentation exacerbates the Chinese industry’s other problems, including weak process controls and product management. Only six o f China’s 30 largest software companies are certified at levels five or four o f the capability- maturity model; in contrast, all the top 30 Indian software companies have achieved these rankings. Chinese software services providers w i l l also have to manage their talent much better. Most do little to develop their employees, and very few use stock options, training programs, or other incentives to build talent. Organizational and operational changes are also needed to protect the intellectual property o f clients.
Source: De Filippo, Hou, and Ip (2005).
Nevertheless, India cannot afford to be complacent about i t s current position in the global I T market. I t s domestic market in particular needs to be developed and catered to effectively to ensure sustained long- term growth and provide benefits to the masses. The experience o f countries, such as China, which have very strong and vibrant domestic markets, should be considered. The Indian industry, however, needs to improve productivity continuously to hold its competitive edge in the global market. Some issues that require constant attention by India’s IT industry include:
0
0
0
Moving up the value chain by developing high-value products through R&D, improving the quality of products and services, and nurturing and generating the high-quality manpower needed for this. Focusing the industry to shift from “software solutions providers” to become manufacturers o f “packaged products.” Marketing i t s products and building brand equity to position further the “India” brand name abroad. This requires strengthening marketing channels with strategic global links, expanding the focus outside the United States to emerging markets in Asia, Pacific, Japan, and so on. Encouraging industry associations, such as NASSCOM and the Manufacturers’ Association o f Information Technology, to provide support to SMEs in their export efforts, because these enterprises do not have the requisite expertise and resources required for aggressive marketing. Promoting the development o f software applications for the domestic market in different Indian languages to meet local requirements (India, Planning Commission 2002~).
0
0
Enhance the reach of IT to the population at large. As a result o f the IT explosion and the impressive progress in the telecommunications and ICT sector showcased above, the usage o f ICTs has, not surprisingly, been rising in the country. But this increase has mainly been concentrated in urban areas in the country, not so much rural. Village information kiosks, however, are gradually enhancing the reach o f ICTs to a larger section o f the population (Box 5-4).
111

Box 5-4: Bridging the Digital Divide: Village Internet Kiosks in Tamil Nadu IIT-Madras i s pioneering an approach in Tamil Nadu that i s turning over the job of connecting rural India to the Internet to profit-minded entrepreneurs. This new approach seeks to bridge the “digital divide” with a national network o f owner-operated computer centers with Internet access-part cybercafes, part digital town halls-that earn income from a broad range o f small transactions. I t takes advantage o f low-cost wireless technology that eliminates the need for telephone lines. Central to the effort i s the “wireless local loop” (WLL), which provides cheap, relatively fast Internet connections to fiber-optic cables as far as 18 miles away. Although many villages still lack phone service, India’s fiber-optic network i s sufficiently well developed to provide wireless coverage for up to 85 percent o f the country. An independent company that spun o f f from this I IT, n-Logue Communications, identifies promising kiosk owners, trains them, and provides equipment-computer, printer, battery backup, and wireless Internet antenna-for about $1,000. N-Logue helps the owners arrange financing, which i s then paid o f f with revenue from the kiosks. The company makes its money from hourly connection fees. So far, n-Logue has set up more than 500 kiosks in Tamil Nadu and other states and has plans for another 10,000 in the near future.
Source: Excerpted from Lancaster (2003).
Ensuring the sharing of ICT benefits among all w i l l be critical to boost India’s growth and poverty reduction efforts. This requires creation o f an enabling environment for ICTs. Critical factors include increased (a) access to ICTs (through widespread availability o f telephones, PCs, and mobile telephones and connectivity to the Intemet), (b) enhancement o f ICT literacy and s k i l l s in the population, and (c) development o f ICT applications providing much-needed services to citizens:
0 Access. Due to high tariff levels (3040 percent o f basis cost o f an assembled PC), the cost o f PCs and other hardware in India i s significantly higher than in other countries. For example, a PC in India costs about 24 months o f average per capita income, compared with 4 months in China and 12 days in the United States! But the rapid growth o f software exports has attracted thousands o f people into the IT industry and has stimulated demand for computers. Sales o f computers rose by 9.6 percent to 1.76 mill ion in 2001. Import liberalization and the entry o f foreign manufacturers have transformed this industry, which, until five years ago, was tiny and dominated by a few Indian manufacturers. The ease of importing components has nurtured hundreds o f unbranded assemblers, which command 62 percent o f the market. Only three major Indian brands remain. H C L sold 151,000 computers in 2001, Wipro sold 65,000, and Zenith sold 64,000. Among foreign manufacturers, Compaq (147,000 units sold in 2001), Hewlett Packard (84,000 units), IBM (72,000 units), Del l (35,000 units), and Acer (18,000 units) have significant presence. After their recent merger, Compaq and Hewlett Packard have become the largest branded supplier (EIU 2003a). Although these developments are laudable, steps need to be taken to increase the reach o f ICTs to the vast portion o f the Indian population that i s currently unserved through measures such as reducing tariffs and promoting the use o f ICTs for domestic needs. ZCT literacy and skil ls. These s k i l l s are critical to ensuring that people can derive benefits from the IT revolution. Although opportunities exist for acquiring the s k i l l s in urban areas (through govemment- sponsored programs to connect schools, private schools, and training institutes), the situation in rural areas i s very different. Illiteracy; lack o f access to ICT infrastructure and, where available, high cost of access; and lack o f content prevent large rural populations from using ICTs. But some innovative technologies, such as Simputer (Simple Computer, a low-cost altemative to PCs) and corDECT (wireless access system integrating voice and Intemet service^),^' can help to raise awareness o f the potential o f ICTs for rural areas.
0
51 T h e key to bridging the digital divide i s to have shared devices that permit simple and natural user interfaces based on sight, touch, and audio.
112
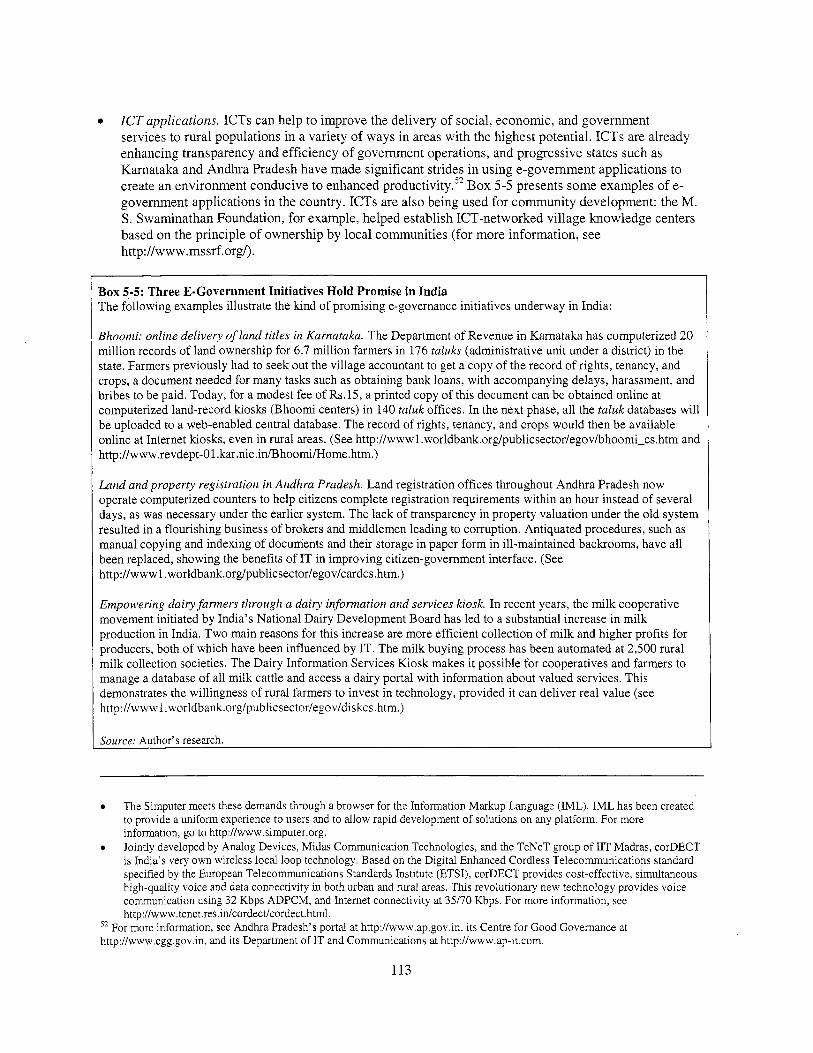
0 ZCT applications. ICTs can help t o improve the delivery of social, economic, and government services t o ru ra l populations in a variety o f ways in areas w i t h the highest potential. ICTs are already enhancing transparency and eff iciency o f government operations, and progressive states such as Karnataka and Andhra Pradesh have made significant strides in using e-government applications to create an environment conducive to enhanced p r o d ~ c t i v i t y . ~ ~ B o x 5-5 presents some examples of e- government applications in the country. ICTs are also being used for community development: the M. S. Swaminathan Foundation, for example, helped establish ICT-networked vi l lage knowledge centers based o n the pr inciple o f ownership by local communities (for more information, see http ://w w w .mssrf. orgl) .
Box 5-5: Three E-Government Initiatives Hold Promise in India The following examples illustrate the kind o f promising e-governance initiatives underway in India:
Bhoomi: online delivery of land titles in Karnataka. The Department o f Revenue in Karnataka has computerized 20 mil l ion records o f land ownership for 6.7 million farmers in 176 taluks (administrative unit under a district) in the state. Farmers previously had to seek out the village accountant to get a copy o f the record o f rights, tenancy, and crops, a document needed for many tasks such as obtaining bank loans, with accompanying delays, harassment, and bribes to be paid. Today, for a modest fee o f Rs. 15, a printed copy o f this document can be obtained online at computerized land-record kiosks (Bhoomi centers) in 140 taluk offices. In the next phase, al l the taluk databases w i l l be uploaded to a web-enabled central database. The record o f rights, tenancy, and crops would then be available online at Internet kiosks, even in rural areas. (See http://www 1 .worldbank.org/publicsector/egov/bhoomi-cs.htm and http://www .revdept-0 1 .kar.nic .in43 hoomi/Home.htm.)
Land and property registration in Andhra Pradesh. Land registration offices throughout Andhra Pradesh now operate computerized counters to help citizens complete registration requirements within an hour instead o f several days, as was necessary under the earlier system. The lack o f transparency in property valuation under the old system resulted in a flourishing business of brokers and middlemen leading to corruption. Antiquated procedures, such as manual copying and indexing o f documents and their storage in paper form in ill-maintained backrooms, have all been replaced, showing the benefits o f I T in improving citizen-government interface. (See http://www 1 .worldbank.org/publicsector/egov/cardcs.htm.)
Empowering dairy farmers through a dairy information and services kiosk. In recent years, the milk cooperative movement initiated by India’s National Dairy Development Board has led to a substantial increase in milk production in India. Two main reasons for this increase are more efficient collection o f milk and higher profits for producers, both of which have been influenced by IT. The milk buying process has been automated at 2,500 rural milk collection societies. The Dairy Information Services Kiosk makes i t possible for cooperatives and farmers to manage a database o f all milk cattle and access a dairy portal with information about valued services. This demonstrates the willingness o f rural farmers to invest in technology, provided i t can deliver real value (see http://www1. worldbank.org/publicsector/egov/diskcs.htm.)
I Source: Author’s research.
T h e Simputer meets these demands through a browser for the Information Markup Language (IML). IML has been created to provide a uniform experience to users and to allow rapid development of solutions on any platform. For more information, go to http://www.simputer.org. Jointly developed by Analog Devices, Midas Communication Technologies, and the TeNeT group of I IT Madras, corDECT i s India’s very own wireless local loop technology. Based on the Digital Enhanced Cordless Telecommunications standard specified by the European Telecommunications Standards Institute (ETSI), corDECT provides cost-effective, simultaneous high-quality voice and data connectivity in both urban and rural areas. T h l s revolutionary new technology provides voice communication using 32 Kbps ADPCM, and Intemet connectivity at 35/70 Kbps. For more information, see http://www.tenet.res.inkordect/cordect.html.
52 For more information, see Andhra Pradesh’s portal at http://www.ap.gov.in, i t s Centre for Good Governance at http://www.cgg.gov.in, and i t s Department o f IT and Communications at http://www.ap-it.com.
113

Increase ZCT applications. Other noteworthy examples o f ICT applications in India include the following:
Agricultural value chains and extension services that link farmers with end-market suppliers to increase value by better anticipating consumer demands and also raise upstream earnings. The “E- chaupal movement,” for example, i s a program initiated by ITC, a private company that uses electronic kiosks to source agrocommodities across 18,000 villages in the country, reaching 1.8 mi l l ion farmers. The electronic kiosks installed in villages enable a virtual aggregation o f poor farmers’ demand and supply needs by linking them to neighboring village agromarkets and providing them real-time information on prices. I t thus connects rural farmers in order to procure produce such as soya, coffee, and prawns, allowing farmers to obtain information on market prices and good farming practices, place orders for inputs such as seeds and fertilizers, and negotiate the sale of their produce directly wi th ITC (for more information, see http://www.echoupal.coddefault.asp). Land titling systems that link rural landholders to a transparent system for verifying and updating tamper-proof land records. These are then used b y banks, courts, private organizations, ISPs, and development program formulation. An example i s Bhoomi (Box 5-5). Education and health management facilities that link rural students and patients with relevant information and techniques. An example i s allowing village health workers to interact online wi th expert systems to improve primary care. Drishtee, a private initiative to scale up Gyandoot-type rural information kiosks, i s an effort in this direction, connecting rural citizens wi th government and private service providers, which allows citizens to send complaints to government regarding services such as health and water and provides computer education and e-health services (for more information, see http://www.drishtee.com/). In less than two years, Drishtee has successfully demonstrated i t s concept in more than 300 kiosks across six Indian states. Other types of information systems that empower the poor, for instance, systems that allow demand- driven learning f rom rural communities regarding what types o f information and ICT initiatives are most needed to increase standards o f living to ensure that initiatives are not supply centered. Another example i s a system allowing local information retrieval to improve benchmarking and thereby to spur upgrading in the level and quality o f infrastructure services, such as water supply and sanitation, local transport, and electricity.
B o x 5-6 presents some additional notable ICT initiatives in India.
Box 5-6: Information Communications Technology Efforts Expand in India A number of notable ICT initiatives are now underway in India:
In an endeavor to bridge the digital divide, Kerala embarked on the Akshaya project in November 2002, which addresses three key issues in I T dissemination to the masses: access, content, and sk i l ls . The aim o f the project i s to generate and distribute locally relevant content, improve public delivery of services, and catalyze the I T industry in the state. The plan i s to develop 6,000 information centers, provide 30,000 employment opportunities, and create investment opportunities. Sustainable Access in Rural India i s a demonstration project set up with help from Harvard and the Massachusetts Institute of Technology and financed in part by India’s ICICI Bank. Situated in the Madurai district of Tamil Nadu, the project has so far set up 40 kiosks in rural villages. The “Hole in the Wall” experiment conducted by the NIIT has shown that semiliterate poor children can quickly teach themselves the rudiments of computers and Internet. By installing an unmanned PC in a local slum, i t was proven that children can learn the basics of ICT literacy without the help of instructors. This shows the potential for enhancing literacy by installing Internet-enabled PCs in such areas with occasional guidance from instructors. The development of Simputer, as mentioned earlier, i s yet another example of such research. In the “Rural Reach Program,” being conducted by Infosys, ICT professionals and educators visit rural schools and help students from grades 5 to 10 to become familiar with technology. Another program i s “Catch Them Young,” which provides basic knowledge of software development and the ICT industry to young students. Infosys’ “Train the Trainer” workshops are conducted in association with eminent universities in various cities with Infosys development centers. The primary objective i s to have active industry-academy interaction and
114

I
keep academia updated on the latest trends in IT . The company i s conducting these programs in most o f i t s development centers across India: in Bangalore, Chennai, Mysore, Bhubaneshwar, Hyderabad, Mohali, Mangalore, and Pune.
[n addition, the number of ICT pilot projects i s growing. Examples include the following: Franchise model computer projects or kiosks (Gyandoot) in the state o f Madhya Pradesh, which generates revenue and i s expected to become independent o f state funding. Swayam Krishi Sangam smart card project, which uses ICTs to reduce the cost o f credit. Computerization of the Mandal Revenue Offices in the State o f Andhra Pradesh. India Health Care Project initiated by CMC Limited, which i s intended to improve the effectiveness o f health prevention programs by using computers, communication technologies, and personal digital assistants for data collection in rural healthcare delivery systems in Andhra Pradesh. Seelampur project o f Datamation, which entails putting ICTs into the hands o f Muslim women in a slum area in Delhi and directly linking the use o f ICTs to alleviation o f their poverty. A number o f schemes to use ICTs in education (Indira Soochna Shakti, empowering a quarter mil l ion schoolgirls through ICTs), bicycle-based connectivity in rural West Bengal, mobile classrooms through IT buses in rural Pune, and the Project Shiksha-Computer Literacy, which are intended to accelerate computer literacy by providing instruction in software solutions, comprehensive training for teachers and students, IT curriculum development, and scholarships for teachers and students across India. Use of ICT for education and e-commerce, as in “Empowering the Poor: A Pilot ICT Program for the Rural Areas o f Pune District,” whose objectives are to promote e-literacy and I T education and develop e-commerce opportunities. Handheld computers that enable auxiliary nurse-midwives in Andhra Pradesh to eliminate redundant paperwork and data entry, freeing time to deliver health care to poor people. Nurse-midwives provide most health services in the state’s vast rural areas; each serves about 5,000 people, typically across multiple villages and hamlets. They administer immunizations, offer advice on family planning, educate people on mother-child health programs, and collect data on birth and immunization rates. They usually spend 15-20 days a month collecting and registering data. But with handheld computers, they can cut that time by up to 40 percent, increasing the impact and reach o f limited resources.
Sources: World Bank 2002e; Lancaster 2003; I IT n.d.; Hole in the Wall Education Ltd. 2003; author’s e-mail correspondence with Infosys (October 2003); Akshaya (http://www.akshaya,net); http://Gyandoot.nic.in; and intemal Bank documents.
Enhance rural connectivity for development. India’s economic development i s predicated on India’s rural development, because around 700 mill ion Indians l ive in rural India in 600,000 villages. The essential needs o f the villages today are many and include water, power, road, sanitation, healthcare, education, and sustainable employment generation opportunities. Lack o f these services has resulted in lack o f economic opportunities in rural India, which has burdened the population with low incomes and significant illiteracy. The private sector has neglected rural markets, because o f a market failure in coordinating the investments required for basic infrastructure and provision o f services.
Two promising models, however, have been proposed, but not yet implemented, for rural economic development: President A. P. J. Kalam’ s initiative Providing Urban Amenities in Rural Areas (PURA) and the Rural Infrastructure and Services Commons model (RISC) (Box 5-7). Their goal i s to raise awareness and get buy-in from policy makers to begin pilots allowing market-based solutions to issues o f rural connectivity and rural development. These initiatives show what i s possible; i t i s hoped that successful pilots wi l l lead to rapid scale-up.
115

Box 5-7: Ushering in Rural Development through Connectivity: The P U R A and RISC Models
Providing Urban Amenities in Rural Areas (PURA). President A. P. J. Kalam’s vision for development o f rural India zonsists o f empowering rural people by providing them with four forms o f connectivity:
Physical connectivity, by providing good quality roads in rural areas for movement o f people and goods as well as for access to schools, health centers, farming areas, markets, and so on. With 600,000 villages, the means to physical connectivity i s to organize villages in clusters o f 10 or more. A r ing road would provide physical connectivity to these clusters, which would become loci o f economic activity by reducing transactions costs. Electronic connectivity, through telecommunications by providing reliable and high-quality telecom, Internet and I T services. Electronic connectivity w i l l be useful in providing services such as tele-education for farmers and villagers, village Internet kiosks, public call offices, telemedicine, e-market, e-governance, e-commerce, and so on. Knowledge connectivity, through education by developing educational and training institutions at these clusters to provide vocational training for farmers, artisans, and craftsmen as well as entrepreneurship programs. Economic connectivity, in which integration o f the three preceding forms o f connectivity would lead to economic activity that would help villagers maximize their economic potential by starting enterprises with the help o f banks, microcredits, and marketing their products.
0
In his vision, PURA i s an economically sustainable business proposition managed by local entrepreneurs and consumers. The government’s role i s largely supportive in providing initial economic support and finding the right structure to manage and maintain the village clusters.
Rural Infrastructure and Services Commons model (RISC). The RISC model recognizes an “ecological” approach, that is, if one creates a sufficiently r ich environment in a location, sustainable economic activity w i l l evolve. I t also recognizes that India’s 600,000 villages have very poor infrastructure, very low rural per capita incomes, and severely limited resources to provide infrastructure to every village. RISC i s a strategy to initiate rural economic development through a modular, scalable, low-risk solution that recognizes that investable resources are severely limited. RISC i s based on triage: i t concentrates infrastructure investments (private and public) in specific locations that are within “bicycle commute” o f about 100,000 people (or 100 villages) to create a standardized infrastructure platform. A wide range of services provided by public and private sector firms can be colocated on this platform. Market forces w i l l determine the services provided by commercial firms and w i l l be largely supported by user fees, which in turn w i l l support the cost o f infrastructure. The participation o f the government w i l l be critical, but not primary.
RISC conceptually and operationally has two levels: the lower infrastructure level (I-level) consists o f power, broadband telecommunications, and physical plant (building, water, air conditioning, sanitation, and security). The user services level (S-level) consists of services that are relevant to rural economic activity, such as market making, financial intermediation, education and library, health, social services, governmental services, and so on. The I-level provides a reliable, standardized, competitively priced infrastructure platform achieved by coordinated and cooperative actions o f firms specializing in the component activities. A variety o f firms providing user services are colocated on the S-level. The presence o f the I-level reduces S-level costs and, therefore, the prices for users. The presence o f the variety of different service providers obtains economies o f scope and agglomeration.
RISC i s a way to bootstrap limited resources to initiate rural economic development by inviting the private sector to invest in profitable ventures in rural areas. As prosperity increases, the rural areas themselves w i l l have a surplus to plowed back in. In a few years, the transportation network as envisioned by PURA wi l l evolve organically and make President Kalam’s Vision 2020 a reality. In other words, implementation o f RISC i s only the f i rs t step in the task o f implementing PURA.
Sources: Details of PURA are included in President Kalam’s Address at the CEO’s Summit on September 26, 2003 (http://presidentofindia.nic.in/scripts/sllatestl .jsp?id=163) as well as in h s Convocation Address at Jamia Millia Islamia, New Delhi, August 30,2004 (http://jmi.nic.in/Notices~otices04/convocation~address.htm). The RISC model has been jointly developed by Vinod Khosla at Kleiner, Perkins, Caufield, and Byers, and by Atanu Dey at Deeshaa Ventures and Netcore Solutions. For more information, see http://www.deeshaa.com. Reuben Abraham, Columbia University, and Atanu Dey undertook the RISCPURA comparison.
116
Summary of Issues and Recommendations
As i s amply demonstrated in this chapter, India has made impressive progress in the IT domain, and i t s IT industries, and IT-enabled services have become one o f the most globalized and dynamic industries and services in the world. At the same time, India also needs to boost the use o f ICTs throughout i t s economy. To reap full benefits o f ICTs (new and traditional) and equitably extend reach, India needs to address national and local dimensions of ICT infrastructure and connectivity (access, content, and language). Some critical policy measures include the following:
0
0
0
0
0
0
0
0
0
0
0
Enhance regulatory certainty and efficiency to facilitate new services that w i l l enable India to reap the benefits o f the convergence o f existing and new technologies and enable the sector to contribute more to economic growth. Boost ICT penetration by resolving regulatory issues in communications and reducing and rationalizing tariff structures on hardware and software. Increase the use o f ICTs as a competitive tool to improve the efficiency o f production and marketing in areas such as supply chain management, logistics, information sharing on what goods are selling in the markets, responding to rapidly changing market needs, and so on. Move up the value chain in IT by developing high-value products through R&D, improving the quality o f products and services, marketing products and building brand equity to position the “India” brand name further, including by strengthening marketing channels with strategic global links, expanding the focus outside the United States to emerging markets in Asia, Pacific, Japan, and so on. Provide suitable incentives to promote IT applications for the domestic economy, as the focus currently seems to be mainly on IT services exports. This includes developing local language content and applications. Put in place suitable human resource development and training initiatives, starting at the primary school and moving on the tertiary levels to meet the expected growth o f IT and other productive sectors o f the economy. Update syllabuses in computer engineering, electronics, and IT in various technical institutions to meet the demands of industry (curriculum in other branches o f engineering should also be broadly based to include I T subjects) Massively enhance ICT literacy and s k i l l s among the population at large through conventional and nonconventional means, so that people can begin to use ICTs to derive benefits, both economically and socially. Create opportunities for local communities to benefit from ICTs by providing support (seed money for local innovation on low-cost and appropriate technologies), enhance private investment in ICT infrastructure, and promote national and international support for rural community-based access. Strengthen partnerships among government agencies, research and academic institutions, private companies, and nongovernmental organizations (NGOs) to ramp up the ICT infrastructure and achieve faster penetration o f ICTs. Further develop and scale up (in joint public-private initiatives where feasible) ICT applications, such as community radio, fixedmobile phones, smart cards, Internet, and satellite television, to bring the benefits o f connectivity to rural communities all across the country and improve the delivery o f services to rural populations. Share successful applications o f ICT, for example, in e-government among different Indian states. This also requires scaling up successful ICT initiatives to bring the benefits o f connectivity to rural communities all across the country. Create a suitable environment for the effective use o f ICTs to permeate the entire economy and lead to flourishing competition and business growth. This calls for the government to continue with the economic reform agenda put in place in the past decade.
117


6. MOVING AHEAD WITH THE KNOWLEDGE ECONOMY IN INDIA
This report, particularly in chapters 2-5, has looked at developments in India regarding the four pillars o f the knowledge economy, highlighted some reforms that have already been accomplished, and outlined some o f the issues on which further reforms should be focused. It underlines the unarguable fact that India has tremendous assets as i t moves to transform itself to a knowledge-based economy. This chapter looks at how India can build on various initiatives that have been put in place in recent years to springboard into the knowledge economy of the twenty-first century.
Indian Initiatives on the Knowledge Economy
The notion o f a knowledge economy i s not new or foreign to India. India’s past achievements in science, philosophy, mathematics, and astronomy reinforce the notion that the country has for millennia been a leading “knowledge society.” In economic terms, India was the world’s largest economy in the f i r s t millennium, producing a third of global GDP (Figure 6-1). B y 1500 its share had declined to 25 percent, as China overtook it and Western Europe’s share began to expand rapidly. India’s share continued to fal l after 1700 due to the collapse of the Moghul Empire, the costs o f adjusting to British governance, and the rapid increase in the share of Western Europe, followed by the spectacular r ise o f the United States. India was a latecomer to the industrial revolution. I t cannot afford to m i s s the knowledge revolution!
Figure 6-1: India: Percentage Share of Global Gross Domestic Product, Years 0-1998 (percent)
40 , 35
30
25
20
15
10
5
0
+Western Europe -e- United States -A- Japan +China +India
Source: Maddison (2001).
In the current knowledge-driven era, India has already developed a profile for the Indian knowledge society (Box 6-1). Broader than a knowledge economy, a knowledge society includes spiritual, social, intellectual, and philosophical knowledge.

Box 6-1: Indian Knowledge Society As noted by a high-level Indian team, the main aim o f an Indian knowledge society i s to use knowledge to drive societal and economic transformation to enrich all. I t has three elements:
0
A learning society that i s committed to innovation A society with the capacity to create, absorb, protect, disseminate, and use knowledge to create economic wealth and societal good A society that uses knowledge through all i t s constituents and endeavors to empower, enrich, and enlighten its people to take an integrated view o f l i fe as a fusion o f mind, body, and spirit.
Source: As presented by a group of senior Indian policy makers and leaders at the “K4D Policy Forum for Brazil, China, and India,” March 22, 2001, Wilton Park, United Kingdom.
In 2000 the Indian Prime Minister laid down a vision for developing India as a knowledge society. Stating that “a knowledge-based society w i l l enable us to leapfrog in finding new and innovative ways to meet the challenges of building a just and equitable social order and seek urgent solutions,” he unveiled a five- point agenda that includes strengthening education for developing a learning society; broadening global networking; encouraging vibrant government-industry-academia interaction in policy making and implementation; leveraging existing competencies in IT, telecom, biotechnology, drug design, financial services, and enterprise-wide management; and building economic and business strategic alliances on capabilities and opportunities.
Taking these on board, India’s Planning Commission developed the report Zndia as Knowledge Superpower: Strategy for Transformation (2001a), which identified three key drivers for the Indian knowledge society for the twenty-first century (Box 6-2).
Box 6-2: Key Drivers for the Indian Knowledge Society Per the Indian Planning Commission report, India as Knowledge Superpower: Strategy for Transformation (2001a), three key drivers exist for the emerging Indian knowledge society: societal transformation for a just and equitable society, wealth generation, and protection o f knowledge, not only generated in research labs, but by communities as traditional knowledge. The report focuses on education as the foundation for the knowledge-driven economy and examines issues related to connectivity, governance, and use o f I T to reduce the “digital divide.” As part o f a strategy to become a knowledge-driven economy, i t recommends a four-tiered approach for increasing employment in the new economy that includes:
I
Creating structures for biotechnology promotion and application Promoting knowledge-based service industries in which India has competitive strengths (such as software and IT) Packaging and marketing traditional knowledge, especially in medicine Improving capacity building in three mutually supportive areas: human resource development, R&D capabilities, and the application o f technologies flowing from innovations.
Source: India, Planning Commission (2001a).
In 2002 India’s President, Dr. A. P. J. Abdul Kalam unveiled Zndia 2020: A Vision for the New Millennium (Kalam and Rajan 2002), which calls for developing an India that i s free from poverty and strong in trade, commerce, and science and technology and that provides health and education to all. For India to join the ranks o f developed nations, i t must invest in i t s people, grow the economy, and create critical infrastructure. India should leverage i t s strengths in the agro-food, engineering, and chemical industries; further globalize i t s service sector; capitalize on i t s vast mineral wealth; and strengthen i t s infrastructure. Tackling issues related to food, agriculture, health care, and service sector development
119

wi l l require an interdisciplinary approach because, as he noted, “for a nation to progress, the golden triangle of R&D laboratories-academia-industry must emerge.”
Building on these premises, the Indian Planning Commission’s Zndia Vision 2020 (2002a) envisages that “by 2020 the people of India w i l l be better educated, healthier, and more prosperous than at any time in i t s long history. India in 2020 would be a nation bustling with energy, entrepreneurship, and innovation.” The report conceives o f India evolving into an information society and knowledge economy built on the foundation o f ICTs. The vision i s predicated on the belief that human resources are the most important determinant o f overall development. The vision document highlights several areas critical to India’s transition to the knowledge economy: (a) creating employment opportunities and raising the level and quality o f education, all the way from abolishing illiteracy to achieving 100 percent enrollment at primary and secondary levels, (b) broadening access to higher education and vocational training through traditional and nontraditional delivery systems, (c) encouraging high-tech science and technology, (d) enhancing India’s expenditures on R&D, (e) improving linkages between technology development and application by fostering close ties between research and business, cf) spurring growth o f Indian IT and biotechnology sectors, and (g) stimulating growth o f manufactured and service exports.
In light o f these initiatives, in 2003, a High-Level Strategic Group (HLSG) was set up comprising leaders from industry, academia, and government to discuss policies that would enable India to optimize the emerging opportunities and see how all stakeholders can work together to advance the country’s effective transition to the knowledge economy and promote knowledge-based industries. The HLSG developed a report, India’s New Opportunity, 2020 (AIMA 2003), that identifies the acceleration o f economic growth and employment o f skilled youth in the next two decades as the key concerns for what i t calls “India Inc.” The HLSG estimates a net workforce shortfall of 32-39 mill ion by 2020 in the developed countries of today. This challenge presents a great opportunity for India in the provision o f remote services. I t i s estimated that by 2020, the contribution of remote services alone w i l l be in the range o f $133-$315 bil l ion of additional revenue flowing into the country and the addition of 10-24 mill ion jobs (direct and indirect). Furthermore, bringing customers into India (medical tourism,53 educational services, and leisure tourism)54 could add another $6-$50 bil l ion in revenues and create an additional 10-48 mil l ion jobs (direct and indirect) by 2020. The HLSG estimates that through the provision o f remote services and the importation of customers, India could enhance i t s annual GDP growth by up to 1.5 percent above current growth rates, most of which (approximately 80-85 percent) would be through remote services. Box 6-3 provides additional information on the recommendations o f t h i s HLSG.
53 According to Dr. Naresh Trehan, executive director and chief cardiovascular surgeon, Escorts Heart Institute and Research Centre, India, the country has great potential as a healthcare center for the world, because healthcare costs are one-tenth to one- seventh the cost in developed countries. India could also become a source o f human capital for nurses and therapists. What i s needed in this domain i s a uniform accreditation system for hospitals, simplification o f procedures for setting up medical schools, provision o f infrastructure for tertiary health care, and enabling o f policy frameworks for research and clinical trials (WEF 2004e). 54 The India Economic Summit 2004 also noted that India i s consistently cited as one o f the top five tourism destinations worldwide. Yet, i t has failed to leverage this strong interest as a means to rebuilding i t s infrastructure, encouraging FDI, and producing nonagricultural employment. More flights, paved roads, clean water, and reliable power would lead to the levels o f tourism spending that developed countries rely on to grow their service sectors. India should look at how i t can make tourism a catalyst for greater infrastructure investment and a source o f future job growth (http://www. w e f o r u m . o r g / s i t e / h o m e p u b l i c . n s f / C o n t e n V I t + 2 0 0 4 ) .
120
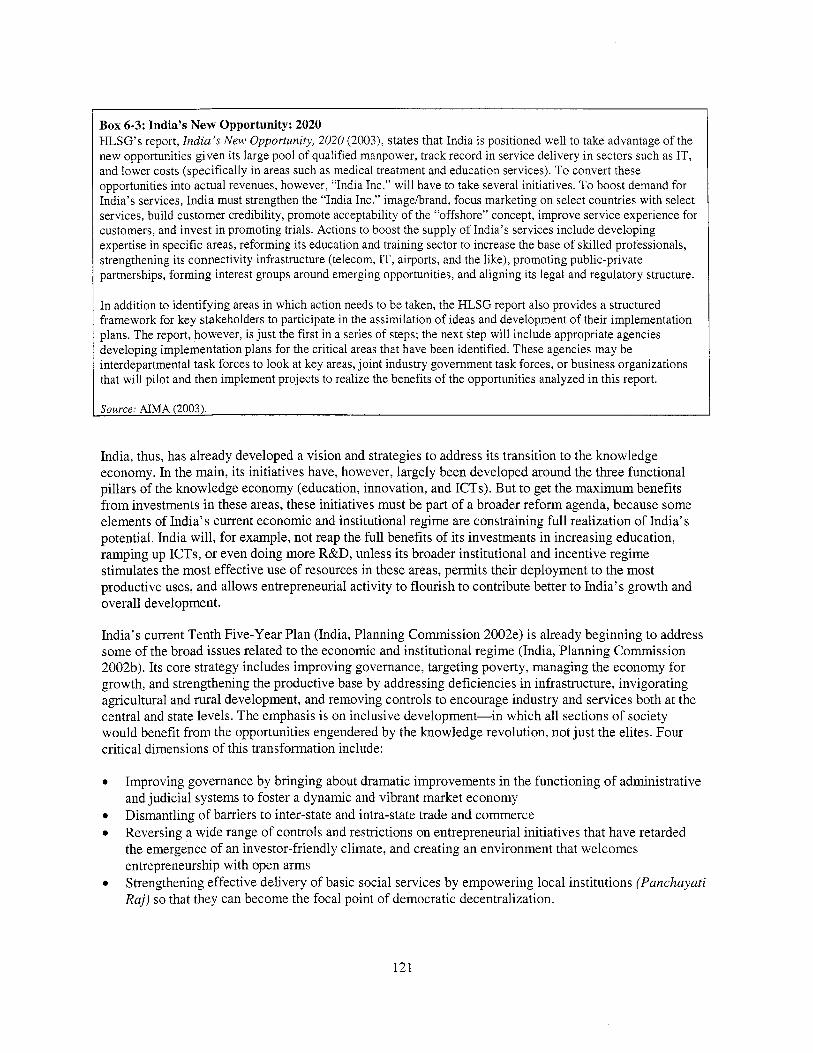
Box 6-3: India’s New Opportunity: 2020 HLSG’s report, India’s New Opportunity, 2020 (2003), states that India i s positioned well to take advantage o f the new opportunities given its large pool of qualified manpower, track record in service delivery in sectors such as IT, and lower costs (specifically in areas such as medical treatment and education services). To convert these opportunities into actual revenues, however, “India Inc.” w i l l have to take several initiatives. To boost demand for India’s services, India must strengthen the “India Inc.” imagebrand, focus marketing on select countries with select services, build customer credibility, promote acceptability o f the “offshore” concept, improve service experience for customers, and invest in promoting trials. Actions to boost the supply o f India’s services include developing expertise in specific areas, reforming its education and training sector to increase the base o f skilled professionals, strengthening i t s connectivity infrastructure (telecom, IT, airports, and the like), promoting public-private partnerships, forming interest groups around emerging opportunities, and aligning i t s legal and regulatory structure.
In addition to identifying areas in which action needs to be taken, the HLSG report also provides a structured framework for key stakeholders to participate in the assimilation o f ideas and development o f their implementation plans. The report, however, i s just the first in a series o f steps; the next step wi l l include appropriate agencies developing implementation plans for the critical areas that have been identified. These agencies may be interdepartmental task forces to look at key areas, joint industry government task forces, or business organizations that w i l l pilot and then implement projects to realize the benefits o f the opportunities analyzed in this report.
Source: AIMA (2003).
India, thus, has already developed a vision and strategies to address its transition to the knowledge economy. In the main, i t s initiatives have, however, largely been developed around the three functional pillars o f the knowledge economy (education, innovation, and ICTs). But to get the maximum benefits from investments in these areas, these initiatives must be part of a broader reform agenda, because some elements o f India’s current economic and institutional regime are constraining full realization of India’s potential. India will, for example, not reap the full benefits o f its investments in increasing education, ramping up ICTs, or even doing more R&D, unless i t s broader institutional and incentive regime stimulates the most effective use of resources in these areas, permits their deployment to the most productive uses, and allows entrepreneurial activity to flourish to contribute better to India’s growth and overall development.
India’s current Tenth Five-Year Plan (India, Planning Commission 2002e) i s already beginning to address some of the broad issues related to the economic and institutional regime (India, Planning Commission 2002b). I t s core strategy includes improving governance, targeting poverty, managing the economy for growth, and strengthening the productive base by addressing deficiencies in infrastructure, invigorating agricultural and rural development, and removing controls to encourage industry and services both at the central and state levels. The emphasis i s on inclusive development-in which all sections o f society would benefit from the opportunities engendered by the knowledge revolution, not just the elites. Four critical dimensions of this transformation include:
0
0
0
Improving governance by bringing about dramatic improvements in the functioning o f administrative and judicial systems to foster a dynamic and vibrant market economy Dismantling o f barriers to inter-state and intra-state trade and commerce Reversing a wide range o f controls and restrictions on entrepreneurial initiatives that have retarded the emergence o f an investor-friendly climate, and creating an environment that welcomes entrepreneurship with open arms Strengthening effective delivery o f basic social services by empowering local institutions (Panchayati Raj) so that they can become the focal point o f democratic decentralization.
0
121

Looking Ahead
I t i s hoped that this report w i l l help stimulate, through a consultative process, a greater sense o f the importance o f the emerging policy agenda on the knowledge economy in India. India’s effective transformation to a knowledge economy calls for i t to act in many different policy domains, deepening, complementing, or reorienting ongoing reforms to use knowledge efficiently and sustaining development in the long term to achieve inclusive growth. India needs to recognize that many policy reforms leading to a knowledge-based economy wi l l not yield results overnight. I t w i l l thus need to make some tough choices in the short term; yet, other reforms w i l l be of a medium- to long-term nature.
I t i s clear, however, that going ahead with such an ambitious agenda in India f i r s t and foremost requires raising massive awareness and consultation among all interested stakeholders in government, the private sector, and civi l society on the need and plans for such a transformation. Creating a shared vision among all parties on ways to accelerate India’s progress toward the knowledge economy i s thus important, as well as commitment on the part o f all stakeholders to stay the course in order to manage such a transition effectively. Effective leadership w i l l be key to articulating this vision, through the involvement o f all stakeholders. I t also requires that the country develop a “virtuous” cycle between growth and the reform process.
Moving to a knowledge economy, however, i s not only about stimulating such a reform agenda from the top. What w i l l be needed i s trial-and-error experimentation on what works in a bottom-up fashion and what does not work in the Indian context as well as scaling up successful bottom-up initiatives. The process requires that India constantly monitor its achievements and adjust i t s strategy in light o f changing conditions.
The challenge o f developing such new governance structures i s not unique to India, but to all countries, including OECD economies. Countries such as Korea, Ireland, or Mexico and emerging economies such as China have become examples of so-called pragmatic agendas, which have placed innovations in governance at the center o f policy making and implementation. In all these cases, national economic crises compelled diverse actors to define and implement a new agenda through explicit or implicit national agreements on goals and mechanisms for moving forward. The crises have also prompted policy makers and private sector leaders to lengthen the time horizon o f the policies adopted. These countries are continuing to work with concerned groups and are balancing the interest of varied stakeholders to shape their transition to the knowledge economy. For example:
In Korea, the main impetus for this transformation and for the development o f a shared national vision came from the private sector. The government i s steadfastly monitoring progress made to date and making rapid and continuous adjustments to i t s overall knowledge strategy in light o f i t s experiences and changing circumstances (Box 6-4). Ireland also exemplifies a successful combination o f top-down and bottom-up policies. I t invested in education and R&D infrastructure in the 1980s, followed by drastic policy changes beginning in 1987. To complement i t s top-down policies, Ireland instituted pragmatic bottom-up programs: regional partnerships to mitigate high unemployment and a program to expand national-supplier linkages from FDI (for more information, see http://www . ida. iehew dendofyear-2003. pdf). China has adopted more o f a top-down approach, but some exemplary initiatives do exist. The most impressive i s in Shanghai, which has developed a coherent strategy that covers all the key policy planks o f the knowledge economy, including 20 well-focused, mutually reinforcing programs. Another i s Shenzhen, which had the first special economic zone open to foreign investments (for more information, see Dahlman and Aubert 2001).
122

0 Mexico i s fo l lowing a two-pronged strategy, which includes undertaking major reforms to create contestable factor markets as wel l as making major advances in education, innovation, enterprise upgrading, and ICT systems (for more information, see Wor ld Bank 2005a).
Box 6-4: Implementing the Republic of Korea’s Knowledge Strategy The Republic of Korea, at the initiative of i t s president launched a national strategy to move to a knowledge-based economy in the wake of the financial and foreign exchange crisis of 1998. The impetus for this came from the private sector-the Maeil Business Newspaper-which concluded in 1996 that an urgent need existed for a more coherent vision of the future o f the Korean economy. The newspaper launched the “Vision Korea Project” as a national campaign in February 1997 and developed the first “Vision Korea Report.” The president’s initiative was led by the Ministry o f Finance and Economy, with intellectual support by the Korean Development Institute, which coordinated the work of a dozen think tanks. A joint World Bank-OECD report provided a framework, outlining concrete steps for reforms in various policy domains. Close monitoring of progress has been important in keeping up with the reform process and identifying areas of inertia or resistance, for example, in the area of education.
Korea’s knowledge strategy of April 2000 evolved into a three-year action plan for five main areas: information infrastructure, human resources, knowledge-based industry, science and technology, and elimination of the “digital divide.” To implement the action plan, five working groups involve 19 ministries and 17 research institutes; the Ministry of Finance and Economy i s coordinating implementation. Every quarter, each ministry submits a self- monitoring report to the Ministry of Finance and Economy, which publishes an integrated quarterly report detailing progress. The mid-term results and adjustments to the plan are sent to the executive director o f the National Economic Advisory Council, which reports on implementation progress and appraises the three-year action plan to i t s advisory members.
1 Source: Dahlman and Aubert (2001).
Taking Action
The knowledge economy i s n o doubt a critical element o f India’s reform agenda. As has been highlighted:
India has already developed a strategic vision o f how knowledge and expertise can be harnessed for the benefit o f all. It also has examples o f states that are making rapid strides in putting in place pragmatic agendas to further growth and competitiveness and reduce poverty. Such successful state- led initiatives should be shared across the country to engage other states in the process o f preparing the bases for the more effective use o f knowledge for development. The Indian government has publicly acknowledged that i t s role in the twenty-first century i s t o remove bottlenecks, both legal and bureaucratic, that are impeding India’s successful transition to the knowledge economy. I t i s focusing on ways to accelerate India’s transition to the knowledge economy b y carrying out economic legislation that wi l l enable the country to have better infrastructure, strengthening property rights and institutions, enhancing social infrastructure in terms o f education and health, protecting knowledge through patent legislation to reap innovation dividends, and using ICTs to meet the needs o f the population at large. The government i s trying to communicate better to the citizens on the need for economic reforms in the various domains, and to be an effective facilitator o f the dialogue o n the knowledge economy in India. In addition, some recent noteworthy initiatives in India are trying to bring together concerned stakeholders to promote India’s transition to the knowledge economy. The HLSG has most recently discussed ways in which different agencies can work together to help India accelerate economic growth and mitigate the unemployment problem that i s forecast for the coming decades; this includes seizing a huge opportunity provided b y a combination o f global developments in industry, trade, and demographics (Box 6-5).
123
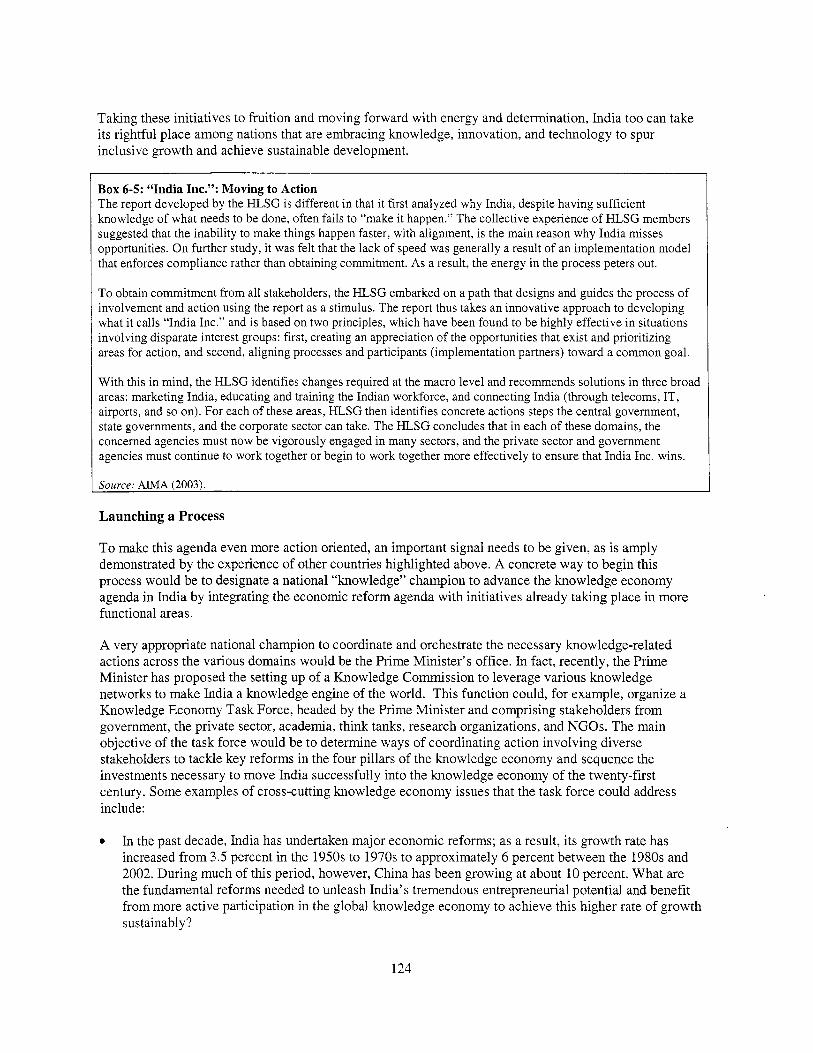
Tak ing these init iat ives t o fruition and mov ing forward with energy and determination, Ind ia too can take i t s rightful place among nations that are embracing knowledge, innovation, and technology t o spur inclusive growth and achieve sustainable development.
Box 6-5: “India Inc.”: Moving to Action The report developed by the HLSG i s different in that it first analyzed why India, despite having sufficient knowledge o f what needs to be done, often fails to “make i t happen.” The collective experience o f HLSG members suggested that the inability to make things happen faster, with alignment, i s the main reason why India misses opportunities. On further study, i t was fel t that the lack o f speed was generally a result o f an implementation model that enforces compliance rather than obtaining commitment. As a result, the energy in the process peters out.
To obtain commitment from al l stakeholders, the HLSG embarked on a path that designs and guides the process o f involvement and action using the report as a stimulus. The report thus takes an innovative approach to developing what i t calls “India Inc.” and i s based on two principles, which have been found to be highly effective in situations involving disparate interest groups: first, creating an appreciation o f the opportunities that exist and prioritizing areas for action, and second, aligning processes and participants (implementation partners) toward a common goal.
With this in mind, the HLSG identifies changes required at the macro level and recommends solutions in three broad areas: marketing India, educating and training the Indian workforce, and connecting India (through telecoms, IT, airports, and so on). For each o f these areas, HLSG then identifies concrete actions steps the central government, state governments, and the corporate sector can take. The HLSG concludes that in each o f these domains, the concerned agencies must now be vigorously engaged in many sectors, and the private sector and government agencies must continue to work together or begin to work together more effectively to ensure that India Inc. wins.
Source: AIMA (2003).
Launching a Process
To make this agenda even more action oriented, an important signal needs to b e given, as i s amply demonstrated by the experience of other countries highl ighted above. A concrete way t o beg in this process would be t o designate a national “knowledge” champion to advance the knowledge economy agenda in Ind ia by integrating the economic re fo rm agenda with init iat ives already taking place in more functional areas.
A very appropriate national champion to coordinate and orchestrate the necessary knowledge-related actions across the various domains wou ld be the Pr ime Minister’s office. In fact, recently, the Pr ime Minister has proposed the setting up of a Knowledge Commission to leverage various knowledge networks t o make Ind ia a knowledge engine of the world. This funct ion could, for example, organize a Knowledge Economy Task Force, headed by the Pr ime Min is te r and comprising stakeholders f r o m government, the private sector, academia, think tanks, research organizations, and NGOs. The ma in objective of the task force wou ld be to determine ways o f coordinating action involving diverse stakeholders to tackle key reforms in the four pi l lars of the knowledge economy and sequence the investments necessary to move Ind ia successfully into the knowledge economy o f the twenty-f irst century. Some examples of cross-cutting knowledge economy issues that the task force cou ld address include:
0 In the past decade, Ind ia has undertaken major economic reforms; as a result, i t s growth rate has increased from 3.5 percent in the 1950s to 1970s to approximately 6 percent between the 1980s and 2002. During much of th i s period, however, China has been growing at about 10 percent. Wha t are the fundamental reforms needed to unleash India’s tremendous entrepreneurial potential and benef i t f r o m more active part icipation in the global knowledge economy to achieve this higher rate o f growth sustainably ?
124

India has the advantage o f a highly skilled human resource base, which has gained world renown. I t also has world-class institutions that train this world-class manpower, but on a limited scale. What would it take to ramp up such institutions even further so that India can become a leader in education and training, not only in IT and software, but also more generally in high-skill areas that can provide greater outsourcing services to the world? An increasing number o f multinational corporations are currently working with Indian f m s to contract and subcontract high-end R&D. How can India become a global leader in innovation in i t s own right, not only in IT-related areas in which it has carved out a global niche, but also in other knowledge-intensive industries, such as pharmaceuticals and biotechnology? India i s a leading exporter o f IT services and software, but has not yet fully harnessed the potential o f ICTs at home to reduce transaction costs and improve efficiency. As it has a large local market and many needs, what w i l l i t take for India to exploit this capability on a larger scale domestically and help the country leapfrog even more rapidly into the knowledge economy o f the twenty-first century?
Dealing with the kinds of illustrative issues highlighted above requires prioritization and working with many different interest groups, which i s not an easy task; thus, some guiding principles for the Knowledge Economy Task Force would include the following:
0 Defining priorities and establishing budgets 0 Adopting systemic, integrated approaches for the different policy planks at all levels o f government 0 Mobilizing state governments, which are key to the Indian economy and i t s modernization
Multiplying experiments and publicizing concrete initiatives that clearly exemplify the move to a knowledge-based economy.
The role o f the Prime Minister’s office would be to put in place a robust mechanism to facilitate, monitor, and scale up successful initiatives.
In sum, India i s well positioned to take advantage o f the knowledge revolution to accelerate growth and competitiveness and improve the welfare o f its citizens and should continue to leverage i t s strengths to become a leader in knowledge creation and use. In the twenty-first century, India w i l l be judged by the extent to which it lays down the appropriate “rules of the game” that w i l l enable i t to marshal i t s human resources, strengths in innovation, and global niches in IT to improve overall economic and social development and transform itself into a knowledge-driven economy. Sustained and integrated implementation o f the various policy measures in these domains would help to reposition India as a significant global economic power, so that it can rightfully take i t s place among the ranks of countries that are harnessing knowledge and technology for their overall economic development and social well-being.
A Final Note
This report presents an outside view o f India’s position on the global scale, recognizes India’s achievements, but sees a tremendous potential that i s yet to be unleashed. What i s needed i s an India-led process of coordination and integration o f the different reforms, combining those in the economic and institutional regime with the many initiatives that are actually being undertaken in more functional areas, as covered in many Indian strategy reports. Consolidating and launching these can only be done through a domestic process of consultation, stakeholder awareness, and buy-in to get backing for the necessary reforms to implement the various actions needed to leverage India’s potential. It i s hoped that this perspective serves as an additional vote o f confidence to help catalyze such an integrated and well- grounded process.
125

Annex 1: India’s Total Factor Productivity Construction: Theoretical Framework
In this total factor productivity decomposition exercise, a neoclassical aggregate production function that accounts for the quality o f labor i s considered. For simplicity, a human-capital augmented version o f the Cobb-Douglas production function along wi th perfect competition and constant returns to scale i s assumed:
where: Y K H L A i s total factor productivity a
i s the level o f aggregate output i s the level o f the capital stock i s the level o f the human capital stock i s the size of the labor force
i s the share o f capital in national income
Taking logs and time derivatives and rearranging leads to the estimate o f growth rate o f total factor productivity with human-capital augmentation:
d - - f - a K - ( l - a ) ( H + i ) Where: 2 represents the growth rate o f variable X.
Fol lowing Woessmann (2000), human capital stock i s specified to have the Mincer specification:
where: r S
rs H = e
i s the market returns to education i s the average years o f schooling.
Data Sources
Real GDP (in constant 1995 U.S. dollars) and labor force figures are taken f rom the Wor ld Bank’s internal database. The capital stock i s constructed using gross capital formation (in constant 1995 U.S. dollars) obtained f rom the Wor ld Bank internal database. The perpetual inventory method i s used w i th an assumed depreciation rate o f 5 percent. T o calculate the init ial value o f the capital stock, the average growth rate o f gross capital formation for the f i r s t f ive years i s used, and the formula i s applied for the sum o f an infinite geometric progressive series.
Estimates for the returns to education are taken f rom Bils and Klenow (2000). For the average years o f schooling, the simple average o f the estimates obtained f rom Barro and Lee (2001) and Cohen and Soto (2001) are used. Note that, given that data for the average years o f schooling are available only on a decade basis, interpolation by growth rates i s used to obtain annual estimates o f the average years o f schooling in order to construct the human capital stock o n an annual basis. The estimate for the labor share in national income for India i s taken f rom Gol l in (2001), whereas that for Ireland i s taken f rom Bemanke and Giirkaynak (2001). The estimate for labor share for India and Ireland are 0.828 and 0.750, respectively. The capital shares were obtained b y taking 1 and subtracting the respective labor shares.
126
Annex 2: Knowledge Assessment Methodology
The Knowledge Assessment Methodology (see www.worldbank.org/kam) i s a user-friendly tool designed by the World Bank Institute to assist client countries in understanding their strengths and weaknesses in terms of their ability to compete in the global knowledge economy. The KAh4 i s designed to proxy a country’s preparedness to compete in the knowledge economy through a series o f relevant and widely available measures: 80 structural and qualitative variables-available for 128 countries-that benchmark how an economy compares with other countries. The KAM helps to identify the problems and opportunities that a country faces and where it may need to focus policy attention or future investments. The unique strength of the knowledge for development methodology i s i t s cross-sector approach, allowing the user to take a holistic view of a wide range o f relevant factors, rather than just focusing on one area.
The 80 variables used serve as proxies for the four areas (pillars) that are critical to the development ,of a knowledge-based economy (economic and institutional regime, education, innovation, and ICTs). Also included in the 80 variables are several measures that track the overall performance o f the economy.
Normalization Procedure for the KAM
The raw data (u) are collected from World Bank datasets and international literature for 80 variables and 128 countries.
Ranks are allocated to countries based on the absolute values (raw data) that describe each and every one of the 80 variables (rank u). Countries with the same performance are allocated the same rank therefore, the rank equals 1 for a country that performs the best among the 128 countries in the sample on a particular variable (that is, it has the highest score), the rank equals 2 for a country that performs second best. and so on.
The number o f countries with a worse rank (Nw) i s calculated for each country.
The following formula i s used to normalize the scores for every country on every variable according to their ranking and in relation to the total number of countries in the sample (Nc) with available data: Normalized (u) = 10*(Nw/Nc).
The above formula allocates a normalized score from 0 to 10 for each o f the 128 countries with available data on the 80 variables. Ten i s the top score for the top performers and 0 the worst for the laggards. The top 10 percent o f performers get a normalized score between 9 and 10, the second best 10 percent get normalized scores between 8 and 9, and so on. As mentioned above, more than one country may be allocated either at the top or bottom o f the normalized scores. The 0-10 scale describes the performance o f each country on each variable, relative to the performance o f the rest o f the country sample.
The KAh4 i s updated about once a year. More information on the most recent version o f the KAM, i t s functionalities, technical notes, data sources, and a user guide are available on the Web site: www. worldbank. orglkam.
127

Annex 3: Knowledge Economy Index for India and Comparator Countries, 1995 and Most Recent Period
I Knowledge I Economic I Information I Economy Index Infrastructure Incentive Regime Innovation Education
Note: The Knowledge Economy Index (KEI) i s the average o f the performance scores o f a country or region in all four knowledge economy pillars: economic incentive regime, education, innovation, and information infrastructure. Source: World Bank, “Knowledge Assessment Methodology,” http://www.worldbank.org/kam.
Korea
Poland
Russia
Brazil
China
India
128
Most 1995 Most 1995 Most 1995 Most 1995 Most 1995 recent recent recent recent recent
7.59 7.60 5.39 6.74 8.11 7.61 7.86 8.11 9.00 7.95
6.70 6.49 5.84 5.15 6.15 6.30 8.22 7.96 6.59 6.54
5.91 5.99 3.34 2.33 7.50 7.89 7.88 7.78 4.91 5.98
5.05 4.49 3.94 4.18 5.02 4.59 5.75 3.85 5.50 5.32
3.80 2.86 2.55 2.29 4.42 3.95 3.74 3.48 4.50 1.71
2.72 2.75 2.91 2.85 3.58 3.34 2.33 2.38 2.06 2.42

Annex 4: Overall Knowledge Economy Scorecards for Brazil, China, Korea, Poland, and Russia, Selected Variables, 1995 and Most Recent Period
Brazi I GDP giov*lh(%) (1 60)
China GDP groMh(%) (7 90)
men Development Index (0.78) (632 48) internet users per 10,000 Development Index (0.75) (822 41) Internet users per 10,000 penpi
(74 80) Computers per 1,000 peo
(486 80) Telephoner pw 1,000 people
(27 60) Computers per 1 ,OD0 peo
(423 20) Telephones p H 1,000 people
(if 8 nontariff barriers (2.00) 111 8 ncntanff barriers (4.00)
Regulslory Qualty (0 26) Regulatory Quslriy (-0 41)
(12.68) Tertiary Enrollment Rule 01 Law (-022) (17 93) Telliary Enrcllment
(107.53) Secondary Enrollm
(87.30) AdM lr iereq rete (% age 15 B
Rule 01 Law (-0 30)
earcherr in RRD I mi l l i i (323 94)
and technicalpurns1 srticle~ Im i l pop. (30.81)
(68 2 9 Secondary Enrollment Researchers in R8D 1 million (583 88)
(90 92) Adun lnerscy rate (% age 15 and abov lentlflc and t e c h n m lournal BI1lCieS I mil w. (9 31 (0 33) Patent applications grented by the USPTO I mil pop (1.02) Patent epplicetions granted by the USPTO 1 mil pop.
Russia Korea GDP growth(%) (6 70) GDP growth(%) (6 40)
(6034 20) Internet users per 10,000 peopl
(551 40) Compderi per 1,000 peop
man DeveiOpmMt Index (0 89) (409 32) internet users per 10,000 peopl man Development Index (0.80)
(66 70) Computers per 1,000 peo le TBrllf 8 nnntsnii barrkrs (6 00) lit1 8 nantarilf barrerS (4.00)
(362.30) Telephones per 1.000 p e w e Regulatory Qusilty (-0 30) (1166.10) Telephones per 1 ,WOpeople Regulatory Qualny (0 86)
(68 37) Terliary Enrollment Rule 01 Law (-0.78) (82.03) Tertiary Enrollment Rule of Law (0 88)
(91.96) Seccndaiy Eniclm earchers in R8D I million (3492 94) (94 17) Secondary Enrollm esearchert n R8D I milion (2662 39)
(99.59) Adut lleracy rsle (%age 15 and 9 !tic and technical journal articles I mll POP. (106.99) (97 90) Adun litwocy rate (% age 15 an andtechnicaijournalsll~cler lmilpop (143 19) (1 41) Patent apphCstlOnE grsnted by the USPTO I mil pop (86 25) Patent apphcstlons granted by the USPTO /mil pop
Poland GDP groMh[%) (3 50)
(2324 M) Internet users per 10,000 p e o p l m f i n i a n Development lwex (0 65)
(1 05 60) Computers per 1,000 pec
(769 60) Telephones per 1.000 people
in 8 rmntsrili barriers (6 00)
Regulatory QusIRy (0.67)
(56 50) Tertiary Enrollment Rule c i Law (0 6 9
(1 01 27) Secondary Enrollm esearchers n R8D lmillion (1 474 59)
(i 00 00) Adult ilteracy rate [% age 15 and a b O v e ) ~ S c i e n t i I o and technical puma1 srticlef I mil pap (1 17 OD) (0 50) Patent eppl~cet~olls granted by the USPTO I mtl POP
- most recent
1995 - - - -
Note: Each o f the 80 variables in the K A M i s normalized on a scale o f 0 to 10. The fuller the scorecard, the better poised a country i s to embrace the knowledge economy. But an economy should not necessarily aim for a perfect score o f 10 on all variables. This i s because the scorecards may be shaped by the particular structural characteristics o f an economy or by trade-offs that characterize different development strategies. Values in parentheses denote actual values for the particular country for the most recent period for which data are available. Source: Wor ld Bank, “Knowledge Assessment Methodology,” http://www.worldbank.org/kam.
129

Annex 5: Data for the Scorecards for India, Brazil, and China, 1995 and Most Recent Period
India Brazil China
(actual/nonnalized)* (actualhormalized) * (actualhomalized) *
most Variable most recent 1995 recent 1995 most recent (1995) Average annual GDP growth (percent)
Human Development Index
Tariff & nontariff barriers
Regulatory quality
Rule of law
Researchers in R&D per million people
Scientific and technical joumal articles per million people
Patent applications granted by USPTO per million people
Adult literacy rate (percent age 15 and above)
Secondary enrollment
Tertiary enrollment
Telephones per 1,000 people (mainlines and mobiles)
Computers per 1,000 people
Intemet users per 10,000 people
5.4018.66
0.6012.30
2.0010.00
-0.3413.54
0.0715.20
98.8512.00
9.2314.09
0.3314.64
61.0311.42
48.4712.50
10.5813.07
7 l.OOl2.03
7.201 1.58
174.8612.58
6.6018.98
0.5512.1 1
2 .oo/o. 00
-0.1313.39
-0.0115.16
146.0012.45
9.3614.17
0.04l3.39
53.3011.43
48.8013.05
6.5812.66
13.0012.03
1.2911.33
3.0013.91
1.60/1.57
0.7815.40
4.0011.75
0.2615.67
-0.3014.41
323.9413.56
30.6115.51
1.0216.00
87.30/4.O9
107.5318.83
17.9314.33
486.8015.86
74.8015.25
822.4115.39
3.2013.54
0.7415.12
4.0013.44
0.1314.96
-0.2414.1 3
168.0012.87
19.6515.04
0.4415.87
83.2014.13
5 5,6013.5 9
12.9013.83
93.0014.77
17.3315.50
11.0015.70
7.90j9.69
0.7514.21
2.0010.00
-0.41l3.07
-0.2214.57
5 83.8814.56
9.3 114.17
0.3314.55
90.9214.65
68.2513.28
12.6813.31
423.2015.3 1
27.6013.58
632.4814.61
9.9019.84
0.6813.41
2.0010.00
-0.lOl3.70
-0.4313.17
464.0014.47
5.8 113.70
0.0513.67
80.8013.57
65.8014.77
5.3012.1 1
36.0013.05
2.2712.08
0. oo/o. 00
* Actual valuelnormalized values are for the group comprising all 128 countries in the database. Notes: Average annual GDP growth (most recent) i s the average annual GDP growth for the period 1998-2002. Average annual GDP growth (1995) i s the average annual GDP growth for the period 1993-97. Source: World Bank. “Knowledge Assessment Methodology,” http:l/www.worldbank.org/kam.
130

Annex 6: Economic and Institutional Regime: Scorecards for Comparator Countries, Selected Variables, Most Recent Period
B razi I Gross C~pRal Formation (21 20)
China Gross Captal Formetlon (39 30)
(80 00) Press freed neral GOY? budget balance as % 01 GDP (.2.50) (36 00) Press freedo neral Govl budget balance 8s % of GDP (-3 80)
(1 48 00) DomeEtic credt to plvate sector (% Of GDP)
Trade 8 s % 01 GDP (54 77) (34 60) Domedic credd to private sector (% of GDP)
Trade as % of GDP (29 41)
(5.30) LOCII~ compettion (5 20) Local competnlon Tariff 8 norhariff barrier$ (4 00)
(33 00) ExpoRs 01 goods and services as % of G ellectual Property 1s well protected (3 40) (I 5 50) Exports of p o d s and ServiCeS as % of G llectusl PropeRy IS weil protected (3 60)
(3 70) Soundness of banks (6 20) Soundness of banks
Russia Gross Capdal Formation (21.501
Korea Gross C8pdaI Formation (31 00)
(67 00) press freed nersl G o d budget balance as % of GDP (I 70) (29 00) Press freed neial Govl budgel balance as % 01 GDP (0 30)
Trade as % of GDP (58 67) (1 03 80) Domedic credt I o p w d e sector (%of GDP)
Trade as % of GDP (78 59) (20 90) Domed~c credd to privde sector (% 01 GDP)
(4 00) Local competdion Tariff 8 nortariff barriers (6 00) (5 30) Local compettion Tariff 8 nontarin barriers (4 00)
(31 70) Exports of goods and Serwes BE % o i G llectual Property IS well prdected (2 30) (3820) Expods of goods and ServlCeS as % of G ellectual Propetty Is well protected (4 50)
(3 80) Soundness of banks (4 70) Soundness of banks
Poland Gross Caplal Formation (21 70)
(1 9 00) Press freedom h G e n e r d Gwt budget bsboce 8s %of GDP (-4.90)
(29 00) Domedic credn to Private sector (% 01 GDP)
Trade as %of GDP (59 45)
(4 80) Local competlion Tariff 8 norharill barriers (6 00)
(21 00) Expotts of mods and Servbes as % of GDP Property IS well protected (3 50)
(4.90) Soundness of banks
Note: Each o f the 80 variables in the KAM i s normalized on a scale of 0 to 10. The fuller the scorecard, the better poised a country i s to embrace the knowledge economy. But an economy should not necessarily aim for a perfect score o f 10 on all variables. T h ~ s i s because the scorecards may be shaped by the particular structural characteristics of an economy or by trade-offs that characterize different development strategies. Values in parentheses denote actual values for the particular country for the most recent period for which data are available. Source: World Bank, “Knowledge Assessment Methodology,” http://www.worldbank.org/kam.
131

Annex 7: Governance Data for India
a. Governance Indicators for India: 1998 and 2002
Percentile Estimate Standard No. surveys Govemance Indicator Year Rank (0-100) (-2.5 to + 2.5) Deviation and polls
Voice and accountability 2002 1998
Political stability 2002 1998
Government 2002 effectiveness 1998 Regulatory quality 2002
1998 Rule o f law 2002
1998 Control of corruption 2002
1998
60.6 59.2 22.2 35.2 54.1 52.5 43.8 41.8 57.2 67.0 49.5 60.1
+0.38 +0.26 -0.84 -0.34 -0.13 -0.13 -0.34 -0.08 +0.07 +0.21 -0.25 -0.17
0.17 0.23 0.20 0.24 0.15 0.20 0.17 0.21 0.13 0.17 0.15 0.16
10 6 9 7 9 8 8 7
13 11 10 10
b. Governance Indicators for India and Regional Average, 2002
Estimate Regional Percentile (-2.5 to + Standard No. surveys Average
Governance Indicator Year Rank (0-1 00) 2.5) Deviation and polls (percent) Voice and accountability 2002 60.6 +0.38 0.17 10 29.6
Political stability 2002 22.2 -0.84 0.20 9 32.4
Govemment effectiveness 2002 54.1 -0.13 0.15 9 48.1
Regulatory quality 2002 43.8 -0.34 0.17 8 35.3
Rule o f law 2002 57.2 +0.07 0.13 13 42.1
Control o f corruption 2002 49.5 -0.25 0.15 10 41.5
c. Governance Indicators for India and Income Category Average, 2002
Income Estimate Category
(percent) Percentile (-2.5 to + Standard No. surveys Avg.
Governance Indicator Year Rank (0-1 00) 2.5) Deviation and polls Voice and accountability 2002 60.6 +0.38 0.17 10 27.9 Political stability 2002 22.2 -0.84 0.20 9 28.6 Govemment effectiveness 2002 54.1 -0.13 0.15 9 24.6
Regulatory quality 2002 43.8 -0.34 0.17 8 25.1 Rule o f law 2002 57.2 +0.07 0.13 13 24.9
Control o f corruption 2002 49.5 -0.25 0.15 10 25.5 Source: Kaufmann, Kraay, and Mastruzzi (2003).
132

Annex 8: Various Costs of Doing Business in India, 2004
~~
a. Starting a Business (2004)
The challenges o f launching a business in India are shown below through four measures: procedures required to establish a business, the associated time and cost, and the minimum capital requirement.
Indicator India Regional Average OECD Average Procedures (number) 11 9 6 Time (days) Cost (percent gross national income [GNI] per capita) Minimum capital (percent of income per capita)
89 49.5
0.0
46 45.4
0.0
25 8
44.1
b. Hiring and Firing Workers (2004)
The difficulties that employers in India face in hiring and firing workers are shown below. Three indexes measure how difficult i t i s to hire a new worker, how rigid the regulations are on working hours, and how difficult it i s to dismiss a redundant worker. Conditions covered by the indexes include availability o f part-time and fixed-term contracts, working time requirements, minimum wage laws, and minimum conditions o f employment. Each index assigns values between 0 and 100, with higher values representing more r igid regulations. The overall Rigidity o f Employment Index i s an average o f the three indexes. Firing costs are calculated on the basis o f (a) the number o f weeks’ worth o f salary in severance, (b) notification, and (c) penalties that must be paid to dismiss a worker. Indicator India Regional Average OECD Average Difficulty o f Hir ing Index 33 37 26.2 Rigidity o f Hours Index 20 Diff iculty o f Firing Index 90
Firing Costs (weeks of wages) Rigidity o f Employment Index 48
79
36.7 50 53.3 26.8 42.3 34.4 84.7 40.4
c. Registering Property (2004)
The ease with which businesses can secure rights to property i s measured below using the following indicators: the number o f procedures necessary to transfer a property title from the seller to the buyer, and the time and the costs as a percentage o f the property value. Indicator India Regional Average OECD Average Procedures (number) 6 5 4
Time (days) 67 55 34 Cost (percent of property per capita) 13.9 6.0 4.9
d. Getting Credit (2004)
Measures on credit information sharing and the legal rights o f borrowers and lenders in India are shown below. One set o f indicators measures the coverage, scope, quality, and accessibility o f credit information available through public and private registries. A second set measures how well collateral and bankruptcy laws facilitate lending; the scores range from 0-10; higher scores indicate that those laws are better designed to expand access to credit. The Credit Information Index measures the scope, access, and quality o f credit information available through public registries or private bureaus; the index ranges from 0-6, and higher values indicate that more credit information i s available from a public registry or private bureau. The Legal Rights Index measures the coverage, scope, quality, and accessibility o f credit information available through public and private registries; the scores range from 0-10, and higher scores indicate that those laws are better designed to expand access to credit.
133
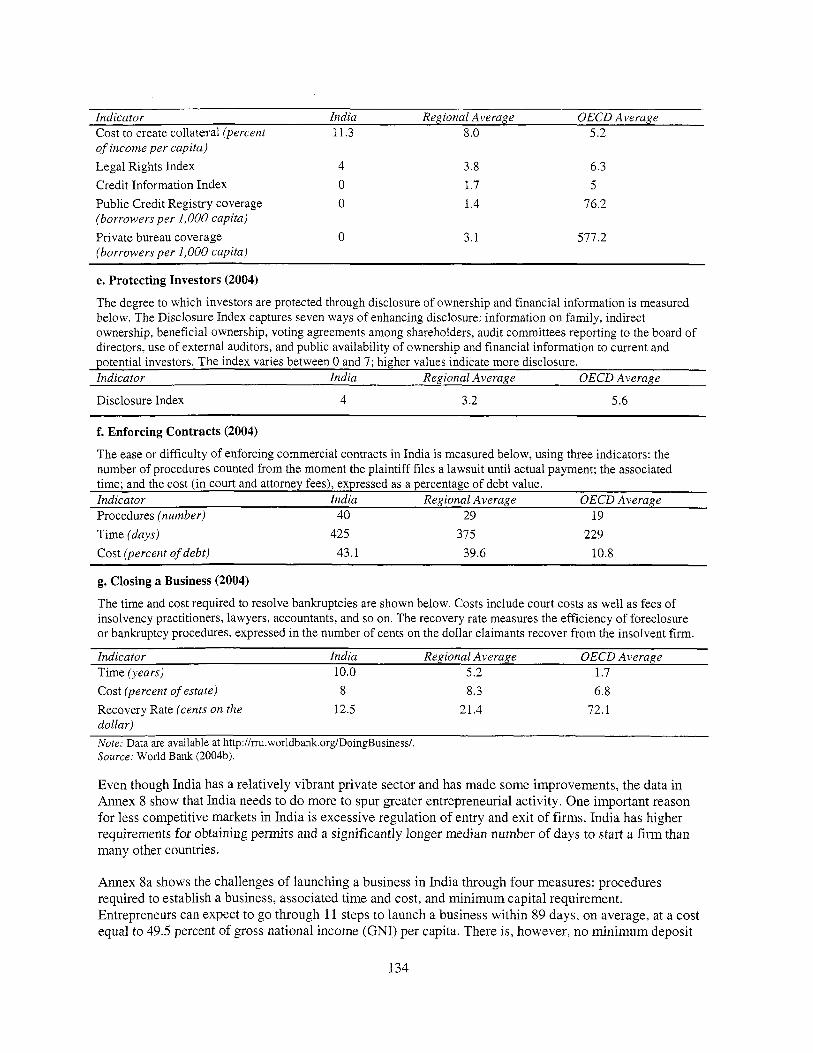
Indicator India Regional Average OECD Average Cost to create collateral (percent 11.3 8.0 5.2 of income per capita) Legal Rights Index 4 3.8 6.3 Credit Information Index 0 1.7 5 Public Credit Registry coverage 0 1.4 76.2 (borrowers per 1,000 capita) Private bureau coverage 0 3.1 577.2 (borrowers per 1,000 capita)
e. Protecting Investors (2004)
The degree to which investors are protected through disclosure o f ownership and financial information i s measured below. The Disclosure Index captures seven ways o f enhancing disclosure: information on family, indirect ownership, beneficial ownership, voting agreements among shareholders, audit committees reporting to the board of directors, use o f external auditors, and public availability o f ownership and financial information to current and potential investors. The index varies between 0 and 7 ; higher values indicate more disclosure. Indicator India Regional Average OECD Average
Disclosure Index 4 3.2 5.6
f. Enforcing Contracts (2004)
The ease or difficulty of enforcing commercial contracts in India i s measured below, using three indicators: the number o f procedures counted from the moment the plaintiff files a lawsuit until actual payment; the associated time; and the cost (in court and attorney fees), expressed as a percentage o f debt value. Indicator India Regional Average OECD Average Procedures (number) 40 29 19 Time (days) Cost (percent of debt)
425 375 229 43.1 39.6 10.8
~ ~~
g. Closing a Business (2004)
The time and cost required to resolve bankruptcies are shown below. Costs include court costs as well as fees o f insolvency practitioners, lawyers, accountants, and so on. The recovery rate measures the efficiency of foreclosure or bankruptcy procedures, expressed in the number o f cents on the dollar claimants recover from the insolvent firm.
Indicator India Regional Average OECD Average Time (years) 10.0 5.2 1.7 Cost (percent of estate) Recovery Rate (cents on the dollar)
8 12.5
8.3 6.8 21.4 72.1
Note: Data are available at http://rm.worldbank.org/DoingBusiness/. Source: World Bank (2004b).
Even though India has a relatively vibrant private sector and has made some improvements, the data in Annex 8 show that India needs to do more to spur greater entrepreneurial activity. One important reason for less competitive markets in India i s excessive regulation o f entry and exit of f i r m s . India has higher requirements for obtaining permits and a significantly longer median number of days to start a firm than many other countries.
Annex Sa shows the challenges o f launching a business in India through four measures: procedures required to establish a business, associated time and cost, and minimum capital requirement. Entrepreneurs can expect to go through 11 steps to launch a business within 89 days, on average, at a cost equal to 49.5 percent of gross national income (GNI) per capita. There is, however, n o minimum deposit
134

requirement to obtain a business registration number, compared with the OECD average o f 44.1 percent o f GNI. Starting a business in India requires about the same number o f permits as in China (12), but in China i t takes less than half the time (41 days), on average, to take care o f all procedures and at a much lower cost (14.5 percent of GNI per capita). They must, however, deposit at least 1,104.2 percent of GNI per capita in a bank to obtain a business registration number.
India also has one of the more regulated labor markets in the world, and restrictions on the hiring and firing o f workers are a great obstacle to doing business (see annex 8b). India’s overall Rigidity of Employment Index i s 48, higher than in China (30), but lower than in Brazil (72). In a World Bank-CII survey (World Bank 2002c), the typical firm reported it had 17 percent more workers than desired and that labor laws and regulations were the main reasons why i t could not adjust i t s workforce to the preferred level. These regulations are a key reason why f m s are reluctant to take on new employees.
In India, i t takes 67 days to register property, higher than i t takes in both Brazil (42 days) and in China (32 days). This i s important in terms of the ease with which businesses can secure rights to property (see annex 8c). In terms of getting credit, annex 8d provides data on credit information sharing and the legal rights of borrowers and lenders in a particular country. India does better than Brazil and China on the Legal Rights Index. India has a score of 4 on this index, and Brazil and China both have a score of 2.
The Disclosure Index measures the degree to which investors are protected through disclosure o f ownership and financial information (annex 8e). This index shows that India and China both have a score of 4, but Brazil does better with a score of 5. Enforcing a contract i s also a major problem in India, as it takes more than a year (425 days) to resolve a payment dispute in India, compared with 566 days in Brazil and 241 days in China (annex 8f). In addition, although it takes less than six months to go through bankruptcy proceedings in Ireland and Japan and 2.4 years in China, in both India and Brazil, it takes more than 10 years (annex 8g). These indicators, thus, reveal some strengths and weaknesses o f India’s national business environment that need to be tackled to improve i t s competitiveness in an increasingly integrated and knowledge-based global economy.
135

Annex 9: Education: Scorecards for Comparator Countries, Selected Variables, Most Recent Period
Brazil Adun lneracy rate (% age 15 and above) (87 30)
China Adun lneracy rate (% age 1 5 and above) (90.92)
(I 61)well educated people do not emlgrate abr rage years of schooling (6 35) (4 33) Wei educated people do noi emigrate abr rage years of schooling (4.88)
(3 60) Avaiisbilny of msnsgement educatlo econdary Enroliment (88 25) (4 70) AVaIIabiHy 01 management edllcatlo ecandsry Enrollment (107 53)
(3 60) Extent of Staff Training Tediary Enrdlment (12 68) (4 SO) Extent of Staff Training Tertiary Enrollment (17.93)
(4.40) Quady of science and math educati e expectancy at bifih, Yeais (70 70) (3 30) Pu~lity of science and math educati e expectancy d birth, years (68 60)
(2.20) Public spending on education as % of at access in schoob (3 50) (4 00) Public spending on educBlion as % of et access in schools (4 00)
Russia Korea AduR lterscy rate (% age 15 and above) (99 59) Adun ineracy rate (% age 15 and above) (97 90)
(3 08) well educated people do not emigrate abr rage years of Schooling (1 0 03) (4 17) well educated people do n d emigate abroad Average years of Schooling (10 84)
Secondary Enrollment (94.17) (3.90) Avallabiiity of management educatlo econdary EnroHment (91.96) (4.20) Amlabilny of manilgement education
(3 00) Extent of Staff Training Tediary Enrollment (68 37) (4 90) Extent of n a i f Training Tertiary Enrollment (82 03)
(5.40) Qualdy of science and math education Ife exPeCtanN at birih, Years (65 80) (4.70) QuaMy of science and math educatlon ife expectancy at birth, years (73 90)
(3 I O ) Public Spending on education as % Of et access in schools (3.20) (3 61) Public spending on educatian as % of at access in schools (6 40)
Poland Aduk Uer8cy rate (% age 15 and above) ( I 00 00)
(3 66) Well educated people do n d emigrate abrc
(4 10) Availabildy of management education
(3.60) Extent Of Staff Training
(4.70) Qualdy of science and math education
Average years of schooling (9 84)
Semndary Enroilment (I01 27)
Tertiary Enrollment (55 50)
Ile expectancy at bitth, years (73 80)
(5.00) Pubiic spending on education as % of 0- Internet access in schools (4.1 0)
Note: Each o f the 80 variables in the KAM i s normalized on a scale o f 0 to 10. T h e fuller the scorecard, the better poised a country i s to embrace the knowledge economy. But an economy should not necessarily aim for a perfect score o f 10 on all variables. T h i s i s because the scorecards may be shaped by the particular structural characteristics o f an economy or by trade-offs that characterize different development strategies. Values in parentheses denote actual values for the particular country for the most recent period for which data are available. Source: World Bank, “Knowledge Assessment Methodology,” http://www.worldbank.org/kam.
136

Annex 10: Innovation: Scorecards for Comparator Countries, Selected Variables, Scaled by Population, Most Recent Period
Poland Giom Foreign Dired ln~edment 8s % 01 GDP (3 60)
(3 40) Rivda %&or rpmdn di,canfatcarpaymsotslrml pop (1458)
(3 W) Hlgh-lech expollf as % of manut and lhemse leer recepls I mil pop (0 89)
1eme 8 englneerlnn enrolment lot10 (% 01 laly I C Y I I dudentr) (28 00)
(3 20) Sate 01 cludcr developme
(0 50) Patent applications granted by the USPTOlmll pop.
ReSCBlChnS In R8D lmlllon (1471 59)
(3 30) Avsilsbildy 01 Venture csplsi otsl experdlura tor R8D LIS % 01 GDP (0 67)
(3 80) A d " Bwden lo r Sort. I Trade as % 0 1 GDP (41 20)
(117 Oo)Ss~ent~lis sndleshnieallournsl 8111deslml erfdy4ompany rEfCBtCh COllWDiat~Dn (3 40) (11 20) Cart ID enforce contract (% 01 ON1 per c 0 iegider a burinerr (% 01 GNI per cspls) (20 30)
Note: Each o f the 80 variables in the KAM i s normalized on a scale o f 0 to 10. The fuller the scorecard, the better poised a country i s to embrace the knowledge economy. But an economy should not necessarily aim for a perfect score o f 10 on all variables. T h i s i s because the scorecards may be shaped by the particular structural characteristics o f an economy or by trade-offs that characterize different development strategies. Values in parentheses denote actual values for the particular country for the most recent period for which data are available. Source: World Bank, "Knowledge Assessment Methodology," http://www.worldbank.org/kam.
137

Annex 11 : Information Infrastructure: Scorecards for Comparator Countries, Selected Variables, Most Recent Period
Brazil Telephoner per 1 ,WO people (486 BO)
China Telephoner per 1,000 peOpk (423 20)
(5 81 ) ICT Expendlure as % 01 www I D ~ D per 1.000 (209 mi (6 32) IC1 Expendnwe os % 01 eiephme lyles per 1,000 (223 20)
(3 16) E.Governm bi~phancperi,000(21400) (6 32) E 4 o I C l m bdC Phone per 1,000 (263 80)
Computers per 1,000 pmple (27 60) (1 77) Intorndional tdccomwncdions, md 01 call CDmpUlers per 1 ,000 people (74 80) (6 70) IneinaODnaItelecommuniCd~Onr, Cod 01 CBB
(632 48) Mernd uself per 10,000 PeOP 56s per 1 ,WO (350 00) (622l1)Inte,ndurerrperlO,OWpe Set$ per 1 ,000 (349 00)
(1 28) Intern6 hods per 1 (17978)lnternet hodtper l 5 per 1 ,WO (433 00)
(42 00) Dally neWsPBPell P e l .ooO (43 00) D d y ncwsp~pers per 1,000
Korea lel~phoneSplr1,000pe~pie(116610)
Russia 1slephOneS per 1,000 people (362 30)
(3 69) IC1 Expendlure as % of WP am T d e p h m e LnsP per 1 ,MO (242 20) (6 49) KT hpcndhrc % O f GDP 81" Telephow lmes pci 1,000 (472 40)
(2 83) E.Gavernment (6 84) E-mvanment M M I I phone per 1,000 (693 70)
Computers p c i l .OOOpeo~lc(88 70)(1 74) lnternation~lelecommunsd~ons,~~S1ol comp!Aer* per i.000 people (551 40) tdl
(2 91) lntern~,0naltclccomm"nr6~0nr, cost 01 call
(409 32) Internel meis per 10,000 pea Sat pet 1,000 (538 00) (En3420JInterneturerrpcr 10,OWpeo Sets per 1,000 (363 00)
(42 18) Mernd hod3 per 1 (52 84) interlct hods per I f pn 1,000 (1034 W)
(1M.00) Daily niwspapors pi, 1,000 (383 00) Daily nwysp~peis per I ,WO
Poland TClqhMel pel 1,000 pmple (769 60)
~ephoneInprper1,000(31870) (5 22) IC1 Expardkurc a t % 01
oblle phone p a 1.000 (450 90)
(1 79) IMemMiOnal telecammunlcdians, cost 01 coymuero per 1 ,OM pmpie (1 05 En)
(2324 501 lntemel U f l f W 10,OM P P I V Sds per 1,000 (422 00)
(203 62) lnternd hosts per I O f per 1,WO (523 00)
(102 00) Dally newfpaperf per 1,000
Note: Each o f the 80 variables in the KAM i s normalized on a scale o f 0 to 10. The fuller the scorecard, the better poised a country i s to embrace the knowledge economy. But an economy should not necessarily aim for a perfect score o f 10 on all variables. This i s because the scorecards may be shaped by the particular structural characteristics o f an economy or by trade-offs that characterize different development strategies. Values in parentheses denote actual values for the particular country for the most recent period for which data are available. Source: World Bank, "Knowledge Assessment Methodology," http:Nwww.worldbank.org/kam.
138

Annex 12: ICT Indicators for India and China, Various Years
Variable India China Telephones per 1,000 people (mainlines + mobiles), 2003 71.00 423.20 Telephone main lines per 1,000 people, 2003 Mobile phones per 1,000 people, 2003 Computers per 1,000 people, 2002 TV sets per 1,000 people, 2002 Radios per 1,000 people, 2001 Daily newspapers per 1,000 people, 2000 Internet hosts per 10,000 people, 2003 Internet users per 10,000 people, 2003 International telecommunications, cost o f call to the United States ($ per 3
E-Government, 2003” ICT Expenditures as percent o f GDP, 2002
minutes), 2002
46.30 24.70 7.20
83.00 120.00 60.00 0.82
174.86 3.20
5.18 2.78
209.20 214.00 27.60
350.00 339.00 42.00
1.28 632.48
6.70
3.16 5.81
Source: World Bank, “Knowledge Assessment Methodology,” http://www.worldbank.org/kam. * Represents the percentage of companies in a country that use the Internet for online government services.
139

References
Abraham, Reuben. 2005 (forthcoming). Mobile Phones and Economic Development: Evidence from the Fishing Industry in India. New York: Columbia University.
AIMA (Al l India Management Association). 2003. India’s New Opportunity, 2020: Report of the High- Level Strategic Group. Prepared with the Boston Consulting Group. Mumbai and New Delhi, India.
A. T. Keamey. 2004. Foreign Direct Investment Confidence Index. Global Business Policy Council. Alexandria, VA. http://www.atkeamey.com/shared~res/pdf/FDICIOct~2004~S.pdf
Altman, Lawrence K. 2003. “Clinton Announces Plan to Cut Cost of AIDS Drugs.” New York Times, 23
Associated Press. 2005. “India’s Software Exports Exceed Targets, to Reach $17.3 Billion.” 25 February.
A T P (Asian Technology Information Program). 2003a. Indian Contract Research, 7 October.
October.
http://www.atip.org/public/atip.reports.03/atip03.053.pdf.
. 2003b. S&T in Bangalore, 9 May. http://www.atip.org/public/atip.reports.03/atip03.029.pdf.
Aubert, Jean-Eric. 2005. Promoting Innovation in Developing Countries: A Conceptual Framework. The
Baily, Martin N. and Diana Farrell. 2004. “Exploding the Myths of Offshoring.” The McKinsey
Barro, Robert J., and Jong-Wha Lee. 2001. “International Data on Educational Attainment: Updates and
Basu, Indrajit. 2003. “India Noses Ahead as R&D Center.” Asia Times Online.
BBC World News. 2004. “Mobile Phones Take Over in India.” 9 November.
World Bank, Washington, D.C.
Quarterly. July.
Implications.” Oxford Economic Papers 3 : 541-63.
http:/ /www.atimes.co~atimes/south~asia/8.html.
http://news.bbc.co.uk/2Mbusiness/3994761 stm.
Weil Seriously.” National Bureau of Economic Research Working Paper 8365. Cambridge, Mass. July.
Bils, Mark, and Peter J. Klenow. 2000. “Does Schooling Cause Growth?” American Economic Review 90 (5): 1160-83. December.
Bourguignon, Franqois, and Boris Pleskovic, eds. 2004. Annual World Bank Conference on Development Economics 2004, “Accelerating Development, ” World Bank. New York: Oxford University Press.
Bowonder, B. 2002. “Evolution of Bangalore as an Innovative Cluster.” Science, Technology, and Innovation: Viewpoints. 8 September. Center for International Development, Harvard University, Cambridge, Mass. http://www.cid.harvard.edu/cidbiotech/comments/comments 178.htm.
Bowonder, B., V. Kelkar, and N. G. Satish. 2004. Manuscript. “Innovation in India: Recent Trends.”
Bradsher, Keith. 2002. “A High-Tech Fix for One Comer of India.” New York Times. 27 December.
Broad, William J. 2004. “U.S. I s Losing I t s Dominance in the Sciences.” New York Times. 3 May.
Broad, William J., and James Glanz. 2003. “Does Science Matter?” New York Times. 11 November.
Chandrashekhar, S., and K. P. Basvarajappa. 2001. “Technological Innovation and Economic
Bernanke, Ben S. and Refet S. Giirkaynak. 2001. “Is Growth Exogenous? Taking Mankiw, Romer, and
Development: Choices and Challenges for India.” Economic and Political Weekly. 25 August.
140

China. 2003. Chinese Statistical Yearbook 2002-2003. National Statistics Bureau o f China. Beijing.
Chitnis, Suma. 2002. “Higher Education in India: Seriously Challenged.” International Higher Education (Spring). Center for International Higher Education, Boston College, Boston, Mass. http://www.bc .edu/bc~org/avp/soe/cihe/newsletter/News27/textO 1 1 .htm.
Middle East. Eli Noam, ed. New York: Oxford University Press.
Gap in ‘New Economy’ Skills.” News release. 3 December. http://newsroom.cisco.com/dlls/global/asiapac/news/2002/pr~l2-03a.html.
Chowdary, T. H. 1997. Telecommunications in India. ” I n Telecommunications in Westem Asia and the
Cisco Systems. 2002. “ITU and Cisco Systems to Expand Internet Training Centre Initiative to Bridge
Cohen, David. 2005. “The Silicon Subcontinent.” New Scientist Issue 2487. 19 February.
Cohen, Daniel, and Marcel0 Soto. 2001. Growth and Human Capital: Good Data, Good Results.
Current Science. 2003. “Indian Institutes of Technology.” Vol. 84, issue 5). 10 March.
Dahlman, Carl and Jean-Eric Aubert. 2001. China and the Knowledge Economy: Seizing the 21” Century,
Dahlman, Carl, and Thomas Andersson. 2000. Korea and the Knowledge-Based Economy: Making the
Das, Gurcharan. 2001. India Unbound. New York: A. A. Knopf.
Datta, P. T. Jyothi. 2004. “Novartis Research Centre: I t ’ s a Toss-up between India, China.” The Hindu
D e Filippo, Giuseppe, Jun Hou, and Christopher Ip. 2005. “Can China Compete in IT Services?” The
Di Lodovico, Amadeo M., William W. Lewis, Vincent Palmade, and Shirish Sankhe. 2001. “India: From
Drucker, Peter F. 2001a. The Essential Drucker: Selections from the Management Works of Peter F.
Technical Papers no. 179. OECD Development Centre. September.
World Bank, Washington, D. C.
Transition. World BanWOECD, Washington, D.C.
Business Line. 24 November.
McKinsey Quarterly no. 1.
Emerging to Surging.” The McKinsey Quarterly no. 4.
Drucker. New York: HarperBusiness.
. 2001b. “The Next Society.” The Economist. 1 November.
Dyson, Tim, Robert Cassen, and Leela Visaria, eds. 2004. Twenty-First Century India: Population, Economy, Human Development and the Environment. New York: Oxford University Press.
EIU (Economic Intelligence Unit). 2003a. 2003 E-Readiness Rankings. EIU White Paper. London, New York, and Hong Kong. http://unpan 1 .un.org/intradoc/groups/public/documents/APCITY~ANO 10006.pdf.
home~page&product~id=30000203&country~id=IN.
http://graphics.eiu.com/files/ad-pdfs/ERR2004.pdf
New York, and Hong Kong. http://graphics.eiu.com/files/ad-pdfdagilent 1 .pdf.
http://db.eiu.com/index.asp?layout=article&eiu~issue~id=5O733245O&eiu~article~id=9O733249O
. 2003b. “India Country Profile.” http://store.eiu.com/index.asp?layout=product-
. 2004a 2004 E-Readiness Rankings. EIU White Paper, London, New York, and Hong Kong.
.2004b. Hamessing Innovation: R&D in a Global Growth Economy. EIU White Paper. London,
. 2004c. “India Country Profile.”
Farrell, Diana. 2004. “The Hidden Dangers of the Informal Economy.” The McKinsey Quarterly, no. 3.
141

Farrell, Diana, and Adil S. Zainulbhai. 2004. “A Richer Future for India.” The McKinsey Quarterly.
Farrell, Diana, Antonio Puron, and Jaana K. Remes. 2005. “Beyond Cheap Labor: Lessons for
Farrell, Diana, Tarun Khanna, Jayant Sinha, and Jonathan R. Woetzel. 2004. “China and India: The Race
Finger, J. Michael, and Philip Schuler, eds. 2004. Poor People’s Knowledge: Promoting Intellectual
Fink, Carsten, and Keith E. Maskus, eds. 2005. Intellectual Property and Development: Lessons from
Finnish National Fund for Research and Development. 1998. Quality of Life, Knowledge, and .
Fortune. 2004. “Riding the Outsourcing Wave.” 19 April.
Freedom House. 2003. Freedom in the World 2003, Annual Survey of Political Rights and Civil Liberties.
Friedman, Thomas L. 2004. “Software o f Democracy.” New York Times. 21 March.
Gollin, Douglas. 200 1. “Getting Income Shares Right.” Working Paper. Williams College. January.
Gordan, Jim, and Poonam Gupta. 2003. “Understanding India’s Services Revolution.” Paper prepared for the IMF-NCAER Conference, “A Tale o f Two Giants: India’s and China’s Experience with Reform,” 14-16 November 2003, New Delhi.
Harvard University, Center for International Development. “Reform: From Half-Baked Socialism to Half- Baked Capitalism.” CIS Working Paper no. 108. Cambridge, Mass.
Hof, Robert D., and Manjeet Kripalani. 2003. “India and Silicon Valley: Now the R&D Flows Both Ways.” Business Week Online. 8 December. http://www.businessweek.com/magazine/conten~O3~49~38610 10-mzOOl .htm.
Hole in the Wall Education Ltd. 2003. Home page. http://www.niitholeinthewall.com.
Huang, Yasheng, and Tarun Khanna. 2003. “Can India Overtake China?” Foreign Policy. July-August.
IDA (Irish Development Agency). 2003. “Ireland’s Transition to the Knowledge Economy.”
IIT (Institutes of Information Technology). n.d. “Sustainable Access in Rural India.” Telecommunication
IMD International. 2004. World Competitiveness Yearbook 2004. Lausanne, Switzerland.
IMF (International Monetary Fund). 2003. “A Tale o f Two Giants: India’s and China’s Experiences with
Special Edition: What Global Executives Think.
Developing Economies.” The McKinsey Quarterly, no. 1.
to Growth.” 2004 Special Edition: China Today. The McKinsey Quarterly. September 13.
Property in Developing Countries. World Bank. New York: Oxford University Press.
Recent Economic Research. World Bank, Washington, D.C.
Competitiveness. http://l94.100.30.1 l/tietoyhteiskunta//english/st5 Ueng206b.htm.
Washington, D.C.
http://www.ida.ie/news/endofyear~2003.pdf.
and Computer Networks Group. Madras, India. http://www.tenet.res.in/rural/saril .html.
http://www02.imd.ch/wcc/yearbook/.
Reform and Growth.” 2003. Web site for conference coorganized by the IMF and National Council o f Applied Economic Research, 14-16 November 2003, New Delhi, India. http://www .imf.org/extemal/np/apd/seminars/2003/newdelhi/index.htm.
http://www.nstmis-dst.org/.
2004a. “Broadband Policy 2004.” New Delhi. http://www.dot.gov.in/broadbandpolicy2004.htm.
India, Department of Science and Technology. 2003. Science and Technology Policy 2003. New Delhi.
India, Ministry of Communications and Information Technology, Department o f Telecommunications.
142

India, Ministry of Communications and Information Technology, Department of Information Technology, and NCAER. 2004b. “India: E-Readiness Assessment 2004 for States /Union Territories.” September. New Delhi.
India, Ministry of External Affairs. 2000. Report of the High-Level Committee on Indian Diaspora. New Delhi. http://indiandiaspora.nic.in/.
. n.d. “S&T Professionals of Indian Diaspora.” http://stio.nic.in/.
India, Planning Commission. 2001a. India as Knowledge Superpower: Strategy for Transformation. New
.2001b. Report of the Steering Committee on Secondaly, Higher, and Technical Education for the
Delhi.
Tenth Five-Year Plan (2002-2007). New Delhi. http://planningco”ission.nic.in/aboutus/co”ittee/strgrp/stgp-scndry.pdf.
http://planningco”ission.nic.in/reports/genrep/pl~vsn2020.pdf.
http://planningco“ission.nic.in/plans/planrel/pl-roadmap.pdf .
Year Plan (2002-2007). New Delhi. http://planningco“ission.nic.in/aboutus/co”ittee/strgrp/stgp-candi.pdf.
http://planningco”ission.nic.in/aboutus/co”ittee/strgrp/stgp_fdi.pdf.
http://planningco”is sionnic. in/plans/planreYfiveyr/welcome. html.
the Tenth Five-Year Plan (2002-2007). New Delhi. http://planningco”ission.nic.in/aboutus/co”ittee/strgrp/stgp_st.pdf.
InterAcademy Council. 2004. Inventing a Better Future: A Strategy for Building Worldwide Capacities in Science and Technology. Amsterdam, Netherlands.
I T U (International Telecommunication Union). 2003. “ITU Digital Access Index: World’s First Global ICT Ranking Education and Affordability Key to Boosting New Technology Adoption.” News release. 19 November. http://www.itu.int/newsarchive/press~releases/2003/3O.html.
Iype, George. 2005. “IN, IIT Set to Go Global.” Business Special. Rediff.Com. 24 January. http://in.rediff.com/money/2005/jan/24spec 1 .htm.
Jain, Kuldeep P., Nigel A. S. Manson, and Shirish Sankhe. 2005. “The Right Passage to India.” The McKinsey Quarterly. 1 March.
Jha, C. S. 2003. Agriculture Higher Education in India: A Quest for Excellence. World Bank, Washington, D.C.
Kahane, Adam. 2004. Solving Tough Problems: An Open Way of Talking, Listening, and Creating New Realities. San Francisco: Berrett-Koehler.
Kak, Subhash. 2003. “Do We Need More IITs?” rediff com. 19 November.
Kalam, A. P. J. Abdul, and Y. S. Rajan. 2002. India 2020: A Vision for the New Millennium. New Delhi:
. 2002a. India Vision 2020. New Delhi.
.2002b. India’s Economic Road Map: The Next Five Years, 2002-2007, The Essence. New Delhi.
. 2002c. Report of the Steering Committee on Communication and Information for the Tenth Five-
. 2002d. Report of the Steering Committee on Foreign Direct Investment. New Delhi.
.2002e. Tenth Five-Year Plan 2002-2007. New Delhi.
. n.d. Report of the Steering Committee of Science and Technology Departments and Agencies for
http://www.rediff.com/news/2003/nov/20kak.htm.
Penguin Books India.
143
Kapur, Devesh, and John McHale. 2003. “Migration’s New Payoff.” Foreign Policy. November-
Kapur, Devesh, and Pratap Bhanu Mehta. 2004. Indian Higher Education Reform: From Half-Baked
December.
Socialism to Half-Baked Capitalism. CID Working Paper no. 108. Center for International Development, Harvard University, Cambridge, Mass. September.
for 1996-2002. Policy Research Working Paper no. 3106. World Bank, Washington, D.C. http://www , worldbank.org/wbi/governance/pubs/govmatters3 .html.
Preliminary Lessons from North India.” World Development, vol. 32, no. 4.
Washington, D.C.
Mobility of Highly Skilled Indians. STI Working Paper 2004/7. OECD, Paris. 27 May.
Working Paper 2004/6. OECD, Paris. 21 April.
Cambridge, Mass.: Harvard Business School Press.
Kaufmann, Daniel, A. Kraay, and M. Mastruzzi. 2003. Governance Matters I l l : Governance Indicators
Kaushik, P. D., and Nirvikar Singh. 2004. “Information Technology and Broad-Based Development:
Kelkar, Vijay. 2003. “India: The Coming Golden Age.” Presentation at the World Bank (28 October),
Khadria, Binod. 2004a. Human Resources in Science and Technology in India and the International
. 2004b. Migration of Highly Skilled Indians: Case Studies of IT and Health Professionals. STI
Kim, Linsu. 1997. Imitation to Innovation: The Dynamics of Korea’s Technological Learning.
Kripalani, Manjeet, and Pete Engardio. 2003. “The Rise of India.” Business Week. 8 December.
Krishnadas, K. C. 2005. “India Raises Foreign Investment L i m i t s on Telecom.” Networkingpipeline. Information Week 500. 2 February. http://info~ationweek.networkin~ipeline.c0~59300540.
Krishnan, Gina S., and Gauri Kamath. 2004. “Nicholas Piramal: Discovery Channel.” Businessworld. 28 November.
Lancaster, John. 2003. “Village Kiosks Bridge India’s Digital Divide.” Washington Post. 12 October.
Levin, Henry M., and Zeyu Xu. 2003. Issues in the Expansion of Higher Education in the Peoples
Lewis, William W. 2004. “The Power of Productivity.” The McKinsey Quarterly no. 2.
Maddison, Angus. 2001. The World Economy: A Millennia1 Perspective. OECD, Paris.
Maira, Arun. 2002. Shaping the Future: Aspirational Leadership in India and Beyond. Hoboken, NJ: John
Republic of China. Teachers College, Columbia University, New York.
Wiley & Sons.
Oaks, London.
Mani, Sunil, and Nagesh Kumar. 2001. Role of Govemment in Promoting Innovation in the Enterprise Sector: An Analysis of the Indian Experience. The United Nations University Institute for New Technologies (INTECH) Discussion Paper Series #2001-3. http://www.intech.unu.edu.
Maskus, Keith E. 2003. Encouraging International Technology Transfer. UNCTAD/ICTSD Capacity Building Project on Intellectual Property Rights and Sustainable Development, New York.
McKinsey Global Institute. 2003. Offshoring: I s it a Win-Win Game? New York, NY. August.
Merchant, Khozem. 2004. “Golden Statues Mark Progress at Infosys.” Business Standard. 24 November.
.2004. Remaking India: One Country, One Destiny. Response Books: New Delhi and Thousand
http://www.business-standard.com/ft/storypage.php?&autono= 173407.
144
Miller, Robert R. 2001. Leapfrogging? India’s Information Technology Industry and the Internet. IFC
Mudur, G. S. 2005. “Reverse Drug Design.” The Telegraph. 17 January. Calcutta, India.
NASSCOM. 2003. Strategic Review 2003. http://www.nasscom.org/strategic.asp.
Discussion Paper no. 42 (May). International Finance Corporation, Washington, D.C.
http://www.telegraphindia.com/ 10501 17/asp/knowhow/story~4249252.asp.
. 2004a. “About NASSCOM.” http://www.nasscom.org/artdisplay.asp?Art~id=1958.
. 2004b. Strategic Review 2004. http://www.nasscom.org/artdisplay.asp?Art~id=2393.
New Scientist. 2005. “India: The Next Knowledge Superpower.” 19 February.
New York Times. 2003. “Cap on U.S. Work Visas Pu ts Companies in India in a Bind.” 1 October.
NIIT. 2002. “Andhra Pradesh IT Training Order for NIIT to Cover 3 Lakh Students in 663 High
http://www.newscientist.com/special/india.
Schools.” News release. 19 July. http://www .prdomain.com/companies/n/niit/news~releases/200207july/pr~200207 19 .htm.
India.” CD-ROM of the K4D Policy Forum, Wilton Park, United Kingdom, March 2001.
Reviews. Paris.
OD1 (Overseas Development Institute). 2001. “Using Knowledge for Development for Brazil, China, and
OECD (Organisation for Economic Cooperation and Development). 2003. China: Progress and Policy
.2004. Innovation in the Knowledge Economy: Implications for Education and Leaming. Paris.
Pai, M. A. 2004. “Why IITs must be Restructured.” 8 September.
Panagariya, Arvind. 2001. “The Indian Diaspora in the United States.” Economic Times. 23 May.
Prahalad, C. K. 2004. “The Fortune at the Bottom of the Pyramid: Eradicating Poverty through Profits,”
PTI (Press Trust of India). 2004a. “India Al l Set to Become an Innovation Hub: Mashelkar.” News
http://in.rediff.com/money/2004/sep/08guest2. htm.
Upper Saddle River, NJ: Wharton School Publishing.
release. 13 April. http://economictimes.indiatimes.com/articleshow/6 14782.cms.
http://in.rediff.com/money/2004/mar/3 1 gdp. htm.
http://inhome.rediff.com/money/2004/sep/ 17bpo. htm.
That Gets Millions into School in Madhya Pradesh. World Bank, Washington, D.C. http://www. worldbank.org/wbi/reducingpoverty/docs/FullCases/India%20PDF/~dia%20Educ%20gu arantee%20scheme.pdf.
Reddy, Prasada. 1997. “New Trends in Globalization of Corporate R&D and hplications for Innovation Capability in Host Countries: A Survey from India.” World Development 25 (1 1).
Reserve Bank of India. 2003. “Summary o f the Annual Report o f RBI for the year ended June 2003.” 27 August. http://www .rbi.org.in/index.dll/3?OpenSectionTextArea?fromdate=8/27/2003&todate=8/27/2003&s 1 secid=1001&s2secid=1OOl&ArchiveMode=1.
. 2004b. “India’s Q3 GDP Spurts to 10.4%.” News release. 31 March.
. 2004c. “The Next Big Opportunity: R&D Outsourcing.” News release. 17 September.
Ramachandran, Vimala. 2004. Education Guarantee Scheme: A Community-Government Partnership
Ridding, John. 2005. “I Heard I t on the Grapevine.” Financial Times. 5-6 February.
145

Rodrik, Dani, ed. 2003a. I n Search of Prosperity: Analytic Narratives on Economic Growth. Princeton, N.J.: Princeton University Press.
University, Cambridge, Mass. September.
Economic Studies and the If0 Institute for Economic Research. April.
Indian Growth Transition. Faculty Research Worlung Papers RWP04-0 13 John F. Kennedy School of Government, Cambridge, Mass. March.
SciDev.Net. 4 January. http://www.scidev.net/News/index.cfm?fuseaction =readNews&itemid=l174&language=l.
http://sify.com/finance/fullstory.php?id= 13607224.
http://sify .com/finance/fullstory.php?id= 13645428.
Singh, J. P. 1999. Leapfrogging Development? The Political Economy of Telecommunications Restructuring. Albany, NY: State University of New York Press.
Singh, Seema. 2004. “India Kicks the Habit.” Newsweek International. 22 November. http://msnbc.msn.com/id/6478695/site/newsweek/.
Srinivasan, S. 2005. “India’s Software Exports Exceed Targets, to Reach $17.3 Billion.” News release. Associated Press. 25 February.
Srinivasan, T. N. 2002. “China and India: Growth and Poverty, 1980-2000.” World Bank, Washington, D.C. http://poverty.worldbank.org/files/12404~TNSrinivasan-Paper2+Tables.pdf.
State of Uttaranchal. 2003. Detailed Project Reports for Proposed Projects under Uttaranchal E- Governance Initiative. May.
The Asia Society. 1999. “E-Commerce in India.” Asia Source. 21 December. http://www.asiasource.org/news/at_mp_02.cfm?newsid= 1446.
The Economic Times. 2004. “New Patent Law by Jan 1.” 17 November. http://economictimes.indiatimes .com/articleshow/925027.cms.
The Economist. 2000. “India’s Economy: The China Syndrome.” 9 December.
. 2003b. “Growth Strategies.” Manuscript. John F. Kennedy School of Government, Harvard
. 2004. “Getting Institutions Right.” CESifo DICE Report. University of Munich’s Center for
Rodrik, Dani, and h i n d Subramanian. 2004. Hindu Growth” to Productivity Surge: The Mystery of the
Science and Development Network. 2004. “Indian Minister Urges Quality in Science Training.”
Sify, Ltd. 2004. “Mobiles Overtake Landmines” Sify Finance. 9 November.
.2005. “Cellular User Base Reaches 47.3 m.” Sify Finance. 9 January.
. 2001. “Islands of Quality.” 31 May.
. 2003a. “Bangalore, Texas.” 20 November.
. 2003b. “Click and Fly.” 9 October.
. 2003c. “Growing Pains.” 21 August.
. 2003d. “Lost in Translation.” 27 November.
. 2003e. “Patently Ambitious.” 4 September.
. 2003f. “Something to Talk about.” 16 October.
. 2003g. “The Right Fix.” 1 September.
. 2004a. “Abating or Exploding.” 15 April.
146

. 2004b. “A World of Work: A Survey of Outsourcing.” 13 November.
. 2004c. “Can India Work: India’s Economic Reforms.” 10 June.
. 2004d. “India’s Shining Hopes: A Survey of India.” 19 February.
. 2004e. “Innovative India.” 1 April.
. 2004f. “Profits and Poverty.” 19 August.
. 2004g. “When Silence I s Not Golden.” 15 April.
. 2005. “The Tiger in Front: A Survey of India and China.” 3 March.
The Hindu Business Line. 2005. “Govemment Plans to Set Up Knowledge Commission: Time to Emerge as Global Major Has Come: PM.” The Hindu Business Line Internet Edition. 13 February. http://www.thehindubusinessline.com/2005/02/13/stories/200502130 1400300. htm.
http://www.tataliteracy.com.
for Development: National and Intemational Perspectives. New York and Geneva. http://www.unctad.org/Templates/WebFlyer.asp?intItemID=2979&lang=1 and http://www.unctad.org/eddocs/wir2003chl~en.pdf.
http://www.unctad.org/Templates/WebFlyer.asp?intItemID=3235&lang= 1.
Technologies Work for Human Development. New York.
Nations to End Poverty. New York.
The Tata Group. 2005. “40 Hours I s All It Takes to Teach an Indian to Read.”
UNCTAD (U.N. Conference on Trade and Development). 2003. World Investment Report, FDZ Policies
.2004. World Investment Report 2004: The Shift toward Services. New York and Geneva.
UNDP (U.N. Development Programme). 2001. Human Development Report 2001: Making New
. 2003. Human Development Report 2003: Millennium Development Goals: A Compact among
UNESCO. 2002. “Hyderabad Statement on Adult and Lifelong Learning.” 10 April. New York.
Vyas, Sameer. 2004. “Addressing Infrastructure Needs of the Poor: The Tamil Nadu Experience of Public Private Partnerships.” Presented at “Scaling Up Poverty Reduction: A Global Learning Process and conference,” Shanghai, 25-27 May, 2004. http://www.worldbank.org/wbi/reducingpoverty/case- India-Addressing. html.
Wagner, Alan. 1998. “Redefining Tertiary Education.” The OECD Observer no. 214,October/November. http://www 1 .oecd.org/publications/observer/2 14/article4-eng. htm.
Webb, Jeremy. 2005. “Make i t Pay.” 77ze New Scientist. Special Issue: India: the Next Knowledge Superpower. 19 February.
WEF (World Economic Forum). 2002. Global Competitiveness Report: 2001-2002. Oxford, Eng.: Oxford University Press. http://www. weforum.org/.
World. Oxford, Eng.: Oxford University Press. http://www.weforum.org/.
http://www.weforum.org/.
http://www . weforum.org/site/homepublic .nsf/Content/India+Economic+Summit+2004%5 CIndia%27 s+Competitiveness+Profile.
. 2003. The Global Information Technology Report 2002-2003: Readiness for the Networked
. 2004a. Global Competitiveness Report: 2004-2005. Oxford, Eng.: Oxford University Press.
. 2004b. “India’s Competitiveness Profile.” India Economic Summit 2004,5-7 December.
147

.2004c. The Global Information Technology Report 2003-2004: Toward an Equitable Informution Society. Oxford, Eng.: Oxford University Press. http://www .weforum.org/site/homepublic.nsf/Content/Global+Competitiveness+Programme%5CGlo bal+Information+Technolog y+Report .
http://www . weforum.org/site/homepublic .nsf/Content/Global+Competitiveness+Progra~e%5CGlo bal+Information+Technolog y +Report.
Competitiveness.” Proceedings of session on 6 December at the India Economic Summit, 5-7 December, New Delhi, India. http://www .weforum.org/site/knowledgenavigator.nsf/Content/-S 126 14?open&event_id= 1 18 1 &year - id=2004.
Westholm, Gunnar, Bertrand Tchatchoua, and Peter Tindemans. 2003. Global Investment in R&D Today: A Statistical Survey of R&D Expenditure and Research Personnel Worldwide. UNESCO, Paris.
Wilson, Dominic, and Roopa Purushothaman. 2003. “Dreaming with BRICs: The Path to 2050.” Global Economics Paper no. 99. Goldman Sachs. http://www.gs.com/insight/research/reports/99.pdf.
Woessmann, Ludger. 2000. “Specifying Human Capital: A Review, Some Extensions, and Development Effects.” Working Paper 1007. K i e l Institute of World Economics, Kiel , Germany.
World Bank. 1999. World Development Report 1998-1999: Knowledge for Development. New York: Oxford University Press.
. 2004d. The Global Information Technology Report 2004-2005.
. 2004e. “The New Growth Centres: Increasing Knowledge and Creativity-Based
. 2000. Scientijk and Technical Manpower Development in India. Washington, D.C.
. 2002a. Constructing Knowledge Societies: New Challenges for Tertiary Education. Washington,
.2002b. “Govemance Research Indicator Country Snapshot (GRICS): 1996-2002.”
. 2002c. Improving the Investment Climate in India: An Investment Climate Assessment. Prepared
. 2002d. TechnicaUEngineering Education Quality Improvement Project. Project appraisal
. 2002e. “Using Information and Communications Technology to Reduce Poverty in Rural India,”
. 2003a. Attaining the Millennium Development Goals in India: How Likely and What Will It
. 2003b. Doing Business in 2004: Understanding Regulation. Prepared with the International
. 2003c. “India Country Assistance Strategy Progress Report.” Washington, D.C.
. 2003d. “India: Sustaining Reform, Reducing Poverty.” Development Policy Review. 14 July.
. 2003e. India: Telecommunications Sector Reform Technical Assistance Project. Telecom
. 2003f. “International Migration of Skilled Personnel from Developing Countries: The Issues,
D.C.
http://info. worldbank.org/govemance/kkz2002/index.htm.
in collaboration with the Confederation of Indian Industries. Washington, D.C.
document. 23 September. Washington, D.C.
PREM Note no. 70, June. Washington, D.C.
Take? Human Development Unit, South Asia Region, Washington, D.C.
Finance Corporation. New York, NY: Oxford University Press.
Washington, D.C.
Mission, Aide Memoire, 15 October.
Determinants, Magnitude, and Policy Options.” Draft paper. Washington, D.C. September.
148
. 2003g. Lifelong Leaming in the Global Knowledge Economy: Challenges for Developing
. 2003h. Unlocking Andhra Pradesh’s Growth Potential,: An Agenda to Achieve the Vision 2020
. 2003i. World Development Indicators. Washington, D.C.
. 2004a. Country Strategy for India. September. Washington, D.C.
. 2004b. Doing Business in 2005: India Regional Profile. Washington, D.C. Prepared with the
. 2004c. Doing Business 2005: Removing Obstacles to Growth. Prepared with the International
. 2004d. India: Investment Climate Assessment 2004: Improving Manufacturing Competitiveness.
. 2004e. “India: Private Sector Strategy for the World Bank Group.” India Country Strategy.
. 2004f. “India’s Transformation to Knowledge-Based Economy: Evolving Role of the Diaspora.”
. 2004g. India: Telecommunications Sector Reform Technical Assistance Project. World Bank
Countries. Washington, D.C. http://www.congress-lifelongleaming.org/frameset.htm.
Growth Targets. PREM Sector Unit, South Asia Region, Washington, D.C.
International Finance Corporation.
Finance Corporation. New York, NY: Oxford University Press.
Finance and Private Sector Development Unit, South Asia Region, Washington, D.C.
Annex 7. Washington, D.C. September.
Background Paper. Washington, D.C.
Telecom Mission, Aide-Memoire (LN. 4555-IN). 5 October.
. 2004h. Project Appraisal Document for an Elementary Education Project (Sarva Shiksha
.2004i. Securing Openness of Cross-Border Trade in Services. South Asia Region, Washington,
. 2004j. Sustaining India’s Services Revolution: Access to Foreign Markets, Domestic Reform and International Negotiations. South Asia Region, Washington, D.C.
. 2004k. World Development Indicators. Washington, D.C.
.20041. World Development Report 2005: A Better Investment Climate for Everyone. New York:
.2005a (forthcoming). Mexico’s Challenge of Knowledge-Based Competitiveness: Toward a
. 2005b (forthcoming). “The “How to” of Technological Adaptation for Faster Growth.” Draft.
Abhiyan). Washington, D.C.
D.C.
Oxford University Press.
Second-Generation NAFTA Agenda. Washington, D. C.
Economic Policy, Poverty Reduction and Economic Management Network, Washington, D.C. February.
http://www .ramdhanyk.com/movabletype/archives/thoughtprocess/OO 1209. h t d .
http://www 1 .economictimes.indiatimes.com/articleshow/2 17263.cms.
WorldisGreen.Com. 2004. “Bharti Launches India Fruit Venture.” 17 September.
Zachariahs, Candice. 2003. “GE India’s Got a Secret Weapon.” The Economic Times. 6 October.
149
Copyright © 2022 FDOKUMEN


![Brazil-India Relations Through the Lens of Political Economy [Book Chapter, 2014]](https://static.fdokumen.com/doc/165x107/63200d4501d52108cc0195cc/brazil-india-relations-through-the-lens-of-political-economy-book-chapter-2014.jpg)