Leveraging Migration for Africa - World Bank Document
236
LEVERAGING MIGRATION for AFRICA Remittances, Skills, and Investments Public Disclosure Authorized Public Disclosure Authorized Public Disclosure Authorized Public Disclosure Authorized Public Disclosure Authorized Public Disclosure Authorized Public Disclosure Authorized Public Disclosure Authorized
-
Upload
khangminh22 -
Category
Documents
-
view
0 -
download
0
Transcript of Leveraging Migration for Africa - World Bank Document

LEVERAGING MIGRATION for AFRICA
Remittances, Skills, and Investments
Pub
lic D
iscl
osur
e A
utho
rized
Pub
lic D
iscl
osur
e A
utho
rized
Pub
lic D
iscl
osur
e A
utho
rized
Pub
lic D
iscl
osur
e A
utho
rized
Pub
lic D
iscl
osur
e A
utho
rized
Pub
lic D
iscl
osur
e A
utho
rized
Pub
lic D
iscl
osur
e A
utho
rized
Pub
lic D
iscl
osur
e A
utho
rized
wb112742
Typewritten Text
61636


Leveraging Migration for Africa


Leveraging Migration for AfricaRemittances, Skills, and Investments
Dilip Ratha
Sanket Mohapatra
C ag lar Özden
Sonia Plaza
William Shaw
Abebe Shimeles
Washington, DC

© 2011 The International Bank for Reconstruction and Development / The World Bank1818 H Street NWWashington DC 20433Telephone: 202-473-1000Internet: www.worldbank.org
All rights reserved
1 2 3 4 14 13 12 11
This volume is a product of the staff of the International Bank for Reconstruction and Devel-opment / The World Bank. The fi ndings, interpretations, and conclusions expressed in this volume do not necessarily refl ect the views of the Executive Directors of The World Bank or the governments they represent.
The World Bank does not guarantee the accuracy of the data included in this work. The boundaries, colors, denominations, and other information shown on any map in this work do not imply any judgement on the part of The World Bank concerning the legal status of any territory or the endorsement or acceptance of such boundaries.
Rights and PermissionsThe material in this publication is copyrighted. Copying and/or transmitting portions or all of this work without permission may be a violation of applicable law. The International Bank for Reconstruction and Development / The World Bank encourages dissemination of its work and will normally grant permission to reproduce portions of the work promptly.
For permission to photocopy or reprint any part of this work, please send a request with complete information to the Copyright Clearance Center Inc., 222 Rosewood Drive, Danvers, MA 01923, USA; telephone: 978-750-8400; fax: 978-750-4470; Internet: www.copyright.com.
All other queries on rights and licenses, including subsidiary rights, should be addressed to the Offi ce of the Publisher, The World Bank, 1818 H Street NW, Washington, DC 20433, USA; fax: 202-522-2422; e-mail: [email protected].
ISBN: 978-0-8213-8257-8eISBN: 978-0-8213-8718-4DOI: 10.1596/978-0-8213-8257-8
Library of Congress Cataloging-in-Publication Data
Leveraging migration for Africa : remittances, skills, and investments / edited by Dilip Ratha. p. cm. Includes bibliographical references and index. ISBN 978-0-8213-8257-8 — ISBN 978-0-8213-8718-4 (electronic) 1. Emigrant remittances—Africa. 2. Africa—Emigration and immigration—Economic aspects. 3. African diaspora—Economic aspects. 4. Investments, Foreign—Africa. 5. Economic development—Africa. I. Ratha, Dilip. HG3982.L48 2011 338.96—dc22 2011012319
Cover painting: Diana Ong/SuperStock by Getty ImagesCover design: Drew Fasick

v
Foreword xi
Acknowledgments xiii
Abbreviations xvii
Introduction and Summary 1Trends in African Migration 1Managing Migration 3Improving the Effi ciency of Migrant Remittances 4Addressing High-Skilled Migration 7Eliciting Contributions from Diasporas 9The Way Forward 11Bibliography 12
Chapter 1 Migration Patterns and Policies in Africa 13Migration from and within Africa 15Immigration to Africa 23Understanding Cross-Country Migration Patterns 23Socioeconomic Characteristics of Migrants from Africa 26Managing Migration 30Annex 1A 38Notes 40Bibliography 41
Chapter 2 Migrant Remittances 47Recent Remittance Trends and the Impact of the Global Financial Crisis 49Implications of Remittances at the Macroeconomic Level 54
Table of Contents

vi • Table of Contents
Development Impact of Remittances at the Microeconomic Level 60Remittance Markets in Africa 73Toward Less Costly and More Transparent Remittances: Policy Changes 84Annex 2A 92Notes 96Bibliography 99
Chapter 3 Migration of the Highly Skilled 109Benefi ts and Patterns of High-Skilled Migration 111Earnings of Tertiary-Educated Migrants in Destination Labor Markets 124Policy Options 137Notes 142Bibliography 143
Chapter 4 Harnessing the Resources of the Diaspora 147Locating the African Diaspora 148Benefi ting from Diasporas 150An Emerging Policy Agenda to Maximize the Benefi ts of Diasporas 165Annex 4A Examples of African Government Institutions Dealing with Diaspora Communities Abroad 177Notes 180Bibliography 183
Boxes1.1 Problems with Data on African Migration 161.2 Forced Migration in Africa 201.3 The Social Costs and Benefi ts of Migration 311.4 The Evolution of European Policies toward Migration
from Africa 36
2.1 How Do Remittances Affect Education Outcomes? 662.2 Moving Money through M-Pesa in Kenya 812.3 Post Offi ces and Remittances in Africa: A Pilot Project in
West Africa 852.4 Policy Initiatives on Remittances in Africa 862.5 Increasing Transparency and Competition in Remittance
Markets: Wall Street Reforms and the European Union’s Payment Services Directive 88

Table of Contents • vii
3.1 The Brain Gain 1123.2 Migration Patterns of Ghana’s Best and Brightest 1263.3 Ghana: A Case Study of Emigrant Physicians 1323.4 Incentives to Retain Health Professionals in Ghana 139
4.1 Defi ning Diasporas 1494.2 A Case Study of African Associations in Denmark 1624.3 Educating the Rwandan Diaspora about Elections in
Rwanda 1684.4 The Role of Embassies in Enabling Diasporas 174
Figures1 Stock of Emigrants from Africa, 2010 22 Remittances and Other Resource Flows to Africa,
1990–2010 53 High-Skill Migration Rates in Africa, by Country Size and
Income Level, 2000 84 Major Destination Countries for Emigrants from Africa,
2010 10
1.1 Major Destination Countries for Emigrants from Africa, 2010 17
1.2 Rate of Migration, by Country, 2010 181.3 Major Migration Corridors in Sub-Saharan Africa, 2010 221.4 Rate of Immigration to African Countries, 2010 241.5 Relationship between Intra-African Migration and
per Capita GDP, 2006 241.6 Relationship between Emigration Rates to OECD Countries
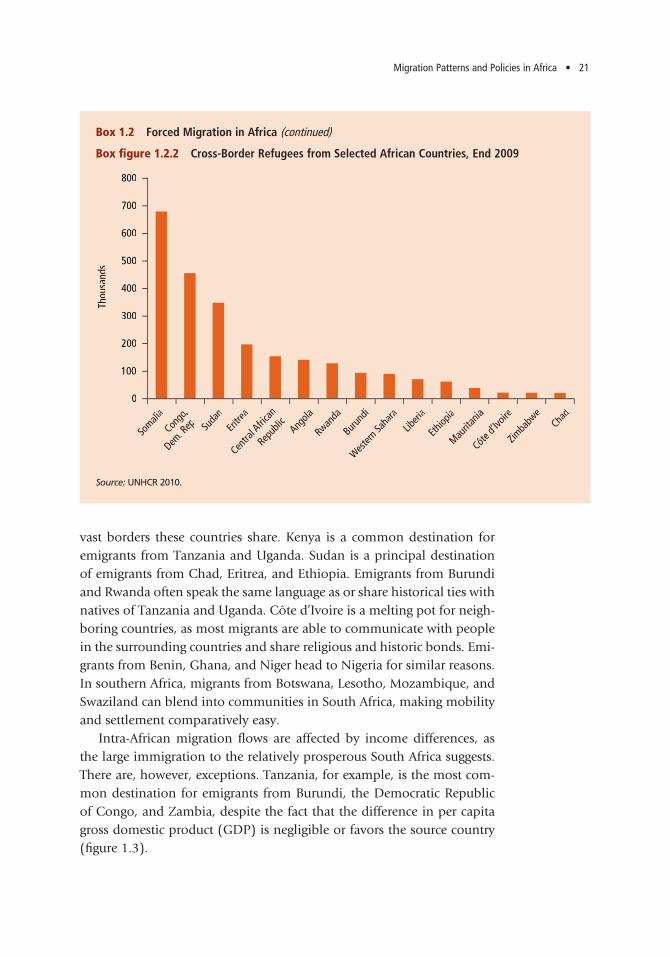
and Log per Capita GDP in Africa, 1990–2000 251.7 Relationship between Colonial Links and Emigration
Patterns in Africa 26
2.1 Remittances and Other Resource Flows to Africa, 1990−2010 50
2.2 Source of Remittances to Africa and to All Developing Regions, 2010 53
2.3 Stability of Various Sources of Resource Flows to Africa, 1990–2008 55
2.4 External Debt as a Share of Exports from and Remittances to Selected Countries in Sub-Saharan Africa 56
2.5 Percentage of Remittance Recipients in Top Two Consumption Quintiles in Selected African Countries,
by Source of Remittances 61

viii • Table of Contents
2.6 Average Annual Remittances in Selected African Countries, by Source of Remittances 62
2.7 Secondary and Tertiary Education Attainment of Remittance Recipient and Nonrecipient Households
in Selected Countries in Africa 672.8 Share of Population in Burkina Faso and Ghana with
Concrete Houses, by Remittance Status 702.9 Percent of Households with Bank Accounts in Selected
African Countries, by Remittance Status 722.10 Factors Inhibiting the Use of Formal Remittance
Channels in Sub-Saharan Africa and All DevelopingCountries 74
2.11 Cost of Sending Remittances to and from Developing Regions 75
2.12 Cost of Sending $200 within Sub-Saharan Africa 762.13 Measures of Retail Banking Accessibility in Developing
Regions 772.14 Formal and Informal Remittance Channels in Africa 792.15 Most Important Areas Related to Migrants and Remittances
Needing Attention, According to Central Banks inSub-Saharan Africa 87
3.1 Share of Migrants in Labor Force, by Region, 1990 and 2000 113
3.2 Migration Rate among Tertiary-Educated Workers, 1990 and 2000 114
3.3 Share of Tertiary-Educated Migrants among All Migrants,1990 and 2000 114
3.4 Share of Tertiary-Educated Workers in the Labor Force, 2000 115
3.5 Tertiary-Educated Migration Rates in Selected African Countries 117
3.6 Migration Rates in Africa, by Country Size, 1990 and 2000 1183.7 Migration of Tertiary-Educated Workers in Africa,
by Country Income Level, 2000 1193.8 Distribution of Total Migrants and Skilled Migrants from
Africa by Destination, 1990 and 2000 1213.9 Distribution of Migrants and Skilled Migrants from
Selected Anglophone Countries in Africa, 2000 1223.10 Distribution of Total Migrants and Skilled Migrants from
Selected Francophone Countries in Africa, 2000 1233.11 Probability That an African-Born Migrant Holding a
Bachelor’s or Professional Degree Obtains a Skilled Job in the United States 125

Table of Contents • ix
3.12 Stock of Migrant Physicians in OECD Countries as Percentage of Locally Trained Physicians in Source
Region, by World Region 1303.13 Number of African-Trained Physicians in Africa and
in OECD Countries, 1991–2004 1313.14 Number of African Physicians Working in Selected
OECD Countries, 1991 and 2004 1343.15 African Countries with Highest Rates of Physician
Emigration, 1991 and 2004 1343.16 Migration Rates among Nurses, by Country, 2000 136
4.1 Top Countries of Origin of African Immigrants in the United States, 2010 150
4.2 Migration and Trade Go Hand in Hand: African and OECD Countries 152
4.3 Investments in Business and Housing Funded by Remittances from within and outside Africa 154
Tables1.1 Emigrants as Percentage of the Population in Selected
World Regions, 2010 161.2 Origin and Destination of Emigrants, by World Region,
2010 191.3 Migration within and outside Africa 191.4 Projected Changes in the Size of the Working-Age
Population in Selected World Regions, 2005–50 231.5 Characteristics of Migrants from Selected African Countries 271.6 Occupation of Individuals from Burkina Faso before
and after Migrating, 2009 291.7 Labor Market Status of Individuals from Selected African
Countries before and after Migrating, 2009 291.8 Return Migration in Selected African Countries 301A.1 Net Migration Rates in Africa per 1,000 People, 1975–2010 38
2.1 Remittances and Other Resource Flows to Africa, 1990–2010 502.2 Securitization Potential for Sub-Saharan Africa, 2009 572.3 Use of Remittances by Recipient Households in Selected
African Countries, by Source of Remittances 642.4 Food Security Strategies and Remittance Receipts among
Ethiopian Households 692.5 Household Access to Information and Communication
Technology in Selected African Countries, by Remittance Status 71

x • Table of Contents
2A.1 Remittance Flows to African Countries, 2006–10 922A.2 Formal and Informal Remittance Channels in Selected
African Countries, 2009 93
3.1 High-Skilled Migration Rates in Sub-Saharan African Countries of Different Sizes and Income Levels, 2000 120
4.1 Estimated Savings by Migrants from Selected African Countries, 2009 157
4.2 African Countries Permitting and Prohibiting Dual Citizenship for Adults 167
4A.1 African Government Institutions Dealing with Diaspora Communities Abroad 177
xi
Every country in Africa has been affected by international migration, in all its forms. Some people choose to migrate; others are forced to do so by natural disasters or confl ict. Migration has often been viewed as a “brain drain” rather than an opportunity. Technological progress has made it easier for migrants to stay in touch with the country they left behind and to contribute to its social and economic development. Until recently, few governments and institutions in Africa recognized the potential contribu-tion that the diaspora could make, if properly managed, to the economic transformation of the continent.
The projected rise in the labor force in poor regions and decline in rich and some emerging economies in the next few decades are expected to create substantial imbalances in the global labor market. If not addressed, these imbalances could have negative long-term economic consequences in both regions. Climate change, which can be addressed only through early preparedness and innovative solutions, is also expected to drive increases in migration from the most populated areas in Africa. Despite pressures for migration and rapid improvements in transportation and communication technology, global migration is occurring at a much slower pace than the movement of goods and capital across the globe, owing to the presence of barriers to migration. And these barriers are likely to rise going forward, as recent increases in immigration and the fi nancial crisis have made migration a sensitive issue in the minds of the public as well as policy makers in the developed and developing worlds.
This fl agship report by the African Development Bank and the World Bank comes at a time when countries are grappling with diffi cult choices on how to manage international migration. Both institutions place great emphasis on the role of migrants in social and economic development. They work in close collaboration with African governments, private
Foreword

xii • Foreword
sector operators, diaspora associations, and other stakeholders to create an environment that encourages the mobilization and effective utiliza-tion of the fi nancial and intellectual resources of migrants for the devel-opment of Africa.
Most countries in Africa face severe fi nancing gaps that impede their development and are in need of fi nance for infrastructure and the transfer of technology. Traditional sources of fi nance, such as offi cial develop-ment assistance and foreign direct investment, have generally proven to be inadequate and unpredictable. By contrast, remittances have increased strongly over the past decade, easing the foreign exchange constraint fac-ing most countries and becoming a reliable source of external fi nance. Leveraging the developmental impact of remittances is high on the agenda of both the African Development Bank and the World Bank. Innovative fi nancing mechanisms such as securitization of future remit-tance fl ows and issuance of diaspora bonds could help fi nance big-ticket projects, such as railways, roads, power plants, institutions of higher learning, institution building, and related projects that are critical for Africa’s economic transformation.
Migration is an integral part of the agenda for regional economic inte-gration that has made headway in the past decade. This report provides a wealth of information on migration and remittance trends, as well as an analysis of the determinants of migration and a discussion of policies that Africa and its partners should adopt to improve the developmental impact of migration. The report also outlines various means through which diaspora resources can be harnessed to promote economic devel-opment in Africa.
The report is a product of a longstanding joint effort by the African Development Bank and the World Bank that exemplifi es solid partner-ship built on mutual respect, collegiality, and professionalism.
Shantayanan Devarajan Chief Economist, Africa Region The World Bank
Mthuli NcubeChief Economist and Vice PresidentAfrican Development Bank
Hans TimmerDirectorDevelopment Prospects GroupThe World Bank

xiii
This report was prepared by the Migration and Remit-tances Unit of the World Bank and the Development Research Department of the African Development Bank. The lead author of the report is Dilip Ratha. The principal authors of the chapters are Abebe Shimeles and William Shaw (chapter 1), Sanket Mohapatra (chapter 2), Çag lar Özden (chapter 3), and Sonia Plaza (chapter 4). William Shaw provided comments and suggestions on all the chapters throughout the preparation of the report. Uri Dadush, Shantayanan Devarajan, Louis Kasekende, Mthuli Ncube, Leonce Ndikumana, John Page, and especially Hans Timmer provided guidance to the team at various stages of the study. Manolo Abella, Richard Adams, Jr., Abdous-alam Drame, Marguerite Duponchel, Suhas Ketkar, Anthony Kusi, Loren B. Landau, David McKenzie, Birgitte Mossin Brønden, John Oucho, Peter Hansen, Nauja Kleist, Elina Scheja, William Shaw, Lars Trans, Simon Turner, and Ida Vammen prepared back-ground papers for the report.
Special thanks are due to Johannes Koettl, Subha Nagarajan, Désiré Vencatachellum, and Peter Walken-horst for contributions to chapter 1; Jose Anson and Nils Clotteau for information on the role of post offi ces in remittances in chapter 2; Mirvat Sewadeh for signifi cant contributions; David McKenzie for the box on the emigration of Ghana’s best and brightest
Acknowledgments
Agencecanadienne dedéveloppementinternational
CanadianInternationalDevelopment Agency

Ministry of the interior,overseas france, local authorities and immigration
xiv • Acknowledgments
in chapter 3; Chris Parsons and Frédéric Docquier for their help with datasets in chapter 3; and Jacqueline Irving and Seifu Mehari for chapter 4.
Kaouther Abderrahim, Manka Angwafo, Sohini Chatterjee, Aymen Dhib, Farai Jena, Onitola Oni, Carly Petracco, Ani Silwal, and Zhimei Xu provided research assistance. Neil Ruiz provided excellent assistance in project coordination throughout.
David McKenzie, Mustapha K. Nabli, and David Olusanya Ajakaiye served as peer reviewers during the project’s advisory committee meeting. Shanta Devarajan, Punam Chuhan-Pole, Maureen Lewis, Benjamin Musuku, and Raju Singh served as inter-nal peer reviewers of the consultation draft. Special thanks to Michael Clemens, Uri Dadush, Sarah Lahmani, Thomas Melonio, Leonce Ndikumana, and Rosemary Vargas-Lundius for serving as external referees of the consultation draft.
Barfour Osei was a part of the team during the initial stages of the project and provided guidance and support. For their generous comments and sup-port, special thanks go to Martin Alsop, Jeff Dayton-Johnson, Thomas Debass, Pedro de Lima, Rick Erle-bach, Tim Green, Robert Holzman, Bela Hovy, Arun Kashyap, Sarah Lahmani, Robert E. B. Lucas, Leonce Ndikumana, Kerry Nelson, David Olusanya Ajakaiye, and Rosemary Vargas-Lundius.
The report draws on primary surveys of migrants’ households in Burkina Faso, Kenya, Nigeria, Senegal, South Africa, and Uganda, managed by Sonia Plaza and with administrative aspects coordinated by Neil G. Ruiz. Advice on survey methodology came from Richard Adams Jr., Richard Bilsborrow, Juan Muñoz, and Mario Navarrete, and is gratefully acknowledged. The surveys were conducted by the Université de Oua-gadougou (for Burkina Faso), the Consortium pour la Recheche Economique et Social (CRES) (for Sen-egal), the Human Sciences Research Council (HSRC) (for South Africa), Makerere Statistical Consults Ltd. (for Uganda), the University of Nairobi School of
Enabling poor rural peopleto overcome poverty

Acknowledgments • xv
Economics (for Kenya), and Zibah Consults Ltd. (for Nigeria). Carly Petracco and Adriana Castaldo helped with the analysis of the survey data.
The report also draws on surveys of remittance ser-vice providers conducted in Burkina Faso, Cape Verde, Ethiopia, France, Ghana, Kenya, Nigeria, Uganda, Sen-egal, and the United Kingdom, which were managed by Sanket Mohapatra, with the administrative aspects coordinated by Neil Ruiz. The surveys were conducted by Yiriyibin Bambio in Burkina Faso, Georgiana Pop in Cape Verde, Alemayehu Geda and Jacqueline Irving in Ethiopia, Frédéric Ponsot in France, Peter Quartey in Ghana, Rose Ngugi in Kenya and Uganda, Chukwuma Agu in Nigeria, Fatou Cisse in Senegal, and Leon Isaacs in the United Kingdom. Thanks also go to Antonio C. David, for his invaluable contributions to the surveys at the initial stage of the project.
The report benefi ted from interviews with govern-ment offi cials, embassy and consulate staff, and lead-ers of the diaspora associations conducted in 2009 in Abu Dhabi, London, New York, Paris, Philadelphia, Pretoria, and Washington, DC.
This study was made possible by the fi nancial sup-port of the African Development Bank; the Canadian International Development Agency (CIDA); the U.K. Department of International Development (DFID); the French Ministry of Immigration, Integration, Asy-lum and Solidarity Development; the Danish Inter-national Development Agency (DANIDA), part of the Ministry of Foreign Affairs of Denmark; the Interna-tional Fund for Agricultural Development (IFAD); and the Swedish International Development Coop-eration Agency (SIDA).
Book design, editing, and production were coor-dinated by Fayre Makeig and by Steven McGroarty, Aziz Gökdemir, Mary Fisk, and Denise Bergeron of the World Bank Offi ce of the Publisher.


xvii
(all dollar amounts are in U.S. dollars)
ADB Asian Development Bank
ADHA Additional Duty Hours Allowance
AIDS acquired immune defi ciency syndrome
AKPA Association of Kenyan Professionals in Atlanta
AML-CFT anti–money laundering and combating the fi nancing of terrorism
API Agency for Promotion of Investments (Mali); Agency for the Promotion of Industry (Tunisia)
ARI African Remittances Institute
ATM automatic teller machine
AU African Union
AUC African Union Commission
BIS-CPSS Bank for International Settlements—Committee on Payment and Settlement Systems
BRIDGE Building Remittance Investments for Development, Growth and Entrepreneurship
CEMAC Communauté Économique et Monétaire de l’Afrique Centrale (Economic and Monetary Community of Central Africa)
CEPEX Centre de Promotion des Exportation (Export Promotion Centre)
CGAP Consultative Group to Assist the Poor
COMPAS Centre on Migration, Policy and Society
Abbreviations

xviii • Abbreviations
DCI Development Corporation for Israel
DNA Diaspora Networks Alliance
DUTFS Diaspora Unit Trust Funds Schemes
EAC East African Community
ECA Economic Commission for Africa
ECOSOCC Economic, Social and Cultural Council of the African Union
ECOWAS Economic Community of West African States
e-money electronic money
EU European Union
FAR Future of African Remittances
FDI foreign direct investment
GCC Gulf Cooperation Council
GDDA–UK Ghanaian Doctors and Dentists Association United Kingdom
GDP gross domestic product
HIV human immunodefi ciency virus
HTA hometown association
ICMPD International Centre for Migration Policy Development
IFAD International Fund for Agricultural Development
ILO International Labour Organization
IMF International Monetary Fund
INEC Independent National Electoral Commission
IOM International Organization for Migration
IT information technology
KAIF Kenyans Abroad Investment Fund
KEPSA Kenya Private Sector Alliances
MIDA Migration for Development in Africa
MME Migration, Mobility, and Employment
NEC National Electoral Commission
NHS National Health Service
NIDO Nigerians in Diaspora Organization
NIDOE Nigerians in Diaspora Organisation Europe
NIPC Nigerian Investment Promotion Commission
NRI nonresident Indian

Abbreviations • xix
OCI overseas citizenship of India
OECD Organisation for Economic Co-operation and Development
OSIC One Stop Investment Centre
PATC Project Advice and Training Centre
PIO person of Indian origin
R&D research and development
RISE Regional Initiative in Science and Education
RSP remittance service provider
SAFE Strategy for Assuring Financial Empowerment
SANSA South African Network of Skills Abroad
TOKTEN Transfer of Knowledge through Expatriate Nationals
UNDP United Nations Development Programme
UNESCO United Nations Educational, Scientifi c and Cultural Organization
UNHCR United Nations High Commissioner for Refugees
UNPD United Nations Population Division
USAID United States Agency for International Development
WALTPS West African Long-Term Perspective Study
WITS World Integrated Trade Solution


Introduction and Summary
1
International migration has profound implications for human wel-fare, and African governments have had only a limited infl uence on welfare outcomes, for good or ill. Improved efforts to manage migra-
tion will require information on the nature and impact of migratory patterns. This book seeks to contribute toward this goal, by reviewing previous research and providing new analyses (including surveys and case studies) as well as by formulating policy recommendations that can improve the migration experience for migrants, origin countries, and destination countries.
The book comprises this introduction and summary and four chap-ters. Chapter 1 reviews the data on African migration and considers the challenges African governments face in managing migration. Chapter 2 discusses the importance of remittances, the most tangible link between migration and development; it also identifi es policies that can facilitate remittance fl ows to Africa and increase their development impact. Chap-ter 3 analyzes high-skilled emigration and analyzes policies that can limit adverse implications and maximize positive implications for develop-ment. Chapter 4 considers ways in which Africa can leverage its diaspora resources to increase trade, investment, and access to technology.
TRENDS IN AFRICAN MIGRATION
According to offi cial statistics, about 30 million Africans—about 3 per-cent of the population—have migrated internationally (including within Africa). This fi gure—which includes both voluntary migrants and interna-tional refugees—almost certainly underestimates the size and importance of migration from and particularly within Africa.

2 • Leveraging Migration for Africa: Remittances, Skills, and Investments
The percentage of a country’s population that has emigrated varies greatly across Africa (fi gure 1). It is particularly large in countries with small populations (because of limited diversifi cation of economic activi-ties within national borders) or histories of confl ict.
About two-thirds of migrants from Sub-Saharan Africa, particularly poorer migrants, go to other countries in the region; the bulk of migrants remain within their subregions. In West Africa, for example, more than 70 percent of intra-African emigration was within the subregion. In contrast, more than 90 percent of migrants from North Africa travel to countries outside the region. Migrants from middle-income countries dis-proportionately migrate to destinations outside Africa, whereas emigrants originating from poorer countries generally go to neighboring countries.
New data on migration from household surveys conducted in Bur-kina Faso, Ghana, Nigeria, and Senegal indicate that migrants tend to be young adults (two-thirds of Burkina Faso’s emigrants were between the ages of 15 and 40) and male (more than 90 percent in Burkina Faso), generally with some education beyond primary school. Migration from these countries resulted in signifi cant occupational changes, in partic-ular a transition from farming to trading, semi-skilled employment, and professional jobs.
Figure 1 Stock of Emigrants from Africa, 2010 (percent of population)
Source: Authors, based on data from World Bank 2011.
40
perc
ent o
f pop
ulat
ion
30
20
10
0
Cape V
erde
São T
omé &
Prínc
ipe
Leso
thoEri
trea
Equa
torial
Guin
ea
Seych
elles
Swaz
iland
Mauriti
us
Liberi
a
Zimba
bwe
Burkina
Faso
Morocco
Somali
aMali
Guinea
-Bissau
Tunis
iaBen
in
Comoro
s
Congo
, Rep
.To
go

Introduction and Summary • 3
Offi cial statistics indicate that migration rates are not particularly high in African countries on average. But migration touches the lives of hun-dreds of millions throughout the continent. Many Africans have moved to new countries, in most cases neighboring ones, without bothering to cross at border posts or register with offi cials. Each migrant may support a signifi cant network of family members in the home country through remittances; in areas of heavy out-migration, economic activity is often highly dependent on these infl ows. Demographic factors are likely to increase migration substantially over the next decade, particularly to countries in the Organisation for Economic Co-operation and Develop-ment (OECD), as the working-age population is projected to grow signifi -cantly in Africa and to decline in the OECD.
Improving the gains from migration will require an understanding of where and how African governments should intervene, given their lim-ited resources, and what destination countries can do, given their differ-ent interests and policy constraints. This volume therefore focuses on four key policy areas where governments can make a difference: managing migration, improving the effi ciency of migrant remittances, addressing high-skilled migration, and eliciting contributions from diasporas.
MANAGING MIGRATION
Limited fi nancial and technical resources, borders that are long and dif-fi cult to police, and ethnic ties across borders have combined to establish a relatively control-free environment for cross-border migration within Africa. The lack of an effective legal and institutional framework to govern migration signifi cantly increases the risks and costs facing migrants. Many migrants from Africa are vulnerable to traffi ckers, in physical danger dur-ing desert or sea crossings, and largely at the mercy of exploitative prac-tices in destination countries. In several African countries, inadequate leg-islation, poor enforcement, and social attitudes make traffi cking diffi cult to combat, a situation that is exacerbated by rules in destination countries that leave migrants, particularly women, in the power of employers and border offi cials. Engaging in stricter law enforcement, providing informa-tion on the dangers of migration, improving regulation of intermediaries, and ensuring that children have adequate support at home (so they do not have to migrate) would help fi ght traffi cking. But rules that seek to protect or control women by restricting their right to migrate can force them into illegal channels, increasing rather than decreasing their vul-nerability to traffi ckers. Some African governments have exacerbated the diffi culties facing migrants through mass expulsions, the use of violence

4 • Leveraging Migration for Africa: Remittances, Skills, and Investments
against unauthorized migrants, and their failure to limit the depredations of the police and other offi cials against undocumented migrants.
Bilateral agreements supporting temporary migration programs can be used to increase legal migration from African countries. But these pro-grams require careful monitoring to protect migrants from exploitation by employers and intermediaries. The resources required to oversee such programs mean that they can cover only a small proportion of undocu-mented migrants.
IMPROVING THE EFFICIENCY OF MIGRANT REMITTANCES
Remittance infl ows to Africa quadrupled in the 20 years since 1990, reaching nearly $40 billion (2.6 percent of GDP) in 2010. They are the continent’s largest source of net foreign infl ows after foreign direct invest-ment (FDI) (fi gure 2).
Remittance receipts generate large benefi ts for emigrants’ countries of origin. At the macro level, remittances tend to be more stable than other sources of foreign exchange; their variation is often countercyclical, help-ing sustain consumption and investment during downturns; and they improve sovereign creditworthiness, by increasing the level and stability of foreign exchange receipts.
At the micro level, both country studies and cross-country analyses have shown that remittances reduce poverty. They also spur spending on health and education, as a result of both higher household incomes and—according to some studies—the devotion of a larger share of remittances than other income sources to these services. In addition, remittances provide insurance against adverse shocks by diversifying the sources of household income. For example, a recent study fi nds that Ethiopian households that receive international remittances are less likely than other households to sell their productive assets, such as livestock, to cope with food shortages.
Large remittance infl ows can present a macroeconomic challenge, how-ever, by causing the exchange rate to appreciate, potentially reducing the production of tradable goods. Policy makers in countries that receive very large remittance infl ows should be alert to their impact on the exchange rate, particularly where supply constraints are a signifi cant hindrance to the expansion of the nontradable sector and a signifi cant portion of remit-tances are spent on domestic nontradables. In addition to maintaining a fl exible exchange rate and considering the true level of remittance infl ows when crafting targets for reserves policies and money supply growth, pol-icy makers can implement microeconomic interventions aimed at easing

Introduction and Summary • 5
labor market rigidities and reforms aimed at improving competitiveness to limit the potential danger of excessive exchange rate appreciation. Large remittance infl ows could also impair growth by reducing the supply of labor, although there is little evidence of this effect.
Remittance fl ows are likely signifi cantly underestimated: only about half of the countries in Sub-Saharan Africa collect remittance data with any regularity, and some major receivers of remittances report no data at all. Few African countries report monthly or quarterly data on remit-tances. African central banks and statistical agencies can improve the woefully inadequate collection of data on remittances by expanding the reporting of remittances from banks to other providers of remit-tance services, such as companies that facilitate money transfers, post offi ces, savings cooperatives, and microfi nance institutions. They can use household surveys and surveys of emigrants to estimate remittance fl ows through formal and informal channels. Labor ministries and embassies in destination countries can also help estimate the volume and costs of remittance transactions.
Policy makers need to increase the transparency and effi ciency of the markets for remittance services. The cost of sending remittances to Sub-Saharan Africa averaged almost 12 percent of a $200 transaction, compared with less than 8 percent for most other developing regions. The cost of cross-border remittances within Africa, if permitted at all, tends to
Figure 2 Remittances and Other Resource Flows to Africa, 1990–2010
Source: Authors, based on data from the World Bank Global Development Finance 2010 database.
e = estimated.
–20
–10
0
10
20
30
40
50
60FDI
Official aidRecordedremittances
Portfolio equity& private debt
US$
bill
ions
1990
1991
1992
1993
1994
1995
1996
1997
1998
1999
2000
2001
2002
2003
2004
2005
2006
2007
2008
2009
2010
e

6 • Leveraging Migration for Africa: Remittances, Skills, and Investments
be even higher. Governments in both sending and receiving countries (in Africa and elsewhere) should discourage exclusive agreements between providers of remittance services (such as commercial banks, post offi ces, credit and savings cooperatives, microfi nance institutions, and mobile money transfer services) and international money transfer agencies, which keep costs high. Providing information on available remittance channels, maintaining databases of the prices charged, and promoting the fi nancial literacy of prospective migrants can strengthen competition in the market and encourage the use of formal channels. Over the long term, fi nancial development should reduce remittance costs by increas-ing access to fi nancial services in rural areas and poor communities and reducing the costs of opening bank accounts.
Post offi ces, credit cooperatives, rural banks, and microfi nance insti-tutions have large networks (particularly among the poor), providing a unique opportunity to expand formal remittance markets and improve access to fi nancial services among the poor and in rural areas. A recent survey found that 81 percent of post offi ces in Sub-Saharan Africa are located outside the three largest cities, where more than 80 percent of Africans live (by contrast, mainstream commercial banks in Africa are usually concentrated in the largest cities). Consistent with fi nancial sta-bility, the regulatory framework should support the provision of money transfer services by these institutions, which should be encouraged to partner with banks and money transfer operators. Such partnerships should not be exclusive agreements with a single money transfer opera-tor, as such limits on competition tend to raise the cost of remittances.
Technological advances have enormous potential to improve compe-tition and broaden the reach of formal remittance markets. Money trans-fer services through mobile phone networks have increased signifi cantly in Africa, especially for internal remittances in Kenya (the use of mobile phones to transfer international remittances is limited by concerns over money laundering). Governments can support this process by improv-ing their telecommunications infrastructure; harmonizing banking and telecommunications regulations to enable mainstream African banks to participate in mobile money transfers; and—to the extent consistent with public safety—simplifying anti-money laundering and combating the fi nancing of terrorism (AML-CFT) regulations for small-value transfers, which would facilitate mobile-to-mobile cross-border transactions.
Governments can potentially improve their access to international capital markets by issuing bonds that are securitized by future remittance infl ows. Such transactions have been limited in African countries because of the overall low level of fi nancial development; weak protection of

Introduction and Summary • 7
creditor rights; volatile macroeconomic environment; lack of relation-ships with international banks; and high fi xed cost of legal, investment banking, and credit-rating services. Measures to improve the potential for remittance securitization include improving the measurement of remittances and encouraging fl ows through formal channels, obtaining sovereign ratings, and implementing a securitization law. Multilateral and bilateral donors can play a role in facilitating such transactions. Any increase in foreign currency debt, however, should be accompanied by prudential risk management.
ADDRESSING HIGH-SKILLED MIGRATION
The emigration of skilled workers can generate substantial benefi ts for ori-gin countries through remittances, contacts with foreign markets, technol-ogy transfer, enhanced skills of returning emigrants, and perhaps increased demand for education in the origin country. However, high-skilled emi-gration can also impair development by reducing the supply of critical services; limiting productivity spillovers to both high- and low-skilled workers; reducing the potential for innovative and creative activities that are at the core of long-term growth; and limiting contributions to the health of social, political, and economic institutions. The loss of workers educated at public expense can represent a substantial fi scal drain, and the many university-educated African emigrants who fail to obtain skilled jobs in high-income destination countries represent a lost investment in human capital (a recent study of the U.S. job market fi nds that immigrants with bachelor’s degrees from 7 of 15 African countries surveyed have less than a 40 percent chance of ending up in a skilled job).
Skilled migration rates are particularly high in Africa. In 2000 one out of every eight Africans with a university education lived in a country in the OECD, the highest rate among developing regions except the Carib-bean, Central America, and Mexico. Small and poor countries have lost an unusually large share of their skilled workforce (fi gure 3); the stock of skilled emigrants averages 30 percent of the skilled workforce in small countries and almost 25 percent in low-income countries—and these fi gures understate the impact of high-skilled migration if the most quali-fi ed workers migrate. In a survey of the top fi ve students graduating from the top 13 high schools in Ghana between 1976 and 2004, three-quarters had emigrated at some point between secondary school and age 35. The low supply of skilled workers in African economies refl ects limited edu-cational opportunities and, in many countries, low returns to education, as a result of diffi cult working conditions, an unfavorable investment

8 • Leveraging Migration for Africa: Remittances, Skills, and Investments
climate, or a small economy. Addressing the lack of skills in African workforces requires increasing opportunities for—and thus increasing the return to—education and training rather than limiting emigration.
A variety of educational policies could be designed to address the dis-advantages of tertiary-educated migration. Each has problems, however. Increasing tuition for publicly funded tertiary education would reduce the fi scal loss involved in the emigration of highly educated workers, but it is not in the interest of African economies to restrict the supply of gradu-ates or limit education to the rich by raising tuition levels. An alternative approach would be to determine eligibility for free education through academic testing and charge lower-scoring applicants full tuition.
Imposing service requirements as a condition of education or profes-sional registration could increase the availability of professionals. It could also encourage emigration to gain professional credentials and discour-age return, however. Graduates might agree to provide a few of years of service in underserved communities as a reasonable cost for subsidized education; some might even consider it an opportunity for postgraduate experience. Ghana experimented with requiring some medical profes-sionals to pay back a portion of their government-funded tuition if they failed to work in the country for a specifi ed time following graduation. Most doctors working abroad paid off the bond rather than complete the service requirement.
Figure 3 High-Skill Migration Rates in Africa, by Country Size and Income Level, 2000
Source: Authors, based on data in Docquier and Marfouk 2004.
0
5
10
15
20
25
30
35
SmallCountries
MediumCountries
LargeCountries
SouthAfrica
perc
ent o
f all
tert
iary
-edu
cate
d w
orke
rs
MiddleIncome
LowIncome

Introduction and Summary • 9
Countries could educate students in lower-level skills (for example, nurses’ or physicians’ assistants rather than nurses and physicians), which would reduce costs and the demand for graduates’ services in destination countries. Such (controversial) programs imply a trade-off between quan-tity and quality of service provision, however. They should be designed with regard to the country’s need for specialists rather than the implica-tions for emigration.
An option worth considering involves getting hiring institutions (for example, public or private hospitals) in receiving countries to open train-ing facilities in Africa. More intrusive policies, such as the imposition of a tax on professionals who emigrate and travel restrictions on educated workers, require the effective support of destination governments and may violate human rights.
Some countries have offered incentives, such as higher salaries, help in fi nding employment, or subsidies for housing and return expenses, to encourage the return of professionals. It is unclear whether such incen-tives are effective, as motivations for migration often include professional advancement and the quality of the research environment. Financial incentives for returnees may also penalize professionals who remained in the country or subsidize the return of people who would have returned in any event. The removal of biases against returning professionals, involv-ing the recognition of foreign qualifi cations and experience, could help facilitate return with limited fi scal costs. Destination countries (for exam-ple, France) and international organizations (for example, the United Nations Development Programme’s Transfer of Knowledge Through Expatriate Nationals [TOKTEN] program) have taken steps to encourage return. These programs have covered only a limited number of migrants, however, and their effectiveness has not been evaluated.
Destination-country policies encourage high-skilled emigration, by offering visas for temporary work or permanent settlement and by actively recruiting some professionals (particularly healthcare workers). Destination countries that benefi t from skilled immigration could be asked to compensate origin countries for this practice, in a way that does not simply replace existing aid fl ows. The controversy over the emigration of health professionals has encouraged public agencies in some countries to limit their foreign recruitment, but the impact of such restraint on overall recruitment levels has not been signifi cant.
ELICITING CONTRIBUTIONS FROM DIASPORAS
About half of Africa’s emigrants live outside Africa, primarily in Europe. The main extraregional destinations for African migrants include France

10 • Leveraging Migration for Africa: Remittances, Skills, and Investments
(9 percent of total emigrants), Saudi Arabia (5 percent), and the United States and the United Kingdom (4 percent each) (fi gure 4).
Destination countries’ growing diasporas offer a signifi cant opportu-nity to improve development by increasing direct investments, improv-ing access to foreign capital markets through investment funds and diaspora bonds, providing grants for development, establishing contacts to promote trade and investment, increasing demand for a country’s exports, and transferring technology (through, for example, professional associations that provide expertise to origin-country fi rms, temporary assignments of skilled expatriates in origin countries, and the return of emigrants with enhanced skills).
Allowing for dual citizenship can encourage greater participation by diasporas in their origin countries by facilitating travel; avoiding the con-straints foreigners face on some transactions (for example, temporary work, land ownership); and providing access to public services and social benefi ts. More broadly, dual citizenship can help maintain emotional ties with the origin country, thus encouraging continued contact and investment. Despite these benefi ts, only 25 of Africa’s 54 countries allow dual citizenship.
Facilitating voting by citizens of the origin country who reside abroad also can help solidify ties. Where such voting is permitted, improvements
Figure 4 Major Destination Countries for Emigrants from Africa, 2010
Source: Authors, based on data from World Bank 2011.
perc
ent o
f Afri
can
emig
rant
s
Franc
e
Côte d’
Ivoire
South
Africa
Saud
i Arab
ia
United
State
s
United
Kingdo
mSp
ain Italy
Burkina
Faso
Nigeria
Jorda
nKe
nya
Suda
n
Ugand
a
Tanz
ania
Portu
galLib
ya
Ethiop
iaIsr
ael
Rwanda
0
2
4
6
8
10

Introduction and Summary • 11
in registration processes and voting procedures (such as increasing the number of locations or allowing for voting by post) may be required.
A few African countries have established government agencies to encourage diasporas to invest, assist local communities, and provide policy advice. Such agencies are also involved in the collection of data on diasporas, the provision of information and counseling services, and the provision of consular services. The results of a recent survey of efforts by embassies from African governments to engage their diasporas found that several have little information on the number of diaspora members, that coordination between the embassies and government ministries is poor, and that there is an urgent need for orienting and training embassy staff on how to work with diaspora members.
Governments can help facilitate diaspora networks by supporting pro-fessional associations and arranging cultural events. In some countries, encouraging the growth of private sector networks may be more effec-tive than involving the government directly in establishing links to the diaspora. Investments in modern communications technology can help the private sector maintain links with diasporas.
Emigrants’ better access to information on their home countries and their greater tolerance of currency devaluation (because they hold local currency liabilities) can induce them to purchase bonds issued by public or private sector entities (“diaspora bonds”). A few governments have also encouraged investment in origin countries by allowing emigrants to enjoy continued social security coverage and to remain eligible for local savings schemes while abroad. Countries with large numbers of emi-grants, including Ghana, Nigeria, Senegal, and South Africa, have devel-oped plans to incorporate diaspora communities as partners in develop-ment programs. The effectiveness of such efforts has yet to be evaluated.
THE WAY FORWARD
International migration has tremendous potential to improve develop-ment and welfare in origin countries. African governments can play a signifi cant role in securing the benefi ts of migration by strengthening ties to diasporas, improving competition in remittance markets, designing educational policies in light of the challenges surrounding high-skilled emigration, and providing information and protection for emigrant workers. But limited fi scal and technical resources in African origin countries constrain the effectiveness of such policies and reduce the gains from migration while exposing migrants to severe risks. African govern-ments also face signifi cant diffi culties in managing immigration, which

12 • Leveraging Migration for Africa: Remittances, Skills, and Investments
can engender resentment and lead to repressive policies, such as mass expulsions, that impose heavy costs on migrants and disrupt African economies.
Africa is a continent of many small countries, which creates signifi cant pressures for international migration. Africa’s population is smaller than that of India, yet movements of people within Africa cannot occur within a common legal and political framework. This problem implies signifi -cant political challenges to governments and higher costs for migrants, who face different legal and regulatory systems, higher fees for remit-tances, and risks associated with undocumented migration.
Substantial efforts are required to reduce the costs and risks facing African migrants and to improve the benefi ts of migration to countries in the region. This book is an attempt to improve the information base so that African governments, destination countries, and the international community can improve migration policies.
BIBLIOGRAPHYDocquier, Frédéric, and Abdeslam Marfouk. 2004. “Measuring the International
Mobility of Skilled Workers (1990–2000). Release 1.0.” World Bank Policy Research Working Paper 3381, Washington, DC.
World Bank. 2011. Migration and Remittances Factbook 2011. Washington, DC: World Bank.

13
1CHAPTER
Migration Patterns and Policies in Africa
13
A frica is known for its long history of migration within and beyond the vast continent. The number of people of African descent that live outside the continent is estimated at almost 140 million, most
of them in the Western Hemisphere (Shinn 2008). Many of these people are not emigrants but members of families that have lived in destination countries for many generations and may have few ties to Africa. By con-trast, migrants that left their country in recent decades—conservatively estimated to number more than 30 million—have been able to keep in close contact with their relatives and maintain economic, social, and political relationships with their country of origin, mainly thanks to glo-balization and improvements in communications technology.
This chapter presents a broad description of international migration from Africa, based on studies, cross-country data, and household sur-veys.1 It focuses on differences in migration rates between Africa and other regions as well as on migration within regions and countries in Africa; the choice of destination country by African emigrants; the potential for increasing migration from Africa in the coming years; and the socioeco-nomic characteristics of migrants and migrant households. The analysis is based on offi cial data, which likely underestimate actual migration fl ows, particularly within Africa. Several conclusions emerge from this analysis:
• The majority of international migrants from Africa (particularly from the poorer countries) go to other African countries, as most potential emigrants lack both the fi nancial resources to travel to distant conti-nents and the education and skills required to succeed in rich coun-tries’ labor markets. In contrast, 90 percent of North African emigrants go to destinations outside of Africa, predominantly Europe, the Mid-dle East, and North America.

14 • Leveraging Migration for Africa: Remittances, Skills, and Investments
• African migration has been heavily infl uenced by the continent’s history of confl ict, coups, insurgencies, dictatorships, war, and natural disas-ters. Past emigration to the Organisation for Economic Co-operation and Development (OECD) countries appears to facilitate current emi-gration through network effects.
• Colonial ties continue to exert an infl uence on the choice of destina-tion countries, with half of African countries reporting that the most common destination for emigrants is the former colonizer.
• Recent household surveys of a few countries (Burkina Faso, Nigeria, and Senegal) provide some tentative information on the profi le of African emigrants. Migrants from these countries tend to be young, relatively well educated, and predominantly male. The probability of a household having a member abroad is positively related to family size, education, and wealth. The majority of migrants from the households surveyed left their country to obtain employment. Migration tends to have a dramatic impact on the labor market status of migrants, often refl ecting a shift from self-employment to wage employment. The rate of return migration from households in these surveys is relatively low (less than 10 percent of total emigrants in Nigeria and Senegal).
• Large differences in potential earnings, the aging of populations in high-income countries, the rapid increase in working-age cohorts in Africa (and the decline of such cohorts in Europe and North America),2 and the importance of network effects will continue to boost pressures for emigration from Africa to high-income countries. Whether these increases in the demand for and supply of migrants result in more migration will depend, in part, on policy decisions. The willingness of high-income countries to accept migrants, and their ability to effectively control their borders, will be tested in the years to come. Potential migrants will need to obtain the skills required to make them competitive in high-income labor markets: poor African laborers who lack education and language skills have little ability to secure jobs in Europe or the United States. Migration decisions will also be affected by the ability of African governments to establish the framework required for rapid development and income-earning opportunities. Migration can provide enormous welfare benefi ts to developing countries, but ultimately development should reduce the need for migration.
• African governments face major challenges in managing migration. Governments could help protect migrants by improving regulation of intermediaries, strengthening legal safeguards against traffi cking, and providing information on the potential dangers involved in illegal bor-

Migration Patterns and Policies in Africa • 15
der crossings and exploitative practices by destination country offi cials and employers. Undocumented migration is accepted in many areas—particularly where migrants come from contiguous areas of neighbor-ing countries and have ethnic ties to people in their new country—but can be a source of considerable social tension. Coping with undocu-mented migration is a daunting challenge in both rich and poor coun-tries. At a minimum, governments should prevent violent or exploita-tive practices such as mass expulsions or tolerance of corrupt offi cials who prey on undocumented immigrants. International cooperation can support better management of migration through well-regulated temporary migration programs, which need to be carefully super-vised to avoid the exploitation of migrants. The substantial resources required to effectively supervise such programs means that they can cover only a very small proportion of potential emigrants.
The chapter is organized as follows. The fi rst section documents migration trends from and within Africa. The second section looks at immigration to Africa. The third section examines cross-country migra-tion patterns. The fourth section identifi es the socioeconomic character-istics of migrants from Africa. The last section suggests what countries can do to manage migration.
MIGRATION FROM AND WITHIN AFRICA
Emigration from Africa has increased substantially over the past several decades (see Russell, Jacobsen, and Stanley 1990 for an early survey and World Bank 2011 for recent data). Nevertheless, the migration rate (the ratio of emigrants to the total population of the country of origin) remains low on average, albeit with marked variation across countries (table 1.1).
According to the World Bank’s bilateral migration matrix data, in 2010 about 30.6 million African people (3 percent of the world’s popula-tion) were living in countries other than the one in which they were born. However, offi cial data on migration in Africa signifi cantly understate the actual movement of people (box 1.1). The actual number of African emi-grants is likely to be signifi cantly larger.
At the country level, France stands out as the leading destination for emigrants from Africa (9 percent of total emigrants), followed by Côte d’Ivoire (8 percent), South Africa (6 percent), Saudi Arabia (5 percent), and the United States and United Kingdom (4 percent each) (fi gure 1.1). In most OECD countries, the share of African emigrants is less than 3 per-cent. Western Europe, the United States, Canada, and Australia account

16 • Leveraging Migration for Africa: Remittances, Skills, and Investments
Box 1.1 Problems with Data on African Migration
Data on migration in Africa are often missing, out of date, or inconsistent with definitions used in
other countries. Intraregional migration flows are often informal and not captured in official statis-
tics. Data on seasonal and transit migration remain a big challenge. The recording of refugee flows
by the United Nations High Commissioner for Refugees (UNHCR) is more accurate and timely.
Although 49 of Africa’s 54 countries provide data from a national census on immigrants by
source country, the data on intra-African migration suffer from significant gaps. Only 15 African
countries have data for the period after 2000, 24 countries have data for the 1990s but not later,
and 10 countries have no data even for the 1990s. Coverage varies across subregions. Data for
the 1990s are available for all southern African countries, three-quarters of East and West African
countries, and half of Central and North African countries. Central Africa has the weakest data,
with no country providing data after 2000. Throughout Africa many countries report migrants
only from the major source countries.
Data on emigration from Africa to high-income countries belonging to the Organisation for
Economic Co-operation and Development (OECD) are of significantly better quality and are more
current than data on intra-African migration. Immigration data from the OECD national censuses
conducted in 2000 were augmented by labor force and population surveys in 2005–07.
The migration data for all destination countries were used to construct a bilateral matrix of
migration stocks for 2010 (Ratha and Shaw 2007; World Bank 2011). The migrant stocks for each
destination country—and a breakdown by source country—were scaled to the UN Population Divi-
sion’s latest estimates of immigrant stocks in each destination country for 2010.
The reliance on infrequent census data particularly impairs knowledge of migration flows in
countries affected by significant economic or political shocks. Côte d’Ivoire, for example, a major
destination for migrants from neighboring countries, may have become less attractive after the
2002–04 civil war. Similarly, the latest South African census does not fully capture the surge in
immigrants from Zimbabwe since that country’s economic crisis began almost a decade ago. Over-
all, migration data in Africa, especially on intra-African migration, require substantial improve-
ment in availability, timeliness, quality, and cross-country comparability.
Table 1.1 Emigrants as Percentage of the Population in Selected World Regions, 2010
Region
Emigrant stock (millions)
Population (millons)
Emigrants/population (percent)
Africa 30.6 1,032 3.0
North Africa 8.7 170 5.1
Sub-Saharan Africa 21.9 862 2.5
East Asia and Pacific 21.7 1,974 1.1
Europe and Central Asia 43.0 404 10.7
Latin America 30.2 581 5.2
South Asia 26.7 1,644 1.6
World 215.8 6,909 3.1
Source: World Bank 2011.Note: Figures include intraregional migration.

Migration Patterns and Policies in Africa • 17
for only about 37 percent of total African migrants (65 percent if intra-African migration is excluded).
Many African countries have experienced sharp changes in net migra-tion rates (the difference between immigration and emigration as a share of origin country population) since the late 1970s, refl ecting the tumul-tuous events in the continent’s history during this period.3 In part, these wide variations in net migration rates were caused by civil and external confl icts. For example, net migration rates have been particularly volatile in Eritrea, Liberia, Malawi, Mozambique, Rwanda, Sierra Leone, and Soma-lia (see annex table 1A.1).4 For Africa as a whole, however, net migration rates have been stable over time, ranging from –0.4 percent to –0.6 percent across fi ve-year periods from 1975 to 2010. As a large percentage of Afri-can migration is within the continent, the cross-country average tends to be close to zero. Patterns since 2006 indicate some decline in the average net migration as well as its variability across countries.
The rate of emigration varies signifi cantly across countries. Some of the smaller countries (for example, Cape Verde, Equatorial Guinea, Lesotho, Mali, São Tomé and Príncipe, and Seychelles) have gross emigration rates that exceed 10 percent (fi gure 1.2). This high level of emigration partly refl ects limited livelihood opportunities and a high variability of income
Figure 1.1 Major Destination Countries for Emigrants from Africa, 2010 (share of African emigrants)
Franc
e
Côte d’
Ivoire
South
Africa
Saud
i Arab
ia
United
State
s
United
Kingdo
mSp
ain Italy
Burkina
Faso
Nigeria
Jorda
nKe
nya
Suda
n
Ugand
a
Tanz
ania
Portu
gal
Libya
Ethiop
iaIsr
ael
Rwanda
0
2
4
6
8
10
perc
ent
Source: Authors, based on data in World Bank 2011.

18 • Leveraging Migration for Africa: Remittances, Skills, and Investments
as a result of dependence on primary commodities (Docquier and Schiff 2009). Several countries suffering civil disorder also have high emigration rates. For example, after more than three decades of war, Eritrean emi-grants represent almost 20 percent of the country’s population.
A marked feature of the movement of people across the globe is that at least half of it takes place within the same continent (except for emigrants from Latin America and the Caribbean, most of whom go to North America, and for East Asia and Pacifi c) (table 1.2).5 The intra-Africa emigration rate is about 50 percent, which is similar to intraregional rates for developing countries in Europe and Central Asia (59 percent) and the Middle East (45 percent).
There is a signifi cant difference between Sub-Saharan Africa and North Africa in this regard. Intraregional emigration in Sub-Saharan Africa accounts for almost 65 percent of total emigrants, the largest intracon-tinental or South-South movement of people in the world. In contrast, more than 90 percent of emigrants from North Africa head to countries outside Africa (table 1.3). Intra-African emigration is driven largely by a search for job opportunities in neighboring countries. It is also driven by the complexities of historical state formation—colonial borders often overlooked linguistic and ethnic commonalities—as well as by waves of internal and cross-border confl icts (box 1.2).
Figure 1.2 Rate of Migration, by Country, 2010
Source: Authors, based on data from World Bank 2011.Note: Figures show stock of emigrants divided by population.
Cape V
erde
Eritre
a
Equa
torial
Guin
ea
Seych
elles
São T
omé &
Prínc
ipe
Leso
tho Mali
Mauriti
us
Morocco
Swaz
iland
Burkina
Faso
Guinea
-Bissau
Benin
Comoro
s
Tunis
ia
Zimba
bwe
Congo
, Rep
.
Guinea
Algeria
Burund
i0
5
10
15
20
25
30
35
40
perc
ent

Migration Patterns and Policies in Africa • 19
The bulk of intra-African emigration has occurred across neighbor-ing countries. In West Africa, more than 70 percent of emigration took place within the same subregion; in southern Africa 66 percent of emi-gration was intra-African, refl ecting the strong pull of South Africa (see table 1.3).
The predominance of cross-border emigration refl ects common lin-guistic and historical roots. For example, a large number of emigrants from Djibouti, Eritrea, Ethiopia, and Somalia are found in the same region because of strong ethnic, religious, and linguistic ties along the
Table 1.2 Origin and Destination of Emigrants, by World Region, 2010 (percent of total emigration)
Destination region
Source region Africa
East Asia and
Pacifi c
Europe and
Central Asia
Latin America and the
Caribbean Middle East South Asia
High- income
countries
Africa 50 0 0 0 4 0 46
East Asia and Pacifi c 0 15 0 0 1 0 83
Europe and Central Asia 0 0 59 0 0 0 41
Latin America and the Caribbean 0 0 0 13 0 0 87
Middle East 2 0 1 1 45 0 51
South Asia 0 2 0 0 8 30 61
High-income countries 1 1 3 5 2 0 87
Source: World Bank 2011; Ratha and Shaw 2007.Note: Rows may not sum to 100 percent because of rounding errors.
Table 1.3 Migration within and outside Africa (percent of all emigrants)
Destination subregion
Origin subregionCentral Africa
East Africa
North Africa
Southern Africa
West Africa
Out of Africa
All Africa 3 13 2 11 21 50
Central Africa 23 26 0 9 3 39
East Africa 1 52 3 3 0 41
North Africa 0 0 6 0 0 93
Southern Africa 0 7 0 66 0 28
West Africa 5 0 0 0 71 24
Other regions 0 0 0 0 0 100
Source: World Bank 2011.Note: Includes only identifi ed sources and destinations. Rows may not sum to 100 percent because of rounding errors.

20 • Leveraging Migration for Africa: Remittances, Skills, and Investments
Box 1.2 Forced Migration in Africa
Nearly 2.2 million Africans living in countries other than the ones in which they were born are
recognized as refugees, displaced mainly by war or drought and other natural disasters (UNHCR
2010 ). About half of these refugees are in Kenya, Chad, the Democratic Republic of Congo, and
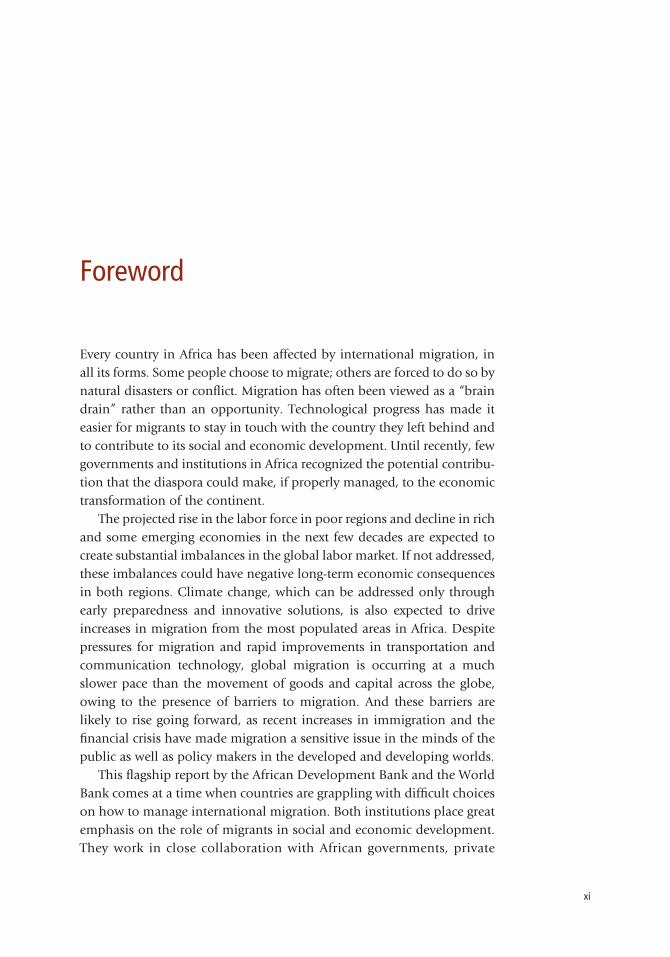
Sudan (box fi gure 1.2.1). The main sources of international refugees are Somalia, the Democratic
Republic of Congo, Sudan, and Eritrea (box fi gure 1.2.2). Another 6.5 million people are consid-
ered internally displaced persons, who were forced to move within African countries.
The number of refugees has declined sharply from the late 1990s, when their numbers reached
about 5 million and 1 out of every 5 Africa migrants was a refugee (Hatton and Williamson 2003;
Lucas 2006). The decline refl ects the lower frequency of coups, guerilla insurgency, government
collapse, and civil war.
Refugees can impose a substantial burden on host countries by requiring additional public
expenditures, putting pressures on infrastructure, and contributing to environmental degradation
(Puerto Gomez and Christensen 2010 ). For example, the presence of Eritrean and Ethiopian refu-
gees was perceived by their Sudanese hosts to pose an enormous strain on the fragile Sudanese
economy (Ek and Karadawi 1991). A large infl ux of refugees can lead to the transformation of for-
est and rural land into camps and settlements, and displaced people may resort to unsustainable
activities in absence of other means of survival (Hugo 2008 ). The social and economic impact of
a protracted refugee presence can be addressed by targeting development assistance to affected
areas, as in the Zambia Initiative, which used community development projects to cope with the
impact of more than 100,000 Angolan refugees (Puerto Gomez and Christensen 2010).
Keny
aCha
d
Congo
,
Dem. R
ep.
Suda
n
Ugand
a
Ethiop
ia
Tanz
ania
TTCon
go, R
ep.
Camero
on
Egyp
t, Arab
Rep.
Algeria
Zambia
Rwanda
South
Africa
Centra
l Afric
an
Repub
lic
0
50
100
150
200
250
300
350
400
Thou
sand
s
Box fi gure 1.2.1 Cross-Border Refugees in Selected African Countries, End 2009
Source: UNHCR 2010.
Migration Patterns and Policies in Africa • 21
vast borders these countries share. Kenya is a common destination for emigrants from Tanzania and Uganda. Sudan is a principal destination of emigrants from Chad, Eritrea, and Ethiopia. Emigrants from Burundi and Rwanda often speak the same language as or share historical ties with natives of Tanzania and Uganda. Côte d’Ivoire is a melting pot for neigh-boring countries, as most migrants are able to communicate with people in the surrounding countries and share religious and historic bonds. Emi-grants from Benin, Ghana, and Niger head to Nigeria for similar reasons. In southern Africa, migrants from Botswana, Lesotho, Mozambique, and Swaziland can blend into communities in South Africa, making mobility and settlement comparatively easy.
Intra-African migration fl ows are affected by income differences, as the large immigration to the relatively prosperous South Africa suggests. There are, however, exceptions. Tanzania, for example, is the most com-mon destination for emigrants from Burundi, the Democratic Republic of Congo, and Zambia, despite the fact that the difference in per capita gross domestic product (GDP) is negligible or favors the source country (fi gure 1.3).
Box 1.2 Forced Migration in Africa (continued)
Box fi gure 1.2.2 Cross-Border Refugees from Selected African Countries, End 2009
Source: UNHCR 2010.
Somali
a
Congo
,
Dem. R
ep.
Eritre
aSu
dan
Centra
l Afric
an
Repub
lic Angola
Rwanda
Burund
i
Western
Saha
ra
Liberi
a
Ethiop
ia
Maurita
nia
Côte d’
Ivoire
Zimba
bwe
Chad
0
100
200
300
400
500
600
700
800
Thou
sand
s

22 • Leveraging Migration for Africa: Remittances, Skills, and Investments
MediterraneanSea
Red Sea
0° 30°
30°
0°
30°
30°30° 0°
60°30°
30°
0°
30°
Mayotte(Fr)
Réunion(Fr)
Cabinda(ANGOLA)
TOGO
BENI
N
BURKINA FASO
NIGERMALI
MAURITANIA
SENEGALTHE GAMBIA
CAPEVERDE
GUINEA-BISSAU GUINEA
GHAN
A
SIERRA LEONELIBERIA CÔTE
D’IVOIRE
NIGERIA
CHADSUDAN
ERITREA
ETHIOPIA
DJIBOUTI
SOMALIA
KENYAUGANDA
CENTRALAFRICAN REPUBLICCAMEROON
EQUATORIAL GUINEASÃO TOMÉ AND PRÍNCIPE
GABON CONGO DEM. REP. OF CONGORWANDA
BURUNDI
TANZANIA
MOZAMBIQUE
MALAWIZAMBIA
ZIMBABWE
BOTSWANA
ANGOLA
NAMIBIA
SOUTHAFRICA LESOTHO
SWAZILAND
MADAGASCAR
COMOROSSEYCHELLES
1,500 KILOMETERS1,0005000
1,000 MILES5000
MAJOR MIGRATION CORRIDORS
INTERNATIONAL BOUNDARIES
This map was produced by the Map Design Unit of The World Bank.The boundaries, colors, denominations and any other information shown onthis map do not imply, on the part of The World Bank Group, any judgmenton the legal status of any territory, or any endorsement or acceptance ofsuch boundaries.
IBRD 38498APRIL 2011
Atlantic Ocean
IndianOcean
More than 90 percent of emigrants from North Africa end up outside Africa (see table 1.3). In contrast, only 41 percent of emigrants from East Africa, 24 percent from West Africa, 39 percent from Central Africa, and 28 percent from Southern Africa end up outside Africa. These fi gures sug-gest that people from North Africa, and to some extent East Africa, have better access to opportunities in OECD and Middle Eastern countries than do people in other parts of Africa.
Demographic changes (coupled with network effects) may further boost emigration from Africa to OECD countries in coming years. The working-age population is set to decline between 2005 and 2050 in Europe and the United States and to increase sharply (doubling the labor
Figure 1.3 Major Migration Corridors in Sub-Saharan Africa, 2010
Source: Authors, based on data from World Bank 2011.

Migration Patterns and Policies in Africa • 23
force) in Sub-Saharan Africa (table 1.4). Although the impact of a declin-ing population on labor demand in industrial countries is uncertain, the aging of their populations will increase the demand for personal and healthcare services. At the same time, the growth of employment in Africa may not be strong enough to absorb all of the new entrants to the labor force. Thus both the demand for and supply of migrants are likely to rise in the future. Even if Africa achieves rapid growth, the income gap with industrial countries will remain a substantial incentive to migrate for the foreseeable future.
IMMIGRATION TO AFRICA
Immigration to Africa by people born outside Africa was estimated at about 618,000 in 2010, about 4 percent of total immigration in the continent, with the rest accounted for by migrants from within the region. The most common destinations for immigrants from Africa are Côte d’Ivoire (16 percent), South Africa (12 percent), and Burkina Faso (6 percent) (fi gure 1.4). South Africa and the Arab Republic of Egypt lead in the number of immigrants from outside Africa. Both have large communities of migrants from Australia, Lebanon, the Philippines, the West Bank, and Yemen.
UNDERSTANDING CROSS-COUNTRY MIGRATION PATTERNS
Differences in the ability to migrate account for a signifi cant part of the variation in intra-African migration rates.6 Emigrants from poorer coun-tries tend to remain in Africa, often in neighboring countries. Figure 1.5 compares per capita income with the share of a country’s emigrants that go to other African countries. A 10 percent difference in per capita GDP
Table 1.4 Projected Changes in the Size of the Working-Age Population in Selected World Regions, 2005–50 (millions)
Age group
Sub-Saharan Africa
Middle East and
North Africa South AsiaEast Asia
and Pacifi c
Eastern Europe
and Central Asia
European Union
and other Europe
North America
15–24 163 10 27 –78 –26 –18 –7
25–39 262 53 178 –65 –14 –37 –6
40–64 274 124 450 215 15 –33 1
Total working age (15–64) 699 187 655 72 –26 –88 –12
Total population 951 270 863 321 –7 –57 22
Source: Koettl 2010.

24 • Leveraging Migration for Africa: Remittances, Skills, and Investments
Figure 1.4 Rate of Immigration to African Countries, 2010
Source: Computations based on World Bank 2011.Note: Figures show stock of immigrants divided by population.
Rate
of i
mm
igra
tion
(%)
Côte d’
Ivoire
South
Africa
Nigeria
Tanz
ania
Keny
aSu
dan
Rwanda
Mozam
bique
Guinea
Burkina
Faso
Ugand
a
Ethiop
ia
Zimba
bwe
Libya
Gambia
, The
Gabon
Malawi
Chad
Zambia
Egyp
t, Arab
Rep.
0
4
8
12
16
Figure 1.5 Relationship between Intra-African Migration and per Capita GDP, 2006
Source: Authors, based on data from World Bank 2008, 2009.
Perc
ent o
f Afri
can
mig
rant
s w
ho re
mai
n in
Afri
ca
y = –0.1079x + 1.1921R2 = 0.2023
0
10
20
30
40
50
60
70
80
90
100
100 2 4 6 8
Log per capita GDP in constant 2005 prices

Migration Patterns and Policies in Africa • 25
is associated with a 1 percentage point difference in the proportion of emigrants staying in Africa.7 Emigrants from middle-income countries disproportionately tend to migrate to destinations outside of Africa; Afri-can emigration rates to the OECD countries are strongly correlated with per capita GDP (fi gure 1.6). Emigrants from middle-income countries are more likely to have the resources to pay for transport to and resettlement expenses in the OECD countries, and they are more likely to have the education and other skills required to fi nd jobs there.
Many African countries maintain close economic, political, and cul-tural ties with their former colonial rulers. France, Belgium, and the United Kingdom in particular cultivated special relationships with their former colonies in Africa that included opportunities for travel, study, and business. Language is also an important link: it is easier for migrants from francophone areas to travel to France and Belgium and those from anglophone areas to travel to the United Kingdom.
Colonial ties continue to play a role in infl uencing the choice of the destination country. The vertical axis of fi gure 1.7 plots the share of a country’s emigrants to former colonizers; the horizontal axis measures the share of a country’s emigrants to the most common destination. If the most common destination is the former colonizer, then the value for the x and y axes would be equal (the point would lie on the 45-degree line
Figure 1.6 Relationship between Emigration Rates to OECD Countries and Log per Capita GDP in Africa, 1990–2000
Source: Authors, based on data from World Bank 2008, 2009.
Perc
ent o
f Afri
can
mig
rant
s w
ho m
igra
te
to O
ECD
coun
trie
s
0
5
10
15
20
25
105 6 7 8 9
Log per capita GDP
26 • Leveraging Migration for Africa: Remittances, Skills, and Investments
from the origin). The large number of observations below the 45-degree line implies that the former colonizer is sometimes, but not always, the most favored destination. Although the trend line shows a limited relationship between former colonial power and the most common des-tination country for emigrants, a signifi cant share of emigrants from Sub-Saharan Africa remain within the region. (The colonial tie would have a stronger impact on choice of destination if only emigration outside of Africa were considered.)
This relationship does not appear to have changed greatly over time: a study conducted in 1990 (Russell, Jacobsen, and Stanley 1990) also found that trans-African emigrants tended to migrate to former coloniz-ers. The fact that the choice of destination country has not changed partly refl ects immigrants’ ability to assist aspiring emigrants from origin coun-tries (Hatton and Williamson 2009). Immigrants help new immigrants by fi nancing trips, facilitating legal entry through family reunifi cation programs, and providing information and other assistance that reduce the burden of resettlement.
SOCIOECONOMIC CHARACTERISTICS OF MIGRANTS FROM AFRICA
Understanding the determinants of migration in Africa is diffi cult because of the lack of descriptive information on migrants and their households in
Figure 1.7 Relationship between Colonial Links and Emigration Patterns in Africa
Source: Authors, based on data from World Bank 2011.
Emig
ratio
n to
form
er c
olon
izer
s
0
20
40
60
80
800 20 40 60Emigration rate to most common country
FranceFrance
France
FrancePortugal
Portugal
Portugal
Portugal
France
France
France
France FranceFrance
France
France
Spain
FranceFrance Belgium
BelgiumItaly
France
France
France + UK
UKUK
UKUKUK
UK UKUK
UK
UK UK UKUK
UKUKUK
USA
UK
Portugal
France

Migration Patterns and Policies in Africa • 27
the origin country. Some detailed evidence on the determinants of internal migration in Africa is available, but there is little information on interna-tional migration.8 It is only recently that household surveys have begun to capture characteristics of households that have a member living in another country. This section presents results from the 2005/06 Living Standard Measurement Survey for Ghana and more recent surveys of Burkina Faso, Nigeria, and Senegal completed for the Africa Migration Project.
Analysis of these household survey data shows that migrants from the countries surveyed tend to be young, predominantly male adults with some education beyond primary schooling (table 1.5). The sex, age, and educational composition of migrants vary by destination. Not surpris-ingly, migrants to OECD countries tend to be older and better educated, and more than 70 percent are men. There are some differences in the motive for migration among the countries covered in the survey. Employ-ment is the predominant reason for emigration from Burkina Faso, whereas education and family reunion are cited as the reason for emigra-tion by almost half of households interviewed in Nigeria and Senegal.
Table 1.5 Characteristics of Migrants from Selected African Countries (percent)
Characteristic/destination Burkina Faso Ghana Nigeria Senegal
Age (middle 50 percent)
Migrants in OECD countries 35 37 33 38
Intra-African migrants 32 35 28 35
Internal migrants 32 35 27 32
Gender (percent male)
Migrants in OECD countries 79 70 72 80
Intra-African migrants 90 63 75 86
Internal migrants 82 62 62 75
Education (percent with given level of education)
Migrants in OECD countries 52 secondary 61 secondary 45 tertiary 44 tertiary
Intra-African migrants 65 primary 45 secondary 38 secondary 48 primary
Internal migrants 45 secondary 54 secondary 49 secondary 35 primary
Reason for emigration
Employment 78 .. 48 48
Education 8 .. 29 29
Family 10 .. 20 20
Others 4 .. 4 3
Source: Authors, based on data from Plaza, Navarette, and Ratha 2011.Note: .. = negligible; OECD = Organisation for Economic Co-operation and Development.

28 • Leveraging Migration for Africa: Remittances, Skills, and Investments
Both the Living Standard Measurement Survey of Ghana and the sur-veys of Burkina Faso, Senegal, and Nigeria conducted for the Africa Migra-tion Project fi nd that larger household size increases the probability that a household member emigrates and remains abroad. This relationship may simply refl ect the fact that among a larger number of household mem-bers, it is more likely that someone had the desire and ability to migrate. It is also consistent with the view that, often, migration is a decision made by households to diversify their income sources in a risky environment in which insurance is unavailable or unaffordable (larger households have greater opportunities for diversifi cation) (Hoddinott 1994). The likeli-hood that a household has sent a migrant abroad is also correlated with the average age in the family, a refl ection of life-cycle effects. This effect is captured clearly in the case of Nigeria and Senegal, where both internal and external migrants come from older families.
In Ghana, the higher the education of the head of household (and that of the parents of the head of household), the higher the probability that a household member has emigrated. The marginal increase in the probability of sending a migrant is about 8 percent for each additional year of schooling of the head of household. This effect is dampened for households with relatively high wage rates. One way to explain the cor-relation between education and migration is that a higher level of edu-cation makes it easier to gather and process the information necessary for international migration. This trend is observed in Nigeria, where the probability of migration increases with education—up to a point. This effect is not seen in Burkina Faso, where obtaining an education was a more important reason for internal than international migration. This result refl ects the fact that data were collected in predominantly rural areas, where secondary schooling may not have been available. Richer families in Burkina Faso are more likely to have a member abroad, but the effect may result from higher incomes from remittances. Income lev-els are not related to internal migration.
In Ghana, families that earn higher pay have a lower probability of having a member abroad. Controlling for the level of education attained and employment status, however, the level of earnings is not signifi cantly related to the probability of migration. Some areas of Ghana (Greater Accra, Ashanti) have substantially higher international migration rates than others, which may refl ect the importance of network effects in facili-tating migration.
The survey data also provide information on the dramatic labor mar-ket effects of migration. In Burkina Faso and Nigeria, migration allowed a shift from self-employment, often in farming, to wage employment.

Migration Patterns and Policies in Africa • 29
Migration appears to have differing implications for women’s labor mar-ket status in these countries. In Burkina Faso and Nigeria, the share of housewives is higher in the sample after migration; in Senegal migration appears to have helped some women change their status from housewife to some form of employment (table 1.6). In Senegal, the shift in labor market status is signifi cant for students, many of whom were able to fi nd wage employment after migrating (table 1.7).
The Burkina Faso survey shows a signifi cant change in labor market status following migration. Nearly all migrants were farmers in their orig-inal place of residence, which is not surprising given that the survey was administered predominantly in rural areas. Migration frequently resulted in changes in occupation. After internal migration, which was often from rural to urban areas, only one-third of internal migrants remained farm-ers (about half of international migrants continued as farmers). Although
Table 1.6 Occupation of Individuals from Burkina Faso before and after Migrating, 2009
Before migration After migration
Occupation Internal International Internal International
Farmer 85.7 91.6 36.4 58.8
Trader 4.5 2.4 20.9 6.8
Professionals (managers) 4.1 2.1 16.0 23.0
Semiskilled workers 2.5 1.6 6.1 1.3
Unstable occupations 2.1 1.8 10.6 5.8
Other 1.1 0.5 10.0 4.3
Source: Authors, based on data from Plaza, Navarette, and Ratha 2011.
Table 1.7 Labor Market Status of Individuals from Selected African Countries before and after Migrating, 2009 (percent)
Burkina Faso Nigeria Senegal
Labor market status Before After Before After Before After
Self-employed 80.3 64.1 15.7 25.6 42.2 42.7
Student 10.2 5.4 42.5 23.2 20.6 7.6
Housewife 2.9 5.1 1.3 4.9 9.4 7.6
Full-time wage earner 2.5 8.8 13.9 33.5 9.0 24.3
Part-time wage earner 1.5 12.2 2.7 4.1 3.3 4.2
Unemployed 1.9 1.5 22.0 4.3 8.9 3.4
Other 1.0 3.0 2.0 4.0 7.0 10.0
Source: Authors, based on data from Plaza, Navarette, and Ratha 2011.

30 • Leveraging Migration for Africa: Remittances, Skills, and Investments
many internal migrants became traders and some even mid-level manag-ers, others ended up in unstable or casual employment.
The survey data show low rates of return migration: the share of emi-grants who returned was only 3 percent in Nigeria, 9 percent in Senegal, and 25 percent in Burkina Faso (table 1.8). The majority of those who did return in Burkina Faso and Nigeria came back in less than four years. In contrast, in Senegal two-thirds of returnees had spent 15 or more years abroad.9
MANAGING MIGRATION
African governments have done little to increase the benefi ts of migra-tion or reduce the risks migrants face. The potential economic benefi ts of migration are impaired by the lack of support for migrants in key mar-kets and insuffi cient fl ows of information. Migration also has important social implications for African societies that cannot be evaluated purely in economic terms (box 1.3). Subsequent chapters discuss key policy areas where governments can make a difference—remittances, high-skilled migration, and diaspora resources. The remainder of this chapter focuses on the principal challenges African governments face in protecting migrants, managing immigration within Africa, and encouraging greater legal migration to high-income countries.
EXPLOITATION
Migrants may be subject to exploitation by intermediaries and employ-ers. They may suffer physical deprivation during illegal border crossings and be vulnerable to traffi ckers. The common practice of migration by children and the phenomenon of “child fostering” in West Africa (where children leave home for a period of years) increases the vulnerability of children to traffi ckers and makes it diffi cult to identify the victims
Table 1.8 Return Migration in Selected African Countries (percent)
Item Burkina Faso Nigeria Senegal
Returnees as a share of migrants 25 3 9
of which:
Returned in less than 4 years 67 69 32
Returned in 5–15 years 16 23 2
Returned after more than 15 years 16 8 66
Source: Authors, based on data from Plaza, Navarette, and Ratha 2011.

Migration Patterns and Policies in Africa • 31
Box 1.3 The Social Costs and Benefi ts of Migration
Migration in Africa has important effects on social issues that cannot be evaluated purely in eco-
nomic terms. These benefi ts include their effects on gender roles, family cohesion, and health.
Changes in Gender Roles
Migration shapes values and attitudes toward gender roles within the household (Ghosh 2009).
When women move, their role as caregiver changes; as a result, men are more likely to engage
in traditionally female activities such as caring for children and the elderly (King and Vullnetari
2006). When men emigrate, women are empowered to take a more prominent part in community
decision making, controlling their own income, and expanding their role in the domestic sphere
(Deshingkar and Grimm 2005).
Recent migration fl ows have included a larger number of women who are migrating inde-
pendently rather than following fathers or husbands (ECA 2006). Migration provides women
with new economic opportunities and sometimes escape from a failed marriage, particularly in
societies in which divorce is not an option. Interpreting high divorce rates among migrants is not
always straightforward. In traditional societies, where divorce is highly uncommon or not pos-
sible, migration has been associated with a higher probability of family breakdown. Although
protracted separation can take its toll on family cohesion, Lucas (2005) points out that men and
women whose marriages were unstable to begin with are more likely to migrate.
Gender differences are apparent in other ways as well. Manuh (2001) fi nds that Ghanaian men
in Canada are more likely than Ghanaian women to return home. For men the attractiveness lies
in the opportunity to go back to a patriarchal society; women do not relish losing the indepen-
dence they have experienced in Canada.
Migration can entail substantial risks for women and children, who often fi nd themselves
victims of traffi ckers. Some research also indicates that migrants’ fertility patterns tend to shift
toward those of natives of the destination country, either through social adaptation or self-
selection of migrants by fertility preferences (Kulu 2005). These changes may affect the broad
population in migrant-sending areas.a
Effects on Family Cohesion
Migration may spread attitudes and behaviors from democratic host countries to less-democratic
sending countries through returning migrants, cross-border communications from diaspora
members, and information networks in migrant-sending communities (Perez-Armendariz and
Crow 2010). Although the decision to migrate may be made in the interest of household wel-
fare, separation from one’s immediate family often entails considerable emotional cost and can
erode family structures and relationships (D’Emilio and others 2007). A breakdown of family
ties because of emigration can impose signifi cant emotional costs on children (McKenzie and
Rapoport 2006).
To some extent, e-mail, Skype, and affordable telephone calls may allow transnational fami-
lies to thrive even at a distance (UNDP 2009). Recent evidence from Mozambique suggests that
migration may also strengthen social networks by enabling households that receive remittances to
participate more actively in their communities (Gallego and Mendola 2010). Closer interfamily col-
laboration can, to some extent, remedy the absence of within-family cohesion and safety nets.
(Box continues on next page)

32 • Leveraging Migration for Africa: Remittances, Skills, and Investments
of abuse.10 A range of coercive and misleading practices are used in the traffi cking of women, which can be compounded by rules in destination countries that leave women in the power of their employers. Inadequate legislation, poor enforcement, fl awed or nonexistent birth registration systems, and social attitudes make traffi cking diffi cult to combat.
The absence of domestic antitraffi cking legislation in several coun-tries offers law enforcement agencies little incentive to pursue criminal syndicates (Martens, Pieczkowski, and van Vuuren-Smyth 2003). Stricter enforcement of existing laws and the enactment of new laws could help control traffi cking, but law enforcement is only part of the answer. Some countries have initiated programs to protect children from traffi ckers. To fi ght traffi cking, in 2002 Burkina Faso introduced a new travel document that requires the name of the adult accompanying a fostered child and the adult who is to shelter the child (Wouterse and van den Berg 2004). Save the Children developed a program in Burkina Faso and Mali to provide children with alternative economic activities and training in their home villages. In general, addressing the root causes of child migration is likely to be more successful than attempts to regulate the employment of chil-dren away from home (Delap, Ouedraogo, and Sogoba 2005).
Governments could enhance protection of potential victims by main-taining lists of legitimate recruitment agencies, publicizing the terrible
Box 1.3 The Social Costs and Benefi ts of Migration (continued)
Effect on Spread of HIV/AIDS and Other Diseases
Several studies have focused on the link between migration and the rapid spread of HIV/AIDS in
different parts of Africa (Decosas and others 1995; Lurie and others 2000; Brummer 2002). Several
studies have shown that migrant laborers tend to have higher HIV infection rates than nonmigrants
(UNFPA 2006).b Some researchers contend that South Africa has been turned into an AIDS hot spot
primarily because of the nature and magnitude of circular labor migration in the region (Barnett
and Whiteside 2002). HIV prevalence has been observed to rise with migration, a situation exacer-
bated by laws, regulations, and policies that present obstacles to effective HIV prevention, treat-
ment, care, and support for migrants (UNAIDS 2008). Temporary circular migration also increases
the risk of family breakdown, the fragmentation of social networks, and psychosocial stress (Kahn
and others 2003). The effects of migration on tuberculosis and pneumoconiosis have been docu-
mented in Lesotho, Malawi, Mozambique, South Africa, and Zambia (Packard 1989; Leger 1992).
a. Fargues (2006) fi nds that fertility patterns in Egypt, Morocco, and Turkey were infl uenced by fertility patterns in destination countries (Western Europe versus the Persian Gulf). Beine, Docquier, and Schiff (2009) fi nd that a 1 percent decrease in the fertility norm in the destination country reduces fertility rates in the origin country by about 0.3 percent.
b. In a detailed study by Kane and others (1993), 27 percent of male Senegalese migrants were HIV positive compared with 1 percent of nonmigrant men from the same area. Migration from neighboring countries was observed to contribute to a rise in HIV infections and AIDS cases in Mali (World Bank 1993).

Migration Patterns and Policies in Africa • 33
experiences of victims and the kinds of offers that might leave migrants vulnerable to traffi ckers, assisting parents in obtaining information on child-fostering opportunities, and assisting potential migrants to inves-tigate the legitimacy of offers. Information campaigns could also be used to change public attitudes toward the exploitation of women and children.
A few African governments have assisted potential emigrants by pro-viding information on migration opportunities and counseling them about the risks involved in migration. Ethiopia, Kenya, and Senegal pro-vide predeparture orientation seminars to inform migrants about poten-tial abuses. The Ethiopian government has also established an offi ce to regulate private recruitment agencies, which are required to obtain a one-year, renewable license, to report the status of their work, and to submit to audits to ensure that workers are not being cheated by the agencies or foreign employers.11 Overall, however, African governments have invested only limited resources in protecting migrants. In contrast, agen-cies in several Asian countries have been created to promote and regulate migration (Wongboonsin 2003). Passing legislation is not enough; it must be accompanied by enforcement of laws that protect migrants.
A few African countries restrict the right of women to emigrate, in part as a means of protecting them.12 These laws actually increase vulnerabil-ity to traffi cking, by forcing some women to migrate illegally and limiting their ability to call on the authorities for help (Black, Hilker, and Pooley 2004).
Bilateral agreements between origin and destination countries can be used to protect migrants. For example, some African countries have entered into agreements with France to enable their workers to receive benefi ts under French social safety net provisions (see, for example, the discussion of Senegal in Ammassari 2005). Algeria, Morocco, and Tuni-sia have entered into agreements with the main destination countries to ensure that emigrants are provided social security and to shield them against racism and xenophobia (Musette 2006). But African countries have only limited ability to infl uence the immigration policies of high-income destination countries.
Destination countries can also help protect migrants. In the Middle East, rules that treat migrants who leave their job—in particular women who leave their work as domestic helpers—as illegal aliens increase migrants’ vulnerability to physical abuse and exploitation. In some countries, migrants may not understand or be aware of the terms of the contracts they are forced to sign on arrival, leaving them at the mercy of employers through prohibitions on leaving the house without permis-sion, heavy penalties for quitting their jobs, or requirements that large

34 • Leveraging Migration for Africa: Remittances, Skills, and Investments
debts to traffi ckers must be worked off before leaving. The regulation of recruitment and the monitoring of working conditions by destination countries would help curb abuse of migrants.
MANAGING IMMIGRATION WITHIN AFRICA
Limited resources, weak public institutions, and long land borders severely impede the control of migration in many African countries, resulting in large numbers of undocumented migrants. Although Afri-can countries generally have laws regulating who may immigrate, such laws are often enforced only at formal entry places, such as airports and ocean ports, and are easily evaded by migrants who take informal routes from contiguous countries. The large informal sector in most African economies means that it is diffi cult to regulate immigrants’ participation in the domestic economy.13 In South Africa, many immigrants remain undocumented because of the considerable cost and time required to be regularized, even with the support of an employer.14
In some respects, the ineffectiveness of immigration restrictions may have a positive impact on development by permitting migration. Even where income differences between countries are not great, cross-border migration can improve welfare by diversifying income sources, facilitat-ing trade, and exploiting differences in seasonal patterns. The West Afri-can Long-Term Perspective Study (WALTPS) concludes that the ability of West Africa to increase its agricultural production at the same rate as population growth may be attributable in part to migration to areas with high agricultural potential. The artisanal marine fi shing industry in West Africa is thriving because of the ease of crossing borders at sea (Odotei 2006). In some cases (for example, migration between Ghana and Togo and between Benin and Nigeria), undocumented migration simply refl ects uncontrolled but generally accepted movements across borders set by European colonial powers that divide ethnic groups accustomed to close communication (Adepoju 2005).
Some African countries do experience diffi culties stemming from their inability to manage migration. Undocumented migration may result in large numbers of residents being perceived as foreigners, who often live in lower-income urban neighborhoods. Large numbers of undocumented immigrants may contribute to lawlessness and can undercut attempts to regulate labor market conditions and protect workers. Martin (2010) notes that cash grants in South Africa designed to support poor work-ers’ incomes are evaded by hiring undocumented immigrants, who can become the focus of random violence and police harassment. Mass expul-

Migration Patterns and Policies in Africa • 35
sions of immigrants—from Ghana in 1969, Nigeria in 1983, and Côte d’Ivoire early in the past decade—resulted in economic disruptions and severe hardships.15
Coping with undocumented immigration involves extremely diffi cult social choices that have confounded governments in both rich and poor countries. At a minimum, governments should avoid violent or exploita-tive practices, such as mass expulsions or tolerance of corrupt offi cials who prey on undocumented immigrants. Some countries where migrants have suffered from violence have made efforts to restore social peace. For example, Côte d’Ivoire’s 2008 anti-xenophobia law imposes sanctions on conduct that incites violence; South Africa set up the “No to Xenophobia” emergency phone line following violence in May 2008 (UNDP 2009).
ENCOURAGING LEGAL MIGRATION
Temporary migration programs may help reconcile the desires of migrants and destination country employers to reap economic benefi ts with the broader society’s concern over the social implications of permanent immigration. A survey by the OECD (2007) found that programs in 57 of 92 countries using temporary employment schemes were man-aged through bilateral agreements. The Global Forum on Migration and Development (2008) outlined a set of best-practice recommendations for such agreements. Topics covered include matching the demand for and supply of workers, involving all stakeholders in recruitment, encourag-ing circular migration, recognizing skills and qualifi cations, respecting workers’ rights and protecting them from high transportation and recruit-ment costs, ensuring equal access for and treatment of women, provid-ing appropriate training, and encouraging return by easing reintegration and allowing for repeat migration. The close supervision of employers is essential to the success of such programs. As migrants’ authorization to work in the destination country is linked to a specifi c employer, it is important to monitor working hours, compensation, and conditions to avoid exploitation. Reliance on private intermediaries also requires close monitoring to ensure that migrants are treated fairly.
Some temporary migration programs have had success in encouraging legal, temporary immigration with minimal visa overstays. However, the supervision required to limit overstays and ensure against exploitation of migrants means that successful programs cover only a small number of migrants (World Bank 2006). Morocco’s agreement with Spain, for exam-ple, allowed for the movement of only 700 workers at a time when there were more than 200,000 Moroccan workers in Spain (Collyer 2004).

36 • Leveraging Migration for Africa: Remittances, Skills, and Investments
A few African countries have entered into bilateral agreements with European nations to gain acceptance of some legal migration and support for development in return for cooperation in the return of undocumented migrants. Italy negotiated readmission agreements with Egypt, Morocco,
Box 1.4 The Evolution of European Policies toward Migration from Africa
The need to reduce undocumented migration has become a dominant theme of European policy mak-
ing toward Africa since the early 1990s, particularly in the Mediterranean states—France, Greece, Italy,
Portugal, Spain, and, more recently, Malta. The approach to undocumented migration has evolved
over the past two decades, from bilateral readmission agreements with origin and transit states (which
proved diffi cult to ratify, because they were politically unpopular in the origin countries) to policies
aimed at preventing confl icts, supporting peacekeeping, tying foreign aid to development strategies
directed at the root causes of emigration, and imposing migration-related conditions on trade conces-
sions and debt forgiveness.a The European Commission has proposed negotiating “mobility partner-
ships” with third countries, with a view to meeting labor shortages through short-term movements of
low-skilled workers, as well as circular migration programs covering the highly skilled to mitigate the
problem of brain drain and foster skills transfers.
The Africa–EU Migration, Mobility and Employment (MME) partnership was launched in 2007 to
improve the prospects for employment in Africa and the management of migration fl ows between
Africa and the European Union (Africa–EU MME Partnership 2010). The fi rst action plan under the joint
strategy, covering 2008–10, was adopted in 2007. A new action plan for managing migration during
2011–13 was endorsed at the Africa–EU Heads of States Summit in Libya in November 2010. Examples of
initiatives under the partnership include the following:
• the African Remittances Institute, which aims to facilitate cheaper, faster, and more secure remit-
tance fl ows from Europe to Africa
• the Human Traffi cking Initiative, designed to strengthen the protection of migrants and enhance
prosecution of human traffi cking in line with the Ouagadougou Action Plan
• the Diaspora Outreach Initiative, which builds on existing work to transfer skills, capacity, and knowl-
edge to Africa
• the Observatory on Migration, established to create a network of researchers and research cen-
ters to provide policy makers, civil society, and the public with reliable and harmonized data on
migration
• the Pan-African University’s Nyerere Program, which aims to contribute to high-level African human
resource development and retention while supporting intra-African academic mobility
• the Centre for Migration Management and Information in Mali (with support from the Economic
Community of West African States [ECOWAS], France, Spain, and the European Commission)
• work on an African Guarantee Fund (by the African Development Bank and Spain) to increase access
to fi nance for small and medium enterprises.
a. The readmission agreement signed by Italy and Egypt in January 2007 allowed Egypt to benefi t from a bilateral debt-swap agreement, as well as from trade concessions for its agricultural produce and larger entry quotas for Egyptian nationals in Italy (Cassarino 2009). The bilateral agreement on the circulation of persons and readmission concluded in July 2006 between Algeria and the United Kingdom was part of a round of negotiations that extended to issues such as energy security, the fi ght against terrorism, and police cooperation.

Migration Patterns and Policies in Africa • 37
and Tunisia by offering cooperating partner countries increases in legal admissions. France, Greece, Italy, and Spain have entered into agreements that link readmission to various incentives (Cassarino 2009). Negotia-tions are underway between some West African governments and France, Italy, Portugal, and Spain to establish temporary migration programs as a means of discouraging undocumented migration. In general, Europe’s policies toward reducing undocumented migration from North Africa through bilateral agreements have evolved signifi cantly over the past few decades (box 1.4).
As return to one’s nation of origin is a fundamental right recognized in UN declarations and few countries have limits on return, the leverage that origin countries gain by promising to facilitate return is minimal. Some of the agreements with North African countries go farther, how-ever, by including commitments to strengthen immigration controls to limit undocumented migration from Sub-Saharan Africa (a large portion of which is assumed to be in transit to Europe). Morocco and Tunisia, for example, have passed laws with severe penalties for assist-ing undocumented migration (de Haas 2007). These efforts may have resulted in human rights violations, including the return of refugees to countries where they face persecution and the holding of refugees and undocumented migrants in detention camps (Adepoju, van Noorloos, and Zoomers 2009). Return from transit countries is a contentious issue between West African countries and countries in North Africa.
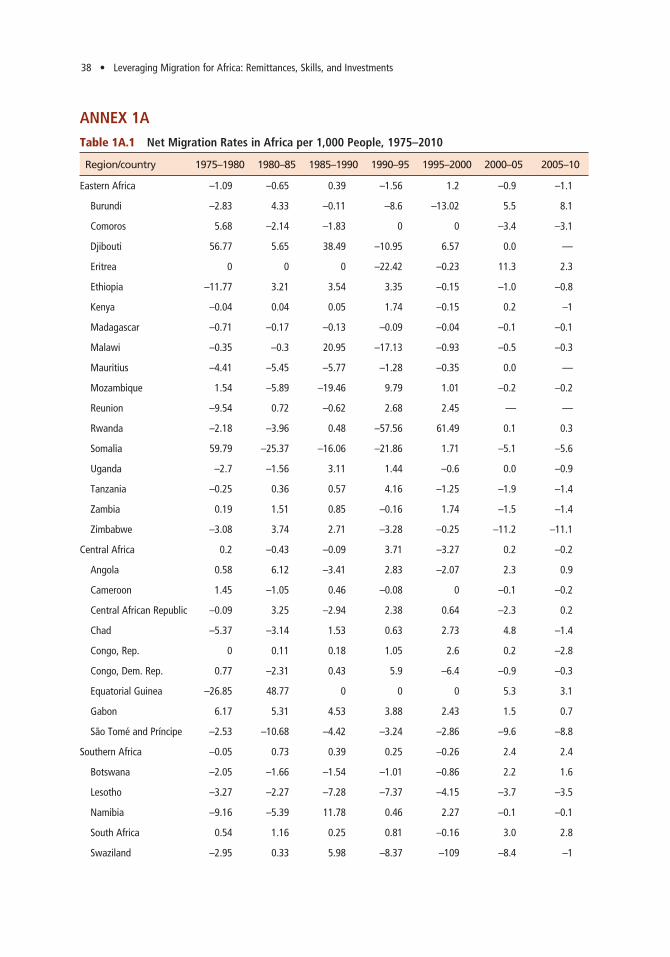
38 • Leveraging Migration for Africa: Remittances, Skills, and Investments
ANNEX 1ATable 1A.1 Net Migration Rates in Africa per 1,000 People, 1975–2010
Region/country 1975–1980 1980–85 1985–1990 1990–95 1995–2000 2000–05 2005–10
Eastern Africa –1.09 –0.65 0.39 –1.56 1.2 –0.9 –1.1
Burundi –2.83 4.33 –0.11 –8.6 –13.02 5.5 8.1
Comoros 5.68 –2.14 –1.83 0 0 –3.4 –3.1
Djibouti 56.77 5.65 38.49 –10.95 6.57 0.0 —
Eritrea 0 0 0 –22.42 –0.23 11.3 2.3
Ethiopia –11.77 3.21 3.54 3.35 –0.15 –1.0 –0.8
Kenya –0.04 0.04 0.05 1.74 –0.15 0.2 –1
Madagascar –0.71 –0.17 –0.13 –0.09 –0.04 –0.1 –0.1
Malawi –0.35 –0.3 20.95 –17.13 –0.93 –0.5 –0.3
Mauritius –4.41 –5.45 –5.77 –1.28 –0.35 0.0 —
Mozambique 1.54 –5.89 –19.46 9.79 1.01 –0.2 –0.2
Reunion –9.54 0.72 –0.62 2.68 2.45 — —
Rwanda –2.18 –3.96 0.48 –57.56 61.49 0.1 0.3
Somalia 59.79 –25.37 –16.06 –21.86 1.71 –5.1 –5.6
Uganda –2.7 –1.56 3.11 1.44 –0.6 0.0 –0.9
Tanzania –0.25 0.36 0.57 4.16 –1.25 –1.9 –1.4
Zambia 0.19 1.51 0.85 –0.16 1.74 –1.5 –1.4
Zimbabwe –3.08 3.74 2.71 –3.28 –0.25 –11.2 –11.1
Central Africa 0.2 –0.43 –0.09 3.71 –3.27 0.2 –0.2
Angola 0.58 6.12 –3.41 2.83 –2.07 2.3 0.9
Cameroon 1.45 –1.05 0.46 –0.08 0 –0.1 –0.2
Central African Republic –0.09 3.25 –2.94 2.38 0.64 –2.3 0.2
Chad –5.37 –3.14 1.53 0.63 2.73 4.8 –1.4
Congo, Rep. 0 0.11 0.18 1.05 2.6 0.2 –2.8
Congo, Dem. Rep. 0.77 –2.31 0.43 5.9 –6.4 –0.9 –0.3
Equatorial Guinea –26.85 48.77 0 0 0 5.3 3.1
Gabon 6.17 5.31 4.53 3.88 2.43 1.5 0.7
São Tomé and Príncipe –2.53 –10.68 –4.42 –3.24 –2.86 –9.6 –8.8
Southern Africa –0.05 0.73 0.39 0.25 –0.26 2.4 2.4
Botswana –2.05 –1.66 –1.54 –1.01 –0.86 2.2 1.6
Lesotho –3.27 –2.27 –7.28 –7.37 –4.15 –3.7 –3.5
Namibia –9.16 –5.39 11.78 0.46 2.27 –0.1 –0.1
South Africa 0.54 1.16 0.25 0.81 –0.16 3.0 2.8
Swaziland –2.95 0.33 5.98 –8.37 –109 –8.4 –1

Migration Patterns and Policies in Africa • 39
Region/country 1975–1980 1980–85 1985–1990 1990–95 1995–2000 2000–05 2005–10
Western Africa 0.4 –0.8 –0.71 –0.71 –0.45 –0.4 –0.6
Benin –4.85 –3.75 –3.23 1.84 –3.2 2.7 1.2
Burkina Faso –6.73 –5.98 –3.07 –2.66 –2.3 1.6 –0.9
Cape Verde –17.37 –11.11 –10.1 –4.65 –2.42 –5.5 –5.1
Côte d’Ivoire 11.07 9.11 4.35 2.98 0.8 –3.7 –1.4
Gambia, The 7.29 7.01 10.53 8.78 7.42 4.4 1.8
Ghana –10.77 3.4 –0.42 0.49 –1.19 0.1 –0.4
Guinea 1.55 –1.52 2.45 10.41 –7.18 –9.7 –6.1
Guinea-Bissau 17.45 –0.04 0.35 3.63 –1.68 0.2 –1.6
Liberia 1.38 0 –34.17 –26.51 35.89 4.1 13.3
Mali –5.25 –5.81 –5.65 –5.37 –5.1 –2.4 –3.2
Mauritania –1.28 –1.88 –3.15 –1.36 0.8 2.1 0.6
Niger –0.71 –0.81 –0.52 0.12 –0.12 –0.5 –0.4
Nigeria 2.87 –1.94 –0.23 –0.21 –0.18 –0.3 –0.4
Senegal 0.78 0.35 0 –1.79 –1.13 –1.9 –1.7
Sierra Leone 0 0 3.29 –18.68 –5.19 14.4 2.2
Togo –8.36 3.64 0.06 –6.67 6.06 –0.1 –0.2
Northern Africa –1 0.3 –2 –1.5 –1.7 –1.6 –0.7
Algeria 0.1 0.8 –0.6 –0.4 –1 –0.9 –0.8
Egypt, Arab Rep. –4 –1.8 –2.1 –1.6 –1.6 –0.8 –0.8
Libya 8.6 10.7 0.5 0.4 0.4 0.5 0.6
Morocco –1.9 –0.5 –2.1 –3.5 –3.6 –3.7 –2.7
Sudan 3.5 3.7 –3.6 –1.2 –1.4 –2.9 0.7
Tunisia –0.6 –0.7 –0.6 –1 –1.2 –1.7 –0.4
Sub-Saharan Africa –1.35 –2.72 –0.35 –1.53 –0.94 –0.4 0.125
Africa –0.4 –0.4 –0.6 –0.5 –0.6 –0.6 –0.5
Source: United Nations Population Division.
ANNEX 1ATable 1A.1 Net Migration Rates in Africa per 1,000 People, 1975–2010 (continued)

40 • Leveraging Migration for Africa: Remittances, Skills, and Investments
NOTES
1. The main data set used was the bilateral migration matrix compiled by the World Bank (2011), which takes stock of migrants by origin as well as destina-tion. The analysis also relied on data provided by the United Nations Population Division (UNPD 2009), the Ghana Living Standard Measurement Survey (Ghana Statistical Service 2008), and household migration surveys collected in 2009 through the Africa Migration Project.
2. Sub-Saharan Africa’s working-age population is projected to increase by 699 million between 2005 and 2050. Over the same period, the working-age population of Europe and North America is projected to fall by a total of 100 million (Koettl 2010).
3. Hatton and Willamson (2003) estimate a regression model to capture the determinants of net migration for Africa. Their fi ndings suggest that movements of refugees; labor market conditions, specifi cally the wage gap; and the supply of labor, particularly among the young, explain a signifi cant part of the variation in net migration rates in Africa.
4. The data for net migration are based on residual estimates from demo-graphic accounting exercises compiled by the UN Population Division using census data.
5. See also UNDP (2009), Ratha and Shaw (2007), and Page and Plaza (2006) for useful discussions of intra-African migration.
6. The purpose of the discussion of fi gures 1.5–1.7 is to compare migration patterns with income levels and colonial ties. There is no claim that these are causal relationships. Establishment of causality would require a model that takes into account the main determinants of migration.
7. Other determinants of migration were not controlled for; this association may be driven by other variables (such as distance). It is also possible that the relationship is biased because errors in measuring migration may be correlated with per capita income.
8. Earlier studies on Africa include Lucas (1985), Bigsten (1994), and Hod-dinott (1994). Azam and Gubert (2006) studied internal as well as international migration in Mali in the Senegal River Valley.
9. See Azam and Gubert (2005) for discussion of the pattern of migration in rural Senegal.
10. In Burkina Faso, for example, 9.5 percent of children ages 6–17 do not live with their parents; 29 percent of these children live abroad, mostly in Côte d’Ivoire (Pizarro 2006).
11. Information on Ethiopia is based on an interview with Ato Abebe Haile, Director of the Employment Service Promotion Directorate, Ministry of Labour and Social Affairs, and a presentation by Minelik Alemuk, Director General for International Law and Consular Affairs of the Ministry of Foreign Affairs of Ethiopia.
12. For example, a married women requires her husband’s permission to travel abroad in Algeria (applies only to women under age 18), the Democratic Republic of Congo, Gabon, and Uganda (when traveling with children). Unmar-ried women under the age of 21 require their father’s permission to travel in

Migration Patterns and Policies in Africa • 41
Egypt. Libya, Swaziland, Sudan, and Yemen impose restrictions on both married and unmarried women (McKenzie 2005).
13. The International Labour Organization (ILO 2002) estimates that the informal sector accounted for 72 percent of total employment in Sub-Saharan Africa (78 percent if South Africa is excluded).
14. Employers wishing to hire foreign workers through legal procedures need to obtain the services of a recruitment company, which will recruit in the country of origin after a “no-objection certifi cate” has been obtained from the Ministry of Home Affairs. Alternatively, employers may support the regularization of undocumented foreign workers whom they may already have employed for a few months, but the law requires that applicants return to their home countries before work permits are granted.
15. See UNDP (2009) on Côte d’Ivoire; Lassailly-Jacob, Boyer, and Brachet (2006) on Nigeria; and de Haas (2007) on Ghana.
BIBLIOGRAPHYAdams, R. H., Jr. 2009. “An Overview of Data Contained in the 2005/06 Ghana
Living Standards Survey (GLSSS 5) (Sub-sample) on Migration and Remit-tances.” World Bank, Washington, DC.
Adepoju, Aderanti. 2005. Creating a Borderless West Africa: Constraints and Pros-pects for Intra-Regional Migration. United Nations Educational, Scientifi c and Cultural Organization (UNESCO), Paris.
Adepoju, Aderanti, Femke van Noorloos, and Annelies Zoomers. 2009. “Europe’s Migration Agreements with Migrant-Sending Countries in the Global South: A Critical Review.” International Migration 48 (3): 42–75.
Africa–EU Migration, Mobility and Employment (MME) Partnership. 2010. Meeting Report. Senior Offi cials Meeting, Brussels, September 15–17. http://www.africa-eu-partnership.org/.
Ammassari, Savina. 2005. Gestion des migrations et politiques de développement: optimiser les benefi ces de la migration internationale en Afrique de l’ouest. Geneva: International Labour Offi ce.
Azam, J. P., and F. Gubert. 2006. “Migrants’ Remittances and the Household in Africa: A Review of the Evidence.” Journal of African Economies (Supplement 2): 426–62.
Barnett, Tony, and Alan Whiteside. 2002. AIDS in the 21st Century: Disease and Globalisation. London: Palgrave McMillan.
Beine, Michel, Frédéric Docquier, and Maurice Schiff. 2009. “International Migra-tion, Transfers of Norms and Home Country Fertility.” World Bank Policy Research Working Paper 4925, Washington, DC.
Bigsten, A. 1994. “The Circular Migration of Smallholders in Kenya.” Journal of African Economies 5 (1): 1–20.
Black, Richard, Lyndsay McLean Hilker, and Claire Pooley. 2004. “Migration and Pro-Poor Policy in East Africa.” Development Research Centre on Migration, Globalisation and Poverty, University of Sussex, United Kingdom.
Brummer, D. 2002. “Labor Migration and HIV/AIDS in Southern Africa.” Inter-national Organization for Migration, Regional Offi ce for Southern Africa, Pretoria, South Africa.

42 • Leveraging Migration for Africa: Remittances, Skills, and Investments
Cassarino, Jean-Pierre. 2009. “Dealing with Unbalanced Reciprocities: Coopera-tion on Readmission and Implications.” In Unbalanced Reciprocities: Readmis-sion Agreements, ed. Jean-Pierre Cassarino. Special Edition of Viewpoints, Mid-dle East Institute, Washington, DC. http://ssrn.com/abstract=1730633.
Collyer, Michael. 2004. “The Development Impact of Temporary International Labour Migration on Southern Mediterranean Sending Countries.” DRC Working Paper T6, Development Research Centre on Migration, Globalisa-tion and Poverty, University of Sussex, United Kingdom.
Decosas, J., F. Kane, J. Anarfi , K. D. Sodji, and H. U. Wagner. 1995. “Migration and AIDS.” Lancet 346 (8978): 826–28.
de Haas, Hein. 2007. “The Myth of Invasion: Irregular Migration from West Africa to the Mahgreb and the European Union.” International Migration Institute, Oxford, United Kingdom.
Delap, Emily, Boureima Ouedraogo, and Bakary Sogoba. 2005. “Developing Alternatives to the Worst Forms of Child Labour in Mali and Burkina Faso.” Save the Children, London.
D’Emilio, A. L., B. Cordero, B. Bainvel, C. Skoog, D. Comini, J. Gough, M. Dias, R. Saab, and T. Kilbane. 2007. “The Impact of International Migration: Children Left Behind in Selected Countries of Latin America and the Caribbean.” United Nations Children’s Fund (UNICEF), Division of Policy and Planning, New York.
Deshingkar, P., and S. Grimm. 2005. “International Migration and Develop-ment: A Global Perspective.” Migration Research Series 19, International Organization for Migration, Geneva.
Docquier, Frédéric, and Abdeslam Marfouk. 2004. “Measuring the International Mobility of Skilled Workers (1990–2000). Release 1.0.” World Bank Policy Research Working Paper 3381, Washington, DC.
Docquier, Frédéric, and Maurice Schiff. 2009. “Measuring Skilled Emigration Rates: The Case of Small States.” IZA Discussion Paper 3388, Institute for the Study of Labor, Bonn.
ECA (Economic Commission for Africa). 2006. International Migration and Devel-opment: Implications for Africa. Addis Ababa: Economic Commission for Africa. http://www.uneca.org/eca_resources/Publications/MigrationReport2006.pdf.
Ek, R., and A. Karadawi. 1991. “Implications of Refugee Flows on Political Stabil-ity in the Sudan.” Ambio 20 (5).
Gallego, J. M., and M. Mendola. 2010. “Labor Migration and Social Networks Participation: Evidence from Southern Mozambique.” Working Paper 183, Department of Economics. University of Milano-Bicocca, Milan.
Ghana Statistical Service. 2008. Ghana Living Standards Survey: Report of the Fifth Round. Accra. http://www.statsghana.gov.gh/docfi les/glss5_report.pdf.
Ghosh, J. 2009. “Migration and Gender Empowerment: Recent Trends and Emerging Issues.” Human Development Research Paper 4, United Nations Development Programme, New York.
Giesbert, L. 2007. “Seeking Opportunties: Migration as an Income Diversifi ca-tion Strat egy of Households in Kakamega District in Kenya.” GIGA Research Programme: Transformation in the Process of Globalization 58, German Institute of Global Area Studies, Hamburg.
Global Forum on Migration and Development. 2008. Compendium of Good Prac-tice Policy Elements in Bilateral Temporary Labour Arrangements. Geneva.
Hatton, T. J., and J. G. Williamson. 2003. “Demographic and Economic Pres-sure on Emigration out of Africa.” Scandinavian Journal of Economics 105 (3): 465–86.

Migration Patterns and Policies in Africa • 43
———. 2009. “Emigration in the Long Run: Evidence from Two Global Centu-ries.” Asian Pacifi c Economic Literature 23 (2): 7–28.
Hoddinott, J. 1994. “ A Model of Migration and Remittances Applied to Western Africa.”Oxford Economic Papers 46 (3): 459–76.
Hugo, Graeme. 2008. “Migration, Development and Environment.” Draft paper for the research workshop “Migration and the Environment: Developing a Global Research Agenda,” Munich, April 16–18. http://www.ciesin.columbia.edu/repository/pern/papers/hugo_statement.pdf.
ILO (International Labour Organization). 2002. “ILO Compendium of Offi cial Statistics on Employment in the Informal Sector.” STAT Working Paper 1, Geneva.
Kahn, K., M. Collison, S. Tollman, B. Wolff, M. Garenne, and S. Clark. 2003. “Health Consequences of Migration: Evidence from South Africa’s Rural Northeast (Agincourt).” Paper prepared for conference “African Migration in Comparative Perspective,” Johannesburg, June 4–7.
Kane, F., M. Alary, I. Ndoye, A. M. Coll, S. M’boup, A. Gueye, P. J. Kanki, and J. R. Joly. 1993. “Temporary Expatriation Is Related to HIV-1 Infection in Rural Senegal.” AIDS 7 (9): 1261–65.
King, R., and J. Vullnetari. 2006. “Orphan Pensioners and Migrating Grandpar-ents: The Impact of Mass Migration on Older People in Rural Albania.” Aging and Society 26 (5): 783–816.
Koettl, J. 2010. “Prospects for Management of Migration between Europe and the Middle East and North Africa.” World Bank, Middle East and North Africa Region, Poverty Reduction and Economic Management Network, Washing-ton, DC.
Konseiga, A. 2005. “New Patterns of Migration in West Africa.” Stichproben 8/2005, Vienna.
Kulu, H. 2005. “Migration and Fertility: Competing Hypothesis Re-examined.” European Journal of Population 21 (1): 51–87.
Lassailly-Jacob, Veronique, Florence Boyer, and Julien Brachet. 2006. “South-South Migration: Example of Sub-Saharan Africa.” European Parliament, Brussels.
Leger, J. P. 1992. “Occupational Disease in South African Mines: A Neglected Epidemic?” South African Medical Journal 81 (4): 197–201.
Lucas, R. E. B. 2005. International Migration and Economic Development: Lessons from Low-Income Countries. Expert Group on Development Issues. Northamp-ton, MA: Edward Elgar Publishing.
———. 2006. “Migration and Economic Development in Africa: A Review of Evidence.” Journal of African Economies (Supplement 2): 337–95.
Lurie, M., B. Williams, A. W. Sturm, G. Garnett, K. Zuma, J. Gittlesohn, and K. Abdool. 2000. “Migration and the Spread of HIV in Southern Africa: Preva-lence and Risk Factors among Migrants and Their Partners and Non-migrants and Their Partners.” Presented at the International Conference on AIDS, Dur-ban, South Africa. July 9–14.
Manuh, Takyiwaa. 2001 “Ghanaian Migrants in Toronto, Canada: Care of Kin and Gender.” Institute of African Studies Research Review 17 (2): 17–26, Uni-versity of Ghana, Legon.
Martens, Jonathan, Maciej “Mac” Pieczkowski, and Bernadette van Vuuren-Smyth. 2003. “Seduction, Sale and Slavery: Traffi cking in Women and Chil-dren for Sexual Exploitation in Southern Africa.” International Organization of Migration, Regional Offi ce for Southern Africa, Pretoria, South Africa.
Martin, Philip. 2010. “Africa: Regions South Africa.” Migration News 17 (Octo-ber): 4.

44 • Leveraging Migration for Africa: Remittances, Skills, and Investments
McKenzie, David J. 2005. “Paper Walls Are Easier to Tear Down: Passport Costs and Legal Barriers to Emigration.” World Bank Policy Research Working Paper 3783, Washington, DC.
McKenzie, D., and H. Rapoport. 2006. “Can Migration Reduce Educational Attainment? Evidence from Mexico.” Policy Research Paper 3952, World Bank, Washington, DC.
Musette, M. S. 2006. “Systems of Statistical Information on Migrant Workers in Central Maghreb.” ILO International Migration Paper 76E, International Labour Offi ce, Geneva.
Odotei, I. 2006. “Fat Money, Thin Body: Between Vulnerability and Survival in the Era of HIV/AIDS: The Case of Migrant Fishermen and Fish Mongers.” In Sex and Gender in an Era of AIDS: Ghana at the Turn of the Millennium, ed. C. Oppong, M. Y. Oppong, and I. K. Odotei. Accra: Sub-Saharan Publishers.
OECD (Organisation for Economic Co-operation and Development). 2007. Pol-icy Coherence for Development 2007: Migration and Developing Countries. Paris.
Packard, R. M. 1989. White Plague, Black Labor: Tuberculosis and the Political Econ-omy of Health and Disease in South Africa. Berkeley: University of California Press.
Page, John, and Sonia Plaza. 2006. “Migration Remittances and Development: A Review of Global Evidence.” Journal of African Economies 15 (Suppl 2): 245–336.
Perez-Armendariz, C., and D. Crow. 2010. “Do Migrants Remit Democracy? International Migration, Political Beliefs, and Behaviour in Mexico.” Com-parative Political Studies 43 (1): 119–48.
Pizarro, Gabriela Rodriguez. 2006. “Specifi c Groups and Individuals: Migrant Workers.” E/CN.4/2006/73/Add.2, UN Economic and Social Council, Com-mission on Human Rights, New York.
Plaza, Sonia, Mario Navarette, and Dilip Ratha. 2011. “Migration and Remit-tances Household Surveys in Sub-Saharan Africa: Methodological Aspects and Main Findings.” World Bank Development Economics Prospects Group, Washington, DC.
Puerto-Gomez, Margarita, and Asger Christensen. 2010. The Impacts of Refugees on Neighboring Countries: A Development Challenge. World Bank, Human Secu-rity Report Project, Washington, DC.
Ratha, Dilip. 2003. “Workers’ Remittances: An External and Stable Source of External Development Finance.” In Global Development Finance, 157–76. Washington, DC: World Bank.
Ratha, Dilip, and William Shaw. 2007. “South-South Migration and Remit-tances.” World Bank Working Paper 102, Washington, DC.
Russell, S. S., K. Jacobsen, and W. D. Stanley. 1990. “International Migration and Development in Sub-Saharan Africa.” Discussion Paper 101, World Bank, Washington, DC.
Shaw, W. 2007. “Migration in Africa: A Review of Economic Literature on Inter-national Migration in 10 Countries.” World Bank, Development Economics Prospects Group, Washington, DC.
Shinn, D. 2008. “African Migration and the Brain Drain.” Paper presented at the Institute for African Studies and Slovenia Global Action Ljubljana, June 20.
Todaro, M. 1969. “A Model of Labor Migration and Urban Unemployment in Developing Countries.” American Economic Review 59 (1): 101–14.
UNAIDS (Joint United Nations Programme on HIV/AIDS). 2008. 2008 Report on the Global AIDS Epidemic. Geneva: UNAIDS.

Migration Patterns and Policies in Africa • 45
UNDP (United Nations Development Programme). 1994. “A Model of Migra-tion and Remittances Applied to Western Africa.” Oxford Economic Papers 46 (3): 459–76.
———. 2009. Human Development Report. Overcoming Barriers: Human Mobility and Development. New York: UNDP.
UNFPA (United Nations Population Fund). 2006. State of the World Population. New York: UNFPA.
UNHCR (United Nations High Commissioner for Refugees). 2010. “Global Trends.” Division of Programme Support and Management, Geneva. http://www.unhcr.org/4c11f0be9.html.
Wongboonsin, Patcharawalai. 2003. “Comparative Migration Policies in the ESCAP Region.” In Migration Patterns and Polices in the Asia Pacifi c Region. Asian Population Studies Series 160, United Nations, Economic and Social Commission for Asia and the Pacifi c, New York.
World Bank. 1993.“Mali: Assessment of Living Conditions.” Report 11842-MLI, Washington, DC.
———. 2006. Global Economic Prospects: Economic Implications of Remittances and Migration. Washington, DC: World Bank.
———. 2008. Migration and Remittances Fact Book 2008. Washington, DC: World Bank.
———. 2009. World Development Indicators. Washington, DC: World Bank.———. 2011. Migration and Remittances Fact Book 2011. Washington, DC: World
Bank. Wouterse, Fleur, and Marrit van den Berg. 2004. “Migration for Survival or
Accumulation: Evidence from Burkina Faso.” Wageningen University and Research Center, Mansholt Graduate School of Social Sciences, Wageningen, the Netherlands.


47
CHAPTER
Migrant Remittances
2
47
Remittances are the central and most tangible link between migra-tion and development (Russell 1992; Ratha 2007). Remittance infl ows to Africa quadrupled between 1990 and 2010, reaching
nearly $40 billion in 2010, equivalent to 2.6 percent of Africa’s gross domestic product (GDP) in 2009 (see table 2.1). After foreign direct investment (FDI), remittances are the continent’s largest source of foreign infl ows. Migrant remittances contribute to international reserves, help fi nance imports, and improve the current account position of recipient countries. They are associated with reductions in poverty, improved health and education outcomes, and increased business investments. Although the limited reach of intermediaries in rural areas, lack of effec-tive competition, and inadequate fi nancial and regulatory infrastructure contribute to high remittance costs and the prevalence of informal chan-nels (especially for intra-African remittances), the rapid adoption of inno-vative money transfer and branchless banking technologies are increasing access to remittances and broader fi nancial services for the poor.
This chapter draws on extensive literature and new surveys of house-holds, central banks, and remittance service providers conducted in select African countries and key migrant-destination countries as part of the Africa Migration Project.1 It discusses the economic implications of migrant remittances for African countries and recipient households, examines the challenges and opportunities for remittance markets in Africa, and makes policy recommendations for better leveraging remit-tances and thus promoting development in Africa.
The chapter presents three main fi ndings.
• At the macro level, remittances are a large and stable source of exter-nal fi nance for African countries that improves their creditworthiness and access to capital. In many African countries, these fl ows exceed

48 • Leveraging Migration for Africa: Remittances, Skills, and Investments
FDI, portfolio equity, and debt fl ows; in some countries they are equal in size to offi cial aid. Remittances tend to be more stable than other sources of foreign exchange, and they are often countercycli-cal, helping sustain consumption and investment during downturns and performing the role of a shock absorber. These benefi cial effects of remittances improve sovereign creditworthiness and the external debt sustainability of African countries. Securitization of future remit-tance fl ows can increase the access of African banks and fi rms to international capital markets; it can also be used to fund longer-term development projects, such as infrastructure and low-income hous-ing. Using remittances for such purposes should be accompanied by prudential debt management and efforts to ensure medium-term sustainability of external debt.
• Remittance receipts are associated with reductions in poverty, increased household resources devoted to investment, and improved health and education outcomes. Migrant remittances help smooth household consumption and act as a form of insurance for households facing shocks to their income and livelihood caused by drought, famine, and other natural disasters. Household surveys in Africa show that remittance-receiving households have greater access to secondary and tertiary education, health services, information and communication technology, and banking than households that do not receive remit-tances. The surveys also reveal that the average amount of remittances received by households from outside Africa is larger than that of intra-regional and domestic remittances. A signifi cant part of all remittances is spent on human and physical capital investments, such as educa-tion, health, land, housing, starting a business, improving farms, and purchasing agricultural equipment.
• Remittance markets in Africa remain relatively underdeveloped in terms of their fi nancial infrastructure and the regulatory environment, but the rapid adoption of innovative money transfer technologies is transforming the landscape for remittances and broader fi nancial services. Sub-Saharan Africa has the highest remittance costs among developing regions and the largest share of informal and unrecorded remittances among developing regions. These costs represent an unnec-essary burden on African migrants, reducing the amounts sent and their development impact. In a survey conducted for this study, almost 70 percent of central banks in Sub-Saharan Africa cited high costs as the most important factor inhibiting the use of formal remit-tance channels. A large share of international remittances to Africa is channeled through a few large international money transfer agencies,

Migrant Remittances • 49
which often work in exclusive partnership with African banks and post offi ces. At the same time, the remittance landscape in Africa is rapidly changing with the introduction of innovative, mobile money transfer and branchless banking technologies. Although adoption of these technologies has been limited largely to domestic money transfers (in part because of concerns about money laundering and terrorist fi nanc-ing related to cross-border remittances), these technologies have the potential to vastly improve access to both remittances and broader fi nancial services, including low-cost savings and credit products, for African migrants and remittance recipients in African countries.
This chapter is organized as follows. The fi rst section discussed the trends and prospects for remittance fl ows to Africa. The second section examines the implications of remittances for growth and access to exter-nal fi nance. The third section considers the implications of remittances for the welfare of African households, drawing on the global evidence and literature on Africa. The fourth section reviews the nature of remit-tance markets in Africa, including issues of cost, competition, legal and regulatory environments, and technological innovations. The last section provides policy recommendations.
RECENT REMITTANCE TRENDS AND THE IMPACT OF THE GLOBAL FINANCIAL CRISIS
Remittances have become one of the most signifi cant sources of foreign exchange for African countries. They are likely to remain so despite a slowdown in their growth as a result of the global fi nancial crisis.
SIZE AND IMPORTANCE OF REMITTANCES TO AFRICA
Offi cially recorded remittance fl ows to Africa are estimated to have reached $40 billion in 2010 (divided roughly equally between North Africa and Sub-Saharan Africa), almost twice the amount received in 2005 and more than four times the $9.1 billion received in 1990 (table 2.1 and fi gure 2.1). Although part of the recorded growth of remittances refl ects improvements in measurement, the main reasons for the extraordinary level of growth are the increase in emigration from Africa and the rising incomes of African migrants, on the back of a booming global economy before the fi nancial crisis in 2008–10. Remittances to Africa equaled 2.6 percent of GDP in 2009, somewhat more than the 1.9 percent average for all developing countries.

50 • Leveraging Migration for Africa: Remittances, Skills, and Investments
Table 2.1 Remittances and Other Resource Flows to Africa, 1990–2010 ($ billions, except where otherwise indicated)
Region/resource fl ow 1990 1995 2000 2005 2007 2008 2009 2010ePercent of GDP, 2009
Sub-Saharan Africa
Migrant remittances 1.9 3.2 4.6 9.4 18.6 21.4 20.6 21.5 2.2
Offi cial aid 16.9 17.8 12.1 30.8 32.6 36.0 .. .. 3.7
Foreign direct investment 1.2 4.4 6.7 18.1 28.7 37.0 30.2 .. 3.2
Private debt and portfolio equity fl ows 0.6 2.5 4.9 10.6 15.6 –6.5 12.3 .. 1.3
North Africa
Migrant remittances 7.2 7.0 6.6 13.1 18.3 19.8 17.5 18.2 3.3
Offi cial aid 7.2 3.0 2.2 2.5 3.0 3.5 .. .. 0.6
Foreign direct investment 1.1 0.9 2.8 9.9 22.5 21.6 14.9 .. 2.9
Private debt and portfolio equity fl ows –0.1 0.0 1.2 1.7 –3.6 –0.4 –0.5 .. –0.1
All Africa
Migrant remittances 9.1 10.2 11.3 22.5 36.9 41.2 38.1 39.7 2.6
Offi cial aid 24.1 20.7 14.3 33.2 35.6 39.5 .. .. 2.6
Foreign direct investment 2.4 5.3 9.5 28.0 51.1 58.6 45.1 .. 3.1
Private debt and portfolio equity fl ows 0.5 2.5 6.2 12.3 12.0 –6.8 11.8 .. 0.8
Source: Authors’ calculations based on data from World Development Indicators (December 2010) database.Note: .. = negligible. e = estimated. Data for offi cial aid as percentage of GDP are for 2008.
Figure 2.1 Remittances and Other Resource Flows to Africa, 1990−2010
–20
–10
0
10
20
30
40
50
60
1990
1991
1992
1993
1994
1995
1996
1997
1998
1999
2000
2001
2002
2003
2004
2005
2006
2007
2008
2009
2010
e
Official aid
US$
bill
ions
Foreign direct investment
Portfolio equity& private debt
Recordedremittances
Source: Authors’ calculations based on data from World Development Indicators (December 2010) database.Note: e = estimated.

Migrant Remittances • 51
Recorded remittance fl ows to the African continent are similar in size to offi cial aid fl ows. They are several times larger than offi cial aid to North Africa (3.3 percent of GDP versus 0.6 percent of GDP) and two-thirds the size of offi cial aid fl ows to Sub-Saharan Africa (2.2 percent of GDP versus 3.7 percent of GDP). Remittance fl ows in many African countries are larger than private capital fl ows, such as FDI and portfo-lio debt and equity fl ows. Private capital fl ows are more important for South Africa, the largest economy in Sub-Saharan Africa, and for oil and mineral producers (for example, Angola, Gabon, and Sudan) that receive substantial FDI fl ows. But for many low-income African countries, remit-tances exceed private investment fl ows and represent a lifeline to the poor.
A few countries account for a substantial share of remittances to Sub-Saharan Africa and North Africa (see annex table 2A.1). Nigeria’s $10 billion equaled about half of all offi cially recorded remittances to Sub-Saharan Africa in 2010. Other large remittance recipients in dollar terms include Sudan, Kenya, Senegal, South Africa, and Uganda. How-ever, as a share of GDP, the largest recipients are Lesotho (28.5 percent), Togo (10.7 percent), Cape Verde (9.4 percent), Senegal (9.3 percent), and The Gambia (8.2 percent). Egypt and Morocco, the two largest recipients in North Africa in terms of both absolute fl ows and share of GDP, account for three-quarters of fl ows to North Africa, followed by Algeria and Tunisia.
These estimates of remittance infl ows, based on data offi cially reported in the International Monetary Fund (IMF) balance of payments statistics, are likely well below the actual volume of remittance fl ows to Africa. The remittance infl ows data reported by country authorities themselves are often higher than the IMF fi gures. For example, Ghana’s central bank reported $1.6 billion in remittance infl ows in 2009—more than 10 times the $114 million reported in the IMF balance of payments statistics. Ethiopia reported more than $700 million—about twice the $353 mil-lion reported by the IMF. These discrepancies are in part related to the misreporting of migrant remittances with other types of current transfers, such as transfers to nongovernmental organizations and embassies and payments related to small-value-trade transactions.
In addition, only about half of Sub-Saharan African countries report remittance data with any regularity (Irving, Mohapatra, and Ratha 2010); some countries—such as the Central African Republic, the Democratic Republic of Congo, Somalia, and Zimbabwe, all of which are believed to receive signifi cant remittance fl ows—report no remittance data at all. Even fewer Sub-Saharan African countries report monthly or quarterly data
52 • Leveraging Migration for Africa: Remittances, Skills, and Investments
on remittances.2 Remittance fl ows through money transfer companies are often captured indirectly, in the reporting of partner banks, for exam-ple, but the independent operations of such fi rms may not be fully cap-tured. Cross-border fl ows through other institutions, such as post offi ces, savings cooperatives, microfi nance institutions, and emerging channels, such as mobile money transfer ser vices, are not captured in most Sub-Saharan African countries.
Surveys of migrants and remittance recipients and other secondary sources suggest that informal remittance fl ows, which are not included in the IMF estimates, could be equal to or exceed offi cial fi gures for Sub-Saharan Africa (Page and Plaza 2006; IFAD 2009). Central banks in some African countries, such as Uganda, are making efforts to estimate these informal fl ows—through, for example, foreign exchange transactions data and surveys of remittance-receiving households—but these efforts appear to be limited to a few countries.
Data on the sources of remittance fl ows to Sub-Saharan Africa are not available. However, estimates based on bilateral migration stocks, incomes in destination countries, and incomes in countries of origin indicate that the top sources of remittances for Sub-Saharan Africa are the EU15 countries (41 percent of infl ows) and the United States (28 percent) (Ratha and Shaw 2007; World Bank 2011) (fi gure 2.2). The remaining sources are other developing countries, primarily in Africa (13 percent); the Gulf Cooperation Council (GCC) countries (9 percent), and other high-income countries (8 percent). North African countries are even more dependent on remittances from Western Europe (54 percent) and the GCC countries (27 percent), receiving only 5 percent of remit-tances from the United States.
Although intraregional migration is more important in Sub-Saharan Africa than in any other developing region (two-thirds of international emigrants from Sub-Saharan African countries are within the region [see chapter 1]), intraregional remittances are estimated to be much smaller than remittances from outside the region. These remittances are smaller primarily because the incomes of cross-border migrants within Africa are lower than the incomes of African migrants in Europe, the United States, and the Gulf.
EFFECT OF THE GLOBAL FINANCIAL CRISIS
Analysis of the impact of the global fi nancial crisis on remittance fl ows is diffi cult because of the lack of timely and reliable data in most Afri-

Migrant Remittances • 53
can countries. Model-based estimates of remittance infl ows suggest that remittance fl ows to Sub-Saharan Africa declined by a modest 3.7 percent in 2009 (Ratha, Mohapatra, and Silwal 2010; see table 2.1). The decline in North African countries was more severe, in part because most North African migrants live in Europe, where GDP fell sharply in 2009.3 Flows to North Africa are estimated to have fallen 11.1 percent in 2009.
Remittance fl ows to Sub-Saharan Africa appear to have been less affected than those to North Africa because the remittance sources are more diversifi ed (see fi gure 2.2). Remittance fl ows to Egypt, the largest recipient in the North African region, declined 18 percent in 2009; fl ows to Morocco, the second-largest recipient, declined 9 percent. In Sub-Saharan Africa, fl ows to Kenya remained fl at in 2009 and declined by 6 percent in Cape Verde and 9 percent in Ethiopia.
Some African countries experienced recovery in remittance fl ows in the fi rst half of 2010. For the year as whole, remittance fl ows to Africa are estimated to have risen 4 percent. The uncertain economic recovery, per-sistently high unemployment rates, and tighter immigration restrictions in destination countries, however, could restrain the growth of remittance infl ows to Africa in the medium term.
Figure 2.2 Source of Remittances to Africa and to All Developing Regions, 2010
Source: Authors’ calculations updating the methodology of Ratha and Shaw 2007 using bilateral migration data from World Bank 2011 and economic data from the World Development Indicators (December 2010).
3%
10%
8%
9%
41%
Sub-Saharan Africa North Africa
Other developing
Within Africa
Other high income
Gulf Cooperation Council
Western Europe
United States
All developingregions
28%
9%1%
20%
18%
19%
33%
3%4%7%
27%
54%
5%

54 • Leveraging Migration for Africa: Remittances, Skills, and Investments
IMPLICATIONS OF REMITTANCES AT THE MACROECONOMIC LEVEL
A review of the macroeconomic impact of remittances, focusing on Sub-Saharan Africa, underlines their positive impact on access to fi nance and growth.
STABILITY AND COUNTERCYCLICALITY OF REMITTANCES
Remittances tend to behave countercyclically. They thus act as a form of insurance against macroeconomic shocks for origin countries (Chami, Hakura, and Montiel 2009). Remittances rose during the fi nancial crises in Mexico in 1995 and in Indonesia and Thailand in 1998 (Ratha 2007). They have increased with natural disasters and political confl icts (Clarke and Wallsten 2004; Yang and Choi 2007; Yang 2008a; Mohapatra, Joseph, and Ratha 2009).
Remittances thus behave very differently from most other private fl ows, which tend to be procyclical (Ratha 2003; Frankel 2010), largely because most remittances involve transactions among members of the same household and are thus less driven by profi t-seeking motives than private resource fl ows. Remittances are also less at the mercy of changes in the priorities of offi cial aid donors and their fi scal situation (World Bank 2006). Remittances can be procyclical when they are sent for investment purposes, as they sometimes are in middle-income countries (Sayan 2006; Lueth and Ruiz-Arranz 2008).4 In Sub-Saharan Africa, where private capi-tal fl ows have fl uctuated considerably from year to year, remittances have been more stable than both FDI and private debt and equity fl ows (Gupta, Pattillo, and Wagh 2009; Singh, Haacker, and Lee 2009) (fi gure 2.3).
SOVEREIGN CREDITWORTHINESS AND EXTERNAL FINANCING
Remittance infl ows can improve sovereign creditworthiness by increasing the level and stability of foreign exchange receipts (Ratha 2007; Avendaño, Gaillard, and Nieto-Parra 2009). Given their size, in the absence of remit-tance receipts, several African countries would have had access to a much lower level of imports or would have run much larger current account defi cits. Remittances also help stabilize the current account by reducing the volatility of overall capital fl ows (Chami and others 2008). Remit-tances can reduce the probability of current account reversals, especially when they exceed 3 percent of GDP (Bugamelli and Paterno 2009).
Appropriately accounting for remittances can improve evaluations of African countries’ external debt sustainability and creditworthiness. The

Migrant Remittances • 55
ratio of external debt to exports would be signifi cantly lower in many African countries if remittances were included in the denominator (fi gure 2.4). Remittances are now being factored into sovereign ratings in middle-income countries and debt sustainability analysis in low-income coun-tries (IMF 2010). In several remittance-recipient countries, country cred-itworthiness analysis by the major rating agencies often cite remittances as a factor in their rating decisions (Avendaño, Gaillard, and Nieto-Parra 2009).5 But less than half of African countries have a sovereign rating from one of the three major rating agencies (Ratha, Mohapatra, and Plaza 2009). Obtaining a sovereign rating—and improving the sovereign rating in those African countries that have one (after appropriately accounting for remittances)—will translate into improved market access for subsov-ereign entities, such as African banks and fi rms, whose foreign currency borrowing is typically subject to the country’s “sovereign ceiling” (Boren-sztein, Cowan, and Valenzuela 2007; Ratha, De, and Mohapatra 2011).
Including remittances in the calculation of the debt-to-exports ratio can provide a more accurate evaluation of debt sustainability and the amount of fi scal adjustment that may be needed to place debt on a sus-tainable path (Abdih and others 2009; IMF and World Bank 2009). The joint World Bank–IMF Low-Income Country Debt Sustainability Frame-work now allows for more explicit consideration of remittances in evalu-ating the ability of countries to repay external obligations and take on nonconcessional borrowing from private creditors (IMF 2010). Including
Figure 2.3 Stability of Various Sources of Resource Flows to Africa, 1990–2008
Source: Authors’ calculations based on World Bank Global Development Finance database 2010.
Coef
ficie
nt o
f var
iatio
n
0
0.5
1.0
1.5
2.0
Private debt and portfolio equity flows
Foreign direct investment
Remittances Official aid

56 • Leveraging Migration for Africa: Remittances, Skills, and Investments
remittances in creditworthiness analysis using the shadow ratings model of Ratha, De, and Mohapatra (2011) suggests that the creditworthiness of remittance-recipient countries would improve by one to three notches. The poor quality of national remittance data in many African countries makes it diffi cult to assess the extent of improvement in sovereign cred-itworthiness that would result from the inclusion of remittances in the Africa region, however.
SECURITIZATION OF FUTURE REMITTANCES
African countries can potentially use future remittances (and other future receivables) as collateral to raise fi nancing from international capital markets for fi nancing development projects (Ratha 2005; Ketkar and Ratha 2009a). Banks in several developing countries—including Brazil, Egypt, El Salvador, Guatemala, Kazakhstan, Mexico, and Turkey—have been able to raise cheaper and longer-term fi nancing (more than $15 bil-lion since 2000) from international capital markets by securitizing future remittance fl ows. A reputable bank in a remittance-receiving country can use remittances (which represent a hard-currency asset for the bank) as collateral as long as it is able to pay out local currency remittances to ben-efi ciaries. The use of an offshore special-purpose vehicle helps mitigate
Figure 2.4 External Debt as a Share of Exports from and Remittances to Selected Countries in Sub-Saharan Africa
Source: Authors’ calculations based on World Bank World Development Indicators database, December 2010.
perc
ent
800
700
600
500
400
300
200
100
0Guinea-Bissau
Liberia Comoros Guinea
Excluding remittances
Including remittances
CapeVerde
Gambia SierraLeone
Côted’Ivoire

Migrant Remittances • 57
several key elements of the sovereign risk (including expropriation and convertibility risks). The future fl ow securitization structure allows securi-ties to be rated higher than the sovereign credit rating and to reach out to a wider group of potential investors.6
Banks in several African countries, aided by the African Export-Import Bank, have used remittance securitization to raise international fi nancing at lower cost and longer maturities. In 1996, the African Export-Import Bank coarranged the fi rst ever future-fl ow securitization by a Sub-Saharan African country, a $40 million medium-term loan to a development bank in Ghana, backed by its Western Union remittance receivables (Afreximbank 2005; Rutten and Oramah 2006). Afreximbank launched its Financial Future-Flow Prefi nancing Programme in 2001 to expand the use of migrant remittances and other future fl ows—credit cards and checks, royalties arising from bilateral service agreements on air fl ight fees, and so forth—as collateral to leverage external fi nancing to fund agricultural and other projects in Sub-Saharan Africa. In 2001, it arranged a $50 million remittance-backed syndicated note issuance facility for a Nigerian entity using Moneygram receivables; in 2004 it coarranged a $40 million remittance-backed syndicated term loan facility to an Ethiopian bank using its Western Union receivables (Afreximbank 2005).
Many African countries can potentially issue bonds backed by future remittances, with amounts ranging from a tenth to a fi fth of their annual remittance fl ows, depending on the level of overcollateralization required to implement these transactions. Updated estimates using the methodol-ogy used by Ratha, Mohapatra, and Plaza (2009) suggest that the poten-tial for securitization of remittances and other future receivables is $35 billion annually for Sub-Saharan Africa (table 2.2).
A low level of domestic fi nancial development, a lack of banking rela-tionships with banks abroad, and the high fi xed costs of legal, investment
Table 2.2 Securitization Potential for Sub-Saharan Africa, 2009 ($ billions)
Type of collateral Receivables Securitization potential
Fuel exports 91.1 18.2
Agricultural raw materials exports 6.7 1.3
Ores and metals exports 37.7 7.5
Travel services 19.0 3.8
Remittances 20.6 4.1
Total 175.0 35.0
Source: Authors’ estimates of securitization potential, based on the methodology of Ratha, Moha -patra, and Plaza 2009 and data from World Development Indicators, December 2010.

58 • Leveraging Migration for Africa: Remittances, Skills, and Investments
banking, and credit-rating services—especially in poor African countries with few large entities—make the use of securitization instruments diffi -cult for Sub-Saharan countries (Ketkar and Ratha 2009a). The viability of securitization of future remittance fl ows can be facilitated by introducing a securitization law and improving fl ows through formal channels.
Bilateral and multilateral donors can play a signifi cant role in facilitat-ing remittance securitization and mitigating the risks to African countries of issuing these remittance-backed bonds. Efforts can include providing seed money for hiring investment banking services; providing legal help, fi nancial guarantees, and technical assistance in project design and cred-itworthiness analysis; and advising on prudential debt management to ensure fi scal and debt sustainability. The international community can also help African countries obtain sovereign ratings, which act as a ceiling for private sector borrowings.7
Potential issuers of remittance-backed bonds should be reminded of the risks of currency mismatch associated with foreign currency debt. Considerations must be given to prudential risk management before tak-ing on additional debt. Potential volatility in remittance fl ows and dis-ruption in relationship with the diaspora can occur quickly in countries where political risks are high. Large foreign currency infl ows after a bond issuance can also cause currency appreciation, which requires careful macroeconomic management.
ECONOMIC GROWTH, FINANCIAL DEVELOPMENT, AND COMPETITIVENESS
Remittances can affect economic growth directly, by raising consump-tion and investment expenditures; by increasing expenditures on health, education, and nutrition that contribute to long-term productivity (see next section); and by improving the stability of consumption and output at both the household and macroeconomic level (Chami, Hakura, and Montiel 2009; Mohapatra, Joseph, and Ratha 2009). These benefi ts in turn increase the supply of investment from both domestic and foreign sources by increasing fi nancial intermediation (Aggarwal, Demirgüç-Kunt, and Martinez Peria 2006; see Gupta, Pattillo, and Wagh 2009 for evidence for Sub-Saharan Africa), which can ultimately contribute to higher growth (Rajan and Zingales 1998; see Ghirmay 2004 and Akinlo and Egbetunde 2010 for Sub-Saharan Africa).8
Remittances also may reduce growth, for several reasons. First, large infl ows of remittances can cause the real exchange rate to appreciate (“Dutch disease”), which can impair growth if tradable production

Migrant Remittances • 59
imparts external benefi ts, such as economies of scale and learning effects (see World Bank 2006; Acosta, Lartey, and Mandelman 2009; Gupta, Pattillo, and Wagh 2009). But remittances do not appear to have had a signifi cant impact on competitiveness for developing countries on aver-age (Rajan and Subramanian 2005).9 And there is little evidence of this effect for Africa, apart from some small countries, such as Cape Verde, where remittance infl ows are nearly 10 percent of GDP (Bourdet and Falck 2006).
Second, in principle, large remittance receipts may reduce the supply of labor (Lucas 1987; Azam and Gubert 2006; Bussolo and Medvedev 2007; Chami and others 2008). There is little evidence of this phenom-enon, however, and choices by some individuals to work less would be unlikely to have a signifi cant impact on output in African countries with high levels of underemployment.
Third, some experts argue that the additional income from remit-tances can reduce pressure to improve the quality of policies and insti-tutions by making recipients less dependent on government benefi ts (Abdih and others 2008) or by providing suffi cient foreign exchange to ease governments’ concerns over structural rigidities. Others, however, fi nd that remittances have a positive impact on growth in countries with higher-quality political and economic policies and institutions (Catri-nescu and others 2009).
The complexity of the growth process and the well-known prob-lems of cross-country growth regressions make it diffi cult to determine whether remittances increase growth rates. Empirical specifi cations that include remittances in cross-country growth regressions provide mixed results (Barajas and others 2009; Catrinescu and others 2009; Singh, Haacker, and Lee 2009). The lack of signifi cance of remittances in some growth equations may refl ect the fact their effects on human and physi-cal capital are realized only over a very long time period; that the effects are endogenous (that is, they rise with declines in output); or that offi cial data on remittances are of poor quality.10
In economies in which the fi nancial system is underdeveloped, remit-tances may alleviate liquidity and credit constraints and help fi nance small business investments, thereby effectively acting as a substitute for fi nancial development (Giuliano and Ruiz-Arranz 2009). The authors fi nd evidence that the impact of remittances on growth is stronger when the level of fi nancial development is weaker. Regression analysis suggests that remittances have the greatest impact on growth when the share of the broad money supply (M2) in GDP (an indicator of fi nancial develop-ment) is below 28 percent, as it is in most African economies.

60 • Leveraging Migration for Africa: Remittances, Skills, and Investments
DEVELOPMENT IMPACT OF REMITTANCES AT THE MICROECONOMIC LEVEL
Remittances can help reduce poverty, raise household investment, and increase access to health and education services. This section reviews the literature on the development implications of remittances from several developing regions, including Africa. It also looks at recent evidence col-lected through the Africa Migration Project surveys of the characteristics of households that receive remittances from outside Africa, within Africa, and within the same country (see Plaza, Navarrete, and Ratha 2011 for the survey methodology). Although it can be diffi cult to separate the effects of remittances from the overall effect of migration in empirical studies (McKenzie and Sasin 2007), it is well established that the primary economic benefi t of migration to recipient households is the receipt of remittances (World Bank 2006; see chapter 4 of this book for other benefi ts, such as the transmission of knowledge, trade and investment linkages, fertility norms, and so on). The fi ndings regarding households receiving remittances in origin countries complement information about the characteristics of remittance senders in destination countries (see World Bank 2006; Bollard, McKenzie, and Morten 2010).
IMPACT OF REMITTANCES ON POVERTY AND INEQUALITY
Remittances can reduce the level of poverty by directly augmenting the incomes of poor recipient households and increasing aggregate demand, thereby increasing employment and wages of the poor. Cross-country regressions generally fi nd that remittances have reduced the share of poor people in the population (Adams and Page 2003, 2005).
Econometric analyses suggest that remittances have reduced poverty in Africa. Anyanwu and Erhijakpor (2010) fi nd that a 10 percent increase in offi cial international remittances as a share of GDP led to a 2.9 per-cent decline in the share of people living in poverty in a sample of 33 African countries for 1990–2005, with declines also observed for the depth and severity of poverty (see also Ajayi and others 2009). Gupta, Pattillo, and Wagh (2009) fi nd that the impact of remittances on poverty in Africa, although positive, was smaller than for other developing coun-tries, a result they attribute to the possibility that poverty can itself cause increased migration and hence larger remittances. Studies of Burkina Faso (Lachaud 1999; Wouterse 2010); Ghana (Quartey and Blankson 2004; Adams 2006; Adams, Cuecuecha, and Page 2008a); Lesotho (Gustafsson and Makonnen 1993); Morocco (Sorensen 2004); and Nigeria (Odozia, Awoyemia, and Omonona 2010) conclude that remittances are associ-

Migrant Remittances • 61
ated with a reduction in the share of people in poverty—and in some cases the depth and severity of poverty as well. A substantial part of remit-tances in Mali is saved for unexpected events, thus serving as insurance for entire households (Ponsot and Obegi 2010). Food security in rural areas of Nigeria improved considerably with an increase in remittances (Babatunde and Martinetti 2010).
The evidence on the implications of remittances for inequality is less clear, because it is not possible to observe counterfactual incomes in the absence of migration (World Bank 2006; Ratha 2007). Households that receive remittances, especially from outside Africa, may have been richer to begin with (allowing a family member to migrate in the fi rst place); they may also have higher incomes because of migration and the receipt of remittances. Recent household surveys conducted as a part of the Africa Migration Project and an earlier survey in Ghana fi nd that more than half of households in Burkina Faso, Ghana, and Nigeria and 30 percent of house-holds in Senegal receiving remittances from outside Africa are in the top two consumption quintiles (fi gure 2.5). Remittances from outside Africa tend to be much larger on average than remittances from other African countries or domestic sources (Bollard, McKenzie, and Morten 2010; fi gure 2.6).
In contrast to remittances from outside Africa, remittances from Afri-can countries may reduce inequality (see Wouterse 2010 for this effect in Burkina Faso).11 Households receiving remittances from other African
Figure 2.5 Percentage of Remittance Recipients in Top Two Consumption Quintiles in Selected African Countries, by Source of Remittances
Source: Authors’ calculations based on results household surveys conducted in Burkina Faso, Kenya, Nigeria, Senegal, and Uganda in 2009 as part of the Africa Migration Project and Ghana Living Standards Survey 2005–06.
0
20
40
60
80
Uganda BurkinaFaso
Ghana Kenya Nigeria Senegal
Remittances from outside AfricaRemittances from within AfricaDomestic remittances
Perc
ent o
f rem
ittan
ce re
cipi
ents
in to
p tw
o co
nsum
ptio
n qu
intil
es

62 • Leveraging Migration for Africa: Remittances, Skills, and Investments
countries or domestic sources tend to be more evenly distributed across consumption expenditure quintiles. Similar analysis for the distribution of wealth using an asset index broadly mirrors these fi ndings.12
A recent study on the characteristics of African remittance senders based on microdata of more than 12,000 African migrants in nine Organ-isation for Economic Co-operation and Development (OECD) countries (Bollard, McKenzie, and Morten 2010) complements the fi ndings from surveys of remittance-recipient households. The destination country data suggest that Africans remit twice as much on average as migrants from other developing countries. The average annual remittance sent by an African emigrant household is $1,263—more than the average annual per capita income of Sub-Saharan African countries. Africans also tend to remit more often, and African migrants from poorer African countries are more likely to remit than those from richer African countries.13 Male African migrants in the OECD send larger amounts on average than females ($1,446 compared with $878 for females) partly because of their higher earnings, but also because they are more likely to have spouses back home.
USES OF REMITTANCES
Some observers claim that remittances are spent mostly on consumption rather than investment, on ceremonies and luxuries rather than essen-
Figure 2.6 Average Annual Remittances in Selected African Countries, by Source of Remittances
Source: Authors’ calculations based on household surveys conducted in Burkina Faso, Kenya, Nigeria, Senegal, and Uganda in 2009 as part of the Africa Migration Project and Ghana Living Standards Survey 2005–06.
Remittances from outside AfricaRemittances from within AfricaDomestic remittances
0
500
1,000
1,500
2,000
2,500
3,000
3,500
Burkina Faso Ghana Uganda Nigeria Kenya Senegal
Aver
age
rem
ittan
ces
in la
st y
ear (
US$
)

Migrant Remittances • 63
tials. This section reviews the substantial literature and data indicating that remittances are often spent on essential consumption, investment in physical and human capital, and expenditures that improve welfare and productivity, including health, education, and information and com-munication technology, and that these expenditures serve as insurance against adverse shocks.
Comparison of the uses of remittances by source (outside Africa, cross-border remittances within Africa, and domestic remittances) suggests that the average amount of remittances received by households from outside Africa is larger than that of intraregional and domestic remittances and that a signifi cant part of it tends to be spent on human and physical capi-tal investments, such as education, health, land, building a house, start-ing a business, improving the farm, or purchasing agricultural equipment (table 2.3). There are also gender-specifi c differences in the uses of remit-tances: evidence from previous studies suggest that remittance-receiving households headed by women tend to spend more on health and educa-tion expenditures than do similar households headed by men.
Investment in physical capital and entrepreneurship
It is diffi cult to identify the share of remittances devoted to specifi c uses, as money is fungible, and reports from remittance recipients on how they use remittances may be biased.14 Evidence from other regions sug-gests that a signifi cant part of remittances is spent on housing investment and the purchase of land, particularly where few other assets are reliable stores of value. Taylor and Wyatt (1996) argue that the shadow value of remittances for overcoming risk and liquidity constraints is particularly important to households in the low- to middle-income range, which oth-erwise tend to be credit constrained. Guatemalan households receiving remittances spend more at the margin on housing, even after controlling for the endogeneity of remittance-receiving status (Adams and Cuecuecha 2010). About one-fi fth of the capital invested in 6,000 microenterprises in urban Mexico was fi nanced by remittances (Woodruff and Zenteno 2001; see also Massey and Parrado 1998).15 In rural Pakistan, inter-national remittances raise the propensity to invest in agricultural land (Adams 1998). Remittance-receiving households that benefi ted from an exchange rate shock spent more hours in self-employment and were more likely to start relatively capital-intensive entrepreneurial enterprises in the Philippines (Yang 2008b). Some recent studies (for example, Ashraf and others 2010) fi nd that giving migrants more control over the uses of remittances can increase savings rates among both migrants and remit-tance recipients.

64 • Leveraging Migration for Africa: Rem
ittances, Skills, and Investments
Table 2.3 Use of Remittances by Recipient Households in Selected African Countries, by Source of Remittances (percent of total remittances)
Burkina Faso Kenya Nigeria Senegal Uganda
UseOutside Africa
Within Africa Domestic
Outside Africa
Within Africa Domestic
Outside Africa
Within Africa Domestic
Outside Africa
Within Africa Domestic
Outside Africa
Within Africa Domestic
Food 23.5 34.9 48.7 12.8 14.5 29.7 10.1 20.1 1.0 52.6 72.6 81.9 7.6 9.7 12.4
Education 12.4 5.9 9.4 9.6 22.9 20.5 22.1 19.6 4.5 3.6 2.3 4.6 12.7 14.5 20.2
Health 11.3 10.1 12.5 7.3 5.8 7.0 5.1 12.0 10.6 10.7 7.3 2.9 6.3 14.5 24.8
Clothing 5.0 0.7 0.7 .. .. .. .. .. .. .. .. .. .. .. ..
Rent (house, land) 1.4 0.6 1.7 5.7 0.4 7.4 4.4 4.9 0.8 1.0 0.0 2.2 5.1 8.1 4.5
Cars/trucks 0.1 0.0 0.1 1.3 1.0 0.4 0.0 0.0 0.5 0.2 0.0 0.0 2.5 0.0 0.0
Marriage/funeral 2.1 3.9 3.1 0.9 1.7 2.0 0.4 1.0 0.7 2.9 2.4 1.1 7.6 6.5 1.7
Construction of new house 25.7 10.1 2.6 11.2 27.5 1.3 5.8 0.0 0.1 7.0 0.7 0.0 2.5 1.6 0.4
Rebuilding of house 0.3 1.0 1.2 5.3 3.1 1.3 4.7 3.2 7.0 4.2 0.7 0.1 6.3 3.2 2.1
Purchase of land 0.0 1.4 0.1 8.4 7.0 1.3 24.8 16.6 18.2 3.0 0.0 0.0 3.8 4.8 2.1
Improvement of farma 0.0 3.9 1.1 2.3 0.4 4.4 .. .. .. .. .. .. .. .. ..
Business 10.4 2.6 2.4 3.9 8.4 13.0 21.7 20.1 11.1 1.3 5.7 0.2 7.6 9.7 2.1
Investment .. .. .. 24.2 0.6 4.7 .. .. .. .. .. .. .. .. ..
Other 7.7 24.9 16.3 7.2 6.6 6.9 0.8 2.6 3.5 13.5 8.3 6.9 38.0 27.4 29.8
Source: Authors’ calculations based on results of household surveys conducted in Burkina Faso, Kenya, Nigeria, Senegal, and Uganda in 2009 as part of the Africa Migration Project.Note: .. = negligible or missing.a. Includes agricultural equipment.
Migrant Remittances • 65
The evidence for Africa on the uses of remittances for investment and entrepreneurship is somewhat limited. In Egypt, overseas savings are asso-ciated with a higher likelihood of entrepreneurship (and thus investment) among return migrants (McCormick and Wahba 2001, 2003). In 1997, Osili (2004) conducted a survey of 112 Nigerian migrant households in Chicago and a matched sample of 61 families in Nigeria. She found that a third of remittances were spent on housing investment the preceding year and that migrants’ housing investment was responsive to changes in macroeconomic conditions such as infl ation, the real exchange rate, and political stability.
The household surveys conducted as part of the Africa Migration Project fi nd that a signifi cant portion of international remittances are spent on land purchases, building a house, business, improving a farm, agricultural equipment, and other investments (as a share of total remittances, invest-ment in these items represented 36.4 percent in Burkina Faso, 55.3 per-cent in Kenya, 57.0 percent in Nigeria, 15.5 percent in Senegal, and 20.2 percent in Uganda [see table 2.3]). A substantial share of within-Africa remittances was also used for these purposes in Burkina Faso, Kenya, Nigeria, and Uganda. The share of domestic remittances devoted to these purposes was much lower in all of the countries surveyed, with the excep-tion of Nigeria and Kenya (see fi gure 4.3 in chapter 4).
Education
Remittances may increase expenditure on education by helping fi nance schooling and reducing the need for child labor. But the absence of an adult household member may put pressure on children to perform additional household chores or work on the family farm, reducing time for education. Evidence from other regions suggests that remittances can contribute to better school attendance, higher school enrollment rates, and additional years in school (box 2.1).
The paucity of household survey data means that the evidence on the impact of remittances on educational outcomes in Africa is relatively weak. In Egypt children of remittance-receiving households were more likely to enroll in university than other children, and girls ages 15−17 in remittance- receiving households performed less domestic work and were more likely to be in school than other girls the same age (Elbadawi and Roushdy 2009). Remittance-receiving households in Ghana invested more in educa-tion than other households (Adams, Cuecuecha, and Page 2008b).
Evidence from household surveys referenced above show that educa-tion was the second-highest use of remittances from outside Africa in

66 • Leveraging Migration for Africa: Remittances, Skills, and Investments
Nigeria and Uganda, the third highest in Burkina Faso, and the fourth highest in Kenya (see table 2.3). Households that receive international remittances have substantially more household members who have completed secondary and tertiary education than other households (fi gure 2.7). In Kenya and Uganda, households devote 15 percent or more of domestic and intraregional remittances to education; Nigerian households devote 20 percent of intra-Africa remittances to education. Although the amounts spent were much smaller than those from remit-tances from outside Africa, these fi gures indicate that a signifi cant share of all sources of remittances goes to education. Although these fi ndings do not control for the possible endogeneity of remittance-receiving sta-
Box 2.1 How Do Remittances Affect Education Outcomes?
Numerous studies (particularly in Latin America) fi nd a positive impact of remittances on edu-
cation. Using cross-country data for 82 countries, Ebeke (2010) fi nds that remittances reduce
the prevalence of child labor in developing countries characterized by weak fi nancial systems
and income instability. Remittances in Ecuador increased school enrollment for the poor and
decreased the incidence of child labor, especially for girls and people in rural areas (Calero, Bedi,
and Sparrow 2009). In El Salvador, the impact of remittances on the likelihood of children remain-
ing in school was 10 times that of other sources of income in urban areas and 3 times that of other
sources in rural areas (Cox-Edwards and Ureta 2003). Guatemalan households receiving interna-
tional remittances spent twice as much at the margin on education as they would have spent
had they not received remittances (Adams and Cuecuecha 2010). In Haiti, remittance-receiving
households reported higher school attendance than households that did not receive remittances
(Amuedo-Dorantes, Georges, and Pozo 2010; Bredl (2011). Girls in migrant-sending households in
Mexico in which the mother had a low level of education completed 0.2–0.9 years more schooling
than girls from households without a migrating relative (Hanson and Woodruff 2003). In Mexico,
remittances had a positive effect on literacy and school attendance for children ages 6−14 (Lopez-
Cordova 2005) .
Results are similar in Asia. Bansak and Chezum (2009) fi nd a net positive impact of migra-
tion and remittances on schooling in Nepal. School enrollment rates for girls in migrant-sending
households in rural Pakistan were 54 percent higher than those of other households (Mansuri
2007). Remittance-receiving households in the Philippines had a higher level of schooling and
educational expenditure and lower rates of child labor for children ages 10–17 (Yang 2008b). In
Sri Lanka remittances were used to fi nance private education, which can improve educational
outcomes (De and Ratha 2006).
Other studies have found a negative impact of migration on educational outcomes. McKenzie
and Rapoport (2010) fi nd that living in a migrant-sending household in Mexico reduced the likeli-
hood of children completing high school by 13–15 percent. This result may refl ect the fact that a
large share of Mexican migration to the United States is for unskilled work and the opportunity
cost of gaining an additional year of schooling is small when there are few domestic employment
options after school. Using micro-level data, Acosta, Fajnzylber, and López (2007) and Acosta and
others (2008) fi nd that remittances were associated with increased educational attainment in only
6 of 11 Latin American countries.

Migrant Remittances • 67
tus, they nevertheless suggest that remittances may help raise the level of resources devoted to education.
Health
Remittances can contribute to better health outcomes by enabling house-hold members to purchase more food and healthcare services and perhaps
Figure 2.7 Secondary and Tertiary Education Attainment of Remittance Recipient and Nonrecipient Households in Selected Countries in Africa
Source: Authors’ calculations based on Africa Migration Project household surveys in Burkina Faso, Kenya, Nigeria, Senegal, and Uganda in 2009 and Ghana Living Standards Survey 2005–06.
Households with no remittances
Households receivingdomestic remittances
Households receivingremittances from outside Africa
0
0.2
0.4
0.6
0.8
1.0
1.2
1.4
1.6
1.8
2.0
Burkina Faso Ghana Uganda Kenya Senegal Nigeria
Aver
age
num
ber o
f hou
seho
ld m
embe
rs
with
sec
onda
ry e
duca
tion
0
0.2
0.4
0.6
0.8
1.0
1.2
1.4
Ghana
b. Tertiary education attainment
a. Secondary education attainment
Senegal Burkina Faso Kenya Uganda Nigeria
Aver
age
num
ber o
f hou
seho
ld m
embe
rs
with
tert
iary
edu
catio
n
68 • Leveraging Migration for Africa: Remittances, Skills, and Investments
by increasing information on health practices. In a cross-country analysis of 56 developing countries, Drabo and Ebeke (2010) fi nd that higher remittances per capita were associated with greater access to private treat-ment for fever and diarrhea and that remittances complemented foreign health aid in poor countries. In a cross-country analysis of 84 countries (46 countries with quintile-level data), Chauvet, Gubert, and Mesplé-Somps (2009) fi nd that remittances reduced overall child mortality but tended to be more effective in reducing mortality among children from the richest households than the poorest households.16
The evidence on the impact of remittances on health outcomes is rather sparse for Africa. Evidence from the household surveys referenced above indicates that households dedicate 5–12 percent of remittances from outside Africa to healthcare (see table 2.3). A similar share of within-Africa and domestic remittances is devoted to health expenditures, but the amounts spent are much lower because of the smaller average size of these remittances. Among households in Ghana that receive remit-tances from outside and within Africa, households headed by women spend more on healthcare than households headed by men (Guzmán, Morrison, and Sjöblom 2007). In rural Mali, households receiving remit-tances increased demand for health services and were more likely to seek modern care (Birdsall and Chuhan 1986). In a recent study using panel data for 1993–2004 for the KwaZulu-Natal province in South Africa, Nagarajan (2009) fi nds that remittance-receiving households spent a larger budget share on food and health expenditures and that remittances enabled poorer households to access better-quality medical care.
Insurance against adverse shocks
Migration enables households to diversify their sources of income and thus reduce their vulnerability to risks such as drought, famine, and other natural disasters. In Ecuador, remittances helped keep children of remittance-receiving households in school when faced with adverse shocks (Calero, Bedi, and Sparrow 2009). Increased remittances helped smooth household consumption and compensate for the loss of assets after an earthquake in El Salvador in 2001 (Halliday 2006). Transfers from friends and relatives in the United States played an important role in reducing the distress caused in Haiti by Cyclone Jeane in 2004 (Weiss-Fagan 2006) and after the devastating earthquake in 2010 (Ratha 2010). Remittance-receiving households in the Aceh region of Indonesia recov-ered more quickly than other households after the 2004 tsunami (Wu 2006). Migrant remittances were important factors in disaster recovery and reconstruction after a devastating earthquake in Pakistan in 2005

Migrant Remittances • 69
(Suleri and Savage 2006). In the Philippines, remittances helped com-pensate for the loss in income caused by adverse rainfall shocks (Yang and Choi 2007). In Thailand, domestic remittances increased in response to below-average rainfall in the recipients’ region and to increases in medical expenses in recipient households (Miller and Paulson 2007).
Migration and remittances have been a part of coping mechanisms adopted by African households facing shocks to incomes and livelihoods (Block and Webb 2001). During droughts in Botswana, families at risk of losing cattle and those relying on crops for their sustenance tended to receive more remittances than other families (Lucas and Stark 1985). Ethiopian households that receive international remittances were less likely than other households to sell their productive assets, such as live-stock, to cope with food shortages (Mohapatra, Joseph, and Ratha 2009 (table 2.4). Remittances in Ghana helped smooth the household con-sumption of rural farmers (Quartey and Blankson 2004; Quartey 2006).
In rural Mali, remittances responded positively to shocks suffered by recipient households (Gubert 2002, 2007). Surveys in the Senegal River Valley in Mali and in Senegal suggest that migration acts as an intrahouse-hold risk-diversifi cation strategy, with remittances a contingent fl ow that supports family consumption in case of an adverse shock (Azam and Gubert 2005, 2006). Similar mechanisms for sharing risk through inter-household transfers of cattle have been observed for East African pastoral-ists (Huysentruyt, Barrett, and McPeak 2009).
Remittances can also enable recipient households to build stronger and more resilient housing. Mohapatra, Joseph, and Ratha (2009) fi nd that remittance-receiving households in Burkina Faso and Ghana were more likely to have a concrete house, after controlling for the possible endogeneity of the remittance-receiving status by using propensity score-matching methods (fi gure 2.8).
Table 2.4 Food Security Strategies and Remittance Receipts among Ethiopian Households (percent of households relying on strategy to cope with food shortages)
StrategyHouseholds not
receiving remittancesHouseholds receiving domestic remittances
Households receiving remittances from
outside Africa
Food aid 42.3 55.9 0.0
Sale of livestock and livestock products 40.5 3.9 0.0
Sale of other agricultural products 18.2 3.7 0.0
Own cash 10.3 5.3 31.3
Sale of household assets 4.1 4.6 11.5
Other 15.6 33 48.9
Source: Mohapatra, Joseph, and Ratha 2009.Note: Columns sum to more than 100 percent because households reported more than one response.
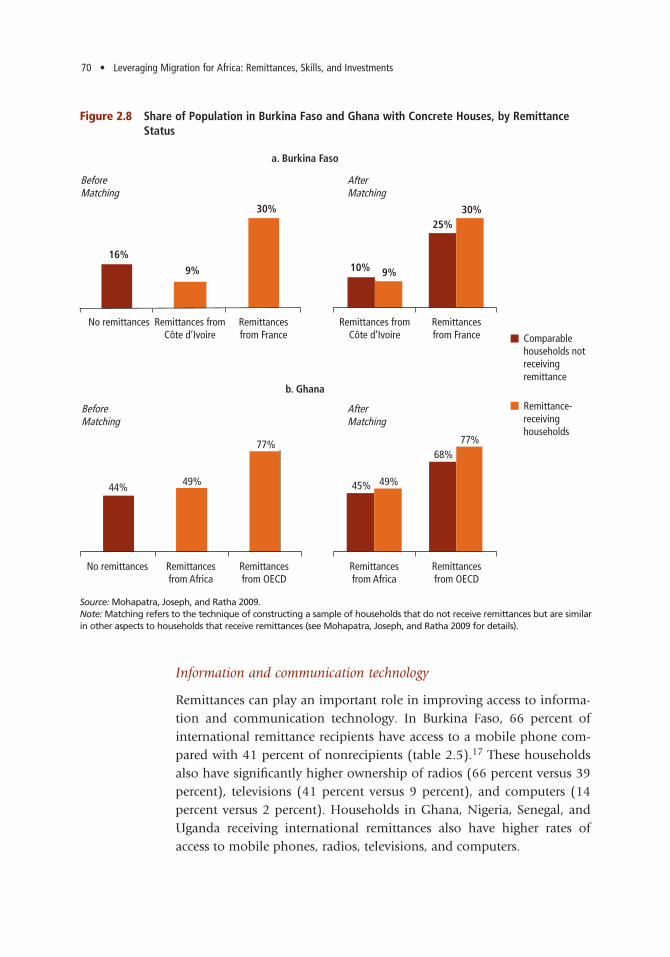
70 • Leveraging Migration for Africa: Remittances, Skills, and Investments
Information and communication technology
Remittances can play an important role in improving access to informa-tion and communication technology. In Burkina Faso, 66 percent of international remittance recipients have access to a mobile phone com-pared with 41 percent of nonrecipients (table 2.5).17 These households also have signifi cantly higher ownership of radios (66 percent versus 39 percent), televisions (41 percent versus 9 percent), and computers (14 percent versus 2 percent). Households in Ghana, Nigeria, Senegal, and Uganda receiving international remittances also have higher rates of access to mobile phones, radios, televisions, and computers.
Figure 2.8 Share of Population in Burkina Faso and Ghana with Concrete Houses, by Remittance Status
Source: Mohapatra, Joseph, and Ratha 2009.Note: Matching refers to the technique of constructing a sample of households that do not receive remittances but are similar in other aspects to households that receive remittances (see Mohapatra, Joseph, and Ratha 2009 for details).
Comparablehouseholds notreceiving remittance
Remittance-receivinghouseholds
No remittances
No remittances
Remittances fromCôte d’Ivoire
Remittances fromCôte d’Ivoire
Remittancesfrom Africa
Remittancesfrom OECD
Remittancesfrom OECD
Remittancesfrom Africa
Remittancesfrom France
Remittancesfrom France
44% 49%
77%
45% 49%
68%77%
AfterMatching
AfterMatching
BeforeMatching
BeforeMatching
a. Burkina Faso
b. Ghana
16%
9%
30%
10% 9%
25%30%

Migrant Remittances • 71
Table 2.5 Household Access to Information and Communication Technology in Selected African Countries, by Remittance Status (percent of households with selected devices)
Country/device
Households receiving domestic
remittances
Households receiving
remittances from within Africa
Households receiving
remittances from outside Africa
Households receiving
no remittances
Burkina Faso
Mobile phone 40.1 40.6 65.5 39.3
Radio 65.4 64.1 69.0 61.5
Television 7.8 6.9 41.4 8.7
Computer access 1.0 1.6 13.8 1.8
Number of observations 422 507 29 1,145
Ghana
Mobile phone 9.1 14.6 45.4 19.6
Radio 48.2 31.4 47.3 49.9
Television 18.7 16.9 52.7 33.6
Computer access 0.5 0.0 3.3 2.4
Number of observations 367 33 133 8,105
Kenya
Mobile phone 79.5 82.3 87.0 77.3
Radio 84.8 86.7 88.9 82.7
Television 50.4 56.6 76.2 52.2
Computer access 7.1 17.7 30.4 20.6
Number of observations 395 113 369 1,065
Nigeria
Mobile phone 70.4 87.3 95.5 57.3
Radio 86.9 94.3 93.8 82.5
Television 54.2 75.8 93.8 48.8
Computer access 7.2 15.1 22.6 10.7
Number of observations 573 77 328 1,272
Senegal
Mobile phone 72.8 82.3 97.5 75.2
Radio 76.3 66.9 95.1 75.9
Television 40.3 37.9 79.7 49.1
Internet access 1.6 0.9 9.6 6.6
Number of observations 320 163 460 1,010
Uganda
Mobile phone 58.3 76.2 85.4 50.4
Radio 78.1 81.0 90.2 73.4
Television 19.4 28.6 59.8 25.7
Internet access 4.1 3.2 28.1 7.1
Number of observations 242 63 82 1,528
Source: Authors’ calculations based on results household surveys conducted in Burkina Faso, Kenya, Nigeria, Senegal, and Uganda in 2009 as part of the Africa Migration Project and Ghana Living Standards Survey 2005–06.

72 • Leveraging Migration for Africa: Remittances, Skills, and Investments
FINANCIAL ACCESS
Remittances are often the only relationship that many poor people have with the formal fi nancial system. If remittances are received through banks or other fi nancial intermediaries (such as microfi nance institutions or savings cooperatives), there is a high likelihood that some part of the remittance will be saved (Aggarwal, Demirgüç-Kunt, and Martinez Peria 2006; Gupta, Pattillo, and Wagh 2009). Even if remittances are received through money transfer companies or informal providers, recipients may save the remittance in some type of fi nancial institution rather than put it under the mattress. The steady stream of remittance receipts can also be used as a factor in evaluating the creditworthiness of recipients for micro-loans, consumer loans, and small business loans (sought, for example, to purchase agricultural equipment) (Ratha 2007). Remittances also play a role in smoothing the income stream of poor households that face high income volatility and shocks. This reduced income volatility can make them more attractive borrowers.
Data from recent household surveys referenced above reveal that households that receive international remittances typically have better access to fi nancial services, such as bank accounts (fi gure 2.9). House-holds receiving domestic remittances tend to be worse off in terms of fi nancial access than households receiving international remittances, in
Figure 2.9 Percent of Households with Bank Accounts in Selected African Countries, by Remittance Status
Source: Authors’ calculations based on results household surveys conducted in Burkina Faso, Kenya, Nigeria, Senegal, and Uganda in 2009 as part of the Africa Migration Project and Ghana Living Standards Survey 2005–06.
0
20
40
60
80
Burkina Faso Senegal Ghana Nigeria UgandaKenya
Households with no remittances
Households receivingdomestic remittances
Households receiving remittances from outside Africa
Perc
ent o
f hou
seho
lds
with
ban
k ac
coun
ts

Migrant Remittances • 73
part because households that send out domestic migrants tend to be poorer. There are some notable exceptions, such as Kenya, where the widespread use of mobile money transfers and the ability to save using mobile phones has effectively substituted for formal banking services (see next section for a detailed discussion).
REMITTANCE MARKETS IN AFRICA
Remittance markets in Africa remain relatively underdeveloped in terms of their fi nancial infrastructure and the regulatory environment, but the rapid adoption of innovative money transfer technologies is transform-ing the landscape for remittances and broader fi nancial services. Surveys of African households and remittance service providers conducted in the context of the Africa Migration Project indicate three broad patterns. First, intraregional (South-South) and domestic remittances are sent over-whelmingly through informal channels. They are hand carried during visits home, sent through transport companies, and delivered through other informal channels, in part because of limited access to and the high cost of formal fi nancial (banking) services relative to average per capita incomes in African countries (Pendleton and others 2006; Bracking and Sachikonye 2008; Tevera and Chikanda 2009).
Second, a large share of remittances from outside Africa is channeled through a few large international money transfer agencies, which often work de facto or de jure in exclusive partnership with African banks and post offi ces (IFAD 2009). In a recent survey, almost 70 percent of central banks in Sub-Saharan Africa cited high costs as the most important factor inhibiting the use of formal remittance channels (Irving, Mohapatra, and Ratha 2010) (fi gure 2.10).
Finally, Africa (especially Kenya) has seen the introduction of innova-tive, mobile money transfer (Morawczynski and Pickens 2009; Aker and Mbiti 2010). Although the adoption of these innovative technologies has been limited mostly to domestic money transfers, largely because of concerns about money laundering and terrorist fi nancing, the technolo-gies have the potential to vastly improve access to both remittances and broader fi nancial services, including low-cost savings and credit products, for African migrants and remittance recipients.
HIGH REMITTANCE COSTS
The cost of sending remittances to Sub-Saharan Africa is the highest among developing regions (fi gure 2.11). In mature corridors such as

74 • Leveraging Migration for Africa: Remittances, Skills, and Investments
Figure 2.10 Factors Inhibiting the Use of Formal Remittance Channels in Sub-Saharan Africa and All Developing Countries
Source: Irving, Mohapatra, and Ratha 2010.
68%
All countries in Sub-Saharan Africa
Remittance-receiving developing countries
56%
0 10 20 30 40
percent
50 70 8060
High cost
No bank branch near beneficiary
Sender’s/recipients’ lack ofaccess to bank accounts
Sender’s/recipients’lack of valid ID
Mistrust/lack of informationon electronic transfers
Mistrust/lack of formalfinancial institutions
Exchange controls
those between the United States and Mexico, remittance costs can be as low as $5; between the Gulf Cooperation Council countries and South Asia, remittance costs can be as low as $1 per transaction.18 Data for select intra-African remittance corridors suggest that the cost of sending remittances within Africa ranges from 5 percent to 15 percent of the amount sent (fi gure 2.12). Large parallel market premiums between offi -cial and parallel market exchange rates in many African countries imply that the true cost is likely to be larger. Evidence based on surveys and fi eld experiments suggests that remittance fl ows respond to reductions in costs (Gibson, McKenzie, and Rohorua 2006; Martinez, Aycinena, and Yang 2010). Reducing remittance costs can lead to increases in the remittances sent by migrants, increasing the resources available to recipi-ent households.
High remittance costs represent an unnecessary burden on African migrants and likely reduce the amounts sent and their development impact (Ratha and Riedberg 2005; World Bank 2006). These high remit-tance costs are related to the low level of fi nancial development in Africa (Aggarwal, Demirgüç-Kunt, and Martinez Peria 2006; Beck and Martinez Peria 2009) and the small number of fi rms handling remittance transfers (IFAD 2009; Orozco 2009).19 The cost of banking services tends to be high relative to income levels in African countries, and the reach of banks outside of urban areas is limited (Demirgüç-Kunt, Beck, and Honohan 2008).20 For example, the average fee to open a savings account is 28

Migrant Remittances • 75
percent of the average African’s annual income—compared with less than 1 percent in countries in Latin America and the Caribbean (fi gure 2.13). The number of bank branches and automatic teller machines (ATMs) per square kilometer is lower in Sub-Saharan Africa than in any other developing region.
Figure 2.11 Cost of Sending Remittances to and from Developing Regions
Source: Authors’ calculations based on data from the World Bank Remittance Prices database, October 2010.Note: Remittance cost includes fees and foreign exchange commissions.a. Excludes the Pacifi c Islands.
a. Average cost of sending remittances to developing regions
b. Cost of sending money to Africa from selected countries
Perc
ent o
f $20
0 se
ntPe
rcen
t of $
200
sent
0
4
8
12
16
20
24
11.3
9.4 9.1
11.7
15.1
10.0
8.2 8.49.7 9.8
14.6
16.2
0
2
4
6
8
10
12
14
16
18
20
Netherlands France Italy UnitedKingdom
South Africa Ghana
First quarter 2009
Third quarter 2010
Sub-SaharanAfrica
Latin Americaand the Caribbean
Europe andCentral Asia
East Asiaand Pacifica
South AsiaMiddle East andNorth Africa
23.1
17.017.9
15.1 14.513.1

76 • Leveraging Migration for Africa: Remittances, Skills, and Investments
Surveys of remittance service providers in Africa suggest that the high costs of remittances in Africa is in part caused by exclusivity agreements between banks and international money transfer companies (IFAD 2009; Irving, Mohapatra, and Ratha 2010). Other studies show that such exclu-sive partnerships keep costs high for migrants and reduce the amounts sent, thereby limiting the development impact of remittances (Ratha and Riedberg 2005; World Bank 2006). Several African countries, including Ethiopia, Nigeria, and Rwanda, have taken steps to eliminate these part-nerships in recent years.
Surveys and interviews of remittance service providers in key desti-nation countries (France, the United Kingdom, and the United States) reveal that African migrants’ lack of access to formal fi nancial services and required identifi cation, exclusive partnerships, and regulations related to anti–money laundering and combating the fi nancing of terrorism (AML-CFT) also raise the costs of transferring money to Africa.21 Because remittance senders lack access to banking facilities, most transfers from destination countries outside Africa are sent as cash through money trans-fer companies or through banks acting as agents of money transfer com-panies rather than through potentially less expensive account-to-account and cash-to-account transfers.
Some West African banks have representative offi ces in France and operate through partnerships with French banks (Ponsot 2011), but
Figure 2.12 Cost of Sending $200 within Sub-Saharan Africaa
Source: Authors’ calculations based on results of surveys of selected remittance service providers con-ducted at end of 2008. a. Figure shows percentage cost of sending $200 or local currency equivalent.
16.0
12.5
10.5
9.0
9.0
8.7
8.3
8.0
6.7
5.8
Burkina Faso – Ghana
Nigeria – Ghana
Nigeria – Benin
Senegal – Mali
Burkina Faso – Côte d'Ivoire
Uganda – Kenya
Kenya – Tanzania
Kenya – Uganda
Uganda – Rwanda
Uganda – Tanzania
0 3 421 5 6 7 8 9 10 11 12percent
14 1513 16

Migrant Remittances • 77
Figure 2.13 Measures of Retail Banking Accessibility in Developing Regions
Source for panel a: Authors’ calculations based on World Bank FinStats database, February 2011.Source for panels b and c: Authors’ calculations based on data from World Bank’s Finance for All database 2007; Demirgüç-Kunt, Beck, and Honohan 2008.
a. Number of bank branches
Num
ber p
er 1
00,0
00 a
dults
5.5
19.8
12.1
17.3
10.9
13.6
0
5
10
15
20
Sub-SaharanAfrica
Latin Americaand the Caribbean
Europe andCentral Asia
East Asiaand Pacific
South Asia Middle East andNorth Africa
b. Number of automatic teller machines (ATMs)
Num
ber p
er 1
,000
sq.
km
.
1.2 3.27.7 8.2
19.9
71.6
0
10
20
30
40
50
60
70
80
Sub-SaharanAfrica
Latin Americaand the Caribbean
Europe andCentral Asia
East Asiaand Pacific
South Asia Middle East andNorth Africa
c. Fees to open a savings account
Perc
ent o
f GDP
per
cap
ita
0
10
20
30 27.9
14.9
6.4 6.0
3.10.9
Sub-SaharanAfrica
Latin Americaand the Caribbean
Europe andCentral Asia
East Asiaand Pacific
South Asia Middle East andNorth Africa

78 • Leveraging Migration for Africa: Remittances, Skills, and Investments
the range of services provided appears to be small.22 Many West African migrants in France appear to prefer to send money through friends, rela-tives, or even community groups.
Exclusivity partnerships are also found in some remittance-sending countries. The French postal service has an exclusive partnership with Western Union (Ponsot 2011). Although documented remittance costs are among the lowest for France–Africa corridors, such partnerships can limit competition and the access of migrants to alternative remittance service providers. U.S. regulations aimed at AML–CFT implemented after September 11, 2001, have made it more diffi cult for smaller remittance service providers to access banking and settlement facilities for the transfer of remittances to Africa (Mohapatra and Ratha 2011). Mainstream U.S. banks appear to be wary of having money transfer operators—particularly from East Africa and other African subregions—as clients.
REMITTANCE CHANNELS IN AFRICA
As a result of the high cost and limited reach of formal channels—as well as the informal and seasonal character of African migration—informal channels play a large role in remittance transfers within Africa (see annex table 2A.2). Some estimates suggest that the prevalence of informal trans-fers in Africa is the highest among all developing regions (Page and Plaza 2006; Ratha and Shaw 2007). Surveys conducted in Southern Africa in 2004–05 found that carrying remittances by hand during visits home accounted for about half of remittance transfers in southern Africa: remit-tances carried by hand and sent through friends and relatives accounted for 88 percent in Lesotho, 73 percent in Swaziland, 68 percent of remit-tances in Botswana, and 46 percent in Zimbabwe (Pendleton and others 2006; Tevera and Chikanda 2009; see Bracking and Sachikonye 2008 for evidence from Zimbabwe on the increasing reliance on informal chan-nels during a period of hyperinfl ation).23
Recent household surveys conducted in the context of the Africa Migration Project in 2009 and an earlier survey conducted in Ghana in 2005–06 (Ghana Living Standards Survey 2005–06) show some country variation in the importance of informal channels. The share of house-holds receiving within-Africa remittances that used informal channels was 60 percent or more in Burkina Faso, Ghana, and Senegal (fi gure 2.14 and annex table 2A.2). Among migrants in South Africa sending remittances to other African countries, mostly within the Southern African region, the share of emigrants using informal channels was almost 80 percent.
Informal channels were even more prevalent for domestic money transfers (95 percent in Burkina Faso and Senegal, 94 percent in Ghana, and 78 percent in Uganda). In relatively prosperous South Africa, informal

Migrant Remittances • 79
Figure 2.14 Formal and Informal Remittance Channels in Africa
Source: Authors’ calculations based on results of household surveys conducted in Burkina Faso, Kenya, Nigeria, Senegal, South Africa, and Uganda in 2009 as part of the Africa Migration Project and Ghana Living Standards Survey 2005–06.a. Channels used to send remittances from South Africa to other African countries. For other countries, the fi gure indicates channels for inward remittances.
a. Remittances from outside Africa
0
20
40
60
80
100
Burkina Faso Ghana Kenya Nigeria Senegal Uganda
perc
ent
b. Remittances within Africa
0
20
40
60
80
100
Burkina Faso Ghana
perc
ent
Kenya Nigeria Senegal Uganda South Africaa
perc
ent
c. Domestic remittances
0
20
40
60
80
100
Burkina Faso Ghana Kenya Nigeria Senegal UgandaSouth Africa
OtherMobile InformalBankMoney transfer operator

80 • Leveraging Migration for Africa: Remittances, Skills, and Investments
remittance channels account for only a quarter of domestic remittances, in part because of a well-developed fi nancial system and recent efforts to improve fi nancial inclusion, such as the introduction of the Mzansi scheme, through which South African banks provide basic, low-cost bank accounts to the poor (Bankable Frontier Associates 2009). Banks in South Africa account for 41 percent of domestic remittances, about three times the volume money transfer companies handle (16 percent). In Nigeria, which has a better banking infrastructure than most other African coun-tries, banks account for 37 percent of the volume of remittances and money transfer companies 6 percent). In contrast, 62 percent of domestic transfers in Kenya were remitted through mobile phones as of late 2009.
During the second half of 2009, the share of households receiving within-Africa remittances that used informal channels was 24 percent in Kenya (the only country of the fi ve with extensive reliance on transfers through mobile phones, which account for 24 percent of within-Africa remittances); 33 percent in Nigeria, where banks are more widely used than in the other countries; and 44 percent in Uganda, where money transfer operators and banks account for about half and 5 percent of domestic remittances were sent using mobile phones (this share is likely to have increased since the survey). By contrast, the share of households using informal channels for remittances from outside Africa was less than 21 percent in fi ve of the six countries surveyed (the exception was 52 percent in Burkina Faso).
Formal channels for remittances from outside Africa and within the region are heavily dominated by money transfer companies, particularly Western Union). For the Sub-Saharan African countries in fi gure 2.14, only about 2 percent of households receiving remittances from outside Africa use banks; the share is slightly higher in Uganda (12.5 percent), Kenya (16.2 percent) and Nigeria (22.3 percent). The role of other intermediaries—including post offi ces, microfi nance institutions, savings and credit cooperatives, and new technologies such as Internet transfers and mobile money transfers—is even more limited for remittances from outside Africa.
MOBILE MONEY SERVICES
Mobile money transfer services have transformed the landscape for do-mestic remittances in several African countries. Box 2.2 describes the trans-formation of the domestic remittance landscape in Kenya since the introduction of the M-Pesa mobile money service in early 2007. Mobile money transfer services are now increasingly being used for savings. More than a fi fth (21 percent) of respondents in the 2008 Financial Sector

Migrant Remittances • 81
Box 2.2 Moving Money through M-Pesa in Kenya
Vodafone, through its subsidiary Safaricom, launched a mobile banking service called M-Pesa
in 2007, which rapidly expanded to reach more than 12 million clients in Kenya (Joseph 2010).a
M-Pesa operates an electronic fl oat, or e-fl oat. Agents of M-Pesa buy a certain amount of e-fl oat
when they join the network. For example, the minimum per branch may be K Sh 50,000 (about
$620). M-Pesa agents are given a “till” for each branch—a special phone on which to transact busi-
ness and manage the fl oat. The M-Pesa agent centrally monitors the fl oat in its branches to deter-
mine whether people are buying e-money or withdrawing cash, and transfers the e-fl oat between
branches as necessary. The e-money purchased by a registered user can be sent to other registered
and nonregistered users, and withdrawn at any M-Pesa agent. The M-Pesa e-money can also be
used to pay electricity bill (under an agreement with the Kenya Power Company) and school fees;
it is being expanded to other types of bill payments. M-Pesa has now partnered with Equity Bank
to offer M-Kesho savings accounts, by which the M-Pesa account is linked to a bank account.24
The availability of the M-Pesa mobile money service has wrought a profound change in the
types of domestic remittance channels used by Kenyans (Pulver, Jack, and Suri 2009). Surveys by
Kenya’s Financial Sector Deepening found that the most commonly used means of sending money
within Kenya in 2006 were by hand (58 percent), bus (27 percent), post offi ce and money order (24
percent), direct deposit (11 percent), and money transfer service (9 percent). By 2008 M-Pesa had
come to dominate domestic remittances, with 47 percent of Kenyans using M-Pesa. As a result,
the share of remittances sent by hand decreased to 32 percent and the share of remittances sent
by transport companies fell to just 9 percent.
The use of mobile phones to transfer money has also enabled recipients to send smaller
amounts of money more often (and collectively more), because of the greater accessibility of
M-Pesa agents. Average transaction size decreased by 30 percent between March 2007 and March
2009, from K Sh 3,300 (about $41 at prevailing exchange rates) to K Sh 2,300 (about $29) (Pulver,
Jack, and Suri 2009) (box fi gure 2.2.1).
Box fi gure 2.2.1 Average Size of Transactions through M-Pesa, March 2007–March 2009
Source: Authors’ calculations based on Pulver, Jack, and Suri 2009.
Source: www.safaricom.co.ke; Mas and Radcliffe 2010; meetings with Safaricom offi cials. a. In the Philippines, G-Cash and S MART provide deposit, credit, and money transfers through mobile phones (World Bank 2006).
Keny
an s
hilli
ngs
US $
2,000
2,500
3,000
3,500
Mar-07
May-07
Jul-07Sep-07
Nov-07
Mar-08
May-08
Jul-08Sep-08
Nov-08
Jan-08Mar-0
9Jan-09
20
25
30
35
40
45
50

82 • Leveraging Migration for Africa: Remittances, Skills, and Investments
Deepening survey reported using electronic money (e-money) on their mobile phones for storing or saving money for everyday use and emer-gencies. Safaricom, in partnership with Kenya’s Equity Bank, recently launched a mobile savings account called M-Kesho, which provides access to interest-bearing savings accounts and access to Equity Bank’s network of ATMs. Other fi rms, such as the mobile operator Zain, are now competing with M-Pesa in Kenya to provide similar services. In neighbor-ing Uganda, Zain and MTN’s mobile money services have more than 1 million users (Business Daily Africa 2010).
Similar mobile money transfer and mobile banking services have expanded to other countries and subregions in Africa. Zain, recently acquired by Bharti Airtel, with 42 million subscribers in 15 African countries, offers Zain Zap, a mobile remittance service that offers money transfers and services such as payments for bills and groceries (Economist 2010).25 Orange Money offers mobile money transfers in a number of West African countries, including Côte d’Ivoire, Mali, Senegal, and Mada-gascar.26 In Benin, mobile operator MTN and Ecobank have launched a service that allows users to open accounts and to transfer, deposit, and withdraw money. In Sierra Leone, Splash introduced a mobile money ser-vice in September 2009, gaining more than 150,000 clients within a year (Awareness Times 2010). In South Africa, Wizzit offers person-to-person mobile money transfer services and works in partnership with ABSA Bank and the South African post offi ce to provide banking facilities, including access to point-of-sale devices and debit cards that can be used at ATMs.27
Mobile money technologies are being used largely for domestic money transfers in Africa and other regions; their use for cross-border remittances is still nascent (see CGAP and Dalberg 2010 for some exam-ples). The limited use partly refl ects concerns related to money launder-ing using cross-border transfers, as discussed earlier. It also refl ects the lack of maturity of branchless banking infrastructure on the receiving end and lack of customer awareness and trust in new services (Bold 2010).
Some telecommunications fi rms that operate across countries are start-ing to offer cross-border remittances in certain subregions. In East Africa, for example, Zain Zap (in partnership with CitiBank and Standard Char-tered Bank) allows its customers to send money to any bank in Kenya, Tanzania, and Uganda and to receive money from any bank account in the world. However, in West Africa, even though members of the West African Economic and Monetary Union have a common central bank and similar monetary regulations, cross-border mobile money transfer services do not appear to be functional. Mobile money transfers being piloted in partnership with international money transfer companies (for exam-ple, from the United Kingdom and the United States to M-Pesa mobile

Migrant Remittances • 83
money accounts in Kenya and in various other remittance corridors) are almost identical to cash-based remittances for the remittance sender and have a similar cost structure, with the difference that the remittance is deposited into the mobile money account of the recipient.
Even within this limited scope, the deposit of cross-border remittances directly into the mobile money account of the recipient has potentially signifi cant advantages over traditional cash-based money transfer serv-ices. It increases the reach of remittance services, as the recipient can withdraw the remittance at domestic money transfer outlets. In Kenya, for example, the international remittance service provider can piggyback on the vast network of M-Pesa agents, greatly reducing, if not eliminating, the need to build a costly network for distribution of international remit-tances or to form alliances with banks or post offi ces. For the recipient, receiving remittances directly into a mobile money account obviates the need to travel to the nearest town or outlet of the money transfer operator to receive cash.
Money transfers through mobile phones raise the issue of whether telecommunications or banking regulators should regulate these serv-ices. Kenya’s M-Pesa was allowed to operate with very little regulatory oversight or reporting requirements in its initial years. Regulators appear to be learning how to deal with this innovation. There is considerable variation in the experience of countries with mobile money services in Africa and other regions.28 Regulatory “forbearance” may allow new tech nologies to scale up rapidly, but it can expose the fi nancial system to systemic risk if the volume of transactions fl owing through the mobile money transfer system is large and the deposits are stored in one or two fi nancial institutions. The issue of how to regulate and create a level playing fi eld between mobile network operators and banks is becoming more important as banks enter the mobile money space. Another issue is how to replicate the Kenyan example in other African countries where telecommunications infrastructure is less developed and operators are state monopolies.
Maimbo, Saranga, and Strychacz (2010) identify some issues relevant to the introduction of cross-border mobile money transfers within the Southern African Development Community. They include developing a robust and effi cient regulatory framework that provides clear guidelines, expands permitted points of service (such as retail agents), reduces report-ing requirements for small-value cross-border transactions, eliminates requirements for proof of legal residence to set up a bank account, and enables small-value money transfers. The authors caution that develop-ing such regulatory frameworks can be diffi cult and time consuming. They therefore suggest launching pilot programs and learning from the

84 • Leveraging Migration for Africa: Remittances, Skills, and Investments
experiences of countries such as Brazil and the Philippines to come up with innovative regulatory solutions.29 Some pilot projects are attempt-ing to bridge the divide between community-based pooled remittances and the use of Internet and mobile technologies. Some service providers are attempting to use Internet-based technologies to transfer remittances from France to villages in Mali (Ponsot 2011).
ROLE OF POST OFFICES
Post offi ces typically have very strong networks in both urban and rural areas, with signifi cant potential to reach poor populations. They also have the right business model for serving the poor. Clotteau and Anson (2011) of the Universal Postal Union estimate that more than 80 percent of post offi ces in Sub-Saharan Africa are located outside the three largest cities, in areas where more than 80 percent of people in the country live. This distribution of outlets stands in sharp contrast to that of mainstream commercial banks, which are concentrated in the largest cities in Africa. Postal networks thus have a unique opportunity to become key players in both international and domestic remittances and to bring the unbanked into the formal fi nancial system (box 2.3).
Post offi ces are also integrating new technologies into their opera-tions. Some mobile money transfer operators, such as M-Pesa in Kenya and Wizzit in South Africa, are actively working with post offi ces and postal savings banks as their agents.30
TOWARD LESS COSTLY AND MORE TRANSPARENT REMITTANCES: POLICY CHANGES
This section outlines policies to improve the quality of data on remit-tances, reduce remittance costs, and improve transparency in remittance markets; encourage innovative money transfer technologies; use remit-tances to improve access to capital markets; and cope with large remit-tance infl ows. Several policy initiatives have been undertaken on these issues in recent years (box 2.4).
IMPROVING REMITTANCE DATA
A majority of central banks in remittance-receiving countries in Sub-Saharan Africa cite better statistics on migration and remittances and improved delivery to remote areas as the top issues in need of attention to promote more effi cient and secure transfer and delivery of migrant

Migrant Remittances • 85
remittances (Irving, Mohapatra, and Ratha 2010 (fi gure 2.15). Improv-ing data collection on remittances is also receiving attention from the international community: the G-8 Global Remittances Working Group lists improving remittance data collection as one of its four thematic areas (World Bank 2009).
African central banks and statistical agencies can improve data collec-tion by expanding the reporting of remittances from banks to nonbank providers of remittance services (such as money transfer companies, post offi ces, savings cooperatives, and microfi nance institutions); using sur-veys of migrants and recipient households to estimate remittance fl ows
Box 2.3 Post Offi ces and Remittances in Africa: A Pilot Project in West Africa
A pilot project for cross-border remittances by post offi ces called Mandat Express International
has been implemented in six West African countries by the Universal Postal Union in collaboration
with IFAD. The project provides remittance services from France to West Africa and within West
Africa. An analysis of transaction data for the project in Burkina Faso shows that almost half of
international remittances are received outside the two largest cities, in semi-urban or rural areas;
only 8–12 percent is sent from rural areas. This pattern suggests that post offi ces with large net-
works in rural areas can play a potentially valuable role in expanding access to money transfers,
basic fi nancial services, and trade-related payments. In Mali, for example, the volume of transac-
tions is higher for both small and large transaction than for intermediate transactions, possibly
indicating that both migrants and small traders are benefi ting from the post offi ces’ international
money order system.
This project addresses the issues that post offi ces in West Africa face in providing remittance
services. Their staffs lack adequate training, and their information technology systems are out-
dated. In 2008, for example, only 17 percent of post offi ces in Sub-Saharan Africa were equipped
with computers and had Internet access. Only 2 of 43 African countries that responded to a
questionnaire had developed a cost accounting system. Furthermore, most postal operators are
public corporations or government departments. As a result, post offi ce workers are not always
customer oriented, which has a negative impact on the quality of service. Perhaps most important,
exclusivity arrangements between post offi ces and international money transfer companies pre-
vent effective competition in the remittances market. These agreements can include offi ces that
are not providing any remittance service and offi ces in which the partner of the post will never
deploy the service.
For very small remittances, the application of anti–money laundering regulations is not pro-
portional to the risk raised by such transactions and hinders the reduction of remittance fees. Most
post offi ces are not connected to national clearing and settlement systems, considerably limiting
their effi ciency. Furthermore, a number of posts are prevented from collecting savings, a natural
complement to remittance services. There is also a problem coordinating regulation. In some
instances, the post is regulated by the postal regulator for international money orders and by the
fi nancial regulator for account-based services. Better coordination among the various regulating
entities should be promoted to ensure better consumer protection.
Source: Clotteau and Anson 2011.

86 • Leveraging Migration for Africa: Remittances, Skills, and Investments
through formal and informal channels; and asking labor ministries and embassies in destination countries to provide estimates of remittance fl ows and the associated costs paid by migrants (see IMF 2009 for addi-tional recommendations).
REDUCING COSTS AND INCREASING TRANSPARENCY IN THE PROVISION OF REMITTANCE SERVICES
Policies designed to increase fi nancial sector development—by, for exam-ple, encouraging greater competition among banks and promoting alter-native providers, such as microfi nance institutions, credit cooperatives,
Box 2.4 Policy Initiatives on Remittances in Africa
The World Bank, in partnership with the European Commission, the African Development Bank, and the
International Organization for Migration, is helping the African Union Commission create the African
Remittances Institute (ARI). Funded by €1.7 million contributed by the European Commission and
administered by the World Bank under the guidance of the African Union Commission and the Euro-
pean Commission, ARI aims to strengthen the capacities of all actors (African governments, banks,
remittance senders and recipients, and so on) to better use remittances as development tools for poverty
reduction and to achieve less expensive, faster, and more secure remittance fl ows to Africa. Activities
will include technical assistance, training, education, and dissemination of data. The preparatory phase
project (both technical and consultative) started in 2010.
In June 2010, the World Bank launched the Future of African Remittances (FAR) program to reduce
the cost of remittances, increase the availability of fi nancial products linked to remittances, and increase
the fl ow of remittances through formal channels. The program aims to promote the development of
nontraditional remittance channels through microfi nance institutions and mobile and nonbank corre-
spondent agency networks (branchless banking) to reach rural areas. As the program matures, its focus
will shift toward facilitating best practices in supervising and regulating remittance markets, developing
and deploying fi nancial products for households receiving remittances, and designing outreach strate-
gies for engaging migrant communities. Small-scale surveys estimating the volume of remittances, the
uses of remittance funds, channels used, transfer costs, and profi les of remittance-receiving households
have been completed in Ethiopia, Kenya, and Uganda.
A multilateral trust fund was established in October 2009 to improve African migrant remittances
by the African Development Bank group and the French government, together with International Fund
for Agricultural Development (IFAD). The fund, which will be managed by the African Development
Bank, has an initial capital of more than €6 million. It aims to provide fi nance to enhance knowledge
on African migrant remittances through thematic and sectoral studies; improve regulatory frameworks
and transfer conditions, with a view to reducing transfer costs; provide fi nancial products that meet the
needs of migrants and their families; and encourage the African diaspora to invest in individual produc-
tive initiatives and in the development of their countries of origin.
Source: Authors, based on information from the African Development Bank, the International Fund for Agricultural Development, and the World Bank Africa Region.
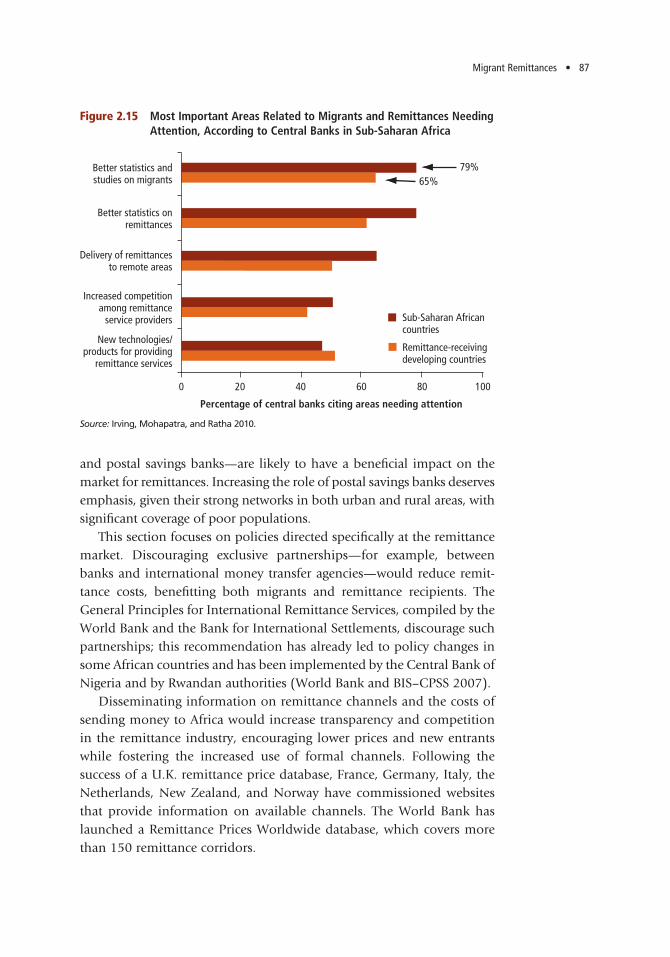
Migrant Remittances • 87
and postal savings banks—are likely to have a benefi cial impact on the market for remittances. Increasing the role of postal savings banks deserves emphasis, given their strong networks in both urban and rural areas, with signifi cant coverage of poor populations.
This section focuses on policies directed specifi cally at the remittance market. Discouraging exclusive partnerships—for example, between banks and international money transfer agencies—would reduce remit-tance costs, benefi tting both migrants and remittance recipients. The General Principles for International Remittance Services, compiled by the World Bank and the Bank for International Settlements, discourage such partnerships; this recommendation has already led to policy changes in some African countries and has been implemented by the Central Bank of Nigeria and by Rwandan authorities (World Bank and BIS–CPSS 2007).
Disseminating information on remittance channels and the costs of sending money to Africa would increase transparency and competition in the remittance industry, encouraging lower prices and new entrants while fostering the increased use of formal channels. Following the success of a U.K. remittance price database, France, Germany, Italy, the Netherlands, New Zealand, and Norway have commissioned websites that provide information on available channels. The World Bank has launched a Remittance Prices Worldwide database, which covers more than 150 remittance corridors.
Figure 2.15 Most Important Areas Related to Migrants and Remittances Needing Attention, According to Central Banks in Sub-Saharan Africa
Source: Irving, Mohapatra, and Ratha 2010.
79%
Sub-Saharan Africancountries
Remittance-receivingdeveloping countries
65%
0 20 40 80 10060
Percentage of central banks citing areas needing attention
Better statistics andstudies on migrants
Better statistics onremittances
Delivery of remittancesto remote areas
Increased competitionamong remittance
service providers
New technologies/products for providing
remittance services

88 • Leveraging Migration for Africa: Remittances, Skills, and Investments
The World Bank is helping several countries control the quality of national price databases and integrate their information into the global database. The information on remittance channels and costs should also be provided in pamphlet form to emigrants at airports before departure, during predeparture orientation/training, and at embassies and asso-ciations in destination countries to reach migrants without access to the Internet. It could also be made available through central banks, labor ministries, foreign employment bureaus, and recruitment associations in origin countries.
Regulations in destination countries could encourage greater trans-parency in remittance markets. The United States has introduced reg-ulations requiring remittance service providers to disclose prices and exchange rate commissions and establish error resolution mechanisms for consumers. A similar initiative to improve transparency, competi-tion, and consumer protection in remittance markets is under way in Europe (box 2.5).
Box 2.5 Increasing Transparency and Competition in Remittance Markets: Wall Street Reforms and the European Union’s Payment Services Directive
The Wall Street Reform and Consumer Protection Act, signed into law by President Obama on July 21,
2010, aims to increase transparency in the pricing of remittance services. Providers of remittance services
in the United States will be required to disclose to remitters the equivalent amount that will be received
in local currency by the benefi ciary, the fees for the transaction, access to error-resolution mechanisms,
and contact details of the relevant regulatory authority. Remittance issues will be integrated into the
strategy for fi nancial literacy for low-income communities as part of the U.S. government’s Strategy
for Assuring Financial Empowerment (SAFE). The Federal Reserve and the Treasury will work to extend
automatic clearinghouse systems and other payment systems for remittances to foreign countries, with
a focus on countries that receive signifi cant remittance transfers from the United States. Studies will be
conducted on the feasibility of using remittance history to improve credit scores and the legal and busi-
ness model barriers to such credit scoring.
Concurrently, the European Payment Services Directive implemented in the European Union (EU)
will increase transparency and improve consumer protection for remittance services. A new type of
institution, called a payment institution, has been created that is subject to less stringent licensing, capi-
tal, and reporting requirements than conventional banks and fi nancial institutions (previously, money
transfer operators had to register as fi nancial institutions in some EU countries). In the United Kingdom,
remittance transactions will come under an independent fi nancial ombudsman service for the fi rst time.
Although the Payment Services Directive applies only for transactions from one EU country to another,
some remittance-sending countries, such as Italy, have extended these rules to transfers to countries
outside the EU.
Source: www.appleseednetwork.org; Isaacs 2011.

Migrant Remittances • 89
FOSTERING THE USE OF INNOVATIVE MOBILE MONEY TRANSFER TECHNOLOGIES
M-Pesa in Kenya is a striking example of the ability of African countries to “leapfrog” even developed countries in the use of innovative mobile money services. Measures that would encourage the expansion of mobile phones to cross-border remittances include the following:
• harmonizing banking and telecommunications regulations to enable mainstream African banks to participate in mobile money transfers and telecommunications fi rms to offer microdeposit and savings accounts
• simplifying AML-CFT regulations for low-value transfers• ensuring that mobile distribution networks are open to multiple inter-
national remittance service providers, instead of becoming exclusive partnerships between an international money transfer operator and a country-based mobile money services.
The price structure of mobile money services should also be examined; the price of mobile money services appear to be similar to that charged for sending cash remittances in the U.K.–Kenya and U.S.–Philippines corridors, despite the fact that reliance on mobile phone transfers reduces the need to build costly distribution networks.
INCREASING THE ROLE OF POST OFFICES AND MICROFINANCE INSTITUTIONS IN REMITTANCES
Increasing the role of African post offi ces in remittance transmissions can leverage their strong networks in both urban and rural areas and better reach poor populations. African post offi ces can partner with destination-country post offi ces, banks, and money transfer companies to extend existing domestic money order facilities to international remittances. Some measures suggested by Clotteau and Anson (2011) include the following:
• Providing universal service. Many African governments are in the pro -cess of defi ning their universal service. Some, like Benin, have included money orders and basic savings accounts in the defi nition. The inclusion of fi nancial services in the defi nition of universal ser-vice should be encouraged to foster fi nancial inclusion by leveraging postal networks.
• Developing infrastructure. Connecting post offi ces to high-speed Inter-net and creating integrated management information systems are nec-essary to ensure adequate quality of service. Burkina Faso, Botswana,

90 • Leveraging Migration for Africa: Remittances, Skills, and Investments
Gabon, Morocco, South Africa, Togo, and Tunisia have already com-pleted or are in the process of completing these steps. At the opposite end of the spectrum are countries such as Chad and the Democratic Republic of Congo, where funds and technical assistance are needed to strengthen infrastructure.
• Developing new products. Basic savings accounts into which remittances can be paid, small savings deposited, and payments processed should be offered in connection with remittances. Countries such as Côte d’Ivoire, Lesotho, and Mali, where postal banking services have been separated from the rest of post offi ce services, might explore other models, such as the agent banking model, in which the post offi ce acts as an agent of a bank, which could also be good alternatives for coun-tries in which the regulatory framework does not allow post offi ces to develop fi nancial services.
• Creating new models. New technologies are changing the way fi nancial services are being delivered. In Kenya, for example, where the success of M-Pesa has been well documented, the post offi ce is acting as a “super-agent,” providing e-fl oat (working capital) for smaller agents. In Tunisia the post offi ce has partnered with the national telecom-munications company to develop mobile payment services. Each post offi ce has to take advantage of its own key strengths (the size and reach of its physical network, its know-how in cash logistics, the number of postal banking clients) to make better use of new technologies.
A clear policy recommendation is to eliminate exclusive partnerships and encourage African post offi ces to partner with more money transfer companies (and even banks), in order to put downward pressure on costs. The revenue losses in the short term will most likely be offset by larger volumes, benefi ting postal networks, migrants, and remittance recipients. Rural banks, savings cooperatives, and microfi nance institutions in Africa can play a similar role in improving access to formal remittance (and fi nancial) services. Measures to encourage the participation of savings and credit cooperatives, rural banks, and microfi nance institutions in providing remittance services will help improve fi nancial access. Money transfers can act as an entry point for providing remittance senders and unbanked recipients in rural areas with other fi nancial products and serv-ices, such as deposits, savings, and credit facilities. Policies should also promote multiple partnerships for sending and delivering remittances among rural banks and microfi nance institutions.

Migrant Remittances • 91
DEALING WITH THE EXCHANGE RATE EFFECTS OF LARGE REMITTANCE INFLOWS
Policy makers in Sub-Saharan Africa should be particularly alert to Dutch disease in countries in which remittances infl ows are large compared with the size of the economy, supply constraints are a signifi cant hindrance to the expansion of the nontradable sector, and a signifi cant portion of remittances is spent on domestic goods, especially nontradables (Gupta, Pattillo, and Wagh 2009). Countries should adjust to large remittance infl ows that are likely to be permanent by maintaining market-based exchange rate policies; supporting the production of tradables that might be harmed by overvaluation of the exchange rate (through infrastruc-ture investments, for example); and reducing labor and product market rigidities that impair competitiveness. Large infl ows that are likely to be temporary can be sterilized, although the cost of sterilization can be high. Meanwhile, the resulting rise in domestic interest rates can attract more capital infl ows, placing further pressure on the exchange rate (Fajnzylber and Lopez 2007). It can be diffi cult to distinguish between temporary and permanent levels of remittance infl ows, although as remittances tend to be relatively stable, the risk of Dutch disease effects is lower than it is for natural resource windfalls and other cyclical fl ows.

92 • Leveraging Migration for Africa: Remittances, Skills, and Investments
ANNEX 2ATable 2A.1 Remittance Flows to African Countries, 2006–10
($ millions, except where otherwise indicated)
Growth (percent)
Share of GDP
(percent)
Region/country 2006 2007 2008 2009 2010e 2008–09 2009–10e 2009
Sub-Saharan Africa 12,668 18,584 21,359 20,575 21,490 –3.7 4.4 2.6
Nigeria 5,435 9,221 9,980 9,585 9,975 –4.0 4.1 5.5
Sudan 1,179 1,769 3,100 2,993 3,178 –3.5 6.2 5.5
Kenya 1,128 1,588 1,692 1,686 1,758 –0.3 4.3 5.7
Senegal 925 1,192 1,288 1,191 1,164 –7.5 –2.3 9.3
South Africa 734 834 823 902 1,008 9.7 11.8 0.3
Uganda 411 452 724 694 773 –4.1 11.3 4.3
Lesotho 361 451 439 450 525 2.6 16.7 28.5
Mali 212 344 431 405 385 –6.1 –4.8 4.5
Ethiopia 172 358 387 353 387 –8.8 9.7 1.2
Togo 232 284 337 307 302 –9.0 –1.7 10.7
North Africa 13,945 18,267 19,815 17,489 18,163 –11.7 3.9 3.3
Egypt, Arab Rep. 5,330 7,656 8,694 7,150 7,681 –17.8 7.4 3.8
Morocco 5,451 6,730 6,895 6,271 6,447 –9.0 2.8 6.9
Algeria 1,610 2,120 2,202 2,059 2,031 –6.5 –1.3 1.5
Tunisia 1,510 1,716 1,977 1,966 1,960 –0.5 –0.3 5.0
Djibouti 28 29 30 28 28 –6.8 –0.3 2.7
Libya 16 16 16 14 16 –10.1 9.3 0.0
All Africa 26,613 36,851 41,174 38,063 39,652 –7.6 4.2 2.6
All developing countries 226,707 278,456 324,832 307,088 325,466 –5.5 6.0 1.9
Source: World Bank migration and remittances unit, based on IMF balance of payment statistics.Note: e = estimated.

Migrant Remittances • 93
Table 2A.2 Formal and Informal Remittance Channels in Selected African Countries, 2009 (percent of recipients)
Country/channelRemittances from
outside AfricaRemittances from
within AfricaDomestic
remittances
Burkina Faso
Money transfer operator 43.2 10.5 2.0
Brought home by migrant during visit 34.1 15.2 49.5
Friend or relative 18.2 64.7 37.4
Bank 2.3 0.7 0.4
Postal money order 0 3.2 1.4
Courier, bus, transport, or travel agency 0 3.0 5.8
Informal individual agent 0 2.5 1.9
ATM card or Internet money transfer 0 0 0.2
Other 2.3 0.2 1.3
Total 100.0 100.0 100.0
Ghana (for 2005–06)
Money transfer operator 67.8 10.9 0.6
Friend or relative 16.1 52.2 45.1
Fast money transfer 7.8 0 0
Brought home by migrant during visit 4.4 32.6 49.0
Bank 2.2 0 0.6
Other 1.7 4.3 4.7
Total 100.0 100.0 100.0
Kenya
Money transfer operator 64.0 38.6 1.5
Bank 17.2 11.4 6.3
Foreign exchange bureau, credit union 6.3 1.5 0.6
Friend or relative 3.8 9.1 6.5
Brought home by migrant during visit 2.0 7.6 20.0
Postal money order 1.4 1.5 1.1
Informal individual agent 1.4 0 0
Courier, bus, other transport, or travel agency 0.5 3.8 1.5
Mobile phone 2.9 23.5 61.5
ATM card or Internet money transfer 0.5 0 0
Other 0 0 0.8
Total 100.0 100.0 100.0

94 • Leveraging Migration for Africa: Remittances, Skills, and Investments
Table 2A.2 Formal and Informal Remittance Channels in Selected African Countries, 2009 (continued) (percent of recipients)
Country/channelRemittances from
outside AfricaRemittances from
within AfricaDomestic
remittances
Nigeria
Money transfer operator 57.1 35.2 6.3
Friend or relative 12.8 15.4 21.2
Direct transfer to bank account 11.8 12.1 35.0
Bank as paying agent for money transfer operator 10.5 17.6 2.6
Brought home by migrant during visit 5.4 13.2 27.7
Informal individual agent 2.5 4.4 4.1
Postal money order 0 1.1 0
Foreign exchange bureau 0 1.1 0.1
Credit union 0 0 0.2
Travel agency 0 0 0.4
Courier, bus, or other transport 0 0 0.5
Mobile phone or telecom service provider 0 0 0.4
Prepaid card or ATM card 0 0 0.2
Internet money transfer 0 0 0.1
Other 0 0 1.2
Total 100.0 100.0 100.0
Senegal
Money transfer operator 81.5 30.8 4.9
Friend or relative 10.1 41.1 37.3
Postal money order 2.5 6.3 3.4
Informal individual agent 1.9 4.3 3.4
Bank as paying agent for money transfer operator 1.5 0 0.1
Credit union 0.7 0 0
Foreign exchange bureau 0.4 0.4 0
Direct transfer to bank account 0.3 0 0
Brought home by migrant during visit 0.5 14.2 36.7
Courier, bus, or other transport 0 0.6 11.8
Mobile phone or telecom service provider 0 0 0.6
Travel agency 0 0 0
Prepaid card or ATM card 0 0 0
Internet money transfer 0 0 0
Other 0.4 2.2 1.9
Total 100.0 100.0 100.0

Migrant Remittances • 95
Table 2A.2 Formal and Informal Remittance Channels in Selected African Countries, 2009 (continued) (percent of recipients)
Country/channelRemittances from
outside AfricaRemittances from
within AfricaDomestic
remittances
Uganda
Money transfer operator 55.4 36.3 4.2
Foreign exchange bureau, credit union 13.4 1.3 0.9
Bank 12.5 15.0 10.8
Friend or relative 8.9 21.3 27.4
Brought back by migrant during visit 4.5 20.0 47.6
Postal money order 2.7 0 0.2
Mobile phone 0.9 2.5 5.2
ATM card or Internet money transfer 0.9 0 0
Courier, bus, other transport, or travel agency 0 2.5 3.1
Informal individual agent 0 0 0
Other 0 1.3 0
Total 100.0 100.0 100.0
South Africa (outward remittances)
Remittances sent to other countries
in AfricaDomestic
remittances
Friend or relative 58.0 18.8
Money transfer operator 4.6 15.8
Courier, bus, or other transport 18.3 1.2
Direct transfer to bank account 5.3 40.6
Foreign exchange bureau 0 0.6
Mobile phone or telecom service provider 0 0.6
Postal money order 6.1 6.7
Travel agency 0 0.6
Credit union 0 0.6
Brought back by migrant during visit 2.3 5.5
Prepaid card or ATM card 2.3 2.4
Internet money transfer 0 1.8
Other nonfi nancial institution that provides remittance services 0 1.2
Other 1.5 3.6
Total 100.0 100.0
Source: Authors, based on results household surveys conducted in Burkina Faso, Kenya, Nigeria, Senegal, South Africa, and Uganda in 2009 as part of the Africa Migration Project and Ghana Living Standards Survey 2005–06.Note: For all countries except South Africa, fi gures show remittance channels for receipt of remittances by households. For South Africa, the fi rst column shows channels for remittances sent by immigrants from other African countries living in South Africa. Money transfer operators include Western Union, Moneygram, and others. Data for Ghana are from 2005 to 2006.

96 • Leveraging Migration for Africa: Remittances, Skills, and Investments
NOTES
1. The Africa Migration Project household surveys were conducted in the second half of 2009 in Burkina Faso, Kenya, Nigeria, Senegal, South Africa, and Uganda. This chapter also draws on an earlier survey conducted in Ghana in 2007–08.
2. There are some notable exceptions in Sub-Saharan Africa. For example, Cape Verde, Ethiopia, Kenya, and Nigeria collect and publish monthly data on remittances. Several North African countries, such as Egypt and Morocco, publish quarterly data.
3. Remittances do not appear to have been affected by economic cycles in migrants’ destination countries in the past. Roache and Gradzka (2007) fi nd that remittance fl ows to Latin America were relatively insensitive to business cycle fl uc-tuations in the United States over the 1990–2007 period. Given the magnitude of the fi nancial crisis that began in 2008, there is a strong possibility that it has affected the incomes of migrants and their ability to send money home.
4. Sayan (2006) fi nds that remittances are strongly countercyclical in poor countries, such as Bangladesh and India, but procyclical in middle-income countries, such as Jordan and Morocco. Lueth and Ruiz-Arranz (2008) fi nd that remittances to Sri Lanka are positively correlated with oil prices—perhaps refl ect-ing the economic situation of Sri Lankan migrants in destination countries in the Gulf—but tend to decline when the Sri Lankan currency weakens.
5. The stability of remittances to the Philippines was an important factor in its ability to issue a $750 million bond despite the global fi nancial crisis. Bangladesh was rated for the fi rst time in April 2010, receiving a BB–rating from Standard & Poor’s Investor Service and a Ba3 from Moody’s Investor Service, similar to the ratings of many emerging markets. The rating agencies cited the high share of remittance fl ows in GDP and the high growth rate as important factors in their rating decisions.
6. An investment-grade rating makes these transactions attractive to a wider range of “buy-and-hold” investors, such as pension funds and institutional inves-tors, which have institutional limitations on buying subinvestment-grade assets. As a result, the issuer can access a wider pool of international investors, allowing it to reduce the cost of capital and lengthen maturities. Moreover, by establishing a credit history for the borrower, these deals enhance the ability to access capital markets and reduce the costs of doing so in the future.
7. The United Nations Development Programme (UNDP), in partnership with Standard and Poors, helped 11 African countries obtain sovereign ratings. The United States, in partnership with the Inter-American Development Bank, launched the BRIDGE (Building Remittance Investments for Development, Growth and Entrepreneurship) initiative, which aims to securitize remittances for infrastructure projects in developing countries, starting with pilots in El Salvador and Honduras.
8. An empirical study of 109 countries for 1990–2003 shows that a well-developed fi nancial sector can more effectively intermediate remittances with investment and that the impact of remittance infl ows on exchange rate apprecia-tion is smaller when the level of fi nancial development is higher (Acosta, Baerg,

Migrant Remittances • 97
and Mandelman 2009). Increased receipt of remittances is also associated with higher market capitalization, a key indicator of fi nancial market development (Billmeier and Massa 2009). A higher sovereign rating as a result of remittances can translate into greater access of subsovereign entities to international capital markets, thereby increasing the level of investment in the economy.
9. Latin American countries receiving remittances have experienced some exchange rate appreciation (Amuedo-Dorantes and Pozo 2004; Fajnzylber and Lopez 2007), but Fajnzylber and Lopez (2007) fi nd little or no impact of remit-tance fl ows on the exchange rate outside Latin America.
10. Another factor accounting for the lack of signifi cance may be omitted variables, such as policies and institutions (Catrinescu and others 2009), the level of fi nancial development (Giuliano and Ruiz-Arranz 2009), and other indirect channels through which remittances can infl uence economic growth (Rao and Hassan 2009).
11. Acosta, Fajnzylber, and López (2007) fi nd that remittances to Latin Amer-ica reduce inequality on average, but the extent of the reduction in inequality is relatively small, with variation across countries.
12. An asset index composed of land, quality of housing, access to electric-ity, and household amenities was used as a proxy for consumption expenditure (Filmer and Pritchett 2001).
13. The evidence on whether skilled or unskilled migrants send larger remit-tances is mixed. Some studies suggest that skilled migrants remit less, because they are more likely to settle down in their host countries and eventually bring their families (Niimi and Ozden 2006; Faini 2007). Other studies, based on microdata, fi nd a positive relationship between education and the amounts remitted (Bollard and others 2009; Clemens 2009). Some authors suggest that remittances sent by skilled migrants may exceed the cost of their training (Clemens 2009; Easterly and Nyarko 2009).
14. Self-reported uses of remittances should be treated with caution, for several reasons. Recipients may recall more recent expenses, especially on infre-quent “big ticket” purchases and underestimate the amounts spent on day-to-day expenses. They may also be reluctant to divulge details of remittances on purposes that the remitter may not have intended or approved of. The absence of detailed bookkeeping that separates remittances from other sources of income implies that few recipients are in a position to provide an accurate picture of the uses of remittances. Despite these caveats, it is still useful to examine the uses of remit-tances reported by recipient households.
15. Woodruff and Zenteno (2007) fi nd that migration is associated with higher investment and higher profi ts for a set of fi rms and looser capital con-straints for a subsample of fi rms in capital-intensive sectors.
16. Fajnzylber and Lopez (2007) fi nd that in Guatemala and Nicaragua, children 1–5 in remittance-receiving households were more likely to be of above average height and weight and to have had a doctor-assisted delivery. Studies of Mexico fi nd that remittances were associated with lower infant mortality rates (Hildebrandt and McKenzie 2005; Lopez-Cordova 2005) and higher healthcare expenditures (Amuedo-Dorantes, Pozo, and Sainz 2007; Valero-Gill 2009). Kanaiaupuni and Donato (1999) fi nd that infant mortality rates initially rose in

98 • Leveraging Migration for Africa: Remittances, Skills, and Investments
Mexican villages with very high rates of migration to the United States but that remittances eventually reduced infant mortality rates.
17. Mohapatra, Joseph, and Ratha (2009) fi nd that remittance-receiving households in Ghana are likely to have better access to communication equip-ment and mobile phones than households that do not receive any remittances, even after controlling for the possibility of self-selection of remittance-receiving households.
18. The World Bank’s remittance price database provides average remittance costs through banks and nonbank intermediaries for more than 150 migration corridors.
19. Transfer costs tend to be lower when fi nancial systems are more developed and exchange rates less volatile (Freund and Spatafora 2008). Beck and Martinez Peria (2009) fi nd that remittance corridors with larger stocks of migrants, a larger number of remittance service providers, and greater banking competition have lower costs.
20. Access to “bank-like” institutions, such as microfi nance institutions and savings and credit cooperatives, is also limited outside of urban areas.
21. Surveys of remittance markets in France and the United Kingdom were conducted as part of the Remittance Markets in Africa report (Mohapatra and Ratha 2011), and qualitative information was collected for the United States. Conduct-ing a survey in the United States proved infeasible, because there is no national-level institutional focal point; each state has a different legal and regulatory framework, compliance requirements, and institutions governing remittances (Andreassen 2006).
22. Mainstream banks in France are starting to target African migrants for remittances and other fi nancial services, such as burial insurance and trans-national mortgages; they continue to play a limited role in remittances (Ponsot 2011). Several French banks have branches and subsidiaries in North Africa and West Africa. They are more established in North African countries, where they provide a range of services to current and former migrants, such as low-cost banking accounts for North African migrants, distribution of pension benefi ts of former migrants who have retired in their countries of origin, and even tran-snational mortgages for current migrants who wish to purchase property. French banks appear to provide a smaller range of services to migrants from North Africa; some banks cite inadequate property rights as their reason for not issuing trans-national loans.
23. The Southern African Migration Project conducted national-level rep-resentative surveys on remittance fl ows and usage at the household level for fi ve countries belonging to the Southern African Development Community: Botswana, Lesotho, Mozambique, Swaziland, and Zimbabwe, with a focus on intraregional transfers from South Africa and Botswana (Pendleton and others 2006). The use of informal channels is predominant in remittances sent from South Africa to neighboring countries. Among formal channels used, TEBA Bank provides bank transfers for migrant mining workers in South Africa, accounting for about 16 percent of transfers to Botswana and 8 percent to Swaziland.
24. http://mobile-fi nancial.com/node/8174/M-PESA-meets-microsavings-with-Equity-Bank-deal-in-Kenya.
Migrant Remittances • 99
25. The concept of mobile money transfers is being transferred from Africa to other developing regions. India’s Bharti Telecom, which recently acquired Zain, has received approval from India’s central bank to start mobile payments services in India. This “mobile wallet” will allow Bharti Airtel’s customers in India to exchange physical cash for virtual money, which they can use to pay for goods and services up to Rs. 5,000 (about $108) per transaction. It does not, however, allow cash withdrawals (Economic Times 2010).
26. http://allafrica.com/stories/201006071332.html.27. http://www.wizzit.co.za.28. In the Philippines, for example, regulators have imposed the same report-
ing requirements on bank and nonbank mobile money providers (Dolan 2009).29. Brazil has considerable experience with branchless banking, using retail
payment networks and point-of-sale devices deployed at agents such as grocery stores (Pickens, Porteous, and Rotman 2009). The Philippines has been at the forefront of mobile money transfer services (World Bank 2006).
30. http://www.postbank.co.ke/.
BIBLIOGRAPHYAbdih, Yasser, Ralph Chami, Jihad Dagher, and Peter Montiel. 2008. “Remit-
tances and Institutions: Are Remittances a Curse?” IMF Working Paper 08/29, International Monetary Fund, Washington, DC.
Abdih, Yasser, Michael Gapen, Amine Mati, and Ralph Chami. 2009. “Fiscal Sus-tainability in Remittance-Dependent Economies. IMF Working Paper 09/190, International Monetary Fund, Washington, DC.
Acosta, Pablo, Nicole Baerg, and Federico Mandelman. 2009. “Financial Devel-opment, Remittances, and Real Exchange Rate Appreciation.” Economic Review 94 (1), Federal Reserve Bank of Atlanta.
Acosta, Pablo A., Cesar Calderon, Humberto Lopez, and Pablo Fajnzylber. 2008. “What Is the Impact of International Remittances on Poverty and Inequality in Latin America?” World Development 36 (1): 89–114.
Acosta, Pablo, Pablo Fajnzylber, and Humberto López. 2007. “The Impact of Remittances on Poverty and Human Capital: Evidence from Latin American Household Surveys.” In International Migration, Economic Development and Policy, ed. Caglar Özden and Maurice Schiff, 59–98. New York: World Bank and Palgrave Macmillan.
Acosta, Pablo, Emmanuel Lartey, and Federico Mandelman. 2009. “Remittances and the Dutch Disease.” Journal of International Economics 79 (1): 102–16.
Adams, Richard H. 1998. “Remittances, Investment and Rural Asset Accumula-tion in Pakistan.” Economic Development and Cultural Change 47: 155–73.
———. 2006. “Remittances and Poverty in Ghana.” Policy Research Working Paper 3838, World Bank, Washington, DC.
Adams, Richard H., and Alfredo Cuecuecha. 2010. “Remittances, Household Expenditure and Investment in Guatemala.” World Development. http://class.povertylectures.com/AdamsCuecuechaRemittancesinGuatemala.pdf.
Adams, Richard H., Alfredo Cuecuecha, and John Page. 2008a. “The Impact of Remittances on Poverty and Inequality in Ghana.” Policy Research Working Paper 4732, World Bank, Washington, DC.
———. 2008b “Remittances, Consumption and Investment in Ghana.” Policy Research Working Paper 4515, World Bank, Washington, DC.

100 • Leveraging Migration for Africa: Remittances, Skills, and Investments
Adams, Richard H., and John Page. 2003. “International Migration, Remittances and Poverty in Developing Countries.” Policy Research Working Paper 3179, World Bank, Washington, DC.
———. 2005. “Do International Migration and Remittances Reduce Poverty in Developing Countries?” World Development 33 (10): 1645–69.
Afreximbank (African Export-Import Bank). 2005. Annual Report. http://www.afreximbank.com.
Aggarwal, Reena, Asli Demirgüç-Kunt, and Maria Soledad Martinez Peria. 2006. “Do Workers’ Remittances Promote Financial Development?” Policy Research Working Paper 3957, World Bank, Washington, DC.
Ajayi, M. A., M. A. Ijaiya, G. T. Ijaiya, R. A. Bello, M. A. Ijaiya, and S. L Adeyemi. 2009. “International Remittances and Well-Being in Sub-Saharan Africa.” Journal of Economics and International Finance 1 (3): 078–084.
Aker, Jenny C., and Isaac M. Mbiti. 2010. “Mobile Phones and Economic Devel-opment in Africa.” Journal of Economic Perspectives 24 (3): 207–32 .
Akinlo, Anthony E., and Tajudeen Egbetunde. 2010. “Financial Development and Economic Growth: The Experience of 10 Sub-Saharan African Countries Revisited.” Review of Finance and Banking 2 (1): 17–28.
Amuedo-Dorantes, Catalina, and Susan Pozo. 2004. “Workers’ Remittances and the Real Exchange Rate: A Paradox of Gifts.” World Development 32 (8): 1407–17.
———. 2010. “New Evidence on the Role of Remittances on Health Care Expen-ditures by Mexican Households.” Review of Economics of the Household DOI 10.1007/s11150-009-9080-7.
Amuedo-Dorantes, Catalina, Annie Georges, and Susan Pozo. 2010. “Migration, Remittances, and Children’s Schooling in Haiti.” In The Annals of the American Academy of Political and Social Science, issue: “Continental Divides: Interna-tional Migration in the Americas,” ed. Katharine M. Donato, Jonathan Hiskey, Jorge Durand, and Douglas S. Massey. Thousand Oaks, CA: Sage.
Amuedo-Dorantes, Catalina, Susan Pozo, and Tania Sainz. 2007. “Remittances and Healthcare Expenditure Patterns of Populations in Origin Communities: Evidence from Mexico.” Integration and Trade Journal 27: 159–84.
Andreassen, Ole. 2006. “Remittance Service Providers in the United States: How Remittance Firms Operate and How They Perceive Their Business Environ-ment.” Financial Sector Discussion Series, Payments Systems and Remit-tances, June. World Bank, Washington, DC.
Anyanwu, John C., and Andrew E. O. Erhijakpor. 2010. “Do International Remit-tances Affect Poverty in Africa?” African Development Review 22 (1): 51–91.
Ashraf, Nava, Diego Aycinena, Claudia Martinez, and Dean Yang. 2010. “Remit-tances and the Problem of Control: A Field Experiment among Migrants from El Salvador.” University of Michigan, Ann Arbor.
Avendaño, Rolando, Norbert Gaillard, and Sebastián Nieto-Parra. 2009. “Are Workers’ Remittances Relevant for Credit Rating Agencies?” OECD Develop-ment Centre Working Paper 282, Organisation for Economic Co-operation and Development, Paris.
Awareness Times (Sierra Leone). 2010. “In Sierra Leone, over 150,000 Clients Registered with Splash Mobile Money.” September 16. http://news.sl/drweb site/publish/article_200516307.shtml.
Azam, Jean-Paul, and Flore Gubert. 2005. “Those in Kayes. The Impact of Remit-tances on their Recipients in Africa.” Revue économique 56 (6): 1331–58.
———. 2006. “Migrants’ Remittances and the Household in Africa: A Review of Evidence.” Journal of African Economies 15 (AERC Supplement): 426–62.
Babatunde, Raphael O., and Enrica C. Martinetti. 2010. “Impact of Remittances on Food Security and Nutrition in Rural Nigeria.” Centre for International Cooperation and Development, University of Pavia, Italy.

Migrant Remittances • 101
Bankable Frontier Associates. 2009. The Mzansi Bank Account Initiative in South Africa. Report commissioned by FinMark Trust, Somerville, MA. http://www.fi nmark.org.za/documents/R_Mzansi_BFA.pdf.
Bansak, Cynthia, and Brian Chezum. 2009. “How Do Remittances Affect Human Capital Formation of School-Age Boys and Girls?” American Economic Review 99 (2): 145–48.
Barajas, Adolfo, Ralph Chami, Connel Fullenkamp, Michael Gapen, and Peter J. Montiel. 2009. “Do Workers’ Remittances Promote Economic Growth?” IMF Working Paper 09/153, International Monetary Fund, Washington, DC.
Barro, Robert. 1997. Determinants of Economic Growth: A Cross-Country Empirical Study. Cambridge, MA: MIT Press.
Beck, Thorsten, and Maria Soledad Martinez Peria. 2009. “What Explains the Cost of Remittances? An Examination across 119 Country Corridors.” Policy Research Working Paper 5072, World Bank, Washington, DC.
Billmeier, Andreas, and Isabella Massa. 2009. “What Drives Stock Market Development in Emerging Markets—Institutions, Remittances, or Natural Resources?” Emerging Markets Review 10 (2): 23–35.
Birdsall, Nancy, and Punam Chuhan. 1986. “Client Choice of Health Care Treat-ment in Rural Mali.” World Bank, Health, Nutrition and Population Depart-ment, Washington, DC.
Block, S., and P. Webb. 2001. “The Dynamics of Livelihood Diversifi cation in Post Famine Ethiopia.” Food Policy 26 (4): 333–50.
Bold, Chris. 2010. “Borderless Branchless Banking.” December 14, CGAP Tech-nology Blog, Consultative Group to Assist the Poor, Washington DC.
Bollard, Albert, David McKenzie, and Melanie Morten. 2010. “The Remitting Patterns of African Migrants in the OECD.” Journal of African Economies 19 (5): 605–34.
Bollard, Albert, David McKenzie, Melanie Morten, and Hillel Rapoport. 2009. “Remittances and the Brain Drain Revisited: The Microdata Show That More Educated Migrants Remit More.” Policy Research Working Paper 5113, World Bank, Washington, DC.
Borensztein, Eduardo, Kevin Cowan, and Patricio Valenzuela. 2007. “Sovereign Ceilings ‘Lite’? The Impact of Sovereign Ratings on Corporate Ratings in Emerging Market Economies.” IMF Working Paper 07/75, International Mon-etary Fund, Washington, DC.
Bourdet, Yves, and Hans Falck. 2006. “Emigrants’ Remittances and Dutch Dis-ease in Cape Verde.” International Economic Journal 20 (3): 267–84.
Bracking, Sarah, and Lloyd Sachikonye. 2008 “Remittances, Poverty Reduction and Informalization in Zimbabwe 2005–6: A Political Economy of Dispos-session?” Brooks World Poverty Institute Working Paper 28, University of Manchester, United Kingdom.
Bredl, Sebastian. 2011. “Migration, Remittances and Educational Outcomes: The Case of Haiti.” International Journal of Educational Development 31(2): 162–68.
Bugamelli, Matteo, and Francesco Paterno. 2009. “Do Workers’ Remittances Reduce the Probability of Current Account Reversals?” World Development 37 (12): 1821–38.
Business Daily Africa. 2010. “Mobile Money Transforms Uganda.” September 7. http://www.businessdailyafrica.com/Mobile%20money%20transforms%20Uganda/-/539546/1004934/-/dhr8ubz.
Bussolo, Maurizio, and Dennis Medvedev. 2007. “Do Remittances Have a Flip Side? A General Equilibrium Analysis of Remittances, Labor Supply Responses, and Policy Options for Jamaica.” Policy Research Working Paper 4143, World Bank, Washington, DC.

102 • Leveraging Migration for Africa: Remittances, Skills, and Investments
Calero, Carla, Arjun S. Bedi, and Robert Sparrow. 2009 “Remittances, Liquidity Constraints and Human Capital Investments in Ecuador.” World Development 37 (6): 1143–54.
Catrinescu, Natalia, Miguel Leon-Ledesma, Matloob Piracha, and Bryce Quillin. 2009. “Remittances, Institutions, and Economic Growth.” World Development 37 (1): 81–92.
CGAP (Consultative Group to Assist the Poor), and Dalberg Global Develop-ment Advisers. 2010. “Improving Access and Reducing Costs of International Remittances through Branchless Banking Solutions.” http://www.cgap.org/gm/document-1.9.49049/Dalberg-CGAP_Intl_Remit_Branchless_Banking_Findings.pdf.
Chami, Ralph, Adolfo Barajas, Thomas Cosimano, Connel Fullenkamp, Michael Gapen, and Peter Montiel. 2008. “Macroeconomic Consequences of Remit-tances.” IMF Occasional Paper 259, International Monetary Fund, Washing-ton, DC.
Chami, Ralph, Dalia Hakura, and Peter Montiel. 2009. “Remittances: An Auto-matic Stabilizer?” IMF Working Paper 09/91, International Monetary Fund, Washington, DC.
Chauvet, Lisa, Flore Gubert, and Sandrine Mesplé-Somps. 2009. “Are Remittances More Effective than Aid to Reduce Child Mortality? An Empirical Assessment Using Inter- and Intra-Country Data.” DIAL Working Paper DT/2009-11, Développement, Institutions et Analyses de Long terme (DIAL), Paris.
Clarke, George, and Scott Wallsten. 2004. “Do Remittances Protect Household in Developing Countries against Shocks? Evidence from a Natural Disaster in Jamaica.” World Bank, Development Research Group, Washington, DC.
Clemens, Michael. 2009. “The Financial Effects of High-Skilled Emigration: New Data on African Doctors Abroad.” Paper presented at the International Conference on Diaspora for Development, Washington, DC, July 13–14. http://siteresources.worldbank.org/INTPROSPECTS/Resources/334934-1110315015165/Clemens.pdf.
Clotteau Nils, and Jose Anson. 2011. “Role of Posts in Remittances and Financial Inclusion.” Background note prepared for the Africa Migration Project, Uni-versal Postal Union, Berne, Switzerland. Migration and Development Brief 15, World Bank, Washington, DC.
Cox-Edwards, Alejandra, and Manuelita Ureta. 2003. “International Migration, Remittances and Schooling: Evidence from El Salvador.” Journal of Develop-ment Economics 72 (2): 429–61.
De, Prabal, and Dilip Ratha. 2006. “Migration and Remittances in Sri Lanka.” World Bank, Development Prospects Group, Washington, DC.
De Haas, H. 2005. “International Migration, Remittances and Development: Myths and Facts.” Third World Quarterly 26 (8): 1269–84.
Demirgüç-Kunt, Asli, Thorsten Beck, and Patrick Honohan. 2008. “Finance for All? Policies and Pitfalls in Expanding Access.” Policy Research Report, World Bank, Washington, DC.
Dolan, Jonathan. 2009. Accelerating the Development of Mobile Money Ecosystems. Report on the Mobile Money Summit 2009, International Finance Corpora-tion and Kennedy School of Government, Harvard University, Cambridge, MA. http://www.hks.harvard.edu/m-rcbg/CSRI/publications/report_39_mobile_money_january_09.pdf.
Drabo, Alassane, and Christian Ebeke. 2010. “Remittances, Public Health Spend-ing and Foreign Aid in the Access to Health Care Services in Developing Countries.” Working Paper E 2010.04, Centre d’Etudes et de Recherche sur le Développement International (CERDI), Clermont-Ferrand, France.
Migrant Remittances • 103
Easterly, William, and Yaw Nyarko. 2009. “Is the Brain Drain Good for Africa?” In Skilled Immigration Today: Prospects, Problems, and Policies, ed. Jagdish Bhag-wati and Gordon Hanson, 316–60. New York: Oxford University Press.
Ebeke, Christian H. 2010. “The Effect of Remittances on Child Labor: Cross-Country Evidence.” Economics Bulletin 30 (1): 351–64.
Economic Times. 2010. “Bharti Gets RBI Nod for Mobile Money Services.” September 17. http://economictimes.indiatimes.com/articleshow/6559841.cms?prtpage=1.
Economist. 2010. “Low-Cost Bundle.” February 18. http://www.economist.com/business-fi nance/displaystory.cfm?story_id=15546456.
Elbadawi, Asmaa, and Rania Roushdy. 2009. “Impact of International Migration and Remittances on Child Schooling and Child Work: The Case of Egypt.” Paper prepared for the World Bank’s MENA International Migration Program, Funded by the European Commission, Washington, DC.
Faini, Riccardo. 2007. “Remittances and the Brain Drain: Do More Skilled Migrants Remit More?” World Bank Economic Review 21 (2): 177–91.
Fajnzylber, Pablo, and Humberto Lopez. 2007. Close to Home: The Development Impact of Remittances in Latin America. Washington, DC: World Bank.
Fargues, Philippe. 2006. “The Demographic Benefi t of International Migration: A Hypothesis and Its Application to Middle Eastern and North African Con-texts.” In International Migration, Economic Development and Policy, ed. Caglar Özden and Maurice Schiff, 59–98. Washington, DC: World Bank, and New York: Palgrave Macmillan.
Filmer, Deon, and Lant Pritchett. 2001. “Estimating Wealth Effects without Expenditure Data—or Tears: An Application to Educational Enrollments in States of India.” Demography 38 (1): 115–32.
Frankel, Jeffrey. 2010. “Are Bilateral Remittances Countercyclical.” Open Econo-mies Review DOI: 10.1007/s11079-010-9184-y.
Freund, Caroline, and Nikola Spatafora. 2008. “Remittances, Transaction Costs, and Informality.” Journal of Development Economics 86 (2): 356–66.
Ghirmay, Teame. 2004. “Financial Development and Economic Growth in Sub-Saharan African Countries: Evidence from Time Series Analysis.” African Devel-opment Review 16 (3): 415–32.
Gibson, John, David McKenzie, and Halahingano Rohorua. 2006. “How Cost Elastic Are Remittances? Evidence from Tongan Migrants in New Zealand.” Pacifi c Economic Bulletin 21 (1): 112–28.
Giuliano, Paola, and Marta Ruiz-Arranz. 2009. “Remittances, Financial Develop-ment and Growth.” Journal of Development Economics 90 (1): 144–52.
Gubert, Flore. 2002. “Do Migrants Insure Those Who Stay Behind? Evidence from the Kayes Area (Western Mali).” Oxford Development Studies 30 (3): 267–87.
———. 2007. “Migration and Development: Mixed Evidence from Western Mali.” Development 50 (4): 94–100.
Gupta, Sanjeev, Catherine A. Pattillo, and Smita Wagh. 2009. “Impact of Remit-tances on Poverty and Financial Development in Sub-Saharan Africa.” World Development 37 (1): 104–15.
Gustafsson, Bjorn, and Negatu Makonnen. 1993. “Poverty and Remittances in Lesotho.” Journal of African Economies 2 (1): 49–73.
Guzmán, Juan Carlos, Andrew R. Morrison, and Mirja Sjöblom. 2007. “The Impact of Remittances and Gender on Household Expenditure Patterns.” In The International Migration of Women, ed. Maurice Schiff, Andrew R. Morrison, and Mirja Sjöblom, 125–52. Washington, DC: World Bank.

104 • Leveraging Migration for Africa: Remittances, Skills, and Investments
Halliday, Timothy. 2006. “Migration, Risk and Liquidity Constraints in El Salva-dor.” Economic Development and Cultural Change 54 (4): 893–925.
Hanson, Gordon, and Christopher Woodruff. 2003. “Emigration and Educa-tional Attainment in Mexico.” Department of Economics, University of Cali-fornia San Diego.
Hildebrandt, Nicole, and David McKenzie. 2005. “The Effects of Migration on Child Health in Mexico.” Economia 6 (1): 257–89.
Huysentruyt, Marieke, Christopher B. Barrett, and John G. McPeak. 2009. “Understanding Declining Mobility and Interhousehold Transfers among East African Pastoralists.” Economica 76: 315–36.
IFAD (International Fund for Agriculture and Development). 2009. Sending Money Home to Africa. Rome.
IMF (International Monetary Fund). 2009. International Transactions in Remit-tances: Guide for Compilers and Users, Statistics Department, Washington, DC.
———. 2010. “Staff Guidance Note on the Application of the Joint Bank-Fund Debt Sustainability Framework for Low-Income Countries.” Prepared by the staffs of the IMF and the World Bank, January 22.
IMF, and World Bank. 2009. A Review of Some Aspects of the Low-Income Country Debt Sustainability Framework. International Monetary Fund and the World Bank, Washington, DC. http://www.imf.org/external/np/pp/eng/2009/080509a.pdf.
Irving, Jacqueline, Sanket Mohapatra, and Dilip Ratha. 2010. “Migrant Remit-tance Flows: Findings from a Global Survey of Central Banks.” Working Paper 194, World Bank, Washington, DC.
Isaacs, Leon. 2011. “Remittance Market in the United Kingdom.” In Remittance Markets in Africa, ed. Sanket Mohapatra and Dilip Ratha. Washington, DC: World Bank.
Joseph, Michael. 2010. “Kenya’s Telecom Revolution and Invention of Mobile Money.” Paper presented at the World Bank, Washington, DC, November 12.
Kanaiaupuni, Shawn M., and Katharine M. Donato. 1999. “Migradollars and Mortality: The Effects of Migration on Infant Survival in Mexico.” Demography 36 (3): 339–53.
Ketkar, Suhas, and Dilip Ratha, ed. 2009a. Innovative Financing for Development. Washington, DC: World Bank.
———. 2009b. “New Paths to Funding.” Finance and Development. Washington, DC: International Monetary Fund.
Lachaud, Jean-Pierre. 1999. “Envoi de fonds, inégalité et pauvreté au Burkina Faso.” Document de travail 40, Groupe d’Economie du Développement de l’Université Montesquieu Bordeaux IV.
Lopez-Cordova, E. 2005. “Globalization, Migration and Development: The Role of Mexican Migrant Remittances.” Economia 6 (1): 217–56.
Lucas, Robert, E. B. 1987. “Emigration to South Africa’s Mines.” American Eco-nomic Review 77 (3): 313–30.
Lucas, Robert E. B. and Oded Stark. 1985. “Motivations to Remit: Evidence from Botswana.” Journal of Political Economy 93 (5): 901–18.
Lueth, Erik, and Marta Ruiz-Arranz. 2008. “Determinants of Bilateral Remittance Flows.” B.E Journal of Macroeconomics 8 (1), Article 26.
Maimbo, Samuel, Tania Saranga, and Nicholas Strychacz. 2010. “Facilitating Cross-Border Mobile Banking in Southern Africa.” Economic Premise 26, World Bank, Washington, DC.
Mansuri, Ghazala. 2007. “Does Work Migration Spur Investment in Origin Com-munities? Entrepreneurship, Schooling, and Child Health in Rural Pakistan.”
Migrant Remittances • 105
In International Migration, Economic Development, and Policy, ed. Çaglar Özden and Maurice Schiff, 99–140. Basingstoke: Palgrave Macmillan.
Martinez, Claudia, Diego Aycinena, and Dean Yang. 2010. “The Impact of Remit-tance Fees on Remittance Flows: Evidence from a Field Experiment among Salvadoran Migrants.” Department of Economics, University of Michigan, Ann Arbor.
Mas, Ignacio, and Dan Radcliffe. 2010. “Mobile Payments Go Viral: M-PESA in Kenya.” Working Paper, Bill and Melinda Gates Foundation, Seattle, WA.
Massey, Douglas, and Emilio A. Parrado. 1998. “International Migration and Business Formation in Mexico.” Social Science Quarterly 79 (1): 1–20.
McCormick, Barry, and Jackline Wahba. 2001. “Overseas Work Experience, Sav-ings and Entrepreneurship amongst Return Migrants to LDCs.” Scottish Journal of Political Economy 48 (2): 164–78.
———. 2003 “Return International Migration and Geographical Inequality: The Case of Egypt.” Journal of African Economies 12 (4): 500–32.
McKenzie, David, and Hillel Rapoport. 2010. “Can Migration Reduce Educa-tional Attainment? Evidence from Mexico.” Journal of Population Economics DOI: 10.1007/s00148-010-0316-x.
McKenzie, David, and Marcin J. Sasin. 2007. “Migration, Remittances, Poverty, and Human Capital: Conceptual and Empirical Findings.” Policy Research Working Paper 4272, World Bank, Washington, DC.
Miller, Douglas L., and Anna L. Paulson. 2007. “Risk Taking and the Quality of Informal Insurance: Gambling and Remittances in Thailand.” Working Paper 2007-01, Federal Reserve Bank of Chicago.
Mohapatra, Sanket, George Joseph, and Dilip Ratha. 2009. “Remittances and Natural Disasters: Ex-Post Response and Contribution to Ex-Ante Prepared-ness.” Policy Research Working Paper 4972, World Bank, Washington, DC.
Mohapatra, Sanket, and Dilip Ratha. 2011. Remittance Markets in Africa. Wash-ington, DC: World Bank.
Morawczynski, Olga, and Mark Pickens. 2009. “Poor People Using Mobile Finan-cial Services: Observations on Customer Usage and Impact from M-PESA.” CGAP Brief, Consultative Group to Assist the Poor, Washington, DC.
Nagarajan, Subha. 2009. “Migration, Remittances, and Household Health: Evi-dence from South Africa.” Ph.D. diss., Department of Economics, George Washington University, Washington, DC.
Niimi, Yoko, and Caglar Ozden. 2006. “Migration and Remittances: Causes and Linkages.” Policy Research Working Paper 4087, World Bank, Washing-ton, DC.
Odozia, John C., Timothy T. Awoyemia, and Bolarin T. Omonona. 2010. “Household Poverty and Inequality: The Implication of Migrants’ Remit-tances in Nigeria.” Journal of Economic Policy Reform 13 (2): 191–99.
Orozco, Manuel. 2009. “Emerging Markets for Rwanda: Remittance Transfers, Its Marketplace and Financial Intermediation.” Inter-American Dialogue, Washington, DC.
Osili, Una Okonkwo. 2004. “Migrants and Housing Investments: Theory and Evidence from Nigeria.” Economic Development and Cultural Change 52 (4): 821–49.
Page, John, and Sonia Plaza. 2006. “Migration Remittances and Development: A Review of Global Evidence.” Journal of African Economies 15 (Suppl. 2): 245–336.
Pendleton, Wade, Jonathan Crush, Eugene Campbell, Thuso Green, Hamilton Simelane, Daniel Tevera, and Fion de Vletter. 2006. “Migration, Remittances

106 • Leveraging Migration for Africa: Remittances, Skills, and Investments
and Development in Southern Africa.” Migration Policy Series 44, Southern African Migration Project, Cape Town, South Africa.
Pickens, Mark, David Porteous, and Sarah Rotman. 2009. “Scenarios for Branch-less Banking in 2020.” CGAP Focus Note 57, Consultative Group to Assist the Poor, Washington, DC. http://www.cgap.org/gm/document-1.9.40599/FN57.pdf.
Plaza, Sonia, Mario Navarrete, and Dilip Ratha. 2011. “Migration and Remit-tances Household Surveys in Africa: Methodological Aspects and Main Find-ings.” World Bank, Washington, DC.
Ponsot, Frédéric. 2011. “Remittance Market in France.” In Remittance Markets in Africa, ed. Sanket Mohapatra and Dilip Ratha. Washington, DC: World Bank.
Ponsot, Frédéric, and Bruno Obegi. 2010. “Etude de capitalisation des initiatives et mécanismes en matière de transferts de fonds au Mali.” Study conducted for the Centre d’Information et de Gestion des Migrations (CIGEM), Mali.
Pulver, Caroline, William Jack, and Tavneed Suri. 2009. “The Performance and Impact of M-PESA: Preliminary Evidence from a Household Survey.” FSD Kenya Trust. http://technology.cgap.org/technologyblog/wp-content/uploads/2009/10/fsd_june2009_caroline_pulver.pdf.
Quartey, Peter. 2006. “The Impact of Migrant Remittances on Household Wel-fare in Ghana.” Research Paper 158, African Economic Research Consor-tium, Nairobi.
Quartey, Peter, and Theresa Blankson. 2004. “Do Migrant Remittances Minimize the Impact of Macro-volatility on the Poor in Ghana.” Report prepared for the Global Development Network, University of Ghana, Legon.
Rajan, Raghuram G., and Arvind Subramanian. 2005. “What Undermines Aid’s Impact on Growth?” IMF Working Paper 05/127, International Monetary Fund, Washington, DC.
Rajan, Raghuram G., and Luigi Zingales. 1998. “Financial Dependence and Growth.” American Economic Review 88 (3): 559–86.
Rao, Bhaskara, and Gazi Hassan. 2009. “A Panel Data Analysis of the Growth Effects of Remittances.” MPRA Working Paper 18021, Munich. http://mpra.ub.uni-muenchen.de/18021/1/MPRA_paper_18021.pdf.
Ratha, Dilip. 2003. “Workers’ Remittances: An Important and Stable Source of External Finance for Developing Countries.” In Global Development Finance 2003. Washington, DC: World Bank.
———. 2005. “Leveraging Remittances for Capital Market Access.” World Bank, Development Prospects Group, Migration and Remittances team, Washing-ton, DC.
———. 2007. “Leveraging Remittances for Development.” Policy Brief, Migration Policy Institute, Washington, DC.
———. 2010. “Mobilize the Diaspora for the Reconstruction of Haiti.” SSRC Fea-ture: Haiti, Now and Next, Social Science Research Council, New York. http://www.ssrc.org/features/pages/haiti-now-and-next/1338/1438/.
Ratha, Dilip, Prabal De, and Sanket Mohapatra. 2011. “Shadow Sovereign Ratings for Unrated Developing Countries.” World Development 39 (3): 295–307.
Ratha, Dilip, and Jan Riedberg. 2005. “On Reducing Remittance Costs.” World Bank, Development Research Group, Washington, DC.
Ratha, Dilip, and Sanket Mohapatra. 2007. “Increasing the Macroeconomic Impact of Remittances.” Paper prepared for the G8 Outreach Event on Remit-tances, Berlin, November 28–30. http://dilipratha.com/index_fi les/G8Berlin.pdf.

Migrant Remittances • 107
Ratha, Dilip, Sanket Mohapatra, and Sonia Plaza. 2009. “Beyond Aid: New Sources and Innovative Mechanisms for Financing Development in Sub-Saharan Africa.” In Innovative Financing for Development, ed. Suhas Ketkar and Dilip Ratha, 143–83. Washington, DC: World Bank.
Ratha, Dilip, Sanket Mohapatra, and Ani Silwal. 2010. “Outlook for Remittance Flows 2010–11: Remittance Flows to Developing Countries Remained Resil-ient in 2009, Expected to Recover in 2010–11.” Migration and Development Brief 12, World Bank, Development Prospects Group. http://www.world-bank.org/prospects/migrationandremittances.
Ratha, Dilip, and William Shaw. 2007. “South-South Migration and Remit-tances.” Development Prospects Group Working Paper 102, World Bank, Washington, DC.
Roache, Shaun K., and Ewa Gradzka. 2007. “Do Remittances to Latin America Depend on the U.S. Business Cycle?” IMF Working Paper 07/273, Interna-tional Monetary Fund, Washington, DC.
Russell, Sharon S. 1992. “Remittances from International Migration: A Review in Perspective.” World Development 14 (6): 677–96.
Rutten, Lamon, and Okey Oramah. 2006. “Using Commoditized Revenue Flows to Leverage Access to International Finance; with a Special Focus on Migrant Remittances and Payment Flows.” Study prepared for the Secretariat of the United Nations Conference on Trade and Development (UNCTAD), Geneva.
Sayan, Serdar. 2006. “Business Cycles and Workers’ Remittances: How Do Migrant Workers Respond to Cyclical Movements of GDP at Home?” IMF Working Paper 06/52, International Monetary Fund, Washington, DC.
Singh, Raju J., Markus Haacker, and Kyung-woo Lee. 2009. “Determinants and Macroeconomic Impact of Remittances to Sub-Saharan Africa.” IMF Working Paper 09/216, International Monetary Fund, Washington, DC.
Skeldon, Ronald. 2002. “Migration and Poverty.” Asia-Pacifi c Population Journal 17 (4): 67–82.
Sorensen, Ninna Nyberg. 2004. “Migrant Remittances as a Development Tool: The Case of Morocco.” IOM Working Paper 2, International Organization for Migration, Geneva. http://www.belgium.iom.int/pan-europeandialogue/documents/remittances_morocco.pdf.
Suleri, Abid Qaiyum, and Kevin Savage. 2006. “Remittances in Crisis: A Case Study of Pakistan.” Overseas Development Institute, London. http://www.odi.org.uk/hpg/papers/BGPaper_RemittancesPakistan.pdf.
Taylor, J. Edward, and T. J. Wyatt. 1996. “The Shadow Value of Migrant Remit-tances, Income and Inequality in a Household-Farm Economy.” Journal of Development Studies 32 (6): 899–912.
Tevera, Daniel, and Abel Chikanda. 2009. “Migrant Remittances and Household Survival in Zimbabwe.” Working Paper, Southern African Migration Project, Cape Town.
Toxopeus, Helen S., and Robert Lensink. 2007. “Remittances and Financial Inclusion in Development.” UNU-WIDER Research Paper 2007/49, United Nations University–World Institute for Development Economics Research, Helsinki.
Valero-Gil, Jorge N. 2009. “Remittances and the Household’s Expenditures on Health.” Journal of Business Strategies (Spring), Huntsville, TX.
Weiss-Fagan, Patricia. 2006. “Remittances in Crisis: A Haiti Case Study.” Over-seas Development Institute, London. http://www.odi.org.uk/hpg/papers/BG_Haiti_remittances.pdf.

108 • Leveraging Migration for Africa: Remittances, Skills, and Investments
Woodruff, Christopher, and Rene Zenteno. 2001. “Remittances and Microen-terprises in Mexico.” UCSD Graduate School of International Relations and Pacifi c Studies Working Paper, University of California San Diego.
———. 2007. “Migration Networks and Microenterprises in Mexico.” Journal of Development Economics 82 (2): 509–28.
World Bank. 2006. Global Economic Prospects 2006: Economic Implications of Remit-tances and Migration. Washington, DC: World Bank.
———. 2009. Issue Brief on Migration and Remittances. Washington, DC: World Bank..
———. 2011. Migration and Remittances Factbook 2011. Washington, DC: World Bank.
World Bank, and BIS-CPSS (Bank for International Settlements–Committee on Payment and Settlement Systems). 2007. Report on General Principles for Inter-national Remittances. Washington DC: World Bank.
Wouterse, F. 2010. “Remittances, Poverty, Inequality and Welfare: Evidence from the Central Plateau of Burkina Faso” Journal of Development Studies 46 (4): 771–89.
Wu, Treena. 2006. “The Role of Remittances in Crisis. An Aceh Research Study.” Overseas Development Institute, London. http://www.odi.org.uk/hpg/papers/BG_Remittances_Aceh.pdf.
Yang, Dean. 2008a. “Coping With Disaster: The Impact of Hurricanes on Inter-national Financial Flows, 1970–2002.” B.E. Journal of Economic Analysis and Policy 8 (1), Article 13.
———. 2008b. “International Migration, Remittances and Household Invest-ment: Evidence from Philippine Migrants’ Exchange Rate Shocks.” Economic Journal 118 (528): 591–630.
Yang, Dean, and HwaJung Choi. 2007. “Are Remittances Insurance? Evidence from Rainfall Shocks in the Philippines.” World Bank Economic Review 21 (2): 219–48.

109
CHAPTER
Migration of the Highly Skilled
The migration of highly educated or skilled people is a critical, con-troversial, and diffi cult subject.1 It is critical because it involves the transfer of human capital, which is a key to economic growth and
poverty reduction. It is controversial because, in many cases, the transfer takes place from countries suffering from scarcity of such resources to countries enjoying relative abundance. It is diffi cult to analyze because the general lack of data means that neither the causes nor the impacts of the phenomenon are well understood.
A high level of skilled migration is rarely the root problem but rather a symptom of myriad other development problems. Without properly addressing various policy challenges—in education, labor and fi nancial markets, healthcare, and public fi nance—efforts to design mechanisms to harness the benefi ts and minimize the costs of skilled migration will not be fully effective. Indeed, they may be futile. The discussion yields the following main conclusions:
• Although the emigration rate for tertiary-educated workers is high in many African countries, rates vary considerably across countries. High-skilled migration rates are particularly high in small, low-income, and confl ict-affected countries. The low levels of human capital in many African countries amplify the impact of high-skilled migration. Rather than trying to stem migration, African governments and policy makers should focus on increasing education and skill levels and establish-ing an environment in which high-skilled workers have productive opportunities at home.
• Tertiary-educated migrants from different African countries exhibit vast differences in terms of their performance in the destination countries’ labor markets. These differences refl ect language ability, the quality of education in origin countries, and the speed of integration
3

110 • Leveraging Migration for Africa: Remittances, Skills, and Investments
in destination-country labor markets. The performance of tertiary-educated migrants is important for the overall development impact of skilled migration, because it affects their potential to send remittances and generate other positive diaspora externalities.
• The data and analysis have important implications for policies to limit the costs and maximize the benefi ts of tertiary-educated migration. Education should be a major focus. Shifting educational resources to less-sophisticated degree programs (for example, training physicians’ assistants rather than doctors) could increase the supply of workers trained to provide services that are in short supply in underserved areas while also reducing the ability of trainees to fi nd employment in destination countries. However, such policies should be implemented based on the country’s need for the right mix of specialists and lower skilled workers, not the implications for high-skilled emigration. Requiring students to perform public service for a moderate period of time (since more onerous requirements are likely to encourage emi-gration and discourage return) and to pay for a portion of the cost of their education while providing performance-based subsidies to some students could increase the benefi ts of higher education while limiting the fi scal losses from high-skilled migration.
• Restrictions on the emigration of high-skilled professionals infringe on civil liberties; may not deter emigration, given the strength of incen-tives to emigrate; and discourage return. Incentives to return may be ineffective, may be provided to migrants who would have returned in any event, and may engender resentment from workers who never migrated. Removing restrictions on the recognition of foreign qualifi -cations and experience could encourage return.
• Taxation of potential emigrants may prove diffi cult to enforce, as it would require the cooperation of destination-country governments that derive great benefi ts from high-skilled emigration. Destination countries might consider providing fi nancial and technical assistance to origin countries’ educational programs, provided that such aid does not replace existing programs. An option worth considering involves getting hiring institutions (whether public or private) to open training facilities in Africa.
This chapter is organized as follows. The fi rst section reviews available data on high-skilled migration from Africa and compares high-skilled migration patterns across African countries.2 The second section reviews the performance of tertiary-educated migrants in destination labor markets, focusing on the migration of healthcare professionals and the impact their migration has on Africa. The third section analyzes various policy options.

Migration of the Highly Skilled • 111
BENEFITS AND PATTERNS OF HIGH-SKILLED MIGRATION
Highly educated workers generate positive externalities that are critical to economic growth and development. These externalities are lost for high-skilled migrants’ home countries upon their departure. Among such externalities are productivity spillovers to both high- and low-skilled workers; public services—such as healthcare and education—that have both immediate and future social spillovers; innovative and creative activities that are at the core of long-term growth; and contributions to the health of social, political, and economic institutions. In addition, in most countries, tertiary education is publicly fi nanced, and the highly educated are net fi scal contributors once they enter the labor force. Their migration therefore implies a fi scal loss for their countries.
On the positive side, the migration of highly skilled people generates numerous benefi ts for their home countries. Migrants send remittances to their families and forge economic and social linkages between their home countries and the rest of the world. A wide range of other positive diaspora externalities, such as the return of professionals with enhanced skills, are addressed in chapter 4 (see also Wahba 2007; Dustmann, Fad-lon, and Weiss 2010). An infl uential body of recent work claims that the migration of highly educated workers can have a net positive impact on the demand for education in a country (box 3.1).
Easterly and Nyarko (2009) argue that in Africa, the gains to migrants and their families are large enough to offset the general losses to the country associated with high-skilled migration and that migration increases overall human capital accumulation. They fail to fi nd evidence of any negative growth effect of skilled migration, concluding that such migration is, on balance, good for Africa. They note that any loss to the origin country is minimal if the emigrating professionals are not able to use their skills effi ciently in the origin country, because of a poor invest-ment climate, inadequate complementary inputs (such as poor medical facilities), or lack of scale economies. The voluminous literature on this subject (see Docquier and Rapoport 2009) attests to the diffi culty of measuring the costs and benefi ts and fails to reach a conclusion on the net benefi ts from high-skilled migration.
HIGH-SKILLED MIGRATION BY WORLD REGION
Migration levels from developing countries, especially from those in Africa, to OECD countries are low. This fact is surprising given the vast wage and income differentials between developing and developed coun-

112 • Leveraging Migration for Africa: Remittances, Skills, and Investments
Box 3.1 The Brain Gain
Individuals generally need to make their education decisions before migration opportunities
materialize. In many instances, education increases the likelihood of emigration to a high-income
country, since immigration policies in many countries favor highly educated people. Because of
such policies, many people invest in more education than they otherwise would have in order to
increase their chances of immigrating (Stark, Helmenstein, and Prskawetz 1997; Beine, Docquier,
and Rapoport 2001). However, some individuals who acquire higher education, with the hope of
immigration, may end up staying at home. This can result in an increase in the stock of human cap-
ital (“brain gain”) if the number of people who acquire extra education but stay at home exceeds
the number of people who migrate. A reduction in the stock of human capital (“brain drain”)
occurs otherwise (Mountford 1997; Stark 2004; World Bank 2006). In one of the few country-level
analyses, Chand and Clemens (2008) argue that high rates of emigration by tertiary-educated Fiji
Islanders raised investment in tertiary education in Fiji as well as the stock of tertiary-educated
people, net of departures.
The empirical evidence is mixed for the relative importance of brain drain versus brain gain
effects. Beine, Docquier, and Rapoport (2001) fi nd that for a subgroup of developing countries
whose per capita gross domestic product (GDP) is less than 15 percent that of G-7 countries, the
stock of human capital has a positive relationship with the migration rate, indicating brain gain.
For the entire sample (which also includes upper-middle-income countries such as Brazil, Mexico,
and South Africa), they fi nd no evidence of a loss of human capital accumulation as a result of
migration.a In a more recent study, Angel-Urdinola, Takeno, and Wodon (2008) fi nd a negative
relationship between emigration of students from Latin American countries to the United States
and tertiary enrollment rates in the countries of origin, indicating an absence of any brain gain.b
There are some positive experiences of brain gain in the health and information technology (IT)
sectors. The expectation of emigrating may have increased the incentive to invest in higher edu-
cation and specialized training such as IT (in India and Taiwan, China) and nursing (in Ghana and
the Philippines) (Solimano 2008).
a. The authors used a cross-section of 37 developing countries in 1998 to examine the relationship between an indicator for the level of educational attainment and the rate of migration to the United States, controlling for other variables, such as public education expenditure, wage differentials, and population of the home country.
b. It is diffi cult to conclude that these results—based on annual data—are evidence of brain drain and not merely the absence of brain gain. Even if there were some brain gain effect, there would typically be a considerable lag between the migration of high-skilled individuals and the incentive for those remaining behind to acquire higher education.
tries. With the exception of the Caribbean and Central America regions, all developing regions had migration rates of 3 percent or less of their total labor force in 2000 (Global Skilled Migration database, described in Docquier and others 2010). Sub-Saharan Africa had the third-lowest migration rate among developing regions, with only 1 percent of its labor force residing in OECD countries or South Africa in 2000 (fi gure 3.1). Only South and East Asia had migration rates lower than Africa, at less than 1 percent of the labor force. Still, all developing regions saw their overall migration levels increase by about 20 percent between 1990 and

Migration of the Highly Skilled • 113
2000, suggesting increased labor mobility from developing countries to OECD destinations.
Highly educated workers are more likely to emigrate than less edu-cated workers. In all developing regions, in both 1990 and 2000, the migration rate for tertiary-educated workers (the number of tertiary- educated migrants divided by the total number of tertiary-educated work-ers) far exceeded the migration rate for less educated workers. In 2000, the migration rates of the tertiary educated ranged from about 5 percent in South America, South Asia, and Eastern Europe to more than 41 per-cent in the Caribbean (fi gure 3.2). Africa had the third-highest migration rate of tertiary-educated workers, after the Caribbean and Central America and Mexico. South Asia had the lowest and East Asia the second-lowest migration rates among the tertiary educated.
Another important statistic is the share of tertiary-educated workers in the total stock of migrants, which exceeds the share of tertiary-educated workers in the domestic labor force in every developing region of the world (fi gure 3.3). In South Asia, for example, tertiary-educated workers accounted for 5 percent of the labor force and 51 percent of all migrants. In Sub-Saharan Africa, the tertiary educated accounted for less than 3 per-cent of the labor force but more than 35 percent of all migrants.
There are numerous economic and policy-induced reasons why tertiary-educated workers in developing regions are more likely than less
Figure 3.1 Share of Migrants in Labor Force, by Region, 1990 and 2000
Source: Authors, based on data from the Global Skilled Migration database (described in Docquier and others 2010).
perc
ent
0
5
10
15
20
1990
2000
Africa Caribbean CentralAmerica
and Mexico
SouthAmerica
East Europe
andCentral Asia
EastAsia
SouthAsia
OECDMiddle Eastand
North Africa

114 • Leveraging Migration for Africa: Remittances, Skills, and Investments
educated workers to emigrate. First, wage gaps (in absolute terms) increase with education, which implies that the overall income gains from emigration are higher (Clemens, Montenegro, and Pritchett 2008). Second, tertiary-educated workers are more likely to possess skills (such as languages) that enable them to adapt to the destination countries’ labor markets and social environments relatively easily and rapidly. Third, educated workers are better able to overcome the fi nancial costs
Figure 3.2 Migration Rate among Tertiary-Educated Workers, 1990 and 2000
Source: Authors, based on data from the Global Skilled Migration database (described in Docquier and others 2010).
perc
ent
1990
2000
East Europe
andCentral Asia
EastAsia
SouthAsia
OECDMiddle Eastand
North Africa
0
10
20
30
40
50
Africa Caribbean Central America
and Mexico
South America
Figure 3.3 Share of Tertiary-Educated Migrants among All Migrants, 1990 and 2000
Source: Authors, based on data from the Global Skilled Migration database (described in Docquier and others 2010).
perc
ent
1990
2000
East Europe
andCentral Asia
EastAsia
SouthAsia
OECDMiddle Eastand
North Africa
Africa Caribbean Central America
andMexico
South America
0
10
20
30
40
50
60

Migration of the Highly Skilled • 115
and legal barriers of immigration. Fourth, selective migration policies in many OECD countries strongly favor tertiary-educated migrants.
Migration rates for tertiary-educated workers are particularly high in Africa. In 2000, one out of every eight tertiary-educated Africans lived in an OECD country, the highest rate among developing regions except the Caribbean and Central America and Mexico. These relatively high skilled immigration rates refl ect the fact that Africa has the lowest rate of tertiary education of any developing region (fi gure 3.4). In 2000, only 3 percent of Africa’s labor force had tertiary education—a far lower fi gure than in the Caribbean (11 percent) or Central America and Mexico (9 percent), the other two regions with high migration rates among tertiary-educated workers. Despite signifi cant increases in tertiary education in many Afri-can countries since 2000, Sub-Saharan Africa still lags other regions.
The small share of the labor force with tertiary education and the relative inability of the unskilled to migrate make skilled migration rates in Africa look especially high relative to other regions. A comparison of Africa and South America provides a useful illustration. In 2000, South America’s labor force of 170 million was much smaller than Sub-Saharan Africa’s of 240 million. However, South America had more than 21.5 mil-lion tertiary-educated workers (12.6 percent of the labor force) compared with only 6.6 million (2.8 percent of the labor force) in Africa. About 1.2 million tertiary-educated migrants from South America and a little more
Figure 3.4 Share of Tertiary-Educated Workers in the Labor Force, 2000
Source: Authors, based on data from the Global Skilled Migration database (described in Docquier and others 2010).
0 5 10
percent
15 20
East Europe & Central Asia
Middle East & North Africa
Central America & Mexico
Caribbean
East Asia
South America
South Asia
Africa

116 • Leveraging Migration for Africa: Remittances, Skills, and Investments
than 1 million from Africa were living in OECD countries in 2000. The migration rate among the tertiary educated in South America (5.5 per-cent) was about one-third of Africa’s (15.2 percent), because of the much larger number of tertiary-educated workers in South America. The migra-tion rate to OECD countries of less educated workers was much higher in South America than in Africa, a refl ection of the lower transportation costs to the United States and the availability of social networks that reduce assimilation costs and legal barriers (Beine, Docquier, and Ozden 2011). At the same time, superior business climates and stable social/political environments in Latin American countries increase the incen-tives to stay at home for tertiary-educated workers (Fajnzylber and Lopez 2007; Grogger and Hanson forthcoming). Both of these factors led to a lower ratio of migrants with tertiary education among all migrants.
HIGH-SKILLED MIGRATION ACROSS AFRICA
Most African countries resemble the regional average, with low levels of human capital and high rates of tertiary-educated migration. Tertiary-educated workers accounted for less than 10 percent of the labor force in the vast majority of African countries in 2000 (fi gure 3.5, panel a). They represented at least 10 percent of migrants in almost every country, how-ever, and more than 30 percent in more than half of the countries.
One of the mistakes often made in discussions of skilled migration is to treat Africa as a single homogenous entity. Aggregate migration rates mask wide disparities among country groups and individual countries. The share of migrants among tertiary-educated workers in Africa ranged from a very low rate of 3 percent in Burkina Faso to a staggering 82 per-cent in Cape Verde. By contrast, overall migration rates range from 1 to 35 percent, with the vast majority of countries below 7 percent (fi gure 3.5, panel b). The wide divergence between tertiary-educated and other workers stems from the fact that most workers are unable to leave Africa, mainly because of fi nancial and physical barriers.
On average, small countries in Africa have higher migration rates than large countries. In 2000, the share of migrants in the labor force in small countries (populations of less than 3 million) was four times the share in large countries. The average migration rate among the tertiary educated in small countries (30 percent) was three times that of large countries and 1.5 times the skilled migration rate in medium-size countries (fi gure 3.6). This pattern of higher overall migration and higher-skilled migration in smaller countries is not limited to Africa but is found in many small coun-tries in the Caribbean and the Pacifi c (Docquier and Marfouk 2007).

Migration of the Highly Skilled • 117
Low-income African countries tend to have higher migration rates than middle-income countries. The migration rate among the tertiary educated in low-income African countries is twice that of middle-income countries (fi gure 3.7). Although the tertiary educated accounted for less than 2 percent of the labor force in low-income countries in 2000, they made up almost one-third of total migrants.
a. Percentage of migrants with tertiary education
b. Percentage of migrants among people with tertiary education
Figure 3.5 Tertiary-Educated Migration Rates in Selected African Countries
Source: Authors, based on data from the Global Skilled Migration database (described in Docquier and others 2010).
0
10
20
30
40
50
60
70
0 2 4 6 8 10 12
Share of the Tertiary Educated in the Labor Force (%)
perc
ent
Share of Migrants in the Labor Force (%)
perc
ent
0
10
20
30
40
50
60
70
80
90
0 5 10 15 20 25 30 35

118 • Leveraging Migration for Africa: Remittances, Skills, and Investments
The high rates of tertiary-educated migration from small and low-income countries refl ect their small pools of tertiary-educated workers. In 2000, less than 900,000 of the 64 million workers in low-income Afri-can countries were tertiary educated. The migration of 200,000 tertiary- educated workers from these countries—a relatively small number con-sidering that in 2000 there were 173,000 tertiary-educated migrants in the OECD countries from South Africa alone—results in a very high level of skilled migration rate for this group. The return on human capital in these countries tends to be relatively low, given the limited opportunities for specialization. The scope for highly skilled workers to generate economic spillovers in more developed countries leads to higher economic gains and strong incentives to migrate.
Ten medium-size countries and nine middle-income countries also had high tertiary-educated migration rates in 2000. Three small countries and three low-income countries had low tertiary-educated migration rates (table 3.1).
At the individual country level, South Africa boasts some of the high-est living standards on the continent and has a relatively skilled labor force. Yet in 2000, the migration rate among tertiary-educated workers in South Africa was only twice that of Burkina Faso, one of the world’s poor-est nations. Meanwhile, Mauritius—often touted as an African success story—had more than 60 percent of its tertiary-educated labor force resid-ing in OECD countries in 2000. This rate is more than seven times the
Figure 3.6 Migration Rates in Africa, by Country Size, 1990 and 2000
Source: Authors, based on data from the Global Skilled Migration database (described in Docquier and others 2010).
0
5
10
15
20
25
30
35M
igra
tion
rate
(percent)
40
Overall Migration rate
SmallCountries
Medium-sizeCountries
LargeCountries
SmallCountries
Medium-sizeCountries
LargeCountries
Migration rate among people with tertiary education
1990
2000

Migration of the Highly Skilled • 119
Figure 3.7 Migration of Tertiary-Educated Workers in Africa, by Country Income Level, 2000
Source: Authors, based on data from the Global Skilled Migration database (described in Docquier and others 2010).
0 10 20 30percent
40 50
South Africa
Middle Income
Low Income
Share of Tertiary Educated in Total Migrants
Migration Rate among Tertiary Educated
Share of Tertiary Educated in the Labor Force
migration rate of similar workers in Madagascar, another francophone island nation with a per capita GDP one-tenth that of Mauritius. High tertiary-educated migration rates from middle-income African countries are likely to refl ect the greater ability to overcome fi nancial and legal bar-riers to migration.
Political confl ict can affect the migration of tertiary-educated workers, but it does not always result in the massive migration of the tertiary edu-cated. Migration rates in 2000 among the tertiary educated in seven African countries that suffered from civil confl icts during the 1990s ranged from a mere 4 percent (in Angola) to 42 percent in (Liberia). Various country-specifi c factors account for this variation. For example, Portuguese- speaking Angolans are less likely to migrate than English-speaking Libe-rians, because most destinations for skilled migrants are also English speaking. The presence of an established diaspora in the destination is another key determinant of migration fl ows, even for skilled workers (Beine, Docquier, and Ozden 2011).
DESTINATIONS OF HIGH-SKILLED MIGRANTS
Tertiary-educated migrants from Africa go predominantly to English-speaking countries such as the United States, Australia, and Canada. In 2000, 53 percent of all tertiary-educated emigrants from African countries to OECD countries went to these three countries, down slightly from 57 percent in 1990 (fi gure 3.8). These countries, on the other hand, account for only 28 percent of total African emigrants to the OECD countries.

120 • Leveraging Migration for Africa: Rem
ittances, Skills, and Investments
Table 3.1 High-Skilled Migration Rates in Sub-Saharan African Countries of Different Sizes and Income Levels, 2000
Migration rate < 10 percent Migration rate 10–25 percent Migration rate > 25 percent
Country Size Income Country Size Income Country Size Income
Angolaa Medium Middle Cameroon Medium Middle Cape Verde Small Middle
Benin Medium Middle Comoros Small Middle Congo, Rep.a Medium Middle
Botswana Small High-middle Congo, Dem. Rep. Large Middle Eritrea Medium Middle
Burkina Faso Medium Middle Equatorial Guinea Small Middle Gambia, The Small Middle
Burundia Medium Middle Gabon Small High-middle Ghana Medium Middle
Central African Republic Medium Middle Lesotho Small Middle Guinea-Bissau Small Low
Chad Small Middle Mali Medium Middle Kenya Large Low
Côte d’Ivoire Medium Middle Nigeria Large Middle Liberiaa Medium Low
Djibouti Small Middle Senegal Medium Middle Malawi Medium Low
Ethiopia Large Middle Swaziland Small Middle Mauritius Small High-middle
Guinea Medium Middle Tanzania Large Low Mozambiquea Medium Low
Madagascar Medium Low Togo Medium Low Namibia Small High-middle
Mauritania Medium Low Zambia Medium Low Rwandaa Medium Low
Niger Medium Low Zimbabwe Medium Low São Tomé and Príncipe Small Middle
South Africa Large High-middle Seychelles Small High-middle
Sudana Large Middle Sierra Leone Medium Low
Somaliaa Medium Low
Uganda Medium Low
Source: Authors, based on data from the Global Skilled Migration database (described in Docquier and others 2010). a. Experienced civil confl ict during the 1990s.
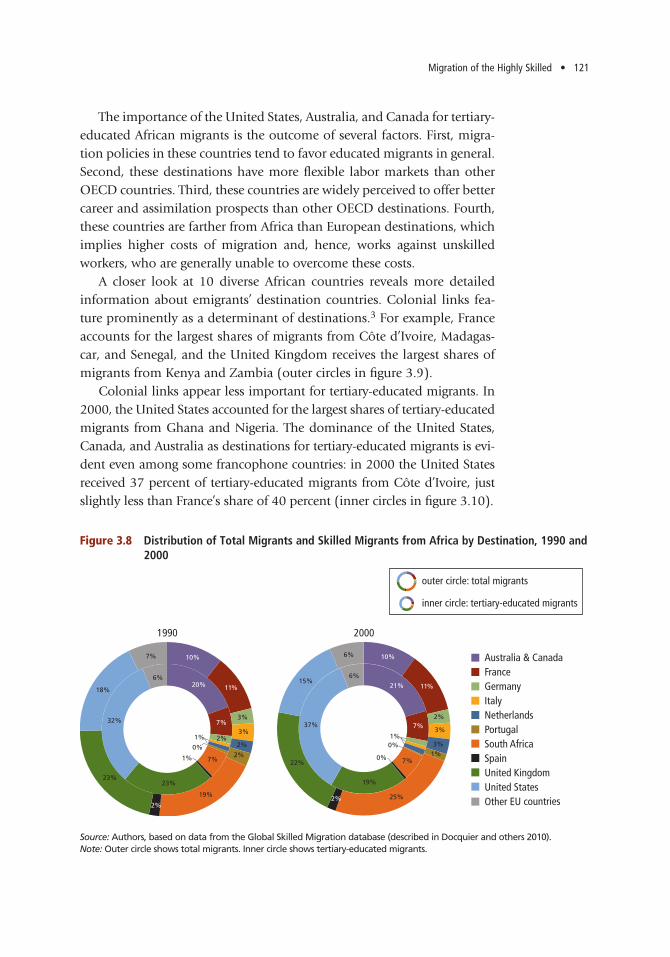
Migration of the Highly Skilled • 121
The importance of the United States, Australia, and Canada for tertiary-educated African migrants is the outcome of several factors. First, migra-tion policies in these countries tend to favor educated migrants in general. Second, these destinations have more fl exible labor markets than other OECD countries. Third, these countries are widely perceived to offer better career and assimilation prospects than other OECD destinations. Fourth, these countries are farther from Africa than European destinations, which implies higher costs of migration and, hence, works against unskilled workers, who are generally unable to overcome these costs.
A closer look at 10 diverse African countries reveals more detailed information about emigrants’ destination countries. Colonial links fea-ture prominently as a determinant of destinations.3 For example, France accounts for the largest shares of migrants from Côte d’Ivoire, Madagas-car, and Senegal, and the United Kingdom receives the largest shares of migrants from Kenya and Zambia (outer circles in fi gure 3.9).
Colonial links appear less important for tertiary-educated migrants. In 2000, the United States accounted for the largest shares of tertiary-educated migrants from Ghana and Nigeria. The dominance of the United States, Canada, and Australia as destinations for tertiary-educated migrants is evi-dent even among some francophone countries: in 2000 the United States received 37 percent of tertiary-educated migrants from Côte d’Ivoire, just slightly less than France’s share of 40 percent (inner circles in fi gure 3.10).
Figure 3.8 Distribution of Total Migrants and Skilled Migrants from Africa by Destination, 1990 and 2000
Source: Authors, based on data from the Global Skilled Migration database (described in Docquier and others 2010). Note: Outer circle shows total migrants. Inner circle shows tertiary-educated migrants.
6%
7%
20%
7%
2%1%
0%
7%1%
23%
32%
10%
11%
3%
3%
2%
2%
2%
23%
18%
19%
Australia & Canada
20001990
FranceGermanyItalyNetherlandsPortugalSouth AfricaSpainUnited KingdomUnited StatesOther EU countries
21%
7%
1%0%
7%0%
19%
37%
6%
10%
11%
2%
3%
3%1%
25%2%
22%
15%
6%
outer circle: total migrants
inner circle: tertiary-educated migrants

122 • Leveraging Migration for Africa: Remittances, Skills, and Investments
Figure 3.9 Distribution of Migrants and Skilled Migrants from Selected Anglophone Countries in Africa, 2000
Source: Authors, based on data from the Global Skilled Migration database (described in Docquier and others 2010).Note: Outer circle shows total migrants. Inner circle shows tertiary-educated migrants.
12%
26%
47%
3%
8%2%
7%
9%
6%
1%1%
29%
33%
4%
Ghana
1%5%
1%3%2%0%
46%
0%
23%
3%
39%
1%2%
0%0%
34%
18%
5%
27%
South Africa
5%1%
0%2% 0%
27%
59%
4%
3%1%
3%5%
1%2%
2%
30%
47%
6%
Nigeria
20%
1%
3%
0%3%
0%
46%
29%
1%
12%
1%0%
3% 0%
66%
15%
2%
Kenya
2%
95%
0%
1%
5%0%
91%
1%2%
Namibia
10%
0%1%
42%
0%
37%
9%1%
18%
0%
37%
0%
28%
16%
1%
Zambia
Australia & CanadaFranceGermanyItalyNetherlandsPortugalSouth AfricaSpainUnited KingdomUnited StatesOther EU Countries
outer circle:total migrantsinner circle:tertiary-educatedmigrants

Migration of the Highly Skilled • 123
Figure 3.10 Distribution of Total Migrants and Skilled Migrants from Selected Francophone Countries in Africa, 2000
Source: Authors, based on data from the Global Skilled Migration database (described in Docquier and others 2010).Note: Outer circle shows total migrants. Inner circle shows tertiary-educated migrants.
Australia & Canada FranceGermanyItalyNetherlandsPortugalSouth AfricaSpainUnited KingdomUnited StatesOther EU countries
Côte d’Ivoire Senegal
Congo, Dem. Rep. Madagascar
12%
11%
6%
1%
3%0%
0%
5%
10%
51%
6%
18%
9%
1%3%
3%1%
6%5%
48%
10%
70%
1%
1%0%
10%6%
6%
78%
1%1%0%
2%
5%
6%
2%
6%
39%
3%1%0%
6%
38%
4%
2%
55%
4%
12%
1%0%1%1%
5%
14%
5%
7%
49%
2%6%
0%1%
26%
4%
1%
47%
1%
28%
1%0%1%
10%
1% 8%2%
3%
1%
outer circle: total migrants
inner circle: tertiary-educated migrants

124 • Leveraging Migration for Africa: Remittances, Skills, and Investments
EARNINGS OF TERTIARY-EDUCATED MIGRANTS IN DESTINATION LABOR MARKETS
The professional placement and performance of tertiary-educated migrants in their destination labor markets have important implications for the policy debate on skilled migration. The type of job a migrant has infl uences his or her performance in the destination country and, thus, the overall welfare gains from migration.
One concern is “brain waste,” which occurs when highly educated migrants accept positions that require little training or education (or do not fi nd employment at all), eroding the benefi ts of migration to them and their home country. Mattoo, Neagu, and Ozden (2008) argue that this issue is more important for people whose quality of education and skills do not match the standards expected in the destination coun-tries’ labor markets. They estimate the probability that a foreign-born bachelor’s degree holder will obtain a skilled job (a job that on aver-age requires tertiary education) and the probability that a foreign-born professional-degree holder (for example, law, medicine, pharmacy) will obtain a science-oriented or professional job in the United States. They fi nd evidence of signifi cant variation across origin countries and espe-cially low rates of professional placement among educated migrants from several African countries (fi gure 3.11). Migrants with bachelor’s degrees from 7 of 15 African countries have less than a 40 percent chance of end-ing up in a skilled job. The pilot project in Ghana (box 3.2) indicates that brain waste is not a problem for top students.
In most cases, the probability of obtaining a skilled job is higher for an African-born migrant with a professional degree than one with a bach-elor’s degree. For example, the probability of obtaining a skilled job for an Eritrean- or Ethiopian-born migrant with a professional degree is three times that of a bachelor-degree holder. Among the 15 countries listed in fi gure 3.11, only bachelor’s degree holders from Senegal and Sierra Leone had higher probabilities of landing a skilled job than holders of profes-sional degrees.
The factors that infl uence the probability that a tertiary-educated migrant obtains a skilled job or a professional job in the United States vary signifi cantly by country of origin. Factors such as expenditure on tertiary education and the use of English as a medium of instruction have a tre-mendous impact on the quality of education. Mattoo, Neagu, and Ozden (2008) show that they strongly infl uence whether a migrant obtains a pro-fessional or other high-skilled job. In a related study, Coulombe and Trem-blay (2009) compare the skill intensity and schooling levels of Canadian immigrants and natives who were submitted to the same standardized tests
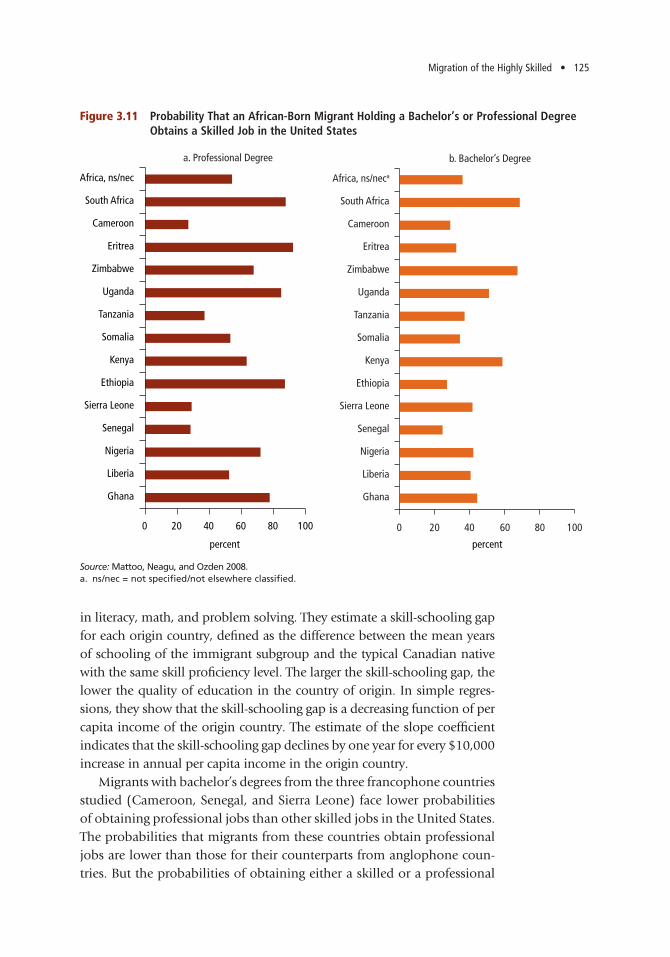
Migration of the Highly Skilled • 125
in literacy, math, and problem solving. They estimate a skill-schooling gap for each origin country, defi ned as the difference between the mean years of schooling of the immigrant subgroup and the typical Canadian native with the same skill profi ciency level. The larger the skill-schooling gap, the lower the quality of education in the country of origin. In simple regres-sions, they show that the skill-schooling gap is a decreasing function of per capita income of the origin country. The estimate of the slope coeffi cient indicates that the skill-schooling gap declines by one year for every $10,000 increase in annual per capita income in the origin country.
Migrants with bachelor’s degrees from the three francophone countries studied (Cameroon, Senegal, and Sierra Leone) face lower probabilities of obtaining professional jobs than other skilled jobs in the United States. The probabilities that migrants from these countries obtain professional jobs are lower than those for their counterparts from anglophone coun-tries. But the probabilities of obtaining either a skilled or a professional
Figure 3.11 Probability That an African-Born Migrant Holding a Bachelor’s or Professional Degree Obtains a Skilled Job in the United States
Source: Mattoo, Neagu, and Ozden 2008.a. ns/nec = not specifi ed/not elsewhere classifi ed.
0 20 40 60
percent percent
80 100
Ghana
Liberia
Nigeria
Senegal
Sierra Leone
Ethiopia
Kenya
Somalia
Tanzania
Uganda
Zimbabwe
Eritrea
Cameroon
South Africa
Africa, ns/nec
0 20 40 60 80 100
Ghana
Liberia
Nigeria
Senegal
Sierra Leone
Ethiopia
Kenya
Somalia
Tanzania
Uganda
Zimbabwe
Eritrea
Cameroon
South Africa
Africa, ns/neca
a. Professional Degree b. Bachelor’s Degree
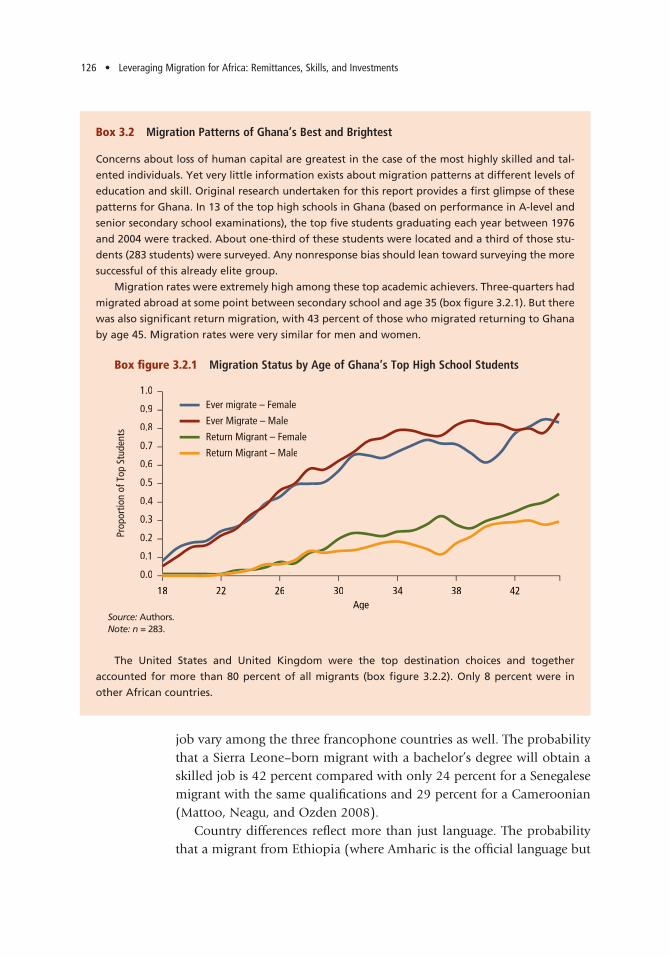
126 • Leveraging Migration for Africa: Remittances, Skills, and Investments
job vary among the three francophone countries as well. The probability that a Sierra Leone–born migrant with a bachelor’s degree will obtain a skilled job is 42 percent compared with only 24 percent for a Senegalese migrant with the same qualifi cations and 29 percent for a Cameroonian (Mattoo, Neagu, and Ozden 2008).
Country differences refl ect more than just language. The probability that a migrant from Ethiopia (where Amharic is the offi cial language but
Box 3.2 Migration Patterns of Ghana’s Best and Brightest
Concerns about loss of human capital are greatest in the case of the most highly skilled and tal-
ented individuals. Yet very little information exists about migration patterns at different levels of
education and skill. Original research undertaken for this report provides a fi rst glimpse of these
patterns for Ghana. In 13 of the top high schools in Ghana (based on performance in A-level and
senior secondary school examinations), the top fi ve students graduating each year between 1976
and 2004 were tracked. About one-third of these students were located and a third of those stu-
dents (283 students) were surveyed. Any nonresponse bias should lean toward surveying the more
successful of this already elite group.
Migration rates were extremely high among these top academic achievers. Three-quarters had
migrated abroad at some point between secondary school and age 35 (box fi gure 3.2.1). But there
was also signifi cant return migration, with 43 percent of those who migrated returning to Ghana
by age 45. Migration rates were very similar for men and women.
Box fi gure 3.2.1 Migration Status by Age of Ghana’s Top High School Students
Source: Authors.Note: n = 283.
The United States and United Kingdom were the top destination choices and together
accounted for more than 80 percent of all migrants (box fi gure 3.2.2). Only 8 percent were in
other African countries.
0.0
0.1
0.2
0.3
0.4
0.5
0.6
0.7
0.8
0.9
1.0
18 22 26 30 34 38 42Age
Prop
ortio
n of
Top
Stu
dent
s
Ever migrate – Female
Ever Migrate – Male
Return Migrant – Female
Return Migrant – Male

Migration of the Highly Skilled • 127
Box 3.2 Migration Patterns of Ghana’s Best and Brightest (continued)
Box fi gure 3.2.2 Migration Destinations of Top Students from Ghana Living Abroad
Source: Authors. Note: n = 283.
Migrant students earned more than fi ve times as much as top students who never migrated
(box fi gure 3.2.3). After controlling for age, parental education, and family wealth status at the
end of high school, a migrant who was abroad earned about $74,000 a year more than a non-
migrant. There was no signifi cant difference between the incomes of nonmigrants and return
migrants, after controlling for various personal attributes. Assuming a discount rate of 5 percent,
the net present value of the lifetime earnings gained from working abroad rather than in Ghana
exceeded $1 million per migrant.
Box fi gure 3.2.3 Annual Earnings of Elite Nonmigrants, Migrants, and Return Migrants in Ghana
Source: Authors. Note: n = 283.
United States58%United Kingdom
22%
Other Africa8%
Other Europe5%
Rest of the world7%
(Box continues on next page)
0 20,000 40,000 60,000 80,000 100,000 120,000
Current migrants
Return migrants
Nonmigrants
Annual income in U.S. dollars (at market exchange rates)
MalesFemales

128 • Leveraging Migration for Africa: Remittances, Skills, and Investments
Box 3.2 Migration Patterns of Ghana’s Best and Brightest (continued)
Another key observation emerging from these data is the difference between women and
men. Labor market data from many different countries indicate that on average women earn
more than men (although the difference is not statistically signifi cant) for identical levels of edu-
cation and other qualifi cations. The data on this elite group point show that women, especially
elite migrants, earn signifi cantly more than men. There are many possible reasons for this gap,
including potential selection biases in migration and education decisions. Examination of these
issues was beyond the scope of this research but worth noting for future rounds of analysis.
Migrants abroad are working in broadly similar occupations as those in Ghana. Typical occupa-
tions include management consultants, engineers, information technology specialists, academics,
doctors, lawyers, and bankers. Elite migrants do not appear to be working in occupations far
beneath their qualifi cation levels.
Almost all of these top professionals have bachelor’s degrees (box table 3.2.1). Among current
migrants 41 percent obtained their bachelor’s degree abroad. In contrast, only 9 percent of return
migrants had foreign degrees. Current migrants are signifi cantly more likely to have obtained an
advanced degree than nonmigrants, and in the majority of cases these advanced qualifi cations
were obtained abroad. Among all former top students currently living in Ghana, 32 percent with
an advanced degree obtained it abroad.
What are the effects of high-skilled migration on Ghana? Among current migrants surveyed
who were not students, 93 percent were sending remittances, and most were sending about
$5,000 a year. There was little involvement in trade: only 3 percent of migrants helped a Ghanaian
fi rm make a trade deal or exported goods from their home country in the past year. About 19
percent made investments in Ghanaian businesses, with a mean investment of $3,700 per migrant.
The most common knowledge transfer that current migrants engaged in was providing advice on
study and work options abroad to other Ghanaians, which about half of migrants reported doing.
There were also some limited interactions with companies and businesses: 16 percent of current
Box table 3.2.1 Educational Achievements of Former Top Ghanaian Students Currently 25–45 (percent)
Masters degree, law degree, medical Bachelor’s degree degree, or doctorate
Proportion of Proportion of degree holders degree holders Proportion who earned Proportion who earnedMigration status with degree it abroad with degree it abroad
Migrant 85 41 68 72
Return migrant 78 9 70 50
Nonmigrant 92 n.a. 32 n.a.
Nonmigrant and return migrant 86 4 49 32
Source: Authors.Note: n = 293. n.a. = not applicable.

Migration of the Highly Skilled • 129
English is the medium of instruction in secondary schools) with a bach-elor’s degree will obtain a skilled job in the United States is about 20 per-cent. The same probability for a migrant from South Africa or Zimbabwe is more than 65 percent. Variations for holders of professional degrees are also wide. For example, the probability that a Tanzanian holder of bach-elor’s degree obtains a professional job is less than 40 percent, compared with 60 percent for a migrant born in Kenya and more than 80 percent for a migrant born in Eritrea (Mattoo, Neagu, and Ozden 2008).
MIGRATION OF HEALTHCARE PROFESSIONALS
Among the highly educated people who leave Africa each year, none has triggered more widespread emotion and, at times, controversy than healthcare professionals. Some argue that the exodus of healthcare profes-sionals, especially physicians, has contributed to a decline in healthcare outcomes in many African countries (Bundred and Levitt 2000). There is no question that many African countries with large numbers of emigrant healthcare professionals face severe shortages of healthcare workers. For example, the vacancy rate in Ghana’s public sector health was 47 percent for doctors and 57 percent for nurses in 2002 (Dovlo 2003). Moreover, given the technological and institutional constraints on substitution among medical personnel, the departure of doctors may result in the underemployment of nurses and other auxiliary staff (Commander, Kangasniemi, and Winters 2004). The number of physicians per hundred
migrants had advised a Ghanaian company, and 14 percent had carried out research with people
in Ghana in the past year.
All of the individuals surveyed received their secondary education in Ghana, and many
received their undergraduate education there, too. The main fi scal cost of migration is the lost
income and sales taxes that the country would have earned as a return on this educational invest-
ment. The fi scal benefi t consists of sales taxes on any cash remittances spent in Ghana and the
fi scal expenditure saved by not having to provide government services to migrants. Taking these
factors into account, the net fi scal loss to Ghana of each of these high-skilled individuals living
abroad rather than at home is estimated to be about $5,500–$6,300 a year. This is about equal
to the amount migrants are remitting each year and less than the sum of their remittances and
investments made in home companies. The amount is also small in comparison to the enormous
gains in income that the migrants enjoy from migrating. That said, remittance fl ows and the
income gains accrue to private individuals rather than the government.
Source: Gibson and McKenzie 2010.
Box 3.2 Migration Patterns of Ghana’s Best and Brightest (continued)

130 • Leveraging Migration for Africa: Remittances, Skills, and Investments
thousand people is less than 5 in many African countries, compared with more than 250 in many OECD countries (the destination for the majority of African physician emigrants) (Bhargava and Docquier 2008). In 2004, there were about 25,000 Africa-trained physicians in OECD countries (Bhargava and Docquier 2008), almost one-fourth the total number of physicians practicing medicine in Sub-Saharan Africa—three times the rate in the next-highest region (fi gure 3.12).
Emigration of African physicians has risen signifi cantly since the early 1990s. The number of physicians in Africa increased 61 percent while the number of migrant physicians rose 91 percent. This increase refl ects the increased capacity and improved quality of medical education in Africa, mainly as a result of the intensive focus by domestic governments and the international community on healthcare problems in Africa (fi gure 3.13).
Factors causing African physicians to leave their home countries are similar to those driving other skilled workers from developing coun-tries to migrate to OECD countries. Some issues are more important for healthcare delivery, however, such as the lack of professional develop-ment prospects, insuffi cient postgraduate training opportunities, and poor practice conditions at home, especially regarding facilities, equip-ment, medical supplies, and support staff (Clemens 2007; Bhargava and Docquier 2008). Ghanaian doctors who live abroad cite income and career development as their main reasons for emigrating (box 3.3).
Figure 3.12 Stock of Migrant Physicians in OECD Countries as Percentage of Locally Trained Physicians in Source Region, by World Region
Source: Authors, based on data in Bhargava, and Docquier 2008 and the Medical Skilled Migration database (described in Bhargava, Docquier, and Moullan 2010).
Central Asia
East Europe andformer Soviet Union
Latin Americaand the Caribbean
Middle East andNorth Africa
East Asia
South Asia
Africa
0.0 5.0 10.0 15.0 20.0 25.0
percent

Migration of the Highly Skilled • 131
The destination choices of African physicians are similar to those of other African professionals but even more biased in favor of English-speaking countries. The United Kingdom, the United States, Canada, and Australia account for more than 85 percent of African physicians in OECD countries, with the United Kingdom alone accounting for 55 percent (fi gure 3.14). Ireland is the fi fth-largest destination for African physicians among OECD countries. A larger number of physicians in developing countries are trained in or fl uent in English when compared to other languages. The practice of medicine requires interaction with other professionals and patients. As a result, English-speaking countries become natural destinations for physicians from developing countries. The prin-cipal language still has some infl uence: France and Belgium, for example, are the dominant destinations for physicians from francophone countries. The fact that the United States receives a signifi cant share of physicians from francophone countries suggests that, in some cases, economic prospects and selective immigration policies can supersede language and colonial links as determining factors.
Policies also play an important role in infl uencing destination choices. Destination countries that emphasize the attraction of high-skilled labor tend to receive more emigrant physicians. Profession-specifi c laws and regulations regarding foreign-trained doctors are also important; regu-latory criteria that discriminate against foreign-trained doctors impede
Figure 3.13 Number of African-Trained Physicians in Africa and in OECD Countries, 1991–2004
Source: Authors, based on data in Bhargava and Docquier 2008 and the Medical Skilled Migration database (described in Bhargava, Docquier, and Moullan 2010).
1991 1992 1993 1994 1995 1996 1997 1998 1999 2001 2002 2003 20042000
140
120
100
80
60
40
20
10
30
25
20
15
10
5
0
Thou
sand
s
Thou
sand
s
Total physicians
Migrant physicians

132 • Leveraging Migration for Africa: Remittances, Skills, and Investments
Box 3.3 Ghana: A Case Study of Emigrant Physicians
The exodus of Ghanaian doctors is not new. Its roots go back to the 1930s, when a scholarship
scheme that was established to train African medical doctors in the United Kingdom planted the
seeds for the fi rst physician migration from Ghana. For at least 20 years, medical schools in Ghana
included study in the United Kingdom as an offi cial component of the medical program. As a
result, in 2004 nearly one of every three Ghanaian doctors worked in an OECD country, mostly in
the United States and the United Kingdom. A 1999 study estimates that of the 489 physicians who
graduated from the University of Ghana between 1985 and 1994, less than 40 percent remained in
the country; more than half went to the United Kingdom and about a third to the United States
(Dovlo and Nyonator 1999). The number of migrant physicians grew steadily from 1991 to 2004,
albeit at a slower pace than that of domestic physicians (box fi gure 3.3.1).
Box fi gure 3.3.1 Number of Ghanaian Physicians at Home and Abroad, 1991–2004
Source: Bhargava and Docquier 2008.
The United States is the largest destination, accounting for 41 percent of all Ghanaian doctors
abroad, followed by the United Kingdom, with 39 percent (box fi gure 3.3.2). The large share of
the United States and the United Kingdom is to be expected given the language factor and the
colonial links to the United Kingdom. Data on Ghanaian doctors in Australia and South Africa,
other likely destination countries, were not available and are not included in these fi gures.
0
200
400
600
800
1,000
1,200
1,400
1,600
1,800
2,000
1991 1992 1993 1994 1995 1996 1997 1998 1999 2000 2001 2002 2003 2004
Total physiciansTT
Num
ber o
f phy
sici
ans
Immigrant physicians
migration. For example, in the United States, foreign-trained doctors need to complete their residency there, regardless of their prior specializations. Despite this requirement the United States is the most important destina-tion for foreign-trained doctors; without it, the number of foreign-trained doctors would be even greater.

Migration of the Highly Skilled • 133
Box 3.3 Ghana: A Case Study of Emigrant Physicians (continued)
Box fi gure 3.3.2 Distribution of Ghanaian Physicians in OECD Countries, 2004
Source: Ozden 2010.
A World Bank survey of Ghanaian physicians in the United Kingdom and the United States
offers important insights not only into the demographic attributes of the migrant doctors but also
about factors that infl uenced their decision to migrate. The top reasons cited by Ghanaian doc-
tors for leaving their home country were related to income and career development. More than
90 percent of respondents said they left the country to pursue their specialization. More than 40
percent of respondents cited concerns about instability in Ghana as one of the top fi ve reasons
for leaving the country.
Sub-Saharan Africa experienced high emigration rates by health profes-sional between 1991 and 2004. But rates varied widely across countries. In absolute numbers, a small group of countries—generally the largest in terms of population—are the source of the vast majority of migrant physicians in OECD countries. The main reason is that these countries also have the largest supply of physicians. Five countries—South Africa, Nigeria, Sudan, Ghana, and Ethiopia—accounted for more than 87 percent of all African physicians in OECD countries; South Africa alone accounted for 60 percent of the total stock of migrant physicians in 2004 (Docquier and Marfouk 2007).
These countries are not necessarily the ones facing the highest rates of migration as a share of the existing physician stock. Most countries with high emigration rates for physicians (rates of more than 10 percent) experienced an increase in migration rates between 1991 and 2004 (fi gure 3.15). Small countries were most affected. Cape Verde had the highest rate
Canada
Germany
Australia
United Kingdom
Rest of Europe
United States
42%
39%
10%
4%
4%1%

134 • Leveraging Migration for Africa: Remittances, Skills, and Investments
Figure 3.14 Number of African Physicians Working in Selected OECD Countries, 1991 and 2004
Source: Authors, based on data in Bhargava and Docquier 2008 and the Medical Skilled Migration database (described in Bhargava, Docquier, and Moullan 2010).
0 2,000 4,000 6,000 8,000
Number of physicians
10,000 12,000 14000 16,000
Sweden
France
Belgium
Germany
Portugal
Italy
Ireland
New Zealand
Australia
Canada
United States
United Kingdom
1991
2004
Figure 3.15 African Countries with Highest Rates of Physician Emigration, 1991 and 2004
Source: Authors, based on date in Bhargava and Docquier 2008 and the Medical Skilled Migration database (described in Bhargava, Docquier, and Moullan 2010).
1991
2004
perc
ent
0
10
20
30
40
50
60
Cape V
erde
São T
ome a
nd Pr
íncipe
Liberi
a
Malawi
Zimba
bwe
Ghana
Somali
a
Ugand
a
Ethiop
ia
Zambia
Suda
n
Angola
Tanz
ania
Togo
Guinea
Camero
on
Sierra
Leon
eEri
trea
Nigeria
Kenya
Rwanda
Mauriti
us
Congo
, Rep
.
Gambia
, The
South
Africa

Migration of the Highly Skilled • 135
of physician migration (55 percent), followed by São Tomé and Príncipe (45 percent).
The reasons behind these variations are similar to those for overall tertiary-educated fl ows. Smaller and poorer countries provide fewer pro-fessional and fi nancial opportunities; in many cases, they do not even have medical schools and thus have to send their students abroad for medical training, at a great fi scal expense in many cases.
Data on the migration behavior of nurses are more limited, but stud-ies indicate that their migration rates are also very high. In 2004, 17 Sub-Saharan African countries saw emigration rates of 20 percent or higher among locally trained nurses (fi gure 3.16). Many of the countries with high physician emigration rates also have high nurse emigration rates, suggesting that the same factors may infl uence the migration decisions of all healthcare professionals. For example, emigration rates of nurses from Cape Verde and São Tomé, which have the two highest rates of migration among physicians, were about 40 percent. In Liberia, 40 percent of doc-tors and 80 percent of nurses emigrated.
IMPACT OF MIGRATION OF HEALTHCARE PROFESSIONALS
Consensus is slowly emerging on the extent of migration of physicians and other healthcare professionals from Africa. There is much less agree-ment on the overall impact on Africa’s health outcomes. Anand and Bärnighausen (2004) performed a cross-country analysis of maternal mortality, infant mortality, and under-fi ve mortality rates. Their results suggest that the density of human resources for healthcare is signifi -cant in accounting for the three mortality rates tested, with elasticities ranging from –0.39 to –0.17. A later study by the same authors using a similar method suggests that healthcare worker density is correlated with the coverage of three vaccinations (MCV, DTP3, and polio3).4 When the impact of doctors and nurses is assessed separately, Anand and Bärnighausen fi nd that only nurse density is positively associated with the three vaccinations.
Clemens (2007) tests the hypothesis that decreases in emigration raise the number of domestic healthcare professionals, increases the mass availability of basic primary care, and improves a range of public health outcomes. His results suggest that Africa’s generally low staffi ng levels and poor public health conditions are the result of factors—such as the segmentation of labor markets for healthcare workers—entirely unrelated to international movements of health professionals. He argues that emigration has increased the production of healthcare workers in

136 • Leveraging Migration for Africa: Rem
ittances, Skills, and Investments
Figure 3.16 Migration Rates among Nurses, by Country, 2000
Source: Clemens and Pettersson 2006.
perc
ent
Liberi
aBuru
ndi
Gambia
Mauriti
us
Sierra
Leon
eCap
e Verd
e
Equa
torial
Guin
eaEri
trea
Seych
elles
Madag
ascar
Sene
gal
Ghana
Zimba
bwe
Comoro
sCam
eroon
Mozam
bique
Togo
Ethiop
iaMala
wiMali
Morocco
Rwanda
Angola
Benin
Congo
, Dem
. Rep
.
Congo
, Rep
.Nige
riaCha
dSo
malia
Ugand
aAlge
riaZa
mbiaKen
ya
Côte d’
Ivoire
Maurita
niaGab
onGuin
eaNam
ibia
South
Africa
Tunis
iaTa
nzan
iaLe
sotho
Swaz
iland
Botswan
a
Burkina
Faso
Djibou
tiLib
yaNige
r
Egyp
t, Arab
Rep.
Suda
n
Guinea
-Bissau
Centra
l Afric
an Rep
ublic
São T
omé &
Prínc
ipe
0
10
20
30
40
50
60
70
80
90

Migration of the Highly Skilled • 137
Africa. He highlights the various benefi ts associated with migration, such as remittances.
Bhargava, Docquier, and Moullan (2010) analyze the effect of physi-cian migration on child mortality and vaccination levels, using a random effects model. Their more nuanced results indicate that many health indicators improve with physician levels when adult literacy levels exceed 55 percent. They demonstrate the importance of the complex linkages among migration, development, and the overall social and economic environment of the country in question and show that the number of physicians in a country is only one of the inputs into the provision of health services. Stopping their migration, they conclude, would have a positive but small impact on the overall human development indicators they analyze.
POLICY OPTIONS
One of the main developmental challenges African countries face—more critical than high-skilled emigration—is low levels of human capital. How to increase human capital, given limited resources, is a complex problem, well beyond the scope of this book. The main focus in this section is on policy choices governing tertiary-educated migration. These choices can be divided along two main dimensions: What stage of a migrant’s profes-sional career should be targeted by the policies—before or after education is obtained? Who implements the policies—sending countries or destina-tion countries, mostly in the OECD?
Two educational issues are most relevant for international migration: tuition policies and the type of education offered. In regard to policies governing tuition, a dilemma exists. Careers in medicine, engineering, and other technical subjects are fast becoming global, and professionals in these fi elds are in high demand in destination countries. Training in these fi elds also tends to be the most costly. Requiring students to pay for a portion of the cost of their training seems only fair, especially if the stu-dents will migrate soon after graduation. This option is frequently recom-mended, especially on economic effi ciency grounds (Clemens 2009). Tui-tion levels that refl ect the actual cost of education would sharply restrict the number of graduates and limit eligibility to the rich, however, because most of the origin countries lack credit markets to fi nance education. Limited access to fi nance, which is especially acute in African countries (Gurgand, Lorenceau, and Melonio 2011), would result in many highly qualifi ed African students being unable to obtain professional education. Furthermore, as professionals in science, technology, and medicine are

138 • Leveraging Migration for Africa: Remittances, Skills, and Investments
the ones generating positive externalities, it would make sense to subsi-dize their education from public funds.
One potential solution is a two-tiered tuition system, similar to the one currently implemented in medical schools in Ghana. It involves partial (or full) cost recovery for a portion of students and free tuition for the rest, where eligibility depends on academic merit, public service requirements, or both. This system may generate extra revenue, which, in turn, would raise the supply of students, reduce the reliance on govern-ment funding, or both. Because a large portion of the fi nancial gain from migration accrues to migrants and their social networks, a partial ex ante recovery of the cost of the education is also economically effi cient.
Another alternative is for governments to offer merit-based scholar-ships for students who otherwise could not afford education. Scholar-ships could substitute for direct public funding; if structured to include certain conditions, they could help stem emigration.
The potential for migration may also infl uence the type of education provided. A frequently suggested policy is to change the education mix—for example, by training physicians’ assistants rather than physicians or health aides rather than nurses. One example concerns “health surveil-lance assistants” in Malawi, who require limited training. The fi rst effect of such change is to increase the overall number of healthcare workers, as the training costs per student are signifi cantly lower than the costs of training higher-level healthcare workers. Because many critical services, such as the immunization of children, can be provided by nurses or other healthcare workers, an increase in the number of healthcare profes-sionals may increase the delivery of such services and improve certain outcomes. The second effect is that migration rates may decline, because the demand for such professionals is likely to be lower in the destination OECD countries. Such policy suggestions can be controversial and may have serious negative welfare implications, however, such as prompting an explicit trade-off between quantity and quality (Soucat and Scheffl er forthcoming). Such a trade-off is found in many countries where services are of high quality only in rich and urban areas, at the cost of poor and rural areas.
Another group of policies takes effect after the education of potential migrants is completed. South Africa requires several years’ service in rural areas after graduation from medical schools. Ghana has experimented with bonding schemes to require some medical professionals to pay back a part of the government-funded tuition if they fail to serve for a number of years after graduation. Except for nursing, however, payment levels were set so low that they did not cover the cost of the education and did not discourage doctors from immigrating—most doctors working abroad

Migration of the Highly Skilled • 139
simply paid off the bond instead of completing the service requirements (Awumbila 2010). Such bond requirements, if imposed at all, should be structured so that they do not signifi cantly reduce the demand for educa-tion or encourage immediate migration to escape from the requirement.
An alternative is to impose additional taxes/payments on migrants (generally referred to as the Bhagwati tax).5 Although such a practice sounds effi cient and fair, in practice it may be diffi cult to impose and enforce, because the cooperation of destination countries’ government or courts may be needed (see Wilson 2009 for a detailed analysis).
Ghana has sought to curb the emigration of medical professionals by offering higher salaries and professional opportunities (box 3.4). But there is no convincing evidence of the cost-effectiveness of such policies, given the vast wage gaps between the destination and origin countries.6
Another alternative that has been suggested is to restrict travel, by refusing to issue passports or diplomas to students and recent graduates. These policies are not likely to be effective; they also violate basic princi-ples of human rights.
Other policies that repeatedly appear in policy discussions aim to encourage the return of professionals. Among the incentives provided
Box 3.4 Incentives to Retain Health Professionals in Ghana
The Ghanaian Ministry of Health established incentive schemes to keep medical professionals in
the country. The program consisted of several components. First, it reduced the need for special-
ized training outside the country by establishing the Ghana College of Physicians and Surgeons.
The college has increased the supply of labor in remote districts, as part of the training is con-
ducted in hospitals outside of Accra.
Second, since 1999 a program called the Additional Duty Hours Allowance (ADHA) has, for
the fi rst time, compensated doctors and nurses for hours worked beyond their normal schedules.
The program was initially successful among doctors, but it was considered demotivating for
nurses, whose salaries were low, in particular in comparison with what doctors earned (Buchan
and Dovlo 2004). Moreover, the program became too expensive: by 2005, ADHA payments and
salaries accounted for 97 percent of total government health expenditures and 67 percent of total
government and donor health expenditures. As a result, in 2006 ADHA was replaced by a compre-
hensive salary regime (the health sector salary scheme) that removed the health sector from the
general Ghanaian salary structure and raised overall salaries.
Third, the government provided health professionals in deprived districts an additional allow-
ance equal to 20 –35 percent of their monthly salaries. Each district’s level of deprivation was
based on the lack of electricity, potable water, all-weather roads, and adequate basic education.
The policy did not succeed in attracting more health professionals to the targeted districts, largely
because healthcare workers in urban areas could supplement their government salaries by taking
highly paid, part-time jobs at private health clinics.
Source: Awumbila 2010.

140 • Leveraging Migration for Africa: Remittances, Skills, and Investments
are efforts to help returnees fi nd jobs and to subsidize housing or return expenses. To stem the loss of its healthcare workers, Kenya provided incentives including paid leave, overtime pay, housing support, car loans, transport allowances, life insurance, shortened working hours, and better healthcare coverage (Ndetei, Khasakhala, and Omolo 2008). In Zam-bia, more training opportunities may have led to higher retention rates (Mathauer and Imhoff 2006).
Migration policies to provide subsidies or other incentives to return migrants are popular, but there is no systematic evidence of their effective-ness. Thorn and Holm-Nielson (2008) fi nd that although adequate pay is necessary, the primary determinants of decisions to return include the quality of the research environment, professional reward structures, and access to state-of-the-art equipment. Financial incentives are also likely to create distortions, such as penalizing professionals who never migrated or subsidizing returnees who were planning to return even in the absence of the incentives. In addition, such policies may result in adverse selection, with the least skilled returning and the more skilled remaining abroad. One simple policy that can provide signifi cant benefi ts at low fi scal cost would be to remove certain biases against returning professionals that exist in professional regulations or government employment, by, for example, adequately recognizing qualifi cations and experience obtained abroad.
Destination-country policies are also important in determining the size and composition of migrant fl ows. Many OECD countries imple-ment selective policies that target highly skilled and educated migrants, making their entry and assimilation as easy as possible. Such policies range from providing special visas for the highly educated to citizenship laws, recognition of professional qualifi cations, and provision of access to public services such as education and healthcare. The increase in demand for high-skilled workers in the United States has been fi lled through per-manent employer-based resident permits (“green cards”) for individuals with advanced degrees in science and technology, temporary H-1B visas for high-skilled workers, and intracompany transfer (L1) visas. Australia, Canada, and New Zealand award higher points for highly educated applicants for work permits. And the European Union (EU) is consider-ing creating a “blue card,” which would grant high-skilled professionals selected through a points-based system unrestricted access to EU labor markets after an initial period in the host country.
Because OECD countries are the main benefi ciaries of the migration of professionals trained by public funds in African countries, there is some justice in asking them to subsidize the education expenses in the origin countries. Provision of such assistance must be additional to other forms

Migration of the Highly Skilled • 141
of assistance if it is to compensate countries of origin for the fi scal loss associated with high-skilled emigration.7 A similar scheme might involve the provision of scholarships for students from developing countries to study at universities in destination countries. Most students, however, use such programs as entry points into the labor markets of the destination countries, as current experience shows.
Among the most popular postgraduation policies debated are the ones centered on the recruitment policies of destination countries. As a result of public pressure, many OECD governments (such as that of the United Kingdom) impose “ethical” recruitment policies, especially for medical professionals. Such policies have had limited effectiveness (Bach 2008). Infl ows of nurses from some of the poorest countries in Sub-Saharan Africa (such as Malawi and Swaziland), which are prohibited by the U.K. code of practice, have continued.8
A potential policy measure is a cooperation arrangement under which OECD governments would agree to help African governments enforce their service or taxation requirements or impose their own additional taxes to be remitted to African governments. No destination country would want to impose such taxes unilaterally, however, for fear of divert-ing migrant professionals to other destination countries that do not implement them. Furthermore, enforcement in many countries might face institutional and legal obstacles.
The debate on policies regarding skilled migration takes place in the absence of detailed and systematic empirical analysis. Not only is it unclear what the policy parameters need to be, in many cases it is not obvious whether any migration-related policy should be implemented at all. For example, if the main constraints in the delivery of healthcare are equipment and facilities, then any policy aiming to limit migration of physicians or other professionals is unlikely to generate an improvement in welfare. In this case, the remittances sent home by migrants or the pro-fessional links they establish may benefi t their country of origin.
Policies restricting mobility directly or through educational restric-tions are extremely distortionary and violate simple human freedoms. Moreover, anecdotal evidence suggests that they are unlikely to work. In cases where limited mandatory service requirements are imposed, the terms and duration need to be carefully chosen in order not to create the perverse effect of encouraging migration to avoid such burdens. Where the goal is cost recovery, such policies should probably be implemented ex ante rather than ex post through additional taxation, which is diffi cult to enforce.
Policies set by destination countries are even less likely to be effective, but additional subsidies to educational institutions in origin countries
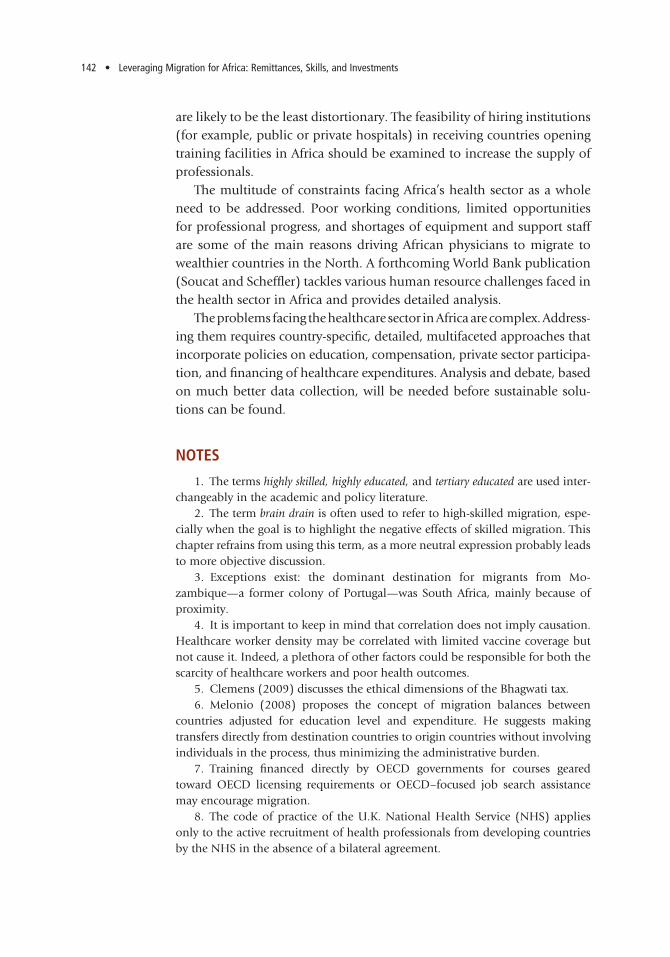
142 • Leveraging Migration for Africa: Remittances, Skills, and Investments
are likely to be the least distortionary. The feasibility of hiring institutions (for example, public or private hospitals) in receiving countries opening training facilities in Africa should be examined to increase the supply of professionals.
The multitude of constraints facing Africa’s health sector as a whole need to be addressed. Poor working conditions, limited opportunities for professional progress, and shortages of equipment and support staff are some of the main reasons driving African physicians to migrate to wealthier countries in the North. A forthcoming World Bank publication (Soucat and Scheffl er) tackles various human resource challenges faced in the health sector in Africa and provides detailed analysis.
The problems facing the healthcare sector in Africa are complex. Address-ing them requires country-specifi c, detailed, multifaceted approaches that incorporate policies on education, compensation, private sector participa-tion, and fi nancing of healthcare expenditures. Analysis and debate, based on much better data collection, will be needed before sustainable solu-tions can be found.
NOTES
1. The terms highly skilled, highly educated, and tertiary educated are used inter-changeably in the academic and policy literature.
2. The term brain drain is often used to refer to high-skilled migration, espe-cially when the goal is to highlight the negative effects of skilled migration. This chapter refrains from using this term, as a more neutral expression probably leads to more objective discussion.
3. Exceptions exist: the dominant destination for migrants from Mo -zambique—a former colony of Portugal—was South Africa, mainly because of proximity.
4. It is important to keep in mind that correlation does not imply causation. Healthcare worker density may be correlated with limited vaccine coverage but not cause it. Indeed, a plethora of other factors could be responsible for both the scarcity of healthcare workers and poor health outcomes.
5. Clemens (2009) discusses the ethical dimensions of the Bhagwati tax.6. Melonio (2008) proposes the concept of migration balances between
countries adjusted for education level and expenditure. He suggests making transfers directly from destination countries to origin countries without involving individuals in the process, thus minimizing the administrative burden.
7. Training fi nanced directly by OECD governments for courses geared toward OECD licensing requirements or OECD–focused job search assistance may encourage migration.
8. The code of practice of the U.K. National Health Service (NHS) applies only to the active recruitment of health professionals from developing countries by the NHS in the absence of a bilateral agreement.

Migration of the Highly Skilled • 143
BIBLIOGRAPHY
Acosta, Pablo, Pablo Fjanzylber, and J. Humberto Lopez. 2007. “The Impact of Remittances on Poverty and Human Capital: Evidence from Latin American Household Surveys. In International Migration, Economic Development and Policy, ed. Caglar Ozden and Maurice Schiff. Washington, DC, and New York: World Bank and Palgrave MacMillan.
Anand, Sudhir, and Till Bärnighausen, 2004. “Human Resources and Health Out-comes: Cross-Country Econometric Study.” Lancet. 364 (9445): 1603–09.
Angel-Urdinola, Diego F., Taizo Takeno, and Quentin Wodon. 2008. “Student Migration to the United States and Brain Circulation-Issues, Empirical Results, and Programmes in Latin America.” In The International Mobility of Talent: Types, Causes and Development Impacts, ed. Andres Solimano. Oxford: Oxford University Press.
Awumbila, Mariama. 2010. Mobility of Health Professionals from Selected African Countries to the European Union (MOHPROF) Project. Revised Ghana National Report (Macro Research) submitted to the International Organization for Migration, Regional Offi ce for Southern Africa, South Africa.
Bach, Stephen. 2008. “International Mobility of Health Professionals: Brain Drain or Brain Exchange?” In The International Mobility of Talent: Types, Causes and Development Impacts, ed. Andres Solimano. Oxford: Oxford University Press.
Beine, Michel, Frédéric Docquier, and Caglar Ozden. 2001. “Diasporas.” Journal of Development Economics 95 (1): 30–41.
Beine, Michel, Frédéric Docquier, and Hillel Rapoport. 2001. “Brain Drain and Economic Growth: Theory and Evidence.” Journal of Development Economics 64 (1): 275–89.
Bhargava, Alok, and Frédéric Docquier. 2008. “HIV Pandemic, Medical Brain Drain, and Economic Development in Sub-Saharan Africa.” World Bank Eco-nomic Review 22 (2): 345–66.
Bhargava, Alok, Frédéric Docquier, and Yasser Moullan. 2010. “Modeling the Effect of Physician Emigration on Human Development.” http://www.ncbi.nlm.nih.gov/pubmed/21288783.
Buchan, James, and Delanyo Dovlo. 2004. International Recruitment of Health Workers to the UK: A Report for DFID. London: Department for International Development Health Systems Resource.
Bundred, Peter E., and Cheryl Levitt. 2000. “Medical Migration: Who are the Real Losers?” Lancet 356 (8225): 245–46.
Chand, Satish, and Michael Clemens. 2008. “Skilled Emigration and Skill Crea-tion: A Quasi-Experiment.” Working Paper 152, Center for Global Develop-ment, Washington, DC.
Clemens, Michael. 2007. “Do Visas Kill? Health Effects of African Health Pro-fessional Emigration.” Working Paper 114, Center of Global Development, Washington, DC.
———. 2009. “Skill Flow: A Fundamental Reconsideration of Skilled-Worker Mobility and Development.” Working Paper 180, Center of Global Develop-ment, Washington, DC.
Clemens, Michael, Claudio E. Montenegro, and Lant Pritchett. 2008. “The Place Premium: Wage Differences for Identical Workers across the U.S. Border.” Working Paper 148, Center for Global Development, Washington, DC.

144 • Leveraging Migration for Africa: Remittances, Skills, and Investments
Clemens, Michael, and Gunilla Pettersson. 2006. “New Data on African Health Professionals Abroad.” Working Paper 95, Center for Global Development, Washington, DC.
Commander, Simon, Mari Kangasniemi, and L. Alan Winters. 2004. “The Brain Drain: Curse or Boon? A Survey of the Literature.” In Challenges to Globalization: Analyzing the Economics, ed. Robert E. Baldwin and L. Alan Winters, 235–78. Cambridge, MA: National Bureau of Economic Research.
Coulombe, Serge, and Jean-François Tremblay. 2009. “Migration and Skills Dis-parities across the Canadian Provinces.” Regional Studies 43 (1): 5–18.
Docquier, Frédéric, and Abdeslam Marfouk. 2007. “International Migration by Education Attainment, 1990–2000.” In International Migration, Remittances and the Brain Drain, ed. Ozden Caglar and Maurice Schiff. Washington, DC, and New York: World Bank and Palgrave Macmillan.
Docquier, Frédéric, Abdeslam Marfouk, Caglar Ozden, and Christopher Parsons. 2010. “Geographic, Gender and Skill Structure of International Migration.” Université Catholique de Louvain, Belgium.
Docquier, Frédéric, and Hillel Rapoport. 2009. “Skilled Immigration: The Per-spective of Developing Countries.” Skilled Immigration Today, ed. Jagdish Bhag-wati and Gordon Hanson. New York: Oxford University Press.
Dovlo, Delanyo. 2003. “The Brain Drain and Retention of Health Professionals in Africa.” Case study prepared for the Regional Training Conference “Improving Tertiary Education in Sub-Saharan Africa: Things That Work!” World Bank, Accra, Ghana, September 23–25.
Dovlo, Delanyo, and Frank Nyonator. 1999. “Migration by Graduates of the University of Ghana Medical School: A Preliminary Rapid Appraisal.” Human Resources for Health 3 (1): 40–51.
Dustmann, Christian, Itzhak Fadlon, and Yoram Weiss. 2010. “Return Migra-tion, Human Capital Accumulation, and the Brain Drain.” April. Draft paper prepared for the Multi-Donor Trust Fund on Labor Markets, Job Creation, and Economic Growth administered by the World Bank’s Social Protection and Labor Unit, Washington, DC.
Easterly, William, and Yaw Nyarko. 2009. “Is the Brain Drain Good for Africa?” Skilled Immigration Today, ed. Jagdish Bhagwati and Gordon Hanson. New York: Oxford University Press.
Fajnzylber, Pablo, and J. Humberto Lopez. 2007. Close to Home: The Development Impact of Remittances in Latin America. World Bank, Washington, DC. http://www.almendron.com/politica/pdf/2006/8845.pdf
Gibson, John, and David McKenzie. 2010. “The Economic Consequences of “Brain Drain” of the Best and Brightest: Microeconomic Evidence from Five Countries.” World Bank Policy Research Working Paper 5394, Washington, DC.
Grogger, Jeffrey, and Gordon Hanson. Forthcoming. “Income Maximization and the Selection and Sorting of International Migrants.” Journal of Development Economics.
Gurgand, Marc, Adrien Lorenceau, and Thomas Melonio. 2011. Student Loans: Liquidity Constraint and Higher Education in South Africa. Paris: Agence Française de Développement.
Mathauer, Inke, and Ingo Imhoff. 2006. “Health Worker Motivation in Africa: The Role of Non-fi nancial Incentives and Human Resource Management Tools.” Human Resources for Health 4 (24): 1–17.

Migration of the Highly Skilled • 145
Mattoo, Aaditya, Ileana Cristina Neagu, and Caglar Ozden. 2008. “Brain Waste? Educated Immigrants in the U.S. Labor Market.” Journal of Development Eco-nomics 87 (2): 255–69.
Melonio, Thomas. 2008. “Migration Balances Concept, Hypotheses and Discus-sion.” Working Paper 74, Agence Française de Développement, Paris.
Mountford, Andrew. 1997. “Can a Brain Drain Be Good for Growth in the Source Country?” Journal of Development Economics 53 (2): 287–303.
Ndetei, David M., Lincoln Khasakhala, and Jacob O. Omolo. 2008. “Incentives for Health Worker Retention in Kenya: An Assessment of Current Practice.” Equinet Discussion Paper 62, Harare, Zimbabwe.
Ozden, Caglar. 2010. “Ghanaian Physicians Abroad and at Home.” Development Economics Research Group, World Bank, Washington DC.
Solimano, Andres. 2008. The International Mobility of Talent: Types, Causes and Development Impacts. Oxford: Oxford University Press.
Soucat, Agnes, and Richard Scheffl er. Forthcoming. Human Resource for Health in Africa: A New Look at the Crisis. World Bank, Washington, DC.
Stark, Oded. 2004. “Rethinking the Brain Drain.” World Development 32 (1): 15–22.
Stark, Oded, C. Helmenstein, and A. Prskawetz. 1997. “A Brain Gain with a Brain Drain.” Economics Letters 55 (2): 227–34.
Thorn, Kristian, and Lauritz B. Holm-Nielson. 2008. “International Mobility of Researchers and Scientists: Policy Options for Turning a Drain into a Gain.” In The International Mobility of Talent: Types, Causes and Development Impacts, ed. Andrés Solimano. Oxford: Oxford University Press.
Wahba, Jackline. 2007. “Returns to Overseas Work Experience: The Case of Egypt.” In International Migration, Economic Development and Policy, ed. Caglar Ozden and M. Schiff. Washington, DC, and New York: World Bank and Pal-grave Macmillan.
Wilson, John. 2009. “Income Taxation and Skilled Migration: The Analytical Issues.” In Skilled Immigration Today, ed. Jagdish Bhagwati and Gordon Han-son. New York: Oxford University Press.
World Bank. 2006. Global Economic Prospects: Economic Implications of Remittances and Migration. Washington, DC: World Bank.


147
CHAPTER
Harnessing the Resources of the Diaspora
4
147
A frican countries have large diaspora groups living in and outside Africa. The potential contribution of the diaspora to the conti-nent’s development goes far beyond the personal remittances dis-
cussed in chapter 2. These contributions range from collective remittances that fund philanthropic activities to knowledge exchange, increased trade links, and better access to foreign capital markets (for example, through diaspora bonds). This chapter reviews the evidence on how the African diaspora contributes to the economic development of countries of origin and offers recommendations on how African governments can support these efforts.
Several important fi ndings emerge from this chapter:
• Efforts to understand the size and characteristics of the diaspora should be a high priority for developing countries interested in harnessing diaspora resources. Lack of adequate data impairs efforts to increase the contri-butions diasporas can make to origin countries. The size of the African diaspora is larger than the offi cial estimate of 30.6 million migrants. Many migrants are not counted in national surveys, especially within Africa, and many descendants of migrants still have emotional ties to the country of their ancestors. Case studies indicate that networks of diaspora families and friends send funds for development purposes, such as constructing schools, providing supplies to schools or hos-pitals, supporting orphans, and supporting small-scale projects, but little is known about the scale or impact of such activities.
• Diasporas facilitate cross-border trade, investment, and access to advanced technology and skills. Diaspora networks play an important role in cross-border exchanges of market information about trade and regula-tions. Diaspora members may also invest directly in origin countries

148 • Leveraging Migration for Africa: Remittances, Skills, and Investments
or provide their expertise to assist investments by multinational fi rms. Compared with other foreign investors, members of diasporas may accept lower interest rates on loans to home countries, because they have emotional ties to home countries, because better access to information may allow them to discount the risk premium relative to other foreign investors, and because they may have local currency liabilities that make them less worried than other investors about the potential for currency devaluation or the forced conversion of assets denominated in foreign currencies to local currencies. Diaspora bonds targeted to nationals residing abroad can open opportunities for investment and facilitate investment in their home countries.
• Diasporas may also provide origin countries access to advanced technology and scarce skills. The role of the diaspora in technology transfer is well documented in many countries, particularly China and India. In con-trast, the evidence for African countries is limited.
• Harnessing diaspora contributions to trade, investment, and technology requires a supportive business climate. Diaspora members may be more willing than other investors to take risks in their own country. Invest-ment by them nevertheless requires a conducive business environ-ment, including property rights, security, elimination of red tape, and good infrastructure. Providing voting rights and dual citizenship to migrants can help maintain their ties to origin countries. Dual citizen-ship can also encourage trade and investment, by enabling migrants to avoid constraints on business activities faced by foreigners. The devo-tion of more staff in embassies to diaspora issues and adequate train-ing of these staff would facilitate better services and enhance linkages. Better coordination among different departments within embassies and governments would increase effi ciency in building relationships with diasporas and their networks.
The chapter is organized as follows. The fi rst section presents a short overview of where the African diaspora is located. The second section dis-cusses how countries benefi t from diasporas, though trade, fi nance, and the transfer of technology. The third section recommends policies that African countries and destination countries could consider to increase the diasporas’ contribution to development.
LOCATING THE AFRICAN DIASPORA
Estimating the size of the African diaspora is diffi cult, because of incom-plete data and differences in the defi nitions of migrants and the diaspora

Harnessing the Resources of the Diaspora • 149
(box 4.1). This chapter uses a narrow but convenient defi nition of the diaspora as “people born in another country.” This defi nition captures only fi rst-generation migrants; it excludes children and grandchildren, who may have ties to the origin country. The chapter’s conclusions should hold, however, irrespective of the defi nition of the diaspora.
As noted in chapter 1, offi cial data estimate the stock of international emigrants from African countries at 30.6 million in 2010. Of these migrants, more than 14 million African migrants live within Africa. For example, large numbers of immigrants from Burundi and the Democratic Republic of Congo live in Tanzania; Somalis are still living in Kenya; and Lesotho, Mozambique, and Zimbabwe have many migrants in South Africa.
A large number of African migrants are also living in high-income OECD countries. France, Saudi Arabia, the United States, and the United
Box 4.1 Defi ning Diasporas
A diaspora can be defi ned as people who have migrated and their descendents who maintain a
connection to their homeland. The U.S. Department of State defi nes diasporas as migrant groups
that share the following features:
• dispersion, whether voluntary or involuntary, across sociocultural boundaries and at least one
political border
• a collective memory and myth about the homeland
• a commitment to keeping the homeland alive through symbolic and direct action
• the presence of the issue of return, although not necessarily a commitment to do so
• a consciousness and associated identity, expressed in diaspora community media, the creation
of diaspora associations or organizations, and online participation (U.S. Department of State
2010).
This defi nition is different from the defi nition used by the African Union, which defi nes the
African diaspora as “consisting of people of African origin living outside the continent, irrespec-
tive of their citizenship and nationality and who are willing to contribute to the development of
the continent and the building of the African Union” (African Union 2005, p. 6).
Estimating the size of a diaspora is complicated by several factors, including place of birth,
time of emigration, citizenship, and questions of identity (Ionescu 2006). For example, estimates
of U.S.–based diasporas are constructed using the “place of birth for the foreign-born popula-
tion” available from the U.S. census. Most European countries in the Organisation for Economic
Co-operation and Development (OECD), Japan, and the Republic of Korea classify immigrants
based on the ethnicity of the parent, which results in higher estimates of the stock of immigrants
than does classifi cation based on place of birth. Temporary immigrants may be considered as part
of a diaspora but may not be captured in immigration statistics. Origin countries also use differ-
ent defi nitions of diasporas. India, for example, uses three categories: nonresident Indian (NRI),
person of Indian origin (PIO), and overseas citizenship of India (OCI).
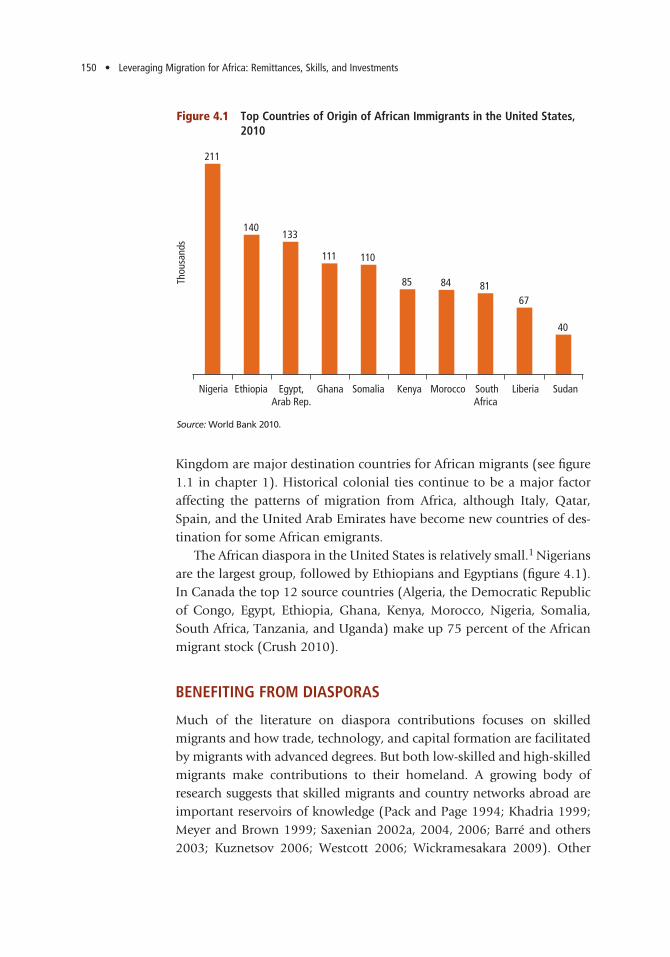
150 • Leveraging Migration for Africa: Remittances, Skills, and Investments
Kingdom are major destination countries for African migrants (see fi gure 1.1 in chapter 1). Historical colonial ties continue to be a major factor affecting the patterns of migration from Africa, although Italy, Qatar, Spain, and the United Arab Emirates have become new countries of des-tination for some African emigrants.
The African diaspora in the United States is relatively small.1 Nigerians are the largest group, followed by Ethiopians and Egyptians (fi gure 4.1). In Canada the top 12 source countries (Algeria, the Democratic Republic of Congo, Egypt, Ethiopia, Ghana, Kenya, Morocco, Nigeria, Somalia, South Africa, Tanzania, and Uganda) make up 75 percent of the African migrant stock (Crush 2010).
BENEFITING FROM DIASPORAS
Much of the literature on diaspora contributions focuses on skilled migrants and how trade, technology, and capital formation are facilitated by migrants with advanced degrees. But both low-skilled and high-skilled migrants make contributions to their homeland. A growing body of research suggests that skilled migrants and country networks abroad are important reservoirs of knowledge (Pack and Page 1994; Khadria 1999; Meyer and Brown 1999; Saxenian 2002a, 2004, 2006; Barré and others 2003; Kuznetsov 2006; Westcott 2006; Wickramesakara 2009). Other
Figure 4.1 Top Countries of Origin of African Immigrants in the United States, 2010
Source: World Bank 2010.
Thou
sand
s
211
140133
111 110
85 84 8167
40
Nigeria Ethiopia Egypt,Arab Rep.
Ghana Somalia Kenya Morocco SouthAfrica
Liberia Sudan

Harnessing the Resources of the Diaspora • 151
studies highlight the contributions of all migrants, including low-skilled diaspora (Orozco 2003, 2006a, 2006b; Lowell and Genova 2004; Lucas 2004; Portes, Escobar, and Radford 2007; Crush 2011). Other studies analyze how members of the African diaspora contribute to their coun-tries of origin (Chikezie 2000; Mohamoud 2003, 2010; Mohan and Zack-Williams 2002; Bakewell 2008). This section describes the contributions of the diaspora, including Africans living within and outside Africa, with-out distinguishing between skilled and unskilled emigrants.
TRADE
Migration can affect trade through two channels. First, immigrants have a preference for their native country’s goods (supporting “nostalgic trade” in ethnic products) (Light, Zhou, and Kim 2002), partially offsetting the loss of these sales associated with migration (if emigrants had stayed at home, they presumably would have demanded the same products) (Gould 1990, 1994). The effect is diffi cult to estimate, because migrants presumably have more income than they would have had in the origin country but relocation to the destination country reduces the effi ciency with which home country goods are supplied (by adding transport costs, for example).
Second—and more important—migrants can increase the availabil-ity of market information essential for trade by helping origin-country exporters fi nd buyers, understand the market, and comply with govern-ment requirements and market standards. Migrants facilitate bilateral trade and investment between host and source countries by helping over-come information asymmetries and other market imperfections (Gould 1994; Rauch and Trindade 2003). Transnational networks can help producers of consumer goods fi nd appropriate distributors and assem-blers fi nd the right component suppliers. Sharing the same language or a similar cultural background eases communication and facilitates better understanding of transport documents, procedures, and regulations.
The literature emphasizes the role of ethnic networks in overcom-ing inadequate information about international trading opportunities, which drives down trade costs (see Rauch 2001 for a review of business networks). Gould (1994) and Rauch and Casella (1998) fi nd that ethnic networks promote bilateral trade by providing market information and by supplying matching and referral services. Empirical studies of Australia, Canada, Spain, the United Kingdom, the United States, and the OECD countries generally fi nd that immigration increases bilateral trade fl ows.2 But these effects differ by type of good (for example, differentiated goods

152 • Leveraging Migration for Africa: Remittances, Skills, and Investments
versus more uniform commodities) and the skill level of the migrants. Estimates of the size of these effects vary widely, and it is diffi cult for the models used to account for endogeneity. Studies for the United States (Gould 1994; Dunlevy and Hutchinson 1999; Rauch 1999; Dunlevy 2004; Herander and Saavedra 2005; Bandyopadhyay, Coughlin, and Wall 2008) and Canada (Head and Reis 1998) fi nd a positive relationship between trade fl ows and migration, although export and import elastici-ties vary across countries and products.
Some governmental agencies and private fi rms in Africa are tapping their diasporas to provide market information (see annex table 4A.1). Activities include the establishment of diaspora trade councils and par-ticipation in trade missions and business networks. The embassies of Ethiopia, Kenya, and Uganda in Washington, DC, and in London support business and trade forums to attract diaspora investors and try to match suppliers with exporters. Some case studies of activities in Sub-Saharan Africa have been conducted (Riddle 2006), but there has not been a proper assessment of whether these contacts generate additional exports.
Countries appear to trade more with countries from which they have received immigrants. Figure 4.2 shows a positive relationship between the size of migrant populations living in OECD countries and the level of bilateral merchandise trade between OECD countries and all African
Figure 4.2 Migration and Trade Go Hand in Hand: African and OECD Countries
Source: Authors, based on data on migrant stocks from World Bank 2010; 2007 trade data from World Integrated Trade Solution (WITS); and methodology in Dolman 2008.
0
4
8
12
16
20
Log of migrant stock
Log
of to
tal t
rade
0 6 10 12 14 162 4 8

Harnessing the Resources of the Diaspora • 153
trading partners for which data are available. This relationship could, of course, refl ect other variables that affect trade fl ows between the OECD and Africa.3
DIRECT INVESTMENT
Diasporas can increase investment fl ows between sending and receiving countries, because they possess important information that can help identify investment opportunities and facilitate compliance with regu-latory requirements. Language skills and similar cultural backgrounds can greatly contribute to the profi tability of investment in unfamiliar countries.4 Diasporas may use the information they have regarding their countries to invest directly. Alternatively, investors can improve their profi tability by tapping the expertise of a diaspora member. A major bar-rier for a multinational or a foreign fi rm setting up a production facility in another country is uncertainty and lack of information regarding the new market. For this reason, professionals and managers from Taiwan, China are very much sought after by multinationals for their operations in China.
Members of a diaspora may be more willing than other investors to take on risks in their origin country, because they are better placed to evaluate investment opportunities and possess contacts to facilitate this process (Lucas 2001). Emotion, sense of duty, social networks, the strength of diaspora organizations, and visits to the origin country may also be important determinants of diaspora investment (Nielsen and Riddle 2007).
Some studies fi nd a signifi cant relationship between migrants, particu-larly skilled ones, and investment infl ows to origin countries. Kluger and Rapoport (2005); Javorcik and others (2006); Docquier and Lodigiani (2007); Murat, Pistoresi, and Rinaldi (2008); and Leblang (2011) fi nd that migration facilitates foreign direct investment.
Some government agencies in Africa are attempting to improve their contacts with diasporas to generate investment opportunities for origin-country fi rms. Ethiopia, Ghana, Kenya, Nigeria, Rwanda, and other Afri-can countries are looking to tap into their diasporas for investments in their homeland countries (see annex table 4A.1). Recognizing the need to create suitable mechanisms to encourage diaspora members to channel remittances toward investment projects in partnering states, the East Afri-can Community is developing a proposal to attract diaspora fi nancing.5 Both governments and the private sector have supported business forums to attract diaspora investors. One of the new roles of African investment

154 • Leveraging Migration for Africa: Remittances, Skills, and Investments
promotion agencies in Ethiopia, Ghana (Riddle 2006), Nigeria, and Uganda is to provide accurate information and linkage opportunities to investors, including from diasporas.
Some private fi rms and African diaspora associations also provide information on investment opportunities and sourcing in their home-land countries. They also facilitate contacts between traders in destination and origin countries.
INVESTMENTS BY HOUSEHOLDS
Many migrants transfer funds to households in origin countries for the purpose of investment (see table 2.3 in chapter 2). Data from house-hold surveys reveal that households receiving international remittances from OECD countries have been making productive investments in land purchases, building houses, businesses, improving the farm, agricultural equipment and other investments (36 percent in Burkina Faso, 55 percent in Kenya, 57 percent in Nigeria, 15 percent in Senegal, and 20 percent in Uganda; fi gure 4.3). Households receiving transfers from other African
Figure 4.3 Investments in Business and Housing Funded by Remittances from within and outside Africa
Source: Authors, based on results of Africa Migration Project Household surveys in Burkina Faso, Kenya, Nigeria, Senegal, and Uganda in second half of 2009, Plaza, Navarrete, and Ratha 2011.Note: “Other investments” includes purchases of land, livestock, and agricultural equipment and investment in agriculture.
Perc
ent o
f tot
al
0Senegal Burkina Faso Uganda Kenya Nigeria
WithinAfrica
OutsideAfrica
WithinAfrica
OutsideAfrica
WithinAfrica
OutsideAfrica
WithinAfrica
OutsideAfrica
WithinAfrica
OutsideAfrica
10
20
30
40
50
60Business and other investments
Housing

Harnessing the Resources of the Diaspora • 155
countries are also investing a signifi cant share of remittances in business activities, housing, and other investments in Kenya (47 percent), Nigeria (40 percent), Uganda (19 percent) and Burkina Faso (19 percent).
Osili (2004) uses a data set from Nigeria to analyze migrants’ housing investments in their communities of origin. She fi nds that older migrants are more likely to invest in housing in their hometown and to devote a larger share of household income to housing investments. She concludes that “housing investments may be the fi rst stage of a broader investment relationship between migrants and their countries of origin” (p. 844). Survey data indicate similar patterns of investment by households receiv-ing transfers from abroad in Latin America (de Haas 2005), with the difference that Latin American migrants and their family members invest in agriculture and other private enterprises as well.6 The evidence for Africa from household surveys for investment in agriculture equipment is somewhat limited.
African migrants in other African countries set up small-scale busi-nesses, such as restaurants and beauty salons. They also invest in hous-ing. The African diaspora has invested in service sector activities, such as import/export companies, telecommunications, and tourism and transport companies (examples include Databank, in Ghana; Geometric Power Limited, in Nigeria; Teylium, in Senegal; and Celtel, in Sudan).
Some governments have eased restrictions on foreign land ownership to attract investments from diasporas. Credit Financier de Cameroon offers housing loans to migrants to attract investment in real estate.7 The Ethiopian government allowed holders of yellow cards (the identifi cation card for the Ethiopian diaspora) to lease land parcels at low rates for the construction of residences in Addis Ababa (see annex table 4A.1). Because of the high demand for land, in 2008 the city of Addis Ababa offi cially suspended allocation of residential land for the diaspora. The Rwanda Diaspora General Directorate allows groups of 15 or more people to acquire land in Kigali for the purpose of house construction, provided the project is approved by the Kigali City Council based on the Kigali Master Plan.8
There is some evidence that returning migrants use savings accumu-lated while abroad to invest in small businesses when they return (King 1986; Gitmez 1988; Murillo Castaño 1988; Massey and others 1987; Ahmed 2000; Murphy 2000; McCormick and Wahba 2003). Based on surveys conducted in 2006, Gubert and Nordman (2011) fi nd that one-third of returnees to Algeria, Morocco, and Tunisia invested in busi-nesses. They do not fi nd a correlation between migration duration and entrepreneurship. The results of a survey of 302 returnees conducted in

156 • Leveraging Migration for Africa: Remittances, Skills, and Investments
2001 indicate that more than half of Ghanaian and 23 percent of Ivorian returnees reported returning with more than $5,000 in savings (Black and Castaldo 2009). Both studies indicate that many return migrants invest in business activity and that work experience and the maintenance of com-munication with friends and family while abroad facilitates the opening a business upon return. Cassini (2005) concludes that the most successful Ghana-based businesses of Ghanaian migrants were owned by migrants who visited home frequently and developed social networks.
INVESTMENTS IN CAPITAL MARKETS
Diaspora members can act as catalysts for the development of fi nancial and capital markets in their countries of origin by diversifying the inves-tor base (many countries’ capital markets are dominated by investments from government and large companies), introducing new fi nancial prod-ucts, and providing a reliable source of funding. Diaspora connections with markets in destination and origin countries are important. This subsection presents some estimates of the savings of the African diaspora and describes two vehicles—diaspora bonds and diaspora investment funds—for encouraging diaspora investments in Africa.
Wealth and savings of the African diaspora in host countries
Ketkar and Dora (2009) use the New Immigration Survey data on the United States to understand the wealth and asset diversifi cation behavior of recent immigrants from Asia, Sub-Saharan Africa, Latin America, and the Middle East and North Africa. They fi nd that the region of origin is not a signifi cant determinant of savings levels once length of stay, educa-tional attainment, and number of children are taken into account. Afri-can immigrants in the United States tend to have lower levels of savings than immigrants from Asia and Latin America, largely because they have been in the country for a shorter period of time and have lower levels of education.
Ratha and Mohapatra (2011) estimate the annual savings of the Afri-can diaspora to be about $52 billion. About $30 billion of this amount—equivalent to 3.2 percent of Sub-Saharan Africa’s GDP—is saved by African migrants in Sub-Saharan African (table 4.1).9 These estimates are based on assumptions that members of the African diaspora with tertiary education earn the average income of their host countries, that migrants without tertiary education earn a third of the average household incomes

Harnessing the Resources of the Diaspora • 157
of the host countries, and that both skilled and unskilled migrants have the same personal savings rates as in their home countries. Not surpris-ingly, savings are higher for countries that have more migrants in high-income OECD countries. Most of these savings are invested in the host countries of the diaspora. It is plausible that a fraction of these savings could be attracted as investment in Africa if African countries designed proper instruments and incentives.
Table 4.1 Estimated Savings by Migrants from Selected African Countries, 2009
Estimated savings by migrants
CountryEmigrant stock
(millions) Billions of dollars Percent of GDP
Egypt, Arab Rep. 3.7 6.0 3.2
Morocco 3.0 9.6 10.5
Zimbabwe 1.3 1.6 34.4
Algeria 1.2 4.2 3.0
Côte d’Ivoire 1.2 0.6 2.6
Nigeria 1.0 3.5 2.0
Sudan 1.0 1.3 2.3
South Africa 0.9 3.8 1.3
Congo, Dem. Rep. 0.9 1.1 10.5
Ghana 0.8 2.0 7.5
Somalia 0.8 1.8 ..
Uganda 0.8 0.6 4.0
Tunisia 0.7 2.0 5.1
Ethiopia 0.6 1.9 6.5
Senegal 0.6 0.9 7.0
Kenya 0.5 1.8 6.1
Angola 0.5 0.9 1.1
Liberia 0.4 0.6 66.8
Cameroon 0.3 0.8 3.8
Mauritius 0.1 0.6 7.2
Other 10.2 7.1 2.5
Total 30.5 52.7 3.6
Sub-Saharan Africa 21.8 30.4 3.2
North Africa 8.7 22.3 4.3
Source: Ratha and Mohapatra 2011.Note: .. = negligible.

158 • Leveraging Migration for Africa: Remittances, Skills, and Investments
Diaspora bonds
A diaspora bond is a retail savings instrument marketed only to mem-bers of a diaspora. It can be an effective tool for tapping diaspora wealth (Ketkar and Ratha 2010). By retailing diaspora bonds in small denomi-nations ($100–$1,000), a government or reputable private corpora-tion in a developing country can tap into the wealth of relatively poor migrants. Diaspora bonds can also be sold in larger denominations to institutional and foreign investors. Investment bankers may be needed to structure these bonds and ensure compliance with securities regulations in the United States and other jurisdictions. Diaspora bonds can be sold globally through national and international banks and money transfer companies. They can be marketed through churches, community groups, ethnic newspapers, stores, and hometown associations in countries and cities where large numbers of migrants reside.
In addition to patriotic reasons and the desire to give back, a diaspora investor may be willing to buy diaspora bonds at a lower interest rate than the rate demanded by foreign investors. The cost of retailing diaspora bonds can be high, but it can be absorbed if the interest rate offered is lower than the rate typically paid to pension funds and other institutional investors. The bond can be made even more attractive by offering tax breaks and credit enhancements (fi rst-loss guarantee, rela-tively senior creditor status).
Migrants are expected to be more loyal than the average investor in times of distress. They likely have better knowledge of their origin coun-try and legal recourse in the event of a default. They are also less likely to worry about the risk of currency devaluation, as they can fi nd ways to spend money back home if the bonds are repaid in local currency terms.
The governments of India and Israel have issued diaspora bonds, rais-ing about $40 billion, often in times of fi nancial crisis.10 In 2009 and 2010, Ethiopia and Nepal issued diaspora bonds, but neither was suc-cessful in mobilizing funds.11 One problem was limited marketing and publicity. In Nepal, “foreign employment bonds” were issued mostly to low-skilled migrants in the Gulf Cooperation Council countries rather than to the richer diaspora groups in OECD countries. The interest rates offered on the bonds, which were denominated in local currency, were low relative to the rates on comparable instruments, which were already lower than the rate of infl ation.
Like other investors, diaspora investors are concerned about the government’s willingness and ability to service its debt. Factors such as government reputation, the rule of law, and the protection of property rights affect their decision to invest in their home countries. Countries

Harnessing the Resources of the Diaspora • 159
in which diaspora groups are politically opposed to the government and countries facing governance problems may fi nd it diffi cult to issue diaspora bonds.
Diaspora bonds have a greater chance of success if the proceeds are earmarked to fi nance projects in which diaspora members are interested. Such projects could include housing, schools, hospitals, and other com-munity infrastructure projects that benefi t the migrants, their families, or their region in the home country. Before launching a bond, therefore, it is advisable that the borrowing government or corporation hold consulta-tions with diaspora groups. To be able to do so, countries need to build a knowledge base about the size, income, and wealth characteristics of diaspora groups in key destination countries. Currently, such information is not easily available.
It is plausible that the issuance of diaspora bonds may reduce the vol-ume of remittances. This does not appear to have been the case for India, where there was additionality of infl ows from diaspora bonds rather than substitution of workers’ remittances (Debabrata and Kapur, 2003). After the maturity of the India Resurgent Bonds, a large part of the proceeds were converted to local currency deposits and began to be counted as remittances (World Bank 2005). In the case of Israel as well, diaspora investors have tended to roll over their capital to newer diaspora bonds after the maturity of the diaspora bonds.
Preliminary estimates suggest that Sub-Saharan African countries could potentially raise $5–$10 billion a year by issuing diaspora bonds (Ratha, Mohapatra, and Plaza 2009). Countries that could potentially issue diaspora bonds include Ethiopia, Ghana, Kenya, Liberia, Nigeria, Senegal, Uganda, and Zambia in Sub-Saharan Africa and Egypt, Morocco, and Tunisia in North Africa.12 These countries have large diasporas abroad, especially in high-income countries.
Ratha and Ketkar (2011) underscore three reasons why there are still very few issuances of diaspora bonds. First, there is limited awareness of this fi nancing vehicle. Developing country policy makers would benefi t from technical assistance aimed at improving their understanding of how to structure bond offerings, register them with regulatory agencies such as the U.S. Securities and Exchange Commission, and determine whether such instruments need to be rated by rating agencies. Second, many coun-tries still have little concrete knowledge of the capabilities and resources of their diasporas. Third, in some cases diaspora members may not trust their home country government. In addition, some Sub-Saharan African countries may face diffi culties because of the absence of national banks in destination countries.

160 • Leveraging Migration for Africa: Remittances, Skills, and Investments
The donor community and multilateral development banks can facili-tate the piloting and mainstreaming of such innovative fi nancing tools (Ratha 2010). Their involvement could include granting or lending seed money for investment banking and credit rating services and providing legal help, fi nancial guarantees, and technical assistance in project design. Potential issuers of diaspora bonds should be reminded of the risks asso-ciated with debt denominated in foreign currency. Considerations must be given to prudential risk management before taking on additional debt. Volatility in migrants’ incomes and disruption in relationships with the diaspora can occur quickly in some countries where political risks are high. Large foreign currency infl ows after a bond issuance require careful macroeconomic management, especially of the exchange rate in order to avoid Dutch disease.
Diaspora investment funds
Developing countries, especially in Sub-Saharan Africa, suffer from a short-fall of private equity capital. Portfolio equity fl ows to Sub-Saharan Africa have gone mainly to South Africa (Ratha, Mohapatra, and Plaza 2009). Foreign investors appear to be averse to investing in Africa because of lack of information, the perception of high risk, and the small size of the mar-ket, which makes stocks relatively illiquid. One way to encourage greater private investment in these markets could be to tap the African diaspora.
Several African investment funds have been proposed to attract invest-ments from wealthy African migrants abroad; examples include the Libe-rian Diaspora Social Investment Fund, the Rwandan Diaspora Mutual Fund, and the Zambia First Investment Fund. Such funds can take the form of regional funds, mutual funds, or private equity to be invested in African companies and pension funds.13 Persuading diaspora investors to invest in African diaspora funds may require strengthening investor pro-tections to ensure proper management of the funds. Some of the options for building diaspora investors’ confi dence proposed by Aydagul, Ketkar, and Ratha (2010) apply to investment funds: management of funds by a state agency, management of funds by a private company,14 and manage-ment of funds by a combination of a private company but with participa-tion of members from the diaspora.
COLLECTIVE REMITTANCES
The African diaspora has begun to collectively contribute fi nancial and nonfi nancial resources to homeland countries, albeit not yet on a large

Harnessing the Resources of the Diaspora • 161
scale. Organizations have been created in Europe, the United States, and some African countries, based on religion, ethnicity, and geographic ties.15 These groups include hometown associations, ethnic associations, alumni associations, religious associations, professional associations, nongovernmental organizations, investment groups, national develop-ment groups, welfare/refugee groups, and Internet-based virtual organiza-tions. The number of associations appears to be roughly correlated with the size of the diaspora in each country.16
In contrast to similar groups of Asian (particularly Filipino) and Latin American diasporas, little is known about the scope, scale, patterns, and impact of African diaspora associations.17 Data are not collected on con-tributions sent by formal migrant associations, and there is no informa-tion on collective remittances by undocumented immigrants.
Hometown associations and other voluntary associations of migrants from the same geographical area have provided substantial funds to some African communities. This fi nancing is often equal to or greater than the municipal budget for public works, particularly in towns with small populations (Orozco 2003). Some twinning projects have also been established. Burundians in a town in France, for example, have partnered with a town in Burundi (Turner and Mossin 2008).
Interviews conducted for this study provide insight into collective remittances from the African diaspora:18
• Networks of families and friends pool resources and support their villages or friends. In some cases they send funds for development purposes, such as constructing a school, providing supplies to schools or hospitals, supporting orphans, or training new migrants arriving in the destination country. In other instances they send funds to support funerals or weddings. These transactions are not documented.
• Diaspora organizations rely on the skills of members, volunteers’ time, donations, and fundraising events for project fi nancing.
• Collective remittances appear to be motivated by migrants’ sense of identity and feeling of solidarity with their home countries, as well as by sociocultural and political bonds and the feeling of being useful and powerful (Guarnizo 2003 reaches similar conclusions).
• The most frequent activity of African diaspora organizations in Den-mark (where 123 associations covering 22 African countries and 18 associations with regional coverage were surveyed) is the shipment of used equipment in containers, typically destined for schools, uni-versities, orphanages, or hospitals (41 associations), followed by the sending of collective remittances (27 associations) and educational
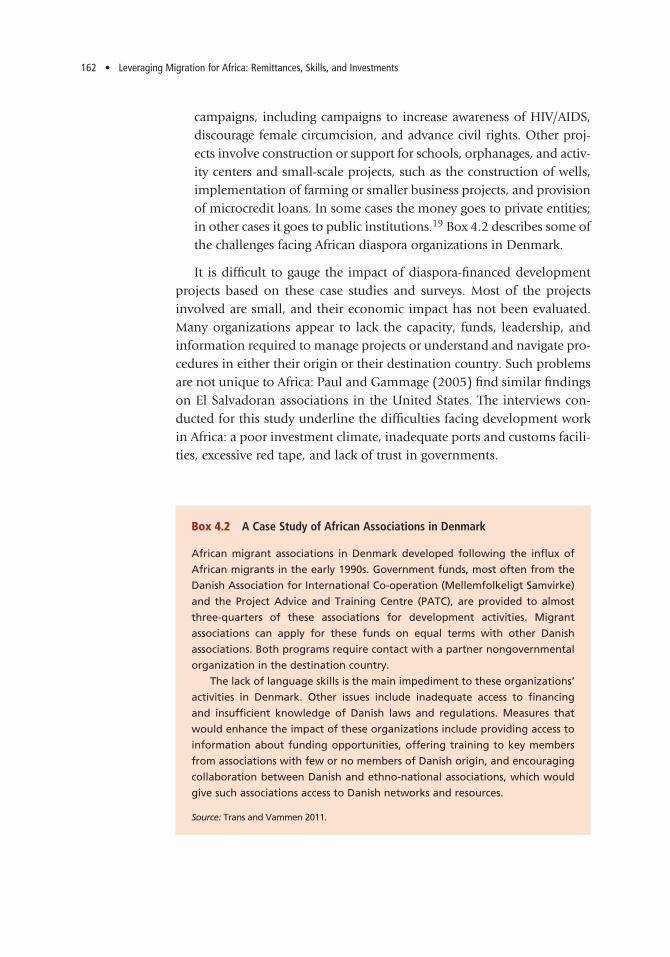
162 • Leveraging Migration for Africa: Remittances, Skills, and Investments
campaigns, including campaigns to increase awareness of HIV/AIDS, discourage female circumcision, and advance civil rights. Other proj-ects involve construction or support for schools, orphanages, and activ-ity centers and small-scale projects, such as the construction of wells, implementation of farming or smaller business projects, and provision of microcredit loans. In some cases the money goes to private entities; in other cases it goes to public institutions.19 Box 4.2 describes some of the challenges facing African diaspora organizations in Denmark.
It is diffi cult to gauge the impact of diaspora-fi nanced development projects based on these case studies and surveys. Most of the projects involved are small, and their economic impact has not been evaluated. Many organizations appear to lack the capacity, funds, leadership, and information required to manage projects or understand and navigate pro-cedures in either their origin or their destination country. Such problems are not unique to Africa: Paul and Gammage (2005) fi nd similar fi ndings on El Salvadoran associations in the United States. The interviews con-ducted for this study underline the diffi culties facing development work in Africa: a poor investment climate, inadequate ports and customs facili-ties, excessive red tape, and lack of trust in governments.
Box 4.2 A Case Study of African Associations in Denmark
African migrant associations in Denmark developed following the infl ux of
African migrants in the early 1990s. Government funds, most often from the
Danish Association for International Co-operation (Mellemfolkeligt Samvirke)
and the Project Advice and Training Centre (PATC), are provided to almost
three-quarters of these associations for development activities. Migrant
associations can apply for these funds on equal terms with other Danish
associations. Both programs require contact with a partner nongovernmental
organization in the destination country.
The lack of language skills is the main impediment to these organizations’
activities in Denmark. Other issues include inadequate access to fi nancing
and insuffi cient knowledge of Danish laws and regulations. Measures that
would enhance the impact of these organizations include providing access to
information about funding opportunities, offering training to key members
from associations with few or no members of Danish origin, and encouraging
collaboration between Danish and ethno-national associations, which would
give such associations access to Danish networks and resources.
Source: Trans and Vammen 2011.

Harnessing the Resources of the Diaspora • 163
Governments in a number of large labor-sending countries have attempted to develop schemes to channel collective remittances into pub-lic revenue, investment, or community development. Given the private nature of these transactions, policy interventions have focused either on appropriating some of the fl ows, largely without success, or on creating incentives to change individual or household behavior. For example, a few governments have offered matching grants for remittances from diaspora groups or hometown associations, in order to attract funding for specifi c community projects. The best known of these matching schemes is Mexico’s 3-for-1 program, under which the local, state, and federal governments each contribute $1 for every $1 of remittances sent to a community for a designated development project (Page and Plaza 2006).Colombia also provides government funding to match migrant group funds for local projects benefi ting vulnerable populations (IOM 2004).
Little evaluation of the impact of these programs has been conducted. Resources have gone primarily to rural areas, where they have increased the supply of essential services (health, education, roads, and electricity) (World Bank 2005). In some cases hometown associations have funded the construction of soccer fi elds and community halls but have not funded the ongoing maintenance of these facilities. It is diffi cult to assess whether these investments—and the matching grants—have gone to the highest-priority projects or have been diverted from other regions with a great need of assistance from fi scally constrained governments (World Bank 2005). Proponents of hometown associations argue that their involvement ensures that programs are focused on community needs and that the associations promote increased accountability and transparency of local and national authorities (Page and Plaza 2006).
The potential of hometown associations to serve as conduits for broader development projects is limited by at least three factors. First, they may not have the best information on the needs of the local com-munity, or they may have different priorities. Second, the capacity of hometown associations to scale up or form partnerships is limited by the fact that their members are volunteers and their fundraising ability is weak.20 Third, hometown associations can become divided, weakening their advocacy potential (Newland and Patrick 2004; Kuznetsov 2006). In the context of Africa, support based on regional ties may exacerbate income disparities, particularly as outmigration is concentrated in a few areas in many African countries. The fact that volunteer initiatives are often driven by individuals, without institutionalized support, could also threaten the sustainability of projects.

164 • Leveraging Migration for Africa: Remittances, Skills, and Investments
TRANSFERS OF TECHNOLOGY AND SKILLS
A diaspora can be an important source and facilitator of research and inno-vation, technology transfer, and skills development. Japan, the Republic of Korea, and Taiwan, China are examples of economies that have relied on their diasporas as knowledge sources. The governments in these econo-mies promoted the return of foreign-educated students or established networks of knowledge exchange with them (Pack and Page 1994). Other developed labor-sending countries with large, skilled emigrant popula-tions (Australia, Ireland, Israel) have also been able to tap their expatriates and develop mentor-sponsor models in certain sectors.
Diaspora involvement in origin countries’ economies can take several forms (Kuznetsov 2006; Plaza 2008a):
• licensing agreements to facilitate the transfer of technology and know-how between diaspora-owned or -managed fi rms in origin and desti-nation countries
• direct investment in local fi rms through joint ventures• knowledge spillovers (which occur, for example, when diaspora mem-
bers assume top managerial positions in foreign-owned fi rms in their country of origin)
• involvement in science or professional networks that promote research in destination countries directed toward the needs of origin countries
• temporary or virtual return, through extended visits or electronic com-munication in professional fi elds such as medicine and engineering
• return to permanent employment in the sending country after work experience in the host country.
Diaspora knowledge networks refer to the “skilled personnel who migrate every year from their home countries to join thousands and millions of their countrymen and women residing in countries other than their own” (Mahroum, Eldridge, and Daar 2006, p. 26; see also Kuznetsov 2006 and Meyer and Quattiaus 2006).21
There are three types of diaspora knowledge networks:
• Scientists and research and development (R&D) personnel networks provide knowledge, mentoring expertise, and fi nance (venture capital).
• Professional and business networks are regional or local networks of skilled diaspora members located in larger cities (Saxenian 2002b).22 Relevant associations provide technical assistance and organize con-ferences, investment forums to match investors with counterparts at home, and recruitment fairs. African examples include the Ghanaian

Harnessing the Resources of the Diaspora • 165
Doctors and Dentists Association United Kingdom (GDDA–UK) and the Association of Kenyan Professionals in Atlanta (AKPA).
• Global knowledge networks are transnational networks linking global regions with origin countries (see Plaza 2008a for a description of Chile Global).
Several African countries are attempting to organize their diasporas in order to gain more benefi ts from their nationals abroad. Diaspora mem-bers sometimes maintain residences in both their origin country and their destination country or return to their origin countries every year to sup-port specifi c activities. These movements and exchanges of knowledge and skills benefi t the origin countries (Easterly and Nyarko 2008). Increasing these benefi ts will require efforts to survey diasporas’ human resources, create active networks, and develop specifi c activities and programs, such as those of small pilot initiatives that invite diaspora members to teach courses at African universities.23
AN EMERGING POLICY AGENDA TO MAXIMIZE THE BENEFITS OF DIASPORAS
Both sending and receiving countries are beginning to implement poli-cies to boost fl ows of fi nancial resources, information, and technology from the diaspora. Several developing countries (including the Philip-pines, India, China, and several African countries) have set up agencies and initiatives to engage with their diasporas.
Such efforts and initiatives have met with little success in Armenia, Colombia, Mexico, Moldova, Peru, and South Africa. Some initiatives—such as Conectandonos al Futuro, in El Salvador, Red Caldas, in Colom-bia, and Red Cientifi ca Peruana, in Peru—lost momentum and faded away (Dickinson 2003; Chaparro, Jaramillo, and Quintero 1994). The South African Network of Skills Abroad (SANSA) has experienced a reduction in the number of new members since its inception in 1998 (Marks 2004). Several high-income countries (including Australia, Ire-land, Israel, and the United Kingdom) have implemented initiatives to strengthen engagement with their diasporas (Kingslye, Sand, and White 2009; Finch, Andrew, and Latorre 2010).
DUAL/MULTIPLE CITIZENSHIP
Holding dual (or multiple) citizenship can improve both a diaspora’s connection with its origin country and its integration into the destination

166 • Leveraging Migration for Africa: Remittances, Skills, and Investments
country.24 Dual citizenship provides an important link between diasporas
and their home countries (Ionescu 2006). Citizenship and residency rights
are important determinants of a diaspora’s participation in trade, invest-
ment, and technology transfer with its origin country (Cheran 2004) and
make it easier to travel to and own land in the origin country.
Origin countries that allow for dual citizenship benefi t, because their
migrants are more willing to adopt the host country’s citizenship, which
can improve their earnings and thus their ability to send remittances to
and invest in the origin country. Immigrants from some countries that
adopted the policy of allowing dual citizenship during the 1990s and
2000s (Brazil, Colombia, Costa Rica, the Dominican Republic, and Ecua-
dor) experienced a rise in earnings in the United States (Mazzolari 2007),
because citizenship allowed them to acquire legal status and gain access
to better jobs. Immigrants from countries that were granted dual citizen-
ship during the 1990s experienced a 3.6 percentage point increase in the
probability of full-time work relative to other Latin American immigrant
groups. Destination countries can also benefi t by providing dual citizen-
ship, which can help foster the assimilation of immigrants.
Origin countries have increased their acceptance of dual citizenship.
For example, 10 Latin America countries (Brazil, Colombia, Costa Rica,
the Dominican Republic, Ecuador, El Salvador, Mexico, Panama, Peru,
and Uruguay) passed new laws on dual nationality or citizenship in the
1990s and 2000s (Jones-Correa 2001). In some countries, such as Kenya,
the policy was adopted under pressure from diaspora groups.25 Other
countries, including most of the former Soviet republics, oppose dual
citizenship status.
About half of the African countries on which information is available
allow dual citizenship (table 4.2). Interest has increased in providing
dual citizenship to the children or grandchildren of migrants, in order
to encourage their ties to origin countries. The potential gains for origin
countries are limited, however, because many destination countries do
not permit dual citizenship.
Chiswick (1978) was the fi rst to show a positive impact of natural-
ization on earnings. More recent studies show that the integration of
migrants in destination countries amplifi es their involvement in the
development of their countries of origin (de Haas 2006). Studies of
Canada and the United States seem to support the existence of a citizen-
ship premium; European studies show mixed results (Bevelander and
Pendakur 2009). According to Cheran (2004), citizenship or residency

Harnessing the Resources of the Diaspora • 167
rights are important in determining immigrants’ participation in trade, investment, and knowledge transfer.
Some origin countries do not allow dual citizenship but offer identi-fi cation card schemes in destination countries. In some countries these cards grant visa rights to migrants. Ethiopia, India, and Mexico offer special
Table 4.2 African Countries Permitting and Prohibiting Dual Citizenship for Adults
Country
Dual citizenship
Country
Dual citizenship
Yes No Yes No
Algeria X Libya X
Angola X Madagascar X
Benin X Malawi X
Botswana X Mali X
Burkina Faso X Mauritania X
Burundi X Mauritius X
Cameroon X Morocco X
Cape Verde X Mozambique X
Central African Republic X Namibia X
Chad — Niger X
Comoros — Nigeria X
Congo, Dem. Rep. X Rwanda X
Congo, Rep. X São Tomé and Principe —
Côte d’Ivoire X Senegal X
Djibouti X Seychelles X
Egypt, Arab Rep. X Sierra Leone X
Equatorial Guinea X Somalia X
Eritrea X South Africa X
Ethiopia X Sudan —
Gabon X Swaziland X
Gambia, The X Tanzania X (in process)
Ghana X Togo X
Guinea X Tunisia X
Guinea-Bissau — Uganda X
Kenya X Zambia (in draft constitution)
X
Lesotho X Zimbabwe X
Liberia X
Source: Authors, based on Brown 2009; information collected from interviews with African countries’ embassies and consular services in Washington, DC, Paris, London, and Pretoria; http://www.multiple citizenship.com/countrylist.html; http://www.cic.gc.ca/english/resources/publications/dual-citizenship.asp; and http://allafrica.com/stories/201001200400.html.— = not available.

168 • Leveraging Migration for Africa: Remittances, Skills, and Investments
identifi cation cards that entitle migrants to specifi c rights. In 2002, the Ethiopian government enacted a law permitting Ethiopian migrants with foreign citizenship to be treated as nationals if they hold a “person of Ethiopian origin” identifi cation card, known locally as a yellow card. The yellow card entitles its holder to most of the rights and privileges of an Ethiopian citizen, such as entry into Ethiopia without a visa, the right to own residential property, and the right to live and work in the country without additional permits. Yellow card holders may not vote or be elected to political offi ce, and they cannot be employed in national defense, security, or foreign affairs (Federal Negarit Gazeta 2002). India issues a Person of Indian Origin (PIO) card, which allows for entry with-out a visa during the period of its validity.26 Mexico issues a matrícula consular to Mexicans living in the United States; this document not only serves as an identity card, it is also accepted by many states as a valid document for issuance of a driver’s license and by many banks for open-ing accounts (World Bank 2005).
VOTING RIGHTS
Origin countries can strengthen their ties to the diaspora by allowing citizens who reside abroad to vote without returning (box 4.3). Some countries give nationals abroad voting rights, and some reserve a specifi c number of seats in parliament for diaspora representatives.
Some African countries that confer voting rights on their diasporas require advanced registration or allow voting in person only. In other
Box 4.3 Educating the Rwandan Diaspora about Elections in Rwanda
Interviews with diaspora groups and individuals indicate that granting voting
rights to the diaspora is an important means of encouraging greater engage-
ment with origin countries. Rwanda provides a useful example of an effort
to engage the diaspora by reaching out and encouraging voting by foreign
citizens. In August 2010, Rwandans living abroad participated in presidential
elections for the fi rst time since the civil war. In preparation for the elections,
a delegation of the National Electoral Commission (NEC) visited Belgium,
Burundi, Denmark, France, Germany, Kenya, Norway, Sweden, Switzerland,
and Uganda to inform emigrants about the electoral process. Of the 17,824
registered voters in the diaspora, 14,242 (78 percent) cast valid votes.
Source: http://global.factiva.com/redir/default.aspx?p=sta&ep=AE&an=AFNWS00020100810e68a000n7&fi d=300516908&cat=a&aid=9JOI000500&ns=53&fn=diaspora&ft=g&OD=V2AUbjNaqd6b6yKMegonfnoY9oOdATkhWR19knPBTvmljPNVjs%2fEl5nw%3d%3d%.

Harnessing the Resources of the Diaspora • 169
countries, voting by mail is possible. Migrants who permanently live abroad can register with an embassy or consulate in the country of their permanent residence and vote there, but the costs of registration may be high. For example, South Africa approved voting rights for South Africans living abroad in 2009, but only about 16,000 voters (out of the esti-mated 1.2 million South African citizens in the diaspora) who had been registered well in advance were able to participate in the 2009 elections. Members of the Nigerian diaspora asked the Independent National Elec-toral Commission (INEC) to register Nigerians abroad so they could par-ticipate in the 2011 elections.27 The extent of participation also depends on whether voting is required (as it is in Peru) or voluntary (as it is in most countries).
DESTINATION COUNTRIES’ SUPPORT FOR DIASPORAS
Some destination countries are devoting resources to helping diasporas promote the development of their countries of origin. Canada, France, Germany, Italy, Spain, the United States, and the European Union, among other governments and institutions, are becoming more inter-ested in working with the diasporas residing in their countries. Some of their initiatives are at the initial stage of implementation. Other pro-grams, such as those promoting return, have been unsuccessful.28
One area of focus has been the reduction in fees for transferring remit-tances (see chapter 2). There are few well-defi ned programs that facilitate diaspora trade, investment, and technology operations apart from small grants or matching grant initiatives (for example, the Development Mar-ketplace for the African Diaspora in Europe, the African Development Marketplace, and the Joint Migration and Development Initiative). There is little information on initiatives and few external evaluations of their effectiveness (de Haas 2006). The United States has focused on engag-ing with diaspora communities as a core element of its foreign policy, with an emphasis on the role diasporas can play in their origin countries (an example is the role Haitian-Americans played in providing relief to Haiti following the earthquake). The U.S. Department of State and the U.S. Agency for International Development (USAID) have sponsored a new initiative called the Diaspora Networks Alliance (DNA).29 Canada, France, the Netherlands, and the European Commission have funded development projects implemented by diaspora groups. The Netherlands has awarded grants to projects aimed at building the capacity of migrant organizations. In 2007, France added cofunding of diaspora projects to its menu for codevelopment. At the 25th Annual Africa-France Summit,

170 • Leveraging Migration for Africa: Remittances, Skills, and Investments
participating heads of state decided “to place the African diasporas liv-ing in France at the center of the migration and development strategies, promoting their involvement in the economic and social development of their country of origin by means of codevelopment programs, encourag-ing migrant business projects and mobilizing their savings for social and productive investment.”30
The governments of France, Italy, the Netherlands, Spain, the United States, and the United Kingdom are working with developing country diaspora groups to promote development in origin countries and sup-port their own foreign policy objectives. Such initiatives (for example, the French codevelopment policy or the European mobility partnership agreements) often aim to “better manage migration fl ows, and in particu-lar to fi ght illegal migration” (EU 2007).
INCENTIVES FOR RETURN BY HOST COUNTRIES
Since the 1970s, some European countries (France, Germany, the Neth-erlands, and recently Spain) have encouraged return migration by pro-viding money to immigrants and fi nancing projects to employ returnees in their home countries (Constant and Massey 2002; Panizzon 2011).31 Few migrants have participated, and most projects have been unsuccess-ful. The French local development migration program provided assis-tance, though mostly on a small scale, to projects by Malian and Senega-lese returnees in their countries of origin (Lacroix 2003).
In the late 1990s, countries changed their approach by encouraging the return of not only unskilled but also skilled immigrants. The approach encouraged circular migration, codevelopment, reintegration of tempo-rary workers in their home countries, and the return of skilled migrants to Africa. For example, France entered into agreements with migrants’ origin countries to facilitate return (Panizzon 2011). Its pact on concerted migration management with Senegal seeks the voluntary return of medi-cal doctors and other health professionals in France by offering research equipment or the prospect of joint university appointments (French Sen-ate 2007). The new mobility partnership agreements also establish circular migration schemes for professional education and expert missions by members of the diaspora (Plaza 2009).
Temporary labor migration is seen by origin countries as a way for migrants to acquire skills abroad and bring them home upon return. Examples include France’s pact with Benin in 2006 and Senegal’s government-run Retours vers l’agriculture plan in 2007, which includes an initiative to reintegrate returning migrants (Panizzon 2011).

Harnessing the Resources of the Diaspora • 171
European governments, often in cooperation with the International Organization for Migration (IOM), have been implementing assisted voluntary return programs for almost three decades. The majority of these programs target irregular migrants. According to the IOM, about 1.6 mil-lion migrants returned to more than 160 countries with the help of these programs. About 32,000 migrants returned under the IOM Assisted Vol-untary Return programs in 2009, up from about 23,000 in 2008. In the United Kingdom, there were 4,945 returns in 2009, 4,301 in 2008, and 4,157 in 2007. The costs of assisted voluntary returns are less than the costs of forced returns (Council of Europe 2010). In the United Kingdom, for example, in 2005 compulsory removals cost British taxpayers £11,000 per person, whereas voluntary returns cost £1,000 per person. Factoring in reintegration assistance, voluntary returns cost less than one-third the cost of forced returns (National Audit Offi ce 2005).
The IOM is helping skilled migrants return to Africa, hoping that the returnees’ fi nancial resources and technical skills will further devel-opment. The Return of Qualifi ed African Nationals Program attracted more than 2,000 highly skilled persons back to 41 African countries over a 16-year period (1974–90). Support for the return of migrants has expanded to include various forms of contact with origin countries. The IOM’s Migration for Development in Africa (MIDA) program sup-ports a variety of return options, including virtual return (through, for example, teaching courses and leading seminars online); repeated visits; investment; temporary return; and permanent reallocation (Ndiaye 2011).32 The MIDA Great Lakes project involves missions, workshops, and round tables to facilitate the exchange of knowledge between institu-tions in Burundi, the Democratic Republic of Congo, and Rwanda with the diaspora in Belgium.33
The United Nations Development Programme’s (UNDP) Transfer of Knowledge through Expatriate Nationals (TOKTEN) projects support three-week to three-month development assignments for expatriates, at much lower costs than hiring professional consultants. A recent evalu-ation of a TOKTEN program in Sri Lanka indicates that these services have not had a signifi cant impact on local institutions, because expatriate involvement was not sustained (TOTKEN provides two visits at most) (Wanigaratne 2006). An evaluation of the Rwandan TOTKEN program in 2005–07, which involved visits by 47 volunteers to teach and provide technical assistance, noted that an average stay of less than two months and the variety of responsibilities constrained the transfer of knowledge to counterparts in host institutions (Touray 2008).

172 • Leveraging Migration for Africa: Remittances, Skills, and Investments
According to the OECD (2010), diaspora knowledge fl ows could increase if barriers to short-term and circular mobility were removed. There has been an increase in mobility partnership pacts between EU and origin countries. For example, an agreement with Cape Verde focuses on visa and border control policies. India has initiated discussions with the European Union on the export of high-skilled professionals (Plaza 2009b). More data and research are needed to develop effective policies to encourage circular migration. The Swedish government has appointed an independent parliamentary committee to examine the connection between circular migration and development, with a report to be pre-sented in March 2011 (Swedish Ministry of Justice 2010).
RETURN INITIATIVES BY SENDING COUNTRIES
A number of origin countries have introduced measures to encourage return by skilled migrants. The most successful efforts have been in Asia. China offers attractive salary packages, multiple-entry visas (for migrants who have lost their Chinese citizenship), and access to for-eign exchange. The Hsinchu Industrial Park initiative, by the govern-ment of Taiwan, China, attracted more than 5,000 returning scientists in 2000 alone (Saxenian 2002b, 2006). Thailand has offered generous research funding and monetary incentives for return (Pang, Lansang, and Haines 2002). Many programs to encourage return have met with only limited success, and studies of return migration suggest “that those who return may be those that have performed relatively poorly when abroad, while those who stay are the best and the brightest” (Lodigiani 2009, p. 21).
Less information is available on African policies to encourage return. A study on return migrants in Côte d’Ivoire and Ghana fi nds that policies that favor returnees above those who never left the country are likely to be counterproductive and to cause resentment (Ammassari 2006).
Experiences from many of the government initiatives implemented by developing countries in Latin America, Asia, and Africa have dem-onstrated that it is diffi cult to promote return, particularly permanent return. Some returnees were not able to reenter local labor markets at a level appropriate for their skills and knowledge. The lack of laboratories and equipment makes it diffi cult for scientists and researchers to keep up to date on the latest scientifi c developments worldwide. Some members of the diaspora may return with unrealistic expectations or fi nd it hard to readjust to local norms (OECD 2010).

Harnessing the Resources of the Diaspora • 173
AFRICAN GOVERNMENTAL INITIATIVES TO ENGAGE THE DIASPORA
African governments are reaching out to the diaspora. Ghana, Nigeria, Sen-egal, and South Africa have launched plans to incorporate their diaspora communities as partners in development projects. Ethiopia, Ghana, Mali, Nigeria, Rwanda, Senegal, Tanzania, Uganda, and other countries have established institutions (at the agency or ministerial level) to interact with the diaspora (see annex table 4A.1).
These initiatives have taken various forms, ranging from the creation of dedicated ministries to deal with migrant communities to the addition of specifi c functions to the ministries foreign affairs, interior, fi nance, trade, social affairs, youth, and so on. Some governments have set up institu-tions such as councils or decentralized institutions that deal with migrant community issues. Several of these initiatives have not maintained their momentum or have been discontinued with a change of government.34
To date, the interest of African governments in their diasporas has focused largely on migrants living outside Africa, such as in OECD coun-tries. Conferences and investment seminars, either at home or in the capitals of major OECD countries, target the diaspora outside Africa.
There have been some proposals to take a more harmonized and integrated approach to the diaspora within each regional economic community. There is a proposal for the creation of a regional diaspora offi ce within the East African Community (EAC). The Economic Com-munity of West African States (ECOWAS) has proposed establishing a dedicated fi nancial instrument at the regional level to facilitate business contributions of the diaspora. These proposals focus on the diaspora outside Africa. Some other initiatives focus on establishing an integrated approach to cross-border payment systems, including the transfer of remittances within ECOWAS and the Economic and Monetary Com-munity of Central Africa (CEMAC). Government institutions abroad, especially embassies and consulates, can play a key role in reaching out to the diaspora (Ionescu 2006). A survey of embassies in Abu Dhabi, Pretoria, Paris, London, and Washington, DC, indicates the need to improve African governments’ capacity and increase their resources in order to sustain the activities of the ministries and institutions dealing with diaspora communities abroad (box 4.4). Steps that could improve embassies’ engagement with diasporas include creating outreach pro-grams to gain more information on diaspora communities, training embassy staff in contacting diaspora members and facilitating investment and trade contacts, and using embassies as vehicles for marketing invest-ment and fi nancial mechanisms such as diaspora bonds. Governments

174 • Leveraging Migration for Africa: Remittances, Skills, and Investments
can help facilitate diaspora networks through the Internet, professional associations, embassies, and cultural events. Some origin countries are supporting long-term and long-distance linkages between emigrants and their countries of origin (Ghai 2004).
African governments are also working through the African Union (AU) on diaspora issues. In 2003, the AU executive council agreed to actively engage the African diaspora.35 In 2005, the African Union for-mally designated the African diaspora as the “sixth region” of the AU’s structure. It allocates 20 seats for the African diaspora in the Economic, Social and Cultural Council of the Africa Union (ECOSOCC).
In September 2008, the African Union Commission (AUC) launched the Africa Diaspora Health Initiative to provide a platform through which health experts from the diaspora can transfer information, skills, and expertise to their counterparts in Africa. It created the African Citizens Directorate to deal with overarching issues in the relationship between overseas diasporas and homeland governments.
The African Union’s approach is to enable the diaspora to organize itself with AU support within the framework provided by executive organs of the union, the council, and the assembly, with the guidance of
Box 4.4 The Role of Embassies in Enabling Diasporas
The authors conducted 48 interviews with government offi cials and diplomats
of embassies in Abu Dhabi, Pretoria, Paris, London, and Washington, DC, to
understand the role embassies are playing in enabling their diasporas to make
economic contributions to their countries. They found few differences across
embassies in this respect. Most origin countries have only a limited engage-
ment with the diaspora, although some embassies are implementing initiatives
to reach their diaspora. Embassies provide consular services to their expatriate
community but little information on trade and investment opportunities.
Some of the diffi culties that embassies are facing in reaching their diaspora
include the following:
• lack of coordination among departments, especially between the embassy
and consular offi ces
• lack of information on the number of nationals in the diaspora
• reluctance of migrants from politically unstable countries to engage with
the embassy
• inadequate staff dedicated to working with the diaspora
• insuffi cient capacity to reach out to the diaspora and facilitate investment,
trade, and skill transfers.
Source: Plaza 2009a.
Harnessing the Resources of the Diaspora • 175
member states. The mechanisms and the process for diaspora engagement are still being worked out, causing some frustration among diaspora com-munities, which in recent forums have expressed a reluctance to wait for AU directions before organizing themselves.36
The World Bank is supporting many of the diaspora activities of the AU and African governments.37 Its African Diaspora Program (launched in September 2007) partners with the African Union, client countries, donors, and diaspora professional networks and hometown associations to enhance the contributions of the African diaspora to the development of their home countries.
Improving the business environment
Like other potential investors and trading partners, migrants seeking to invest in or trade with African countries are often constrained by the poor business environment. Interview results stress the impediments of exces-sive red tape and customs delays.
The diaspora requires a conducive business environment, a sound and transparent fi nancial sector, rapid and effi cient court systems, and a safe working environment (Page and Plaza 2006). De Haas (2005) empha-sizes that bad infrastructure, corruption, red tape, lack of macroeconomic stability, trade barriers, lack of legal security, and lack of trust in govern-ment institutions affect migrants’ decisions to invest in their home coun-tries and to return. A survey of skilled South African migrants identifi es crime, the cost of living, taxation, and the quality of public and com-mercial services as the main barriers to conducting business (Kuznetsov 2006). Black and Castaldo (2009) report policies, laws, and regulations as the biggest obstacles facing diaspora members and return migrants in establishing a business. Case studies and interviews with members of the African diaspora indicate that procedures governing business licenses, registrations, and exports and imports remain complicated. Indeed, some diaspora associations report barriers to shipping donated goods, citing, for example, cumbersome import procedures for donated books.38 Some African governments are providing incentives to attract investment from the diaspora. Ethiopia offers investment incentives for both foreign investors and the diaspora that include income tax exemption for two to seven years, 100 percent duty exemption on the import of machinery and equipment for investment projects, and 100 percent customs exemption on spare parts whose value does not exceed 15 percent of the total value of capital goods imported (Federal Negarit Gazeta 2003). Such policies have encouraged many in the Ethiopian diaspora to invest in small busi-

176 • Leveraging Migration for Africa: Remittances, Skills, and Investments
nesses in Ethiopia, including cafes, restaurants, retail shops, and transport services in big cities and small towns that were otherwise restricted to Ethiopian nationals living in the country (Chakco and Gebre 2009).
The treatment of potential investors from the diaspora remains con-troversial. Some diaspora members have complained that certain coun-tries (for example, Burundi) have more favorable policies for foreign investors than for members of the diaspora. It may be better to provide effi cient procedures for all investors, without requiring proof of the inves-tor’s origin and nationality. However, origin countries could still benefi t from focusing their scarce resources on providing services to members of the diaspora and to move beyond consular services to a broader range of support for diaspora investors.
Encouraging participation in savings and social security schemes
Governments can mobilize resources from diasporas by encouraging their participation in social security, housing, and microfi nance pro-grams. Bangladesh has created a number of schemes tailored to inves-tors and nonresidents, such as saving accounts in foreign currency. The Philippines allows its citizens to enroll in or continue their social security coverage while abroad. Workers from the Philippines can also continue contributing to the Pag-IBIG Fund (Home Development Mutual Fund), which Filipinos can access through embassies and consulates abroad (ADB 2004). Some of these initiatives could be implemented in Africa to generate savings.
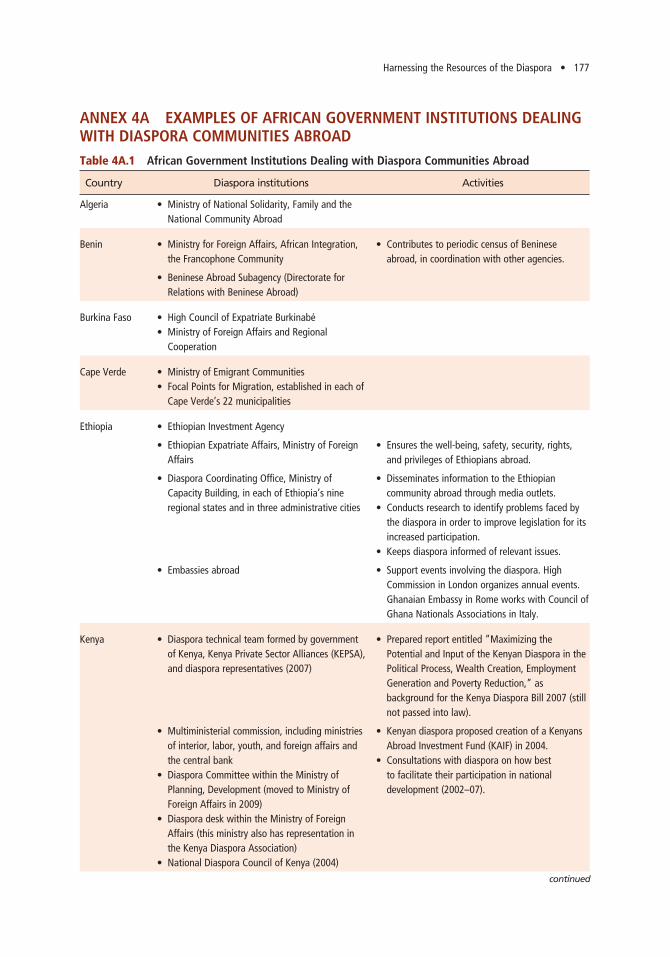
Harnessing the Resources of the Diaspora • 177
ANNEX 4A EXAMPLES OF AFRICAN GOVERNMENT INSTITUTIONS DEALING WITH DIASPORA COMMUNITIES ABROAD Table 4A.1 African Government Institutions Dealing with Diaspora Communities Abroad
Country Diaspora institutions Activities
Algeria • Ministry of National Solidarity, Family and the National Community Abroad
Benin • Ministry for Foreign Affairs, African Integration, the Francophone Community
• Contributes to periodic census of Beninese abroad, in coordination with other agencies.
• Beninese Abroad Subagency (Directorate for Relations with Beninese Abroad)
Burkina Faso • High Council of Expatriate Burkinabé• Ministry of Foreign Affairs and Regional
Cooperation
Cape Verde • Ministry of Emigrant Communities• Focal Points for Migration, established in each of
Cape Verde’s 22 municipalities
Ethiopia • Ethiopian Investment Agency
• Ethiopian Expatriate Affairs, Ministry of Foreign Affairs
• Ensures the well-being, safety, security, rights, and privileges of Ethiopians abroad.
• Diaspora Coordinating Offi ce, Ministry of Capacity Building, in each of Ethiopia’s nine regional states and in three administrative cities
• Disseminates information to the Ethiopian community abroad through media outlets.
• Conducts research to identify problems faced by the diaspora in order to improve legislation for its increased participation.
• Keeps diaspora informed of relevant issues.
• Embassies abroad • Support events involving the diaspora. High Commission in London organizes annual events. Ghanaian Embassy in Rome works with Council of Ghana Nationals Associations in Italy.
Kenya • Diaspora technical team formed by government of Kenya, Kenya Private Sector Alliances (KEPSA), and diaspora representatives (2007)
• Prepared report entitled “Maximizing the Potential and Input of the Kenyan Diaspora in the Political Process, Wealth Creation, Employment Generation and Poverty Reduction,” as background for the Kenya Diaspora Bill 2007 (still not passed into law).
• Multiministerial commission, including ministries of interior, labor, youth, and foreign affairs and the central bank
• Diaspora Committee within the Ministry of Planning, Development (moved to Ministry of Foreign Affairs in 2009)
• Diaspora desk within the Ministry of Foreign Affairs (this ministry also has representation in the Kenya Diaspora Association)
• National Diaspora Council of Kenya (2004)
• Kenyan diaspora proposed creation of a Kenyans Abroad Investment Fund (KAIF) in 2004.
• Consultations with diaspora on how best to facilitate their participation in national development (2002–07).
continued

178 • Leveraging Migration for Africa: Remittances, Skills, and Investments
Table 4A.1 African Government Institutions Dealing with Diaspora Communities Abroad (continued)
Country Diaspora institutions Activities
• Embassies abroad • Organized series of investments forums to promote investments in the United States and United Kingdom (for example, Kenya Diaspora Investment EXPO 2010). Ministers of fi nance and foreign affairs participated. Consular affairs/diaspora desk established in London to facilitate networking in United Kingdom
Mali • Ministry of Malians Abroad and African Integration
• Distributes a Practical Guide for Malians Abroad
(2003). Assists in administration of skill transfer programs, such as the United Nations’ Transfer of Knowledge through Expatriate Nationals (TOKTEN) program.
• Guichet Unique of the Agency for Promotion of Investments (API)
• High Council of Malians Abroad • Provides information to Malians considering emigrating.
Morocco • Ministry Charged with the Moroccan Community Residing Abroad
• Ministerial Delegate for the Prime Minister Responsible for Moroccans Resident Abroad
• Provides advice on investment, fi nancial planning, diaspora tax, customs, commerce and transportation, social security, remittances/banking references, and cultural events.
• Hassan II Foundation for Moroccans Resident Abroad
• Provides social and legal assistance, including partial funding for the repatriation of the deceased.
• Council of the Moroccan Community Abroad • Monitors public policies regarding emigrant nationals, ensuring the protection of their rights and enhancing their participation in the political, economic, cultural, and social development of Morocco.
Nigeria • Ministry of Foreign Affairs Unit of the Nigerians in Diaspora Organization (NIDO)
• Oversees the interests of Nigerian nationals living abroad.
• Organizes annual diaspora conference.
• National Volunteer Service
• One Stop Investment Centre (OSIC) of the Nigerian Investment Promotion Commission (NIPC)
Senegal • Ministry of Senegalese Abroad and Tourism• Senegalese Diaspora Foundation (Fundation des
Senegalais de l’extérieur)• Guichet Unique of Investment Promotion and
Major Works Agency (APIX)• Superior Council of Senegalese Abroad

Harnessing the Resources of the Diaspora • 179
Country Diaspora institutions Activities
Tunisia • Ministry of Social Affairs, Solidarity and Tunisians Abroad Subministry: Offi ce for Tunisians Abroad
• Guichet Unique of Agency for the Promotion of Industry (API)
• Guichet Unique of the Export Promotion Centre (CEPEX)
• Guichet Unique of Agricultural Investment• Promotion Agency (APIA)• Regional delegations in 17 regions of Tunisia
(under the Offi ce of Tunisians)• Ministry of Social Affairs, Solidarity and Tunisians
Living Abroad
• Provides social workers at consulates to address family issues in the diaspora.
• Organizes exploratory and study visits and summer camps in Tunisia for diaspora youth.
• Registers highly skilled expatriates.
Zambia • Diaspora desk at President’s Offi ce • Encourages and coordinates dialogue with Zambians living abroad.
Source: Authors, based on data from Rannverg 2009; ICMPD–IOM 2010; Mohamoud 2010; http://www.mfa.gov.et/Ethiopians_ Origin_Abroad/Ethiopia_Origin.php; and meetings with embassies and consular services offi cials; http://www.ccme.org.ma/en/Presentation/council-for-the-moroccan-community-abroad.html.Note: Table is not exhaustive. It is intended to provide only relevant examples.
Table 4A.1 African Government Institutions Dealing with Diaspora Communities Abroad (continued)

180 • Leveraging Migration for Africa: Remittances, Skills, and Investments
NOTES1. According to Wickramasekara (2009, 6), “The African diasporas can be
broadly classifi ed into two categories: (a) Africans in America, the United Kingdom, Brazil/Latin American/Caribbean as a result of involuntary migration and (b) the new African immigrants, mainly in North America and Europe, and to a smaller extent in Australia and Japan, among others, as a result of voluntary migration for education and for employment.” The African Union uses a similar classifi cation.
2. A growing body of research suggests that diasporas and country networks abroad are an important reservoir of knowledge of trade and investment oppor-tunities. This literature emphasizes that trade and migration are complements rather than substitutes. See Gould (1990, 1994); Helliwell (1997); Head and Ries (1998); Dunlevy and Hutchinson (1999); Rauch and Trindade (1999, 2002); Hutchinson and Dunlevy (2001); Girma and Yu (2002); Light, Zhou, and Kim (2002); Wagner, Head, and Ries (2002); Combes, Lafourcade, and Mayer (2003); Dunlevy (2003); Rauch (2003); Bardhan and Guhathakurta (2004); Blanes Cristóbal (2004); Bryant and Law (2004); Co, Euzent, and Martin (2004); Blanes (2005); Herander and Saavedra (2005); Blanes and Martín-Montaner (2006); Dunlevy (2006); Bandyopadhyay, Coughlin, and Wall (2008); Bettin and Lo Turco (2008); Dolman (2008); Foad (2008); and Morgenroth and O’Brien (2008).
3. Countries that are far apart trade much less than countries that are near one another. Colonial ties are important. Landlocked countries trade less than countries with coasts.
4. Transnational companies often make investments based on their ethnic ties (Aykut and Ratha 2003). For example, some ethnic Korean companies invest in Kazakhstan and some ethnic Chinese companies invest in the East Asia and Pacifi c Region.
5. http://www.eac.int/invest/index.php?option=com_content&view=article& id=53:eac-diaspora&catid=39:global-east-africans.
6. Data from African household surveys conducted in Burkina Faso, Kenya, Nigeria, Senegal, South Africa, and Uganda do not indicate that African migrants invest in agricultural equipment (Plaza, Navarrete, and Ratha 2011).
7. http://www.slideshare.net/ifad/vincent-okele.8. http://www.rwandandiaspora.gov.rw/rwanda-investment/housing.html.9. These estimates—which update the estimates in Ratha, Mohapatra, and
Plaza (2009)—are based on the assumptions that members of the African diaspora with tertiary education earn the average income of their host countries, that migrants without tertiary education earn a third of the average household incomes of the host countries, and that both skilled and unskilled migrants have the same personal savings rates as in their home countries.
10. According to Ketkar and Ratha (2009a), the Development Corpora-tion for Israel (DCI) raised more than $25 billion from diaspora bonds. Jewish diaspora investors pay a steep price premium (perhaps better characterized as a large patriotic yield discount) when buying DCI bonds. The State Bank of India raised $11.3 billion through three issues of diaspora bonds, issued after ordinary sources of funding had all but vanished in 1991, following the balance of pay-ments crisis], and in 1998, after the country conducted nuclear tests.
11. See Negash (2009) and Mersha (2009) for a description of the Ethiopian Diaspora Investment Potential and the millennium bond issued by the Ethio-pian Electric Power Corporation.
Harnessing the Resources of the Diaspora • 181
12. Countries outside Africa that can issue diaspora bonds include Bang-ladesh, Colombia, El Salvador, Haiti, India, Jamaica, Mexico, Nepal, Pakistan, Philippines, Romania, Sri Lanka, and Tajikistan.
13. Several diaspora investment funds have been created or are in the proc-ess of being created and registered. One example is the Diaspora Unit Trust Funds Schemes (DUTFS), a collective investment scheme licensed by the Capital Markets Authority of Kenya. See http://www.mobilepay.co.ke/tangaza/2010/04/kenyans-abroad-to-benefi t-from-the-diaspora-investment-fund/.
14. A private company, PHB Asset Management Limited, a subsidiary of Bank PHB Plc, manages the $200 million diaspora investment fund set up by the Nigerians in Diaspora Organisation Europe (NIDOE) in 2008 (http://timbuktu chronicles.blogspot.com/2008/03/diaspora-investment-fund.html).
15. Diaspora groups in Africa that have formed organizations include Soma-lis in Kenya, Zimbabweans in South Africa, and various groups in Côte d’Ivoire. Associations of Zimbabweans in the diaspora contributed fuel, food, and medi-cines to Zimbabwe during the economic crisis through the Global Zimbabwe Forum.
16. For example, the countries with the largest numbers of Ghanaians are the United States and the United Kingdom (about 100,000 migrants each), Italy (50,000), Germany (34,000), and the Netherlands (20,000). There are about 100 Ghanaian associations in the United Kingdom (Van Hear, Pieke, and Vertovec 2004); 200 in the United States; 21 in Germany; and 70 in the Netherlands.
17. See Alarcon 2002; Goldring 2004; and Orozco and Welle 2006 for a review of Asian and Latin American associations.
18. People interviewed include members of diaspora organizations in Den-mark, South Africa, the United Kingdom, and the United States, and embassy offi cials in France, South Africa, the United Arab Emirates, the United Kingdom, and the United States. In the United States, the interviews covered 10 groups from Ethiopia, Liberia, Mali, and Nigeria and two organizations covering Africa.
19. Trans and Vammen (2011) cite an association that sends regular dona-tions to Eritrea to support development projects.
20. Interviews with African diaspora organizations in the United States indicated that their members volunteer their time and work for the diaspora association’s activities after normal work hours. To raise funds, these associations sponsor runners in marathons and organize arts and crafts fairs and other events. Membership fees are low, so they cannot fully cover the associations’ activities.
21. Meyer and Brown (1999) describe three categories of diaspora involve-ment: student networks, local associations of skilled expatriates, and scientifi c diaspora networks.
22. Arora and Gambardella (2004) and Commander and others (2004) describe the role Indian professionals in the diaspora played in promoting India as an outsourcing destination.
23. Associations of Chinese and Indian scientists and engineers living abroad exchange information and collaborate on research and development projects with scientists in their countries of origin (Saxenian 2002b). Financing local sabbatical stays for researchers living abroad as well providing them with the opportunity to teach short courses or workshops are good measures to promote exchange. African associations that engage in these activities include the Inter-national Society of African Scientists (Delaware) and the Ethiopian Scientifi c Society (Washington, DC). The Carnegie Institute for Advanced Study Regional Initiative in Science and Education (RISE) aims to strengthen higher education
182 • Leveraging Migration for Africa: Remittances, Skills, and Investments
in Sub-Saharan Africa by increasing the number of qualifi ed professors teaching in Africa’s universities. Members of the diaspora can contribute by teaching short courses, hosting RISE students at laboratories abroad, and engaging in collabo-rative research with researchers in their home countries. The Nelson Mandela Research Center sponsors professors from the diaspora who teach in African universities.
24. A person can acquire citizenship by place of birth (the jus soli rule of citizenship), by descent according to blood kinship (jus sanguinis), or by natu-ralization. Most countries apply one or a combination of the three rules. Canada and the United States are the only developed countries that still offer birthright citizenship to tourists and undocumented people.
25. For Kenya, see http://www.cnn.com/2010/WORLD/africa/08/05/kenya.elections/index.html.
26. The PIO card also grants holders of Indian passports access to all facili-ties in acquiring, holding, transferring, and disposing of immovable properties in India, except in matters relating to the acquisition of agricultural/plantation properties. The card does not allow holders to vote.
27. See http://www.afriqueavenir.org/en/2010/08/03/nigerians-in-the-diaspora-demand-voting-rights-in-2011-election/.
28. See the REMPLOD research project (Van Dijk and others 1978).29. http://www.usaid.gov/our_work/global_partnerships/gda/remittances.html.30. http://www.ambafrance-uk.org/France-Africa-Summit-conclusions.html.31. Examples include Germany since 1972, the Netherlands since 1975, France
since 1977, and Spain since 2008 (https://blogs.worldbank.org/peoplemove/ volunteers-wanted-will-spain-successfully-entice-unemployed-migrants-to-leave).
32. http://www.iom.int/jahia/Jahia/activities/by-theme/migration-development/ mida-africa/how-it-works.
33. http://www.migration4development.org/content/mida-migration- development-africa.
34. A 2003–05 Ghanaian poverty reduction strategy paper that proposed establishing a Non-Resident Ghanaian Fund for poverty projects was never implemented. A 2007 Kenya Diaspora bill, designed to increase benefi ts from the diaspora, was never passed. Nigeria launched a dialogue with Nigerians abroad to incorporate their views in national development policies.
35. This mandate led to the adoption of a new Article 3: “to invite and encourage the full participation of the African diaspora as an important part of our continent, in the building of the AU (Legwaila 2006).
36. See the report from an AU–UN gathering of the diaspora in New York, October 20–21, 2010 (http://kingdomzx.net/forum/topics/report-from-recent-african?xg_source=activity).
37. The World Bank’s strategy for engaging the African diaspora involves working with the African Union Commission and country governments to help create enabling environments for diaspora engagement and working with devel-opment partners to support diaspora development projects in Africa. In July 2008, the Bank signed an agreement with the African Union.
38. It is necessary that all merchandise meant for charity purposes fulfi ll the same inspection, quality control, and certifi cation processes required for other imports.
Harnessing the Resources of the Diaspora • 183
BIBLIOGRAPHYAbella, M., and F. Alburo. 2003. “Driving Forces of Labour Migration in Asia.” In
World Migration 2003. Geneva: International Organization for Migration. ADB (Asian Development Bank). 2004. Technical Assistance for the Southeast Asia
Workers’ Remittance Study. http://www.adb.org/Documents/TARs/REG/tar-stu- 38233.pdf.
Adepoju, A. 2005a. “Migration in West Africa.” Paper prepared for the Policy Analysis and Research Program of the Global Commission on International Migration, Global Commission on International Migration, Geneva. http://www.gcim.org/attachements/RS8.pdf.
———. 2005b. “Patterns of Migration in West Africa.” In At Home in the World: International Migration and Development in Contemporary Ghana and West Africa, ed. T. Manuh, 24–54. Accra: Sub-Saharan Publishers.
African Union. n.d. “Statement at the African Union Consultation with the Afri-can Diaspora in the US: Building Bridges across the Atlantic.” http://www.unohrlls.org/en/orphan/791/.
———. 2005. Report of the Meeting of Experts from Member States on the Defi nition of the African Diaspora. Addis Ababa, April 11–12.
Ahmed, S. 2000. Strange Encounters: Embodied Others in Post-Coloniality. London: Routledge.
Alarcon, R. 2002. “The Development of Home Town Associations in the United States and the Use of Social Remittances in Mexico.” In Sending Money Home: Hispanic Remittances and Community Development, ed. R. O. de la Garza and B. L. Lowell. Lanham, MD: Rowman & Littlefi eld Publishers.
Ammassari, S. 2006. “From Nation-Building to Entrepreneurship: The Impact of Elite Return Migrants in Côte d’Ivoire and Ghana.” Paper presented at the International Workshop on Migration and Poverty in West Africa, University of Sussex, United Kingdom, March 13–14.
Arocena, R. A. 2006. “Brain Drain and Innovation Systems in the South.” Inter-national Journal on Multicultural Societies 8 (1): 43–60.
Arora, Ashish, and Alfonso Gambardella. 2004. “The Globalization of the Soft-ware Industry: Perspectives and Opportunities for Developed and Develop-ing Countries.” NBER Working Papers 10538, National Bureau of Economic Research, Cambridge, MA.
Aydagul, B., Suhas Ketkar, and Dilip Ratha. 2010. “Diaspora Bonds for Funding Education.” Paper presented at the Soros Foundation, New York.
Aykut, Dilek, and Dilip Ratha. 2003. “South-South FDI Flows: How Big Are They?” Transnational Corporations 13 (1): 149–76.
Ba, H. 2006. “Les statistiques des travailleurs migrants en Afrique de l’Ouest.” Cahier des Migrations Internationales 79F, Bureau International du Travail, Geneva.
Bakewell, Oliver. 2008. “In Search of the Diaspora within Africa.” Africa Diaspora 1 (1): 5–27.
Bandyopadhyay, Subhayu, Cletus C. Coughlin, and Howard J. Wall, 2008. “Ethnic Networks and U.S. Exports.” Review of International Economics 16 (1): 199–213.
Bardhan, Ashok Deo, and Subhrajit Guhathakurta. 2004. “Global Linkages of Subnational Regions: Coastal Exports and International Networks.” Contem-porary Economic Policy 22 (2): 225–36.

184 • Leveraging Migration for Africa: Remittances, Skills, and Investments
Barré, Remi, V. Hernández, J-B. Meyer, and D. Vinck. 2003. Diasporas scientifi -ques? Comment les pays en développement peuvent-ils tirer parti de leurs chercheurs et de leurs ingénieurs expatriés? Institute de Recherche pour le Développement, Paris.
Bettin, Giulia, and Alessia Lo Turco. 2008. “A Cross Country View on South-North Migration and Trade: Dissecting the Channels.” Revised March 31, 2010. Department of Economics, Università Politecnica delle Marche, Ancona, Italy. http://ssrn.com/abstract=1233544.
Bevelander, P., and R. Pendakur. 2009. “Citizenship, Co-ethnic Populations and Employment Probabilities of Immigrants in Sweden.” IZA Working Paper 4495, Institute for the Study of Labor, Bonn.
Biopact. 2007. “Spain and Senegal to Cooperate on Biofuels as a Way to Curb Ille-gal Migration.” http://biopact.com/2007/08/spain-and-senegal-to-cooperate-on.html.
Black, R., and A. Castaldo. 2009. “Return Migration and Entrepreneurship in Ghana and Côte d’Ivoire: The Role of Capital Transfers.” Tijdschrift voor Econo-mische en Sociale Geografi e 100 (1): 44 –58. Oxford.
Black, R., K. Koser, K. Munk, G. Atfi eld, L. D’Onofrio, and R. Tiemoko. 2004. Understanding Voluntary Return. Home Offi ce Online Reports, London.
Blanes, J. V. 2005. “Does Immigration Help to Explain Intra-Industry Trade? Evidence for Spain.” Review of World Economics 141 (2): 244–70.
Blanes, J. V., and J. A. Martín-Montaner. 2006. “Migration Flows and Intra-Indus-try Trade Adjustment.” Review of World Economics 142 (3): 568–85.
Blanes Cristóbal, J. V. 2004. “Does Immigration Help to Explain Intra-Industry Trade? Evidence for Spain.” Economic Working Papers at Centro de Estudios Andaluces E2004/29, Seville, Spain.
Brown, Jan H. 2009. “Dual Citizenship: Living on Both Sides of the Global Fence.” NYSBA International Law Practicum 22 (Autumn): 2.
Bryant, J., and D. Law. 2004. “New Zealand’s Diaspora and Overseas-born Pop-ulation.” Working Paper 04/13, New Zealand Treasury, Wellington. http://www.treasury.govt.nz/publications/research-policy/wp/2004/04-13.
Business Asia. 1994. “Human Reunifi cation.” 26: 5–6. Cassini, S. 2005. “Negotiating Personal Success and Social Responsibility: Assess-
ing the Developmental Impact of Ghanaian Migrants’ Business Enterprises in Ghana.” Master’s thesis, International School for Humanities and Social Sciences, University of Amsterdam.
Chakco, Elizabeth, and P. Gebre. 2009. “Leveraging the Diaspora for Develop-ment: Lessons from Ethiopia.” Paper presented at the International Conference on Diaspora for Development, World Bank, Washington, DC, July 13–14.
Chaparro, Fernando, H. Jaramillo, and V. Quintero 1994. “Role of Diaspora in Facilitating Participation in Global Knowledge Networks: Lessons of Red Caldas in Colombia.” Report prepared for the Knowledge for Development Program of the World Bank, Bogota.
Cheran, R. 2004. “Diaspora Circulation and Transnationalism as Agents for Change in the Post-confl ict Zones of Sri Lanka.” Policy paper submitted to the Berghof Foundation for Confl ict Management, Berlin.
Chikezie, Chukwu-Emeka. 2000. “Africans Help Their Homelands.” West Africa 13 (November): 12–14.
Chiswick, Barry. 1978. “The Effect of Americanization on the Earnings of Foreign-Born Men.” Journal of Political Economy 86 (5): 897–921.
Co, Catherine Y., Patricia Euzent, and Thomas Martin. 2004. “The Export Effect of Immigration into the USA.” Applied Economics 36 (6): 573–83.

Harnessing the Resources of the Diaspora • 185
Combes, Pierre-Philippe, Miren Lafourcade, and Theirry Mayer. 2003. “Can Busi-ness and Social Networks Explain the Border Effect Puzzle?” CEPR Discussion Paper 3750, Center for Economic and Policy Research, London.
Commander, Simon, Rupa Chanda, Mari Kangasniemi, and Alan Winters. 2004. “Must Skilled Migration Be a Brain Drain? Evidence from the Indian Software Industry.” IZA Discussion Paper 1422, Institute for the Study of Labor, Bonn.
Constant, Amelie, and Douglas Massey. 2002. “Return Migration by German Guestworkers: Neoclassical versus New Economic Theories.” International Migration 40 (4): 5–38.
Council of Europe. 2010. “Voluntary Return Programmes: An Effective, Humane and Cost Effective Mechanism for Returning Irregular Migrants.” Parlia-mentary Assembly. http://assembly.coe.int/Documents/WorkingDocs/Doc10/EDOC12277.pdf.
Crush, Jonathan. 2010. “Diaspora Networks at Work in SADC.” Paper presented at the conference “Africa’s New Frontier: Innovation, Technology, Prosperity,” Ottawa, February 4.
———. 2011. “Diasporas of the South: Situating the African Diaspora in Africa.” In Diaspora for Development in Africa, ed. Sonia Plaza and Dilip Ratha. Wash-ington, DC: World Bank.
Debabrata, Patra, and Muneesh Kapur. 2003. “Indians’ Worker Remittances: A Users’ Lament about Balance of Payments Compilation.” Paper presented at the 16th Meeting of the IMF Committee on Balance of Payment Statistics, Washington, DC, December 1–5.
de Bree, June, Tine Davids, and Hein de Haas. “Post-return Experiences and Transnational Belonging of Return Migrants: A Dutch-Moroccan Case Study.” Global Networks: A Journal of Transnational Affairs 10: 489–509. doi: 10.1111/j.1471-0374.2010.00299.
de Haas, Hein. 2005. “International Migration, Remittances and Development: Myths and Facts.” Third World Quarterly 26 (8): 1269–84.
———. 2006. “Engaging Diasporas: How Governments and Development Agen-cies Can Support Diaspora Involvement in the Development of Origin Coun-tries.” International Migration Institute, Oxford.
Dickinson, D. 2003. “How Networking Can Help Mitigate the Brain Drain.” Sci-ence and Development Network SciDevNet. http://unpan1.un.org/intradoc/groups/public/documents/APCITY/UNPAN022377.pdf.
Docquier, Frédéric, and Elisabetta Lodigiani. 2007. “Skilled Migration and Business Networks.” Development Working Paper 234, Centro Studi Luca d’Agliano, University of Milano, Milan.
Dolman, B. 2008. “Migration, Trade and Investment.” Productivity Commission Staff Working Paper, Canberra, Australia.
Dunlevy, James. A. 2003. “Interpersonal Networks in International Trade; Evi-dence on the Role of Immigration in Promoting Exports from the American States.” Paper presented at the Seventh Annual Meeting of the International Society for New Institutional Economics, Budapest, September 12.
———. 2004. “Interpersonal Networks in International Trade: Evidence on the Role of Immigrants in Promoting Exports from the American States.” Work-ing Paper, Department of Economics Miami University, Oxford, OH.
———. 2006. “The Infl uence of Corruption and Language on the Pro-trade Effect of Immigrants: Evidence from the American States.” Review of Economics and Statistics 88 (1): 182–86.
Dunlevy, James A., and William K. Hutchinson. 1999. “The Impact of Immigra-tion on American Import Trade in the Late Nineteenth and Early Twentieth Centuries.” Journal of Economic History 59 (04): 1043–62.

186 • Leveraging Migration for Africa: Remittances, Skills, and Investments
Easterly, W., and Yaw Nyarko. 2008. “Is the Brain Drain Good for Africa?” Brook-ings Global Economy and Development Working Paper 19, Washington, DC.
ECA (Economic Commission for Africa). 2006. International Migration and Devel-opment: Implications for Africa. New York: Economic Commission of Africa.
EU (European Union). 2007. “Circular Migration and Mobility Partnerships between the European Union and Third Countries.” Press release, May 16. http://europa.eu/rapid/pressReleasesAction.do?reference=MEMO/07/197.
EuropeAid, Unit E3. 2010. “Social and Human Development and Migration.” Report circulated at the Global Forum on Migration and Development, Puerto Vallarta, Mexico, November 9–11.
Federal Negarit Gazeta of the Federal Democratic Republic of Ethiopia. 2002. Proclamation 270/202. Providing Foreign Nationals of Ethiopian Origin with Cer-tain Rights to be Exercised in Their Country of Origin Proclamation. February 3, Addis Ababa.
———. 2003. Proclamation 84. Finch, Tim, Holly Andrew, and Maria Latorre. 2010. “Global Brit: Making the
Most of the British Diaspora.” June, Institute for Public Policy Research, London.
Foad, Hishman. 2008. “FDI and Immigration: A Regional Analysis.” Department of Economics, San Diego State University, San Diego, CA. http://papers.ssrn.com/sol3/papers.cfm?abstract_id=1092286.
French Ministry of Foreign Affairs. n.d. Diplomatie France. http://www.diplomatie.gouv.fr/fr/pays-zones-geo_833/senegal_355/presentation-du-senegal_1293/index.html)
French Senate. 2007. Le co-développement à l’essai. Travaux Parlementaires, Rapports d’information No. 417 (2006–2007) de Mme. Catherine Tasca, MM. Jacques Pelletier et Bernard Barraux, fait au nom de la Commission DES Affaires Etrangères, déposé le 25 juillet, Paris. http://www.senat.fr/rap/r06-417/r06-417.html.
Gao, T. 2000. “Ethnic Chinese Networks and International Investment: Evidence for Inward FDI in China.” Working Paper 00-08, Department of Economics, University of Missouri.
Ghai, D. 2004. “Diasporas and Development: The Case of Kenya.” Global Migration Perspectives 10, Global Commission on International Migration, Geneva. http://www.gcim.org/attachements/GMP%20No%2010.pdf.
Gillespie, Kate. 1999. “Diaspora Interest in Homeland Investment.” Journal of International Business Studies 30 (3): 623–34.
Girma, Sourafel, and Zhihao Yu. 2002. “The Link between Immigration and Trade: Evidence from the United Kingdom.” Review of World Economics 138 (1): 115–30.
Gitmez, A. S. 1988. “The Socio-economic Re-integration of Returned Workers: The Case of Turkey.” In International Migration Today, ed. C. Stahl. Paris: United Nations Educational, Scientifi c and Cultural Organization (UNESCO).
Goldring, Luin. 2004. “Family and Collective Remittances to Mexico: A Multi-Dimensional Typology of Remittances.” Development and Change 35 (4): 799–840.
Gould, David. 1990. “Immigrant Links to the Home Country: Implications for Trade, Welfare and Factor Returns?” Ph.D. diss., Department of Economics University of California, Los Angeles.
———. 1994. “Immigrants’ Links to the Home Country: Empirical Implica-tions for U.S. Bilateral Trade Flows.” Review of Economics and Statistics 76 (2): 302–16.

Harnessing the Resources of the Diaspora • 187
Guarnizo, L. 2003. “The Economics of Transnational Living.” International Migra-tion Review 37 (3): 666–99.
Gubert, Flore, and Christophe J. Nordman. 2011. “Return Migration and Small Enterprise Development in the Maghreb.” In Diaspora for Development in Africa, ed. Sonia Plaza and Dilip Ratha. Washington, DC: World Bank.
Hansen, P., and N. Kleist. 2008. “Somali Collective Remittances: Diaspora Con-tributions to Confl ict, Peace and Development in the Somali Homelands.” Background paper for the Africa Migration Project, Danish Institute for Inter-national Studies, Copenhagen.
Head, Keith, and John Ries.1998. “Immigration and Trade Creation; Economet-ric Evidence from Canada.” Canadian Journal of Economics 31 (1): 47–62.
Helliwell, J. 1997. “National Borders, Trade and Migration.” Pacifi c Economic Review 2 (3): 165–85.
Herander, Mark, and Luz A. Saavedra. 2005. “Exports and the Structure of Immigrant-Based Networks: The Role of Geographic Proximity.” Review of Economics and Statistics 87(2): 323–35.
Hutchinson, W., and J. Dunlevy. 2001. “The Pro-trade Effect of Immigration on American Exports During the Period 1870 to 1910.” Working Paper 0125, Department of Economics, Vanderbilt University, Nashville, TN.
ICMPD–IOM (International Centre for Migration Policy Development–Inter-national Organization for Migration). 2010. Linking Emigrant Communi-ties for More Development. Inventory of Institutional Capacities and Practices. Joint ICMPD–IOM Project Report. Vienna. http://www.icmpd.org/fi leadmin/ICMPD-Website/Emigrant_Communities_Project/Inventory_EN.pdf.
IOM (International Organization for Migration). 2004. “Migration from Latin America to Europe: Trends and Policy Challenges.” IOM Migration Research Series No. 16. Geneva.
Ionescu, Dina. 2006. “Engaging Diasporas as Development Partners for Home and Destination Countries: Challenges for Policymakers.” Migration Research Series 26, International Organization for Migration, Geneva.
Javorcik, Beata S., Caglar Ozden, Mariana Spatareanu, and Cristina Neagu. 2006. “Migrant Networks and Foreign Direct Investment.” Policy Research Working Paper 4046, World Bank, Washington, DC.
Jones-Correa, Michael. 2001. “Under Two Flags: Dual Nationality in Latin Amer-ica and Its Consequences for Naturalization in the United State.” International Migration Review 35 (4): 997–1029.
Ketkar, Suhas L., and Manoj K. Dora. 2009. “Wealth of Recent Immigrants to the United States.” Paper presented at the International Conference on Diaspora for Development, World Bank, Washington, DC, July 13–14.
Ketkar, S., and D. Ratha. 2009a. Innovative Financing for Development. Washing-ton, DC: World Bank.
———. 2009b. “New Paths to Funding.” Finance and Development (June): 43–45. International Monetary Fund, Washington, DC.
———. 2010. “Diaspora Bonds: Tapping the Diaspora during Diffi cult Times.” Journal of International Commerce, Economics and Policy 1 (2): 252.
Khadria, Binod. 1999. The Migration of Knowledge Workers: Second-Generation Effects of India’s Brain Drain. New Delhi: Sage Publications.
King, Russell. 1986. Return Migration and Regional Economic Problems. London: Croom Helm.
Kingslye, Aiking, Anita Sand, and Nicola White. 2009. “The Global Irish Mak-ing a Difference Together: A Comparative Review of International Diaspora Strategies.” Ireland Funds Report, Dublin.

188 • Leveraging Migration for Africa: Remittances, Skills, and Investments
Kluger, M., and H. Rapoport. 2005. “Skilled Emigration, Business Networks, and Foreign Direct Investment.” CESifo Working Paper 1455, Munich.
Kuznetsov, Y. 2006. Diaspora Networks and the International Migration of Skills: How Countries Can Draw on Their Talent Abroad. Washington, DC: World Bank.
Lacroix, T. 2003. “Espace transnational et territoires: les réseaux marocains du développement.” Ph.D. diss., Université de Poitiers, Poitiers, France.
Leblang, D. 2011. “Another Link in the Chain: Migrant Networks and Interna-tional Investment.” In Diaspora for Development in Africa, ed. Sonia Plaza and Dilip Ratha. Washington, DC: World Bank.
Legwaila, L. J. 2006. “The Role of the Diaspora in Support of Africa’s Develop-ment.” African Leadership Diaspora Forum, London.
Light, Ivan, M. Zhou, and R. Kim. 2002. “Transnationalism and American Exports in an English-Speaking World.” International Migration Review 36 (3): 702–25.
Lindley, A. 2005. “Infl uence of Remittances and Diaspora Donations on Educa-tion.” Paper presented at the Conference on Somali Remittances, Washing-ton, DC, December 1–2.
Lodigian, Elizabetta. 2009. “Diaspora Externalities as a Cornerstone of the New Brain Drain Literature.” CREA Discussion Paper 2009-03, Center for Research in Economic Analysis, University of Luxembourg.
Lowell, L., and S. Gerova. 2004. Diasporas and Economic Development: State of Knowledge. Washington, DC: World Bank.
Lucas, R. B. E. 2001. “Diaspora and Development: Highly Skilled Migrants from East Asia.” Institute for Economic Development Working Paper 120, Depart-ment of Economics, Boston University, Boston, MA.
———. 2004. International Migration and Economic Development: Lessons from Low-Income Countries. London: Edward Elgar Publishing.
Mahroum, S., C. Eldridge, and A. S. Daar. 2006. “Transnational Diaspora Options: How Developing Countries Could Benefi t from Their Emigrant Populations.” International Journal on Multicultural Societies 8 (1): 25–42.
Marks, Jonathan. “Expatriate Professionals as an Entry Point into Global Knowledge- Intensive Value Chains: South Africa.” Report prepared for the Knowledge for Development Program, World Bank Institute, Washington, DC. http://siteresources.worldbank.org/EDUCATION/Resources/278200-1126210664195/1636971-1126210694253/South_Africa_Diasporas.pdf.
Massey, D. S., Rafael Alarcon, Jorge Durand, and Humberto Gonzalez. 1987. Return to Aztlan: The Social Process of International Migration from Western Mexico. Berkeley: University of California Press.
Mazzolari, Francesca. 2007. “Dual Citizenship Rights: Do They Make More and Better Citizens?” IZA Discussion Paper 3008, Institute for the Study of Labor, Bonn, Germany.
McCormick and Wahba 2003. “Return International Migration and Geographical Inequality: The Case of Egypt.” Journal of African Economies 12 (4): 500–32.
McKenzie, David J., and Johan Mistiaen. 2007. “Surveying Migrant Households: A Comparison of Census-Based, Snowball, and Intercept Point Surveys.” IZA Discussion Paper 3173, Institute for the Study of Labor, Bonn, Germany.
Mersha, Genet. 2009. “The Gilgel Gibe Saga: The Bond and Dilemma of Ethiopian Diaspora for a Description of the Main Features of the Millennium Bond.” Ethio Quest News, April 5. http://www.ethioquestnews.com/Perspective/ Gilgel_Gibe_Saga.html.

Harnessing the Resources of the Diaspora • 189
Meyer, J-B., and M. Brown. 1999. “Scientifi c Diasporas: A New Approach to the Brain Drain.” Discussion Paper 41, United Nations Educational, Scientifi c and Cultural Organization (UNESCO), Paris. http://www.unesco.org/most/meyer.htm.
Meyer, J-B., and J-P. Quattiaus. 2006. “Diaspora Knowledge Networks: Vanishing Doubts and Increasing Evidence.” International Journal on Multicultural Socie-ties 8 (1): 4 –24.
Mohamoud, Awil. 2003. “African Diaspora and Development of Africa.” Report prepared for the African Diaspora Summit in the Netherlands, Felix Meritis European Centre for Art, Culture and Science, Amsterdam, December 16.
———, ed. 2010. Building Institutional Cooperation between the Diaspora and Homeland Governments in Africa. The Cases of Ghana, Nigeria, Germany, USA and the UK. The Hague: African Diaspora Policy Initiative, Africa Diaspora Policy Centre.
Mohan, Giles, and A. B. Zack-Williams. 2002. “Globalisation from Below: Conceptualising the Role of the African Diaspora in Africa’s Development.” Review of African Political Economy 92 (29): 211–36.
Morgenroth, E. L. W., and M. D. O’Brien. 2008. “Some Further Results on the Impact of Migrants on Trade.” Working Paper DYNREG26, Economic and Social Research Institute, Dublin. http://ideas.repec.org/p/esr/wpaper/dynreg 26.html.
Murat, M., B. Pistoresi, and A. Rinaldi. 2008. “Italian Diaspora and Foreign Direct Investment: A Cliometric Perspective.” Paper presented at the Economic His-tory Society Annual Conference, University of Nottingham, United Kingdom, March 28–30. http://www.eco.unc.edu.ar/ief/workshops/2008/24abril2008_Murat_Pistoresi_Rinaldi_EHR.pdf.
Murillo Castaño, Gabriel. 1988. “International Labor Migration and Refugees in the Americas: Issues for Hemispheric Cooperation.” In Defense of the Alien: Immigration Reform, Temporary Workers, Supreme Court, Private Sector, Legal Aspects of Detention and Sanctuary Movement 10: 182–213.
Murphy, Rachel. 2000. “Migration and Inter-household Inequality: Observations from Wanzai County, Jiangxi.” China Quarterly 164: 965–82.
National Audit Offi ce. 2005. “Returning Failed Asylum Applicants, 19/7/2005.” Press Notice.
Ndiaye, Ndioro, Sussane Melde, and Rougui Ndiaye-Coïc. 2011. “The Migration for Development in Africa (MIDA) Experience and Beyond.” In Diaspora for Development, ed. Sonia Plaza and Dilip Ratha. Washington, DC: World Bank.
Negash, Minga. 2009. “Ethiopian Diaspora Investment Potential and EEPCO’s Millenium Bond.” University of Witwatersrand, Johannesburg. http://www.ethiopianreview.info/2010/minga-negash-ethiopia-diaspora-investment- potential-article-march-2009.pdf.
Newland, K., and E. Patrick. 2004. “Beyond Remittances: The Role of Diaspora in Poverty Reduction in their Countries of Origin.” Scoping study for the Department of International Development prepared by the Migration Policy Institute, Washington, DC.
Nielsen, T. M., and L. Riddle. 2007. “Why Diasporas Invest in the Homelands: A Conceptual Model of Motivation.” School of Business, George Washing-ton University, Washington, DC. http://papers.ssrn.com/sol3/Papers.cfm? abstract_id=987725.

190 • Leveraging Migration for Africa: Remittances, Skills, and Investments
OECD (Organisation for Economic Co-operation and Development). 2010. The Contribution of Diaspora Return to Post-Confl ict and Fragile Countries. Key Find-ings and Recommendations. Paris: Partnership for Democratic Governance.
Orozco, M. 2003. “The Impact of Migration in the Caribbean and Central American Region.” Focal Policy Paper FPP-03-03, Canadian Foundation for the Americas, Ottawa. http://www.focal.ca/pdf/migration.pdf.
———. 2005. “Diasporas, Development and Transnational Integration: Ghana-ians in the U.S., U.K. and Germany.” Inter-American Dialogue, Georgetown University, Washington, DC.
———. 2006a. “Conceptualizing Diasporas: Remarks about the Latino and Car-ibbean Experience.” Paper presented at the International Forum on Remit-tances, Inter-American Development Bank, Washington, DC. http://idbdocs.iadb.org/wsdocs/getdocument.aspx?docnum=561695.
———. 2006b. “Diaspora and Development: Some Considerations.” June, Inter-American Dialogue, Washington, DC. http://www.thedialogue.org/page.cfm? pageID=32&pubID=1010&s=.
———. 2006c. “Migrant Hometown Associations (HTAs): The Human Face of Globalization.” In World Migration Report 2005. Geneva: International Organization for Migration.
Orozco, M., and K. Welle. 2006. “Hometown Association and Development: Ownership, Correspondence, Sustainability and Replicability.” In New Pat-terns for Mexico, ed. Barbara Merz. Cambridge, MA: Harvard University Press.
Orozco, Manuel, and Rebecca Rouse. 2007. Migrant Hometown Associations and Opportunities for Development: A Global Perspective. February, Migration Infor-mation Source, Migration Policy Institute, Washington, DC.
Osili, U. 2004. “Migrants and Housing Investments: Theory and Evidence from Nigeria.” Economic Development and Cultural Change 52 (4): 821–49.
Pack, H., and John Page. 1994. “Accumulation, Exports, and Growth in the High-Performing Asian Economies.” Carnegie-Rochester Conference Series on Public Policy 40 (1): 199–235.
Page, John, and Sonia Plaza. 2006. “Migration, Remittances and Economic Development: A Review of Global Evidence.” Journal of African Economies 15 (2): 245–336.
Palmer, C. A. 1998. “Defi ning and Studying the Modern African Diaspora.” Perspectives (September). http://www.historians.org/perspectives/issues/1998/ 9809/9809VIE2.CFM.
Pang, T., M. Lansang, and A. Haines. 2002. “Brain Drain and Health Profession-als.” British Medical Journal Online.
Panizzon, V. 2011. “From Co-development to Solidarity Development: French Policies of Subsidizing Migrant Transmission Mechanisms in a Eurafrican Context.” In Diaspora for Development in Africa, ed. Sonia Plaza and Dilip Ratha. Washington, DC: World Bank.
Paul, Alison, and Sarah Gammage 2005. “Hometown Associations and Develop-ment: The Case of El Salvador.” Destination. Working paper 3, Washington, DC.
Paulson, A., and U. Okonkwo Osili. 2007. “Immigrants’ Access to Financial Ser-vices and Asset Accumulation.” Working paper. http://www.econ.yale.edu/seminars/labor/lap07/osili-paulson-071105.pdf.
Plaza, Sonia. 2008a. “Mobilizing the Diaspora: Creating and Enabling Environ-ment for Trade, Investment, Knowledge Transfer and Enterprise Develop-ment.” In Africa’s Finances: The Contribution of Remittances, ed. Raj Bardouille, Muna Ndulo, and Margaret Grieco. Cambridge Scholars Publishing.

Harnessing the Resources of the Diaspora • 191
———. 2008b. “Volunteers Wanted: Will Spain Successfully Entice Unemployed Migrants to Leave?” September 23, People Move Blog, World Bank, Washing-ton, DC. https://blogs.worldbank.org/peoplemove/volunteers-wanted-will-spain-successfully-entice-unemployed-migrants-to-leave.
———. 2009a. “Promoting Diaspora Linkages: The Role of Embassies.” Confer-ence on Diaspora and Development, July 14, World Bank, Washington, DC.
———. 2009b. “Labor Mobility and Circular Migration: What Are the Challenges of the Stockholm Program.” November 2, People Move Blog, World Bank, Washington, DC. https://blogs.worldbank.org/peoplemove/labor-mobility-and-circular-migration-what-are-the-challenges-of-the-stockholm-program.
Plaza, Sonia, Mario Navarrete, and Dilip Ratha. 2011. “Migration and Remit-tances Household Surveys in Sub-Saharan Africa: Methodological Aspects and Main Findings.” Background paper. World Bank, DEC-PREM, Migration and Remittances Unit, Washington, DC.
Portes, A., C. Escobar, and A. W. Radford. 2007. “Immigrant Transnational Organizations and Development: A Comparative Study.” International Migra-tion Review 41 (1): 242–81.
Rannverg, Dovelyn Agunias, ed. 2009. Closing the Distance: How Governments Strengthen Ties with their Diasporas. Washington, DC: Migration Policy Institute.
Ratha, Dilip. 2010. “Diaspora Bonds for Development Financing during the Crisis.” October 26, People Move Blog, World Bank, Washington, DC. http://blogs.worldbank.org/peoplemove/diaspora-bonds-for-development- fi nancing- during-a-crisis.
Ratha, Dilip, and Suhas Ketkar. 2011. “Diaspora Bonds: Tapping the Diaspora during Diffi cult Times:” In Diaspora for Development in Africa, ed. Sonia Plaza and Dilip Ratha. Washington, DC: World Bank.
Ratha, Dilip, and Sanket Mohapatra. 2011. “Preliminary Estimates of Diaspora Savings.” Migration and Development Brief 14, World Bank, Washington, DC.
Ratha, Dilip, Sanket Mohapatra, and Sonia Plaza. 2009. “Beyond Aid: New Sources and Innovative Mechanisms for Financing Development in Sub-Saharan Africa.” In Innovative Financing for Development, ed. Dilip Ratha and Suhas Ketkar. Washington, DC.
Ratha, Dilip, and William Shaw. 2007. “South-South Migration and Remit-tances.” World Bank Development Prospects Group Working Paper 102, Washington, DC.
Rauch, James. 1999. “Networks versus Markets in International Trade.” Journal of International Economics 48 (1): 7–35.
———. 2001. “Business and Social Networks in International Trade.” Journal of Economic Literature 39 (December): 1177–203.
———. 2003. “Diasporas and Development: Theory, Evidence, and Program-matic Implications.” Department of Economics, University of California, San Diego. USAID/TESS–funded project. http://www.tessproject.org/products/special_studies/diasporas.pdf =.
Rauch, James, and Alessandra Casella. 1998. “Overcoming Informational Barri-ers to International Resource Allocation: Prices and Group Ties.” NBER Work-ing Paper 6628, National Bureau of Economic Research, Cambridge, MA.
Rauch, James, and Victor Trindade. 1999. “Ethnic Chinese Networks in Inter-national Trade,” NBER Working Paper 7189, National Bureau of Economic Research, Cambridge, MA.
———. 2002. “Ethnic Chinese Networks in International Trade.” Review of Eco-nomics and Statistics 84 (1): 116–30.
Riddle, Liesl. 2006. “Export and Investment Promotion Organizations: Bridges to the Diaspora Business Community?” Paper presented at the UN Expert

192 • Leveraging Migration for Africa: Remittances, Skills, and Investments
Convocation “Strengthening the Business Sector and Entrepreneurship in Developing Countries: The Potential of Diasporas,” New York, October 5. http://www.un.org/esa/ffd/business/msc/tie/Riddle.ppt.
Saxenian, A. L. 2002a. “Brain Circulation: How High-Skill Immigration Makes Everyone Better Off.” Brookings Review 20 (1): 28–31.
———. 2002b. “The Silicon Valley Connection: Transnational Networks and Regional Development in Taiwan, China and India.” Science Technology and Society 7 (1): 117–49.
———. 2004. “Taiwan’s Hsinchu Region: Imitator and Partner for Silicon Val-ley.” In Building High Tech Clusters: Silicon Valley and Beyond. Cambridge, UK: Cambridge University Press.
———. 2006. The New Argonauts: Regional Advantage in a Global Economy. Cam-bridge, MA: Harvard University Press.
Swedish Ministry of Justice. 2010. “Sweden’s Committee for Circular Migration and Development.” Fact Sheet, July–September, Stockholm.
Taylor, J. Edward. 1986. “Differential Migration, Networks, Information and Risk.” In Research in Human Capital and Development: Migration, Human Capi-tal and Development, vol. 4, ed. Oded Stark. Greenwich, CT: JAI Press.
Taylor, J. Edward, and Peri L. Fletcher. 1996. “International Migration and Economic Development: A Micro Economy-Wide Analysis.” In Development Strategy, Employment and Migration, ed. Edward J. Taylor. OECD Development Centre, Organisation for Economic Co-operation and Development, Paris.
———. 1999. “The New Economics of Labor Migration and the Role of Remit-tances in the Migration Process.” International Migration 37 (1): 63–88.
Terrazas, Aaron. 2010. “Diaspora Investment in Developing and Emerging Country Capital Markets: Patterns and Prospects.” Diaspora and Develop-ment Policy Project, Migration Policy Institute, Washington, DC.
Touray, Katim S. 2008. “Final Evaluation of the Support Project to the Imple-mentation of the Rwanda TOKTEN Program.” Final Report for the UNDP Evaluation Center, United Nations Development Programme, New York. http://erc.undp.org/evaluationadmin/reports/viewreport.html;jsessionid=7CB6512829832D08DEA79BA3E36245B5?docid=1814.
Trans, Lars Ove, and Ida Marie Vammen. 2011. “African Diaspora Associations in Denmark: A Study of Their Development Activities and Potentials.” In Diaspora for Development in Africa, ed. Sonia Plaza and Dilip Ratha. Washing-ton, DC: World Bank.
Turner, S., and B. Mossin 2008. Diaspora Engagement in Post-Confl ict Burundi. Washington, DC: World Bank.
U.S. Department of State. Telegraph 86401. Washington, DC. ———. 2010. Engaging with Diaspora Communities. Focus on EAP, EUR, and NEA.
Summary Report, Foreign Service Institute Leadership and Management School Policy Leadership Division and the Global Partnership Initiative, For-eign Policy Institute, Offi ce of the Secretary of State, Washington, DC.
Van Dijk, P. J. C., R. W. Koelstra, Paolo De Mas, Rinus Penninx, Herman van Renselaar, and Leo van Velzen. 1978. “REMPLOD Project. Slotconclusies en Aanbevelingen.” NUFFIC/IMWOO REMPLOD, The Hague.
Van Hear, N., Frank Pieke, and Steven Vertovec. 2004. “The Contribution of UK–Based Diasporas to Development and Poverty Reduction.” April, Report for the Department for International Development prepared by the ESRC Centre on Migration, Policy and Society (COMPAS), University of Oxford,

Harnessing the Resources of the Diaspora • 193
Oxford. http://www.compas.ox.ac.uk/fi leadmin/fi les/pdfs/Non_WP_pdfs/Reports_and_Other_Publications/DFID%20diaspora%20report.pdf.
Wagner, D., K. Head, and J. Ries. 2002. “Immigration and the Trade of Prov-inces.” Scottish Journal of Political Economy 49 (5): 507–25.
Wanigaratne, R. D. 2006. “An Evaluation of the UNDP Transfer of Technol-ogy through Expatriate National Program (TOKTEN).” Evaluation Resource Center, United Nations Development Programme, New York. http://erc.undp.org/evaluationadmin/reports/viewreport.html;jsessionid=C2765F5275DEBAF69935903CCEE56D57?docid=1863.
Wei, Djao. 2003. Being Chinese: Voices from the Diaspora. Tucson: University of Arizona Press.
Westcott, C. G. 2006. “Harnessing Knowledge Exchange among Overseas Profes-sionals of Afghanistan, People’s Republic of China and Philippines.” Paper presented at the Labour Migration Workshop, hosted by the United Nations Institute for Training and Research, the United Nations Population Fund, the International Organization for Migration, and the International Labour Organization, New York, March 15.
Wickramasekara, Piyasiri. 2009. “Diasporas and Development: Perspectives on Defi nitions and Contributions.” Perspectives on Labour Migration 9, Inter-national Labour Offi ce, Social Protection Sector, International Migration Programme, Geneva.
World Bank. 2005. Global Economic Prospects 2006: Economic Implications of Remit-tances and Migration. World Bank: Washington, DC.
———. 2010. Migration and Remittances Factbook 2011. Washington, DC: World Bank.


195
Index
Boxes, fi gures, notes, and tables are indicated with b, f, n, and t following the page number.
AABSA Bank, 82Acosta, Pablo, 66b, 97n11Africa Diaspora Health Initiative, 174Africa–EU Migration, Mobility
and Employment (MME) partnership, 36b
Africa Migration Project surveys, 27–28, 47
on remittances, 60, 61, 65, 73, 78African Citizens Directorate, 174African Development Marketplace,
169African Export-Import Bank, 57African Guarantee Fund, 36bAfrican Remittances Institute, 36b, 86bAfrican Union
defi nition of diaspora, 149b, 180n1diaspora issues, focus on, 174, 175,
182n35African Union Commission (AUC),
86b, 174, 182n37Algeria
bilateral agreements on emigrants, 33
remittances, size and importance of, 51
returning migrants investing in small businesses, 155
AML-CFT. See anti-money laundering and combating fi nancing of terrorism regulations
Anand, Sudhir, 135Angel-Urdinola, Diego F., 112banglophone countries. See
francophone vs. anglophone countries
Angola and high-skilled migration, 119
Annual Africa-France Summit, 169Anson, Jose, 84, 89anti-money laundering and
combating fi nancing of terrorism (AML-CFT) regulations, 6, 76, 78, 89
Anyanwu, John C., 60Asia
educational use of remittances, 66b
high-skilled migration, 113Association of Kenyan Professionals
in Atlanta (AKPA), 165–66AUC. See African Union CommissionAustralia
bilateral trade, migration’s effect on, 151
healthcare professionals, migration to, 131

196 • Index
Australia (Continued)high-skilled migration
as destination country, 121, 140initiative to engage with diaspora,
165automatic teller machines (ATMs),
75, 82Aydagul, B., 160
BBangladesh
remittances and, 96nn4–5saving accounts aimed at diaspora,
176Bank for International Settlements,
General Principles for International Remittance Services, 87
banks. See fi nancial access and remittances
Bansak, Cynthia, 66bBärnighausen, Till, 135Belgium
as destination country, 25healthcare professionals, migration
to, 131Benin
common ties within region and cross-border emigration, 21, 34
mobile money transfers, 82remittances, channels for, 89return agreement with France, 170
Bhagwati tax, 139, 142n5Bhargava, Alok, 137Bharti Airtel, 82, 99n25bilateral agreements on migration, 4,
33, 36–37Black, R., 175bonds
backed by future remittances, 57diaspora and, 6, 11, 148, 158–60,
180–81nn10–12healthcare professionals required to
give, 139–40Botswana
common ties within region and cross-border emigration, 21
remittanceschannels, 78, 98n23infrastructure development and,
89insurance against adverse shocks,
69brain drain, 142n2. See also
high-skilled migrationbrain gain, 112b“brain waste,” 124Brazil
mobile money transfers, 99n29remittance channels, 84securitization of future remittances,
56BRIDGE (Building Remittance
Investments for Development, Growth and Entrepreneurship) initiative, 96n7
Burkina FasoAfrica Migration Project surveys,
27–29child fostering program, 32,
40n10as destination country for African
migrants, 23high-skilled migration, 116remittances
channels, 78, 79f, 80, 93teducational use of, 66household investments made
with, 154–55, 154fhousing and, 69, 70fimportance of, 60–61information and communication
technology and, 70, 71tinfrastructure development and,
89recipients’ placement in
consumption quintiles, 61–62, 61–62f
uses of, 64t, 65return migration rates, 30, 30tsocioeconomic characteristics of
migrants from, 2, 14traffi cking enforcement, 32

Index • 197
child fostering, 30, 32, 33child mortality, 68, 97–98n16, 135child traffi cking, 30, 32–33Chiswick, Barry, 166citizenship. See dual/multiple
citizenshipcivil confl ict, 18, 119Clemens, Michael, 112b, 136–37,
142n5climate change, effect of, xiColombia
initiative to engage with diaspora, 165
remittance matching program, 163
colonial ties as infl uence on choice of migrant destination, 14, 25–26, 26f, 121, 150
competitiveness and remittances, 59Conectandonos al Futuro, 165Congo, Democratic Republic of
high-skilled migration, 123frefugees, 20bremittances
infrastructure development and, 90
size and importance of, 51costs of remittances, 48, 73–78,
74–75f, 97n19policy changes, 5–6, 86–88
Côte d’Ivoirecolonial links to destination
country, 121data on emigrant fl ow, 16bas destination country for African
migrants, 15, 21, 23high-skilled migration, 121, 123fmass expulsion of migrants from,
35mobile money transfers, 82remittances and bank products, 90returning migrants
investing in small businesses, 156policies favoring, 172
Coulombe, Serge, 124–25Credit Financier de Cameroon, 155Cyclone Jeane (Haiti), 68
CCameroon, high-skilled jobs in, 124,
126Canada
African diaspora communities, 150groups’ development projects,
169bilateral trade, migration’s effect
on, 151, 152healthcare professionals, migration
to, 131high-skilled migration
as destination country, 121, 140likelihood of obtaining high-
skilled job, 124–25Cape Verde
gross migration rates, 17healthcare professionals’ migration,
133, 135high-skilled migration, 116mobility partnership pacts, 172remittances, size and importance
of, 51capital market investment, 11,
156–60Casella, Alessandra, 151Cassini, S., 156Castaldo, A., 175CEMAC (Economic and Monetary
Community of Central Africa), 173
Central Africa. See also specifi c countriesmigration outside of region, 22
Central Bank of Nigeria, 87Centre for Migration Management
and Information in Mali, 36b
Chadrefugees, 20bremittances and infrastructure
development, 90Sudan as destination country for
emigrants from, 21Chand, Satish, 112bChauvet, Lisa, 68Cheran, R., 166–67Chezum, Brian, 66b

198 • Index
Ddata problems
on African migration, 15, 16bon diaspora, 147on high-skilled migration, 141on remittances, need for improved
data, 5, 51–52, 84–86, 96n3De, Prabal, 56De Haas, Hein, 175Democratic Republic of Congo.
See Congo, Democratic Republic of
demographics, effect of, 22–23, 23t, 40n2. See also socioeconomic characteristics of migrants from Africa
Denmark and African diaspora organizations, 161–62, 162b
destination countries. See also OECD countries; specifi c countries
capital market investment, 156–57colonial ties as infl uence on choice
of, 14, 25–26, 26f, 121, 150data on emigrant fl ow, 16b, 17f,
150fearnings of tertiary-educated
migrants in destination labor markets, 114, 124–29, 127b, 180n9
high-skilled migration patterns, 9, 119–23, 120t
incentives for return by, 170–72by percent of emigrants, 9–10, 10f,
17fsupport of, 9, 169–70
Development Marketplace for the African Diaspora in Europe, 169
diaspora, 147–93. See also destination countries
African governmental initiatives to engage, 173–76, 177–79t, 182n34
business environment, 175–76savings and social security
schemes, 176benefi ts of, xi, 9–11, 31b, 150–65
capital market investment, 11, 156–60
bonds, 6, 11, 148, 158–60, 180–81nn10–12
in host countries, 156–57investment funds, 160,
181nn13–14classifi cation of African diasporas,
180n1collective remittances, 160–63defi nition of, 149, 149bdirect investment, 153–54embassies’ engagement with, 173,
174bformation of associations, 161–63,
162b, 181n15household investment, 154–56,
154fknowledge networks, 164–65,
180n2locating, 11, 148–50policies to maximize benefi ts,
165–72dual/multiple citizenship, 10,
148, 165–68, 167t, 182n24incentives for return by host
countries, 170–72return initiatives by sending
countries, 172support of destination countries,
11, 169–70voting rights, 10–11, 148,
168–69, 168bsavings of migrants in host
countries, 156–57, 157ttrade, effects of, 147, 151–53, 152f,
180n3transfers of technology and skills,
148, 164–65Diaspora Networks Alliance (DNA),
169Diaspora Outreach Institute (EU), 36bdiseases, migration’s effect on spread
of, 32bDocquier, Frédéric, 137Donato, Katharine M., 97n16Dora, Manoj K., 156Drabo, Alassane, 68

Index • 199
El Salvadordiaspora associations in U.S., 162initiative to engage with diaspora,
165remittances
educational use of, 66binsurance against adverse shocks,
68securitization of future
remittances, 56embassies’ engagement with
diasporas, 173, 174b, 177–79t
e-money systems. See mobile money services
Erhijakpor, Andrew E. O., 60Eritrea
civil confl ict, effect of, 18common ties within region and
cross-border emigration, 19diaspora association supporting
development projects, 181n19
net migration rates, 17refugees from, 20bSudan as destination country for
emigrants from, 21ethical recruitment policies for
medical professionals, 141, 142n8
Ethiopiaagencies and initiatives to engage
with diasporas, 173bilateral trade, migration’s effect
on, 152common ties within region and
cross-border emigration, 19
diaspora bonds, 158, 180n11diaspora community
investing in small businesses, 175–76
in U.S., 150healthcare professionals’ migration
to OECD countries, 133high-skilled migration, 126, 129identifi cation cards (yellow cards)
for migrants, 167–68
dual citizenship, 10, 148, 165–68, 167t, 182n24
Dutch disease, 58, 91, 160
Eearnings of tertiary-educated migrants,
114, 124–29, 127b, 180n9earthquake in Haiti (2010), 68East Africa. See also specifi c countries
insurance against adverse shocks, 69
migration outside of region, 22East African Community (EAC),
173Easterly, William, 111Ebeke, Christian, 66b, 68Economic, Social and Cultural
Council of the Africa Union (ECOSOCC), 174
Economic and Monetary Community of Central Africa (CEMAC), 173
Economic Community of West African States (ECOWAS), 173
economic growth and remittances, 58–59
Ecuadorremittances
educational use of, 66binsurance against adverse shocks,
68education. See also tertiary education
highly educated migrants. See high-skilled migration
remittances used for, 4, 65–67, 66b, 67f
Egypt, Arab Rep.bilateral agreements on emigrants,
36diaspora communities in U.S., 150immigration from outside Africa
to, 23remittances
securitization of future remittances, 56
size and importance of, 51, 53uses of, 65

200 • Index
Ethiopia (Continued)land leasing by diaspora members,
155licensing of private recruitment
agencies, 33predeparture orientation seminars,
33remittances
costs of, 76data collection on, 86bfood security and, 69, 69tinsurance against adverse shocks, 4
Sudan as destination country for emigrants from, 21
European Commission and diaspora groups’ development projects, 169
European Payment Services Directive, 88b
European Unionhigh-skilled migration, as
destination countries, 140Payment Services Directive, 88bpolicies toward migration from
Africa, 36bas source of remittances, 52, 53f
exchange rate effects of large remittance infl ows, 4–5, 91, 97n9
exploitation, 3–4, 30–34
FFajnzylber, Pablo, 66b, 97n11, 97n16family cohesion, 31b
remittances and, 54fi nancial access
diaspora and, 148remittances and, 72–73, 72f, 90tuition for tertiary education and,
137fi nancial crisis, effect on remittances,
52–53Financial Future-Flow Prefi nancing
Programme (Afreximbank), 57
forced migration and refugees, 20b
Francebilateral agreements on emigrants, 37as destination country, 15, 25,
149–50high-skilled migration, 121
diaspora groups’ development projects, 169–70
healthcare professionals, migration to, 131
policies toward migration from Africa, 36b
remittanceschannels, 87, 98n22collection of data on, 98n21cost of sending, 76
return agreements with countries of origin, 170
francophone vs. anglophone countries. See also specifi c countries
healthcare professionals’ migration patterns, 131
likelihood for high-skilled workers to obtain high-skilled jobs, 125–26
French development program local migration, 170
Future of African Remittances (FAR) program, 86b
GGammage, Sarah, 162GCC countries. See Gulf Cooperation
Council countries and remittances
G-8 Global Remittances Working Group, 85
gender issues. See women migrantsGeneral Principles for International
Remittance Services (World Bank & Bank for International Settlements), 87
Ghanaagencies and initiatives to engage
with diasporas, 173, 182n34

Index • 201
policies favoring, 172rates, 31b
socioeconomic characteristics of migrants from, 2
Ghana College of Physicians and Surgeons, 139b
Ghanaian Doctors and Dentists Association United Kingdom (GDDA–UK), 165–66
global fi nancial crisis, effect on remittances, 52–53
Global Forum on Migration and Development, 35
Gould, David, 151governmental initiatives to maximize
benefi ts, 173–79Guatemala
remittanceseducational use of, 66bhealthcare and, 97n16securitization of future
remittances, 56use of, 63
Gubert, Flore, 68, 155Gulf Cooperation Council (GCC)
countries and remittancescosts of remittances, 74as sources of, 52, 53f
Gupta, Sanjeev, 60
HHaiti
remittanceseducational use of, 66binsurance against adverse shocks,
68Hatton, T. J., 40n3healthcare
migration of healthcare professionals, effect on health outcomes, 135, 137
remittances used for spending on, 4, 67–68
healthcare professionals, 9, 129–37in Africa vs. other countries and
regions, 130–31f, 132b
common ties within region and cross-border emigration, 21, 34
diaspora communities abroadlargest communities by
destination countries, 181n16
as partners in development programs, 11, 173
healthcare professionals, migration of, 129, 130, 132–33b
incentives to retain in Ghana, 139, 139b
to OECD countries, 133service requirement, 8
high-skilled migrationage of migration, 7brain waste in home country, 124destination countries, 121, 122fpatterns, 126–28b
Living Standard Measurement Survey (2005/06), 27, 28
mass expulsion of migrants from, 35
medical school tuition, 138–39nursing training, 112bremittances
channels, 78, 79f, 93teducation and, 65healthcare and, 68housing and, 69, 70finformation and communication
technology and, 70, 71t, 97n17
insurance against adverse shocks, 69
recipients’ placement in consumption quintiles, 61–62, 61–62f
securitization of future remittances, 57
size and importance of, 51, 60–61
return migrationinvesting in small businesses,
156

202 • Index
healthcare professionals (Continued)bond requirements, 139–40ethical recruitment policies for,
141, 142n8foreign-trained doctors, U.S. residency
requirement for, 132incentives to retain, 139–40, 139bnurse emigration rates by African
country, 136fphysician emigration rates by
African country, 134frepayment of government-funded
tuition, 139return rates, 140service requirement for, 8, 139taxes on migrants, 139travel restrictions on, 139
high-skilled migration, 7–9, 109–45. See also tertiary education
civil confl ict and, 119defi nition of “highly skilled,”
142n1earnings in destination labor
markets, 114, 124–29, 127b, 180n9
failure to fi nd skilled job in home country vs. in U.S., 124, 125f
healthcare professionals, 8–9, 129–37
patterns, 111–23across Africa, 116–19, 117–18fby country size and income level,
7, 8fdestination countries, 119–23,
120–21t, 127bremittances, 111, 128breturn rates, 126bby world region, 111–16,
113–15fpolicy options, 8–9, 110, 137–42reasons for, 113–15restrictions on, 110service requirements, 8–9taxation of, 110
HIV/AIDS, 32bHolm-Nielson, Lauritz B., 140household investment, 154–56, 154f
Hsinchu Industrial Park initiative (Taiwan), 172
Human Traffi cking Institute (EU), 36b
Iidentifi cation cards for migrants,
167–68immigration to Africa, 23, 24fIndependent National Electoral
Commission (INEC), 169India
diasporadefi nition of, 149bencouraging exchange of
knowledge and research and development with home country, 181n23
promoting outsourcing to home country, 181n22
diaspora bonds, 158, 159, 180n10IT training, 112bmobile money transfers, 99n25mobility partnership pacts, 172Person of Indian Origin (PIO)
cards, 167–68, 182n26remittances, 96n4
Indonesia tsunami recovery (2004) and remittances, 68
inequality and remittances, 60–62information and communication
technology, remittances used for, 70, 71t
insurance against adverse shocks, remittances used for, 4, 48, 54, 68–70
International Fund for Agricultural Development (IFAD), 86b
International Labour Organization (ILO), 41n13
International Monetary Fund (IMF) balance of payments statistics, 51
International Organization for Migration (IOM), 171
investment fundsdiaspora and, 153–56, 154f, 160,
181nn13–14remittances and, 63–65

Index • 203
recipients’ placement in consumption quintiles, 61–62, 61–62f
size and importance of, 51, 53uses of, 64t, 65
Kenya’s Equity Bank, 82Ketkar, Suhas L., 156, 159, 160,
180n10knowledge networks, 164–65, 180n2,
181n23
Llabor market. See also high-skilled
migrationchange in status following
migration, 28–29, 29tglobal imbalances, xi
large countries. See small vs. large countries
Latin America. See also specifi c countriesagencies and initiatives to engage
with diasporas, 165dual citizenship allowed, 166high-skilled migration, 113,
115–16remittances
costs of sending, 75, 75feducational use of, 66bhousehold investment of, 155inequality reduction and, 97n11
return, policies for promoting, 172legal migration, 3–4, 14–15, 33,
35–39Lesotho
common ties within region and cross-border emigration, 21
gross migration rates, 17remittances
bank products and, 90channels, 78size and importance of, 51,
60–61Liberia
healthcare professionals’ migration, 135
net migration rates, 17Liberian Diaspora Social Investment
Fund, 160
Israeldiaspora bonds, 158, 159, 180n10initiative to engage with diaspora,
165Italy
bilateral agreements on emigrants, 36–37
as destination country, 150diaspora groups’ development
projects, 170policies toward migration from
Africa, 36bremittance channels, 87
JJapan, transfers of technology and
skills, 164–65Joint Migration and Development
Initiative, 169Joseph, George, 69, 97n17
KKanaiaupuni, Shawn M., 97n16Kenya
bilateral trade, migration’s effect on, 152
colonial links to destination country, 121
as destination country, 21diaspora investment funds, 181n13dual citizenship allowed, 166healthcare professionals, incentives
to retain, 140high-skilled migration, 121, 122f,
129mobile money services, 6, 73, 80,
89. See also M-Pesa systempredeparture orientation seminars,
33refugees, 20bremittances
channels, 79f, 83, 93tdata collection on, 86beducational use of, 66household investments made
with, 154–55, 154finformation and communication
technology and, 70, 71t

204 • Index
licensing of private recruitment agencies, 33
López, Humberto, 66b, 97n11, 97n16low-income countries
cross-country migration, 2high-skilled migration, 7, 8f,
117–18, 119fremittances, size and importance
of, 51Lueth, Erik, 96n4
Mmacroeconomics and remittances, 4,
48–49, 54–59Madagascar
colonial links to destination country, 121
high-skilled migration, 119, 121, 123f
mobile money transfers, 82Maimbo, Samuel, 83Malawi
health surveillance assistants, costs of training, 138
net migration rates, 17Mali
agencies and initiatives to engage with diasporas, 173
child fostering program, 32gross migration rates, 17mobile money transfers, 82remittances
bank products and, 90insurance against adverse shocks,
69managing migration, 3–4, 14–15,
30–39within Africa, 34–35exploitation, 3, 30–34family cohesion, 31blegal migration, 3–4, 14–15, 35–39
marine fi shing industry, 34Martin, Philip, 34mass expulsion of migrants, 3, 15,
34–35Mattoo, Aaditya, 124Mauritius, high-skilled migration
from, 118–19
McKenzie, David, 66bMelonio, Thomas, 142n6Mesplé-Somps, Sandrine, 68Mexico
identifi cation cards (matrícula consular) for migrants, 167–68
remittancescosts of, 74educational use of, 66bsecuritization of future
remittances, 563-for-1 program of government
matching, 163use of, 63
microeconomics and remittances, 4, 60–73
microfi nance institutions, role of, 5, 89–90
Middle East treatment of migrants as illegal aliens, 33
middle-income countrieshigh-skilled migration, 7, 8f,
117–18, 119fmigration outside of Africa, 2remittances, 54
Migration for Development in Africa (MIDA) program (IOM), 171
migration trends, 1–3, 13–45. See also managing migration
cross-country patterns, 2, 13, 15–26, 149
corridors and per capita GDP, 21, 22f
by country, 2, 2f, 18fby region, 19t
forced migration and refugees, 20bGDP relationship, 21, 22f, 23–25,
24–25fimmigration to Africa, 23, 24fmigration rate for Africa, 15, 16t,
149net migration rates, 17, 38–39t,
40nn3–4origin and destination of emigrants,
by world region, 18, 19treasons for, xi, 14, 27, 40nn6–7

Index • 205
Netherlandsdiaspora groups’ development
projects, 169–70remittance channels, 87
net migration rates, 17, 38–39t, 40nn3–4
New Immigration Survey data on U.S., 156
New Zealandhigh-skilled migration, 140remittance channels, 87
NigeriaAfrica Migration Project surveys,
27–29agencies and initiatives to engage
with diasporas, 173common ties within region and
cross-border emigration, 21, 34
diaspora communities abroadinvestment funds, 181n14as partners in development
programs, 11, 173in U.S., 150voting rights, 169
healthcare professionals’ migration to OECD countries, 133
high-skilled migration, 121, 122fmass expulsion of migrants from,
35remittances
channels, 79f, 80, 94tcosts of, 76educational use of, 66household investments made
with, 154–55, 154finformation and communication
technology and, 70, 71trecipients’ placement in
consumption quintiles, 61–62, 61–62f
securitization of future remittances, 57
size and importance of, 51, 60–61uses of, 64t, 65
return migration rates, 30, 30tsocioeconomic characteristics of
migrants from, 2, 14
return migration rates, 30, 30t, 31bsocial costs and benefi ts of, 31–32bsocioeconomic characteristics of
migrants from Africa, 2, 14, 26–30, 27t
M-Kesho, 82mobile money services, 6, 80–84,
99n25, 99n29policy changes, 89
Mohapatra, Sanket, 56, 57, 69, 97n17, 156
money laundering concerns, 6, 49, 76Morocco
agreement with Spain on migration, 35
bilateral agreements on emigrants, 33, 36
remittancesinfrastructure development and,
90procyclical, 96n4size and importance of, 51, 60–61
returning migrants investing in small businesses, 155
undocumented migration laws with penalties, 37
Moullan, Yasser, 137Mozambique
common ties within region and cross-border emigration, 21
destination country for migrants from, 142n3
net migration rates, 17M-Pesa system (Kenya), 80, 81b,
82–84, 89, 90multilateral development banks, role
in diaspora bonds, 160
NNagarajan, Subha, 68natural disasters
increase in remittances and, 54remittances used for recovery,
68–69Neagu, Ileana Cristina, 124Nepal
diaspora bonds, 158educational use of remittances, 66b

206 • Index
Nils, Clotteau, 84, 89Nordman, Christophe J., 155North Africa. See also specifi c countries
forced return from transit countries, 37
migration outside of region, 2, 13, 19, 22
remittanceschannels, 98n22size and importance of, 49, 51,
53Norway’s remittance channels, 87“nostalgic trade,” 151nurses. See healthcare professionalsNyarko, Yaw, 111Nyerere Program (Pan-African
University), 36b
Ooccupations after migration, 28–29,
29t, 128bOECD countries as migrant
destinations, 3, 14, 15, 149bilateral trade, migration’s effect
on, 151data on emigrant fl ow, 16bethnicity of parents used to classify
immigrants, 149bhealthcare professionals, 130–31f,
132b, 133, 134fhigh-skilled migration, 7, 111–13,
115, 121, 140–41training fi nanced by OECD
country, 142n7OECD studies and surveys
on diaspora knowledge fl ows, 172on temporary migration programs,
35Orange Money, 82Osili, Una Okonkwo, 65, 155Ozden, Caglar, 124
PPakistan
remittances, use of, 63earthquake (2005) recovery, 68education, 66b
Pan-African University’s Nyerere Program, 36b
Pattillo, Catherine A., 60Paul, Alison, 162Philippines
diaspora community contributing to Pag-IBIG Fund, 176
nursing training, 112bremittances
channels, 84, 89, 99n28disaster recovery and, 69education and, 66bmobile money transfers, 99n29stability of, 96n5use of, 63
physicians. See healthcare professionals
Plaza, Sonia, 57pneumoconiosis, 32bPortugal
bilateral agreements on emigrants, 37
policies toward migration from Africa, 36b
post offi ces, role of, 5, 6, 73, 78, 82, 84
policies increasing, 89–90West Africa pilot project, 85b
poverty and remittances, 4, 60–62
RRapoport, Hillel, 66bRatha, Dilip, 56, 57, 69, 97n17, 156,
159, 160, 180n10Rauch, James, 151recruitment policies, 33–34, 41n14
ethical recruitment policies for medical professionals, 141, 142n8
Red Caldas, 165Red Cientifi ca Peruana, 165refugees, 20b, 37Remittance Prices Worldwide
database (World Bank), 87–88, 97n18
remittances, 4–7, 47–108collective remittances, 160–63comparison of African migrants’
remittances to those of other developing countries, 62
competitiveness and, 59

Index • 207
sources of, 52, 53fsovereign creditworthiness and
external fi nancing, 4, 54–56, 56f, 96–97nn7–8
stability and countercyclicality of, 54, 55f, 96nn4–5
uses of, 62–71, 64teducation, 4, 65–67, 66b, 67fhealthcare, 4, 67–68information and communication
technology, 70, 71tinsurance against adverse shocks,
4, 48, 54, 68–70investment in physical capital
and entrepreneurship, 63–65, 155
self-reported uses, 97n14return migration
agreements with countries of origin, 170
healthcare professionals, 140high-skilled migrants, 126bincentives for return by host
countries, 170–72initiatives by sending countries,
172investing in small businesses,
155–56rates, 30, 30t, 31b
Return of Qualifi ed African Nationals Program, 171
Ruiz-Arranz, Marta, 96n4Rwanda
agencies and initiatives to engage with diasporas, 173
common ties within region and cross-border emigration, 21
net migration rates, 17remittances, costs of, 76voting rights of diaspora, 168b
Rwanda Diaspora General Directorate, 155
Rwandan Diaspora Mutual Fund, 160
SSafaricom, 82SANSA (South African Network of
Skills Abroad), 165
developmental impact of, xii, 60–73
diaspora bonds’ effect on, 159economic growth and, 58–59fi nancial access and, 72–73, 72fglobal fi nancial crisis, effect of,
52–53from high-skilled migration, 111,
128binformal remittances, 52, 73intraregional remittances, 52, 53fat macroeconomic level, 4, 48–49,
54–59markets in Africa, 5–6, 48–49,
73–84channels, 78–80, 79f, 93–95tcosts, 6, 48, 73–78, 74–75f,
97n19mobile money services, 99n29post offi ces, role of. See post
offi ces, role ofmatching grants from home
countries for, 163at microeconomic level, 4, 60–73mobile money services, 6, 49,
80–84, 89, 99n25mobile payment services, 90policy changes, 84–95, 86b, 87f
cost reductions and improved transparency, 5–6, 86–88
data improvements, 5, 84–86exchange rate effects of large
remittance infl ows, 4–5, 91, 97n9
mobile money transfer technologies, 6, 89
post offi ce and microfi nance institution role, 5, 6, 89–90
poverty and inequality, impact on, 4, 60–62
recipients’ placement in consumption quintiles in their country, 61–62, 61–62f
securitization of future remittances, 7, 56–58, 57t
size and importance of, 3, 4, 5f, 47, 49–52, 50f, 50t, 92t
skilled vs. unskilled migrants, 97n13

208 • Index
São Tomé and Príncipegross migration rates, 17healthcare professionals’ migration,
135Saranga, Tania, 83Saudi Arabia as destination country,
15, 149–50Save the Children, 32savings and social security schemes
aimed at diaspora, 176savings of migrants in host countries,
156–57, 157tSayan, Serdar, 96n4securitization of future remittances, 7,
56–58, 57tSenegal
Africa Migration Project surveys, 27–29
agencies and initiatives to engage with diasporas, 173
colonial links to destination country, 121
diaspora communities abroad as partners in development programs, 11, 173
high-skilled jobs in, 124, 126high-skilled migration, 121, 123fmobile money transfers, 82predeparture orientation seminars,
33remittances
channels, 78, 79f, 94thousehold investments made
with, 154, 154finformation and communication
technology and, 70, 71tinsurance against adverse shocks,
69recipients’ placement in
consumption quintiles, 61–62, 61–62f
size and importance of, 51uses of, 64t
return migrationagreement with France, 170rates, 30, 30t
socioeconomic characteristics of migrants from, 2, 14
Sierra Leonehigh-skilled jobs, 124, 126mobile money transfers, 82net migration rates, 17
skilled migration. See high-skilled migration
small vs. large countrieshealthcare professionals’ migration,
133, 135high-skilled migration, 116, 118,
118fsocioeconomic characteristics of
migrants from Africa, 2, 14, 26–30, 27t
Somaliacommon ties within region and
cross-border emigration, 19net migration rates, 17refugees, 20bremittances, size and importance
of, 51South Africa
common ties within region and cross-border emigration, 21
data on emigrant fl ow, 16bas destination country, 15, 23,
142n3diaspora communities abroad
as partners in development programs, 11, 173
voting rights, 169healthcare professionals’ migration
to OECD countries, 133service requirement after medical
school graduation, 139high-skilled migration, 118, 119f,
129destination countries, 122f
HIV/AIDS, 32bimmigration from outside Africa
to, 23labor market regulation, 34remittances
channels, 78–79, 95thealthcare and, 68informal channels, 98n23infrastructure development and,
90

Index • 209
Sub-Saharan Africadiaspora bonds, potential of, 159migration
health professionals, 133to OECD countries, 112within region, 2, 19, 26
post offi ces, location of, 6remittances
costs of sending, 76fpost offi ces, role of, 84securitization of future
remittances, 57–58, 57tsize and importance of, 49, 51, 53
Sudanas destination country, 21healthcare professionals’ migration
to OECD countries, 133refugees, 20bremittances, size and importance
of, 51Swaziland
common ties within region and cross-border emigration, 21
remittance channels, 78Sweden’s parliamentary committee
to examine the connection between circular migration and development, 172
TTaiwan, China
IT training, 112breturn incentive programs, 172transfers of technology and skills,
164–65Takeno, Taizo, 112bTanzania
agencies and initiatives to engage with diasporas, 173
common ties within region and cross-border emigration, 21
high-skilled migration, 129Kenya as destination country for
emigrants from, 21taxation of high-skilled migration,
110, 141healthcare professionals, 139
Taylor, J. Edward, 63
post offi ces, role of, 84size and importance of, 51
undocumented migrants in, 34South African Network of Skills
Abroad (SANSA), 165South America. See Latin America;
specifi c countriessouthern Africa. See also specifi c
countriesmigration outside of region, 22remittance channels, 78
Southern African Development Community, 83, 98n23
Southern African Migration Project, 98n23
sovereign creditworthiness and external fi nancing, 4, 54–56, 56f, 96–97nn7–8
Spainagreement with Morocco on
migration, 35bilateral agreements on emigrants,
37bilateral trade, migration’s effect
on, 151as destination country, 150diaspora groups’ development
projects, 170policies toward migration from
Africa, 36bSplash (Sierra Leone mobile money
transfers), 82Sri Lanka
remittancescorrelated with oil prices, 96n4educational use of, 66b
Transfer of Knowledge Through Expatriate Nationals (TOKTEN) program, evaluation of, 171
State Department (U.S.)defi nition of diaspora, 149bDiaspora Networks Alliance (DNA),
169Strategy for Assuring Financial
Empowerment (SAFE), 88b
Strychacz, Nicholas, 83

210 • Index
TEBA Bank, 98n23technology and skills, transfer of, 148,
164–65temporary migration programs, 4, 9,
15, 35, 37, 170terrorism, funding of. See anti-money
laundering and combating fi nancing of terrorism regulations
tertiary education. See also high-skilled migration
Africa’s lowest rate of any developing region for, 115, 115f
healthcare professionals, 8, 129–37remittances used for, 67ftuition policies, 8, 137–38
Thailanddisaster recovery, use of remittances
for, 69return incentive programs, 172
Thorn, Kristian, 140Togo
common ties within region and cross-border emigration, 34
remittancesinfrastructure development and,
90size and importance of, 51
tradediaspora’s effects on, 147, 151–53,
152f, 180n3high-skilled migration and, 128b
traffi cking, 3. See also exploitationtransfers of technology and skills,
164–65transnational companies, 180n4transparency of remittance systems,
5–6, 86–88Tremblay, Jean-François, 124–25tuberculosis, 32bTunisia
bilateral agreements on emigrants, 33, 37
remittancesinfrastructure development and,
90
mobile payment services, 90size and importance of, 51
returning migrants investing in small businesses, 155
undocumented migration laws with penalties, 37
UUganda
agencies and initiatives to engage with diasporas, 173
bilateral trade, migration’s effect on, 152
common ties within region and cross-border emigration, 21
Kenya as destination country for emigrants from, 21
mobile money services, 82remittances
channels, 79f, 80, 95tdata collection on, 86beducational use of, 66household investments made
with, 154–55, 154finformation and communication
technology and, 70, 71trecipients’ placement in
consumption quintiles, 61–62, 61–62f
size and importance of, 51, 52uses of, 64t, 65
undocumented migration, 15, 34–35United Arab Emirates as destination
country, 150United Kingdom
bilateral trade, migration’s effect on, 151
cost of forced vs. voluntary returns to country of origin, 171
as destination country, 15, 25, 121, 126b, 149–50
diaspora groups’ development projects, 170
healthcare professionals, migration to, 131, 141, 142n8
initiative to engage with diaspora, 165

Index • 211
migrationoutside of region, 22within region, 2, 34
remittanceschannels, 82cost of sending, 76post offi ces, role of, 85b
West African Economic and Monetary Union, 82
West African Long-Term Perspective Study (WALTPS), 34
Wickramasekara, Piyasiri, 180n1Willamson, J. C., 40n3Wizzit (South Africa mobile money
transfer service), 82, 84Wodon, Quentin, 112bwomen
change in gender roles, 31bchange of occupational status after
migration, 29comparison of remittances from
with those from men, 62educational use of remittances, 66bhealthcare use of remittances, 68high-skilled migration and
earnings, 128blegal restrictions on, 3, 33, 40–41n12traffi cking issues, 32–33treated as illegal aliens in Middle
East, 33Woodruff, Christopher, 97n15World Bank
African Diaspora Program, 175, 182n37
African Remittances Institute, 36b, 86b
bilateral migration matrix data, 15, 16b, 40n1
Future of African Remittances (FAR) program, 86b
General Principles for International Remittance Services, 87
Ghanaian physicians in UK and U.S., survey of, 133b
health sector challenges in Africa, 142Remittance Prices Worldwide
database, 87–88, 97n18
remittances, collection of data on, 98n21
United Nations Development Programme, 96n7
Transfer of Knowledge Through Expatriate Nationals (TOKTEN) program, 9, 171
United Nations High Commissioner for Refugees (UNHCR), 16b
United Statesbilateral trade, migration’s effect
on, 151, 152as destination country, 15, 126b,
149–50by countries of origin, 150, 150f
diaspora groups’ development projects, 170, 181n20
healthcare professionalsforeign-trained doctors, residency
requirement for, 132migration to, 131
high-skilled migrationas destination country, 126b, 140failure to fi nd skilled job in
home country vs. in U.S., 124, 125f
remittancescollection of data on, 98n21as source of, 52, 53f
U.S. Agency for International Development (USAID), 169
Vviolence against migrants, 3–4, 34–35visa overstays, 35voting rights, 10–11, 148, 168–69,
168b
Wwage gaps for tertiary-educated
workers, 114Wagh, Smita, 60Wall Street Reform and Consumer
Protection Act of 2010, 88bWest Africa. See also specifi c countries
forced return from transit countries, 37

212 • Index
cross-border emigration, 21healthcare professionals, incentives
to retain, 140high-skilled migration, 122f
Zambia First Investment Fund, 160Zenteno, Rene, 97n15Zimbabwe
high-skilled migration, 129remittances
channels, 78size and importance of, 51
World Bank–IMF Low-Income Country Debt Sustainability Framework, 55
Wyatt, T. J., 63
ZZain (mobile money transfer service),
82, 99n25Zambia
colonial links to destination country, 121
ECO-AUDIT
Environmental Benefits Statement
The World Bank is committed to pre-serving endangered forests and natural resources. The Office of the Publisher has chosen to print Leveraging Migration for Africa: Remittances, Skills, and Invest-ments on recycled paper with 30 percent post-consumer waste, in accordance with the recommended standards for paper usage set by the Green Press Initiative, a nonprofit program supporting publishers in using fiber that is not sourced from en dangered forests. For more information, visit www.greenpressinitiative.org.
Saved:• 10 trees• 3 million British thermal units of total energy• 922 pounds of greenhouse gases (CO2 equivalent)• 4,443 gallons of wastewater• 270 pounds of solid waste


A JOINT EFFORT LED BY THE AFRICAN DEVELOPMENT BANK
and the World Bank, Leveraging Migration
for Africa is the fi rst comprehensive
publication on harnessing migration,
remittances, and other diaspora resources for the
development of Africa. It comes at a time when
countries in Africa and elsewhere are grappling with
diffi cult choices on how to manage migration.
Policy makers can help leverage the contributions
of migrants to the development of Africa, reduce
remittance costs, improve the effi ciency of remittance
markets in both origin and destination countries,
and address the needs of the origin countries
without restricting the emigration of high-skilled
professionals. Innovative fi nancing mechanisms such
as issuance of diaspora bonds and securitization of
future remittance fl ows can help fi nance big-ticket
projects, such as railways, roads, power plants, and
institutions of higher learning that will, step by step,
help to transform Africa. This volume contributes to a
greater understanding of migration and its potential
role in Africa’s development.
ISBN 978-0-8213-8257-8
SKU 18257