LEVERAGING A WATER EFFICIENT ECONOMY - Sitawi
66
LEVERAGING A WATER EFFICIENT ECONOMY Opportunities for Companies and Financial Institutions PREPARED BY:
-
Upload
khangminh22 -
Category
Documents
-
view
0 -
download
0
Transcript of LEVERAGING A WATER EFFICIENT ECONOMY - Sitawi
1
LEVERAGING A WATER EFFICIENT ECONOMY
Opportunities for Companies and Financial Institutions
PREPARED BY:
2
CREDITSProject Partners: CEBDS e GIZContents: SITAWI Finance for GoodCoordination: CEBDS Sustainable Finance Working Group (CTFin)Translation: SITAWI Finance for GoodGraphic Design: Júlia CaldasMonth and Year of Publication: June 2016
GIZThe wide range of services offered by the Deutsche Gesellschaft für Internationale Zusammenarbeit (GIZ) GmbH are based on a wealth of regional and technical expertise and on tried and tested management know-how. We are a German federal enterprise and offer workable, sustainable and effective solutions in political, economic and social change processes. Most of our work is commissioned by the German Federal Ministry for Economic Cooperation and Development (BMZ).
However, GIZ also operates on behalf of other German ministries and public and private bodies in Germany and abroad. These include governments of other countries, European Union institutions, such as the European Commission, the United Nations and the World Bank. We are equally committed to helping our clients in the private sector attain their goals. GIZ operates throughout Germany and in more than 130 countries worldwide. Our registered offices are in Bonn and Eschborn. We have 16,510 staff members around the globe, almost 70% of whom are employed locally as national personnel.
The Emerging Markets Dialogue ProgrammeThe goal of the Emerging Markets Dialogue Programme (EMD) on Green Finance is to increase capital flows to green investments and thereby enable the transformation towards sustainable economies. To achieve this aim, the EMD works with public and private actors from Emerging Markets and Europe to overcome barriers and gaps to increasing eco and climate-friendly investments.
For example, the EMD works with financial institutions from Emerging Markets and Europe to quantify environ-mental risks and opportunities in the financial sector and to jointly develop and test a set of asset class-specific tools to incorporate environmental considerations into lending and investment decisions. GIZ is commissioned to implement the EMD by the German Federal Ministry for Economic Cooperation and Development (BMZ).
The Federal Ministry for Economic Cooperation and Development (BMZ) BMZ develops the guidelines and the fundamental concepts on which German development policy is based. It devises long-term strategies for development cooperation with partner countries and international development organisations.
CEBDSThe Brazilian Business Council for Sustainable Development (CEBDS) is a non-profit civil association that promotes sustainable development in the Brazilian private sector, with the support of Government and Civil Society. Business leaders, who realize the need to integrate corporate activities into the sustainable develop-ment scope, especially after RIO 92, founded CEBDS in 1997. Currently, the association groups more than 70 of the biggest corporate groups in the country, whose aggregate revenues account to almost 40% of Brazilian GDP and responsible for over 1 Million of direct jobs.
CEBDS is the representative of the World Business Council for Sustainable Development (WBCSD) in Brazil, an association founded by business leaders who realise the need to integrate corporate activities into the sustainable development scope.

3
Sustainable Finance Working Group (CTFin)The Sustainable Finance Working Group (CTFin) is one of the Working Groups that CEBDS organizes and it aggregates the largest financial institutions in Brazil. CTFin helps financial institutions to play their part in promoting sustainable development, encouraging discussion of principles and best practices.
SITAWI Finance for GoodSITAWI is a Brazil-based organisation working to advance social and environmental outcomes through finance and investing. SITAWI manages philanthropic funds for large donors, develops financial solutions to social enterprises and advises financial institutions and institutional investors on integrating ESG issues into strategy, risk management and investment analysis.
SITAWI works with Latin America’s leading players in social and sustainable finance, and is piloting innovative mechanisms for the region such as Social Impact Bonds and Green Bonds. Its work has been recognized as Latin America’s Best Socially Responsible Investment project by IADB’s beyond Banking 2011 awards and by Extel Independent Research in Responsible Investment - IRRI 2015 as a top 10 ESG research provider to investors globally.
Project Team Gustavo Pimentel, Project Manager, Editor Cristine Pavoni, Financial Specialist, Co-Author Cristóvão Alves, Market Analyst, Co-Author Daniela Fontana, Water Specialist Patricia Herkenhoff, Water Researcher Júlia Caldas, Graphic Design
AcknowledgementsThe authors would like to thank CEBDS (Fernanda Gimenes, André Ramalho, Marina Santarosa), GIZ (Simone Dettling, Yannick Motz), CNI – National Industry Confederation (Percy Soares) and CEBDS’ members companies for inputs and comments in preliminary versions of this study.
4
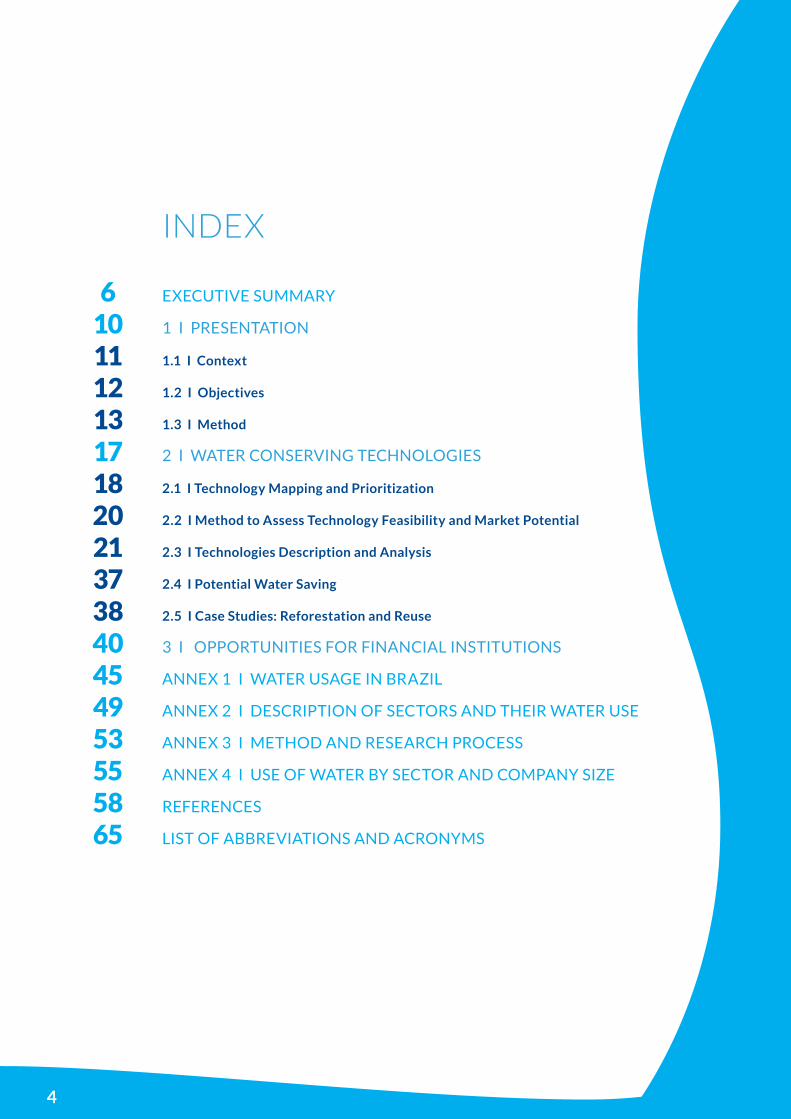
INDEX
EXECUTIVE SUMMARY
1 I PRESENTATION
1.1 I Context
1.2 I Objectives
1.3 I Method
2 I WATER CONSERVING TECHNOLOGIES
2.1 I Technology Mapping and Prioritization
2.2 I Method to Assess Technology Feasibility and Market Potential
2.3 I Technologies Description and Analysis
2.4 I Potential Water Saving
2.5 I Case Studies: Reforestation and Reuse
3 I OPPORTUNITIES FOR FINANCIAL INSTITUTIONS
ANNEX 1 I WATER USAGE IN BRAZIL
ANNEX 2 I DESCRIPTION OF SECTORS AND THEIR WATER USE
ANNEX 3 I METHOD AND RESEARCH PROCESS
ANNEX 4 I USE OF WATER BY SECTOR AND COMPANY SIZE
REFERENCES
LIST OF ABBREVIATIONS AND ACRONYMS
6 10 11 12 13 17 18 20 21 37 38 40 45 49 53 55 58 65

5
6
Technology LivestockSoy
Agriculture
Sugarcane
Agriculture
Food
ProcessingAutomotive Petrochemical
Steel
and
Metal
Mining Beverage
Pulp
and
Paper
1
Hydrometer for
Consumption
Segmentation
2Drip
Irrigation
3Dust
Disperser
4
Aquiculture
for Sewage
Treatment
5
Evaporation
to Vinasse
Concentration
6Water Loss
Detector
7Chemical Free
Cooling Tower
8Rainwater
Harvest
9Ozone
Treatment
10Artificial
Wetlands
11 UltraFiltration
12Reverse
Osmosis
13Thermal
Distillation
14 Reforestation
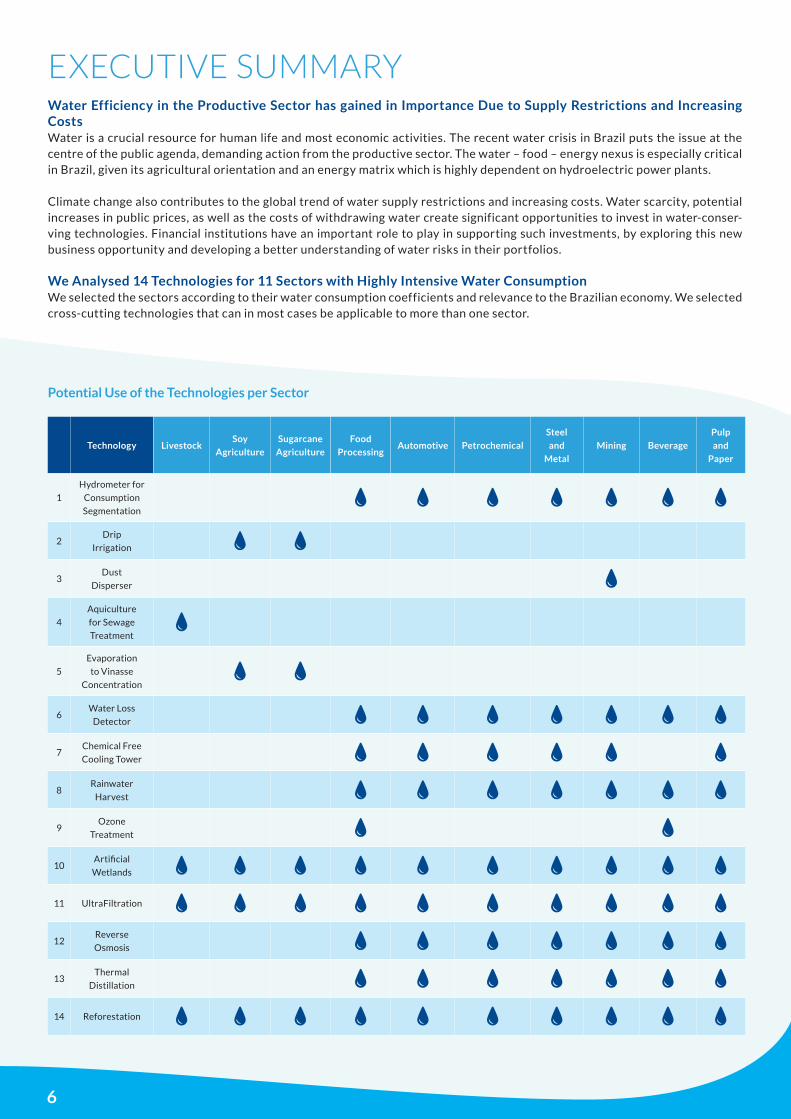
Potential Use of the Technologies per Sector
Water Efficiency in the Productive Sector has gained in Importance Due to Supply Restrictions and Increasing CostsWater is a crucial resource for human life and most economic activities. The recent water crisis in Brazil puts the issue at the centre of the public agenda, demanding action from the productive sector. The water – food – energy nexus is especially critical in Brazil, given its agricultural orientation and an energy matrix which is highly dependent on hydroelectric power plants.
Climate change also contributes to the global trend of water supply restrictions and increasing costs. Water scarcity, potential increases in public prices, as well as the costs of withdrawing water create significant opportunities to invest in water-conser-ving technologies. Financial institutions have an important role to play in supporting such investments, by exploring this new business opportunity and developing a better understanding of water risks in their portfolios.
We Analysed 14 Technologies for 11 Sectors with Highly Intensive Water ConsumptionWe selected the sectors according to their water consumption coefficients and relevance to the Brazilian economy. We selected cross-cutting technologies that can in most cases be applicable to more than one sector.
EXECUTIVE SUMMARY

7
The Indicator Water Break Even Cost Can be Used to Make Preliminary Feasibility Analysis We performed a feasibility analysis to measure the economic attractiveness of a technology from the user point of view, considering the initial investment (CAPEX), operational costs (OPEX), other costs, water saving potential, other savings and risk mitigation. To evaluate the feasibility of each technology, we used the NPV (Net Present Value) with the aforementioned variables, costs and benefits for a period of 15 years.
However, to calculate the NPV, it is necessary to know the total water cost for the user, which depends on many variables such as public price in the basin, costs of withdrawal, transport, treatment, and effluent disposal. These variables may change according to the sector, size and location of the user. We estimated a water break even cost (WBC) that enables the investment when the NPV corresponded to zero.
When the NPV is zero, there is no economic profit or loss for the investment. Therefore, the WBC is the value that makes the investment attractive. When current water cost is inferior to WBC, the investment can save water and generate intangible benefits (reputation, supply security), but it is not profitable. When water costs are above the WBC, the technology is economically feasible.
The Potential Water Saving of the 14 Technologies Amounts to 19% of Water Withdrawn for Industry and 3% for AgricultureThe water saving potential of the abovementioned technologies is 4.4 billion cubic meters per year, 2.3 billion from technologies used in industry and 2.1 billion for technologies in agriculture. These values exclude double counting from competing technologies.
The Investment Gap for these Technologies is R$ 49 Billion, of which R$ 25 Billion could Represent a Lending Opportunity for Financial InstitutionsThese significant amounts represent the market and lending potential. Actual investment and lending is dependent on several structural and momentum factors of the Brazilian economy as well as strategies deployed by users and financial institutions (FIs).
Source: National Water Agency (ANA). Estimation by SITAWI..
m3/s m3/year % of Water Saving with Technologies
Water withdrawal in Brazil in 2010 I Industry 403 12,720,837,688 19%
Water consumption in Brazil in 2010 I Industry 197 6,223,722,105 39%
Water withdrawal in Brazil in 2010 I Agriculture 1.281 40,393,831,680 3%
Water consumption in Brazil in 2010 I Agriculture 836 26,361,573,120 5%
Water-saving Potential of the Assessed Technologies

8
TechnologyAverage
CAPEX for Project (R$)
Water Break Even Cost
(R$/m³)
Investment Gap
(R$ Million)
Attractiveness for FI Lending
Hydrometer for Consumption Segmentation 215,280 1.21 1,290 Low
Drip Irrigation for Sugarcane 4,000,000 0.12 497 Moderate
Drip Irrigation for Soy 4,000,000 0.94 2,168 High
Dust Disperser - 5.41 606 Low
Aquiculture for Sewage Treatment 21,720 10.68 453 Low
Evaporation to Vinasse Concentration 30,000,000 1.38 3,780 High
Water Loss Detector 14,000 1.74 82 Low
Chemical Free Cooling Tower 310,000 0 10,809 Moderate
Rainwater Harvesting 9,150 8.20 321 Low
Ozone Treatment 150,000 3.64 21 Low
Artificial Wetlands 1,500,000 0.84 764 Moderate
Ultrafiltration 33,000,000 0.46 1,727 High
Reverse Osmosis 7,100,000 0.99 7,895 High
Thermal Distillation 8,500,000 1.80 15,735 High
Reforestation 133,000,000 1.26 2,660 Moderate
TOTAL R$ 48,808
Summary of Attractiveness of Each Technology for Financial Institutions
Depending on the average CAPEX, the water break even cost and the investment gap for each technology, we estimated the attractiveness for financial institutions, i.e. the share of the investment gap that FIs potentially would finance. Based on this percentage we estimated the opportunity value, which is the value (in R$) that could be financed by FIs.
Atactiveness for FIs Investment Gap (R$ Million)
Potentially Financed by FIs (%)
Opportunity Value for FIs (R$ Million)
High 31,305 60% 18,783
Moderate 14,730 40% 5,892
Low 2,773 20% 555
TOTAL 48,808 - 25,230
Opportunity Value of the Technologies According to Its Attractiveness for FIs
9
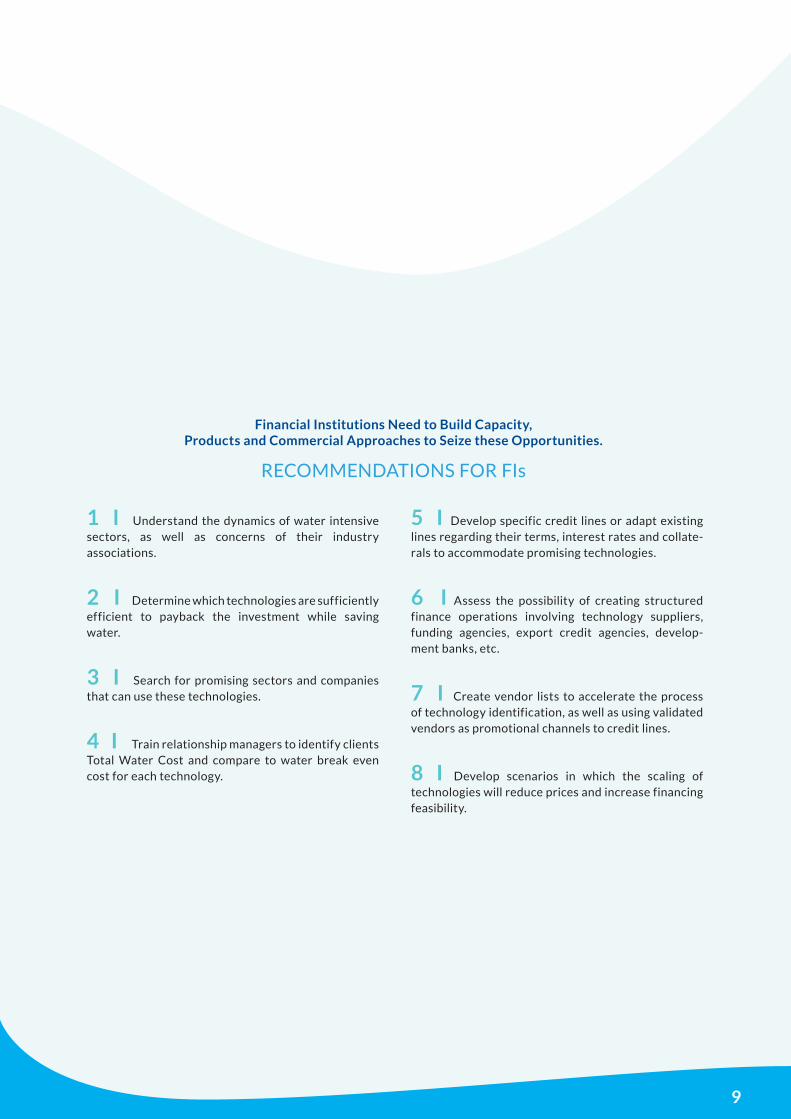
Financial Institutions Need to Build Capacity, Products and Commercial Approaches to Seize these Opportunities.
RECOMMENDATIONS FOR FIs
1 I Understand the dynamics of water intensive sectors, as well as concerns of their industry associations.
2 I Determine which technologies are sufficiently efficient to payback the investment while saving water.
3 I Search for promising sectors and companies that can use these technologies.
4 I Train relationship managers to identify clients Total Water Cost and compare to water break even cost for each technology.
5 I Develop specific credit lines or adapt existing lines regarding their terms, interest rates and collate-rals to accommodate promising technologies.
6 I Assess the possibility of creating structured finance operations involving technology suppliers, funding agencies, export credit agencies, develop-ment banks, etc.
7 I Create vendor lists to accelerate the process of technology identification, as well as using validated vendors as promotional channels to credit lines.
8 I Develop scenarios in which the scaling of technologies will reduce prices and increase financing feasibility.

10
PRESENTATION1
11
Water has always been a valuable resource but, given its abundance, it was also taken for granted for many years. Going forward, the views on water are changing and society must understand that water management must become a key global priority. Water consump-tion is estimated to increase globally by 50% until 2050 (UN, 2014). Challenges related to water supply risk, loss management, reuse and new legislations arise and demand new and more effective solutions.
A contemporary and innovative way to cope with this matter is to recognize the nexus between water – food – energy. The population growth will demand more crops and much more water resources, given that agriculture is highly water intensive.
In Brazil there is even more pressure due to the importance of agriculture for our economy and for all countries we export to. Moreover, Brazil is extremely dependent on water for energy generation, for its large amount of hydropower plants.
Around 70% of the country’s electricity matrix is hydroelectric, competing directly with other water demands (EPE, 2014). Therefore, water shortages might also lead do electricity shortages. In order to distribute the resource correctly and to preserve watersheds already under pressure, it is necessary
to implement an effective management program that considers public interest and all stakeholders.
This water – food – energy nexus is also affected by global climate change. The phenomenon is altering the occurrence of extreme weather events, such as droughts, floods, wind, wildfires and cyclones all around the world.
In Brazil, changes in rainfall regimes in countryside are already predicted (FBDS, 2009). In addition, direct impacts over agricultural productivity have also been detected. Examples include the reduction of yearly gains of productivity from 2% to 1% in the last two decades (IPCC, 2014), dislocation, species extinction and damages to natural and built infrastructure,
According to the United Nations (2014), the growth in demand for water resources by industries could achieve 400% until 2050. Examples from the last few years in Brazil demonstrate that financial damages can be significant if there is no investment in a risk mitigation plan.
The recent water crisis in Brazil (see Annex 1) incentivizes the search of investment in water saving technologies, given the uncertainty of water costs and risk of shortages.
1.1 I Context
12
1.2 I Objectives
The objective of this study is to assess and highlight business opportunities for financial institutions in the transition to a more water-conserving economy in Brazil. We will identify high water-use sectors in Brazil and promising technologies that focus on water saving. To this end, the study will:
1 I Analyse how these technologies compare to business as usual models in terms of environmental and social externa-lities as well as their competitiveness and risk profile.
2 I Estimate the potential market and the potential aggregated volume of investments in water efficiency for a range of water-intensive sectors in the coming years: How big is the “investment gap” in water conservation technologies?
3 I Identify the most promising (highest growth poten-tial) technologies for Brazil and estimate the minimum water cost incurred by companies to break even when making the investment.
4 I Outline business opportunities for financial institutions in financing the transition towards a more sustainable water use in the Brazilian economy.
13
Water is widely used across economic sectors and has various uses within the same industry. The most common sources for industrial use are surface water, groundwater, rainwater and reuse of wastewater.
The cost of water for the Brazilian industry is a highly complex variable, because it depends on a variety of factors beyond the charges from the Water Basin Committees. These factors are described below:
● Cost of purchased water is the tariff charged by a water provider, regulated or not, to supply water at the destination. Micro and small companies generally buy from local water utilities. Larger companies may buy water from other industries that have water tre-atment plants in their facilities.
● Cost of water adduction is the cost of infrastruc-ture and energy for pumping to the WTP (Water Treatment Plant) or to the production site. This cost depends on the distance to be pumped to (the greater the distance the higher the cost), the flow being pum-ped (the higher the flow, higher the cost), the height from the sloping ground to the pumping point and the material of which pipes are made of (load loss).
● The cost of water treatment depends on the quality of the water abstracted related with the quality required by the production process. The latter is determined by the type of product and the technology adopted. Furthermore, if water has to undergo a chemical treatment, this figure should include the cost of supplies to treat water, electrici-ty to WTP operation, cost of temporary storage and disposal of waste generated by the treatment.
● Liquid effluent discharge cost in water bodies, based on the industrial sector, is defined according to the national classification of economic activities of the Brazilian Institute of Geography and Statistics - IBGE. Among these, there are mining, agribusiness and processing industries. The costs, in general, depend on the quality of the effluent released and the quality of the receiving body.
The rate is computed in terms of consumption and some quality parameters such as organic matter by BOD (Biochemical Oxygen Demand) of the final waste released in the water body. In the cases when water is obtained from a water utility company that supplies the city, the same volume is collected as waste water generated.
1.3 I Method
TOTAL WATER COST
14
Details on sectors and how they use water in their production processes are available in Annex 2.
1 I ANIMAL FARMING I. Aquaculture II. Livestock
2 I CROPS FARMING I. Cotton farming II. Soybean farming III. Sugarcane farming
3 I FOOD PROCESSING
4 I AUTOMOTIVE I. Cars II. Trucks and buses III. Parts and components
5 I Chemical I. Chemical II. Petrochemical III. Pharmaceutical
6 I STEEL AND METALLURGY I. Steel II. Metallurgy of Ferrous Metals III. Metallurgy of Non-Ferrous Metals
7 I INDUSTRIAL MACHINERY MANUFACTURING
8 I MINING I. Iron Ore Mining II. Non Ferrous Mining III. Non Metallic Mining
9 I BEVERAGES I. Breweries II. Non-Alcoholic Beverages
10 I PULP AND PAPER I. Paper Mills II. Pulp Mills
1 I LIVESTOCK
2 I SUGARCANE FARMING
3 I SOYBEAN FARMING
4 I FOOD PROCESSING
5 I AUTOMOTIVE
6 I PETROCHEMICAL
7 I STEEL AND METALLURGY
8 I MINING
9 I BEVERAGES
10 I PULP AND PAPER
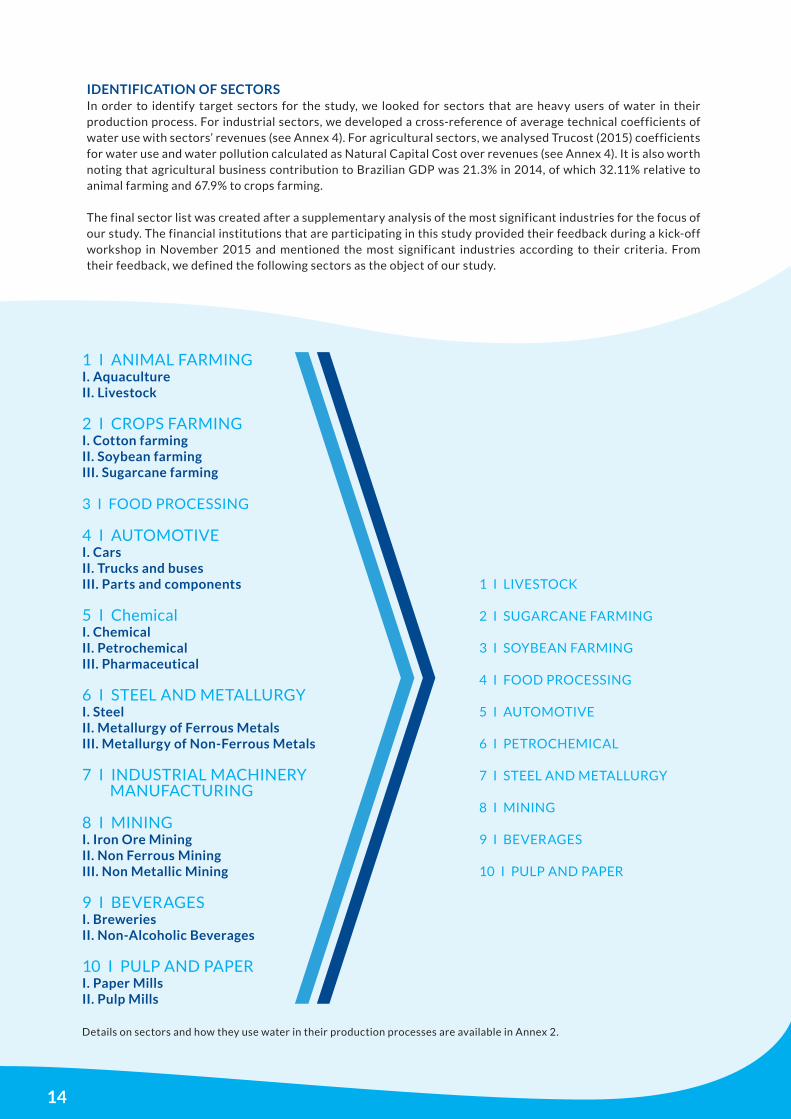
In order to identify target sectors for the study, we looked for sectors that are heavy users of water in their production process. For industrial sectors, we developed a cross-reference of average technical coefficients of water use with sectors’ revenues (see Annex 4). For agricultural sectors, we analysed Trucost (2015) coefficients for water use and water pollution calculated as Natural Capital Cost over revenues (see Annex 4). It is also worth noting that agricultural business contribution to Brazilian GDP was 21.3% in 2014, of which 32.11% relative to animal farming and 67.9% to crops farming.
The final sector list was created after a supplementary analysis of the most significant industries for the focus of our study. The financial institutions that are participating in this study provided their feedback during a kick-off workshop in November 2015 and mentioned the most significant industries according to their criteria. From their feedback, we defined the following sectors as the object of our study.
IDENTIFICATION OF SECTORS
15
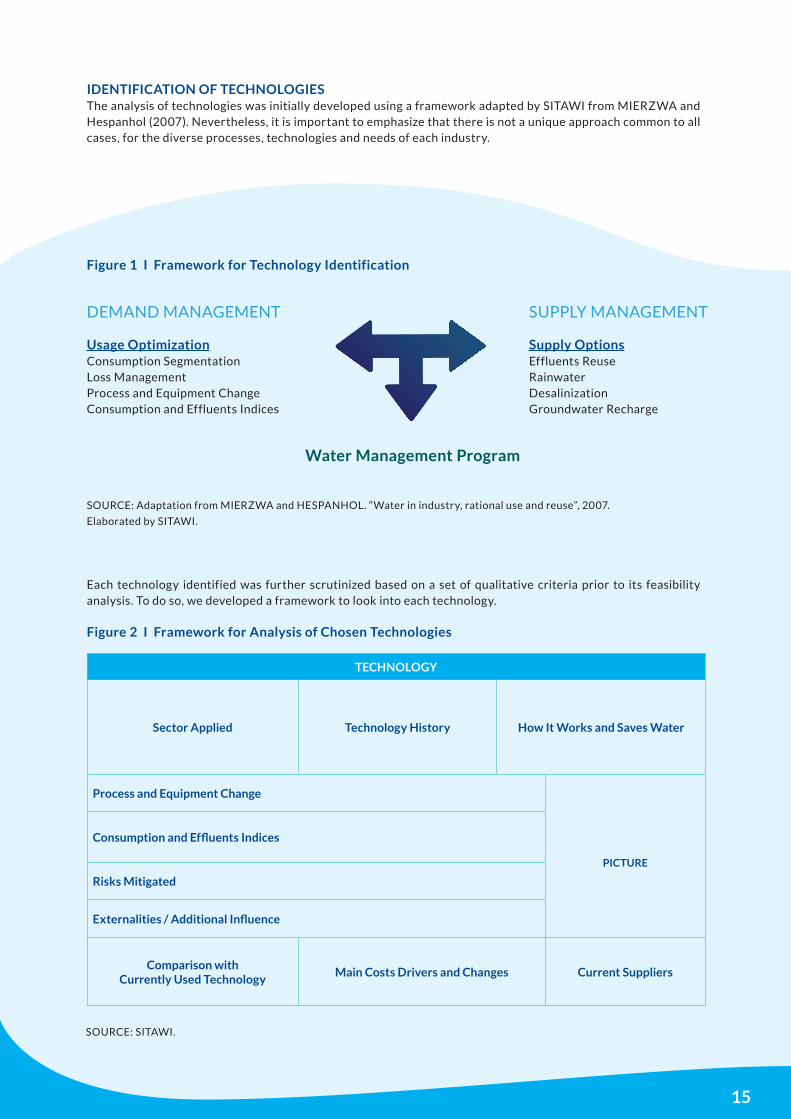
Figure 1 I Framework for Technology Identification
Water Management Program
SOURCE: Adaptation from MIERZWA and HESPANHOL. “Water in industry, rational use and reuse”, 2007.
Elaborated by SITAWI.
TECHNOLOGY
Sector Applied Technology History How It Works and Saves Water
Process and Equipment Change
PICTURE
Consumption and Effluents Indices
Risks Mitigated
Externalities / Additional Influence
Comparison with Currently Used Technology
Main Costs Drivers and Changes Current Suppliers
Figure 2 I Framework for Analysis of Chosen Technologies
SOURCE: SITAWI.
Each technology identified was further scrutinized based on a set of qualitative criteria prior to its feasibility analysis. To do so, we developed a framework to look into each technology.
DEMAND MANAGEMENT
Usage Optimization Consumption Segmentation Loss Management Process and Equipment Change Consumption and Effluents Indices
SUPPLY MANAGEMENT
Supply Options Effluents Reuse Rainwater Desalinization Groundwater Recharge
The analysis of technologies was initially developed using a framework adapted by SITAWI from MIERZWA and Hespanhol (2007). Nevertheless, it is important to emphasize that there is not a unique approach common to all cases, for the diverse processes, technologies and needs of each industry.
IDENTIFICATION OF TECHNOLOGIES
16
FEASIBILITY ANALYSISThe feasibility analysis evaluated whether a technology was financially attractive from the users’ point of view, considering initial investment (Capex), operating costs (Opex), additional costs, water savings and other savings and risk mitigation. To quantify the viability of each technology we used NPV (Net Present Value) calculation with the variables mentioned above, costs and savings within 15-year period.
However, to calculate an NPV we would have had to use a cost for water and, as mentioned before, water cost has wide a range of variation given the many variables that influence its value. Therefore, we’ve set a target NPV to zero and identified the water break even cost (WBC). When NPV is zero there is no profit or loss, the investment pays itself, therefore the WBC identified is the value at which the invest-ment starts to become attractive.
When the user’s total water cost is lower than the WBC, the investment will not payoff economically. Any cost above the WBC turns the technology attrac-tive enough to achieve a positive NPV, and thus being considered economically feasible.
INVESTMENT GAPThe investment gap was estimated considering the current use of technology in one or a few sectors and the potential for further adoption. In order to do so, we estimated the number of potential future users that can adopt those technologies minus an estima-te of those that already use them, and multiplied the market size (number of equipment) by the Capex of an average-sized installation, achieving the total invest-ment gap.
OPPORTUNITIES FOR FINANCIAL INSTITUTIONSThe last step consisted on the financing opportunities for banks. In particular we identified the addressable market size, market fragmentation/company size and ticket size of projects.
We also explained how FIs may assess the water risk exposure of their portfolios and identify which tech-nologies are the most promising to their clients.
17
W A T E R C O N S E R V I N G TECHNOLOGIES
2
18
Technology Reuse Economy Availability
1 Hydrometer for Consumption Segmentation
2 Drip Irrigation
3 Dust Disperser
4 Sewage for Aquaculture
5 Evaporation to Vinasse Concentration
6 Water Loss Detector
7 Chemical Free Cooling Tower
8 Rainwater Harvesting
9 Ozone Treatment
10 Artificial Wetlands
11 UltraFiltration
12 Reverse Osmosis
13 Thermal Distillation
14 Reforestation
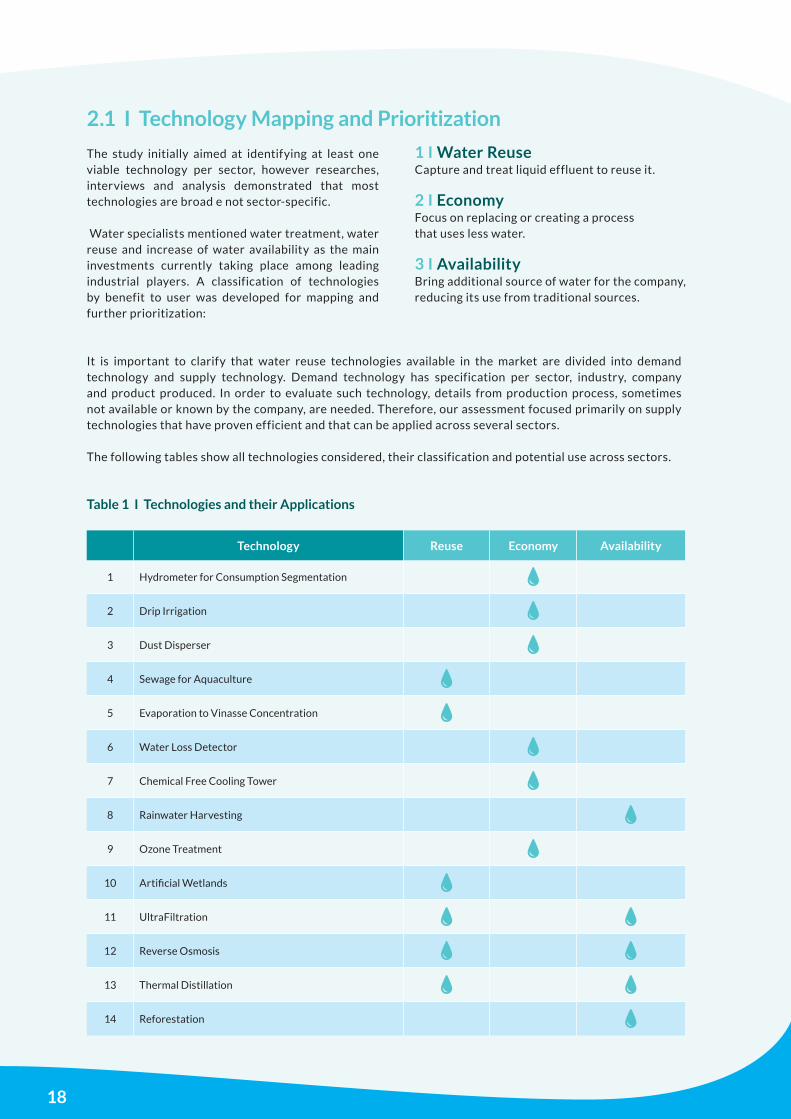
2.1 I Technology Mapping and Prioritization
Table 1 I Technologies and their Applications
The study initially aimed at identifying at least one viable technology per sector, however researches, interviews and analysis demonstrated that most technologies are broad e not sector-specific.
Water specialists mentioned water treatment, water reuse and increase of water availability as the main investments currently taking place among leading industrial players. A classification of technologies by benefit to user was developed for mapping and further prioritization:
It is important to clarify that water reuse technologies available in the market are divided into demand technology and supply technology. Demand technology has specification per sector, industry, company and product produced. In order to evaluate such technology, details from production process, sometimes not available or known by the company, are needed. Therefore, our assessment focused primarily on supply technologies that have proven efficient and that can be applied across several sectors.
The following tables show all technologies considered, their classification and potential use across sectors.
1 I Water Reuse Capture and treat liquid effluent to reuse it.
2 I Economy Focus on replacing or creating a process that uses less water.
3 I Availability Bring additional source of water for the company, reducing its use from traditional sources.

19
Technology LivestockSoy
Agriculture
Sugarcane
Agriculture
Food
ProcessingAutomotive Petrochemical
Steel
and
Metal
Mining Beverage
Pulp
and
Paper
1
Hydrometer for
Consumption
Segmentation
2Drip
Irrigation
3Dust
Disperser
4
Aquiculture
for Sewage
Treatment
5
Evaporation
to Vinasse
Concentration
6Water Loss
Detector
7Chemical Free
Cooling Tower
8Rainwater
Harvest
9Ozone
Treatment
10Artificial
Wetlands
11 UltraFiltration
12Reverse
Osmosis
13Thermal
Distillation
14 Reforestation
Table 2 I Potential Use of Technology per Sector
2.2 I Method to Assess Technology Feasibility and Market Potential
Some basic assumptions were used in most of the analysis, such as an alternate technology, case or an illustrative situation to be used for comparison, as well as estimates of productivity. The assumptions are described in each technology sub-section.
We discounted the cash flows of the technology at a fixed real rate of 14.15% (WACC – weighted avera-ge cost of capital) to check its feasibility. The Water Break Even Cost (WBC) is the cost of water in which the Net Present Value of the investment equals zero.
If the user’s total cost of water is equal or above the WBC, the technology is economically feasible.However, the WBC is only indicative, given the com-plexity and variability of water consumption by in-dustry sector, which makes necessary to perform a site-specific feasibility analysis before making the investment.
The WBC, nevertheless, provides a good insight to users and investors to help them select the most pro-mising technology for deeper studies.
In order to estimate the market potential, we looked for the number, size and localization of companies of the 10 selected sectors. These were complemented with data on the current use of 14 technologies in the selected sectors.
In several cases, we needed to use assumptions and proxies to calculate the investment gap, which is the CAPEX of an average project times the number of companies that do not use these technologies yet. Data and assumptions used are described in the summary of each technology in this section.
20

Hydrometers (mechanical speedometer type) are the most widely used meters in micro measurement and are pivotal for consumption segmentation. They present operating characteristics particular to each type and gauge model representing its hydraulic behavior (pressure drop as a function of flow rate) and measurement capacity.
Their features include integration capacity of measurement functions, aggregation and data storage in small size, and facility to be employed and robustness in the face of different exposure conditions. Within the proposed use of water meters for water measurement in building systems, the points for their installation have different loca-tions from the building feeder to the distribution subsystem extension. In large industrial facilities, placement and number of hydrometers can vary on each specific situation.
HYDROMETER FOR CONSUMPTION SEGMENTATION
HYDROMETER FOR CONSUMPTION SEGMENTATION
FEASIBILITY ANALYSIS MARKET POTENTIAL
1 I GENERAL PARAMETERS
A I CAPEX (R$) R$ 215,280E I Size of Companies that may Use the Technology
S/M/L
B I OPEX per year (R$) R$ 0F I Applicable
Sectors
Food Processing, Automotive, Petrochemical, Metal and Steel, Beverage,
Pulp and Paper, Mining
C I Annual Water Saving per Equipment (m³)
12,000
OTHER COSTS OR BENEFITS OF THE TECHNOLOGYG I Companies that Already
Use the Technology (%)50%
There are no other costs or benefits with the technology
H I Number of Equipment 89,799
i I Total Water Saving with the Technology (m³)
180,000
2 I SPECIFIC PARAMETER OF THE TECHNOLOGY
J I Companies Concerned about Water Scarcity
70%
D I Water Break Even Cost (R$/m³)
R$ 1.21 K I Investment Gap R$ 1,288,789,866
3 I REFERENCES AND ASSUMPTIONSA - CAPEX for 15 hydrometers with capacity of 1.5 m³/hour. This technology does not have OPEX. However, the equipment must be replaced every 2 years. Thus, CAPEX for the period of 15 years is R$ 215,280.B - The technology does not have OPEX.C - The technology can reduce 10% of water consumption of a company. In the model we assumed a company that consumes 120,000 m³/year, thus, water saving is equal to 12,000 m³/year.D – Break even cost of water to enable investments in the technology.E – Technology applicable to companies of all sizes. F – Technology applicable to all industrial sectors. G - We estimated that around 50% of companies already have initiatives to reduce their water consumption.H - There are 18,735 companies in the sectors appointed in (F), from which 4,137 are medium companies and 1,200 are large companies. We assumed that each medium company can implement 15 hydrometers, small companies can implement half of that and large companies three times more, which results in 88,799 equipment. Data taken from SIDRA/IBGE.I - We obtained the volume of water saving multiplying the number of equipment (H) potentially commercialized by the water saving generated by each hydrometer.K - To obtain the investment gap we multiplied the number of equipment by the cost of each equipment for a period of 15 years.
2.3 I Technologies Description and Analysis
21
22
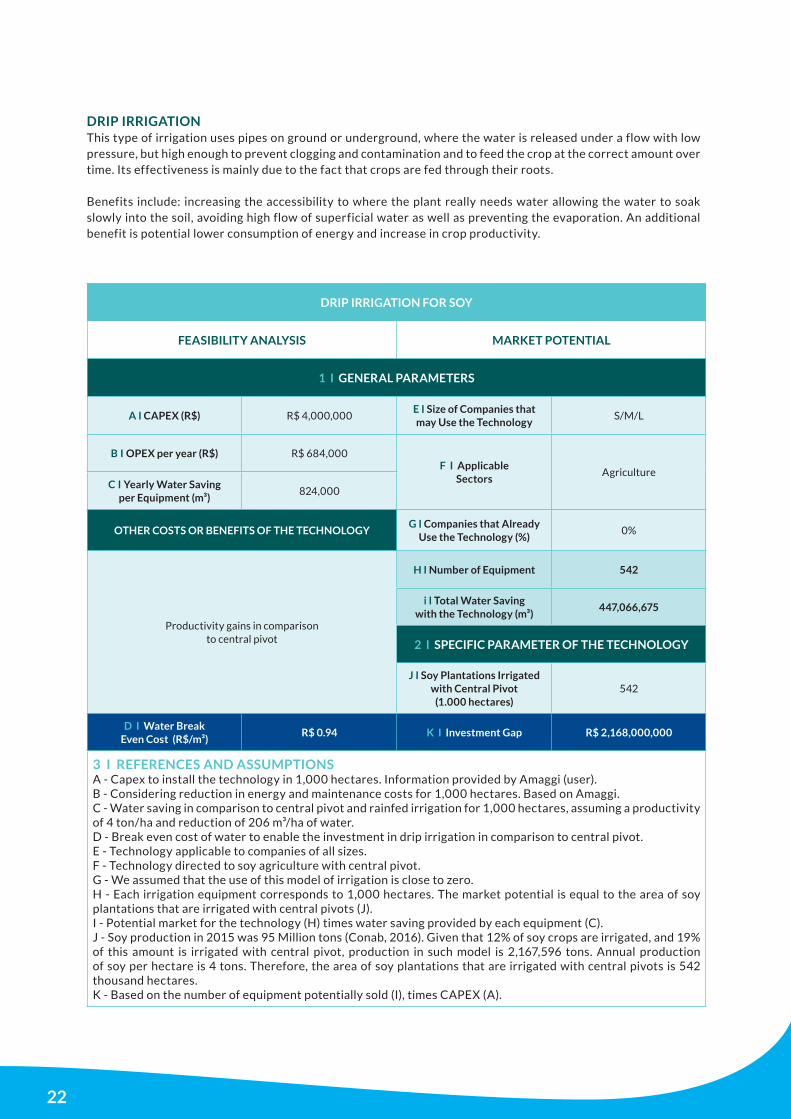
This type of irrigation uses pipes on ground or underground, where the water is released under a flow with low pressure, but high enough to prevent clogging and contamination and to feed the crop at the correct amount over time. Its effectiveness is mainly due to the fact that crops are fed through their roots.
Benefits include: increasing the accessibility to where the plant really needs water allowing the water to soak slowly into the soil, avoiding high flow of superficial water as well as preventing the evaporation. An additional benefit is potential lower consumption of energy and increase in crop productivity.
DRIP IRRIGATION
DRIP IRRIGATION FOR SOY
FEASIBILITY ANALYSIS MARKET POTENTIAL
1 I GENERAL PARAMETERS
A I CAPEX (R$) R$ 4,000,000E I Size of Companies that may Use the Technology
S/M/L
B I OPEX per year (R$) R$ 684,000F I Applicable
SectorsAgriculture
C I Yearly Water Saving per Equipment (m³)
824,000
OTHER COSTS OR BENEFITS OF THE TECHNOLOGYG I Companies that Already
Use the Technology (%)0%
Productivity gains in comparison to central pivot
H I Number of Equipment 542
i I Total Water Saving with the Technology (m³)
447,066,675
2 I SPECIFIC PARAMETER OF THE TECHNOLOGY
J I Soy Plantations Irrigated with Central Pivot
(1.000 hectares)542
D I Water Break Even Cost (R$/m³)
R$ 0.94 K I Investment Gap R$ 2,168,000,000
3 I REFERENCES AND ASSUMPTIONSA - Capex to install the technology in 1,000 hectares. Information provided by Amaggi (user).B - Considering reduction in energy and maintenance costs for 1,000 hectares. Based on Amaggi.C - Water saving in comparison to central pivot and rainfed irrigation for 1,000 hectares, assuming a productivity of 4 ton/ha and reduction of 206 m³/ha of water.D - Break even cost of water to enable the investment in drip irrigation in comparison to central pivot.E - Technology applicable to companies of all sizes.F - Technology directed to soy agriculture with central pivot.G - We assumed that the use of this model of irrigation is close to zero.H - Each irrigation equipment corresponds to 1,000 hectares. The market potential is equal to the area of soy plantations that are irrigated with central pivots (J).I - Potential market for the technology (H) times water saving provided by each equipment (C).J - Soy production in 2015 was 95 Million tons (Conab, 2016). Given that 12% of soy crops are irrigated, and 19% of this amount is irrigated with central pivot, production in such model is 2,167,596 tons. Annual production of soy per hectare is 4 tons. Therefore, the area of soy plantations that are irrigated with central pivots is 542 thousand hectares.K - Based on the number of equipment potentially sold (I), times CAPEX (A).
23
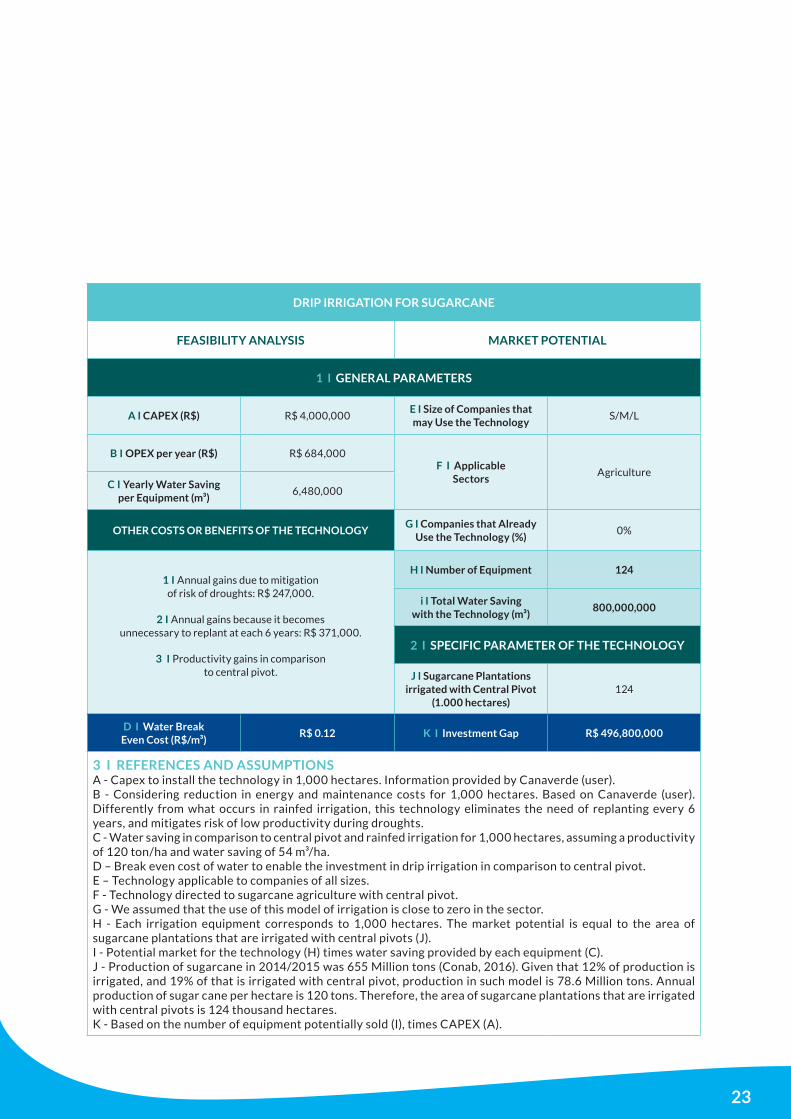
DRIP IRRIGATION FOR SUGARCANE
FEASIBILITY ANALYSIS MARKET POTENTIAL
1 I GENERAL PARAMETERS
A I CAPEX (R$) R$ 4,000,000E I Size of Companies that may Use the Technology
S/M/L
B I OPEX per year (R$) R$ 684,000F I Applicable
SectorsAgriculture
C I Yearly Water Saving per Equipment (m³)
6,480,000
OTHER COSTS OR BENEFITS OF THE TECHNOLOGYG I Companies that Already
Use the Technology (%)0%
1 I Annual gains due to mitigation of risk of droughts: R$ 247,000.
2 I Annual gains because it becomes
unnecessary to replant at each 6 years: R$ 371,000.
3 I Productivity gains in comparison to central pivot.
H I Number of Equipment 124
i I Total Water Saving with the Technology (m³)
800,000,000
2 I SPECIFIC PARAMETER OF THE TECHNOLOGY
J I Sugarcane Plantations irrigated with Central Pivot
(1.000 hectares)124
D I Water Break Even Cost (R$/m³)
R$ 0.12 K I Investment Gap R$ 496,800,000
3 I REFERENCES AND ASSUMPTIONSA - Capex to install the technology in 1,000 hectares. Information provided by Canaverde (user).B - Considering reduction in energy and maintenance costs for 1,000 hectares. Based on Canaverde (user). Differently from what occurs in rainfed irrigation, this technology eliminates the need of replanting every 6 years, and mitigates risk of low productivity during droughts.C - Water saving in comparison to central pivot and rainfed irrigation for 1,000 hectares, assuming a productivity of 120 ton/ha and water saving of 54 m³/ha.D – Break even cost of water to enable the investment in drip irrigation in comparison to central pivot.E – Technology applicable to companies of all sizes. F - Technology directed to sugarcane agriculture with central pivot.G - We assumed that the use of this model of irrigation is close to zero in the sector. H - Each irrigation equipment corresponds to 1,000 hectares. The market potential is equal to the area of sugarcane plantations that are irrigated with central pivots (J).I - Potential market for the technology (H) times water saving provided by each equipment (C).J - Production of sugarcane in 2014/2015 was 655 Million tons (Conab, 2016). Given that 12% of production is irrigated, and 19% of that is irrigated with central pivot, production in such model is 78.6 Million tons. Annual production of sugar cane per hectare is 120 tons. Therefore, the area of sugarcane plantations that are irrigated with central pivots is 124 thousand hectares.K - Based on the number of equipment potentially sold (I), times CAPEX (A).

24
The use of water in mining processes is significant, especially because a large amount of dust gets suspended during the entire process, from mining, to the transportation and then at the final deposition of minerals. In order to reduce the amount of suspended dust, water is extensively sprayed on the fields and on the piles of minerals.
The use of sprayed water, besides being inefficient, might reduce the quality of the mineral and affect the moisture specification. A solution adopted by some mining companies is the incorporation of chemical products in the sprayed water, capable of decreasing the suspended dust with more efficiency. The chemical dust disperser reduces significantly the frequency and quantity of water applications.
DUST DISPERSER
DUST DISPERSER
FEASIBILITY ANALYSIS MARKET POTENTIAL
1 I GENERAL PARAMETERS
A I CAPEX (R$) R$ 0E I Size of Companies that may Use the Technology
S/M/L
B I OPEX per year (R$) R$ 3,171,427F I Applicable
SectorsMining
C I Yearly Water Saving per Equipment (m³)
600,000
OTHER COSTS OR BENEFITS OF THE TECHNOLOGYG I Companies that Already
Use the Technology (%)50%
1 I Annual reduction in fuel costs: R$ 73,092.
2 I Better quality
of minerals exploited.
H I Number of Equipment 191
i I Total Water Saving with the Technology (m³)
114,628,879
2 I SPECIFIC PARAMETER OF THE TECHNOLOGY
J I Annual Consumptionof Water in Roads to
Disperse Dust (m³/ha.year)6,963
K I Roads in Mining Areas (m²) 18,815
D I Water Break Even Cost (R$/m³)
R$ 5.41 M I Investment Gap R$ 605,895,502
3 I REFERENCES AND ASSUMPTIONSA - The technology has no Capex, because it can be used in traditional equipment for dust dispersing. B - Suggested price of the technology is USD 1.00/kg. For each m³ of water, it must be applied 10kg of the product, reducing water consumption in 88%. In the model we used 857,000 kg of the product must be applied, costing R$ 3.17 Million. In this model, it is possible to reduce water consumption in 600,000 m³. Suppliers provided information.C - The technology reduces the quantity of water used to 88%. In the model we analyzed, the product was used in 85,714 cubic meters of water, reducing water consumption in 600,000 m³.D – Break even cost of water to enable investments in the technology.E - As this technology is primarily used in dirt roads localized nearby mining areas, it can be applicable to companies of all sizes.F - Technology used to reduce water consumption in minerals transportation.G - We estimate that around 50% of mining companies do not use this process yet, due to easy access to water sources.H - Based on the potential of water saved with the technology (I) divided by the water saved per equipment (C).I - Hectares of roads localized in mining areas (K) times average water consumption in roads to disperse dust (J) times reduction of 88% of water consumption with chemical substances.J - Suppliers provided information.K - We estimated that 10% of mining areas are used as roads. Information of mining areas was taken from DNPM (National Department of Mineral Production), 2014.
25
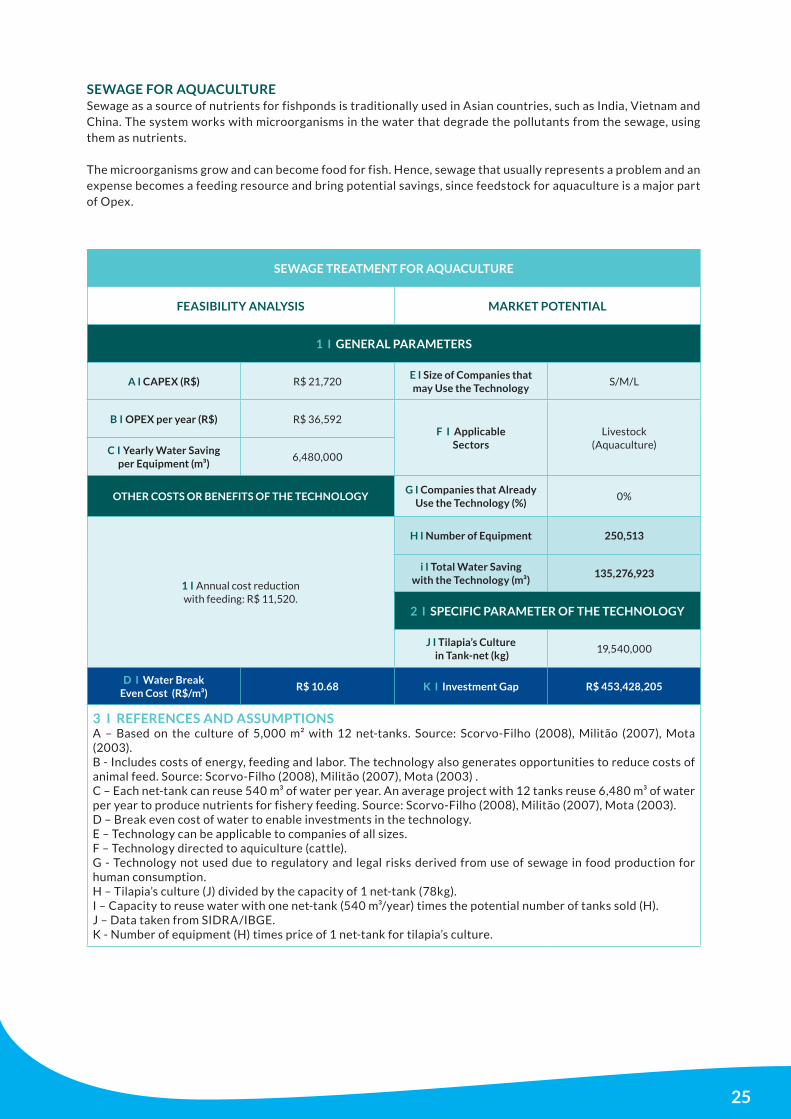
Sewage as a source of nutrients for fishponds is traditionally used in Asian countries, such as India, Vietnam and China. The system works with microorganisms in the water that degrade the pollutants from the sewage, using them as nutrients.
The microorganisms grow and can become food for fish. Hence, sewage that usually represents a problem and an expense becomes a feeding resource and bring potential savings, since feedstock for aquaculture is a major part of Opex.
SEWAGE FOR AQUACULTURE
SEWAGE TREATMENT FOR AQUACULTURE
FEASIBILITY ANALYSIS MARKET POTENTIAL
1 I GENERAL PARAMETERS
A I CAPEX (R$) R$ 21,720E I Size of Companies that may Use the Technology
S/M/L
B I OPEX per year (R$) R$ 36,592F I Applicable
SectorsLivestock
(Aquaculture)C I Yearly Water Saving per Equipment (m³)
6,480,000
OTHER COSTS OR BENEFITS OF THE TECHNOLOGYG I Companies that Already
Use the Technology (%)0%
1 I Annual cost reduction with feeding: R$ 11,520.
H I Number of Equipment 250,513
i I Total Water Saving with the Technology (m³)
135,276,923
2 I SPECIFIC PARAMETER OF THE TECHNOLOGY
J I Tilapia’s Culture in Tank-net (kg)
19,540,000
D I Water Break Even Cost (R$/m³)
R$ 10.68 K I Investment Gap R$ 453,428,205
3 I REFERENCES AND ASSUMPTIONSA – Based on the culture of 5,000 m² with 12 net-tanks. Source: Scorvo-Filho (2008), Militão (2007), Mota (2003).B - Includes costs of energy, feeding and labor. The technology also generates opportunities to reduce costs of animal feed. Source: Scorvo-Filho (2008), Militão (2007), Mota (2003) .C – Each net-tank can reuse 540 m³ of water per year. An average project with 12 tanks reuse 6,480 m³ of water per year to produce nutrients for fishery feeding. Source: Scorvo-Filho (2008), Militão (2007), Mota (2003).D – Break even cost of water to enable investments in the technology.E – Technology can be applicable to companies of all sizes.F – Technology directed to aquiculture (cattle).G - Technology not used due to regulatory and legal risks derived from use of sewage in food production for human consumption.H – Tilapia’s culture (J) divided by the capacity of 1 net-tank (78kg).I – Capacity to reuse water with one net-tank (540 m³/year) times the potential number of tanks sold (H).J – Data taken from SIDRA/IBGE.K - Number of equipment (H) times price of 1 net-tank for tilapia’s culture.

26
The production of sugarcane is very intensive in water, generating vinasse as wastewater, effluent from the production of ethanol. A new route technology seeks recovery of water vinasse and reduces emissions of greenhouse gases as well as the risk of groundwater contamination. In a plant, the generation of vinasse is in the ratio of 10 liters per liter of ethanol produced.
Currently, the vinasse is used as organic fertilizer in large parts of the plants because of its nutrients. However, it spends a lot of diesel oil and it is very diluted, which may be a risk for groundwater contamination. Vinasse concentration is a system that uses the first downlink turbulent mist coupled to the distillation column which allows the production of ethanol in the already concentrated vinasse, with no additional steam consumption.
EVAPORATION TO VINASSE CONCENTRATION
EVAPORATION TO VINASSE CONCENTRATION
FEASIBILITY ANALYSIS MARKET POTENTIAL
1 I GENERAL PARAMETERS
A I CAPEX (R$) R$ 30,000,000E I Size of Companies that may Use the Technology
S/M/L
B I OPEX per year (R$) R$ 916,000F I Applicable
SectorsAgriculture
C I Yearly Water Saving per Equipment (m³)
907,000
OTHER COSTS OR BENEFITS OF THE TECHNOLOGYG I Companies that Already
Use the Technology (%)0%
1 I Annual gains of productivity in sugarcane agriculture: R$ 1,262,250.
2 I Annual savings
with fertilizers: R$ 3,326,400.
H I Number of Equipment 126
i I Total Water Saving with the Technology (m³)
114,282,000
2 I SPECIFIC PARAMETER OF THE TECHNOLOGY
J I Companies Concerned about Water Scarcity
70%
K I Minimum Production of Ethanol to enable Technology (m³/day)
600
D I Water Break Even Cost (R$/m³)
R$ 1.38 L I Investment Gap R$ 3,780,000,000
3 I REFERENCES AND ASSUMPTIONSA - Capex for a project that generates 907,000 m³ per year. Citrotec (supplier) provided this information.B - Includes energy and maintenance costs. The technology also generates other benefits such as higher productivity in agriculture and reduction in use of fertilizers. Information provided by Citrotec.C - The technology can generate 210 m³/hour of water and can work 4,800 per harvest, which corresponds to an annual saving of 907,000 m³ of water.D – Break even cost of water to enable investments in the technology.E – The technology is applicable to companies of all sizes, as long as its daily production is above 600 m³ of ethanol.F – Only applicable to sugarcane producers.G - We assumed that there is not significant use of this technology in the country as of 2016.H - Brazil has 358 ethanol producers, and 180 produce more than 600 m³/day (ANP, Ethanol Newsletter, February 2016). Considering that only 70% of the companies are concerned about water scarcity (J), the market potential is 126 equipment.I - Market potential (H) times water saving per equipment (C).J – Base on FIESP (2009).K - According to ANP, 180 ethanol producers meet this criterion. The threshold of 600 m³/day was defined as a minimum scale that enables investments in the technology.L - Number of equipment (H) times CAPEX (A).
27
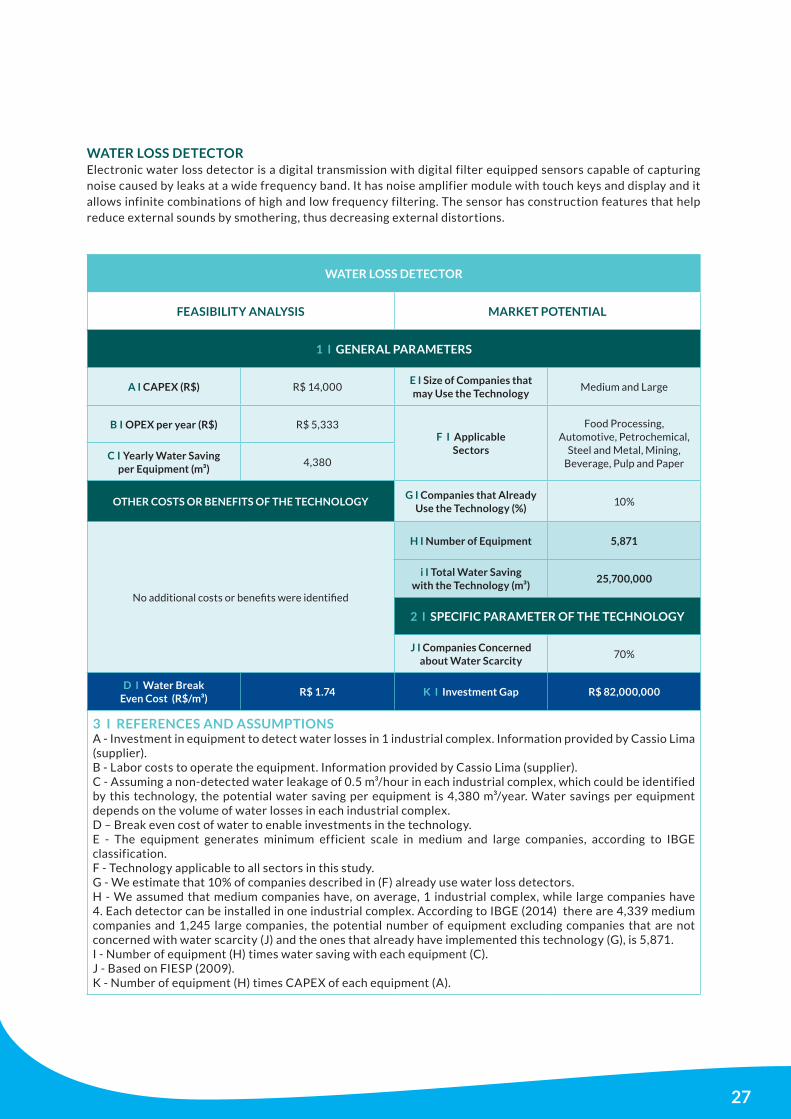
Electronic water loss detector is a digital transmission with digital filter equipped sensors capable of capturing noise caused by leaks at a wide frequency band. It has noise amplifier module with touch keys and display and it allows infinite combinations of high and low frequency filtering. The sensor has construction features that help reduce external sounds by smothering, thus decreasing external distortions.
WATER LOSS DETECTOR
WATER LOSS DETECTOR
FEASIBILITY ANALYSIS MARKET POTENTIAL
1 I GENERAL PARAMETERS
A I CAPEX (R$) R$ 14,000E I Size of Companies that may Use the Technology
Medium and Large
B I OPEX per year (R$) R$ 5,333F I Applicable
Sectors
Food Processing, Automotive, Petrochemical,
Steel and Metal, Mining, Beverage, Pulp and Paper
C I Yearly Water Saving per Equipment (m³)
4,380
OTHER COSTS OR BENEFITS OF THE TECHNOLOGYG I Companies that Already
Use the Technology (%)10%
No additional costs or benefits were identified
H I Number of Equipment 5,871
i I Total Water Saving with the Technology (m³)
25,700,000
2 I SPECIFIC PARAMETER OF THE TECHNOLOGY
J I Companies Concerned about Water Scarcity
70%
D I Water Break Even Cost (R$/m³)
R$ 1.74 K I Investment Gap R$ 82,000,000
3 I REFERENCES AND ASSUMPTIONSA - Investment in equipment to detect water losses in 1 industrial complex. Information provided by Cassio Lima (supplier).B - Labor costs to operate the equipment. Information provided by Cassio Lima (supplier).C - Assuming a non-detected water leakage of 0.5 m³/hour in each industrial complex, which could be identified by this technology, the potential water saving per equipment is 4,380 m³/year. Water savings per equipment depends on the volume of water losses in each industrial complex.D – Break even cost of water to enable investments in the technology.E - The equipment generates minimum efficient scale in medium and large companies, according to IBGE classification.F - Technology applicable to all sectors in this study.G - We estimate that 10% of companies described in (F) already use water loss detectors.H - We assumed that medium companies have, on average, 1 industrial complex, while large companies have 4. Each detector can be installed in one industrial complex. According to IBGE (2014) there are 4,339 medium companies and 1,245 large companies, the potential number of equipment excluding companies that are not concerned with water scarcity (J) and the ones that already have implemented this technology (G), is 5,871.I - Number of equipment (H) times water saving with each equipment (C).J - Based on FIESP (2009).K - Number of equipment (H) times CAPEX of each equipment (A).
28
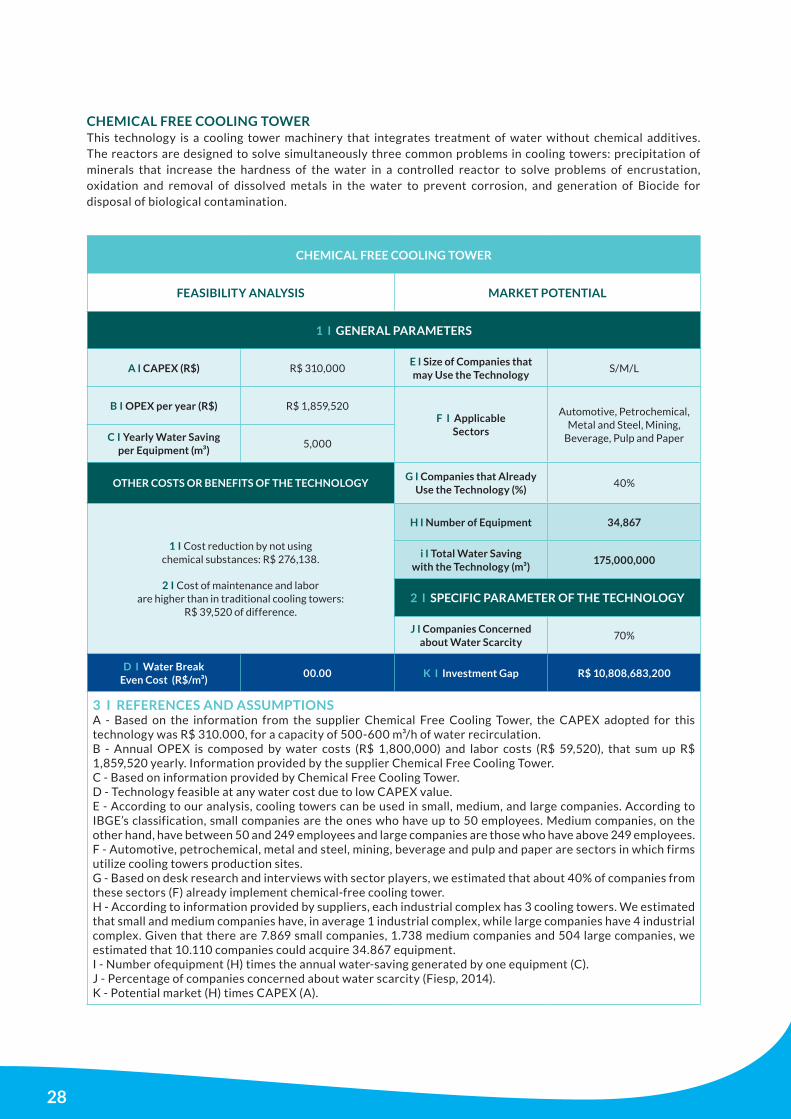
This technology is a cooling tower machinery that integrates treatment of water without chemical additives. The reactors are designed to solve simultaneously three common problems in cooling towers: precipitation of minerals that increase the hardness of the water in a controlled reactor to solve problems of encrustation, oxidation and removal of dissolved metals in the water to prevent corrosion, and generation of Biocide for disposal of biological contamination.
CHEMICAL FREE COOLING TOWER
CHEMICAL FREE COOLING TOWER
FEASIBILITY ANALYSIS MARKET POTENTIAL
1 I GENERAL PARAMETERS
A I CAPEX (R$) R$ 310,000E I Size of Companies that may Use the Technology
S/M/L
B I OPEX per year (R$) R$ 1,859,520F I Applicable
Sectors
Automotive, Petrochemical, Metal and Steel, Mining,
Beverage, Pulp and PaperC I Yearly Water Saving per Equipment (m³)
5,000
OTHER COSTS OR BENEFITS OF THE TECHNOLOGYG I Companies that Already
Use the Technology (%)40%
1 I Cost reduction by not using chemical substances: R$ 276,138.
2 I Cost of maintenance and labor
are higher than in traditional cooling towers: R$ 39,520 of difference.
H I Number of Equipment 34,867
i I Total Water Saving with the Technology (m³)
175,000,000
2 I SPECIFIC PARAMETER OF THE TECHNOLOGY
J I Companies Concerned about Water Scarcity
70%
D I Water Break Even Cost (R$/m³)
00.00 K I Investment Gap R$ 10,808,683,200
3 I REFERENCES AND ASSUMPTIONSA - Based on the information from the supplier Chemical Free Cooling Tower, the CAPEX adopted for this technology was R$ 310.000, for a capacity of 500-600 m³/h of water recirculation.B - Annual OPEX is composed by water costs (R$ 1,800,000) and labor costs (R$ 59,520), that sum up R$ 1,859,520 yearly. Information provided by the supplier Chemical Free Cooling Tower. C - Based on information provided by Chemical Free Cooling Tower. D - Technology feasible at any water cost due to low CAPEX value. E - According to our analysis, cooling towers can be used in small, medium, and large companies. According to IBGE’s classification, small companies are the ones who have up to 50 employees. Medium companies, on the other hand, have between 50 and 249 employees and large companies are those who have above 249 employees.F - Automotive, petrochemical, metal and steel, mining, beverage and pulp and paper are sectors in which firms utilize cooling towers production sites.G - Based on desk research and interviews with sector players, we estimated that about 40% of companies from these sectors (F) already implement chemical-free cooling tower.H - According to information provided by suppliers, each industrial complex has 3 cooling towers. We estimated that small and medium companies have, in average 1 industrial complex, while large companies have 4 industrial complex. Given that there are 7.869 small companies, 1.738 medium companies and 504 large companies, we estimated that 10.110 companies could acquire 34.867 equipment.I - Number ofequipment (H) times the annual water-saving generated by one equipment (C).J - Percentage of companies concerned about water scarcity (Fiesp, 2014).K - Potential market (H) times CAPEX (A).
29
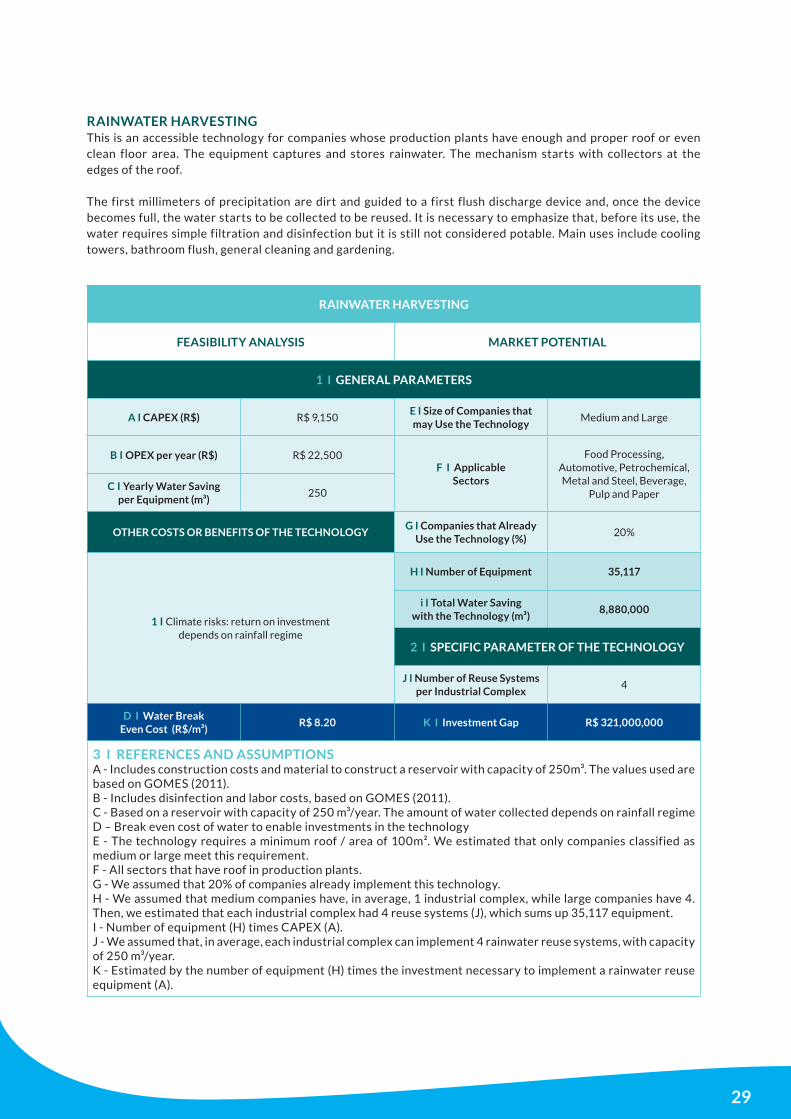
This is an accessible technology for companies whose production plants have enough and proper roof or even clean floor area. The equipment captures and stores rainwater. The mechanism starts with collectors at the edges of the roof.
The first millimeters of precipitation are dirt and guided to a first flush discharge device and, once the device becomes full, the water starts to be collected to be reused. It is necessary to emphasize that, before its use, the water requires simple filtration and disinfection but it is still not considered potable. Main uses include cooling towers, bathroom flush, general cleaning and gardening.
RAINWATER HARVESTING
RAINWATER HARVESTING
FEASIBILITY ANALYSIS MARKET POTENTIAL
1 I GENERAL PARAMETERS
A I CAPEX (R$) R$ 9,150E I Size of Companies that may Use the Technology
Medium and Large
B I OPEX per year (R$) R$ 22,500F I Applicable
Sectors
Food Processing, Automotive, Petrochemical, Metal and Steel, Beverage,
Pulp and PaperC I Yearly Water Saving
per Equipment (m³)250
OTHER COSTS OR BENEFITS OF THE TECHNOLOGYG I Companies that Already
Use the Technology (%)20%
1 I Climate risks: return on investment depends on rainfall regime
H I Number of Equipment 35,117
i I Total Water Saving with the Technology (m³)
8,880,000
2 I SPECIFIC PARAMETER OF THE TECHNOLOGY
J I Number of Reuse Systems per Industrial Complex
4
D I Water Break Even Cost (R$/m³)
R$ 8.20 K I Investment Gap R$ 321,000,000
3 I REFERENCES AND ASSUMPTIONSA - Includes construction costs and material to construct a reservoir with capacity of 250m³. The values used are based on GOMES (2011).B - Includes disinfection and labor costs, based on GOMES (2011). C - Based on a reservoir with capacity of 250 m³/year. The amount of water collected depends on rainfall regime D – Break even cost of water to enable investments in the technologyE - The technology requires a minimum roof / area of 100m². We estimated that only companies classified as medium or large meet this requirement.F - All sectors that have roof in production plants.G - We assumed that 20% of companies already implement this technology.H - We assumed that medium companies have, in average, 1 industrial complex, while large companies have 4. Then, we estimated that each industrial complex had 4 reuse systems (J), which sums up 35,117 equipment. I - Number of equipment (H) times CAPEX (A).J - We assumed that, in average, each industrial complex can implement 4 rainwater reuse systems, with capacity of 250 m³/year.K - Estimated by the number of equipment (H) times the investment necessary to implement a rainwater reuse equipment (A).
30
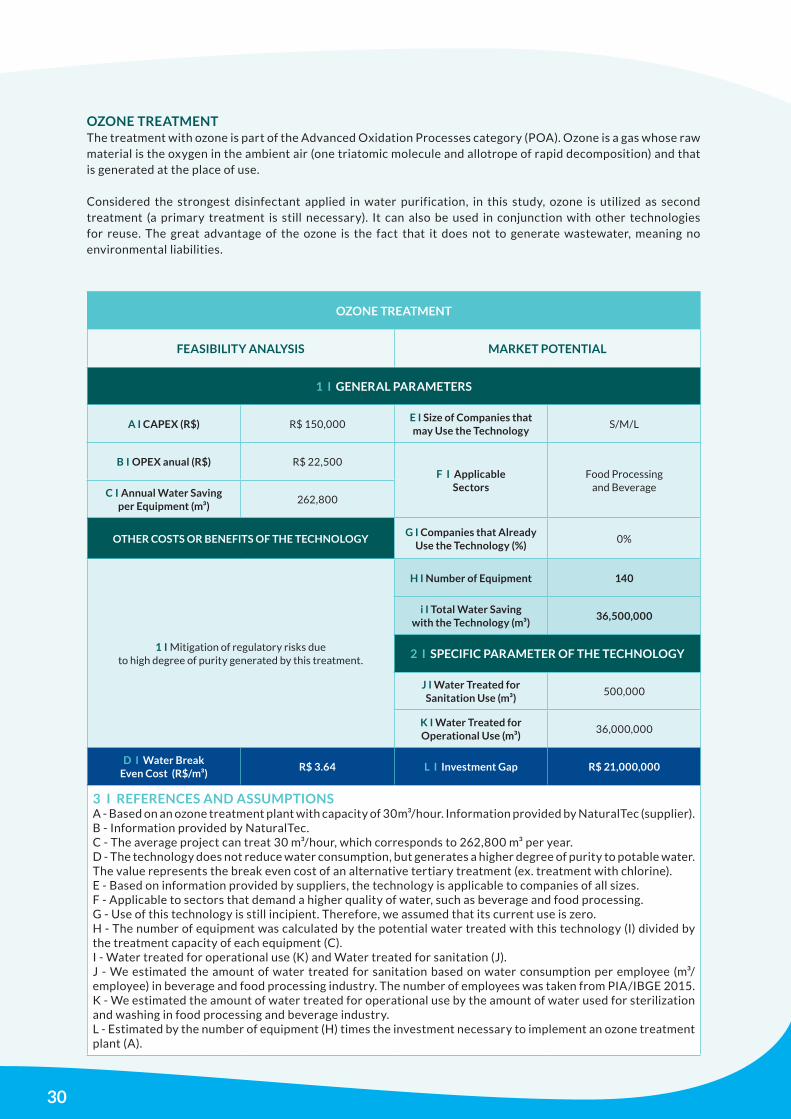
OZONE TREATMENT
OZONE TREATMENT
FEASIBILITY ANALYSIS MARKET POTENTIAL
1 I GENERAL PARAMETERS
A I CAPEX (R$) R$ 150,000E I Size of Companies that may Use the Technology
S/M/L
B I OPEX anual (R$) R$ 22,500F I Applicable
SectorsFood Processing
and BeverageC I Annual Water Saving per Equipment (m³)
262,800
OTHER COSTS OR BENEFITS OF THE TECHNOLOGYG I Companies that Already
Use the Technology (%)0%
1 I Mitigation of regulatory risks due to high degree of purity generated by this treatment.
H I Number of Equipment 140
i I Total Water Saving with the Technology (m³)
36,500,000
2 I SPECIFIC PARAMETER OF THE TECHNOLOGY
J I Water Treated for Sanitation Use (m³)
500,000
K I Water Treated for Operational Use (m³)
36,000,000
D I Water Break Even Cost (R$/m³)
R$ 3.64 L I Investment Gap R$ 21,000,000
3 I REFERENCES AND ASSUMPTIONSA - Based on an ozone treatment plant with capacity of 30m³/hour. Information provided by NaturalTec (supplier).B - Information provided by NaturalTec. C - The average project can treat 30 m³/hour, which corresponds to 262,800 m³ per year.D - The technology does not reduce water consumption, but generates a higher degree of purity to potable water. The value represents the break even cost of an alternative tertiary treatment (ex. treatment with chlorine).E - Based on information provided by suppliers, the technology is applicable to companies of all sizes.F - Applicable to sectors that demand a higher quality of water, such as beverage and food processing.G - Use of this technology is still incipient. Therefore, we assumed that its current use is zero.H - The number of equipment was calculated by the potential water treated with this technology (I) divided by the treatment capacity of each equipment (C).I - Water treated for operational use (K) and Water treated for sanitation (J). J - We estimated the amount of water treated for sanitation based on water consumption per employee (m³/employee) in beverage and food processing industry. The number of employees was taken from PIA/IBGE 2015.K - We estimated the amount of water treated for operational use by the amount of water used for sterilization and washing in food processing and beverage industry.L - Estimated by the number of equipment (H) times the investment necessary to implement an ozone treatment plant (A).
The treatment with ozone is part of the Advanced Oxidation Processes category (POA). Ozone is a gas whose raw material is the oxygen in the ambient air (one triatomic molecule and allotrope of rapid decomposition) and that is generated at the place of use.
Considered the strongest disinfectant applied in water purification, in this study, ozone is utilized as second treatment (a primary treatment is still necessary). It can also be used in conjunction with other technologies for reuse. The great advantage of the ozone is the fact that it does not to generate wastewater, meaning no environmental liabilities.
31
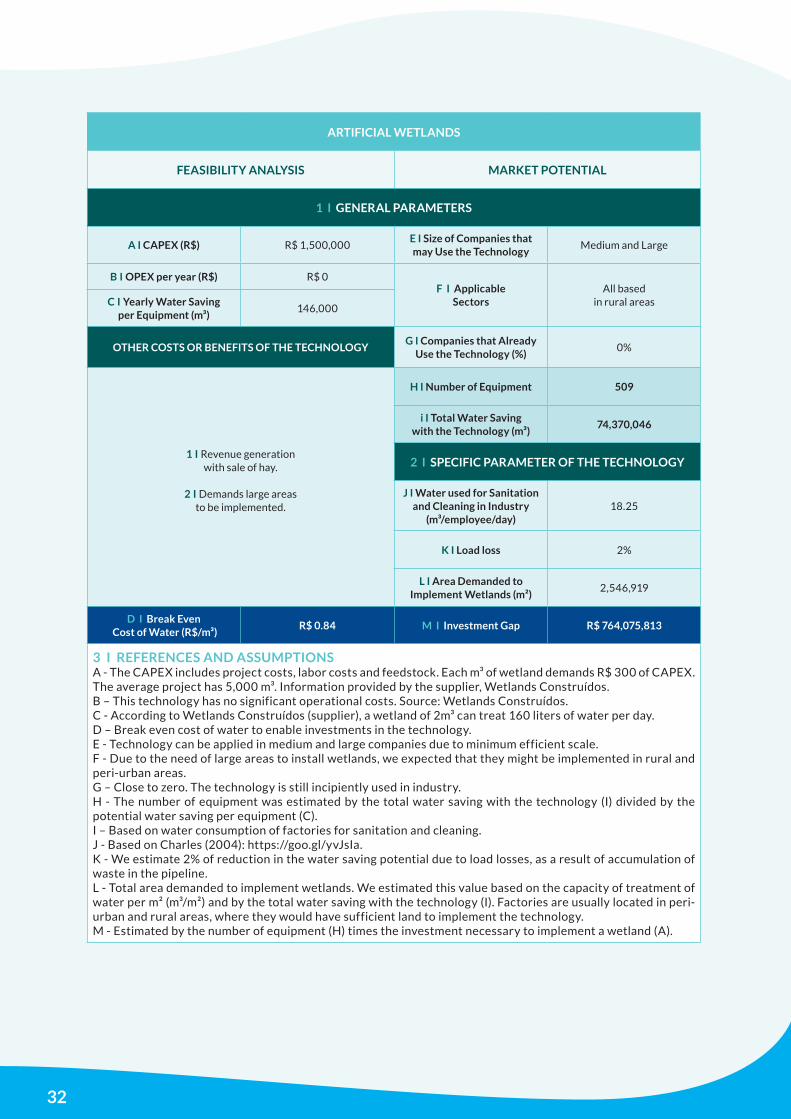
ARTIFICIAL WETLANDSWetlands are regions where land and water interact creating an ecosystem able to become one of the most productive in the world. The natural conditions created by a wetland can be reproduced with the construction of artificial wetlands.
These are capable of treating industrial and domestic effluents through the assimilation of the nutrients by the plants and biomass. The effluents that would be treated to be discharged can be recirculated and reu-sed in some parts of the industrial plant, reducing the consumption of clean water.
The infrastructure required is a shallow excavated area lined with waterproofing geo-membrane, in order to avoid contamination. Above the protected surface, supports are placed, such as stones, to sus-tain the plants.
The treatment is odorless, does not make use of energy, as other regular treatment plants, and assimi-lates carbon from the atmosphere. The construction of artificial wetlands is an elegant solution to indus-tries, since it is a green infrastructure, capable of tre-ating the water and providing a beautiful landscape.
32
ARTIFICIAL WETLANDS
FEASIBILITY ANALYSIS MARKET POTENTIAL
1 I GENERAL PARAMETERS
A I CAPEX (R$) R$ 1,500,000E I Size of Companies that may Use the Technology
Medium and Large
B I OPEX per year (R$) R$ 0F I Applicable
SectorsAll based
in rural areasC I Yearly Water Saving per Equipment (m³)
146,000
OTHER COSTS OR BENEFITS OF THE TECHNOLOGYG I Companies that Already
Use the Technology (%)0%
1 I Revenue generation with sale of hay.
2 I Demands large areas to be implemented.
H I Number of Equipment 509
i I Total Water Saving with the Technology (m³)
74,370,046
2 I SPECIFIC PARAMETER OF THE TECHNOLOGY
J I Water used for Sanitation and Cleaning in Industry
(m³/employee/day)18.25
K I Load loss 2%
L I Area Demanded to Implement Wetlands (m²)
2,546,919
D I Break Even Cost of Water (R$/m³)
R$ 0.84 M I Investment Gap R$ 764,075,813
3 I REFERENCES AND ASSUMPTIONSA - The CAPEX includes project costs, labor costs and feedstock. Each m³ of wetland demands R$ 300 of CAPEX. The average project has 5,000 m³. Information provided by the supplier, Wetlands Construídos.B – This technology has no significant operational costs. Source: Wetlands Construídos. C - According to Wetlands Construídos (supplier), a wetland of 2m³ can treat 160 liters of water per day.D – Break even cost of water to enable investments in the technology.E - Technology can be applied in medium and large companies due to minimum efficient scale.F - Due to the need of large areas to install wetlands, we expected that they might be implemented in rural and peri-urban areas.G – Close to zero. The technology is still incipiently used in industry.H - The number of equipment was estimated by the total water saving with the technology (I) divided by the potential water saving per equipment (C).I – Based on water consumption of factories for sanitation and cleaning. J - Based on Charles (2004): https://goo.gl/yvJsIa.K - We estimate 2% of reduction in the water saving potential due to load losses, as a result of accumulation of waste in the pipeline.L - Total area demanded to implement wetlands. We estimated this value based on the capacity of treatment of water per m² (m³/m²) and by the total water saving with the technology (I). Factories are usually located in peri-urban and rural areas, where they would have sufficient land to implement the technology.M - Estimated by the number of equipment (H) times the investment necessary to implement a wetland (A).
33
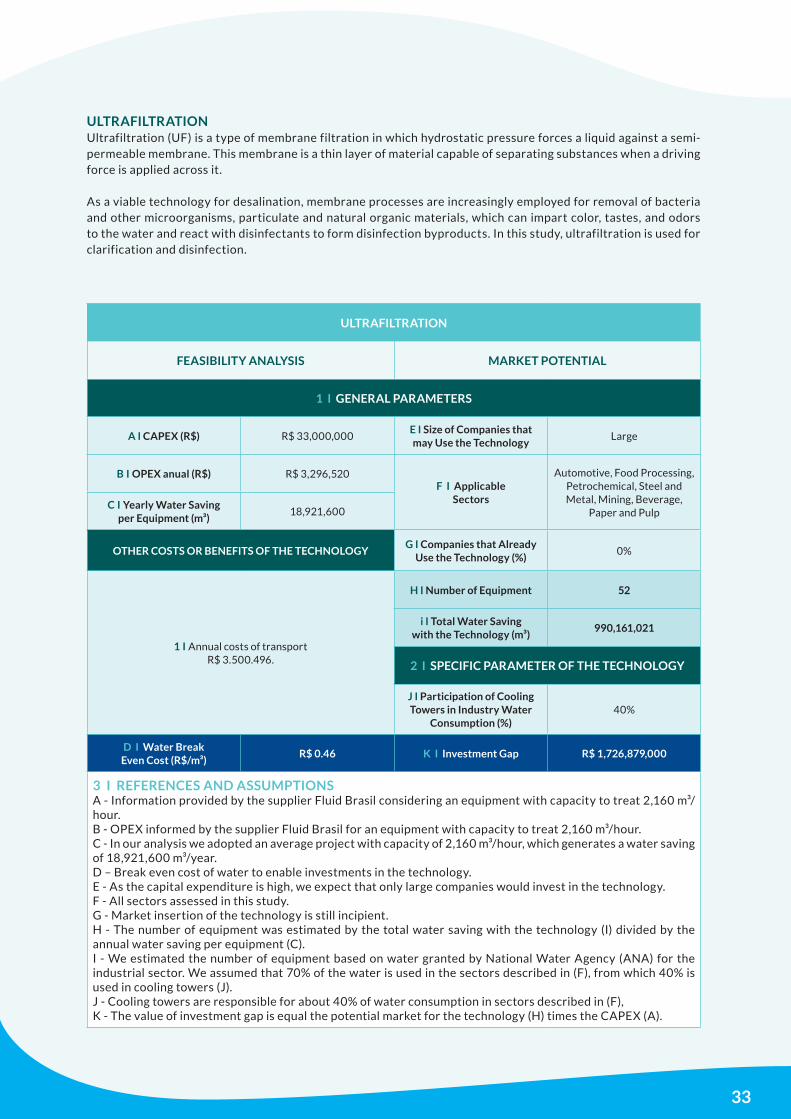
Ultrafiltration (UF) is a type of membrane filtration in which hydrostatic pressure forces a liquid against a semi-permeable membrane. This membrane is a thin layer of material capable of separating substances when a driving force is applied across it.
As a viable technology for desalination, membrane processes are increasingly employed for removal of bacteria and other microorganisms, particulate and natural organic materials, which can impart color, tastes, and odors to the water and react with disinfectants to form disinfection byproducts. In this study, ultrafiltration is used for clarification and disinfection.
ULTRAFILTRATION
ULTRAFILTRATION
FEASIBILITY ANALYSIS MARKET POTENTIAL
1 I GENERAL PARAMETERS
A I CAPEX (R$) R$ 33,000,000E I Size of Companies that may Use the Technology
Large
B I OPEX anual (R$) R$ 3,296,520F I Applicable
Sectors
Automotive, Food Processing, Petrochemical, Steel and Metal, Mining, Beverage,
Paper and PulpC I Yearly Water Saving
per Equipment (m³)18,921,600
OTHER COSTS OR BENEFITS OF THE TECHNOLOGYG I Companies that Already
Use the Technology (%)0%
1 I Annual costs of transport R$ 3.500.496.
H I Number of Equipment 52
i I Total Water Saving with the Technology (m³)
990,161,021
2 I SPECIFIC PARAMETER OF THE TECHNOLOGY
J I Participation of Cooling Towers in Industry Water
Consumption (%)40%
D I Water Break Even Cost (R$/m³)
R$ 0.46 K I Investment Gap R$ 1,726,879,000
3 I REFERENCES AND ASSUMPTIONSA - Information provided by the supplier Fluid Brasil considering an equipment with capacity to treat 2,160 m³/hour.B - OPEX informed by the supplier Fluid Brasil for an equipment with capacity to treat 2,160 m³/hour.C - In our analysis we adopted an average project with capacity of 2,160 m³/hour, which generates a water saving of 18,921,600 m³/year.D – Break even cost of water to enable investments in the technology.E - As the capital expenditure is high, we expect that only large companies would invest in the technology.F - All sectors assessed in this study.G - Market insertion of the technology is still incipient.H - The number of equipment was estimated by the total water saving with the technology (I) divided by the annual water saving per equipment (C).I - We estimated the number of equipment based on water granted by National Water Agency (ANA) for the industrial sector. We assumed that 70% of the water is used in the sectors described in (F), from which 40% is used in cooling towers (J).J - Cooling towers are responsible for about 40% of water consumption in sectors described in (F),K - The value of investment gap is equal the potential market for the technology (H) times the CAPEX (A).
34
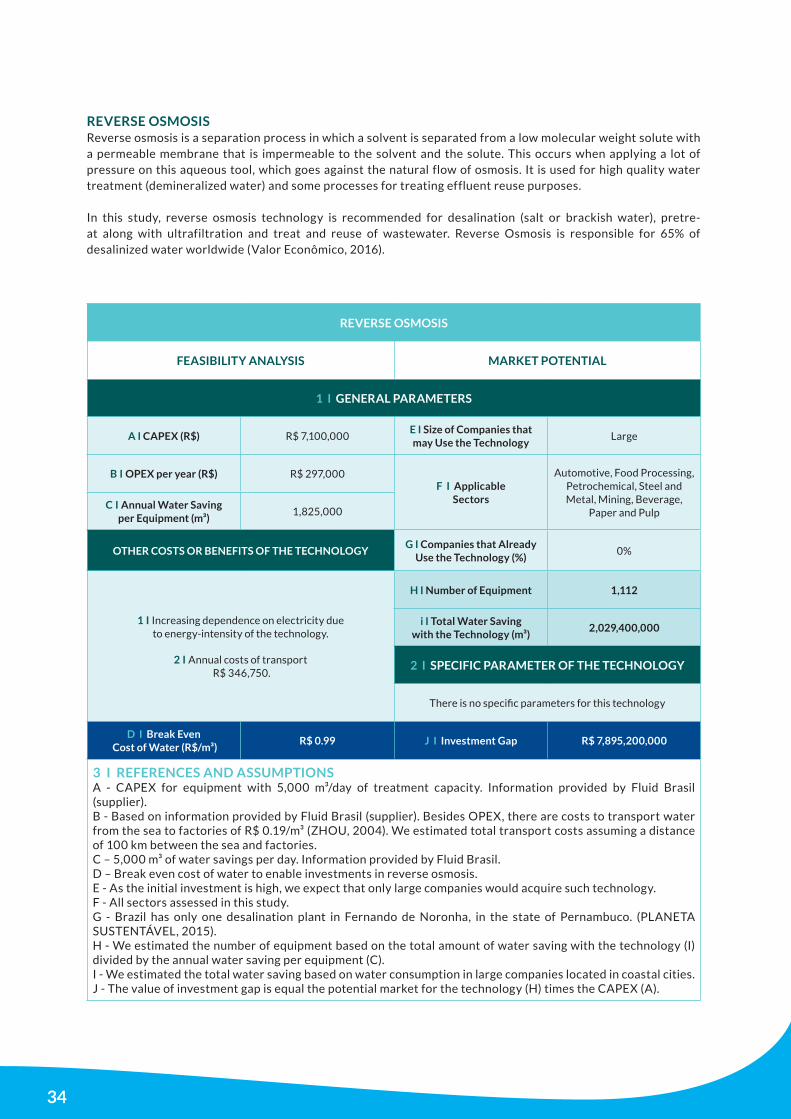
Reverse osmosis is a separation process in which a solvent is separated from a low molecular weight solute with a permeable membrane that is impermeable to the solvent and the solute. This occurs when applying a lot of pressure on this aqueous tool, which goes against the natural flow of osmosis. It is used for high quality water treatment (demineralized water) and some processes for treating effluent reuse purposes.
In this study, reverse osmosis technology is recommended for desalination (salt or brackish water), pretre-at along with ultrafiltration and treat and reuse of wastewater. Reverse Osmosis is responsible for 65% of desalinized water worldwide (Valor Econômico, 2016).
REVERSE OSMOSIS
REVERSE OSMOSIS
FEASIBILITY ANALYSIS MARKET POTENTIAL
1 I GENERAL PARAMETERS
A I CAPEX (R$) R$ 7,100,000E I Size of Companies that may Use the Technology
Large
B I OPEX per year (R$) R$ 297,000F I Applicable
Sectors
Automotive, Food Processing, Petrochemical, Steel and Metal, Mining, Beverage,
Paper and PulpC I Annual Water Saving
per Equipment (m³)1,825,000
OTHER COSTS OR BENEFITS OF THE TECHNOLOGYG I Companies that Already
Use the Technology (%)0%
1 I Increasing dependence on electricity due to energy-intensity of the technology.
2 I Annual costs of transport
R$ 346,750.
H I Number of Equipment 1,112
i I Total Water Saving with the Technology (m³)
2,029,400,000
2 I SPECIFIC PARAMETER OF THE TECHNOLOGY
There is no specific parameters for this technology
D I Break Even Cost of Water (R$/m³)
R$ 0.99 J I Investment Gap R$ 7,895,200,000
3 I REFERENCES AND ASSUMPTIONSA - CAPEX for equipment with 5,000 m³/day of treatment capacity. Information provided by Fluid Brasil (supplier).B - Based on information provided by Fluid Brasil (supplier). Besides OPEX, there are costs to transport water from the sea to factories of R$ 0.19/m³ (ZHOU, 2004). We estimated total transport costs assuming a distance of 100 km between the sea and factories.C – 5,000 m³ of water savings per day. Information provided by Fluid Brasil.D – Break even cost of water to enable investments in reverse osmosis.E - As the initial investment is high, we expect that only large companies would acquire such technology.F - All sectors assessed in this study.G - Brazil has only one desalination plant in Fernando de Noronha, in the state of Pernambuco. (PLANETA SUSTENTÁVEL, 2015).H - We estimated the number of equipment based on the total amount of water saving with the technology (I) divided by the annual water saving per equipment (C).I - We estimated the total water saving based on water consumption in large companies located in coastal cities.J - The value of investment gap is equal the potential market for the technology (H) times the CAPEX (A).
35
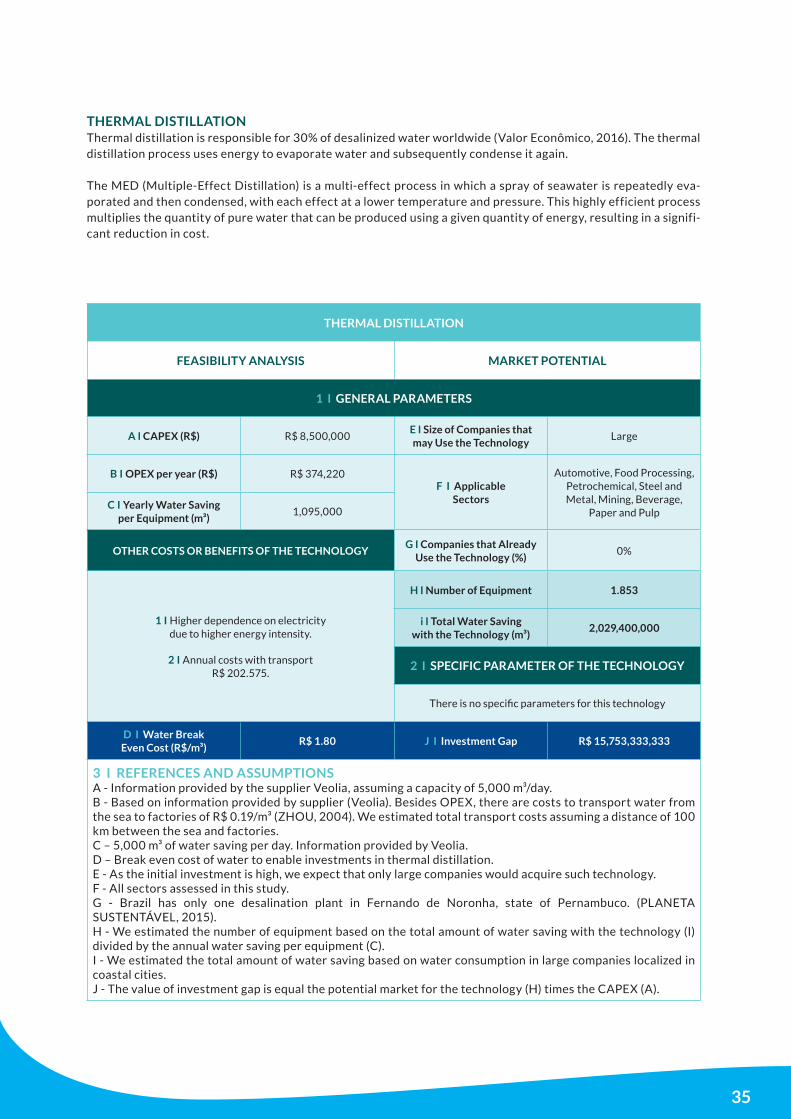
Thermal distillation is responsible for 30% of desalinized water worldwide (Valor Econômico, 2016). The thermal distillation process uses energy to evaporate water and subsequently condense it again.
The MED (Multiple-Effect Distillation) is a multi-effect process in which a spray of seawater is repeatedly eva-porated and then condensed, with each effect at a lower temperature and pressure. This highly efficient process multiplies the quantity of pure water that can be produced using a given quantity of energy, resulting in a signifi-cant reduction in cost.
THERMAL DISTILLATION
THERMAL DISTILLATION
FEASIBILITY ANALYSIS MARKET POTENTIAL
1 I GENERAL PARAMETERS
A I CAPEX (R$) R$ 8,500,000E I Size of Companies that may Use the Technology
Large
B I OPEX per year (R$) R$ 374,220F I Applicable
Sectors
Automotive, Food Processing, Petrochemical, Steel and Metal, Mining, Beverage,
Paper and PulpC I Yearly Water Saving
per Equipment (m³)1,095,000
OTHER COSTS OR BENEFITS OF THE TECHNOLOGYG I Companies that Already
Use the Technology (%)0%
1 I Higher dependence on electricity due to higher energy intensity.
2 I Annual costs with transport
R$ 202.575.
H I Number of Equipment 1.853
i I Total Water Saving with the Technology (m³)
2,029,400,000
2 I SPECIFIC PARAMETER OF THE TECHNOLOGY
There is no specific parameters for this technology
D I Water Break Even Cost (R$/m³)
R$ 1.80 J I Investment Gap R$ 15,753,333,333
3 I REFERENCES AND ASSUMPTIONSA - Information provided by the supplier Veolia, assuming a capacity of 5,000 m³/day.B - Based on information provided by supplier (Veolia). Besides OPEX, there are costs to transport water from the sea to factories of R$ 0.19/m³ (ZHOU, 2004). We estimated total transport costs assuming a distance of 100 km between the sea and factories.C – 5,000 m³ of water saving per day. Information provided by Veolia. D – Break even cost of water to enable investments in thermal distillation.E - As the initial investment is high, we expect that only large companies would acquire such technology.F - All sectors assessed in this study.G - Brazil has only one desalination plant in Fernando de Noronha, state of Pernambuco. (PLANETA SUSTENTÁVEL, 2015).H - We estimated the number of equipment based on the total amount of water saving with the technology (I) divided by the annual water saving per equipment (C).I - We estimated the total amount of water saving based on water consumption in large companies localized in coastal cities.J - The value of investment gap is equal the potential market for the technology (H) times the CAPEX (A).
36
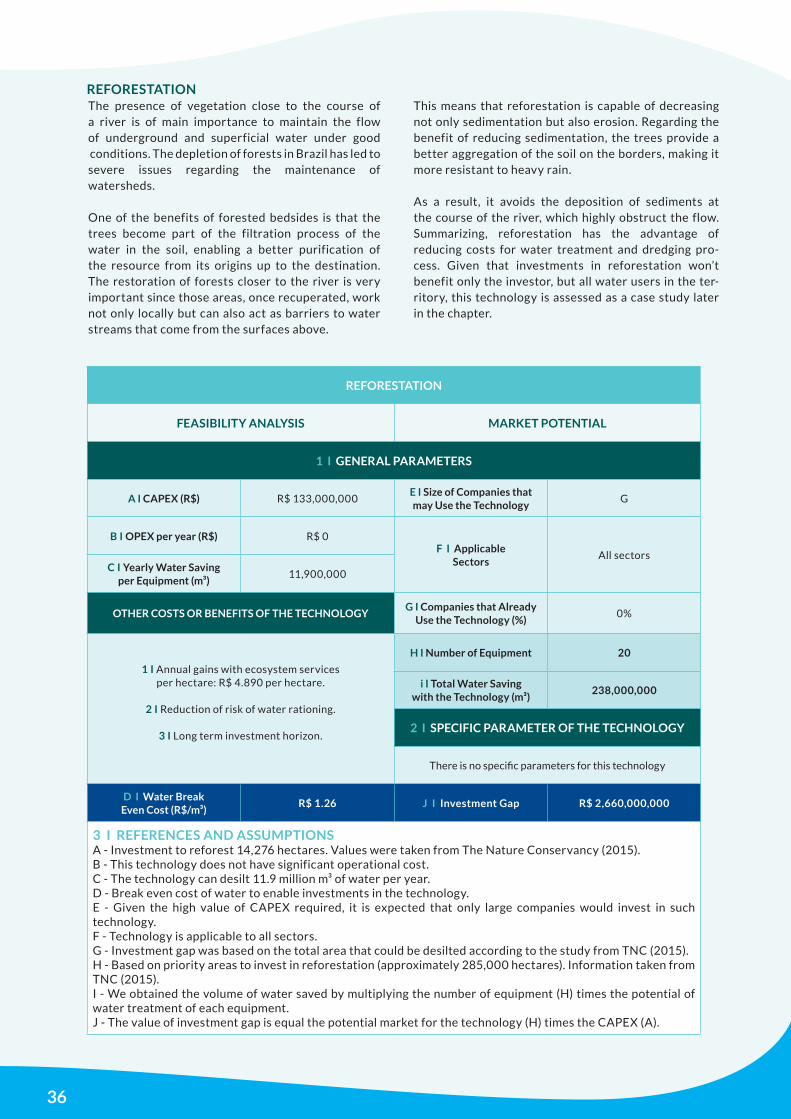
The presence of vegetation close to the course of a river is of main importance to maintain the flow of underground and superficial water under good conditions. The depletion of forests in Brazil has led to severe issues regarding the maintenance of watersheds.
One of the benefits of forested bedsides is that the trees become part of the filtration process of the water in the soil, enabling a better purification of the resource from its origins up to the destination. The restoration of forests closer to the river is very important since those areas, once recuperated, work not only locally but can also act as barriers to water streams that come from the surfaces above.
This means that reforestation is capable of decreasing not only sedimentation but also erosion. Regarding the benefit of reducing sedimentation, the trees provide a better aggregation of the soil on the borders, making it more resistant to heavy rain.
As a result, it avoids the deposition of sediments at the course of the river, which highly obstruct the flow.Summarizing, reforestation has the advantage of reducing costs for water treatment and dredging pro-cess. Given that investments in reforestation won’t benefit only the investor, but all water users in the ter-ritory, this technology is assessed as a case study later in the chapter.
REFORESTATION
REFORESTATION
FEASIBILITY ANALYSIS MARKET POTENTIAL
1 I GENERAL PARAMETERS
A I CAPEX (R$) R$ 133,000,000E I Size of Companies that may Use the Technology
G
B I OPEX per year (R$) R$ 0F I Applicable
SectorsAll sectors
C I Yearly Water Saving per Equipment (m³)
11,900,000
OTHER COSTS OR BENEFITS OF THE TECHNOLOGYG I Companies that Already
Use the Technology (%)0%
1 I Annual gains with ecosystem services per hectare: R$ 4.890 per hectare.
2 I Reduction of risk of water rationing.
3 I Long term investment horizon.
H I Number of Equipment 20
i I Total Water Saving with the Technology (m³)
238,000,000
2 I SPECIFIC PARAMETER OF THE TECHNOLOGY
There is no specific parameters for this technology
D I Water Break Even Cost (R$/m³)
R$ 1.26 J I Investment Gap R$ 2,660,000,000
3 I REFERENCES AND ASSUMPTIONSA - Investment to reforest 14,276 hectares. Values were taken from The Nature Conservancy (2015).B - This technology does not have significant operational cost.C - The technology can desilt 11.9 million m³ of water per year.D - Break even cost of water to enable investments in the technology.E - Given the high value of CAPEX required, it is expected that only large companies would invest in such technology.F - Technology is applicable to all sectors.G - Investment gap was based on the total area that could be desilted according to the study from TNC (2015).H - Based on priority areas to invest in reforestation (approximately 285,000 hectares). Information taken from TNC (2015).I - We obtained the volume of water saved by multiplying the number of equipment (H) times the potential of water treatment of each equipment.J - The value of investment gap is equal the potential market for the technology (H) times the CAPEX (A).
37
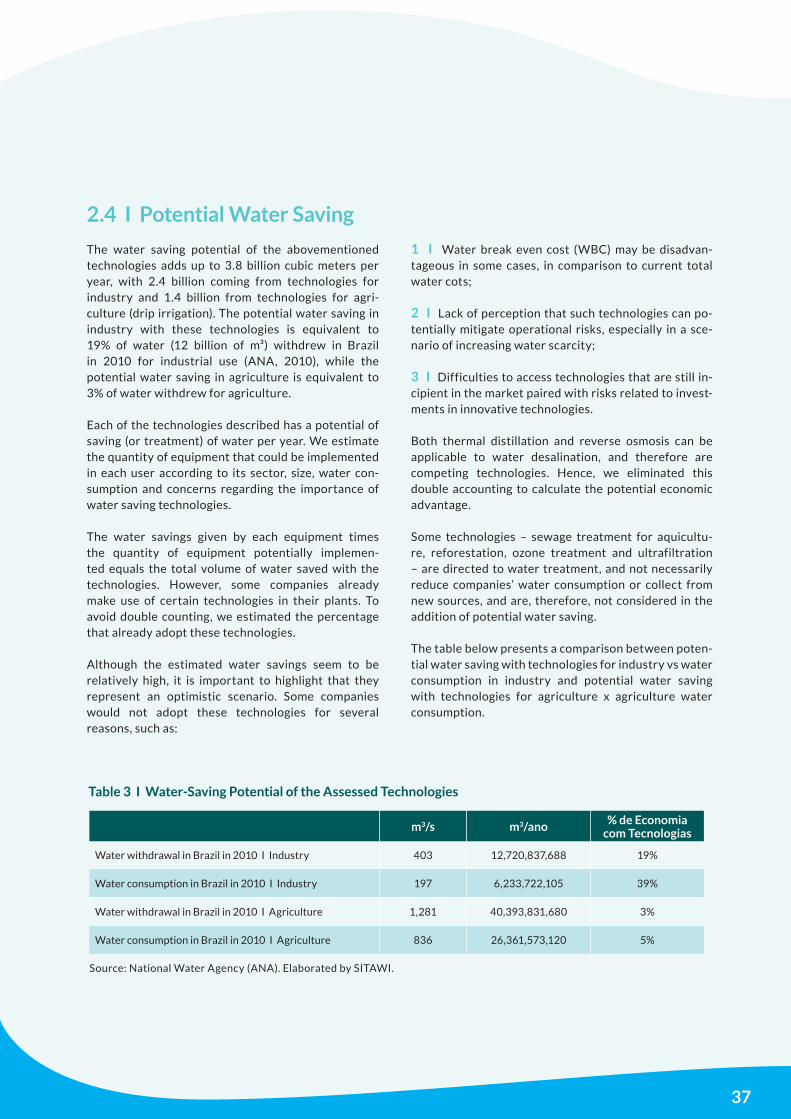
Source: National Water Agency (ANA). Elaborated by SITAWI.
m3/s m3/ano % de Economia com Tecnologias
Water withdrawal in Brazil in 2010 I Industry 403 12,720,837,688 19%
Water consumption in Brazil in 2010 I Industry 197 6,233,722,105 39%
Water withdrawal in Brazil in 2010 I Agriculture 1,281 40,393,831,680 3%
Water consumption in Brazil in 2010 I Agriculture 836 26,361,573,120 5%
Table 3 I Water-Saving Potential of the Assessed Technologies
2.4 I Potential Water Saving
The water saving potential of the abovementioned technologies adds up to 3.8 billion cubic meters per year, with 2.4 billion coming from technologies for industry and 1.4 billion from technologies for agri-culture (drip irrigation). The potential water saving in industry with these technologies is equivalent to 19% of water (12 billion of m³) withdrew in Brazil in 2010 for industrial use (ANA, 2010), while the potential water saving in agriculture is equivalent to 3% of water withdrew for agriculture.
Each of the technologies described has a potential of saving (or treatment) of water per year. We estimate the quantity of equipment that could be implemented in each user according to its sector, size, water con-sumption and concerns regarding the importance of water saving technologies.
The water savings given by each equipment times the quantity of equipment potentially implemen-ted equals the total volume of water saved with the technologies. However, some companies already make use of certain technologies in their plants. To avoid double counting, we estimated the percentage that already adopt these technologies.
Although the estimated water savings seem to be relatively high, it is important to highlight that they represent an optimistic scenario. Some companies would not adopt these technologies for several reasons, such as:
1 I Water break even cost (WBC) may be disadvan-tageous in some cases, in comparison to current total water cots;
2 I Lack of perception that such technologies can po-tentially mitigate operational risks, especially in a sce-nario of increasing water scarcity;
3 I Difficulties to access technologies that are still in-cipient in the market paired with risks related to invest-ments in innovative technologies.
Both thermal distillation and reverse osmosis can be applicable to water desalination, and therefore are competing technologies. Hence, we eliminated this double accounting to calculate the potential economic advantage.
Some technologies – sewage treatment for aquicultu-re, reforestation, ozone treatment and ultrafiltration – are directed to water treatment, and not necessarily reduce companies’ water consumption or collect from new sources, and are, therefore, not considered in the addition of potential water saving.
The table below presents a comparison between poten-tial water saving with technologies for industry vs water consumption in industry and potential water saving with technologies for agriculture x agriculture water consumption.
38
2.5 I Case Studies: Reforestation and Reuse
REFORESTATION CASEThe Nature Conservancy (TNC) in cooperation with the University of Stanford and WWF developed the following case on the evaluation of the potential benefits of investing in reforestation as a technology for water efficiency. The report was created for the project Water Movement for São Paulo to promo-te investments to reduce the sedimentation of local rivers.
The lack of plants in the areas close to rivers makes the soil less compact and more susceptible to be carried to the riverbed. The deposition of land on the riverbed cause severe damage to the flow along with high costs for recovering.
The improvement on the retention capacity around the closest areas of the river will not only decrease the sedimentation of the area that suffered the in-tervention, but it will also influence the movements of the sediments coming from the upper parts. This indicates that the preservation and management of priority areas can increase the barrier effect.
For this case, the goal is to reduce in 50% the sedi-mentation in areas that would receive the invest-ments and its features. The actions to restore the area vary according to the current situation and can involve different initiatives, such as the conservation of already well-maintained areas or the restoration of the degraded ones.
The framework used for the estimation of the sedimentation is called inVEST and evaluates different environmental services through biophysical and economic variables.
The analysis started with the assessment of the actual sedimentation and the identification of the areas with the largest potential of deposition, called the critical areas. After that, green interven-tion models were elaborated and the estimates of the costs for implementation were defined.
Taking in account the production of sediments and nutrients as well as the biophysical benefits, which were the reduction on the process of sedimentation, the final evaluation of the benefits of de-silting was made.
The area where investment will be targeted is 9,816 ha for the Cantareira System and 4,460 ha for the
Alto Tiete System out of a total area of 493,441 when summing up both, representing an intervention in 2.9% of the area. The investments will total R$ 133.8 million, paid in 10 years.
According to the case developed by TNC, the bene-fits will start by the year 11, when there will be an economy of R$ 39 million each year on the de-silting process until the year 14. By the year 14, the benefits will be completely reached, generating an economy of R$ 12 million per year. These benefits will cover the costs by the year 22.
Another study by Trucost and Conservation International estimates that each hectare of refores-tation generates R$ 4,890 yearly of environmental services, which includes recycling and nutrition gene-ration, soil formation, genetic resources generation, carbon sequestration, residues recuperation and water and soil purification. Since benefits start to show gradually, the financial return is seen only by year 5 and goes until year 15, when reforestation is 100% done. The NPV (net pre-sent value) generated is R$ 61 million, without consi-dering perpetuity.
Another important benefit of reforestation is the risk reduction of production stoppage given lack of water resources. In São Paulo, there was a 8.7% reduction in industrial activity due to the water crisis of the first semester of 2015.
Considering that this was the worst crisis in the past 50 years according to INMET (National Meteorology Institute), the estimated probability of another equal situation (in the next 100 years) is 2% (1/50), without considering the effects of climate change.
Economic activities that depend on Cantareira and Alto Tiete account to R$ 95 billion per semester and 67% of producers declare that they are impacted by the water crisis. According to such data, we estimated the impact of reforestation decreasing this risk.
Currently, according to INMET, Cantareira basin re-tains 20% of water, leaving sources with low level. Reforestation could increase this number by 80% (INMET). This means that by multiplying by 4 the abi-lity to retain water, the proportional risk of stoppage goes from 2% to 0.5% a.a. The NPV generated was R$ 94.5 million.
39
AQUAPOLO CASEAQUAPOLO is a company born from a specific partnership between Odebrecht Ambiental and SABESP (Water and Sanitation Utility for the State of São Paulo) with the purpose of addressing the tre-atment and distribution of industrial reuse water to petrochemical companies in ABC, a region of São Paulo Metro Area. A pioneer in large scale industrial reuse in Brazil, this project is among the largest water reuse initiatives worldwide.
Aquapolo generates an important economy of potable water, the equivalent of consumption of a city with 500 thousand inhabitants, allowing the increase of water supply to the population of this region. The project aims at transforming sewage, previously treated by the Sewage Treatment Station (ETE), into water adequate for industrial use.
To achieve its goal, Aquapolo uses latest technology in effluents treatment, through disk filter systems that retain solid above or equal to 400 microns, Tertiary Membrane Rio Reactor system (TMBR), reverse osmosis and a chlorine dioxide system to produce 3,600 m³ of reuse water per hour. Industrial water is usually applied to cooling towers and reposition of boiler water for energy generation.
Aquapolo was projected to meet the demand of Braskem with an investment of R$396 million, star-ting its operations in December of 2012, with a 42-year BOO (Design, Build, Operation and Ownership) contract.
The greatest challenges of this project were to guarantee quality and water parameters of industrial use according to client’s requirements and to main-tain a competitive tariff compared to traditional pro-duction costs.
Water cost of the project is a little lower than water tariff charged by SABESP, however there are additional benefits to Braskem, such as reduction in production stoppages because of maintenance of heating systems.
Besides clear risk mitigations, there is the intangible risk of water scarcity and production stoppage, which was definitely a key determinant for Braskem to invest. It is important to remember that in a situation of scarcity, domestic water supply is a priority while industries are a secondary choice. According to ANA, main data about Aquapolo project are:
1 I Production capacity of 650 L/s of industrial reuse water, with potential to expand to 1,000 L/s;
2 I Removal of over 584,000 kg/year of ammonia and 31,390kg/year of phosphorus, adding a third level in the sewage treatment system;
3 I Generation of about 800 jobs during construction and 50 jobs during operation;
4 I Tax collection of R$ 2.5 million for ISS (Service Tax);
It should be noted that a key condition for the viability of a similar project is to have an ETE near the industrial complex. Specialists on the field highlight that if some companies benchmark this project, the risk of a water crisis would be strongly mitigated.
Such solutions are sustainable and fit into the circular economy model, where there are no residues because the raw material of one process is the residue of another.

40
$
OPPORTUNITIES FOR FINANCIAL INSTITUTIONS3
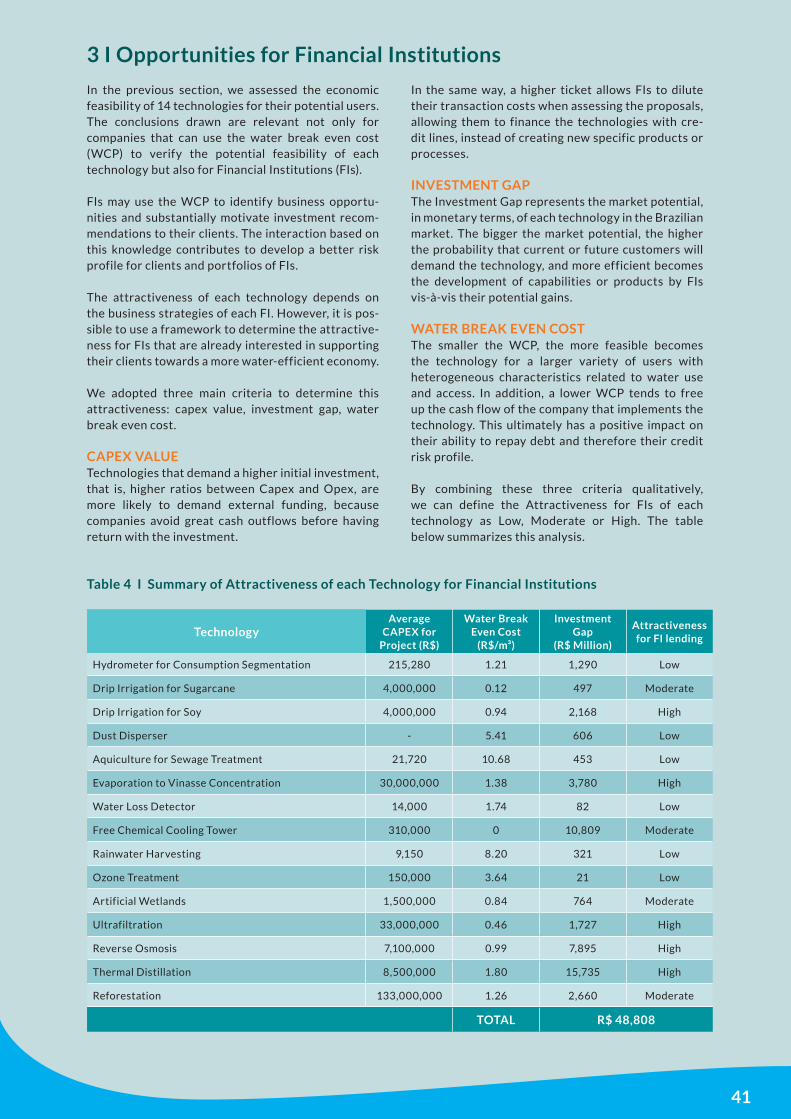
41
In the previous section, we assessed the economic feasibility of 14 technologies for their potential users. The conclusions drawn are relevant not only for companies that can use the water break even cost (WCP) to verify the potential feasibility of each technology but also for Financial Institutions (FIs).
FIs may use the WCP to identify business opportu-nities and substantially motivate investment recom-mendations to their clients. The interaction based on this knowledge contributes to develop a better risk profile for clients and portfolios of FIs.
The attractiveness of each technology depends on the business strategies of each FI. However, it is pos-sible to use a framework to determine the attractive-ness for FIs that are already interested in supporting their clients towards a more water-efficient economy.
We adopted three main criteria to determine this attractiveness: capex value, investment gap, water break even cost.
CAPEX VALUETechnologies that demand a higher initial investment, that is, higher ratios between Capex and Opex, are more likely to demand external funding, because companies avoid great cash outflows before having return with the investment.
In the same way, a higher ticket allows FIs to dilute their transaction costs when assessing the proposals, allowing them to finance the technologies with cre-dit lines, instead of creating new specific products or processes.
INVESTMENT GAPThe Investment Gap represents the market potential, in monetary terms, of each technology in the Brazilian market. The bigger the market potential, the higher the probability that current or future customers will demand the technology, and more efficient becomes the development of capabilities or products by FIs vis-à-vis their potential gains.
WATER BREAK EVEN COSTThe smaller the WCP, the more feasible becomes the technology for a larger variety of users with heterogeneous characteristics related to water use and access. In addition, a lower WCP tends to free up the cash flow of the company that implements the technology. This ultimately has a positive impact on their ability to repay debt and therefore their credit risk profile.
By combining these three criteria qualitatively, we can define the Attractiveness for FIs of each technology as Low, Moderate or High. The table below summarizes this analysis.
3 I Opportunities for Financial Institutions
TechnologyAverage
CAPEX for Project (R$)
Water Break Even Cost
(R$/m³)
Investment Gap
(R$ Million)
Attractiveness for FI lending
Hydrometer for Consumption Segmentation 215,280 1.21 1,290 Low
Drip Irrigation for Sugarcane 4,000,000 0.12 497 Moderate
Drip Irrigation for Soy 4,000,000 0.94 2,168 High
Dust Disperser - 5.41 606 Low
Aquiculture for Sewage Treatment 21,720 10.68 453 Low
Evaporation to Vinasse Concentration 30,000,000 1.38 3,780 High
Water Loss Detector 14,000 1.74 82 Low
Free Chemical Cooling Tower 310,000 0 10,809 Moderate
Rainwater Harvesting 9,150 8.20 321 Low
Ozone Treatment 150,000 3.64 21 Low
Artificial Wetlands 1,500,000 0.84 764 Moderate
Ultrafiltration 33,000,000 0.46 1,727 High
Reverse Osmosis 7,100,000 0.99 7,895 High
Thermal Distillation 8,500,000 1.80 15,735 High
Reforestation 133,000,000 1.26 2,660 Moderate
TOTAL R$ 48,808
Table 4 I Summary of Attractiveness of each Technology for Financial Institutions
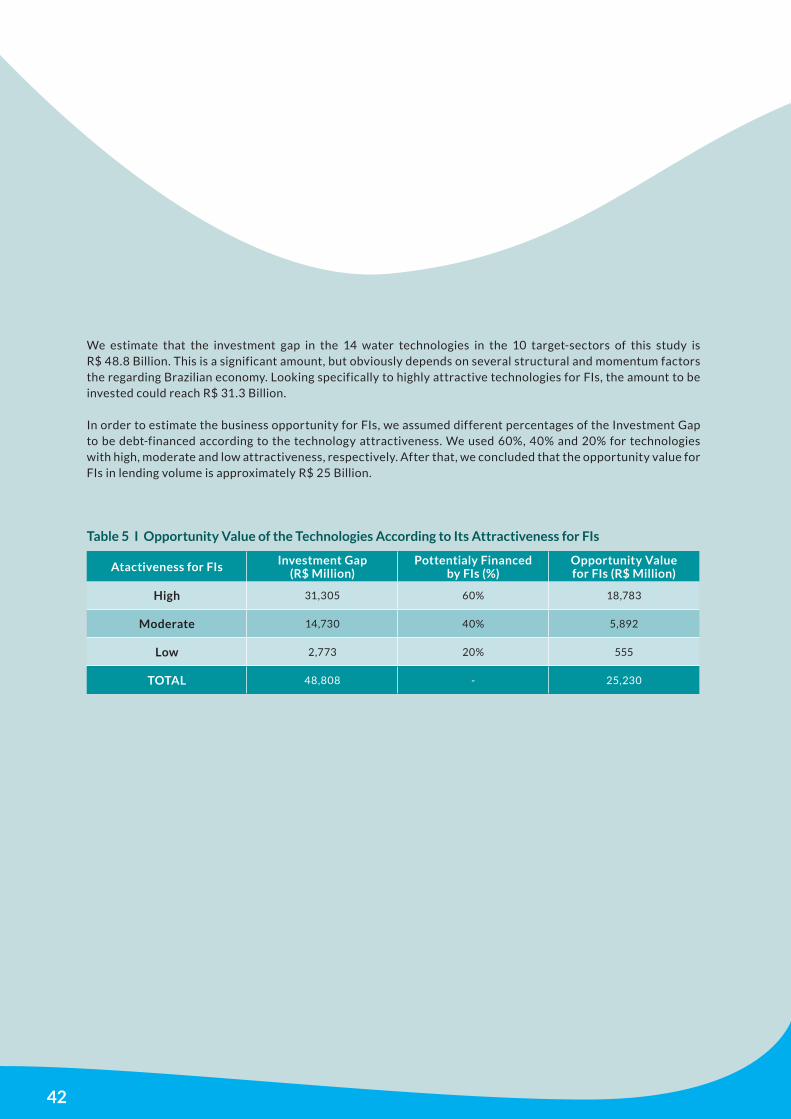
42
We estimate that the investment gap in the 14 water technologies in the 10 target-sectors of this study is R$ 48.8 Billion. This is a significant amount, but obviously depends on several structural and momentum factors the regarding Brazilian economy. Looking specifically to highly attractive technologies for FIs, the amount to be invested could reach R$ 31.3 Billion.
In order to estimate the business opportunity for FIs, we assumed different percentages of the Investment Gap to be debt-financed according to the technology attractiveness. We used 60%, 40% and 20% for technologies with high, moderate and low attractiveness, respectively. After that, we concluded that the opportunity value for FIs in lending volume is approximately R$ 25 Billion.
Atactiveness for FIs Investment Gap (R$ Million)
Pottentialy Financed by FIs (%)
Opportunity Value for FIs (R$ Million)
High 31,305 60% 18,783
Moderate 14,730 40% 5,892
Low 2,773 20% 555
TOTAL 48,808 - 25,230
Table 5 I Opportunity Value of the Technologies According to Its Attractiveness for FIs
43
SEIZING OPPORTUNITIESFinancial institutions need to deve-lop capabilities, products and commercial aproaches to capitalize on these valuable oppor-tunities. In particular, financial institutions should:
● Understand the dynamics of water intensive sectors, as well as concerns of their industry associations.
● Determine which technologies are sufficiently efficient to payback the investment while saving water.
● Search for promising sectors and companies that can use these technologies.
● Train relationship managers to identify clients’ total water cost and compare to water break even cost for each technology.
MANAGING RISKSBesides the opportunities presented in this study, understanding the most promising technologies and their break even costs of water may be a useful for FIs to consider water risks as a formal variable in their models of credit and portfolio risk. In this sense, possible action include:
● Elaborate criteria regarding water risk exposure, total water cost and use of technologies in models to assess the risk of credit for its clients.
● Develop specific credit lines or adapt the existing lines regarding their terms, interest rates and collate-rals to accommodate promising technologies.
● Assess the possibility of creating structured finan-ce operations involving technology suppliers, funding agencies, export credit agencies, development banks, etc.
● Create vendor lists to accelerate the process of technology identification, as well as using validated vendors as promotional channels to credit lines.
● Develop scenarios in which the scaling of tech-nologies will reduce prices and increase financing feasibility.
● Consider these variables for an assessment of portfolio water risk exposure, with focuses on sectors, geography and size of companies.
● Develop alternative (collaterals, bank guarantees, and insurance) to mitigate risks and stimulate clients towards a more water-efficient economy.

44
ANEXX
45
Brazil is one of the richest nations in water resources, accounting for 13% of the world’s fresh water reser-ve (ANA, 2013). However, its distribution within the country is highly uneven. The Northern region, where the Amazon forest is located, and where only 5% of the Brazilian population lives, concentrates 81% of the available fresh water.
Meanwhile, only 6% is available in the Southeast region, which is responsible for almost half of the GDP (Gross Domestic Product) and where 42% of the population lives (ANA, 2012). The incompatibility between demand and availability, the degree of urban development and the presence of water-intensive sectors require initiatives towards higher efficiency to mitigate the risk of collapse.
The most water-consuming sector in Brazil is agriculture, accounting for 72% of total consumption. However, inefficiencies in water use in this sector, largely caused by the use of central pivot irrigation, lead to estimated water losses of half of the sector’s total consumption (ANA, 2012).
Since reducing crops’ water consumption is not feasible, initiatives that lead to better irrigation and practices that reduce losses are likely to be the most appropriate solution to safeguard stressed watersheds.
The second most water-consuming sector in Brazil is livestock, accounting for 11% of total consumption. A reduction on water consumption in this sector is necessary, given that consumption is very high if compared to the sector’s output.
In addition, due to an increase of consumption of animal products, especially in developing countries, the demand for water from the livestock sector tends to rise, requiring a closer look and discussion of addi-tional solutions to meet the increased demand.
Households are the third largest water consumers, responsible for 9% of Brazil’s total consumption (ANA, 2013). However, in large cities, the propor-tions are different, as water consumption is higher for
domestic and industrial use than for the agriculture and livestock sectors, a reflection of land use.
The utility companies responsible for water withdrawal and distribution suffer from high techni-cal losses, which can reach up to 40% of total water withdrawal (ANA, 2012). These companies are also responsible for supplying water to parts of the indus-trial sector, the country’s fourth largest water consu-mer, accounting for 7% of total use.
Good practices of water conservation have already been adopted by some of the water intensive sectors, such as automotive, petrochemical, metallurgy and beverages. While some companies are very water--conscious and efficient, reaching up to 97% of water reuse, others do not manage their water as effecti-vely (Santos et. al., 2010).
In general, large companies, especially the ones that are very water intensive, have their own water withdrawal system, which they have built after having obtained an permit from the National Water Agency (ANA) or from the appropriate state bodies for the withdrawal of superficial and underground water. For these companies, it is important to preserve the watershed that supplies them with water, and to respect legislation, nature conservancy and the water cycle.
Not only is water distribution in Brazil a physical problem, but also an institutional one. The number of stakeholders involved - federal, state and municipal governments, trade associations, regulatory bodies, companies, farmers and households - makes water management a challenging issue to address.
The distribution of rainfall is changing due to clima-te change, which, together with the lack of initiatives to preserve the water reservoirs, leads to scarcity in regions that had not been subject to water stress be-fore. Storms and floods, which are also more frequent, do not necessarily lead to an increase in water availa-bility, since water withdrawal can be impaired. These events have other highly detrimental effects, such as damages on infrastructure, diseases and deaths.
ANEXX 1 I Water Usage in Brazil
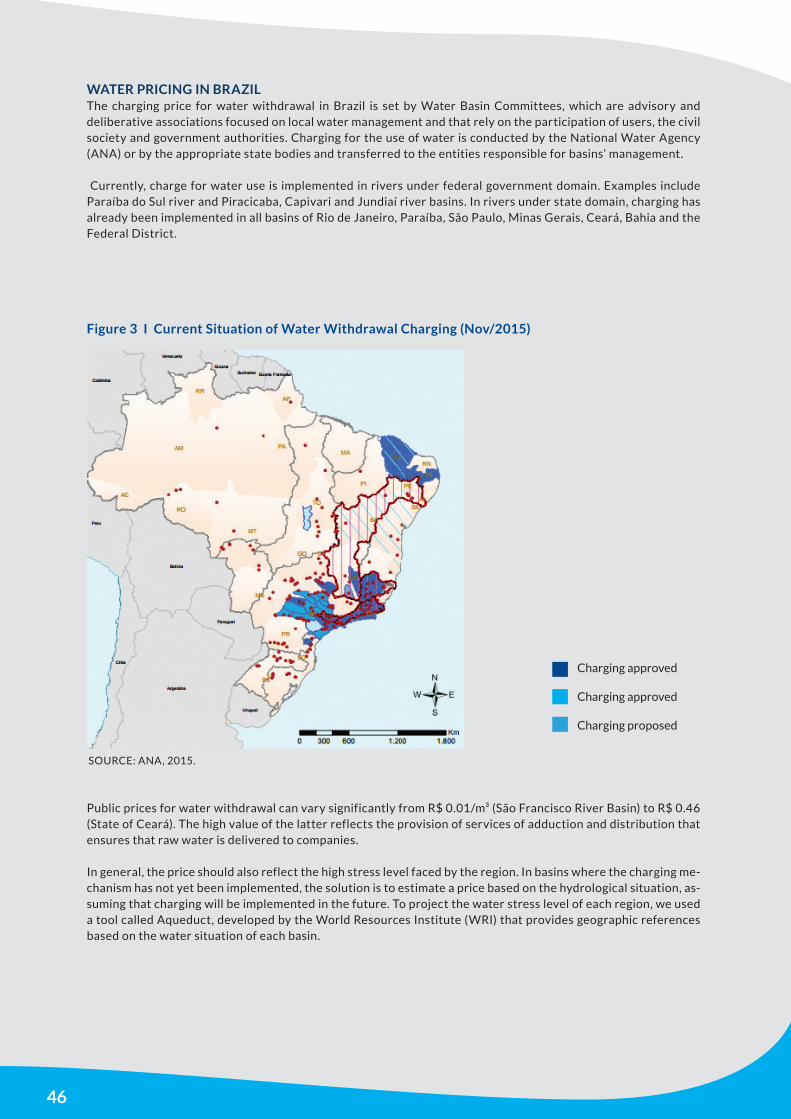
46
Public prices for water withdrawal can vary significantly from R$ 0.01/m³ (São Francisco River Basin) to R$ 0.46 (State of Ceará). The high value of the latter reflects the provision of services of adduction and distribution that ensures that raw water is delivered to companies.
In general, the price should also reflect the high stress level faced by the region. In basins where the charging me-chanism has not yet been implemented, the solution is to estimate a price based on the hydrological situation, as-suming that charging will be implemented in the future. To project the water stress level of each region, we used a tool called Aqueduct, developed by the World Resources Institute (WRI) that provides geographic references based on the water situation of each basin.
The charging price for water withdrawal in Brazil is set by Water Basin Committees, which are advisory and deliberative associations focused on local water management and that rely on the participation of users, the civil society and government authorities. Charging for the use of water is conducted by the National Water Agency (ANA) or by the appropriate state bodies and transferred to the entities responsible for basins’ management.
Currently, charge for water use is implemented in rivers under federal government domain. Examples include Paraíba do Sul river and Piracicaba, Capivari and Jundiaí river basins. In rivers under state domain, charging has already been implemented in all basins of Rio de Janeiro, Paraíba, São Paulo, Minas Gerais, Ceará, Bahia and the Federal District.
WATER PRICING IN BRAZIL
Figure 3 I Current Situation of Water Withdrawal Charging (Nov/2015)
Charging approved
Charging approved
Charging proposed
SOURCE: ANA, 2015.
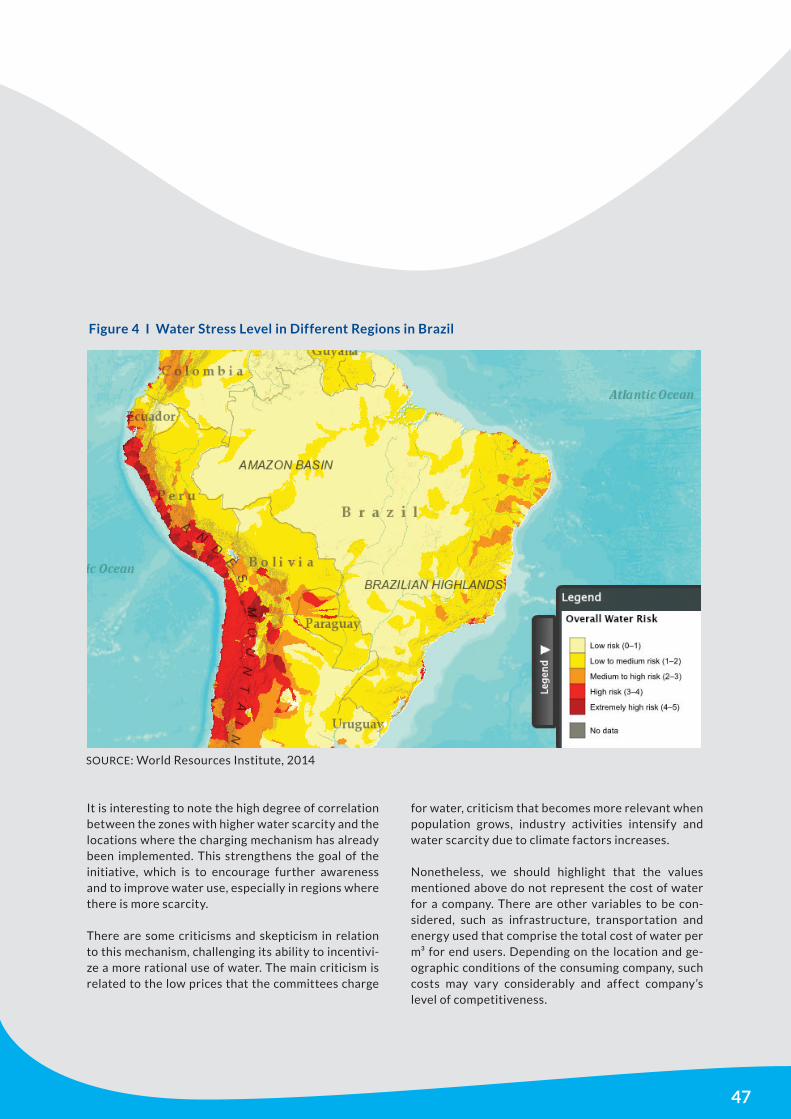
47
Charging approved
Charging approved
Charging proposed
SOURCE: World Resources Institute, 2014
Figure 4 I Water Stress Level in Different Regions in Brazil
It is interesting to note the high degree of correlation between the zones with higher water scarcity and the locations where the charging mechanism has already been implemented. This strengthens the goal of the initiative, which is to encourage further awareness and to improve water use, especially in regions where there is more scarcity.
There are some criticisms and skepticism in relation to this mechanism, challenging its ability to incentivi-ze a more rational use of water. The main criticism is related to the low prices that the committees charge
for water, criticism that becomes more relevant when population grows, industry activities intensify and water scarcity due to climate factors increases.
Nonetheless, we should highlight that the values mentioned above do not represent the cost of water for a company. There are other variables to be con-sidered, such as infrastructure, transportation and energy used that comprise the total cost of water per m³ for end users. Depending on the location and ge-ographic conditions of the consuming company, such costs may vary considerably and affect company’s level of competitiveness.

48
In 2014-2015, a severe water distribution crisis took place in the state of São Paulo as water rationing and interruption measures were implemented to cope with the water scarcity. Given the gradual emptying of the Cantareira reservoir, the main water source of São Paulo’s metropolitan area, its “dead volume” started being used, meaning that water from below the reservoir’s regular withdrawal level was pumped up to ensure the maintenance of water supply.
Not only has the water crisis affected households, but it has also affected several companies that make intense use of water in their industrial processes. Even though some companies do not depend exclu-sively on the public distribution system and have their own sources to withdraw water, a large number of firms still depend on water utilities to meet their needs or they compete for the same reservoir.
According to a 2014 study by FIESP, large companies (250+ employees) account for 10% of the companies of the state of São Paulo and are usually large water consumers. Only 22.7% of such companies do not ope-rate their own water withdrawal system. In addition, only 29.5% of these companies believe that water ra-tioning can significantly impact their revenues.
WATER CRISISClimate change scenarios (FBDS, 2009) predict that the rainfall regime will not stabilize in the near future and that many populated regions in Brazil will face se-vere droughts more frequently.
The expectation, according to CEBDS (2015), is that in areas of caatinga and cerrado there will be more droughts, while Atlantic Forest regions will face an increase in rainfall. Additionally, phenomena such as cyclones and floods may influence the water volu-me available and potentially cause a rise in sea level (CEBDS, 2015).
This scenario requires the adoption of long-term so-lutions, such as the protection and restoration of watersheds, the adoption of new technologies that reduce the amount of clean water used, the reduction of water losses, constructions that bring new sources of water, as well as better practices from all users.
Even companies that do not depend on water utilities must acknowledge that the adoption of water effi-ciency initiatives is necessary, once even their alter-native sources may be affected.
49
LIVESTOCK Animal farming requires high volumes of fresh water, especially for feeding purposes. A continuous supply of fresh water is needed, which may increase local competition for water supply. The consumption of fresh water generates a large quantity of effluents, with high volume of faeces and urinary waste.
Liquid waste from livestock farming, which includes organic matter from cleaning and slaughtering and may also include antibiotics, hormones and pesticides, can cause environmental pollution. Pesticides applied to animals must be handled carefully in order to mitigate risks for human health and the environment.
Moreover, areas used for extensive farming in Brazil have been deemed responsible for intensive defores-tation and even desertification in some cases, since large pasture areas are required and cattle grazing may prevent forest growth. Some of these impacts may be irreversible, hence, there is strong demand that this sector uses water efficiently and manages potential impacts.
SUGARCANE AGRICULTURECrop growing is a water intensive activity as a continuous supply of water is needed during the entire production cycle to ensure high quality sugar-cane in large quantities. The ratio between crop yield and quantity of water used is called water producti-vity, while economic productivity is defined as “the value derived per unit of water used”.
There are several variables that influence agricultural production, such as the seed used, climate conditions, evapotranspiration, soil conditions, amount of fertili-zer used, drainage, biomass and water stress. These factors also influence the availability of water and the quantity of water required for crop growing.
The sector also generates effluents as crops contain pesticides and fertilizers. Careful must be employed to keep the soil and the underground and surface water free from contamination. The processing of sugarcane also produces effluents and consu-mes water intensively, requiring improvements to minimize impacts.
SOYBEAN AGRICULTUREThe water requirements in soybean agriculture are directly related to the crop’s productivity, hence a continuous supply of water is needed. In periods of intensive water demand, the sector may put a strain on local water availability. Therefore, appropriate planning, and the adoption of proper measures are required to avoid an extreme situation of scarcity.
Large investments made in major crops reflect the importance of water availability for full crop grow-th, especially in periods of drought or dry spells that compromise its growth, sometimes, during critical periods of higher water requirements. Water su-pply of 450 to 850 mm is necessary during the cycle for soybean crop yield to be considerable. Excessive water may be also harmful for the crops.
Since soybean is a good source of protein, its main consumer is the livestock sector, where it is used in feed production. Following the increase of red meat consumption, soybean crops have been increasing and are deemed to be causing deforestation in many areas that are converted for large-scale production.
Another cause for concern are the fertilizers and pesticides which may pollute underground and surface water. As in the previous cases, appropriate management is necessary to avoid a decrease in the quality of local water as well as other impacts such as eutrophication.
ANEXX 2 I Description of Sectors and their Water Use
50
FOOD PROCESSINGThe use of water on food production takes place in four stages. The first one is during primary production, which is the activity that will supply the raw material, such as agriculture, livestock or the production of dairy products. The consumption of water in this first stage depends on the specific sector, although it is still counted as the product’s water footprint.
Once in the factory, the ingredients and all the products that will have direct contact with the food must be cleaned and disinfected. Cooling and heating are important stages of the production process, re-quiring large amounts of water, quantity that varies depending on the production facility. The last stage that requires water is when water is added to the food, as part of a recipe or the final product.
Since water requirements for food production are high, most of the water used must be drinkable. In some cases, the food industry uses non-potable water, for example, in firefighting and in steampro-duction. In these cases, the water must be clearly identified as non-potable and cannot be associated or mixed with the drinking water that is directly used in food production.
Pollutants derived from ingredients sanitation, such as pesticides, herbicides and detergents, become effluents. The effluents produced by this industry contain high amounts of organic matter and some toxic substances, requiring appropriate treatment.
AUTOMOTIVEThe automotive industry often has five vehicle production stages. Water consumption is high for heat exchangers, including cooling, heating and cleaning. In the first stage, the shape of the plates is defined, after having passed by the press, consuming the equivalent of 16% of total water use. Afterwards, the plates are welded together, and water consump-tion accounts for 4.6% of the total.
Once the car frame is finished, it is painted. This stage is responsible for the largest consumption of water, reaching half of the total. This is because the painting stage has many steps and requires rinsing several times. The water used generates effluents containing mainly oil and metals.
After the vehicle is painted, the engine is tested, the equipment is washed and all parts are installed. This stage accounts for the second largest consumption of water, one fifth of total water consumption, and it involves cleaning and heat exchangers. The assembly is the final process in which tests are made. A con-sumption of 9.5% of total water is expected during this phase.
Most of the automotive industries that have water reuse initiatives have reduced water consumption by an average of 3.7 m³ (Fiat is an example) per vehicle produced.
PETROCHEMICALThe petrochemical sector is the most relevant sector of the chemical industry. The sector is responsible for the transformation of products originated from oil and natural gas into goods such as plastic, rubber, synthetic fibres, detergents and fertilizers. The lar-gest water consumer of the entire process is the cooling tower, that suffers losses of large quantities of water due to evaporation.
As the water from the heat exchangers does not come into direct contact with the processed materials, and hence it features the same characteristics as previou-sly, such systems are often implemented in a closed circuit, in which water is cooled in a cooling tower for reuse. The generation of wastewater by the petroche-mical industry derives mostly from the condensation of vapours, purges of the cooling towers and the spil-led products that are eventually washed by rainwater.
These effluents usually contain high levels of organic matter, which may include phenols and benzene, and suspended solids. They may also include heavy metals, radioactive pollutants present in the oil and, sometimes, biological pollutants.
51
STEEL AND METALLURGY The sector responsible for the transformation of metals is metallurgy. The majority of metals in nature are not naturally pure, but are found aggregated with other minerals, requiring metallurgical processes for them to be used. The firms of the metallurgicalsector can be divided into those that produce iron, tubes, non-ferrous metals and fusion of metals and steel mill.
The steel mill sector is a large water consumer. It produces steel, which is made in a blast furnace oven by mixing iron, coke and lime. The production of coke itself is very water intensive due to water loss by evaporation during its cooling process.
The other process responsible for intensive water use is the production of the steel plates. The plates are produced at very high temperatures and require large amounts of water for cooling, incurring in some water loss from evaporation.
Treatment to wash pollutant gases is also responsible for large water consumption. The gases produced by this sector are highly concentrated with oxides and with heavy metals, derived from the coke and the minerals, and effluents from washing, requiring treatment before they are discharged. Moreover, the high water temperature employed during the cooling process can be considered a pollutant, requiring coo-ling before it is discharged.
MININGIn mining, water is one of the main inputs, and it is used within a broad range of activities from extraction to final delivery to the costumer, including mineral processing, dust suppression, waste trans-port, and administrative use. The basic mining process of all minerals consists of two phases: extraction and processing, which is specific for each type of mineral.
The processing stage aims to change the grain size and the minerals’ relative concentration through physical and chemical differences that exist in the mineral without changing the chemical and physical identities of the mineral itself. The process removes the gangue minerals from the ore minerals usually by
grinding, washing and drying. In order to separate the ore, processes such as flotation are used. For the ma-terial to be grinded in smaller pieces, the equipment requires more humidity. Both processes demand high volume of water.
The consumption of water in dust suppression is also high, since the minerals generate a significant amount of suspended dust during exploitation and transpor-tation. The suppression of dust is often made with water on the streets that lead to the mine, especially because they are usually dirt roads, and over the piles of minerals, since its powder can be easily carried and spread. Water is not highly efficient in keeping the dust suppressed, thus, this process requires large water consumption.
The production of effluents is also high, but the parameters and treatment required depend on the processes and the characteristics of the mineral and of the soil from where it was extracted. Most times, it contains acids, heavy metals and some other pollutants, requiring special attention to protect the surrounding area to avoid contamination.
BEVERAGES The production of beverages often demands a large amount of clean water. To avoid mistakes during the production, such as interruptions due to lack of the resource or changes in the final product that may compromise the plant’s reputation, it is important to have a reliable and continuous source of fresh water.
In addition to the use of water as raw material, water is also needed for cleaning, cooling and heating activities, similarly to other industries. The cleaning process includes the factory and other cleaning, such as the cleaning of packages and ingredients like fruits.
It should be noted that the consumption of fresh water in this sector can include different processes and the production of various types of effluents, since the beverage companies have a range of products with different specifications, such as fresh, alcoholic and artificial drinks. Organic matter and sometimes herbicides and fertilizers from the raw material mainly compose the effluents generated from the processes.

52
While tree plantations avoid some of the negative effects of forest gaps, such as soil erosion, floods and landslides, monocultures still have negative effects on soil fertility and on biodiversity. Monocultures represent the main mode of production of the pulp and paper companies and they often require the use of large amounts of pesticides and fertilizers, which cause risks to the workers and to the environment, particularly to water.
The consumption of water during the paper production starts with the processes of cleaning, peeling and cutting the trees. After they are cleaned, the logs are cooked in an aqueous solution of sodium hydroxide and sodium sulfide. After cooked, the effluent is separated from the pulp, which must also be washed.
The liquor used for cooking is completed recove-red, but failures such as losses and leakages may be
PULP AND PAPERoccasional sources of contamination. The final process is bleaching, which whitens the paper fibre. Performed in towers, there are sequential stages in which different reagents are applied.
At the end of each stage, the paste is washed to remove the chemical product and then forwarded to a new bleaching stage. The washing system is backwash in order to reduce the consumption of water, energy and reagents. The washing process ser-ves both purposes: it thickens the pulp and changes the temperature.
Paper production generates a large volume of effluents, which can potentially limit the expansion of the process. The effluents produced by this sector are full of organic compounds, chemical products and include lignin, a compound that is difficult to degrade and toxic to the biological community, requiring in-tensive treatment processes.

53
RESEARCH PROCESS To conduct this study, we analysed data from secondary sources and conducted interviews with water / environment specialists and with representa-tives from companies from the selected sectors that have water efficiency initiatives. We also interviewed suppliers of relevant technologies and developed case studies with the information provided.
We started by analysing the most promising technolo-gies available in the market. Such technologies often have more information available, are already proved to achieve water optimisation and can be used by different sectors. Such research approach leveraged our analysis and improved our understanding of the most important technologies.
However, key data such as companies’ specific initiati-ves, water risk mitigation practices, amounts invested and basic information such as number of employees, and number and size of plants had to be estimated.
Many companies are reluctant to share their infor-mation for strategic reasons or due to bureaucratic reasons. In order to calculate the investment gap, a number of variables were estimated, such as the
current status of technology use and potential market size. To estimate the investment gap and potential market size, we considered the total number of com-panies from each of the sectors of the study and their size. Further information is available in Annex 4.
The use of case studies was important given that each technology is applied differently depending on the industry, the product, the location of the plant, and the environmental conditions around it.
Besides, sector specific technologies often require very detailed information for an economic and fi-nancial analysis to be properly conducted. For this reason, we chose relevant technologies that can be employed by different sectors, which allows a more generic and also richer analysis of feasibility.
We created an extensive list of potential interviewe-es, together with CEBDS and other market specialists. Due to factors such as companies’ level of interest and period of the year, many were not available to partici-pate. Water specialists and technology suppliers also participated. Our final list of interviewees is available below.
ANEXX 3 I Method and Research Process
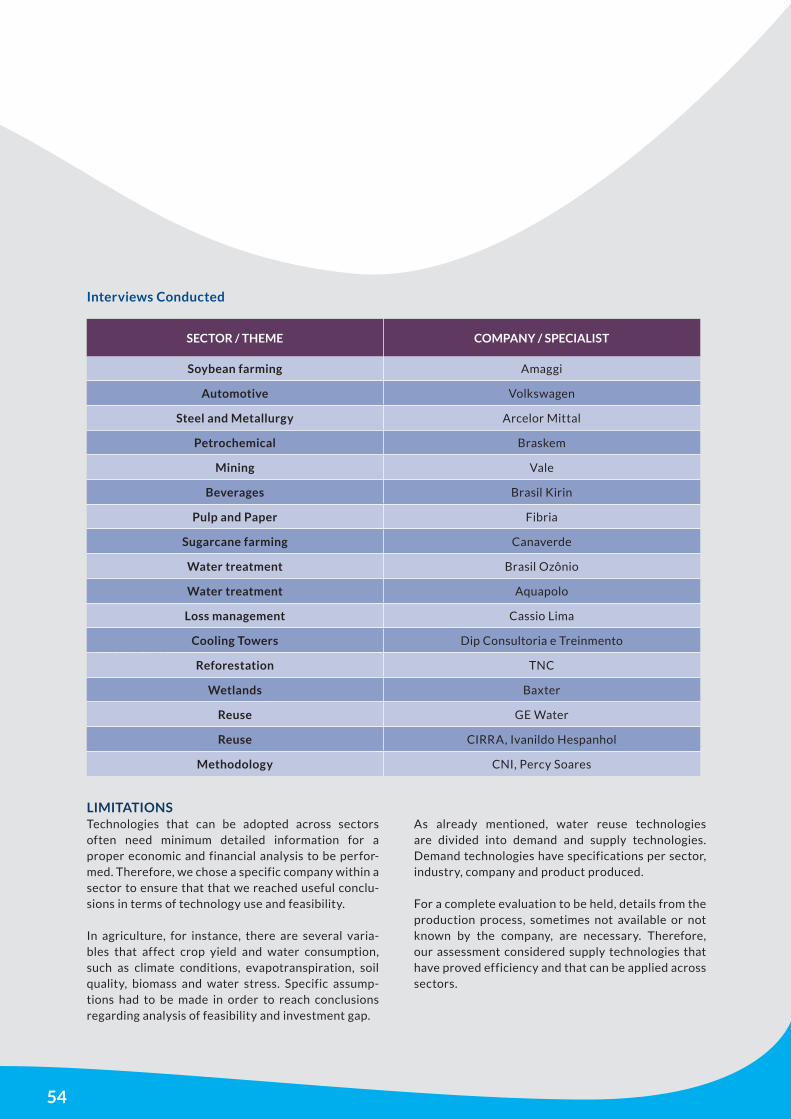
54
Interviews Conducted
Technologies that can be adopted across sectors often need minimum detailed information for a proper economic and financial analysis to be perfor-med. Therefore, we chose a specific company within a sector to ensure that that we reached useful conclu-sions in terms of technology use and feasibility.
In agriculture, for instance, there are several varia-bles that affect crop yield and water consumption, such as climate conditions, evapotranspiration, soil quality, biomass and water stress. Specific assump-tions had to be made in order to reach conclusions regarding analysis of feasibility and investment gap.
LIMITAÇÕES
As already mentioned, water reuse technologies are divided into demand and supply technologies. Demand technologies have specifications per sector, industry, company and product produced.
For a complete evaluation to be held, details from the production process, sometimes not available or not known by the company, are necessary. Therefore, our assessment considered supply technologies that have proved efficiency and that can be applied across sectors.
SECTOR / THEME COMPANY / SPECIALIST
Soybean farming Amaggi
Automotive Volkswagen
Steel and Metallurgy Arcelor Mittal
Petrochemical Braskem
Mining Vale
Beverages Brasil Kirin
Pulp and Paper Fibria
Sugarcane farming Canaverde
Water treatment Brasil Ozônio
Water treatment Aquapolo
Loss management Cassio Lima
Cooling Towers Dip Consultoria e Treinmento
Reforestation TNC
Wetlands Baxter
Reuse GE Water
Reuse CIRRA, Ivanildo Hespanhol
Methodology CNI, Percy Soares
LIMITATIONS
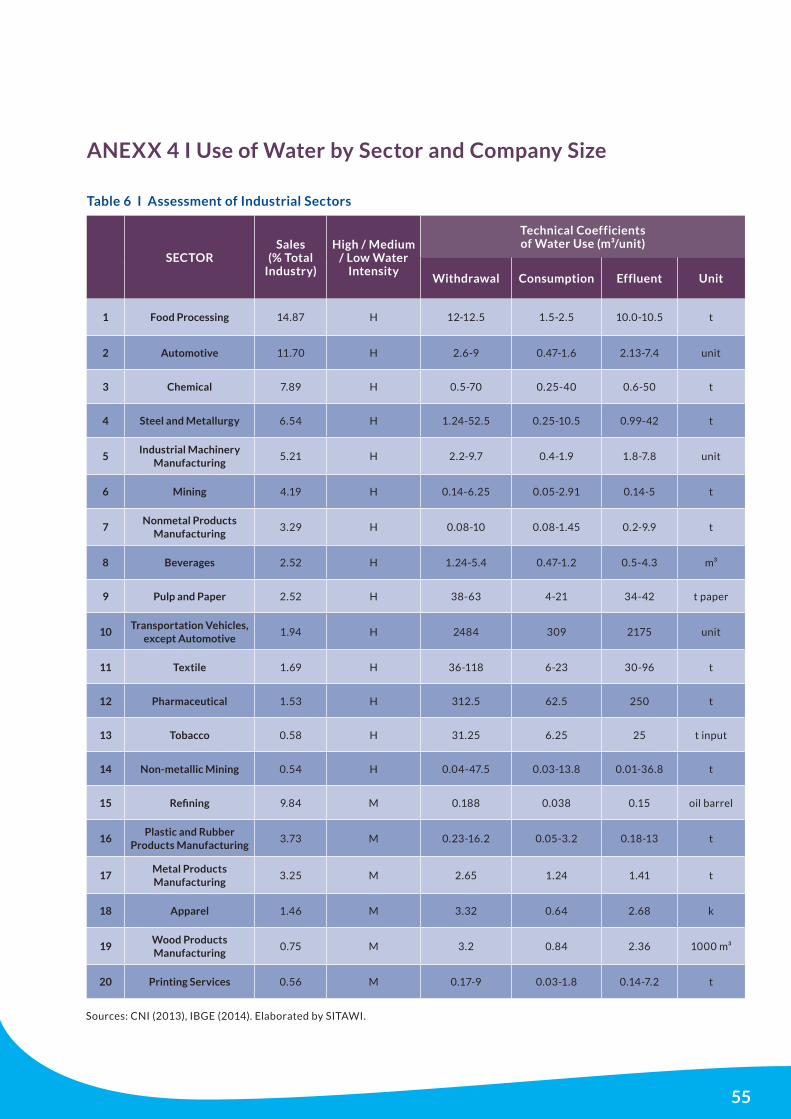
55
ANEXX 4 I Use of Water by Sector and Company Size
Table 6 I Assessment of Industrial Sectors
SECTORSales
(% Total Industry)
High / Medium / Low Water
Intensity
Technical Coefficients of Water Use (m³/unit)
Withdrawal Consumption Effluent Unit
1 Food Processing 14.87 H 12-12.5 1.5-2.5 10.0-10.5 t
2 Automotive 11.70 H 2.6-9 0.47-1.6 2.13-7.4 unit
3 Chemical 7.89 H 0.5-70 0.25-40 0.6-50 t
4 Steel and Metallurgy 6.54 H 1.24-52.5 0.25-10.5 0.99-42 t
5Industrial Machinery
Manufacturing 5.21 H 2.2-9.7 0.4-1.9 1.8-7.8 unit
6 Mining 4.19 H 0.14-6.25 0.05-2.91 0.14-5 t
7Nonmetal Products
Manufacturing3.29 H 0.08-10 0.08-1.45 0.2-9.9 t
8 Beverages 2.52 H 1.24-5.4 0.47-1.2 0.5-4.3 m³
9 Pulp and Paper 2.52 H 38-63 4-21 34-42 t paper
10Transportation Vehicles,
except Automotive1.94 H 2484 309 2175 unit
11 Textile 1.69 H 36-118 6-23 30-96 t
12 Pharmaceutical 1.53 H 312.5 62.5 250 t
13 Tobacco 0.58 H 31.25 6.25 25 t input
14 Non-metallic Mining 0.54 H 0.04-47.5 0.03-13.8 0.01-36.8 t
15 Refining 9.84 M 0.188 0.038 0.15 oil barrel
16Plastic and Rubber
Products Manufacturing3.73 M 0.23-16.2 0.05-3.2 0.18-13 t
17Metal Products Manufacturing
3.25 M 2.65 1.24 1.41 t
18 Apparel 1.46 M 3.32 0.64 2.68 k
19Wood Products Manufacturing
0.75 M 3.2 0.84 2.36 1000 m³
20 Printing Services 0.56 M 0.17-9 0.03-1.8 0.14-7.2 t
Sources: CNI (2013), IBGE (2014). Elaborated by SITAWI.
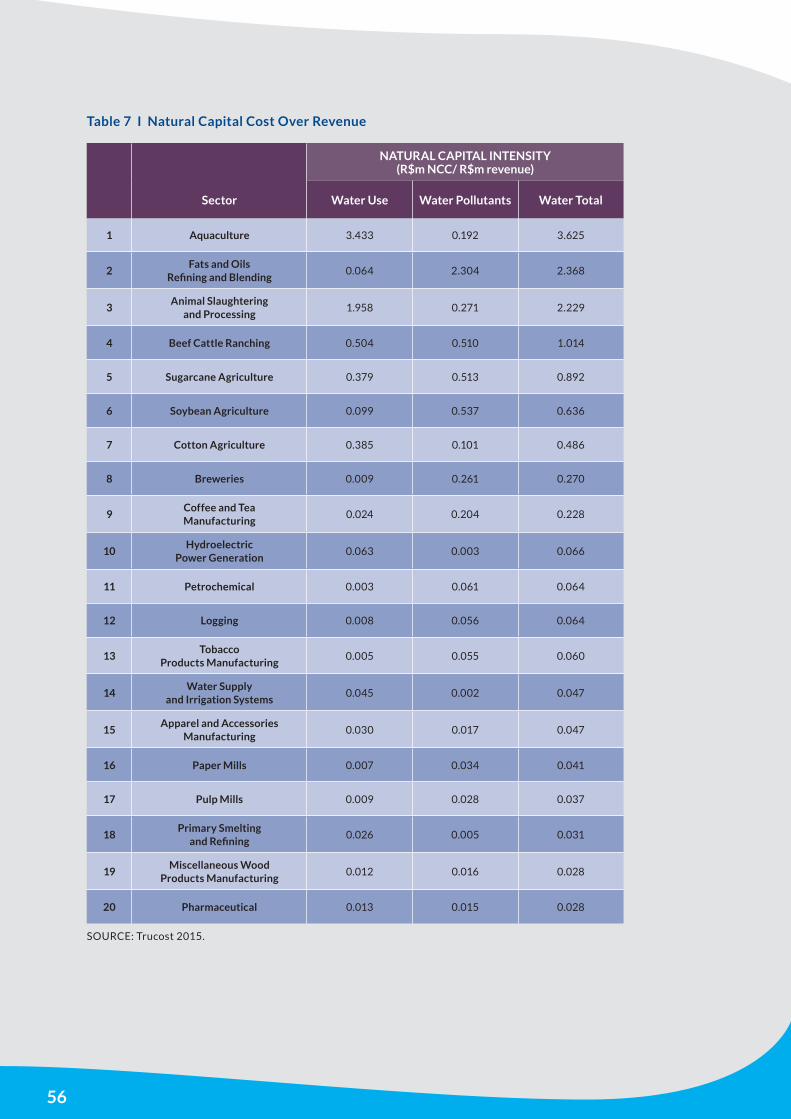
56
NATURAL CAPITAL INTENSITY (R$m NCC/ R$m revenue)
Sector Water Use Water Pollutants Water Total
1 Aquaculture 3.433 0.192 3.625
2Fats and Oils
Refining and Blending 0.064 2.304 2.368
3Animal Slaughtering
and Processing 1.958 0.271 2.229
4 Beef Cattle Ranching 0.504 0.510 1.014
5 Sugarcane Agriculture 0.379 0.513 0.892
6 Soybean Agriculture 0.099 0.537 0.636
7 Cotton Agriculture 0.385 0.101 0.486
8 Breweries 0.009 0.261 0.270
9Coffee and Tea Manufacturing
0.024 0.204 0.228
10Hydroelectric
Power Generation 0.063 0.003 0.066
11 Petrochemical 0.003 0.061 0.064
12 Logging 0.008 0.056 0.064
13Tobacco
Products Manufacturing 0.005 0.055 0.060
14Water Supply
and Irrigation Systems 0.045 0.002 0.047
15Apparel and Accessories
Manufacturing 0.030 0.017 0.047
16 Paper Mills 0.007 0.034 0.041
17 Pulp Mills 0.009 0.028 0.037
18Primary Smelting
and Refining 0.026 0.005 0.031
19Miscellaneous Wood
Products Manufacturing 0.012 0.016 0.028
20 Pharmaceutical 0.013 0.015 0.028
SOURCE: Trucost 2015.
Table 7 I Natural Capital Cost Over Revenue
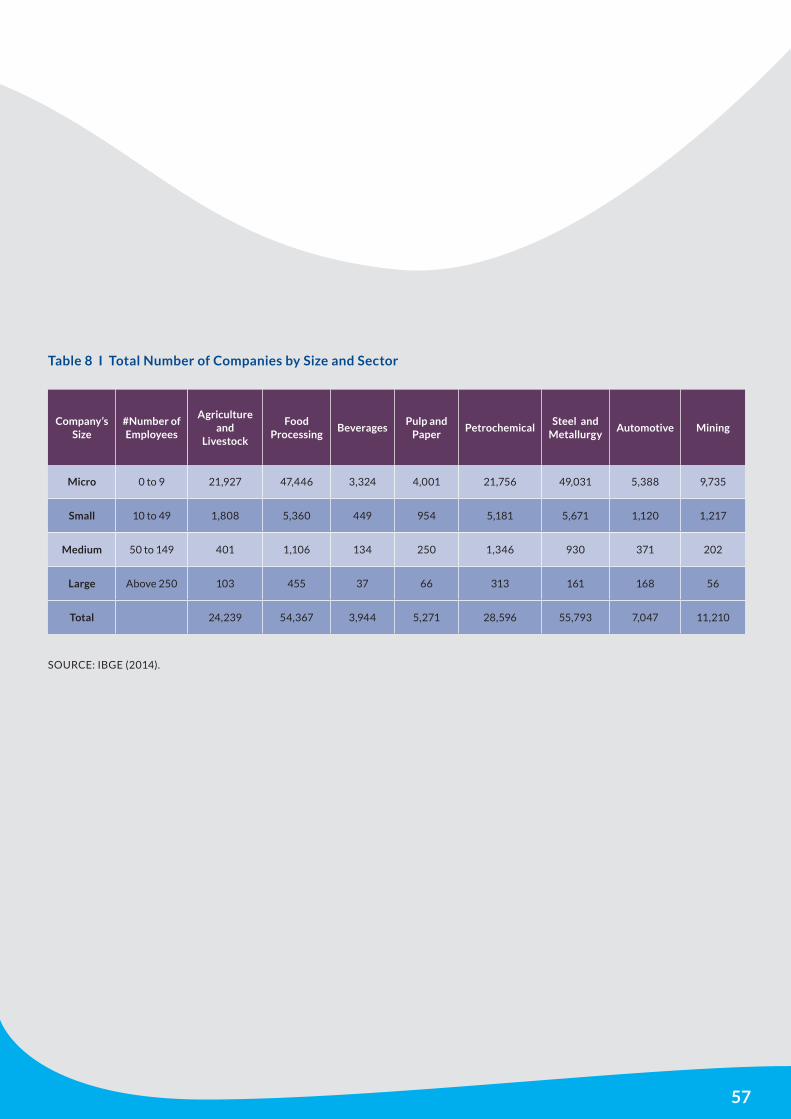
57
Company’s Size
#Number of Employees
Agriculture and
Livestock
Food Processing
BeveragesPulp and
PaperPetrochemical
Steel and Metallurgy
Automotive Mining
Micro 0 to 9 21,927 47,446 3,324 4,001 21,756 49,031 5,388 9,735
Small 10 to 49 1,808 5,360 449 954 5,181 5,671 1,120 1,217
Medium 50 to 149 401 1,106 134 250 1,346 930 371 202
Large Above 250 103 455 37 66 313 161 168 56
Total 24,239 54,367 3,944 5,271 28,596 55,793 7,047 11,210
SOURCE: IBGE (2014).
Table 8 I Total Number of Companies by Size and Sector

58
● CERES Aqua Gauge, 2012 - The Ceres Aqua Gauge: A Framework for 21st Century Water Risk Management.
● The 2030 Water Resources Group, 2009 - Charting Our Water Future.
● UN, 2015 - World Water Development Report - Case Studies and Indicators.
WATER AND INVESTMENTS
● CERES, 2015 - Investor Water Handbook.
● IFC Sustainable Financial Markets Facility - Environmental and Social Assessment Tool
● World Bank, 2005 - Financing water supply and sanitation investments. ● WBCSD Water, 2012 - Water valuation - Building the business case. ● EPA - Water-Saving Technologies ● SABESP – Tarifas (http://site.sabesp.com.br/site/interna/Default.aspx?secaoId=183)
● WBCSD, 2015 - The business case for natural infrastructure. (http://www.naturalinfrastructu-reforbusiness.org/wp-content/uploads/2016/02/WBCSD_BusinessCase_jan2016.pdf)
● WRI, 2015 - Cities Can Save Money by Investing in Natural Infrastructure for Water. (http://www.wri.org/blog/2015/10/cities-can-save-money-investing--natural-infrastructure-water)
BRAZIL
● CEBDS, March 2015 - Gerenciamento de riscos Hídricos no Brasil e o setor empresarial: desafios e oportunidades. (http://cebds.org/wp-content/uplo-ads/2015/03/CEBDS_RiscoHidrico_BAIXA.pdf)
● CNI, 2013 - Água, indústria e sustentabilidade. (http://arquivos.portaldaindustria.com.br/app/con-teudo_18/2013/09/23/4967/20131025113511891782i.pdf)
● CNI, 2013 - Uso de água no setor industrial brasi-leiro. (http://arquivos.portaldaindustria.com.br/app/conteudo_18/2014/03/12/6021/20140313113650962172e.pdf)
● FBB, MMA, FUNARBE, 2011 - Relatório Final dos Coeficientes Técnicos de Recursos Hídricos das Atividades Industrial e Agricultura Irrigada (http://www.mma.gov.br/estruturas/161/_publica-cao/161_publicacao21032012055532.pdf)
● FIESP - Manual de Conservação e Reúso de Água para o Setor Industrial (http://www.fiesp.com.br/arquivo-download/?id=15019)
● Luana Lisboa, Demetrius David da Silva, Iara de Castro e Oliveira, Bruno Marcel de Barros da Silva, 2014 - Matriz de Coeficientes Técnicos de Recursos Hídricos para o Setor Industrial Brasileiro. (https://www.abrh.org.br/SGCv3/UserFiles/Sumarios/d2f724fbcd473e0a52087d6318d8194d_13ce3efa8a0568b8270a6667575ba948.pdf)
● TruCost, 2015 - Natural Capital Risk Exposure Brazilian Banks
● UFRRJ, 2007 – Saneamento Ambiental, Abastecimento de água. (http://www.ufrrj.br/ins-titutos/it/deng/leonardo/downloads/APOSTILA/Apostila IT 179/Cap 4 parte 1.pdf)
● Portal Brasil, 2014 - Saiba mais sobre água, consu-mo consciente e recursos hídricos no Brasil. (http://www.brasil.gov.br/ciencia-e-tecnologia/2010/10/agua-e-consumo-consciente)
● IBGE – Biomas. (http://7a12.ibge.gov.br/vamos-co-nhecer-o-brasil/nosso-territorio/biomas.html)
● SNIRH – Divisão Hidrográfica. (http://www3.snirh.gov.br/portal/snirh/snirh-1/acesso-tematico/divisao-hidrografica)
● SNIRH – Conjuntura dos recursos hídricos. Informe 2014. (http://www3.snirh.gov.br/portal/snirh/snirh-1/conjuntura-dos-recursos-hidricos/informes2014.pdf)
● SNIRH – Conjuntura dos recursos hídricos. Informe 2015. (http://www3.snirh.gov.br/portal/snirh/snirh-1/conjuntura-dos-recursos-hidricos/conjuntura_in-forme_2015.pdf)
● Reporter Brasil, 2004 - A má distribuição da água no Brasil. (http://reporterbrasil.org.br/2004/04/b--artigo-b-a-ma-distribuicao-da-agua-no-brasil/)
● Rios Vivos – Água. (http://riosvivos.org.br/agua/)
● SNIRH – Quantidade de água. (http://www3.snirh.gov.br/portal/snirh/snirh-1/acesso-tematico/quantidade-de-agua)
REFERENCES
59
● FIRJAN, 2015 – Manual de conservação e reúso de água na indústria. (http://www.firjan.com.br/lumis/portal/file/fileDownload.jsp?fileId=2C908A8F4EB-C426A014ED0443AB76C01&inline=1)
● INMET - Normais climatológicas do Brasil, Período 1961-1990. (http://www.inmet.gov.br/webcdp/clima-tologia/normais/imagens/normais/textos/apresenta-cao.pdf)
● Plinio Tomaz, 2001 – Economia de água. (http://www.pliniotomaz.com.br/downloads/Novos_livros/livro_economia_de_agua_170114/eco-nomia_de_agua.pdf)
● IBGE, 2015 – Estatísticas do Cadastro Central de Empresas 2013
SÃO PAULO
● CPDEC & UNICAMP, 2014 - O uso e o consumo da água no estado de São Paulo. (https://www3.eco.uni-camp.br/neit/images/stories/arquivos/o_uso_e_con-sumo_da_agua_no_estado_de_sp.pdf)
● Folha de São Paulo, 2014 - Indústrias consomem cerca de 40% da água de SP, mas fazem pouco em reúso. (http://www1.folha.uol.com.br/cotidia-no/2014/11/1549655-industrias-consomem-cerca--de-40-da-agua-de-sp-mas-fazem-pouco-em-reúso.shtml)
● Planeta Sustentável, 2015 - Crise da água em SP: ‘Vilões’ do consumo, indústria, comércio e agronegó-cio ensaiam êxodo e falam em novos tempos. (http://planetasustentavel.abril.com.br/blog/planeta-agua/crise-da-agua-em-sp-viloes-do-consumo-industria--comercio-e-agronegocio-ensaiam-exodo-e-falam--em-novos-tempos/)
● Revista Forum – Como superar a crise da água. (http://www.revistaforum.com.br/digital/especial/como-superar-a-crise-da-agua/)
CLIMATE CHANGE
● Planeta Sustentável, 2014 - Entenda a segunda parte do 5º. relatório do IPCC (http://planetasusten-tavel.abril.com.br/blog/blog-do-clima/2014/04/01/entenda-a-segunda-parte-do-5o-relatorio-do-ipcc/)
● FBDS e Lloyd’s, 2009 - Mudanças climáticas e eventos extremos no Brasil. (http://www.fbds.org.br/cop15/FBDS_MudancasClimaticas.pdf)
REUSE
● General Electric, 2008 - Addressing water scar-city through recycling and reuse:a menu for poli-cymakers. (https://www.ge.com/sites/default/files/Addressing_Water_Scarcity_Recycle_Reuse_White_Paper.pdf)
● Mierzwa - Hespanhol, 2007 - Água Na Indústria - Uso Racional e Reúso. (http://www.teses.usp.br/teses/disponi-veis/3/3147/tde-14112002-203535/publico/TeseJCM.pdf)
● Tchobanoglous et al., 2003 - Wastewater Engineering. Treatment and reuse. (http://www.mumbaidp24seven.in/reference/Ch_1WastewaterEngineering4thed_byMetcalfan-dEddy.pdf)
● Aquapolo ambiental, 2016 – Água de reúso. (http://www.aquapolo.com.br/agua-de-reúso-videos)
● G. Miller, 2005 - Integrated concepts in water reuse: managing global water needs. (http://www.homepages.ucl.ac.uk/~ucessjb/S3 Reading/miller 06.pdf)
● Revista Pesquisa Fapesp, 2015 – Água Reciclada. (http://revistapesquisa.fapesp.br/2015/10/01/teste-agua-reciclada-audio-2/)
● Aquapolo ambiental, 2015 – Case Study
● New Jersey Stormwater, 2004 - Computing Stormwater Runoff Rates and Volumes. (http://www.njstormwater.org/bmp_manual/NJ_SWBMP_5 print.pdf)
● Mariani de Nez - UNESC, 2010 – Análise da viabilidade do aproveitamento da água pluvial em agroindústria. Estudo de caso: Agrovêneto Indústria de Alimentos S.A. (http://www.bib.unesc.net/biblioteca/sumario/00004D/00004D04.pdf)
● Ricardo de Lima, Thiago Machado - UNIFEB, 2008 - Aproveitamento de Água Pluvial: análise do custo de implan-tação do sistema em edificações. (http://www.feb.br/index.php/xxxvi-semana-cultural-e-cientifica-do-ise/doc_downlo-ad/372-texto-completo-tcc2008-ricardo-e-thiago)
● Leonardo Pereira, Antonio Pasqualetto, Marco Minami - PUC – GO, 2008 - Viabilidade econômico/ambiental da implantação de um sistema de captação e aproveitamen-to de água pluvial em edificação de 100m2 de cobertura. (http://www.ucg.br/ucg/prope/cpgss/arquivosupload/36/file/continua/viabilidade economico_ambiental da implan-ta%C3%87%C3%83o de um sistema de capta%C3%87%-C3%83o e aproveitamento de %C3%81gua.pdf)
● Hespanhol, 2008 - Um novo paradigma para a gestão de recursos hídricos. (http://www.scielo.br/pdf/ea/v22n63/v22n63a09.pdf)
● Raquel de Carvalho - UFPR, 2010 - Potencial econômico do aproveitamento de águas pluviais: Análise da implanta-ção de um sistema para a região urbana de Londrina. (http://dspace.c3sl.ufpr.br/dspace/bitstream/handle/1884/34378/CARVALHO, RAQUEL SARAVY DE.pdf?sequence=1)
60
BEVERAGES
● BIER (Beverage Industry Environmental Roundtable), 2012 - Managing Water-Related Business Risks & Opportunities in the Beverage Sector (http://media.wix.com/ugd/49d7a0_f49252ae57154a7baefbd0c314e311f1.pdf)
● BNDES, 2014 – O setor de bebidas no Brasil (https://web.bndes.gov.br/bib/jspui/bitstre-am/1408/3462/1/BS 40 O setor de bebidas no Brasil_P.pdf)
● CETESB, 2009 - Cervejas e Refrigerantes Série P+L
SUGARCANE
● FIESP, 2009 - Manual de Conservação e Reúso de Água na Agroindústria Sucroenergetica. (http://www.fiesp.com.br/arquivo-download/?id=1616)
● Waldenir Britto - FACAPE, 2007 - Custos de Irrigação na Cana-de-Açúcar: Um Estudo Realizado com os Diversos Sistemas de Irrigação em Juazeiro-BA. (http://anaiscbc.emnuvens.com.br/anais/article/viewFile/1471/1471)
● Jornal da UNICAMP, 2014 - Método permite irri-gação de cana com esgoto doméstico. (http://www.unicamp.br/unicamp/ju/605/metodo-permite-irriga-cao-de-cana-com-esgoto-domestico)
● João Paulo Nunes da Silva, Maria Regina Nunes da Silva - IFES Goiás, 2012 - Noções básicas sobre o cultivo de cana-de-açúcar. (http://estudio01.proj.ufsm.br/cadernos/ifgo/tecnico_acucar_alcool/noco-es_cultura_cana_acucar.pdf)
● Mirlei Pereira - UFU, 2010 - A inserção recente da cana-de-açúcar no sudoeste da Amazônia: novos indícios da instabilidade do território em Rondônia e Acre. (http://www.scielo.br/scielo.php?pi-d=S1518-70122010000200007&script=sci_arttext)
AGRICULTURE
● Mukhopadhyay, 2012 - Smart Sensing Technology for Agriculture and Environmental Monitoring. (http://www.springer.com/us/book/9783642276378)
● Ivan Ricardo Carvalho, Cleiton Korcelski, Guilherme Pelissari, Airton Dalmir Hanus, Genesio Mario da Rosa - UFSM, 2013 - Demanda hídri-ca das culturas de interesse agronômico. (http://www.conhecer.org.br/enciclop/2013b/CIENCIAS AGRARIAS/DEMANDA HIDRICA.pdf)
● FAO, 2010 - Status of water use efficiency of main crops - SOLAW Background Thematic Report - TR07 (http://www.fao.org/fileadmin/templates/solaw/files/thematic_reports/TR_07_web.pdf)
● IBGE, 2015 - Levantamento sistemático da produção agrícola. (ftp://ftp.ibge.gov.br/Producao_Agricola/Levantamento_Sistematico_da_Producao_Agricola_%5bmensal%5d/Fasciculo/lspa_201510.pdf)
● IWMI Part 3 Ch7, 2007- Pathways for increasing agricultural water productivity (http://www.iwmi.cgiar.org/assessment/Water for Food Water for Life/Chapters/Chapter 7 Water Productivity.pdf)
● Revista Pesquisa Fapesp, 2015 – A contribui-ção do campo. (http://revistapesquisa.fapesp.br/2015/03/13/a-contribuicao-do-campo/)
● BBC Brasil, 2015 - A agricultura é vilã ou vítima na crise hídrica? (http://www.bbc.com/portuguese/noticias/2015/03/150302_agua_agricultura_pai)
MINING
● IBRAM ANA, 2013 - Water Resources Management and the Mining Industry. (http://www.ana.gov.br/bibliotecavirtual/arquivos/A gest%-C3%A3o dos recursos h%C3%ADdricos e a minera%-C3%A7%C3%A3o.pdf)
● International Council on Mining and Metals (ICMM), 2012 - Water management in mining: a selection of case studies. (https://www.icmm.com/document/3660)
● National Water Commission Australia, 2012 - Integrating the mining sector into water planning and entitlements regimes. (http://archive.nwc.gov.au/_ _data/assets/pdf_file/0005/21857/Integrating-the-mining-sector.pdf)
● In the mine, 2015 – Beneficiation in times of lack of water. (http://inthemine.com.br/site/index.php/beneficiamento-em-tempos-de-falta-dagua)
● Votorantim, 2014 - FIESP pays tribute to Votorantim Metais for its Water Conservation and Reuse project. (http://www.votorantim.com.br/en-us/Noticias/listaNoticias/Pages/140403_voto-rantimmetaisehomenageadanafiespdeconservacao-ereúsodaagua.aspx)
● Mining.com, 2015 – Água e minera-ção. Fatos e Verdades. (http://noticias-mineracao.mining.com/2015/02/11/agua-e-mineracao-fatos-e-verdades)
● UFMG, 2012 – Flotação de minério de ferro. (http://www.ceermin.demin.ufmg.br/monogra-fias/19.PDF)
● PORMIN, 2011 - Beneficiamento de Minérios. (http://www.redeaplmineral.org.br/pormin/noticias/legislacao/beneficiamento_de_minerio.pdf)

61
● MINÉRIOS & MINERALES, 2015 – Tecnologia de beneficiamento a seco é premiada. (http://revistami-nerios.com.br/EdicoesInt/1676/47/Tecnologia_de_beneficiamento_a_seco_e_premiada.aspx)
● MINÉRIOS & MINERALES, 2011 – Processo – Peneiramento a umidade natural cria paradigma. (http://www.minerios.com.br/EdicoesInt/138/4/ProcessoPeneiramento_a_umidade_natural_cria_pa-radigma.aspx)
● Mining.com, 2015 - New Steel, dos Lorentzen, aposta em nova tecnologia. (http://noticiasminera-cao.mining.com/2015/04/13/new-steel-dos-lorent-zen-aposta-em-nova-tecnologia/)
● In the mine, 2015 – Tecnologia viabiliza concen-tração a seco. (http://newsteel.com.br/wp-content/uploads/2015/06/In-The-Mine.pdf)
● Canadian Mining Journal, 2014 - Innovative device offers solution to waterless mineral processing. (http://www.canadianminingjournal.com/features/innovative-device-offers-solution-to-waterless-mi-neral-processing/)
● Dovemining.com – Dry Processing Plants. (http://dovemining.com/dry-processing-plants/)
● Gold-rus.com – Aero Dry Mining Equipment and Machinery. (http://www.gold-rus.com/Gold/Aero-Dry-Processing-Plant.html)
● Physical Separation in Science and Engineering, 2003 - Gravity separation: Old technique/new methods. (downloads.hindawi.com\archi-ve\2003\812865.pdf)
● Water World, 2012 - Thirsty world of mining: harvesting new water solutions. (http://www.wate-rworld.com/articles/wwi/print/volume-27/issue-1/regulars/creative-finance/thirsty-world-of-mining.html)
IRRIGATION
● EPA - WaterSense Labeled Irrigation Controllers. (https://www3.epa.gov/watersense/products/con-troltech.html)
● José Payero, C. Yonts, Suat Irmak, David Tarkalson – UNL, 2005 - Advantages and Disadvantages of Subsurface Drip Irrigation. (http://extensionpublica-tions.unl.edu/assets/pdf/ec776.pdf)
● A. Tagar, F. A. Chandio, I. A. Mari, B. Wagan - WASET, 2012 - Comparative Study of Drip and Furrow Irrigation Methods at Farmer’s Field in Umarkot. (http://waset.org/publications/2316/com-parative-study-of-drip-and-furrow-irrigation-me-thods-at-farmer-s-field-in-umarkot)
● Margriet Caswell, David Zilberman, George E. Goldman - UCANR, 1984 - Economic implications of drip irrigation. (https://ucanr.edu/repositoryfiles/ca3807p4-70927.pdf)
● MIT – Mission 2017 – Irrigation. (http://12.000.scripts.mit.edu/mission2017/irrigation/)
● Rodrigo Souza, Marcos do Amaral, Walter Silvestre, Tiago Sacramenta - INOVAGRI, 2013 – Avaliação econômica da irrigação em pomares de açaí. (http://www.inovagri.org.br/revista/index.php/rbai/article/download/137/pdf_122)
● Portal Dia de Campo, 2011 - A depreciação como ferramenta de decisão na irrigação. (http://www.diadecampo.com.br/zpublisher/materias/Materia.asp?id=25713&secao=Colunas%20e%20Artigos)
● Uri Goldstein - GTACC, 2006 - Custos de Implantação e Amortização de Sistemas de Irrigação Localizada em Citrus. (http://www.gtacc.com.br/pdf/irrigation/169.pdf)
● Rio Rural, 2012 – Irrigação por gotejamento. (http://www.pesagro.rj.gov.br/downloads/riorural/32_Irrigacao_por_go-tejamento.pdf)
● Rio Rural, 2012 – Irrigação por aspersão. (http://www.pesagro.rj.gov.br/downloads/riorural/33_Irrigacao_por_as-persao.pdf)
● Yoram Krontal - ASSOCANA, 2013 - Irrigação por go-tejamento, tecnologia de alto rendimento e redução dos custos de produção. (http://www.assocana.com.br/restri-to/04_e_05.12.13_15.Yoran_Krontal.pdf)
● Paulino et al., 2011, Situação da agricultura irrigada no brasil de acordo com o censo agropecuário 2006 (http://re-vistas.fca.unesp.br/index.php/irriga/article/view/201)
● Thomaz Machado, Marcos Neves, Sigismundo Neto - FEARP, 2002 - Viabilidade econômica da irrigação localizada na cultura da cana-de-açúcar. (http://www.canapedeagua.com.br/index.php?option=com_docman&task=doc_downlo-ad&gid=19&Itemid=6)
● Regina Célia de M. Pires, Flávio B. Arruda, Emílio Sakai, Rinaldo de O. Calheiros, Orivaldo Brunini - APTA, 2008, Agricultura irrigada. (http://www.dge.apta.sp.gov.br/publi-cacoes/T&IA/T&IAv1n1/Revista_Apta_Artigo_Agricultura.pdf)
● Canal Rural, 2014 - Irrigação por gotejamento pode eco-nomizar até 50% de água. (http://www.canalrural.com.br/noticias/agricultura/irrigacao-por-gotejamento-pode-eco-nomizar-ate-agua-24147)
● ANA, 2014 - Water resources management and water use for irrigation in Brazil. Current situation and potential areas. (http://docslide.com.br/government-nonprofit/gestao-de--recursos-hidricos-e-o-uso-da-agua-para-irrigacao-no-bra-sil-situacao-atual-e-areas-potenciais.html)
62
● EMBRAPA, 2011 - Situação da agricultura irrigada no brasil de acordo com o censo agropecuário 2006. (http://ainfo.cnptia.embrapa.br/digital/bitstream/item/47913/1/2011AP16.pdf)
● UDOP, 2015 - Valores de ATR e Preço da Tonelada de Cana-de-açúcar desde 2000. (http://www.udop.com.br/cana/tabela_consecana_parana.pdf)
● Nova Cana, 2013 – Fertilizantes minerais e orgâ-nicos na produção da cana-de-açúcar. (https://www.novacana.com/cana/fertilizantes-minerais-organi-cos-producao-cana-de-acucar/)
REFORESTATION
● The Nature Conservancy, 2012, Green Infrastructure Case studies. (http://www.nature.org/about-us/working-with-companies/case-studies-for--green-infrastructure.pdf)
● World Resources Institute, Natural Infrastructure for Water. (http://www.wri.org/our-work/project/natural-infrastructure-water)
● World Resources Institute, 2009 - Natural in-frastructure - Investing in Forested Landscapes for Source Water Protection in the United States. (http://www.wri.org/sites/default/files/wri13_report_4c_naturalinfrastructure_v2.pdf)
● Greening the grey, 2013 - Trees Do It. (http://www.greeningthegrey.org/trees-do-it/)
● Rim D. Coder - University of Georgia, 1996 - Identified Benefits of Community Trees and Forests (http://www.nfs.unl.edu/documents/communityfo-restry/coderbenefitsofcommtrees.pdf)
● BNDES, 2013 - BNDES aprova R$ 167,7 mi para maior projeto de restauração florestal do Brasil. (http://www.bndes.gov.br/SiteBNDES/bndes/bndes_pt/Institucional/Sala_de_Imprensa/Noticias/2013/meio_ambiente/20130612_fibria.html)
● UNEP, 2014 – Green Infrastructure. Guide for water management. (http://www.unepdhi.org/-/media/microsite_unepdhi/publications/documents/unep/web-unep-dhigroup-green-infrastructure-gui-de-en-20140814.pdfhttps:/portals.iucn.org/library/efiles/documents/2014-026.pdf)
● CNT, 2010 – The value of green infrastructure. (http://www.cnt.org/sites/default/files/publications/CNT_Value-of-Green-Infrastructure.pdf)
● Natural Capital Project – InVEST. (http://www.naturalcapitalproject.org/software/#rios)
● Susanne Schmidt - The University of Queensland - Riparian reforestation to increase water infiltration and reduce run-off. (http://www.ipswich.qld.gov.au/_ _data/assets/pdf_file/0006/39048/Riparian-reforstation-to-increase-water-filtration-and-rduce-runoff_Susanne-Schmidt.pdf)
● EBC, 2012 - Reflorestamento amplia alternativas de renda para o produtor rural. (http://memoria.ebc.com.br/agenciabrasil/noticia/2012-06-23/reflores-tamento-amplia-alternativas-de-renda-para-produ-tor-rural)
● MMA, 2011 - Pagamentos por Serviços Ambientais na Mata Atlânica: lições aprendidas e desafios. (http://www.mma.gov.br/estruturas/202/_arquivos/psa_na_mata_atlantica_licoes_aprendidas_e_desa-fios_202.pdf)
● ANA – Programa Produtor de água. (http://produ-tordeagua.ana.gov.br/)
● Braga - USP, 2005 - CONSERVAÇÃO INTEGRADA DE FLORESTA E ÁGUA. (http://www.teses.usp.br/teses/disponiveis/18/18138/tde-24102008-103711/publico/BragaT.pdf)
AUTOMOTIVE
● FIAT - Gestão de recursos hídricos: Um estudo de caso em indústria automobilística. (http://www.aea.org.br/aea2009/downloads/trabalhospremio/CategoriaResponsabilidadeAmbiental-MencaoHonrosa-RodrigoMiarellideOliveira.pdf)
● Automotive Business, 2015 - Moda em SP, reúso de água é praxe na indústria. (http://www.automotivebusiness.com.br/artigo/1063/moda-em-sp-reúso-de-agua-e-praxe-na-industria)
● CIMM, 2014 - Volkswagen do Brasil reduz o consu-mo de água com investimento em processos. (http://www.cimm.com.br/portal/noticia/exibir_noticia/11614-volkswagen-do-brasil-reduz-o-consumo-de--agua-com-investimento-em-processos)
● Julianna da Silva - UNESP, 2013 - Reúso de água residúaria na indústria automobilística: Estudo de caso da montadora FIAT Automóveis S.A – Betim/MG. (https://www.google.com.br/url?sa=t&rct=j&-q=&esrc=s&source=web&cd=1&cad=rja&uact=8&-ved=0ahUKEwizjdeQsYzNAhUIeSYKHUyzAf4QF-ggdMAA&url=http%3A%2F%2Fwwwp.feb.unesp.br%2Feduoliv%2FSeminarios2013%2F%3Faction%-3Ddownload%26file%3DL0p1bGxpYW5hL0ludH-JvZHXn429fZG9jeC5wZGY%3D&usg=AFQjCNGp-TRWUej9POQ8tprj2D7wtXr7EgA&sig2=vFAMo-j7PTZs5-SjYX1659g)
63
● IPEA, 2009 - O Desempenho Ambiental das Empresas do Setor Automotivo na Região Metropolitana de Curitiba. (https://www.google.com.br/search?q=%E2%80%A2+IPEA%2C+2009+--+O+Desempenho+Ambiental+das+Empresas+-do+Setor+Automotivo+na+Regi%C3%A3o+Me-tropolitana+de+Curitiba.&oq=%E2%80%A2+-IPEA%2C+2009+-+O+Desempenho+Ambiental+das+Empresas+do+Setor+Automotivo+na+Regi%C3%A3o+Metropolitana+de+Curitiba.&aqs=chrome..69i57.398j0j9&sourceid=chrome&ie=UTF-8)
● Larissa de Lima - UFJF, 2010 – A prática da melho-ria contínua em processos sustentáveis: estudo de caso sobre a redução do consumo de água em uma indústria automobilística. (http://www.ufjf.br/enge-nhariadeproducao/files/2014/09/2010_3_Larissa.pdf)
AQUACULTURE
● FGV, 2003 - Projeto Potencialidades Regionais. Estudo de viabilidade econômica: Piscicultura. (http://www.suframa.gov.br/publicacoes/proj_pot_regionais/piscicultura.pdf)
● Ministério de Pesca e Aquicultura, 2015 - Plano de Desenvolvimento da Aquicultura Brasileira - 2015/2020. (http://www.mpa.gov.br/files/docs/Outros/2015/Plano_de_Desenvolvimento_da_Aquicultura-2015-2020.pdf)
● SEBRAE Mercados - A EVOLUÇÃO DA PISCICULTURA NO BRASIL. (http://www.sebraemercados.com.br/a-evolucao-da-piscicultura-no-brasil/)
● Célia Scorvo, João Scorvo Filho, Alceu Donadelli, Patrícia Turco - APTA, 2012 – Piscicultura em tanques rede em represas rurais. (http://www.aptaregional.sp.gov.br/acesse-os-artigos-pesquisa-e--tecnologia/edicao-2012/janeiro-junho-2/1168-pis-cicultura-em-tanques-rede-em-represas-rurais/file.html)
● EMBRAPA, 2010 - Noções básicas sobre piscicul-tura e cultivo em tanques-rede no Pantanal. (http://www.cpap.embrapa.br/publicacoes/online/CAR03.pdf)
● IBGE, 2006 - Censo Agropecuário 2006. (http://www.sidra.ibge.gov.br/bda/pesquisas/ca/default.asp?o=2&i=P)
● Ministério de Pesca e Aquicultura, 2014 – Pesca Industrial (http://www.mpa.gov.br/pesca/industrial)
● Ministério de Pesca e Aquicultura, 2014 – Espécies cultivadas. (http://www.mpa.gov.br/aquicultura/especies-cultivadas)
● Panorama da aquicultura - Demandas para uma produção sustentável de tilápia. (http://www.panoramadaaquicultura.com.br/novosite/?p=2637)
● Suetônio Mota - UFC, 2013 - Aproveitamento de Águas Residuárias Tratadas em Irrigação e Piscicultura. (http://www.abes-sp.org.br/arquivos/evento210613/03.pdf)
● Cidade Verde, 2011 - Agespisa inicia nova pesquisa sobre criação de peixe em esgoto. (http://cidadeverde.com/noti-cias/82777/agespisa-inicia-nova-pesquisa-sobre-criacao--de-peixe-em-esgoto)
● Luciana Emanuelle Sanches Silva, Guilherme Semionato Galício - UEMS, 2012 - Alimentação de peixes em piscicultu-ra intensiva. (http://www.conhecer.org.br/enciclop/2012b/ciencias agrarias/Alimentacao.pdf)
● PROSAB, 2006 - Reúso das águas de esgoto sanitário, inclusive desenvolvimento de tecnologias de tratamento para esse fim.(https://www.finep.gov.br/images/apoio-e--financiamento/historico-de-programas/prosab/Esgoto-Prosab_-_final.pdf)
● Fernanda Furlaneto, Maura Esperancini - UNESP, 2008 - Estudo da viabilidade econômica de projetos de implantação de piscicultura em viveiros escavados. (ftp://ftp.sp.gov.br/ftpiea/publicacoes/ie/2009/tec1-0209.pdf)
● PROSAB, 2009 – Esgoto: Nutrientes de esgoto sa-nitário: utilização e remoção. (ftp://ftp.mct.gov.br/Biblioteca/27770-Nutrientes_esgoto_sanitarios.pdf)
● World Health Organization, 1989 - Guidelines for the safe use of wastewater and excreta in agricultu-re and aquaculture. (http://apps.who.int/iris/bitstre-am/10665/41681/1/9241542489.pdf)
● Fernanda Furlaneto, Daercy Ayroza, Luiz Ayroza - APTA, 2006 - Custo e rentabilidade da produção de tilápia (ore-ochromis spp.) Em tanque-rede no médio paranapanema, Estado de São Paulo, safra 2004/05. (ftp://ftp.sp.gov.br/ftppesca/rentabilidade_tilapia.pdf)
● Globo Rural, 2015 - Veja os dados da piscicultura no Brasil (http://revistagloborural.globo.com/Noticias/Criacao/Peixe/noticia/2015/04/veja-os-dados-da-piscicultura-no--brasil.html)
● SSWM, 2014 - Aquaculture (Fish). (http://www.sswm.info/category/implementation-tools/wastewater-treatment/hardware/semi-centralised-wastewater-treatment-10)
● UNEP - How does wastewater-fed aquaculture work. (http://www.unep.or.jp/ietc/Publications/TechPublications/TechPub-15/2-9/9-1-3.asp)
● FAO - Wastewater use in aquaculture.(http://www.fao.org/docrep/t0551e/t0551e09.htm)

64
● Clovis Pereira, Flavio Lapolli - UFSC, 2008 - Criação de tilápias no efluente doméstico tra-tado em lagoas de estabilização. (https://pe-riodicos.ufsc.br/index.php/biotemas/article/viewFile/2175-7925.2009v22n1p93/18724)
● Suetonio Mota et al. - ABES - UFC, 2011 - Avaliação da sustentabilidade ambiental do uso de esgoto doméstico tratado na piscicultura. (http://www.scielo.br/pdf/esa/v16n1/a08v16n1.pdf)
WETLANDS
● Instituto Terramax, 2009 - Utilização de sistemas de wetlands construídas para tratamento de águas. (http://www.ambiente.sp.gov.br/pactodasaguas/files/2011/12/sistema-wetlands.pdf)
● Sérgio Abrahão - UFV, 2006 – Tratamento de água residuária de laticínios em sistemas alagados construídos cultivados com forrageiras. (http://www.gpqa.ufv.br/docs/mestrado/2006/Tratamento de agua residuaria de laticinios em sistemas alagados construidos cultivados com forrageiras.PDF)
SOYBEAN
● Agrolink, 2015 - Sistema de irrigação subterrâ-neo alavanca em até 46% a produtividade de grãos (http://agrolink.com.br/culturas/soja/noticia/sis-tema-de-irrigacao-subterraneo-alavanca-em-ate--46--a-produtividade-de-graos_217854.html)
● SF Agro, 2015 - Irrigação subterrânea é alternativa em tempos de crise hídrica (http://sfagro.uol.com.br/irrigacao-subterranea-e-alternativa-em-tempos-de--crise-hidrica/)
● Secretaria de Agricultura, Pecuária e Agronegócio do RS, 2012 - A Irrigação - Tecnologia de ponta, é responsabilidade ambiental (http://www2.agricultu-ra.rs.gov.br/noticias_detalhe.php?cod=5155)
● Anizelli, 2012 - De sequeiro aos pivôs centrais: A experiência da Fazenda Sta. Clara (http://www.agr.feis.unesp.br/pdf/Conird_2012/apresentacoes_pa-lestrantes/oficina_conird_fabricio_5_nov_2012.pdf)
● Jacobi, O portal do Geólogo - Minerodutos ou agri-cultura irrigada: quem gasta mais água? (http://www.geologo.com.br/mineroduto4.asp)
● DPH, 2004 – Soja e água. (http://base.d-p-h.info/pt/fiches/dph/fiche-dph-7548.html)
● Barreto. USP, 2004 - Os impactos socioam-bientais do cultivo de soja no Brasil. (https://www.google.com.br/url?sa=t&rct=j&q=&esr-c=s&source=web&cd=1&cad=rja&uact=8&-ved=0ahUKEwjyhdiK74nMAhVExpAKHeKI-DW8QFggiMAA&url=http%3A%2F%2Fwww.anppas.org.br%2Fencontro_anual%2Fencon-tro2%2FGT%2FGT05%2Fclarissa_barreto.pdf&usg=AFQjCNFg8yEChCekGIpZpQpyRuE4PLC-g-g&sig2=VKPFFDYN2g-J0FhNYcBsUA)
● WWF, 2014 – A expansão da soja. (http://www.wwf.org.br/informacoes/?38423/A-expanso-da-soja)
PETROCHEMICAL
● Paula Scarlati - UFRJ, 2013 - Redução do consu-mo de água na indústria petroquímica. (http://tpqb.eq.ufrj.br/download/reducao-de-consumo-de-agua--na-industria-petroquimica.pdf)
OZONE
● NaturalTec – Desinfecção Ozônio. (http://www.naturaltec.com.br/Desinfeccao-Ozonio.html)
DESALINATION
● Marceu Tabosa - CONTECC, 2015 - Estudo de viabilidade econômica de uma planta de osmose reversa com gerador eólico. (http://www.confea.org.br/media/Mecanica_estudo_de_viabilidade_econo-mica_de_uma_planta_de_osmose_reversa_com_gera-dor_eolico.pdf)
● Robério Campos - UFPE, 2007 - Avaliação benefí-cio-custo de sistemas de dessalinização de água em comunidades rurais cearenses. (http://www.scielo.br/pdf/resr/v45n4/a07v45n4)
● André Lermontov, Cristiano Borges, Paula Reuther, Lidia Yokoyama, Dante Luvisotto - UFRJ, 2013 - Analise econômica da dessalinização de água do mar por osmose inversa visando abastecimento público no Estado do Rio de Janeiro. (http://www.grupoa-guasdobrasil.com.br/wp-content/uploads/2013/01/artigo-dessanilizacao.pdf)
65
List of Abbreviations and Acronyms
● ANA - National Water Agency
● ANP - National Agency of Petroleum National Gas and Biofuels
● BID - Inter-American Development Bank
● BMZ - Bundesministerium für wirtschaftliche Zusammenarbeit und Entwicklung - German Ministry of Economic Cooperation and Development
● CAPEX - Capital expenditure
● CEBDS – Brazilian Business Council for Sustainable Development
● CETESB - Environmental Sanitation Technology Company ● ESG - Environmental, Social and Governance ● ETA - Water Treatment Stations
● ETE - Sewage Treatment Station
● FBDS - Brazilian Foundation for Sustainable Development
● FI – Financial Institutions
● Fiesp - Federação das Indústrias do Estado de São Paulo
● GDP – Gross Domestic Product
● GIZ - Gesellschaft für Internationale Zusammenarbeit – International Cooperation Society
● IBGE - Brazilian Institute of Geography and Statistics
● INMET – National Institute of Meteorology
● IRR - Internal Rate of Return
● IRRI - Independent Research in Responsible Investment
● MED – Multiple Effect Distillation
● NVP – Net present value
● OBD – Oxygen Biochemical Demand
● OPEX - Operational expenditure
● POA – Advanced Oxidation Processes
● RO – Reverse Osmosis
● TMBR - Tertiary Membrane Rio Reactor System
● TNC - The Nature Conservancy
● UF - Ultrafiltration
● UN – United Nations
● WACC - Weighted Average Cost of Capital
● WBC – Water Break Even Cost
● WBCSD – World Business Council for Sustainable Development
● WRI - World Resources Institute
● WWF - World Wildlife Fund

666
PREPARED BY: