
What you were never told about Revelation: A revaluation and reassessment

Physics of the Earth and Planetary Interiors, 81 (1993) 261-276 Elsevier Science Publishers B.V., Amsterdam
261
Other Studies
1. Introduction
Throughout the 1970s and early 198Os, large numbers of magnetotelluric (MT) data sets were collected in various studies world-wide. Most of these data were collected and interpreted without provision for the possible effects of near-surface (e.g. static) distortion contributions. Since the time of the data collection, our understanding and ability to deal with such effects, and our modelling and interpretation techniques, have
Magnetotelluric studies from two contrasting Brazilian basins: a reassessment of old data
D. Beamish *,a, J.M. Travassos b,l
a British Geological Suruey, Keyworth, Nottingham NGI2 5GG, UK b Department0 de Geophysics, CNPq-Obseruat6rio National, R. Gen. Bruce 586, 20291 Rio de Janeiro, Brazil
(Received 16 July 1992; revision accepted 4 January 1993)
ABSTRACT
Before the mid-1980s large numbers of magnetotelluric (MT) data were collected and interpreted without addressing the possible effects of near-surface (e.g. static) distortion contributions. In the intervening time, modelling and interpretation techniques have improved. There are many instances where extensive, processed tensor survey data of reasonable quality exist on various back-up media. Before any complete reanalysis of these often large data sets, it is useful to investigate the degree of the distortion effects and the approximate degree of resolution of the data. Such assessment should help to clarify whether a full tensorial reanalysis is worth while. The present study provides contrasting examples of the reappraisal of old data sets collected in two Brazilian basins, both with associated seismic reflection profiles and deep exploration well-logs. Both examples use ‘simplified’ data consisting of only the off-diagonal tensor elements. These data are used in a limited way to assess static distortion and their intrinsic resolution capabilities. In the first example, from the basalt-covered Parana basin, a very high degree of static distortion is displayed. The application of simple distortion correction techniques allow the data to define the main (vertical) geoelectric units of the basin. In the second example, from the Solimoes basin in northern Brazil, static distortion, although less severe, can be readily identified. In this complex petroleum province the resolution of structure, both vertical and lateral, is of very low order. The MT data appear ‘blind’ to the detail of the Palaeozoic sedimentary rocks, and more detailed reanalysis is probably not warranted.
improved. The present study is a reappraisal of two data sets from the 1980s collected in two very different Brazilian basins.
Although the use of MT studies in whole crustal and gross (regional) basin evaluation is well documented, studies concerning more de- tailed (e.g. stratigraphic) evaluations, of more di- rect potential value to the exploration industry, are limited. Here we consider hydrocarbon explo- ration data from two contrasting Brazilian basins, both with associated seismic reflection profiles and deep resistivity well-logs. In the first case, the Parana basin, massive flood basalts cover the sedimentary section; in the second, the Solimbes basin, upper Palaeozoic sediments are intruded by a succession of major diabase sills. The two
* Corresponding author. Telephone: 0602 363 432. Fax: 0602 363 145. EMAIL: k_ [email protected].
’ Also at: PETROBRAS/CENPES/SEGEF, 21910 Rio de Janeiro, Brazil. basins provide contrasting examples of the intrin-
0031-9201/93/$06.00 0 1993 - Elsevier Science Publishers B.V. All rights reserved
262 D. Beamish,J.M Travassos/PhysicsoftheEarth and Planetary Interiors81 (1993)261—276
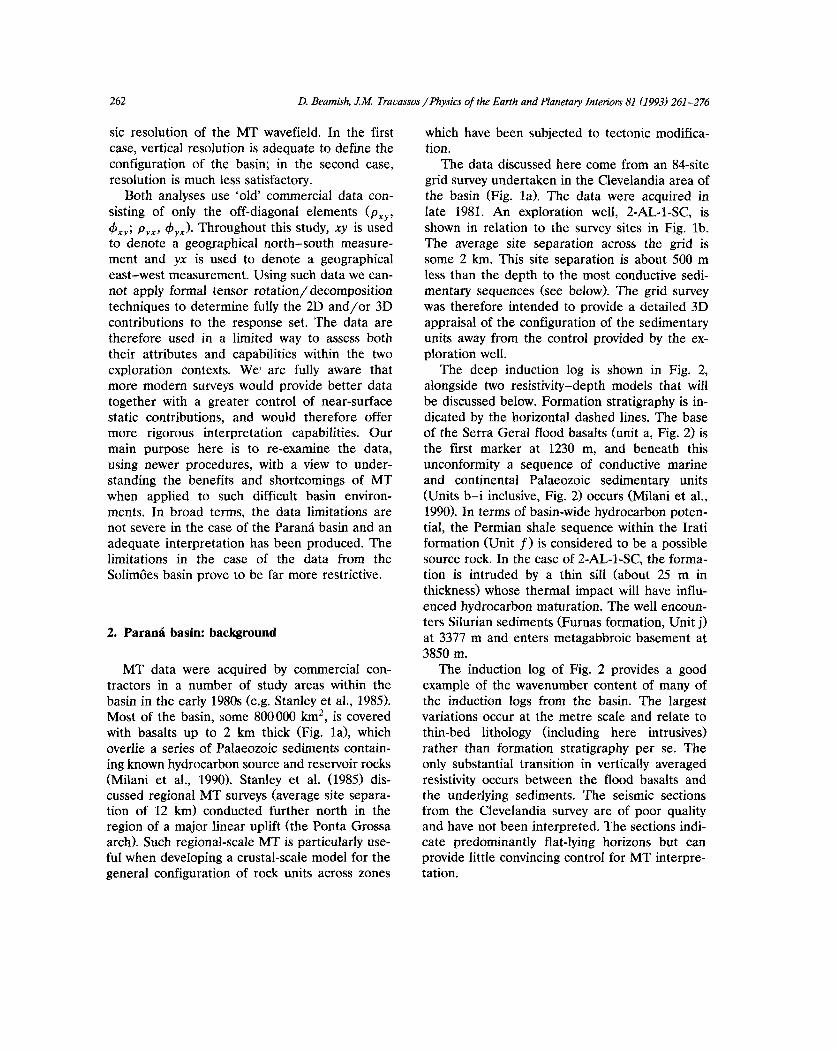
sic resolution of the MT wavefield. In the first which havebeen subjectedto tectonicmodifica-case,vertical resolutionis adequateto define the tion.configuration of the basin; in the secondcase, The datadiscussedhere come froman 84-siteresolution is much less satisfactory. grid surveyundertakenin the Clevelandiaareaof
Both analysesuse ‘old’ commercialdatacon- the basin (Fig. la). The data were acquired insisting of only the off-diagonal elements~ late 1981. An exploration well, 2-AL-i-SC, is
~ .~ 4~).Throughoutthis study,xy is used shown in relation to the survey sites in Fig. lb.to denotea geographicalnorth—southmeasure- The average site separationacross the grid isment and yx is used to denotea geographical some 2 km. This site separationis about 500 meast—westmeasurement.Usingsuchdatawe can- lessthan the depthto the most conductivesedi-not apply formal tensorrotation/decomposition mentarysequences(see below).The grid surveytechniquesto determinefully the 2D and/or3D wastherefore intendedto provide a detailed3Dcontributionsto the responseset. The data are appraisalof the configurationof the sedimentarytherefore usedin a limited way to assessboth units away from the control provided by the ex-their attributes andcapabilities within the two plorationwell.exploration contexts. We’ are fully aware that The deep induction log is shown in Fig. 2,more modernsurveys wouldprovide betterdata alongsidetwo resistivity—depthmodelsthat willtogetherwith a greatercontrol of near-surface be discussedbelow.Formationstratigraphyis in-static contributions,and would therefore offer dicatedby the horizontal dashedlines. The basemore rigorous interpretation capabilities. Our of the SerraGeral flood basalts(unit a, Fig. 2) ismain purpose here is to re-examinethe data, the first marker at 1230 m, and beneath thisusing newer procedures, witha view to under- unconformity a sequenceof conductive marinestanding thebenefits and shortcomingsof MT and continental Palaeozoic sedimentary unitswhen applied to such difficult basin environ- (Units b—i inclusive,Fig. 2) occurs(Milani et a!.,ments. In broad terms, the data limitations are 1990).In termsof basin-widehydrocarbonpoten-not severein the case ofthe Paranábasinandan tial, the Permianshale sequencewithin the Iratiadequateinterpretationhasbeenproduced.The formation (Unit f) is consideredto bea possiblelimitations in the case of the data from the sourcerock. In the case of2-AL-i-SC, the forma-Solimôesbasinprove to be far more restrictive. tion is intruded by a thin sill (about 25 m in
thickness)whosethermalimpact will have influ-encedhydrocarbonmaturation.Thewell encoun-
- tersSilurian sediments(Furnasformation,Unit j)2. Parana basin: background at 3377 m and entersmetagabbroic basementat
3850m.MT datawere acquiredby commercial con- The induction log of Fig. 2 provides a good
tractors in a number of study areaswithin the exampleof the wavenumbercontentof many ofbasinin the early1980s(e.g.Stanleyet al., 1985). the induction logs from the basin. The largestMost of the basin,some 800 000 km2, is covered variationsoccur at the metrescaleand relate towith basaltsup to 2 km thick (Fig. la), which thin-bed lithology (including here intrusives)overlie a seriesof Palaeozoicsedimentscontain- rather than formation stratigraphyper se. Theing known hydrocarbonsourceandreservoir rocks only substantialtransitionin vertically averaged(Milani et a!., 1990). Stanleyet a!. (1985) dis- resistivity occursbetweenthe flood basaltsandcussedregional MT surveys(averagesite separa- the underlying sediments.The seismic sectionstion of 12 km) conductedfurther north in the from the Clevelandiasurvey are of poor qualityregion of a major linear uplift (the PontaGrossa andhavenot been interpreted.The sectionsmdi-arch).Suchregional-scaleMT is particularlyuse- cate predominantlyflat-lying horizons but canful whendevelopinga crustal-scalemodel for the provide little convincingcontrol for MT interpre-generalconfiguration of rock units across zones tation.

D. Beamish,f.M Travassos/Physicsof theEarth and Planetaryinteriors81 (1993)261—276 263
a) I580 540 0 - BRAZIL
SAO PAULO
1km
+ ~ + /
32°,~~~”
SITE LOCATION MAPb~ CLEVELANDIA DATA 84 SOUNDINGS82 ~ ~~‘~
26t ~24 ~23~ ~‘ ~ ~l9~IS~ ~
80 t
30t31t32t33t34t35 ~ -~—2
78 ~ ~ ~ ~~1• 53 ~- 52~ 5~~- so~49 ~. 49~45~
~76 ~t58~S9tSlt62~63t65t66 tt69t4
74 1 -~ 2 s -~ 4 ~- ~ ~‘ 6 1- ~ ~ ~ 12 ~ 13 14
*7572- 84 -~- ~ ~. 82~.81 ~ ~ 77 I -~-73
t ~76
70 I I I I I I
67 69 71 73 75 77 79 81 83 85 87 89 91 93 95KM
Fig. 1. Surveylocation,Paranábasin.In the upperfigure (a) the inset showsthelocation of the Paranábasinon a mapof SouthAmerica.The main map showsthe extentof basaltcover (‘v’ symbols) and structuralContoursof depth to seismic basement(contourinterval I km), afterMilani et al. (1990).+, Basinmargins,in Brazil. Positionof Clevelandiaarrayis shownarrowed(notto scale).The lower figure (b) shows MTsounding locations,andWell 2-AL-i-SC is arrowed.Threeeast—westprofiles (2, 4 and6)arearrowed.

264 D. Beami.sh,f.M Travassos/Physicsof theEarth and PlanetaryInteriors 81(1993)261—276
I 11111111 I 11111111 I 11111111 I 11111111 I 11111111 1111111 I I~IIIl —
400— —
800— —
1200- - . D .. . ~ -
91600— P D P —
~2000~A. . D A0 2400— - ::::.:.:::..::.::..:::::::::::::.::::. .:::::D:: :::::::!r: —
11.2800— -
3200— I —
3600— —
4000— I 11111 I 1111111) I 11111111 I II IIIII~ I 11111111 I 11111111 I lU —
—2 —1 0 1 2 3 4 5
LOG [ RESISTIVITY (OHM.M) IFig. 2. Induction log (1 m sampling)and stratigraphy(dotted lines) fromWell 2-AL-i-SC. Baseof Serra Geralbasalt(unit a) isarrowed.D, Diabasesills. Infilled profiles are thereflectivity coefficient series(Beamishand Travassos,1992c)from the smoothinversionmodelsat Sites8 (left) and 10 (right). The samearbitrary gainfactorswere applied to both. Formations:a, Serra Geralbasalt;b, Botucato; c, Rio deRasto;d, Terezina;e, SerraAlta; f, Irati; g, Palermo;h, Rio Bonito; i, Itararé; j, FurnasFormation.
3. Paranábasin:datacharacteristics A high degree of spatial consistencyis ob-servedin the phaseof the off-diagonal compo-
The dataacquiredby the Clevelandiasurvey nents.Beamishand Travassos(1992b) suggestedhave been presentedand discussedby Beamish that a realisticconceptualmodel consistsof a 3Dand Travassos(1992a, b).Those studiesdemon- thinsheetover an Earth in which the layer pa-stratedthat static distortion, producingparallel rametersvary sufficiently slowly (laterally) that aoffsets, is asignificant featureof all the sounding 1D interpretationof the static correcteddata isdatacollectedin this basalt-covered environment, valid downto a certainminimumfrequency (aboutNo additional survey information was collected 0.1Hz). Thisform of conceptualmodel hasbeenwith regardto the control of statics,anda num- discussedpreviouslyby Jones(1988)for MT databer of correction schemes,as applied to this acquiredacrossa sedimentarybasin.At frequen-survey, have been discussedby Beamish and ciesbetween0.1 and 0.01 Hz, where departuresTravassos(1992b). The preferred method in- from the conceptualmodel become significant,volves a combinationof spatial averagingand a effectivepenetrationsrangefrom 2000 to 5000 m.parametricconstraint(auniform resistivityof the This suggests thatthe 1D assumptionwill onlybasalt ‘layer’), togetherwith phase-onlydata in- introducesignificanterrorsin termsof basementversion. Theseproceduresprovide estimatesof structure.the frequency-independentgain factors for bothcomponents,which are then usedto correct themeasuredapparentresistivity data. The result of 4. Paranábasin:datamodellingapplying these proceduresare the ‘static-cor-rected’ soundingdata in the xy and yx compo- In termsof basin stratigraphy,it is importantnents. to establishthe ‘correct’ numberof layerswhen
D. Beamish, J.M. Trauassos /Physics of the Earth and Planetary Interiors 81 (1993) Z-276 265
1D layered modelling is used for interpretation. In the case of the Clevelandia data, all the sound- ings can be adequately represented by a four-layer model (Beamish and Travassos, 1992b). The data resolve three main units above the electrical basement. The upper (resistive) unit corresponds to the flood basalts, and the entire Palaeozoic sedimentary sequence is then represented by two layers, the lower of which is a highly conducting
(about 1 R m) formation. The underlying (resis- tive) half-space, at a depth of about 3 km, con- forms to the electrical, seismic (e.g. Fig. la> and geological (e.g. Fig. 2) basement.
It is now accepted that smooth, minimum- structure models offer a number of advantages over conventional, layered-model construction schemes (Oldenburg, 19901. In smooth model construction, the number of interfaces need not
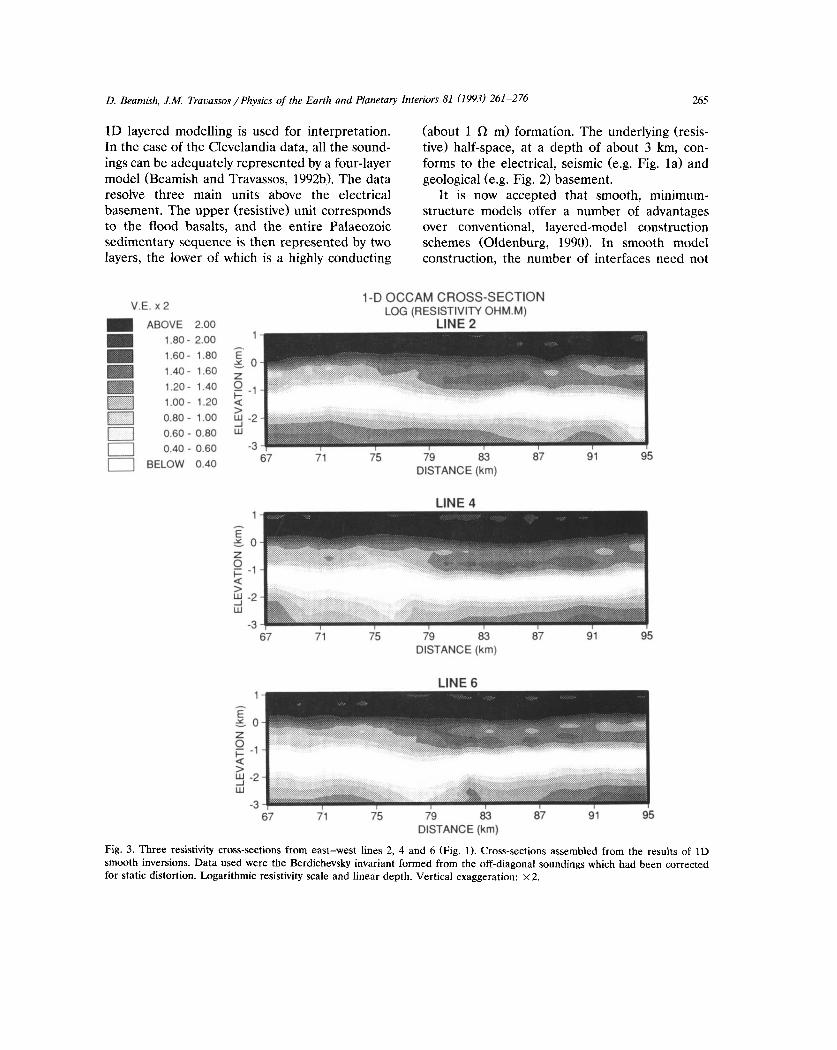
V.E. x 2 1 -D OCCAM CROSS-SECTION
m ABOVE 2.00 LOG (RESISTIVITY 0HM.M)
LINE 2 II 1.80- 2.00
; 0.40 0.60 - - 0.80 0.60 ( BELOW 0.40 67 71 75 79 83 87 91 95
DISTANCE (km)
LINE 4 1
z SO
5 F -1
5 y -2 . . ) :::. :...:;;,:~,..:.:.: . . . . ::,., : . . .:. : ,,, ..::..;.:;; W
-3 67 71 75 79 83 87 91 95
DISTANCE (km)
LINE 6
79 83 DISTANCE (km)
87 91 95
Fig. 3. Three resistivity cross-sections from east-west lines 2, 4 and 6 (Fig. 1). Cross-sections assembled from the results of 1D
smooth inversions. Data used were the Berdichevsky invariant formed from the off-diagonal soundings which had been corrected for static distortion. Logarithmic resistivity scale and linear depth. Vertical exaggeration: x2.

266 D. Beamish,f.M Travassos/PhysicsoftheEarth and Planetary Interiors81 (1993)261—2 76
I I I I
a)
4-BRAZIL o’,-~- ~ I ÷8AS~N+
4. + - 2°
,‘ /~ \~,‘ ~. ,.1~,
+ .L.~—————~ ~ JURUA SUB-BASIN ~ 4°- ~
_‘~__1.-~ ~
.~ND ~, ,~ ~
68~ + ~ ~mOkm 62°
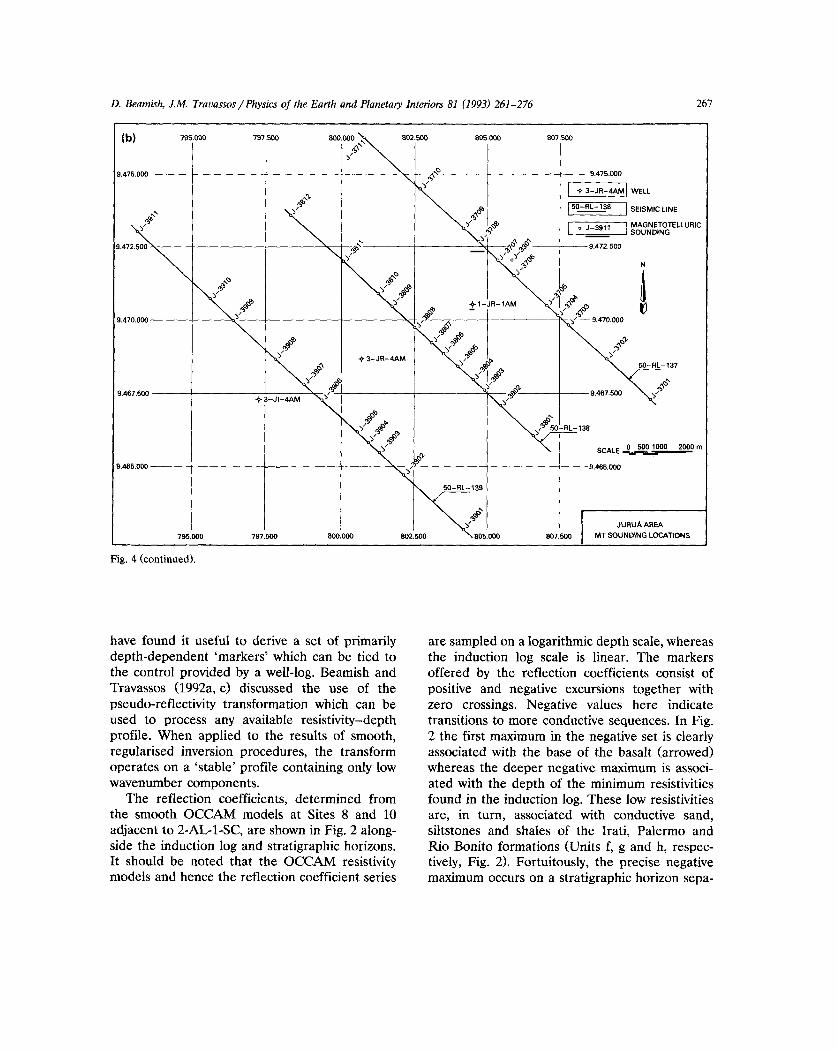
Fig. 4. Surveylocation,Solimhesbasin.Diagram(a) showsmain sub-basinswithin theSolimhesbasin(Brazil, 1990).The locationofthe MT surveywithin the Juruásub-basinis shownarrowed.Diagram(b) shows Profiles 50-RL-137,50-RL-i38 and50-RL-i39,with both MT measurements andseismicreflection data. Locationsof Wells i-JR-lAM, 3-JR-4AMand3-JI-4AM arealsoshown.
be predefined,and the resultingmodelsappear the mappedareaof Fig. 3 (28 km x 10 k.m). Themore stable and less susceptible to parameter upper sedimentaryunit displays an east—westequivalencing when cross-sections are con- variation in resistivity that is spatiallyconsistentstructed.1D smoothOCCAM inversion (Consta- acrossthe threeprofiles. The minimum resistivi-ble et a!., 1987) was applied to the Berdichevsky tieswhich can only be associatedwith a seriesofinvariant data (formed from the two static cor- formations(seebelow)are mappedas primarily arectedcomponents) andsolutionswere obtained horizontalunit in the eastbut with implied sub-at an r.m.s. misfit of 1.3 for all soundings.The horizontalcomponentsof dip at eastingsless thansmoothmodelsincorporate30 layersper decade 81 km. Any ‘structure’ at basementdepths(eleva-of depth. tions less than —2 km) implied by the resistivity
Resistivity cross-sections,obtained by assem- variations mustbe treated with caution becausebling the smooth inversion models,acrossthree of the limitationsof thepresent1D assessment.east—westprofiles, each containing14 soundings,are shown in Fig. 3. With referenceto Fig. ib,Line 2 usesthe data from Sites 30—43, Line 4usesthe data from Sites58—71 and Line 6 uses 5. ParanIbasin:well-log controlthe datafrom Sites72—85.We emphasisethat theresults in Fig. 3 are propertycross-sections,and Resistivitycross-sectionssuch asthoseof Fig.structural(e.g.stratigraphic)horizonscanonly be 3, whetherthe resultof 1D or 2D modelling, areinferredusingwell-logcontrol. Theresistivebasalt anattemptto imageresistivity anddepthsimulta-cover is clearlyof highly uniform thicknessacross neously.For stratigraphicmappingpurposes we
D. Beamish,f.M Travassos/Physicsof theEarth and PlanetaryInteriors 81(1993) 261—276 267
(b) 795.000 797 500 800.000 ‘~\ 802 500 806 000 807 500
;~~\\\
1.475.000 ~9.475.000
+3—JR—4AM! WELLN ____
N. ~ 50—RL—138 SEISMIC LINE
‘N N. ~ J3911
r.472.50’~N.ç~~— .___TN.\ ~ N~ —9.472.500
N + ___
~ 4? ~ ./‘50_RL—138
0 500 1000 2000 mSCALE —~—....~—————
9.485.000 —9.465.000
50—RL--138
4?JURUA AREA
795.000 797.500 800.000 802.500 805.000 807.500 MTSOUNDINGLOCATIONS
Fig. 4 (continued).
havefound it useful to derive a set of primarily aresampledon alogarithmicdepthscale,whereasdepth-dependent‘markers’which can be tied to the induction log scale is linear. The markersthe control provided by a well-log. Beamishand offered by the reflection coefficients consistofTravassos(1992a, c) discussedthe use of the positive and negative excursionstogetherwithpseudo-reflectivitytransformationwhich can be zero crossings. Negative values here indicateused to processany available resistivity—depth transitionsto moreconductivesequences.In Fig.profile. When applied to the results of smooth, 2 the first maximum in the negativeset is clearlyregularisedinversion procedures, thetransform associatedwith the baseof the basalt(arrowed)operateson a ‘stable’ profile containingonly low whereasthe deepernegativemaximum is associ-wavenumbercomponents. atedwith the depthof the minimum resistivities
The reflection coefficients, determinedfrom found in the induction log. Theselow resistivitiesthe smoothOCCAM models at Sites 8 and 10 are, in turn, associatedwith conductive sand,adjacentto 2-AL-i-SC, areshownin Fig. 2 along- siltstonesand shalesof the Irati, Palermo andside the induction log andstratigraphichorizons. Rio Bonito formations(Units f, g andh, respec-It shouldbe noted that the OCCAM resistivity tively, Fig. 2). Fortuitously, the precisenegativemodels andhence thereflectioncoefficient series maximumoccurson astratigraphichorizonsepa-
268 D. Beamish,J.M Travassos/Physicsof the Earth and PlanetaryInteriors 81(1993)261—276
rating the Irati and Palermo formations. The carbon potential.The second (seismic-based)transition to resistive basementis indicatedby campaign,launchedin 1975,culminated withthethe final transitionto positivevalues, discoveryin 1978 of commercialquantitiesof gas
The useof reflectioncoefficientsfor cross-see- in the Juruá Trend, and further evolution oftional mappingwas discussedfurtherby Beamish researchactivities led to the discoveryin 1986 ofand Travassos(1992c),where further interpreta- oil in the UrucuTrend (Brazil, 1990).tion of the Clevelandiadatacan also be found. Located in the central part of the basin, theInspectionof theinductionlogs from anumberof Juruáprovinceis associatedwith theJuruástruc-distributed exploration wells also indicates that tural lineament,a tectonic featurecomposedofthe bulk featuresof the resistivityprofile of Fig. 2 asymmetrical anticlines associatedwith reversearerepeatedin many areas.The reflectioncoeffi- faults. In 1982, MT data were acquired alongcients shown in Fig.2 thereforeprobably repre- three profiles with associatedseismic reflectionsent the maximum achievablevertical resolution data(Fig. 4b). The dataconsideredareagainonlyacross majorpartsof this extensivearea,in which the off-diagonalelementsof the soundingsin theexplorationis still continuing, geographicnorth—south(xy) andeast—west(yx)
components. Thesurvey area, with an almostuniform elevationof about 80 m, containsthree
6. Sotimôesbasin:background explorationwells (3-JI-4AM, 3-JR-4AM and 1-JR-lAM), as shown in Fig. 4b.The inductionlogs
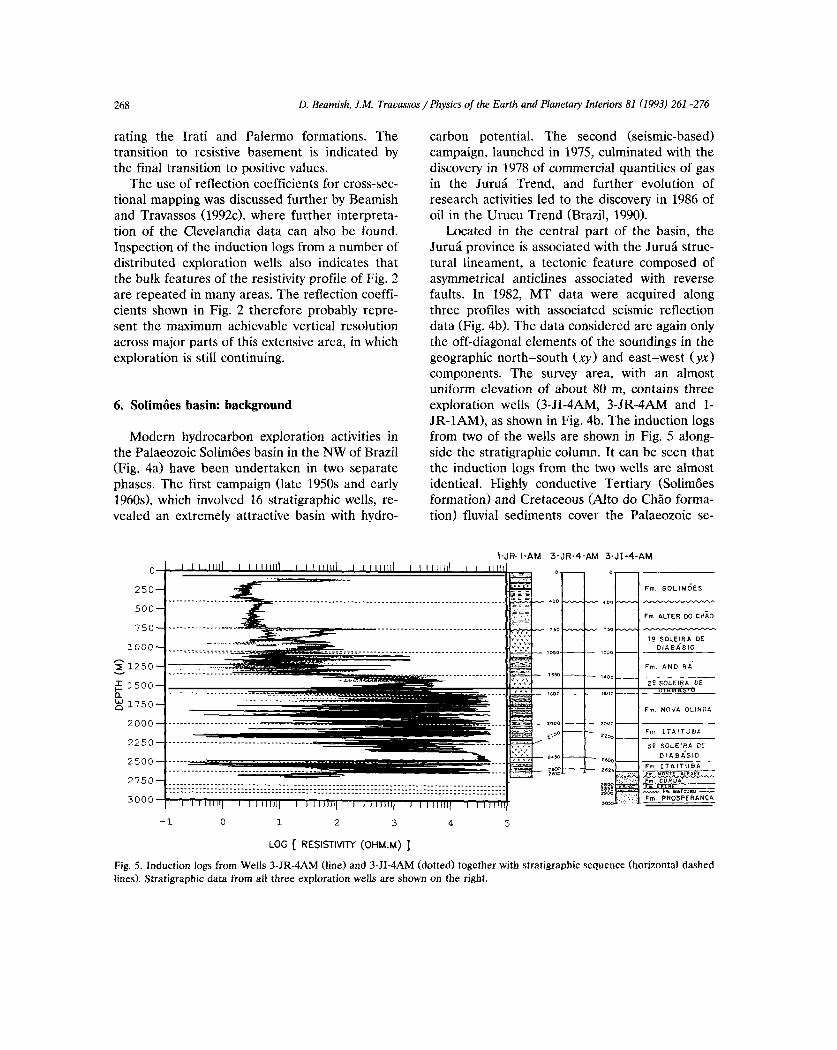
Modern hydrocarbon explorationactivities in from two of the wells are shownin Fig. 5 along-thePalaeozoicSolimôesbasinin theNW of Brazil side the stratigraphiccolumn. It canbe seenthat(Fig. 4a) havebeen undertakenin two separate the induction logs from the two wells are almostphases.The first campaign(late 1950sand early identical. Highly conductiveTertiary (Solimôes1960s),which involved 16 stratigraphicwells, re- formation) andCretaceous(Alto do Chãoforma-vealedan extremely attractive basinwith hydro- tion) fluvial sedimentscover the Palaeozoicse-
1-JR- 1-AM 3-JR-4-AM 3-Jl-4-AM
0— I I 1111111 I I 1111111 I 11111111 I I 1111111 11111111 I 1111111 ... — _______________
250— Frr~. SOLIM5ES
5_~.._—*oo .——..500— -
F,,, ALTER 00 CHAO750 ~r,-~-. .~—.— ,,,~ ,~
., :fl~ 12 SOLEIRA DE1000— — ________ D~ABASIO
_ ; II~~--~1250— s—.s-!Jfl Ii F,,, ANDIRA
I 1500— — — 29 SOLEIRACEDIABA0IO
w1750_0 F,,. NOVA OLiN3A
2000 — . 2000 — — 2000 — —
0 — — En,. ITAITUBA
2250— :.~.: 30 SOLEIRA CE
2500— ‘~- :~:-:~2~O—~~ DIABASIC
• --•- j:: — — 222~ ______________275 — ______________~ ___________
CC3000— ~.~ Fr,,. psospERANcoI 11111111 I IIIIIIJ~ I I IlIIII~ I IIIII~l~ I 11111111 I 11111 00~1
—1 0 1 2 3 4 5
LOG ( RESISTIVITY (OHM.M)
Fig. 5. Induction logs from Wells 3-JR-4AM (line)and3-JI-4AM (dotted) togetherwith stratigraphicsequence(horizontaldashedlines). Stratigraphic datafrom all threeexplorationwells areshown onthe right.

D. Beamish,IM Travassos/Physicsof theEarth and PlanetaryInteriors 81 (1993)261—276 269
quence,providinga coverthicknessof 750 m. The Fig.6), only subtlevariationsin responsecharac-sedimentsare intrudedby threemassivediabase teristicsareobserved.sills aboveDevonian marineshales(Prosperança To examine absolutevariations, andstatic off-formation)which are gas prone. The interpreted sets, the anisotropy ratios and associatedphaseseismicsectionalong Profile50-RL-138is shown differences betweenthe xy and yx componentsin Fig. 6, and indicatesa high-anglereversefault for the11 sitesalongProfile 50-RL-139areshownoverhangingan anticlinalbasementstructure.The in Fig. 8. Significantparallelbehaviourin appar-directionof the threeprofiles (N42°W;Fig. 4b) is ent resistivity between the two componentsisalmostperpendicularto the direction of inverse observedat all sitesdownto a frequencyof aboutfaulting (N30°E)found in the study area. 0.1 Hz. Acrossthe same bandwidthphasediffer-
encesare generallyless than 12°.Although theactual offsets, asmonitored by the anisotropy
7. Juruáprovince:datacharacteristics ratios,amountto absolutevaluesof lessthan two(in apparentresistivity), they appearto be stable
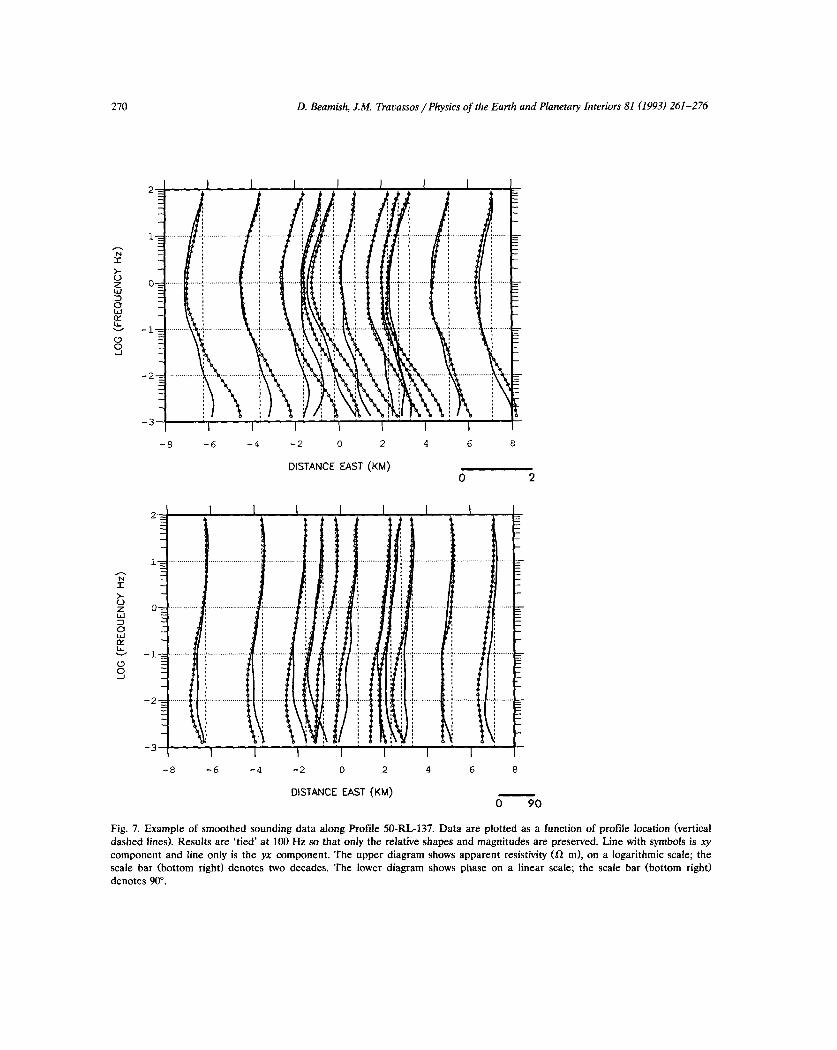
Soundingdata in both componentsalong Pro- functionsof frequency andtherefore aresignifi-file 50-RL-137are shown in cross-sectionalform cant.In summary,the datacharacteristicsof thein Fig. 7. (The dataalong the other two profiles Juruá survey appear to require at least a 2Dare similar in form.) The data displayedin this analysiswith allowancefor small (of the order offigure are smoothed versions of the original less than two) superimposedstatic contributions.soundingdataand each soundingis ‘tied’ at thehighest frequency(100 Hz) to the site location.Curves are scaledidentically acrossthe profile 8. Juruáprovince:vertical resolutionbut only the relative shapes andmagnitudesofthe soundingdataaredisplayed.Despitethe fact The main problem for MT resolution in thethat the profile must traversea knownfault (e.g. Juruáprovincestemsfrom the highly conducting
PROFILE50-RL-138
12 11 10 9 8 7 6 5 4 3 2
s.... - ~~-~-—___
TER~.~ ~
.5— ~CiA~EöUS~ -. ‘ -: -
~ I _
~ ~MONTE ALEGREI II -j ________________________15 ~ _____
~ . . . .
.
~ - ~0~ ____
2 -~-‘~. .
2.5—.,, - .. ..
Fig. 6. InterpretedseismicsectionalongProfileSO-RL-138.Numbers12—2 denotelocationsof the MT soundings.Sectionlength isclose to 10 km.
270 D. Beamish,J.M. Travassos/Physicsof theEarth and PlanetaryInteriors 81 (1993)261—276
~~816~~8
DISTANCE EAST (KM)0 2
:r I ...~‘T7. H.
~ 1614 ~ 8
DISTANCE EAST (KM)0 90
Fig. 7. Exampleof smoothedsoundingdata alongProfile 50-RL-137.Data are plotted as afunction of profile location (verticaldashedlines). Resultsare ‘tied’ at 100Hz so that only the relativeshapesand magnitudesare preserved.Line with symbolsis zycomponent andline only is the yx component.The upperdiagramshows apparentresistivity (fl m), on a logarithmic scale; thescale bar (bottom right) denotestwo decades.The lower diagramshows phaseon a linear scale; the scalebar (bottom right)denotes90°.

D. Beamish,f.M. Travassos/Physicsof the Earth and Planetary Interiors81(1993) 261—276 271
cover coupledwith the subsequentincreasingre- (Alto do Chãoformation). All subsequentstrati-sistivity of the deepersedimentsand intrusives graphic units,particularly the resistive diabase(Fig. 5). Using the induction log results,the up- sills, give rise to very small conductancevalues.per two formations provide integratedconduc- The complete ‘logged’ Palaeozoicsequenceonlytancesof 136 S (Solimôes formation) and 94 S contributesa combinedconductanceequivalent
2—= IZ ~.
1-~ .
= •
I -
>-Ciz - -Ui
oUi - • -
- . -
Cio : -- -
-2-
—3- —
0 1 2 3 4 5 6 7 8 9 10
ANISOTROPY RATIO
2— I
NI = . .i - . .
>-(J .
z - -Ui I • . .
o . .Ui - . .
- - . • -
o ~ .
o :- . .
-2-n • ...
—3— —
0 5 10 15 20
PHASE DIFFERENCE (DEG)
Fig. 8. The upperdiagram showsanisotropyratios~ /p~~)for the 11 soundings alongprofile 50-RL-139.The lower diagramshows the correspondingphase differencesbetweenthecomponents(4~—
272 D. Beamish,J.M Travassos7Physicsofthe Earth and PlanetaryInteriors 81 (1993)261—276
to some 15% of theconductive Tertiary and 9. Juruáprovince:2D modellingCretaceouscover.Thus,despitesome ofthe largeresistivity contraststhat exist at depth,the whole Despitethe very low order vertical resolution,Palaeozoic successionremains unresolvable in an examinationof the lateral influenceson thedetail. dataiswarranted.A simplified 2D forwardmodel,
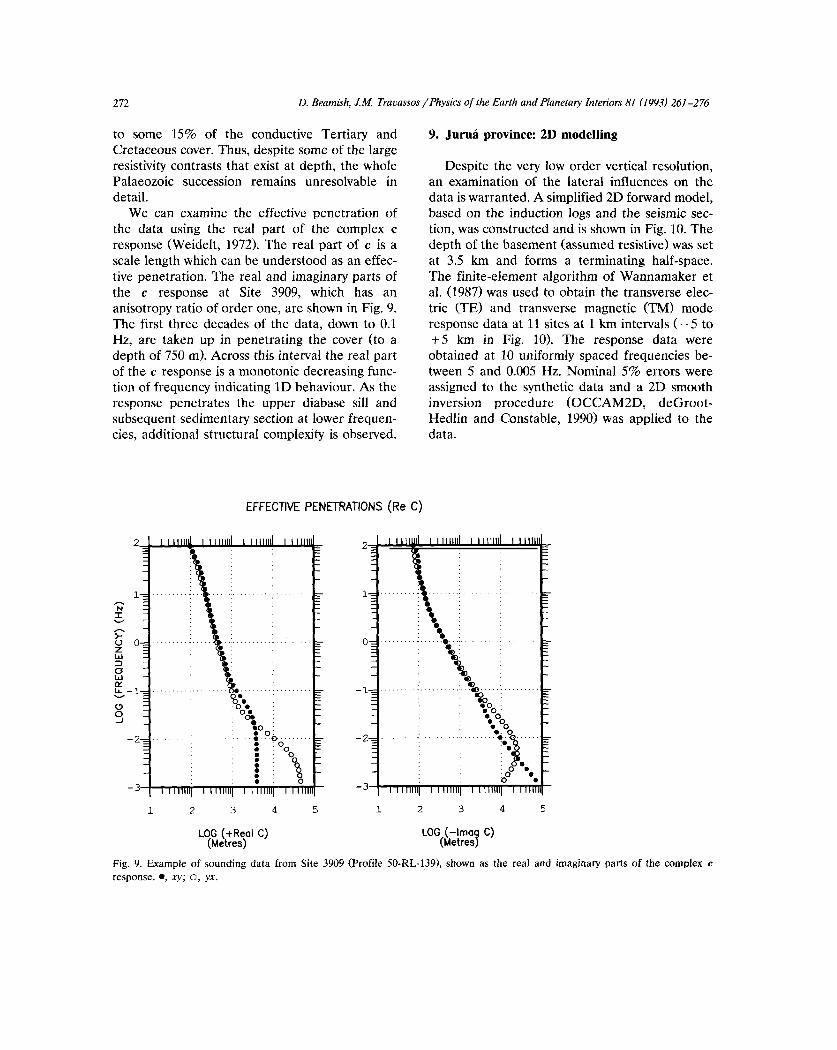
We can examinethe effective penetrationof basedon the induction logs and the seismicsee-the data using the real part of the complex c tion, wasconstructedandis shown in Fig.10. Theresponse(Weidelt, 1972). The real partof c is a depthof the basement(assumedresistive)was setscalelength whichcanbe understoodasan effec- at 3.5 km and forms a terminating half-space.tive penetration.The realandimaginarypartsof The finite-elementalgorithmof Wannamakeretthe c response at Site 3909, which has an al. (1987) wasusedto obtain the transverseelec-anisotropyratio of orderone,areshown in Fig.9. tric (TE) and transversemagnetic (TM) modeThe first threedecadesof the data, down to 0.1 responsedataat 11 sitesat 1 km intervals(—5 toHz, are takenup in penetratingthe cover (to a + 5 km in Fig. 10). The responsedata weredepthof 750 m). Acrossthis interval thereal part obtainedat 10 uniformly spacedfrequenciesbe-of the c responseis a monotonicdecreasingfunc- tween5 and 0.005 Hz. Nominal 5% errorsweretion of frequencyindicating 1D behaviour.As the assignedto the syntheticdata and a 2D smoothresponsepenetratesthe upper diabasesill and inversion procedure (OCCAM2D, deGroot-subsequentsedimentarysectionat lower frequen- Hedlin andConstable,1990) was applied to thecies, additionalstructuralcomplexity isobserved, data.
EFFECTIVE PENETRATIONS (Re C)
2.... I I IIIII~ I 11111111 I 11111111 I lIlt’ — 2— I III II I 11111111 11111111 111111
. :i.!00000\ 1 1
I 11111111 I 11111111 I 11111111 II III — I 11111111 11111111 11111111
1 2 3 4 5 1 2 3 4 5
LOG (+ReoI C) LOG (—Imog C)(Metres) (Metres)
Fig. 9. Example of soundingdatafrom Site 3909(Profile 50-RL-139),shown as the real andimaginary partsof the complexcresponse.•,.Ey; 0, yx.
D. Beamish,f.M Travassos/Physicsof theEarth and PlanetaryInteriors 81(1993)261—276 273
40(1.60) _______ I ii
~3- 5011.70) ~ ~
-
: ABOVE - 2.60 -1 ____ __________2.20- 2.40 -22.00 - 2.201.80-2.00
~ 1.60- 1.80 ~ -3
~ 1.40- 1.60 ~~ 1.20- 1.40~ 1.00- 1.20
LIII 0.80- 1.00~ 0.60-0.80
5I I I I I I
~ BELOW 0.60 ~ -4 -3 -2 DISTANCE (km) 2 3 4 5
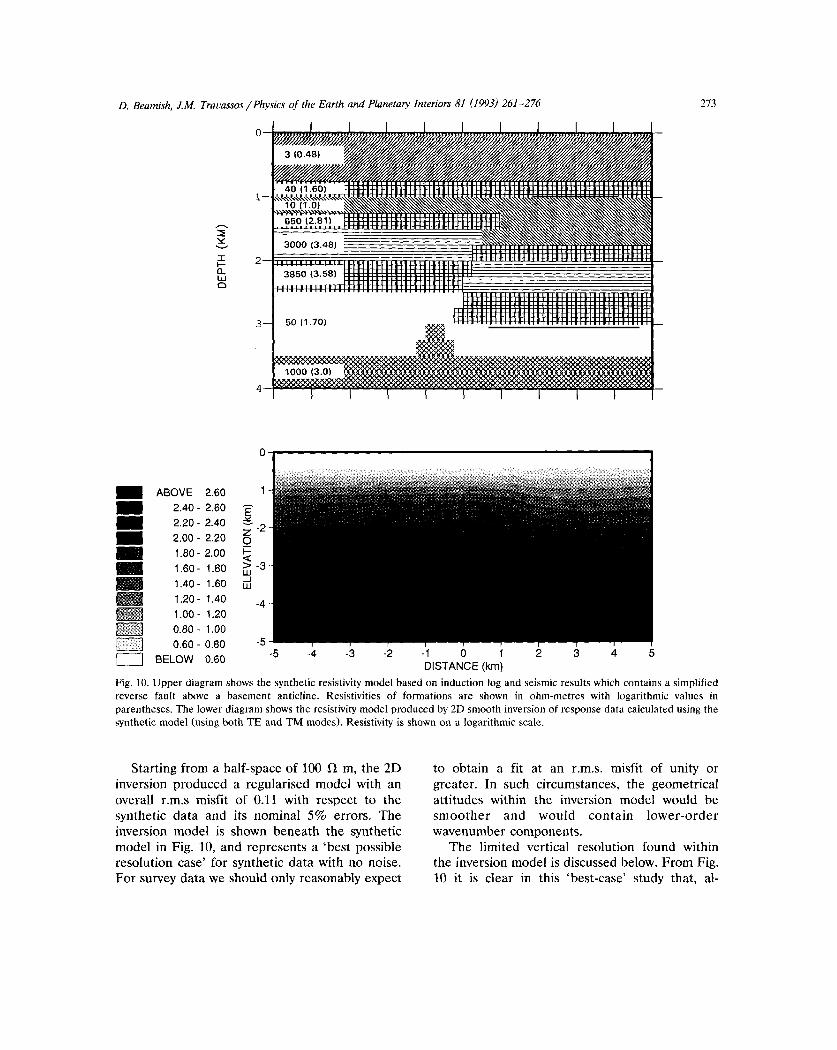
Fig. 10. Upperdiagramshowsthe syntheticresistivitymodel basedon induction log and seismicresultswhich containsa simplifiedreverse fault above a basement anticline.Resistivities of formations are shown in ohm-metres with logarithmic values inparentheses.The lower diagramshows theresistivitymodelproducedby 2D smoothinversionof response datacalculatedusingthesyntheticmodel (using both TE andTM modes).Resistivityis shownon a logarithmicscale.
Startingfrom a half-spaceof 100 fI m, the 2D to obtain a fit at an r.m.s. misfit ofunity orinversion produceda regularisedmodel with an greater. In such circumstances,the geometricaloverall r.m.s misfit of 0.11 with respectto the attitudeswithin the inversion model would besynthetic data and its nominal 5% errors. The smoother and would contain lower-orderinversion model is shown beneaththe synthetic wavenumber components.model in Fig. 10, and representsa ‘best possible Thelimited vertical resolution found withinresolution case’ for syntheticdatawith no noise. the inversionmodelis discussedbelow.FromFig.For surveydataweshouldonly reasonably expect 10 it is clear in this ‘best-case’ study that, al-
274 D. Beamish,f.M Travassos/Physicsof the Earth and Planetary Interiors81(1993)261—276
ABOVE 1.60 ~ -31.40- 1.60 i:d1.20- 1.401.00- 1.20
~ 0.80 - 1.00~ 0.60-0.80 -5’ I I I
‘I -5 -4 -3 -2 -1DISTANCE (km)
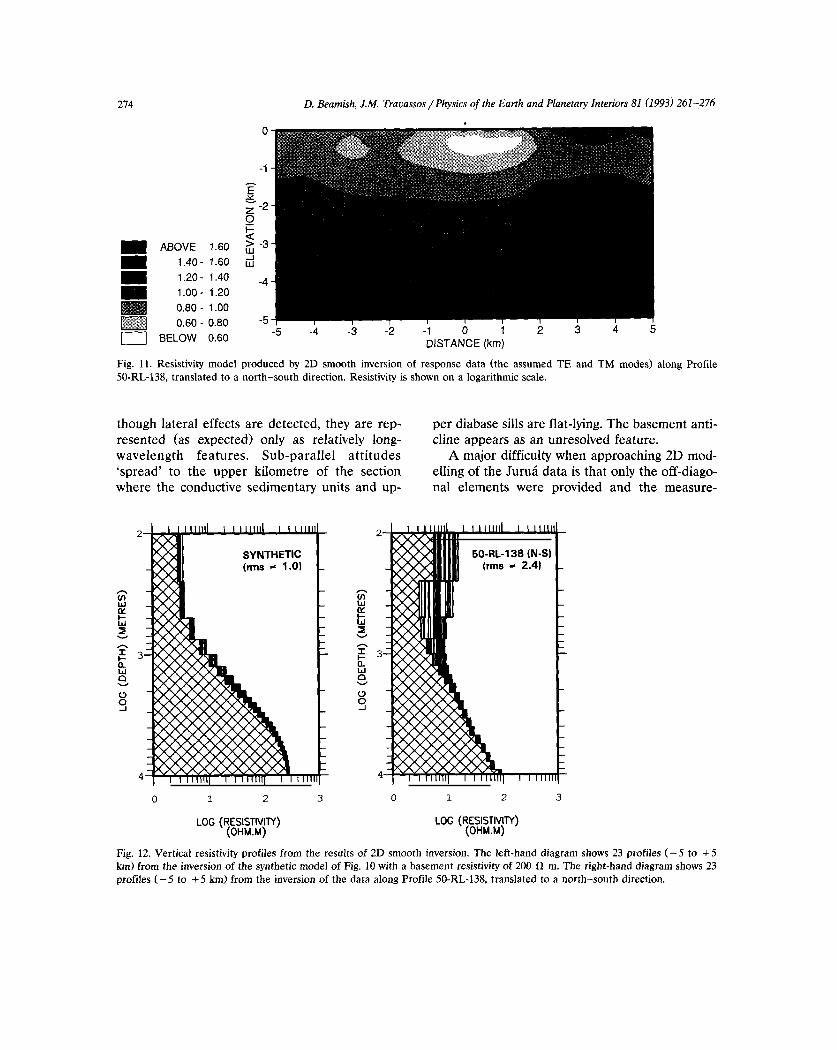
Fig. 11. Resistivity modelproducedby 2D smoothinversion of response data(the assumedTE and TM modes)along Profile50-RL-138,translatedto a north—southdirection, Resistivity isshownon alogarithmicscale.
thoughlateral effectsare detected,they are rep- perdiabasesills are flat-lying. The basementanti-resented (asexpected)only as relatively long- dine appearsasan unresolvedfeature.wavelength features. Sub-parallelattitudes A major difficulty whenapproaching2D mod-‘spread’ to the upperkilometre of the section elling of the Juruádatais that onlytheoff-diago-where the conductivesedimentaryunits and up- nal elements were providedand the measure-
2— 1(11111 I tiitiiil tIIIII’_ 2’— I I I ititittl I Iltill —
SYNTHETIC 50-RL-138 (N-SI(rms 1.0) . - (rms = 2.4) -
(I)w . . Ui - -
I,- . . ~- -Ui Ui -
13.. -
0. 0.Ui Uio 0
C, . 0 - -
o 0-
I 11111 I Itt 111th I I Iii
0 1 2 3 0 1 2 3
LOG (RESISTIVITY) LOG (RESISTIVITY)(OHM.M) (OHM.M)
Fig. 12. Vertical resistivityprofiles from the resultsof 2D smoothinversion.The left-handdiagramshows 23 profiles (—5 to + 5km)from theinversionof the syntheticmodel of Fig. 10 with a basementresistivityof 200 fl m. The right-handdiagramshows 23profiles (—5 to *5 km) from theinversionof thedata alongProfile 50-RL-138,translatedto a north—southdirection.
D. Beamish,f.M Travassos/Physicsof the Earth and PlanetaryInteriors 81 (1993) 261—276 275
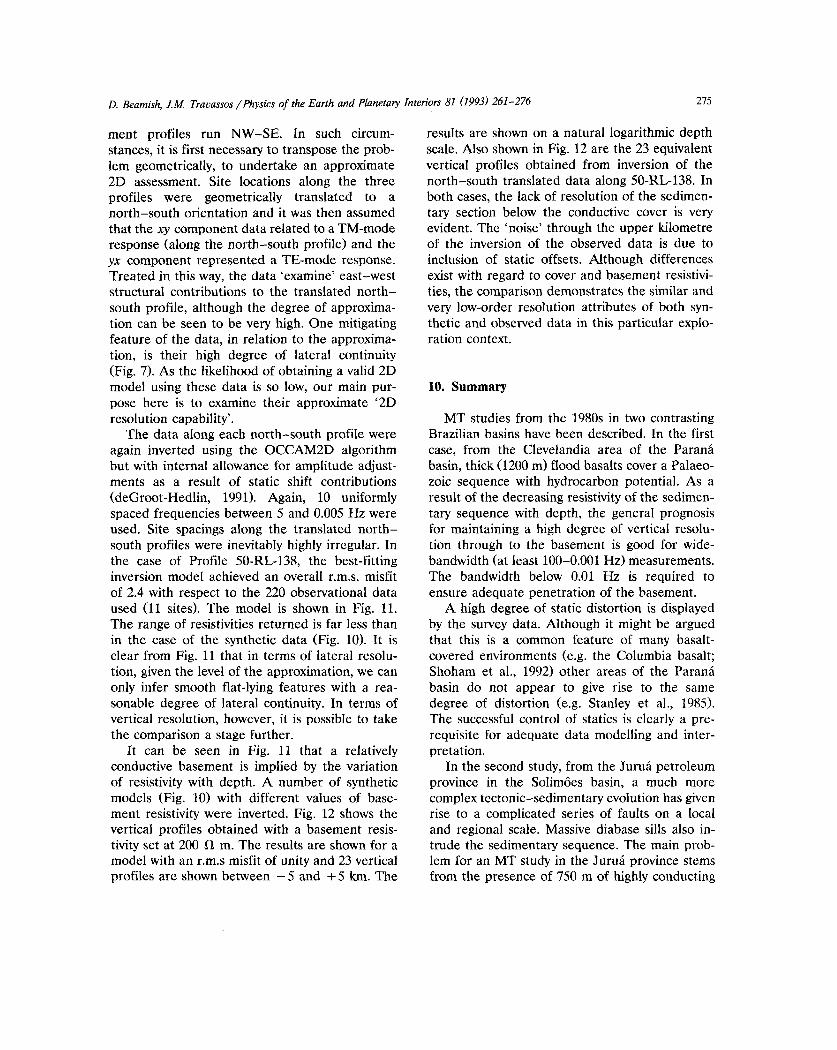
ment profiles run NW—SE. In such circum- resultsareshown on anaturallogarithmic depthstances,it is first necessaryto transposetheprob- scale.Also shownin Fig. 12 are the23 equivalentlem geometrically,to undertakean approximate vertical profiles obtained from inversion of the2D assessment. Sitelocations along the three north—southtranslateddataalong50-RL-138. Inprofiles were geometrically translated to a bothcases,the lackof resolution of the sedimen-north—southorientationandit was thenassumed tarysection below the conductivecover is verythat thexy componentdatarelatedto a TM-mode evident. The‘noise’ throughthe upperkilometreresponse(alongthe north—southprofile) andthe of the inversion of the observeddata is due toyx componentrepresenteda TE-mode response. inclusion of static offsets. Although differencesTreatedin this way, the data‘examine’ east—west exist with regardto coverandbasementresistivi-structuralcontributions to the translatednorth— ties, the comparisondemonstratesthesimilar andsouthprofile, althoughthe degreeof approxima- very low-order resolutionattributesof both syn-tion canbe seento bevery high. One mitigating thetic andobserveddatain this particularexplo-featureof the data, in relation to the approxima- ration context.tion, is their high degreeof lateral continuity(Fig. 7). As the likelihood of obtaininga valid 2Dmodel usingthesedata is so low, our main pur- 10. Summarypose here is to examinetheir approximate‘2Dresolutioncapability’. MT studiesfrom the 1980sin two contrasting
Thedataalong eachnorth—southprofile were Brazilianbasinshavebeendescribed.In the firstagain inverted using the OCCAM2D algorithm case, fromthe Clevelandiaarea of the Paranábutwith internalallowancefor amplitude adjust- basin,thick (1200 m) flood basaltscover aPalaeo-ments as a result of static shift contributions zoic sequencewith hydrocarbon potential.As a(deGroot-Hedlin, 1991). Again, 10 uniformly resultof the decreasingresistivity of the sedimen-spacedfrequencies between5 and0.005Hz were tary sequencewith depth, thegeneralprognosisused.Site spacingsalong the translatednorth— for maintaininga high degreeof vertical resolu-southprofiles were inevitably highly irregular.In tion through to the basementis good for wide-the case of Profile 50-RL-138, the best-fitting bandwidth(at least100—0.001Hz)measurements.inversion model achievedan overall r.m.s. misfit The bandwidth below 0.01 Hz is required toof 2.4 with respectto the 220 observationaldata ensureadequatepenetrationof the basement.used (11 sites).The model is shown in Fig. 11. A high degreeof static distortion is displayedThe rangeof resistivitiesreturnedis far less than by the survey data. Although it might be arguedin the caseof the synthetic data (Fig. 10). It is that this is a common featureof many basalt-clear from Fig. 11 that in terms of lateralresolu- coveredenvironments(e.g. the Columbiabasalt;tion, given the level of the approximation,we can Shohamet al., 1992) other areasof the Paranáonly infer smooth flat-lying featureswith a rea- basin do not appearto give rise to the samesonabledegreeof lateral continuity. In termsof degreeof distortion (e.g. Stanley et al.,1985).vertical resolution,however,it is possibleto take The successfulcontrol of statics isclearly a pre-the comparisona stage further. requisite foradequatedatamodelling and inter-
It can be seen in Fig. 11 that a relatively pretation.conductivebasementis implied by the variation In thesecondstudy, from the Juruápetroleumof resistivity with depth. A numberof synthetic province in the Solimôes basin, a much moremodels (Fig. 10) with different values of base- complextectonic—sedimentaryevolutionhas givenment resistivitywere inverted.Fig. 12 shows the rise to a complicatedseriesof faults on a localvertical profiles obtainedwith a basementresis- and regionalscale. Massivediabasesills also in-tivity set at 200 fl m. The resultsareshownfor a trudethe sedimentarysequence.The main prob-model with anr.m.s misfit of unity and23 vertical lem for an MT studyin the Juruáprovincestemsprofiles areshownbetween—5 and + 5 km. The from the presenceof 750 m of highly conducting
276 D. Beamish,IM. Travassos/Physicsof theEarthand PlanetaryInteriors 81 (1993)261—276
fluvial sedimentsthat cover the Palaeozoicsedi- removalfrom magnetotelluric data.J. App). Geophys.,29:
ments. In effect, MT dataappear‘blind’ to the 157178.Beamish, D. and Travassos,J.M., 1992c. Magnetotelluric
detail of the Palaeozoicsequenceandassociatedimagingof basalt-coveredsediments.First Break, 10: 345—
intrusives. Even in casesof low-order verticalresolution, an examinationof lateral influences Brazil, I.R., 1990. SolimôesBasin: oil potential and explo-
on profile datais not precluded.Approximate2D ration perspectives—northernBrazil. Bol. Geociênc.data inversion and synthetic modelling studies Petrobrás,4: 85—93.
Constable, S.C., Parker, R.L. and Constable, C.G., 1987.indicate that only highly accurate (1%) tensor Occam’s inversion: apractical algorithm for generating
dataare likely to detectthe reversefaults typical smooth modelsfrom electromagnetic sounding data.Geo-
of the area. physics,52: 289—300.deGroot-Hedlin,C., 1991. Removalof static shift in two-di-
mensionsby regularisedinversion.Geophysics,56: 2102—2106.
Acknowledgements deGroot-Hedlin,C. and Constable,C., 1990. Occam’s inver-sion to generatesmooth, two-dimensionalmodels frommagnetotelluric data.Geophysics,55: 1613—1624.
We thank Dr. F. Nepomucencoof Petrobrás Jones,AG., 1988. Staticshift of magnetotelluricdata anditsResearchCenter for supporting thiswork. We removal in a sedimentarybasinenvironment.Geophysics,
arealso verygrateful to SteveConstable,Cather- 53: 967—978.
me deGroot-Hedlin,GastonFischer,Bob Parker Milani, E.J., Kinoshita, EM., AraCijo, L.M. and da Cruz
and Phil Wannamaker,whose algorithm codes Cunha,P.R., 1990. ParanáBasin: petroleumpotential inthe depocenterarea.Bol. Geociênc.Petrobrás,4: 21—34.
havebeenusedto model the data.We also thank Oldenburg, D., 1990. Inversion of electromagnetic data:an
the two refereesand editor (Alan Jones),whose overview of new techniques.Surv. Geophys.,11: 23 1—270.
careful scrutiny much improved the manuscript. Shoham,Y., Morrison, F. and Torres-Verdin,C., 1992. Elec-
This paper is publishedwith the approvalof the tromagneticmappingof electricalconductivitybeneaththe
Director,British GeologicalSurvey(NERC). Columbia basalt.54th Meeting,EAEG, Paris, ExpandedAbstracts,EAEG, The Netherlands,pp. 418—419.
Stanley, W.D., Saad,AR. andOhofugi, W., 1985. Regionalmagnetotelluric surveys in hydrocarbon exploration,ParanaBasin, Brazil. Bull. Am. Assoc. Pet, Geol., 69:References346—360.
Wannamaker,P.E., Stodt,J.A. and Rijo, L., 1987. A stableBeamish,D. andTravassos,J.M., 1992a.The useof the D~ finite element solution for two-dimensionalmagnetotel-
solution in magnetotelluricinterpretation. J. Appi. Geo- luric modelling. Geophys.J. R. Astron. Soc.,88: 277—296.phys.,29: 1—19. Weidelt, P., 1972. The inverseproblemof geomagneticinduc-
Beamish,D. andTravassos,J.M., 1992b.A studyof staticshift tion. Z. Geophys.,38: 257—289.
Copyright © 2022 FDOKUMEN