Results of magnetotelluric and gravimetric measurements in western Nicaragua, Central America
13
Geophys. J. Int. (1997) 128,647-658 Results of magnetotelluric and gravimetric measurements in western Nicaragua, Central America Sten-Ake Elming' and Thorkild Rasmussen2.* 'Department of Applied Geophysics, University of Luled, S-95187 Luled Sweden. E-mail: [email protected] 'Department of Solid Earth Physics, University of Uppsala, S-75122 Uppsala, Sweden Accepted 1996 November 1. Received 1996 October 14; in original form 1995 April 27 SUMMARY Magnetotelluric and gravity data have been collected within a ca. 170 km long traverse running from the Pacific coast of Nicaragua in the west to the Nicaraguan Highland in the east. This part of Nicaragua is characterized by sedimentary rocks of the Pacific Coastal Plain, separated from the Tertiary volcanic rocks of the Highland by the NW-SE-trending Nicaraguan Depression. 2-D interpretation of the magnetotelluric (MT) data, collected at 13 stations, indicates four regions of high electrical conductivity in addition to the conductive coastal region. Two of these are associated with conducting sediments and pyroclastics in the upper part of the crust. Two other conductive structures have been defined at depth around 20 km and the one best defined is located below the depression. From the distribution of seismic events, volcanic activity in the depression and the similarity in geophysical characteristics with areas such as the Rio Grande Rift, this conductor is interpreted as a melt layer or a complex of magma chambers. Models of the upper lithosphere, constrained by the MT model, vertical electrical sounding (VES) data, seismic data and densities, have been tested using gravity data. A model that passes this test shows a gradual thickening of the crust eastwards from the Pacific coast. An anomaly centred over the depression is interpreted to have its origin in a thinning of the crust. In this model the melt layer is situated on top of the bulge of the lower lithosphere. A change in the composition of the crust, from the Pacific Coastal Plain to the Highland, is indicated from the change in character of the MT response and from the density distribution in the gravity model. This may support the hypothesis that the Pacific region is an accreted terrane. MT and gravity data indicate a depth to a resistive and high-density basement in the depression of ca. 2 km. On the basis of this, the vertical setting in the depression is estimated to be of the order of 2.5 km. Key words: Central America, Chortis block, gravity, magnetotellurics, Nicaragua, Pacific Coastal Plain. INTRODUCTION Magnetotelluric (MT) and gravity studies have been performed as part of a regional geophysical and geological study of western Nicaragua. Data were collected within a transect running from the Pacific coast in the west, crossing the Nicaraguan Depression and ending in the Nicaraguan Highland (Fig. 1). Nicaragua forms the southern part of the Chortis block Mithin the Caribbean plate (Dengo 1985), which has a complex ;eological history based on the interaction with the North and 'Present address: Geological Survey of Sweden, Box 670, S-75128 Uppsala, Sweden. South American plates, the Farallon plate, and the Cocos and Nazca plates. The Cocos plate is being subducted beneath the Caribbean plate in a northeastward direction, and the associated trench is located some 100 km west of the Pacific coast of Nicaragua. Nicaragua is dominated by the Central American Highlands, which extend NW-SE through the country. The highlands (Fig. 1) are mainly composed of Tertiary to upper Cretaceous volcanic rocks, in the north superimposed on metamorphosed Palaeozoic and Mesozoic rock formations. At the Pacific coast, rocks of both sedimentary and volcanic origins with ages ranging from Pliocene to upper Cretaceous (McBirney & Williams 1965) are believed to have been deposited on a Nicoya Complex-type of basement (Parsons 8 1997 RAS 647
Transcript of Results of magnetotelluric and gravimetric measurements in western Nicaragua, Central America

Geophys. J . Int. (1997) 128,647-658
Results of magnetotelluric and gravimetric measurements in western Nicaragua, Central America
Sten-Ake Elming' and Thorkild Rasmussen2.* 'Department of Applied Geophysics, University of Luled, S-95187 Luled Sweden. E-mail: [email protected] 'Department of Solid Earth Physics, University of Uppsala, S-75122 Uppsala, Sweden
Accepted 1996 November 1. Received 1996 October 14; in original form 1995 April 27
SUMMARY Magnetotelluric and gravity data have been collected within a ca. 170 km long traverse running from the Pacific coast of Nicaragua in the west to the Nicaraguan Highland in the east. This part of Nicaragua is characterized by sedimentary rocks of the Pacific Coastal Plain, separated from the Tertiary volcanic rocks of the Highland by the NW-SE-trending Nicaraguan Depression. 2-D interpretation of the magnetotelluric (MT) data, collected at 13 stations, indicates four regions of high electrical conductivity in addition to the conductive coastal region. Two of these are associated with conducting sediments and pyroclastics in the upper part of the crust. Two other conductive structures have been defined at depth around 20 km and the one best defined is located below the depression. From the distribution of seismic events, volcanic activity in the depression and the similarity in geophysical characteristics with areas such as the Rio Grande Rift, this conductor is interpreted as a melt layer or a complex of magma chambers. Models of the upper lithosphere, constrained by the MT model, vertical electrical sounding (VES) data, seismic data and densities, have been tested using gravity data. A model that passes this test shows a gradual thickening of the crust eastwards from the Pacific coast. An anomaly centred over the depression is interpreted to have its origin in a thinning of the crust. In this model the melt layer is situated on top of the bulge of the lower lithosphere. A change in the composition of the crust, from the Pacific Coastal Plain to the Highland, is indicated from the change in character of the MT response and from the density distribution in the gravity model. This may support the hypothesis that the Pacific region is an accreted terrane. MT and gravity data indicate a depth to a resistive and high-density basement in the depression of ca. 2 km. On the basis of this, the vertical setting in the depression is estimated to be of the order of 2.5 km.
Key words: Central America, Chortis block, gravity, magnetotellurics, Nicaragua, Pacific Coastal Plain.
INTRODUCTION
Magnetotelluric (MT) and gravity studies have been performed as part of a regional geophysical and geological study of western Nicaragua. Data were collected within a transect running from the Pacific coast in the west, crossing the Nicaraguan Depression and ending in the Nicaraguan Highland (Fig. 1).
Nicaragua forms the southern part of the Chortis block Mithin the Caribbean plate (Dengo 1985), which has a complex ;eological history based on the interaction with the North and
'Present address: Geological Survey of Sweden, Box 670, S-75128 Uppsala, Sweden.
South American plates, the Farallon plate, and the Cocos and Nazca plates. The Cocos plate is being subducted beneath the Caribbean plate in a northeastward direction, and the associated trench is located some 100 km west of the Pacific coast of Nicaragua.
Nicaragua is dominated by the Central American Highlands, which extend NW-SE through the country. The highlands (Fig. 1) are mainly composed of Tertiary to upper Cretaceous volcanic rocks, in the north superimposed on metamorphosed Palaeozoic and Mesozoic rock formations.
At the Pacific coast, rocks of both sedimentary and volcanic origins with ages ranging from Pliocene to upper Cretaceous (McBirney & Williams 1965) are believed to have been deposited on a Nicoya Complex-type of basement (Parsons
8 1997 RAS 647

648 S . - k Elming and T. Rasrnussen
13"
12"
1 1" 86" 85'
Alluvium
Recent volcanic rocks Pliocene-Pleis tocene volcanic rocks CoyolGroup - %=!- Matagalpa Group - ggEni Tertiary marine sedimentary rocks Paleozoic & Mesozoic rocks
Pliocene Tamarind0 - group Miocene
Volcano MT - stations VES surveys A-A'Gravlty and MT interpretation profile Normal Faults
Figure 1. Geological map of western Nicaragua. The locations of MT stations and VES surveys are marked with circles and crosses, respective1 The profile for gravity and MT interpretations is shown as a solid line
Corporation Report 1972). The relatively narrow strip of the Pacific Coastal Plain is separated from the Highlands by what has been defined as a half-graben (McBirney & Williams 1965), the Nicaraguan Depression. The age of the depression is unknown, but it might be related to the change in direction of subduction when the Farallon plate split into the COCOS and Nazca plates (Weinberg 1992) some 26 Myr ago (Handschumacher 1976). A chain of active volcanoes is located along the western margin of the depression, parallel to the trench. The depression is filled by products of Quaternary to Mio-Pliocene volcanism and Quaternary sediments.
Lead isotope studies in Nicaragua (Sundblad, Cumming & Krstic 1991) indicate a continental type of crust in the northeastern part of the Highlands and, at least in the north- west, the depression may be the surficial expression of the southwestern border of a deep-seated pre-Mesozoic basement. Geochemical data from volcanic rocks (Nystrom et al. 1988) show a trend of increasing crustal contamination and influence of a Palaeozoic basement towards the northeast. Palaeomagnetic studies of Tertiary to Upper Cretaceous vol- canic and sedimentary rocks (Elming 1992) indicate different tectonic histories for the Pacific region and the Highlands.
The purpose of this study is to provide electric conductivity and density constraints on geological crustal structures along the transect. This may then serve as a base for the under- standing of the tectonic evolution of this part of Central America. Questions to be answered are as follows.
(1) Is the Pacific coastal province an accreted terrane? (2) What is the character of the depression? Is this a
hidden contact between an accreted terrane and the continental Chortis block?
(3) If so, is there a different physical signature for the crust of the Pacific province compared to that of the Highlands?
MAGNETOTELLURIC MEASUREMENTS
Data collection
MT data have been collected at 13 sites, three of which are located in the Pacific Coastal Plain, five within the Nicaraguan
Depression and four in the Nicaraguan Highland (Fig. 1 Instrumentation and field procedure are similar to thos described in Rasmussen, Roberts & Pedersen (1987). Th frequency range is from 10 to 1/3600 Hz.
Response function estimation
In the frequency domain, the following linear relationshi exists between the horizontal electric field E = { E , E y } T , an1 the magnetic field intensity, H = {H,H,}T:
.=(::I ::I)H=ZH.
A similar linear relation is valid between the vertical magneti field intensity H , and the horizontal magnetic field component H , and H,:
H , = A H , + BH, . It is common practice to visualize the information containec in the impedance tensor Z in terms of two apparent resistivi? functions, pxy and p y x , and two phase functions, pxy and pyx these are defined as follows:
P x y = C1/(~Po~l l~x ,12>
P y x = ~ ~ / ~ ~ P o ~ l l ~ y x 1 2 ~
pry = arg(Z,,)?
p y x = ars(-zy,)> where o is the angular freqeuncy and p,, the magnetic permeability in a vacuum.
The impedance tensor and tipper functions and their randolr errors are estimated using a procedure described in Pederser (1982).
Characteristics of response functions
The data quality was sufficiently high to obtain estimates oj the response functions with reasonably low standard errors (less than 5 per cent on tensor off-diagonal amplitude) through- out most of the frequency range and for most of the sites.
0 1997 RAS, G J I 128, 647-658

M T and gravimetric measurements in western Nicaragua 649
However, estimates of the response function at periods around 1 s are usually of poor quality, and response functions at some stations show high standard errors corresponding to a high noise level in one of the electric components.
Analysis of the impedance tensor for information about the dimensionality of the electrical structure is essential for decisions about how to model the data. The method of Zhang, Roberts & Pedersen ( 1987) has been used to calculate regional strike estimates for all stations and the results are shown in Fig. 2. The strike, if any, is defined as that angle where the diagonal elements are proportional to the corresponding column off-diagonal ones. When no static shift is present, the proportionality factor is zero. A 90" ambiguity exists for these calculations. The estimates vary considerably with respect to both period and station. Thus, 3-D electrical structures are present. Some stations (A, D, E, F and H) have stable estimates around 55"NW for periods between 10 and 100s. The value 55"NW is in reasonably good agreement with the main trend of the surface geological structures (the Nicaraguan Depression), and suggests that this direction of strike is the preferred one for the modelling of the data 2-D structures. However, in attempting to model the data using a 2-D structure, it must be emphasized that 3-D indications are strong and probably bias the modelling results. Similarly, results based on a 1-D structure can be somewhat misleading.
The measured resistivity and phase responses obtained in the rotated coordinate system are shown in Fig. 3. For periods shorter than 10 s, the geometric average (ZxyZyx)1/2 is displayed (see discussion below on modelling). The two westernmost stations (A and B) in the Pacific Coastal Plain (Fig. 1) show monotonously increasing apparent resistivity with increasing period for the direction corresponding to H-polarization. In contrast, the stations C, D and G in the central part of the profile show distinct minima in their apparent resistivities around 2 s. Very low values (less than 1 R m) of the H-polarization apparent resistivities at periods around 300s for stations D and E indicate a conductive structure below these stations. The apparent resistivity values for the high-frequency part from these two stations are similar for both coordinate axes and suggest that severe problems with static shift are not present. A very different character of the response functions is observed for stations I, J, K, L and M in the Nicaraguan Highland. They display a distinct diffference in the apparent resistivity functions corresponding to the two coordinate axes.
Modelling
As mentioned previously, a well-defined strike of the structures is not present in the impedance tensors. Computational prob- lems as well as insufficient station coverage do not allow 3-D inversions, and approximations in modelling the data by 2-D structures are necessary. The choice of a strike of 55"NW is in agreement with the major trend of the surface geological structures and with strike estimates from some of the measured impedances. 2-D modelling is performed according to the procedure described in Rasmussen (1993), in which a slightly modified version of the 2-D Occam's inversion of deGroot- Hedlin & Constable (1990) is presented. The basic principle in Occam's inversion is to search for the smoothest model that reproduces the measured data to a prescribed tolerance level specified as the root mean square (rms) of the weighted data
residuals. A discussion on how to choose the tolerance levels is presented in detail in Rasmussen (1993) and will not be repeated here.
Due to limitations in computer memory, some data reduction was necessary prior to the inversion. In total, 27 frequencies were selected for inversion. Apparent resistivity and phase data calculated from the geometric average of the off-diagonal elements of the impedance tensor were used for periods shorter than 10s. For periods longer than lOs, the usual E- and H-polarization data are used in the inversion. The geometric average for the high-frequency data is used instead of the E- and H-polarization data as the widths of the regularization blocks are too large to allow a proper 2-D modelling of the structures. A homogeneous half-space was used as a starting model and a minimum possible rms misfit of 1.1 was obtained for the inversion. In order to avoid fitting to noise in the data, a final inversion with a prescribed tolerance level of 1.2 was used. The data are shown in Fig. 3.
In our model (Fig. 4a) five regions characterized by high electrical conductivity are observed. One of these, at the western end of the profile at coordinates less than 10 km, is associated with the presence of conductive sea water and conductive sediments. Further along the profile, at 25-45 km and 55-80 km conductive surface structures are observed. These conductive structures have their origin in the alluvial deposits and pyroclastics that fill the Nicaraguan Depression. The high-resistivity region around 50 km, separating the two conductive structures, is not considered resolved by the data. The resistive structure is either a result of fit to noise features in the data or due to the influence of 3-D structures in the data. Two conductive structures at depths of around 20 km can also be seen in the model. One of these is defined at five stations and is located below the depression, between 40 and 90 km along the profile. The other is found between 125 and 145 km; however, this structure is not as well defined as the other.
Overparametrization is important in Occam's inversion in order to seek smooth, well-fitting models. This inevitably results in a low resolution of the structures (see for example the discussion in Rasmussen 1993). In order to extract properties that are better resolved, it may be advantageous to visualize the model in terms of vertically integrated conductivity. Fig. 4( b) shows the vertically integrated conductivity as cumulative conductance values for a number of depth levels corresponding to some of the grid boundaries in the 2-D model. An average conductance value of about 1000s is indicated for the sediments in the Nicaraguan Depression, and the conductance of the mid-crustal structure below the depression is about 2000 s. The indicated conductor at mid- crustal depth might be confined to a somewhat thinner layer than seen in the 2-D Occam model. If we assume a resistivity of the conductive layer of 1 0 m and a constant value of the integrated conductivity, a thickness of 2 km is obtained for this layer.
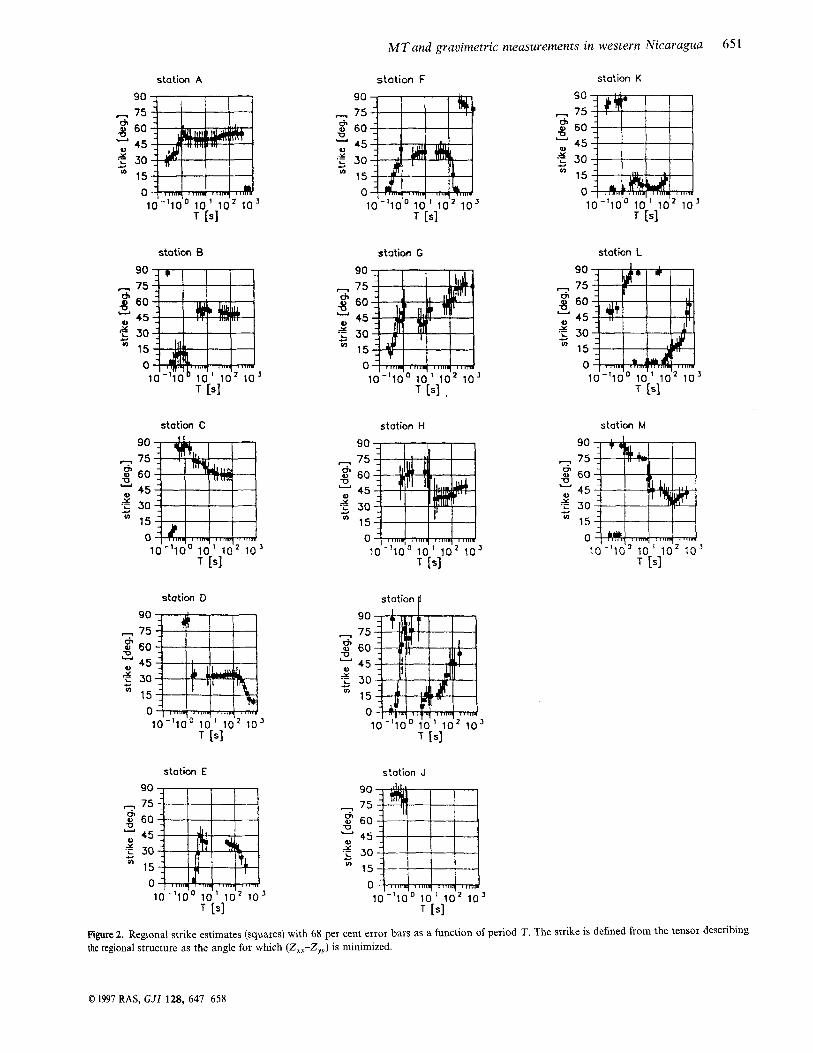
Interpretation in terms of layered 1-D models might give further information about the uppermost part of the crust. The 1-D inversion scheme described in Pedersen & Rasmussen (1989) was applied to apparent resistivity and phase data calculated from the determinant of the impedance tensor at Station F. The model shown in Fig. 5 includes two layers with low resistivity (40 R m and 2 R m) and thicknesses of 0.1 km and 2 km, respectively, in the upper part of the crust. The
8 1997 RAS, G J I 128, 647-658

650 S.-A. Elming and T. Rasmussen
conductance of the two layers is 945 S. These layers refer to alluvial deposits and pyroclastics in the depression for which a description in terms of a 1-D structure might be appropriate. However, the mid-crustal conductor indicated at a depth of ca. 13 km is not a good description of the deeper structures due to deviations from one-dimensionality for the longer periods.
GRAVIMETRIC MEASUREMENTS
Gravimetric data have been collected along a profile running from the Pacific Coast in the southwest to the Nicaraguan Highland in the northeast (Figs 1 and 6). The distance between the measuring stations is 1 km. Data have also been collected within a zone of ca. 25 km on both sides of the profile (Fig. 6). The measurements were performed using Worden and LaCoste & Romberg gravimeters and tied to the Latin American gravity reference standard network (LAGSN77, McConnell, Winter & Geller 1979).
The drift of the LaCoste & Romberg gravimeter was low and the data could be collected with an accuracy of ca. 0.3 gu. The drift of the Worden gravimeter was higher; however, by repeated base station readings a good control was obtained. The accuracy of the data collected with the Worden gravimeter was still not better than ca. 1 gu.
Altitudes were determined with a single barometer, which has a resolution of 1 m. The measurements were tied each hour to benchmarks separated some 20 km from each other. By repeated measurements of a number of stations the average error in the altitude determination was estimated at ca. 2 m; however, deviations of ca. 5 m may occur due to very local variations in air pressure. Using a Bouguer density of 2670 kg m-3, this means that the accuracy in the calculated Bouguer data is of the order of 10 gu.
Constraints on the gravity interpretations
Due to severe problems with non-uniqueness in the modelling of the gravity data, a priori information of structures and density distribution is of importance in order to limit the number of models that might explain the gravity data.
Geological data provide information about the lateral extents of the various rock formations, and measured densities (Lopez 1988; Gonzalez 1991; Ubieta 1995; Table la) combined with a knowledge of the average composition provide density estimates of the various formations in the upper part of the crust.
Densities of the deeper parts of the crust and the upper mantle are based on seismic velocities obtained from studies in western Nicaragua (Bazanov et al. 1985), offshore north- western Nicaragua (Shor & Fisher 1961; Victor 1976) and northern Central America (Kim, Matumoto & Latham 1982). From the relationship between compressional velocities and densities (Ludwig, Nafe & Drake 1970) an average density of the various parts of the crust can be estimated roughly (Table lb). This relation is based on experimental data on unconsolidated sediments, sedimentary, metamorphic and igneous rocks. At velocities in the range 6-8 km s-', obser- vations on velocities and densities of rocks at 10 kbar (Birch 1961; in Ludwig et al. 1970) are also included.
The densities of the middle and lower parts of the crust east of the trench are estimated at 2705 kg m-3 and 2900 kg m-3, respectively. The estimation of densities of the crust of central
Nicaragua (Table lb) refers to the three-layered crustal model of northern Central America that was presented by Kim et al. (1982). The total thickness of the crust in the model is 38 km, which serves as an important constraint on the gravity interpretation as it is not possible to define the thickness of the crust only on the basis of the estimated densities.
A geological model of the crust between the trench and the Pacific coast of Nicaragua was presented by Victor (1976). A simplified version of this model, which is based on seismic, gravity and magnetic data, and seismic data from the coastal region of the Pacific Coastal Plain (Bazanov et al. 1985), has been used to constrain our gravity interpretation.
The seismic reflection data indicate a thickness of ca. 5 km of sedimentary cover close to the coast of western Nicaragua (Bazanov et al. 1985). From the compressional velocities of the sedimentary rocks, densities are estimated and listed in Table l(b).
On the basis of seismic data from explosions and local earthquakes, Matumoto et al. (1977) defined the thickness of the fill in the western part of the Nicaraguan Depression as ca. 600m. The velocities of the two upper layers (2900 and 3600 m s-' respectively) are comparable to the velocities in the Miocene sediments in the Pacific coast (en. 3000 m s-'). In their model only the upper layer was defined as fill; however, the total thickness of the two layers is 1600m, which is comparable to the depth to a resistive basement (2 km) determined from MT data.
Large-scale vertical electrical soundings (VES) in the Nicaraguan Depression gave some information about the infill and depth of the depression (Nissen, Elming & Enstrom 1986). Below ca. 300 m of Quaternary and Pliocene-Pleistocene deposits, a highly conductive layer (2-3 R m), extending several hundred of metres in depth, was found. Due to the low resistivities it was not possible to penetrate deep enough to detect any highly resistive basement. It was concluded that, if a resistive basement exists, the depth of the top of this substratum must exceed 1 km.
The mean density of the sedimentary rocks and tuffs in the Pacific region is estimated at 2180 kg m-3 and that of the fill of the Nicaraguan Depression at 2120 kg m-3, with an error in the range of 100 kgm-3. These densities are low when compared with the density of the basement in the Pacific region (2705 kg m-3, Nicoya Complex-type?), basaltic- andesitic lava of the recent volcano and volcanic rocks of the Highlands (2700-2750 kg m-3). From this density distri- bution gravity lows in the Bouguer anomaly should be expected. Gravity lows are also observed at the Pacific coast (Figs 6 and 8) and in the depression, where a local minimum is superimposed on a positive anomaly.
INTEGRATIVE INTERPRETATION A N D DISCUSSION
The modelling of the gravity data has been performed with an interactive computer program modified from Enmark ( 1981). The models are '2.5-D, which means that the length along the strike of the models can be limited. A model based on gravity data cannot be proven to be the correct one but a model can always be rejected if it does not fit the measured data. To reduce the number of possible models, constraints can be added. However, it must be emphasized that we will still not
0 1997 RAS, GJI 128, 647-658
M T and gravimetric measurements in western Nicaragua 65 1
station A
90 - n 75
7 45 m U o 60
Y -c 30 * 15
0 1
..4
’
station B 90
n 75
y 45 60
.e 30 * 15
0 1
-u
Y .cI
station C
90 n 75
7 45 0,
U o 60
.C 30 * 15
0
Y e
station D 90
n 75
y 45 60
’D
Y ‘C 30 * 15
0
c
station E
station F station K 90
n 75
; 45 60
U
Y .c 30 cn 15
0 1
Y
station G
90 75 3 60 - 45
*z 30 15 0 1
0 Y
CI
station L
90 n 75
; 45 60 U
Y ‘i 30 Y
* 15 0 1 J
station H station M 90 90
o 60 60 75 n 75
; 45 ; 45 CT U
7
U
Y ‘L 30 1
‘r & 30 Y
* 15 * 15 0 0 1
station p
station J 90
n 75
y 45 CT U o) 60
‘c 30 * 15
0 1
Y c
90 75
o 60 - 45 .z 30 cn 15
0
7 rn
’D
0 Y
Y
lo-lloo 10 lo2 10’ T [.I
Figure 2. Regional strike estimates (squares) with 68 per cent error bars as a function of period T. The strike is defined from the tensor describing the regional structure as the angle for which (Zxx-Zyy) is minimized.
8 1997 RAS, GJI 128, 647-658

652 S . - 2 . Elming and T. Rasrnussen
1 u St A
5.0
4.0
3.0
2.0
1 a 0.0
-1.0 -1.0 OlO 1:0 2:0 310
90 -7 75 8 60 - 45
1 :: 0 -1.0 0.0 1.0 2.0 3.0
bg psriod C a 1
St. E
-1.0 0.0 1.0 2.0 3.0
log period [ a ]
st. c 5.0
4.0
3.0
2.0
1 .o 0.0
-1.0 -1.0 0.0 1.0 2.0 3.0
90 75 60 45 30 15 0 -1.0 0.0 1.0 2.0 3.0
bg period [ s ]
St. 0 St. E St. F
5.0 5.0 5.0
4.0 4.0 4.0
f 3.0 3.0 3.0 g 2.0 2.0 2.0
$ 1.0 1 .o 1 a n" 0.0 0.0 0.0
-1.0 -1.0 -1.0 -1.0 0.0 1.0 2.0 3.0 -1.0 0.0 1.0 2.0 3.0 -1.0 0.m 1.0 2.0 3.0
90
j ;: 1 ;: 45
0 -1.0 0.0 1.0 2.0 3.0
bs period C s I
90 75 60 45 30 15 0 -1.0 0.0 1.0 2.0 3.0
log period [ s ]
90 75 60 45 30 15 0 -1.0 0.0 1.0 2.0 3.0
log period [ a 3
St. G St. H St. I
5.0 5.0 5.0 a 4.0 4.0 4.0
3 3.0 3.0 3.0 g 2.0 2.0 2.0
g 1.0 1 .o 1 .o s" 0.0 0.0 0.0 0
-1.0 -1.0 -1.0
90 go 90 75 75 75
4 60 60 60 45 45 45 1 30 30 30 15 15 15 0 0 0
Y
log period [ s ] log period [ s 3 bag psriod [ s 3
Figure 3. Measured apparent resistivities and phases with bars showing the scaled error in the rotated coordinate system. The squares correspond to the direction 55"NW, which is defined as the direction of E-polarization for the 2-D modelling. The circles correspond to the direction of H-polarization. Diamonds represent the response calculated as the geometric average of the tensor off-diagonal elements. Filled symbols indicate data used in the 2-D Occam's inversion and the solid lines are the model responses.
reach a unique solution since profound ambiguities remain in conductivity, and any attempt to integrate results from other the interpretation. geophysical methods inevitably requires a discussion in terms
In particular, no simple and unique relations exist between of plausible geological environments. the various physical parameters, such as density and electrical In the interpretation presented here a density of
0 1997 RAS, G J I 128, 647-658
M T and gravimetric measurements in western Nicaragua 653
0.01
0.1
10
St. J
5.0
4.0
3.0
2.0
1 .o 0.0
-1.0 -1.0 0.0 1.0 2.0 3.0
I I ""q I .mm.
'
1'
rL
:
St H
5.0
4.0
3.0
2.0
1 .o 0.0
-1.0 -1.0 0.0 1.0 2.0 3.0
90 75
45 8 60 Y
1 :: 0 -1.0 0.0 1.0 2.0 3.0
bg period [ P 3
Figure 3. (Continued.)
SAN BENITO
St. K
5.0
4.0
3.0
2.0
1 .o 0.0
-1.0 -1.0 0.0 1.0 2.0 3.0
90 75 60 45 30 15 0
log period [ P ]
. I , . , , , , , I . . 1 1 1 1 I I , , , , . , , I . I " I . , , , .
-1 "100 Id1 l d 2 I d 3 period [ s ]
st. L
5.0
4.0
3.0
2.0
1 .o 0.0
-1.0
90 75 60 45 30 15 0 -1.0 0.0 1.0 2.0 3.0
bg PSGd c 1
period [ s ]
Figure 5. Determinant apparent resistivity and phase (circles) at Station F, with model responses (solid lines) from the best-fitting model with five layers.
%I 1997 RAS, GJI 128, 647-658

654 S.-A. Elming and T. Rasmussen
Figure 6. Bouguer anomaly map of the transect running from the Pacific coast to the Nicaraguan Highlands. The location of the interpretation profile is marked by the line A-A. The positions of the gravity stations are marked by crosses.
2670 kg m-3, corresponding to an average density of a continental upper crust, has been taken for the surrounding basement density.
For the interpretation of the positive anomaly of longer wavelength, with the maximum centred over the depression, a body of high density in the deeper part of the crust could be the source. Diapirism, active or passive, generated through the subduction may result in a thinning of the lithosphere in relation to the depression zone (Kraig 1974; Keary & Vine 1990). Kraig (1971) suggested that marginal basin extensions are the result of intrusion of basaltic mantle diapirs generated by partial melting at the top of the subducting lithosphere.
Other workers (e.g. Packham & Falvey 1971) have suggested the magma upwelling was passive and a result of other mechanisms that caused extensional stresses in the back-arc region. Whatever model of evolution is used, a thinning of the lithosphere and the crust in this back-arc region would result in a mass excess that depends on the ratio of the crust to mantle thinning.
The lower-crustal conductor, defined from the MT data, will in this model be situated on top of a bulge of the upper mantle. Within the type of geological environment characterizing the study area, enhanced values of electrical conductivity are usually explained either as due to ionic conductors in a
0 1997 RAS, GJI 128, 647-658

M T and gravimetric measurements in western Nicaragua 655
Table 1. (a) Mean densities (kg m-3) of rocks within the geotraverse, with standard deviations. References: 1: Lopez (1988); 2: this paper; 3: Ubieta (1995); 4: Gonzalez (1991). (b) Average density (kg m-3) of rocks estimated from seismic velocities.
(a) Age Formation/ Rock N / n Density Ref group
Pacific Coastal Plain Pleistocene/ Las Sierra Tuff 36/48 2046k 155 1 P 1 i o c e n e El Retiro Tuff 22/24 2185+125 1 Pliocene El Salto Sandstone 9/9 2119 k 144 2 ? Diorite 1/3 2762+ 10 2
Nicaraguan Highlands Pliocene/ El Coy01 Ashflows: Miocene Andesitic 11/22 2299 k 122 3
Basaltic 5/13 2493k 59 3 Dacitic 4/7 2380k 95 3 Basalt 9/35 2758+_ 49 3 Andesite 8/20 2735+ 29 3 Ignimbrite /25 2480k 90 4
(b) Geological province/rock/age
Pacific Coastal Plain
Average density (range)
Sedimentary rocks Pliocene Pliocene/Miocene Miocene/Eocene
1750 (1600-1900) 2100(1900-2300) 2230 (2100-2360)
Nicaraguan Depression
Holocence/Pliocene 2350(2200-2500)
Nicaraguan Highland
Middle part of the crust (8-23 km)
Tuffs, sediments, sedimentary rocks 2200(2100-2300)
Upper part of the crust (0-8 km) 2670(2500-2800) 2750(2600-2900)
Lower part of the crust (23-38 km) 2900(2700-3100)
hydrated crust or as due to the presence of melt fractions. Release of water into the basal crust, recycled by the subduction of wet sediments (e.g. Kurtz, deLaurier & Gupta 1986) is suggested as an explanation for the observations of high conductivity below Vancouver Island.
MT measurements from the Rio Grande define a good conductor at a depth of about 10 km (Jiracek, Rodi & Vanyan 1987), and from studies of magnetic variations a good conductor at a depth of 15-20 km was defined (Hermance & Neumann 1991). Other types of geophysical investigations in the Rio Grande Rift have also indicated an anomalous crust at a depth of 15-20km. Seismic studies revealed a sub- horizontal fluid-like reflector at a depth of 20 km (e.g. Olsen, Baldridge & Callender 1987). Furthermore, a sharp decrease in the number of seismic events at a depth of 11 km is observed, indicating an increase in the ductility of the crust (Sanford, Olsen & Jaksha 1979).
Seismic activity is also high in the Nicaraguan Depression and the number of seismic events decreases dramatically at depths below 20 km (Fig. 7). The 2-D MT interpretation indicates a conductor of large vertical (15-20 km) and hori- zontal (ca. 50 km) extent. However, this shape might be due at least partly to the method giving a smooth image of the resistivity distribution, and the conductor may be no more than 2 km thick and located at a depth of 20 km, if its resistivity is set at 1 t2 m.
On the basis of the MT and seismic data, the volcanic activity within the depression and the similarity with the
geophysical characteristics of the Rio Grande Rift, the good conductor in the lower crust is interpreted as a melt layer or a complex of several magma chambers.
Gravity model
A model of the upper 30km of the lithosphere, with the constraints mentioned above included, has been tested for a fit to the gravity data (Fig. 8).
The amplitudes of the residual anomalies, originating from the low-density deposits of the depression, are constrained by the MT-determined depth to basement. A gravity field that supports the constraints of amplitudes of local anomalies is achieved for a crustal thinning below the depression. The gently increasing thickness of the crust from the subduction region in the west is interrupted by this thinning of 2.5 to 5 km at a distance of 155 to 215 km from the trench. The thinning implies a mass excess due to the contrast in density (400 kg mL3) between the lower crust and upper mantle. The model of the melt layer is simplified and shown here as a fairly thin layer of basaltic-andesitic partial melt, with an estimated density of 2730 kg m-3, located on top of the bulge of the lower lithosphere. Depending on the thickness and density of the interpreted magma chamber, the amount of crustal thinning has to be adjusted to give a reasonable residual anomaly over the depression. Some 70 km east of the trench the thickness of the crust has been determined as 17 km (Shor & Fisher 1961), and in the present model this thickness increases to ca. 26 km at a distance of 260 km from the trench.
In the crustal model presented by Victor (1976), an upper- crystalline-basement density of 2600 kg m-3 was used. In our model such a density would be too low, not giving the density contrasts needed to explain the large amplitude anomalies in e.g. the Pacific Coastal Plain and the western part of the depression. Instead, a density of 2705 kg m-3 seems to be more appropriate, a density that is somewhat higher than expected from the seismic velocities of the upper part of the basement (4800-5080 m s- l ) . This density is also higher than that sug- gested for the Nicoya Complex (2600 kg m-3, Woodcock 1975) but very similar to the density (2700 kg m-3) of the upper part of the underthrusting oceanic plate.
From the coast of the Pacific the basement rises and forms an antiform with its crest some 16 km east of the coast. An antiform parallel to the trench is also defined from tectonic studies of Western Nicaragua (e.g. Weinberg 1992).
At 25 km from the coast the profile cuts the western edge of the depression. This is expressed by a pronounced local minimum in the gravity field, interpreted to have its origin in a down-faulted basement filled predominantly with volcanic ash flows (2120 kg m-3). The depth to the basement (ca. 2 km) is constrained by the MT data.
At ca. 45 km along the profile an active volcano is expressed by a positive anomaly. The lava (2745 kg m-3) is not restricted to the caldera but covers a larger area and constitutes the very upper part of the surface rocks ca. 20 km further to the east along the profile. The irregular shape of the Bouguer anomaly is explained by the density contrast between locally occurring ash flow deposits and lava.
The local gravity minimum related to the depression east of the volcano chain has its centre at ca. 70 km along the profile. The depth to the basement here (ca. 2 km) is also constrained by MT data. Tertiary volcanic rocks are exposed in the
0 1997 RAS, GJI 128, 647-658

656 X-A. Elming and T. Rasmussen
(km) -200 ,100 0 100 (km) . I
80
100
120 .
Figure 7. Depth distribution of hypocentres of earthquakes in the subduction zone west of Nicaragua and below the Nicaraguan Depression (Larsson & Mattson 1987). The distribution is based on 2564 records from the period between 1975 and 1982. Filled symbols denote the occurrence of many earthquakes on the same spot, while open symbols mark less reliable locations of hypocentres.
depression 100 km northwest of the study area and probably constitute the basement in the depression. Volcanic tuffs are interpreted to constitute a part of the filling of the depression (Nissen et al. 1986) from the VES data. Using a density corresponding to that of the tuffs for the fill, a good fit to the gravity data is obtained.
The positive anomaly east of the depression (at ca. 90 km) has its origin in lavas related to a Pliocene caldera. Further east the Bouguer gravity field undulates with only small amplitudes reflecting compositional variations of the volcanic rocks of the Highland.
The density structure of the deeper crust west of and below the Nicaraguan Depression is in this model different from that east of the depression. MT data from the Nicaraguan Highlands also reveal a different character of the response function when compared with data from the Pacific Coastal Plain. This may support the gravity model, indicating com- positional differences in the crust, that is, showing that the crust below and west of the depression does not have the same origin as that of central Nicaragua.
SUMMARY AND CONCLUSIONS
2-D modelling of the MT measurements has revealed four regions of high conductivity. Two of these regions are related to sedimentary rocks and volcanic deposits at the surface of the crust, while the other two have their source in the lower crust. The best defined of the deep-seated good conductors is located at a depth of ca. 20km below the Nicaraguan Depression. From the depth distribution of seismicity, the volcanic activity in the depression and the similarity in geo- physical characteristics with the Rio Grande Rift, this con- ductor is interpreted as a melt layer or a complex of several magma chambers.
Gravity data have been used to test models of the upper
lithosphere. The models are constrained by the MT model, seismic data, VES data, rock densities and geological infor- mation. A model that passes this test shows a gradual thicken- ing of the crust eastwards from the Pacific coast. The upper crust in the Pacific Coastal Plain is folded in an antiformal shape. An anomaly of longer Wavelength, centred over the depression, seems to have its origin in a thinning of the crust. The magma chamber in this model is situated on top of the interpreted bulge of the lower lithosphere.
East of the depression, the crust is assumed to be of continental composition, an assumption that is supported by lead isotope and to some extent by geochemical data. A change in the crustal composition from the Central American Highlands towards the depression is indicated by the change in character of the MT response function. In order to obtain a good fit to the gravity data, a density of the upper part of the crust in the Pacific Coastal Plain that is higher than that of the Highland seems necessary. This also indicates a change in the composition of the crust, which may support the hypothesis that the Pacific region is an accreted terrane and the Nicaraguan Depression is the hidden contact with the Central American Highlands.
From the MT and gravity data, the depth to a resitive and high-density basement in the depression is determined at ca. 2 km. If the high-conductivity fill of the depression is composed of alluvials and volcanic tuffs, as indicated by the estimated density, the vertical setting in the depression is in the order of at least 2.5 km.
ACKNOWLEDGMENTS
Dr P. Zhang, Ing. A. Enstrom and staff from the former Nicaraguan Ministry of Mines (INMINE) are gratefully acknowledged for their participation in fieldwork. Thanks are also due to M. Vnuk for drawing the figures. This work was
0 1997 RAS, GJI 128, 647-658

Y .- m
W
8 Y 3
*
-0
x > I .- .* c Y 3 -0
c
a
0 1997 RAS, G J I 128,647-658

M T and gravimetric measurements in western Nicaragua 651
0 1997 RAS, GJI 128, 647-658

658 S . - k Elming and T. Rasmussen
financially supported by the Swedish Association for Research Cooperation with Developing Countries (SAREC).
REFERENCES
Bazanov, E., Goriounov, G., Zioubko, A., Kamenev, S., Kachalov, Y. & Samodourov, V., 1985. Geologia y Potenticial Petrolifero y Gas$ero de Nicaragua, Tom0 1 y 2, Archivo de Petronic, Manaugua, Nicaragua.
deGroot-Hedlin, C. & Constable, S., 1990. Occam’s inversion to generate smooth two-dimensional models from magnetotelluric data. Geophysics, 55, 16 13- 1624.
Dengo, G., 1985. Mid America: Tectonic setting for the Pacific margin from southern Mexico to northwestern Columbia, in Ocean Basins and Margins, eds Nairn, A.E.M., Churkin, M. & Stehli, F.G., 5 , 123-180.
Elming, S.-A., 1992. A palaeomagnetic study of Tertiary-Cretaceous rocks in Nicaragua, Central America, 13th Caribbean Geological Conference, Cuba, p. 85 (abstract).
Enmark, T., 1981. A versatile interactive computer program for computation and automatic optimization of gravity models, Geoexplorution, 19, 47-66.
Gonzalez, G.A., 1991. Geological modelling based on gravity and magnetic measurements in the northern part of the Nicaraguan Depression, Licentiate thesis, Lulei University of Technology, Sweden.
Handshumacher, D.W., 1976. Post-Eocene plate tectonics of the eastern Pacific, in The Geophysics of the Pacific Ocean Basin and its Margin, eds Sutton, G.H., Manghani, M.H. & Moberly, R., Am. Geophys. Un., Geophys. Monogr., 19, 177-202.
Hermance, J.F. & Neumann, G.A., 1991. The Rio Grande rift: new electromagnetic constraints on the Socorro magma body, Phys. Earth planet. Inter., 66, 101-117.
Jiracek, G.R., Rodi, W.L. & Vanyan, L.L., 1987. Implications of magneto-telluric modeling for the deep crustal environment of the Rio Grande rift, Phys. Earth planet. Inter., 45, 179-192.
Keary, P. & Vine, F.J., 1990. Global Tectonics, Blackwell Scientific Publications, Oxford.
Kim, J.J., Matumoto, T. & Latham, G., 1982. A crustal section of northern Central America as inferred from wide-angle reflections from shallow earthquakes, Bull. seism. Soc. Am., 72, 925-940.
Kraig, D.E., 1971. Origin and development of marginal basins in the western Pacific, J. geophys. Res., 76, 2542-2561.
Kraig, D.E., 1974. Evolution of arc systems in the western Pacific, in An. Rev. Earth planet Sci., eds Donath, F.A., Stehli, F.G. & Wetherill, G.W., 2, 51-75.
Kurtz, R.D., delaurier, J.M. & Gupta, J.C., 1986. A magnetotelluric sounding across Vancover Island detects the subducting Juan de Fuca plate, Nature. 321, 596-599.
Larsson, T. & Mattson, C., 1987. Seismic hazard analysis in Nicaragua, M S thesis, Royal Univerisity of Technology, Department of soil and rock mechanics, Stockholm.
Lopez, M.H., 1988. Mediciones de parametros magneticos y densidad de formaciones Sierra media y El Retiro, INMINE-SAREC report, Managua 1988.
Ludwig, W.J., Nafe, J.E. & Drake, C.L., 1970. Seismic refraction, in
The Sea, pp. 53-84, ed. Maxwell, E.A., Vol. 4, Pt 1, Wiley Interscience, New York.
Matumoto, T., Ohtake, M., Latham, G. & Uniana, J., 1977. Crustal structure in southern Central America, Bull. seism. Soc. Am., 67,
McBirney, A.R. & Williams, H., 1965. Volcanic history of Nicaragua, University of California Publ. Geol. Sci., 55,
McConnell, R.K., Winter, P.J. & Geller, R.F., 1979. Latin American gravity standardization network, 1977, LAGSN77, Vol. 6, Earth Physics branch, Ottawa, Canada.
Nissen, J., Elming, S.-A. & Enstrom, 1986. Geoelectricd deep soundings in the Nicaraguan Depression zone, Swedish Geological Company, ID-nr: URAP 86005.
Nystrom, J.O., Levi, B., Troeng, B., Ehrenborg, J. & Carranza, G., 1988. Geochemistry of volcanic rocks in a traverse through Nicaragua, Rev. Geol. Amer. Central, 8, 77-109.
Olsen, K.H., Baldridge, W.S. & Callender, J.F., 1987. Rio Grande rift: an overview, in Continental Rifts-Principal and Regional Characteristics, eds Ramberg, I.B., Milanovsky, E.E. & Qvale, G., Tectonophysics, 143, 119-139.
Packham, G.H. & Falvey, D.L., 1971. A hypothesis for the formation of marginal seas in the Western Pacific, Tectonophysics, 11, 79-110.
Parsons Corporation Report, 1972. The geology of western Nicaragua, Nicaragua Tax Improvement and Natural Resources Inventory Project, final technical report 4.
Pedersen, L.B., 1982. The magnetotelluric impedance tensor-its random and bias errors, Geophys. Prospect., 30, 188-210.
Pedersen, L.B. & Rasmussen, T.M., 1989. Inversion of magnetotelluric data: a non-linear least-squares approach, Geophys. Prospect., 37,
Rasmussen, T.M., 1993. Two-dimensional Occam Model of COPROD2 Data-first order description of resolution and variance, J. Geomag. Geoelectr., 45, 1027-1037.
Rasmussen, T.M., Roberts, R.G. & Pedersen, L.B., 1987. Magnetotellurics along the Fennoscandian Long Range profile, Geophys. J. R . astr. Soc., 98, 799-810.
Sanford, A.R., Olsen, K.H. & Jaksha, L.H., 1979. Seismisity of the Rio Grande rift, in Rio Grande Rift: Tectonics and Magmatism, pp. 145-168, ed. Rieker, R.E., Am. Geophys. Un., Washington, DC.
Shor, G.G. & Fisher, R.L., 1961. Middle American Trench: Seismic Refraction Studies, Geol. SOC. Am. Bull., 72, 721-730.
Sundblad, K., Cumming, G.L. & Krstic, K., 1991. Lead isotropic evidence for the formation of epithermal gold quartz veins in the Chortis Block, Nicaragua, Economic Geology, 88, 944-959.
Ubieta, K., 1995. Geological structures at the southern edge of the Chortiz Crustal Block, Licentiate thesis, Lulei University of Technology, Sweden.
Victor, L., 1976. Structure of the continental margin of Central America from northern Nicaragua to northern Panama, MS thesis, Oregon State University, OR.
Weinberg, R., 1992. Neotectonic development of western Nicaragua, Tectonics, 11, 1010-1017.
Woodcock, S.F., 1975. Crustal structure of the Tehunatepec Ridge and adjacent continental margins of southwestern Mexico and western Guatemala, MS thesis, Oregon State University, OR.
Zhang, P., Roberts, R.G. & Pedersen, L.B., 1987. Magnetotelluric strike rules, Geophysics, 52, 267-278.
121- 134.
669-695.


![Consumo Energético, Rivas-Nicaragua [Subcuenca Gil Gonzalez]](https://static.fdokumen.com/doc/165x107/632535c285efe380f30695c2/consumo-energetico-rivas-nicaragua-subcuenca-gil-gonzalez.jpg)