Magnetostratigraphic Evidence from the Cold Creek Bar for Onset of Ice-Age Cataclysmic Floods in...
13
Magnetostratigraphic evidence from the Cold Creek bar for onset of ice-age cataclysmic floods in eastern Washington during the Early Pleistocene Christopher J. Pluhar a, * , Bruce N. Bjornstad b , Stephen P. Reidel b , Robert S. Coe a , Paul B. Nelson a a University of California, Earth Science Department, 1156 High St. Santa Cruz, CA 95064-1077, USA b Pacific Northwest National Laboratory, Applied Geology and Geochemistry (K6-81), P.O. Box 999, Richland, WA 99352, USA Received 2 March 2004 Available online 9 September 2005 Abstract This study provides a detailed magnetostratigraphy of sediments composing the Cold Creek cataclysmic flood bar in the Pasco Basin, Washington. Our interpretation suggests onset of Missoula floods or similar events prior to 1.1 myr, later than previously suggested by Bjornstad et al. [Bjornstad, B.N., Fecht, K.R., Pluhar, C.J., 2001. Long history of pre-Wisconsin, Ice Age cataclysmic floods: evidence from southeastern Washington State. Journal of Geology 109 (6), 695–713]. Nonetheless these data suggest that Channeled Scabland features formed over a much longer timespan than commonly cited, that continental ice sheets of the early Pleistocene reached as far south as those of the late Pleistocene, and that similar physiography existed in eastern Washington and perhaps Montana to both generate and route Missoula- flood-like events. This study adds paleomagnetic polarity results from 213 new samples of silts and sands derived from nine new drill cores penetrating the Cold Creek cataclysmic flood bar to our previous database of 53 samples from four boreholes, resulting in a much more robust and detailed magnetostratigraphy. Rock magnetic studies on these sediments show pure magnetite to be the predominant remanence- carrying magnetic mineral, ruling out widespread remagnetization by secondary mineralization. The magnetostratigraphy at eastern Cold Creek bar is characterized by a normal polarity interval bracketed by reversed polarities. Equating the normal zone with the Jaramillo subchron (0.99 –1.07 myr) affords the simplest correlation to the magnetic polarity timescale. Western Cold Creek bar was likely deposited during the Brunhes chron (0 – 0.78 myr) since it exhibits mainly normal polarities with only two thin reversed-polarity horizons that we interpret as magnetic excursions during the Brunhes. D 2005 University of Washington. All rights reserved. Keywords: Paleomagnetism; Magnetostratigraphy; Susceptibility; Hysteresis parameters; Hanford; Pasco Basin; Cold Creek bar; Missoula; Scabland; Cataclysmic flood; Jokulhlaup Introduction Since acceptance of the Missoula flood hypothesis for formation of eastern Washington’s Channeled Scabland (Bretz, 1930), study has focussed mainly on the scores of jokulhlaups now thought to have occurred during the last glacial (e.g., Waitt, 1985; Atwater, 1986; Smith, 1993; Steele, 1991; Clague et al., 2003; Benito and O’Connor, 2003; O’Connor and Baker, 1992; McDonald and Busacca, 1992). Several workers have also inferred, using paleo- magnetic polarity (e.g., McDonald and Busacca, 1988, 1992) and unpublished U/Th disequilibrium dating (sum- marized in Baker et al., 1991) that cataclysmic floods have occurred during the middle and early Pleistocene. These studies of pre-late-Pleistocene deposits are valuable first steps in working out the Quaternary chronology of cataclysmic floods in eastern Washington, but are limited by available surficial exposures and preservation of the geologic record in an inherently erosive environment. In this 0033-5894/$ - see front matter D 2005 University of Washington. All rights reserved. doi:10.1016/j.yqres.2005.06.011 * Corresponding author. Fax: +1 831 459 3074. E-mail address: [email protected] (C.J. Pluhar). Quaternary Research 65 (2006) 123 – 135 www.elsevier.com/locate/yqres
-
Upload
independent -
Category
Documents
-
view
1 -
download
0
Transcript of Magnetostratigraphic Evidence from the Cold Creek Bar for Onset of Ice-Age Cataclysmic Floods in...
www.elsevier.com/locate/yqres
Quaternary Research 6
Magnetostratigraphic evidence from the Cold Creek bar for onset
of ice-age cataclysmic floods in eastern Washington during
the Early Pleistocene
Christopher J. Pluhara,*, Bruce N. Bjornstadb, Stephen P. Reidelb,
Robert S. Coea, Paul B. Nelsona
aUniversity of California, Earth Science Department, 1156 High St. Santa Cruz, CA 95064-1077, USAbPacific Northwest National Laboratory, Applied Geology and Geochemistry (K6-81), P.O. Box 999, Richland, WA 99352, USA
Received 2 March 2004
Available online 9 September 2005
Abstract
This study provides a detailed magnetostratigraphy of sediments composing the Cold Creek cataclysmic flood bar in the Pasco Basin,
Washington. Our interpretation suggests onset of Missoula floods or similar events prior to 1.1 myr, later than previously suggested by
Bjornstad et al. [Bjornstad, B.N., Fecht, K.R., Pluhar, C.J., 2001. Long history of pre-Wisconsin, Ice Age cataclysmic floods: evidence from
southeastern Washington State. Journal of Geology 109 (6), 695–713]. Nonetheless these data suggest that Channeled Scabland features
formed over a much longer timespan than commonly cited, that continental ice sheets of the early Pleistocene reached as far south as those of
the late Pleistocene, and that similar physiography existed in eastern Washington and perhaps Montana to both generate and route Missoula-
flood-like events. This study adds paleomagnetic polarity results from 213 new samples of silts and sands derived from nine new drill cores
penetrating the Cold Creek cataclysmic flood bar to our previous database of 53 samples from four boreholes, resulting in a much more
robust and detailed magnetostratigraphy. Rock magnetic studies on these sediments show pure magnetite to be the predominant remanence-
carrying magnetic mineral, ruling out widespread remagnetization by secondary mineralization. The magnetostratigraphy at eastern Cold
Creek bar is characterized by a normal polarity interval bracketed by reversed polarities. Equating the normal zone with the Jaramillo
subchron (0.99–1.07 myr) affords the simplest correlation to the magnetic polarity timescale. Western Cold Creek bar was likely deposited
during the Brunhes chron (0–0.78 myr) since it exhibits mainly normal polarities with only two thin reversed-polarity horizons that we
interpret as magnetic excursions during the Brunhes.
D 2005 University of Washington. All rights reserved.
Keywords: Paleomagnetism; Magnetostratigraphy; Susceptibility; Hysteresis parameters; Hanford; Pasco Basin; Cold Creek bar; Missoula; Scabland;
Cataclysmic flood; Jokulhlaup
Introduction
Since acceptance of the Missoula flood hypothesis for
formation of eastern Washington’s Channeled Scabland
(Bretz, 1930), study has focussed mainly on the scores of
jokulhlaups now thought to have occurred during the last
glacial (e.g., Waitt, 1985; Atwater, 1986; Smith, 1993;
Steele, 1991; Clague et al., 2003; Benito and O’Connor,
0033-5894/$ - see front matter D 2005 University of Washington. All rights rese
doi:10.1016/j.yqres.2005.06.011
* Corresponding author. Fax: +1 831 459 3074.
E-mail address: [email protected] (C.J. Pluhar).
2003; O’Connor and Baker, 1992; McDonald and Busacca,
1992). Several workers have also inferred, using paleo-
magnetic polarity (e.g., McDonald and Busacca, 1988,
1992) and unpublished U/Th disequilibrium dating (sum-
marized in Baker et al., 1991) that cataclysmic floods have
occurred during the middle and early Pleistocene. These
studies of pre-late-Pleistocene deposits are valuable first
steps in working out the Quaternary chronology of
cataclysmic floods in eastern Washington, but are limited
by available surficial exposures and preservation of the
geologic record in an inherently erosive environment. In this
5 (2006) 123 – 135
rved.
C.J. Pluhar et al. / Quaternary Research 65 (2006) 123–135124
paper, we document the detailed paleomagnetic stratigraphy
of cataclysmic flood deposits in an area that contains one of
the most complete depositional records of Ice Age flooding,
the Cold Creek giant flood bar of the Pasco Basin. This
work builds upon our previous limited paleomagnetic
data (Bjornstad et al., 2001) as well as stratigraphic and
sedimentologic investigations of the last 50 yr at the
Hanford site (summarized in US DOE/RL 2002-39).
Extensive discussion of the latter is beyond the scope of
this paper, but the magnetostratigraphy presented here is
particularly useful because of the difficulties in stratigraphic
correlation and the seeming impossibility of providing age
constraints for the sands and gravels of the Cold Creek bar.
Geologic setting
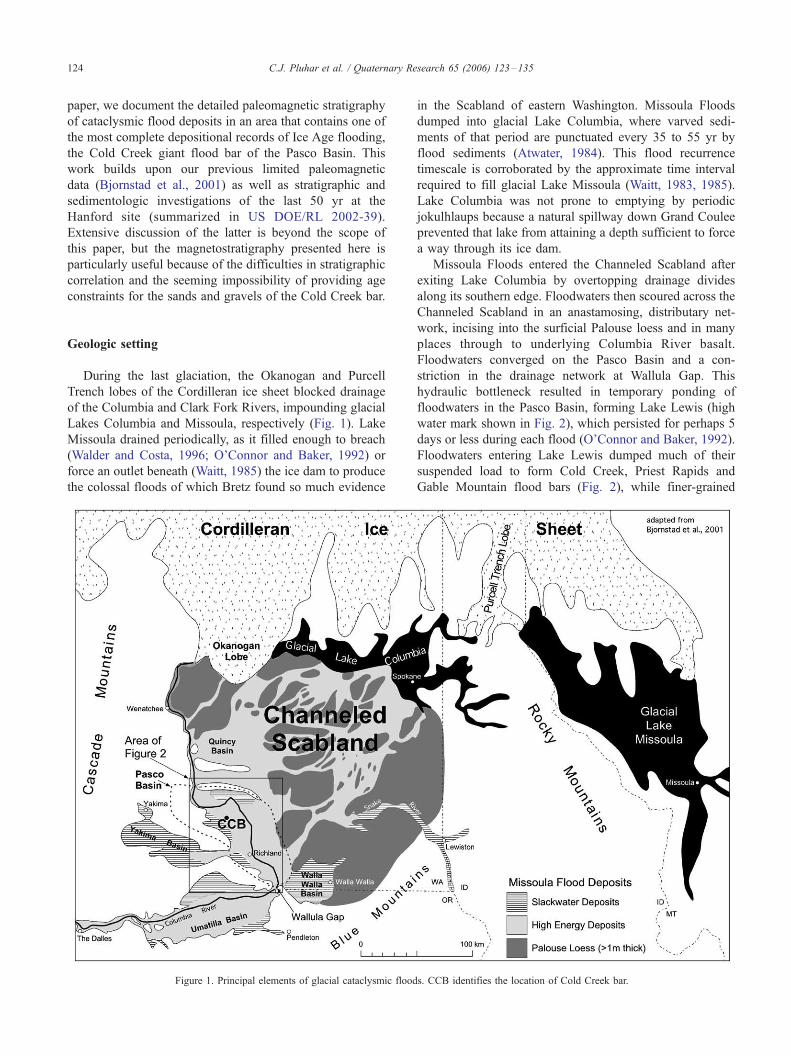
During the last glaciation, the Okanogan and Purcell
Trench lobes of the Cordilleran ice sheet blocked drainage
of the Columbia and Clark Fork Rivers, impounding glacial
Lakes Columbia and Missoula, respectively (Fig. 1). Lake
Missoula drained periodically, as it filled enough to breach
(Walder and Costa, 1996; O’Connor and Baker, 1992) or
force an outlet beneath (Waitt, 1985) the ice dam to produce
the colossal floods of which Bretz found so much evidence
Figure 1. Principal elements of glacial cataclysmic floods. CCB identifies the location of Cold Creek bar.
in the Scabland of eastern Washington. Missoula Floods
dumped into glacial Lake Columbia, where varved sedi-
ments of that period are punctuated every 35 to 55 yr by
flood sediments (Atwater, 1984). This flood recurrence
timescale is corroborated by the approximate time interval
required to fill glacial Lake Missoula (Waitt, 1983, 1985).
Lake Columbia was not prone to emptying by periodic
jokulhlaups because a natural spillway down Grand Coulee
prevented that lake from attaining a depth sufficient to force
a way through its ice dam.
Missoula Floods entered the Channeled Scabland after
exiting Lake Columbia by overtopping drainage divides
along its southern edge. Floodwaters then scoured across the
Channeled Scabland in an anastamosing, distributary net-
work, incising into the surficial Palouse loess and in many
places through to underlying Columbia River basalt.
Floodwaters converged on the Pasco Basin and a con-
striction in the drainage network at Wallula Gap. This
hydraulic bottleneck resulted in temporary ponding of
floodwaters in the Pasco Basin, forming Lake Lewis (high
water mark shown in Fig. 2), which persisted for perhaps 5
days or less during each flood (O’Connor and Baker, 1992).
Floodwaters entering Lake Lewis dumped much of their
suspended load to form Cold Creek, Priest Rapids and
Gable Mountain flood bars (Fig. 2), while finer-grained
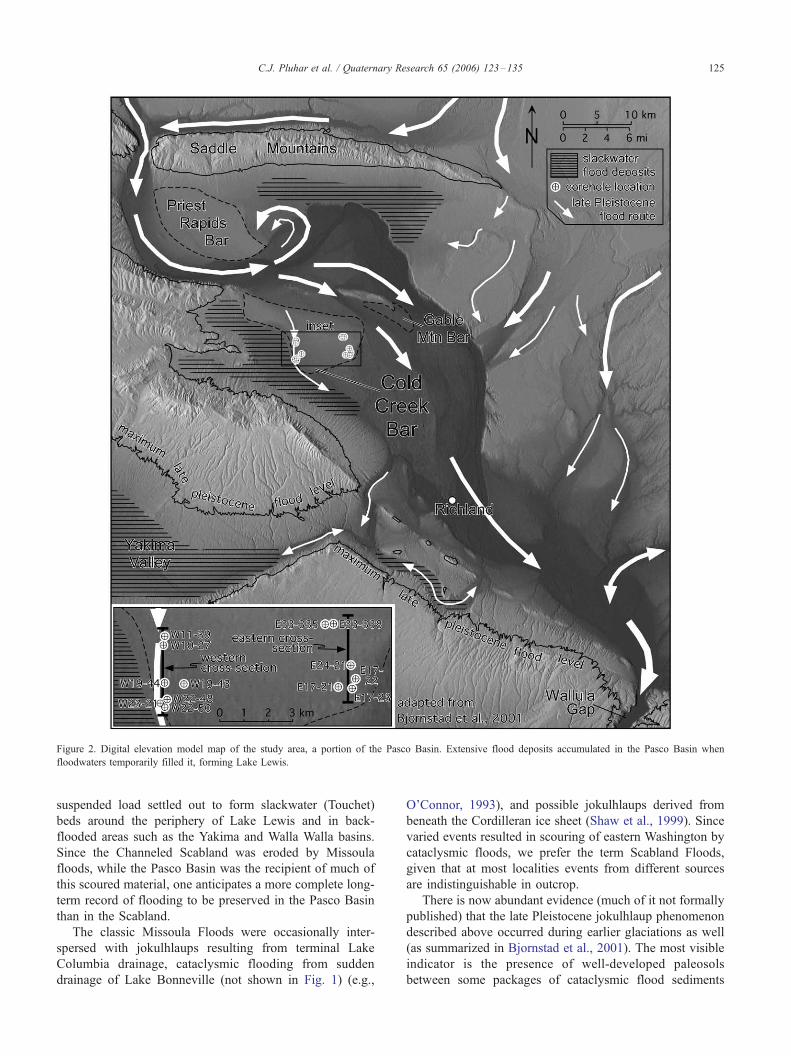
Figure 2. Digital elevation model map of the study area, a portion of the Pasco Basin. Extensive flood deposits accumulated in the Pasco Basin when
floodwaters temporarily filled it, forming Lake Lewis.
C.J. Pluhar et al. / Quaternary Research 65 (2006) 123–135 125
suspended load settled out to form slackwater (Touchet)
beds around the periphery of Lake Lewis and in back-
flooded areas such as the Yakima and Walla Walla basins.
Since the Channeled Scabland was eroded by Missoula
floods, while the Pasco Basin was the recipient of much of
this scoured material, one anticipates a more complete long-
term record of flooding to be preserved in the Pasco Basin
than in the Scabland.
The classic Missoula Floods were occasionally inter-
spersed with jokulhlaups resulting from terminal Lake
Columbia drainage, cataclysmic flooding from sudden
drainage of Lake Bonneville (not shown in Fig. 1) (e.g.,
O’Connor, 1993), and possible jokulhlaups derived from
beneath the Cordilleran ice sheet (Shaw et al., 1999). Since
varied events resulted in scouring of eastern Washington by
cataclysmic floods, we prefer the term Scabland Floods,
given that at most localities events from different sources
are indistinguishable in outcrop.
There is now abundant evidence (much of it not formally
published) that the late Pleistocene jokulhlaup phenomenon
described above occurred during earlier glaciations as well
(as summarized in Bjornstad et al., 2001). The most visible
indicator is the presence of well-developed paleosols
between some packages of cataclysmic flood sediments
C.J. Pluhar et al. / Quaternary Research 65 (2006) 123–135126
(e.g., Patton and Baker, 1978; McDonald and Busacca,
1988). Such strongly developed soils likely formed over
many thousands of years (Bjornstad et al., 2001) and
suggest that the flood deposits they cap stem from earlier
glaciations. U/Th disequilibrium dates on some of these
pedogenic carbonates yield ages of 0.2 to 0.4 myr (Baker et
al., 1991). In addition, the basal portions of many of these
localities exhibit reversed paleomagnetic polarity (McDo-
nald and Busacca, 1988, 1992; many unpublished works
summarized in Baker et al., 1991), indicating deposition
before 0.78 myr, the last major polarity (Brunhes-
Matuyama) reversal. The current study expands upon and
revises earlier paleomagnetic work (in Bjornstad et al.,
2001) on the Cold Creek bar that suggested that Scabland
Floods commenced prior to 1.77 myr, the end of the Olduvai
normal subchron.
Methods
As part of research into the nature and extent of
subsurface contamination at the U.S. Department of
Energy’s Hanford site, many drill cores have been recently
collected from the Cold Creek bar. We have drawn our
paleomagnetic samples from some of these drill cores,
which were collected using a ‘‘split spoon’’ sampling device
deployed either on a wireline or threaded rods. In either case
neither absolute azimuthal core orientation, nor relative
azimuth between core segments was preserved. Thus,
magnetic polarity for these cores is based solely on
paleomagnetic inclination. The split spoons consisted of
10-cm-diameter, 0.6- to 1.8-m-long hollow tubes containing
three Lexani liners. Intact sediment core was collected by
driving the split spoon ahead of the drill bit into undisturbed
sediment. The split spoon was then pulled up, opened, and
the liners were capped and labeled with core number, depth
interval, and up direction.
In the laboratory, drill core segments were split in half
lengthwise. To collect paleomagnetic samples, five faces of
a sample cube were carved from the center line of a core
segment, using stainless-steel instruments. An 8-cm3, plastic
box, open on one end and labeled with core number, depth,
and ‘‘up’’ arrow, was placed over each sample before the
rear, sixth face of the sample cube was carved away from
the drill core. Finally, a few drops of sodium silicate
impregnating solution were added to the sediment and
allowed to dry before securing the plastic cover.
We collected 213 new paleomagnetic samples from nine
drill cores to add to the 53 samples from four cores already
described in Bjornstad et al. (2001). The new and old data
are hereafter treated together and integrated. Samples fall
into two geographic groups (Fig. 2). Coreholes on the
eastern side of the Cold Creek flood bar penetrated sands
and gravels while those on the western side of the flood bar
in a minor flood channel penetrated mainly silty sands and
sands.
Stratigraphically, samples span the entire Hanford
formation, an informal name given to Pleistocene cataclys-
mic flood sediments of the Pasco Basin (see US DOE/RL-
2002-39 for details), as well as the upper parts of the units
that underlie it: either the Cold Creek unit, a fine-grained,
pedogenically altered unit of eolian to fluvial origin thought
to be Pliocene in age (US DOE/RL-2002-39), or the fluvial
(in this vicinity), Mio-Pliocene (Smith et al., 2000; Packer
and Johnston, 1979) Ringold Formation. Samples were
always collected from the most fine-grained horizons
available. Nonetheless, this often meant sampling medium-
to coarse-grained sands.
Paleomagnetic remanence
The magnetic moments of samples were measured in a
3-axis DC SQUID cryogenic magnetometer housed in a
magnetically shielded room that cancels more than 99% of
Earth’s ambient magnetic field. In order to reveal whether
the samples carry stable magnetization directions, we
performed progressive stepwise demagnetization experi-
ments, thereby preferentially removing low-stability, secon-
dary magnetic overprint components. Demagnetization
continued at increasing levels until the sample’s moment
direction became random or the maximum demagnetization
level had been achieved. Both alternating-field (AF) and
thermal demagnetization techniques were employed to a
maximum of 200 mT or 700-C, respectively. Thermal
demagnetization, conducted on samples after sawing them
out of their plastic boxes, appears to yield slightly better
results than AF, as suggested by the higher likelihood in
some cores of revealing a reversed polarity using the former.
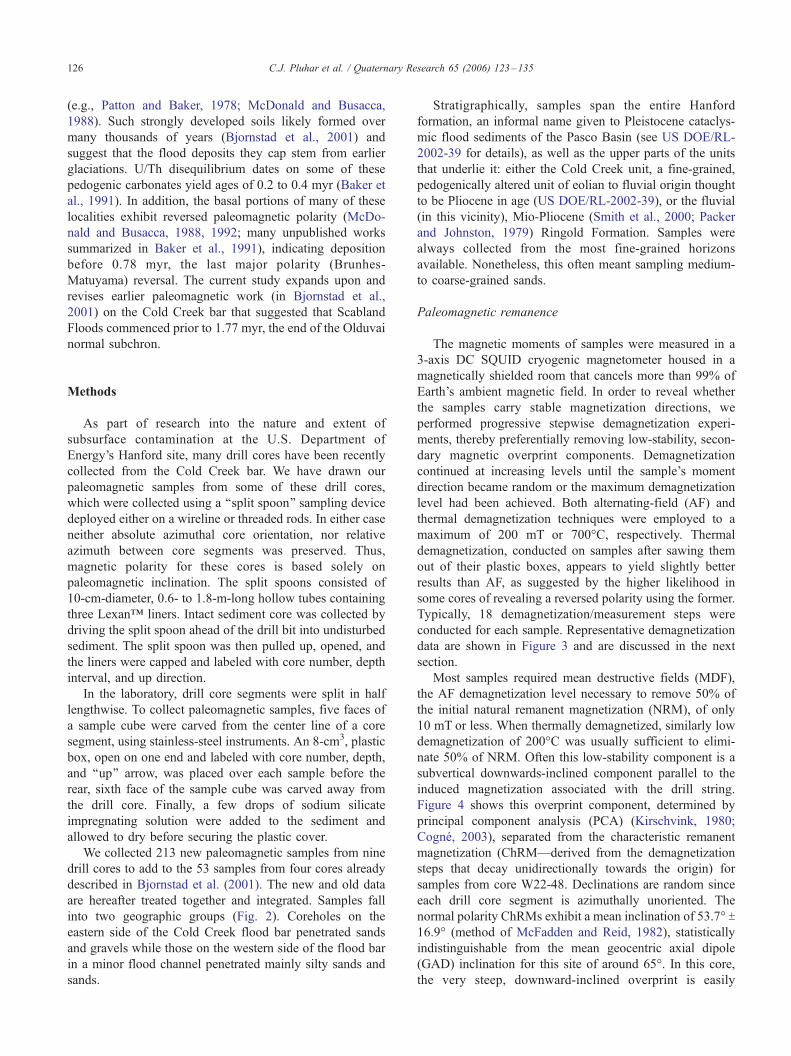
Typically, 18 demagnetization/measurement steps were
conducted for each sample. Representative demagnetization
data are shown in Figure 3 and are discussed in the next
section.
Most samples required mean destructive fields (MDF),
the AF demagnetization level necessary to remove 50% of
the initial natural remanent magnetization (NRM), of only
10 mT or less. When thermally demagnetized, similarly low
demagnetization of 200-C was usually sufficient to elimi-
nate 50% of NRM. Often this low-stability component is a
subvertical downwards-inclined component parallel to the
induced magnetization associated with the drill string.
Figure 4 shows this overprint component, determined by
principal component analysis (PCA) (Kirschvink, 1980;
Cogne, 2003), separated from the characteristic remanent
magnetization (ChRM—derived from the demagnetization
steps that decay unidirectionally towards the origin) for
samples from core W22-48. Declinations are random since
each drill core segment is azimuthally unoriented. The
normal polarity ChRMs exhibit a mean inclination of 53.7- T16.9- (method of McFadden and Reid, 1982), statistically
indistinguishable from the mean geocentric axial dipole
(GAD) inclination for this site of around 65-. In this core,
the very steep, downward-inclined overprint is easily
Figure 3. Judging Polarity. (A) A typical normal-polarity sample from E24-21, 213.0V. (B) A typical indeterminate-polarity sample from E24-21, 198.2V. (C) A typical reversed-polarity sample from E24-21, 233.0V.All of these samples exhibit drilling-induced secondary magnetic components.
C.J.
Pluharet
al./Quatern
ary
Resea
rch65(2006)123–135
127
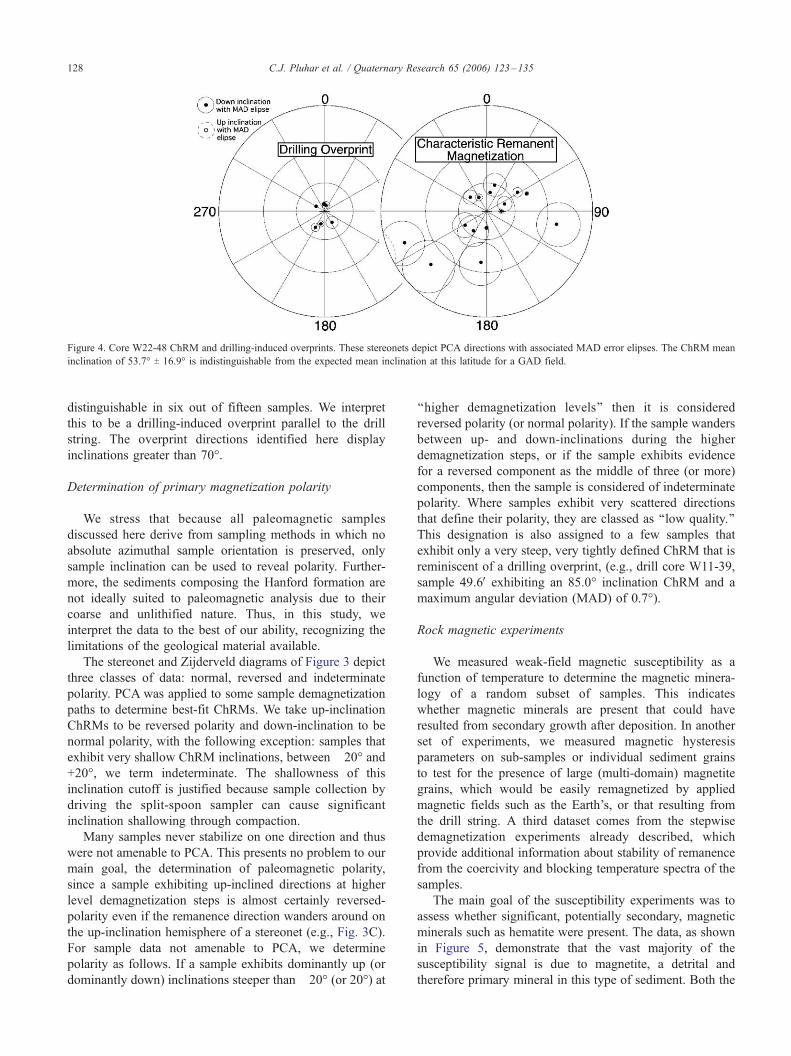
Figure 4. Core W22-48 ChRM and drilling-induced overprints. These stereonets depict PCA directions with associated MAD error elipses. The ChRM mean
inclination of 53.7- T 16.9- is indistinguishable from the expected mean inclination at this latitude for a GAD field.
C.J. Pluhar et al. / Quaternary Research 65 (2006) 123–135128
distinguishable in six out of fifteen samples. We interpret
this to be a drilling-induced overprint parallel to the drill
string. The overprint directions identified here display
inclinations greater than 70-.
Determination of primary magnetization polarity
We stress that because all paleomagnetic samples
discussed here derive from sampling methods in which no
absolute azimuthal sample orientation is preserved, only
sample inclination can be used to reveal polarity. Further-
more, the sediments composing the Hanford formation are
not ideally suited to paleomagnetic analysis due to their
coarse and unlithified nature. Thus, in this study, we
interpret the data to the best of our ability, recognizing the
limitations of the geological material available.
The stereonet and Zijderveld diagrams of Figure 3 depict
three classes of data: normal, reversed and indeterminate
polarity. PCA was applied to some sample demagnetization
paths to determine best-fit ChRMs. We take up-inclination
ChRMs to be reversed polarity and down-inclination to be
normal polarity, with the following exception: samples that
exhibit very shallow ChRM inclinations, between �20- and+20-, we term indeterminate. The shallowness of this
inclination cutoff is justified because sample collection by
driving the split-spoon sampler can cause significant
inclination shallowing through compaction.
Many samples never stabilize on one direction and thus
were not amenable to PCA. This presents no problem to our
main goal, the determination of paleomagnetic polarity,
since a sample exhibiting up-inclined directions at higher
level demagnetization steps is almost certainly reversed-
polarity even if the remanence direction wanders around on
the up-inclination hemisphere of a stereonet (e.g., Fig. 3C).
For sample data not amenable to PCA, we determine
polarity as follows. If a sample exhibits dominantly up (or
dominantly down) inclinations steeper than �20- (or 20-) at
‘‘higher demagnetization levels’’ then it is considered
reversed polarity (or normal polarity). If the sample wanders
between up- and down-inclinations during the higher
demagnetization steps, or if the sample exhibits evidence
for a reversed component as the middle of three (or more)
components, then the sample is considered of indeterminate
polarity. Where samples exhibit very scattered directions
that define their polarity, they are classed as ‘‘low quality.’’
This designation is also assigned to a few samples that
exhibit only a very steep, very tightly defined ChRM that is
reminiscent of a drilling overprint, (e.g., drill core W11-39,
sample 49.6V exhibiting an 85.0- inclination ChRM and a
maximum angular deviation (MAD) of 0.7-).
Rock magnetic experiments
We measured weak-field magnetic susceptibility as a
function of temperature to determine the magnetic minera-
logy of a random subset of samples. This indicates
whether magnetic minerals are present that could have
resulted from secondary growth after deposition. In another
set of experiments, we measured magnetic hysteresis
parameters on sub-samples or individual sediment grains
to test for the presence of large (multi-domain) magnetite
grains, which would be easily remagnetized by applied
magnetic fields such as the Earth’s, or that resulting from
the drill string. A third dataset comes from the stepwise
demagnetization experiments already described, which
provide additional information about stability of remanence
from the coercivity and blocking temperature spectra of the
samples.
The main goal of the susceptibility experiments was to
assess whether significant, potentially secondary, magnetic
minerals such as hematite were present. The data, as shown
in Figure 5, demonstrate that the vast majority of the
susceptibility signal is due to magnetite, a detrital and
therefore primary mineral in this type of sediment. Both the
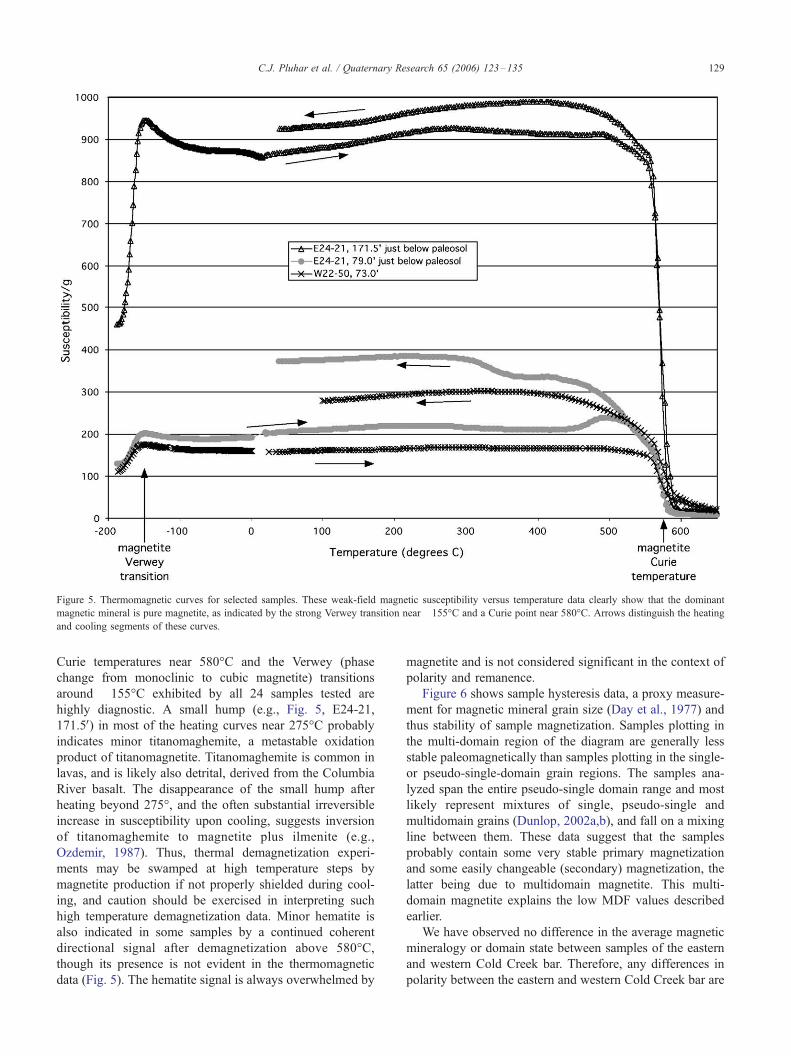
Figure 5. Thermomagnetic curves for selected samples. These weak-field magnetic susceptibility versus temperature data clearly show that the dominant
magnetic mineral is pure magnetite, as indicated by the strong Verwey transition near �155-C and a Curie point near 580-C. Arrows distinguish the heating
and cooling segments of these curves.
C.J. Pluhar et al. / Quaternary Research 65 (2006) 123–135 129
Curie temperatures near 580-C and the Verwey (phase
change from monoclinic to cubic magnetite) transitions
around �155-C exhibited by all 24 samples tested are
highly diagnostic. A small hump (e.g., Fig. 5, E24-21,
171.5V) in most of the heating curves near 275-C probably
indicates minor titanomaghemite, a metastable oxidation
product of titanomagnetite. Titanomaghemite is common in
lavas, and is likely also detrital, derived from the Columbia
River basalt. The disappearance of the small hump after
heating beyond 275-, and the often substantial irreversible
increase in susceptibility upon cooling, suggests inversion
of titanomaghemite to magnetite plus ilmenite (e.g.,
Ozdemir, 1987). Thus, thermal demagnetization experi-
ments may be swamped at high temperature steps by
magnetite production if not properly shielded during cool-
ing, and caution should be exercised in interpreting such
high temperature demagnetization data. Minor hematite is
also indicated in some samples by a continued coherent
directional signal after demagnetization above 580-C,though its presence is not evident in the thermomagnetic
data (Fig. 5). The hematite signal is always overwhelmed by
magnetite and is not considered significant in the context of
polarity and remanence.
Figure 6 shows sample hysteresis data, a proxy measure-
ment for magnetic mineral grain size (Day et al., 1977) and
thus stability of sample magnetization. Samples plotting in
the multi-domain region of the diagram are generally less
stable paleomagnetically than samples plotting in the single-
or pseudo-single-domain grain regions. The samples ana-
lyzed span the entire pseudo-single domain range and most
likely represent mixtures of single, pseudo-single and
multidomain grains (Dunlop, 2002a,b), and fall on a mixing
line between them. These data suggest that the samples
probably contain some very stable primary magnetization
and some easily changeable (secondary) magnetization, the
latter being due to multidomain magnetite. This multi-
domain magnetite explains the low MDF values described
earlier.
We have observed no difference in the average magnetic
mineralogy or domain state between samples of the eastern
and western Cold Creek bar. Therefore, any differences in
polarity between the eastern and western Cold Creek bar are
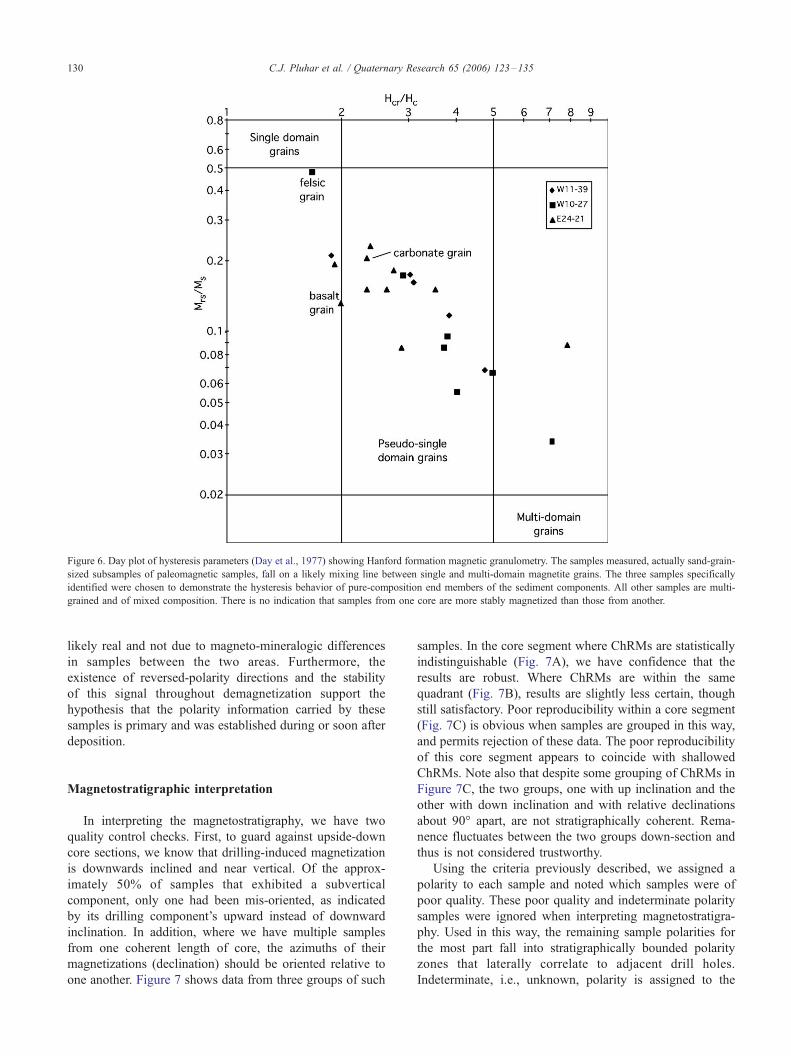
Figure 6. Day plot of hysteresis parameters (Day et al., 1977) showing Hanford formation magnetic granulometry. The samples measured, actually sand-grain-
sized subsamples of paleomagnetic samples, fall on a likely mixing line between single and multi-domain magnetite grains. The three samples specifically
identified were chosen to demonstrate the hysteresis behavior of pure-composition end members of the sediment components. All other samples are multi-
grained and of mixed composition. There is no indication that samples from one core are more stably magnetized than those from another.
C.J. Pluhar et al. / Quaternary Research 65 (2006) 123–135130
likely real and not due to magneto-mineralogic differences
in samples between the two areas. Furthermore, the
existence of reversed-polarity directions and the stability
of this signal throughout demagnetization support the
hypothesis that the polarity information carried by these
samples is primary and was established during or soon after
deposition.
Magnetostratigraphic interpretation
In interpreting the magnetostratigraphy, we have two
quality control checks. First, to guard against upside-down
core sections, we know that drilling-induced magnetization
is downwards inclined and near vertical. Of the approx-
imately 50% of samples that exhibited a subvertical
component, only one had been mis-oriented, as indicated
by its drilling component’s upward instead of downward
inclination. In addition, where we have multiple samples
from one coherent length of core, the azimuths of their
magnetizations (declination) should be oriented relative to
one another. Figure 7 shows data from three groups of such
samples. In the core segment where ChRMs are statistically
indistinguishable (Fig. 7A), we have confidence that the
results are robust. Where ChRMs are within the same
quadrant (Fig. 7B), results are slightly less certain, though
still satisfactory. Poor reproducibility within a core segment
(Fig. 7C) is obvious when samples are grouped in this way,
and permits rejection of these data. The poor reproducibility
of this core segment appears to coincide with shallowed
ChRMs. Note also that despite some grouping of ChRMs in
Figure 7C, the two groups, one with up inclination and the
other with down inclination and with relative declinations
about 90- apart, are not stratigraphically coherent. Rema-
nence fluctuates between the two groups down-section and
thus is not considered trustworthy.
Using the criteria previously described, we assigned a
polarity to each sample and noted which samples were of
poor quality. These poor quality and indeterminate polarity
samples were ignored when interpreting magnetostratigra-
phy. Used in this way, the remaining sample polarities for
the most part fall into stratigraphically bounded polarity
zones that laterally correlate to adjacent drill holes.
Indeterminate, i.e., unknown, polarity is assigned to the
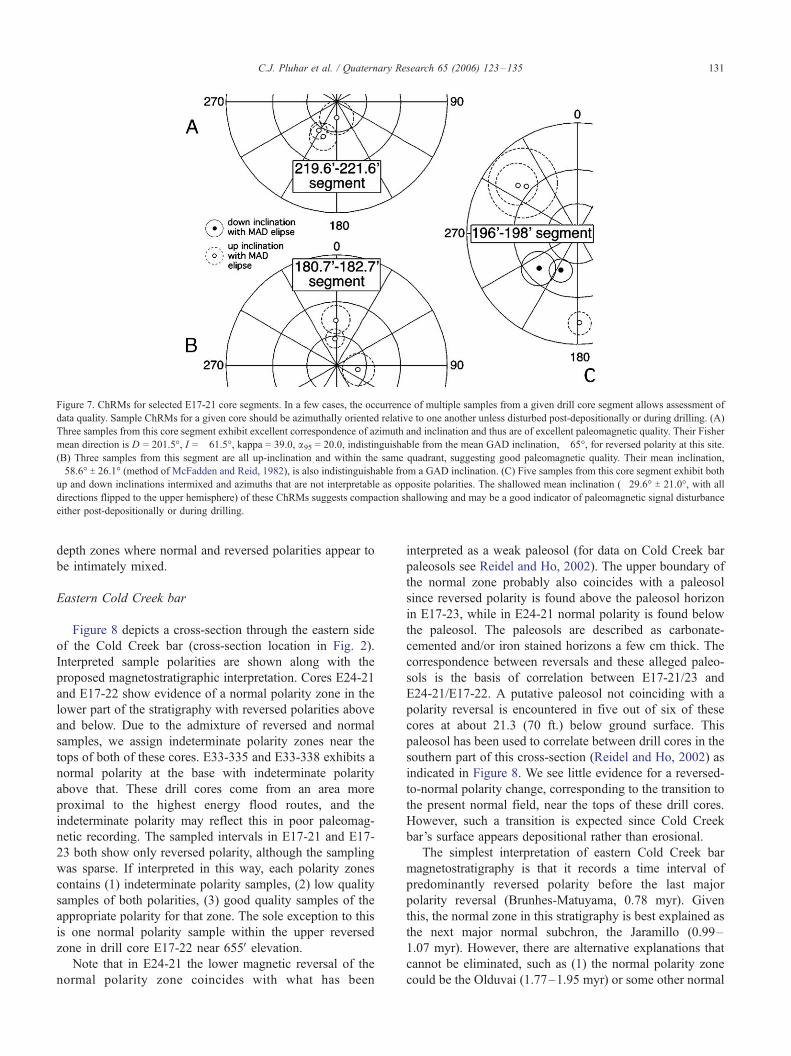
Figure 7. ChRMs for selected E17-21 core segments. In a few cases, the occurrence of multiple samples from a given drill core segment allows assessment of
data quality. Sample ChRMs for a given core should be azimuthally oriented relative to one another unless disturbed post-depositionally or during drilling. (A)
Three samples from this core segment exhibit excellent correspondence of azimuth and inclination and thus are of excellent paleomagnetic quality. Their Fisher
mean direction is D = 201.5-, I = �61.5-, kappa = 39.0, a95 = 20.0, indistinguishable from the mean GAD inclination, �65-, for reversed polarity at this site.
(B) Three samples from this segment are all up-inclination and within the same quadrant, suggesting good paleomagnetic quality. Their mean inclination,
�58.6- T 26.1- (method of McFadden and Reid, 1982), is also indistinguishable from a GAD inclination. (C) Five samples from this core segment exhibit both
up and down inclinations intermixed and azimuths that are not interpretable as opposite polarities. The shallowed mean inclination (�29.6- T 21.0-, with all
directions flipped to the upper hemisphere) of these ChRMs suggests compaction shallowing and may be a good indicator of paleomagnetic signal disturbance
either post-depositionally or during drilling.
C.J. Pluhar et al. / Quaternary Research 65 (2006) 123–135 131
depth zones where normal and reversed polarities appear to
be intimately mixed.
Eastern Cold Creek bar
Figure 8 depicts a cross-section through the eastern side
of the Cold Creek bar (cross-section location in Fig. 2).
Interpreted sample polarities are shown along with the
proposed magnetostratigraphic interpretation. Cores E24-21
and E17-22 show evidence of a normal polarity zone in the
lower part of the stratigraphy with reversed polarities above
and below. Due to the admixture of reversed and normal
samples, we assign indeterminate polarity zones near the
tops of both of these cores. E33-335 and E33-338 exhibits a
normal polarity at the base with indeterminate polarity
above that. These drill cores come from an area more
proximal to the highest energy flood routes, and the
indeterminate polarity may reflect this in poor paleomag-
netic recording. The sampled intervals in E17-21 and E17-
23 both show only reversed polarity, although the sampling
was sparse. If interpreted in this way, each polarity zones
contains (1) indeterminate polarity samples, (2) low quality
samples of both polarities, (3) good quality samples of the
appropriate polarity for that zone. The sole exception to this
is one normal polarity sample within the upper reversed
zone in drill core E17-22 near 655V elevation.Note that in E24-21 the lower magnetic reversal of the
normal polarity zone coincides with what has been
interpreted as a weak paleosol (for data on Cold Creek bar
paleosols see Reidel and Ho, 2002). The upper boundary of
the normal zone probably also coincides with a paleosol
since reversed polarity is found above the paleosol horizon
in E17-23, while in E24-21 normal polarity is found below
the paleosol. The paleosols are described as carbonate-
cemented and/or iron stained horizons a few cm thick. The
correspondence between reversals and these alleged paleo-
sols is the basis of correlation between E17-21/23 and
E24-21/E17-22. A putative paleosol not coinciding with a
polarity reversal is encountered in five out of six of these
cores at about 21.3 (70 ft.) below ground surface. This
paleosol has been used to correlate between drill cores in the
southern part of this cross-section (Reidel and Ho, 2002) as
indicated in Figure 8. We see little evidence for a reversed-
to-normal polarity change, corresponding to the transition to
the present normal field, near the tops of these drill cores.
However, such a transition is expected since Cold Creek
bar’s surface appears depositional rather than erosional.
The simplest interpretation of eastern Cold Creek bar
magnetostratigraphy is that it records a time interval of
predominantly reversed polarity before the last major
polarity reversal (Brunhes-Matuyama, 0.78 myr). Given
this, the normal zone in this stratigraphy is best explained as
the next major normal subchron, the Jaramillo (0.99–
1.07 myr). However, there are alternative explanations that
cannot be eliminated, such as (1) the normal polarity zone
could be the Olduvai (1.77–1.95 myr) or some other normal
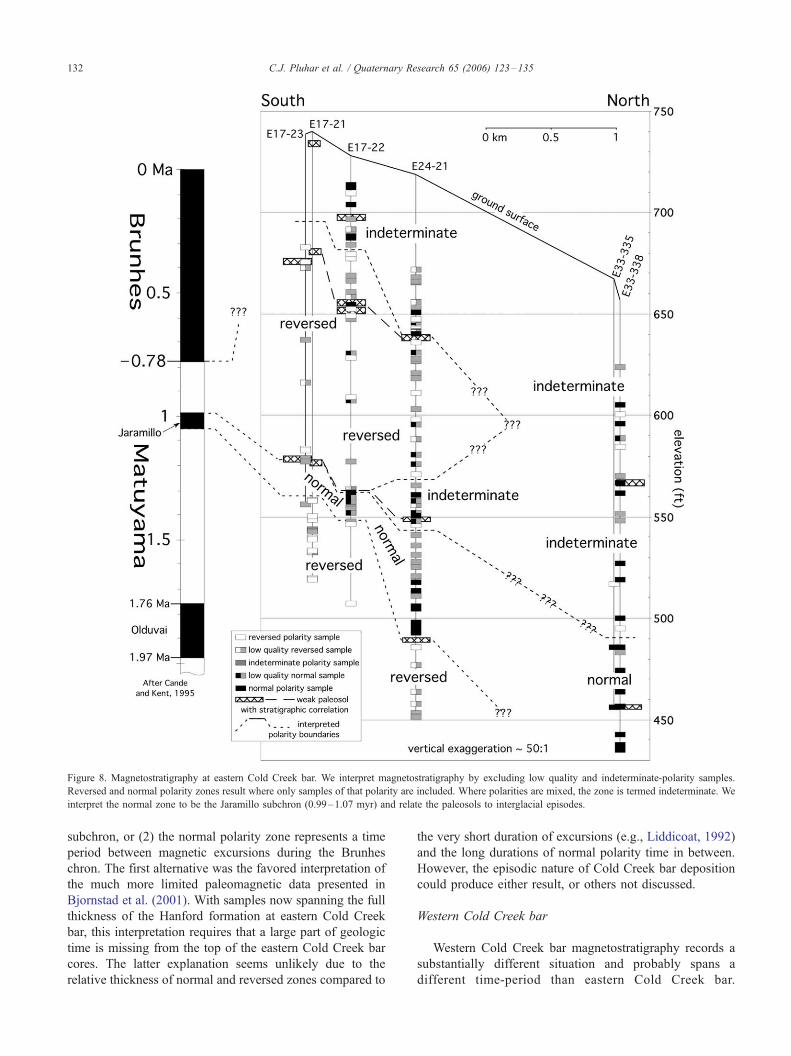
Figure 8. Magnetostratigraphy at eastern Cold Creek bar. We interpret magnetostratigraphy by excluding low quality and indeterminate-polarity samples.
Reversed and normal polarity zones result where only samples of that polarity are included. Where polarities are mixed, the zone is termed indeterminate. We
interpret the normal zone to be the Jaramillo subchron (0.99–1.07 myr) and relate the paleosols to interglacial episodes.
C.J. Pluhar et al. / Quaternary Research 65 (2006) 123–135132
subchron, or (2) the normal polarity zone represents a time
period between magnetic excursions during the Brunhes
chron. The first alternative was the favored interpretation of
the much more limited paleomagnetic data presented in
Bjornstad et al. (2001). With samples now spanning the full
thickness of the Hanford formation at eastern Cold Creek
bar, this interpretation requires that a large part of geologic
time is missing from the top of the eastern Cold Creek bar
cores. The latter explanation seems unlikely due to the
relative thickness of normal and reversed zones compared to
the very short duration of excursions (e.g., Liddicoat, 1992)
and the long durations of normal polarity time in between.
However, the episodic nature of Cold Creek bar deposition
could produce either result, or others not discussed.
Western Cold Creek bar
Western Cold Creek bar magnetostratigraphy records a
substantially different situation and probably spans a
different time-period than eastern Cold Creek bar.
C.J. Pluhar et al. / Quaternary Research 65 (2006) 123–135 133
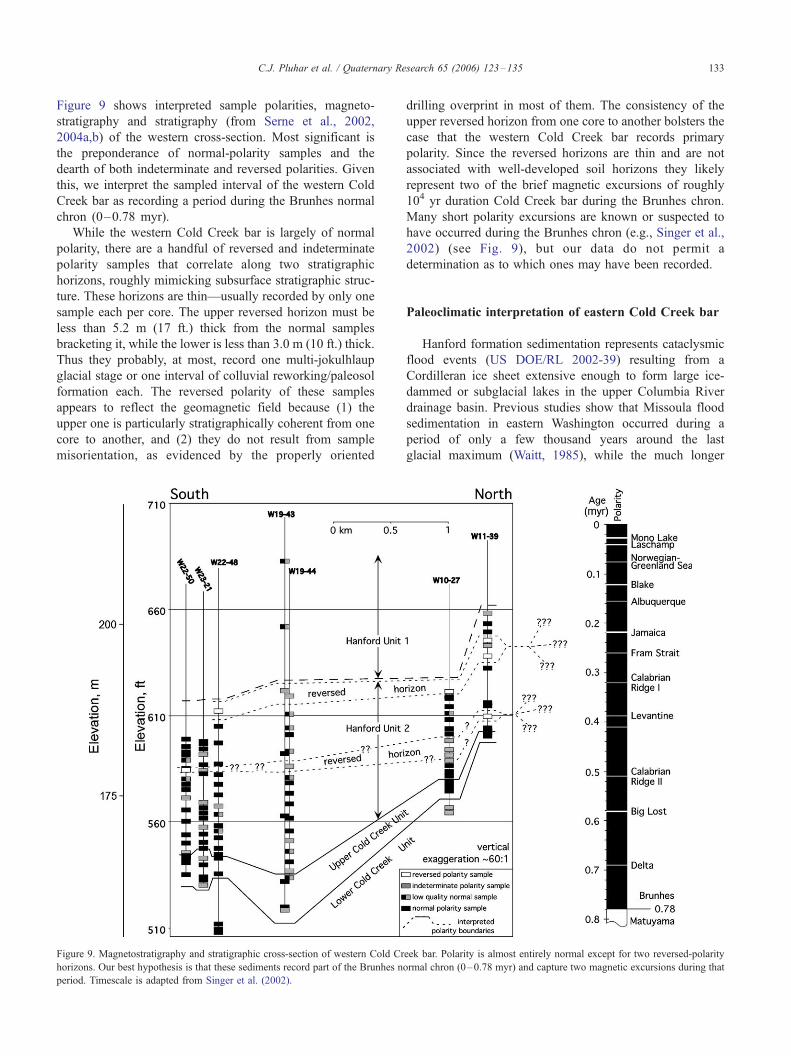
Figure 9 shows interpreted sample polarities, magneto-
stratigraphy and stratigraphy (from Serne et al., 2002,
2004a,b) of the western cross-section. Most significant is
the preponderance of normal-polarity samples and the
dearth of both indeterminate and reversed polarities. Given
this, we interpret the sampled interval of the western Cold
Creek bar as recording a period during the Brunhes normal
chron (0–0.78 myr).
While the western Cold Creek bar is largely of normal
polarity, there are a handful of reversed and indeterminate
polarity samples that correlate along two stratigraphic
horizons, roughly mimicking subsurface stratigraphic struc-
ture. These horizons are thin—usually recorded by only one
sample each per core. The upper reversed horizon must be
less than 5.2 m (17 ft.) thick from the normal samples
bracketing it, while the lower is less than 3.0 m (10 ft.) thick.
Thus they probably, at most, record one multi-jokulhlaup
glacial stage or one interval of colluvial reworking/paleosol
formation each. The reversed polarity of these samples
appears to reflect the geomagnetic field because (1) the
upper one is particularly stratigraphically coherent from one
core to another, and (2) they do not result from sample
misorientation, as evidenced by the properly oriented
Figure 9. Magnetostratigraphy and stratigraphic cross-section of western Cold Cr
horizons. Our best hypothesis is that these sediments record part of the Brunhes no
period. Timescale is adapted from Singer et al. (2002).
drilling overprint in most of them. The consistency of the
upper reversed horizon from one core to another bolsters the
case that the western Cold Creek bar records primary
polarity. Since the reversed horizons are thin and are not
associated with well-developed soil horizons they likely
represent two of the brief magnetic excursions of roughly
104 yr duration Cold Creek bar during the Brunhes chron.
Many short polarity excursions are known or suspected to
have occurred during the Brunhes chron (e.g., Singer et al.,
2002) (see Fig. 9), but our data do not permit a
determination as to which ones may have been recorded.
Paleoclimatic interpretation of eastern Cold Creek bar
Hanford formation sedimentation represents cataclysmic
flood events (US DOE/RL 2002-39) resulting from a
Cordilleran ice sheet extensive enough to form large ice-
dammed or subglacial lakes in the upper Columbia River
drainage basin. Previous studies show that Missoula flood
sedimentation in eastern Washington occurred during a
period of only a few thousand years around the last
glacial maximum (Waitt, 1985), while the much longer
eek bar. Polarity is almost entirely normal except for two reversed-polarity
rmal chron (0–0.78 myr) and capture two magnetic excursions during that

C.J. Pluhar et al. / Quaternary Research 65 (2006) 123–135134
interglacial intervals before and after are characterized by
depositional hiatuses and pedogenesis at the study area. If
this can be generalized to the entire Hanford formation,
the majority of the time spanned by the section is
represented by depositional hiatuses and the candidate
paleosols of Reidel and Ho (2002), while the majority of
the section was deposited during very short periods with
high deposition rates. The correspondence of the polarity
boundaries with the putative paleosols is thus not
surprising.
Based on this logic, the basal jokulhlaup sediments were
deposited during a glacial interval and reversed polarity. A
hiatus then occurred with attendant pedogenesis. During this
hiatus the Earth’s magnetic field reversed to normal polarity.
The reversed to normal boundary and the putative paleosol
probably represents a hiatus of at least the few thousand years
necessary for a magnetic reversal (Singer and Pringle, 1996;
Clement, 2004). A return to glacial conditions then occurred,
as evidenced by renewed Hanford formation deposition.
Deposition was probably followed by another interruption
with coincident paleosol formation and a transition back to
reversed polarity, again suggesting a hiatus for a period
sufficient for magnetic polarity reversal. Return to full glacial
conditions is indicated by further Hanford formation depo-
sition, succeeded by a hiatus with pedogenesis, followed by
another glaciation and renewed deposition. Hence, four
glacial maxima are recorded by these sediments with three
intercalated hiatuses, two of which correspond to magnetic
reversals. More conservatively, if the interpreted presence of
weak paleosols is rejected, and only the magnetic reversals
are interpreted as representing hiatuses, then three glacial
maxima are recorded.
Discussion and conclusions
Investigations of the Cold Creek flood bar stratigraphy
in the Pasco Basin of eastern Washington yield a longer,
more complete record of pre-late-Pleistocene cataclysmic
Scabland flood events than any surface exposures studied
to date. Our preferred interpretation of the magnetostrati-
graphic results is that the 76-m (250-ft.) thick section of
largely reversed Hanford formation sediments at the
eastern Cold Creek bar records a period starting before
1.07 myr (before the Jaramillo subchron) and ending
between 0.78 and 0.99 myr (between the Jaramillo
subchron and the Brunhes-Matuyama reversal), with the
uppermost portions of the section being of indeterminate
polarity. The two magnetic reversals within this stratig-
raphy coincide with weak paleosols and thus fall during
interglacial depositional hiatuses. Therefore, it appears that
at least three glacial maxima during the early Pleistocene
are recorded at the eastern Cold Creek bar. We interpret
the 27-m (90-ft.) thick (largely normal polarity) section
sampled at the western Cold Creek bar as spanning some
part of the Brunhes normal chron (0–0.78 myr).
The forgoing interpretations have several implications.
First, the onset of cataclysmic flooding in eastern Wash-
ington predated 1.07 myr, so that physiographic elements
conducive to periodic jokulhlaups had already developed by
this time somewhere in the greater Columbia River drainage
system, and formation of the Channeled Scabland had
already begun. Hence the Cordilleran ice sheet during the
early to mid-Pleistocene must have reached latitudes south-
erly enough to affect the Columbia River drainage basin.
This is in agreement with recent results (Balco et al., 2005)
that date two Laurantide icesheet tills in Missouri as early
Pleistocene and late Pliocene. Second, the markedly
different magnetostratigraphy of the eastern and western
Cold Creek bars implies that flood routes and loci of
deposition have evolved with time. Third, if the western
Cold Creek bar records some portion of the Brunhes chron
then the reversed horizons within that magnetostratigraphy
record magnetic excursions—the first suggestion of such an
occurrence in Scabland Flood deposits. Dating these
horizons and correlating them to the magnetic polarity time-
scale could further refine the eastern Washington jokulhlaup
stratigraphy.
Given the inherent episodicity of jokulhlaup deposition
and the possibility of initial erosion during each event,
followed by deposition, there remains the possibility of
undetected hiatuses throughout our magnetostratigraphy.
Hence competing hypotheses cannot be fully rejected at
present. Among these are the possibility, suggested by
Bjornstad et al. (2001), that the eastern Cold Creek bar
records the Olduvai normal subchron (1.77–1.95 myr)
rather than the Jaramillo (0.99–1.07 myr). However, with
the current dataset and selecting the most conservative
interpretation, we arrive at the stated conclusion because
(1) unless we choose the first pre-Brunhes normal
subchron, there is no basis for favoring any particular
antecedent subchrons, and (2) correlating with the
Jaramillo requires the minimum missing section within the
eastern and/or between the eastern and the western Cold
Creek bar. Another possibility that cannot be rejected is that
cores in both the eastern and the western Cold Creek bar
record parts of the Brunhes chron, and that the reversed
zones at both areas record magnetic excursions. This
hypothesis obviates a missing section at the top of the
eastern Cold Creek bar cores, but requires that the majority
of section at this area be deposited during two separate
excursions—a chain of events that would seem to be
extremely unlikely.
Acknowledgments
Many thanks to Fred Mann, Karl Fecht, Robert S.
Anderson and Eli Silver. Helpful peer review was provided
by Jim O’Connor, Randy Enkin, and Vic Baker. Battelle
Memorial Institute funded this research through contracts
4584 and 403148-A-B3.
C.J. Pluhar et al. / Quaternary Research 65 (2006) 123–135 135
References
Atwater, B.F., 1984. Periodic floods from glacial Lake Missoula into the
Sanpoil Arm of glacial Lake Columbia, northeastern Washington.
Geology 12 (8), 464–467.
Atwater, B.F., 1986. Pleistocene glacial-lake deposits of the Sanpoil River
valley, northeastern Washington. U.S. Geological Survey Bulletin
B1661 (39 pp.).
Baker, V.R., Bjornstad, B.N., Busacca, A.J., Fecht, K.R., Kiver, E.P.,
Moody, U.L., Rigby, J.G., Stradling, D.F., Tallman, A.M., 1991.
Quaternary geology of the Columbia Plateau. In: Morrison, R.B.
(Ed.), Quaternary Nonglacial Geology; Conterminous U.S., The
Geology of North America, vol. K-2. Geological Society of America,
Boulder, CO, pp. 215–250.
Balco, G., Rovey II, C.W., Stone, J.O., 2005. The first glacial maximum in
North America. Science 307 (5707), 222.
Benito, G., O’Connor, J.E., 2003. Number and size of last-glacial Missoula
floods in the Columbia River valley between the Pasco Basin,
Washington, and Portland, Oregon. Geological Society of America
Bulletin 115 (5), 624–638.
Bjornstad, B.N., Fecht, K.R., Pluhar, C.J., 2001. Long history of pre-
Wisconsin, Ice Age cataclysmic floods: evidence from southeastern
Washington State. Journal of Geology 109 (6), 695–713.
Bretz, J.H., 1930. Lake Missoula and the Spokane flood. Geological
Society of America Bulletin 41 (1), 92–93.
Clague, J.J., Barendregt, R., Enkin, R.J., Foit, F.F., 2003. Paleomagnetic
and tephra evidence for tens of Missoula floods in southern Washington.
Geology 31 (3), 247–250.
Clement, B.M., 2004. Dependence of the duration of geomagnetic polarity
reversals on site latitude. Nature 428, 637–640.
Cogne, J.P., 2003. PaleoMac: a MacIntosh application for treating
paleomagnetic data and making plate reconstructions. Geochemistry,
Geophysics, Geosystems 4 (1), 1007 (8 pp.).
Day, R., Fuller, M., Schmidt, V.A., 1977. Hysteresis properties of
titanomagnetites; grain-size and compositional dependence. Physics of
the Earth and Planetary Interiors 13 (4), 260–267.
Dunlop, D.J., 2002a. Theory and application of the Day plot Mrs/Ms
versus Hcr/Hc 2. Application to data for rocks, sediments, and soils.
Journal of Geophysical Research, B Solid Earth and Planets 107 (B3),
5:1–5:15.
Dunlop, D.J., 2002b. Theory and application of the Day plot Mrs/Ms versus
Hcr/Hc 1. Theoretical curves and tests using titanomagnetite data.
Journal of Geophysical Research, B Solid Earth and Planets 107 (B3),
4:1–4:22.
Kirschvink, J.L., 1980. The least-squares line and plane and the analysis of
palaeomagnetic data. Geophysical Journal of the Royal Astronomical
Society 62 (3), 699–718.
Liddicoat, J.C., 1992. Mono Lake excursion in Mono Basin, California, and
at Carson Sink and Pyramid Lake, Nevada. Geophysical Journal
International 108 (2), 442–452.
McDonald, E.V., Busacca, A.J., 1988. Record of pre-late Wisconsin giant
floods in the channeled scabland interpreted from loess deposits.
Geology 16 (8), 728–731.
McDonald, E.V., Busacca, A.J., 1992. Late Quaternary stratigraphy of loess
in the channeled scabland and Palouse regions of Washington State.
Quaternary Research 38 (2), 141–156.
McFadden, P.L., Reid, A.B., 1982. Analysis of palaeomagnetic inclination
data. Geophysical Journal of the Royal Astronomical Society 69 (2),
307–319.
O’Connor, J.E., 1993. Hydrology, hydraulics, and geomorphology of the
Bonneville flood. Special Paper-Geological Society of America 274
(83 pp.).
O’Connor, J.E., Baker, V.R., 1992. Magnitudes and implications of peak
discharges from glacial Lake Missoula. Geological Society of America
Bulletin 104 (3), 267–279.
Ozdemir, O., 1987. Inversion of titanomaghemites. Physics of the Earth and
Planetary Interiors 46 (1–3), 184–196.
Packer, D.R., Johnston, J.M., 1979. A preliminary investigation of the
magnetostratigraphy of the Ringold formation. Woodward-Clyde Con-
sultants. Report RHO-BWI-C-42. 49 pp.
Patton, P.C., Baker, V.R., 1978. New evidence for pre-Wisconsin flooding
in the channeled scabland of eastern Washington. Geology 6 (9),
567–571.
Reidel, S.P., Ho, A.M., 2002. Geologic and Wireline Summaries from
Fiscal Year 2002 ILAW Boreholes. Pacific Northwest National
Laboratory, Richland, WA, Report PNNL-14029.
Serne, R.J., Bjornstad, B.N., Schaef, H.T., Williams, B.A., Lanigan, D.C.,
Horton, D.G., Clayton, R.E., Mitroshkov, A.V., Legore, V.L., O’Hara,
M.J., Brown, C.F., Parker, K.E., Kutnyakov, I.V., Serne, J.N., Last,
G.V., Smith, S.C., Lindenmeier, C.W., Zachara, J.M., Burke, D., 2002.
Characterization of Vadose Zone Sediment: Uncontaminated RCRA
Borehole Core Samples and Composite Samples. Pacific Northwest
National Laboratory, Richland, WA, Report PNNL-13757-1.
Serne, R.J., Bjornstad, B.N., Horton, D.G., Lanigan, D.C., Lindenmeier,
C.W., Lindberg, M.J., Clayton, R.E., Legore, V.L., Geiszler, K.N.,
Baum, S.R., Valenta, M.M., Kutnyakov, I.V., Vickerman, T.S., Orr,
R.D., Brown, C.F., 2004a. Characterization of Vadose Zone Sediments
Below the T Tank Farm: Boreholes C4104, C4105, 299-W10-196 and
RCRA Borehole 299-W11-39. Pacific Northwest National Laboratory,
Richland, WA, Report PNNL-14849.
Serne, R.J., Bjornstad, B.N., Horton, D.G., Lanigan, D.C., Lindenmeier,
C.W., Lindberg, M.J., Clayton, R.E., Legore, V.L., Orr, R.D.,
Kutnyakov, I.V., Baum, S.R., Geiszler, K.N., Valenta, M.M., Vicker-
man, T.S., 2004b. Characterization of Vadose Zone Sediments Below
the TX Tank Farm: Probe Holes C3830, C3831, C3832 and 299-
W10-27. Pacific Northwest National Laboratory, Richland, WA,
Report PNNL-14594.
Shaw, J., Munro-Stasiuk, M., Sawyer, B., Beaney, C., Lesemann, J.-E.,
Musacchio, A., Rains, B., Young, R.R., 1999. The Channeled Scabland;
back to Bretz? Geology 27 (7), 605–608.
Singer, B.S., Pringle, M.S., 1996. Age and duration of the Matuyama–
Brunhes geomagnetic polarity reversal from 40Ar/39Ar incremental
heating analyses of lavas. Earth and Planetary Science Letters 139
(1–2), 47–61.
Singer, B.S., Relle, M.K., Hoffman, K.A., Battle, A., Laj, C., Guillou, H.,
Carracedo, J.C., 2002. Ar/Ar ages from transitionally magnetized lavas
of La Palma, Canary Islands, and the geomagnetic instability timescale.
Journal of Geophysical Research, B, Solid Earth and Planets 107(B11)
(2307), 7:1–7:20.
Smith, G.A., 1993. Missoula flood dynamics and magnitudes inferred
from sedimentology of slack-water deposits on the Columbia
Plateau, Washington. Geological Society of America Bulletin 105
(1), 77–100.
Smith, G.R., Morgan, N., Gustafson, E., 2000. Fishes of the Mio-
Pliocene Ringold Formation, Washington; Pliocene capture of the
Snake River by the Columbia River. Papers on Paleontology, vol. 32.
University of Michigan, Museum of Paleontology, Ann Arbor, MI,
USA. 47 pp.
Steele, W.K., 1991. Paleomagnetic evidence for repeated glacial Lake
Missoula floods from sediments of the Sanpoil River valley, northeast-
ern Washington. Quaternary Research 35 (2), 197–207.
United States Department of Energy, 2002. Standardized Stratigraphic
Nomenclature for Post-Ringold Formation Sediments within the
Central Pasco Basin. U.S. Department of Energy Report DOE/RL
2002-39, United States Department of Energy, Richland, WA. 121 pp.
Waitt Jr., R.B., 1983. Tens of successive, colossal Missoula floods at north
and east margins of channeled scabland. U. S. Geological Survey Open-
File Report 83-0671. 29 pp.
Waitt Jr., R.B., 1985. Case for periodic, colossal joekulhlaups from
Pleistocene glacial Lake Missoula. Geological Society of America
Bulletin 96 (10), 1271–1286.
Walder, J.S., Costa, J.E., 1996. Outburst floods from glacier-dammed lakes;
the effect of mode of lake drainage on flood magnitude. Earth Surface
Processes and Landforms 21 (8), 701–723.