Magnetomotive optical coherence microscopy for cell dynamics and biomechanics
7
Magnetomotive optical coherence microscopy for cell dynamics and biomechanics Xing Liang a,b , Benedikt W. Graf a,b , Renu John a , Vasilica Crecea a,c , Freddy T. Nguyen a,d , Huafeng Ding a,b , Hyon-min Song a,b , Gabriel Popescu a,b , Alex Wei f , and *Stephen A. Boppart a,b,e a Beckman Institute for Advanced Science and Technology, b Department of Electrical and Computer Engineering, c Department of Physics, d Department of Chemistry, e Departments of Bioengineering and Internal Medicine, University of Illinois at Urbana-Champaign, 405 North Mathews Avenue, Urbana, IL, USA 61801 f Department of Chemistry, Purdue University, 560 Oval Drive, West Lafayette, IN, USA 47907 ABSTRACT Magnetomotive microscopy techniques are introduced to investigate cell dynamics and biomechanics. These techniques are based on magnetomotive transducers present in cells and optical coherence imaging techniques. In this study, magnetomotive transducers include magnetic nanoparticles (MNPs) and fluorescently labeled magnetic microspheres, while the optical coherence imaging techniques include integrated optical coherence (OCM)and multiphoton (MPM) microscopy,and diffraction phase microscopy (DPM). Samples used in this study are murine macrophage cells in culture that were incubated with magnetomotive transducers. MPMis used to visualize multifunctional microspheres based on their fluorescence, while magnetomotive OCM detects sinusoidal displacements of the sample induced by a magnetic field. DPM is used to image single cells at a lower frequency magnetic excitation, and with its Fourier transform light scattering (FTLS) analysis, oscillation amplitude is obtained, indicating the relative biomechanical properties of macrophage cells. These magnetomotive microscopy method shave potential to be used to image and measure cell dynamics and biomechanical properties. The ability to measure and understand biomechanical properties of cells and their microenvironments, especially for tumor cells, is of great importance and may provide insight for diagnostic and subsequently therapeutic interventions. Keywords: Magnetic tweezers, optical coherence microscopy, diffraction phase microscopy, cell biomechanics *[email protected]; phone 217-244-7479; fax 217-333-5833; http://biophotonics.illinois.edu 1. INTRODUCTION Cells constitute the basic unit of life and have a number of functions such as synthesis, storage and transport of molecules, the expression of genetic information, the recognition, transmission and transduction of signals, and many others. Biomechanical properties are extremely significant for specific cell types and their functions.Many normal and diseased conditions of cells depend on or are regulated by their dynamic mechanical environments and biomechanical properties. These properties can provide important information about biological and structural functions.There have been some techniques investigated to measure single cell biomechanical properties such as atomic force microscopy (AFM) and magnetic twisting cytometry (MTC) 1-2 . However, most experimental studies have focused on cell dynamics and biomechanics in vitro, which are most likely to be very different from the cells in living tissues. Magnetomotive microscopy is applied to study cell dynamics and cellular biomechanics with high resolution. This technique combines magnetic excitation of magnetic transducers and optical microscopy techniques. Magnetic excitations are one of the internal mechanical excitation methods used as an optical coherence tomography (OCT) imaging contrast mechanism. Magnetomotion has been used for functional contrast enhancements in OCT by applying magnetic fields to tissues with magnetic contrast agents, such as magnetic nanoparticles (MNPs) 3 . These MNPshave also been used as magnetic resonance imaging (MRI) contrast agents for molecular imaging purposes 4 , and have also been used to investigate the mechanical properties of tissue phantoms 5 . Optical microscopy techniques in this study include an Optical Coherence Tomography and Coherence Domain Optical Methods in Biomedicine XV, edited by James G. Fujimoto, Joseph A. Izatt, Valery V. Tuchin, Proc. of SPIE Vol. 7889, 788926 · © 2011 SPIE · CCC code: 1605-7422/11/$18 doi: 10.1117/12.875139 Proc. of SPIE Vol. 7889 788926-1 Downloaded from SPIE Digital Library on 29 Feb 2012 to 192.17.250.190. Terms of Use: http://spiedl.org/terms
Transcript of Magnetomotive optical coherence microscopy for cell dynamics and biomechanics

Magnetomotive optical coherence microscopy for cell dynamics and biomechanics
Xing Lianga,b, Benedikt W. Grafa,b, Renu Johna, Vasilica Creceaa,c, Freddy T. Nguyena,d, Huafeng
Dinga,b, Hyon-min Songa,b, Gabriel Popescua,b, Alex Weif, and *Stephen A. Bopparta,b,e
aBeckman Institute for Advanced Science and Technology,
bDepartment of Electrical and Computer Engineering, cDepartment of Physics, dDepartment of Chemistry, eDepartments of Bioengineering and Internal Medicine,
University of Illinois at Urbana-Champaign, 405 North Mathews Avenue, Urbana, IL, USA 61801 fDepartment of Chemistry,
Purdue University, 560 Oval Drive, West Lafayette, IN, USA 47907
ABSTRACT
Magnetomotive microscopy techniques are introduced to investigate cell dynamics and biomechanics. These techniques are based on magnetomotive transducers present in cells and optical coherence imaging techniques. In this study, magnetomotive transducers include magnetic nanoparticles (MNPs) and fluorescently labeled magnetic microspheres, while the optical coherence imaging techniques include integrated optical coherence (OCM)and multiphoton (MPM) microscopy,and diffraction phase microscopy (DPM). Samples used in this study are murine macrophage cells in culture that were incubated with magnetomotive transducers. MPMis used to visualize multifunctional microspheres based on their fluorescence, while magnetomotive OCM detects sinusoidal displacements of the sample induced by a magnetic field. DPM is used to image single cells at a lower frequency magnetic excitation, and with its Fourier transform light scattering (FTLS) analysis, oscillation amplitude is obtained, indicating the relative biomechanical properties of macrophage cells. These magnetomotive microscopy method shave potential to be used to image and measure cell dynamics and biomechanical properties. The ability to measure and understand biomechanical properties of cells and their microenvironments, especially for tumor cells, is of great importance and may provide insight for diagnostic and subsequently therapeutic interventions.
Keywords: Magnetic tweezers, optical coherence microscopy, diffraction phase microscopy, cell biomechanics *[email protected]; phone 217-244-7479; fax 217-333-5833; http://biophotonics.illinois.edu
1. INTRODUCTION Cells constitute the basic unit of life and have a number of functions such as synthesis, storage and transport of molecules, the expression of genetic information, the recognition, transmission and transduction of signals, and many others. Biomechanical properties are extremely significant for specific cell types and their functions.Many normal and diseased conditions of cells depend on or are regulated by their dynamic mechanical environments and biomechanical properties. These properties can provide important information about biological and structural functions.There have been some techniques investigated to measure single cell biomechanical properties such as atomic force microscopy (AFM) and magnetic twisting cytometry (MTC)1-2. However, most experimental studies have focused on cell dynamics and biomechanics in vitro, which are most likely to be very different from the cells in living tissues.
Magnetomotive microscopy is applied to study cell dynamics and cellular biomechanics with high resolution. This technique combines magnetic excitation of magnetic transducers and optical microscopy techniques. Magnetic excitations are one of the internal mechanical excitation methods used as an optical coherence tomography (OCT) imaging contrast mechanism. Magnetomotion has been used for functional contrast enhancements in OCT by applying magnetic fields to tissues with magnetic contrast agents, such as magnetic nanoparticles (MNPs)3. These MNPshave also been used as magnetic resonance imaging (MRI) contrast agents for molecular imaging purposes4, and have also been used to investigate the mechanical properties of tissue phantoms5. Optical microscopy techniques in this study include an
Optical Coherence Tomography and Coherence Domain Optical Methods in Biomedicine XV, edited by James G. Fujimoto,Joseph A. Izatt, Valery V. Tuchin, Proc. of SPIE Vol. 7889, 788926 · © 2011 SPIE · CCC code: 1605-7422/11/$18
doi: 10.1117/12.875139
Proc. of SPIE Vol. 7889 788926-1
Downloaded from SPIE Digital Library on 29 Feb 2012 to 192.17.250.190. Terms of Use: http://spiedl.org/terms

integrated OCM and MPM system, and a DPM with a Fourier transform light scattering technique. In this study, magnetic transducers are mechanically modulated by external magnets, and optical microscopy techniques are used to image cell dynamics, which provide data for quantifying cellular biomechanics.
2. MATERIALS AND METHODS 2.1 Integrated optical coherence and multiphoton microscopy The first imaging platform used for this experiment is an integrated optical coherence (OCM) and multiphoton microscope (MPM)6. OCM is a high resolution variation of optical coherence tomography (OCT) that uses a high numerical aperture (NA) beam to achieve high lateral spatial resolution7. The high NA also restricts the depth of field so images are typically acquired in an en face orientation, similar to confocal microscopy. Unlike a confocal microscope which relies on spatial filtering, OCM produces optical sections of samples using coherence gating. Images are based on optical scattering which allows the structural features of tissue to be visualized. MPM is a nonlinear imaging technique which can be used to excite two-photon fluorescence within the focal volume of a high NA beam. In this experiment MPM is used to image fluorescent/magnetic microspheres. The integrated OCM-MPM microscope allows simultaneous imaging with both modalities. This allows the microspheres to be visualized and their location within the cells to be determined.
Figure 1. (A) Schematic of integrated optical coherence and multiphoton microscope (BS, beam splitter; CCD, line
scan camera; DG, diffraction grating; M, mirror; HWP, half wave plate; PBS, polarizing beam splitter; PCF, photonic crystal fiber). (B) Diagram of the sample arm. The red beam is light coming from the laser source as well as light backscattered from the sample while the green beam is the two photon excited fluorescence.
A schematic of the microscope is shown in Figure 1(A). A dual spectrum laser source is implemented by splitting the output of a tunable Ti-sapphire laser into two beams, one for OCM and one for MPM. The details of this laser source has been previously described8. Briefly, the MPM beam is used directly for two photon excited fluorescence while the OCM beam is coupled into a photonic crystal fiber (LMA-5, crystal fiber) where the spectrum is broadened through supercontinuum generation. The beams are recombined in the sample arm of the interferometer using a polarizing beam splitter. This laser source enables tuning of the center wavelength of the laser to optimally excite fluorescence in MPM while maintaining a broad spectrum for enhanced optical sectioning in OCM. The interference pattern between scattered light in the sample arm and the reference beam is detected by a line CCD camera. OCM processing consists of computational dispersion correct and correction of coherence gate curvature caused by scanning of the beam. The details of the OCM processing architecture have been previously presented9.
The diagram of the sample arm is shown in Figure 1(B). The dual spectrum laser beam passes through a pair of scanning galvanometers before entering a beam expanding telescope. The beam is then focused by a 0.95 NA water immersion objective lens (XLUPLFL20XW, Olympus) onto the sample. Fluorescence generated at the focal volume is reflected by a dichroic mirror and focused to a PMT. Scattered light collected by the objective lens travels back along
Proc. of SPIE Vol. 7889 788926-2
Downloaded from SPIE Digital Library on 29 Feb 2012 to 192.17.250.190. Terms of Use: http://spiedl.org/terms

the beam path to the interferometer. An electromagnet situated below the sample is used to modulate the magnetic microspheres. Axial displacements of the particles and the cell can be detected at phase shifts in the OCM signal as a means for detecting the sample magnetomotive response. The amplitude and phase of the oscillations relative to the driving waveform is determined by the local mechanical environment of the magnetic transducers.
2.2 Diffraction phase microscopy and Fourier transform light scattering Diffraction phase microscopy (DPM) is a quantitative phase microscopy technique which provides the phase shift associated with transparent structures from single interferogrammeasurements10. DPM can supply detailed structural information of cells with submicron resolution. The schematic of a DPM system is shown in Figure 2(A). This type system has been previously described in detail10. Briefly, a transparent sample is illuminated by a narrow band laser source. Transmitted light is split into multiple diffraction orders using a diffraction grating. The interference between two spatially filtered diffraction orders is detected by a CCD array. Processing of this interference pattern allows the phase and amplitude of the transmitted light to be determined. Figure 2(B) is an example of a DPM image of red blood cells.
Figure 2. (A) Schematic of a diffraction phase microscope and (B) a quantitative phase image of red blood cells10.
FTLS is a novel approach to study static and dynamic light scattering, which combines the high spatial resolution (~0.5 μm) associated with DPM and intrinsic averaging of light scattering techniques 11.The underlying principle of FTLS is to retrieve the phase and amplitude associated with a DPM image and numerically propagate this field to the scattering plane.
A diagram of the experimental setup with DPM and FTLS is shown in Figure 3. Murine macrophages in a Petri dish were incubated with either MNPs or magnetic microspheres. A permanent magnet was used to mechanically excite magnetomotive transducers in the cells on the bottom of the 35 mm Petri dishes. In the experiments, the permanent magnet was spatially displaced by a mechanical wave driver at a frequency range of 0.5-2 Hz. Acquisition of DPM data during magnetic excitation allows phase changes of the sample to be determined.
Figure 3.Diagram of the experimental setup for magnetomotive measurements with DPM and FTLS.
2.3Magnetomotive transducers Various types of magnetomotive transducers were used in this study. These include iron oxide based magnetic nanoparticles (MNPs) and different types of magnetic microspheres. The experiments using the integrated OCM-MPM system were based on both fluorescent and non-fluorescent magnetic microspheres. The fluorescent microspheres are core/shell type particles with a core of iron oxide nanoparticles embedded in polymer and a shell of fluorescently labeled polymer (Bang Labs, ME04F/9486). There particles had a diameter ranging from 1-2 micrometers. Non-fluorescent microspheres were created in our laboratory and consisted of iron oxide nanoparticles suspended in vegetable oil with a surface coating of albumin. These particles had diameters ranging from 1-5 micrometers. Magnetomotive imaging
Proc. of SPIE Vol. 7889 788926-3
Downloaded from SPIE Digital Library on 29 Feb 2012 to 192.17.250.190. Terms of Use: http://spiedl.org/terms

experiments with DPM were based on MNPs (30 nm diameter). The MNPs (Ocean NanoTech #SHP-20) consisted of maghemite cores (exact ratio unknown) and COOH-terminated polymer coatings.
3. RESULTSAND DISCUSSION 3.1 Magnetomotive microscopy with integrated OCM-MPM Integrated OCM-MPM was demonstrated for high resolution magnetomotive microscopy on murine macrophages incubated with fluorescent microspheres. Imaging with this multimodal microscope allows single cells with engulfed microspheres to be easily located. Figure 4 shows simultaneously acquired OCM MPM images of the macrophages and microspheres. OCM visualizes individual cells while MPM give a high contrast view of the microspheres. Overlaying the two images allows cells with single microspheres to be identified as well as assessment of microsphere location within the cells.
Figure 4.(A) OCM, (B) MPM images of murine macrophages with engulfed fluorescent microspheres. (C) The overlay
of the OCM and MPM images helps to identify cells of interest for magnetomotive imaging.
For magnetomotive imaging a single cell was chosen that appeared to have a single microsphere engulfed. This cell and the microsphere are shown in an overlaid OCM-MPM image in Figure 5(A). The imaging beam can be positioned to a location of interest on the cell and OCM axial scans acquired over time. This type of data is called a motion-mode image (M-mode) and it allows the optical scattering as a function of depth to be observed over a period of time. Figure 5(B) shows an example of an M-mode image taken from this cell without any magnetic modulation. There are two depths of the sample that provide high scattering. The top surface corresponds to the cell surface and the engulfed microsphere while the lower surface is a reflection from the coverslip.
Figure 5.(A) OCM-MPM image of a single macrophage with an engulfed microsphere, (B) example of an M-mode
image showing the optical scatter from the microsphere, cell and coverslip as a function of time.
Acquisition of M-mode data during magnetic modulation of the sample allows the dynamic response of the microsphere and cell to be observed. As seen in the Figure 5(A), the beam was position to the location of the microsphere. M-mode data was acquired during modulation of the electromagnet with a 5 Hz sinusoidal waveform. The phase of the M-mode data from the depth of the microsphere can be used to determine its axial displacement. The axial displacement as function of time is shown in Figure 6(A). There is a clear displacement of the particle that correlates to the driving waveform of the electromagnet. The magnitude Fourier transform of this trace in Figure 6(A) shows a clear peak at 5 Hz.
Proc. of SPIE Vol. 7889 788926-4
Downloaded from SPIE Digital Library on 29 Feb 2012 to 192.17.250.190. Terms of Use: http://spiedl.org/terms
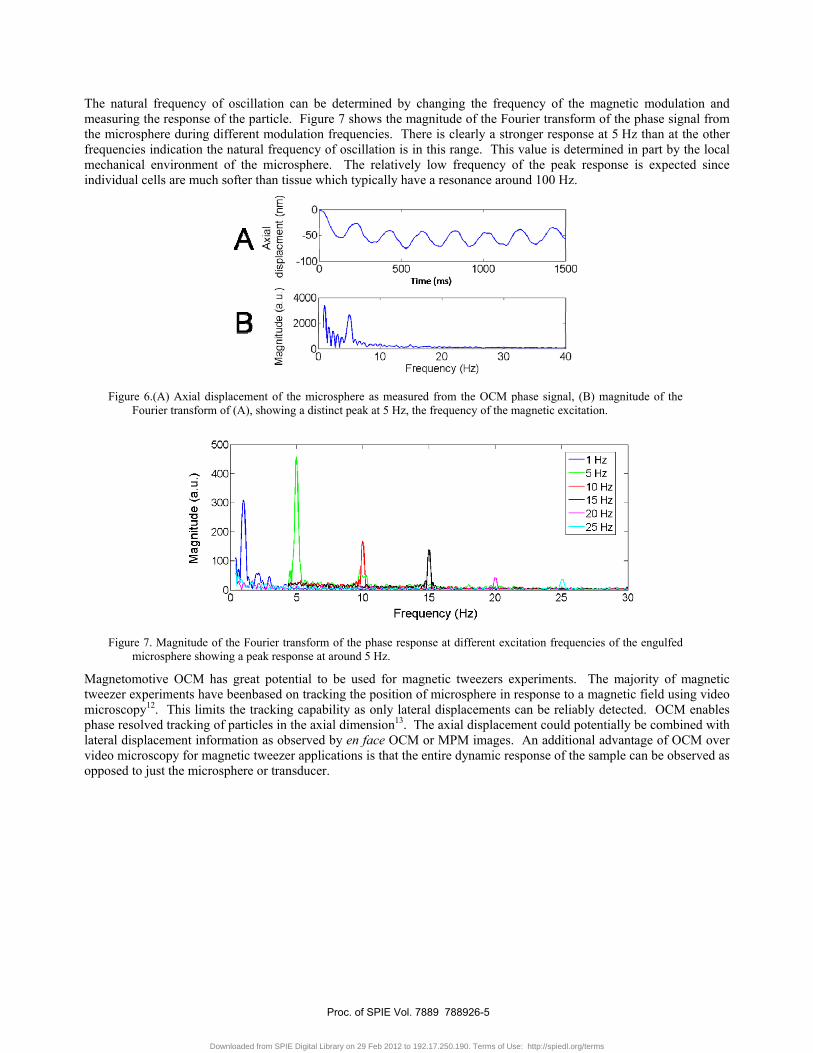
The natural frequency of oscillation can be determined by changing the frequency of the magnetic modulation and measuring the response of the particle. Figure 7 shows the magnitude of the Fourier transform of the phase signal from the microsphere during different modulation frequencies. There is clearly a stronger response at 5 Hz than at the other frequencies indication the natural frequency of oscillation is in this range. This value is determined in part by the local mechanical environment of the microsphere. The relatively low frequency of the peak response is expected since individual cells are much softer than tissue which typically have a resonance around 100 Hz.
Figure 6.(A) Axial displacement of the microsphere as measured from the OCM phase signal, (B) magnitude of the
Fourier transform of (A), showing a distinct peak at 5 Hz, the frequency of the magnetic excitation.
Figure 7. Magnitude of the Fourier transform of the phase response at different excitation frequencies of the engulfed
microsphere showing a peak response at around 5 Hz.
Magnetomotive OCM has great potential to be used for magnetic tweezers experiments. The majority of magnetic tweezer experiments have beenbased on tracking the position of microsphere in response to a magnetic field using video microscopy12. This limits the tracking capability as only lateral displacements can be reliably detected. OCM enables phase resolved tracking of particles in the axial dimension13. The axial displacement could potentially be combined with lateral displacement information as observed by en face OCM or MPM images. An additional advantage of OCM over video microscopy for magnetic tweezer applications is that the entire dynamic response of the sample can be observed as opposed to just the microsphere or transducer.
Proc. of SPIE Vol. 7889 788926-5
Downloaded from SPIE Digital Library on 29 Feb 2012 to 192.17.250.190. Terms of Use: http://spiedl.org/terms

Figure 8.Images of a mouse macrophage.(A) DPM image of the cell, (B) TEM image of nanoparticles engulfed by the
macrophage. Scale bar indicates 5 µm. Red arrows indicate nanoparticles. Unit for color bar is radians.
3.2 Magnetomotive imaging with DPM and FTLS
ADPM image of a macrophage is shown in figure 8, in which Figure 8(A) is the DPM image and Figure 8(B) is the TEM image, showing the engulfed nanoparticles. The first row of Figure 9 represents FTLS power spectra from the first dish of macrophages, which phagocytosed MNPs before imaging. Figure 9(A) shows the power spectrum without magnetic modulation, from which we can see that no obvious light scattering signal was detected, except for the DC components. Figure 9(B) shows the power spectrum with 1 Hz magnetic modulation while Figure 9(C) shows the power spectra with 2 Hz magnetic modulation. The second row of Figure 9 shows the FTLS power spectra of the second dish of macrophages, with no magnetic modulation, 1 Hz magnetic modulation, and 2 Hz magnetic modulation. Since there were no MNPs present in this Petri dish, the macrophages were not mechanically modulated by the magnetic fields, and thus no peaks in the power spectrum were detected.
The results suggest that this method can be used to detect cellular biomechanical properties, based on using the MNPs as nanotransducers, DPM as an imaging modality, and FTLS as an analysis tool. The magnitude of the peaks in the FTLS power spectrum can be used as an indication of how much the cells are deformed by the nanotransducers, and thus can be a representative parameter for the measurement of cellular biomechanical properties.
Figure 9.FTLS power spectra from macrophages. (A)-(C) Power spectra with nanoparticles. (D)-(F) Power spectra
without nanoparticles. (A) and (D) are power spectra with no magnetic field modulation. (B) and (E) are power spectra with 1 Hz magnetic field modulation. (C) and (F) are power spectra with 2 Hz magnetic field modulation. Arbitrary units for y axis.
Proc. of SPIE Vol. 7889 788926-6
Downloaded from SPIE Digital Library on 29 Feb 2012 to 192.17.250.190. Terms of Use: http://spiedl.org/terms

4. CONCLUSIONS Magnetomotive microscopy techniques for the investigation of cell dynamics and biomechanics are introduced and demonstrated on single cells. Magnetic nanoparticles and microspheres were used as magnetic transducers, while OCM/MPM and DPM/FTLS were used as optical coherence imaging modalities to image dynamic cell motions under the magnetic excitation. OCM provides structural images from the samples, MPM provides two-photon fluorescence from multifunctional microspheres, and magnetomotive OCM provides dynamic motion data from the samples during the magnetic mechanical excitation. DPM provides time-lapse quantitative phase images of the cells, while FTLS analysis provides the magnitude of the spectral peaks duringthe dynamic light scattering from the cells, which can be utilized as an averaged biomechanical property for the cell of interest. Magnetomotive microscopy has the potential for measuring cell biomechanical properties in vitro and in vivo, for more cell types, and especially for studying variations in cancer cell biomechanics during tumor development and metastasis.
5. ACKNOWLEDGEMENTS This work was supported in part by grants from the National Institutes of Health (NIH/NCI RC1 CA147096). We also would like to acknowledge support from the predoctoral National Institute of Environmental Health Sciences training program in endocrine, developmental and reproductive toxicology at the University of Illinois at Urbana-Champaign (for Benedikt W. Graf).
6. REFERENCES [1] A. B. Mathur, A. M. Collinsworth, W. M. Reichert, W. E. Kraus and G. A. Truskey, "Endothelial, cardiac
muscle and skeletal muscle exhibit different viscous and elastic properties as determined by atomic force microscopy," J. Biomech. 34, 1545-1553 (2001).
[2] N. Wang, J. P. Butler and D. E. Ingber, "Mechanotransduction across the cell-surface and through the cytoskeleton," Science 260, 1124-1127 (1993).
[3] A. L. Oldenburg, J. R. Gunther and S. A. Boppart, "Imaging magnetically labeled cells with magnetomotive optical coherence tomography," Opt. Lett. 30, 747-749 (2005).
[4] T. Islam and G. Wolf, "The pharmacokinetics of the lymphotropic nanoparticle MRI contrast agent ferumoxtran-10," Cancer Biomark. 5, 69-73 (2009).
[5] V. Crecea, A. L. Oldenburg, X. Liang, T. S. Ralston and S. A. Boppart, "Magnetomotive nanoparticle transducers for optical rheology of viscoelastic materials," Opt. Express 17, 23114-23122 (2009).
[6] C. Vinegoni, T. Ralston, W. Tan, W. Luo, D. L. Marks and S. A. Boppart, "Integrated structural and functional optical imaging combining spectral-domain optical coherence and multiphoton microscopy," Appl. Phys. Lett. 88, 053901 (2006).
[7] J. A. Izatt, M. R. Hee, G. M. Owen, E. A. Swanson and J. G. Fujimoto, "Optical coherence microscopy in scattering media," Opt. Lett. 19, 590-592 (1994).
[8] B. W. Graf, Z. Jiang, H. Tu and S. A. Boppart, "Dual-spectrum laser source based on fiber continuum generation for integrated optical coherence and multiphoton microscopy," J. Biomed. Opt. 14, 034019 (2009).
[9] B. W. Graf, S. G. Adie and S. A. Boppart, "Correction of coherence gate curvature in high numerical aperture optical coherence imaging," Opt. Lett. 35, 3120-3122 (2010).
[10] G. Popescu, T. Ikeda, R. R. Dasari and M. S. Feld, "Diffraction phase microscopy for quantifying cell structure and dynamics," Opt. Lett. 31, 775-777 (2006).
[11] H. F. Ding, Z. Wang, F. Nguyen, S. A. Boppart and G. Popescu, "Fourier Transform Light Scattering of Inhomogeneous and Dynamic Structures," Phys. Rev. Lett. 101(2008).
[12] A. R. Bausch, W. Moller and E. Sackmann, "Measurement of local viscoelasticity and forces in living cells by magnetic tweezers," Biophys. J. 76, 573-579 (1999).
[13] E. J. McDowell, A. K. Ellerbee, M. A. Choma, B. E. Applegate and J. A. Izatt, "Spectral domain phase microscopy for local measurements of cytoskeletal rheology in single cells," J. Biomed. Opt. 12(2007).
Proc. of SPIE Vol. 7889 788926-7
Downloaded from SPIE Digital Library on 29 Feb 2012 to 192.17.250.190. Terms of Use: http://spiedl.org/terms