Diffraction-induced coherence levels
11
Diffraction-induced coherence levels Alexander Tavrov, Joanna Schmit, Norbert Kerwien, Wolfgang Osten, and Hans Tiziani We examined the influence of complex diffraction effects on low-coherence fringes created for high-aspect depth-to-width ratio structures called trenches. The coherence function was analyzed for these micrometer-wide trenches and was registered with a white-light interference microscope. For some types of surface structure we observed that additional low-coherence fringes that do not correspond directly to the surface topology are formed near the sharp edges of the structures. These additional coherence fringes were studied by rigorous numerical evaluations of vector diffractions, and these simulated interference fields were then compared with experimental results that were obtained with a white-light interference microscope. © 2005 Optical Society of America OCIS codes: 630.1670, 180.3170, 120.3180, 120.2650, 129.665, 110.4980. 1. Introduction White-light interferometry 1–3 (WLI) is widely used both in the lab and in industry to determine micro- roughness and surface profiles of many elements such as micromechanical systems, patterns on semi- conductor wafers, and binary optics. WLI is based on the principle of low-coherence peak sensing and de- livers high-accuracy measurements with repeatabil- ity of the order of nanometers. However, when microstructures with high depth-to-width aspect ra- tios called trenches are measured, the fringes gener- ated by WLI systems may need careful interpretation of the interference field. In this paper we focus on WLI because optical coherence tomography, which is also based on low-coherence peak sensing but instead uses a single point source and a detector, is used mostly for measurements of biological samples, which are often a turbid type of medium in which these trenchlike surfaces are rather uncommon; how- ever, if they are encountered, a careful interpretation of the detected coherence will also be needed. No adequate explanation as to why these techniques may not reproduce the nominal depth of narrow trenches a few micrometers wide or why these mea- surements are strongly affected by the width and depth of the measured structures has yet been re- ported. Other factors such as numerical aperture (NA), magnification, polarization, and wavelength spectra also seem to influence the accuracy of the measurement. In this paper we outline the influence of diffraction effects on the coherence function cre- ated for trenches; we base our results on a rigorous simulation that models the imaging system in a WLI setup, and vector diffraction calculation is used for modeling the coherence functions created for topolo- gies with critical aspect ratios. The coherence function is examined for influences from the microstructure and the properties of the optical system. Vector diffraction images of the crit- ical topologies are analyzed for parameter variations under various imaging conditions by use of a white- light interference microscope. We compared the sim- ulated data with experimental measurements and found them in good qualitative agreement. Our sim- ulations 4 used mainly a software package that is based on rigorous coupled-wave analysis 5 (RCWA) and the Hopkins effective-source theory. 6 We ob- served that for some types of surface structure addi- tional coherence peaks are created that do not correspond directly to the surface topology. Because in the research reported in this paper we examined structures with two height levels, the coherence fringes that are created when one measures these structures appear at two levels also; we call these fringe localizations coherence levels. We found that additional coherence levels that do not correspond to When this research was conducted, A. Tavrov, N. Kerwien, W. Osten, and H. Tiziani were with the Institut für Technische Optics, University of Stüttgart, Pfaffenwaldring 9, D-70569 Stüttgart, Germany. A. Tavrov is now with the Tokyo University of Agricul- ture and Technology, 2-24-16 Naka-cho, Koganei-shi, Tokyo 184- 8588 Japan. J. Schmit ([email protected]) is with Veeco Instruments, Inc., 2650 East Elvira Road, Tucson, Arizona 85711. Received 26 February 2004; revised manuscript received 1 July 2004; accepted 16 November 2004. 0003-6935/05/112202-11$15.00/0 © 2005 Optical Society of America 2202 APPLIED OPTICS Vol. 44, No. 11 10 April 2005
-
Upload
independent -
Category
Documents
-
view
0 -
download
0
Transcript of Diffraction-induced coherence levels
Diffraction-induced coherence levels
Alexander Tavrov, Joanna Schmit, Norbert Kerwien,Wolfgang Osten, and Hans Tiziani
We examined the influence of complex diffraction effects on low-coherence fringes created for high-aspectdepth-to-width ratio structures called trenches. The coherence function was analyzed for thesemicrometer-wide trenches and was registered with a white-light interference microscope. For some typesof surface structure we observed that additional low-coherence fringes that do not correspond directly tothe surface topology are formed near the sharp edges of the structures. These additional coherence fringeswere studied by rigorous numerical evaluations of vector diffractions, and these simulated interferencefields were then compared with experimental results that were obtained with a white-light interferencemicroscope. © 2005 Optical Society of America
OCIS codes: 630.1670, 180.3170, 120.3180, 120.2650, 129.665, 110.4980.
1. Introduction
White-light interferometry1–3 (WLI) is widely usedboth in the lab and in industry to determine micro-roughness and surface profiles of many elementssuch as micromechanical systems, patterns on semi-conductor wafers, and binary optics. WLI is based onthe principle of low-coherence peak sensing and de-livers high-accuracy measurements with repeatabil-ity of the order of nanometers. However, whenmicrostructures with high depth-to-width aspect ra-tios called trenches are measured, the fringes gener-ated by WLI systems may need careful interpretationof the interference field. In this paper we focus onWLI because optical coherence tomography, which isalso based on low-coherence peak sensing but insteaduses a single point source and a detector, is usedmostly for measurements of biological samples,which are often a turbid type of medium in whichthese trenchlike surfaces are rather uncommon; how-ever, if they are encountered, a careful interpretationof the detected coherence will also be needed. Noadequate explanation as to why these techniques
may not reproduce the nominal depth of narrowtrenches a few micrometers wide or why these mea-surements are strongly affected by the width anddepth of the measured structures has yet been re-ported. Other factors such as numerical aperture(NA), magnification, polarization, and wavelengthspectra also seem to influence the accuracy of themeasurement. In this paper we outline the influenceof diffraction effects on the coherence function cre-ated for trenches; we base our results on a rigoroussimulation that models the imaging system in a WLIsetup, and vector diffraction calculation is used formodeling the coherence functions created for topolo-gies with critical aspect ratios.
The coherence function is examined for influencesfrom the microstructure and the properties of theoptical system. Vector diffraction images of the crit-ical topologies are analyzed for parameter variationsunder various imaging conditions by use of a white-light interference microscope. We compared the sim-ulated data with experimental measurements andfound them in good qualitative agreement. Our sim-ulations4 used mainly a software package that isbased on rigorous coupled-wave analysis5 (RCWA)and the Hopkins effective-source theory.6 We ob-served that for some types of surface structure addi-tional coherence peaks are created that do notcorrespond directly to the surface topology. Becausein the research reported in this paper we examinedstructures with two height levels, the coherencefringes that are created when one measures thesestructures appear at two levels also; we call thesefringe localizations coherence levels. We found thatadditional coherence levels that do not correspond to
When this research was conducted, A. Tavrov, N. Kerwien, W.Osten, and H. Tiziani were with the Institut für Technische Optics,University of Stüttgart, Pfaffenwaldring 9, D-70569 Stüttgart,Germany. A. Tavrov is now with the Tokyo University of Agricul-ture and Technology, 2-24-16 Naka-cho, Koganei-shi, Tokyo 184-8588 Japan. J. Schmit ([email protected]) is with VeecoInstruments, Inc., 2650 East Elvira Road, Tucson, Arizona 85711.
Received 26 February 2004; revised manuscript received 1 July2004; accepted 16 November 2004.
0003-6935/05/112202-11$15.00/0© 2005 Optical Society of America
2202 APPLIED OPTICS � Vol. 44, No. 11 � 10 April 2005
the surface topology may be caused by the diffractionof narrow structures and that these additional coher-ence levels must be properly interpreted in WLI andoptical coherence tomography systems.
2. Principles of White-Light Interferometry
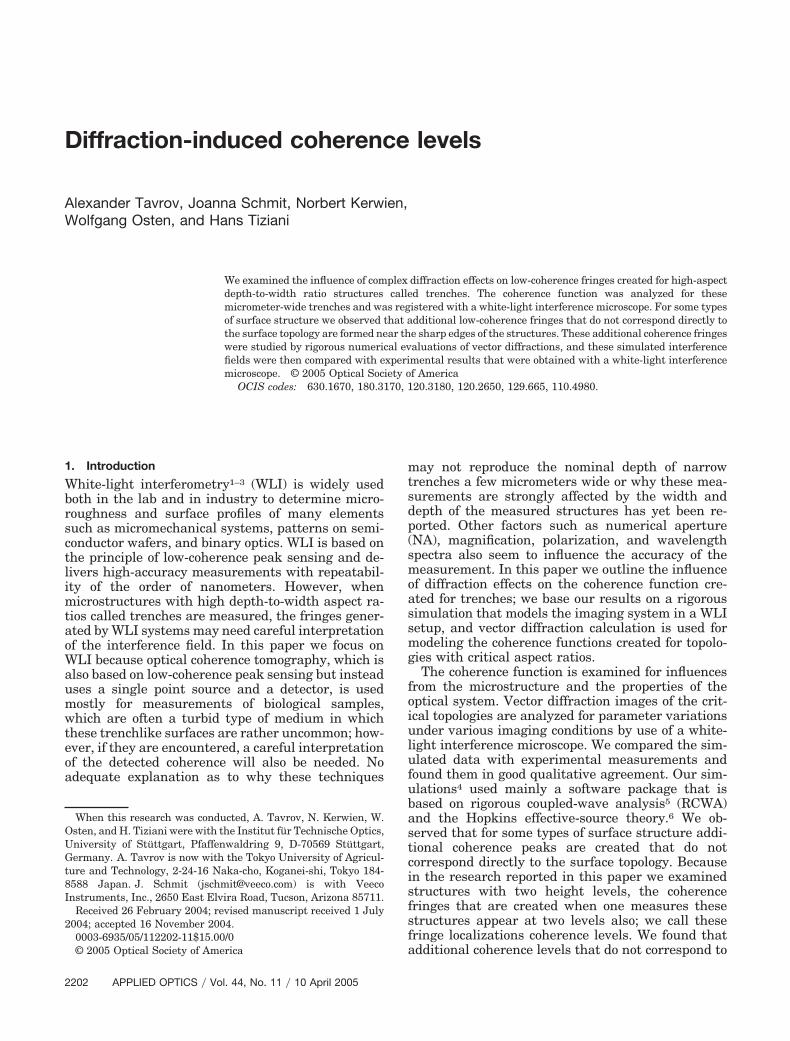
To articulate the principles of a WLI system we use atwo-beam interferometer that contains a beam split-ter and two ideal mirrors in the arms of the inter-ferometer. The object under test is illuminated withmultiple plane waves of different frequencies, whichresult from using a broadband spectral illuminationsource, and at different angles, which are determinedby the NA of the objective. The maximum contrast ofthe interference fringes is observed when the opticalpath difference in the interferometer arms ap-proaches zero (see Fig. 1). In an ideal case (in whichthe influence of the NA of the objective is neglected)the fringe contrast can be described as an autocorre-lation function and can be calculated as the Fouriertransform of the illumination spectrum F���:
� �� F(�)F(� � �z)d�, (1)
where �z is the optical path difference.If we assume that the mirror in the object arm of
the interferometer is replaced by two infinitely thinparallel glass plates (optical interfaces), then, whilethe second mirror performs the scan along the opticalaxis, we will observe two main maxima of fringe con-trast with their axial locations corresponding to thesurfaces of the first and second glass plates. In WLI ifthese glass plates are not perfectly flat, their surfacetopology will be measured in a single scan becauseWLI is a whole-field measuring technique whereas inoptical coherence tomography the positions of themaximal fringe contrast are detected by an axial scanfor each lateral coordinate, which results in the re-construction of the surface topology of the glass platein three-dimensional coordinates.
This geometrical approach to fringe formation atthe locations that correspond to the optical interfacesyields a robust approximation of the surface topology
of large-scale structures. The approach works bestwhen the central wavelength of the illuminationsource is smaller than the size of the structures onthe tested surface and when the effects of diffractionand scattering are negligible. However, this geomet-rical model has difficulty in describing topologies ofsmall structures; these topologies include rough sur-faces, surfaces with material inhomogeneities, andtopologies that contain geometries with small width-to-depth aspect ratios. For each of these topologies,diffraction and scattering effects play an importantrole in the fringe field formation.
Thus we have found that the position of the coher-ence level that is the interference contrast maximumcorresponds to the optical interface only within thegeometric optics approximation. For small spatialstructures special precautions need to be taken ininterpreting fringes. The most critical point is inter-preting the lateral position of the coherence level,because we have found that several fringe contrastmaxima may be situated in the edge area. Moreover,these additional fringe contrast maxima can expandand vary quite far away from the edges of the struc-tures and form additional coherence levels, which wecall diffraction-induced coherence levels. The form,amplitude, and location of these coherence levels de-pend on the object structure as well as on imagingparameters such as illumination spectrum, polariza-tion, and NA. These additional coherence levels stillcannot be explained by a simple diffraction approachbecause the effects are seen not only within closeproximity to the edges of the structures but also quitefar away from the edges. They are not second-ordercoherence levels or any multiple of the main coher-ence level. Diffraction effects are commonly known asdispersive effects, and they result in different imagesfor different wavelengths. In this paper we examinethe result of integration over the wavelength’s spec-trum and the outline’s complex fringe contrast, whichdetermines the properties of the coherence function.
These additional and quite unusual coherencelevels, which do not correspond to the positions ofactual optical interfaces in three-dimensionalspace, may be explained by complex vector diffrac-tion theory in wideband spectral light. The expla-nation for these diffraction effects lies in theproperties and the propagation of the coherencefunction. To study these complex diffraction effectsin microscopes we employ rigorous simulation ofvector diffraction fields. This approach can also ac-count for different polarization states in the illumi-nation and detection paths, and it was successfullyused to show the dependence of the measurementresults of submicrometer-wide trenches on the po-larization used in the optical setup.4 If the linearpolarization is set parallel to the tested trench ge-ometry, this TE mode will reproduce the nominallinewidth of the trench more accurately than theTM mode for which the polarization vector is setorthogonally to the trench. That this polarizationdependence is also visible in WLI measurementsfurthers our argument that these additional coher-
Fig. 1. Schematic of the white-light interferometry setup.
10 April 2005 � Vol. 44, No. 11 � APPLIED OPTICS 2203
ence levels need to be evaluated by use of complexvector diffraction theory. To study the presence ofthese additional coherence levels and their depen-dence on the system and the micrometer trenchstructure characteristics, we simulated the fringefield in a white-light interference microscope setup,using the complex vector diffraction approach, andwe compared these results with those for the fringefield obtained in a commercially available micro-scope.
3. Rigorous Coupled-Wave (Modal) Method
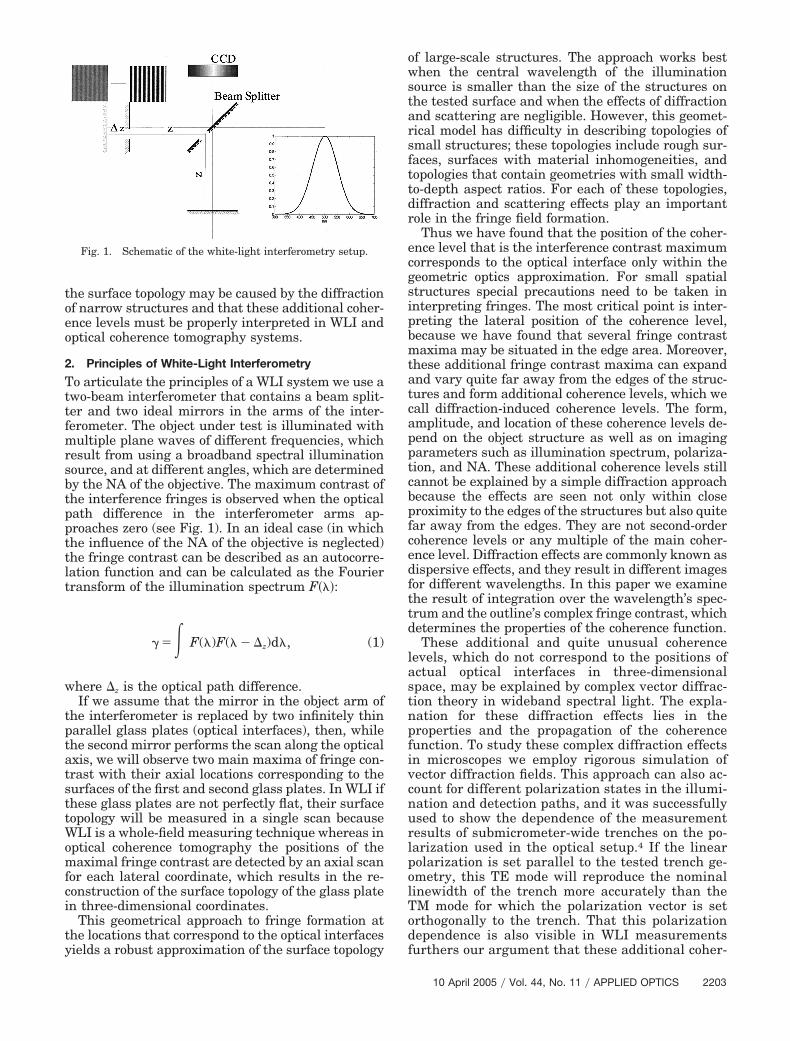
To trace different polarization components in a for-mation of a diffraction image we applied RCWA5,7
and the Hopkins image-formation theory of effectivesource.6 We used MicroSim software, which incorpo-rates rigorous routines to simulate images for polar-ization and interference microscopy.8,9 For oursimulations we applied a WLI optical setup based ona Linnik interference microscope (Fig. 2) with polar-ization elements to control the polarization in theillumination and imaging paths. The spectral distri-bution of the illumination source was simulated tohave a Gaussian profile (50-nm semiwidth) with con-tinuous spectral distribution approximated by 81equidistantly distributed wavelengths and a centralwavelength of 610 nm. The source is imaged by thecondenser lens into the entrance pupil of the objec-tive, fulfilling the Köhler illumination principle, andthe entrance pupil is located at the back focal plane ofthe objective.
The imaging is partially coherent, and coherenceparameter � is defined by the ratio of the effective NAof the illumination system, NAil, to the NA of theimaging system, NAobj:
� �NAil
NAobj. (2)
We consider the typical parameters for a WLI micro-scope: NAil � NAobj � 0.1. . . 0.3. As described abovein Section 2, the beam splitter splits and directs thebeams to the reference and the measurement arms.One beam is reflected from the sample, and the sec-ond beam is reflected from the reference mirror; thenthe two beams are recombined to produce an inter-ference pattern, which is imaged by the relay lens inthe CCD plane. The CCD plane is conjugate to boththe sample and the reference mirror planes.
To control the polarization state of the microscopeillumination we insert a linear polarizer into the il-lumination path (position 11 in Fig. 2). A second lin-ear polarizer is inserted into the imaging path(position 12) to control the polarization state in theimaging part of the microscope.
For simulation purposes the pupils of the objectiveswhere the images of the source are created are di-vided into checkerboard patches, which make up theeffective source. A single patch of pupil correspondsto a fraction of the NA of the objective, namely,�NA � 0.05. Each patch generates a plane waveobliquely incident onto the object. The wave interactswith the object and produces the spatial-frequencyspectrum in the exit pupil of the microscope objective.The final image is the incoherent sum of all the im-ages produced by the different regions of the effectivesource. We obtained the three-dimensional distribu-tion of the nonnormalized Jones vector given by
Jx, y, z � ��
L(k�)
���
H(k, �)exp(ik, � · r)cos1�2()�Ex(k, �)
Ey(k, �)�2
,
(3)
where L�kt� is the effective-source intensity and H�kt�is the coherent transfer function of the objective.E�kt� is the Fourier spectrum of the structure imagethat corresponds to the incident field given by prop-agation vector k for each angular mode in the illumi-nation pupil and is denoted here by subscript � and inthe object pupil by subscript �: cos��1�2 � �k0
2 � kx2
� ky2�1�2�k0. The Fourier spectrum E�kt� is computed
by use of the RCWA.5,7 In these simulations we usedthe rapidly convergent version of the RCWA.
In our study we used nominal surface topology pa-rameters such as height and width in the micrometerrange. Surface structures were represented as expan-sions in the gratings. Step structures were simulatedby use of a large grating constant. To ensure theaccuracy of the representation of surface structures,the grating parameters needed to be chosen withcare. As a twofold improvement in representationaccuracy results in a four-times increase in compu-tational time, the optimal period and mode numberhad to be found. We decided that sufficient accuracy
Fig. 2. Linnik interferometer microscope: 1, light source; 2, fieldstop; 3, condenser lens; 4, microscope objective in the measurementarm; 5, beam splitter; 6, microscope objective in the reference arm;7, reference mirror; 8, measured object; 9, CCD lens; 10, CCD; 11,linear polarizer; 12, analyzer.
2204 APPLIED OPTICS � Vol. 44, No. 11 � 10 April 2005
is achieved with a grating period 10 times smallerthan that of a single surface structure and using 50angular modes. The convergence and accuracy werechecked for small line widths where the convergencehas shown to be most critical. Especially for the TMmode the convergence is also critical; neverthelessthe computation shown is related mainly to the TEmode.
We next simulated correlograms and other inter-ferometric images such as fringe contrast and phaseand object shape. The complex contrast10 of a corre-logram results from the interference of two waveswith different Jones vectors, J1 and J2, and is denotedA in Eq. (4) below. Complex contrast A can be alsodescribed by the measured quantities’ interferencecontrast �, mutual intensity I0, and phase �:
A � J1TJ2
* (4)
�I0� exp(i)
2 , (5)
where a superscript T indicates a transpose operationand an asterisk denotes complex conjugation. Thenthe detected intensity I of the correlogram is given by
I � (J1 � J2)T(J1 � J2)
* (6)
� I0[1 � � cos()]. (7)
In interferometry the image in the object arm, J1� Jx, y, z, which is computed by Eq. (3), is comparedwith the image in the reference arm, which is approx-imated here as a plane isotropic surface. Jones vectorJ2 in the reference arm corresponds to the polariza-tion on input. For this paper we assume that J2 iseither linearly or circularly polarized. Linear polar-ization with its azimuth � � 0° corresponds to theTM mode, and an azimuth of � � 90° corresponds tothe TE polarization mode:
J2 � [cos(�), sin(�)]. (8)
Circular polarization is described by the Jones vector
J2 �1
2[1, i]. (9)
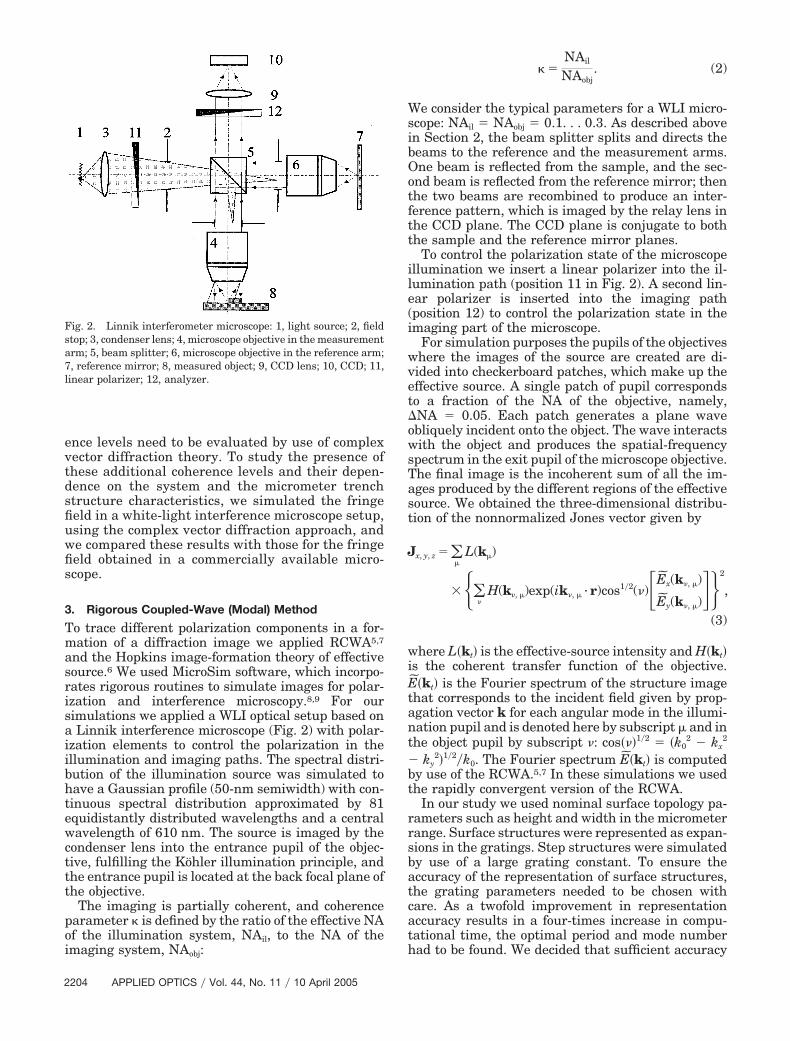
Intensity I of correlograms from Eq. (6) was ana-lyzed with a conventional four-step phase-shift algo-rithm,11,12 where phase shift � � �2 was determinedat central wavelength �0 and added in the object armin a stepwise manner. This resulted in a certain de-focus for the each step, so the corresponding image ateach defocused position was evaluated by free-spacepropagation from the focal position. We collectedgroups of consequent intensities I [Eq. (6)] of thecorrelogram for four defocused positions to evaluateinterference variables I0, �, and � from Eq. (7) foreach iteration. Finally, we summed the intensities ofthe fringes created for each given wavelength fromthe simulated spectrum to recreate a three-dimensional low-coherence correlogram. Figure 3shows the results of the simulated correlogram inten-sity for a 5-�m-wide and 23-�m-deep trench as seenduring a single scan along the optical axis by a line ofpixels perpendicular to the trench.
4. Simulation Results
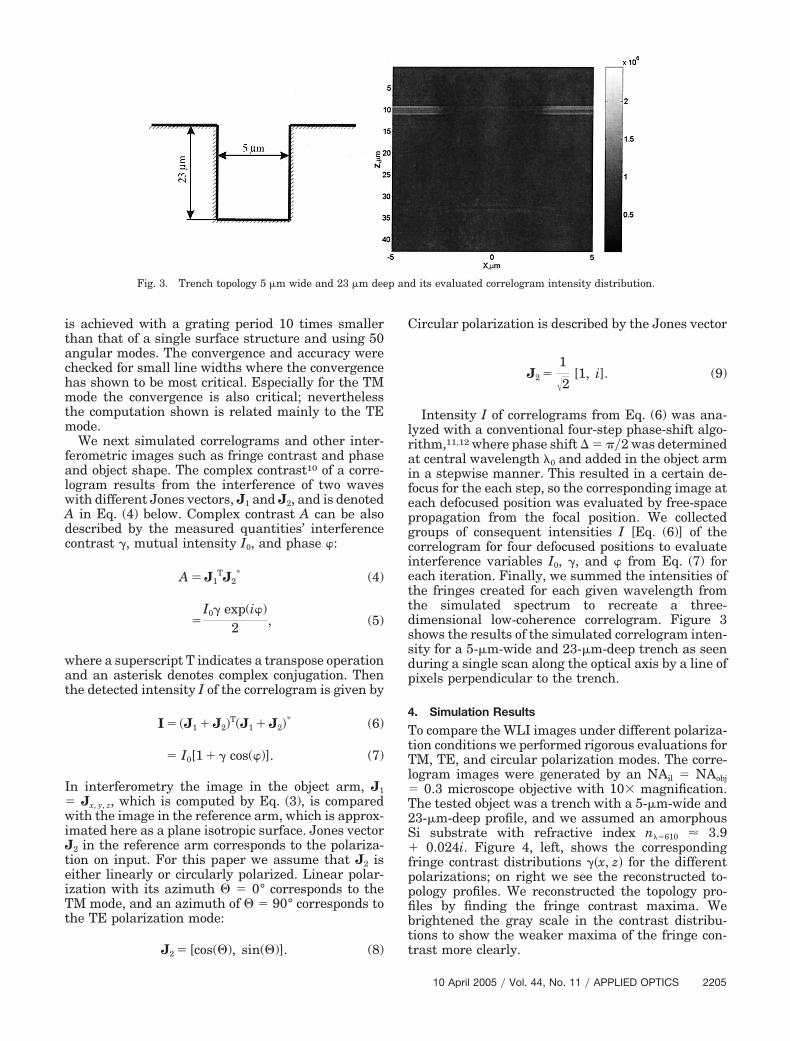
To compare the WLI images under different polariza-tion conditions we performed rigorous evaluations forTM, TE, and circular polarization modes. The corre-logram images were generated by an NAil � NAobj� 0.3 microscope objective with 10� magnification.The tested object was a trench with a 5-�m-wide and23-�m-deep profile, and we assumed an amorphousSi substrate with refractive index n��610 � 3.9� 0.024i. Figure 4, left, shows the correspondingfringe contrast distributions ��x, z� for the differentpolarizations; on right we see the reconstructed to-pology profiles. We reconstructed the topology pro-files by finding the fringe contrast maxima. Webrightened the gray scale in the contrast distribu-tions to show the weaker maxima of the fringe con-trast more clearly.
Fig. 3. Trench topology 5 �m wide and 23 �m deep and its evaluated correlogram intensity distribution.
10 April 2005 � Vol. 44, No. 11 � APPLIED OPTICS 2205

Both TE modes [Fig. 4(d)] and the circular polar-ization mode [Fig. 4(f)] reconstructed the 5-�m trenchwidth well, registering a 4.5-�m trench width. How-
ever, the width reconstruction in TM polarization[Fig. 4(b)] came in at 2.5 �m, which is two timessmaller than the nominal width. The lateral dimen-
Fig. 4. Left, the fringe contrast distributions for trench topology 5 �m wide and 23 �m deep. Right, the reconstructed correspondingtrench profiles. (a), (b) TM; (c), (d) TE; (e), (f) circular polarization.
2206 APPLIED OPTICS � Vol. 44, No. 11 � 10 April 2005
sions of these kinds of deep topology are best mea-sured by use of TE or circular polarization modes.
If the trench were rotated by 90° in the field of view,the TM mode would give the same results as the TEmode. The polarization dependence of the recon-structed profile shows that, near the topology edge,the fringe contrast has its maximum on the upper orlower level, depending on the vector diffraction imageof the topology, so the diffraction effects are domi-nant.
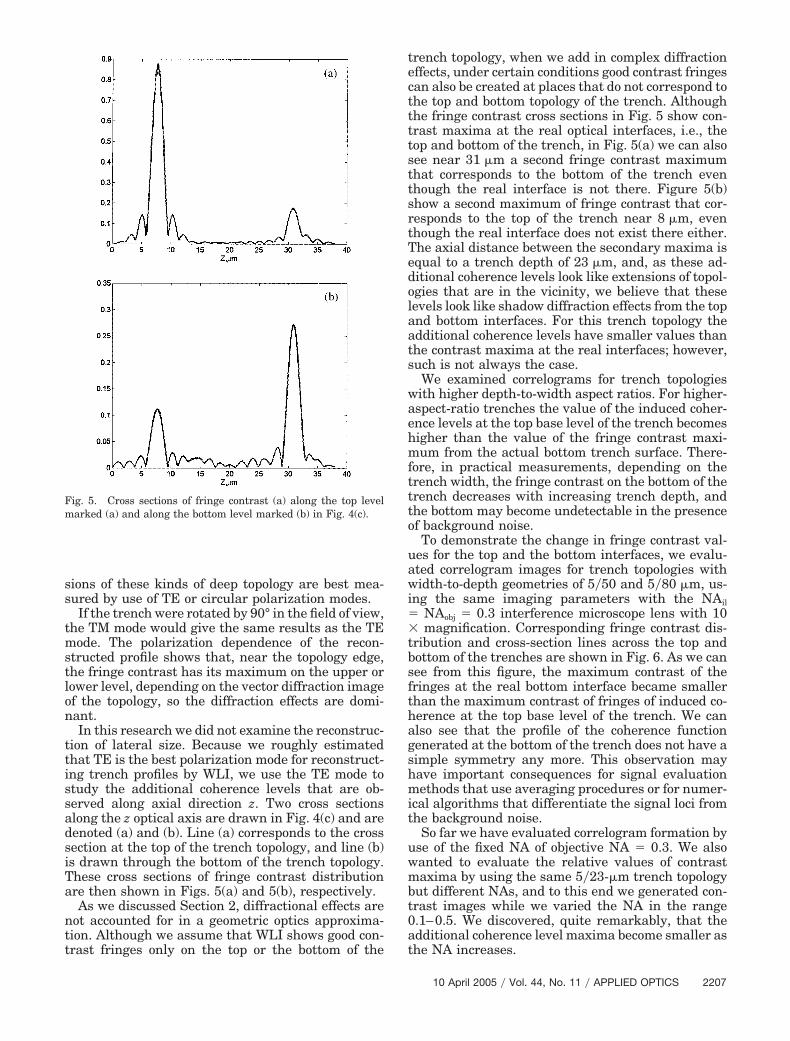
In this research we did not examine the reconstruc-tion of lateral size. Because we roughly estimatedthat TE is the best polarization mode for reconstruct-ing trench profiles by WLI, we use the TE mode tostudy the additional coherence levels that are ob-served along axial direction z. Two cross sectionsalong the z optical axis are drawn in Fig. 4(c) and aredenoted (a) and (b). Line (a) corresponds to the crosssection at the top of the trench topology, and line (b)is drawn through the bottom of the trench topology.These cross sections of fringe contrast distributionare then shown in Figs. 5(a) and 5(b), respectively.
As we discussed Section 2, diffractional effects arenot accounted for in a geometric optics approxima-tion. Although we assume that WLI shows good con-trast fringes only on the top or the bottom of the
trench topology, when we add in complex diffractioneffects, under certain conditions good contrast fringescan also be created at places that do not correspond tothe top and bottom topology of the trench. Althoughthe fringe contrast cross sections in Fig. 5 show con-trast maxima at the real optical interfaces, i.e., thetop and bottom of the trench, in Fig. 5(a) we can alsosee near 31 �m a second fringe contrast maximumthat corresponds to the bottom of the trench eventhough the real interface is not there. Figure 5(b)show a second maximum of fringe contrast that cor-responds to the top of the trench near 8 �m, eventhough the real interface does not exist there either.The axial distance between the secondary maxima isequal to a trench depth of 23 �m, and, as these ad-ditional coherence levels look like extensions of topol-ogies that are in the vicinity, we believe that theselevels look like shadow diffraction effects from the topand bottom interfaces. For this trench topology theadditional coherence levels have smaller values thanthe contrast maxima at the real interfaces; however,such is not always the case.
We examined correlograms for trench topologieswith higher depth-to-width aspect ratios. For higher-aspect-ratio trenches the value of the induced coher-ence levels at the top base level of the trench becomeshigher than the value of the fringe contrast maxi-mum from the actual bottom trench surface. There-fore, in practical measurements, depending on thetrench width, the fringe contrast on the bottom of thetrench decreases with increasing trench depth, andthe bottom may become undetectable in the presenceof background noise.
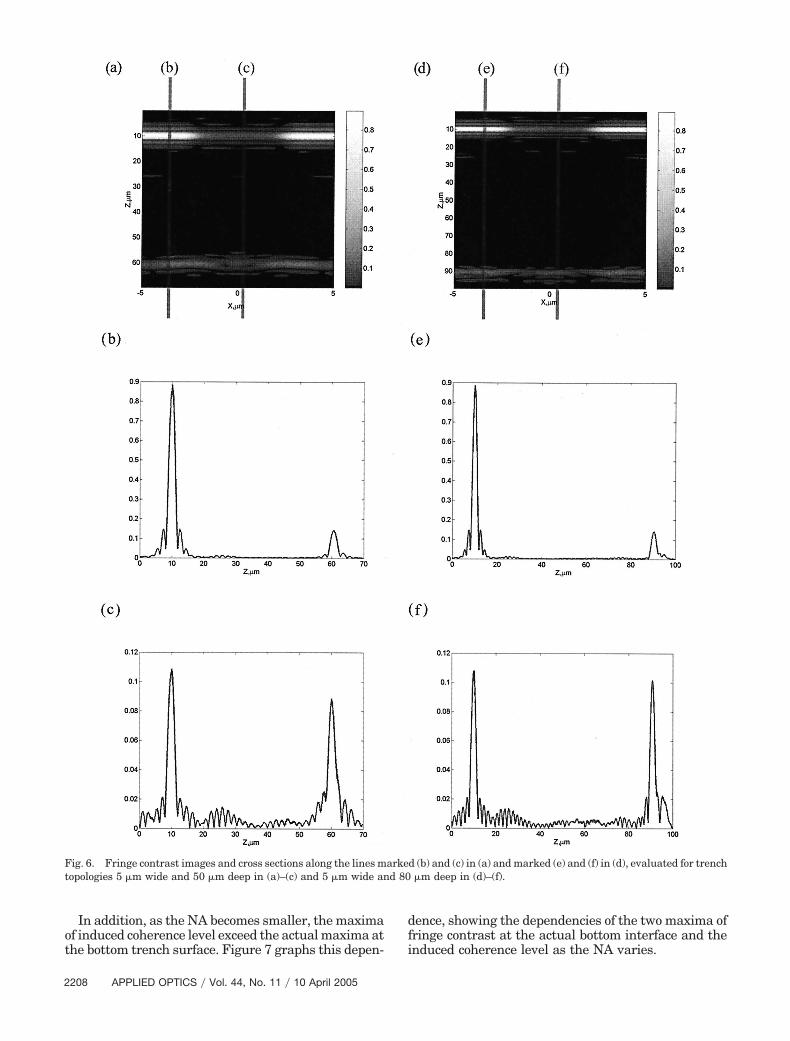
To demonstrate the change in fringe contrast val-ues for the top and the bottom interfaces, we evalu-ated correlogram images for trench topologies withwidth-to-depth geometries of 5�50 and 5�80 �m, us-ing the same imaging parameters with the NAil� NAobj � 0.3 interference microscope lens with 10� magnification. Corresponding fringe contrast dis-tribution and cross-section lines across the top andbottom of the trenches are shown in Fig. 6. As we cansee from this figure, the maximum contrast of thefringes at the real bottom interface became smallerthan the maximum contrast of fringes of induced co-herence at the top base level of the trench. We canalso see that the profile of the coherence functiongenerated at the bottom of the trench does not have asimple symmetry any more. This observation mayhave important consequences for signal evaluationmethods that use averaging procedures or for numer-ical algorithms that differentiate the signal loci fromthe background noise.
So far we have evaluated correlogram formation byuse of the fixed NA of objective NA � 0.3. We alsowanted to evaluate the relative values of contrastmaxima by using the same 5�23-�m trench topologybut different NAs, and to this end we generated con-trast images while we varied the NA in the range0.1–0.5. We discovered, quite remarkably, that theadditional coherence level maxima become smaller asthe NA increases.
Fig. 5. Cross sections of fringe contrast (a) along the top levelmarked (a) and along the bottom level marked (b) in Fig. 4(c).
10 April 2005 � Vol. 44, No. 11 � APPLIED OPTICS 2207
In addition, as the NA becomes smaller, the maximaof induced coherence level exceed the actual maxima atthe bottom trench surface. Figure 7 graphs this depen-
dence, showing the dependencies of the two maxima offringe contrast at the actual bottom interface and theinduced coherence level as the NA varies.
Fig. 6. Fringe contrast images and cross sections along the lines marked (b) and (c) in (a) and marked (e) and (f) in (d), evaluated for trenchtopologies 5 �m wide and 50 �m deep in (a)–(c) and 5 �m wide and 80 �m deep in (d)–(f).
2208 APPLIED OPTICS � Vol. 44, No. 11 � 10 April 2005

5. Experimental Results
Experiments were performed with the NT 3000 opti-cal profiler produced by Veeco Instruments, Inc. Theinstrument employed an objective lens with a NA of0.4 and magnification of 20�; the CCD lateral sam-pling was 497 nm, and the detected central wave-length of a halogen lamp was 615 nm. The spectrumhad a quasi-Gaussian profile with 150-nm semi-width. Silicon gratings with a 5- and 10-�m-widetrenches repeated every 9 and 14 �m were measured.
Figure 8 shows the WLI images through focusalong the line of pixels perpendicular to the gratingwith the 9-�m period. Figure 8(a) shows the correlo-gram’s intensity distribution, Fig. 8(b) is the recon-structed fringe contrast distribution, and Fig. 8(c) isthe topology reconstruction. The criterion of maxi-mum contrast was also implemented here to recon-struct the trench topologies. In Fig. 8(b) two lines, (d)and (e), are marked that show the loci of the cross
Fig. 7. Contrast versus NA for the induced coherence level con-trast maximum (darker curve) and for fringes at the bottom actualinterface (lighter curve), evaluated for the trench topology with5�23-�m geometry.
Fig. 8. WLI measurements of the topology for 9-�m-period and 5-�m-wide trench gratings: (a) correlogram; (b) fringe contrast; (c)reconstructed profile; (d), (e) cross sections of the contrast image along the lines marked in (b).
10 April 2005 � Vol. 44, No. 11 � APPLIED OPTICS 2209
sections made through the top and the bottom of thetopology. These cross sections are shown as subplotsin Figs. 8(d) and 8(e). Based on the simulations de-scribed above, we can say that the reconstructeddepth was always correct, so here the nominal depthwas �15 �m. The profile reconstruction in the lateraldimension is uncertain because we used a maximumcontrast algorithm that is not optimized for the vary-ing ratio of the fringe contrast along the inducedcoherence level and the fringes at the bottom of thetrench.
Cross sections of the fringe contrast distribution,presented in Figs. 8(d) and 8(e), show two clear max-ima where the induced coherence level (smaller con-trast) maximum may be caused by complex diffraction;these measurement results are similar to what weobtained in the computer simulations. We can comparethese results qualitatively with the simulated crosssections in Figs. 5(a) and 5(b). Both results show also
that the fringes at the bottom of the trench extendbeyond the physical limits of the trench.
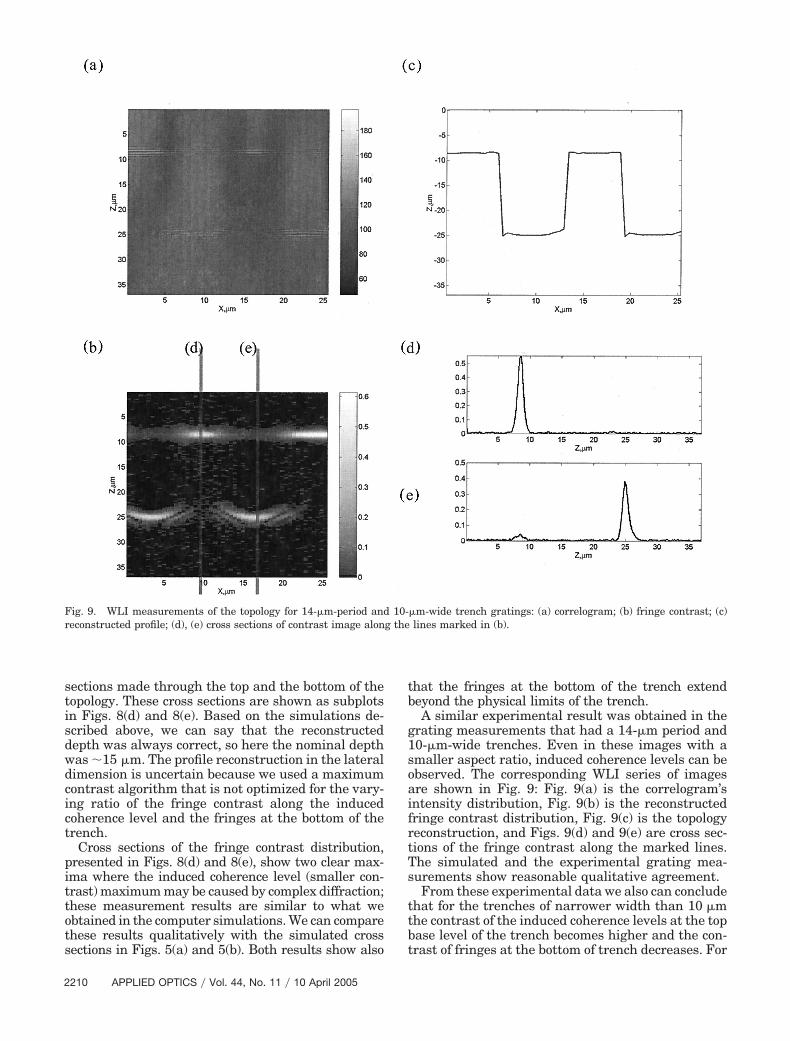
A similar experimental result was obtained in thegrating measurements that had a 14-�m period and10-�m-wide trenches. Even in these images with asmaller aspect ratio, induced coherence levels can beobserved. The corresponding WLI series of imagesare shown in Fig. 9: Fig. 9(a) is the correlogram’sintensity distribution, Fig. 9(b) is the reconstructedfringe contrast distribution, Fig. 9(c) is the topologyreconstruction, and Figs. 9(d) and 9(e) are cross sec-tions of the fringe contrast along the marked lines.The simulated and the experimental grating mea-surements show reasonable qualitative agreement.
From these experimental data we also can concludethat for the trenches of narrower width than 10 �mthe contrast of the induced coherence levels at the topbase level of the trench becomes higher and the con-trast of fringes at the bottom of trench decreases. For
Fig. 9. WLI measurements of the topology for 14-�m-period and 10-�m-wide trench gratings: (a) correlogram; (b) fringe contrast; (c)reconstructed profile; (d), (e) cross sections of contrast image along the lines marked in (b).
2210 APPLIED OPTICS � Vol. 44, No. 11 � 10 April 2005
trenches of 15 �m and wider we did not detect thepresence of induced coherence levels.
We observed the influence of varying the NA of theobjective used for measurement and the depth of thetrench on contrast of the fringes. We registered cor-relograms for a 5-�m-wide and 15-�m-deep trench,using 10� 0.3-NA and 50� 0.55-NA objectives, andobserved a relation similar to that shown in Fig. 7between fringe contrasts. The contrast of fringes atthe induced coherence level is lower than the contrastof fringes at the bottom of trench, and both decreasewith higher-NA objectives.
As for trenches of the same width but differentdepth, using a 10� 0.3-NA objective we observed thatfor trenches 5 �m wide and 40 �m deep the contrastof the fringes at the bottom of trench decreased toapproximately the value of the induced coherencelevel contrast. This result agrees very well with theresults for simulated data for a 5-�m-wide and50-�m-deep trench, as shown in Fig. 6(c). Fortrenches 10 and 15 �m deep the contrast of thefringes at the bottom of the trench was a few timeshigher then at the induced coherence level.
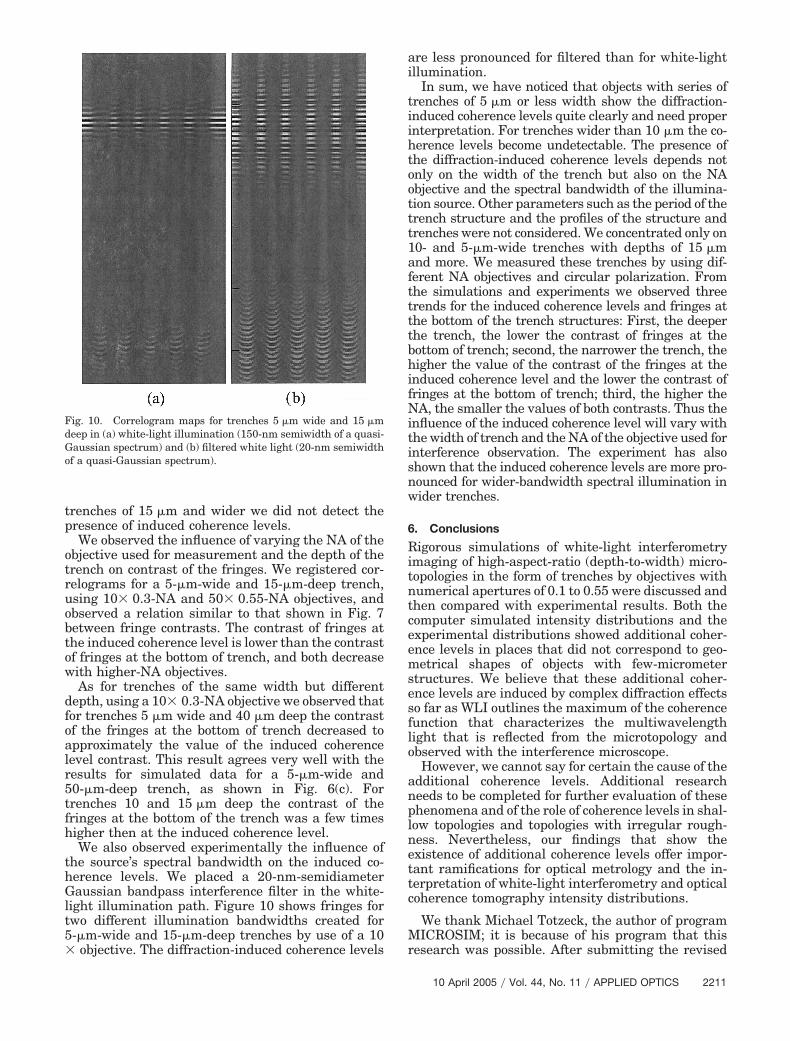
We also observed experimentally the influence ofthe source’s spectral bandwidth on the induced co-herence levels. We placed a 20-nm-semidiameterGaussian bandpass interference filter in the white-light illumination path. Figure 10 shows fringes fortwo different illumination bandwidths created for5-�m-wide and 15-�m-deep trenches by use of a 10� objective. The diffraction-induced coherence levels
are less pronounced for filtered than for white-lightillumination.
In sum, we have noticed that objects with series oftrenches of 5 �m or less width show the diffraction-induced coherence levels quite clearly and need properinterpretation. For trenches wider than 10 �m the co-herence levels become undetectable. The presence ofthe diffraction-induced coherence levels depends notonly on the width of the trench but also on the NAobjective and the spectral bandwidth of the illumina-tion source. Other parameters such as the period of thetrench structure and the profiles of the structure andtrenches were not considered. We concentrated only on10- and 5-�m-wide trenches with depths of 15 �mand more. We measured these trenches by using dif-ferent NA objectives and circular polarization. Fromthe simulations and experiments we observed threetrends for the induced coherence levels and fringes atthe bottom of the trench structures: First, the deeperthe trench, the lower the contrast of fringes at thebottom of trench; second, the narrower the trench, thehigher the value of the contrast of the fringes at theinduced coherence level and the lower the contrast offringes at the bottom of trench; third, the higher theNA, the smaller the values of both contrasts. Thus theinfluence of the induced coherence level will vary withthe width of trench and the NA of the objective used forinterference observation. The experiment has alsoshown that the induced coherence levels are more pro-nounced for wider-bandwidth spectral illumination inwider trenches.
6. Conclusions
Rigorous simulations of white-light interferometryimaging of high-aspect-ratio (depth-to-width) micro-topologies in the form of trenches by objectives withnumerical apertures of 0.1 to 0.55 were discussed andthen compared with experimental results. Both thecomputer simulated intensity distributions and theexperimental distributions showed additional coher-ence levels in places that did not correspond to geo-metrical shapes of objects with few-micrometerstructures. We believe that these additional coher-ence levels are induced by complex diffraction effectsso far as WLI outlines the maximum of the coherencefunction that characterizes the multiwavelengthlight that is reflected from the microtopology andobserved with the interference microscope.
However, we cannot say for certain the cause of theadditional coherence levels. Additional researchneeds to be completed for further evaluation of thesephenomena and of the role of coherence levels in shal-low topologies and topologies with irregular rough-ness. Nevertheless, our findings that show theexistence of additional coherence levels offer impor-tant ramifications for optical metrology and the in-terpretation of white-light interferometry and opticalcoherence tomography intensity distributions.
We thank Michael Totzeck, the author of programMICROSIM; it is because of his program that thisresearch was possible. After submitting the revised
Fig. 10. Correlogram maps for trenches 5 �m wide and 15 �mdeep in (a) white-light illumination (150-nm semiwidth of a quasi-Gaussian spectrum) and (b) filtered white light (20-nm semiwidthof a quasi-Gaussian spectrum).
10 April 2005 � Vol. 44, No. 11 � APPLIED OPTICS 2211
manuscript, we learned that an additional coherencelevel for an object 5 �m high and 5 �m wide hadpreviously been observed13; however, no explanationfor this phenomenon was given.
References1. P. J. Caber, “Interferometric profiler for rough surfaces,” Appl.
Opt. 32, 3438–3441 (1993).2. M. Fleischer, R. Windecker, and H. J. Tiziani, “Theoretical
limits of scanning white-light interferometry signal evaluationalgorithms,” Appl. Opt. 40, 2815–2820 (2001).
3. L. Deck and P. de Groot, “High-speed noncontact profiler basedon scanning white-light interferometry,” Appl. Opt. 33, 7334–7338 (1994).
4. A. Tavrov, M. Totzeck, N. Kerwien, and H. J. Tiziani, “Rigorouscoupled-wave analysis calculus of sub micrometer interferencepattern and resolving edge position versus signal-to-noise ra-tio,” Opt. Eng. 41, 1886–1892 (2002).
5. M. G. Moharan, E. B. Grann, D. A. Pommet, and T. K. Gaylord,“Formulation for stable and efficient implementation of therigorous coupled-wave analysis of binary gratings,” J. Opt. Soc.Am. A 12, 1068–1076 (1995).
6. H. H. Hopkins, “Image formation with partially coherentlight,” Photograph. Sci. Eng. 21, 114–123 (1977).
7. M. G. Moharan, E. B. Grann, D. A. Pommet, and T. K. Gaylord,“Stable implementation of the rigorous coupled-wave analysisfor surface-relief gratings: enhanced transmittance matrix ap-proach,” J. Opt. Soc. Am. A 12, 1077–1086 (1995).
8. M. Totzeck, H. Jacobsen, and H. J. Tiziani, “Edge localizationof subwavelength structures by use of polarization interferom-etry and extreme-value criteria,” Appl. Opt. 39, 6295–6305(2000).
9. M. Totzeck, “Numerical simulation of high-NA quantitativepolarization microscopy and corresponding near-fields,” Optik(Stuttgart) 112, 399–406 (2001).
10. K. Leonhardt and H. J. Tiziani, “Optical topometry of surfaceswith locally changing materials, layers and contaminations. 1.Topographic methods, based on two-beam interferometry,” J.Mod. Opt. 46, 101–114 (1999).
11. K. Creath, “Phase-measurement interferometry techniques,”in Progress in Optics, E. Wolf, ed. (Elsevier, Amsterdam, 1988),Vol. XXVI, pp. 349–393.
12. J. Schmit and K. Creath, “Window function influence on phaseerror in phase-shifting algorithms,” Appl. Opt. 35, 5642–5649(1996).
13. P. Ettl, “Über die Signalentstehung bei Weißlichtinterferame-trie,” Ph.D. thesis (University of Erlangen-Nürnberg, 2001),pp. 46–50.
2212 APPLIED OPTICS � Vol. 44, No. 11 � 10 April 2005