Transactions and proceedings of the Royal Society of Victoria
Upload
khangminh22Category
view
1download
0
ROME 201728-29 September
ITALIAN CHAPTEREUROPEAN SOCIETY OF BIOMECHANICS
VII ANNUAL MEETING
ESB- 2017
Proceedings
Giuseppe VairoEditor
UNIVERSITY OF ROMETOR VERGATA


ESB-ITA 2017


ESB-ITA 2017
Proceedings of the VII Annual Meeting Italian Chapter of the European Society of Biomechanics
28-29 September 2017, Rome - Italy
Edited by
Giuseppe Vairo
University of Rome “Tor Vergata” Department of Civil Engineering and Computer Science Rome, Italy

Editor Giuseppe Vairo
University of Rome “Tor Vergata” Department of Civil Engineering and Computer Science Rome, Italy
ISBN: 978-88-6296-000-7
Proceedings VII Annual Meeting Italian Chapter of the European Society of Biomechanics – ESB-ITA2017
First edition, November 2017
Copyright © 2017 – Università degli Studi di Roma “Tor Vergata”, Dipartimento di Ingegneria Civile e Ingegneria Informatica. Via del Politecnico 1, 00133 Rome – Italy

vii
Preface
This book contains the abstracts of contributions at the 7th Annual Meeting of the Italian Chapter of the European Society of Biomechanics (ESB-ITA 2017), held in Rome, Italy, on 28-29 September 2017. ESB-ITA 2017 has been a continuation of the successful ESB-ITA meetings previously held in Bologna (2011), Rome (2012), Pisa (2013), Pavia (2014), Milan (2015) and Naples (2016), and it has been organized by the University of Rome “Tor Vergata” (Department of Civil Engineering and Computer Science).
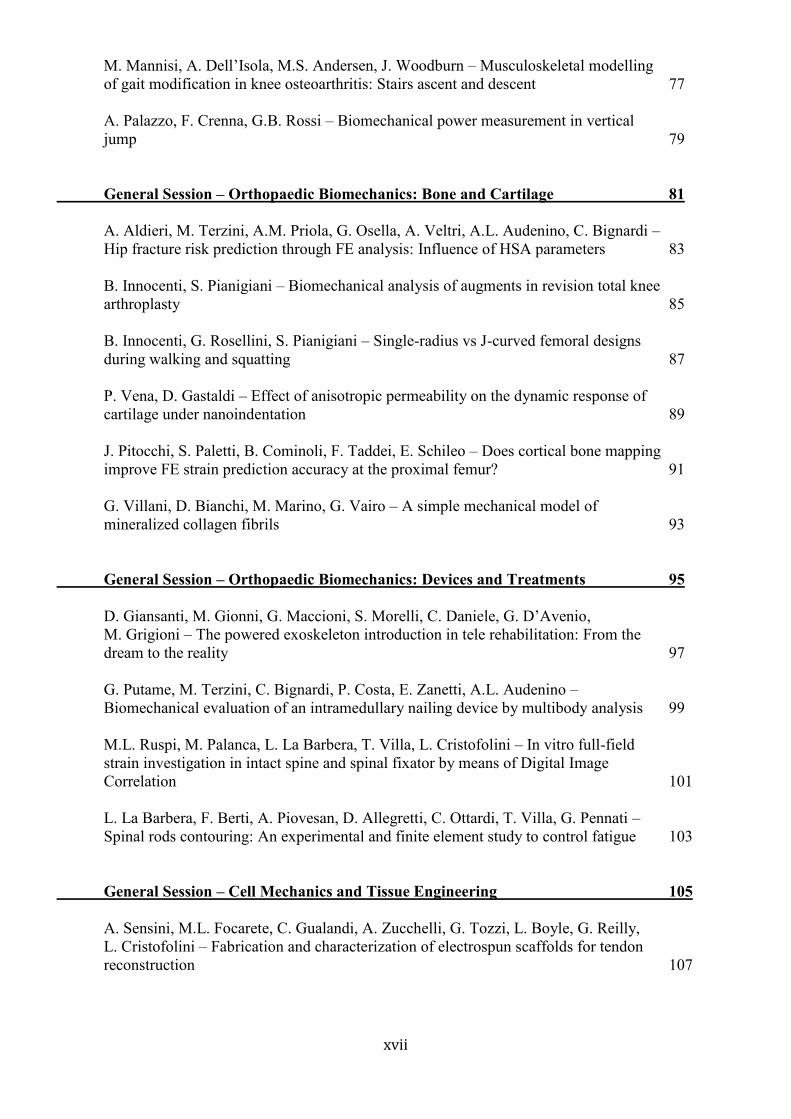
ESB-ITA 2017 has attracted more than 100 registered participants and its programme consisted in 79 scientific contributions, including 2 plenary lectures (Philippe Buchler, Institute for Surgical Technology and Biomechanics, University of Bern, Switzerland; Rodolfo Repetto, Department of Civil, Chemical and Environmental Engineering, University of Genoa, Italy) and 77 regular presentations delivered during 2 thematic sessions, 5 general sessions, 1 poster session, and 1 special session devoted to the final stage of the ESB-ITA Master Thesis Award 2017. Scientific contributions have been authored by about 300 authors from 15 countries, with more than 25% of non-Italian authors.
This picture clearly confirms that the ESB Italian Chapter is no longer just an idea, but it is a real and active scientific community, with a well-defined identity and with growing and challenging perspectives.
The book is organized in agreement with the meeting programme, arranged by distinguishing a thematic symposium on the ocular biomechanics (scientifically coordinated by Anna Pandolfi, from the Politecnico di Milano) and general sessions on different biomechanical topics (e.g., cardiovascular biomechanics, tissue constitutive modelling, musculoskeletal biomechanics, orthopaedic biomechanics, tissue growth and remodelling, image-based methods). Experimental findings, modelling strategies, computational techniques, and novel insights on mechanobiological mechanisms are traced through the presented contributions. Studies addressing the biomechanics of different biological systems in both health and disease are proposed, aiming to promote the translation towards medicine and clinics of research findings and approaches coming from diverse areas of physics (solid mechanics, fluid mechanics, electro-chemistry). A broad spectrum of scales is covered, ranging from the cellular, through the tissue, up to organ scale. Moreover, medical devices and their interaction with living tissues are also addressed.
In this view, contributions herein collected can be considered as a snapshot on the state-of-the-art and on the actual trends of biomechanical research, especially - but not exclusively - in Italy.
The support of Daniele Bianchi for preparing this volume is gratefully acknowledged.
Rome, Giuseppe Vairo November 2017

viii

ix
ESB- 2017
ESB-ITA Executive Board - Michele Marino (President)
Leibniz Universität Hannover, Germany - Michele Conti
Università degli Studi di Pavia, Italy - Luca Cristofolini
Università degli Studi di Bologna, Italy - Diego Gallo
Politecnico di Torino, Italy
ESB-ITA 2017 - Scientific Committee Anna Pandolfi – Politecnico di Milano, Italy (Scientific Coordinator of the Thematic Symposium “Ocular Biomechanics”) Federica Caselli – Università degli Studi di Roma “Tor Vergata”, Italy Simona Celi – Fondazione CNR G. Monasterio, Pisa, Italy Claudio Chiastra – Politecnico di Milano, Italy Antonino M. Fea – Università degli Studi di Torino, Italy Alessio Gizzi – Università Campus Bio-Medico di Roma, Italy Bernardo Innocenti – Université Libre de Bruxelles, Belgium Diana Massai – Hannover Medical School, Germany Giorgio Mattei – Optics11; VU Amsterdam, The Netherlands Claudia Mazzà – University of Sheffield, UK Umberto Morbiducci – Politecnico di Torino, Italy Simone Morganti – Università degli Studi di Pavia, Italy Carlo Orione – International Society of High-Tech in Ophthalmology Salvatore Pasta – Fondazione Ri.Med, Palermo, Italy Rita Stagni – Università degli Studi di Bologna, Italy Francesco Sturla – Politecnico di Milano, Italy Marco de Tullio – Politecnico di Bari, Italy
ESB-ITA 2017 - Organizing Committee Department of Civil Engineering and Computer Science (DICII) - University of Rome “Tor Vergata” Giuseppe Vairo, Chairman Daniele Bianchi Cristina Falcinelli Elisabetta Monaldo

x

xi
Under the auspices of ESB – European Society of Biomechanics ISHO – International Society of High-Tech in Ophthalmology ALITUR – Associazione Laureati Ingegneria di Tor Vergata, Università di Roma Politecnico di Milano Università degli Studi di Roma “Tor Vergata”
Industrial Partners SenTech Srl
Via di Quarto Peperino, 35 – 00188 Roma www.sentech.it
IVTech Srl
via di Bagnaia 414 – 55054 Massarosa (LU) www.ivtech.it
3Ds Dassault Systemes Italia Srl
via dell'Innovazione, 3 – 20126 Milano www.3Ds.com
CAE Technologies Srl via Benigno Crespi, 19 – 20159 Milano www.caetech.it
Location
Libera Università Maria Santissima Assunta (LUMSA) Borgo Sant’Angelo, 13 – 00193 Roma
European Society of Biomechanics
SenTech Systems and Energy Technologies

xii

xiii
Contents
Authors xxi Geographical Distribution of Authors (in the world) xxxiii Geographical Distribution of Authors (in Italy) xxxv
Thematic Symposium – Ocular Biomechanics 1
P. Büchler – A biomechanical model of the cornea to guide refractive interventions 3 R. Repetto – Models of fluid flow in the vitreous chamber and generation of vitreoretinal tractions 3
L. Sala, C. Prud’homme, M. Szopos, G. Guidoboni – Towards a full model for ocular biomechanics, fluid dynamics and hemodynamics 3
Zhuola, S. Barrett, Y.A. Kharaz, E Comerford, R. Akhtar – Nano-structure and mechanical changes in sclera following proteoglycan depletion 3
F. Stefanoni, A. Harris, M. Szopos, C. Prud’homme, R. Sacco, D. Messenio, M.L. Costantino, G. Guidoboni – Clinical assessment of intraocular pressure: A whole eye dynamic model 4
A. Kazaili, R. Akhtar – Ultrastructural and nanomechanical changes of the cornea following enzymatic degradation 4
R. Sacco, A.G. Mauri, A. Cardani, B.A. Siesky, G. Guidoboni, A. Harris – Multiscale modeling and simulation of neurovascular coupling in the retina 4
E. Lipari, A. Sborgia, M. Nubile, L. Mastropasqua, G. Alessio – Polarimetric interferometry to objectively evaluate the optical properties of corneal stroma 5

xiv
M.A. Ariza-Gracia, D.P. Pinero, J.F. Rodriguez, B. Calvo – Computational corneal biomechanics in clinic 5
V. Romano, Zhuola, Z. Chang, B. Steger, H. Levis, S. Kaye, R. Akhtar – Biomechanical evaluation of central and peripheral Descemet membrane endothelial graft 5
I. Nepita, L. Liggieri, E. Santini, F. Ravera, M.R. Romano, J.O. Pralits, R. Repetto – The effect of serum proteins on dynamic interfacial properties of silicone oils in vitrectomized eyes 6
M. Vasta, A. Gizzi, A. Pandolfi – A stochastic model of stroma: Interweaving variability and compressed fibril exclusion 6 F. Salerni, R. Repetto, A. Harris, P. Pinsky, C. Prud’homme, M. Szopos, G. Guidoboni – Mathematical modelling of ocular and cerebral hemo-fluid dynamics: Application to VIIP 6
A. Montanino, M. Angelillo, A. Pandolfi – A meshfree approach to cornea-aqueous humor interaction during tonometry tests 7
M.A. Ariza-Gracia, W. Wu, M. Malve, B. Calvo, J.F. Rodriguez Matas – Fluid-structure interaction of the non-contact tonometry test 7
M. Dvoriashyna, A. Foss, E. Gaffney, O. Jensen, R. Repetto – A mathematical model of fluid transport across the retinal pigment epithelium 8
F. Recrosi, R. Repetto, A. Tatone, G. Guidoboni –Thermodynamical derivation of a nonlinear poroelastic model describing hemodynamics-mechanics interplay in the Lamina Cribrosa 8
M. Ferroni, M. Cereda, F. Boschetti – Saccadic movement effects on intraocular drug delivery for a wet-AMD clinical case 8
A. Stocchino, R. Repetto, M. Romano – Assessment of the fluid dynamic performance of a vitreous cutter 9
P. Davvalo Khongar, J.O. Pralits, X. Cheng, P. Pinsky, P. Soleri, R. Repetto – Effect of an iris-fixated intraocular lens on corneal metabolism: A numerical study 9
General Session – Cardiovascular CFD, Hemodynamics 11
S. Migliori, M. Bologna, E. Montin, G. Dubini, C. Aurigemma, F. Burzotta, L. Mainardi, F. Migliavacca, C. Chiastra – Reconstruction of stented coronary arteries for CFD analyses: From in vitro to patient-specific models 13 D. Gallo, P. Bijari, U. Morbiducci, Y. Qiao, Y. Xie, D. Haabets, B. Wasserman, D.A. Steinman – Hemodynamic factors associations with early atherosclerotic changes at the carotid bifurcation 15

xv
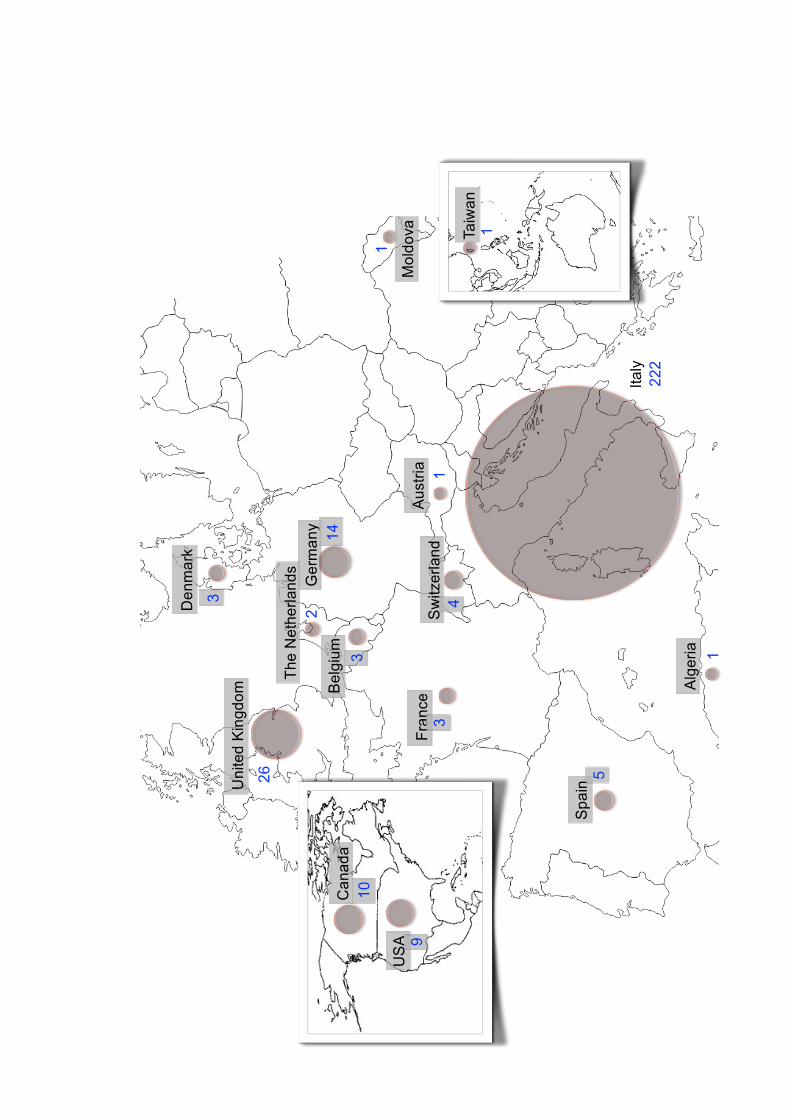
K. Calò, M. Owais Khan, D. Gallo, S. Scarsoglio, D.A. Steinman, L. Ridolfi, U. Morbiducci – Exploring intracranial aneurysm hemodynamics with a complex networks approach 17 G. D’Avenio, M. Grigioni – Comparison of blood-damage-related turbulence descriptors in the flow field of heart valves 19 M. Bozzetto, P. Brambilla, B. Ene-Iordache, A. Remuzzi – Novel strategies for patient-specific modelling of arteriovenous fistula for hemodialysis 21 F. Piatti, D. Belkacemi, A. Caimi, F. Sturla, A. Greiser, F. Pluchinotta, M. Carminati, A. Redaelli – On the potential of 4D Flow in guiding CFD analyses: A case study of aortic coartaction 23 K. Capellini, E. Costa, M.E. Biancolini, E. Vignali, V. Positano, L. Landini, S. Celi – An image-based and RBF mesh morphing CFD simulation for aTAA hemodynamic 25
M.D. de Tullio – Numerical assessment of blood damage through prosthetic heart valves 27 A. Dimasi, D. Piloni, L. Spreafico, M. Meskin, E. Votta, R. Vismara, G.B. Fiore, L. Fusini, M. Muratori, P. Montorsi, M. Pepi, A. Redaelli – Hemodynamic insights of bileaflet mitral prosthetic valve thrombosis: A CFD study 29 A. Finotello, S. Morganti, S. Marconi, R. Romarowski, P. Totaro, F. Auricchio – Double aortic arch: Engineering support to decision making process 31
General Session – Cardiovascular Tissues 33
B.M. Fanni, E. Gasparotti, S. Celi, V. Positano, F. Faita, N. Di Lascio, L. Landini, S. Schievano, C. Capelli – Image-based mechanical characterization of large blood vessels 35 G.M. Formato, F. Auricchio, A. Frigiola, M. Conti – Luminal narrowing of anomalous coronary arteries: A parametric structural finite element analysis 37 N. Casalini, G. Luraghi, F. Migliavacca, J.F.R. Matas – On the importance of anisotropy in biological materials: Application to aortic tissues 39 G. Rossini, M. Sabbatini, F. Sturla, A. Della Corte, C. Bancone, S. Dellegrottaglie, A. Redaelli, E. Votta – Impact of leaflets solid elements discretization on patient-specific aortic root FE models biomechanics 41 E. Lanzarone, M. Conti, S. Marconi, H.W.L. De Beaufort, S. Trimarchi, F. Auricchio – Alteration of lumped parameters under stent graft in ex-vivo porcine aortas 43
D. Bianchi, M. Marino, G. Vairo, P. Wriggers – A computational approach for the
coupled chemo-mechano-biological remodelling of arterial tissue constituents 45

xvi
E. Monaldo, D. Bianchi, A. Gizzi, M. Marino, S. Filippi, G. Vairo – Computational multiscale modelling of fluid-structure interaction in arterial vessels: Tissue mechanics and wall shear stress analysis 47 Z. Chang, M.L. Hansen, P.-Y. Chen, P. Paoletti, L.M. Rasmussen, R. Akhtar – Nanoscale characterisation of human internal mammary artery with high pulse wave velocity 49
General Session – Cardiovascular Devices and Treatments 51
D. Allegretti, F. Berti, L. Petrini, G. Pennati, P. Nithiarasu, S. Pant – Identification of NiTi stent material parameters through surrogate-assisted optimisation 53
F. Berti, A. Bertini, D. Allegretti, G. Pennati, F. Migliavacca, L. Petrini – The role of inelastic deformations in the mechanical response of endovascular nickel-titanium devices 55 E. Gasparotti, E. Vignali, K. Capellini, G. Vivoli, A.G. Cerillo, V. Positano, S. Berti, L. Landini, S. Celi – A FE tool to simulate a trans-catheter anchor-based system for mitral valve regurgitation 57 G. Vivoli, E. Gasparotti, M. Rezzaghi, M. Mariani, V. Positano, S. Berti, L. Landini, S. Celi – 3D left atrial appendage modelling: A multimodal imaging approach 59 F. Sturla, O.A. Pappalardo, M. Selmi, F. Onorati, G. Faggian, E. Votta, A. Redaelli – Biomechanical outcomes of the Mitraclip® procedure: A finite element analysis 61
General Session – Motion Analysis 63
M.C. Bisi, R. Stagni – Assessment of changes in movement complexity and movement automaticity with maturation 65 V.-D. Tran, P. Dario, S. Mazzoleni – An upper limb musculoskeletal model including acromioclavicular joint ligaments: Preliminary results 67 M. Terzini, E.M. Zanetti, A.L. Audenino, L. Gastaldi, S. Pastorelli, E. Panero, A. Sard, C. Bignardi – Multibody modelling of ligamentous and bony stabilizers in the elbow joint 69 P. Tamburini, M.C. Bisi, R. Stagni – Frequency content of gait trunk acceleration: A longitudinal study 71 G. Pacini Panebianco, R. Stagni, S. Fantozzi – Gait parameters estimation using inertial sensors: Comparative analysis of 12 methods 73 R. Di Marco, E. Scalona, E. Palermo, C. Mazzà – Repeatability analysis of a novel multi-segment model of the foot-ankle complex 75
xvii
M. Mannisi, A. Dell’Isola, M.S. Andersen, J. Woodburn – Musculoskeletal modelling of gait modification in knee osteoarthritis: Stairs ascent and descent 77 A. Palazzo, F. Crenna, G.B. Rossi – Biomechanical power measurement in vertical jump 79
General Session – Orthopaedic Biomechanics: Bone and Cartilage 81
A. Aldieri, M. Terzini, A.M. Priola, G. Osella, A. Veltri, A.L. Audenino, C. Bignardi – Hip fracture risk prediction through FE analysis: Influence of HSA parameters 83 B. Innocenti, S. Pianigiani – Biomechanical analysis of augments in revision total knee arthroplasty 85 B. Innocenti, G. Rosellini, S. Pianigiani – Single-radius vs J-curved femoral designs during walking and squatting 87 P. Vena, D. Gastaldi – Effect of anisotropic permeability on the dynamic response of cartilage under nanoindentation 89 J. Pitocchi, S. Paletti, B. Cominoli, F. Taddei, E. Schileo – Does cortical bone mapping improve FE strain prediction accuracy at the proximal femur? 91
G. Villani, D. Bianchi, M. Marino, G. Vairo – A simple mechanical model of mineralized collagen fibrils 93
General Session – Orthopaedic Biomechanics: Devices and Treatments 95
D. Giansanti, M. Gionni, G. Maccioni, S. Morelli, C. Daniele, G. D’Avenio, M. Grigioni – The powered exoskeleton introduction in tele rehabilitation: From the dream to the reality 97 G. Putame, M. Terzini, C. Bignardi, P. Costa, E. Zanetti, A.L. Audenino – Biomechanical evaluation of an intramedullary nailing device by multibody analysis 99 M.L. Ruspi, M. Palanca, L. La Barbera, T. Villa, L. Cristofolini – In vitro full-field strain investigation in intact spine and spinal fixator by means of Digital Image Correlation 101 L. La Barbera, F. Berti, A. Piovesan, D. Allegretti, C. Ottardi, T. Villa, G. Pennati – Spinal rods contouring: An experimental and finite element study to control fatigue 103
General Session – Cell Mechanics and Tissue Engineering 105
A. Sensini, M.L. Focarete, C. Gualandi, A. Zucchelli, G. Tozzi, L. Boyle, G. Reilly, L. Cristofolini – Fabrication and characterization of electrospun scaffolds for tendon reconstruction 107

xviii
S. Silvani, I. Cattaneo, M. Figliuzzi, A. Remuzzi – Effect of substrate mechanical properties on alveolar epithelial cells 109 P. Lenarda, A. Gizzi, M. Paggi – A computational framework for electromechanical contact between excitable deformable cells 111
D. Massai, E. Bolesani, D. Robles Diaz, C. Kropp, H. Kempf, C. Halloin, U. Martin, T. Braniste, G. Isu, V. Harms, U. Morbiducci, G. Drager, R. Zweigerdt – Peristaltic pump-based circulation can promote insulin precipitation in hPSC culture media 113
G. Marchiori, M. Berni, M. Petretta, M. Berni, C. Gualandi, M. Boi, D. Bellucci, M. L. Focarete, V. Cannillo, B. Grigolo, M. Bianchi – Novel procedure to design 3D printed composite scaffolds for trabecular bone regeneration 115
P.N. Sergi, I. Tonazzini, M. Cecchini, S. Micera – Hybrid modelling of neuron-like cells response to gratings 117
F. Caselli, A. De Ninno, R. Reale, P. Bisegna – Electrical impedance based monitoring of cells flowing in a microchannel 119
General Session – Miscellany 121
G. D’Avenio, A. Amodeo, M. Grigioni – The role of additional pulmonary blood flow in the cavopulmonary anastomosis 123 C. Falcinelli, Z. Li, W. Lam, G. Stanisz, A. Agur, C. Whyne – 3D muscle fibre arrangement derived from diffusion-tensor imaging: A validation study 125 M. Zingales, G. Marchiori, E. Bologna, D. Spadaro, L. Camarda, M. Berni, N.F. Lopomo – Time-dependent behaviour of native ligament and synthetic grafts used in ACL reconstruction 127 A. Rizzo, D. Bianchi, G.M. Russo, M. Russo, R. Ferrante, G. Vairo – A computational model for brain-shift assessment in neurosurgery 129 D. Bianchi, C. Lorenzi, D. Severino, L. Arcuri, A. Dolci, G. Vairo – Mechanical behaviour of dental treatments based on an anatomic-functional-geometry (AFG) preparation technique 131 L. Cacopardo, N. Guazzelli, R. Nossa, G. Mattei, A. Ahluwalia – Engineering viscoelasticity in biomaterials 133
Special Session – Master Thesis Award 135
E. Monaldo – Modelling and simulation of fluid-structure interaction in arterial vessels via a multiscale constitutive framework 137 A. Mainardi – Towards the knee on a chip: Development of a microfluidic platform for the mechanical stimulation of three dimensional cartilaginous constructs 138

xix
C. Atzeni – Modelling of leukocyte motion in hepatic sinusoids using the Volume of Fluid (VOF) method 139 M. Genta – Endothelial cells response to combined loading from flow and substrate deformation: A quantitative analysis 140
Author Index 143

xx

xxi
Authors
A Agur A. Division of Anatomy, University of Toronto, Canada Ahluwalia A. Research Center ‘E. Piaggio’, Department of Information Engineering, University
of Pisa, Italy Akhtar R. Department of Mechanical Materials and Aerospace Engineering, University of
Liverpool, UK Aldieri A. Department of Mechanical and Aerospace Engineering, Politecnico di Torino,
Italy Alessio G. Department of Medical Basic Sciences, Neuroscience and Sense Organs,
Ophthalmology Clinic; University of Bari "A. Moro", Italy Allegretti D. Laboratory of Biological Structure Mechanics (LaBS), DCMIC, Politecnico di
Milano, Italy Amodeo A. Pediatric Hospital “Bambino Gesu”, Rome, Italy Andersen M.S. Department of Material and Production, Aalborg University, Denmark Angelillo M. Dipartimento di Ingegneria, Università di Salerno, Fisciano, Italy Arcuri L. Department of Clinical Sciences and Translational Medicine, University of Rome
"Tor Vergata", Italy Ariza-Gracia M.A. Mechanical Engineering Department, University of Zaragoza, Spain; ISTB,
Universitat Bern, Switzerland Atzeni C. Department of Chemistry, Materials and Chemical Engineering "Giulio Natta",
Politecnico di Milano, Italy Audenino A.L. Department of Mechanical and Aerospace Engineering, Politecnico di Torino,
Italy Auricchio F. Department of Civil Engineering and Architecture, University of Pavia, Italy Aurigemma C. Institute of Cardiology, Catholic University of the Sacred Heart, Rome, Italy
B Bancone C. Department of Cardiothoracic and Respiratory Sciences, Second University of
Naples, Italy Barrett S. Department of Physics, University of Liverpool, UK Belkacemi D. Department of Mechanical Engineering, University of Chlef, Algeria Bellucci D. DIEF, University of Modena and Reggio Emilia, Modena, Italy Berni M. Laboratory of Nanobiotechnology, Rizzoli Orthopaedic Instituite, Bologna, Italy Berni M. Laboratory of Nanobiotechnology, Rizzoli Orthopaedic Instituite, Bologna, Italy Berti F. Laboratory of Biological Structure Mechanics (LaBS), DCMIC, Politecnico di
Milano, Italy Berti S. Department of Interventional Cardiology Unit, Fondazione CNR-Regione
Toscana “G. Monasterio”, Massa Bertini A. Laboratory of Biological Structure Mechanics (LaBS), DCMIC, Politecnico di
Milano, Italy Bianchi D. Department of Civil Engineering and Computer Science, University of Rome
"Tor Vergata", Italy

xxii
Bianchi M. Laboratory of Nanobiotechnology, Rizzoli Orthopaedic Instituite, Bologna, Italy Biancolini M.E. Department of Enterprise Engineering, University of Rome Tor Vergata, Italy Bignardi C. Department of Mechanical and Aerospace Engineering, Politecnico di Torino,
Italy Bijari P. Department of Mechanical & Industrial Engineering, University of Toronto,
Canada Bisegna P. Department of Civil Engineering and Computer Science, University of Rome
"Tor Vergata", Italy Bisi M.C. Department of Electrical, Electronic and Information Engineering, University of
Bologna, Italy Boi M. Laboratory of Nanobiotechnology, Rizzoli Orthopaedic Instituite, Bologna, Italy Bolesani E. Leibniz Research Laboratories for Biotechnology and Artificial Organs,
Hannover Medical School, Germany; REBIRTH-Cluster of Excellence, Hannover Medical School, Germany
Bologna E. DICAM, University of Palermo, Italy Bologna M. Laboratory of Biological Structure Mechanics (LaBS), DCMIC, Politecnico di
Milano, Italy; Department of Electronics, Information and Bioengineering, Politecnico di Milano, Italy
Boschetti F. Department of Chemistry, Materials and Chemical Engineering "Giulio Natta", Politecnico di Milano, Italy
Boyle L. INSIGNEO Institute for in silico Medicine, University of Sheffield, UK Bozzetto M. Department of Bioengineering, IRCCS-Istituto di Ricerche Farmacologiche
“Mario Negri, Milano, Italy Brambilla P. Department of Diagnostic Radiology, Papa Giovanni XXIII Hospital, Bergamo,
Italy Braniste T. Leibniz Research Laboratories for Biotechnology and Artificial Organs,
Hannover Medical School, Germany; National Center for Materials Study and Testing, Technical University of Moldova, Republic of Moldova
Buchler P. Institute for Surgical Technology and Biomechanics, University of Bern, Switzerland
Burzotta F. Institute of Cardiology, Catholic University of the Sacred Heart, Rome, Italy C
Cacopardo L. Research Center ‘E. Piaggio’, Department of Information Engineering, University of Pisa, Italy
Caimi A. Department of Electronics, Information and Bioengineering, Politecnico di Milano, Italy
Calò K. PoliToBIOMed Lab, Department of Mechanical and Aerospace Engineering, Politecnico di Torino, Italy
Calvo B. Mechanical Engineering Department, University of Zaragoza, Spain; CIBBER-BBN, Spain
Calvo B. Mechanical Engineering Department, University of Zaragoza, Spain; CIBBER-BBN, Spain
Camarda L. DISCOG, University of Palermo, Italy Cannillo V. DIEF, University of Modena and Reggio Emilia, Modena, Italy Capelli C. Institute of Cardiovascular Science, University College of London, UK Capellini K. BioCardioLab, Fondazione CNR-Regione Toscana “G. Monasterio”, Massa, Italy Cardani A. Department of Mathematics, Politecnico di Milano, Italy Carminati M. Multimodality Cardiac Imaging Section, IRCCS Policlinico San Donato, Italy Casalini N. Laboratory of Biological Structure Mechanics (LaBS), DCMIC, Politecnico di
Milano, Italy

xxiii
Caselli F. Department of Civil Engineering and Computer Science, University of Rome
"Tor Vergata", Italy Cattaneo I. IRCCS- Istituto di Ricerche Farmacologiche “Mario Negri”, Milano, Italy Cecchini M. NEST, the National Enterprise for nanoScience and nanoTechnology, Pisa, Italy;
Istituto Nanoscienze-CNR, Pisa, Italy; Scuola Normale Superiore, Pisa, Italy Celi S. BioCardioLab, Fondazione CNR-Regione Toscana "G. Monasterio", Massa, Italy Cereda M. Department of Biomedical and clinical science Luigi Sacco, Sacco Hospital,
University of Milan, Italy Cerillo A.G. Cardio Surgery Unit, Fondazione CNR-Regione Toscana “G. Monasterio”,
Massa, Italy Chang Z. Department of Mechanical, Materials and Aerospace Engineering, School of
Engineering, University of Liverpool, UK Chen P.-Y. Department of Materials Science and Engineering, National Tsing Hua
University, Hsinchu, Taiwan Cheng X. Department of Mechanical Engineering, Stanford University, California, USA Chiastra C. Laboratory of Biological Structure Mechanics (LaBS), DCMIC, Politecnico di
Milano, Italy Comerford E. Institute of Ageing and Chronic Disease, University of Liverpool, UK Cominoli B. Laboratorio di Tecnologia Medica, Istituto Ortopedico Rizzoli, Bologna, Italy Conti M. Department of Civil Engineering and Architecture, University of Pavia, Italy Costa E. RINA Consulting SpA, Rome, Italy; Department of Enterprise Engineering,
University of Rome Tor Vergata, Italy Costa P. Intrauma S.p.A, Rivoli (TO), Italy Costantino M.L. Department of Mathematics, Politecnico di Milano, Milano, Italy Crenna F. Measurement Laboratiry, DIMS/MEC, University of Genoa, Italy Cristofolini L. Department of Industrial Engineering, Università di Bologna, Italy
D D'Avenio G. Center of Innovative Technologies in Public Health, Istituto Superiore di Sanità,
Rome, Italy Daniele C. Department TISP, Istituto Superiore Sanità, Rome, Italy Dario P. The BioRobotics Institute, Scuola Superiore Sant’Anna, Pisa, Italy Davvalo Khongar P. Department of Civil, Chemical and Environmental Engineering, University of
Genoa, Italy De Beaufort H.W.L. Thoracic Aortic Research Center, Policlinico San Donato IRCCS, University of
Milan, San Donato Milanese, Italy De Ninno A. Department of Civil Engineering and Computer Science, University of Rome
"Tor Vergata", Italy de Tullio M.D. Department of Mechanics, Mathematics and Management, Politecnico di Bari,
Italy Dell'Isola A. School of Health and Life Sciences, Glasgow Caledonian University, UK Della Corte A. Department of Cardiothoracic and Respiratory Sciences, Second University of
Naples, Italy Dellegrottaglie S. Department of Advanced Biomedical Sciences, Federico II University, Napoli,
Italy; Division of Cardiology, Ospedale Medico-Chirurgico Accreditato Villa dei Fiori, Acerra, Napoli, Italy
Di Lascio N. CNR Institute of Clinical Physiology, Pisa, Italy Di Marco R. Department of Mechanical and Aerospace Engineering, Sapienza University of
Rome, Italy; Department of Mechanical Engineering, University of Sheffield, England, UK
Dimasi A. Department of Electronics, Information and Bioengineering, Politecnico di Milano, Italy

xxiv
Dolci A. Department of Clinical Sciences and Translational Medicine, University of Rome
"Tor Vergata", Italy Drager G. REBIRTH-Cluster of Excellence, Hannover Medical School, Germany; Institute
of Organic Chemistry, Leibniz University Hannover, Germany Dubini G. Laboratory of Biological Structure Mechanics (LaBS), DCMIC, Politecnico di
Milano, Italy Dvoriashyna M. Department of Civil, Chemical and Environmental Engineering, University of
Genoa, Italy E
Ene-Iordache B. Department of Bioengineering, IRCCS-Istituto di Ricerche Farmacologiche “Mario Negri, Milano, Italy
F Faggian G. Division of Cardiovascular Surgery, Università degli Studi di Verona, Italy Faita F. CNR Institute of Clinical Physiology, Pisa, Italy Falcinelli C. Orthopaedic Biomechanics Laboratory, Sunnybrook Research Institute, Toronto,
Canada Fanni B.M. BioCardioLab, Fondazione CNR-Regione Toscana "G. Monasterio", Massa, Italy Fantozzi S. Department of Electrical, Electronic and Information Engineering, University of
Bologna, Italy Ferrante R. SenTech srl, Rome, Italy Ferroni M. Department of Chemistry, Materials and Chemical Engineering "Giulio Natta",
Politecnico di Milano, Italy Figliuzzi M. IRCCS- Istituto di Ricerche Farmacologiche “Mario Negri”, Milano, Italy Filippi S. Department of Engineering, University Campus Bio-Medico of Rome, Italy Finotello A. Department of Experimental Medicine, University of Genoa, Italy Fiore G.B. Department of Electronics, Information and Bioengineering, Politecnico di
Milano, Italy Focarete M.L. Department of Chemistry “G. Ciamician”, Università di Bologna, Italy Formato G.M. Department of Civil Engineering and Architecture, University of Pavia, Italy Foss A. Department of Ophtalmology, Nottingham University Hospitals NHS Trust,
Nottingham, UK Frigiola A. Department of Cardio-Thoracic Surgery, IRCSS Policlinico San Donato, San
Donato (MI), Italy Fusini L. Centro Cardiologico Monzino IRCCS, Milano, Italy
G Gaffney E. Wolfson Centre for Mathematical Biology, Mathematical Institute, University of
Oxford, UK Gallo D. PoliToBIOMed Lab, Department of Mechanical and Aerospace Engineering,
Politecnico di Torino, Italy Gasparotti E. BioCardioLab, Fondazione CNR-Regione Toscana "G. Monasterio", Massa, Italy Gastaldi D. Department of Chemistry, Materials and Chemical Engineering, Politecnico di
Milano, Italy Gastaldi L. Department of Mechanical and Aerospace Engineering, Politecnico di Torino,
Italy Genta M. Department of Mechanical and Aerospace Engineering, Politecnico di Torino,
Italy Giansanti D. Department TISP, Istituto Superiore Sanità, Rome, Italy Gionni M. Catholic University, Rome, Italy Gizzi A. Department of Engineering, University Campus Bio-Medico of Rome, Italy Gizzi A. Department of Engineering, University Campus Bio-Medico of Rome, Italy

xxv
Greiser A. Siemens Healthcare GmbH, Germany Grigioni M. Center of Innovative Technologies in Public Health, Istituto Superiore di Sanità,
Rome, Italy Grigolo B. Laboratory of Nanobiotechnology, Rizzoli Orthopaedic Instituite, Bologna, Italy Gualandi C. CHIM, University of Bologna, Italy Guazzelli N. Research Center ‘E. Piaggio’, Department of Information Engineering, University
of Pisa, Italy Guidoboni G. Department of Electrical Engineering and Computer Science, University of
Missouri, Columbia, MO, USA H
Haabets D. Department of Mechanical & Industrial Engineering, University of Toronto, Canada
Halloin C. Leibniz Research Laboratories for Biotechnology and Artificial Organs, Hannover Medical School, Germany; REBIRTH-Cluster of Excellence, Hannover Medical School, Germany
Hansen M.L. Department of Cardiothoracic and Vascular Surgery, Odense University Hospital, Denmark
Harms V. Institute of Organic Chemistry, Leibniz University Hannover, Germany Harris A. Eugene and Marilyn Glick Eye Institute, Indiana University School of Medicine,
Indianapolis, IN, USA I
Innocenti B. BEAMS Department, Universite Libre de Bruxelles, Belgium Isu G. Department of Mechanical and Aerospace Engineering, Politecnico di Torino,
Italy; Department of Biomedicine, University of Basel, Switzerland
J Jensen O. School of Mathematics, University of Manchester, UK
K Kaye S. Department of Ophthalmology, St. Paul’s Eye Unit, Royal Liverpool University
Hospital, UK; Department of Eye and Vision Science, Institute of Ageing and Chronic Disease, University of Liverpool, UK
Kazaili A. School of Engineering, University of Liverpool, UK Kempf H. Leibniz Research Laboratories for Biotechnology and Artificial Organs,
Hannover Medical School, Germany; REBIRTH-Cluster of Excellence, Hannover Medical School, Germany
Kharaz Y.A. Institute of Ageing and Chronic Disease, University of Liverpool, UK Kropp C. Leibniz Research Laboratories for Biotechnology and Artificial Organs,
Hannover Medical School, Germany; REBIRTH-Cluster of Excellence, Hannover Medical School, Germany
L La Barbera L. Department of Chemistry, Materials and Chemical Engineering, Politecnico di
Milano, Italy Lam W. Physical Sciences, Sunnybrook Research Institute, Toronto, Canada Landini L. BioCardioLab, Fondazione CNR-Regione Toscana "G. Monasterio", Massa,
Italy; Department of Information Engineering, University of Pisa, Italy
Lanzarone E. Consiglio Nazionale delle Ricerche (CNR), Istituto di Matematica Applicata e Tecnologie Informatiche (IMATI), Milan, Italy
Lenarda P. IMT School for Advanced Studies, Lucca, Italy Levis H. Department of Ophthalmology, St. Paul’s Eye Unit, Royal Liverpool University
Hospital, UK Li Z. Division of Anatomy, University of Toronto, Canada

xxvi
Liggieri L. CNR Institute for Condensed Matter Chemistry and Energy Technologies, Genoa,
Italy Lipari E. Phronema s.r.l., Bari, Italy Lopomo N.F. Laboratory of Biomechanics, Rizzoli Orthopaedic Institute, Bologna, Italy; DII,
University of Brescia, Italy
Lorenzi C. Department of Clinical Sciences and Translational Medicine, University of Rome "Tor Vergata", Italy
Luraghi G. Laboratory of Biological Structure Mechanics (LaBS), DCMIC, Politecnico di Milano, Italy
M Maccioni G. Department TISP, Istituto Superiore Sanità, Rome, Italy Mainardi A. Department of Electronics, Information and Bioengineering, Politecnico di
Milano, Italy Mainardi L. Department of Electronics, Information and Bioengineering, Politecnico di
Milano, Italy Malve M. Mechanical Engineering Department, University of Navarra, Spain Mannisi M. School of Health and Life Sciences, Glasgow Caledonian University, UK Marchiori G. Laboratory of Nanobiotechnology, Rizzoli Orthopaedic Instituite, Bologna, Italy Marchiori G. Laboratory of Nanobiotechnology, Rizzoli Orthopaedic Instituite, Bologna, Italy Marconi S. Department of Civil Engineering and Architecture, University of Pavia, Italy Mariani M. Department of Interventional Cardiology, Fondazione CNR – Regione Toscana
“G. Monasterio”, Massa, Italy Marino M. Institute of Continuum Mechanics, Leibniz Universität Hannover, Germany Martin U. Leibniz Research Laboratories for Biotechnology and Artificial Organs,
Hannover Medical School, Germany; REBIRTH-Cluster of Excellence, Hannover Medical School, Germany
Massai D. Leibniz Research Laboratories for Biotechnology and Artificial Organs, Hannover Medical School, Germany; REBIRTH-Cluster of Excellence, Hannover Medical School, Germany; Department of Mechanical and Aerospace Engineering, Politecnico di Torino, Italy
Mastropasqua L. Department of Medicine and Ageing Sciences, Ophthalmology Clinic, University "G. d' Annunzio" of Chieti-Pescara, Italy
Matas J.F.R. Laboratory of Biological Structure Mechanics (LaBS), DCMIC, Politecnico di Milano, Italy
Mattei G. Research Center ‘E. Piaggio’, Department of Information Engineering, University of Pisa, Italy; Optics11, The Netherlands
Mauri A.G. Department of Mathematics, Politecnico di Milano, Italy Mazzà C. Department of Mechanical Engineering, University of Sheffield, England, UK;
INSIGNEO Institute for in silico medicine, University of Sheffield, England, UK Mazzoleni S. The BioRobotics Institute, Scuola Superiore Sant’Anna, Pisa, Italy; Laboratory of
Rehabilitation Bioengineering, Auxilium Vitae Rehabilitation Centre, Volterra, Italy
Meskin M. Department of Electronics, Information and Bioengineering, Politecnico di Milano, Italy
Messenio D. Eye Clinic, Department of Clinical Science - ASST Fatebenefratelli Sacco - University of Milan, Italy
Micera S. The Biorobotics Institute, Scuola Superiore Sant'Anna, Pisa, Italy; Translational Neural Engineering Laboratory, EPFL, Geneve, Switzerland
Migliavacca F. Laboratory of Biological Structure Mechanics (LaBS), DCMIC, Politecnico di
Milano, Italy

xxvii
Migliori S. Laboratory of Biological Structure Mechanics (LaBS), DCMIC, Politecnico di
Milano, Italy Monaldo E. Università degli Studi “Niccolò Cusano”, Roma, Italy Montanino A. Dipartimento di Ingegneria Civile ed Ambientale, Politecnico di Milano, Italy Montin E. Department of Electronics, Information and Bioengineering, Politecnico di
Milano, Italy Montorsi P. Centro Cardiologico Monzino IRCCS, Milano, Italy Morbiducci U. PoliToBIOMed Lab, Department of Mechanical and Aerospace Engineering,
Politecnico di Torino, Italy Morelli S. Department TISP, Istituto Superiore Sanità, Rome, Italy Morganti S. Department of Electrical, Computer, and Biomedical Engineering, University of
Pavia, Italy Muratori M. Centro Cardiologico Monzino IRCCS, Milano, Italy
N Nepita I. Department of Civil, Chemical and Environmental Engineering, University of
Genoa, Italy Nithiarasu P. Zienkiewicz Centre for Computational Engineering, Swansea University, Wales,
UK Nossa R. Research Center ‘E. Piaggio’, Department of Information Engineering, University
of Pisa, Italy Nubile M. Department of Medicine and Ageing Sciences, Ophthalmology Clinic, University
"G. d' Annunzio" of Chieti-Pescara, Italy O
Onorati F. Division of Cardiovascular Surgery, Università degli Studi di Verona, Italy Osella G. Department of Oncology, San Luigi Gonzaga Hospital, University of Torino,
Italy Ottardi C. Department of Chemistry, Materials and Chemical Engineering, Politecnico di
Milano, Italy Owais Khan M. Department of Mechanical and Industrial Engineering, University of Toronto,
Canada P
Pacini Panebianco G. Department of Electrical, Electronic and Information Engineering, University of Bologna, Italy
Paggi M. IMT School for Advanced Studies, Lucca, Italy Palanca M. Alma Mater Studiorum – Università di Bologna Palazzo A. Measurement Laboratiry, DIMS/MEC, University of Genoa, Italy Palermo E. Department of Mechanical and Aerospace Engineering, Sapienza University of
Rome, Italy Paletti S. Laboratorio di Tecnologia Medica, Istituto Ortopedico Rizzoli, Bologna, Italy Pandolfi A. Dipartimento di Ingegneria Civile ed Ambientale, Politecnico di Milano, Italy Panero E. Department of Mechanical and Aerospace Engineering, Politecnico di Torino,
Italy Pant S. Zienkiewicz Centre for Computational Engineering, Swansea University, Wales,
UK Paoletti P. Centre for Engineering Dynamics, School of Engineering, University of
Liverpool, Liverpool, L69 3GH, UK Pappalardo O.A. Department of Electronics, Information and Bioengineering, Politecnico di
Milano, Italy; Division of Cardiovascular Surgery, Università degli Studi di Verona, Italy
Pastorelli S. Department of Mechanical and Aerospace Engineering, Politecnico di Torino, Italy

xxviii
Pennati G. Laboratory of Biological Structure Mechanics (LaBS), DCMIC, Politecnico di
Milano, Italy Pepi M. Centro Cardiologico Monzino IRCCS, Milano, Italy Petretta M. Laboratory of Immunorheumathology, Rizzoli Orthopaedic Instituite, Bologna,
Italy Petrini L. Department of Civil and Environmental Engineering, Politecnico di Milano, Italy Pianigiani S. BEAMS Department, Universite Libre de Bruxelles, Belgium Piatti F. Department of Electronics, Information and Bioengineering, Politecnico di
Milano, Italy Piloni D. Department of Electronics, Information and Bioengineering, Politecnico di
Milano, Italy Pinero D.P. OFTALMAR, Vithas Medimar Internacional Hospital, Spain Pinsky P. Department of Mechanical Engineering, Stanford University, California, USA Piovesan A. Department of Chemistry, Materials and Chemical Engineering, Politecnico di
Milano, Italy Pitocchi J. Laboratorio di Tecnologia Medica, Istituto Ortopedico Rizzoli, Bologna, Italy Pluchinotta F. Multimodality Cardiac Imaging Section, IRCCS Policlinico San Donato, Italy Positano V. BioCardioLab, Fondazione CNR-Regione Toscana "G. Monasterio", Massa, Italy Pralits J.O. Department of Civil, Chemical and Environmental Engineering, University of
Genoa, Italy Priola A.M. Department of Oncology, San Luigi Gonzaga Hospital, University of Torino,
Italy Prud'homme C. IRMA UMR 7501, CNRS, Universite de Strasbourg, France Putame G. Department of Mechanical and Aerospace Engineering, Politecnico di Torino,
Italy Q
Qiao Y. Russell H. Morgan Department of Radiology and Radiological Sciences, Johns Hopkins University, USA
R Rasmussen L.M. Department of Clinical Biochemistry and Pharmacology, Centre of Individualized
Medicine in Arterial Diseases (CIMA), Odense University Hospital, Odense, Denmark
Rasponi M. Department of Electronics, Information and Bioengineering, Politecnico di Milano, Italy
Ravera F. CNR Institute for Condensed Matter Chemistry and Energy Technologies, Genoa, Italy
Reale R. Department of Civil Engineering and Computer Science, University of Rome "Tor Vergata", Italy
Recrosi F. GSSI, Gran Sasso Science Institute, L'Aquila, Italy Redaelli A. Department of Electronics, Information and Bioengineering, Politecnico di
Milano, Italy Reilly G. INSIGNEO Institute for in silico Medicine, University of Sheffield, UK Remuzzi A. Department of Industrial Engineering, University of Bergamo, Dalmine (BG),
Italy Repetto R. Department of Civil, Chemical and Environmental Engineering, University of
Genoa, Italy Rezzaghi M. Department of Interventional Cardiology, Fondazione CNR – Regione Toscana
“G. Monasterio”, Massa, Italy Ridolfi L. PoliToBIOMed Lab, Department of Mechanical and Aerospace Engineering,
Politecnico di Torino, Italy

xxix
Rizzo A. Department of Civil Engineering and Computer Science, University of Rome
"Tor Vergata", Italy Robles Diaz D. Leibniz Research Laboratories for Biotechnology and Artificial Organs,
Hannover Medical School, Germany; REBIRTH-Cluster of Excellence, Hannover Medical School, Germany
Rodriguez J.F. Laboratory of Biological Structure Mechanics (LaBS), Politecnico di Milano, Italy
Romano M. Department of Biomedical Sciences, Humanitas University, Milano, Italy Romano V. Department of Ophthalmology, St. Paul’s Eye Unit, Royal Liverpool University
Hospital, Liverpool, UK; Department of Eye and Vision Science, Institute of Ageing and Chronic Disease, University of Liverpool, UK
Romarowski R. Department of Civil Engineering and Architecture, University of Pavia, Italy Rosellini G. BEAMS Department, Universite Libre de Bruxelles, Belgium Rossi G.B. Measurement Laboratiry, DIMS/MEC, University of Genoa, Italy Rossini G. Department of Electronics, Information, And Bioengineering, Politecnico di
Milano, Italy Ruspi M.L. Alma Mater Studiorum – Università di Bologna Russo G.M. SenTech srl, Rome, Italy Russo M. SenTech srl, Rome, Italy
S Sabbatini M. Department of Electronics, Information, And Bioengineering, Politecnico di
Milano, Italy Sacco R. Department of Mathematics, Politecnico di Milano, Italy Sala L. IRMA UMR 7501, CNRS, Universite de Strasbourg, France Salerni F. Mathematical, Physical and Computer Science, University of Parma, Italy Santini E. CNR Institute for Condensed Matter Chemistry and Energy Technologies, Genoa,
Italy Sard A. Hand Surgery Division, AOU CTO, Torino, Italy Sborgia A. Department of Medical Basic Sciences, Neuroscience and Sense Organs,
Ophthalmology Clinic; University of Bari "A. Moro", Italy Scalona E. Department of Mechanical and Aerospace Engineering, Sapienza University of
Rome, Italy Scarsoglio S. PoliToBIOMed Lab, Department of Mechanical and Aerospace Engineering,
Politecnico di Torino, Italy Schievano S. Institute of Cardiovascular Science, University College of London, United
Kingdom Schileo E. Laboratorio di Bioingegneria Computazionale, Istituto Ortopedico Rizzoli,
Bologna, Italy Selmi M. Department of Electronics, Information and Bioengineering, Politecnico di
Milano, Italy; Division of Cardiovascular Surgery, Università degli Studi di Verona, Italy
Sensini A. Department of Industrial Engineering, Università di Bologna, Italy Sergi P.N. The Biorobotics Institute, Scuola Superiore Sant'Anna, Pisa, Italy Severino D. Private Practice in Rome Siesky B.A. Eugene and Marilyn Glick Eye Institute, Indiana University School of Medicine,
Indianapolis, IN, USA Silvani S. IRCCS- Istituto di Ricerche Farmacologiche “Mario Negri”, Milano, Italy Soleri P. Ophtec BVm Groningen, The Netehrlands Spadaro D. DICAM, University of Palermo, Italy

xxx
Spreafico L. Department of Electronics, Information and Bioengineering, Politecnico di
Milano, Italy Stagni R. Department of Electrical, Electronic and Information Engineering, University of
Bologna, Italy Stanisz G. Physical Sciences, Sunnybrook Research Institute, Toronto, Canada Stefanoni F. Department of Mathematics, Politecnico di Milano, Italy Steger B. Department of Ophthalmology, Medical University of Innsbruck, Austria Steinman D.A. Department of Mechanical & Industrial Engineering, University of Toronto,
Canada Stocchino A. Department of Civil, Chemical and Environmental Engineering, University of
Genoa, Italy Sturla F. Laboratorio di Simulazione Computazionale e 3D - IRCCS Policlinico San
Donato, San Donato Milanese, Italy Szopos M. IRMA UMR 7501, CNRS, Universite de Strasbourg, France
T Taddei F. Laboratorio di Tecnologia Medica, Istituto Ortopedico Rizzoli, Bologna, Italy;
Laboratorio di Bioingegneria Computazionale, Istituto Ortopedico Rizzoli, Bologna, Italy
Tamburini P. Department of Electrical, Electronic and Information Engineering, University of Bologna, Italy
Tatone A. DISIM, Università degli Studi dell'Aquila, Italy Terzini M. Department of Mechanical and Aerospace Engineering, Politecnico di Torino,
Italy Tonazzini I. NEST, the National Enterprise for nanoScience and nanoTechnology, Pisa, Italy;
Istituto Nanoscienze-CNR, Pisa, Italy; Fondazione Veronesi, Milano, Italy
Totaro P. Division of Cardiothoracic Surgery, Research Hospital Foundation San Matteo, Pavia, Italy
Tozzi G. School of Engineering, University of Portsmouth, UK Tran V.-D. The BioRobotics Institute, Scuola Superiore Sant’Anna, Pisa, Italy; Laboratory
of Rehabilitation Bioengineering, Auxilium Vitae Rehabilitation Centre, Volterra, Italy
Trimarchi S. Thoracic Aortic Research Center, Policlinico San Donato IRCCS, University of Milan, San Donato Milanese, Italy
V Vairo G. Department of Civil Engineering and Computer Science, University of Rome
"Tor Vergata", Italy Vasta M. Dipartimento INGEO, Università di Chieti-Pescara, Italy Veltri A. Department of Oncology, San Luigi Gonzaga Hospital, University of Torino,
Italy Vena P. Department of Chemistry, Materials and Chemical Engineering, Politecnico di
Milano, Italy Vignali E. BioCardioLab, Fondazione CNR-Regione Toscana “G. Monasterio”, Massa, Italy Vignali E. BioCardioLab, Fondazione CNR-Regione Toscana “G. Monasterio”, Massa, Italy Villa T. Department of Chemistry, Materials and Chemical Engineering, Politecnico di
Milano, Italy; IRCCS Istituto Ortopedico Galeazzi, Milano, Italy Villani G. Department of Civil Engineering and Computer Science, University of Rome
"Tor Vergata", Italy Vismara R. Department of Electronics, Information and Bioengineering, Politecnico di
Milano, Italy Vivoli G. BioCardioLab, Fondazione CNR-Regione Toscana “G. Monasterio”, Massa, Italy

xxxi
Votta E. Department of Electronics, Information and Bioengineering, Politecnico di
Milano, Italy W
Wasserman B. Russell H. Morgan Department of Radiology and Radiological Sciences, Johns Hopkins University, USA
Whyne C. Orthopaedic Biomechanics Laboratory, Sunnybrook Research Institute, Toronto, Canada
Woodburn J. School of Health and Life Sciences, Glasgow Caledonian University, UK Wriggers P. Institute of Continuum Mechanics, Leibniz Universität Hannover, Germany Wu W. Mechanical Engineering Department, University of Texas at San Antonio, USA
X Xie Y. Russell H. Morgan Department of Radiology and Radiological Sciences, Johns
Hopkins University, USA Z
Zanetti E. Department of Engineering, University of Perugia, Italy Zhuola Department of Mechanical Materials and Aerospace Engineering, University of
Liverpool, UK Zingales M. DICAM, University of Palermo, Italy Zucchelli A. Department of Industrial Engineering, Università di Bologna, Italy Zweigerdt R. Leibniz Research Laboratories for Biotechnology and Artificial Organs,
Hannover Medical School, Germany; REBIRTH-Cluster of Excellence, Hannover Medical School, Germany

xxxii
xxxiii
Geographical Distribution of Authors
... in the world
222
14
S5
S
1
14
3B
3
3
2
26
1
1
S 9
10

xxxiv

xxxv
B4
B2
B
B1
26
3
13
2
68
3
4
27
115
2
1
34
S1
21
4
1
13
Geographical Distribution of Authors
... in Italy

xxxvi

THEMATIC SYMPOSIUM
Ocular Biomechanics


A biomechanical model of the cornea to guide refractive interventions
P. Büchler1
1Institute for Surgical Technology and Biomechanics, University of Bern, Switzerland Email: [email protected] Abstract — The planning of refractive surgical interventions is a challenging task. Numerical modelling has been proposed as a solution to support surgical intervention and predict visual acuity. We propose a numerical framework to simulate patient-specific intervention based on corneal topography acquired on the patient. A validation study performed on patients who underwent cataract surgery showed that the model was able to predict the level of astigmatism induced by the intervention. We can conclude that the numerical simulation can become a valuable tool to plan corneal incisions in cataract surgery and other ophthalmo-surgical procedures in order to optimize patients’ refractive outcome and visual function. Keywords: opto-mechanical; personalized finite-element analysis; wavefront.
Models of fluid flow in the vitreous chamber and generation of
vitreoretinal tractions
R. Repetto1
1Department of Civil, Chemical and Environmental Engineering, University of Genoa, Italy Email: [email protected] Abstract — The vitreous cavity is filled by the vitreous humour, which is a substance with viscoelastic properties. Understanding the dynamics of vitreous induced by eye rotations is important because the vitreous exerts tractions on the retina that are associated with the occurrence of retinal detachment. In the talk various mathematical and experimental models of generation of vitreoretinal tractions will be presented and discussed. Both the physiological case and various pathological states will be considered, in particular myopia, posterior vitreous detachment and vitreoschisis. Keywords: vitreoretinal tractions; vitreoschisis; posterior vitreous detachment; myopia.
Towards a full model for ocular biomechanics, fluid dynamics and
hemodynamics
L. Sala1, C. Prud’homme1, M. Szopos1, G. Guidoboni2
1IRMA UMR 7501, CNRS, Université de Strasbourg, France; Email: [email protected] 2Department of Electrical Engineering & Computer Science, University of Missouri, Columbia, MO, USA Email: [email protected] Abstract — This contribution presents an ongoing work to implement a patient-specific mathematical virtual simulator for the eye. The aim is to create a multiscale and multiphysics model for the description of ocular biomechanics, fluid dynamics and hemodynamics. This instrument may serve to illustrate and estimate some clinically relevant parameters and predict their spatial and temporal evolution adopting forward-looking numerical techniques. Keywords: ocular virtual simulator; hybridisable discontinuous Galerkin method; multiphysics; multiscale.
Nano-structure and mechanical changes in sclera following
proteoglycan depletion Zhuola1, S. Barrett2, Y.A. Kharaz3, E. Comerford3,
R. Akhtar1
1Dept. Mechanical Materials & Aerospace Engr., Univ. of Liverpool, UK; Email: [email protected] 2Department of Physics, University of Liverpool, UK 3Institute of Ageing and Chronic Disease, University of Liverpool, UK Abstract — The mechanical properties of ocular tissues such as the sclera have a major impact on healthy function of the eye, and are governed by the properties and composition of the microstructural components. For example, biomechanical degradation associated with myopia occurs alongside a reduction of proteoglycans. In this study, the role of proteoglycan degradation on the nano-mechanical properties of the porcine sclera is explored. In vitro enzymatic degradation of proteoglycans was conducted with α-amylase and chondroitinase ABC enzymes. Collagen fibril morphology and nanomechanical stiffness was
Proceedings VII Meeting Italian Chapter of the European Society of Biomechanics (ESB-ITA 2017) 28-29 September 2017, Rome - Italy
3
ISBN: 978-88-6296-000-7

measured with atomic force microscopy (AFM). The elastic modulus of the tissue was reduced in all enzyme treated samples relative to controls. In addition, collagen fibril organisation was disrupted by proteoglycan depletion. Our data demonstrate that proteoglycans play an important role in determining not only the mechanical properties at these length scales but also collagen fibril arrangement. Keywords: proteoglycan depletion; collagen structure; scleral mechanical properties.
Clinical assessment of intraocular pressure: A whole eye dynamic model
F. Stefanoni1, A. Harris3, M. Szopos2, C. Prud’homme2, R. Sacco1, D. Messenio4,
M.L. Costantino1, G. Guidoboni5
1Department of Mathematics, Politecnico di Milano, Italy; Email: [email protected] 2IRMA UMR 7501, CNRS, Strasbourg University, France 3Eugene and Marilyn Glick Eye Institute, Indiana University School of Medicine, Indianapolis, IN, USA 4Eye Clinic, Department of Clinical Science - ASST Fatebenefratelli Sacco - University of Milan, Italy 5Department of Electrical Engineering and Computer Science, University of Missouri, Columbia, MO, USA Email: [email protected] Abstract — The aim of this work is to provide a quantitative description of how geometrical and material properties of ocular tissues and fluids influence intraocular pressure (IOP). Keywords: intraocular pressure; glaucoma management; mathematical modelling; sensitivity analysis. Ultrastructural and nanomechanical
changes of the cornea following enzymatic degradation
A. Kazaili1, R. Akhtar2
1School of Engineering, University of Liverpool, UK Email: [email protected] 2Dept. Mechanical Materials & Aerospace Engr., Univ. of Liverpool, UK; Email: [email protected]
Abstract — Understanding of the ultrastructure and nano-mechanical behaviour of the cornea is important for a number of ocular disorders. In this study, atomic force microscopy (AFM) was used to determine nano-scale changes in the porcine cornea following enzymatic degradation. Different concentrations of amylase were used to degrade the cornea. Following enzyme treatment a reduction in nano-stiffness along with a disrupted collagen topography in the stroma was observed. This study highlights the interplay between mechanical properties and collagen organisation in the healthy cornea. Keywords: corneal biomechanics; amylase; keratoconus. Multiscale modeling and simulation of neurovascular coupling in the retina
R. Sacco1, A.G. Mauri1, A. Cardani1, B.A. Siesky2,
G. Guidoboni3, A. Harris2
1Department of Mathematics, Politecnico di Milano, Italy Email: riccardo.sacco, aureliogiancarlo.mauri, [email protected] 2School of Medicine, Indiana University, USA Email: [email protected], [email protected] 3Department of Electrical Engineering and Computer Science, University of Missouri, Columbia, MO, USA Email: [email protected] Abstract — The role of nitric oxide (NO), usually considered as a potent vasodilator, in regulating retinal neurovascular coupling is still elusive. Measurements of flicker light-induced functional hyperemia in humans show that an increase of NO levels reduces vasodilation. This evidence has lead to conjecture that such increase may be responsible for suppressing flickerevoked vasodilation in diabetic retinopathy. In this paper, we propose a mathematical model to theoretically investigate the effect of an increase of neural NO (nNO) on the vasodilation of retinal arterioles. Simulation results indicate that nNO increase may (1) significantly affect vasoconstrictive agent production by glial cells; and (2) elicit vasoconstriction rather than vasodilation in retinal arterioles. Model predictions seem therefore to support the conjecture that NO increase may be responsible for suppressing flicker-evoked vasodilation in diabetic retinopathy. Keywords: visual neuroscience; mathematical modelling; retinal regulation; retinal disfunction.
Proceedings VII Meeting Italian Chapter of the European Society of Biomechanics (ESB-ITA 2017) 28-29 September 2017, Rome - Italy
4
ISBN: 978-88-6296-000-7

Polarimetric interferometry to objectively evaluate the optical
properties of corneal stroma
E. Lipari1, A. Sborgia2, M. Nubile3, L. Mastropasqua3, G. Alessio2
1Phronema s.r.l., Bari, Italy; Email: [email protected] 2Dept. Medical Basic Sci., Neuroscience & Sense Organs, Ophthalmology Clinic; University of Bari "A. Moro", Italy 3Dept. Medicine & Ageing Sciences, Ophthalmology Clinic, University "G. d' Annunzio" of Chieti-Pescara, Italy Abstract — A new non-invasive method, has been developed to objectively evaluate the optical properties of stroma, based on the interferometric analysis of diffractive and polarizing effects related to the birefringent properties of corneal collagen fibrils. The new method shows a relevant impact on corneal surgeries specifically for lamellar transplantation where, due to the polarizing properties of stroma, the alignment between collagen fibrils of donor cornea with patient collagen fibrils orientation has shown an improvement of visual acuity post op. Further studies on regularity of cornea isogyre pattern are showing a strong impact of this new method on early stage diagnosis of corneal disease. Keywords: corneal cross; isogyre; melatope; birefringence.
Computational corneal biomechanics in clinic
M.A. Ariza-Gracia1,2, D.P. Pinero3, J.F. Rodriguez4,
B. Calvo1,5 1AMB, i3A, University of Zaragoza, Spain Email: [email protected] 2ISTB, Universität Bern, Switzerland Email: [email protected] 3OFTALMAR, Vithas Medimar Internacional Hospital, Spain; Email: [email protected] 4LaBS, Politecnico di Milano, Italy Email: [email protected] 5CIBBER-BBN, Spain; Email: [email protected] Abstract — Corneal topographers and air-puff devices aim at completely characterizing the so-called ‘corneal biomechanics’, a collection of
features that describes the corneal behaviour. The European FP7 project (PopCorn) was born with the goal of integrating both technologies together. Between the novelties, computational models were included as an integral part of the clinical assessment. Automatic patient-specific (P-S) reconstruction of the cornea, alongside material prediction based on finite element simulations, optimization, and fitting were used to strive forward in the a priori surgical planning. Both methodologies show a good performance in retrieving the P-S geometry of the cornea (error < 1%), and the maximum deformation amplitude of a non-contact tonometry (error ~ 5%). Nevertheless, physiological and no-physiological corneas cannot be classified solely in terms of material, at least with a single experiment. Eventually, and due to the interplay of different factors (geometry, material, and pressure), results coming from air-puff devices should be handled with care. Keywords: non-contact tonometry; corneal biomechanics; patient-specific; material characterization.
Biomechanical evaluation of central and peripheral Descemet membrane
endothelial graft
V. Romano1,2, Zhuola1, Z. Chang3, B. Steger4, H. Levis2, S. Kaye1,2, R. Akhtar3
1Department of Ophthalmology, St. Paul’s Eye Unit, Royal Liverpool University Hospital, UK Email: [email protected] 2Department of Eye and Vision Science, Institute of Ageing and Chronic Disease, University of Liverpool, UK 3Department of Mechanical, Materials and Aerospace Engineering, School of Engineering, University of Liverpool, UK; Email: [email protected] 4Department of Ophthalmology, Medical University of Innsbruck, Austria Abstract — Corneal endothelial transplant is the gold standard treatment in cases of corneal endothelial cellular dysfunction. Preparation, delivery and unfolding of the graft are technically demanding. We assessed the biomechanical behaviour of Descemet membrane to better understand DMEK graft behaviour and to select the right diameter and donor age graft. The biomechanical behaviour was tested using atomic force microscopy on five corneas unsuitable for
Proceedings VII Meeting Italian Chapter of the European Society of Biomechanics (ESB-ITA 2017) 28-29 September 2017, Rome - Italy
5
ISBN: 978-88-6296-000-7

transplantation. Peripheral cornea was found to be stiffer than the centre (respectively, 3171.89 MPa, 2837.20 MPa). Elastic modulus of both centre and periphery of the cornea exhibited a trend to decrease with age. In addition, central cornea becomes stiffer than the periphery in older patients, while the peripheral cornea was stiffer in younger patients. Atomic force microscopy is a suitable technique for evaluating biomechanical behaviour of DMEK grafts. One interpretation of this varied behaviour is that the type and quantity of collagen change with age and with location. Keywords: cornea transplant; endothelial keratoplasty; atomic force microscopy; biomechanical behaviour.
The effect of serum proteins on dynamic interfacial properties of silicone oils in vitrectomized eyes
I. Nepita1, L. Liggieri3, E. Santini3, F. Ravera3,
M.R. Romano2, J.O. Pralits1, R. Repetto1
1Dept. Civil, Chemical & Environmental Engr., University of Genoa, Italy Email: [email protected] 2Dept. Biomedical Sci., Humanitas University, Milano, Italy; Email: [email protected] 3CNR Institute for Condensed Matter Chemistry and Energy Technologies, Genoa, Italy Email: [email protected] Abstract — The formation and stability of emulsions in vitrectomized eyes is linked to the properties of the silicone oilaqueous humor interface, in particular the surface tension. In the presence of natural surfactants, such as serum and plasma, the value of the surface tension is likely to change, but little quantitative information is presently available. To this end we perform accurate experiments measuring the interfacial properties of silicone oil (Siluron 1000) with an aqueous solution in the presence of endogenous-like proteins. It is found that the surface tension is significantly reduced when physiologically realistic concentrations are used. Moreover, the obtained values of the dilational viscoelastic modulus are compatible with the formation of stable emulsions. Keywords: vitrectomy; silicone oil; surface tension; emulsion.
A stochastic model of stroma: Interweaving variability and compressed fibril exclusion
M. Vasta1, A. Gizzi2, A. Pandolfi3
1Dept. INGEO, University of Chieti-Pescara, Italy Email: [email protected] 2Department of Engineering, University Campus Bio-Medico of Rome, Italy; Email: [email protected] 3Dept. Civil & Environmental Engr., Politecnico di Milano, Italy; Email: [email protected] Abstract — Hyperelastic constitutive models of the human stroma accounting for the stochastic architecture of the collagen fibrils and particularly suitable for computational applications are discussed. The material is conceived as a composite where a soft ground matrix is embedded with collagen fibrils characterized by inhomogeneous spatial distributions typical of reinforcing stromal lamellae. A multivariate probability density function of the spatial distribution of the fibril orientation is used in the formulation of the lamellar branching observed on the anterior third of the stroma, selectively excluding the contribution of compressed fibrils. The physical reliability and the computational robustness of the model are enhanced by the adoption of a second order statistics approximation of the average structure tensors typically employed in fiber-reinforced models. Keywords: hyperelasticity; second order structure tensors; compressive fibril exclusion; lamellar branching. Mathematical modelling of ocular and
cerebral hemo-fluid dynamics: Application to VIIP
F. Salerni1, R. Repetto2, A. Harris3, P. Pinsky4, C. Prud’homme5, M. Szopos5, G. Guidoboni6
1Mathematical, Physical and Computer Science, University of Parma, Italy Email: [email protected] 2Dept. Civil, Chemical & Environmental Engr., University of Genoa, Italy Email: [email protected] 3Ophthalmology, Indiana University School of Medicine, Unites States; Email: [email protected] 4Mechanical Engineering, Stanford University, United States; Email: [email protected] 5CNRS, IRMA UMR 7501, Strasbourg University, France
Proceedings VII Meeting Italian Chapter of the European Society of Biomechanics (ESB-ITA 2017) 28-29 September 2017, Rome - Italy
6
ISBN: 978-88-6296-000-7

Email: [email protected]; [email protected] 6Department of Electrical Engineering & Computer Science, University of Missouri, Columbia, MO, USA Email: [email protected] Abstract — This work aims at investigating the interactions between the flow of fluids in the brain and eyes and their potential implications in the development of visual impairment and intracranial pressure (VIIP) syndrome in astronauts. We propose a reduced (0-dimensional) mathematical model of fluid circulation in eyes and brain, which is embedded into a simplified whole-body circulation model. This model allows us to predict fluid redistribution in the upper body vasculature and variation of the intracranial (ICP) and intraocular (IOP) pressures. The model results suggest that, by taking into account some effects of microgravity, it is possible to observe IOP increase, blood flow decrease in the choroid and ciliary body circulation. These findings provide clues on the role that vascular components may play in VIIP pathogenesis, for which astronauts could be screened on earth and in-flight. Keywords: visual impairment and intracranial pressure syndrome; intracranial pressure; intraocular pressure; blood flow.
A meshfree approach to cornea-aqueous humor interaction
during tonometry tests
A. Montanino1, M. Angelillo2, A. Pandolfi1
1Dept. Civil & Environmental Engr., Politecnico di Milano, Italy; Email: [email protected] 2Dept. Engineering, Università di Salerno, Fisciano, Italy; Email: [email protected] Abstract — The dynamic tonometer test (air puff test) is an invivo investigative procedure routinely utilized in ophthalmology to estimate the intraocular pressure (IOP). A rapid localized air jet applied on the anterior surface induces the inward motion of the cornea, which interacts with the aqueous humour - filling the narrow space between cornea and iris - with a strong influence on the dynamics of the cornea. Potentially the test, quick and painless, could be combined with inverse analysis methods to characterize the patient-specific mechanical properties of the human cornea. As a step towards this aim, the present study describes a fluid-structure interaction (FSI) approach based on a
simplified geometry to simulate the anterior chamber of the eye undergoing the air puff test. We regard the cornea as a nonlinear elastic and isotropic membrane described through an analytical model and discretize the weakly compressible Newtonian fluid with a meshfree particle approach. Numerical analyses reveal a marked influence of the fluid on the dynamics of the cornea. Additionally, we investigate the possibility to use the dynamics of the test to estimate the intraocular pressure. Keywords: meshfree methods; particle methods; collocation methods; fluid-solid interaction; fluid-dynamics; air puff test.
Fluid-structure interaction of the non-contact tonometry test
M.A. Ariza-Gracia1, W. Wu2, M. Malve3,
B. Calvo1, J.F. Rodriguez4 1Mechanical Engineering Department, University of Zaragoza, Spain; Email: mariza, [email protected] 2Mechanical Engineering Department, University of Texas at San Antonio, USA; Email: [email protected] 3Mechanical Engineering Department, University of Navarra, Spain; Email: [email protected] 4LaBS, DCMIC, Politecnico di Milano, Italy Email: [email protected] Abstract — The study of the corneal biomechanics has gain interest for its applications on predicting refractive surgery outcomes and the study of a number of pathologies affecting the cornea. In this regard, non-contact tonometry has become a popular diagnostic tool in ophthalmology, and as an alternative method to characterize corneal biomechanics. Since identification of material parameters using non-contact tonometry tests rely on the inverse finite element method, accurate and reliable simulations are required. In this work we present a full fluid structure simulation of a non-contact tonometry test accounting for the effect of considering the presence of the humours. Results indicate that when inertial effects are considered, not including the humours may lead to overestimating the corneal displacement and therefore to an overestimation of the actual corneal stiffness when using the inverse finite element method. Keywords: corneal mechanics; fluid structure interaction; non-contact tonometry.
Proceedings VII Meeting Italian Chapter of the European Society of Biomechanics (ESB-ITA 2017) 28-29 September 2017, Rome - Italy
7
ISBN: 978-88-6296-000-7

A mathematical model of fluid transport across the retinal
pigment epithelium M. Dvoriashyna1, A. Foss2, E. Gaffney3, O. Jensen4,
R. Repetto1 1Dept. Civil, Chemical & Environmental Engr., University of Genoa, Italy Email: [email protected] 2Department of Ophthalmology, Nottingham University Hospitals NHS Trust, Nottingham, UK Email: [email protected] 3Wolfson Centre for Mathematical Biology, Mathematical Institute, University of Oxford, UK Email: [email protected] 4School of Mathematics, University of Manchester, UK Email: [email protected] Abstract —We propose a mathematical model of fluid transport across the retinal pigment epithelium (RPE), aimed at understanding the mechanisms that govern the flow. Quantitative description of this flow is relevant, as fluid accumulation in the sub-retinal space is related to several pathological conditions such as, in particular, age related macular degeneration (AMD). Possible mechanisms that drive water flow across the RPE are osmosis and electro-osmosis. We develop a model, which couples electrophysiology and fluid dynamics in the RPE. The model predicts the existence of ion concentration gradients in the cleft gap between adjacent cells and these gradients drive an osmotic flux, which is comparable with the measured water flux across the RPE. We also find that local osmosis is the dominant mechanism for water transport and electro-osmotic flow is subdominant, and this result is robust with change of parameters. Keywords: retinal pigment epithelium; osmosis; electro-osmosis.
Thermodynamical derivation of a nonlinear poroelastic model
describing hemodynamics-mechanics interplay in the Lamina Cribrosa
F. Recrosi1, R. Repetto2, A. Tatone3, G. Guidoboni4 1GSSI, Gran Sasso Science Institute, L’Aquila, Italy Email: [email protected] 2DICCA, University of Genoa, Italy Email: [email protected] 3DISIM, Università degli Studi dell’Aquila, Italy
Email: [email protected] 4Department of Electrical Engineering & Computer Science, University of Missouri, Columbia, MO, USA Email: [email protected] Abstract — In this paper we formulate a poroelastic model starting from a model of species diffusion in an elastic material. The governing equations are derived from general thermomechanical principles. We carefully revise the role of the energy-stress Eshelby tensor, mutuated from the framework of tissue growth, in describing the hemo-mechanical behaviour of the tissue. The model accounts for nonlinear deformations of the solid matrix and deformation induced changes in porosity and permeability. The model is applied to study the mechanics of the lamina cribrosa in the eye. This is a porous tissue at the head of the optic nerve. Deformation of this tissue and impairment of blood flow induced by tissue deformation are considered to be related to the pathogenesis of glaucoma. Keywords: poroelasticity; blood perfusion; species diffusion; large deformations.
Saccadic movement effects on intraocular drug delivery for a
wet-AMD clinical case
M. Ferroni1, M. Cereda2, F. Boschetti1 1Dept. Chemistry, Materials & Chemical Engr. "G. Natta", Politecnico di Milano, Italy Email: marco.ferroni, [email protected] 2Dept. Biomedical & Clinical Sci. Luigi Sacco, Sacco Hospital, University of Milan, Italy Email: [email protected] Abstract — Nowadays, intravitreal injections are the gold standard for the treatment of age-related macular degeneration (AMD). The prediction of the transport mechanism for the injected anti vascular endothelial growth factor (anti-VEGF) is needed in order to understand its distribution and consumption after each injection. Thus, this study aims at implementing a full model of the vitreous drug delivery. The main novelty of this work is the coupling between an experimental evaluation of the scleral permeability and a numerical analysis of the saccadic dependency of the transport phenomena. Keywords: computational fluid-dynamics; vitreous drug delivery; saccade; age-related macular degeneration.
Proceedings VII Meeting Italian Chapter of the European Society of Biomechanics (ESB-ITA 2017) 28-29 September 2017, Rome - Italy
8
ISBN: 978-88-6296-000-7

Assessment of the fluid dynamic performance of a vitreous cutter
A. Stocchino1, R. Repetto1, M. Romano2
1Department of Civil, Chemical and Environmental Engineering, University of Genoa, Italy Email: alessandro.stocchino, [email protected] 2Department of Biomedical Sciences, Humanitas University, Italy; Email: [email protected] Abstract — Vitreous cutters are surgical devices used during vitrectomy to remove the vitreous humour from the eye and replace it with tamponade fluids. Aim of the present work is to assess the performance of a vitreous cutter (the EVA Phacovitrectomy System by DORC) used with different needle sizes and blade shapes. The analysis is based on laboratory measurements of fluid flow performed using the particle image velocimetry technique. Keywords: vitrectomy; PIV; vitreous cutter.
Effect of an iris-fixated intraocular lens on corneal metabolism:
A numerical study
P. Davvalo Khongar1, J.O. Pralits1, X. Cheng2, P. Pinsky2, P. Soleri3, R. Repetto1
1Dept. Civil, Chemical & Environmental Engr., University of Genoa, Italy Email: [email protected] 2Dept. Mechanical Engr., Stanford University, CA, USA Email: [email protected] 3Ophtec BV, Groningen, Netherlands Email: [email protected] Abstract — One of the possible risks associated with the implant of iris-fixated intraocular lenses (pIOL) is loss of corneal endothelial cells. We hypothesise that this might be due to alterations in corneal metabolism secondary to the lens implantation. To verify the feasibility of this assumption we propose a mathematical model of the transport and diffusion of metabolic species in the anterior chamber and the cornea, coupled to a model of aqueous flow. Results are obtained both with and without the pIOL in the case of closed eyelids. The results suggest that glucose availability may be significantly reduced at the corneal
endothelium. However, it must still be verified whether this finding has a clinical relevance. Keywords: intraocular lens; aqueous flow; corneal metabolism.
Proceedings VII Meeting Italian Chapter of the European Society of Biomechanics (ESB-ITA 2017) 28-29 September 2017, Rome - Italy
9
ISBN: 978-88-6296-000-7

10

GENERAL SESSION
Cardiovascular CFD Hemodynamics


Abstract— This study describes a method for the reconstruction patient-specific stented coronary artery models from medical images routinely acquired during percutaneous coronary intervention. The resultant high fidelity geometries allow evaluating local hemodynamic alterations within coronary arteries after the stent deployment. The method was developed and validated on a phantom resembling a typical human coronary artery. Subsequently, it was applied to an in vivo OCT dataset to demonstrate its applicability to patient-specific cases.
Keywords— Optical coherence tomography, image segmentation, computational fluid dynamics, coronary stent.
I. INTRODUCTION ASCULAR tissue response to percutaneous coronaryintervention, such as in-stent restenosis, is influenced by
alterations of local blood flow pattern due to stent implantation [1]. Computational fluid dynamics (CFD) simulations allow the evaluation of hemodynamic variables that are known to trigger in-stent restenosis but cannot be measured in vivo.
Medical image processing is a central step for creating accurate patient-specific vessel models to be used for CFD studies. Coronary artery imaging is largely performed both during diagnostic phase and mini-invasive treatment. Among the available intravascular imaging modalities, optical coherence tomography (OCT) ensures the highest resolution (axial resolution of 12-15 μm and lateral resolution of 20-40 μm) [2]. The main drawback of OCT is that the correct orientation of the vessel in the space is not captured [2]. Consequently, information from different imaging techniques, such as angiography, is needed to reconstruct the 3D vessel geometries.
In the present work, we propose a reconstruction method based on OCT and angiographic images for creating patient-specific stented coronary artery models for the execution of CFD analyses. The reconstruction method was developed and validated on a phantom, which is representative of a typical human coronary artery. Subsequently, the method was applied to an in vivo image dataset to demonstrate its applicability to patient-specific cases.
II. MATERIAL AND METHODS
A. OCT-based reconstruction method The workflow for the reconstruction of stented coronary
artery models from OCT and angiographic images is depicted in Fig. 1. Briefly, an automatic segmentation method is used to detect the lumen contours and stent struts in each OCT
frame. Details about this segmentation method are reported elsewhere [2]. The 3D shape of the treated artery is provided by the vessel centreline, which is reconstructed from two angiography projections using the software CAAS (Pie Medical Imaging BV, The Netherlands). The 3D centerline is used to properly arrange the lumen contours and stent struts, so that the twist angle error is reduced. The 3D model of the coronary artery with the stent is obtained from the aligned components and is used to perform the CFD analysis.
B. Validation of the reconstruction method A phantom of a coronary vessel resembling a human left anterior descending coronary segment with bifurcations was 3D printed (Fig. 2). After the deployment of a Multi-Link 8 stent (Abbott Vascular, USA) by an interventional cardiologist, an OCT acquisition was performed. The phantom was also scanned with an X-ray micro computed tomography (µCT) system and the obtained slices were processed to extract the vessel and stent centerlines. Then, the OCT-based reconstruction method was employed to obtain the 3D model of the vessel phantom.
Figure 1 – Workflow for 3D reconstruction of stented coronary artery CFD models from angiography and OCT.
Reconstruction of stented coronary arteries for CFD analyses: from in vitro to patient-specific models
S. Migliori1, M. Bologna1,2, E. Montin2, G. Dubini1, C. Aurigemma3, F. Burzotta3, L. Mainardi2, F. Migliavacca1, and C. Chiastra1
1 LaBS, Dept. of Chemistry, Materials and Chemical Engineering “Giulio Natta”, Politecnico di Milano, Milan, Italy 2 Dept. of Electronics, Information and Bioengineering, Politecnico di Milano, Milan, Italy
3 Institute of Cardiology, Catholic University of the Sacred Heart, Rome, Italy
V
Proceedings VII Meeting Italian Chapter of the European Society of Biomechanics (ESB-ITA 2017) 28-29 September 2017, Rome - Italy
13
ISBN: 978-88-6296-000-7

Figure 2 – Coronary artery phantom: A) CAD model of a coronary vessel resembling a patient-specific left anterior descending coronary artery with bifurcations. B) 3D print of the phantom. C) Angiography after stent deployment.
The automatic segmentation algorithm of the OCT images was validated against manual segmentation, executed by two independent image readers. Statistical correlation, agreement, and linear regression between datasets were tested. Differences between the automatic and manual segmentation methods were evaluated by computing similarity indexes.
The 3D reconstruction was compared against that obtained from µCT, which was considered as reference.
C. Application to a patient-specific case The reconstruction method was applied to OCT and
angiographic images of the right coronary artery of a patient treated at the Institute of Cardiology, Catholic University of the Sacred Heart (Rome, Italy) with a 3.5x28 mm Xience Prime stent (Abbott Vascular).
The obtained 3D stented model, which includes one bifurcation, was discretized using 5,957,992 tetrahedral elements. A transient CFD analysis was performed using Fluent (Ansys Inc.). A typical right coronary artery flow waveform [3] was applied at the inlet with a flat velocity profile. The mean flow-rate was estimated by counting in the angiographic projections the number of frames required for the contrast agent to pass from the inlet to the outlets [4]. A flow-split 0.94:0.06 for the distal main branch and side branch, respectively, was applied at the outlets. Simulations settings are reported in [5].
III. RESULTS
A. Validation of the reconstruction method High linear correlation was found between the automatic
and manual segmentations in terms of lumen area values (r=0.999, p<0.005). The values of similarity indexes confirmed the correct identification of lumen contours (i.e. values of evaluated indexes > 96%) and a good detection of the stent (i.e. values of evaluated indexes > 77%).
The 3D model reconstructed from OCT showed good consistency with acquired images. The regions with malapposed stent struts within the 3D model were consistent with those in the OCT images. The percent difference in area and relative error of volume between the OCT and μCT lumen reconstructions were 17.5% and 7.1%, respectively. The median of the total distances between stent reconstructions was 198.75 μm.
B. Patient-specific case The local hemodynamics of the patient-specific case was
analyzed in terms of wall shear stress (WSS) descriptors. Figure 3 shows the WSS distribution along the lumen surface. The region exposed to time-averaged WSS lower than 0.4 Pa, which is related to the risk of restenosis, was confined to the stent region with a percentage area of 39.5%.
Figure 3 – Contour map of time-averaged WSS (TAWSS) along the lumen of the right coronary artery segment of a patient treated with a 3.5x28 mm ience Prime stent.
IV. CONCLUSION
This study describes a validated method for the reconstruction of patient-specific stented coronary artery models from medical images routinely acquired during percutaneous coronary intervention. The resultant high fidelity geometries allow evaluating local hemodynamic alterations within coronary arteries after stent deployment, with outcomes that are peculiar of each clinical case.
ACKNOWLEDGEMENT S. Migliori is supported by the European Commission through the H2020
Marie Sk odowska-Curie European Training Network H2020-MSCA-ITN-2014 VPH-CaSE, www.vph-case.eu, GA No. 642612.
M. Levi and C. Credi (+LAB, Dept. of Chemistry, Materials and Chemical Engineering “Giulio Natta”, Politecnico di Milano) are acknowledged for the 3D printing of the phantom. R. Fedele (Dept. of Civil and Environmental Engineering, Politecnico di Milano) is acknowledged for the µCT of the phantom.
REFERENCES [1] K. Van der Heiden, F. J. H. Gijsen, A. Narracott, S. Hsiao, I. Halliday,
et al., “The effects of stenting on shear stress: relevance to endothelial injury and repair.,” Cardiovasc. Res., vol. 99, no. 2, pp. 269–75, 2013.
[2] C. Chiastra, E. Montin, M. Bologna, S. Migliori, C. Aurigemma, et al., “Reconstruction of stented coronary arteries from optical coherence tomography images: feasibility, validation, and repeatability of a segmentation method,” PLoS One, In press, 2017.
[3] J. E. Davies, Z. I. Whinnett, D. P. Francis, C. H. Manisty, J. Aguado-Sierra, et al., “Evidence of a dominant backward-propagating ‘suction’ wave responsible for diastolic coronary filling in humans, attenuated in left ventricular hypertrophy,” Circulation, vol. 113, no. 14, pp. 1768–1778, 2006.
[4] S. Sakamoto, S. Takahashi, A. U. Coskun, M. I. Papafaklis, A. Takahashi, et al., “Relation of Distribution of Coronary Blood Flow Volume to Coronary Artery Dominance,” Am. J. Cardiol., vol. 111, no. 10, pp. 1420–1424, 2013.
[5] C. Chiastra, S. Morlacchi, D. Gallo, U. Morbiducci, R. Cárdenes, et al., “Computational fluid dynamic simulations of image-based stented coronary bifurcation models.,” J. R. Soc. Interface, vol. 10, no. 84, p. 20130193, 2013.
Proceedings VII Meeting Italian Chapter of the European Society of Biomechanics (ESB-ITA 2017) 28-29 September 2017, Rome - Italy
14
ISBN: 978-88-6296-000-7

Abstract—Here we aimed at identifying associations between local hemodynamics and imaging markers of early atherosclerosis. At the carotid bifurcation, distinct hemodynamic factors are involved at different stages of the early atherosclerotic changes (i.e., endothelial dysfunction and adventitial neovascularization vs. wall thickening), and may not necessarily go hand-in-hand.
Keywords—Atherosclerosis, wall shear stress, wall thickness, contrast enhancement.
I. INTRODUCTION MPLE evidence supports the role of “disturbed” bloodflow in the focal development of atherosclerotic
plaques, in particular low and oscillatory wall shear stress (WSS). In vivo studies on the role of hemodynamic stimuli in atherosclerosis have typically used wall thickness (WT) or intima-media thickness as a measurable surrogate markers of atherosclerotic changes to the vessel wall. However, the earliest preclinical manifestations of atherosclerosis, namely endothelial cells (ECs) dysfunction and adventitial vasa vasorum neo-vascularization, appear prior to wall thickening and apparent structural changes of the vessel wall [1].
Contrast-enhanced MRI now allows for the in vivo characterization of early atherosclerotic changes, as uptake of the contrast agent into the wall is thought to be mediated by adventitial vasa vasorum and EC permeability [2]. Moreover, MRI can be used to measure WT in vivo, and provides the anatomical and functional information required for subject-specific computational quantification and classification of local hemodynamic conditions. This allows us to compare, for the first time in vivo in humans, markers of “disturbed” WSS as obtained from patient-specific computational hemodynamics against MRI-derived markers of the earliest preclinical atherosclerotic changes.
II. METHODS
A. In vivo Data MRI scans were performed on a 3T scanner (Achieva,
Philips Healthcare; Best, The Netherlands). The protocol included 3D time-of-flight, 3D contrast-enhanced magnetic resonance angiography (CE-MRA), phase contrast MRI (PC-MRI), and black blood MRI (BB-MRI). A CE-MRA was acquired following intravenous injection of gadolinium as contrast agent. Retrospectively-gated, 2D cine PC-MRI images were acquired prior to contrast injection and placed
transverse to the nominal long axis of the common carotid artery (CCA) and, in a separate acquisition, through the internal and external carotid arteries (ICA and ECA, respectively). Further details of the CE-MRA and PC-MRI protocols are provided elsewhere [2].
BB-MRI images were acquired both before and after the CE-MRA at the CCA and at the carotid bifurcation. To measure WT, the inner and outer wall boundaries were segmented from the pre- and post-contrast BB-MRI images at the CCA, and for the ICA at the first slice distal to the flow divider (FD), a standard location hereafter referred to as FD+1. The contours were used to compute WT at 12 equally-spaced sectors. Contrast enhancement (CE) was computed as the relative change in sector intensities from the pre to post-contrast BB-MRI images. CCA-WT and CCA-CE were defined as the respective maximum values from the 12 sectors. For ICA-WT and ICA-CE, we determined the maxima from the FD+1 slice data.
B. Computational Hemodynamics In lumen segmentation from CE-MRA, all 42 cases
included the proximal CCA to at least five diameters upstream of the bifurcation. Subject-specific flow rate waveforms were extracted from the cine PC-MRI series. Computational hemodynamics simulations were carried out [3]. We computed three established descriptors of low and oscillatory shear, i.e. the time-averaged wall shear stress magnitude (TAWSS), oscillatory shear index (OSI), and relative residence time (RRT). Data from all 42 simulated cases were pooled to identify the upper (lower) 20th percentile value of OSI, and RRT (TAWSS). For each CFD model, branches were split into CCA and ICA segments. For each segment, the surface area exposed to OSI, RRT above (or TAWSS below) its respective threshold value was calculated, and divided by the respective segment’s surface area. These variables, reflecting the relative area exposed to disturbed flow associated with a particular hemodynamic descriptor, are denoted as LSA (low shear area), OSA (oscillatory shear area), RTA (residence time area).
Pearson linear regressions were used to identify relationships between each hemodynamic variable and either WT or CE. Multiple regressions were used to control for cardiovascular risk factors independently correlated with WT or CE. Regressions are reported as the individual standardized correlation coefficient (β) and P-value.
Hemodynamic factors associations with early atherosclerotic changes at the carotid bifurcation D. Gallo1, P. Bijari2, U. Morbiducci1, Y. Qiao3, Y. Xie3, D. Haabets2, B. Wasserman3, D.A. Steinman2
1 PoliToBIOMed Lab, Department of Mechanical and Aerospace Engineering, Politecnico di Torino, Italy 2 Department of Mechanical & Industrial Engineering, University of Toronto, Canada
3 Russell H. Morgan Department of Radiology and Radiological Sciences, Johns Hopkins University, USA
A
Proceedings VII Meeting Italian Chapter of the European Society of Biomechanics (ESB-ITA 2017) 28-29 September 2017, Rome - Italy
15
ISBN: 978-88-6296-000-7

III. RESULTS
Age and hypertension were used to adjust CCA-WT in subsequent (multiple) linear regressions. HDL concentration was used to adjust ICA-WT. Neither ICA-CE nor CCA-CE was correlated with any cardiovascular risk factors.
The complete set of 42 reconstructed carotid bifurcation geometries, showing LSA, is presented in Figure 1. As summarized in Table I, a significant and segment-specific association between wall thickening and OSA at the CCA (β=0.311, P=0.031) and ICA (β=0.343, P=0.022), but no other hemodynamic variable, was observed. CE at the ICA, on the other hand, was strongly associated with LSA (β=0.533, P=0.0003) and RTA (β=0.489, P=0.001) at that segment. CCA-CE was not associated with any hemodynamic variable.
Figure 1. Maps of WSS for all 42 cases outlining LSA, ordered from lowest (top left) to highest (bottom right) LSA.
IV. DISCUSSION
The presented results indicate that LSA is associated with increased contrast uptake at the carotid bulb, as measured by CE at the ICA, whereas high OSI (and not LSA) is associated with increased bulb WT. As no significant correlation was found between WT and CE, in the atherosclerosis initiation process they represent different aspects, which we demonstrate to be linked to distinct hemodynamic disturbances. Since the processes resulting in an increased gadolinium uptake precede wall thickening and frank atheroma formation [4], low WSS appears to be an earlier marker of atherosclerotic changes than high OSI, at least in the subclinical individuals studied here. This advocates against the common conflation of the terms “low” and “oscillatory” WSS in the context of early atherosclerosis studies at the carotid bifurcation. Notably, our data indicate that oscillatory WSS affects a later stage in atherosclerosis than low WSS, namely wall thickening.
The presented association between LSA and CE at the carotid bulb is consistent with the idea of CE being an early marker of EC dysfunction caused by flow stagnation, a flow condition characterized by low WSS. In fact, low WSS has been reported to increase EC permeability by inducing non-physiological EC turnover, and increasing the presence of leaky junctions [5]. Such WSS-mediated processes on ECs would naturally increase contrast agent uptake from the luminal side into the vessel wall. On the other hand, neovascularization from adventitial vasa vasorum may also be postulated as a reason for increased CE. In fact, ample evidence supports the occurrence of neovascularization as
the initial stage of atherosclerotic disease, occurring before the development of atherosclerotic plaque [2]. The dominant stimulus is relative hypoxia and the associated local oxidative stress. It has been previously demonstrated that hypoxic conditions at the vessel wall occur in regions of the carotid bifurcation characterized by low WSS conditions [2].
Although it is not possible in our study to separate these sources of augmented CE uptake, the present relation ultimately suggests a connection between both mechanisms. In fact, LSA in the bifurcation implies a slowly recirculating flow, providing, concurrently: i) the cue for inflammatory changes underlying EC permeability increase; and ii) a fluid mechanical barrier to oxygen transport, exposing EC and in general the vessel wall to hypoxic conditions, which in turn stimulate adventitial vasa vasorum neovascularization.
V. CONCLUSION Low WSS and oscillatory WSS appear to associated with
different facets of early atherosclerosis at the carotid artery. From the present results, low WSS is associated with increased contrast uptake, while oscillatory WSS is associated with increased wall thickening. Since the processes resulting in an increased contrast uptake precede wall thickening, low WSS magnitude may be considered an earlier “local” risk marker for atherosclerotic changes than oscillatory (or indeed low and oscillatory) WSS.
REFERENCES [1] B.J. Choi, Y. Matsuo, T. Aoki, T.G. Kwon, A. Prasad at al., “Coronary
endothelial dysfunction is associated with inflammation and vasa vasorum proliferation in patients with early atherosclerosis”, Arterioscl Throm Vas Biol, vol. 34, pp- 2473-2477, 2014.
[2] Y. Qiao, D. Steinman, M. Etesami, A. Martinez, E.G. Lakatta et al., “Impact of T2 decay on carotid artery wall thickness measurements”, J Magn Reson Imaging, vol. 37(6), pp. 1493-1498, Jun 2012.
[3] D. Gallo, D. Steinman, U. Morbiducci, “Insights into the co-localization of magnitude- vs. direction-based indicators of disturbed shear at the carotid bifurcation”, J Biomech, vol. 46, pp. 2413-2419, 2016.
[4] M. Jeziorska, D.E. Woolley, “Neovascularization in early atherosclerotic lesions of human carotid arteries: Its potential contribution to plaque development”, Hum Pathol, vol. 30, pp. 919-925, 1999.
[5] J. LaMack, H. Himburg, X. Li, M. Friedman, “Interaction of wall shear stress magnitude and gradient in the prediction of arterial macromolecular permeability”, Ann Biomed Eng, vol. 33, pp. 457-464, 2005.
TABLE I - *P<0.05; **P<0.001.
Hemodynamic Wall Thickness Contrast Enhancement
Variables CCA ICA CCA ICA
CCA - LSA E = 0.116 E = 0.094 E = -0.066 E = 0.141
CCA - OSA E 0.311 E = 0.272 E = -0.101 E = 0.030
CCA - RTA E = 0.241 E = 0.180 E = -0.109 E = 0.146
ICA - LSA E = 0.208 E = 0.155 E = 0.028 E 0.533
ICA - OSA E = 0.177 E 0.343 E = -0.106 E = 0.217
ICA - RTA E = 0.272 E = 0.248 E = -0.001 E 0.489
Standardized coefficients (β) from linear regressions of hemodynamic variables vs. wall thickness or contrast enhancement. Bold and superscripts highlight significant regressions.
Proceedings VII Meeting Italian Chapter of the European Society of Biomechanics (ESB-ITA 2017) 28-29 September 2017, Rome - Italy
16
ISBN: 978-88-6296-000-7

Abstract—Here Complex Network theory is applied for the first time to explore the intricate hemodynamics in intracranial aneurysms. The exploratory analysis, carried out on an image-based computational hemodynamics model, suggests the formation of spatial patterns which coherently link parent vessel fluid structures to the intricate hemodynamics within the aneurysmal sac. Keywords— computational hemodynamics, complex
networks, intracranial aneurysm.
I. INTRODUCTION N recent years coupling medical imaging andcomputational fluid dynamics (CFD) has shown promise
for informing treatment planning and rupture risk assessment for intracranial aneurysms [1]-[5]. However, a disparity of opinions still persists in the aneurysm CFD literature regarding the diagnostic/therapeutic impact of computational hemodynamics [6], [7], where robust hemodynamic indicators of rupture risk have not yet been identified. To get more knowledge on aneurysmal hemodynamics, here an aneurysm case is considered, presenting high-frequency flow instabilities [1], [3], and on it an exploratory approach is applied, based on the complex network (CN) theory [8], [9]. CNs represent a powerful tool to explore complexity of physical systems with a huge number of interacting elements. Although interest in complex networks has been increasing in the last years, no studies have been applied to cardiovascular hemodynamics. In detail, an investigation starting from a two-point correlation for the velocity magnitude of intracranial aneurysm hemodynamics numerically solved is proposed. The analysis of the degree centrality, a well-established metric for CN characterization, suggests the formation of spatial patterns that coherently link parent vessel fluid structures to the intricate hemodynamics within the aneurysmal sac.
II. METHODS
A. CFD simulations To explore the efficacy of complex networks when applied
to cardiovascular hemodynamics, an aneurysm model from the open-source Aneurisk database (Aneurisk-Team, 2012) was selected. The Vascular Modelling ToolKit (VMTK) was used to generate a mesh of 1.8M P2-P1 tetrahedra and a pulsatile simulation was performed using a second-order accuracy, finite element CFD solver, with a temporal resolution of 20,000 time steps per cardiac cycle [1], [3]. A fully developed Womersley velocity profile was applied at the inlet, and zero pressure was specified at the outlet sections. For this CN analysis the resulting CFD data were
downsampled to a 290k P1-P1 mesh and 2500 time steps.
B. Model Branch Splitting To get insights into how local hemodynamics inside the
parent vessel is correlated with fluid structure in the aneurysmal sac, the parent vessel was split into its three branches, and the aneurysmal sac was isolated. As final result of the splitting strategy, the main parent vessel (Branch1), its branches (Branch2 and Branch3), and the isolated aneurysm (Sac) were obtained.
C. Complex Networks: Definitions and Metrics In graph theory, a CN is a network with significant patterns
of connection between its elements and topological features that often occur when modelling real systems. A network (or graph) is defined by a set V = 1,...,N of nodes and a set E of links i, j . In this work, we assume that the graphs are undirected, i.e., links have no orientation ( i, j = j, i ). In addition to that, only one link can exist between each pair of nodes. The graph is represented by the adjacency matrix:
^ `^ `¯
®
EjiifEjiif
Aij ,1,,0
(1)
Aij elements are equal to 1 if a link does exist between nodes i and j, and is equal to zero elsewhere.
One of the most popular CN metrics, applied to measure the centrality of a node, is the normalized degree centrality:
¦
N
jiji Ak N 11
1 (2)
that gives the number of first neighbours of node i, normalized to the total number of possible neighbours (N-1).
D. Application of CNs to the aneurysm hemodynamics Velocity magnitude time histories along the cardiac cycle at
all nodes of the discretized fluid domain were considered as obtained from the downsampled CFD simulation, and the correlation between each pair of nodes was calculated. Then, a correlation matrix R was created where each element Rij is the Pearson correlation coefficient between velocity magnitude time histories in nodes i and j. The correlation matrix was used to build the network. In detail, the adjacency matrix of eq. (1) was defined by establishing that a link between nodes i and j does exist only if Rij is greater than a threshold value Rt. In this way, the couples of nodes i, j with Rij > Rt are represented in the adjacency matrix with Aij = 1, being Aij = 0 elsewhere. Here, we are interested in exploring the spatial patterns of correlation in the velocity field along the cardiac cycle. For this reason, correlation and adjacency matrices were built up considering: (1) the
Exploring intracranial aneurysm hemodynamics with a complex networks approach
K. Calò1, M. Owais Khan2, D. Gallo1 S. Scarsoglio1, D.A. Steinman2, L. Ridolfi1, and U. Morbiducci1
1 PoliToBIOMed Lab, Politecnico di Torino, Italy; email:[email protected] 2 Department of Mechanical and Industrial Engineering, University of Toronto, Canada; email: [email protected]
I
Proceedings VII Meeting Italian Chapter of the European Society of Biomechanics (ESB-ITA 2017) 28-29 September 2017, Rome - Italy
17
ISBN: 978-88-6296-000-7

correlation coefficients between all nodes in Branch1 (Rb1-b1); (2) the correlation coefficients between all nodes in the Sac (RS-S); (3) the correlation coefficients between nodes in Branch1 and nodes in the Sac (Rb1-S).
Here the median of the distribution of the correlation coefficients Rb1-b1 between nodes in Branch1 (Fig. 1) was selected as threshold value Rt and applied to build up the adjacency matrices of Rb1-b1, RS-S and Rb1-S distributions, respectively. The obtained adjacency matrices were used to calculate the normalized degree centrality metric as in eq. (2), indicating with ki
b1-S the number of nodes inside the Sac connected to the node i in Branch1, and with ki
b1-b1 (kiS-S) the
number of first neighbors, inside Branch1 (Sac). The CN-based characterization of the intracranial aneurysm hemodynamics was enriched by the calculation of the entropy H of the normalized degree centrality ki, defined as:
1
lnN
i ii
H p k p k
¦ (3)
where p(ki) is the probability of ki. The value of H provides a lower bound for the expected degree of centrality among velocity magnitude time histories required to represent relationships involving dependence, as sampled from p(k).
III. RESULTS
The distributions of Rb1-b1, RS-S and Rb1-S are presented in Fig. 1. It can be noticed that the distributions are all left-skewed, and correlation are mostly positive. The median value of the two-points correlations of velocity magnitude time histories in the Sac region is lower than Branch1. The median value of Rb1-b1was selected here as threshold value (Rt = 0.928) to calculate normalized degree centrality values.
Figure 1 - Probability density functions of Rb1-b1, RS-S and Rb1-S. Median values of the distributions are also presented.
A visual inspection of the map of kib1-S values in the parent
vessel (Fig. 2, upper panel) highlights that the velocity magnitude time histories with the highest number of links (in terms of correlation) with time histories in the aneurysmal sac are located at the outer walls of bending segments of the parent vessel, where flow instability onset has been observed [4]. The visualization of the map of degree centrality also highlights the presence of a wide region of the sac where velocity magnitude time histories are highly linked with the velocity magnitude of nodes in the sac itself (ki
S-S map in Fig. 2, lower panel). Entropy of normalized degree centrality in Branch1 (H = 8.48) is higher than the Sac (H = 6.12). This
can be interpreted as follows: a lower bound for the degree of centrality is required to represent patterns of linked (i.e., highly correlated) velocity magnitude time histories within the Sac than in Branch1. This is to say that the more the velocity magnitude time histories in the nodes of the flow field are linked (as in the Sac, with respect to Branch1), the more you can compress its representation, with implications for flow structures clustering and visualization purposes.
IV. CONCLUSION
Here we present for the first time the application of CN theory to cardiovascular hemodynamics. In detail, networks were built from spatio-temporal data following a two-point correlation approach. High degree centrality regions evidenced spatial patterns coherently moving, e.g., from the parent vessel to the aneurysmal sac and in the sac and within the sac itself. Based on present findings, the application of CNs to intricate cardiovascular flows looks promising and deserves additional future investigation.
Figure 2 - upper panel: visualization (two different views) of kb1-S in the parent vessel; lower panel: visualization (two different views) of kS-S in the aneurysmal sac.
REFERENCES [1] M.O. Khan, et al., On the quantification and visualization of transient
periodic instabilities in pulsatile flows. J Biomech. 2017;52:179-182. [2] B. Chung, J.R. Cebral, CFD for evaluation and treatment planning of
aneurysms: review of proposed clinical uses and their challenges. Ann Biomed Eng. 2015;43(1):122-38.
[3] M.O. Khan, et al., Narrowing the expertise gap for predicting intracranial aneurysm hemodynamics: Impact of solver numerics versus mesh and time-step resolution. AJNR Am J Neuroradiol. 2015;36(7):1310-6.J.
[4] K. Valen-Sendstad, et al., High-resolution computational fluid dynamics detects flow instabilities in the carotid siphon: implications for aneurysm initiation and rupture? J Biomech. 2014;47(12):3210-6.
[5] K. Valen-Sendstad, D.A. Steinman, Mind the gap: Impact of computational fluid dynamics solution strategy on prediction of intracranial aneurysm hemodynamics and rupture status indicators. AJNR Am J Neuroradiol. 2014;35(3):536-43.
[6] A.M. Robertson, P.N. Watton. Computational fluid dynamics in aneurysm research: critical reflections, future directions. AJNR Am J Neuroradiol. 2012;33(6):992-5.
[7] D.F. Kallmes. CFD--computational fluid dynamics or confounding factor dissemination. AJNR Am J Neuroradiol. 2012;33(3):395-6.
[8] S. Boccaletti, et al. (2006) Complex networks: Structure and dynamics. Phys Rep 424: 175–308.
[9] S. Scarsoglio, et al., Complex networks unveiling spatial patterns in turbulence, Int J Bifurcation and Chaos 2016; 26, 1650223-1–12.
Proceedings VII Meeting Italian Chapter of the European Society of Biomechanics (ESB-ITA 2017) 28-29 September 2017, Rome - Italy
18
ISBN: 978-88-6296-000-7

Comparison of blood-damage-related turbulence descriptors in the flow field of heart valves
G. D’Avenio and M. GrigioniCenter of Innovative Technologies in Public Health, Istituto Superiore di Sanità, Rome, Italy; email: [email protected];
Abstract—The issue of evaluating turbulence-related blood damage is still the subject of debate. Two relevant quantities are identified in the literature with the maximum turbulence shear stress (TSSmax) and the turbulent viscous stress. A comparison of these quantities in a complex flow field was undertaken, by measuring the flow field downstream of a bileaflet valve (nominal size: 27 mm) by means of stereo particle image velocimetry (PIV) on different pulse duplicators, in aortic position and in physiological conditions (70 bpm and 35% systole/cycle ratio). The TSSmax was found to be associated with zones of turbulence production, in correspondence with large velocity gradients at the edge of the jets exiting the valve. The main contributions to turbulence viscous stress were also observed in the same zones associated to highest TSSmax, shortly downstream of the leaflets.
The results point out that the differences in the considered turbulence-related quantities are rather subtle, at least qualitatively, so that they are both capable to give relevant information on the fluid dynamics of prosthetic implants and the associated blood trauma.
Keywords—Prosthetic heart valves, turbulence, particle image velocimetry.
I. INTRODUCTION he issue of evaluating turbulence-related blood damage is still the subject of debate. Two relevant quantities are
identified in the literature with the maximum turbulence shear stress (TSSmax) [1-3] and the turbulent viscous stress [4]. A comparison of these quantities in a complex flow field such as the one downstream of a prosthetic heart valve is needed to improve the current knowledge on the issue.
II. METHODS
The flow field downstream of a bileaflet valve (nominal size: 27 mm) was measured by means of stereo particle image velocimetry (PIV) on the Sheffield University pulse duplicator (Fig. 1), in aortic position and in physiological conditions (70 bpm and 35% systole/cycle ratio). The valve is depicted in Fig. 2. The measurements were made at peak systole, a high regime (cardiac output= 5 l/min) was imposed. The Reynolds number, computed with the maximum instantaneous flow rate Q and the nominal size of the valve D, was equal to 7360. This indicates that the measurements were made in turbulence conditions.
Two cameras, capable of recording 1280x1024 pixel images in frame-straddling mode, were set in the Scheimpflug configuration, enabling a uniform focus across the image plane. The choice of the angle between cameras (set at least at 60 degrees) yielded good quality of
measurements of the cross-plane velocity component. A Q-switched laser double-head laser (up to 150 mJ/pulse) was used for image recordings. The results hereby presented refer to the peak systolic phase.
The TSSmax is defined as follows:
231 σσ −
TSSmax=
using the Reynolds stress tensor, calculated from the instantaneous velocity fluctuations (ui, with i=1,2,3):
⎥⎥⎥
⎦
⎤
⎢⎢⎢
⎣
⎡==
3
2
1
000000
σσ
σρ kiuuT
Fig. 1 - The Sheffield University-developed Pulse Duplicator (PD), seen from the top. The blood-analogue solution flows in the system in the counterclockwise direction. The aortic and mitralic sections are indicated in the figure as A and M, respectively; SA: systemic aortic compliance; FCV: flow control valve; R: atrial reservoir.
The turbulent viscous stress is given by:
using the rate of strain tensor Sij,
Fig. 2 - The tested valve (a 27-mm Total Annulus Diameter bileaflet), inserted upstream of the glassblown aorta
T
( ) 2/1ijijv SSµτ =
⎟⎟⎠
⎞⎜⎜⎝
⎛
∂
∂+
∂∂
=i
j
j
iij x
UxUS
21
Proceedings VII Meeting Italian Chapter of the European Society of Biomechanics (ESB-ITA 2017) 28-29 September 2017, Rome - Italy
19
ISBN: 978-88-6296-000-7

III. RESULTS
TSSmax (Fig. 4) was found to be associated with zones of turbulence production, in correspondence with large velocity gradients at the edge of the two lateral jets exiting the valve, bounded by the occluders and the housing ring of the valve itself. A similar finding applies also for the turbulent viscous stress (Fig. 5), even though the absolute value of the maximum stress is lower than in the case of TSSmax (as reported also in [4],[5]).
Fig. 5 – Turbulent viscous stress downstream of the valve (positioned at the bottom of he figure). One sinus of Valsalva is clearly visible at the left-hand side.
IV. CONCLUSION
As far as the flow field immediately downstream of the valve is considered, TSSmax and turbulent viscous stress were found to carry similar information about blood damage potential of a given implant design. This is in contradiction to the viewpoint, suggested by some researchers, that TSSmax is not relevant as a blood damage predictor, as opposed to the turbulent viscous stress [5]: instead, the two quantities were found to be clearly related, so that, at least for a qualitative examination of the “hot spots” for blood damage, the choice of either quantity is admittable (bearing in mind that the respective thresholds for damage are not the same). The choice of either quantity is clearly related to the features of the available velocimetry equipment. In particular, it must be stressed that TSSmax can be measured with single-point techniques such as LDA [6] or Hot-Film Anemometry, since it does not require the calculation of velocity gradients, as opposed to the turbulent viscous stress.
measurement plane
Fig. 3 – Sketch of the glassblown aorta, as seen from the inlet plane. The measurement plane contained the valve axis.
REFERENCES [1] Ellis JT, Healy TM, Fontaine AA, Saxena R, Yoganathan AP (1996)
Velocity measurements and flow patterns within the hinge region of a Medtronic Parallel bileaflet mechanical valve with clear housing. J Heart Valve Dis. 5(6):591-9.
[2] Sallam, A.M. and Hwang, N.H.C. (1984) Human red blood cell hemolysis in a turbulent shear flow: contribution of Reynolds shear stresses. Biorheology 21, 783-797. Fig. 4 – TSSmax downstream of the valve (positioned at the bottom of he
figure). One sinus of Valsalva is clearly visible at the left-hand side. [3] Grigioni, M; Daniele, C; D'Avenio, G; Barbaro, V (1999). A discussion on the threshold limit for hemolysis related to Reynolds shear stress J Biomech, 32(10):1107 – 1112
At larger distances from the valve plane, not negligible values of TSSmax were found in proximity to the sinus of Valsalva, where the interaction of the main flow with the boundary may cause nonstationary flow conditions, with a consequent contribution in terms of correlation between velocity fluctuations (Reynolds stresses).
[4] Jones SA (1995). A relationship between Reynolds stresses and viscous dissipation: implications to red cell damage. Annals of Biomedical Engineering 23 (1), 21–28
[5] Ge L, Dasi LP, Sotiropoulos F, Yoganathan AP. Characterization of hemodynamic force induced by mechanical heart valves: Reynolds vs. viscous stresses. Ann Biomed Eng, 36(2), 276-297 (2008).
[6] Grigioni M, Daniele C, D'Avenio G, Barbaro V. The influence of the leaflets' curvature on the flow field in two bileaflet prosthetic heart valves. J Biomech. 2001;34(5):613-21. Again, similar findings were obtained with τν (Fig. 5), even
though a more spreaded out zone of high values was observed close to the flow boundary.
Proceedings VII Meeting Italian Chapter of the European Society of Biomechanics (ESB-ITA 2017) 28-29 September 2017, Rome - Italy
20
ISBN: 978-88-6296-000-7

Abstract—Arteriovenous fistula (AVF) is the preferred vascular access for hemodialysis, but maintaining its patency is still challanging. Considerable research supports the role of local hemodynamic forces as triggering factors for the stenosis formation responsible for AVF failure. Longitudinal studies with repeated evaluations of local hemodynamic conditions are needed, therefore novel contrast-free MRI protocols should be designed to acquire reliable AVF patient-specific models suitable for computational fluid dynamics. In the present investigation we explored the feasibility of a novel contrast-free MRA protocol to acquire high-resolution images suitable for generation of patient-specific AVF models. Keywords—arteriovenous fistula, contrast-free MRI,
computational fluid dynamics, hemodialysis.
I. INTRODUCTION ATIVE arteriovenous fistula (AVF) is the preferred vascular access for hemodialysis patients, but it still has
high rate of failure due to vascular stenosis mainly caused by neointimal hyperplasia [1-2]. A growing body of evidence supports a key role of hemodynamics in stenosis formation [3-4], therefore longitudinal studies with repeated evaluations of local hemodynamic conditions and vascular changes over time are needed to investigate the relationship between disturbed flow and changes in vessel wall structure resulting in the formation of vascular stenosis. These studies require reliable and non-invasive investigations to obtain patient-specific 3D AVF models to perform computational fluid dynamics (CFD) simulations. To avoid the use of gadolinium, due to the risk of inducing nephrotoxic fibrosis in end stage renal disease patients, novel protocols for contrast-free MR angiography should be designed. The purpose of our study was to explore the feasibility of a novel protocol for contrast-free MR angiography to investigate the hemodynamics inside AVF, coupling this imaging technique with high resolution CFD.
II. MATHERIALS AND METHODS
A. MRA acquisitions We acquired contrast-free MRA in a 78-year male with
radio-cephalic side-to-end AVF. We performed 3D fast spin echo T1-weighted imaging with variable flip angles using CUBE T1 on 1.5T scanner (GE, Optima 450w GEM), with the following parameters: axial plane; 19ms echo time; 24ms echo-train length; 2mm slice thickness; 0.55x0.55x2.0mm voxel size. MRA acquisition was performed one week after AVF surgical creation.
B. 3D model reconstruction and mesh generation Figure 1 shows the MRA-to-CFD pipeline of this study.
AVF lumen with its limbs, the proximal artery (PA), distal artery (DA), juxta-anastomotic vein (JAV) and distal outflow vein (V), were digitally segmented using imageJ and patient-specific 3D surface was generated using the Vascular Modelling Toolkit (VMTK) [5]. A polygonal surface was generated by using a gradient-based level set followed by a marching cubes approach. Starting from the surface model, the internal volume was discretized using foamyHexMesh mesher, which is part of OpenFOAM 4 suite [6]. We obtained a mesh of 1,055,000 cells, with dominant-hexahedral core cells characterized by low orthogonality and well alignment to the vessel surface. Two thin boundary layers of cells were generated near the wall in order to capture the sharp gradients of velocity in this region.
Figure 1.Workflow of the study from MRA acquisition to CFD analysis
Novel strategies for patient-specific modelling of arteriovenous fistula for hemodialysis
M. Bozzetto1, P. Brambilla2, B. Ene-Iordache1 and A. Remuzzi3,1
1Department of Bioengineering, IRCCS-Istituto di Ricerche Farmacologiche “Mario Negri, Italy; email: [email protected] 2Department of Diagnostic Radiology, Papa Giovanni XXIII Hospital, Bergamo, Italy. email:[email protected]
3Department of Management, Information and Production Engineering; University of Bergamo, Italy; email: [email protected]
N
Proceedings VII Meeting Italian Chapter of the European Society of Biomechanics (ESB-ITA 2017) 28-29 September 2017, Rome - Italy
21
ISBN: 978-88-6296-000-7

C. CFD simulations of blood flow Transient Navier-Stokes equations were solved by using
OpenFoam, an open-source CFD-toolbox based on the finite volume method [6]. Volumetric flow waveforms obtained from US examinations were prescribed as boundary conditions at the inlet of the PA and at the outlet of the DA (Figure 1), while traction-free condition was set at the vein outflow. Vessel walls were assumed to be rigid and blood density equal to 1.05 g/cm3. Blood was modelled as patient-specific, non-Newtonian fluid using the Bird-Carreau rheological model. We used pimpleFoam, a transient OpenFOAM solver for incompressible flows, set with second order backward time integration scheme and set to operate in PISO mode only, resulting in very small time steps. This solver adjusts the time step based on a maximum Courant-Friedrichs-Lewy number, which we set to 1. Three complete cardiac cycles were solved to avoid start-up transients and only the third cycle was saved for post-processing in 1,000 equal time steps.
D. Characterization of the flow We characterized the AVF blood flow phenotype using
velocity streamlines and localized normalized helicity (LNH), a descriptor of changes in the direction of the rotation of flow. Post-processing of results was executed using the open-source data analysis and visualization application Paraview.
III. RESULTS
Contrast-free CUBE T1 yielded high-resolution images within a reasonable scan time of 5 to 10 minutes. Images were suitable for the segmentation of AVF lumen and reconstruction of patient-specific 3D model, that was used for high-resolution CFD analysis. Figure 2 shows velocity streamlines, representative of the peak-systolic time-point. Straight and parallel streamlines are present in the PA in AVF model, while secondary flows and complex vortices develop after the anastomosis in the JAV, and continue along the main stream of the venous segment.
Figure 2. Velocity streamlines representative for the peak systolic time-point
Figure 3 shows that coherent highly helical flow structures, identified by LNH isosurfaces [7], originate in the anastomosis towards the vein with both clockwise and
counter-clockwise rotation, as classified by the blue and red colour, respectively.
Figure 2. LNH isosurfaces representative for the peak-systolic-point
Results of the present investigation are in line with our previous observations conducted in four AVFs acquired using contrast-enhanced MRI [8].
IV. CONCLUSION
This novel contrast-free MRA protocol represents a feasible approach to obtain 3D AVF model that can be used for longitudinal investigations on the role of hemodynamics in AVF failure. The detailed study of blood flow field in anastomosed vessels at the patient-specific level may help to elucidate the role of hemodynamic in vascular remodelling and stenosis formation, with the final aim of improving AVF clinical outcome, both in terms of complications immediately after surgery and in terms of long-term patency. This achievement, besides entailing a significant reduction in medical costs, may significantly improve the quality of life of patients.
REFERENCES [1] Al-Jaishi AA, Oliver MJ, Thomas SM, Lok CE, Zhang JC, Garg AX, et
al. Patency rates of the arteriovenous fistula for hemodialysis: a systematic review and meta-analysis. Am J Kidney Dis Off J Natl Kidney Found 2014;63:464–78.
[2] Lee T, Chauhan V, Krishnamoorthy M, Wang Y, Arend L, Mistry MJ, et al. Severe venous neointimal hyperplasia prior to dialysis access surgery. Nephrol Dial Transplant Off Publ Eur Dial Transpl Assoc - Eur Ren Assoc 2011;26:2264–70.
[3] Bennett S, Hammes MS, Blicharski T, Watson S, Funaki B. Characterization of the cephalic arch and location of stenosis. J Vasc Access 2015;16:13–8.
[4] Ene-Iordache B, Remuzzi A. Disturbed flow in radial-cephalic arteriovenous fistulae for haemodialysis: low and oscillating shear stress locates the sites of stenosis. Nephrol Dial Transplant Off Publ Eur Dial Transpl Assoc - Eur Ren Assoc 2012;27:358–68.
[5] Antiga L, Piccinelli M, Botti L, Ene-Iordache B, Remuzzi A, Steinman DA. An image-based modeling framework for patient-specific computational hemodynamics. Med Biol Eng Comput 2008;46:1097–112.
[6] OpenFoam T. The OpenFOAM Foundationhttp://www.openfoam.org 2014
[7] Morbiducci U., R. Ponzini, M. Grigioni and A. Redaelli. Helical flow as fluid dynamic signature for atherogenesis risk in aortocoronary bypass. A numeric study. J Biomech 40: 519-534, 2007.
[8] Bozzetto, M., Ene-Iordache, B. & Remuzzi, A. (2015). Transitional Flow in the Venous Side of patient-Specific Arteriovenous Fistulae for Hemodialysis. Annals of Biomedical Engineering, 44 (8), p2388–2401.
Proceedings VII Meeting Italian Chapter of the European Society of Biomechanics (ESB-ITA 2017) 28-29 September 2017, Rome - Italy
22
ISBN: 978-88-6296-000-7

Abstract—In the context of congenital diseases of the aorta, affecting either the valve apparatus or the thoracic portions, new biomarkers derived from fluid dynamics has been investigated as possible means to gain further insight in patients’ diagnosis and risk stratification. To this aim, in the present work we exploited the potential of in vivo data based on magnetic resonance imaging to guide and verify the reliability of numerical simulations in a case of aortic coarctation.
Keywords—4D Flow, magnetic resonance, CFD analysis, aortic coartaction.
I. INTRODUCTION ONGENITAL abnormalities of the aorta may affect thevalve apparatus (e.g. bicuspid aortic valve), or the
ascending and arch portions (e.g. coarctation). In the clinical scenario, morphological analyses are commonly used to grade the progression of the pathology [1]. In the last decade, derangements of the fluid dynamics within the region of interest have been investigate as possible diagnostic and prognostic markers of the pathology. In this context, novel in vivo flow-encoding magnetic resonance (MR) imaging techniques and in silico computational fluid dynamics (CFD) have been exploited to gain insights in the redistribution of flows and pressures [2,3]. Nonetheless, MR-derived measurements suffer from low spatial-temporal resolution and uncertainties in data processing, while the realism of CFD-based models is yet of great challenge.
In the present work, we proposed a combination of in vivo and in silico methods to highlight the potential of MR-derived data in guiding the realism of CFD models, focusing on a specific case of a 26 years old female with aortic coarctation.
II. MATERIALS AND METHODS
A. MR sequences MR acquisitions were performed on a 1.5 T scanner
(Magnetom Aera, Siemens Healthcare, Erlangen, Germany). Two MR sequences were acquired: gadolinium-enhanced MR angiography (MRA), and 3D time-resolved phase-contrast cardiac magnetic resonance, with prototype pulse sequences for three-directional velocity-encoding (4D Flow). The MRA volume was acquired prescribing a voxel size resolution of 1.09×1.09x1.10 mm3 (echo time = 0.95 ms, repetition time = 2.67 ms, flip angle = 25°). The 4D Flow volume of acquisition was oriented along a sagittal plane encompassing the ascending aorta, the aortic arch and the
thoracic aorta. An almost isotropic voxel resolution of 1.77×1.77x2.00 mm3 was prescribed [4]. The remaining parameters were: echo time = 2.44 ms, repetition time = 38.72 ms, flip angle = 8°, temporal resolution = 45.27 ms. Data were acquired with prospective ECG-gating during free-breathing, using a respiratory navigator. The velocity-encoding range (VENC) was properly set to 200 cm/s after scouting on cross-sections positioned in the ascending aorta and downstream of the coarctation. Exploiting ad hoc in-house MATLAB software MATLAB (The MathWorks Inc., Natick, MA, United States), 4D Flow data were analyzed yielding the time-dependent 3D velocity field within a user-defined region of interest (ROI) [5].
B. CFD model The patient-specific inner-wall of the aorta was extracted
from the MRA volume through a level sets algorithm available in VMTKLab (Orobix Srl, Bergamo, Italy) for semi-automated segmentation. The aortic inner-wall surface was clipped proximally, at the sino-tubular junction, to define the inlet surface (Sin) and distally to create the outlet surfaces for the three sovra-aortic branches Sout,i (i=1,2,3) the descending aorta Sout,4. A volumetric mesh was then computed in ANSYS Icem CFD (ANSYS, Inc., Canonsburg, USA), resulting in approximately 800,000 tetrahedrons with an average mesh size of 1.1 mm and boundary layers to improve near-wall gradients computations. The CFD boundary conditions were defined according to the 3D velocity field extracted from the 4D Flow volume. Specifically, the inlet and outlet surfaces of the CFD model were registered in the 4D Flow volume applying a rigid transformation computed according to the relative orientation of MRA and 4D Flow scans. The discrete velocity field was sampled within the ROI on the cross-sections identified by Sin, Sout,1-2-3, following the methods proposed in [6]. The extracted points were used to define: i) the full 3D velocity profile at Sin, ii) the net flow rate at Sout,1-
2-3. At Sout,4 a zero-pressure boundary condition was applied. Blood was modeled as a Newtonian fluid (ρ=1060 kg·m-3 and µ=0.0035cP). A no-slip condition was assumed at the aortic wall and. Three cardiac cycles were simulated to minimize the influences of initial-conditions.
III. RESULTS AND DISCUSSION
Simulated systolic fluid dynamics well compared with ground-truth 4D Flow data, reporting a qualitatively similar
On the potential of 4D Flow in guiding CFD analyses: a case study of aortic coartaction
F. Piatti1*, D. Belkacemi2*, A. Caimi1, F. Sturla1, A. Greiser3, F. Pluchinotta4, M. Carminati4, and A. Redaelli1
1 Department of Electronics, Information and Bioengineering, Politecnico di Milano, Italy; email: [email protected] 2 Department of Mechanical Engineering, University of Chlef, Algeria;
3 Siemens Healthcare GmbH, Germany; 4 Multimodality Cardiac Imaging Section, IRCCS Policlinico San Donato, Italy;
C
Proceedings VII Meeting Italian Chapter of the European Society of Biomechanics (ESB-ITA 2017) 28-29 September 2017, Rome - Italy
23
ISBN: 978-88-6296-000-7

pattern of blood velocity field. Computed streamlines highlighted the persistence of a high-velocity jet passing across the coartaction region from mid to late systole (Fig. 1). Consistently with 4D Flow data, recirculation zones were observed proximal to the coartaction jet as well as in the concavity of the ascending aorta.
Fig. 1. Streamlines computed at the time-frames corresponding to peak (a), mid- (b) and late (c) systole.
At peak systole, we quantitatively compared CFD results and 4D Flow data on three different aortic sections: i) in the proximal ascending aorta close to pulmonary trunk, ii) downstream of the aortic arch and iii) in the distal descending aorta (Table 1).
Fig. 2. a) velocity magnitude contours on selected cross-sections and b) wall shear stress distributions, computed at peak systole.
On all the selected cross-sections, the CFD analysis captured the patterns of the velocity field reported by the 4D Flow processing (Fig. 2). However, CFD underestimated
peak velocity values (|v|max) by 2% and 24% in the ascending and descending aorta, respectively (Table 1). The length of the blood jet passing across the coartaction was comparable and equal to about 53 mm. When focusing on the wall shear stress (WSS) field, the CFD model well-captured the high-WSS region downstream of the coartaction, as visible in the 4D Flow dataset, even if the computed WSS peak values were an order of magnitude higher than the ones estimated with 4D Flow data. Of note, this result is in accordance with previous evidences [5, 7], proving that the use of highly space- and time-resolved CFD analysis can provide more accurate estimations of aortic WSS.
IV. CONCLUSIONS
As suggested by our preliminary results, the realism and reliability of CFD simulations can be assessed by comparison with ground-truth in vivo 4D Flow data. Specifically, the potential of 4D Flow was exploited both considering the time-dependent characteristics of the velocity field, thus confirming the transient features captured by CFD, as well as location dependent velocity patterns and peak values. Also, comparisons between more refined variables, e.g. WSS, owing to their improved estimation from 4D Flow data [5], may contribute in evaluating the outcomes of CFD models, which would allow, if further optimized, to obtain more accurate computations of the considered variables.
REFERENCES [1] H. I. Michelena et al., “Identifying Knowledge Gaps and Rising to the
Challenge From the International Bicuspid Aortic Valve Consortium (BAVCon)”, Circulation. 2014, 129: pp. 2691-2704.
[2] Z. Stankovic et al., “4D flow imaging with MRI”, Cardiovasc Diagn Ther, 2014, 4(2): pp. 173–192.
[3] J. F. LaDisa et al., “Aortic Coarctation: Recent Developments In Experimental And Computational Methods To Assess Treatments For This Simple Condition”, Prog Pediatr Cardiol, 2010, 30(1): pp. 45–49.
[4] P. Dyverfeldt et al., “4D flow cardiovascular magnetic resonance consensus statement”, J Cardiovasc Magn Reson, 2015, 17:72.
[5] F.Piatti et al., “Towards the improved quantification of in vivo abnormal wall shear stresses in BAV-affected patients from 4D-flow imaging: Benchmarking and application to real data”, J Biomech, 2017, 50, pp. 93-101.
[6] F. Piatti et al., “4D Flow Analysis of BAV-related Fluid-dynamic Alterations: Evidences of Wall Shear Stress Alterations in Absence of Clinically-Relevant Aortic Anatomical Remodeling”, Front Physiol, accepted for publication.
[7] S. K. Atkins et al., “Bicuspid aortic valve hemodynamics induces abnormal medial remodeling in the convexity of porcine ascending aortas”, Biomech Model Mechanobiol, 2014, 13: pp. 1209-1225
TABLE I
4D Flow CFD
|v|max, Tps (m/s)
Plane 1 1.34 1.32 (-1.5%)
Plane 2 2.23 1.70 (-23.8%)
Plane 3 2.01 1.81 (-9.9%)
LJet (mm) 52.9 53.3 (+0.7%)
|WSS|max, Tps (Pa) 2.3 22.9
LWSS (mm) 58.6 60.1 (+2.6%)
Results of 4D Flow post-processing and of CFD simulation
Proceedings VII Meeting Italian Chapter of the European Society of Biomechanics (ESB-ITA 2017) 28-29 September 2017, Rome - Italy
24
ISBN: 978-88-6296-000-7
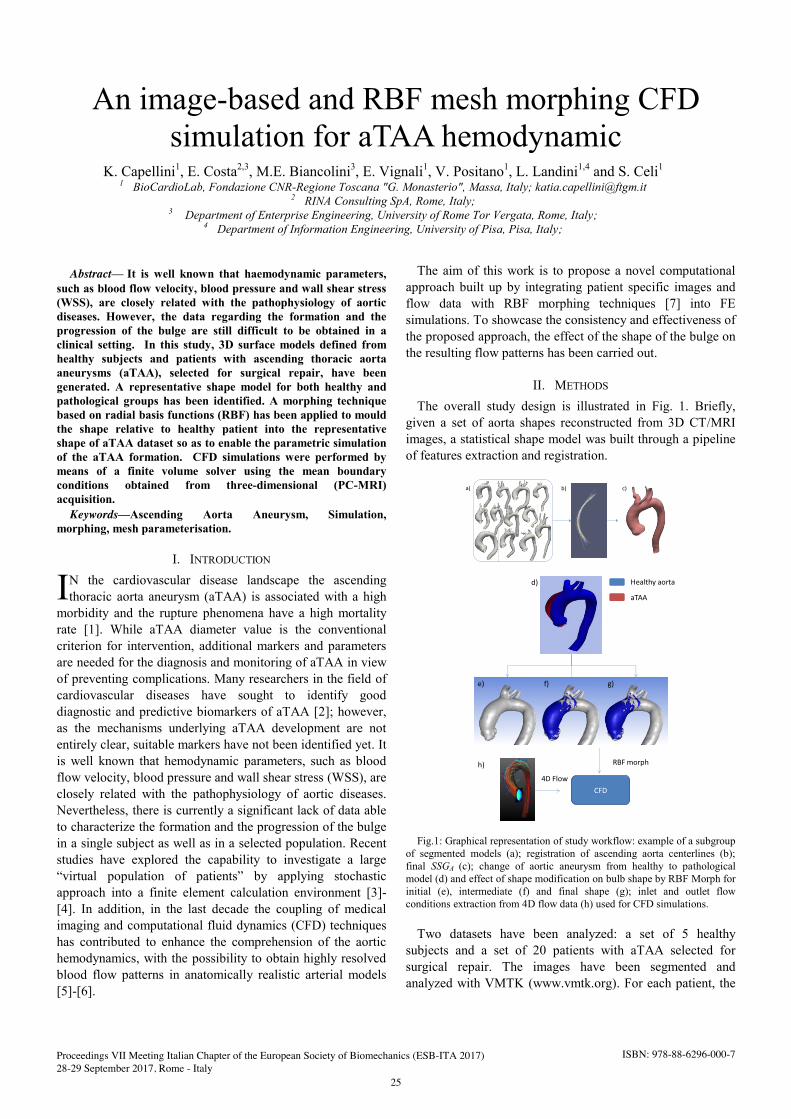
Abstract— It is well known that haemodynamic parameters, such as blood flow velocity, blood pressure and wall shear stress (WSS), are closely related with the pathophysiology of aortic diseases. However, the data regarding the formation and the progression of the bulge are still difficult to be obtained in a clinical setting. In this study, 3D surface models defined from healthy subjects and patients with ascending thoracic aorta aneurysms (aTAA), selected for surgical repair, have been generated. A representative shape model for both healthy and pathological groups has been identified. A morphing technique based on radial basis functions (RBF) has been applied to mould the shape relative to healthy patient into the representative shape of aTAA dataset so as to enable the parametric simulation of the aTAA formation. CFD simulations were performed by means of a finite volume solver using the mean boundary conditions obtained from three-dimensional (PC-MRI) acquisition. Keywords—Ascending Aorta Aneurysm, Simulation,
morphing, mesh parameterisation.
I. INTRODUCTION N the cardiovascular disease landscape the ascendingthoracic aorta aneurysm (aTAA) is associated with a high
morbidity and the rupture phenomena have a high mortality rate [1]. While aTAA diameter value is the conventional criterion for intervention, additional markers and parameters are needed for the diagnosis and monitoring of aTAA in view of preventing complications. Many researchers in the field of cardiovascular diseases have sought to identify good diagnostic and predictive biomarkers of aTAA [2]; however, as the mechanisms underlying aTAA development are not entirely clear, suitable markers have not been identified yet. It is well known that hemodynamic parameters, such as blood flow velocity, blood pressure and wall shear stress (WSS), are closely related with the pathophysiology of aortic diseases. Nevertheless, there is currently a significant lack of data able to characterize the formation and the progression of the bulge in a single subject as well as in a selected population. Recent studies have explored the capability to investigate a large “virtual population of patients” by applying stochastic approach into a finite element calculation environment [3]-[4]. In addition, in the last decade the coupling of medical imaging and computational fluid dynamics (CFD) techniques has contributed to enhance the comprehension of the aortic hemodynamics, with the possibility to obtain highly resolved blood flow patterns in anatomically realistic arterial models [5]-[6].
The aim of this work is to propose a novel computational approach built up by integrating patient specific images and flow data with RBF morphing techniques [7] into FE simulations. To showcase the consistency and effectiveness of the proposed approach, the effect of the shape of the bulge on the resulting flow patterns has been carried out.
II. METHODS
The overall study design is illustrated in Fig. 1. Briefly, given a set of aorta shapes reconstructed from 3D CT/MRI images, a statistical shape model was built through a pipeline of features extraction and registration.
d)
e) f) g)
Healthy aorta
aTAA
a) b) c)
CFD
RBF morph
4D Flow
h)
Fig.1: Graphical representation of study workflow: example of a subgroup of segmented models (a); registration of ascending aorta centerlines (b); final SSGA (c); change of aortic aneurysm from healthy to pathological model (d) and effect of shape modification on bulb shape by RBF Morph for initial (e), intermediate (f) and final shape (g); inlet and outlet flow conditions extraction from 4D flow data (h) used for CFD simulations.
Two datasets have been analyzed: a set of 5 healthy subjects and a set of 20 patients with aTAA selected for surgical repair. The images have been segmented and analyzed with VMTK (www.vmtk.org). For each patient, the
An image-based and RBF mesh morphing CFD simulation for aTAA hemodynamic
K. Capellini1, E. Costa2,3, M.E. Biancolini3, E. Vignali1, V. Positano1, L. Landini1,4 and S. Celi1 1 BioCardioLab, Fondazione CNR-Regione Toscana "G. Monasterio", Massa, Italy; [email protected]
2 RINA Consulting SpA, Rome, Italy; 3 Department of Enterprise Engineering, University of Rome Tor Vergata, Rome, Italy;
4 Department of Information Engineering, University of Pisa, Pisa, Italy;
I
Proceedings VII Meeting Italian Chapter of the European Society of Biomechanics (ESB-ITA 2017) 28-29 September 2017, Rome - Italy
25
ISBN: 978-88-6296-000-7

3D surface model has been then reconstructed (a). Features such as the centerlines, the section areas, the diameters, the curvature and the tortuosity values have been extracted and collected. Due to the interest in the ascending aneurysms, the registration process has been focused on this portion of the aorta (b). For each group, an averaged statistical shape geometry (SSGH and SSGA for healthy and aneurismatic geometry, respectively) has been defined (c).
The SSGH has been used as starting geometry while the SSGA has been used as target model (d). The RBF mesh morphing has been applied to modify SSGH in order to obtain SSGA by imposing changes to the vascular anatomy (e-g). In this study, we used a 4D PC-MRI in vivo dataset of the thoracic aorta of both healthy and pathological subjects. The representative inlet and outlet flow conditions were assumed for the CFD simulations, by using RBF mesh morphing technique. ANSYS Fluent has been used as Navier-Stokes CFD solver, the Fluent add on version of the RBF Morph software has been used for mesh morphing.
III. RESULTS
Figure 2 depicts the results of the morphological investigation performed on the two groups. While the maximum diameter and the tortuosity are suitable to distinguish between healthy and pathological subjects, the value of the mean curvature is not significantly different between the two groups.
Fig. 2 Morphological results of both SSGH to SSGA with indication of the standard deviations.
The registration process has pointed out a close correlation among the ascending tract of the aorta geometries within each group, as indicated by the SD value. Figure 3 depicts preliminary results of CFD simulations obtained by Fluent with RBF mesh morphing technique (a-b) and from 4D PC-MRI data (c-d) for SSGA and SSGH. These results have shown that the turbulence of flow could be a further discretionary factor for aTAA identification. The flow velocity streamlines have revealed a greater turbulence for SSGA than SSGH. These simulations outcomes are in accordance with clinical results extracted from 4D PC-MRI dataset and with data in literature.
IV. CONCLUSION
In this work two specific issues have been considered. Firstly, the capability to define a representative morphology starting from a real patient population for both healthy and pathological subjects.
a) b)
c) d)
Fig. 3 Flow velocity streamlines for SSGH (a) and SSGA (b) extracted from CFD simulation; Flow velocity streamlines for SSGH (c) and SSGA (d) extracted from real 4D PC-MRI data.
This statistical shape analysis demonstrates its potential for discovering previously unknown 3D shape biomarkers in a complex anatomical shape population. Finally a novel RBF mesh morphing technique has been applied to study the aortic aneurysms evolution. Considering that the RBF mesh morphing is a meshless approach, this allows an easy management of hybrid meshes (nodal positions are updated regardless the kind of cell connected) and of partitioned meshes which are typically adopted in HPC simulations (preservation of interfaces is guaranteed as the field applied is a point function).
ACKNOWLEDGEMENT This work was supported by the VALVETECH (by
Regione Toscana) and VIVIR (PE-2013-02357974) projects.
REFERENCES [1] Hiratzka LF, Bakris GL, Beckman JA, Bersin RM, Carr VF, Casey
DE, Jr, et al., Guidelines for the diagnosis and management of patients with thoracic aortic disease. J Am Coll Cardiol 2010;55:e27–e129.
[2] Van Bogerijen GH, Tolenaar JL, Grassi V, Lomazzai C, Segreti S, Rampoldi V, et al. Biomarkers in TAA-the Holy Grail. Prog Cardiovasc Dis. 2013;56:109-115.
[3] Celi S, Berti S. Three-dimensional sensitivity assessment of thoracic aortic aneurysm wall stress: a probabilistic finite-element study. Eur J Cardiothorac Surg. 2014; 45:467-475
[4] Liang L, Liu M, Martin C, Elefteriades J, Sun W (2017). A machine learning approach to investigate the relationship between shape features and numerically predicted risk of ascending aortic aneurysm. Biomech Model Mechanobiol. 2017; DOI 10.1007/s10237-017-0903
[5] Biancolini, M. E., 2012. Mesh morphing and smoothing by means of radial basis functions (RBF): a practical example using Fluent and RBF Morph. In: Handbook of Research on Computational Science and Engineering: Theory and Practice.
[6] Boccadifuoco A., Mariotti A., Celi S., Martini N and Salvetti M. V., Uncertainty quantification in numerical simulations of the flow in thoracic aortic aneurysms, ECCOMAS Congress 2016 - Proceedings of the 7th European Congresson Computational Methods in Applied Sciences and Engineering, At Crete Island, Greece, Volume: Volume 3, Pages 6226-6249 (ISBN : 978 - 618 - 82844 - 0 - 1)
[7] Biancolini , M. E., Ponzini, R., Antiga, L. and Morbiducci, U. (2012), A new workflow for patient specific image-based hemodynamics: parametric study of the carotid bifurcation, Conference CompImage 2012, 5 September 2012, Rome, Italy.
Proceedings VII Meeting Italian Chapter of the European Society of Biomechanics (ESB-ITA 2017) 28-29 September 2017, Rome - Italy
26
ISBN: 978-88-6296-000-7

Abstract—The aim of the present work is to present a computational tool for simulating the fluid-structure interaction of blood flow through prosthetic heart valves. The complex flow fields past different valve models are responsible for different level of stresses on blood cells that could be related to thromboembolic complications. Mechanical hemolysis is estimated by means of a coarse-grained strain-based model, employing an accurate representation of the single red blood cell membrane. The different propensity of several prostheses to thromboembolic complications is finally evaluated.
Keywords—Immersed boundary, aortic valves, hemolysis
HANKS to considerable improvements in prosthetic heart valve design and surgical procedures achieved in
the last years, the surgical replacement of a diseased heartvalve with an artificial one is a safe and routine clinical practice worldwide. Approximately half of the implanted devices are mechanical valves and half are bio-prosthetic.
The bi-leaflet valve is the most popular mechanical design: the valve is made of two semilunar rigid disks attached to a rigid valve ring by small hinges. Bio-prosthetic (or tissue) valves are composed of three deformable leaflets that open closely resembling the native tri-leaflet aortic valve. A major concern related to such devices is that blood elements might be exposed to non-physiologic conditions that are responsible for high shearing and damage. In fact, existing mechanical valves, despite their lifelong durability, need anticoagulation therapy. Tissue valves are free of anticoagulation therapy, but have limited lifetime. Recently a concept of an innovative mechanical model, with a tri-leaflet design has been presented, with a physiological operating mode that should avoid blood damage (see Figure 1).
In this work, a numerical approach is presented in order to accurately predict the flow patterns through such devices and then evaluate the blood damage. The method combines a finite-difference flow solver strongly coupled with a finite-element structural solver for fluid-structure interaction [1]. A suitable version of the immersed boundary technique is employed for handling rigid and deformable geometries, while direct numerical simulation is utilized to solve the complex fluid-structure-interaction problem and obtain detailed information of the flow patterns. Realistic geometries for the valves and ascending aorta are considered. Very different flow fields are obtained for the different valve models, also characterized by distinct levels of stresses acting on the blood cells (see Figure 1).
In order to predict possible membrane damage of the red blood cells (mechanical hemolysis) induced by abnormal
stress levels, a large number of Lagrangian tracer particles are released at the inlet of the computational domain (upstream of the valve), and blood damage is evaluated along each trajectory using a high-fidelity hemolysis model [2]. The model employs an accurate representation of the single red blood cell, which is based on a coarse-grained molecular model of the erythrocyte membrane spectrin cytoskeleton [3]. In this way, under the hydrodynamic loadings, the instantaneous shape distortion of the cells and consequent damage are evaluated, accounting for the finite response time of cell deformation and relaxation. Hemolysis index for three valve models are evaluated, assessing the different propensity of the prostheses to thromboembolic complications.
REFERENCES [1] M. D. de Tullio and G. Pascazio, “A moving–least–squares immersed
boundary method for simulating the fluid–structure interaction of elastic bodies with arbitrary thickness”, Journal of Computational Physics, vol. 325, pp. 201-225, 2016.
[2] H.M. Exxeldin, M.D. de Tullio, M. Vanella, S.D. Solares, E. Balaras, “A strain–based model for mechanical hemolysis based on a coarse-grained red blood cell model”, Annals of Biomedical Engineering, vol. 43, pp. 1398-1409, 2015.
[3] D.A. Fedosov, B. Caswell and G.E. Karniadakis, “A multiscale red blood cell model with accurate mechanics, rheology, dynamics”, Biophysical Journal, vol. 98, pp. 2215-2225, 2010.
Numerical assessment of blood damage through prosthetic heart valves
M.D. de Tullio1
1 Department of Mechanics, Mathematics and Management, Politecnico di Bari, Italy; email:[email protected]
T
FIGURE 1: PULSATILE FLOW THROUGH PROSTHETIC AORTIC VALVES:DECELERATION PHASE. BACKWARD FINITE TIME LYAPUNOV EXPONENT FIELDS IN A SYMMETRY PLANE FOR THREE DIFFERENT VALVE MODELS.
Proceedings VII Meeting Italian Chapter of the European Society of Biomechanics (ESB-ITA 2017) 28-29 September 2017, Rome - Italy
27
ISBN: 978-88-6296-000-7

28

Abstract— Prosthetic valve thrombosis (PVT) is a serious complication affecting prosthetic heart valves. The mean pressure gradient derived from Doppler echocardiography used to diagnose PVT may result in false negatives, mainly in cases of bileaflet mechanical valves (BMVs) in mitral position. In this study, we implemented computational fluid dynamic (CFD) analyses to investigate a mitral commercial BMV using a fluid structure interaction (FSI) approach. Three different valve configurations were studied: a fully functional valve and two different stenotic conditions, characterized by one and two hypomobile leaflets, respectively. The fluid dynamic field across the valve was analysed, showing flow inhomogeneities and disturbances in the two stenotic configurations, particularly present in the asymmetric stenotic configuration. Such disturbances may be the cause for altered Doppler acquisitions and Bernoulli-derived mean pressure gradient in patients. Keywords— Prosthetic valve thrombosis, Bileaflet mechanical
valves, Computational fluid dynamics, Fluid-structure interaction.
I. INTRODUCTION ROSTHETIC valve thrombosis (PVT) is a seriouscomplication of prosthetic heart valves. It consists of a
thrombus or pannus formation that hinder the movement of the valve leaflets. In bileaflet mechanical valves (BMVs), the thrombus can involve one leaflet or both, up to complete orifice obstruction. PVT has an incidence of 6% per patient-year, with higher frequency in mitral position [1] and an associated mortality of 10% [2]. The mean pressure gradient (MPG) is the diagnostic index derived from transthoracic Doppler echocardiography used to diagnose PVT [3]. Clinical studies [4] revealed that the MPG may result in false negatives in the detection of PVT in BMVs (Doppler silent thrombosis). In the present study, computational fluid dynamic (CFD) analyses were implemented to simulate the hemodynamics of a commercial BMV in different configurations, replicating well-functioning as well as PVT conditions. Indeed, CFD analyses of complex flow field, such as those across BMVs, can help elucidating on the clinical paradox of Doppler silent thrombosis.
II. METHODS
A. Bileaflet mechanical valve configurations In this study, the Sorin Bicarbon Fitline size 25 mm (Sorin
Group SpA, Italy) used in mitral position, was investigated by means of CFD analyses. Three different valve configurations (Fig. 1) were identified for the study:
- well-functioning valve (N60), with a symmetric leaflet opening angle of 60°;
- stenotic symmetric valve (SS35), with a symmetric leaflet opening angle of 35°;
- stenotic asymmetric valve (SA57), with one leaflet open at 57°, and the second leaflet completely closed.
SS35 and SA57 represent two equivalent conditions of PVT as for valve obstruction (flow area reduced by 50%), but characterized by different configurations that replicate PVT affecting only one leaflet (SA57) or both (SS35).
FIG. 1. Valve configurations: a) well-functioning valve (N60), b) dysfunctional symmetric stenosis (SS35), and c) dysfunctional asymmetric stenosis (SA57). Opening angles of the leaflets are shown.
B. CFD models Simulations were performed with the finite volume solver ANSYS Fluent v14.5 (Ansys Inc, USA) using the grid deformation method integrated with a strongly-coupled ALE-based fluid structure interaction (FSI) approach [5]. CFD models were implemented replicating experimental testing conditions of the valve in a test bench developed by our group for testing mitral valves in vitro [6]. The valve is housed into an atrial-ventricular system (Fig. 2) comprising the valve housing, the atrial and ventricular chambers, an inlet conduit connected to the atrial chamber and an outlet conduit, corresponding to the pump connection in the experimental set-up. A flow straightener downstream of the inlet stabilizes the flow entering the atrial chamber.
FIG. 2. Model of the test bench housing the BMV. The valve housing is located between the atrial and ventricular chambers. Inlet and outlets conduits, as well as the flow straightener are shown.
Hemodynamic insights of bileaflet mitral prosthetic valve thrombosis: a CFD study
A. Dimasi1, D. Piloni1, L. Spreafico1, M. Meskin1, E. Votta1, R. Vismara1, G.B. Fiore1, L. Fusini2, M. Muratori2, P. Montorsi2, M. Pepi2, and A. Redaelli1
1 Dept of Electronics, Information and Bioengineering, Politecnico di Milano, Italy; email:[email protected] 2 Centro Cardiologico Monzino IRCCS, Italy; email:[email protected]
P
Proceedings VII Meeting Italian Chapter of the European Society of Biomechanics (ESB-ITA 2017) 28-29 September 2017, Rome - Italy
29
ISBN: 978-88-6296-000-7

The fluid domain was discretized with 4.5 106 tetrahedral elements in Meshing (Ansys Inc, USA). The flow straightener was treated as an effective porous zone with permeability and inertial coefficients derived from experimental characterizations. The fluid was modeled as Newtonian and incompressible with rheological properties of blood (1060 kg/m3 density and 3 mPa s dynamic viscosity). A physiological transmitral flow rate derived from the normal tracing of a continuous wave Doppler of a stable patient with a Sorin Bicarbon Fitline in mitral position was imposed at the inlet, and zero pressure was set at the outlet. The valve leaflets were modelled as rigid bodies with one degree of freedom (the rotation around the axis passing through the hinges), whose angular acceleration was computed from local pressure distributions through user-defined subroutines. Kinematic constraints were applied to control the opening configurations of the valve (N60, SS35 and SA57). The entire cardiac cycle (0.8s) was simulated with a time step of 0.02 ms.
III. RESULTSIn N60, the flow through the valve is well distributed in the three orifices, determining the typical triple-jet structure of bileaflet MVs (Fig. 3A), with peak velocity (about 2 m/s) within the normal range of mitral prosthetic valves.
FIG. 3. Velocity profiles in the mid-section plane of the valve at the instant of peak flow rate: A) N60, B) SS35, C) SA57.
Flow inhomogeneities are observed in the SS35 model, while significant flow disturbances are present in the SA57 model (Fig. 3B,C). The latter are also observed by the pathlines at the instant of peak flow rate (Fig. 4).
FIG. 4. Pathlines across SS35 and SA57 models at the instant of peak flow rate.
Such disturbances result in higher pressure drops monitored across the SA57 valve, as reported in Table I, in which average (time-averaged over the diastolic period) and maximum pressure drops are reported for the three models.
TABLE I AVERAGE AND MAXIMUM PRESSURE DROP ACROSS THE VALVE DURING THE
DIASTOLIC PERIOD. Average ΔP [mmHg] Max ΔP[mmHg]
N60 6.38 12.60
SS35 19.73 38.73
SS57 22.56 56.57
Interestingly, the two stenotic configurations, despite having the same flow area are characterized by two different hydraulic resistances, with higher pressure drops in SA57 model. Both SS35 and SA57 reported high pressure drops (average ΔP) which would be classified clinically as PVTs (average ΔP >8 mmHg). However, as shown in Fig. 3, the fluid jets of the stenotic configurations (mainly the asymmetric one) are characterized by flow disturbances, which may affect the in vivo estimation of the mean pressure gradient by Doppler, in which the Bernoulli approximation is used to derive pressure drops from acquired velocities. In this context, the use of the mean pressure gradient as an index for diagnosing PVT should be carefully evaluated and analysed.
IV. CONCLUSION
In this study, we implemented CFD analyses of BMVs in normal and stenotic configurations using a FSI in-house developed approach. CFD analyses allowed to evaluate flow distributions and hydraulic resistances of different valve configurations. From CFD computed pressure drops, both the stenotic configurations analysed would be classified as thrombotic (mean pressure gradient > 8 mmHg). However, it may be claimed that flow disturbances arising in stenotic valves could alter the estimation of pressure drops with Doppler acquisition and Bernoulli approximation. To this end, future studies will involve Doppler acquisitions in in vitro tests of BMVs, to better elucidate on the paradox of Doppler silent thrombosis.
REFERENCES [1] F.M. Caceres-Loriga, et al., “Prosthetic heart valve thrombosis:
Pathogenesis, diagnosis and management”. Int. J. Cardiol. vol. 110, pp. 1–6, 2006. doi:10.1016/j.ijcard.2005.06.
[2] R. Roudaut, et al., “Thrombosis of prosthetic heart valves: diagnosis and therapeutic considerations.” Heart vol. 93, pp. 137–42, 2007.
[3] W.A. Zohgbi, et al. “Recommendations for Evaluation of Prosthetic Valves With Echocardiography and Doppler Ultrasound. A Report From the American Society of Echocardiography’s Guidelines and Standards Committee and the Task Force on Prosthetic Valves, Developed in Conjunction.” J. Am. Soc. Echocardiogr. vol. 22, pp. 975–1014, 2009.
[4] M. Muratori, et al. “Feasibility and diagnostic accuracy of quantitative assessment of mechanical prostheses leaflet motion by transthoracic and transesophageal echocardiography in suspected prosthetic valve dysfunction” Am. J. Cardiol. vol.97, pp. 94–100, 2006.
[5] A. Redaelli, et al. “3-D simulation of the St. Jude Medical bileaflet valve opening process: fluid structure interaction study and experimental validation” J. Heart Valve Dis. vol.13, pp. 804-14, 2004.
[6] R. Vismara, et al., “A pulsatile simulator for the in vitro analysis of the mitral valve with tri-axial papillary muscle displacement” Int. J. Artif. Organs vol. 34, pp. 383–391, 2011.
Proceedings VII Meeting Italian Chapter of the European Society of Biomechanics (ESB-ITA 2017) 28-29 September 2017, Rome - Italy
30
ISBN: 978-88-6296-000-7

Abstract— In this work we propose an engineering framework to support pre-operative decision making process and to plan optimal intervention strategies in complex and unusual vascular anatomies. Different engineering approaches are implemented: 3D printed models, computational fluid dynamics (CFD) analyses and virtual examination of best surgical access. The rare case of a patient with double aortic arch is presented. Obtained results confirmed the high potential of those tools to support clinical decisions. Keywords—aortic arch, patient-specific modelling, 3D
printing, CFD.
I. INTRODUCTION OUBLE aortic arch (DAA) is a rare pathologycharacterized by a bifurcation of the ascending aortawhich forms a vascular ring around the trachea and the
esophagus and causes wheezing and difficulties in respiration and swallowing. Usually symptoms lead to diagnosis and surgical treatment in early childhood; symptomatic adult patients are extremely rare and the surgical treatment could be a challenge [1].
The aim of our study is to propose an engineering framework to support clinical decisions: on one side, 3D printed models could help surgeons to better understand the patient unique vascular anatomy and to plan the procedure. On the other side, patient-specific computational fluid dynamics (CFD) analyses of pre-operative condition compared with different post-operative configurations may suggest the most conservative surgical approach in terms of hemodynamic performance. Finally, a tool that creates virtual surgical windows has been developed to plan the optimal surgical access for minimally invasive intervention.
II. METHODS
A 20-year-old female referred to IRCCS San Matteo Hospital of Pavia with dysphagia and difficulties in respiration for evaluation and management. 64-slice Computed Tomography (CT) revealed DAA with distal trachea and esophagus compressed by the vascular ring. A surgery is required to tie off and separate the smaller branch of the DAA and to relieve pressure on the esophagus and trachea. A minimally invasive approach was considered the most feasible choice. It consists in left mini-thoracotomy (incision through intercostal space) and clamping of the left-sided aortic arch. A bronchoscopy was required to evaluate if there is a compromise of the tracheal lumen and to determine the degree of tracheomalacia, which is a pathological weakness and
floppiness of the wall of the trachea, due to the compression of the DAA [2].
A. 3D printing Pre-operative CT images are pre-processed and segmented.
A semi-automatic gradient-based level set technique implemented in VMTK software is employed [3], and 3D surface models of the vessel lumen and tracheal lumen are created. The full-size physical model is then manufactured with gypsum binder jetting process (printer: Project 460+, 3DSystems).
B. CFD analysis The 3D surface of the aortic lumen is processed through a
developed pipeline which leads to the generation of a CFD-suitable mesh in a semi-automatic way. Operations are performed using VMTK library. Boundary conditions are then set: mean values of flow waves are directly imposed in the ascending aorta and 3 element Windkessels are attached to each output (i.e. descending aorta and four supraortic vessels). The Navier-Stokes equations are computationally solved within a rigid wall domain using a Finite Element Analysis software, i.e., the open-source C++ library LifeV (www.lifev.org).
C. Virtual surgical planning After loading DICOM images in Matlab (Mathworks Inc,
Natick, MA), the developed algorithm allows the user to: easily segment chest by erasing internal structures; create surgical windows simulating mini-sternotomy or mini-thoracotomy approaches; widen/tighten and/or move the virtual window in order evaluate different options and to make the proper surgical choice.
III. RESULTS AND DISCUSSIONS
A. 3D printing 3D printed model of the pathological aorta (see Figure 1)
has been examined by a team of cardiovascular surgeons and interventional radiologists. The model has proved very helpful for a deep understanding of the patient’s anatomy and to plan surgery. In particular, the optimal surgical strategy in terms of “tying off and separation” position is investigated. In addition, the hollow model of the tracheal lumen is employed to evaluate tracheal patency and select the type, flexible or rigid, and size of bronchoscope in order to perform bronchoscopy.
Double aortic arch: engineering support to decision making process
A. Finotello1, S. Morganti2, S. Marconi3, R. Romarowski3, P. Totaro4 and F. Auricchio3
1 Dept. of Experimental Medicine, University of Genova, Genova, Italy 2 Dept. of Electrical, Computer, and Biomedical Engineering, University of Pavia, Pavia, Italy
3 Dept. of Civil Engineering and Architecture, University of Pavia, Pavia, Italy 4 Division of Cardiothoracic Surgery, Research Hospital Foundation San Matteo, Pavia, Italy
D
Proceedings VII Meeting Italian Chapter of the European Society of Biomechanics (ESB-ITA 2017) 28-29 September 2017, Rome - Italy
31
ISBN: 978-88-6296-000-7
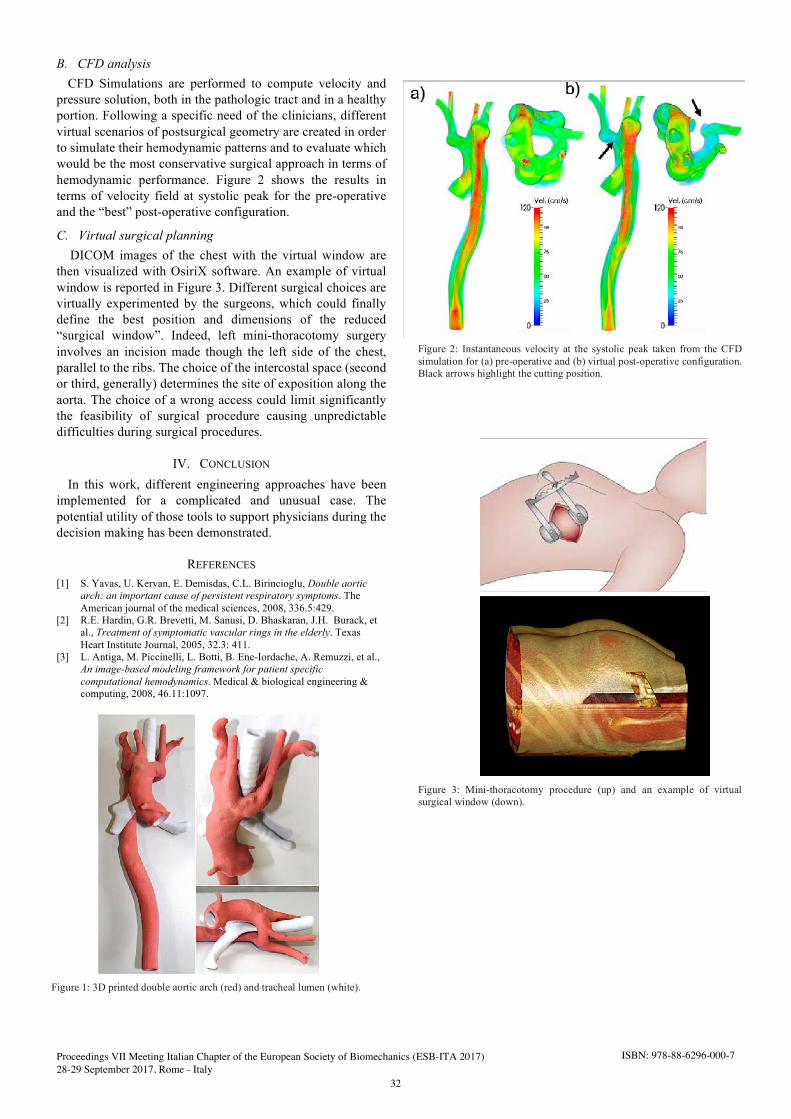
B. CFD analysis CFD Simulations are performed to compute velocity and
pressure solution, both in the pathologic tract and in a healthy portion. Following a specific need of the clinicians, different virtual scenarios of postsurgical geometry are created in order to simulate their hemodynamic patterns and to evaluate which would be the most conservative surgical approach in terms of hemodynamic performance. Figure 2 shows the results in terms of velocity field at systolic peak for the pre-operative and the “best” post-operative configuration.
C. Virtual surgical planning DICOM images of the chest with the virtual window are
then visualized with OsiriX software. An example of virtual window is reported in Figure 3. Different surgical choices are virtually experimented by the surgeons, which could finally define the best position and dimensions of the reduced “surgical window”. Indeed, left mini-thoracotomy surgery involves an incision made though the left side of the chest, parallel to the ribs. The choice of the intercostal space (second or third, generally) determines the site of exposition along the aorta. The choice of a wrong access could limit significantly the feasibility of surgical procedure causing unpredictable difficulties during surgical procedures.
IV. CONCLUSION
In this work, different engineering approaches have been implemented for a complicated and unusual case. The potential utility of those tools to support physicians during the decision making has been demonstrated.
REFERENCES [1] S. Yavas, U. Kervan, E. Demisdas, C.L. Birincioglu, Double aortic
arch: an important cause of persistent respiratory symptoms. The American journal of the medical sciences, 2008, 336.5:429.
[2] R.E. Hardin, G.R. Brevetti, M. Sanusi, D. Bhaskaran, J.H. Burack, et al., Treatment of symptomatic vascular rings in the elderly. Texas Heart Institute Journal, 2005, 32.3: 411.
[3] L. Antiga, M. Piccinelli, L. Botti, B. Ene-Iordache, A. Remuzzi, et al., An image-based modeling framework for patient specific computational hemodynamics. Medical & biological engineering & computing, 2008, 46.11:1097.
Figure 2: Instantaneous velocity at the systolic peak taken from the CFD simulation for (a) pre-operative and (b) virtual post-operative configuration. Black arrows highlight the cutting position.
Figure 1: 3D printed double aortic arch (red) and tracheal lumen (white).
Figure 3: Mini-thoracotomy procedure (up) and an example of virtual surgical window (down).
Proceedings VII Meeting Italian Chapter of the European Society of Biomechanics (ESB-ITA 2017) 28-29 September 2017, Rome - Italy
32
ISBN: 978-88-6296-000-7

GENERAL SESSION
Cardiovascular Tissues


Abstract—Accurate planning of minimally invasive cardiovascular procedures such as percutaneous pulmonary valve implantation relies on a mechanical characterization of the material properties of the patient's implantation site. A non-invasive image-based framework able to perform this task is currently lacking. The aim of this study is to develop an image-based method able to extrapolate the mechanical properties of cardiovascular structures from Phase Contrast Magnetic Resonance Imaging (PC MRI). An experiment was set up on using cylindrical and patient-specific phantoms, which were 3D-printed and inserted in a mock circulatory loop (MCL) to simulate a simplified model of the cardiovascular system. PC MRI data were acquired and area and flow dynamic curves were obtained, allowing estimation of the Young's modulus (E) of the phantoms' material by using the flow-area (QA) loop method. Uniaxial tensile tests on the material were also performed to obtain direct measure of the material elasticity. Finally, finite element (FE) simulations were carried out with the aim to replicate the experiment, by coupling the sensors' information detected during the imaging acquisition and the material properties evaluated by QA loop method and tensile tests. MCL experiments and PC MRI acquisitions were feasible on TangoBlackPlus FL 980 phantoms. Areas and flows estimated by FE simulations well matched the PC MRI measurements. The estimation of the material characteristics by QA loop method was consistent with “gold standard” measurement, although further experiments are required to establish the correct framework. Keywords— image-based, MRI, FE, patient-specific.
I. INTRODUCTION ERCUTANEOUS pulmonary valve implantation (PPVI)was introduced [1] to handle several congenital heart
valve pathologies by means of a minimally invasive approach. The planning of such intervention is currently based on imaging techniques as Magnetic Resonance Imaging (MRI) providing information on the anatomy and on the function of the implantation site. While MRI allows an accurate description of the implantation site, inferring the mechanical properties still represents a challenging task. Previous studies tried to combine finite element (FE) analysis and MRI to derive constitutive material parameters [2], [3]. However, a validated image-based method capable to infer the mechanical properties of vessel tissue is still lacking. Such a method would allow to predict the feasibility of the intervention by simulating accurately interactions between a certain device within a patient-specific geometry.
In this study, we developed an image-based experiment for
the mechanical characterization of selected materials. The results can improve patient-specific modelling of PPVI and other cardiovascular interventions.
II. MATERIALS AND METHODS
An experimental mock circulatory loop (MCL) has been set up to test models of a blood vessel which were 3D-printed under cardiac pulsatile conditions, i.e. a hollow cylinder (150 mm length, 12.7 mm internal diameter and 2 mm thickness) and a patient-specific model of pulmonary artery.
The material used for the phantoms was TangoBlackPlus FLX980 (TP), a compliant material already employed to mimic arterial vessels [4]. The MCL was powered by a pulsatile pump (Harvard apparatus pulsatile blood pump) while flow and pressure information were measured by a flowmeter (ME 9PXL) and a catheter pressure (Opsens 9F).
The MCL circuit was positioned in the MRI scanner (Siemens Avanto 1.5 T) room in order to acquire Phase Contrast (PC) MRI of the phantoms, while sensors registered flow and pressure data by using a Biopac MP150. PC cross-sectional images (pixel size 1.17 mm, 40 temporal frames) were acquired in through plane modality in the middle of the cylindrical phantom and in three sections of the patient-specific phantom (proximal, stenotic and distal), with a VENC of 200 cm/s. Area and flow values were evaluated by a validated post-processing software (Segment 2.0).
The flow-area (QA) loop method, commonly applied on ultrasound (US) images [5], [6], was used to evaluate the material properties of TP in terms of Young's modulus (E). The QA loop method is based on the evaluation of the pulse wave velocity (PWV), evaluated as the slope of the linear part of the loop obtained by coupling flow and area information as obtained from imaging data. Then, wall cross-sectional area (WCSA) and cross-sectional distensibility (DC) are directly derived from PWV. From WCSA, DC, and the minimum area A of the phantom, the E value is computed as in Eq. (1).
DC
WCSAAE
13 (1)
The TP elastic modulus was also assessed by uniaxial tensile tests, conducted on fifteen 3D-printed TP dogbone-like specimens. For this purpose, an extensometer system has been set up, composed by: the testing machine (zwicki-Line Materials Testing Machine) to pull the samples; a camera (HD Webcam C525) for tracking the markers attached on the
Image-based mechanical characterization of large blood vessels
B.M. Fanni1, E. Gasparotti1, S. Celi1, V. Positano1, F. Faita2, N. Di Lascio2, L. Landini1,3, S. Schievano4 and C. Capelli4
1 BioCardioLab, Fondazione CNR-Regione Toscana "G. Monasterio", Massa, Italy; email: [email protected] 2 CNR Institute of Clinical Physiology, Pisa, Italy
3 Department of Information Engineering, University of Pisa, Pisa, Italy 4 Institute of Cardiovascular Science, University College of London, London, United Kingdom
P
Proceedings VII Meeting Italian Chapter of the European Society of Biomechanics (ESB-ITA 2017) 28-29 September 2017, Rome - Italy
35
ISBN: 978-88-6296-000-7

sample and a load cell (HBM S2M), respectively for the strain (ε) and stress (σ) evaluation.
Finally, FE simulations were conducted on the cylindrical model with the commercial software Abaqus 6.14-5 (Dassault Systèmes) to replicate the conditions of the MCL experiment by means of fluid-structural interaction (FSI) analyses. The solid part was meshed with 6000 elements, while the fluid part with 21000 elements. The simulations were run on the FE model by coupling the flow information registered by the flowmeter during the MRI acquisition and the material properties evaluated by both QA loop method and tensile tests in order to evaluate the differences between direct and indirect methods.
III. RESULTS AND DISCUSSION
QA loop method applied to the segmentation results of PC images, of which a frame is given in Fig. 1, provided an E value estimation of 0.22±0.04 MPa.
The results of the tensile tests computed the E value as the average slope of the linear fitting curve for each σ-ε curve and found to be 0.50±0.02 MPa.
In FSI simulations, the flow and area dynamics were computed in the middle section of the FE cylindrical model. Fig. 2 shows a frame at maximum flow level of the model with E=0.50 MPa. FSI simulations for E=0.50 MPa showed a good agreement with area PC MRI measurements (4.63%) and an overestimation of flow (16.38%). For E=0.22 MPa there was an overestimation of both area (8.67%) and flow (20.67%). Flow and area dynamic curves evaluated from both PC imaging segmentation and FSI simulations for E=0.50 MPa are compared in Fig. 3.
Results of this preliminary study were encouraging, even if they show differences between image-based methods, tensile tests and FE analyses. The E value computed from the QA loop method appeared to be underestimated, considering the results from tensile tests, confirmed by the FSI simulations' results. Further investigations should be conducted in order to assess the reasons of such differences. In particular, a further evaluation of the QA loop method should be carried out comparing its use on US images, on which the QA loop method is validated, and MRI data. Furthermore, others rubber-like materials could be tested, following the same flowchart of this work, also modeling more complex geometries such as patient-specific, with the final aim of developing an image-based framework able to characterize the mechanical behavior of a patient-specific vessel, which would lead to new modeling environments for predictive, individualized healthcare.
Fig. 1 - Cross-sectional single frame PC image of cylindrical phantom (highlighted), both magnitude (left) and phase (right).
Fig. 2 - Deformed shape of the FSI cylindrical model, both solid (left) and fluid (right) parts, at maximum flow level, by assigning E 0.50 MPa. In the color bar, stress are given in Pa, while velocities in m/s.
Fig. 3 - Left: flow curves evaluated from imaging segmentation (blue) and FSI simulation (red) for E 0.50 MPa. Right: same for area curves.
IV. CONCLUSION
In this work, an experimental set-up has been developed in order to test a selected material for the inferring of its mechanical properties by means of PC MRI, combining experimental and computational tools.
ACKNOWLEDGEMENT This work was supported by the VIVIR (PE-2013-
02357974) and VALVETECH (Regione Toscana) projects.
REFERENCES [1] P. Bonhoeffer, Y. Boudjemline and Z. Saliba, Percutaneous
replacement of pulmonary valve in a right-ventricle to pulmonary-artery prosthetic conduit with valve dysfunction. The Lancet, vol. 356, pp. 1403-1405, 2000.
[2] G. M. Bosi, C. Capelli, S. Khambadkone, A. M. Taylor and S. Schievano, Patient-specific finite element models to support clinical decisions: a lesson learnt from a case study of percutaneous pulmonary valve implantation. Catheterization and Cardiovascular Interventions, vol. 26, pp. 1120-1130, 2015.
[3] V. Flamini, A. P. Creane, C. M. Kerskens, C. Lally, Imaging and finite element analysis: A methodology for non-invasive characterization of aortic tissue. Medical Engineering & Physics, vol. 37, pp. 48-54, 2015.
[4] G. Biglino, P. Verschueren, R. Zegels, A.M. Taylor and S. Schievano, Rapid prototyping compliant arterial phantoms for in-vitro studies and device testing. Journal of Cardiovascular Magnetic Resonance 2013, 15:2.
[5] R. Williams, A. Needles, E. Cherin, Y. Q. Zhou, R. M. Henkelman et al., Noninvasive ultrasonic measurement of regional and local pulse-wave velocity in mice. Atherosclerosis journal, vol. 237, pp. 31-37, 2014.
[6] N. Di Lascio, F. Stea, C. Kusmic, R. Sicari and F. Faita, Non-invasive assesment of pulse wave velocity in mice by means of ultrasound images. Atherosclerosis, vol. 237, pp. 31-37, 2014.
Proceedings VII Meeting Italian Chapter of the European Society of Biomechanics (ESB-ITA 2017) 28-29 September 2017, Rome - Italy
36
ISBN: 978-88-6296-000-7

Abstract— Although anomalous origin of coronary arteries represents one of the most dangerous pathologies for young athletes, being related to sudden death, the underlying mechanisms are still to be elucidated. The present study aims to better understand how the lumen of the anomalous coronary may narrow during aortic expansion. To this aim, we created a parametric geometrical model of the aortic root and anomalous coronary, performing a static finite element analysis (FEA). In particular, we have analysed nine models with different take-off angles and intramural penetration, showing the functional effect of these geometrical features of the anatomical anomaly.
Keywords— Structural finite element analysis, coronary arteries, anomalies.
I. INTRODUCTION ORONARY artery anomalies (CAAs) consist ofcongenital anatomical alterations of coronary arteries
pattern characterized by specific features (e.g. origin, course, termination…) that is out of physiologic condition [1].
In particular, the anomalous aortic origin of coronary artery (AAOCA) occurs when coronary arises from the opposite or non-coronary sinus of Valsalva Figure 1. Different anomalous courses of the coronary are associated with this condition [2]; among these, the interarterial (between the aorta and the pulmonary artery) and/or intramural (inside the aortic wall) are thought to carry the major risk for sudden death due to coronary occlusion during aortic expansion [1].
Figure 1 - Caudal perspective of aortic root with A) normal coronary and B) AAOCA with intramural course.
Although this pathology “rarely” (0.3-1%) occurs in the general population [1], its clinical incidence is principally found in individuals subjected to prolonged physical efforts, such as young athletes and soldiers, which undergo larger aortic dilatations comparing to others. For instance, Maron et al. showed that 11% of cardiovascular deaths among competitive athletes were due to AAOCA [3].
The pathophysiology of AAOCA is not clear: Angelini and colleagues ascribed the reduced coronary blood flow during aortic expansion to the compression of intramural portion [4]; Kaushal et al. suggested also that an acute angle of take-off could lead to a slit-like orifice [5]; on the other hand, Taylor and co-workers did not found any correlation between these geometrical features and sudden cardiac death [6]. Other authors suggest that coronary occludes only for compression
between aortic root and pulmonary artery [7]. Given such premises, the present study proposes to uses
structural finite element analysis (FEA) to assess the impact of coronary inclusion rate in the aortic wall and of the take-off angle on the coronary lumen narrowing during aortic exertion. This is, to the best of our knowledge, the first biomechanical study on AAOCA.
II. MATERIALS AND METHODS
A. Parametric CAD model generation First, we created a fully parametric geometrical model of
an idealized aortic root with AAOCA using the CAD software Rhinoceros v. 5.0 working with the plug-in Grasshopper v. 2014 (McNeel and associates, Seattle, Washington, USA). The model has twenty-three free parameters that allow to obtain an aortic root with the desired geometry and permit to simulate the AAOCA varying the positioning of the coronary on the root, the take-off angle ( ), the amount of intramural penetration ( ) and the length of intramural course (Figure 2).
Figure 2 - Example views of CAD model. For labels, see “Material and Methods, B. FEM analysis”.
Second, we built the model by setting the parameters using typical values encountered in the literature, selecting studies on individuals subjected to prolonged physical efforts whenever possible. All parameters were fixed except and , which are defined as follows: a) is the angle formed by the coronary axis and the plane tangential to the external surface of the root in the intersection point and b) is the amount of intramural penetration and is related to the distance ρ between the points of the coronary axis and the external surface of the aortic root through the following equation:
%100int
x
RR
Rest
est UG (1)
Occlusion in anomalous coronary arteries: a parametric structural finite element analysis
G.M. Formato1, F. Auricchio1, A. Frigiola2 and M. Conti1
1 Department of Civil Engineering and Architecture, University of Pavia, Pavia, Italy 2 Department of Cardio-Thoracic Surgery, IRCSS Policlinico San Donato, San Donato (MI), Italy
C
Proceedings VII Meeting Italian Chapter of the European Society of Biomechanics (ESB-ITA 2017) 28-29 September 2017, Rome - Italy
37
ISBN: 978-88-6296-000-7

B. FEM analysis Nine models were selected for the FEM simulations, in the
following referred as: A0W0, A45W0, A70W0, A0W50, A45W50, A70W50, A0W100, A45W100, A70W100, where “A” refers to (°) and “W” refers to . Static simulations were performed with Abaqus Standard solver (Dassault Systèmes, Providence, RI, USA). The model was discretized with tetrahedral elements with quadratic interpolation (element C3D10). An approximate size of 1 was chosen for the elements of the aortic root, and 0.3 for those of the coronary, resulting in FE models having, on average, 263856 nodes and 172348 elements. Taking into account a pre-tensioning of the model, hydrostatic pressures of 100 mmHg and 15 mmHg were then applied to the internal surfaces of the aortic root and coronary to simulate the systolic pressures during exercise. As boundary conditions, the extremities of the aortic root were prevented to translate longitudinally and rotate planarly, but allowed to move radially to follow the dilatation of the root. Furthermore, a translational rigidity was added to the free extremity of the coronary using Abaqus spring elements “Spring1” to simulate the linking of the vessel to the tissues.
C. Post-processing After the simulations, the internal surfaces of the deformed
coronary were extracted as .WRL files and converted to triangular meshes with Rhinoceros. The .STL files were then imported in the VMTK software v. 1.3 (Orobix S.R.L., Bergamo, Italy) to compute the centerlines using a sampling length of 0.1 mm. The centerlines were then exported to Paraview v. 5.3.0 (Kitware Inc., New York, USA) for data visualization and manipulations.
III. RESULTS AND DISCUSSION
FE analysis revealed that a) aortic expansion leads to coronary occlusion and b) there is a dependence of coronary occlusion on both take-off angle and intramural penetration. Figure 3 relates the percentage reduction of the minimum radius along the coronary to , evidencing that the more is the intramural penetration the more is the coronary occlusion.
Figure 3 - Percentage reduction of coronary radius at different wall penetrations. The reduction increases with intramural penetration.
Although there is not such a result in the literature, the magnitude of the reduction of the radii agree with that of Angelini and colleagues, who found that diameters of intramural portion of coronaries narrowed by 8-10% during exercise conditions [4]. Figure 4 shows that acute take-off
angles lead to a reduction of the coronary lumen at the ostium level, as evidenced by the values at the left extremes of the graphs. These results confirm the hypothesis of Cheitlin et al. [8]. Furthermore, Figure 4 shows that the maximum coronary occlusion (evidenced by red lines) is found in correspondence of the sinuses, where the expansion is maximum.
Figure 4 - Plot of the coronary radius for nine studied models. The maximum reductions (red marks) are in corrispondence of the Valsalva sinuses. Acute take-off angles lead to a lumen norrowing at ostial level.
IV. CONCLUSION
This preliminary study reveals that a possible mechanism of coronary occlusion can rely on biomechanical reasons. Further studies should be made with more physiological pressures and boundary conditions to better understand this phenomenon.
ACKNOWLEDGEMENT This study is partially supported by the following projects: ESC Research Grant 2016; Smart Fluidics for Life Science (Lombardy Region).
REFERENCES [1] P. Angelini, Texas Heart Institute Journal, vol. 29, no. 4, 2002. [2] A. Fabozzo, Seminars in Thoracic and Cardiovascular Surgery, vol.
28, no. 4, 2016, pp. 791–800. [3] B. J. Maron, JAMA, vol. 276, no. 3, 1996, pp. 199–204. [4] P. Angelini, Texas Heart Institute Journal, vol. 33, no. 2, 2006. [5] S. Kaushal, The Annals of Thoracic Surgery, vol. 92, no. 3, 2011, pp.
986–992. [6] A. J. Taylor, American Heart Journal, vol. 133, no. 4, 1997, pp. 428–
435. [7] C. Basso, Journal of the American College of Cardiology, vol. 35, no.
6, 2000. [8] M. D. Cheitlin, Circulation, vol. 50, no. 4, 1974, pp. 780–787.
Proceedings VII Meeting Italian Chapter of the European Society of Biomechanics (ESB-ITA 2017) 28-29 September 2017, Rome - Italy
38
ISBN: 978-88-6296-000-7

Abstract— Modelling of biological tissues in numerical simulations requires an accurate choice of the constitutive laws, whose influence could be determinant to obtain reliable results. Although some default materials are already available in commercial software, they might be inappropriate to describe the complex and anisotropic behaviour of soft tissues. The aim of this work is the implementation of a user-defined material, which allows to model in ANSYS LS-DYNA a hyperplastic matrix with two different families of embedded fibres, whose directions can be locally imposed. Finite element simulations on a biological heart valve and a reconstructed aortic root with physiological load were carried out. Stresses comparison in the valve and in the aortic root between the user-defined anisotropic material and an isotropic one show that anisotropy generates more realistic stress fields . Keywords—Anisotropic, constitutive law, user-defined
material, finite element.
I. INTRODUCTION HE capability of capturing the complex behaviour ofbiological tissue is one of the main issues for a correct
biomechanical modelling. In the literature, many authors highlighted the importance of material anisotropy of soft tissues [1-3]. In this light, in order to carry out reliable numerical analyses on heart valves and vessels, the presence of different families of oriented fibers has to be taken into account. Although some material models have already been implemented in most commonly used commercial software, sometimes the nature of the material or the peculiarity of the investigation require more accurate constitutive equations. Nevertheless, constitutive models are a simplified representation of a complex reality and need a thorough validation. Experimental data are needed to extract the parameters that give relevance to the material model. In this work we present a versatile anisotropic constitutive model implemented in ANSYS LS-DYNA, which allows to describe a hyperplastic matrix with two different families of embedded fibres, whose directions can be locally imposed. The relevance of this model is exploited in finite element simulations on a biological aortic valve and on a reconstructed aortic root.
II. MATERIAL AND METHODS
A. Material Description The subroutine implemented for ANSYS LS-DYNA solver
worked as a user-defined material accounting for the presence of two families of embedded fibres that run in preferred directions. The following form of the strain energy function was used:
W = Wiso + Waniso + Wvol
iso() = 𝐶10(𝐼1 − 3) + 𝐷1[𝑒𝐷2(𝐼1−3) − 1]𝑊aniso(𝑪, 𝒂04, 𝒂06) = 𝑘1
2𝑘2[𝑒𝑘2(𝐼4−3)2 − 1] +
𝑘32𝑘4
[𝑒𝑘4(𝐼6−3)2 − 1]
𝑊vol(𝐽) = 𝑘2 (𝐽 − 1)2
(1)
where iso() describes the isotropic behaviour of thecollagenous matrix in which the fibres are embedded and 𝑊aniso conveys the anisotropic behaviour typical of the softtissues. 𝐼4, 𝐼6 are the pseudo-invariants of 𝐂 and are definedfrom the unit vectors 𝒂04, 𝒂06 describing the directions of thefibres in the reference configuration. This term has been recently revised by Nolan et al. [1] with respect to the one described in the model of Holzapfel and Odgen [2].
B. Fibres Orientation In order to give consistence to the anisotropic term 𝑊aniso,
the definition of a local coordinate system for each element, centered in its centroid, is mandatory. Based on the works of Driessen et al. [4,5] for the valves and Alastrue et al. [6] for the vascular vessels, a local coordinate system at each element was defined according to the principal stress directions, obtained with ad hoc pre-analyses (right panels in Fig. 1). The local coordinate system for the leaflet elements was spanned by eigenvectors referring to the circumferential and radial directions, while for the aortic root axial and circumferential directions were found. The LS-DYNA input files of the simulations were modified with MATLAB and a specific coordinate system for the elements was set locally.
Fig. 1 Models used in the simulations and principal stress directions used to define the local coordinate systems for each elements.
On the importance of anisotropy in biological materials: application to aortic tissues
Nicole Casalini, Giulia Luraghi, Francesco Migliavacca, José Félix Rodriguez Matas
Laboratory of Biological Structure Mechanics (LaBS), DCMIC, Politecnico di Milano, Italy; email: [email protected]
T
Proceedings VII Meeting Italian Chapter of the European Society of Biomechanics (ESB-ITA 2017) 28-29 September 2017, Rome - Italy
39
ISBN: 978-88-6296-000-7

C. Aortic Valve FE Simulations A generic tri-leaflets aortic valve (Fig.1, top) with a
diameter of 25 mm, discretized with 10,812 hexahedral reduced integrated solid elements was considered. Two cycles, representing a physiological load, were carried out imposing the pressure drop directly to the leaflets. The orientations for the two families of fibres were set to coincide with the axes of the local coordinate systems. Material parameters for the constitutive model in (1) were obtained by means of nonlinear regression analysis of biaxial data from Sacks et al. [7].
D. Aortic Root FE Simulations An aortic root (Fig.1, bottom), reconstructed from CT
images and discretized with 21,824 hexahedral fully integrated solid elements, was used. Two cardiac cycles were carried out imposing the pressure drop to the internal wall. In this case, the orientations of the two families of fibres were imposed considering an angle ±50° [8] with respect to the local axial direction, representing an average of the three layers composing the aorta. Experimental data from Holzapfel et al. [9] were considered.
Simulations considering the material as isotropic were also performed. The isotropic part of model (1) was fitted to average experimental data from Sacks et al. and Holzapfel et al. for the valve and the aorta respectively. All meshes were created with ALTAIR Hypermesh and the simulations were carried out with ANSYS LS-DYNA 971 release 9.0.
III. RESULTS
The analyses showed how the anisotropy influences the stress field in the models (Fig.2). In particular, the presence of the fibres allowed us to observe different areas of stress concentration during the opening of the valve and the pressurization of the aorta. It is also possible to notice the influences in the structural kinematics; the opening area in the anisotropic valve was a 5% bigger than for the isotropic case.
Fig. 2: Comparison of 1st principal stresses obtained from the simulations of the valve and the aortic root with both anisotropic and isotropic material laws.
IV. CONCLUSION
The main relevance of this work is the implementation of a user-defined material, which allows to model in ANSYS LS-DYNA a hyperplastic matrix with two different families of embedded fibres, whose directions can be locally imposed. This user-defined material could be used in structural simulations as well as in Fluid-Structure Interaction simulations, which involve the coupling between valves and vessels with blood. This material description is intended to be a more elegant alternative to the so called multilayer composite approach [10], commonly used in LS-DYNA to model two families of fibres but introducing a discontinuity of the strain and stress fields. More investigations are required to analyse the influence of the anisotropy with FSI simulations and how the orientation of the fibres influences the material behaviour.
REFERENCES [1] Holzapfel, Gerhard A., and Ray W. Ogden. "Constitutive modelling of
passive myocardium: a structurally based framework for material characterization." Philosophical Transactions of the Royal Society of London A: Mathematical, Physical and Engineering Sciences 367.1902 (2009): 3445-3475.
[2] Joda, Akram, et al. "Multiphysics simulation of the effect of leaflet thickness inhomogeneity and material anisotropy on the stress–strain distribution on the aortic valve." Journal of biomechanics 49.12 (2016): 2502-2512.
[3] Geest, Jonathan P. Vande, et al. "The effects of anisotropy on the stress analyses of patient-specific abdominal aortic aneurysms." Annals of biomedical engineering 36.6 (2008): 921-932.
[4] Driessen, N. J. B., et al. "A computational model for collagen fibre remodelling in the arterial wall." Journal of theoretical biology 226.1 (2004): 53-64.
[5] Driessen, Niels JB, Carlijn VC Bouten, and Frank PT Baaijens. "Improved prediction of the collagen fiber architecture in the aortic heart valve." Journal of biomechanical engineering 127.2 (2005): 329-336.
[6] Alastrue, Victor, Garcia A, Peña E, Rodriguez JF, Martinez MA, Doblare M. “Numerical framework for patient-specific computational modelling of vascular tissue.” International Journal for Numerical Methods in Biomedical Engineering 26 (2010): 35-51.
[7] Sacks, Michael S., David B. Smith, and Erik D. Hiester. "A small angle light scattering device for planar connective tissue microstructural analysis." Annals of biomedical engineering 25.4 (1997): 678-689.
[8] Nolan, D. R., et al. "A robust anisotropic hyperelastic formulation for the modelling of soft tissue." Journal of the mechanical behavior of biomedical materials 39 (2014): 48-60.
[9] Holzapfel, Gerhard A., Christian AJ Schulze-Bauer, and Michael Stadler. "Mechanics of angioplasty: Wall, balloon and stent." ASME Applied Mechanics Division-Publications-AMD 242 (2000): 141-156.
[10] Wenk, Jonathan F., Mark B. Ratcliffe, and Julius M. Guccione. "Finite element modeling of mitral leaflet tissue using a layered shell approximation." Medical & biological engineering & computing 50.10 (2012): 1071-1079.
Proceedings VII Meeting Italian Chapter of the European Society of Biomechanics (ESB-ITA 2017) 28-29 September 2017, Rome - Italy
40
ISBN: 978-88-6296-000-7

Abstract— Finite element models (FEMs) have been widely used to quantify aortic root (AR) biomechanics and its role in several pathologies. Among these, the progression of aortic valve calcification represents a particularly relevant condition. In this context, the discretization of the valve leaflets has a key role; in the literature, shell elements are typically used, but a more reliable computation of leaflet stresses might be obtained through the use of solid elements. To compare these two discretization approaches, we implemented a semi-automated tool for the generation of image-based aortic root FEMs; the tool allows for discretizing the valve leaflets using shell or solid hexahedral elements, and for setting space-dependent patterns of leaflets thickness for solid leaflets. The ARs of three healthy subjects were modeled, and their biomechanics throughout the cardiac cycle were computed. Results highlighted that the use of solid elements leads to a more reliable quantification of leaflets stresses and that the local leaflet thickness strongly influences stresses patterns. Keywords— Finite element biomechanical model, aortic root,
cMRI, aortic valve leaflets
I. INTRODUCTION HE aortic root (AR) is the functional and anatomical unit connecting the outlet of left ventricle to the ascending
aorta. It includes the aortic valve (AV), the Valsalva sinuses, the aortic annulus, the sino-tubular junction (STJ), the interleaflets triangles and the proximal ascending aorta. To better understand AR structural mechanics and its role into AR pathophysiology, different finite element models (FEMs) have been proposed in the scientific literature. Most of these use shell elements to discretize the geometry of AV leaflets, although this approach likely limits the detailed insight into leaflet stress distribution and into its role in the progression of clinically relevant pathological conditions, such as calcific AV disease. The discretization of AV into solid elements was proposed only by few numerical studies, and its impact on computed leaflet stresses was never investigated. In this scenario, we generated the FEM of a small set of healthy ARs based on medical imaging, and computed AR biomechanics throughout the cardiac cycle. For each FEM, two variants were generated, which were characterized by the use of shell and solid elements, respectively, to discretize AV geometry.
II. MATERIAL AND METHODS
A. Acquisition of cMRI data and segmentation Cardiac MRI was performed on 3 healthy volunteers. T1-weighted cine-cMRI sequences were acquired on 18 planes
evenly rotated around the axis passing through the center of the annulus and the center of the sino-tubular junction. Acquisitions were performed on a 1.5 T Achieva scanner (Philips Healthcare Medical System, Irvine, Calif). In-plane spatial resolution and slice thickness were 1.1 mm and 7 mm, respectively. Thirty frames/cardiac cycle were acquired with R-wave triggering. In the first systolic frame, when the transvalvular pressure acting on AV leaflets was considered negligible [2], AR substructures were manually traced through in house Matlab© scripts.
B. Reconstruction and discretization of AR geometry Through in house Matlab© scripts, AR 3D geometry was obtained a point-cloud, which was filtered to eliminate noise effects. A 3D surface for each AR structure was created and discretized with quadrangular shell elements.
In Figure 1, A) full volume mesh of the aortic wall, B) AV shell model, C) AV solid model. Data are shown for subject 1.
The full volume mesh for the aortic wall was created by extruding the shell element along the local outward normal to generate three layers of hexahedral solid elements with a cumulative thickness of 1.0 mm (Figure 1A). The AV leaflets shell model was generated by assigning a virtual homogeneous thickness of 0.8 mm to the leaflet shell elements. The AV solid model was obtained through a complex extrusion process to obtain three layers of hexahedral solid elements through the leaflet thickness (Figure 1C). The latter was region-dependent (1.2 mm for the attachment edge and the free margin, 0.3 mm for the belly region), as in [3].
C. Tissues mechanical properties The mechanical response of the aortic wall was assumed linear, elastic and isotropic, with a 2 MPa Young’s modulus
G. Rossini1*, M. Sabbatini1*, F. Sturla1, A. Della Corte2, C. Bancone2, S. Dellegrottaglie3,4, A. Redaelli1, E. Votta1 1 Department of Electronics, Information, And Bioengineering, Politecnico di Milano, Italy; email: [email protected]
2 Department of Cardiothoracic and Respiratory Sciences, Second University of Naples, Napoli, Italy3 Department of Advanced Biomedical Sciences, Federico II University, Napoli, Italy
4 Division of Cardiology, Ospedale Medico-Chirurgico Accreditato Villa dei Fiori, Acerra, Napoli, Italy * these two authors contributed equally to this work
Impact of leaflets solid elements discretization on patient-specific aortic root FE models biomechanics
T
(A) (B) (C)
Proceedings VII Meeting Italian Chapter of the European Society of Biomechanics (ESB-ITA 2017) 28-29 September 2017, Rome - Italy
41
ISBN: 978-88-6296-000-7

and a 0.45 Poisson’s ratio. AV leaflets tissue was described as a transversely anisotropic and hyperelastic material using the model originally proposed by Guccione [4]; the model parameters were identified by least square fitting of experimental data from biaxial tensile tests by Billiar and Sacks [5] [6]. The constitutive model was implemented into a VUMAT subroutine for ABAQUS/Explicit©.
D. Computation of aortic wall pre-stresses The initial configuration of the AR was defined at early systole, when AV leaflets are approximately unloaded, but the aortic wall is pressurized to 80 mmHg. Consistently, aortic wall pre-stresses were computed through the iterative process described in detail in a recent work by Votta [7].
E. Computation of AR biomechanics The structural response of the pre-stressed AR over two consecutive cardiac cycles was computed; to this aim, physiological time-dependent ventricular and aortic pressures were applied to the aortic wall upstream from and downstream of the AV, respectively, and a consistent trans-valvular pressure drop was applied to the AV leaflets.
III. RESULTS AND DISCUSSION
AV kinematics as computed by the solid and the shell models were compared. When shell elements were used, leaflets were allowed for wide local rotations at their insertion onto the aortic wall, which behaved as a sort of spherical joint. When solid elements were used, the connection behaved as a deformable encastre, preventing from free rotations. In systole, this effect reflected into a reduced outward motion of the solid leaflet, and hence into a smaller orifice area at peak systole (Figure 2A, 2B). At peak diastole, this effect reflected into a different leaflets profile: when shell elements were used, AV leaflets tended to prolapse (Figure 2C).
In Figure 2, A) shell and B) solid orifice area at peak systole; C) left coronary leaflet profile at peak diastole (red = shell, black = solid). Data are shown for subject 1.
AV mechanical response during the cardiac cycle was evaluated through the analysis of the circumferential stresses on the ventricular and atrial side of the leaflets, as well at their mid-section. Shell models (Figure 3, first line) showed a patchy distribution, in particular on the two AV sides, without a clear separation between the belly region and the cooptation area, and marked differences, up to 981 kPa, were detected between the ventricular and aortic sides (Table I). Conversely, in the solid elements models (Figure 3, second line) the distribution was much smoother and a gradual trend over the three considered layers was visible. Computed stresses values also proved the strong impact of the thickness modulation; in particular, max principal, radial and
circumferential stresses were notably increased in the solid thinned belly region as compared to the corresponding value for constant thickness shell models.
In Figure 3, circumferential stress patterns on the ventricular side, mid-section and aortic side for the shell model (first line) and solid model (second line). Data are shown for subject 1. The pink circles highlight the region where values in Table 1 were obtained.
In Table I, circumferential stresses (MPa) in the belly region. Values were obtained through averaging over the region highlighted in Figure 3.
IV. CONCLUSION
Computed results highlighted that the use of solid elements has a major impact on AV kinematics, and leads to a more reliable quantification of leaflet stresses and of the associated variations through the leaflet thickness. Moreover, it was evident that leaflet stresses strongly depend on the local leaflet thickness, thus suggesting that in the context of patient-specific modeling a reliable quantification of the patient-specific tissue thickness distribution should be mandatory.
REFERENCES [1] C. A. Conti et al., “Dynamic FE analysis of the aortic root from MRI
derived parameters”, in Medical Engineering and Physics, 2010. [2] K.J. Grande-Allen, R. P. Cochran, P. G. Reinhall, K.S. Kunzelman,
“Stress variations in the human aortic root and valve: the role of anatomic asymmetry”, in Annals of Biomedical Engineering, 1998.
[3] J. M. Guccione, A. D. McCulloch, L. K. Waldman, “Passive material properties of intact ventricular myocardium determined for a cylindrical model”, in Journal of Biomechanical Engineering, 1991.
[4] M. S. Sacks, K. L. Billiar, “Biaxial mechanical properties of the native and glutaraldehydetreated aortic valve cusp: part I, experiment results”, in Journal of Biomechanical Engineering, 2000.
[5] M.S. Sacks, K. L. Billiar, “Biaxial mechanical properties of the native and glutaraldehydetreated aortic valve cusp: part II, a structural constitutive model”, in Journal of Biomechanical Engineering, 2000.
[6] E. Votta et al., “A novel approach to the quantification of aortic root in vivo structural mechanics”, in International Journal for Numerical Methods in Biomedical Engineering, 2016.
CIRCUMFERENTIAL STRESSES IN THE BELLY REGION
location Subject 1 Subject 2 Subject 3
shell solid shell solid shell solid V side 0.526 0.770 0.480 0.851 1.054 1.108 Mid-
section 0.096 0.640 0.078 0.758 0.073 0.995
A side 0.169 0.548 0.351 0.682 0.497 0.909
(A) (B) (C)
Proceedings VII Meeting Italian Chapter of the European Society of Biomechanics (ESB-ITA 2017) 28-29 September 2017, Rome - Italy
42
ISBN: 978-88-6296-000-7

Abstract—In this work we consider ex vivo porcine models and we estimate the physical parameters underlying the arterial fluid dynamics, both with and without stent, in terms of hydraulic resistance, inertance and compliance. Preliminary results show an increased resistance and a decreased compliance in the presence of the stent for non-fresh aortas, while only an increased resistance for fresh aortas.
Keywords—Aortic stent graft, lumped parameters, ex vivo porcine model.
I. INTRODUCTION HORACIC Endovascular Aortic Repair (TEVAR) has proved to be a safe treatment option for patients with
thoracic aortic disease. However, at the same time, TEVAR seems to locally stiffen the aorta, with systemic cardiovascular effects, as found in in vivo animal models [1]–[3] and in our recent ex vivo studies on porcine models with different types of endografts [4], [5]. In these studies, the aortic stiffening was indirectly assessed through the pulse wave velocity. Here, we use our ex vivo data on porcine models to estimate the physical parameters underlying the arterial fluid dynamics. More specifically, we consider a lumped parameter approach, in which the physical parameters are given in terms of hydraulic resistance, inertance and compliance. These parameters are estimated before and after the endografting, based on pressure-flow measurements obtained by connecting the porcine model to a pulsatile mock loop.
II. MATERIALS AND METHODS
Both fresh (i.e., tested the same day of pig sacrifice) and non-fresh (i.e., stored at 4°C for one day and then tested) porcine aortas are considered. Each aorta has been tested under three conditions: i) without endograft; ii) after the deployment of a 15cm-long stent graft; iii) after the extension of the stent graft length up to 25cm. The aortas are inserted in the pulsatile mock loop of [6], in series between the volumetric pump representing the ventricle and the afterload (Figure 1a). The circuit is filled with water at room temperature, and a physiological flow waveform is generated by the pump [7] with mean flow of 5 L/min and a heart rate of 60 bpm.
Aortas are modelled by means of a three-element circuit (including resistance R1, inertance L1, and compliance C1), while the afterload by means of a four-element circuit
(including resistances Rc2 and Rp2, inertance L2, and compliance C2); see Figure 1b for the overall layout. The goal is to estimate the aortic parameters in the presence and in the absence of the stent, to quantify the impact of the endovascular implant on the overall fluid dynamics. Operatively, we first characterize the impedance simulator, whose parameters are constant over all the experiments; then, we estimate parameters R1, L1 and C1 while fixing the others.
a)
b)
Fig. 1. Mock loop circuit (a), and lumped parameter models of the aorta and the afterload (b).
Pressure and flow waveform measurements are acquired and digitalized with a frequency of 1 kHz; data refer to six consecutive cardiac cycles once the steady state is reached. Estimations are based on the differential equations that describe the pressure in the system as function of the flow. As for the impedance simulator, the differential equation that describes the pressure P1 at the entry of the impedance simulator as a function of the flow Q2 through Rc2 and L2 is
(1)
where t is the time. The estimation procedure is as follows. First, pressure P1 and flow Q2 signals are filtered with a low-pass filter (cut frequency of 10 Hz). Then, the filtered signal Q2 has been derived to get dQ2/dt and d2Q2/dt2. Finally, the
Alteration of lumped parameters under stent graft in ex vivo porcine aortas
E. Lanzarone1, M. Conti2, S. Marconi2, H.W.L. De Beaufort3, S. Trimarchi3, and F. Auricchio2
1Consiglio Nazionale delle Ricerche (CNR), Istituto di Matematica Applicata e Tecnologie Informatiche (IMATI), Milan, Italy; email: [email protected]
2Department of Civil Engineering and Architecture (DICAr), University of Pavia, Pavia, Italy; email: [email protected], [email protected], [email protected]
3Thoracic Aortic Research Centre, Policlinico San Donato IRCCS, University of Milan, San Donato Milanese, Italy; email: [email protected], [email protected]
T
Proceedings VII Meeting Italian Chapter of the European Society of Biomechanics (ESB-ITA 2017) 28-29 September 2017, Rome - Italy
43
ISBN: 978-88-6296-000-7

optimal set of parameters Rc2, Rp2, L2 and C2 that fit the computed trend with the filtered signal of P1 have been computed through a mean squared error minimization.
The optimization has been performed constraining all parameters to be non-negative. The entire estimation procedure has been performed in R, with packages seewave, pspline, desolve, and FME. As for the aortic parameters, the differential equation that describes the pressure P0 at the entry of the aorta as a function of the flow Q1 through R1 and L1 is:
(2)
where P1 is the same as in Eq. (1). For the estimation, the signals of P0, P1 and Q1 are the actually acquired, while Q2 is not directly measured for the sake of experimental simplicity. It is thus derived as follows: given the filtered P1, unobserved values of Q2 are simulated by using a discretized version of Eq. (1) and the already estimated afterload parameters, assigning the initial values of Q2 by imposing the mean values of Q2 and Q1 to be equal. The estimations have been obtained in the same way of the impedance simulator.
Fig. 2. Resistances and compliances for fresh and non-fresh aortas: without stent (black columns), with the 15cm-long stent (dark-gray columns) and with the 25cm-long stent (light-gray columns).
III. RESULTS
Parameters values for the afterload circuit are Rc2 = 1.0865, L2 = 0.13814, Rp2 = 19.262, and C2 = 0.49912 (measurement units for pressure in mmHg and flow in L/min). They are mostly in line with those of a physiological afterload [8]. Resistances values are similar to the physiological ones [6]; compliance C2 is higher even though of the same order of magnitude; inertance L2 is quite higher (see [9]), in agreement with the oscillations observed in P1. Preliminary results are reported for three fresh and three non-fresh aortas. Parameters R1 and C1 are reported in Figure 2, while null or quite null inertances have been always found. Outcomes clearly show an increased resistance in the presence of the stent, which is even higher for the 25cm-long stent. As for the compliances, there is a clear decreasing trend opposite to the increasing one of the resistance for non-fresh aortas. On the contrary, no compliance variations are found for fresh aortas.
IV. DISCUSSIONS AND CONCLUSIONS
In this work, we considered a lumped parameter model of the aorta to investigate the variation of the physical parameters underlying the aortic fluid dynamics in the presence or in the absence of TEVAR.
The goal is to provide a better and more robust estimation approach than that provided by the pulse wave velocity. Preliminary results show some trends, which can be interesting from a clinical point of view. Future work will involve additional experiments to give statistical significance to the results, and an analysis to link the altered parameters with the mechanical properties of the vessel.
REFERENCES [1] H. Vernhet, R. Demaria, A. Pérez-Martin, J.M. Juan, M.C. Oliva-
Lauraire, C. Marty-Double, J.P. Sénac, and M. Dauzat, “Wall mechanics of the stented rabbit aorta: long-term study and correlation with histological findings,” J Endovasc Ther, vol. 10, pp. 577–84, 2003.
[2] G. Dobson, J. Flewitt, J. Tyberg, R. Moore, and M. Karamanoglu, “Endografting of the descending thoracic aorta increases ascending aortic input impedance and attenuates pressure transmission in dogs,” Eur J Vasc Endovasc, vol. 32, pp. 129–35, 2006.
[3] A.A. Zacharoulis, S.M. Arapi, G.A. Lazaros, A.I. Karavidas, and A.A. Zacharoulis, “Changes in coronary flow reserve following stent implantation in the swine descending thoracic aorta,” J Endovasc Ther, vol. 14, pp. 544–50, 2007.
[4] H. De Beaufort, M. Conti, A. Kamman, F.J.H. Nauta, E. Lanzarone, F.L. Moll, J. A. van Herwaarden, F. Auricchio, and S. Trimarchi, “Stent graft deployment increases aortic stiffness in an ex-vivo porcine model,” Ann Vasc Surg, DOI 10.1016/j.avsg.2017.04.024, 2017.
[5] H. De Beaufort, M. Coda, M. Conti, T. van Bakel, F.J.H. Nauta, E. Lanzarone, F.L. Moll, J. van Herwaarden, F. Auricchio, and S. Trimarchi, “Comparison of the stiffening effects of four thoracic aortic stent grafts in an experimental setting,” under review.
[6] E. Lanzarone, R. Vismara, and G.B. Fiore, “A new pulsatile volumetric device with biomorphic valves for the in vitro study of the cardiovascular system,” Artif Organs, vol. 33, pp. 1048–62, 2009.
[7] W. Swanson, and R. Clark, “A simple cardiovascular system simulator: design and performance.” J Bioeng, vol. 1, pp. 135–45, 1977.
[8] M.K. Sharp, and R.K. Dharmalingam, “Development of a hydraulic model of the human systemic circulation.” ASAIO J, vol. 45, pp. 535–40, 1999.
[9] E. Lanzarone, and F. Ruggeri, “Inertance estimation in a lumped-parameter hydraulic simulator of human circulation,” J Biomech Eng - T ASME, vol. 135, p. 061012, 2013.
Proceedings VII Meeting Italian Chapter of the European Society of Biomechanics (ESB-ITA 2017) 28-29 September 2017, Rome - Italy
44
ISBN: 978-88-6296-000-7

Abstract—In this work, a computational framework for the implementation of a chemo-mechano-biological formulation of the remodelling of arterial tissue constituents is developed. Accordingly, arterial behaviour has been analyzed through a multiphysics strategy that couples: macroscopic mechanical description; molecular transport phenomena; remodelling laws of tissue micro- and nano-structural features. Numerical results have been obtained by addressing a case study which shows the effects of extracellular matrix remodelling induced by intra-arterial-wall transport of, e.g., matrix metalloproteinases, transforming growth factor-beta and interleukines. Keywords—Arterial biomechanics, molecular transport,
chemo-mechano-biological remodelling, coupled mechanics.
I. INTRODUCTION RTERIAL physiopathological behaviour involves multiphysics mechanisms, as the result of the complex
interplay between microscale transport phenomena and mechanical equilibrium. Indeed, vascular mechanics depends on the structural organization and properties of arterial wall constituents. In turn, the latter are affected by remodelling mechanisms associated with tissue biochemical environment, that is with the proteolytic activity of enzymes diffusing within aortic thickness or by the synthesis of arterial constituents from cells. Tissue biochemical environment is governed by cell-cell signalling pathways, mediated by soluble factors diffusing in arterial tissues [1]. Accordingly, structural properties and molecules (e.g., enzymes, cytokines, growth factors) are closely related in a closed-loop feedback control system and determine the physiological functional behaviour of the artery. In this framework, a challenging open issue in biomechanics is to model the effects of physio-pathological mechanisms on the macroscale functional response of cardiovascular structures, starting down from their biological onset.
For instance, multiphysics mechanisms control the degradation and the deposition of the extracellular matrix (ECM) whose dysregulation leads to pathological tissue remodelling. Several biologically active molecules affect the rate of deposition and degradation of ECM (such as, matrix metalloproteinases MMPs, endogenous tissue inhibitors TIMPs, transforming growth-factors TGF-βs, interleukines ILs). Under physiological conditions, a balance between ECM deposition and degradation is maintained, while a loss of activity control may result in diseases such as aneurysms. In order to account for these mechanisms in numerical simulations of arterial biomechanics, a direct relationship between micro/nanoscale mechanisms and mechanical response of arterial tissues is needed, avoiding phenomenological-like descriptions. In this framework, constitutive hyperelastic models based on multiscale homogenization techniques for collagenous tissues have been
recently introduced [2]. These models explicitly incorporate nano- and microscale mechanisms, giving a special insight on the link between histology and mechanical response of collagenous tissues. The aim of this work is to develop a computational framework for the chemo-mechano-biological remodelling of arterial tissue constituents in patient-specific arterial segments. The multiphysics coupling strategy for microscale reactive/transport phenomena and tissue mechanical response traced in [3] is employed. The key components of these computational problems are highlighted and analysed, presenting modelling approaches which are validated and discussed.
II. MATERIALS AND METHODS
In the present work, the mechanics of arterial tissues is modeled by employing multiscale homogenization methods [2] and it is coupled with reaction-diffusion processes of biochemical substances by the definition of suitable remodelling laws [3]. Analytical and computational approaches are employed in order to obtain the macroscale tissue response in function of both nanoscale mechanisms [4] and microscale nonlinearities [5]. In particular, tissue anisotropic mechanical response are obtained on the basis of computational models of curvilinear fiber-like structures and analytical molecular descriptions. Molecular transport is described by means of reaction-diffusion equations whose source and consumption terms depend on the biological activity of cells. Remodelling laws are driven by the obtained tissue biochemical environment and described by means of partial differential equations inspired by the logistic function. A staggered solution strategy is conceived, exploiting the principle of time scale separation between mechanical, transport and remodelling mechanisms. The simulation tool is developed implementing an in-house Matlab code which exploits the solving finite-element capabilities of COMSOL Multiphysics.
III. RESULTS
Results are obtained addressing an exemplary case study of patient-specific arterial segment obtained from computed tomography (CT) images (Fig. 1).
The effects of altered microscale transport processes on arterial mechanisms are analyzed. For instance, the biochemical activity of MMPs (matrix metalloproteinases), TGF-β (transforming growth factor-β) and IL (interleukine) can be effectively addressed by the present computational framework. The concentration profiles of these molecules within arterial tissues are obtained in function of cellular
Computational chemo-mechano-biological remodelling of arterial tissue constituents
D. Bianchi1, M. Marino2, G. Vairo1, P. Wriggers2
1 DICII, University of Rome “Tor Vergata”, Italy; email:bianchi; [email protected] 2 IKM, Leibniz University of Hannover, Germany; email: marino; [email protected]
A
Proceedings VII Meeting Italian Chapter of the European Society of Biomechanics (ESB-ITA 2017) 28-29 September 2017, Rome - Italy
45
ISBN: 978-88-6296-000-7

activity affected, e.g., by inflammatory states. When biologically-active molecules reach biological cells, they activate the synthesis/degradation of ECM constituents. Accordingly, since ECM has a major influence on tissue mechanical properties, microscale transport-processes highly affect arterial macroscale mechanics. In particular, the effects of possible imbalance of cell-cell signalling pathways on arterial mechanics are analysed. As an example, Fig. 2 shows the influence of an inflammatory state, simulated by an increased concentration of MMPs, on the mechanical response of the tissue affected by remodelling process.
Fig. 1: Numerical case study defined on a portion of thoracic aorta affected by atherosclerotic plaques. !! : coefficient diffusion; ℂ! : fourth order stiffness tensor (k = a for arterial tissue; k = p for atherosclerotic plaque).
Fig. 2: Distribution in the arterial thickness of: (left) concentration of MMPs as a result of molecular transport process, (right) circumferential strain !! as a result of mean blood pressure load after remodelling process.
IV. CONCLUSION
This work presents a multiphysics computational strategy for the modelling of arterial mechanics, of transport processes, and of the two-way interaction between mechanics and transport. As a matter of fact, the proposed computational approach represents a novel tool for elucidating the closed-loop system represented by arterial biochemical environment, histological remodelling mechanisms, and arterial compliance.
This strategy, in conjunction with appropriately designed experiments, would open to a novel insight on the onset and progression of arterial diseases, with a better understanding
on the original pathological cause. Thereby, it promises novel and ground-breaking results for in silico medicine. For instance, proposed framework can be employed to quantitatively analyse the protective role of TGF-β, whose increased production might represent an internal feedback mechanism or be a consequence of a pharmacological treatment [6].
ACKNOWLEDGEMENT
D. Bianchi and G. Vairo acknowledge the Italian Minister of University and Research, MIUR (Program: “Consolidate the Foundations 2015”; Project: BIOART; Grant number (CUP): E82F16000850005). M. Marino acknowledges that this work has been carried out within the framework of the SMART BIOTECS alliance between the Technical University of Braunschweig and the Leibniz University of Hannover. This initiative is financially supported by the Ministry of Economy and Culture (MWK) of Lower Saxony, Germany.
REFERENCES [1] J.B. Michel, O. Thaunat, X. Houard, O. Meilhac, G. Caligiuri, A.
Nicoletti, “Topological Determinants and Consequences of Adventitial Responses to Arterial Wall Injury”, Arterioscler. Thromb. Vasc. Biol., vol. 27(6), pp. 1259-1268, 2007.
[2] F. Maceri, M. Marino, G. Vairo, “Age-Dependent Arterial Mechanics via a Multiscale Elastic Approach”, Int. J. Comp. Meth. Engrg. Science Mech, vol. 14, pp. 141-151, 2013.
[3] M. Marino, ,G. Pontrelli, G. Vairo, P. Wriggers, “Coupling microscale transport and tissue mechanics: modeling strategies for arterial multiphysics”, Micro. Transport Model Bio Proc, to appear.
[4] S.G. M. Uzel and M.J. Buehler, “Molecular structure, mechanical behavior and failure mechanism of the C-terminal cross-link domain in type I collagen”, J Mech Behav Biomed Mat, vol. 4, pp. 4153-161, 2011.
[5] F. Maceri, M. Marino, G. Vairo, “A unified multiscale mechanical model for soft collagenous tissues with regular fiber arrangement”, J Biomech., vol. 43, pp. 355-363, 2010.
[6] J. Dai, S. Michineau G. Franck G, Desgranges, J.P. Becquemin, M. Gervais, E. Allaire, “Long term stabilization of expanding aortic aneurysms by a short course of cyclosporine a through transforming growth factor-beta induction”, PloS one, vol. 6, pp. e28903, 2011.
Proceedings VII Meeting Italian Chapter of the European Society of Biomechanics (ESB-ITA 2017) 28-29 September 2017, Rome - Italy
46
ISBN: 978-88-6296-000-7

Proceedings VII Meeting Italian Chapter of the European Society of Biomechanics (ESB-ITA 2017) 28-29 September 2017, Rome - Italy
47
ISBN: 978-88-6296-000-7

Proceedings VII Meeting Italian Chapter of the European Society of Biomechanics (ESB-ITA 2017) 28-29 September 2017, Rome - Italy
48
ISBN: 978-88-6296-000-7

Abstract—Arterial stiffening is well-established as a powerful predictor of cardiovascular diseases. However, arterial stiffening is rarely associated with extracellular matrix changes in arterial tissue. In this study, we present localized nanomechanical properties in the human internal mammary artery (IMA) along with collagen fibril morphology in patients with low and high pulse wave velocity (PWV). The samples were measured using atomic force microscopy (AFM) with the PeakForce Quantitative Nanomechanical Mapping (PF-QNM) technique. We found strong associations between the morphology of arterial collagen fibrils, nanoscale mechanical properties and PWV. Keywords—Arterial stiffening, Pulse wave velocity, collagen
fibrils, Atomic force microscopy.
I. INTRODUCTION RTERIAL stiffening, or arteriosclerosis, occurs as part ofthe natural aging process of the artery has been wellstudied at macroscale. However, little is known about
changes in extracellular matrix (ECM) in arterial tissue. Recently, biomechanical properties of vascular stiffening have been studied at microscale by using nanoindentation [1] and scanning acoustic microscopy (SAM) [2], however changes of specific components of arterial tissue are still poorly documented. Atomic force microscopy (AFM) has been widely used to determine surface morphology of a variety of biological samples such as bone [3], skin, articular cartilage, intervertebral disc, epicardium [4]. PeakForce Quantitative Nanomechanical Mapping (PF-QNM) as a new AFM based model was introduced to map surface morphology and mechanical properties by recorded force curves at nanoscale [5]. More important, as the most widespread protein in the body, collagen fibrils not only maintain the tissue integrity but also provide tough mechanical properties for tissues. [6] Although collagen fibrils in various connect tissues, including dermis, tendon and bone, were evaluated [6], study of changes in arterial collagen fibrils is scant. In this study, localized mechanical properties and surface morphology of tunica media and tunica adventitia in human internal mammary (IMA) were explored using AFM, thus disclosed associations between changes in arterial tissue and pulse wave velocity.
II. METHODS
Human internal mammary arteries were collected during coronary artery bypass grafting (CABG) and provided by Centre of Individualized Medicine in Arterial Diseases (CIMA) (Odense University Hospital, Odense, Denmark) Prior to CABG, patients were assessed by carotid-femoral pulse wave velocity (PWV). The arterial tissue was gathered immediately after surgery and formalin-fixed (approximately 24 hours in 4% buffered paraformaldehyde) and embedded in optical cutting temperature (OCT) compound (Tissue-Tek Sakura Finetek, The Netherlands) and immediately frozen at -80 °C after snap freezing. The unfixed, frozen sample was then cryosectioned to a nominal thickness of 5 Pm using a Leica CM1850 cryostat (Leica Microsystems (UK) Ltd, Milton Keynes) and stored in a -80 °C freezer. All cross-sections were carried out in ambient condition by using a MultiMode8 atomic force microscopy (AFM) (Bruker, Nano Surfaces Division, Santa Barbara, USA) with Bruker RTESPA-150 probe (nominal tip radius 8nm, force constant 8 N/m, resonance frequency 150 kHz) and morphological properties of the collagen fibrils were analysed via ImageSXM (version 1.97).
All date was presented as means±SEM. Mean elastic modulus of arterial tissues and morphological properties were tested using student t-test.
III. RESULTS 16 patients were split into high PWV (13.6±1.1ms-1) and low (8.5±0.3ms-1) PWV groups (t-test, P<0.001). The media and adventitia had high elastic modulus values in the high PWV group (Figure 1). In the adventitial layer, abundant collagen fibrils were observed which were highly orientated in both groups (Figure 2). The collagen fibril diameters were found to be higher in the high PWV group (Low PWV=117.23±22.19nm, High PWV=119.18±21.96nm, P<0.001) (Figure 3).
Nanoscale characterisation of human internal mammary artery with high pulse wave velocity
Z. Chang1, M. L. Hansen2, 3, PY. Chen4 and P. Paoletti5, L. M. Rasmussen3 and R. Akhtar1
1 Department of Mechanical Materials and Aerospace Engineering, School of Engineering University of Liverpool, Liverpool, L69 3GH UK;[email protected]
2 Department of Cardiothoracic and Vascular Surgery, Odense University Hospital, Denmark; [email protected] 3 Department of Clinical Biochemistry and Pharmacology, Centre of Individualized Medicine In Arterial Diseases (CIMA),
Centre for Clinical Proteomics, Odense University Hospital, Odense, Denmark; email: [email protected] 4 Department of Materials Science and Engineering, National Tsing Hua University, Hsinchu,
Taiwan; [email protected] 5 Centre for Engineering Dynamics, School of Engineering, University of Liverpool, Liverpool, L69 3GH, UK;
A
Proceedings VII Meeting Italian Chapter of the European Society of Biomechanics (ESB-ITA 2017) 28-29 September 2017, Rome - Italy
49
ISBN: 978-88-6296-000-7

Figure1. Elastic modulus of the media (n=136) and adventitia (n=136) between low and high PWV groups, respectively.
Figure2. AFM height images of arterial collagen fibrils in adventitial layer in patients with low PWV (a) and high PWV (b).
Figure3. Diameter of collagen fibrils: There were 3084 and 3911 measurements in the low and high PWV group, respectively.
IV. CONCLUSION
Nanomechanical properties in arterial tissue associated with carotid-femoral PWV. Collagen fibril diameter was found to be higher in patients with high PWV. Nano-scale changes in the IMA are therefore indicative of systematic changes in arterial stiffness in the vasculature.
ACKNOWLEDGEMENT The authors would like to thank Odense University Hospital,
Denmark for providing the arterial tissue for the study. Zhuo Chang is funded by a University of Liverpool and National Tsing Hua University and Dual PhD studentship.
REFERENCES [1] A. Hemmasizadeh, M. Autieri, and K. Darvish, ‘Multilayer material
properties of aorta determined from nanoindentation tests.’, J. Mech. Behav. Biomed. Mater., vol. 15, pp. 199–207, Nov. 2012.
[2] H. K. Graham, R. Akhtar, C. Kridiotis, B. Derby, T. Kundu, A. W. Trafford, and M. J. Sherratt, ‘Localised micro-mechanical stiffening in the ageing aorta.’, Mech. Ageing Dev., vol. 132, no. 10, pp. 459–67, Oct. 2011.
[3] J. M. Wallace, ‘Applications of atomic force microscopy for the assessment of nanoscale morphological and mechanical properties of bone’, Bone, vol. 50, no. 1, pp. 420–427, 2012.
[4] H. K. Graham, N. W. Hodson, J. a Hoyland, S. J. Millward-Sadler, D. Garrod, A. Scothern, C. E. M. Griffiths, R. E. B. Watson, T. R. Cox, J. T. Erler, A. W. Trafford, and M. J. Sherratt, ‘Tissue section AFM: In situ ultrastructural imaging of native biomolecules.’, Matrix Biol., vol. 29, no. 4, pp. 254–60, May 2010.
[5] T. J. Young and M. A. Monclus, ‘The use of the Peak Force Quantitative Nanomechanical Mapping AFM-based method for high-resolution Young’s modulus measurement of polymers’, J. Chem. Inf. Model., vol. 53, no. 9, pp. 1689–1699, 2013.
[6] M. Fang, E. L. Goldstein, A. S. Turner, C. M. Les, B. G. Orr, G. J. Fisher, K. B. Welch, E. D. Rothman, and M. M. Banaszak Holl, ‘Type i collagen D-spacing in fibril bundles of dermis, tendon, and bone: Bridging between nano- and micro-level tissue hierarchy’, ACS Nano, vol. 6, no. 11, pp. 9503–9514, 2012.
Proceedings VII Meeting Italian Chapter of the European Society of Biomechanics (ESB-ITA 2017) 28-29 September 2017, Rome - Italy
50
ISBN: 978-88-6296-000-7

GENERAL SESSION
Cardiovascular Devices and Treatments


Abstract— NiTinol peripheral stents fatigue behaviour is widely investigated in literature by numerical analyses. Simulations provide a valuable support for design with several advantages, but the NiTi material characteristics, often limited or unavailable, have to be specifically reproduced in order to obtain reliable results. The present work proposes a methodology based on surrogate-assisted optimization methods, to obtain the material properties from experiments directly on the stent. The application of the method gives robust results in the identification of the correct material properties in improving the reliability of numerical study on NiTi stents. Keywords— Cardiovascular, NiTinol, Stent, Optimisation.
I. INTRODUCTION ITINOL (NiTi) peripheral stents are widely used forendovascular treatment of peripheral artery disease.
However, the peripheral vascular district is characterized by complex movements which impose cyclic multi-axial loadings to the implanted device that may result in stent failure due to fatigue [1]. Finite Element (FE) analysis can be a powerful method to assess the state of stress of the device in a specific loading condition and is widely employed in academia and industry [2, 3]. To obtain reliable predictions, both the in-vivo loading conditions and specific device characteristics (in terms of geometry and material properties) must be modelled accurately [4, 5]. Whereas the geometry of the device can be obtained by optical measurements, the information about material properties is often limited and difficult to estimate. Indeed, NiTi material behaviour is strictly dependent on the alloy composition and the manufacturing treatments. In literature, a range of parameters for the material model are reported and these characteristics deeply affect the stent’s global and local behaviour. The present work proposes a methodology, based on surrogate-assisted optimization methods [6, 7], to obtain the parameters for the Shape Memory Alloy (SMA) model, available in ANSYS [8], from experimental tests on the stent. The methodology has been developed for a virtual case study on a reference geometry with NiTi material made in-house and then validated on experimental tests conducted on real stents of the same geometries and material, where variability and experimental noise could be present.
II. MATERIALS AND METHODS
A. Numerical analysis: Stent FE Model, Boundary conditions & NiTinol material
The geometrical design chosen for the reference virtual case study is a peak-to-peak design. The reference stent
geometry, as the most of the peripheral stent geometries, is made by a functional unit that is repeated circumferentially and axially to obtain the whole stent. To simplify the model and to reduce the computational cost, the analyses have been made on this functional unit (Figure 1a). A comparison between the whole stent and the unit has been made to establish the accuracy of the model results. A cycle of axial tensile loading and releasing has been chosen as numerical simulation on the stent functional unit. A NiTi biomedical material made by our LaBS group, studied experimentally and implemented in the ANSYS constitutive material (9 parameters: EA, v (constant=0.3), σSAS, σFAS, σSSA, σFSA, εL, α, EM) [8] has been chosen for the virtual reference case study.
B. Physical behaviour: Analysis of the mechanical stent axial behaviour The mechanical behaviour of the stent unit when subjected to an axial loading and releasing has been analysed and three different phases, describing the nonlinear NiTi characteristic, have been highlighted (Figure 1b). In the first phase the stent behaviour is linear elastic, involving EA. In the second phase the stent stiffness decreases, the material starts the transformation on the upper plateau involving σ SAS, σ FAS, ε, α. In the third phase the behaviour is firstly linear and then it starts the transformation on the lower plateau, involving EM, σ SSA, σ FSA. Each of these three phases, in term of force in time, will be the input (measurement) for the identification method.
Figure 1 – Stent geometry and functional unit FE model (a); The mechanical behaviour of the stent unit model when axially loaded and released (b).
C. Parameters identification through optimization process The surrogate-assisted optimization process is decomposed in to the aforementioned three phases to separately estimate the parameters affecting each phase. The process starts by defining the lower and upper bounds for all the parameters based on literature (Table I). Then, for each phase, the parametric space is sampled through the quasi-random space-filling SOBOL sequence. Each sample point is numerically analysed in an FE simulation and a loss function (L2 error) between the reference behaviour and the behaviour of the stent with material properties corresponding to the sample is calculated. The loss function is then used to construct a
Identification of NiTi Stent Material Parameters Through Surrogate-assisted Optimisation
D. Allegretti1, F. Berti1, L. Petrini2, G. Pennati1, P. Nithiarasu3 and S. Pant3
1 Laboratory of Biological Structure Mechanics (LaBS), DCMIC, Politecnico di Milano, Italy; email:[email protected] 2 Department of Civil and Environmental Engineering, Politecnico di Milano, Milan, Italy;
3 Zienkiewicz Centre for Computational Engineering, Swansea University, Wales (UK);
N
Proceedings VII Meeting Italian Chapter of the European Society of Biomechanics (ESB-ITA 2017) 28-29 September 2017, Rome - Italy
53
ISBN: 978-88-6296-000-7

Gaussian Process (GP) surrogate model (often referred to as a Kriging model in literature) [7]. The GP model is then searched (minimised) using a genetic algorithm (GA) followed by an L-BFGS descent from the best point predicted by the GA. The final solution, with the lowest loss function, is taken as an estimate of the parameters.
III. RESULTS
The method predictions, about the development of the method on the virtual case study, have been evaluated by comparison between the parameters identified and the reference values through several measures: the error between values in a normalized space (Table I); the material behaviours in terms of stress-strain curve (Figure 2); the stent global static behaviour in terms of force over displacement (Figure 3); the stent fatigue local behaviour in terms of first principal mean strain and equivalent alternate strain for an exampling loading conditions (Figure 4). The results highlight a high predictivity of the methodology with low errors (< 10% in the parameters values) in all the evaluations.
TABLE I ERROR BETWEEN MATERIAL PARAMETERS VALUES IN A NORMALIZE SPACE
Type EA σ SAS σ FAS σ SSA σ FSA ε L α EM
Reference 0.36 0.1 0.414 0.5 0.091 0.32 1 0.173
Identified 0.3541 0.0856 0.4097 0.5591 0.1729 0.3475 1 0.1484
Error 0.016 0.0144 0.0043 0.0592 0.0819 0.0275 0 0.0246
Figure 2 – The mechanical Stress-Strain static behavior of the material for the reference and the identified values.
Figure 3 - The static behavior of the stent functional unit has been analyzed with the reference and the identified material. A good agreement is showed.
Figure 4 – The fatigue behavior for an example loading case has been analyzed for the reference and the identified material. The comparison shows
a good match between fatigue predictions.
IV. EXTENSIONS
The method described has been applied to an experimental case study to validate its effectiveness. Stent specimens in-house-made by our group at LaBS with the same material and same peak-to-peak geometry considered for the virtual case have been tested under axial tension in a temperature controlled chamber (Figure 5a). The experimental outcomes have been used as input for the identification method performed as explained above. Unlike the virtual case the experimental data (Figure 5b) are affected by experimental variability induced by possible slight differences in the stent structures and experimental noises.
Figure 5 – Experimental axial test on the stent sample(a); Experimental mechanical behaviour of 2 stent samples axially loaded and realesed(b).
V. CONCLUSION The work proposes a new and robust methodology able to
identify the NiTi material parameters directly from the stent using optimization algorithm. The use of this method gives an improvement on the reliability of the numerical study on NiTi peripheral stent when a stent sample is available for experimental tests. At the moment the experimental validation analyses are promising and still ongoing.
VI. ACKNOWLEDGEMENT
This work is partially funded by Engineering and Physical Sciences Research Council (EPSRC) Delivery Plan (EP/P511249/1).
REFERENCES [1] Ansari, F., L. Pack, S. Brooks and T. Morrison. Design considerations
for studies of the biomechanical environment of the femoropopliteal arteries. J. Vasc. Surg. 58:804-813, 2013.
[2] Meoli, A., E. Dordoni, L. Petrini, F. Migliavacca, G. Dubini and G. Pennati. Computational study of axial fatigue for peripheral Nitinol stens. J. Mater. Eng. Perform. 23:2606-2613, 2014.
[3] Grujicic, M., Pandurangan, B., Arakere, A., and Snipes, J., 2012, “Fatigue life computational analysis for the self-expanding endovascular nitinol stents”, J. Mater. Eng. Perform., 21, pp. 2218–2230.
[4] Petrini, L., Trotta, A., Dordoni, D., Migliavacca, F., Dubini, G., et al.,2’16, “A Computational Approach for the Prediction of Fatigue Behaviour in Peripheral Stents: Application to a Clinical Case”, Ann Biomed Eng, 44: 536.
[5] Conti, M., Marconi, M., Campanile, G., Reali, A., Adami, D., et al. 2017, “Patient-specific finite element analysis of popliteal stenting”, Meccanica, 52: 633. doi:10.1007/s11012-016-0452-9
[6] Pant, S., Limbert, G., Curzen, N.P., Bressloff, N.W., 2011, “Multiobjective design optimisation of coronary stents”, Biomaterials 32 (31), 7755-7773.
[7] Forrester AIJ, S bester A, Keane AJ. Engineering design via surrogate modelling: a practical guide. Chichester: Wiley; 2008.
[8] ANSYS mechanical APDL material reference, Shape Memory alloy (SMA) material models (3.19)
Proceedings VII Meeting Italian Chapter of the European Society of Biomechanics (ESB-ITA 2017) 28-29 September 2017, Rome - Italy
54
ISBN: 978-88-6296-000-7

Abstract— Nickel–titanium alloys are adopted for minimally invasive endovascular devices which are subjected to cyclic loads that can induce fatigue fracture. They may also be subjected to large deformations due to crimping procedure that can induce material yielding. Recently, the authors developed a new constitutive model that considers inelastic strains due to not-completed reverse phase transformation or/and plasticity and their accumulation. The model is implemented in the finite element code ABAQUS/Standard and used to study the mechanical behaviour of a percutaneous aortic valve during a durability test. Keywords—Nickel-Titanium constitutive model,
cardiovascular devices, fatigue, permanent plasticity.
I. INTRODUCTION
ICKEL-TITANIUM alloys (NiTi) are commonly used in the production of cardiovascular devices for mini-
invasive applications due to their superelastic properties [1]. In particular, vascular stents and percutaneous valves require a first pre-operative crimping, in which the diameter is reduced to fit the dimension of the catheter used for deployment. This procedure introduces large strains that, depending on the crimping entity, the material properties and the device design, may cause plasticity in NiTi [2]. This may also affect the device response during cyclic loading induced by leg or heart movements. For a reliable prediction of device efficacy a correct description of this phenomenon is necessary. In this work a new constitutive model for NiTi, able to consider both inelastic strains due to plasticity and fatigue phenomena is validated with experimental results and used to simulate cardiovascular devices. The aim is to show how considering or not plastic effects and their influence on the fatigue behavior may significantly affect the outputs of the analysis and hence it may lead to inaccurate estimation of device performance.
II. MATERIALS AND METHODS
A. Material characterization Experimental uniaxial tensile tests were conducted on biomedical NiTi wires of 1.2 mm diameter with a MTS/2M machine at environmental temperature equals to 23° (not austenitic, phase R). The usage of an extensometer on a central portion allowed to obtain a strain driven test combined with an imposed crosshead displacement of 0.25 mm/min. 20 cyclic loading-unloading tests were performed at different deformations (4%, 7%, 8%). Further tests studied the material post-yielding behaviour and how temperature affects yielding threshold. Cylindrical tubes (external diameter 2.16 mm, inner diameter 1.7 mm) were tested thanks to servo hydraulic MTS858MiniBionix. 15 uniaxial
loading-unloading cycles were conducted at different strain levels (5%, 8%, 10%, and 12%).
B. Constitutive model A new constitutive model has been formulated starting from the already implemented Souza-Auricchio-Petrini model [3] [4] [5] and the modifications proposed by Auricchio et al. [6] and Barrera et al. [7]. This new model, able to consider both fatigue and plasticity, has been formulated and implemented in the ABAQUS code.
C. TAVI simulation The stent frame of a TAVI device was modelled in ABAQUS. Material parameters from experimental tests were used as input. All the procedure was simulated with plasticity activated and then deactivated. A first step reproduced the crimping phase up to the catheter diameter (about 8 mm) followed by a free recovery by using a rigid cylindrical surface, in order to detect inelastic strain effects during the procedure. Proper contact properties were applied. A second step aimed at mimicking the durability test described by Wu et al. [8]: after crimping the device self-expand into a silicone cylindrical chamber (external diameter 19 mm, thickness 3 mm), modelled as a simple linear elastic material (Fig. 1). The last step consisted in the application of a pressure gradient of 100 mmHg due to systolic and diastolic phases; this allowed for a diameter reduction during diastole which causes further loadings on the device structure.
III. RESULTS
Numerical model of a TAVI prototype device with plasticity deactivated exhibited very high stresses, almost exceeding material failure point, while its activation lowered the peaks of about 300 MPa, leaving residual strains at release (Fig. 2). During the cyclic loading maximum absolute values are reached during pressure removal and the minimum value is reached when the pressure is 100 mmHg. By activating fatigue and plasticity strain values are almost doubled, while in terms of stresses there is a transition between tension and compression (Fig. 2). The presence of residual strain altered the device diameter and so the oversizing and radial force on the wall.
IV. CONCLUSIONS
Nickel-Titanium alloys are widely used for cardiovascular devices but there are some modelling issues not well treated so far. Here a validated model for NiTi is proposed for simulating a TAVI prototype, easily adaptable to other clinical devices and materials. Plasticity plays an important role severely modifying the state of stress of the device with respect to the elastic case; in some regions stress may pass
The Role of Inelastic Deformations in the Mechanical Response of Endovascular Nickel-Titanium Devices
Francesca Berti1, Alessandro Bertini1, Dario Allegretti1, Giancarlo Pennati1, Francesco Migliavacca1, Lorenza Petrini2
1 Laboratory of Biological Structure Mechanics (LaBS), DCMIC, Politecnico di Milano, Italy; e-mail:[email protected] Department of Civil and Environmental Engineering, Politecnico di Milano (Italy)
N
Proceedings VII Meeting Italian Chapter of the European Society of Biomechanics (ESB-ITA 2017) 28-29 September 2017, Rome - Italy
55
ISBN: 978-88-6296-000-7

from compression to tension when plasticity is activated, with consequent wrong estimate on the fatigue performance. Those aspects highlight the importance of using a suitable constitutive model according to the specific application. Further investigations are ongoing.
Figure 1. Valve (a) in the fully expanded configuration, (b) at the end of the crimping, (c) at the end of the self-expansion and (d) inside the silicone tube [9].
Figure 2. σ-ε curves of TAVI device most stressed element during its shape recovery in the silicone tube: above the plasticity deactivated model, below the plasticity activated one. Right side shows the σ-ε curves corresponding to the step of pressure removal in the two cases [9].
ACKNOWLEDGEMENT
The authors would like to acknowledge the group at the Department of Cardiovascular Engineering, Institute of Applied Medical Engineering, Helmholtz-Institute, RWTH Aachen University, Aachen, Germany for the work done together when studying the in vitro behavior of the valve used in this study. The authors would like to acknowledge Dr. Elena Villa and Dr. Adelaide Nespoli from National Research Council-ICMATE, Lecco, Italy for the contribution in experimental tests.
REFERENCES [1] Duerig T. et al. An overview of nitinol medical applications. Materials Science and Eng. A273-275 (1999) 149-160 [2] Petrini L. et al. Simplified multi-stage computational approach to assess the fatigue behavior of a NiTi transcatheter aortic valve during in vitro tests: a proof-of-concept study. Journal of Medical Devices (2017) [3] Souza A. C. et al. A three-dimensional model for solid undergoing stress-induced phase transformations. European Journal of Mechanics A/Solids 17 789-806 (1998) [4] Auricchio F. and Petrini L. Improvements and algorithmical considerations on a recent three-dimensional model describing stress-induced solid phase transformation. International Journal for Numerical Methods in Engineering 55 1255-1284 (2002) [5] Auricchio F. and Petrini L. Three-dimensional model describing stress-induced solid phase transformations: solution algorithm and boundary value problems. International Journal for Numerical Methods in Engineering 61 807-836 (2004) [6] Auricchio F. A macroscopic 1d model for shape memory alloys including asymmetric behaviors and transformation-dependent elastic properties. Computer Methods in Applied Mechanics and Engineering 198 1631-1637 (2009) [7] Barrera N. et al. Macroscopic modeling of functional fatigue in shape memory alloys. European Journal of Mechanics A/Solids 45 101-109 (2014) [8] Wu W. et al. Fluid structure interaction model of a percutaneous aortic valve: comparison with an in vitro test and feasibility study in a patient-specific case. Ann. Biomed Eng. 44(2) 590-603 (2016) [9] Petrini L. et al. The role of inelastic deformations in the mechanical response of endovascular shape memory alloy devices. J. Engineering in Medicine 1-14 (2017)
Proceedings VII Meeting Italian Chapter of the European Society of Biomechanics (ESB-ITA 2017) 28-29 September 2017, Rome - Italy
56
ISBN: 978-88-6296-000-7
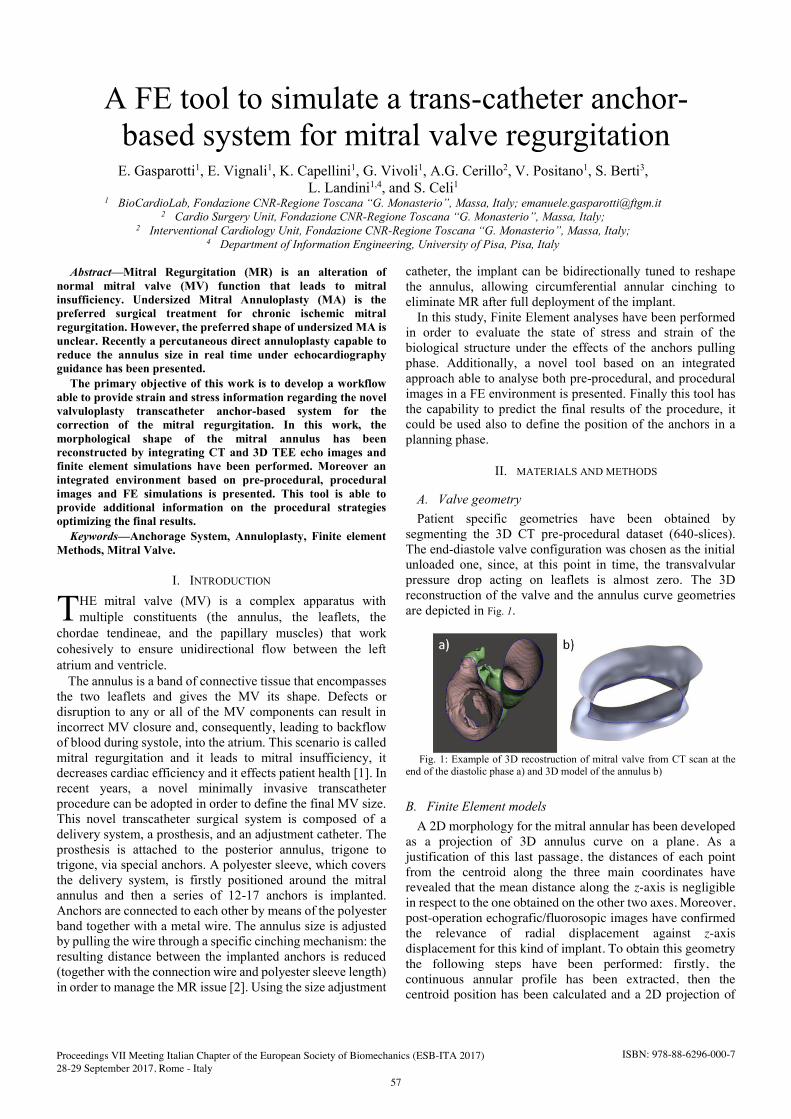
Abstract—Mitral Regurgitation (MR) is an alteration of normal mitral valve (MV) function that leads to mitral insufficiency. Undersized Mitral Annuloplasty (MA) is the preferred surgical treatment for chronic ischemic mitral regurgitation. However, the preferred shape of undersized MA is unclear. Recently a percutaneous direct annuloplasty capable to reduce the annulus size in real time under echocardiography guidance has been presented.
The primary objective of this work is to develop a workflow able to provide strain and stress information regarding the novel valvuloplasty transcatheter anchor-based system for the correction of the mitral regurgitation. In this work, the morphological shape of the mitral annulus has been reconstructed by integrating CT and 3D TEE echo images and finite element simulations have been performed. Moreover an integrated environment based on pre-procedural, procedural images and FE simulations is presented. This tool is able to provide additional information on the procedural strategies optimizing the final results. Keywords—Anchorage System, Annuloplasty, Finite element
Methods, Mitral Valve.
I. INTRODUCTION HE mitral valve (MV) is a complex apparatus withmultiple constituents (the annulus, the leaflets, the
chordae tendineae, and the papillary muscles) that work cohesively to ensure unidirectional flow between the left atrium and ventricle.
The annulus is a band of connective tissue that encompasses the two leaflets and gives the MV its shape. Defects or disruption to any or all of the MV components can result in incorrect MV closure and, consequently, leading to backflow of blood during systole, into the atrium. This scenario is called mitral regurgitation and it leads to mitral insufficiency, it decreases cardiac efficiency and it effects patient health [1]. In recent years, a novel minimally invasive transcatheter procedure can be adopted in order to define the final MV size. This novel transcatheter surgical system is composed of a delivery system, a prosthesis, and an adjustment catheter. The prosthesis is attached to the posterior annulus, trigone to trigone, via special anchors. A polyester sleeve, which covers the delivery system, is firstly positioned around the mitral annulus and then a series of 12-17 anchors is implanted. Anchors are connected to each other by means of the polyester band together with a metal wire. The annulus size is adjusted by pulling the wire through a specific cinching mechanism: the resulting distance between the implanted anchors is reduced (together with the connection wire and polyester sleeve length) in order to manage the MR issue [2]. Using the size adjustment
catheter, the implant can be bidirectionally tuned to reshape the annulus, allowing circumferential annular cinching to eliminate MR after full deployment of the implant.
In this study, Finite Element analyses have been performed in order to evaluate the state of stress and strain of the biological structure under the effects of the anchors pulling phase. Additionally, a novel tool based on an integrated approach able to analyse both pre-procedural, and procedural images in a FE environment is presented. Finally this tool has the capability to predict the final results of the procedure, it could be used also to define the position of the anchors in a planning phase.
II. MATERIALS AND METHODS
A. Valve geometry Patient specific geometries have been obtained by
segmenting the 3D CT pre-procedural dataset (640-slices). The end-diastole valve configuration was chosen as the initial unloaded one, since, at this point in time, the transvalvular pressure drop acting on leaflets is almost zero. The 3D reconstruction of the valve and the annulus curve geometries are depicted in Fig. 1.
Fig. 1: Example of 3D recostruction of mitral valve from CT scan at the end of the diastolic phase a) and 3D model of the annulus b)
B. Finite Element models A 2D morphology for the mitral annular has been developed
as a projection of 3D annulus curve on a plane. As a justification of this last passage, the distances of each point from the centroid along the three main coordinates have revealed that the mean distance along the z-axis is negligible in respect to the one obtained on the other two axes. Moreover, post-operation echografic/fluorosopic images have confirmed the relevance of radial displacement against z-axis displacement for this kind of implant. To obtain this geometry the following steps have been performed: firstly, the continuous annular profile has been extracted, then the centroid position has been calculated and a 2D projection of
A FE tool to simulate a trans-catheter anchor-based system for mitral valve regurgitation
E. Gasparotti1, E. Vignali1, K. Capellini1, G. Vivoli1, A.G. Cerillo2, V. Positano1, S. Berti3, L. Landini1,4, and S. Celi1
1 BioCardioLab, Fondazione CNR-Regione Toscana “G. Monasterio”, Massa, Italy; [email protected] 2 Cardio Surgery Unit, Fondazione CNR-Regione Toscana “G. Monasterio”, Massa, Italy;
2 Interventional Cardiology Unit, Fondazione CNR-Regione Toscana “G. Monasterio”, Massa, Italy; 4 Department of Information Engineering, University of Pisa, Pisa, Italy
T
Proceedings VII Meeting Italian Chapter of the European Society of Biomechanics (ESB-ITA 2017) 28-29 September 2017, Rome - Italy
57
ISBN: 978-88-6296-000-7

the annular profile has been assumed. Finally, a planar surface is obtained from the projection by adding a homothetic transformation in order to better emulate the tissue-anchor system. The geometry has been meshed with 1385 linear triangular elements using Delaunay triangulation method. The material properties have been assumed isotropic, with Young’s Module equal to 2.4 MPa and Poisson’s ratio equal to 0.49.
During the pulling phase the resulting distance between the implanted anchors is reduced therefore, the total length of wire decreases. In addition, the wire, anchored at the ends, slides through the intermediate anchors through polyester sleeve. This behaviour in the study has been simplified considering only one cable that can slide through anchors. The model of metal cable has been developed assuming, in accordance with classical cable theory, that has zero flexural rigidity, that the cable is either inextensible and that external loads, applied by anchors on cable, are modelled in the form of point loads. Therefore, the shape of the cable is discontinuous and it is a polygonal chain. An equations system has been implanted and developed in Matlab to simulate the interaction between all the elements (anchors, cable and annulus) during the pulling phase. These implemented equations are:
x equilibrium equations of each portion cable at theintermediate anchor’s point;
x equilibrium equations of the portion cable at the ends;x equation of sliding conditions;x equation of final cable’s length;x compatibility equations of wire-annulus interactions.
C. Finite Element simulation In order to define the initial polygonal shape of the cable, a
series of 17 anchors (according to clinical procedure) has been selected on the annulus geometry. Fig. 2 depicts the FE model with boundary conditions. A parallel solution between the constitutive cable equations and the finite element equations has been performed with MATLAB software, imposing a length cable-decreasing equal to 20 mm.
Fig. 2: FE model
III. RESULTS
Fig. 3 depicts, as example, the radial displacements on the projected annulus plane, due to the effects of cable cinching on the internal shape of the annulus. As expected, the maximum value of radial displacement is located in in the middle of the posterior leaflet (at about 90°) and a more elliptical shape has been assumed by the annulus. These results are in good agreements with the clinical results. From our simulations, a reduction of area equal to 26% and a maximum radial
displacement of about 5 mm have been obtained. The cable normal stress is equal to 4 N. The equivalent stress map in the annulus shows a peak at the position of the end anchors equal to 3.5 MPa, in these points there is also a peak of equivalent strain equal to 6 mm/mm. The maximum anchor force is equal to 4 N and it is located at the ends. These last results are in accordance with the clinical procedure due to the presence of fixed anchors at both ends.
Fig. 3: Example of radial displacements on the projected annulus plane (a), stain map (b), stress map (c) and plot of magnitude of the reaction forces on each anchors (d) with 3D CAD model of an anchor (e).
IV. CONCLUSIONS
We presented here a structural FE model of the MV correction that combines a description of valvular geometry and the tissues’ mechanical response with the modelling of annular contraction by using specific anchors. The work presented here in is a pilot study aimed at testing a new modelling approach and to the authors’ knowledge; this is the first time that this procedure has been investigated in a FE model. By adding features to the model, the annulus shape after implant adjustment could be defined in advance also by taking into account of the hyperelastic nature of the cardiac tissues. With this approach, it will be possible to evaluate the results of the procedure in a pre-planning phase; it will be possible to define the anchors position able to give the desired annulus’ deformed shape. This work poses the basis for more complex approaches that might allow the potential to foresee the post-procedure results.
ACKNOWLEDGMENT This research was supported by Regional ValveTech project
funding from Regione Toscana.
REFERENCES [1] J. M. Rabbah, N. Saikrishna, A. W. Siefert, A. Santhanakrishnan and A.
P. Yoganathan, "Mechanics of Healthy and Functionally Diseased Mitral Valves: A Critical Review," ASME. J Biomech Eng., vol. 135(2), pp. 021007-16., 2013.
[2] G. Nickenig, C. Hammerstingl, R. Schueler, Y. Topilsky, P. A. Grayburn, A. Vahanian, D. Messika-Zeitoun, M. Urena Alcazar, S. Baldus, R. Volker, M. Huntgeburth, O. Alfieri, A. Latib, G. La Canna, E. Agricola, A. Colombo, K.-H. Kuck, F. Kreidel, C. Frerker, F. C. Tanner, O. Ben-Yehuda and F. Maisano, "Transcatheter Mitral Annuloplasty in Chronic Functional Mitral Regurgitation 6-Month Results With the Cardioband Percutaneous Mitral Repair System," JACC: Cardiovascular Interventions, vol. 9, pp. 2039-2047, 2016.
x
y
ux=0 for x=0
Node fully constrained
cableanchor
a) b)
c) d) e)
Proceedings VII Meeting Italian Chapter of the European Society of Biomechanics (ESB-ITA 2017) 28-29 September 2017, Rome - Italy
58
ISBN: 978-88-6296-000-7

Abstract—The left atrial appendage (LAA) is a complex structure responsible for 90% of thrombus formation in patients with non-valvular atrial fibrillation. Our aim was to evaluate the feasibility of creating dynamic 3D LAA models from CT and US images, to be used in assessing of LAA anatomy and function and in assisting pre-operative planning. 3D LAA surface models were created for each cardiac phase; a custom plug-in software was developed to extract LAA anatomical and functional parameters directly from the 3D models. LAA parameters obtained by CT models were validated through comparison with the ones obtained using the gold standard technique, and a strong agreement between the two methods was found. LAA assessment by 3D models based method is feasible and 3D LAA surface models can be printed to support the preoperative evaluation or used for virtual procedure simulations and biomechanical characterization by finite element software. Keywords—left atrial appendage, 3D model, CT, 3D echo.
I. INTRODUCTION HE left atrial appendage (LAA) is a site responsible for
90% of thrombus formation in patients with non-valvular atrial fibrillation (NVAF) [1]. In case of NVAF and contraindications to anticoagulation therapy, the percutaneous LAA closure is a treatment strategy to reduce the cardioembolic risk. This procedure is particularly difficult because of LAA anatomical complexity. Previous studies investigated the LAA anatomy and function and their possible role in thrombus formation using different imaging modalities [2]-[4].
Our aim was to assess the feasibility of creating 3D STL (Stereo Lithography interface format) dynamic LAA models from CT and US images to extract LAA parameters and to improve the preoperative planning by 3D printing support.
II. METHODS
Two different imaging modalities were used for the volumetric LAA acquisition: ECG-gated cardiac CT and 3D intracardiac echocardiography (ICE). The gated CT acquisition was characterised by 10 phases. In order to synchronise the 4D US acquisition with the 4D CT dataset, the ICE image sequences were sub-sampled at 10 phases.
Two software were used for LAA segmentation and 3D surface models creation (3Mensio for CT images, 3DSlicer for ICE images). For each phase of the cardiac cycle, the corresponding 3D STL model was created. A custom plug-in software was developed in Matlab to measure LAA volume and LAA ostium area directly from the 3D surface models. LAA ejection fraction (LAAEF) was calculated to assess the
LAA motility. The 3D models based method for LAA parameters extraction was validated on 10 CT dataset from patients scheduled for percutaneous LAA closure procedure. For the validation, LAA ostium area and LAA volume in the LA systolic and diastolic phases were measured availing the Simpson’s method, the gold standard technique [5], by using Osirix software. The intra-observer reproducibility was assessed by Coefficient of Variation (CoV), both for 3D models based method and for gold standard technique. Agreement between methods was assessed by paired t-test.
A 3D LAA model from CT was printed to simulate the LAA closure procedure.
III. RESULTS
Generating 3D LAA models was feasible by using both CT and 3D ICE images, as shown in Fig.1. The higher anatomical accuracy of CT models made these more reliable for the 3D printing.
Fig.1 – LAA 3D surface models at the LA systolic and diastolic phases, from cardiac CT images (a, b) and from 3D ICE images (c, d).
Fig. 2 shows an example of LAA volume variation curves during the cardiac cycle, obtained by CT and US data. CT images analysis with the gold standard technique has validated the results given by our method, proving that the extraction of LAA reliable measurements directly from 3D LAA models is feasible. Validation results were summarised in Table I; the method we proposed had a better intra-observer reproducibility and a strong agreement with the gold standard technique. The availability of a 3D LAA model for each phase of cardiac cycle allowed the LAA motility evaluation. The LAAEF values obtained in this study were
3D left atrial appendage modelling: a multimodal imaging approach
G. Vivoli1, E. Gasparotti1, M. Rezzaghi2, M. Mariani2, V. Positano1, S. Berti2, L. Landini1,3, S. Celi1 1 BioCardioLab, Fondazione CNR – Regione Toscana “G. Monasterio”, Massa, Italy; email:[email protected]
2 Department of Interventional Cardiology, Fondazione CNR – Regione Toscana “G. Monasterio”, Massa, Italy 3 Department of Information Engineering, University of Pisa, Pisa, Italy
Ta)
c) d)
b)
Proceedings VII Meeting Italian Chapter of the European Society of Biomechanics (ESB-ITA 2017) 28-29 September 2017, Rome - Italy
59
ISBN: 978-88-6296-000-7

Fig.2 - LAA volume variation curve during a full cardiac cycle, obtained by 3D LAA models from CT (red) and US (blue) images.
compared to the ones concerning normal patients without NVAF or cardiovascular diseases reported in a previous work (55±17 %) [6]. The comparison has validated the hypothesis of the reduction of LAA contractile function in NVAF patients, hence reduced LAAEF could be considered as a risk factor in thrombus formation.
IV. CONCLUSION
The comparison with the gold standard technique has validated the 3D models based method we proposed, which proved to be able to measure LAA anatomical and functional parameters reliably. Generating 3D LAA models covering the entire cardiac cycle was feasible by using both CT and US images. The capability of working with different images sources plays an important role in the field of the interventional cardiology due to the possibility of fusing reconstructed 3D models with 2D angiographic images (Fig. 3a). Moreover, our multimodal approach allowed evaluating limits and advantages of the two imaging modalities. Although 3D echocardiography has the benefit of a greater time resolution, CT models are more suitable for 3D printing because of their greater anatomical accuracy. A 3D LAA model from CT was printed to simulate the LAA closure procedure (Fig. 3b) and it provided a tangible and accurate LAA reproduction, which assisted the choosing of the size and the position of the occluder device. Currently, simulation practice avails the 3D printing support, but future works will include the use of 3D LAA models for virtual simulation of LAA closure procedure by finite element (FE) software. FE simulations will be able to evaluate the wall overstretch in the
case oversizing of the device (Fig. 3c). The possibility of using 3D LAA models from both CT and US images for the future FE simulations is useful considering that the choice of the best modality for the LAA imaging is still an open topic. Finally, the difficulty of having available LAA histological data suggests the LAA biomechanical characterization by reverse engineering technique as a further future application of 3D LAA models.
Fig.3 – Example of XA-CT-ECHO image fusion (a); LAA closure procedure simulation by 3D printing support (b); 3D CAD model for LAA closure by means of finite element simulation (c).
ACKNOWLEDGEMENT This study was supported by the grant from Fondazione
Cassa di Risparmio di Carrara.
REFERENCES [1] R. Beigel, N. C. Wunderlich, S. Y. Ho, R. J. Siegel, “The left atrial
appendage: anatomy, function, and noninvasive evaluation,” JACC Cardiovascular Imaging, 2014, 7(12): 1251-65.
[2] A. Al-Issa, Y. Inoue, J. Cammin, Q. Tanq, S. Nazarian, E. K. Fishman, K. Taguchi, H. Ashikaga, “Regional function analysis of left atrial appendage using motion estimation CT and risk of stroke in patients with atrial fibrillation,” European Heart Journal – Cardiovascular Imaging, 2016, 17(7) : 788-96.
[3] R. Beinart, E. K. Heist, J. B. Newell, G. Holmvang, J. N. Ruskin, M. Mansour, “Left atrial appendage dimensions predict the risk of stroke/TIA in patients with atrial fibrillation,” J Cariovascular Electrophysiol, 2011, 22(1):10-5.
[4] G. Valocik, O. Kamp, M. Mihciokur, H. F. J. Mannaerts, Y. Li, S. Ripa, C. A. Visser, “Assessment of the left atrial appendage mechanical function by three-dimensional echocardiography,” Eur J Echocardiography, 2002, 3(3), 207-213.
[5] M. Taina, R. Vanninen, M. Hedman, P. Jakala, S. Karkkainen, T. Tapiola, P. Sipola, “Left atrial appendage volume increased in more than half of patients with cryptogenic stroke,” PLoS One, 2013, 8(11): e79519
[6] S. Boucebci, T. Pambrun, S. Velasco, P. O. Duboe, P. Ingrand, J. P. Tasu, “Assessment of normal left atrial appendage anatomy and function over gender and ages by dynamic cardiac CT,” European Radiology, 2016, 26 (5): 1512-20
TABLE I VALIDATION RESULTS
LAA parameters 3D models based method
Gold Standard method
3D models based method – BSA
normalized
Gold Standard method – BSA
normalized
3D models based
method - CoV
Gold Standard method - CoV p-value
Ostium Areamax 4.80 ± 1.66 cm2 4.77 ± 1.53 cm2 2.78 ± 1.16 cm2 2.76 ± 1.08 cm2 2.6% 4.1% 0.5045
Ostium Areamin 3.78 ± 1.72 cm2 3.79 ± 1.69 cm2 2.19 ± 1.13 cm2 2.20 ± 1.09 cm2 3.7 % 6.1% 0.8227
Volumemax 10.61 ± 5.17 cm3 10.55 ± 4.88 cm3 6.19 ± 3.67 cm3 6.19 ± 3.63 cm3 2.5% 5.2% 0.8319
Volumemin 7.51 ± 4.85 cm3 7.46 ± 4.71 cm3 4.39 ± 3.28 cm3 4.38 ± 3.27 cm3 2.6% 5.9% 0.7693
LAA EF 33 ± 16 % 33 ± 16 % 33 ± 16 % 33 ±16 % 6.2% 17.1% 0.9993
Ostium Areamax: LAA ostium area during the LA diastolic phase; Ostium Areamin: LAA ostium area during the LA systolic phase; Volumemax: LAA volume during the LA diastolic phase; Volumemin: LAA volume during the LA systolic phase; LAA EF: LAA ejection fraction; CoV: Coefficient of Variation to evaluate the intra-observer variability; p: p-value from paired t-test for the agreement between our method (3d models based) and the gold standard one.
a) b) c)
Proceedings VII Meeting Italian Chapter of the European Society of Biomechanics (ESB-ITA 2017) 28-29 September 2017, Rome - Italy
60
ISBN: 978-88-6296-000-7

Abstract—Percutaneous mitral valve (MV) interventions are gaining attention as an alternative to open-chest surgery in reducing mitral regurgitation (MR). Nonetheless, clip implantation can induce biomechanical alterations in the valve functioning, which can be related to sub-optimal outcomes or implant failure. Patient-specific finite element (FE) models, derived from cardiac magnetic resonance (CMR) imaging are herein exploited to quantify MV biomechanics after Mitraclip® implantation and elucidate the determinants of a well-performed procedure as well as the impact of a different level of precision during clip implantation on the MV outcomes.
Keywords—Mitral valve, Mitraclip®, Finite element Analysis.
I. INTRODUCTION ITRAL regurgitation (MR) is the most prevalent heartvalve disease in the Western population [1]. Among
possible surgical options, the edge-to-edge repair technique treats MR by suturing the leaflets together and creating a double-orifice valve [2]. The Mitraclip® device has recently emerged as the only available percutaneous strategy able to replace conventional open-chest surgery in high-risk patients [3]. However, despite its conceptual ease, the Mitraclip® implantation still represents a complex procedure, requiring skilled operators and experienced echocardiographists [4]; indeed, a demanding learning curve is necessary to effectively perform the procedure and acquire a high-quality level of implantation. We herein sought to exploit FE patient-specific models to gain further insight into the effects of the Mitraclip® procedure on MV biomechanics, pointing out the biomechanical implications of a suboptimal implantation encompassing clip mispositioning, partial MV leaflets grasping as well as leaflet misapposition.
II. MATERIAL AND METHODS
A male patient (57 years old) was submitted to preoperative cine CMR acquisition (TX Achieva 3.0T, Philips Medical System, Eindhoven, Netherlands) before undergoing surgical repair of posterior P2 prolapse due to primary chordal rupture. The end-diastolic MV geometrical model was reconstructed in MATLAB (The MathWorks Inc., Natick, MA, United States), after manual tracing of MV leaflets and inclusion of papillary muscles (PMs) tips and chordae tendineae [5]. MV prolapse defect was reproduced by removing marginal chordae according to intraoperative clinical evidence. Annular and PMs kinematics was reproduced consistently to cine CMR data.
All tissues were assumed homogeneous, non-linear and
elastic: leaflets mechanical response was described through the transversely isotropic constitutive model proposed by Lee [6]. Also, the hyperelastic response of chordae tendinae was reproduced fitting uniaxial test data from fresh porcine MVs [7]. To simulate the Mitraclip® implantation, the two arms of the clip were modelled as rigid rectangular plates and driven through ad hoc kinematic boundary conditions to reproduce the positioning of the device between the MV leaflets on the site of MV defect, and the final device deployment [5]. In particular, an optimal as well as several sub-optimal implantations (Fig. 1) were simulated reproducing a different level of precision in setting: i) Mitraclip® positioning, i.e. exactly on the site of MV defect or at a variable distance from it (1 and 2 arms width); ii) MV leaflets grasping, defined as complete, marginal or asymmetrical, respectively. For each scenario, the post-operative MV biomechanics was assessed throughout a cardiac cycle, prescribing a physiological time-dependent transvalvular pressure drop on the ventricular side of MV leaflets.
Fig. 1. FE tests on Mitraclip® implantations. All the simulations were run in the commercial solver ABAQUS/Explicit 6.10 (SIMULIA, Dassault Systèmes, Vélizy-Villacoublay). A general scale-penalty contact algorithm was adopted for MV leaflets while contact slippage and separation were prevented between MV leaflets and the Mitraclip® arms.
III. NUMERICAL RESULTS AND DISCUSSION
Regardless of the level of implant precision, MV coaptation area (CoA) improved at peak systole reporting a 30%-40%
Biomechanical Outcomes of the Mitraclip® Procedure: A Finite Element Analysis
F. Sturla1,2, O. A. Pappalardo1,3, M. Selmi1,3, F. Onorati3, G. Faggian3, E. Votta1 and A. Redaelli1
1 Department of Electronics, Information and Bioengineering, Politecnico di Milano, Milano, Italy 2 Laboratorio di Simulazione Computazionale e 3D, IRCCS Policlinico San Donato, San Donato Milanese, Italy
3 Division of Cardiovascular Surgery, Università degli Studi di Verona, Verona, Italy
M
Proceedings VII Meeting Italian Chapter of the European Society of Biomechanics (ESB-ITA 2017) 28-29 September 2017, Rome - Italy
61
ISBN: 978-88-6296-000-7

CoA recovery with respect to the prolapse configuration (CoA of 5.55 cm2), with a complete grasping on the site of defect representing the optimal option.
Fig. 2. MV coaptation and double-orifice areas.
During diastole, the Mitraclip® inherently induced a major reduction in the double-orifice area (DoA), which was overall equal to about 60%-70% of the preoperative MV orifice area. Of note, leaflets misapposition due to sub-optimal grasping did not impact on the MV double-orifice configuration, which remained almost symmetrical.
Fig. 3. MV leaflets mechanical stress.
The clip mispositioning, although not significantly altering the DoA entity, resulted in an asymmetrical double-orifice configuration (Fig. 2) and reached a 20%-80% DoA repartition when simulating a 2 arms-width clip mispositioning far from the actual site of MV defect. As concern MV maximum principal stress, at peak systole (Fig. 3), a common pattern of stress redistribution on MV leaflets was visible with high mechanical leaflet stress localized close to the clip; in this region, an asymmetrical grasping of the leaflets proved to increase mechanical stresses up +15% with respect to a complete grasping, although the stress magnitude remained overall below 400kPa. During diastole, a large extent of MV leaflets was unloaded and exhibited stress values largely below 100 kPa. Clip mispositioning promoted an increase in mechanical stress close to the clip arms.
IV. CONCLUSIONS
FE results confirm that MV biomechanics following the clipping procedure can be dependent on the proper execution of the grasping procedure as well as on the clip positioning, requiring accurate evaluation prior to clip delivery. Thus, echographic or fluoroscopic post-procedural evaluation of the implant is mandatory to confirm the proper positioning of the clip, independently from a good Doppler hemodynamic result. Hence, the biomechanical insight provided by patient-specific FE analysis may play a key role in elucidating the optimal setting of the procedure as well as in tackling current challenges of percutaneous MV repair strategies.
REFERENCES [1] V. T. Nkomo, J. M. Gardin, T. N. Skelton, J. S. Gottdiener, C. G.
Scott, M. Enriquez-Sarano, Burden of valvular heart diseases: a population-based study, Lancet. 2006 Sep 16;368(9540):1005-11.
[2] O. Alfieri, F. Maisano, M. De Bonis, P. L. Stefano, L. Torracca, M. Oppizzi, et al. The double-orifice technique in mitral valve repair: a simple solution for complex problems. I Thorac Cardiovasc Surg. 122(4):674-681, 2001.
[3] T. Feldman, S. Kar, M. Rinaldi, P. Fail, J. Hermiller, R. Smalling, P. L. Whitlow, W. Gray, R. Low, H. C. Herrmann, S. Lim, E. Foster, D. Glower; EVEREST Investigator. Percutaneous Mitral Repair With the MitraClip System: Safety and Midterm Durability in the Initial EVEREST (Endovascular Valve Edge-to-Edge REpair Study) Cohort. J Am Coll Cardiol. 2009 Aug 18;54(8):686-94.
[4] N. C. Wunderlich, R. J. Siege. Peri-interventional echo assessment for the MitraClip procedure. Eur Heart J Cardiovasc Imaging. 2013 Oct;14(10):935-49.
[5] F. Sturla, A. Redaelli, G. Puppini, F. Onorati, G. Faggian, E. Votta. Functional and Biomechanical Effects of the Edge-to-Edge Repair in the Setting of Mitral Regurgitation: Consolidated Knowledge and Novel Tools to Gain Insight into Its Percutaneous Implementation. Cardiovasc Eng Technol. 2015 Jun;6(2):117-40.
[6] C. H. Lee, R. Amini, R. C. Gorman, J. H. 3rd Gorman 3rd, M. S. Sacks. An inverse modeling approach for stress estimation in mitral valve anterior leaflet valvuloplasty for in-vivo valvular biomaterial assessment. J. Biomech. 2014 Jun; 47(9):2055–2063.
[7] K. S. Kunzelman, R. P. Cochran. Mechanical properties of basal and marginal mitral valve chordae tendineae. ASAIO Trans. 1990 Jul; 36(3):M405–M408.
Proceedings VII Meeting Italian Chapter of the European Society of Biomechanics (ESB-ITA 2017) 28-29 September 2017, Rome - Italy
62
ISBN: 978-88-6296-000-7

GENERAL SESSION
Motion Analysis


Abstract— The present work aims at testing multiscale entropy (MSE) on trunk acceleration data to assess movement complexity and its changes with maturation. If MSE can measure movement complexity, it should decrease with maturation in paradigmatic tasks (e.g. gait), because of the concurrent increase in automaticity, and increase in non-paradigmatic tasks (e.g. tandem gait). Children, adolescents, and adults participated in the study. MSE was estimated on trunk acceleration data during gait and tandem gait. Results agreed with the hypothesis, indicating MSE as a complexity measure sensible to differences in performance related to age and level of automaticity, specific of the performed task. Keywords—Motor control development, Movement
complexity, Inertial sensors, Sample Entropy
I. INTRODUCTION OTOR development beyond infancy is characterized bya gradual increase in agility, adaptability, and ability to
make complex movement sequences [1]. Complexity of movement can be defined as the capability of using different strategies (complex strategies) to accomplish a specific task [2]. It can be described by the regularity of the pattern of variability and by the number of strategies used over time [2], and it is assumed to increase with increasing interactions among multiple control mechanisms operating over a range of time scales, reflecting system’s capacity to adapt to environmental stresses. Thus, it is expected to increase with maturation, reaching its highest level in adulthood [3]. Multiscale Entropy (MSE) has been proposed to estimate complexity (assessed by sample entropy, SEN) on different kinematic signals, at different time scales (using different values of τ) [4]. When applied on trunk acceleration data during natural gait (NW) at different ages, MSE was found to decrease from childhood to adulthood, apparently contradicting the premises [5]. On the contrary, authors hypothesized that this decrease was related to the specific motor task analyzed and resulted from the concurrent increase in gait automaticity [5]. This work aims to test this hypothesis, applying MSE on a non-paradigmatic task (tandem gait, TW) in order to exclude aspects of automaticity: if MSE allows estimating movement complexity, an increase with maturation is expected in TW performance.
II. MATERIALS AND METHODS
A. Study subjects Seven groups of participants of different ages were
included in the study: children aged 6-10 years (6YC, 7YC, 8YC, 9YC, 10YC), adolescents (15YA) and young adults (25YA).
All of the children had no known developmental delay. All children and adults had no musculoskeletal pathology and had a BMI between the 5th and the 95th percentile of the BMI-for-age [6]. None of them had previous experience of TW.
B. Experimental setup Two tri-axial wireless inertial sensors (OPALS, Apdm,
USA) were mounted respectively on the lower back and on the right leg using straps. Data were recorded at 128Hz while the participants walked in NW and walked in TW at self-selected speed back and forth on a 10m long tapeline on the floor.
C. Data Analysis Stride detection was estimated from the angular velocity
around the medio-lateral axis of the leg [7]. For both NW and TW, the turns, the first two and the last two strides of each trial were excluded. For all participants 10 consecutive strides were analyzed. Each time series included a number of data points higher than 3000 [4], [8].
SEN was calculated according to Bisi & Stagni 2016 [5] on the V, AP and ML accelerations of the trunk (SENv, SENap and SENml) for NW and TW (τ ranging from 1 to 6).
In order to evaluate the concurrent development of automaticity and complexity, each SEN value in NW was expressed in percentage of the corresponding value in TW (for each value of τ) to represent the ratio (R-SEN).
A Jarque-Bera test [9] was performed to test normal distributions of the estimated parameters on the different groups: since the normal distribution was not verified on all the groups, median values and 25- and 75- percentiles of results were calculated. A Kruskal-Wallis test [10], [11] with minimum level of significance of 5% was performed to analyze the effect of age on SEN and R-SEN.
III. RESULTS
TW SEN followed the trend hypothesized with maturation on all the three axes, showing median values increasing significantly with increasing group age. NW SENap and SENv decreased significantly with age (SENap when using τ>4), while no age effect was found on ML axis.
Significant age effect was found for R-SEN in all directions for all τ. Similar value trends were observed for this parameter for all τ in the different directions: R-SEN is 100% (AP) and 85% (V) in 6YC decreasing to 50% at maturation; 115% in 6YC decreasing to 90% for ML direction. Fig. 1a, b and c show respectively results for SEN in TW, in NW and R-SEN for the AP and V (τ ranging from 1 to 6).
Assessment of changes in movement complexity and movement automaticity with maturation
M.C. Bisi1, R. Stagni1
1 DEI, University of Bologna, Italy; email: [email protected]
M
Proceedings VII Meeting Italian Chapter of the European Society of Biomechanics (ESB-ITA 2017) 28-29 September 2017, Rome - Italy
65
ISBN: 978-88-6296-000-7

Fig. 1. a) SEN in TW, b) SEN in NW and c) R-SEN (%) for the different age groups (median, 25th and 75th percentiles), obtained with different values of τ (τ =1÷6 from light grey to black). Asterisks indicate significant age effect.
IV. DISCUSSION
The results of this study confirmed the expected trend: age of maturation affected significantly complexity of the acceleration signal in all the directions, particularly in AP and ML that are stressed during TW by the constricted base of support, thus possibly evidencing adaptive/complex solutions found by motor control. Differently from what was observed for NW here and in previous research [5], SEN calculated for TW allowed to detect the expected increase in the complexity of motor control for all τ.
In particular, the ratio R-SEN between the two walking conditions can provide an insight into the concurrent maturation of motor automaticity. Assuming the development of complexity in TW as reference, R-SEN in NW shows a
reduction to half of the complexity of TW for all time-scales in AP and V directions (in the plane of pendulum behavior [12]), while remaining comparable in the ML direction.
The results of the present study showed MSE and R-SEN, applied to NW and TW, capable to detect the expected changes in motor control maturation, taking into account the concurrent development of automaticity and complexity. This work highlights the importance of the selected task when aiming to analyze the different aspects of the maturation of motor control.
V. CONCLUSION
The results of this study confirmed MSE, estimated on trunk acceleration data, as a characterizing parameter of the maturation of motor control, sensitive to age related changes in both motor automaticity and complexity.
ACKNOWLEDGMENT Authors would like to thank participants, their parents and
teachers and coordinators of the schools “Istituto San Giuseppe Lugo” and “Liceo di Lugo” (Italy) that allowed data acquisition.
REFERENCES
[1] M. Hadders-Algra, «Variation and variability: key words in human motor development», Phys. Ther., vol. 90, n. 12, pagg. 1823–1837, dic. 2010.
[2] S. C. Dusing e R. T. Harbourne, «Variability in postural control during infancy: implications for development, assessment, and intervention», Phys. Ther., vol. 90, n. 12, pagg. 1838–1849, dic. 2010.
[3] M. Diehl, K. Hooker, e M. J. Sliwinski, Handbook of Intraindividual Variability Across the Life Span. Routledge, 2015.
[4] M. Costa, C.-K. Peng, A. L. Goldberger, e J. M. Hausdorff, «Multiscale entropy analysis of human gait dynamics», Phys. Stat. Mech. Its Appl., vol. 330, n. 1–2, pagg. 53–60, Dicembre 2003.
[5] M. C. Bisi e R. Stagni, «Complexity of human gait pattern at different ages assessed using multiscale entropy: From development to decline», Gait Posture, vol. 47, pagg. 37–42, giu. 2016.
[6] E. Cacciari et al., «Italian cross-sectional growth charts for height, weight and BMI (2 to 20 yr)», J. Endocrinol. Invest., vol. 29, n. 7, pagg. 581–593, ago. 2006.
[7] K. Aminian, B. Najafi, C. Büla, P.-F. Leyvraz, e P. Robert, «Spatio-temporal parameters of gait measured by an ambulatory system using miniature gyroscopes», J. Biomech., vol. 35, n. 5, pagg. 689–699, mag. 2002.
[8] Y. Tochigi, N. A. Segal, T. Vaseenon, e T. D. Brown, «Entropy analysis of tri-axial leg acceleration signal waveforms for measurement of decrease of physiological variability in human gait», J. Orthop. Res., vol. 30, n. 6, pagg. 897–904, giu. 2012.
[9] M. Jarque, A. K. Bera, C. M. Jarque, e A. K. Bera, «A test for normality of observations and regression residuals», Intern. Stat. Rev, pagg. 163–172, 1987.
[10] W. H. Kruskal e W. A. Wallis, «Use of Ranks in One-Criterion Variance Analysis», J. Am. Stat. Assoc., vol. 47, n. 260, pagg. 583–621, 1952.
[11] J. D. Gibbons e S. Chakraborti, «Nonparametric Statistical Inference», in International Encyclopedia of Statistical Science, M. Lovric, A c. di Springer Berlin Heidelberg, 2011, pagg. 977–979.
[12] K. G. Holt, E. Saltzman, C.-L. Ho, M. Kubo, e B. D. Ulrich, «Discovery of the pendulum and spring dynamics in the early stages of walking», J. Mot. Behav., vol. 38, n. 3, pagg. 206–218, mag. 2006.
Proceedings VII Meeting Italian Chapter of the European Society of Biomechanics (ESB-ITA 2017) 28-29 September 2017, Rome - Italy
66
ISBN: 978-88-6296-000-7

Abstract— Biomechanical models of the musculoskeletal systems are commonly used to estimate internal structural loads and muscle activation during body movements. Several musculoskeletal models developed in the last decade are used to evaluate upper limb movements in normal conditions. However only few studies are able to predict the influence of abnormal movements following injuries are available so far. An upper limb biomechanical model which includes strain-adjustable ligaments of the acromioclavicular joint was developed by using the OpenSim software. The model including 7 degrees of freedom is able to evaluate the movements of the shoulder, elbow and wrist. The ligaments strain can be adjusted in order to simulate different types of Rockwood acromioclavicular dislocation. Movements recorded from a healthy subject are used as preliminary assessment of the proposed model. Keywords— musculoskeletal model, upper limb biomechanics,
shoulder, ligament injury.
I. INTRODUCTION NDERSTANING internal structural loads and muscleactivation is crucial for quantitative evaluation of human
movements: unfortunately in vivo measurements are not immediate and easy. Hence, musculoskeletal models which provide meaningful noninvasive estimations of these variables can be used. During the last decade several upper limb musculoskeletal models have been developed, such as the Stanford VA upper limb model, the Garner model, the Delft shoulder and elbow model (DSEM), the Dickerson mathematical musculoskeletal shoulder model and the AnyBody shoulder model.
The musculoskeletal shoulder models are used to obtain a detailed biomechanical description. In addition they can be also used to predict the influence of injuries on movements. The Stanford VA upper limb model was used to perform simulations of surgical rotator cuff repair of the supraspinatus muscle–tendon unit [1]. Recently the impact of cuff tear arthropathy on the mechanics of the deltoid during elevation in the frontal, scapular and sagittal planes was simulated by using the AnyBody shoulder model [2]. The use of a musculoskeletal model for assessing the effects of a change in morphological structure is becoming rather common and may represent a promising reliable and valid approach.
The human shoulder joint can be considered as a group of joints which includes the sternoclavicular joint, the acromioclavicular (AC) joint, the glenohumeral joint and the scapulothoracic joint. AC joint injuries occur commonly in active and athletic persons. The injuries of the AC joint are graded according to the amount of injury on the acromioclavicular and coracoclavicular ligaments [3]. The Rockwood’s classification divides AC injuries into six
different types, from type I to type VI according to the severity of the joint dislocation.
The AC joint stability, which is maintained by a group of ligaments and muscles, is influenced by the specific dislocation injury. The analysis of the effects of abnormal ligament on upper limb movements is still an open issue. A biomechanical model which includes adjustable strain ligament can be used to predict the effects of ligaments injury on upper limb movements.
A biomechanical upper limb model including AC joint ligaments have been developed. Upper limb movements recorded on a healthy subject are presented and analysed. The ultimate goal of this biomechanical model is to estimate the motion kinematics of the shoulder according to different types of Rockwood AC dislocation and to provide a clinical support to the evaluation of functional recovery of the patient after a treatment.
Preliminary results from an upper limb musculoskeletal model including acromioclavicular joint ligaments are presented in this article.
II. MATERIALS AND METHODS
A. Musculoskeletal upper limb model The upper limb musculoskeletal model presented in this
study was developed by using OpenSim platform version 3.3 (National Central for Simulation in Rehabilitation Research NCSRR, Stanford, CA, USA). The musculoskeletal model of the upper limb used in this study was developed from a previous upper limb model [4]. The model includes 7 degrees of freedom (DOF) such as shoulder rotation, shoulder elevation, elevation plane of the shoulder, elbow flexion, forearm rotation and wrist flexion. Fifty musculotendon actuators across these joints were also included. The model was based on the anthropometry and muscle force-generating characteristics of a 50th percentile adult male.
In addition, the trapezius muscle was added to control the moving, rotating, and stabilizing the scapula. The parameters of the trapezius muscle, including tendon slack length, optimal muscle-fiber length and peak isometric muscle force, are obtained from the DSEM [5]. This muscle was included in order to control the shoulder elevation.
B. Acromioclavicular joint ligaments The AC joint is stabilized by a complex of three ligaments
arranged around the joint: the coracoacromial ligament, the acromioclavicular ligament and the coracoclavicular ligament. The coracoclavicular ligament consists of the
An upper limb musculoskeletal model including acromioclavicular joint ligaments: preliminary results
Vi-Do Tran1,2, Paolo Dario1, and Stefano Mazzoleni1,2
1 The BioRobotics Institute, Scuola Superiore Sant’Anna, Pisa, Italy 2 Laboratory of Rehabilitation Bioengineering, Auxilium Vitae Rehabilitation Centre, Volterra, Italy
U
Proceedings VII Meeting Italian Chapter of the European Society of Biomechanics (ESB-ITA 2017) 28-29 September 2017, Rome - Italy
67
ISBN: 978-88-6296-000-7

conoid ligament, which inserts into the inferior surface of the clavicle of the conoid tubercle near its posterior ridge, and the trapezoid ligament, which runs obliquely, superiorly, and then laterally toward the trapezoid ridge to the inferior surface of the clavicle [3].
The ligaments were modelled in OpenSim by means of two
parameters: physiological cross-sectional area and resting length, the length at which the ligament has no strain and no force is produced. The length and stiffness of ligaments in normal condition are reported in Table I.
III. RESULTS
The developed musculoskeletal upper limb model is shown in Fig. 1. To demonstrate how this model works based on the inverse kinematics problem by using experimental data, an able-bodied subject was asked to perform right upper limb movements.
Fig. 1. Upper limb model in an anterior view (left) and acromioclavicular joint (right) where ligaments are represented as green bars.
The movements were recorded by a motion capture system (SMART-DT, BTS Bioengineering Corp., Milano, Italy) which is capable of recording 3D movements. The body landmarks to be recorded were: acromion, clavicular, C7, bicep front, elbow lateral, elbow medial, wrist lateral, wrist medial and hand. A reflective marker was attached to each body landmark. The subject performed a “hand to mouth” movement five times with a self-paced velocity (e.g., 4 seconds for bringing the hand towards the mouth and 4 seconds for returning to the original position).
0 1 2 3 4 5 6 7 8-80
-40
0
40
80
120140
---
-
Fig. 2. Trajectories of DOFs angles during a representative trial.
Based on the marker positions recorded during an experimental trial, anatomical scaling, inverse kinematics and dynamics were performed. Scaling was used to match the anthropometric values of the generic model to the characteristics of the subject. Then the joints angles of each DOF of the model were obtained by means of the Inverse Kinematics OpenSim Tool. Finally inverse dynamics is used to estimate the forces and moments that cause the motion.
Fig. 3. Contribution of muscles to elbow moment (BIClong: biceps brachii long head, BICshort: biceps brachii short head, BRD: brachioradialis).
Fig. 2 shows the joint angles corresponding to elevation plane of the shoulder, shoulder rotation, shoulder elevation, elbow flexion during a representative trial. The angles obtained are in agreement with the literature [9]. The contribution of biceps brachii and brachioradialis muscles to elbow moment are presented in Fig. 3.
IV. CONCLUSION
The developed model was tested in order to evaluate upper limb movement kinematics by means of experimental data. The influence of different types of Rockwood AC dislocations can be evaluated by means of this biomechanical model. Further analysis will be performed in order to study the effects of ligaments strain on shoulder movements.
REFERENCES [1] K.R. Saul, S. Hayon, et al., “Postural dependence of passive tension in
the supraspinatus following rotator cuff repair: A simulation analysis,” Clin. Biomech., vol. 26, no. 8, pp. 804–810, 2011.
[2] P.O. Lemieux, N. Nuño, et al., “Mechanical analysis of cuff tear arthropathy during multiplanar elevation with the AnyBody shoulder model,” Clin. Biomech., vol. 27, no. 8, pp. 801–806, 2012.
[3] C.A. Rockwood, M. FA, et al., The Shoulder, 2nd Edition, Volume 1. Philadelphia, PA: W B Saunders Co, 1998.
[4] K.S. Holzbaur, W.M. Murray, et al., “A model of the upper extremity for simulating musculoskeletal surgery and analyzing neuromuscular control,” Ann. Biomed. Eng., vol. 33, no. 6, pp. 829–840, 2005.
[5] D. Blana, J.G. Hincapie, et al., “A musculoskeletal model of the upper extremity for use in the development of neuroprosthetic systems,” J. Biomech., vol. 41, no. 8, pp. 1714–1721, 2008.
[6] B.A. Ponce, P.J. Millett, et al., “Acromioclavicular joint instability-reconstruction indications and techniques,” Oper. Tech. Sports Med., vol. 12, no. 1, pp. 35–42, 2004.
[7] R. Fremerey, L. Bastian, et al., “The coracoacromial ligament: anatomical and biomechanical properties with respect to age and rotator cuff disease,” Knee Surg. Sports Traumatol. Arthrosc., vol. 8, no. 5, pp. 309–313, 2000.
[8] R.S. Costic, A. Vangura, et al., “Viscoelastic behavior and structural properties of the coracoclavicular ligaments.,” Scand. J. Med. Sci. Sports, vol. 13, no. 5, pp. 305–10, 2003.
[9] H. Gill, L. Gustafsson, et al., “Shoulder joint range of motion in healthy adults aged 20 to 49 years,” Br. J. Occup. Ther., vol. 69, no. 12, pp. 556–561, 2006.
TABLE I LIGAMENTS PARAMETERS
Ligament Length (m) Stiffness (N/m)
Acromioclavicular 0.0150 [6] N/A
Coracoacromial 0.0369 [7] 51600 [7]
Conoid 0.0112 [8] 70000 [8]
Trapezoid 0.0096 [8] 83000 [8]
N/A: Not available.
Proceedings VII Meeting Italian Chapter of the European Society of Biomechanics (ESB-ITA 2017) 28-29 September 2017, Rome - Italy
68
ISBN: 978-88-6296-000-7

Abstract—The elbow ligamentous and bony structures play essential roles in the joint stability. A predictive tool of the joint behaviour after the loss of retentive structures would be helpful in designing reconstructive surgeries and in pre-operative planning. In this work, a multibody model consisting of bones and non-linear ligamentous structures is presented and validated through comparison with experimental data. Keywords—elbow, multibody, ligaments, MCLC
I. INTRODUCTION HE elbow joint comprises ligamentous and bonystabilizers that furnish both primary and secondary
stability during flexion. At 20°-120° degrees of flexion, the elbow stability is dependent on medial collateral ligament complex (MCLC), which is composed of three ligamentous structures: Anterior Bundle (AB), Posterior Bundle (PB) and Transverse Bundle (TB). TB is commonly considered not involved in the elbow stability [1]. The undisputed importance of the AB as a primary stabilizer of the elbow to valgus stress was deeply investigated, and, up to present days, in simple unstable or complex dislocations the reconstruction techniques addresses the AB only [2]. Although the PB role in elbow stability has not been clearly defined yet, it is always injured in dislocated elbows and it is sacrificed in many common surgical procedures. Anyhow, any reconstruction procedure aims at the restoration of the original joint stability, and since ligaments stabilizing tensions change with the motion, a thorough knowledge of osseous interactions and ligaments function is necessary. However, an exhaustive experiment into the ligament constraints changes in relation to joint motions would be time consuming. An advantageous solution would be the use of computational modelling, that has become an important tool for the characterization of complex systems. Moreover, validated models can be used to investigate and optimize surgical procedures in a virtual setting.
The purpose of this study was to develop an anatomically detailed elbow joint multibody model provided with non-linear ligaments. The model performances were evaluated through comparison between the model kinematics and experimental measurements collected from literatures.
II. MATERIALS AND METHODS
A multibody model was created in ADAMS (MSC Software Corporation, Santa Ana, CA) by importing the CAD geometries of humerus, ulna and radio, pre-assembled in the extended position. A density of 1600 kg/m3 was used for the
osseous components [3].
A. Ligaments formulation The model comprises the ligament complexes involved in
the elbow joint: medial collateral ligament complex (MCLC), lateral collateral ligament complex (LCLC), radial collateral ligament (RCL) and interosseous membrane (IOM), as listed in Table I. Both localization (Figure 1) and ligaments stiffness (Table I) were obtained through anatomic and biomechanical data found in literature.
TABLE I LIGAMENTS STIFFNESS
ID Tissue bundle Ligaments Stiffness K (N/mm) A-a MCLC
[4] Anterior AB 36.15
B-b Posterior AB 36.15 C-c Anterior PB 26.00 D-d Posterior PB 26.00 E-e LCLC
[4] Anterior RCL 23.25
F-f Posterior RCL 23.25 G-g Ulnar 57.00 N-n Anterior Annular 57.00 P-p Posterior Annular 57.00 O-o DRULs
[5] Dorsal 13.20
H-h Palmar 11.00 I-i IOM
[6]-[8] Oblique cord 65.00
M-m Proximal Accessory band 18.90 L-l Distal Accessory band 18.90 K-k Proximal Central band 65.00 J-j Distal Central band 65.00
Ligaments and intraosseous membrane were then modelled as non-linear springs thanks to the implementation of user define functions (Eq. (1)) describing the load–strain relation.
°°¯
°°®
!dd
L
L
L
LK
KLoadHHHH
H
HHHH
2200
)(41
02 (1)
The stiffness parameters K for each bundle are summarized in Table I, while the spring parameter εL was assumed to be 0.03. A parallel damper with a damping coefficient of 0.5 Ns/mm was also added to the formulation [9].
B. Articular contact Humerus-ulna, humerus-radio and ulna-radio contact forces
were defined through an impact formulation (Eq. (2)) describing the contact force Fc as a function of the interpenetration between bodies (G ) and the interpenetration velocity (G ).
GGG )(ckF ec (2)
k is the contact stiffness (8000 N/mm), e is the nonlinear
Multibody modelling of ligamentous and bony stabilizers in the elbow joint
M. Terzini1, E.M. Zanetti2, A.L. Audenino1, L. Gastaldi1, S. Pastorelli1, E. Panero1, A. Sard3 and C. Bignardi1
1 Dept. of Mechanical and Aerospace Engineering, Politecnico di Torino, Torino, Italy 2 Dept. of Engineering, University of Perugia, Perugia, Italy
3 Hand Surgery Division, AOU CTO, Torino, Italy
T
Proceedings VII Meeting Italian Chapter of the European Society of Biomechanics (ESB-ITA 2017) 28-29 September 2017, Rome - Italy
69
ISBN: 978-88-6296-000-7
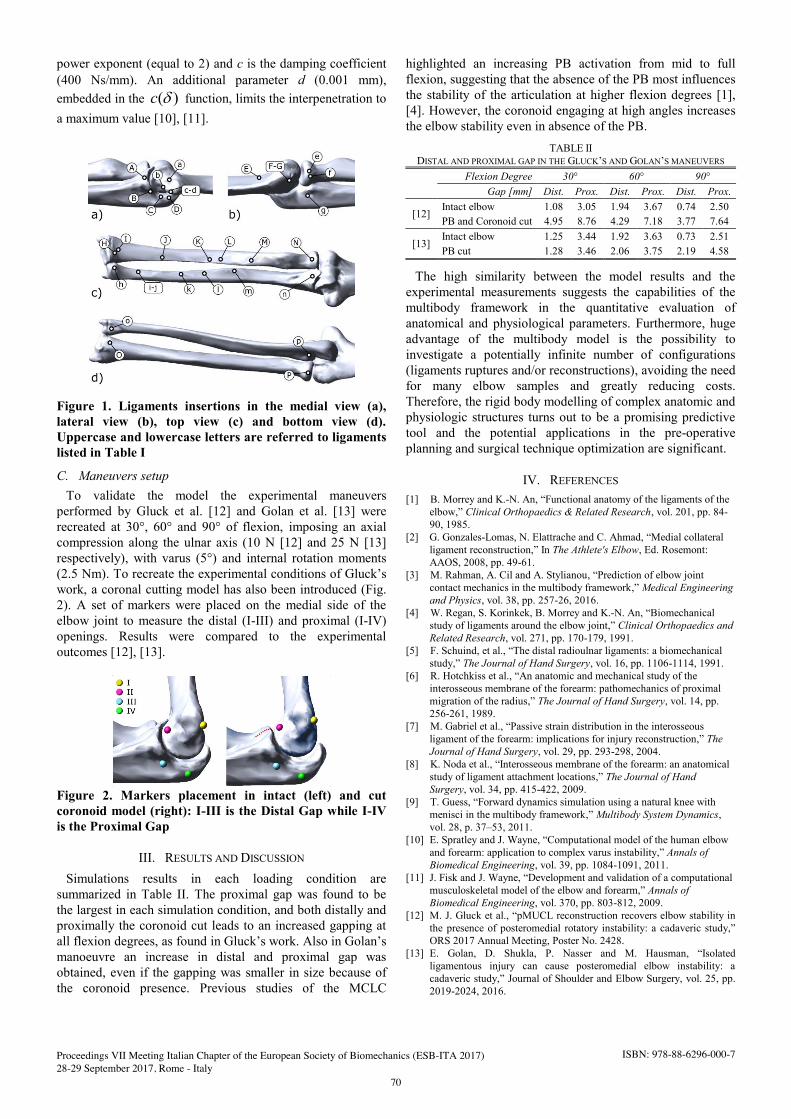
power exponent (equal to 2) and c is the damping coefficient (400 Ns/mm). An additional parameter d (0.001 mm), embedded in the )(Gc function, limits the interpenetration to a maximum value [10], [11].
Figure 1. Ligaments insertions in the medial view (a), lateral view (b), top view (c) and bottom view (d). Uppercase and lowercase letters are referred to ligaments listed in Table I
C. Maneuvers setup To validate the model the experimental maneuvers
performed by Gluck et al. [12] and Golan et al. [13] were recreated at 30°, 60° and 90° of flexion, imposing an axial compression along the ulnar axis (10 N [12] and 25 N [13] respectively), with varus (5°) and internal rotation moments (2.5 Nm). To recreate the experimental conditions of Gluck’s work, a coronal cutting model has also been introduced (Fig. 2). A set of markers were placed on the medial side of the elbow joint to measure the distal (I-III) and proximal (I-IV) openings. Results were compared to the experimental outcomes [12], [13].
Figure 2. Markers placement in intact (left) and cut coronoid model (right): I-III is the Distal Gap while I-IV is the Proximal Gap
III. RESULTS AND DISCUSSION
Simulations results in each loading condition are summarized in Table II. The proximal gap was found to be the largest in each simulation condition, and both distally and proximally the coronoid cut leads to an increased gapping at all flexion degrees, as found in Gluck’s work. Also in Golan’s manoeuvre an increase in distal and proximal gap was obtained, even if the gapping was smaller in size because of the coronoid presence. Previous studies of the MCLC
highlighted an increasing PB activation from mid to full flexion, suggesting that the absence of the PB most influences the stability of the articulation at higher flexion degrees [1], [4]. However, the coronoid engaging at high angles increases the elbow stability even in absence of the PB.
TABLE II DISTAL AND PROXIMAL GAP IN THE GLUCK’S AND GOLAN’S MANEUVERS
Flexion Degree 30° 60° 90° Gap [mm] Dist. Prox. Dist. Prox. Dist. Prox.
[12] Intact elbow 1.08 3.05 1.94 3.67 0.74 2.50 PB and Coronoid cut 4.95 8.76 4.29 7.18 3.77 7.64
[13] Intact elbow 1.25 3.44 1.92 3.63 0.73 2.51 PB cut 1.28 3.46 2.06 3.75 2.19 4.58
The high similarity between the model results and the experimental measurements suggests the capabilities of the multibody framework in the quantitative evaluation of anatomical and physiological parameters. Furthermore, huge advantage of the multibody model is the possibility to investigate a potentially infinite number of configurations (ligaments ruptures and/or reconstructions), avoiding the need for many elbow samples and greatly reducing costs. Therefore, the rigid body modelling of complex anatomic and physiologic structures turns out to be a promising predictive tool and the potential applications in the pre-operative planning and surgical technique optimization are significant.
IV. REFERENCES
[1] B. Morrey and K.-N. An, “Functional anatomy of the ligaments of the elbow,” Clinical Orthopaedics & Related Research, vol. 201, pp. 84-90, 1985.
[2] G. Gonzales-Lomas, N. Elattrache and C. Ahmad, “Medial collateral ligament reconstruction,” In The Athlete's Elbow, Ed. Rosemont: AAOS, 2008, pp. 49-61.
[3] M. Rahman, A. Cil and A. Stylianou, “Prediction of elbow joint contact mechanics in the multibody framework,” Medical Engineering and Physics, vol. 38, pp. 257-26, 2016.
[4] W. Regan, S. Korinkek, B. Morrey and K.-N. An, “Biomechanical study of ligaments around the elbow joint,” Clinical Orthopaedics and Related Research, vol. 271, pp. 170-179, 1991.
[5] F. Schuind, et al., “The distal radioulnar ligaments: a biomechanical study,” The Journal of Hand Surgery, vol. 16, pp. 1106-1114, 1991.
[6] R. Hotchkiss et al., “An anatomic and mechanical study of the interosseous membrane of the forearm: pathomechanics of proximal migration of the radius,” The Journal of Hand Surgery, vol. 14, pp. 256-261, 1989.
[7] M. Gabriel et al., “Passive strain distribution in the interosseous ligament of the forearm: implications for injury reconstruction,” The Journal of Hand Surgery, vol. 29, pp. 293-298, 2004.
[8] K. Noda et al., “Interosseous membrane of the forearm: an anatomical study of ligament attachment locations,” The Journal of Hand Surgery, vol. 34, pp. 415-422, 2009.
[9] T. Guess, “Forward dynamics simulation using a natural knee with menisci in the multibody framework,” Multibody System Dynamics, vol. 28, p. 37–53, 2011.
[10] E. Spratley and J. Wayne, “Computational model of the human elbow and forearm: application to complex varus instability,” Annals of Biomedical Engineering, vol. 39, pp. 1084-1091, 2011.
[11] J. Fisk and J. Wayne, “Development and validation of a computational musculoskeletal model of the elbow and forearm,” Annals of Biomedical Engineering, vol. 370, pp. 803-812, 2009.
[12] M. J. Gluck et al., “pMUCL reconstruction recovers elbow stability in the presence of posteromedial rotatory instability: a cadaveric study,” ORS 2017 Annual Meeting, Poster No. 2428.
[13] E. Golan, D. Shukla, P. Nasser and M. Hausman, “Isolated ligamentous injury can cause posteromedial elbow instability: a cadaveric study,” Journal of Shoulder and Elbow Surgery, vol. 25, pp. 2019-2024, 2016.
Proceedings VII Meeting Italian Chapter of the European Society of Biomechanics (ESB-ITA 2017) 28-29 September 2017, Rome - Italy
70
ISBN: 978-88-6296-000-7

Abstract— Acquisition and elaboration of trunk acceleration signal during gait have assumed a key role in motor assessment. This has led to develop different indexes and metrics to evaluate gait performance that, directly or indirectly, imply the analysis of the harmonic content of the signal. In addition, smartphones with embedded accelerometers have been proposed as a monitoring tool, even when not supporting high sampling frequencies. Thus, the knowledge of the spectrum characteristics of the trunk acceleration signal during gait is crucial to identify hardware and software requirements and to correctly use the indexes and their parameters. The aim of the present study was to analyze the harmonic content of the trunk acceleration signal characterizing the gait of nine age groups from 7 to 85 year-old. To do this, the fundamental frequency and the frequency corresponding to the 50, 90, 95 and 98% of the normalized power of the trunk acceleration during gait were analysed. Results highlighted that: the harmonic content (at 98%) of the acceleration signal for all the analysed population, with exception of the adolescents, is below 30 Hz where the high frequencies contribute is due to the AP direction. Regarding the adolescents their spectrum is wide up to 45Hz. Keywords— Gait frequency analysis, stride frequency,
fundamental frequency, gait signal bandwidth.
I. INTRODUCTION OW a day, the accelerometer measures during gait are extensively used to evaluate motor functionality of both
healthy and pathological subjects [1], [2]. In particular, trunk acceleration during gait permits to characterize different aspects of the motor pattern itself. [3]. Moreover, a variety of metrics and indexes to evaluate variability, stability, complexity and regularity of the gait motor pattern have been developed [4]–[6]. Some of these indexes directly or indirectly analyse the harmonic content of the employed signal. Even if literature [5], [7], [8], referred to significant changes in gait pattern in relationship with the analysed population, assessed through direct or indirect analysis of the harmonic content of the signal, but, the lack of a standardize procedure for the signal acquisition (e.g. sampling frequency, time duration of the signal) clearly appears. Moreover, other works through using smartphone embedded accelerometers, which do not support constant and higher than 50 Hz sampling frequency due to the multiple functions they provide, analysed variability and stability aspects of gait in pathological populations [9]. Thus, the knowledge of the spectrum features (e.g. fundamental frequency, bandwidth) of the trunk acceleration signal during gait is crucial (i) to identify hardware and/or software requirements of the used inertial sensors (ii) to understand if and/or how these requirements are in relationship with the analysed populations and (iii) improving the basic knowledge of the gait acceleration signal, will permit to correctly and
consistently -with the population- use of the metrics and their parameters since they directly or indirectly manage the signal in the frequency domain. The aim of the present study was to evaluate the harmonic content of the trunk acceleration signal during gait of nine different age populations to cover the entire life span. To do this, spectrum features: fundamental frequency, the frequency corresponding to the 50, 90, 95 and 98% of the signal power of the three, antero-posterior (AP) medio-lateral (ML) and vertical (V), acceleration directions were calculated.
II. MATERIAL AND METHODS
Nine age groups, from 7 to 85 year-old, of 10 healthy subjects each were recruited (see Table 1).
Two tri-axial wireless inertial sensor (OPAL, Apdm USA) were fixed: one on the lower back and one above the ankle needed for the stride detection [10]. The participants walked at self-selected speed for about 30 seconds along a straight path. Trunk acceleration was recorded with a sampling frequency (fs) at 128 Hz. For all the subjects, an integer number of strides to cover at least a time duration of 20 seconds were analysed. The analysed strides raged from 23 (7YC) to 14 (15YAf); moreover the maximal signal duration was 21.3 s. Fundamental Frequency (FF) and the frequency corresponding to the 50, 90, 95 and 98% of the normalized power of the trunk acceleration in the three directions (f50,90,95,98%_ap,ml,v) were calculated. To avoid influence of the anthropometric parameters, FF was normalized (FFNORM) according to Hof et al. [11]; whereas, in order to assess possible interference between the harmonic content and the fundamental frequency, all the other features were normalized (f50,90,95,98%_ap,ml,v_NORM) with respect to FF. Since the normal distribution was not verified on all the groups,
Frequency content of gait trunk acceleration: a longitudinal study
P. Tamburini1, M.C. Bisi1 and R. Stagni1 1 Dept. of Electrical, Electronic and Information Engineering, University of Bologna, Bologna, Italy.
N
TABLE I DETAILS OF AGE GROUPS: MEDIAN, MINIMUM AND MAXIMUM VALUES.
Description and acronym Age [year] Weight [Kg] Height [cm]
7-years old children (7YC) 7 (7, 7) 29 (22, 37) 129 (119, 134)
9-years old children (9YC) 9 (9, 9) 34 (22,45) 140 (138,145)
15-years old adolescents Female Not Grown (15YAf)
15 (15,15) 54 (49, 74) 162 (147, 172)
15-years old adolescents Male Not Grown (15YAm_NG) [7]
15 (15,15) 64 (49, 74) 172 (169,176)
15-years old adolescents Male Grown (15YAm_G) [7]
15 (15,15) 59 (46, 65) ∆w=2 (-1, 4)
172 (160,175) ∆h=3.6 (3, 4)
25-years old adults (25YA) 25 (22, 26) 70 (48, 86) 168 (154, 187)
45-years old adults (45YA) 45 (41, 48) 74 (45, 100) 174 (155, 193)
65-years old adults (65YA) 65 (62, 69) 85 (68, 120) 176 (164,186)
85-years old elderlies (85YE) 85 (84, 91) 74 (57, 90) 177 (160, 175)
Proceedings VII Meeting Italian Chapter of the European Society of Biomechanics (ESB-ITA 2017) 28-29 September 2017, Rome - Italy
71
ISBN: 978-88-6296-000-7

median, 25- and 75-percentile values were calculated.
III. RESULTS
FF ranged from a maximum of 1.1 Hz, for the 7 year-old, to a minimum of 0.88 Hz for the male grown adolescents. FFNORM showed different trend in respect to FF (see Fig 1).
Figure 1: Median, 25th and 75th percentile of FF and FFNORM, panel A and B respectively, for all the age groups.
f98%_ap showed a higher value (45Hz) for adolescent groups and lower one (20Hz) for 9YC. In V direction instead, f98%_v ranged from 20 Hz (all 15YA, 65YA and 85YE) to 15 Hz (25YA). No trends were observed for ML direction with age. The same trends were found for all the normalized features.
IV. CONCLUSION
To evaluate the harmonic content of the trunk acceleration signal during gait, of nine age groups from 7 to 85 years-old, fundamental frequency and frequencies corresponding to the 50, 90, 95 and 98% of the signal power were calculated.
The obtained FF values suggest that, in according with other studies [12], [13], the fundamental frequency corresponds to the stride frequency (cadence). Studies [14], [15] affirm that modifications in gait pattern, after 5-7 years old, are more influenced by changes in height than by modification of the motor control system. In order to understand how much -the observed FF changes- are due to physical characteristics, the normalization [11] by anthropometric parameters of the fundamental frequency (FFNORM) was performed. From 7 year-old to 45 year-old close values of FFNORM were found, confirming that stride frequency changes are due to anthropometric conditions. On the other hand, different behaviour for male grown adolescents and elderly (YA65 and 85YA) was found. In particular, male grown adolescents showed lower values than not grown peers and a decreasing of FFNORM values from YA65 to YA85 was observed. These suggest a change/involvement of motor control system for the adolescents [7] and also a comorbidity contribute for the elderly [16], [17]. The choice to normalize the f50,90,95,98%_ap,ml,v with respect to the FF was performed in order to evaluate if the fundamental frequency of each population could influence the harmonic content of the signal. The obtained results showed similar values and trends, for normalized and not features, suggesting that the observed differences are peculiar of the populations. Values of f50,90,95,98% highlight how the spectrum, in AP and V direction, is characterized by a peak at low frequency (around 3.5 Hz) and then by a uniform and low power band, wider in AP than in V direction. Instead ML direction is marked by a flat spectrum.
In general, the results of the present study suggest operative indications about how the trunk acceleration signal should be elaborated: (i) if the harmonic content is directly managed not less of 20 seconds of signal within a integer number of strides (about 20 stride) must be analysed, allowing a correct and reliable spectral analysis of a discrete, periodic and finite duration signals; anyhow, in all the elaborations a reliability of the used metrics has to be guaranteed [4]; (ii) to ensure a 98% of the harmonic content of the signal a sampling frequency higher then 90 Hz for the adolescents and than 60 Hz for the other age population should be used.
In order to further and strengthen improve the elaboration of trunk acceleration more researches are necessary; focusing on if and how the acquisition parameters, mainly the sampling frequency, change the values of indexes and metrics used to evaluate gait performance.
REFERENCES [1] H. B. Menz, S. R. Lord, and R. C. Fitzpatrick, “Age‐related
differences in walking stability,” Age Ageing, vol. 32, no. 2, pp. 137–142, Mar. 2003.
[2] P. Fazio et al., “Gait measures with a triaxial accelerometer among patients with neurological impairment,” Neurol. Sci., vol. 34, no. 4, pp. 435–440, Apr. 2013.
[3] W. Zijlstra and A. L. Hof, “Displacement of the pelvis during human walking: experimental data and model predictions,” Gait Posture, vol. 6, no. 3, pp. 249–262, Dec. 1997.
[4] F. Riva, M. C. Bisi, and R. Stagni, “Gait variability and stability measures: Minimum number of strides and within-session reliability,” Comput. Biol. Med., vol. 50, pp. 9–13, Jul. 2014.
[5] M. C. Bisi, F. Riva, and R. Stagni, “Measures of gait stability: performance on adults and toddlers at the beginning of independent walking,” J. NeuroEngineering Rehabil., vol. 11, no. 1, Sep. 2014.
[6] D. Hamacher, D. Hamacher, A. Törpel, M. Krowicki, F. Herold, and L. Schega, “The reliability of local dynamic stability in walking while texting and performing an arithmetical problem,” Gait Posture, vol. 44, pp. 200–203, Feb. 2016.
[7] M. C. Bisi and R. Stagni, “Development of gait motor control: what happens after a sudden increase in height during adolescence?,” Biomed. Eng. OnLine, vol. 15, May 2016.
[8] D. Hamacher, D. Hamacher, N. B. Singh, W. R. Taylor, and L. Schega, “Towards the assessment of local dynamic stability of level-grounded walking in an older population,” Med. Eng. Phys., vol. 37, no. 12, pp. 1152–1155, Dec. 2015.
[9] T. Isho, H. Tashiro, and S. Usuda, “Accelerometry-Based Gait Characteristics Evaluated Using a Smartphone and Their Association with Fall Risk in People with Chronic Stroke,” J. Stroke Cerebrovasc. Dis., vol. 24, no. 6, pp. 1305–1311, Jun. 2015.
[10] K. Aminian, B. Najafi, C. Büla, P.-F. Leyvraz, and P. Robert, “Spatio-temporal parameters of gait measured by an ambulatory system using miniature gyroscopes,” J. Biomech., vol. 35, no. 5, pp. 689–699, May 2002.
[11] A. L. Hof, “Scaling gait data to body size,” Gait Posture, vol. 4, no. 3, pp. 222–223, May 1996.
[12] F. Danion, E. Varraine, M. Bonnard, and J. Pailhous, “Stride variability in human gait: the effect of stride frequency and stride length,” Gait Posture, vol. 18, no. 1, pp. 69–77, Aug. 2003.
[13] D. H. Sutherland, R. Olshen, L. Cooper, and S. L. Woo, “The development of mature gait.,” J Bone Jt. Surg Am, vol. 62, no. 3, pp. 336–353, Apr. 1980.
[14] “Gait Analysis: Normal and Pathological Function,” J. Sports Sci. Med., vol. 9, no. 2, p. 353, Jun. 2010.
[15] D. H. Sutherland, R. Olshen, L. Cooper, and S. L. Woo, “The development of mature gait,” J. Bone Joint Surg. Am., vol. 62, no. 3, pp. 336–353, Apr. 1980.
[16] Y. Barak, R. C. Wagenaar, and K. G. Holt, “Gait Characteristics of Elderly People With a History of Falls: A Dynamic Approach,” Phys. Ther., vol. 86, no. 11, pp. 1501–1510, Nov. 2006.
[17] B. E. Maki, “Gait Changes in Older Adults: Predictors of Falls or Indicators of Fear?,” J. Am. Geriatr. Soc., vol. 45, no. 3, pp. 313–320, Mar. 1997.
Proceedings VII Meeting Italian Chapter of the European Society of Biomechanics (ESB-ITA 2017) 28-29 September 2017, Rome - Italy
72
ISBN: 978-88-6296-000-7

Abstract — The assessment of human walking using wearable inertial sensors plays a relevant role in clinical, sport and home-monitoring application. In particular, the identification of gait events, used to define gait temporal parameters, represent a fundamental aspect in this evaluation. In order to define gait parameters, many algorithms have been implemented. Each of them processes peculiar signals (acceleration or angular velocity) measured from sensors attached on different anatomical part of the body. The aim of this study is to compare the performances of 12 methods proposed for gait events detection and temporal parameters estimation. The number of false negative/positive in detecting gait events, the precision and accuracy in estimating temporal parameters vary according to the signal considered, the data processing applied and the sensors positioning.
Keywords— gait events, temporal parameters, inertial sensors, stereophotogrammetry.
I. INTRODUCTION NERTIAL Measurement Units (IMUs) have been widelyused to assess walking performance. Thanks to their small size, low cost and portability, in particular, they represent
an ideal device for functional assessment outside the gait analysis laboratory. One of the main IMUs application is the identification of gait events (GE), which included toe off (TO) and heel strike (HS), used to quantify gait temporal parameters (GTP), such as stride time, step time, swing time and stance time. GPT definition plays a relevant role in clinical, sport and home-monitoring applications [4]. In the literature, many GE estimation algorithms have been proposed, differing in modelling approach, number and positioning of IMU [1–7]. Previous analysis compared the performance of some of these algorithms [4] considering similar IMU positioning. The aim of this study is to compare the performances of 12 methods proposed for GPT estimation, identified from a literature review, analyzing the influence of IMU positioning.
II. METHODS
A. Partecipants Thirty-five healthy subjects (17 female, 18 male; 26.0±3.8 years old; 1.72±0.08 m; 69.0±13.1 Kg) were recruited for this study. All the subjects were recruited from the students/volunteers at the University of Bologna and gave informed consent before participating.
B. Motor tasks and measurement equipment Five tri-axial IMUs (WaveTrack, Cometa, Milano, fc285Hz) were positioned on the feet, shanks and pelvis of each subject for acceleration and angular velocity acquisition. Four retroreflective markers were applied on each foot (toe, lateral
malleolus, III and V metatarsal head) for 3D trajectories acquisition using stereophotogrammetry (BTS Smart-DX, fc250Hz). Participants were asked to walk for 2 minutes at their self-selected comfortable speed.
C. Data analysis GEs identified from stereophytogrammetric data were assumed as gold standard (GS) [8]. To identify the GEs from IMUs data 11 methods from the literature [1-7] and one newly proposed method (M1) were implemented. M1 is based on the local minima identification of the shank angular velocity. For each method, GPTs were calculated from GEs. Then, the following parameters were calculated: 1) the number of missed GEs relative to the number of trueGEs (sensitivity) and of correctly detected GEs relative to the total amount of detected GEs (positive predicted values, PPV) [4]; 2) the accuracy and the precision of GE estimation;3) the accuracy and the precision of GPT estimation.Data analysis were performed with MatLab (Math Works 2017a, NATICK, USA).
III. RESULTS
A. Sensitivity and PPV The highest sensitivity and PPV values were obtained for
M1, [1] and [7] methods. All the three methods exploit angular velocity signals from sensors mounted on the shank. Values of sensibility and PPV for TO and HS are illustrated in Table 1.
.
B. Accuracy and precision of GE and GPT estimation Bland-Altman's plots show: - a higher accuracy and precision in GE detection for M1,
[1] and [3] methods. In Figure 1 an example of Bland – Altman plot obtained for TO detection in M1 method is reported.
Gait parameters estimation using inertial sensors: comparative analysis of 12 methods
G. Pacini Panebianco1, R. Stagni1, S. Fantozzi1
1DEI-University of Bologna, Bologna, Italy; email:[email protected]
I
TABLE I SENSIBILITY AND PPV FOR TOE OFF AND HEEL STRIKE
Method Sensibility PPV
Position TO HS TO HS
M1 0.90 0.95 0.98 0.80
Shanks [1] 0.87 0.96 0.99 0.83
[7] 0.90 0.97 0.98 0.82
Proceedings VII Meeting Italian Chapter of the European Society of Biomechanics (ESB-ITA 2017) 28-29 September 2017, Rome - Italy
73
ISBN: 978-88-6296-000-7

- a higher accuracy and precision in GPT estimation for M1 and [1] methods. In Figure 2 an example of Bland – Altman plot obtained for step estimation in [1] method is shown.
IV. CONCLUSION
In this study a comparative performance estimation of 12 methods proposed for GPT estimation was defined. The assessed performance of the 12 methods suggests that the most reliable results (low number of false positives/negatives, high accuracy and precision of GE and GPT estimation) are obtained for methods exploiting angular velocity signals from sensors mounted on the shank (M1, [1]). The comparison of these results to algorithm using shank linear acceleration ([7]) shows similar values for PPV and sensibility, while lower values of accuracy and precision are obtained. The positioning of the IMU on the foot ([3]) seems to provide as good accuracy and precision in GEs and GPTs detection as using sensors mounted on the shank (M1, [1]), but with an increased number of extra and missing events. In general, the worst performance in observed for methods exploiting the linear acceleration measured on the pelvis ([2,4]), both in terms of number of false positives/negatives, accuracy and precision of GEs and GPTs. These preliminary results, based
on the functional assessment of healthy subjects, should be extended to subjects with specific gait abnormalities.
REFERENCES [1] K.Aminian et al., ‘Spatio-temporal parameters of gait measured by an
ambulatory system using miniature gyroscopes’, Journal of Biomechanics, 35 (2002) 689–699
[2] F.Buganè et al., ‘Estimation of spatial-temporal gait parameters in level walking based on a single accelerometer: Validation on normal subjects by standard gait analysis’, Computer methods and programs in biomedicine, 108 (2012) 129–137
[3] A. Ferrari et al., ‘A Mobile Kalman-Filter Based Solution for the Real-Time Estimation of Spatio-Temporal Gait Parameters’, IEEE Transaction on neural systems and rehabilitation enegineering, Vol. 24, No. 7, July 2016
[4] D.Trojaniello et al., ‘Accuracy, sensitivity and robustness of five different methods for the estimation of gait temporal parameters using a single inertial sensor mounted on the lower trunk’, Gait and Posture, 40 (2014):487–92
[5] Khandelwal S. and Wickström N. (2014). ‘Identification of Gait Events using Expert Knowledge and Continuous Wavelet Transform Analysis.’ In Proceedings of the International Conference on Bio-inspired Systems and Signal Processing, pages 197-20
[6] P. Catalfamo Formento et al., ‘Gait Event Detection on Level Ground and Incline Walking Using a Rate Gyroscope’, Sensors, 14(2014): 5470-85
[7] J.Ah Lee et al., ‘Portable Activity Monitoring System for Temporal Parameters of Gait Cycles’, The Journal of Medical Systems, (2010) 34: 959–966
[8] C.M. O’Connor, ‘Automatic detection of gait events using kinematic data’, Gait and Posture, 25 (2007): 469–74
Figure1 Bland – Altman for TO (M1)
Figure 2 Bland – Altman for step time ([1])
Proceedings VII Meeting Italian Chapter of the European Society of Biomechanics (ESB-ITA 2017) 28-29 September 2017, Rome - Italy
74
ISBN: 978-88-6296-000-7
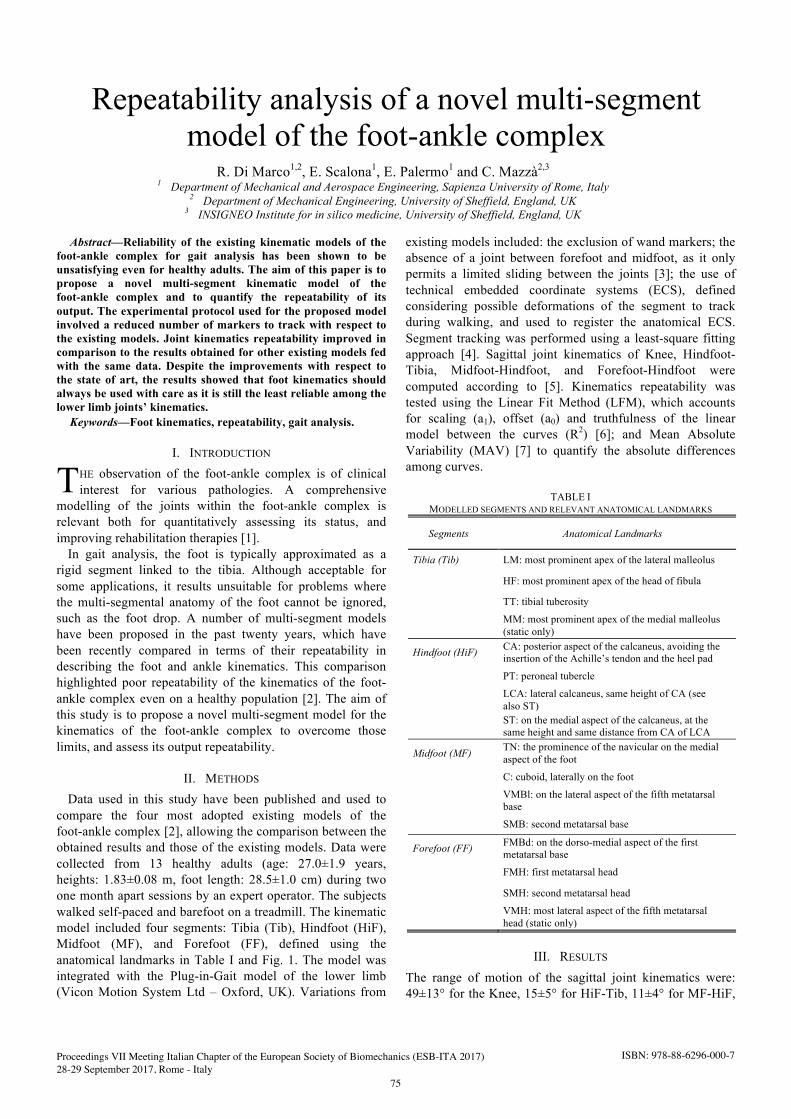
Abstract—Reliability of the existing kinematic models of the foot-ankle complex for gait analysis has been shown to be unsatisfying even for healthy adults. The aim of this paper is to propose a novel multi-segment kinematic model of the foot-ankle complex and to quantify the repeatability of its output. The experimental protocol used for the proposed model involved a reduced number of markers to track with respect to the existing models. Joint kinematics repeatability improved in comparison to the results obtained for other existing models fed with the same data. Despite the improvements with respect to the state of art, the results showed that foot kinematics should always be used with care as it is still the least reliable among the lower limb joints’ kinematics. Keywords—Foot kinematics, repeatability, gait analysis.
I. INTRODUCTION HE observation of the foot-ankle complex is of clinical interest for various pathologies. A comprehensive
modelling of the joints within the foot-ankle complex is relevant both for quantitatively assessing its status, and improving rehabilitation therapies [1].
In gait analysis, the foot is typically approximated as a rigid segment linked to the tibia. Although acceptable for some applications, it results unsuitable for problems where the multi-segmental anatomy of the foot cannot be ignored, such as the foot drop. A number of multi-segment models have been proposed in the past twenty years, which have been recently compared in terms of their repeatability in describing the foot and ankle kinematics. This comparison highlighted poor repeatability of the kinematics of the foot-ankle complex even on a healthy population [2]. The aim of this study is to propose a novel multi-segment model for the kinematics of the foot-ankle complex to overcome those limits, and assess its output repeatability.
II. METHODS
Data used in this study have been published and used to compare the four most adopted existing models of the foot-ankle complex [2], allowing the comparison between the obtained results and those of the existing models. Data were collected from 13 healthy adults (age: 27.0±1.9 years, heights: 1.83±0.08 m, foot length: 28.5±1.0 cm) during two one month apart sessions by an expert operator. The subjects walked self-paced and barefoot on a treadmill. The kinematic model included four segments: Tibia (Tib), Hindfoot (HiF), Midfoot (MF), and Forefoot (FF), defined using the anatomical landmarks in Table I and Fig. 1. The model was integrated with the Plug-in-Gait model of the lower limb (Vicon Motion System Ltd – Oxford, UK). Variations from
existing models included: the exclusion of wand markers; the absence of a joint between forefoot and midfoot, as it only permits a limited sliding between the joints [3]; the use of technical embedded coordinate systems (ECS), defined considering possible deformations of the segment to track during walking, and used to register the anatomical ECS. Segment tracking was performed using a least-square fitting approach [4]. Sagittal joint kinematics of Knee, Hindfoot-Tibia, Midfoot-Hindfoot, and Forefoot-Hindfoot were computed according to [5]. Kinematics repeatability was tested using the Linear Fit Method (LFM), which accounts for scaling (a1), offset (a0) and truthfulness of the linear model between the curves (R2) [6]; and Mean Absolute Variability (MAV) [7] to quantify the absolute differences among curves.
TABLE I MODELLED SEGMENTS AND RELEVANT ANATOMICAL LANDMARKS
Segments Anatomical Landmarks
Tibia (Tib) LM: most prominent apex of the lateral malleolus
HF: most prominent apex of the head of fibula
TT: tibial tuberosity MM: most prominent apex of the medial malleolus (static only)
Hindfoot (HiF) CA: posterior aspect of the calcaneus, avoiding the insertion of the Achille’s tendon and the heel pad PT: peroneal tubercle LCA: lateral calcaneus, same height of CA (see also ST) ST: on the medial aspect of the calcaneus, at the same height and same distance from CA of LCA
Midfoot (MF) TN: the prominence of the navicular on the medial aspect of the foot C: cuboid, laterally on the foot VMBl: on the lateral aspect of the fifth metatarsal base SMB: second metatarsal base
Forefoot (FF) FMBd: on the dorso-medial aspect of the first metatarsal base FMH: first metatarsal head
SMH: second metatarsal head VMH: most lateral aspect of the fifth metatarsal head (static only)
III. RESULTS
The range of motion of the sagittal joint kinematics were: 49±13° for the Knee, 15±5° for HiF-Tib, 11±4° for MF-HiF,
Repeatability analysis of a novel multi-segment model of the foot-ankle complex
R. Di Marco1,2, E. Scalona1, E. Palermo1 and C. Mazzà2,3
1 Department of Mechanical and Aerospace Engineering, Sapienza University of Rome, Italy 2 Department of Mechanical Engineering, University of Sheffield, England, UK
3 INSIGNEO Institute for in silico medicine, University of Sheffield, England, UK
T
Proceedings VII Meeting Italian Chapter of the European Society of Biomechanics (ESB-ITA 2017) 28-29 September 2017, Rome - Italy
75
ISBN: 978-88-6296-000-7

and 15±5° for FF-HiF. Table II and Table III show the results of the within- and between-subject repeatability, respectively.
Fig. 1 – THE ANATOMICAL LANDMARKS USED TO DEFINE THE LOCALEMBEDDED COORDINATE SYSTEMS. LATERAL (LEFT-SIDE) AND MEDIAL VIEW
OF THE FOOT (RIGHT-SIDE).
IV. DISCUSSION
The experimental protocol used for the proposed model was easier to implement than those analysed in [2], both for the reduced number of markers to be tracked and their visibility. In fact, all the markers were visible to the stereophotogrammetric system, both in static and walking trials, and extensive procedures of gap filling were not needed. Same consideration cannot be made for the medial markers of the models studied in [2]. Joint kinematics repeatability improved in comparison with the results
obtained for the existing models using the same data [2]. The LFM correlation coefficient and obtained for the Within-Subject analysis on the joint kinematics MF-HiF, were higher than the model proposed in [8] (R2 = 0.77 ± 0.20 [2]). Obtained results for the between-subject analysis strengthen this consideration. Indeed, R2 was higher than those obtained for both models in [8], [9] (0.79 ± 0.15 and 0.51 ± 0.28, respectively [2]). The above considerations prove the proposed modelling of the MF-HiF joint as an improvement of the state of art. The FF-HiF modelled the virtual joint that allows rotations between metatarsals and hindfoot bones, and showed slightly better performance than the existing models both for within- and between-subject analyses [2]. MAVs values obtained from all the joint kinematics estimated using the proposed model were overall comparable to those obtained through the other models [2]. The only exception was found for the MF-HiF with respect to [8], which resulted the least reliable kinematic with a ROM of 5°.
V. CONCLUSION Despite the obtained improvements, foot kinematics is still
the least reliable among the lower limb joints’ kinematics, confirming the inadequacy of using normative data to interpret relevant results.
ACKNOWLEDGEMENT
This study was supported by the EU Community (MD-Paedigree, FP7-ICT-2011-9) and the UK EPSRC (EP/J013714/1 and EP/K03877X/1).
REFERENCES [1] J.A.I. Prinold, C. Mazzà, R. Di Marco, I. Hannah, C. Malattia, et al.,
“A Patient-Specific Foot Model for the Estimate of Ankle Joint Forces in Patients with Juvenile Idiopathic Arthritis” Ann Biomed Eng, vol. 44, pp. 247–257, 2016.
[2] R. Di Marco, S. Rossi, V. Racic, P. Cappa, C. Mazzà “Concurrent repeatability and reproducibility analyses of four marker placement protocols for the foot-ankle complex” J Biomech, vol. 49, pp. 3168-3176, 2016.
[3] H. Gray, Gray’s Anatomy. Barnes & Noble, 2010, pp. 1096. [4] I. Soderkvist, P. Wedin, “Determining the movements of the skeleton
using well-configured markers” J Biomech, vol. 26, pp. 1473-1477, 1993.
[5] G. Wu, S. Siegler, P. Allard, C. Kirtley, A. Leardini, et al., “ISB recommendation on definitions of joint coordinate system of various joints for the reporting of human joint motion—part I: ankle, hip, and spine” J Biomech, vol. 35, pp. 543-548, 2002.
[6] M. Iosa, A. Cereatti, A. Merlo, I. Campanini, S. Paolucci, A. Cappozzo, “Assessment of waveform similarity in clinical gait data: the Linear Fit Method” Biomed Res International, vol. XX, pp. 214156, 2014.
[7] A. Ferrari, A.G. Cutti, P. Garofalo, M. Raggi, M. Heijboer, A. Cappello, A. Davalli, “First in vivo assessment of “Outwalk”: a novel protocol for clinical gait analysis based on inertial and magnetic sensors” Med Biol Eng Comput, vol. 48, pp. 1-15, 2010.
[8] Z. Sawacha, G. Cristoferi, G. Guarnieri, S. Corazza, G. Donà, et al., “Characterizing multisegment foot kinematics during gait in diabetic foot patients” J NeurEng Rehab, vol. 6, 2009.
[9] A. Leardini, M.G. Benedetti, L. Berti, D. Bettinelli, R. Nativo, S. Giannini, “Rear-foot, mid-foot and fore-foot motion during the stance phase of gait” GaitPosture, vol. 25, pp. 453.462, 2007.\
TABLE II LFM COEFFICIENTS AND MAV OBTAINED FOR THE WITHIN-SUBJECT
REPEATABILITY ANALYSIS
Joints LFM coefficients
MAV (°) a1 a0 (°) R2
Knee 1.00 ± 0.08 0 ± 2 0.97 ± 0.04 7 ± 5
HiF-Tib 1.00 ± 0.11 0 ± 1 0.91 ± 0.09 3 ± 1
MF-HiF 1.00 ± 0.17 0 ± 0 0.93 ± 0.07 2 ± 1
FF-HiF 1.00 ± 0.14 0 ± 1 0.95 ± 0.05 2 ± 1
TABLE III LFM COEFFICIENTS AND MAV OBTAINED FOR THE BETWEEN-SUBJECT
REPEATABILITY ANALYSIS
Joints LFM coefficients
MAV (°) a1 a0 (°) R2
Knee 1.00 ± 0.20 0 ± 7 0.91 ± 0.07 27
HiF-Tib 1.00 ± 0.27 0 ± 1 0.69 ± 0.18 8
MF-HiF 1.00 ± 0.35 0 ± 1 0.82 ± 0.12 7
FF-HiF 1.00 ± 0.33 0 ± 3 0.83 ± 0.12 12
Proceedings VII Meeting Italian Chapter of the European Society of Biomechanics (ESB-ITA 2017) 28-29 September 2017, Rome - Italy
76
ISBN: 978-88-6296-000-7
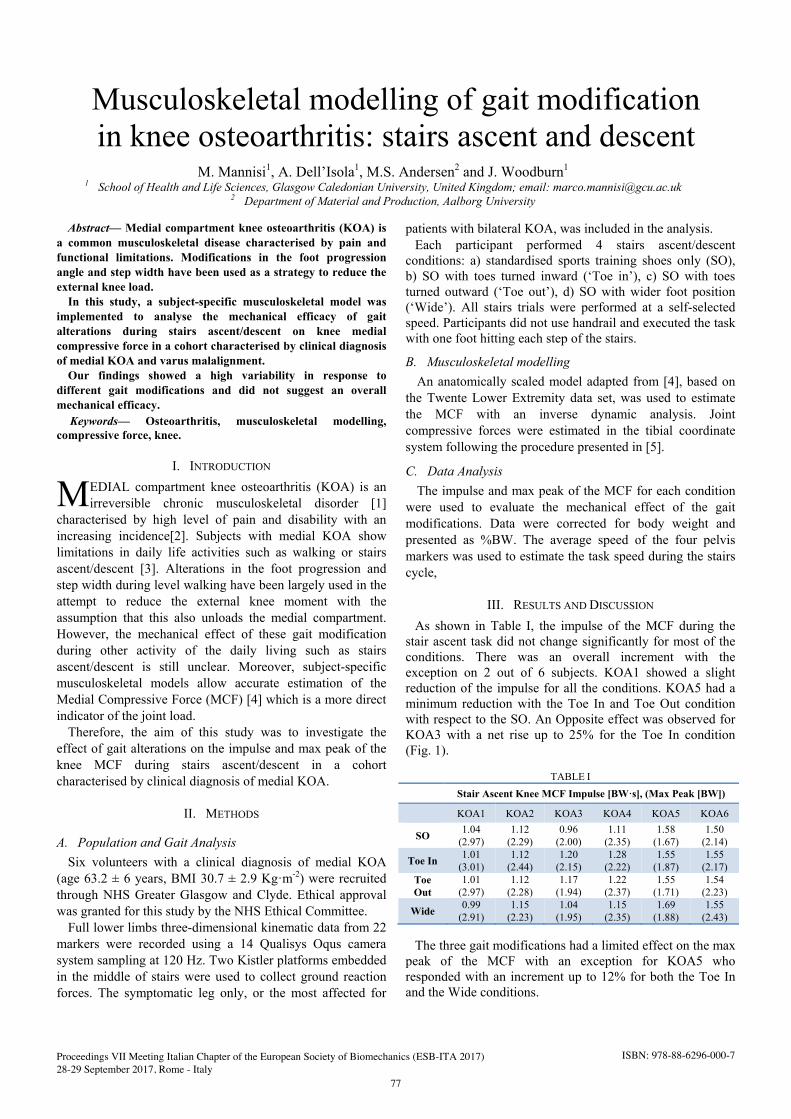
Abstract— Medial compartment knee osteoarthritis (KOA) is a common musculoskeletal disease characterised by pain and functional limitations. Modifications in the foot progression angle and step width have been used as a strategy to reduce the external knee load.
In this study, a subject-specific musculoskeletal model was implemented to analyse the mechanical efficacy of gait alterations during stairs ascent/descent on knee medial compressive force in a cohort characterised by clinical diagnosis of medial KOA and varus malalignment.
Our findings showed a high variability in response to different gait modifications and did not suggest an overall mechanical efficacy. Keywords— Osteoarthritis, musculoskeletal modelling,
compressive force, knee.
I. INTRODUCTION EDIAL compartment knee osteoarthritis (KOA) is an irreversible chronic musculoskeletal disorder [1]
characterised by high level of pain and disability with an increasing incidence[2]. Subjects with medial KOA show limitations in daily life activities such as walking or stairs ascent/descent [3]. Alterations in the foot progression and step width during level walking have been largely used in the attempt to reduce the external knee moment with the assumption that this also unloads the medial compartment. However, the mechanical effect of these gait modification during other activity of the daily living such as stairs ascent/descent is still unclear. Moreover, subject-specific musculoskeletal models allow accurate estimation of the Medial Compressive Force (MCF) [4] which is a more direct indicator of the joint load.
Therefore, the aim of this study was to investigate the effect of gait alterations on the impulse and max peak of the knee MCF during stairs ascent/descent in a cohort characterised by clinical diagnosis of medial KOA.
II. METHODS
A. Population and Gait Analysis Six volunteers with a clinical diagnosis of medial KOA
(age 63.2 ± 6 years, BMI 30.7 ± 2.9 Kg·m-2) were recruited through NHS Greater Glasgow and Clyde. Ethical approval was granted for this study by the NHS Ethical Committee.
Full lower limbs three-dimensional kinematic data from 22 markers were recorded using a 14 Qualisys Oqus camera system sampling at 120 Hz. Two Kistler platforms embedded in the middle of stairs were used to collect ground reaction forces. The symptomatic leg only, or the most affected for
patients with bilateral KOA, was included in the analysis. Each participant performed 4 stairs ascent/descent
conditions: a) standardised sports training shoes only (SO), b) SO with toes turned inward (‘Toe in’), c) SO with toesturned outward (‘Toe out’), d) SO with wider foot position (‘Wide’). All stairs trials were performed at a self-selected speed. Participants did not use handrail and executed the task with one foot hitting each step of the stairs.
B. Musculoskeletal modelling An anatomically scaled model adapted from [4], based on
the Twente Lower Extremity data set, was used to estimate the MCF with an inverse dynamic analysis. Joint compressive forces were estimated in the tibial coordinate system following the procedure presented in [5].
C. Data Analysis The impulse and max peak of the MCF for each condition
were used to evaluate the mechanical effect of the gait modifications. Data were corrected for body weight and presented as %BW. The average speed of the four pelvis markers was used to estimate the task speed during the stairs cycle,
III. RESULTS AND DISCUSSION
As shown in Table I, the impulse of the MCF during the stair ascent task did not change significantly for most of the conditions. There was an overall increment with the exception on 2 out of 6 subjects. KOA1 showed a slight reduction of the impulse for all the conditions. KOA5 had a minimum reduction with the Toe In and Toe Out condition with respect to the SO. An Opposite effect was observed for KOA3 with a net rise up to 25% for the Toe In condition (Fig. 1).
TABLE I Stair Ascent Knee MCF Impulse [BW·s], (Max Peak [BW])
KOA1 KOA2 KOA3 KOA4 KOA5 KOA6
SO 1.04 (2.97)
1.12 (2.29)
0.96 (2.00)
1.11 (2.35)
1.58 (1.67)
1.50 (2.14)
Toe In 1.01 (3.01)
1.12 (2.44)
1.20 (2.15)
1.28 (2.22)
1.55 (1.87)
1.55 (2.17)
Toe Out
1.01 (2.97)
1.12 (2.28)
1.17 (1.94)
1.22 (2.37)
1.55 (1.71)
1.54 (2.23)
Wide 0.99 (2.91)
1.15 (2.23)
1.04 (1.95)
1.15 (2.35)
1.69 (1.88)
1.55 (2.43)
The three gait modifications had a limited effect on the max peak of the MCF with an exception for KOA5 who responded with an increment up to 12% for both the Toe In and the Wide conditions.
Musculoskeletal modelling of gait modification in knee osteoarthritis: stairs ascent and descent
M. Mannisi1, A. Dell’Isola1, M.S. Andersen2 and J. Woodburn1
1 School of Health and Life Sciences, Glasgow Caledonian University, United Kingdom; email: [email protected] 2 Department of Material and Production, Aalborg University
M
Proceedings VII Meeting Italian Chapter of the European Society of Biomechanics (ESB-ITA 2017) 28-29 September 2017, Rome - Italy
77
ISBN: 978-88-6296-000-7

Figure 1: Medial Compressive Force for KOA3 during stairs ascent
Overall our results on the stairs ascent did not suggest a consistent mechanical effect for any of the three selected gait modifications on the medial condyle knee compressive force.
TABLE II
Stair Descent Knee MCF Impulse [BW·s], (Max Peak [BW])
KOA1 KOA2 KOA3 KOA4 KOA5 KOA6
SO 1.33 (3.36)
1.29 (3.18)
1.31 (2.56)
1.33 (3.18)
2.08 (2.35)
1.59 (2.44)
Toe In 1.32 (4.20)
1.23 (3.37)
1.47 (2.46)
1.63 (3.09)
3.35 (2.27)
1.32 (1.75)
Toe Out
1.14 (3.58)
1.33 (3.29)
1.31 (2.38)
1.55 (3.49)
2.75 (2.76)
1.53 (2.25)
Wide 1.06 (3.46)
1.34 (3.25)
1.24 (2.55)
1.38 (3.25)
2.52 (2.73)
1.51 (2.34)
Table II shows high variability and an inconsistent response trend during the stairs descent. As shown in Fig 2, KOA6 responded positively to the three gait modifications with a reduction of both the impulse and the max peak of the MCF with the greater reduction during the Toe In condition. The impulse of the MCF decreased significantly for KOA1 while the max peak of the MCF increased. KOA4 and KOA5 showed the largest increase in the impulse of the MCF.
Figure 2: Medial Compressive Force for KOA6 during stairs descent
Walking speed was mostly constant during the stairs ascent trials (Table III). The relative variations between the three gait modifications with respect to the SO were limited below the 10% with the only exception for the Toe In condition for KOA4 and KOA6.
TABLE III
Walking speed for Stair Ascent (Descent) [m/s]
KOA1 KOA2 KOA3 KOA4 KOA5 KOA6
SO 0.69 (0.54)
0.70 (0.58)
0.56 (0.43)
0.69 (0.57)
0.41 (0.29)
0.54 (0.31)
Toe In 0.69 (0.57)
0.72 (0.56)
0.54 (0.41)
0.59 (0.40)
0.41 (0.18)
0.46 (0.29)
Toe Out
0.69 (0.60)
0.76 (0.60)
0.50 (0.40)
0.61 (0.47)
0.42 (0.22)
0.50 (0.30)
Wide 0.72 (0.63)
0.68 (0.55)
0.51 (0.44)
0.65 (0.52)
0.40 (0.25)
0.50 (0.33)
For the stairs descent trials, the walking speed was lower. Overall, Toe in condition was characterised by a reduction of the walking speed. For this task, the speed alteration was less evident particularly for both Toe Out and Wide conditions with respect to SO. These findings suggest that an outward change in foot posting angle or a wider step may not alter patient’s ability during stairs descent.
Overall, it was not possible to identify a response trend for both MCF impulse and max peak for any of the analysed gait modification.
This inconsistency could be associated with the difficulty of the analysed tasks. Stairs ascent/descent is indeed a complex task which requires a high neuromuscular, cognitive and motor function.
IV. CONCLUSION
Our results do not support the biomechanical efficacy of gait modification on the reduction of the MCF during the stairs ascent/descent. However, some subject may respond positively to a gait retraining.
Further analysis based on an extended dataset is necessary to better understand the mechanical effect of gait modification during stairs tasks. Results from this study may suggest that the best strategy of gait modification should be tailored on a subject-specific level.
ACKNOWLEDGEMENT This study is part of the KNEEMO Initial Training
Network, funded by European Union’s Seventh Framework Programme for research, technological development and demonstration under Grant Agreement No. 607510.
REFERENCES [1] National Institute for Health and Clinical Excellence,
“Osteoarthritis Care and management in adults,” London NICE, vol. CG177, no. February, 2014.
[2] K. Giannakouris, “Ageing characterises the demographic perspectives of the European societies,” Eurostat, Stat. Focus, vol. 72, p. 11, 2008.
[3] C. C. Winter, M. Brandes, C. Mueller, T. Schubert, M. Ringling, A. Hillmann, D. Rosenbaum, and T. L. Schulte, “Walking ability during daily life in patients with osteoarthritis of the knee or the hip and lumbar spinal stenosis: a cross sectional study,” Bmc Musculoskelet. Disord., vol. 11, 2010.
[4] M. E. Lund, M. S. Andersen, M. de Zee, and J. Rasmussen, “Scaling of musculoskeletal models from static and dynamic trials,” Int. Biomech., vol. 2, no. 1, pp. 1–11, 2015.
[5] E. S. Grood and W.J. Suntay, “A Joint Coordinate System for the Clinical Description of Three-Dimensional Motions: Application to the Knee,” J. Biomech. Eng., vol. 105, pp. 136–144, 1983.
Proceedings VII Meeting Italian Chapter of the European Society of Biomechanics (ESB-ITA 2017) 28-29 September 2017, Rome - Italy
78
ISBN: 978-88-6296-000-7

Abstract — The paper presents an investigation on biomechanical power measurement methods in a vertical jump from a static position (squat jump) or from a dynamic one with static foot either (countermovement jump).
Keywords—Vertical jump biomechanics, power measurement, inertial sensors
I. INTRODUCTION ERTICAL jump without the help of a run-up is a widelyused gesture to determine subjects’ sports attitude or
explosive performance by measuring the mechanical power output [1]. In spite of its wide use there is no standardization neither for quantities to be measured nor for signal processing required to obtain power.
As a simplification it is possible to take into account only jump maximum height since it is of course strictly correlated to legs’ mechanical power output [2-5]. One of the simplest tests includes a high jump from a standing position and the measurement of the maximal height the subject is able to reach by extending arms [6]. The maximal height resulting from such test is actually the practical result due to mechanical energy exchange between ground and legs, anyway a deeper characterisation of the power output might be useful, considering for example a direct power measurement and its time evolution during the gesture, that certainly give much more information about subject’s performance. Furthermore, by introducing surface electromyography it is possible to correlate power output and muscle activity and/or force output and muscles activation timing to obtain information useful for example in more specific training sessions [7]. Usually practical applications of such tests focus on external mechanical power but from a biomechanical characterisation the overall power including the one required to fast moving body and legs segments is of great interest.
Different test modalities are reported in the literature. Traditional squat jump starts from a static position with knee and hip flexed and the jump takes place by a fast whole body elongation including arms. Another possibility is a dynamic pre-activation by a countermovement requiring muscles elongation, followed by a fast contraction. It has been found that such a condition increases power output, probably due to muscle elastic properties [8].
Several measurement systems are used to characterize the
gesture [9]. One of the simplest is based on the measurement of body linear displacement by using a sensor in contact with the body, a typical example is the using of a draw wire encoder or potentiometer. During the jump the subject draws the encoder wire attached to his/her waist. The subject’s height time history is recorded for further off line processing. More detailed methods are based on video systems and required the subjects to be instruments with proper markers placed on specific anatomical landmarks. Such a system offers a complete characterization of the biomechanical kinematics in two or even three dimensional space. Moreover, a force platform may be included in the set giving information about jump dynamics by measuring ground reaction force [10].
II. METHODS AND PROCEDURES
A. Experimental set-up In this paper we focus on power measurement considering
alternative methods to obtain either external mechanical power or overall power required to carry out the gesture [11]. We consider experimental results obtained with a measurement system including both kinematic and dynamic sensors. Kinematic characterization of the gesture is obtained through a redundant measuring system including video system with active markers and a high quality camera, and inertial sensors placed on main body segments. Dynamics is characterized by a force platform measuring three axial ground reaction force. Beside that acceleration measurements are available by an inertial sensor placed on the subject’s back at L3 position where we identify the Centre of Mass height in standing position. An experimental procedure has been developed to guarantee test repeatability and reproducibility and to characterise results variability. For this purpose several test are carried out by a subject in a test session and several subjects undergo test sessions in different days. Reproducibility is verified by reproducing tests sessions with same subjects in different time. A test session includes set up tests at beginning and conclusion, squat jumps, countermovement jumps and proper resting periods.
B. Data processing On the basis of available measurement signals it is possible
to indirectly measure according to different strategies. It is worth to underline that in any case, we are focusing on
Biomechanical power measurement in vertical jump
A. Palazzo(, F. Crenna1, and G.B. Rossi1
1Measurement Laboratory, DIME/MEC, University of Genova, Italy; [email protected], [email protected], [email protected]
V
Proceedings VII Meeting Italian Chapter of the European Society of Biomechanics (ESB-ITA 2017) 28-29 September 2017, Rome - Italy
79
ISBN: 978-88-6296-000-7

mechanical power only and not on physiological power.
Table 1 schematise the available methods to obtain a power measurement.
In the final paper we will compare results from these methods considering also their repeatability to give a quantitative scenario of the different power measurement possibilities and their reliability.
Output power is of course the main contribution to the overall power that includes the power required to move body segments. As for the external power, the latter contribution can be obtained either from marker position video measurements or by inertial angular position and velocity measurements. In this case also results will be discussed focusing on their repeatability and compatibility. The information provided will be useful for an estimation of power measurement uncertainty.
REFERENCES [1] Klavora, Vertical jump tests: a critical review, Strength &
Conditioning Journal, 22 (5),70,2000. [2] M. E. Powers, Vertical jump training for volleyball, Strength &
Conditioning Journal, 18 (1), 18-23, 1996. [3] J.M. Carlock, The relationship between vertical jump power
estimates and weightlifting ability: a field-test approach, J. Strength Cond Res, 18, pp. 534-539, 2004
[4] L. Ziv, Vertical jump in female and male basketball players—A review of observational and experimental studies, J Sci Med Sport, vol. 13, pp. 332-339, 2010
[5] U. Wisløff, Strong correlation of maximal squat strength with sprintperformance and vertical jump height in elite soccer players, Br J Sports Med., vol. 38, pp. 285-288, 2004
[6] D. A. Sargent, The physical test of man, American Physical Education Review, vol. 26, pp. 188-194, 1921.
[7] N. J. Chimera, Effects of plyometric training on muscle-activation strategies and performance in female athletes, Journal of Athletic Training, 39 (1), 24-31,2004
[8] M.F.Bobbert, K.G..M. Gerritsen et al, Why is countermovement jump height greater than squat jump height?, Medicine and Science in Sports and Exercise, 1996, 1402-1412
[9] F Crenna, G B Rossi, A Palazzo, Measurement of human movement under metrological controlled conditions, ACTA Imeko, 4, 48-56, 2015
[10] N.P. Linthorne, Analysis of standing vertical jumps using a force platform, Ann. J. Phys. 69, 11,2001, 1198-1204
[11] E.L. Dugan, T.L.A. Doyle et al, Determining the optimal load for jump squats: a review of methods and calculations, J Strength Cond Res, vol. 18, pp. 668-74, 2004.
[12] F Crenna, G B Rossi, V Belotti and A Palazzo, Filtering signals for movement analysis in biomechanics, Proc XXI IMEKO World Congress,2015, Prague, Czech Republic
TABLE I MECHANICAL POWER MEASUREMENT METHODS
Method Description
Dynamic Based on GRF measurements and on velocity obtained by GRF integration and subject’s mass
Kinematic I Based on acceleration as measured by COM inertial sensor and on velocity obtained by integration
Kinematic II Based on acceleration and velocity obtained by differentiation and filtering of COM marker position measured by video system [12]
Mixed Considering both GRF and kinematics measured at COM.
Proceedings VII Meeting Italian Chapter of the European Society of Biomechanics (ESB-ITA 2017) 28-29 September 2017, Rome - Italy
80
ISBN: 978-88-6296-000-7

GENERAL SESSION
Orthopaedic Biomechanics: Bone and Cartilage


Abstract—The current clinical gold standard for osteoporosis diagnosis is the measure of the areal bone mineral density (aBMD). However, 50% of fractures occur in individuals not classified as osteoporotic, demonstrating aBMD alone cannot predict fracture risk accurately. Aim of the study was to assess the geometrical parameters significantly affecting hip fracture risk probability. Twenty-eight subject-specific finite element analyses have been performed to simulate walking and falling, and the influence of the parameters on principal strains determined. The interaction of aBMD with buckling ratio and cross sectional area turned out to significantly affect strains in the sideways fall configuration, while the interaction between aBMD and body mass index was significant in the walk loading configuration. Keywords—Osteoporosis, hip fracture risk, HSA, finite
element analysis.
I. INTRODUCTION STEOPOROSIS, caused by an imbalance in bonemetabolism, results in the deterioration of bone microarchitecture, quality and consequently of bone
strength, which markedly increases the probability of fracture. From this perspective, hip fracture is considered to be the most serious complication of osteoporosis, representing a major source of morbidity and mortality around the world [1].
The current gold standard for osteoporosis diagnosis and clinical fracture risk assessment is the use of dual energy X-ray absorptiometry (DXA), which measures areal bone mineral density (aBMD). However, the great limitation of aBMD is that it provides an estimate of the bone density projected on a two-dimensional surface, ignoring factors which do affect bone strength, such as bone geometry and spatial density distribution.
During the two last decades many efforts have been dedicated to the assessment of a more reliable prediction tool for hip fracture risk. Many studies adopted the hip structural analysis (HSA) method, which provides geometrical information from DXA data [2], [3], [4], trying to correlate geometry and fracture risk. In addition, finite element (FE) analyses have been extensively used due to the possibility to develop CT based subject-specific models able to account for the individual features in terms of geometry and material properties distribution.
In this work subject-specific FE simulations have been performed aiming to assess the HSA derived geometrical factors significantly affecting the strains experienced by the proximal femur. The identification of associations between subject-specific FE analyses and clinically available information would indeed strongly affect the noninvasive assessment of hip fracture risk.
II. MATERIALS AND METHODS
Twenty-eight post-menopausal female subjects, aged from 55 to 81 years, have been engaged in the study after signing an informed consent. Clinical data including age, height, weight, BMI, BMD, T-score and HSA variables have been provided, together with CT scans of their right proximal femur.
A. FE Models The CT scans were first imported in Mimics (v17,
Materialise, Leuven, Belgium) where, after the segmentation, three-dimensional subject-specific models were created. Subsequently, using the 3-matic module in Mimics, the models were meshed using 4-node tetrahedral elements (Tet4). After the meshing procedure was completed, isotropic and inhomogeneous material properties were assigned (Fig. 1). Specifically, mathematical relations between density and the CT images Hounsfield Units (HU) [5] and between density and Young’s modulus [6] have been set. A constant Poisson’s ratio (ν = 0.3) was assigned to the model. Since for the material properties assignment Mimics requires elements to be grouped in a discrete number of bins according to their density, a sensitivity analysis was performed in order to set the adequate number of bins. A look-up file was then written for the inhomogeneous material properties assignment, and 25 bins were considered.
Figure 1: from left to right the 3-d model, the inhomogeneous material distribution, the meshed model.
B. FE Analyses The 28 meshed models output from Mimics were imported
in Ansys Workbench (v14.5, Canonsburg, Pennsylvania, U.S.), where 3-Matic Tet4 elements were converted to SOLID185. Walk and sideways fall conditions were simulated, with subject-specific loads applied. To simulate the walk condition, approximated to a single-leg stance [7], the articular reaction force was applied on the femoral head, and the muscle force was assigned as a distributed force (15 mm radius circular area) on the greater trochanter. The sideways fall was reproduced constraining the femoral head surface and applying a distributed (16 mm radius circular area) compressive force on the side of greater trochanter [1], [4]. In both conditions, the femoral diaphysis was completely fixed 5 mm distally from the lesser trochanter. In order to analyse the variables significantly affecting hip fracture risk,
Hip fracture risk prediction through FE analysis: influence of HSA parameters
A. Aldieri1, M. Terzini1, A. M. Priola2, G. Osella2, A. Veltri2, A. L. Audenino1, C. Bignardi1 1 DIMEAS, Politecnico di Torino, Italy
2 Department of Oncology, San Luigi Gonzaga Hospital, University of Torino, Italy
O
Proceedings VII Meeting Italian Chapter of the European Society of Biomechanics (ESB-ITA 2017) 28-29 September 2017, Rome - Italy
83
ISBN: 978-88-6296-000-7

neck and intertrochanteric regions have been considered separately. According to clinical observations indeed, hip fractures most recurrently occur at these anatomical locations [1]. Principal strains have been considered, since strains have been proved to dominate the fracture process [1] and growing consensus has been established on the adoption of maximum principal strain-based failure criteria [8]. In particular, since failure is thought to occur if tensile or compressive principal strains exceed limit values, the extreme strain values per each patient have been considered.
C. Statistical analysis A two-way ANOVA coupled with a post-hoc test was
carried out in the Matlab environment, aiming to assess which HSA variables most significantly affect strains at the two examined anatomical regions. Variables to be included had been identified as statistically significant by means of a preliminary one-way ANOVA.
III. RESULTS AND DISCUSSION
Only the minimum principal strains (Fig. 2) were considered in the fall configuration, since during sideways falls the femur mainly experiences compressive strains. The average strain was -0.036 at the neck and -0.161 at the intertrochanteric site, both exceeding the compressive limit [8]. The minimum principal strains identified were -0.084 at the neck and -1.864 at the intertrochanter.
Figure 2: minimum principal strain distribution (mm/mm) experienced by one patient during the sideways fall configuration.
During the walking configuration instead, both minimum and maximum principal strains (Fig. 3) were analyzed. On average, minimum compressive principal strains set to -0.005 and -0.026, while the average maximum tensile principal strain set to 0.003 and 0.027 at the neck and intertrochanter respectively. Considering the extreme values of the whole patients set, the greatest compressive principal strains were -0.009 at the neck and -0.258 at the intertrochanter, while the highest tensile principal strains reached 0.006 at the neck and 0.195 at the intertrochanteric site. These results suggest that, during walking, the intertrochanteric site may be at higher risk.
The post-hoc test allowed to claim that, during the sideways fall, patients characterized by a low BMD coupled with a low cross-sectional area turned out to experience significantly (p=0.015) greater compressive strains at the neck, and those with a low BMD and a high buckling ratio at both the intertrochanteric (p=0.04) and neck (p=0.001) sites.
Figure 3: minimum principal (left) and maximum principal (right) strain distribution (mm/mm) experienced by one patient during walking configuration.
In the walk loading configuration, patients with a low BMD and a high body mass index experienced significantly higher compressive principal strain (p=0.01) and tensile principal strains (p=0.04) in the neck, while higher tensile principal strains were observed in the intertrochanter (p=0.026).
The results obtained are in good agreement with other studies concerning the significant influence of cross sectional area, buckling ratio [2], [3] and body mass index [4], [9]. Nevertheless, this study did not identify as statistically significant the hip axis length and the neck shaft angle, which have been considered significant predictors of hip fracture risk [2], [9]. The preliminary results here described will be widen in the next future with additional patients and will be validated through the introduction of the potential hip fracture history of the analysed patients.
REFERENCES [1] H. Kheirollahi,, Y. Luo, “Identification of High Stress and Strain
Regions in Proximal Femur during Single-Leg Stance and Sideways Fall Using QCT-Based Finite Element Model,” World Academy of Science, Engineering and Technology, International Journal of Medical, Health, Biomedical, Bioengineering and Pharmaceutical Engineering, 2015, vol. 9.8, pp. 633-640.
[2] M. Ito, et al. “Analysis of hip geometry by clinical CT for the assessment of hip fracture risk in elderly Japanese women,” Bone, 2010, vol. 46.2, pp. 453-457.
[3] S. Kaptoge, et al., “Prediction of incident hip fracture risk by femur geometry variables measured by hip structural analysis in the study of osteoporotic fractures,” Journal of Bone and Mineral Research, 2008, vol. 23.12, pp. 1892-1904.
[4] Z. Ferdous, and Y. Luo, “Study of hip fracture risk by DXA-based patient-specific finite element model,” Bio-medical materials and engineering, 2015, vol. 25.2, pp. 213-220.
[5] J. Y. Rho, M. C. Hobatho, R. B. Ashman, “Relations of mechanical properties to density and CT numbers in human bone,” Medical engineering & physics, 1995, vol. 17.5, pp. 347-355.
[6] E. F Morgan, H. H. Bayraktar, T. M. Keaveny, “Trabecular bone modulus–density relationships depend on anatomic site,” Journal of biomechanics, 2003, vol. 36.7, pp. 897-904.
[7] J. Y. Kwon, et al., “Osteocyte Apoptosis-Induced Bone Resorption in Mechanical Remodeling Simulation-Computational Model for Trabecular Bone Structure,” in: Apoptosis and Medicine. InTech, 2012.
[8] E. Schileo, et al., “To what extent can linear finite element models of human femora predict failure under stance and fall loading configurations?,” Journal of biomechanics, 2014, vol. 47.14, pp. 3531-3538.
[9] S. Gnudi, E. Sitta, E. Pignotti, “Prediction of incident hip fracture by femoral neck bone mineral density and neck–shaft angle: a 5-year longitudinal study in post-menopausal females,” The British journal of radiology, 2014.
Proceedings VII Meeting Italian Chapter of the European Society of Biomechanics (ESB-ITA 2017) 28-29 September 2017, Rome - Italy
84
ISBN: 978-88-6296-000-7

Abstract—Augments are a quite common solution for treat bone loss in revision total knee arthroplasty. Industry provided to surgeon several options, in terms of material, thickness, shape and locations. However, proper guidelines for their use in clinical situations is not currently available. Therefore, a biomechanical analysis of available features for augment designs is performed in this study by means of finite element modelling. The results show that the presence of an augment slightly alters the bone stresses. The change in thickness of the augment did not result in significant change of bone stress while a change in material have an influence. The change in stress is more marked when a non-porous metal is used especially for tibial augments. Keywords—TKA, Single-Radius, J-Curved, walking, Squat.
I. INTRODUCTION n revision total knee arthroplasty (TKA), the management of bone loss depends on location, type, and extent of bony
deficiency. Treatment strategies involved cement filling, bone grafting and augments. On the market several solutions are currently available, differing for their shape, thickness and material. While the choice of the shape and the thickness is mainly dictated by the bone defect, no explicit guideline is currently available to describe the best choice of material to be selected for a specific clinical situation. However, the use of different materials could induce different responses in terms of bone stress and thus changes in implant stability that could worsen long-term implant performance.
For these reasons, this study aims at conducting a biomechanical investigation by analyzing the changes in bone stresses in the femur and in the tibia bones induced by the insertion of augments.
Different features for augment designs, such as different materials, thicknesses and locations, were investigated in the present study.
II. MATERIALS AND METHODSPhysiological three-dimensional tibial and femoral bone
models were generated from computer tomography images of a left fourth generation composite tibia and femur, size medium. Such models are widely used for numerical and experimental tests [1,2]. The tibial and femoral bone model consists of three parts: cortical bone, cancellous bone and the intramedullary canal.
Based upon a review of currently available products, different augments features were identified. For the augment placed on the femoral bone, the following different positions were considered: distal augment, posterior augment and distal and posterior augments. For all these positions, a thickness of
5 or 10 mm was considered. For the augment placed on the tibial bone only the proximal position was considered, with a thickness of 5, 10 or 15 mm. All the augments were placed in the medial condyle.
Apart the control, in which no augment was used, but only the TKA is considered, the augment was considered as potentially made by three different materials: bone cement, to simulate cement filling, porous tantalum trabecular metal and conventional metal (titanium for the tibia and CoCr for the femoral bone).
A conventional PS TKA design was considered in this study and implanted on the femoral and tibial bone according to the surgical guidelines provided by the manufacturer.
The analysis was performed by means of finite element modeling that were defined, in terms of the geometry, materials (Table I), and ligament pre-strain by following a previous validated model [3-5]
Each configuration was analysed applying the max force achieved during walking (2500 N) [6].
The bone stress was investigated, both in the medial and in the lateral side, analyzing two regions of interest, one close to the augment (investigating a region of 10 mm close to the augment) and the other one as a global region of 50 mm thickness.
The bone stress was compared among the different models and also with respect to the control model.
TABLE I: Material Model and Properties used in this study. The third axis was taken parallel to the anatomical axis.
Material Material Model
Elastic Modulus [GPa]
Poisson Ratio
Cortical bone
Transversally isotropic
E1 = 11.5 E2 = 11.5 E3 = 17.0
υ12 = 0.50 υ13 = 0.30 υ23 = 0.30
Cancellous bone isotropic E= 2.1 υ = 0.31
CoCr isotropic E= 240 υ = 0.30
UHMWPE isotropic E= 0.72 υ = 0.46
LCL isotropic E= 0.11 υ = 0.45
aMCL isotropic E= 0.20 υ = 0.45
pMCL isotropic E= 0.20 υ = 0.45
III. RESULTS
The use of an augment always induces a change in bone stress, especially in the region close to the augment (figure 1 and figure 2).
Biomechanical Analysis of Augments in Revision Total Knee Arthroplasty
Bernardo Innocenti1*, Silvia Pianigiani1
1 BEAMS Department, Université Libre de Bruxelles, Bruxelles, Belgium; *[email protected]
I
Proceedings VII Meeting Italian Chapter of the European Society of Biomechanics (ESB-ITA 2017) 28-29 September 2017, Rome - Italy
85
ISBN: 978-88-6296-000-7

The main parameter that is responsible of the change of bone stress is the material (stiffness) of the augment that should be as close as possible to the one of the bone.
In detail, the presence of no-porous metal in the tibial augment can change the bone stress (up to 19%) while the use of bone cement of porous tantalum metal can reduce the change in stress (less than 5%) that might result in a substantially lower loosening rate.
Therefore, bone cement has the best results in terms of bone stress, however, it is only suitable for extremely small defects. Porous tantalum trabecular metal has results very close to cement and it could be consider as a good alternative to cement for any size of defect.
Metal (both titanium and CoCr) has the least satisfying results inducing the highest change in bone stress with respect the control.
The change in thickness of the augment did not result in significant change of bone stress.
Figure 1: medial and lateral average bone stress in the control and for the different materials and thickness in the case of femoral augment
Figure 1: medial and lateral average bone stress in the control and for the different materials and thickness in the case of tibial augment
IV. CONCLUSION
Significant bone defects associated with component loosening, subsidence and osteolysis are commonly encountered during revision TKA. To treat them, femoral and tibial metal augments could be a valid alternative. Several
solutions are available on the market for different positions, in different shapes and materials. However, very few studies are nowadays available to provide possible guidelines based upon biomechanical studies on the effect of augment on bone stresses. The results of this study show that the presence of an augment slightly alters the bone stress in different locations. The change in thickness of the augment did not result in significant change of bone stress while a change in material have an influence on tibial bone stress. The change in stress is more marked when a non-porous metal is used for the tibial augment. Porous tantalum metal and bone cement will reduce the change in stress that might result in a substantially lower loosening rate.
ACKNOWLEDGEMENT This work was supported by FNRS (Fonds National de la
Recherche Scientifique, CDR 19545501) and by FER ULB (Fonds d’Encouragement à la Recherche, FER 2014). The funders had no role in study design, data collection and analysis, decision to publish, or preparation of the manuscript.
REFERENCES [1] Innocenti B, Bellemans J, Catani F (2015) Deviations from optimal
alignment in TKA: is there a biomechanical difference between femoral or tibial component alignment? J Arthroplasty 31(1):295–301.
[2] Soenen M, Baracchi M, De Corte R, et al. Stemmed TKA in a femur with a total hip arthroplasty. Is there a safe distance between the stem tips? J Arthroplasty 2013;28:1437.
[3] Innocenti B, Bilgen OF, Labey L, van Lenthe GH, Sloten JV, Catani F (2014) Load sharing and ligament strains in balanced, overstuffed and understuffed UKA. A validated finite element analysis. J Arthroplasty 29(7):1491–1498
[4] Brihault J, Navacchia A, Pianigiani S, Labey L, De Corte R, Pascale V, Innocenti B (2016) All-polyethylene tibial components generate higher stress and micromotions than metal-backed tibial components in total knee arthroplasty. Knee Surg Sports Traumatol Arthrosc 24:2550–2559
[5] Innocenti B, Pianigiani S, Ramundo G, Thienpont E. (2017) Biomechanical Effects of Different Varus and Valgus Alignments in Medial Unicompartmental Knee Arthroplasty. J Arthroplasty (in press)
[6] International Standards Organization. Standard number 14243-1: Implants for surgery. Wear of total knee-joint prostheses; Part 1: Loading and displacement parameters for wear-testing machines with load control and corresponding environmental conditions for test. Geneva: ISO, 2009.
Proceedings VII Meeting Italian Chapter of the European Society of Biomechanics (ESB-ITA 2017) 28-29 September 2017, Rome - Italy
86
ISBN: 978-88-6296-000-7

Abstract—Single-radius and J-Curved femoral components are two currently available designs used for femoral components of total knee arthroplasty (TKA). Apart from clinical studies, no literature work compares, biomechanically and exhaustively, these two TKA solutions up to now. This research study aim at investing the effect of the two different femoral designs during daily activities, as walking and squat, using finite element analysis. Comparing TKA kinetics and kinematics between the two designs, the main differences were identified only for high flexion activities, after 80° of knee flexion. Keywords—TKA, Single-Radius, J-Curved, Walking, Squat.
I. INTRODUCTION p to the last decade, native knee joints were thought to present multiple instantaneous centers of knee
flexion/extension rotation, therefore the femoral components shapes for TKA purposes were designed with a progressive decrease of the radius of curvature. This approach is followed in the design of the so called J-Curve femoral component that are widely used, providing successful clinical outputs. Their success can be attributed to the claimed reduction in mobility and pain caused by usual diseases such as osteoarthritis, post-traumatic or rheumatoid arthritis. Such design feature, changing the radius from 0° and 90°, could be linked to the "Mid-range instability" because it allows ligament slackness and instability during knee flexion. For this reason, single-radius designs have been introduced. This design is claimed to ensure consistent tension in the collateral ligaments throughout the functional range of movement. This philosophy is based on the isometry of the superficial medial collateral ligament, and that is widely accepted as basis of soft tissue tensioning in knee replacement.
However, it is reasonable to hypothesize that single-radius design modification in the geometry may induce changes in the functional performance of the artificial joint, leading to a different load distribution and, therefore, different polyethylene stress, different kinematics and different strains in the ligaments.
To check this assumption, in this study, the biomechanical behaviour of the two different femoral designs was analyzed and compared during walking and squatting. In particular, the tibio-femoral contact forces and kinematics, together with the collateral ligament strain, were analyzed and compared using a previously validated finite element model.
II. MATERIALS AND METHODSPhysiological three-dimensional tibial and femoral bone
models were generated from computer tomography images of
a left, fourth generation, composite tibia and femur, size medium. Such models are widely used for numerical and experimental tests [1,2]. The tibial and femoral bone model consists of three parts: cortical bone, cancellous bone and the intramedullary canal.
Starting from a conventional J-Curved femoral component, the correspondent single-radius design was developed. The two femoral components were coupled with the same tibial insert defining two separate implant models. The TKA design was implanted on the femoral and tibial bone according to the surgical guidelines provided by the manufacturer. Each of them was investigated during a walking and squat motor task.
The analysis was performed by means of finite element models that were defined, in terms of the geometry, materials (Table I), ligament pre-strain following a previous validated published model [3-5]. For the walking activities the load conditions were based according to the (ISO 14243-1) [6], while for the squat they follow the one measured during an experimental activity [7,8]. In this study, the investigated parameters were:
- implant contact areas and forces, - bone and polyethylene stresses, - ligaments strains, - tibio-femoral kinematics.
TABLE I: Material Models and Properties used in this study. The third axis was taken parallel to the anatomical axis.
Material Material Model
Elastic Modulus [GPa]
Poisson Ratio
Cortical bone
Transversally isotropic
E1 = 11.5 E2 = 11.5 E3 = 17.0
υ12 = 0.50 υ13 = 0.30 υ23 = 0.30
Cancellous bone isotropic E= 2.1 υ = 0.31
CoCr isotropic E= 240 υ = 0.30
UHMWPE isotropic E= 0.72 υ = 0.46
LCL isotropic E= 0.11 υ = 0.45
aMCL isotropic E= 0.20 υ = 0.45
pMCL isotropic E= 0.20 υ = 0.45
III. RESULTS
For walking (Figure 1), no significant differences were noticed between the two designs both in kinematics and kinetics outputs (changes in contact forces and ligament strains lower than 1%).
Single-Radius vs J-Curved Femoral Designs during Walking and Squatting
Bernardo Innocenti1*, Giulia Rosellini1, Silvia Pianigiani1
1 BEAMS Department, Université Libre de Bruxelles, Bruxelles, Belgium; *[email protected]
U
Proceedings VII Meeting Italian Chapter of the European Society of Biomechanics (ESB-ITA 2017) 28-29 September 2017, Rome - Italy
87
ISBN: 978-88-6296-000-7

Figure 1: Contact pressure [MPa] and area distribution and location for J-Curved (JC) and Single Radius (SR) during walking.
During the squat task (Figure 2), the two TKAs present similar behaviour, up to around 80° of flexion. After this specific flexion value, the single-radius design starts to translate more posteriorly generating a slight different kinematics with respect to the J-Curved design. Moreover, contact forces and pressure outputs were also higher, up to 25%, and the MCL strains were also slight higher.
Figure 2: Contact pressure [MPa] and area distribution and location for J-Curved (JC) and Single Radius (SR) during squat.
IV. CONCLUSION
During walking, for which the maximum knee flexion is 60°, the two analysed TKA solutions show a similar behaviour in terms of kinematics and contact forces. However, during squatting, after 80° of knee flexion, the single-radius design determines slight differences in kinematics and higher tibio-femoral forces that could induce higher polyethylene tibial-femoral and post-cam stresses, furthermore, the MCL strain are also higher, but only after 90°. Therefore, as also reported by other authors in the literature [8-10], the results of this study did not find mid-range instability of the knees, and so they could not demonstrate enhanced mid-range stability of the single-radius TKA over the older multi-radius implant.
ACKNOWLEDGEMENT This work was supported by FNRS (Fonds National de la
Recherche Scientifique, CDR 19545501) and by FER ULB (Fonds d’Encouragement à la Recherche, FER 2014). The funders had no role in study design, data collection and analysis, decision to publish, or preparation of the manuscript.
REFERENCES [1] Innocenti B, Bellemans J, Catani F (2015) Deviations from optimal
alignment in TKA: is there a biomechanical difference between femoral or tibial component alignment? J Arthroplasty 31(1):295–301.
[2] Soenen M, Baracchi M, De Corte R, et al. Stemmed TKA in a femur with a total hip arthroplasty. Is there a safe distance between the stem tips? J Arthroplasty 2013;28:1437.
[3] Innocenti B, Bilgen OF, Labey L, van Lenthe GH, Sloten JV, Catani F (2014) Load sharing and ligament strains in balanced, overstuffed and understuffed UKA. A validated finite element analysis. J Arthroplasty 29(7):1491–1498
[4] Brihault J, Navacchia A, Pianigiani S, Labey L, De Corte R, Pascale V, Innocenti B (2016) All-polyethylene tibial components generate higher stress and micromotions than metal-backed tibial components in total knee arthroplasty. Knee Surg Sports Traumatol Arthrosc 24:2550–2559
[5] Innocenti B, Pianigiani S, Ramundo G, Thienpont E. (2017) Biomechanical Effects of Different Varus and Valgus Alignments in Medial Unicompartmental Knee Arthroplasty. J Arthroplasty (in press)
[6] International Standards Organization. Standard number 14243-1: Implants for surgery. Wear of total knee-joint prostheses; Part 1: Loading and displacement parameters for wear-testing machines with load control and corresponding environmental conditions for test. Geneva: ISO, 2009.
[7] Victor J, Labey L, Wong P, Innocenti B, Bellemans J, The Influence of muscle load on tibio-femoral knee kinematics, J Orthop Res 28:419–428, 2010.
[8] Victor J, Van Doninck D, Labey L, Van Glabbeek F, Parizel P, Bellemans J (2009) A common reference frame for describing rotation of the distal femur: a ct-based kinematic study using cadavers. J Bone Joint Surg Br 91(5):683–690
[9] Innocenti B, Yagüe HB, Bernabé RA, Pianigiani S, Investigation on the effects induced by TKA features on tibio-femoral mechanics part I: femoral component designs, Journal of Mechanics in Medicine and Biology, 15(2):1-7, 2015.
[10] Mahoney OM, McClung CD, dela Rosa MA, Schmalzried TP, The Effect of Total Knee Arthroplastry Design on Extensor Mechanism Function, The Journal of Arthroplasty, 17(4):416-421, 2002.
Proceedings VII Meeting Italian Chapter of the European Society of Biomechanics (ESB-ITA 2017) 28-29 September 2017, Rome - Italy
88
ISBN: 978-88-6296-000-7

Abstract— Dynamic nanoindentation is an experimental technique suitable to characterize articular cartilage on its superficial layer and to determine elastic properties as well as hydraulic tissue permeability. Anisotropic mechanical properties of the tissue, owed to its micro-scale architecture of the collagen fibril network, makes the mechanical characterization a challenging task. Models for the dynamic nanoindentation experiment provide useful insight allowing for more refined characterization technique. In this paper, dynamic nanoindentation of cartilage is investigated with particular reference to the tissue anisotropic mechanical and physical properties. Anisotropic permeability is introduced in a coupled fluid-mechanics modeling in the frequency domain. The focus of this work is on the effect of anisotropy in tissue permeability on the frequency response of the cartilage. The final aim is to define specific experimental measures able to identify hydraulic permeability properties of the tissue. To this aim, the peculiar effect of geometric features (indenter radius) is investigated.
Keywords—cartilage nanoindentation, frequency response, anisotropic permeability.
I. INTRODUCTION HE analysis of articular cartilage properties is a branch of great interest in both clinical and biomaterials study; in
fact, its peculiar structure strongly inhomogeneous, anisotropic, non-linear, with time and depth-dependent features [1] gives its fundamental role in the correct functionality of joints, in terms of load transmission and lubrication support. This tissue can be seen as a porous solid matrix, constituted by chondrocytes, collagen fibers and proteoglycans, saturated with synovial liquid; therefore, mechanisms that rule its mechanical behaviour are viscoelasticity, due to the solid phase, and poroelasticity, due to the fluid flow through the pores. In particular, the superficial layer has a very important role; acting as a protective barrier, its damage involves decreasing in stiffness, with resulting problems in load transmission, and increasing in permeability, altering its physiological internal pressurization [2]. Therefore, the study of properties like stiffness and permeability is crucial for establishing a correlation between their variations and pathological condition of the overall tissue. For the simulation of cartilage actual load we use dynamic mechanical analysis, where the load is imposed cyclically [3]. Through indentation we can get the contribution of single constituents at nanometric level. Therefore, in this work, we simulate and analyse, exploiting a combination of the finite element framework Abaqus (Simulia, Providence, RI, USA) and the data processing software Matlab (MathWorks, Natick, MA, USA), the frequency response of materials tested in indentation,
evaluating how anisotropic parameters as stiffness and permeability affect superficial layer mechanical behaviour.
II. METHODS
Dynamic nanoindentation tests are here simulated. In this experiment, a spherical tip is put in contact with the sample and a preload is applied. A harmonic oscillation at a given frequency is applied at the tip and the force is monitored throughout the cycles. When stationarity response is achieved for a given frequency, force oscillation amplitude and time shifts are recorded. The measurement is performed for a wide range of frequency so to have a spectrum of the frequency response of the tissue [4].
The dynamic nanoindentation experiments have been simulated in the frequency domain by simulating the coupled mechanical response of a fully saturated deformable anisotropic material [5]. Given the small harmonic oscillations of the indenter tip, a linearized anisotropic stress-strain relationship has been used:
Δ! =! −!−! 1
−!" 0−! 0
−!" −!0 0
! 00 !!
!
Δ! (1)
in which ! is the elastic anisotropy ratio Ea/Er (axial versus radial elastic modulus), ! is the out-of-isotropy plane Poisson ratio and ! is the in-plane Poisson ratio.
The fluid flow through the porous microstructure has been modeled through the Darcy type relationship:
! = ! ∇! (2)
in which K is the permeability tensor that for anisotropic tissue is here assumed as:
! = !! !! !! (3)
and ∇! is the fluid pressure gradient. In order to perform a parametric study, anisotropy ratio for
the permeability !! = !! !! and an average permeability ! = !!!!!!
! have been introduced. The linearized problem in the frequency domain is the
solved through the linear finite element system of equations:
!!! −!!" !!" −!!!
!! = !!
!! (4)
Effect of anisotropic permeability on the dynamic response of cartilage under nanoindentation
P. Vena1 and D. Gastaldi1
1 Department of Chemistry, Materials and Chemical Engineering, Politecnico di Milano, Italy email:[email protected]; [email protected]
T
Proceedings VII Meeting Italian Chapter of the European Society of Biomechanics (ESB-ITA 2017) 28-29 September 2017, Rome - Italy
89
ISBN: 978-88-6296-000-7

in which U and P are the nodal variables of displacement and fluid pressure, respectively, f is the frequency of excitation of the tip and i is the imaginary unit.
In this study four different tip radii have been simulated: 400 µm, 125 mm, 25 µm and 7.5 µm. The initial penetration depth (pre-load) was such that h0=R/10 in all cases so to have the same strain level in the tissue for all the studied cases. The finite element model in the frequency domain provided as results the force amplitude and the time shift for all frequency studied.
Fig. 1: Time shift for different values of perimeability anisotropy (tip raius=7.5 µm)
Fig. 2: Maximum time shift for different anisotropy ratio of permeability and different tip radii.
Fig. 3: Frequency at maximum time shift for different anisotropy ratio of permeability and different tip radii.
III. RESULTS AND DISCUSSIONS
Fig. 1 shows the typical spectrum for the time shift in a dynamic nanoindentation simulations with a 7.5 µm tip radius and different permeability anisotropy ratios (average permeability is kept constant). It is worth noting that permeability anisotropy has an appreciable effect on two main experimental factors: i) the maximum time shift (peak of the curves) and ii) the frequency at maximum time shift.
Fig. 2 shows the value of the maximum time shift vs permeability anisotropy ratio (Ak) for different tip radii. Time shift increases with Ak (i.e. with increasing axial permeability with respect to radial permeability). Fig. 3 shows the frequency at peak vs Ak for all tip radii. Frequency at peak generally decreases with increasing Ak . Comparing Fig.2 and Fig. 3 it is worth noting that the characteristic size of the experiment (tip radius) does have a considerable effect on the frequency at peak while it is irrelevant for the peak height.
IV. CONCLUSION
The results achieved in this work show the relevance of the frequency domain modeling allowing for anisotropic permeability. As the characteristic size of the experiment (tip radius) is showing a considerable effect on some of the experimental measures (frequency at peak of time shift) and a negligible effect on other measures (height of the time shift peak), an experimental procedure can be envisaged in which different tip radii are used so to identify both tissue elastic and permeability anisotropy of the superficial layers.
ACKNOWLEDGEMENT
The Authors acknowledge the assistance of the student Andrea Chiara De Nadai in performing numerical simulations presented in this paper.
REFERENCES [1] M. Taffetani, M. Griebel, D. Gastaldi, S. Klisch, and P. Vena,
“Poroviscoelastic Finite Element Model Including Continuous Fiber Distribution for the Simulation of Nanoindentation Tests on Articular Cartilage,” J. Mech. Behav. Biomed. Mater., 32(1), 2014 pp. 17–30.
[2] A. Pearle, R. Warren, and S. Rodeo, “Basic Science of Articular Cartilage and Osteoarthritis,” Clin. Sports Med., 24(1), 2005 pp. 1–12.
[3] O. Franke, M.Goken, M. Meyers, K. Durst, and A. Hodge, “Dynamic Nanoindentation of Articular Porcine Cartilage,” Mater. Sci. Eng. C, 31(4), 2011, pp. 789–795.
[4] M. Taffetani, R. Raiteri, R. Gottardi, D. Gastaldi, p. Vena, "A quantitative interpretation of the response of articular cartilage to atomic force microscopy-based dynamic nanoindentation tests", Journal of Biomechanical Engineering, 2015, pp. 071005-1- 071005-8.
[5] M. Taffetani, E. Bertarelli, R. Gottardi, R. Raiteri, and P. Vena, “Modelling of the Frequency Response to Dynamic Nanoindentation of Soft Hydrated Anisotropic Materials: Application to Articular Cartilage,” Comput. Model. Eng. Sci., 87(5), 2012 pp. 433–460.
Proceedings VII Meeting Italian Chapter of the European Society of Biomechanics (ESB-ITA 2017) 28-29 September 2017, Rome - Italy
90
ISBN: 978-88-6296-000-7

Abstract— Our research hypothesis is that the explicit modelling of cortical bone layer through cortical bone mapping (validated for cortical thickness and density estimates) can improve the accuracy of CT-based FE models of the proximal femur, locally limited by CT partial volume artefacts. This hypothesis was tested in terms of elastic strain prediction on a published cohort of 10 femurs, against strain measurements in stance and fall loading configuration. Preliminary results in two specimens modelled with constant cortical density confirmed that in focal areas where reference models showed peak errors, strain accuracy can be greatly improved, at the cost of a global over-stiffening of the structure, which may be resolved by modelling variable cortical density in the study follow-up.
Keywords— proximal femur, cortical bone, finite element, CT deconvolution algorithms.
I. INTRODUCTION FTER more than 20 years of technical development, femoral strength estimates from CT-based FE models
(FE-strength for short) have reached clinical trials. Notably, three FE-strength studies demonstrated a superior fracture classification ability than the current standard of care (aBMD) [1-3], but the cost-effectiveness ratio of FE-strength is not yet appealing for routine clinical application. The FE-strength methodologies of [1-3] diverge significantly as to model creation, material modelling, and failure criterion. We observed a similar concordance of results and difference in methods in FE-strength validation studies [4]. Also in these, results are overall good, yet sub-optimal. What are current models lacking to improve their performance? One morphological feature usually not modeled in current FE-strength approaches is the cortical/trabecular distinction. This omission is mainly due to the blurred appearance of the thin cortical bone layer, caused by the partial volume effect (PVE) inherent in CT images. There is evidence that PVE in CT images influences FE results [5], and impairs FE strain prediction accuracy: in a past study we found that peak errors in FE predictions against experimental strain gauge measurements happened at sites of thin cortical bone shell (i.e. all around the femoral neck) [6]. These sites correspond to areas of actual fracture development [4].
Recently, Treece et al. developed and validated cortical bone mapping (CBM), which estimates cortical bone thickness from CT images by way of a deconvolution algorithm, [7]. A newer version of CBM accurately estimates not only cortical thickness but also cortical density [8].
Our research hypothesis is that the explicit modelling of cortical bone layer through CBM can improve the accuracy of CT-based FE models of the proximal femur. In the present
study we focused on testing this hypothesis in terms of strain prediction accuracy in the elastic field, on a published cohort of 10 femurs where strain gauge measurements were available for stance and side-fall loading configuration [9].
II. MATERIALS AND METHODS
A. Specimens This study used specimens, images, and reference models
from a previous experimental campaign. Specimen and imaging details of the ten fresh-frozen cadaveric femurs were presented in [9]. It is worth recalling that no donors suffered from musculo-skeletal diseases, and that CT scans were taken over the whole femur with a clinical protocol.
B. Experimental tests Details of the experimental protocol for mechanical testing
of the femurs were presented in [10] for stance (all specimens) and in [11] for fall (specimens #4-10) loading configurations. It is worth recalling that:
(i) a uniaxial testing machine (Mod. 8502, Instron, US) with low-friction bearings was used;
(ii) 12 triaxal strain gauges (KFG - 3-120-D1711L3M2S, Kyowa, Japan) were glued on the four anatomical aspects at three distal levels (head, neck and metaphysis) to measure the magnitude and direction of principal strains.
(iii) six different loading directions were applied directly to the femoral head to mimic stance configuration (0°, 3°, 8° and 24° in the frontal plane, –3° and 18° in the sagittal plane;
(iv) twelve different directions combining three internal rotation (0°, 15° and 30°) and four adductions angles (0°, 10°, 20° and 30°) were applied to mimic fall configuration, delivering the load through aluminium spherical caps cemented to the femoral head and greater trochanter.
C. Cortical bone mapping We performed the CBM using the freeware Stradwin 5.2
(http://mi.eng.cam.ac.uk/~rwp/stradwin/). We segmented the proximal femur to have an initial estimate of the surface, through which profiles of HU values are sampled, and used to obtain deconvolved cortical thickness and density. We then:
(ii) ran the deconvolution algorithm keeping cortical density constant so to estimate the cortical layer (i.e. periosteal and endosteal cortical surfaces), called Cortical model I (CmI)
(iii) ran the deconvolution algorithm with variable cortical density so to estimate both the cortical layer, and cortical density at profiles normal to the surface (CmII).
Does cortical bone mapping improve FE strain prediction accuracy at the proximal femur?
J. Pitocchi1, S. Paletti1, B. Cominoli1, F. Taddei1,2, and E. Schileo2 1 Laboratorio di Tecnologia Medica, Istituto Ortopedico Rizzoli, Bologna, Italy ; email: [email protected]
2 Laboratorio di Bioingegneria Computazionale, Istituto Ortopedico Rizzoli, Bologna, Italy ; email: [email protected]
A
Proceedings VII Meeting Italian Chapter of the European Society of Biomechanics (ESB-ITA 2017) 28-29 September 2017, Rome - Italy
91
ISBN: 978-88-6296-000-7

D. FE models To generate the FE models using CBM we first obtained B-
spline representations of the surfaces (Geomagic Studio, v. 7, Raindrop Geomagic, Inc., USA), then meshed with 10-node tetrahedra the cortical layer (mesh size d1 mm) and the trabecular compartment (Hypermesh 13.0, Altair Engineering Inc., USA). In the trabecular compartment, we mapped bone properties with Bonemat (freeware at www.bonemat.org). For the cortical layer, we developed a specialised Bonemat (still unpublished) that takes as input cortical density values sampled at outer surface locations. Two models were thus generated, from CmI and CmII (variable cortical density).
To define inhomogeneous isotropic material properties, radiological density from the densitometric CT calibration was converted first to ash then to wet density according to [12]. The density-elasticity relationship of [13] was used.
Boundary conditions mimicked those of the experimental tests, following a spatial registration procedure. As only the proximal femur cortical model was available, we adopted a cut-boundary displacement method to replicate the experimental distal constraint, as in [10].
Linear FE analyses were performed (Ansys Inc., v. 15, USA). At the surface, we assumed a plane-stress state. Principal strains were calculated by averaging for each surface node (corresponding to the closest point where each strain gauge was located on the femur) the strains values in a circle of 3 mm to guarantee the continuum hypothesis.
III. RESULTS
We here present preliminary results on two specimens, for the FE model featuring constant cortical bone density (CmI), compared to results of reference FE models [9]. Two different result trends clearly emerge from the data.
Locally, at sites of cortical thinning where reference model was inaccurate, all accuracy metrics improved (Table 1).
Conversely, global accuracy metrics remained almost unaffected (Table 2), although peak error was significantly
reduced. Reduction in peak errors but concomitant global over-stiffening (as witnessed by regression slope well below unity) explain these global figures. Separating data per specimen or loading configuration had almost no effect on accuracy metrics.
IV. CONCLUSION
We incorporated for the first time (to our knowledge) accurate local cortical thickness estimates from a CT image deconvolution algorithm into CT-based FE models of the proximal femur. Preliminary results confirmed our hypothesis that explicit modelling of the cortical layer can improve FE strain accuracy where reference models are usually show the highest errors. However, these improvements were counterbalanced by a general over-stiffening of the model response, possibly due to the assignment of constant density to the cortical layer, resulting in an homogeneous, high elastic modulus (around 18-20 GPa). We expect that modelling local variation of cortical density can help resolve this problem.
ACKNOWLEDGEMENT Italian Donation Program 5x1000, year 2013.
REFERENCES
[1] D. L. Kopperdahl, T. Aspelund, P. F. Hoffmann, S. Sigurdsson, et al. "Assessment of incident spine and hip fractures in women and men using finite element analysis of CT scans" J Bone Miner Res vol. 29, pp. 570–80, 2014.
[2] C. Falcinelli, E. Schileo, L. Balistreri, F. Baruffaldi, et al. "Multiple loading conditions analysis can improve the association between finite element bone strength estimates and proximal femur fractures: A preliminary study in elderly women" Bone vol. 67, pp. 71–80, 2014.
[3] K. K. Nishiyama, M. Ito, A. Harada, and S. K. Boyd. "Classification of women with and without hip fracture based on quantitative computed tomography and finite element analysis" Osteoporos. Int. vol. 25, pp. 619–626, 2014.
[4] E. Schileo, L. Balistreri, , L. Grassi, L. Cristofolini, and F. Taddei. "To what extent can linear finite element models of human femora predict failure under stance and fall loading configurations" J Biomech vol. 47, pp. 3531–3538, 2014.
[5] T. D. Szwedowski, J. Fialkov, and C. M. Whyne. "Sensitivity Analysis of a Validated Subject-Specific Finite Element Model of the Human Craniofacial Skeleton" J Eng Med vol. 225, pp. 58–67, 2011.
[6] L. Grassi, E. Schileo, F. Taddei, L. Zani, et al. "Accuracy of finite element predictions in sideways load configurations for the proximal human femur" J. Biomech vol. 45, pp 394–399, 2012.
[7] G. M. Treece, K. E. Poole, A. H. Gee, "Imaging the femoral cortex: thickness, density and mass from clinical CT" Med Image Anal vol. 16, pp. 952-965, 2012.
[8] G. M. Treece and A. H. Gee. "Independent measurement of femoral cortical thickness and cortical bone density using clinical CT" Med Image Anal vol. 20, pp. 249-264, 2015.
[9] C. Falcinelli, E. Schileo, A. Pakdel, C. M. Whyne, et al. "Can CT image deblurring improve finite element predictions at the proximal femur?" J Biomech Behav Biomed Mater, vol. 63 , pp. 337-351, 2016.
[10] L. Cristofolini, M. Juszczyk, F. Taddei, and M. Viceconti. "Strain distribution in the proximal human femoral metaphysis" J Eng Med vol. 223, pp. 273–288, 2009.
[11] L. Zani, P. Erani, L. Grassi, F. Taddei, and L. Cristofolini. "Strain distribution in the proximal Human femur during in vitro simulated sideways fall" J Biomech vol. 48, pp. 2130–2143, 2015.
[12] E. Schileo, E. Dall’Ara, F. Taddei, A. Malandrino, et al. "An accurate estimation of bone density improves the accuracy of subject-specific finite element models" J Biomech vol. 41, pp. 2483–2491, 2008.
[13] E. F. Morgan, H. H. Bayraktar, and T. M. Keaveny. "Trabecular bone modulus–density relationships depend on anatomic site" J Biomech vol. 36, pp. 897–904, 2003.
TABLE II GLOBAL FE STRAIN ACCURACY (ALL DATA POOLED)
Title Reference Model Cortical model I R^2 0.90 0.89
Slope 1.24 0.69
Intercept (PH) -10 -7
RMSE% 14.0% 11.5%
Max err% 74.4% 45.1% FE strain accuracy pooling all 816 strain data
TABLE I LOCAL FE STRAIN ACCURACY (ANTERIOR NECK STRAIN GAUGE)
Title Reference Model Cortical model I R^2 0.97 0.99
Slope 2.70 1.01 Intercept (PH) 6 -5
RMSE% 90.0% 3.8% Max err% 193.2% 7.1%
FE strain accuracy at a neck site where reference model errors were high
Proceedings VII Meeting Italian Chapter of the European Society of Biomechanics (ESB-ITA 2017) 28-29 September 2017, Rome - Italy
92
ISBN: 978-88-6296-000-7
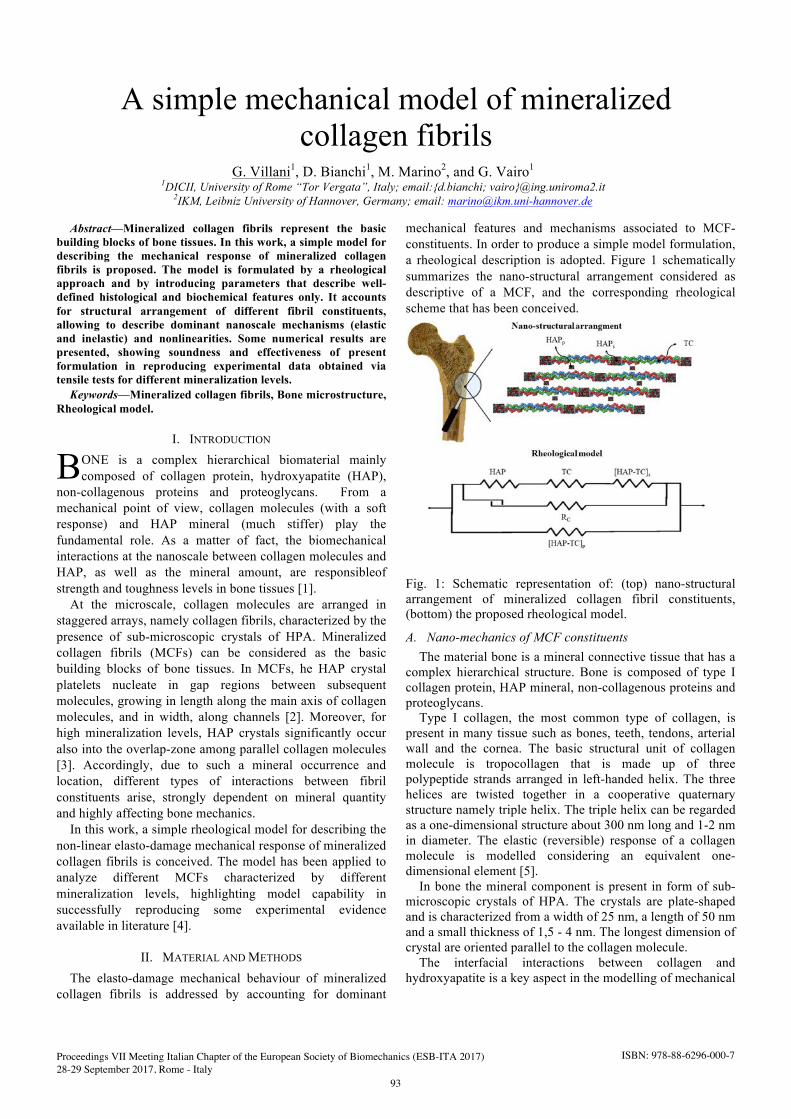
Abstract—Mineralized collagen fibrils represent the basic building blocks of bone tissues. In this work, a simple model for describing the mechanical response of mineralized collagen fibrils is proposed. The model is formulated by a rheological approach and by introducing parameters that describe well-defined histological and biochemical features only. It accounts for structural arrangement of different fibril constituents, allowing to describe dominant nanoscale mechanisms (elastic and inelastic) and nonlinearities. Some numerical results are presented, showing soundness and effectiveness of present formulation in reproducing experimental data obtained via tensile tests for different mineralization levels. Keywords—Mineralized collagen fibrils, Bone microstructure,
Rheological model.
I. INTRODUCTION ONE is a complex hierarchical biomaterial mainly composed of collagen protein, hydroxyapatite (HAP),
non-collagenous proteins and proteoglycans. From a mechanical point of view, collagen molecules (with a soft response) and HAP mineral (much stiffer) play the fundamental role. As a matter of fact, the biomechanical interactions at the nanoscale between collagen molecules and HAP, as well as the mineral amount, are responsibleof strength and toughness levels in bone tissues [1].
At the microscale, collagen molecules are arranged in staggered arrays, namely collagen fibrils, characterized by the presence of sub-microscopic crystals of HPA. Mineralized collagen fibrils (MCFs) can be considered as the basic building blocks of bone tissues. In MCFs, he HAP crystal platelets nucleate in gap regions between subsequent molecules, growing in length along the main axis of collagen molecules, and in width, along channels [2]. Moreover, for high mineralization levels, HAP crystals significantly occur also into the overlap-zone among parallel collagen molecules [3]. Accordingly, due to such a mineral occurrence and location, different types of interactions between fibril constituents arise, strongly dependent on mineral quantity and highly affecting bone mechanics.
In this work, a simple rheological model for describing the non-linear elasto-damage mechanical response of mineralized collagen fibrils is conceived. The model has been applied to analyze different MCFs characterized by different mineralization levels, highlighting model capability in successfully reproducing some experimental evidence available in literature [4].
II. MATERIAL AND METHODS
The elasto-damage mechanical behaviour of mineralized collagen fibrils is addressed by accounting for dominant
mechanical features and mechanisms associated to MCF- constituents. In order to produce a simple model formulation, a rheological description is adopted. Figure 1 schematically summarizes the nano-structural arrangement considered as descriptive of a MCF, and the corresponding rheological scheme that has been conceived.
Fig. 1: Schematic representation of: (top) nano-structural arrangement of mineralized collagen fibril constituents, (bottom) the proposed rheological model.
A. Nano-mechanics of MCF constituents The material bone is a mineral connective tissue that has a
complex hierarchical structure. Bone is composed of type I collagen protein, HAP mineral, non-collagenous proteins and proteoglycans.
Type I collagen, the most common type of collagen, is present in many tissue such as bones, teeth, tendons, arterial wall and the cornea. The basic structural unit of collagen molecule is tropocollagen that is made up of three polypeptide strands arranged in left-handed helix. The three helices are twisted together in a cooperative quaternary structure namely triple helix. The triple helix can be regarded as a one-dimensional structure about 300 nm long and 1-2 nm in diameter. The elastic (reversible) response of a collagen molecule is modelled considering an equivalent one-dimensional element [5].
In bone the mineral component is present in form of sub-microscopic crystals of HPA. The crystals are plate-shaped and is characterized from a width of 25 nm, a length of 50 nm and a small thickness of 1,5 - 4 nm. The longest dimension of crystal are oriented parallel to the collagen molecule.
The interfacial interactions between collagen and hydroxyapatite is a key aspect in the modelling of mechanical
A simple mechanical model of mineralized collagen fibrils
G. Villani1, D. Bianchi1, M. Marino2, and G. Vairo1
1DICII, University of Rome “Tor Vergata”, Italy; email:d.bianchi; [email protected] 2IKM, Leibniz University of Hannover, Germany; email: [email protected]
B
Proceedings VII Meeting Italian Chapter of the European Society of Biomechanics (ESB-ITA 2017) 28-29 September 2017, Rome - Italy
93
ISBN: 978-88-6296-000-7

response. The interaction in the hole zone as well as the interaction in overlap region are accounted in the model [6].
B. Rheological model The behaviour of viscoelastic materials under uniaxial
loading may be represented by means of conceptual models composed of elastic and viscous elements which provide physical insight. The developed model accounts: (i) mechanical response of tropocollagen molecule; (ii) mechanical response of HAP cristals; (iii) interaction between tropocollagen molecules and HAP in hole zone; (iv) interaction between tropocollagen and HAP in the overlap region; (v) restraint mechanism.
III. RESULTS
Results are obtained addressing a tensile test. In particular, stress-strain curve are obtained, highlighting the coupled influence of mineralization and of different tropocollagen HAP interaction. Fig. 2 shown the obtained results for two mineralized collagen fibrils, with different HAP content, in comparison with experimental data [4].
Fig. 2: Stress - strain response resulting from tensile tests for: (top) low content HAP mineralized collagen fibrils, (bottom) high content HAP mineralized collagen fibrils. Comparison between present model (blue line) and experimental data [4].
IV. CONCLUSION
The mechanical response of mineralized collagen fibrils has been addressed by proposing a simple rheological model, based on histological and biochemical features.
Numerical results show the model capability in reproduce the experimental evidence found in literature and is able to reproduce the different behaviour of mechanical responses to external load.
Moreover, the developed model, based on a structurally-motivated description, accounts dominant nano-scale mechanisms in order to understand the interaction between the mineralized collagen fibrils constituents. It is worth to highlighting that the used approach introduces model parameters describing well-defined histological and biochemical features only, thereby opening to a straight-forward model calibration based on clinical/experimental
evidence gates.
ACKNOWLEDGEMENT
D. Bianchi, G. Vairo: Italian Minister of University and Research, MIUR (Consolidate the Foundations 2015 - BIOART).
M. Marino: State of Lower Saxony (Germany) - Masterplan “Smart Biotecs”.
REFERENCES [1] S. Weiner, H.D. Wagner, “The material bone: structure-mechanical
function relations”, Annual Review of Materials Science, vol. 28, pp. 271-298, 1998.
[2] W. J. Landis, H. S. Frederick, “Mineral Deposition in the Extracellular Matrices of Vertebrate Tissues: Identification of Possible Apatite Nucleation Sites on Type I Collagen.” Cells, Tissues, Organs, vol. 189, pp. 20-24, 2017.
[3] A. L. Arsenault, M.D. Grynpas, “Crystals in calcified epiphyseal cartilage and cortical bone of the rat”. Calcif. Tissue Int. vol. 43,pp 219-225, 1988.
[4] F. Hang A. H. Barber, “Nano-mechanical properties of individual mineralized collagen fibrils from bone tissue, J. R. Soc. Interface, vol. 8, pp 500-505, 2011.
[5] F. Maceri, M. Marino, G. Vairo, “Age-Dependent Arterial Mechanics via a Multiscale Elastic Approach”, Int. J. Comp. Meth. Engrg. Science Mech, vol. 14, pp. 141-151, 2013.
[6] Z. Qin, A. Gautieri, A. K. Nair, H. Inbar, M. J. Buehler, “Thickness of Hydroxyapatite Nanocrystal Controls Mechanical Properties of the Collagen-Hydroxyapatite Interface”, Langmuir, vol. 28 (4), pp. 1982-1992, 2012.
Proceedings VII Meeting Italian Chapter of the European Society of Biomechanics (ESB-ITA 2017) 28-29 September 2017, Rome - Italy
94
ISBN: 978-88-6296-000-7

GENERAL SESSION
Orthopaedic Biomechanics: Devices and Treatments


Abstract— Depending on the level and completeness of the damage, the
bone marrow injury can give rise to four different clinical frameworks: tetraplegia, paraplegia, tetraparesis, paraparesis. The impact of the problem for the health care system is very high and complex for the risk of death and for the costs. It is widely demonstrated that solutions for rehabilitation and for the aids which allow the “upright position” are also very useful to improve the functionality of the internal organs and avoid the bedsores. The state of art of the Powered Exoskeletons and usability in the rehabilitation process have been investigated. Particular attention was also dedicated to the novel methodologies based on the Brain Computer Interface (BCI) applied to the Powered Exoskeletons. The study ends pointing out the basic issues for the integration to a health care process; (a) the integration with the domotics, tele-rehabilitation, virtual reality environments; (b) the importance of a wider risk analysis. Keywords—Powered exoskeleton, tele-rehabilitation
I. INTRODUCTION HE medullar damage is a very wide ranging health problem. Depending on the magnitude of the damage to the spinal
cord, medullar lesions occur distinguish themselves in complete and incomplete [1-3]: the complete lesion is where it exists a total anatomic interruption of all nerve communication below the level of wound; the incomplete lesion, on the other hand, presuppose a kind of neurological "savings" below the level of injury. Depending on the level and completeness of the damage, the injury bone marrow can give rise to four different clinical problems [3]: - Tetraplegia - Paraplegia - Tetraparesis - Paraparesis The dimension of the problem is very wide. It has been reported in [3] that: • The ratio is about 1 every 1000 subjects in the USA.• The ratio is 18/20 new cases every 1.000.0000 subjects foreach year; the 80 % of subjects has an age comprised between 10-40 years with a prevalence of the paraplegia. • The 67.5 % of cases are traumatic.The rehabilitation and the design of specific aids are a key point for these subjects: there is in fact the need to make all efforts to help them to recover the mobility and autonomy in the better possible manner. It is widely demonstrated that solutions for rehabilitation and for the aids which allow the “upright position” are also very useful to improve the functionality of the internal organs and avoid the bedsores.
However such solutions are encumbering, cost-expensive and cannot thus be used at home in tele-rehabilitation but can be used only in specialized clinics.
II. THE INTRODUCTION OF THE POWERED EXOSKELETON
A. The mechanical exoskeleton versus the wheelchair
The Mechanical (not motorized) Exoskeleton, such as the Reciprocating Gait Orthosis (RGO), even if, allows a rehabilitation with a “upright position” needs a high energy consumption during the use ; for this reason subjects prefer to use the wheelchair at home, a useful aid but an incomplete rehabilitation-tool that does not allow the “upright position” and the assisted deambulation [4].
For this reason since the 1800 the dream was to automatize the exoskeleton.
B. The powered exoskeleton
The introduction of the mechatronics and robotics is allowing new chances to the exoskeleton. Today we prefer to talk about the “powered exoskeleton” (PE) (also known as powered armor, power armor, exoframe, hardsuit, or exosuit).
The PE is a wearable system that includes electric motors, pneumatics, levers, hydraulics, or other technologies, integrated together that allow the automatic movement of the limb with increased strength, force and resolution.
Today these systems are employed in several fields, which are principally: (a) the medical field (as a device for rehabilitation); (b) the field of the defence and of the emergency (as a device allowing the force augmentation during the actions) and (c) the civil field (as a device allowing the augmentation of the force during the handling of the loads).
In some cases a PE can be useful in the different above listed fields.
It is evident that the PE could give a great contribution in tele-rehabilitation at home thanks the functionalities allowing:
• The assisted walk and the recovery of the motion controlthanks to the programs for tele-rehabilitation conducted by means of the PEs also called in this case “Step Rehabilitation Robots".
• Improving quality of life, reducing the visit to the clinic.• Minimization of costs, thanks to the reduction of
therapists and the use the tele-rehabilitation. It is possible to find in [5] a recent overview of commercial
The Powered Exoskeleton introduction in Tele Rehabilitation: from the dream to the reality
D. Giansanti1, M. Gionni2, G. Maccioni1, S. Morelli1, C. Daniele1, G. D’ Avenio1 and M. Grigioni1
1Department TISP, ISS, Italy; email: [email protected] 2 Faculty of medicine & surgery, Catholic University of the Sacred Heart, Rome Italy; [email protected]
T
Proceedings VII Meeting Italian Chapter of the European Society of Biomechanics (ESB-ITA 2017) 28-29 September 2017, Rome - Italy
97
ISBN: 978-88-6296-000-7
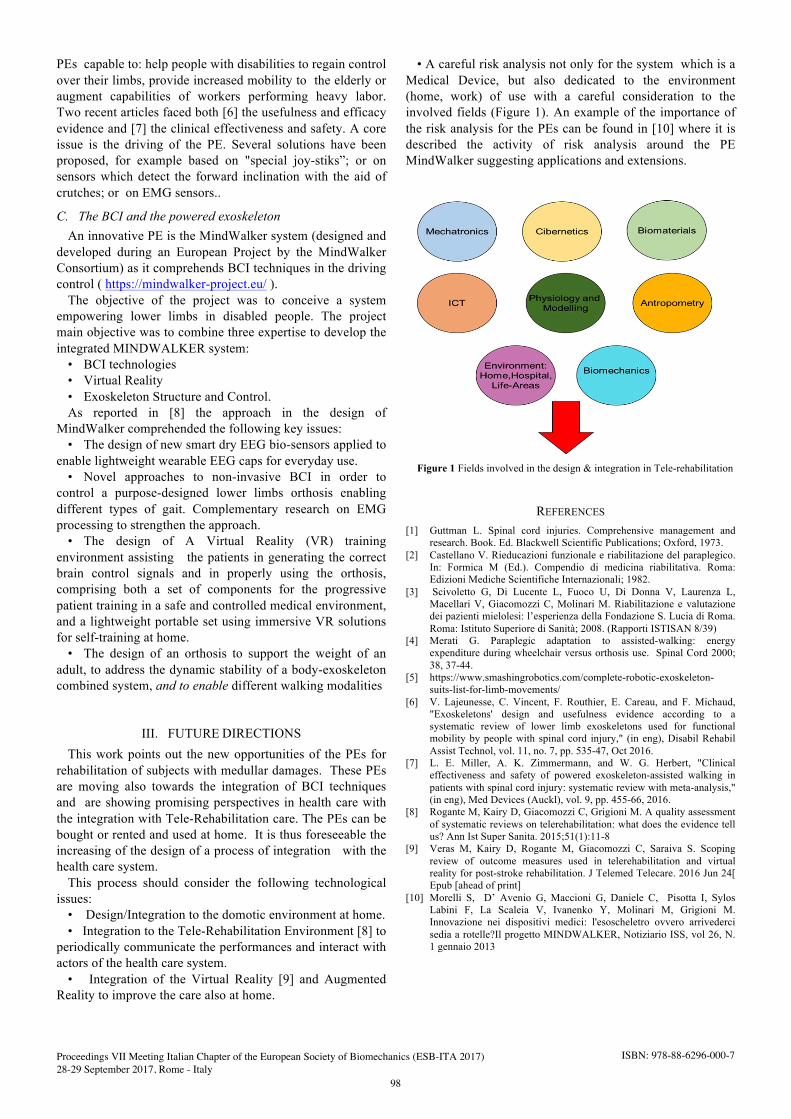
PEs capable to: help people with disabilities to regain control over their limbs, provide increased mobility to the elderly or augment capabilities of workers performing heavy labor. Two recent articles faced both [6] the usefulness and efficacy evidence and [7] the clinical effectiveness and safety. A core issue is the driving of the PE. Several solutions have been proposed, for example based on "special joy-stiks”; or on sensors which detect the forward inclination with the aid of crutches; or on EMG sensors..
C. The BCI and the powered exoskeleton An innovative PE is the MindWalker system (designed and
developed during an European Project by the MindWalker Consortium) as it comprehends BCI techniques in the driving control ( https://mindwalker-project.eu/ ).
The objective of the project was to conceive a system empowering lower limbs in disabled people. The project main objective was to combine three expertise to develop the integrated MINDWALKER system:
• BCI technologies• Virtual Reality• Exoskeleton Structure and Control.As reported in [8] the approach in the design of
MindWalker comprehended the following key issues: • The design of new smart dry EEG bio-sensors applied to
enable lightweight wearable EEG caps for everyday use. • Novel approaches to non-invasive BCI in order to
control a purpose-designed lower limbs orthosis enabling different types of gait. Complementary research on EMG processing to strengthen the approach.
• The design of A Virtual Reality (VR) trainingenvironment assisting the patients in generating the correct brain control signals and in properly using the orthosis, comprising both a set of components for the progressive patient training in a safe and controlled medical environment, and a lightweight portable set using immersive VR solutions for self-training at home.
• The design of an orthosis to support the weight of anadult, to address the dynamic stability of a body-exoskeleton combined system, and to enable different walking modalities
III. FUTURE DIRECTIONSThis work points out the new opportunities of the PEs for
rehabilitation of subjects with medullar damages. These PEs are moving also towards the integration of BCI techniques and are showing promising perspectives in health care with the integration with Tele-Rehabilitation care. The PEs can be bought or rented and used at home. It is thus foreseeable the increasing of the design of a process of integration with the health care system.
This process should consider the following technological issues:
• Design/Integration to the domotic environment at home.• Integration to the Tele-Rehabilitation Environment [8] to
periodically communicate the performances and interact with actors of the health care system.
• Integration of the Virtual Reality [9] and AugmentedReality to improve the care also at home.
• A careful risk analysis not only for the system which is aMedical Device, but also dedicated to the environment (home, work) of use with a careful consideration to the involved fields (Figure 1). An example of the importance of the risk analysis for the PEs can be found in [10] where it is described the activity of risk analysis around the PE MindWalker suggesting applications and extensions.
Figure 1 Fields involved in the design & integration in Tele-rehabilitation
REFERENCES [1] Guttman L. Spinal cord injuries. Comprehensive management and
research. Book. Ed. Blackwell Scientific Publications; Oxford, 1973. [2] Castellano V. Rieducazioni funzionale e riabilitazione del paraplegico.
In: Formica M (Ed.). Compendio di medicina riabilitativa. Roma: Edizioni Mediche Scientifiche Internazionali; 1982.
[3] Scivoletto G, Di Lucente L, Fuoco U, Di Donna V, Laurenza L, Macellari V, Giacomozzi C, Molinari M. Riabilitazione e valutazione dei pazienti mielolesi: l’esperienza della Fondazione S. Lucia di Roma. Roma: Istituto Superiore di Sanità; 2008. (Rapporti ISTISAN 8/39)
[4] Merati G. Paraplegic adaptation to assisted-walking: energy expenditure during wheelchair versus orthosis use. Spinal Cord 2000; 38, 37-44.
[5] https://www.smashingrobotics.com/complete-robotic-exoskeleton-suits-list-for-limb-movements/
[6] V. Lajeunesse, C. Vincent, F. Routhier, E. Careau, and F. Michaud, "Exoskeletons' design and usefulness evidence according to a systematic review of lower limb exoskeletons used for functional mobility by people with spinal cord injury," (in eng), Disabil Rehabil Assist Technol, vol. 11, no. 7, pp. 535-47, Oct 2016.
[7] L. E. Miller, A. K. Zimmermann, and W. G. Herbert, "Clinical effectiveness and safety of powered exoskeleton-assisted walking in patients with spinal cord injury: systematic review with meta-analysis," (in eng), Med Devices (Auckl), vol. 9, pp. 455-66, 2016.
[8] Rogante M, Kairy D, Giacomozzi C, Grigioni M. A quality assessment of systematic reviews on telerehabilitation: what does the evidence tell us? Ann Ist Super Sanita. 2015;51(1):11-8
[9] Veras M, Kairy D, Rogante M, Giacomozzi C, Saraiva S. Scoping review of outcome measures used in telerehabilitation and virtual reality for post-stroke rehabilitation. J Telemed Telecare. 2016 Jun 24[ Epub [ahead of print]
[10] Morelli S, D’ Avenio G, Maccioni G, Daniele C, Pisotta I, Sylos Labini F, La Scaleia V, Ivanenko Y, Molinari M, Grigioni M. Innovazione nei dispositivi medici: l'esoscheletro ovvero arrivederci sedia a rotelle?Il progetto MINDWALKER, Notiziario ISS, vol 26, N. 1 gennaio 2013
Proceedings VII Meeting Italian Chapter of the European Society of Biomechanics (ESB-ITA 2017) 28-29 September 2017, Rome - Italy
98
ISBN: 978-88-6296-000-7

Abstract — The present study investigates the suitability of the multibody method as alternative approach to the finite element method in order to evaluate biomechanical performances of a Marchetti-Vicenzi self-locking nail under dynamic loading. Torsional, compressive and bending dynamic loads were simulated. Results in terms of bone-device contact forces and device stiffness were obtained confirming and supporting issues observed in clinical reports.
Keywords — intramedullary nail, multibody analysis, biomechanics, bone fracture
I. INTRODUCTION NTRAMEDULLARY nail fixation is a gold standard treatmentfor long bone diaphyseal fractures. Compared to inter-
locking nails constrained in the medullary canal through proximal and distal fixation screws, self-locking nails allow for reduced soft tissues injuries in the distal area thanks to expandable mechanisms. Although different self-locking mechanisms have been proposed, they still show limitations in terms of implant stability and reversibility. In order to predict the in vivo implant stability, static analysis using finite element method is generally adopted [1]-[3]. However, static analysis cannot describe interaction between bone and nail during dynamic loads. This study investigates the suitability of the numerical multibody analysis as alternative approach to evaluate biomechanical performance of an intramedullary self-locking nailing device under dynamic loads. In particular, a device derived from the Marchetti-Vicenzi nail was examined.
II. MATERIALS AND METHODS
A. Multibody approach Two main critical aspects were identified in the model
design: the former deal with the high number of contacts among model parts, the latter is related to the self-locking mechanism, which involves large deformations of its parts. In an attempt to reduce high computational costs due to the whole model complexity, a multibody approach was chosen. Numerical simulations were carried out using ADAMS/Solver software package (2017, MSC Software, Santa Ana, CA), which includes a native modelling object (i.e. finite element part) able to accurately solve large deformation cases [4].
B. Fracture model A 3D standard model of the human femur was used to
reproduce the physiological geometry of the medullary canal that surrounds the implanted device. In accordance with AO/OTA classification, a 32-A2 fracture was reproduced by removing a bone slice (1 mm thick) at 30° to the frontal body
axis. Therefore, the two obtained bone segments were modelled as two distinct rigid bodies. A density of 2000 kg/m3 was used for the osseous components.
C. Self-locking nailing device model The Marchetti-Vicenzi nail consists of a hollow stub in
which the proximal ends of six pre-curved wires are crimped together. The six pre-curved distal ends of the wires are free to expand in the medullary canal when the slider component, which initially keeps the six wires closed, is moved proximally over the axis nail (Fig. 1). Unlike other rigid parts of the model, wires were modelled as deformable cylinders. The selected material for all device parts was the stainless steel AISI 316 LVM with the following mechanical properties: Young’s modulus 200 GPa, Poisson’s ratio 0.3 and density 8000 kg/m3.
Figure 1. (a) Nail model at the beginning of the closing step; (b) Nail model at the end of the closing step; (c) Nail model at the end of the opening step inside the fractured femur model (slider at proximal position).
D. Simulation steps and loading conditions Prior to loading, simulation involved two steps: first, the
self-locking mechanism closure aimed at the mechanism preload (Fig. 1b); second, the self-locking mechanism opening in the medullary canal space (Fig. 1c). During the opening step, the slider was stopped in three different positions (namely distal, medial and proximal) along the longitudinal axis of the nail. Then, for each different longitudinal position of the slider, three types of dynamic loading conditions were simulated [5]: torsional, compressive and bending loads, which were sequentially applied to the distal bone segment as shown in Figure 2. It should be noted that four supporting cylinders were introduced in the model to simulate the four-point bending test. All dynamic loads were applied using a 0.25 Hz sinusoidal waveform. In detail, for the torsional load along the longitudinal axis of the femur, a maximal torsional moment of 500 N∙mm was applied over 6 seconds. For the compressive load, a maximal axial force of 750 N was applied over 2 seconds. Finally, for the bending
Biomechanical evaluation of an intramedullary nailing device by multibody analysis
G. Putame1, M. Terzini1, C. Bignardi1, P. Costa2, E. Zanetti3, A. Audenino1
1 Department of Mechanical and Aerospace Engineering, Politecnico di Torino, Torino, Italy 2 Intrauma S.p.A, Rivoli (TO), Italy
3 Department of Engineering, University of Perugia, Perugia, Italy
I
(a) (b) (c)
Proceedings VII Meeting Italian Chapter of the European Society of Biomechanics (ESB-ITA 2017) 28-29 September 2017, Rome - Italy
99
ISBN: 978-88-6296-000-7

load, a maximal downward force of 175 N was applied to each upper supporting cylinder. Contact force between each wire tip and the medullary canal surface were measured during the opening step. Displacement values were measured and post-processed by using MATLAB software (R2017a, MathWorks Inc., Natick, MA, USA) to obtain the model stiffness for each loading case and slider position.
Figure 2. Models for compressive and torsional tests (a) and four-point bending test with four supporting cylinders (in green) (b). White arrows indicate applied forces and moments.
E. Model constraints Four types of contact pairs were defined: wire-to-wire,
wire-to-slider, wire-to-bone and bone-to-support. Last two contact pairs were assumed frictionless. No contact between proximal and distal bone segments was considered and a fixed joint was imposed between proximal bone segment and stub. To allow appropriate loading conditions, translations and rotations of the two bone segments were conveniently fixed or released in run-time. Besides, it should be specified that a spherical joint was imposed between each wire tip and the medullary canal surface when loading conditions were applied. Such an assumption was justified since the present study aimed at assessing the mechanical behaviour of the self-locking nail in relation to its opening arrangement in a physiologic-like geometry.
III. RESULTS AND DISCUSSION
In this section, results in terms of bone-device contact forces and mean stiffness for each studied loading case are presented and discussed. In Figure 3 contact forces between wire tips and bone are shown. Considering the measured tip penetration depths during contacts, contact pressure of 240 MPa on average was obtained. Such pressure values may be related to bone reabsorption or cracks, with a consequent loss of distal locking [3]. Therefore, high contact pressure might explain cracks propagation and wire protrusions observed in previous clinical reports [6] [7]. As can be seen in Table 1, stiffness is lower for internal rotation than for external one. This is due to the winding direction that wires acquire during the closing step. Bending stiffness, obtained as applied force versus displacement for each upper cylinder, resulted slightly higher when the slider was at its distal position. Although results suggest that the device stiffness always increases when the slider is at its distal position, compressive stiffness value for the proximal case is higher than expected. This is due to the occurrence of diaphyseal contacts between the wire stems and the canal during the compression.
Figure 3. Contact force (a) and pressure (b) between wire tips and intramedullary canal during the opening phase.
TABLE I TORSIONAL, BENDING, COMPRESSIVE STIFFNESS AND DISPLACEMENTS
TORSIONAL LOADING CONDITION External rotation Internal rotation
Slider position
Max Disp. (°)
Mean Stiff. (Nmm/°)
Max Disp. (°)
Mean Stiff. (Nmm/°)
Distal 11.7 38.4 15.5 36.7 Medial 27.2 28.6 20.6 26.6 Proximal 28.2 37.0 13.1 33.4 BENDING LOADING CONDITION
Proximal cylinder Distal cylinder Slider position
Max Disp. (mm)
Mean Stiff. (N/mm)
Max Disp. (mm)
Mean Stiff. (N/mm)
Distal 11.7 10.7 10.5 12.3 Medial 15.1 8.9 15.2 9.8 Proximal 15.6 8.6 15.4 8.7 COMPRESSIVE LOADING CONDITION Slider position Max Disp. (mm) Mean Stiff. (N/mm) Distal 0.5 1479.9 Medial 1.1 517.8 Proximal 0.8 736.7
IV. CONCLUSION
Even though the present study is based on a specific nailing device, the findings suggest that the multibody method may be a valid alternative approach to the finite element method in order to assess the biomechanical performance of complex models that involves large deformations and many contacts.
REFERENCES [1] D. Ivanov, Y. Barabash and A. Barabash, “A numerical comparative
analysis oh ChM and Fixation nails for diaphyseal femur fractures”, in Acta of Bioengineering and Biomechanics, vol. 18, pp. 73-81, 2016
[2] D. Ivanov, A. Barabash and Y. Barabash, “Preclinical biomechanics of a new intramedullary nail for femoral diaphyseal fractures”, in Russian Open Medical Journal, vol. 4, 2015
[3] F. Giudice, G. La Rosa, T. Russo and R. Varsalona, “Evaluation and improvement of the efficiency of the Seidel humeral nail by numerical-experimental analysis of the bone-implant contact”, in Medical Engineering & Physics, vol. 28, pp. 682-693, 2006
[4] MSC ADAMS/View software user guide, “Getting started with FE Parts”, 2017
[5] G. Wang, T. Pan, X. Peng and J. Wang, “A new intramedullary nailing device for the treatment of femoral shaft fractures: A biomechanical study,” in Clinical Biomechanics, vol. 23, pp. 315-312, 2008
[6] S. Madan, R. Natarajan, S. Walsh and C. Blakeway, “The Marchetti–Vicenzi nail. A DGH experience”, in Injury, Int. J. Care Injured, vol. 34, pp. 346-348, 2003
[7] A, Ruffilli, F. Traina, F. Pilla, D. Fenga and C. Faldini, “Marchetti Vicenzi elastic retrograde nail in the treatment of humeral shaft fractures: review of the current literature”, in Musculoskelet Surg, vol. 99, pp. 201-209, 2015
(a)
(b)
(a) (b)
Proceedings VII Meeting Italian Chapter of the European Society of Biomechanics (ESB-ITA 2017) 28-29 September 2017, Rome - Italy
100
ISBN: 978-88-6296-000-7

Abstract - Spine is one of the most studied systems of the human skeleton because of the several types of problems that can injure it (accidents, pathologies, stresses). Many studies evaluated the range of motion, stiffness and strain on hard tissues under different loading conditions. To integrate the study with the deformation of the soft tissues (intervertebral discs and ligaments), Digital Image Correlation (DIC) can measure the distribution of deformation in a contact-less way and provide a full-field view of the examined surface under load.
This study was performed using segment of human spine loaded in anterior bending with the use of loading machine and DIC. All tests showed the different deformation of the specimen in the vertebral body, intervertebral discs, ligaments and in the posterior rods.
This work showed the feasibility and importance of investigating the spine in a full-field way, due to the high strain inhomogeneity in the vertebrae and intervertebral discs. Therefore it can give useful information to design medical devices and to surgeons to implant them. Keywords - Biomechanics, Ligaments, Digital Image
Correlation, Intervertebral disc.
I. INTRODUCTION
INVESTIGATING the biomechanics of the spine is a fundamental task because it could help engineers and clinicians to design implants with a higher success ratio [1].
Up to date, the spine was characterized as a whole, without an experimental description of the strain distribution on the surface of the spine segment; or describing the details of a single organ (the vertebrae, the discs and the ligaments) without taking in account the complex boundary conditions of the spine [2],[3]. The aim of this work was to merge these two different methodologies: measuring the full-field strain distribution on a intact spine segment on the vertebral bodies and the intervertebral discs (IVDs), and on the supraspinous spine ligaments and spine fixator after spinal stabilization.
II. MATERIAL AND METHODS
A. Specimen and DIC A fresh-frozen human spine segment (L2 to S1) was
obtained through an ethically approved international donation program. The anterior soft tissues (including the anterior ligament) were removed without damaging the vertebrae, the intervertebral discs and the other ligaments.
An high-contrast white-on-black speckle pattern [4]-[5] was required to evaluate the strain using Digital Image Correlation
(DIC) on the spine surface. The background was prepared staining the entire spine segment with methylene blue with a brush. The white speckle pattern, instead, was created using water-based paint sprayed with an optimized airgun [6] (figure 1).
A commercial 3D-DIC (Q400, Dantec Dinamics,Skovlunde, DK) with two 5MPixels cameras and 35mm lens was employed. A field of view of 60x80 mm^2 was set for the two cameras to frame the functional spinal unit of L3-L4 and its IVD, obtaining a pixel size of 0.03mm. Consequently, the speckles had an average size on the camera sensor of 6 pixels and a standard deviation of 6 pixels, as required [6].
An optimization in zero strain condition allowed selecting the best compromise between the measurement spatial resolution and the measurement uncertainties. A facet size of 33 pixels, a grid spacing of 19 pixels, and a filter with a kernel of 5x5 were set obtaining a strain uncertainties of 140 microstrain.
After testing the intact spine (see next paragraph), the specimen was instrumented with pedicle screw fixation system by a surgeon. In order to evaluate the strain on the rods, a white-on-black speckle pattern was prepared, using black paint for the background and white paint for the dots.
B. Mechanical testing
The load was applied with a uni-axial testing machine (8032, Instron, High Wycombe, UK) in displacement control. A compression-anterior bending was reproduced with an eccentric compression: the point where the force was applied had an anterior offset equal to the 20% of the antero-posterior depth of the central intervertebral disc. The setup avoided the transmission of any other load component (figure 1). Ten
In vitro full-field strain investigation in intact spine and spinal fixator by means of DIC
Maria Luisa Ruspi1, Marco Palanca1, Luigi La Barbera2,3, Tomaso Villa2,3, Luca Cristofolini1
1 Alma Mater Studiorum – Università di Bologna: [email protected], [email protected], 2 Laboratory of Biological Structure Mechanics, Department of Chemistry, Materials and Chemical Engineering
“G. Natta”, Politecnico di Milano, Italy, 3 IRCCS Galeazzi Orthopaedic Institute, Milan, Italy
[email protected], [email protected], [email protected]
I
Figure 1 – Spine segment prepared with the speckle pattern: it was illuminated by led lights. The two digital cameras acquired images during the test.
Proceedings VII Meeting Italian Chapter of the European Society of Biomechanics (ESB-ITA 2017) 28-29 September 2017, Rome - Italy
101
ISBN: 978-88-6296-000-7

preconditioning cycles were applied between 0 and 1.0 mm of compression at 0.5Hz. A compression of 3.0 mm was applied in 0.1mm steps, while DIC images were acquired at each step. We repeated the test: the first time to evaluate the strain on natural spine, the second time to evaluate the strain on spinal fixator. The test was designed to avoid specimen damage, based on some preliminary tests [7].
III. RESULTS AND DISCUSSION DIC system evaluated successfully the strains of the entire
functional spinal unit (vertebra and IVD from the frontal view, and supraspinous ligaments from the posterior view) and of the fixation system.
With the intact spine, the IVD reached larger deformations than the vertebrae, as expected (figure 2). On the frontal part of the IVD, the maximum principal strain was in the order of +50000 microstrain (tension) and it was aligned circumferentially, while the minimum principal strain was in the order of -150000 microstrain (compression) and was aligned axially (figure 2). These strain maps showed no-homogeneous strain distribution on the IVD, revealing strain peaks in the central side of the disc. In the frontal part of the vertebral bone, the strains were lower than in the IVD: the maximum principal strain was in the order of +10000 microstrain (tension), while the minimum principal strain was in the order of -5000 microstrain (compression) (figure 2).
On the posterior view of the specimen, the strain on the supraspinous ligament and the two rods were evaluated during the anterior bending (figure 3). The ligaments, after the fixation, had strain in the order of ten thousand microstrain, like the strain evaluated on the bars. The strain on the rods can be easily achieved with traditional strain gauges but, using full-field measurement technique, stress/strain concentration region can be highlighted. As in this configuration, the left rod
is more strained than the right rod, and larger strain were in the medial side of the rods. Moreover, the measure was not affected by the rods orientation.
IV. CONCLUSION This study aimed to examine multi-vertebrae segment of
spine providing a full-field strain distribution on hard tissues (vertebrae), soft tissues (intervertebral discs, supraspinous ligaments) and spinal fixators. The spine was accounted as a whole, considering the complex boundary condition and described in details with particular emphasis to the soft tissues (intervertebral disc and ligament), which cannot be analysed using traditional techniques. This study showed a non-homogeneous distribution of the strain on the IVD and its interfaces with vertebrae, that shows the importance of implementing a full-field analysis to explore the spine biomechanics. The spinal fixators, can be explored using this technique as well, in order to focus the weak points of this system with a high failure rate. Finally, the use of DIC to analyse the spine can increase the knowledge of the biomechanics of the spine, opening the way to new basic and transactional researches (understanding the role of ligaments, studying fixator devices, analysing failures that occur after surgery).
REFERENCES 1. Lau, D., et al., Proximal junctional kyphosis and failure after
spinal deformity surgery. SPINE, 2014. 39. 2. Brandolini, N., L. Cristofolini, and M. Viceconti, Experimental
Methods for the Biomechanical Investigation of the Human Spine: A Review. Journal of Mechanics in Medicine and Biology, 2014. 14(01): p. 1430002.
3. Danesi, V., et al., Effect of the In Vitro Boundary Conditions on the Surface Strain Experienced by the Vertebral Body in the Eastic Regime.pdf. Journal of Biomechanical Engeneering, 2016. 138.
4. Palanca, M., et al., Exploring the strain distribution of thoracolumbar spine segments: An application of Digital Image Correlation. Medical Engineering and Physics, 2017.
5. Palanca, M., et al., The evaluation of strain on spine segments in a contactless way and full-field view. ESB, 2016.
6. Palanca, M., G. Tozzi, and L. Cristofolini, The use of digital image correlation in the biomechanical area: a review. International Biomechanics, 2015. 3: p. 1-21.
7. Cristofolini, L., In vitro evidence of the structural optimization of the human skeletal bones. J Biomech, 2015. 48(5): p. 787-96.
Figure 3 - Posterior view of spine segment during anterior bending: strain distribution on the two rods and on the supraspinous ligament
Figure 2 – Anterior view of spine segment during anterior bending: strain distribution on the vertebrae and intervertebral discs
Proceedings VII Meeting Italian Chapter of the European Society of Biomechanics (ESB-ITA 2017) 28-29 September 2017, Rome - Italy
102
ISBN: 978-88-6296-000-7

Abstract—French bender is the clinical gold standard for spinal rod contouring. Despite it allows the surgeon in achieving any desired shape, it is believed to weaken the implants, finally promoting fatigue failure. The current study proposes a new method combining non-linear FE models and experimental tests to better understand the role of residual stresses resulting from contouring. Learning how to control this phenomenon may contribute in reducing the high failure rate met during clinical use, as well as improving the usage of current implants. Keywords— Spine rod contouring, French bender, residual
stresses, fatigue.
I. INTRODUCTION OSTERIOR spinal fixation through long constructsrepresents the gold standard for a variety of clinical
disorders. Long deformities (e.g. scoliosis) or the stabilization of bone osteotomies represents few examples [1, 2]. In all these cases, the surgeon is expected to adapt the rod to restore the natural spine curvature through contouring [3]. Despite preformed spinal rods with uniform curvature are available in the market, the clinical gold standard for contouring is French bender, which allows achieving even sharper angles. Clinical experience demonstrated high failure rate of contoured spinal rods due to the cyclical loads occurring in everyday life, i.e. mechanical fatigue [2, 3]. However, such events cannot be explained only due to the relatively low loads met during clinical use [1, 4]. Among the key factors influencing fatigue failure, very little attention was directed towards the comprehension of how alternative contouring methods affect the residual stress field within the implant [5]: understanding and controlling these factors would be decisive to prevent hardware failure in clinical practice. The aims of current study is to test the contribution of residual stress introduced through contouring obtained with a French bender on the fatigue behaviour of spinal rods.
II. MATERIAL AND METHODS
A. Static French bender contouring To study the contribution of contouring, the available
Ti6Al4V spinal rods (diameter 5.5 mm) were divided into different groups. Straight rod (n=5) served as a reference. FB rods (n=10) were contoured using the French bender on ad-hoc guides to achieve a desired 150 mm curvature radius (Fig.1, top-left).
The FE model of French bender contouring (Fig.1, bottom-left) was virtually reproduced in Abaqus Standard CAE 6.14-1 (Dassault Systemes Ri, Simulia Corp. Providence, RI, USA). The experimental elasto-plastic material properties characterized through tensile tests were assumed (E=110 GPa, ν=0.3, VY=886 MPa, VU=1134 MPa, HU=5.35%). Contouring step was simulated applying a vertical displacement to obtain a local curvature radius of 150 mm [5]. Residual stress distribution (following release) and maximum equivalent stress components (upon loading) were compared across each group.
Fig. 1: French bender contouring (left) and 4-point-bending fatigue (right): Experimental set-ups (top) and FE model (bottom). contouring (top) and FE model (bottom).
B. 4-point-bending fatigue Spinal rods were experimentally tested on a custom-made
4-point-bending jig (Fig.1, top-right) [6] applying a sinusoidal load with a maximum of 930 N (load ratio R of 0.1) up to 1 Mcycles (run-out). Mann-Whitney statistical test allowed to highlight differences in the number of cycles to failure among groups (p≤0.05 significance level). To describe thoracic and lumbar implantation sites, two loading configurations were considered for FB rods (Fig. 2):
- FBL (n=5): representative of a bending moment in flexion on lumbar region, - FBK (n=5): representative of a bending moment in flexion on thoracic regions.
Fatigue loading following French bender contouring was also simulated in 4-point-bending, reproducing the loading-unloading cycles applied during tests (Fig.1, bottom-right). The predicted stress components upon loading and unloading were used as an input for a Matlab script V.15 (Mathworks, Natick, Massachusetts) to calculate the maximum equivalent stress according to Sines criterion:
maVMSines IK ,VV (1)
Spinal rods contouring: an experimental and finite element study to control fatigue
Luigi La Barbera1*, Francesca Berti1*, Agnese Piovesan1, Dario Allegretti1, Claudia Ottardi1 Tomaso Villa1,2, Giancarlo Pennati1
1 Dept. of Chemistry, Materials and Chemical Engineering, Politecnico di Milano, Italy, email:[email protected] 2 IRCCS Istituto Ortopedico Galeazzi, Italy.
*Authors equally contributed
P
Proceedings VII Meeting Italian Chapter of the European Society of Biomechanics (ESB-ITA 2017) 28-29 September 2017, Rome - Italy
103
ISBN: 978-88-6296-000-7
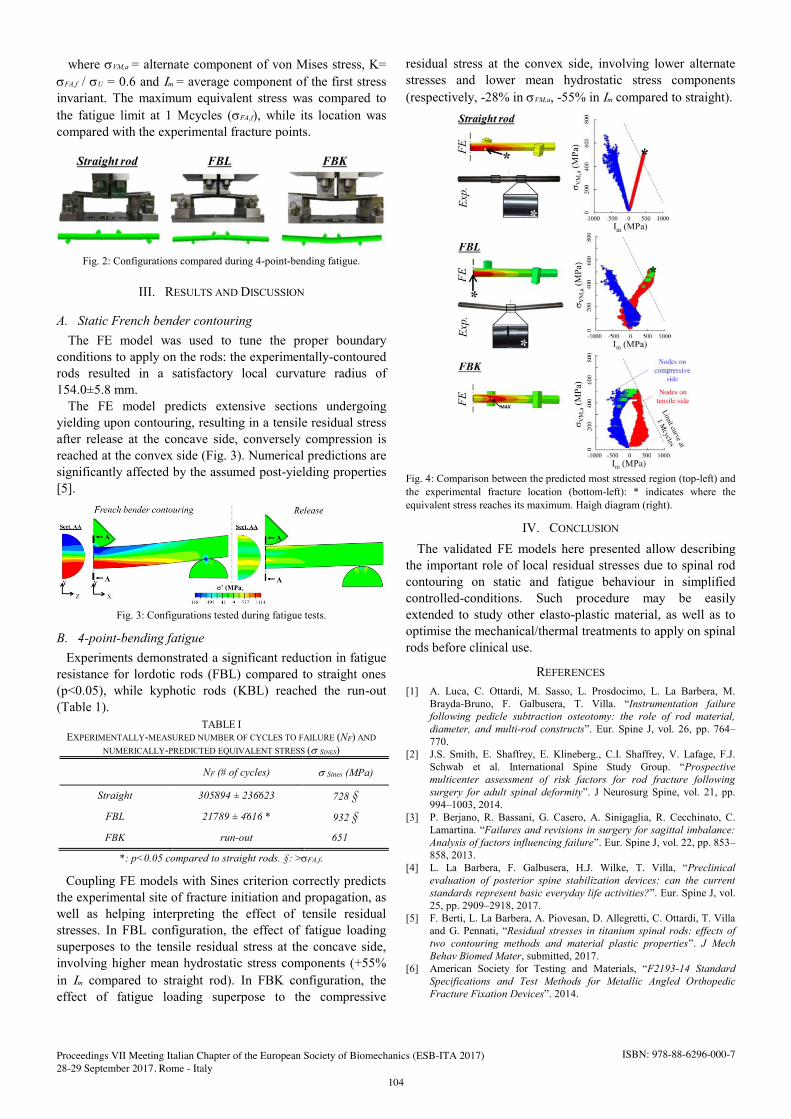
where VVM,a = alternate component of von Mises stress, K= VFA,f / VU = 0.6 and ,m = average component of the first stress invariant. The maximum equivalent stress was compared to the fatigue limit at 1 Mcycles (VFA,f), while its location was compared with the experimental fracture points.
Fig. 2: Configurations compared during 4-point-bending fatigue.
III. RESULTS AND DISCUSSION
A. Static French bender contouring The FE model was used to tune the proper boundary
conditions to apply on the rods: the experimentally-contoured rods resulted in a satisfactory local curvature radius of 154.0±5.8 mm.
The FE model predicts extensive sections undergoing yielding upon contouring, resulting in a tensile residual stress after release at the concave side, conversely compression is reached at the convex side (Fig. 3). Numerical predictions are significantly affected by the assumed post-yielding properties [5].
Fig. 3: Configurations tested during fatigue tests.
B. 4-point-bending fatigue Experiments demonstrated a significant reduction in fatigue
resistance for lordotic rods (FBL) compared to straight ones (p<0.05), while kyphotic rods (KBL) reached the run-out (Table 1).
Coupling FE models with Sines criterion correctly predicts the experimental site of fracture initiation and propagation, as well as helping interpreting the effect of tensile residual stresses. In FBL configuration, the effect of fatigue loading superposes to the tensile residual stress at the concave side, involving higher mean hydrostatic stress components (+55% in ,m compared to straight rod). In FBK configuration, the effect of fatigue loading superpose to the compressive
residual stress at the convex side, involving lower alternate stresses and lower mean hydrostatic stress components (respectively, -28% in VVM,a, -55% in ,m compared to straight).
Fig. 4: Comparison between the predicted most stressed region (top-left) and the experimental fracture location (bottom-left): * indicates where the equivalent stress reaches its maximum. Haigh diagram (right).
IV. CONCLUSION
The validated FE models here presented allow describing the important role of local residual stresses due to spinal rod contouring on static and fatigue behaviour in simplified controlled-conditions. Such procedure may be easily extended to study other elasto-plastic material, as well as to optimise the mechanical/thermal treatments to apply on spinal rods before clinical use.
REFERENCES [1] A. Luca, C. Ottardi, M. Sasso, L. Prosdocimo, L. La Barbera, M.
Brayda-Bruno, F. Galbusera, T. Villa. “Instrumentation failure following pedicle subtraction osteotomy: the role of rod material, diameter, and multi-rod constructs”. Eur. Spine J, vol. 26, pp. 764–770.
[2] J.S. Smith, E. Shaffrey, E. Klineberg., C.I. Shaffrey, V. Lafage, F.J. Schwab et al. International Spine Study Group. “Prospective multicenter assessment of risk factors for rod fracture following surgery for adult spinal deformity”. J Neurosurg Spine, vol. 21, pp. 994–1003, 2014.
[3] P. Berjano, R. Bassani, G. Casero, A. Sinigaglia, R. Cecchinato, C. Lamartina. “Failures and revisions in surgery for sagittal imbalance: Analysis of factors influencing failure”. Eur. Spine J, vol. 22, pp. 853–858, 2013.
[4] L. La Barbera, F. Galbusera, H.J. Wilke, T. Villa, “Preclinical evaluation of posterior spine stabilization devices: can the current standards represent basic everyday life activities?”. Eur. Spine J, vol. 25, pp. 2909–2918, 2017.
[5] F. Berti, L. La Barbera, A. Piovesan, D. Allegretti, C. Ottardi, T. Villa and G. Pennati, “Residual stresses in titanium spinal rods: effects of two contouring methods and material plastic properties”. J Mech Behav Biomed Mater, submitted, 2017.
[6] American Society for Testing and Materials, “F2193-14 Standard Specifications and Test Methods for Metallic Angled Orthopedic Fracture Fixation Devices”. 2014.
TABLE I EXPERIMENTALLY-MEASURED NUMBER OF CYCLES TO FAILURE (NF) AND
NUMERICALLY-PREDICTED EQUIVALENT STRESS (VSINES)
NF (# of cycles) VSines (MPa)
Straight 305894 ± 236623 728 §
FBL 21789 ± 4616 * 932 §
FBK run-out 651
*: p<0.05 compared to straight rods. §: >VFA,f.
Proceedings VII Meeting Italian Chapter of the European Society of Biomechanics (ESB-ITA 2017) 28-29 September 2017, Rome - Italy
104
ISBN: 978-88-6296-000-7

GENERAL SESSION
Cell Mechanics and Tissue Engineering


Abstract—Tendon injuries represent an unsolved clinical need. Electrospun bundles using blends of poly-L-lactic acid (PLLA) and collagen (Coll) in different percentages were prepared by an ‘ad hoc’ crosslinking system to increase the mechanical properties and reduce the loss of collagen after ageing in a physiological environment. The mechanical properties and cell proliferation were tested. High-resolution x-ray tomography was also performed to investigate the morphologyof the bundles. Keywords—Electrospinning, tendon tissue engineering, x-ray
tomography, cell viability.
I. INTRODUCTION ENDON injuries represent an unsolved clinical need. Recent preliminary studies confirmed the suitability of resorbable electrospun scaffolds (bundles), for
mimicking the multiscale structure of tendon fascicles [1]-[2]. In the present work we produced resorbable electrospun crosslinked bundles made of PLLA/Coll blends at different compositions. The productions process aimed to reproduce the hierarchical structure and the mechanical properties of Achilles’ tendon fascicles. The aims of this work are to: (i) test the mechanical properties and the effect of crosslinking before and after ageing in a physiological environment; (ii) produce a morphological analysis of the bundles via high-resolution x-ray tomograph; (iii) test the cell viability and proliferation on the bundles.
II. MATERIALS & METHODS
Bundles were produced with two blends:
PLLA/Coll 75/25 w/w. PLLA/Coll 50/50 w/w.
To prepare 3D bundles made of aligned fibers, a high-speed rotating drum collector was used. The electrospun layer was manually rolled along the drum and then removed (Fig.1A). The bundles were 470 mm long and 550-650 µm in diameter. The crosslinking process was performed with a solution of N-(3-Dimethylaminopropyl)-N′-ethylcarbodiimide hydrochloride (EDC) and N-Hydroxysuccinimide (NHS) 0.02 M mixed in Ethanol/distilled water 95/5 v/v. Five specimens for each blend were mechanically tested immediately after crosslinking, and after ageing in phosphate buffer solution (PBS) for 7 and 14 days. As a reference five specimens as spun for each blend were also tested. To evaluate the mechanical properties of the bundles a tensile
test was conducted (Fig.2): Specimens were immersed in 0.9% NaCl saline
solution for two minutes before testing. Customized capstan grips to minimize stress
concentrations. Gauge length: 16 mm. A strain rate close to physiological: 1 s-1. Monotonic ramp to break detection.
Morphological characterization of the bundles was carried out via high-resolution x-ray tomography (Zeiss Versa 510, voxel size = 1 and 0.4 µm, Fig.1B). Cell viability was assessed via a resazurin reduction assay with non-tumor human fibroblasts (NTF-322) on days 1, 7, 14 and 21 (Fig. 2D). Cells were also immunostained for acetylated alpha-tubulin and counterstained with DAPI to assess cellular alignment on day 7 (Fig.1C).
Fig.1: A) Bundle wrapped on the drum; B) x-ray tomography of bundle; C) NTF-322s aligned on a bundle (Blue-DAPI,
Red-Acetylated alpha-tubulin).
Fabrication and characterization of electrospun scaffolds for tendon reconstruction
Alberto Sensini1, Maria Letizia Focarete2, Chiara Gualandi2, Andrea Zucchelli1, Gianluca Tozzi3,
Liam Boyle4, Gwendolen Reilly4, Luca Cristofolini1
1 Department of Industrial Engineering, Università di Bologna, Italy; email: [email protected] 2 Department of Chemistry “G. Ciamician”, Università di Bologna, Italy; email: [email protected]
3 School of Engineering, University of Portsmouth, United Kingdom; email: [email protected] 4 INSIGNEO Institute for in silico Medicine, University of Sheffield, United Kingdom; email: [email protected]
T
Proceedings VII Meeting Italian Chapter of the European Society of Biomechanics (ESB-ITA 2017) 28-29 September 2017, Rome - Italy
107
ISBN: 978-88-6296-000-7

III. RESULTS & DISCUSSION
Fig.2: A) Capstan grips with a bundle; B) Stress-strain curves for PLLA/Coll 75/25; C) Stress-strain curves for PLLA/Coll
50/50. D) Cell viability of NTF-322 on bundles.
All the specimens showed a ductile behaviour with large deformations (Fig.2). For all the bundles the stress-strain curves showed an initial non-linear toe region, similar to the laxity of the tendon collagen fibers at rest. The values of failure stress for the two compositions, immediately after crosslinking (Table I-II), were higher than the as spun ones reported in previous studies [1]-[2]. In particular for the PLLA/Coll 75/25 blend, stress values were in the same order of magnitude of the human tendon fascicles [3], although decreased, after ageing in PBS. The hydration increased the failure strain and decreased the Young modulus of all specimens compared to the dry specimens [1]-[2]. The x-ray tomography on the bundles confirmed the good morphology and alignment of the nanofibers, also after the crosslinking process. The cross-linking process had no negative effect on the viability of the cells and all fibres supported cell growth over a 21 day period (Fig 2D). However the PLLA/Coll 50/50 blend did show a reduction in initial attachment.
TABLE I PLLA/COLL 75/25 MECHANICAL PROPERTIES
Samples Young
modulus (MPa)
Yield stress (MPa)
Failure stress (MPa)
Failure strain (%)
As spun 28.0-32.5 7.7-8.5 10.3-12.3 76.2-97.2
Crosslink 28.0-39.4 5.3-9.9 12.6-22.8 139-183
Crosslink 7d PBS 25.4-33.0 5.8-7.9 10.2-14.0 110-145
Crosslink 14d PBS 22.1-38.8 5.1-6.1 9.1-12.1 72-137
TABLE II PLLA/COLL 50/50 MECHANICAL PROPERTIES
Samples Young
modulus (MPa)
Yield stress (MPa)
Failure stress (MPa)
Failure strain (%)
As spun 9.0-22.6 2.4-3.7 5.0-7.3 141-166
Crosslink 20.5-36.9 3.3-5.0 10.6-17.0 151-236
Crosslink 7d PBS 8.0-18.1 2.8-4.2 2.3-9.2 122-161
Crosslink 14d PBS 7.1-26.1 1.5-2.3 5.4-7.7 62.0-150
IV. CONCLUSION
The mechanical properties of the crosslinked bundles for the two blends suggested their suitability for tendon tissue regeneration. The high-resolution x-ray tomography confirmed the good morphology of the nanofibers before and after the crosslinking process. All fibres supported cell proliferation over a 21 day period. These promising results for the new crosslinked bundles confirm their potential for tendon tissue reconstruction.
ACKNOWLEDGEMENT
The Authors gratefully acknowledge the Marco Polo Mobility Grant of the Università di Bologna, Zeiss Global Centre at University of Portsmouth for the use of facilities and the University of Sheffield for cell cultures. Michele Segala and Chiara Dazzi are acknowledged for their help in crosslinking treatments and mechanical characterization.
REFERENCES [1] A. Sensini, M. L. Focarete, C. Gualandi, G. Tozzi, L. Cristofolini,
BIOMECHANICAL SUITABILITY OF SCAFFOLDS MADE OF ELECTROSPUN BUNDLES FOR TENDON REPAIR. Bone Joint J, 99-B(SUPP 1), 42. Accessed January 31, 2017..
[2] A. Sensini, C. Gualandi, L. Cristofolini, G. Tozzi, M. Dicarlo, G. Teti, M. Mattioli-Belmonte, M. L. Focarete, Biofabrication of bundles of poly(lactic acid)-collagen blends mimicking the fascicles of the human Achille tendon, Biofabrication, 9, pp. 1 - 16, 2017.
[3] P. Hanson, P. Aagaard, S.P. Magnusson, Biomechanical properties of isolated fascicles of the Iliopsoas and Achilles tendons in African American and Caucasian men, Annals of Anatomy - Anatomischer Anzeiger, Volume 194, Issue 5, September 2012, Pages 457-460
Proceedings VII Meeting Italian Chapter of the European Society of Biomechanics (ESB-ITA 2017) 28-29 September 2017, Rome - Italy
108
ISBN: 978-88-6296-000-7

Abstract— A549 epithelial adenocarcinoma cells are usually chosen as a model of type II pulmonary epithelial cells for in vitro toxicological evaluations of air born microparticles. These cells are normally cultured in conventional two-dimensional (2D) systems on a rigid support with the consequent lost of typical alveolar cell features. The aim of this work was to study the effect of substrate mechanical properties on A549 cells morphology and function. 2D static culture of A549 cells were seeded and cultured on rigid conventional polyester Thermanox™ coverslips and on elastic PDMS membrane. A549 cells grown for 72 hours on the rigid support did not show the typical alveolar cell features with rounded shape and microvilli, that were present in cells cultured on the elastic PDMS membrane. In addition, cells cultured on Thermanox™ coverslips did not show production of surfactant, while an aboundant surfactanct present was observed in cells cultured on the elastic substrate. These findings give evidence that the elastic properties of the substrate importantly affect cell morphology and functions of these epithelial cells. The use of an artificial support with adequate mechanical properties it is important for the use of in vitro tests during cell toxicity evaluations.
Keywords — Cell mechanics, Mechanobiology, Substrate stiffness, Elastic module.
I. INTRODUCTION HE alveolar epithelium is predominantly composed of type I and type II epithelial cells [1]. Type II pulmonary cells are usually chosen for toxicity studies at alveolar
level in determining the toxic effects of air born microparticles (PM). In particular, the A549 epithelial adenocarcinoma cell line is a common option to reproduce in vitro the respiratory membrane in contact with air [2]. These cells are usually cultured in conventional two-dimensional (2D) systems based on adherent cell monolayers in a static dish culture. It is well known that the function of cells is dependent on factors including chemical, physical, and mechanical stimuli [3]. Particularly, the rigidity (“stiffness”) of the extracellular matrix (ECM) defined by its elastic modulus (E), has a significant effect on epithelial cell growth, proliferation and differentiation [4, 5]. Mechanical inputs, due to the elasticity of the extracellular matrix, regulate also the transduction of important transcriptional regulators [6, 7]. As a consequence, the mechanical properties of cell substrate can importantly affect cell function, protein expression and cell structure [8]. The aim of our work was to investigate whether the culture of A549 cells on substrate with different elastic properties affects cell morphology and function.
II. METHODS
A549 cells (ATCC® CCL-185™) were cultured in FK12 medium (ATCC, Middlesex, UK) supplemented with 10% inactivated fetal bovine serum (Thermo Fisher Scientific, Waltham, USA). Cells were grown in T75 flasks at 37°C with 5% CO2 and trypsinized for passage three times a week. Two substrate surfaces were used for A549 cell culture in standard conditions, the rigid surface of Thermanox™ Coverslips (Thermo Fisher Scentific, Waltham, Massachusetts, USA) and a polydimethylsiloxane (PDMS) artificial elastic membrane (Elastosil® Film, Silex Ltd, Hampshire, UK). We determined the elastic module of Elastosil® Film by a tension test. A rectangular tensile specimen was gripped between the clamps of a tensile-testing machine and subjected to a controlled tension until failure.The elongation of the gauge section and the applied force were used to calculate the average elastic modulus of E = 0.53 MPa. Differently, the elastic modulus of polyester Thermanox™ Coverslips is reported to be approximately of 1,000 MPa. Cells were seeded at concentration of 1*104 cells/cm2 on Thermanox™ Coverslips and Elastosil® Film and maintained in culture for 72h. Every 24 hours images were digitized using a phase-contrast microscope to monitor cell adherence and growth. At the end of the observation period, samples were fixed in 0.5 glutaraldehyde or 2% paraformadehyde (Società Italiana Chimici, Milano, Italy) in 4% sucrose, for scanning electron microscopy (SEM) and immunofluorescence analysis, respectively. For SEM observation cells were postfixed with osmium tetroxide, dehydrated through a series of passages in increasing ethanol baths and dried in pure hexamethyldisilazane (HMDS, Fluka Chemie AG, Buchs, Switzerland). At the end, samples were mounted on stubs, coated with gold in a sputter coater (Agar Scientific, Stansted, UK) and then examined on a Cross-Beam 1540EsB electron microscope (Carl Zeiss GmbH, Oberkochen, Germany). To perform immunohistochemical, analysis samples fixed in paraformadehyde, permeabilized using triton X-100 and incubated in 3% bovine serum albumin. A549 cells were then treated with rhodamine-labeled phalloidin for 45 minutes at room temperature and counterstained with DAPI (1 mg/ml) for 20 minutes at room temperature. Samples were finally examined by laser confocal microscopy (LSM 510 Meta, Carl Zaiss, Germany).
Effect of substrate mechanical properties on alveolar epithelial cells
S. Silvani1, I. Cattaneo1, M. Figliuzzi1 and A. Remuzzi2
1 IRCCS- Istituto di Ricerche Farmacologiche “Mario Negri”, Italy; 2 Department of Industrial Engineering, University of Bergamo, Dalmine (BG), Italy;
email: [email protected]
T
Proceedings VII Meeting Italian Chapter of the European Society of Biomechanics (ESB-ITA 2017) 28-29 September 2017, Rome - Italy
109
ISBN: 978-88-6296-000-7

III. RESULTS
Phase-contrast images of A549 cells cultured on Thermanox™ Coverslips or Elastosil® Film showed a uniform cell adherence and growth on both substrates. On Thermanox™ Coverslips cells reached confluence after 72 hours while and formed a uniform monolayer. On Elastosil® Film A549 cells remained distributed in clusters, they did not spread over the membrane surface and remained attached in the same position, despite their growth. SEM analysis highlighted important differences in morphology and function of A549 cells depending on whether the cells were cultured on rigid or on elastic support (as shown in Fig. 1 and 2). Through SEM analysis, it was observed that A549 cells grown on Thermanox™ Coverslips remained flat, expressing a low number of microvilli. A549 cells cultured on Elastosil® Film maintained the typical alveolar cell morphology, with rounded shape and large number of microvilli on cell surface. In addition these cells produced an important amount of surfactant (see Fig. 2), an important lipoprotein complex for the prevention of lung collapse in vivo.
Figure 1. SEMimagesofA549cellsculturedonThermanoxcoverslipsafter72hofculture.
Figure 2. SEMimagesofA549cellsculturedonElastosilfilmafter72hofculture.
F-actin staining revealed that the elastic properties of the substrate importantly affect cells cytoscheleton. As shown in Fig. 3, A549 cells seeded on Thermanox™ Coverslips have a random distribution of F-actin fibers, with a few elongated fibers crossing the entire cellular bodies. In contrast, cells
grown up on Elastosil® Film displaied a randomly oriented cobblestone shape with F-Actin fibers mostly organized in dense peripheral actin bands.
Figure 3. Immunofluorescence imagesofA549cellsstainedforF-Actin(red)culturedonThermanoxcoverslips(left)andonElastosilfilm
(right)after72hofculture.Magnification40X.
IV. CONCLUSION
Our findings indicate that A549 cells cultivated on substrates with different elastic properties develop important differences in cell morphology and functionality. Cells in contact with a soft elastic support showed acquired phenotype similar to the physiological one of alveolar type II cells. Thus, to assess the toxicity of substances that can arrive in contact with alveolar membrane in the lungs, in vitro test should be based on an elastic culture supports instead of the traditional rigid culture dishes.
ACKNOWLEDGEMENT
This research was funded in part by a grant from the European Commission (Project Lowbrasys H2020-MG-2014/ Grant Agreement no. 636592). The Authors thank Dr. Ing. Giuseppina Lauriola and Prof. Federica Boschetti for assistance during mechanical testing.
REFERENCES [1] R. G. Crystal, S. H. Randell, J.F. Engelhardt, J. Voynow and M.
Sunday, “Airway Epithelial Cells” in Proc Am Thorac Soc,Vol. 5, pp. 772-777, 2008.
[2] M. A. Nandkumar, U. Ashna, L. V. Thomas and P. D. Nair, “Pulmonary surfactant expression analysis-Role of cell-cell interactions and 3D tissue-like architecture” in Cell Biol Int, Vol 39, pp. 272-282, March 2015.
[3] Z. Li et al., “Differential Regulation of Stiffness, Topography, and Dimension of Substrates in Rat Mesenchymal Stem Cells” in Biomaterials, Vol 34, pp.7616-7625, Jul 2014.
[4] D. Gagné et al., “Integrin-linked kinase regulates migration and proliferation of human intestinal cells under a fibronectin-dependent mechanism” in Journal of Cellular Physiology, Vol 222, pp.387-400, Febr 2010.
[5] A. Stockinger, A. Eger, J. Wolf, H. Beug and R. Foisner, “E-cadherin regulates cell growth by modulating proliferation-dependent β-catenin transcriptional activity” in J Cell Biol., Vol 154, pp.1185-1196, Sept 2001.
[6] S. Piccolo, S. Dupont and M. Condenonsi, “The biology of YAP/TAZ: Hippo Signaling and Beyond” in Physiological Reviews, Vol 94, pp. 1287-1312, Oct 2014.
[7] S. Dupont et al., “Role of YAP/TAZ in mechanotransduction” in Nature , Vol 474, pp. 179-183, Jun 2011.
[8] J. Fu et al., “Mechanical regulation of cell function with geometrically modulated elastomeric substrates” in Nat Methods, Vol 7(9), pp. 733-736, Sep 2010.
Proceedings VII Meeting Italian Chapter of the European Society of Biomechanics (ESB-ITA 2017) 28-29 September 2017, Rome - Italy
110
ISBN: 978-88-6296-000-7

Abstract—Excitable deformable cells act as cooperativestructures and show emergent behaviors from their interactions.The theoretical modeling and numerical simulation of such aninteraction is far from being fully unveiled though informationtransmission mismatches have been shown to underline severepathological conditions. In this study we provide a novel contactmechanics computational framework simulating the cooperativeinteraction among cardiac myocytes.
Keywords—Cardiomyocytes modeling, Active-strain, ContactMechanics, Nonlinear coupled PDEs.
I. INTRODUCTION
ARDIAC tissue is a complex heterogeneous and
anisotropic medium characterized by nonlinear and
multiscale dynamics. Imperfect mechanotransduction in the
cardiac tissue, converting mechanical deformation into a
change in cell growth or remodeling, is a cutting edge
research topic [1]-[2] since it can lead to a variety of
diseases. In order to describe the dominant mechanisms
occurring at different scales within a constitutive framework
for the cardiac tissue, microstructural properties have to be
properly described, including mechano-regulated interactions
occurring among the tissue constituents. In particular,
modeling and simulation of contact interactions between
myocytes is a topic still unchallenged today and a progress in
this field would allow the study of emergent phenomena
considered at the forefront of research in cardiovascular
biomechanics. In this perspective, in the present contribution,
a novel constitutive and computational framework for the
simulation of contact between cardiac myocytes is proposed.
The present work introduces important novelties with respect
to the current state-of-the-art. First, we extend the single cell
study proposed in [3], by formulating a novel constitutive
model for electro-mechanical contact between myocytes.
Second, we provide a novel finite element procedure
introducing a new structure-structure interaction with mixed
C
type boundary conditions, for two-dimensional bodies with
nonlinear electro-mechanical coupling. A representative
example of the problem is provided in figure.
II.CONTINUUM MODEL OF THE ACTIVE-STRAIN MYOCYTE
The kinematics of myocytes is framed within the classical
description of continuum mechanics under finite elasticity
assumptions and specialized for two-dimensional domains. In
order to encompass the nonlinear coupling between the
electrophysiological dynamics and the hyperelastic material
response induced by the excitation-contraction mechanisms
along the fibers directions in a single cardiomyocyte, the
multiplicative decomposition of the deformation gradient into
an elastic (passive) part and an active part is assumed [3]-[4]-
[5] The mechanical model is based on the active-strain
formulation [3]. The activation variables dynamics, which are
responsible for the contraction and thickening of the medium,
are ruled by the two-variable phenomenological Rogers-
McCulloch’s model [8]. The model has been demonstrated to
capture the main features of the action potential spatio-
temporal dynamics with a reduced mathematical complexity
though several possible extensions are available in the
literature [9]. The arising nonlinear coupled system of
equations, describing the atctive-strain elctromechanical
dynamics of a single cell, is solved numerically using a finite
element procedure. Following previous studies [10], a
possible solution strategy is based on staggered schemes for
the solution of the coupled system. This procedure consists in
dividing the problem into a mechanical phase and an
electrophysiological phase, corresponding to the equations
and solving at each time step the mechanical problem first
and then the electrophysiological problem. Both the
mechanical and the electrophysiological model are nonlinear
systems requiring a nested Newton-Raphson iterative scheme
A computational framework for electromechanical
contact between excitable deformable cells
P. Lenarda1, A. Gizzi
2, and M.Paggi
1
1 IMT School for Advanced Studies, Lucca, Italy; email: [email protected], [email protected] 2 Department of Engineering, University Campus Bio-Medico of Rome, Rome, Italy; email: [email protected]
Fig. 1 Representative scheme of cell-cell multiphysics contact mechanics.
Proceedings VII Meeting Italian Chapter of the European Society of Biomechanics (ESB-ITA 2017) 28-29 September 2017, Rome - Italy
111
ISBN: 978-88-6296-000-7

for the numerical solution.
III. STRUCTURE-STRUCTURE ELECTROMECHANICAL INTERACTION
MODEL
The exchange of the electrical impulse between two cells is
ruled by clusters of intercellular proteic channels, namely
gap junctions [11], that are voltage dependent and can induce
important effects on the overall emerging dynamics.
Imperfect mechanotransduction in the cardiac tissue,
converting mechanical deformation into a change in cell
growth or remodeling, is a cutting edge research topic, since
it can lead to a variety of diseases. In order to encompass the
complex nonlinear cell-cell interaction mechanism it is
introduced a set of internal boundary conditions defined on
the contact boundary between the two myocytes.
As far as the mechanical response is concerned, tractions
exchanged at the contact boundary must be continuous for
equilibrium considerations and are function of the relative
displacements. Experimental results based on atomic force
microscope measurements clearly pinpoint the existence of a
contact regime [1], which can be modelled as a traction-
separation constitutive relation [12]-[13] of the form:
T n=T n,max gn/ gn , max ,if 0<gn<gn , max ,
and T n=0, if gn>gn,max ,
where T n is the normal component of the cohesive
traction vector at the contact boundary, and gn is the
normal relative opening displacement, while gn ,max
T n,max are respectively critical gap opening and
maximum value of the normal traction.
. As far as the transfer of electric signals across the contact
boundary is concerned, it is assumed that the current flows
solely in the direction normal to the interface. According to
the experimental evidence [11], the contact diffusivity at the
boundary Dn is modeled as a nonlinear function of the
transjunctional voltage gap of the form:
Dn=a1+a2( 1
1+e−a1−a4Δ v
−1
1+e−a1+a4Δ v ),
where Δ v is the transjunctional gap between the two
myocytes and the other constants are model parameters.
IV. CONCLUSION
The proposed novel constitutive model, validated against
experimental evidences, reproduces static and dynamic
observed behaviors with particular attention to (i) length and
slope of contact boundary, (ii) maximum tractions at the
interface, (iii) cell width-length ratio, and (iv) propagation
rate of action potential between adjacent myocytes. The
proposed computational contact framework opens a new
micro-scale level of analysis within the context of nonlinear
interaction among biological objects. Forthcoming
contributions will target different biomedical applications,
e.g., crosstalk-based cardiovascular diseases, low energy
defibrillation devices, and microfluidic chip design and
optimization.
ACKNOWLEDGEMENT
The present work has received funding from the European
Research Council under the European Union’s Seventh
Framework Programme (FP/2007-2013) / ERC Grant
Agreement n. 306622 (ERC Starting Grant “Multi-field and
multi-scale Computational Approach to Design and
Durability of PhotoVoltaic Modules” - CA2PVM).
REFERENCES
[1] M.L. McCain, H. Lee, Y. Aratyn-Schaus, A.G. Klber, and K.K. Parker,
“Cooperative coupling of cell-matrix and cell-cell adhesions in cardiac
muscle”. PNAS vol. 109, pp. 9881–9886, 2012.
[2] V. S. Deshpande, R. M. McMeeking, A. G. Evans, “A bio-chemo-
mechanical model for cell contractility”, PNAS 103, pp. 14015–14020,
2006.
[3] R. Ruiz-Baier, et al. “Mathematical modeling of active contraction in
isolated cardiac myocytes”, Math. Med. Biol., vol. 31, pp. 259–283,
2014.
[4] C. Cherubini, S. Filippi, P. Nardinocchi, and L. Teresi, “An
electromechanical model of cardiac tissue: Constitutive issues and
electrophysiological effects,” Prog. Biophys. Mol. Biol., vol. 97, pp.
562–573, 2008.
[5] D. Ambrosi, G. Arioli, F. Nobile, and A. Quarteroni,
“Electromechanical coupling in cardiac dynamics: the active strain
approach,” SIAM J. Appl. Math., vol 71, pp. 605–621, 2011.
[6] A. Gizzi, C. Cherubini, S. Filippi, and A. Pandolfi, “Theoretical and
numerical modeling of nonlinear electromechanics with applications to
biological active media,” Comm. Comput. Phys., vol. 17, pp. 93–126 ,
2015.
[7] C. Cherubini, S. Filippi, P. Nardinocchi, L. Teresi, “An electromechanical model of cardiac tissue: Constitutive issues and electrophysiological effects”, Progress in Biophysics & Molecular
Biology 97 , pp. 562–573, 2008.
[8] J.M. Rogers, A.D. McCulloch, “A collocation-Galerkin finite element
model of cardiac action potential propagation,” IEEE Trans. Biomed. Eng., vol. 41, pp. 743–757, 1994.
[9] F.H. Fenton and E.M. Cherry, “Models of cardiac cells,” Scholarpedia,
vol. 3, pp. 1868, 2008.
[10] A. Quarteroni, T. Lassilla, S. Rossi, and R. Ruiz-Baier, “Integrated
Heart - Coupling multiscale and multiphysics models for the simulation
of the cardiac function ,” Comput. Methods Appl. Mech. Engrg., vol.
314, pp. 345—407, 2017.
[11] A.P. Henriquez, et al., “Influence of dynamic gap junction resistance on
impulse propagation in ventricular myocardium, A computer simulation
study,” Biophys. J., vol 81, pp. 2112–2121, 2001.
[12] M. Paggi, O. Wriggers, “Stiffness and strength of hierarchical
polycrystalline materials with imperfect interfaces,” J. Mech. Phys. Sol., vol. 60, pp. 557–572, 2012.
[13] J. Reinoso, M. Paggi, “ A consistent interface element formulation for
geometrical and material nonlinearities”. Comput. Mech. vol 54:1569–
1581, 2014.
Proceedings VII Meeting Italian Chapter of the European Society of Biomechanics (ESB-ITA 2017) 28-29 September 2017, Rome - Italy
112
ISBN: 978-88-6296-000-7

Abstract—In the perspective of automated processes for human pluripotent stem cell (hPSC) production, we investigated the sensitivity of specific hPSC culture media to peristaltic pump-based circulation. Low protein media circulated overnight were affected by insulin precipitation. hPSC aggregates, cultured as relevant assay, revealed unreported sensitivity of hPSCs to reduced insulin concentrations. Notably, the addition/presence of human serum albumin (HSA) in the media stabilized insulin and supported hPSC culture. Keywords—Pluripotent stem cells bioprocessing, Peristaltic
pumping, Insulin, Albumin.
I. INTRODUCTION PSCs represent a unique cell source for the unlimited
production of functional human cell types in vitro [1]. For their envisioned clinical use, standardised mass production is indispensable but still a challenge [2]. Recently, it was demonstrated that “matrix-free cell only aggregate” suspension culture in stirred-tank bioreactors represents a promising strategy [3], however the high sensitivity of hPSCs to physicochemical culture parameters requires additional efforts for the development of stable chemically-defined culture media and advanced culture technologies essential for standardized GMP/GCP-compliant bioprocesses.
Aiming at automated production in suspension culture, we investigated the sensitivity of specific hPSC culture media to peristaltic pump-based circulation, a technology extensively used in bioprocessing and tissue engineering.
II. MATERIALS AND METHODS
Culture media E8, TeSR-E8, mTeSR1, StemMACS iPS-Brew XF, DMEM/F12, E8 lacking one protein at a time (i.e. E8 minus bFGF, -TGFβ1, -transferrin, -insulin), and E8 + 0.01-0.1% HSA were conditioned overnight in the incubator under (Fig.1a): 1) static condition in 50 mL tube (SC); 2) continuous circulation (5-100 ml/min) within a peristaltic pump-based circuit (PC). Single hHSC_1285_T-iPS2 and HES3 NKX2-5eGFP/w cells were cultured 24h on orbital shaker to form aggregates (1x10⁶ cells, 3mL E8 + RI) [3], which were successively cultured for 3 days in conditioned media (Fig.1b). Light microscopy, flow cytometry (propidium iodide (PI) marker for hPSC viability, NANOG and OCT4 markers for hPSC pluripotency), UPLC-MS, and SEM analyses were performed.
Figure 1. Schematics of (a) hPSC culture media conditioning and (b) hPSC aggregate suspension culture with conditioned media.
III. RESULTS
hPSC aggregates cultured in SC E8 maintained their spherical morphology and increased in diameter over the 3 days (Figs 2a-c), in accordance with [3]. Unexpectedly, hPSC aggregates cultured in PC E8 were characterized at day 1 by irregular morphology and reduced size compared to the SC E8 controls, followed by increase in cell debris and disaggregation on days 2-3 (Figs 2d-f).
Figure 2. Light microscopy images of (a-c) hPSC aggregates cultured in SC E8 and (d-f) hPSC aggregates cultured in PC E8 over 3 days.
Peristaltic pump-based circulation can promote insulin precipitation in hPSC culture media
D. Massai1,2,4, E. Bolesani1,2, D. Robles Diaz1,2, C. Kropp1,2, H. Kempf1,2, C. Halloin1,2, U. Martin1,2, T. Braniste1,3, G. Isu4,5, V. Harms6, U. Morbiducci4, G. Dräger2,6, and R. Zweigerdt1,2
1 Leibniz Research Laboratories for Biotechnology and Artificial Organs, Hannover Medical School, Germany 2 REBIRTH-Cluster of Excellence, Hannover Medical School, Germany
3 National Center for Materials Study and Testing, Technical University of Moldova, Republic of Moldova 4 Department of Mechanical and Aerospace Engineering, Politecnico di Torino, Italy
5 Department of Biomedicine, University of Basel, Switzerland 6 Institute of Organic Chemistry, Leibniz University Hannover, Germany
H
Proceedings VII Meeting Italian Chapter of the European Society of Biomechanics (ESB-ITA 2017) 28-29 September 2017, Rome - Italy
113
ISBN: 978-88-6296-000-7
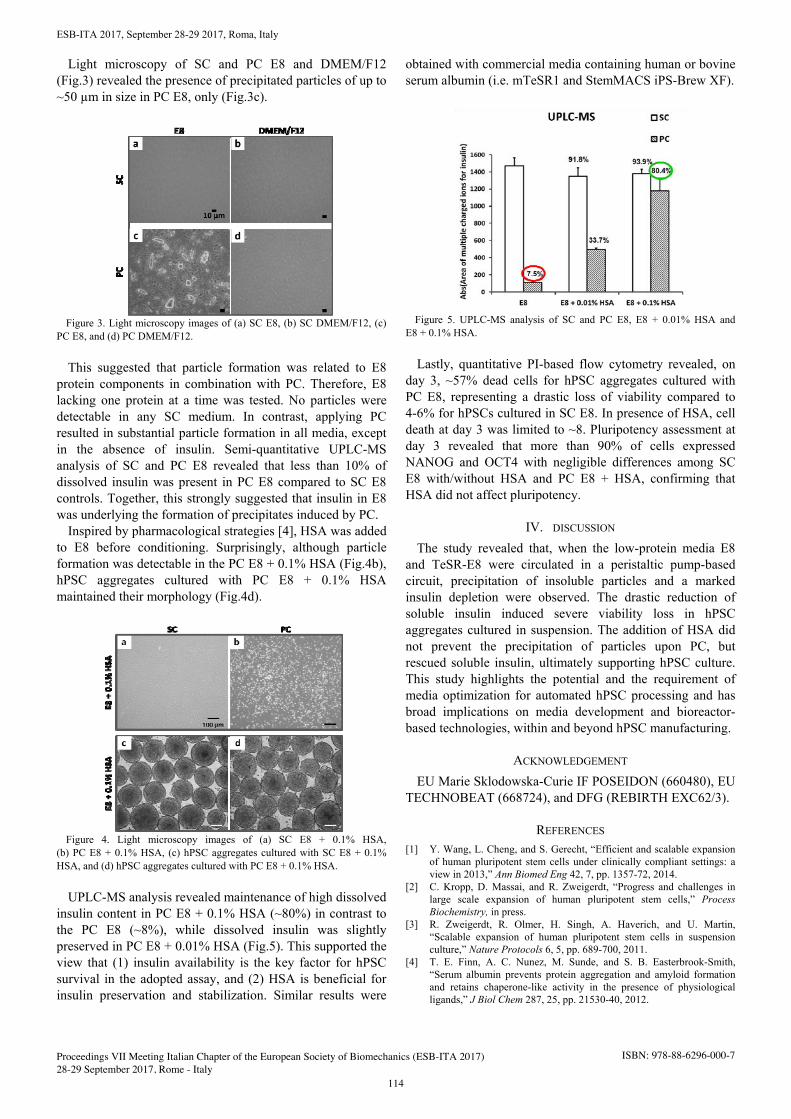
ESB-ITA 2017, September 28-29 2017, Roma, Italy 2
Light microscopy of SC and PC E8 and DMEM/F12 (Fig.3) revealed the presence of precipitated particles of up to ~50 µm in size in PC E8, only (Fig.3c).
Figure 3. Light microscopy images of (a) SC E8, (b) SC DMEM/F12, (c) PC E8, and (d) PC DMEM/F12.
This suggested that particle formation was related to E8 protein components in combination with PC. Therefore, E8 lacking one protein at a time was tested. No particles were detectable in any SC medium. In contrast, applying PC resulted in substantial particle formation in all media, except in the absence of insulin. Semi-quantitative UPLC-MS analysis of SC and PC E8 revealed that less than 10% of dissolved insulin was present in PC E8 compared to SC E8 controls. Together, this strongly suggested that insulin in E8 was underlying the formation of precipitates induced by PC.
Inspired by pharmacological strategies [4], HSA was added to E8 before conditioning. Surprisingly, although particle formation was detectable in the PC E8 + 0.1% HSA (Fig.4b), hPSC aggregates cultured with PC E8 + 0.1% HSA maintained their morphology (Fig.4d).
Figure 4. Light microscopy images of (a) SC E8 + 0.1% HSA, (b) PC E8 + 0.1% HSA, (c) hPSC aggregates cultured with SC E8 + 0.1% HSA, and (d) hPSC aggregates cultured with PC E8 + 0.1% HSA.
UPLC-MS analysis revealed maintenance of high dissolved insulin content in PC E8 + 0.1% HSA (~80%) in contrast to the PC E8 (~8%), while dissolved insulin was slightly preserved in PC E8 + 0.01% HSA (Fig.5). This supported the view that (1) insulin availability is the key factor for hPSC survival in the adopted assay, and (2) HSA is beneficial for insulin preservation and stabilization. Similar results were
obtained with commercial media containing human or bovine serum albumin (i.e. mTeSR1 and StemMACS iPS-Brew XF).
Figure 5. UPLC-MS analysis of SC and PC E8, E8 + 0.01% HSA and E8 + 0.1% HSA.
Lastly, quantitative PI-based flow cytometry revealed, on day 3, ~57% dead cells for hPSC aggregates cultured with PC E8, representing a drastic loss of viability compared to 4-6% for hPSCs cultured in SC E8. In presence of HSA, cell death at day 3 was limited to ~8. Pluripotency assessment at day 3 revealed that more than 90% of cells expressed NANOG and OCT4 with negligible differences among SC E8 with/without HSA and PC E8 + HSA, confirming that HSA did not affect pluripotency.
IV. DISCUSSION
The study revealed that, when the low-protein media E8 and TeSR-E8 were circulated in a peristaltic pump-based circuit, precipitation of insoluble particles and a marked insulin depletion were observed. The drastic reduction of soluble insulin induced severe viability loss in hPSC aggregates cultured in suspension. The addition of HSA did not prevent the precipitation of particles upon PC, but rescued soluble insulin, ultimately supporting hPSC culture. This study highlights the potential and the requirement of media optimization for automated hPSC processing and has broad implications on media development and bioreactor-based technologies, within and beyond hPSC manufacturing.
ACKNOWLEDGEMENT EU Marie Sklodowska-Curie IF POSEIDON (660480), EU
TECHNOBEAT (668724), and DFG (REBIRTH EXC62/3).
REFERENCES [1] Y. Wang, L. Cheng, and S. Gerecht, “Efficient and scalable expansion
of human pluripotent stem cells under clinically compliant settings: a view in 2013,” Ann Biomed Eng 42, 7, pp. 1357-72, 2014.
[2] C. Kropp, D. Massai, and R. Zweigerdt, “Progress and challenges in large scale expansion of human pluripotent stem cells,” Process Biochemistry, in press.
[3] R. Zweigerdt, R. Olmer, H. Singh, A. Haverich, and U. Martin, “Scalable expansion of human pluripotent stem cells in suspension culture,” Nature Protocols 6, 5, pp. 689-700, 2011.
[4] T. E. Finn, A. C. Nunez, M. Sunde, and S. B. Easterbrook-Smith, “Serum albumin prevents protein aggregation and amyloid formation and retains chaperone-like activity in the presence of physiological ligands,” J Biol Chem 287, 25, pp. 21530-40, 2012.
Proceedings VII Meeting Italian Chapter of the European Society of Biomechanics (ESB-ITA 2017) 28-29 September 2017, Rome - Italy
114
ISBN: 978-88-6296-000-7

Abstract— The main challenge in regenerating bone defects isto create scaffolds with properties, particularly mechanical ones, in the range of the native tissue performance. In this study we evaluated, by Finite Element Analysis (FEA), the influence of materials and geometrical parameters on the mechanical performance of a novel PCL/Bioglass scaffold for bone tissue regeneration. The different architectures were firstly realized by Computer-Aided Design (CAD) software, then used to simulate compression test with FEA, according to ASTM standard. The different combinations of materials (described by Young’s modulus and Poisson’s ratio), together with geometricalparameters (e.g. fiber and pore size, layer orientation), were used as inputs for FEA. The output was the compressive modulus of each scaffold. The design procedure was characterized by two innovative aspects. The first one was to strictly relate CAD step to the current possibilities of the manufacturing technology. The second aspect was to apply the Taguchi method at the very beginning of FEA, with the aim of anticipating the optimization of the scaffold design before the experimental phase. Thanks to this design procedure, it was found out a relation between geometrical/material parameters and scaffold performance which guides its physical realization.
Keywords—Scaffold; Design Optimization; Taguchi method;Finite Element Analysis
I. INTRODUCTION ne of the current innovative treatments for segmental bone defects (SBDs) is to use artificial scaffolds to
overcome the problems associated with autologous bone grafts. A wide range of synthetic materials has been proposed. In this perspective, 3D composite scaffolds made of a polymeric matrix loaded with an inorganic phase are of increasing interest in bone tissue regeneration [1]. The aim of this study was to evaluate the influence of material and geometrical parameters on the mechanical behaviour of novel PCL/Bioglass scaffolds, prior to take on their manufacturing, in order to have as much control as possible on their performances, with spare of time and costs.
Different scaffold architectures, obtained by the combination of geometrical inputs linked to the manufacturing technique (3D printing) and to the literature, were realized by CAD software.
CAD models were then imported in a FEA program firstly to validate them against experimental compressive testing and then to reveal a relation between material/geometrical
parameters and mechanical performance of the scaffolds, thus to optimize them for 3D printing.
II. MATERIALS AND METHODS
The main geometrical input parameters of the scaffold architecture were fibre diameter (330 and 840 μm), pore size (300, 450 and 600 μm), layer orientation (45, 60 and 90°) and offset of consecutive planes with the same orientation (Figure 1). They are chosen combining literature suggestions in the field [2]-[3] with the manufacturing technique, which is Fused Deposition Modeling (FDM) by a 3D Discovery printer (RegenHU, Switzerland).
Figure 1. Geometrical input parameters of the scaffold: layer orientation (A), offset (B), fibre diameter (C) and pore size (D).
The different scaffold architectures, obtained combining the above parameters, were realized by CAD software. Thanks to CAD calculations it was possible to compress the geometrical manufacturing parameters into global characteristics, such as fibre/pore diameter ratio [4], in order to control scaffold porosity [5]. CAD models were imported in a FEA software (Abaqus, Simulia) to simulate their compressive performance according to standard [6]. Material was modelled as isotropic, linear elastic. Young's modulus and Poisson ratio were spanned in a wide range, both to cover the values generally attributed to polymer/bioglass composites and to obtain scaffold performances closed to the trabecular bone. By Taguchi method, all the possible factorial combinations of geometrical and material parameters were reduced to the
Novel procedure to design 3D printed composite scaffolds for trabecular bone regeneration
G. Marchiori1, M. Berni1, M. Petretta4, C. Gualandi2, M. Boi1, D. Bellucci3, M. L. Focarete2, V. Cannillo3, B. Grigolo1, M. Bianchi1
1 Laboratory of Nanobiotechnology, Rizzoli Orthopaedic Instituite, Bologna, Italy; [email protected] 2 CHIM, University of Bologna, Italy; [email protected]
3 DIEF, University of Modena and Reggio Emilia, Italy; [email protected] 4 Laboratory of Immunorheumathology, Rizzoli Orthopaedic Instituite, Italy; [email protected]
O
Proceedings VII Meeting Italian Chapter of the European Society of Biomechanics (ESB-ITA 2017) 28-29 September 2017, Rome - Italy
115
ISBN: 978-88-6296-000-7

principal ones, which were selected as inputs for the FEA simulations. Finally, PCL/Bioactive glass material with specific composition was realized by mixing PCL pellets and Bioactive glass powders with innovative formulation (BGMIX_Mg [7], size < 20 µm). It was tested by indentation to obtain fibre material properties and then plotted in scaffolds. These were tested by compression [6] in order to validate the FEA simulations.
III. RESULTS AND DISCUSSION
36 different architectures were obtained combining the geometrical manufacturing parameters. By porosity control, the architectures with fibre diameter of 840 μm were rejected, reducing the number of geometrical models at 18. The selected geometrical parameters, together with the material ones at three different levels (low, medium and high values of Young's modulus and Poisson's ratio) would give 162 combinations. Applying the Taguchi method they were reduced to only 18, which underwent simulation. FEA output suggested, e.g. for PCL/Bioglass combination of 70/30 wt.%, that the architectures with fibre diameter of 330 μm, pore size 300 μm, regardless the fibers orientation, could be able to reach the compressive behavior of trabecular bone.
IV. CONCLUSION
It was proposed an innovative procedure to design and control the porosity and mechanical performance of scaffolds for tissue regeneration. It has been proved for 3D printing and bone regeneration, but it is suggested for various kinds of manufacturing and tissue engineering applications.
REFERENCES [1] Patrina S.P. Poh et al., “In vitro and in vivo bone formation potential of
surface calcium phosphate-coated polycaprolactone and polycaprolactone/bioactive glass composite scaffolds” in Acta Biomaterialia, 2016, vol. 30, pp. 319–330.
[2] L. Moroni et al. “Finite Element Analysis of Meniscal Anatomical 3D Scaffolds: Implications for Tissue Engineering” in The Open Biomedical Engineering Journal, 2007, vol. 1, pp. 23–24.
[3] B. Ostrowska et al. “Influence of internal pore architecture on biological and mechanical properties of three-dimensional fibre deposited scaffolds for bone regeneration” in Journal of Biomedical Materials Research - Part A, 2016, vol. 104, pp. 991–1001.
[4] N. Chantarapanich et al. “Scaffold Library for Tissue Engineering: A Geometric Evaluation” in Computational and MathematicalMethods in Medicine,2012.
[5] F.J. Martinez-Vazquez et al., “Improving the compressive strength of bioceramic robocast scaffolds by polymer infiltration,” Acta Biomaterialia, 2010, vol. 6, pp. 4361–4368,.
[6] ISO 84:2014 - Rigid cellular plastics - Determination of compression properties.
[7] D. Bellucci et al., “Role of magnesium oxide and strontium oxide as modifiers in silicate-based bioactive glasses: Effects on thermal behaviour, mechanical properties and in-vitro bioactivity,” in Materials Science and Engineering C, 2017, vol. 72, pp. 566-575.
Proceedings VII Meeting Italian Chapter of the European Society of Biomechanics (ESB-ITA 2017) 28-29 September 2017, Rome - Italy
116
ISBN: 978-88-6296-000-7

Abstract—The influence of topographic cues on the neuriticlength of neural-like cells was studied through a synergisticapproach, which involved both theoretical and computationaltools and was able to reproduce through a closed formexpression the relationship between length and alignment ofneuritic extensions of neuron-like cells.
Keywords—Hybrid model, Neuron-like cells,Mechanotransduction, Neural interfaces
I. INTRODUCTION
OPOGAPHIC cues influence the response of cells. Morespecifically, surfaces with a regular alternation of ridges
and grooves (gratings) were found to enhance alignment andoutgrowth of murine neural progenitor cells (mNPCs) [1] andof human mesenchymal stem cells (hMSC) [2]. Similarly,gratings were described to affect polarization, adhesion,growth and alignment of neuron-like cells [3-5]. Although adeeper knowledge of these cellular behaviours is crucial inseveral field of science (from medicine to neuroengineering)few studies were performed to investigate emergent neuralresponses, starting from interactions among cellulartransducers (e.g., filopodia and growth cones) and thegeometry of substrate. Since the nature of these responses isnot totally understood, here, a hybrid procedure (theoretical +computational) was used to investigate the connectionbetween the mean alignment of neuritic protrusion of PC12cells and their length on gratings.
T
II.METHODS
Neuron-like cells (PC12; CRL-17210, ATCC) weremaintained at 37°C temperature and 5% CO2 in a RMPIgrowth medium supplemented with 10% Horse Serum, 5%Fetal Bovine Serum, 2 mM glutamine, 10 U/ml penicillin,and 10 µM/ml streptomycin. Cells were seeded on threedifferent Cyclic Olefin Copolymer (COC) gratings, whilecontrol images were obtained from cell cultured on flatsurfaces. As previously reported [5], cells were differentiatedon different substrates through a treatment with NGF (finalconcentration 100 ng/ml). Each experiment was repeatedthree times independently. Differential interference contrast(DIC) images were acquired with an inverted Nikon-Ti PSFwide-field microscope (Nikon, Japan), and elaborated with
ImageJ (National Institute of Health, USA). Morespecifically, neuritic protrusions of PC12 cells weremeasured both on flat surface and gratings, while neuriticelongations were normalized with respect to the mean neuriticlength on control (flat) substrates. Similarly, the angle ofalignment with respect to the main anisotropy direction wasmeasured. Therefore, the proposed hybrid approach (see also[6,7] for previous investigations) was used to infer a novelclosed form relationship between the resulting neuriticelongation and the mean alignment of protrusions during theoutgrowth process.
III. RESULTS
Theoretical and computational tools were simultaneouslyused to provide a novel closed form relationships, which waswritten as:
<> = Re[g()] (1)
where <> was the mean angle of alignment, was theneuritic elongation and Re[%] was the real part of a closedform function g(), which was expressed as:
g()=K1·f()+ K2·f()-1 K– 3 (2)
where i was complex unit, while constants and functions inEquation (2) had the following forms:
K1 =(3½·i-1)/2;f() =(A·B()-C()·D)1/3;K2 =-23·54·7·43·3-1·(3½·i+1);K3 =103;A=5·103/[33/2·(23·1033·130927·1319429)½]; B()=(33·23·1033·130927·1319429·2-
28
·511
·13·1033·2027·130927·+29·33·510·23·8233·1319429)½
C()=23·33·54·23·1319429·-210·515·13·2027;D=(33·23·1319429)-1 ;
Hybrid modelling of neuron-like cells response togratings
P.N. Sergi*1, I. Tonazzini2,3,4 M. Cecchini2,3,5 and S. Micera1,6
1The Biorobotics Institute, Scuola Superiore Sant'Anna, 56127 Pisa,(I); email: [email protected] 2NEST, the National Enterprise for nanoScience and nanoTechnology, 56127 Pisa (I), email: [email protected]
3Istituto Nanoscienze-CNR, 56127 Pisa (I) ; email: [email protected] Fondazione Veronesi, 20122, Milano (I);
5Scuola Normale Superiore, 56127 Pisa (I); 6Translational Neural Engineering Laboratory, EPFL, 1202 Genève (CH); email: [email protected]
Proceedings VII Meeting Italian Chapter of the European Society of Biomechanics (ESB-ITA 2017) 28-29 September 2017, Rome - Italy
117
ISBN: 978-88-6296-000-7
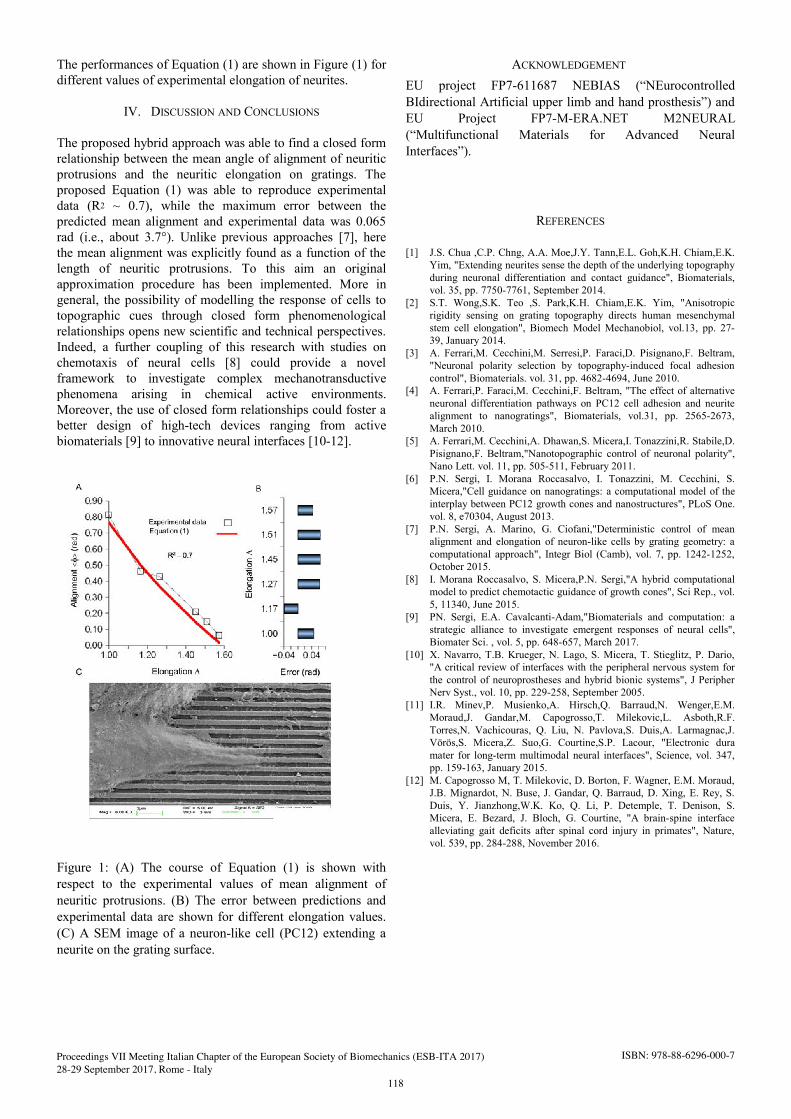
The performances of Equation (1) are shown in Figure (1) for different values of experimental elongation of neurites.
IV. DISCUSSION AND CONCLUSIONS
The proposed hybrid approach was able to find a closed formrelationship between the mean angle of alignment of neuriticprotrusions and the neuritic elongation on gratings. Theproposed Equation (1) was able to reproduce experimentaldata (R2 ~ 0.7), while the maximum error between thepredicted mean alignment and experimental data was 0.065rad (i.e., about 3.7°). Unlike previous approaches [7], herethe mean alignment was explicitly found as a function of thelength of neuritic protrusions. To this aim an originalapproximation procedure has been implemented. More ingeneral, the possibility of modelling the response of cells totopographic cues through closed form phenomenologicalrelationships opens new scientific and technical perspectives.Indeed, a further coupling of this research with studies onchemotaxis of neural cells [8] could provide a novelframework to investigate complex mechanotransductivephenomena arising in chemical active environments.Moreover, the use of closed form relationships could foster abetter design of high-tech devices ranging from activebiomaterials [9] to innovative neural interfaces [10-12].
Figure 1: (A) The course of Equation (1) is shown withrespect to the experimental values of mean alignment ofneuritic protrusions. (B) The error between predictions andexperimental data are shown for different elongation values.(C) A SEM image of a neuron-like cell (PC12) extending aneurite on the grating surface.
ACKNOWLEDGEMENT EU project FP7-611687 NEBIAS (“NEurocontrolledBIdirectional Artificial upper limb and hand prosthesis”) andEU Project FP7-M-ERA.NET M2NEURAL(“Multifunctional Materials for Advanced NeuralInterfaces”).
REFERENCES
[1] J.S. Chua ,C.P. Chng, A.A. Moe,J.Y. Tann,E.L. Goh,K.H. Chiam,E.K.Yim, "Extending neurites sense the depth of the underlying topographyduring neuronal differentiation and contact guidance", Biomaterials,vol. 35, pp. 7750-7761, September 2014.
[2] S.T. Wong,S.K. Teo ,S. Park,K.H. Chiam,E.K. Yim, "Anisotropicrigidity sensing on grating topography directs human mesenchymalstem cell elongation", Biomech Model Mechanobiol, vol.13, pp. 27-39, January 2014.
[3] A. Ferrari,M. Cecchini,M. Serresi,P. Faraci,D. Pisignano,F. Beltram,"Neuronal polarity selection by topography-induced focal adhesioncontrol", Biomaterials. vol. 31, pp. 4682-4694, June 2010.
[4] A. Ferrari,P. Faraci,M. Cecchini,F. Beltram, "The effect of alternativeneuronal differentiation pathways on PC12 cell adhesion and neuritealignment to nanogratings", Biomaterials, vol.31, pp. 2565-2673,March 2010.
[5] A. Ferrari,M. Cecchini,A. Dhawan,S. Micera,I. Tonazzini,R. Stabile,D.Pisignano,F. Beltram,"Nanotopographic control of neuronal polarity",Nano Lett. vol. 11, pp. 505-511, February 2011.
[6] P.N. Sergi, I. Morana Roccasalvo, I. Tonazzini, M. Cecchini, S.Micera,"Cell guidance on nanogratings: a computational model of theinterplay between PC12 growth cones and nanostructures", PLoS One.vol. 8, e70304, August 2013.
[7] P.N. Sergi, A. Marino, G. Ciofani,"Deterministic control of meanalignment and elongation of neuron-like cells by grating geometry: acomputational approach", Integr Biol (Camb), vol. 7, pp. 1242-1252,October 2015.
[8] I. Morana Roccasalvo, S. Micera,P.N. Sergi,"A hybrid computationalmodel to predict chemotactic guidance of growth cones", Sci Rep., vol.5, 11340, June 2015.
[9] PN. Sergi, E.A. Cavalcanti-Adam,"Biomaterials and computation: astrategic alliance to investigate emergent responses of neural cells",Biomater Sci. , vol. 5, pp. 648-657, March 2017.
[10] X. Navarro, T.B. Krueger, N. Lago, S. Micera, T. Stieglitz, P. Dario,"A critical review of interfaces with the peripheral nervous system forthe control of neuroprostheses and hybrid bionic systems", J PeripherNerv Syst., vol. 10, pp. 229-258, September 2005.
[11] I.R. Minev,P. Musienko,A. Hirsch,Q. Barraud,N. Wenger,E.M.Moraud,J. Gandar,M. Capogrosso,T. Milekovic,L. Asboth,R.F.Torres,N. Vachicouras, Q. Liu, N. Pavlova,S. Duis,A. Larmagnac,J.Vörös,S. Micera,Z. Suo,G. Courtine,S.P. Lacour, "Electronic duramater for long-term multimodal neural interfaces", Science, vol. 347,pp. 159-163, January 2015.
[12] M. Capogrosso M, T. Milekovic, D. Borton, F. Wagner, E.M. Moraud,J.B. Mignardot, N. Buse, J. Gandar, Q. Barraud, D. Xing, E. Rey, S.Duis, Y. Jianzhong,W.K. Ko, Q. Li, P. Detemple, T. Denison, S.Micera, E. Bezard, J. Bloch, G. Courtine, "A brain-spine interfacealleviating gait deficits after spinal cord injury in primates", Nature,vol. 539, pp. 284-288, November 2016.
Proceedings VII Meeting Italian Chapter of the European Society of Biomechanics (ESB-ITA 2017) 28-29 September 2017, Rome - Italy
118
ISBN: 978-88-6296-000-7

Abstract— Recent progress in micrometer-scale techniques has promoted the analysis of biological cells using lab-on-a-chip microfluidic devices. In this work, an electrical impedance based system for monitoring the motion, size and shape of cells flowing in a microchannel is presented, which can be used for a label-free biophysical characterization at the single-cell level.
Keywords—Cells, electrical impedance, microfluidics, lab on a chip.
I. INTRODUCTION INGLE-CELL impedance cytometry is a non-invasive
method for characterizing individual cells and particles with high-throughput [1, 2]. A microfluidic impedance chip typically consists of a microchannel equipped with microelectrodes and filled with a conductive buffer. An AC voltage is applied to a pair of electrodes, which causes a current to flow between them. The current change upon passage of a cell between the electrodes is measured and then analysed to determine cell properties. Coplanar-electrode chip layouts are especially attractive, because they can be easily patterned yielding miniaturized, reproducible, and ultimately low-cost devices.
The system presented in this work (Figure 1) is equipped with coplanar electrodes and comprises three parts: i) a 5-electrode zone for accurate sizing, velocity estimation and vertical position estimation [3], ii) an optical sensing region (triggered by electrical impedance signals) for transverse position estimation [4], iii) a 4-electrode cross zone for shape analysis [5]. Details on the operating principle are provided in the cited references.
II. MATERIAL AND METHODS
A. Chip microfabrication The microfluidic impedance chip consists of a PDMS
(polydimethylsiloxane) fluidic top layer and patterned microelectrodes on glass (Figure 1). In the sensing region, the microchannel cross sectional area is 40 µm (w) x 21 µm (h). The Ti/Au electrodes (20 nm/200 nm) were deposited on the glass substrate (75×25×1 mm) using optical lithography, e-beam evaporation and lift off procedures. The PDMS microchannels were replica molded from photo-lithographically patterned SU-8 master. The PDMS and glass were both activated by O2 plasma treatment before alignment and irreversible bonding. For fluidic access, a Teflon tube was inserted into the chip inlet and connected to a syringe pump (Harvard Apparatus), whereas electrical connections were made to the chips using pogo-pins within a custom holder.
B. Experimental setup Polystyrene beads (6 μm diameter), baker’s yeast or U937
cells were considered in the experiments (typical concentration of 106 cell/ml in PBS). Samples were pumped through the device at a flow rate of 10 µl/min. An excitation signal of 4 V@1 MHz was applied. Impedance was measured using a Zurich Instruments trans-impedance amplifier (HF2TA, 10kΩ gain) and impedance scope (HF2IS, 20 kHz filter bandwidth, 115 kHz sampling rate). A Mini UX100 high-speed camera was used for image acquisition. A custom Matlab toolbox was used for signal and image processing (event detection and feature extraction).
III. RESULTS AND DISCUSSION
Some results relevant to particle sizing and localization are here reported. In particular, a histogram of the estimated diameter of baker’s yeasts spiked with 6 μm beads is shown in Figure 2. Two yeast populations with Gaussian size distributions can be clearly distinguished (4.5±0.5 µm and 5.7±0.3 µm).
A density plot of bead centers in a transverse position X versus relative prominence P plane is reported in Figure 3 (the relative prominence P encodes for particle vertical position, the higher P and the closer the particle is to the channel floor). The graph shows particle focusing towards positions with lateral coordinate ± 12.5 μm and relative prominence ~ 0.2 or ~ 0.75. Electrical and optical recordings are shown in Figure 2 for four exemplary events. Points have been selected at low (A), medium (B, C) or high (D) relative prominence P and at positive (C), zero (B, D) or negative (A) X-coordinate. Particle passing through the center of the channel experience the highest velocity of the laminar flow profile, as can be observed from the particle in point B, which has the shortest duration among the ones reported.
Future activities will integrate into the device focusing mechanisms (e.g. acustophoretic) or deformation systems (e.g. flow induced or electric-field induced), in order to enable the analysis of cell biomechanical properties.
ACKNOWLEDGEMENT The research leading to this work was supported by the SIR
2014 Programme (Grant RBSI14TX20).
REFERENCES [1] K.C. Cheung, M. Di Berardino, G. Schade-Kampmann, M. Hebeisen,
A. Pierzchalski, J. Bocsi, A. Mittag, and A. Tárnok, “Microfluidic impedance-based flow cytometry,” Cytometry Part A, vol. 77(7), pp. 648–666, 2010.
Electrical impedance based monitoring of cells flowing in a microchannel
F. Caselli, A. De Ninno, R. Reale and P. BisegnaDepartment of Civil Engineering and Computer Science, University of Rome Tor Vergata, Italy; [email protected]
S
Proceedings VII Meeting Italian Chapter of the European Society of Biomechanics (ESB-ITA 2017) 28-29 September 2017, Rome - Italy
119
ISBN: 978-88-6296-000-7

[2] T. Sun and H. Morgan, “Single-cell microfluidic impedance cytometry: a review,” Microfluid. Nanofluid., vol. 8(4), pp. 423–443, 2010.
[3] A. De Ninno, V. Errico, F.R. Bertani, L. Businaro, P. Bisegna and F. Caselli, “Coplanar electrode microfluidic chip enabling accurate sheathless impedance cytometry,” Lab Chip, vol. 17(6), pp.1158–66, 2017.
[4] R. Reale, A. De Ninno, V. Errico, L. Businaro, P. Bisegna and F. Caselli, “3D particle localization in a microfluidic impedance
cytometer,” submitted to the 21st International Conference on Miniaturized Systems for Chemistry and Life Sciences, MicroTAS, 2017.
[5] M. Shaker, L. Colella, F. Caselli, P. Bisegna and P. Renaud, “An impedance-based flow micro-cytometer for single cell morphology discrimination,” Lab Chip, vol. 14(14), pp. 2548–55, 2014.
Figure 1. (a) Microfluidic impedance chip, consisting of a PDMS fluidic top layer and patterned coplanar microelectrodes on glass. Microscopy image of (b) 5-electrode sensing zone and (c) 4-electrode cross.
Figure 2. Baker’s yeast spiked with 6 μm diameter beads. Histogram of the estimated cell diameter (Y1 and Y2, yeast populations; B, beads).
Figure 3. Density plot of particle centers distribution in the microchannel cross-section (6 μm diameter beads). Electrical (5-electrode zone) and optical signals relevant to four exemplary events are shown (see text for explanation).
Proceedings VII Meeting Italian Chapter of the European Society of Biomechanics (ESB-ITA 2017) 28-29 September 2017, Rome - Italy
120
ISBN: 978-88-6296-000-7

GENERAL SESSION
Miscellany


The role of additional pulmonary blood flow in the cavopulmonary anastomosis
G. D’Avenio1, A. Amodeo2, and M. Grigioni1
1Center of Innovative Technologies in Public Health, Istituto Superiore di Sanità, Rome, Italy; email: [email protected]; [email protected]
2Pediatric Hospital “Bambino Gesù”, Rome, Italy,email: [email protected]
Abstract—The bidirectional cavopulmonary anastomosis (BCPA) is an operation often performed on children with functionally single ventricles, and is meant to prepare a future total cavopulmonary anastomosis. In the circulation ensuing from a BCPA, the lower circulation is external to the lung perfusion, with a propensity to low oxygen saturation, being only oxygenated by the mixing with the blood from the pulmonary veins, in the right atrium. A study is presented of the role of an additional pulmonary blood flow on the oxygen saturation, by means of a lumped parameter model. Keywords— Cardiac surgery, congenital heart disease,
univentricular circulation, mathematical modelling
I. INTRODUCTION ince many years, patients with only one functional ventricle (the so-called univentricular patients) are operated on with one (or more, in various stages at
different patient’s ages) of a series of surgical operations. The bidirectional cavopulmonary anastomosis (BCPA) is one of these, principally meant to prepare a future total cavopulmonary anastomosis, i.e., the connection with the two vene cavae connected directly to the pulmonary arteries. This connection is particularly important in the treatment of hypoplastic left heart syndrome (HLHS), when the functional right ventricle must be gradually prepared to bear the load associated to the circulation [1].
The circulation after the BCPA is basically composed of two circuits in parallel, the upper and the lower circulation, the latter being external to the lung perfusion. Hence, there is a potential problem of low oxygen saturation: the lower circulation is only oxygenated by the mixing with the blood from the pulmonary veins, in the right atrium (RA), hence the blood in the inferior part of the systemic circulation can be hypooxygenated, especially during exercise conditions. It has been proposed that an additional pulmonary blood flow, such as that imparted by a modified Blalock-Taussig shunt (which derives a fraction of the blood from the subclavian artery to the pulmonary arteries) could be beneficial as for the oxygen saturation [2]. In the present study, this hypothesis is verified by means of a lumped parameter model, which is a generalization of that proposed in [3].
II. MATERIALS AND METHODS
With reference to the modelling of the BCPA proposed by Santamore et al. [3], suitable modifications can be provided to account for the presence of an additional contribution to the pulmonary flow, such as that imparted by a Blalock-Taussig shunt.
For the total oxygen consumption V , it can be stated that2O
&
( )2222
1 OsOsOO VkkVkVkV &&&& −−++=
s
(1)
k being the fraction of the whole body oxygen consumption relative to used by the upper body, while k is the fraction of the same quantity which can be attributed to the part of the circulatory system constituted by the shunt. Eq. (1) states that the oxygen consumption in the lower body is ( )
21 Os Vkk &−−
0≅sk
.
It is natural to assume that . The rate of oxygen supply in the IVC and SVC is given by Eqs. 2 and 3, respectively:
( ) IVCOIVCOIVCOa QCVkQC222 ,, 1 =−− &
SVCOSVCOSVCOa QCVkQC222 ,, =− &
2,Oa
2O&
2,OIVCC2,OSVC
shuntSVCP QQQ +
(2)
(3)
These formulas relate the oxygen content in the aorta, C ,
and the rate of oxygen consumption in the whole body, V ,
to the oxygen content in the lower and upper body circulation, and C respectively.
Since the pulmonary flow is given in this case by two contributions, the following formula applies:
(4) =
where is the flow rate across the shunt connecting the aorta and the PAs.
shuntQ
SVCP QQ
In the usual BCPA, i.e., without additional sources of pulmonary blood flow, the mass conservation in Eq. (4) is simplified as = . The balance of oxygen content in the pulmonary circulation leads to
(4b)POPVLOshuntOshuntSVCOSVC QCVQCQC2222 ,,,, =++ &
SVCIVC QQCO + The combined cardiac output can be expressed as
= (5) In a steady state, the oxygen provided by the lungs is
equal to that consumed in the body, i.e.,
22 , OLO VV && =
SVCOSVC QC2,
POPVLOshuntOshuntOSVCOa QCVQCVkQC22222 ,,,, =++− &&
22 ,, OaOshunt CC =
(6)
From Eq. (4b), after substitution of the term
with the right-hand side of Eq. 3, .
Since , this equation can be rewritten as
( ) ( −+ 1 )VkQQC + &
( )shuntSVCOPV
OshuntSVCOa
QQC +=2
22
,
, (7)
S
Proceedings VII Meeting Italian Chapter of the European Society of Biomechanics (ESB-ITA 2017) 28-29 September 2017, Rome - Italy
123
ISBN: 978-88-6296-000-7

)
In the derivation, use has been made of Eq. (6). From Eq. (7) we can write the following expression, useful to derive the oxygen delivery to the arterial system:
( ) ( )( ) IVCOPVIVCOaO
shuntOPVshuntOa
QCQCVk
QCOCQCOC
222
22
,,
,,
1 −+−−
+=+
&(8)
Dividing Eq. (7) by and multiplying it by , we derive the formula:
( shuntSVC QQ +
IVCQ
( ) ( )shuntSVC
IVCOIVCOPVOa QQ
QVkQCC+
−−=−222
1,,& (9)
Plugging this expression for ( ) IVCOPVOa QCC22 ,, − in the
right-hand side of Eq. (8), the following formula can be straightforwardly derived:
( )shuntOa QCOC +2,
( ) ( )x
xVkQCOC OshuntOPV+
−−+=11
22,& (10)
where the position IVC
shuntSVC
QQQx +
≡ has been made.
In order to evaluate the effect of the systemic-to-pulmonary shunt, we assume in the following that
COQshunt β= , hence different degrees of shunting will be considered, by means of the choice of β .
From Eq. 10, the value of systemic oxygen delivery ( ) can be immediately derived. COC Oa ×
2,
III. RESULTS
The results of changing the parameter β (i.e., the fraction of the CO which is driven into the systemic-to-pulmonary shunt) in the model point out that there is an overall improvement in blood oxygen saturation level, either globally or at the regional (IVC or SVC) level, for increasing values of β . The values for the SVC/IVC ratio in the figures hereby reported are in the physiological range (comprised between 35/65 and 65/35), as in
IVCSVC QQ /[4].
In particular, Fig. 1 reports the global blood oxygen saturation level, which increases with , for every value of the shunt parameter
IVCSVC QQ /β . This is expected, since
higher SVC flows entail a higher pulmonary perfusion, as per Eq. 4. It is evident that increasing β , at a given value of the ratio , improves the blood oxygen saturation level, especially at the lower Q values. This result is remarkable especially for exercise conditions, when the lower body consumes a higher volume of oxygen than the upper body.
IVCSVC QQ /
IVCSVC Q/
IVCSVC QQ /
Also for the regional blood oxygen saturation level the presence of additional blood flow is beneficial. Fig. 2 shows the IVC oxygen saturation as a function of and β. A marked improvement is observed, especially for the minimum physiological value of in Fig. 2, allowing the oxygen saturation in the lower circulation to reach over 70% (for β=0.3), from 60% in absence of additional pulmonary flow.
IVCSVC QQ /
A similar improvement, even though of smaller degree, was observed also for the SVC compartment.
Figure 1: Oxygen saturation vs. SVC/IVC ratio, as a function of the parameter β, which characterizes the systemic-to-pulmonary shunt.
Figure 2: IVC oxygen saturation vs. SVC/IVC ratio, as a function of the parameter β, which characterizes the systemic-to-pulmonary shunt.
The observed advantages of providing an additional source of pulmonary blood flow, such as the modified Blalock-Taussig shunt, after BCPA are substantially in accordance with recent reports of a retrospective study with a remarkable sample size (82 patients) [5].
This mathematical model can presumably be used in the future to optimize the management of the pediatric patients with a single functional ventricle, from birth to the final surgical stage, the TCPC, i.e., total cavopulmonary connection.
REFERENCES [1] Goldberg CS, Gomez CA, 2003. Hypoplastic left heart syndrome: new
developments and current controversies. Semin Neonatol. 8(6):461-8. [2] Caspi J, Pettitt TW, Ferguson TB Jr, Stopa AR, Sandhu SK, 2003.
Effects of controlled antegrade pulmonary blood flow on cardiac function after bidirectional cavopulmonary anastomosis. Ann Thorac Surg. 76(6):1917-21.
[3] Santamore WP, Barnea O, Riordan CJ, Ross MP, Austin EH, 1998. Theoretical optimization of pulmonary-to-systemic flow ratio after a bidirectional cavopulmonary anastomosis. Am J Physiol. 274(2 Pt 2):H694-700.
[4] Salim, MA, Case CL, Sade RM, Watson DC, Alpert BS, and DiSessa TG, 1995. Pulmonary/systemic flow ratio in children after cavopulmonary anastomosis. J. Am. Coll. Cardiol. 25: 735–738.
[5] van Slooten YJ, Elzenga NJ, Waterbolk TW, van Melle JP, Berger RMF, Ebels T, 2012, The Effect of Additional Pulmonary Blood Flow on Timing of the Total Cavopulmonary Connection, Ann Thorac Surg., 93(6):2028-2033
Proceedings VII Meeting Italian Chapter of the European Society of Biomechanics (ESB-ITA 2017) 28-29 September 2017, Rome - Italy
124
ISBN: 978-88-6296-000-7

Abstract—Diffusion-tensor imaging (DTI) enables the reconstruction of the 3D arrangement of fibre bundles (FB) within a muscle, however, validation of DTI generated muscle FB data is limited. This study compared the 3D muscle FB arrangement (pennation angle (PA) and fibre bundle length (FBL)) within a human masseter generated through DTI to manual digitization. While agreement was found in PA, generated FBLs were generally longer in DTI. This muscle FB orientation data can ultimately be integrated to improve the representation of physiologic muscle loading in patient specific finite element modelling. Keywords—Diffusion tensor imaging, 3D muscle modelling,
fibre tracking, muscle fibres directionality
I. INTRODUCTION HREE dimensional (3D) finite element (FE) models arewidely used to investigate the behaviour of
musculoskeletal structures. In particular, FE modelling of craniomaxillofacial (CMF) behaviour requires representation of complex geometries, material property distributions and physiologic loading patterns. Computed Tomography (CT) imaging data can provide robust skeletal geometry and material property information, but is limited in representing soft tissues key to loading. Simplified loading conditions (no muscle loads or muscle loading represented by one dimensional links between origins and insertions [1]) are widely used, but may not represent physiologic conditions. To accurately represent muscle loading requires both the 3D geometry and the arrangement of fibre bundles within each muscle [2]-[6]. Fibre bundle (FB) tracking algorithms applied to magnetic resonance based diffusion-tensor imaging (MR-DTI) enables the reconstruction of the 3D arrangement of FB within a muscle. However, to date there is only limited validation of DTI generated muscle FB data [7]. As such, prior to the integration of muscle FB directionality data into CMF FE models, experimental validation of DTI based fibre tracking in the muscles of mastication is required. The specific aim of this work is to evaluate the ability of DTI based fibre tracking to represent the spatial organization of FBs in the human masseter.
II. MATERIAL AND METHODS
A single cadaveric specimen (female, 6 months of age) was used in all acquisitions and analyses. Research Ethics Board approval was received from Sunnybrook Research Institute and the University of Toronto.
A. IMAGE ACQUISITION A CT scan was acquired on a Toshiba Aquilion 320
machine (120 kVp, 100 mA, voxel size 0.62×0.62×0.3 mm). MRI was conducted on a 3T scanner (Achieva, Philips Medical Systems, Best, Netherlands) with a 16-channel SENSE XL torso coil. DTI with fat suppression was acquired using diffusion-weighting factor, b of 1200 s/mm2 (11 repetitions) and a built-in 32-direction sampling scheme in addition to a non-diffusion-weighted scan (FOV=350 mm FH ×200 mm AP ×300 mm RL, 2 mm isotropic resolution, TR=190 s, TE=72 ms, flip angle=90°, diffusion time 23.4 ms, acquisition time 38.5 h). A high resolution proton density-weighted structural scan with fat suppression was also acquired (TR=9.9 s, TE=10 ms, flip angle=90°, the same FOV as the DTI, but 0.5 mm isotropic resolution, acquisition time 4.8 h).
B. IMAGE PROCESSING Imaging data were first co-registered. The CT scan was
segmented (using thresholding and manual refinement) to extract the bone surface. The boundaries of the right masseter were manually segmented on the MRI structural image volume. This generated mask was resampled to be applied to the DTI volumes. The DTI data were separated into their respective gradient directions, averaged among the repetitions and filtered to reduce noise. The diffusion tensor, the eigenvalues and the associated eigenvectors were computed at each voxel. Based on the first eigenvector, the masseter fibre pathways were reconstructed using a streamline tracking algorithm. A fractional anisotropy below 0.01 was chosen as a stop criterion for fibre tracking. All analyses were performed within the Amira software environment (Amira Dev. 5.5, Visualization Imaging, San Diego, CA).
C. MANUAL DIGITIZATION One hundred eighty-one FBs of the masseter were serially
microdissected, and digitized using a MicroScribe MX Digitizer (0.05 mm accuracy Immersion Corporation, San Jose, CA). FBs were delineated on the surface of the muscle, digitized and excised. This process was repeated until the entire muscle was digitized.
D. COMPARISON OF MUSCLE ARCHITECTURAL PARAMETERS Muscle architecture from DTI and manual digitization was
compared in terms of pennation angle (PA) and fibre bundle
3D muscle fibre arrangement derived from diffusion-tensor imaging: a validation study
C. Falcinelli1, Z. Li2, W. Lam3, G. Stanisz3, A. Agur2 and C. Whyne1
1 Orthopaedic Biomechanics Laboratory, Sunnybrook Research Institute, Toronto, Canada; [email protected]; [email protected]
2 Division of Anatomy, University of Toronto, Canada; [email protected]; [email protected] 3 Physical Sciences, Sunnybrook Research Institute, Toronto, Canada; [email protected]; [email protected]
T
Proceedings VII Meeting Italian Chapter of the European Society of Biomechanics (ESB-ITA 2017) 28-29 September 2017, Rome - Italy
125
ISBN: 978-88-6296-000-7

length (FBL). Each FB was reconstructed using a Catmull-Rom cubic spline using the original data points resampled to an equal-spacing. To determine the PA of each FB, first the tangent vectors were computed for the terminal 20% of the length of the FB and then averaged [8], [9]. Next, the line of action of the masseter was determined by averaging the orientations of all the FBs [8], [9]. Finally, the PA for each FB was calculated as the angle between the FB and the overall line of action. Each FBL was determined by first calculating the Euclidean distance between adjacent points along the FB, and next the lengths of all segments were summed to obtain the total length[8].
E. STATISTICAL ANALYSIS The PA and FBL distributions were tested for normality
(Kolmogorov-Smirnov test). The Mann Whitney test was used to evaluate correspondence between the two methods (SPSS 20, SPSS Inc., IBM, Chicago, IL, USA).
III. RESULTS
A final set of 193 DTI-derived FBs were analysed in comparison to the 181 FBs digitized. Some DTI-derived FBs were found to be anatomically unrealistic, terminating in the proximal portion of the masseter or with a very short length (minimum FL 2.5 mm). These spurious FBs may have due to an additional stop criterion for tracking during muscle segmentation [7], [10]. As such, FBs that terminated too proximally and those shorter than the minimum length of the digitized FBs were removed prior to analysis (SelecLines module, Amira; Matlab, MathWorks, MA, USA).
A. PA RESULTS Both the DTI-derived PA distribution and that derived from
digitization were not normally distributed (p<0.0001). In Table I median, standard deviation (SD), first (Q1) and third (Q3) quartiles for PA measurements are reported. There was no significant difference in the PA measurement between the two methods (Mann Whitney test, p=0.411).
TABLE I PENNATION ANGLE AND FIBER BUNDLE LENGTH
PA° DTI (193 fiber bundles)
Manual Digitization (181 fiber bundles)
Median 13.1 12.6 SD 9.7 10.7 Q1 8. 1 7.8 Q3 19.7 20.2
FL (mm) DTI (193 fiber bundles)
Manual Digitization (181 fiber bundles)
Median 19.7 17.8 SD 4.6 3.1 Q1 16.3 16.3 Q3 23.6 19.5 Median, SD, first (Q1) and third (Q3) quartiles for PA and FBL
distributions from the masseter muscle via DTI and digitization methods.
B. FBL RESULTS While the FBL distribution derived from the digitization
data was not normally distributed (p<0.002), the DTI-derived
FBL distribution was statistically normal (p=0.09). In Table I median, standard deviation, Q1 and Q3 quartiles for PA measurements are reported. Significant difference in the FBL measurement between the two methods was found (Mann Whitney test, p<0.01).
IV. DISCUSSION
Whereas PA estimated through DTI data showed a strong correlation with the digitization-derived PA, a lack of agreement between the two methods was observed for the FBL. The lack of FBL agreement may depend on the tractography stopping criterion that can determine an early termination (e.g. before reaching the aponeurosis) of the tracts. This may lead to more variability in length for the DTI-derived fibres compared to digitization [11], and represents a challenge in DTI based fibre length estimation [10].
V. CONCLUSIONS Manual digitization of muscle fibre data is a laborious task
that is not practical for larger scale applications including patient specific FE model generation. Image based methods which can yield fibre data may be used to improve the physiologic representation of muscle loading in patient specific CMF FE models. This works represents a first attempt to validate the 3D fibre arrangement derived from DTI in the human masseter muscle.
REFERENCES [1] A. Pakdel, J. Fialkov, and C. M. Whyne, “High resolution bone
material property assignment yields robust subject specific finite element models of complex thin bone structures,” J Biomech, vol. 49, pp. 1454–1460, 2016.
[2] S. S. Blemker, P. M. Pinsky, and S. L. Delp, “A 3D model of muscle reveals the causes of nonuniform strains in the biceps brachii,” J Biomech, vol. 38, pp. 657–665, 2005.
[3] S. S. Blemker, and S. L. Delp, “Three-dimensional representation of complex muscle Architectures and geometries,” Ann of Biomed Eng, vol. 33, pp. 661–673, May 2005.
[4] O. Rohrle, and A. J. Pullan, “Three-dimensional finite element modelling of muscle forces during mastication,” J Biomech, vol. 40, pp. 3363–3372, 2007.
[5] Y. T. Lu, H. X. Zhu, S. Richmond, and J. Middleton “Modelling skeletal muscle fibre orientation arrangement,” Comput Methods Biomech Biomed Engin, vol. 14:12, pp. 1079–1088, 2011.
[6] C. A. Sanchez, J. E. Lloyd, S. Fels, and P. Abolmaesumi, “Embedding digitized fibre fields in finite element models of muscles,” Comput Methods Biomech Biomed Engin, vol. 2:4, pp. 223–236, 2014.
[7] P. Schenk, et al., “Determination of the three-dimensional muscle architectures: validation of the DTI-based fiber tractography method by manual digitization,” J Anat, vol. 223, pp. 61–68, 2013.
[8] Z. Li, J. P. M. Mogk, D. Lee, J. Bibliowicz and A. M. Agur, “Development of an architecturally comprehensive database of forearm flexors and extensors from a single cadaveric specimen,” Comput Methods Biomech Biomed Engin, vol. 3, pp. 3–12, 2015.
[9] D. Lee, Z. Li, Q. Z. Sohail, K. Jackson, E. Fiume, and A. Agur, “A three-dimensional approach to pennation angle estimation for human skeletal muscle,” Comput Methods Biomech Biomed Engin, vol. 18, pp. 1474–1484, 2015.
[10] J. Oudeman, et al., “A novel diffusion-tensor MRI approach for skeletal muscle fascicle length measurements,” Physiol Rep, vol. 4, e13012, 2016.
[11] B. Bolsterlee, A. D’Souza, S.C. Gandevia, and R. D. Herbert, “How does the passive lengthening change the architecture of the human media gastrocnemius muscle?,” J Appl Physiol, vol. 122, pp. 727–738, 2017.
Proceedings VII Meeting Italian Chapter of the European Society of Biomechanics (ESB-ITA 2017) 28-29 September 2017, Rome - Italy
126
ISBN: 978-88-6296-000-7
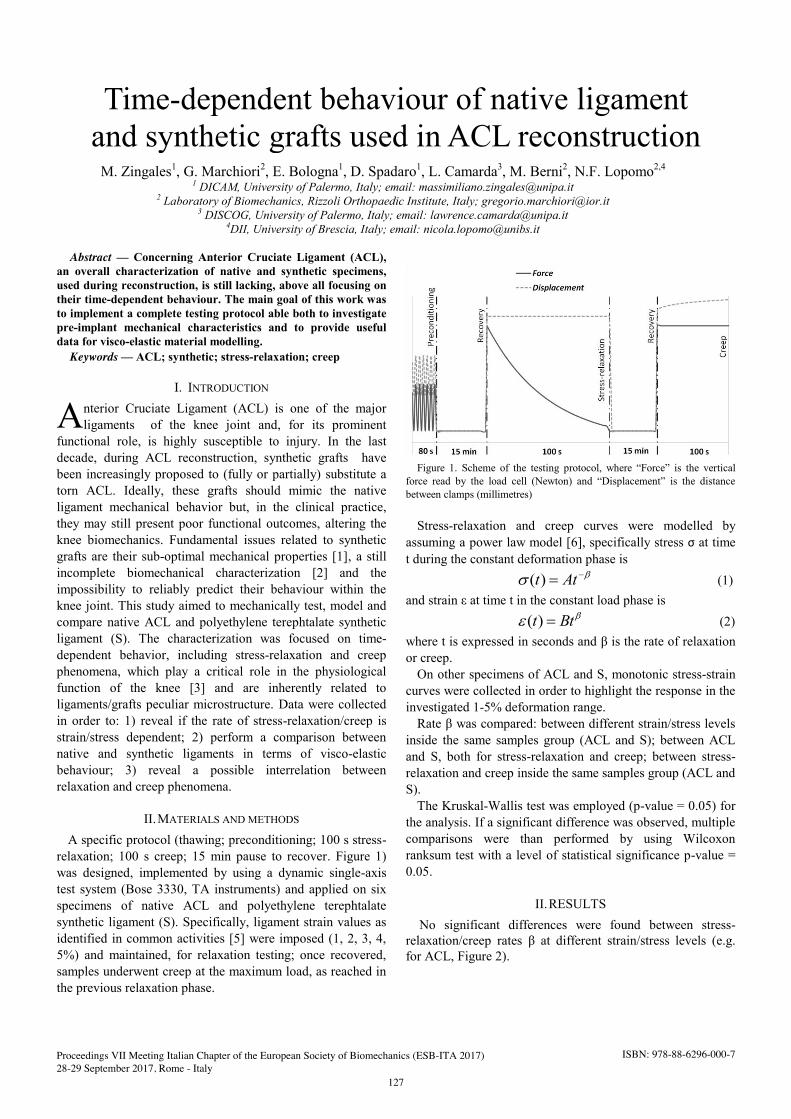
Abstract — Concerning Anterior Cruciate Ligament (ACL), an overall characterization of native and synthetic specimens, used during reconstruction, is still lacking, above all focusing on their time-dependent behaviour. The main goal of this work was to implement a complete testing protocol able both to investigate pre-implant mechanical characteristics and to provide useful data for visco-elastic material modelling.
Keywords — ACL; synthetic; stress-relaxation; creep
I. INTRODUCTION nterior Cruciate Ligament (ACL) is one of the majorligaments of the knee joint and, for its prominent
functional role, is highly susceptible to injury. In the last decade, during ACL reconstruction, synthetic grafts have been increasingly proposed to (fully or partially) substitute a torn ACL. Ideally, these grafts should mimic the native ligament mechanical behavior but, in the clinical practice, they may still present poor functional outcomes, altering the knee biomechanics. Fundamental issues related to synthetic grafts are their sub-optimal mechanical properties [1], a still incomplete biomechanical characterization [2] and the impossibility to reliably predict their behaviour within the knee joint. This study aimed to mechanically test, model and compare native ACL and polyethylene terephtalate synthetic ligament (S). The characterization was focused on time-dependent behavior, including stress-relaxation and creep phenomena, which play a critical role in the physiological function of the knee [3] and are inherently related to ligaments/grafts peculiar microstructure. Data were collected in order to: 1) reveal if the rate of stress-relaxation/creep is strain/stress dependent; 2) perform a comparison between native and synthetic ligaments in terms of visco-elastic behaviour; 3) reveal a possible interrelation between relaxation and creep phenomena.
II. MATERIALS AND METHODS
A specific protocol (thawing; preconditioning; 100 s stress-relaxation; 100 s creep; 15 min pause to recover. Figure 1) was designed, implemented by using a dynamic single-axis test system (Bose 3330, TA instruments) and applied on six specimens of native ACL and polyethylene terephtalate synthetic ligament (S). Specifically, ligament strain values as identified in common activities [5] were imposed (1, 2, 3, 4, 5%) and maintained, for relaxation testing; once recovered, samples underwent creep at the maximum load, as reached in the previous relaxation phase.
Figure 1. Scheme of the testing protocol, where “Force” is the vertical force read by the load cell (Newton) and “Displacement” is the distance between clamps (millimetres)
Stress-relaxation and creep curves were modelled by assuming a power law model [6], specifically stress σ at time t during the constant deformation phase is
EV Att)( (1) and strain ε at time t in the constant load phase is
EH Btt )( (2) where t is expressed in seconds and β is the rate of relaxation or creep.
On other specimens of ACL and S, monotonic stress-strain curves were collected in order to highlight the response in the investigated 1-5% deformation range.
Rate β was compared: between different strain/stress levels inside the same samples group (ACL and S); between ACL and S, both for stress-relaxation and creep; between stress-relaxation and creep inside the same samples group (ACL and S).
The Kruskal-Wallis test was employed (p-value = 0.05) for the analysis. If a significant difference was observed, multiple comparisons were than performed by using Wilcoxon ranksum test with a level of statistical significance p-value = 0.05.
II. RESULTSNo significant differences were found between stress-
relaxation/creep rates β at different strain/stress levels (e.g. for ACL, Figure 2).
Time-dependent behaviour of native ligament and synthetic grafts used in ACL reconstruction
M. Zingales1, G. Marchiori2, E. Bologna1, D. Spadaro1, L. Camarda3, M. Berni2, N.F. Lopomo2,4
1 DICAM, University of Palermo, Italy; email: [email protected] 2 Laboratory of Biomechanics, Rizzoli Orthopaedic Institute, Italy; [email protected]
3 DISCOG, University of Palermo, Italy; email: [email protected] 4DII, University of Brescia, Italy; email: [email protected]
A
Proceedings VII Meeting Italian Chapter of the European Society of Biomechanics (ESB-ITA 2017) 28-29 September 2017, Rome - Italy
127
ISBN: 978-88-6296-000-7

Fugure 2. Stress-relaxation (SR) and creep (Creep) rate β at the various strain levels 1-2-3-4-5% for ACL group.
Monotonic stress-strain curves supported this finding, showing a linear trend in the response on the investigated deformation range, both for ACL and S (Figure 3).
Figure 3. Monotonic curves in the 1-5% strain range. Imposed linear fitting was good: relative coefficient of determination R2 is closed to 1.
ACL relaxes more slowly, whereas S creeps much faster. These results underlined that the initial higher stiffness of the synthetic ligament respect to the native one may be balanced over time. Furthermore, stress relaxation proceeded faster than creep: the linear visco-elasticity with an exponential law was not met.
III. DISCUSSION
For the first time in a single study, both native ACL and the most commonly used synthetic grafts were tested under stress-relaxation and creep conditions, by considering different levels of strain/stress, with the aim of – first - comparing the time-dependent behavior of the two different materials and – secondary - trying to correlate the two phenomena from a phenomenological point of view.
In this study, the two possible sources of nonlinearity in the viscous mechanical response were represented by the influence of the stress level in its temporal evolution and by different time-dependent dynamics between stress-relaxation and creep. From a modeling point of view, the first influencing factor translates into the impossibility to separate the involved variables (time and strain/stress), the second in
the necessity of describing stress-relaxation and creep phenomena considering different parameters.
The results of this study highlighted how different levels of strain/stress did not influence the time-dependent behavior of the ligaments and grafts, confirming what already reported for native ACL [6] considering the only stress-relaxation phenomenon. However, the reported findings underlined significant differences between the time-dependent behavior of the two considered materials. Furthermore, differences between stress-relaxation and creep phenomena were reported for both native ligament and synthetic grafts; conditions that, until now, were demonstrated only on animal tissue [7].
IV. CONCLUSION
This study reported interesting findings concerning the time-dependent behavior of native ACL and synthetic grafts. Furthermore, here is reported a first preliminary attempt to model stress-relaxation and creep, in a perspective of predicting graft behavior. About these findings, two possible solutions could be pursued to model together stress-relaxation and creep phenomena in native and synthetic ACL: trying to adapt the linear visco-elastic theory to the micro-structure of the analyzed tissues, or introducing a more complete description that takes into account the fluid phase among the fibers of the tissue.
ACKNOWLEDGEMENT This study was supported by the "5×1000" (2013) funding
provided by Istituto Ortopedico Rizzoli, Bologna (Italy) and by the project “Multi-Scale Modeling for Predictive Characterization of Ligaments and Grafts Behavior in ACL Reconstruction” (GR2011-2012, project code: GR-2011-02351803) funded by the Italian Ministry of Health.
REFERENCES [1] J. W. Freeman and A. L. Kwansa, “Recent Advancements in Ligament
Tissue Engineering: The Use of Various Techniques and Materials for ACL Repair”, in Recent Patents on Biomedical Engineering, vol. 1, pp. 18-23, 2008.
[2] S. G. McLean, K. F. Mallet, E. M. Arruda, “Deconstructing the Anterior Cruciate Ligament: what we know and do not know about function, material properties, and injury mechanics”, in Journal of Biomechanical Engineering, vol. 137(2), pp. 020906-19, 2015
[3] S. Deo, A. Getgood, “A Technique of Superficial Medial Collateral Ligament Reconstruction Using an Adjustable-Loop Suspensory Fixation Device”, in Arthroscopy Techniques, vol. 4(3), pp. 261-265, 2015
[4] R. M. Castile, N. W. Skelley, B. Babaei, R. H. Brophy, S. P. Lake, “Microstructural properties and mechanics vary between bundles of the human anterior cruciate ligament during stress-relaxation”, in Journal of Biomechanics, vol. 49(1), pp. 87-93, 2015
[5] E. Manley, P. Provenzano, D. Heisey, R. Lakes, R. Vanderby, “Required test duration for group comparisons in ligament viscoelasticity: A statistical approach”, in Biorheology, vol. 40, pp. 441-450, 2003
[6] D. P. Pioletti, L. R. Rakotomanana, “On the independence of time and strain effects in the stress relaxation of ligaments and tendons”, in Journal of Biomechanics, vol. 33(12), pp. 1729-1732, 2000
[7] G. M. Thornton, A. Oliynyk, C. B. Frank, N. G. Shrive, “Ligament creep cannot be predicted from stress relaxation at low stress: a biomechanical study of the rabbit medial collateral ligament”, in Journal of Orthopedic Research, vol. 15(5), pp. 652-656, 1997
Proceedings VII Meeting Italian Chapter of the European Society of Biomechanics (ESB-ITA 2017) 28-29 September 2017, Rome - Italy
128
ISBN: 978-88-6296-000-7

Abstract— In this study a novel computational model, formulated via a finite-element technique and based on the Biot's linear poroelasticity theory, is developed for the assessment of brain shift in neurosurgery. The proposed computational framework aims to furnish a contribution towards the definition of a tool useful for surgical planning and for improving the intra-operatory accuracy of neuro-navigation systems. Some exemplary results are presented, highlighting the influence of a glioblastoma tumoral mass on the brian shift associated to a craniotomy surgical procedure. Keywords—Brain shift, Biot’s poroelasticity theory, Patient-
specific computational models, Brian tissue mechanics.
I. INTRODUCTION EURONAVIGATION represents the best technique for complex brain and spinal surgeries since it is the only
method allowing both minimal invasiveness and high precision during the surgical procedure [1].
Neuronavigation relies on morphological data acquired in the preoperative stage by employing Magnetic Resonance Imaging (MRI) and Computed Tomography (CT), from which patient-specific anatomy is reconstructed. Before the surgical procedure begins the neuro-navigator has to be set up in order to establish a spatial correspondence between the reference system associated to the physical space of the patient and the reference system assigned to the virtual model displayed on the monitor of the neuro-navigator. Afterwards the registration procedure and referring to brain surgery, the possible insurgence of brain shift (BS) as induced by different and coupled factors associated to surgical treatments (e.g., opening of the dura mater, high or unbalanced intracranial pressure, cerebrospinal fluid leakage, administration of drugs, dimension of craniotomy, tissue resection [2]), may induce non negligible errors in the neuro-navigation procedure, resulting in an overall loss of accuracy and in possible ineffective surgical performance.
Different methods have been developed to correct the inaccuracy induced by the BS. One of the most used consists in acquiring new data after the change of configuration of the brain tissue, by carrying out intraoperative MRI [3] that allows the updating of the neuro-navigator set-up and thereby the recovering of a suitable accuracy degree. Nevertheless, such an approach is expensive and time consuming, and it generally may result incompatible with timing of neurosurgery brain treatments. Another interesting method involves ultrasound systems (US), which are portable, they allow for real-time data acquisition, and are less expensive than the intraoperative MRI-based one. However, image resolution obtained in this case is usually not suitable for neuro-navigation purposes [4].
In this context, a challenging and open topic is represented by the possibility to simulate through numerical models the brain deformation/adaptation process induced by surgical treatments, opening to the conception of novel smart neuro-navigation systems able to self-offset the BS effects on the basis of patient-specific biomechanical models.
II. MATERIALS AND METHOD
A methodology for developing three-dimensional computational models of brain and neurocranium, incorporating patient-specific geometry from computer tomography (CT) images and biophysical data, is herein described (Fig. 1).
Fig. 1: Definition of patient-specific computational models.
A. Geometry reconstruction Input data are constituted by volumetric greyscale images
in DICOM format obtained by co-registration of CT and MRI. Brain, skull, ventricles and falx cerebri have been segmented from volumetric images employing the software Teneco SW developed by SenTech, and providing a description of the geometry via a surface mesh. Segmentation errors, due to possible coarse resolution of medical devices and/or involuntary patient movements, are reduced by applying a Taubin smoothing algorithm [6]. The computational domain (including brain, neurocranium, ventricles and falx cerebri) resulting from segmentation and smoothing process is discretized and employed for finite-element simulations.
B. Constitutive description All tissue regions are assumed to behave as nearly-
incompressible linearly elastic materials with isotropic constitutive symmetry. In detail, brain tissue is regarded as a porous medium saturated by fluid [4], [7]. Accordingly, its mechanical behaviour has been modelled via the Biot's
A computational model for brain-shift assessment in neurosurgery
A. Rizzo1,2, D. Bianchi1, R. Ferrante2, G. M. Russo2, M. Russo2, and G. Vairo1 1 DICII, University of Rome “Tor Vergata”, Italy; email:d.bianchi; [email protected]
2 SenTech s.r.l., Via Di Quarto Peperino, 35, 00188 Rome, Italy; email: [email protected]
N
Proceedings VII Meeting Italian Chapter of the European Society of Biomechanics (ESB-ITA 2017) 28-29 September 2017, Rome - Italy
129
ISBN: 978-88-6296-000-7

poroelastic linear theory [8], allowing to account for the influence of pressure within the pores on the overall stress in the porous matrix. Brain tissue (namely, the porous matrix) has been described as strongly inhomogeneous, in agreement with the greyscale distribution occurring in diagnostic images and by adopting mechanical data measured in both in vivo [9], [10] and ex vivo [11], [12] studies. Possible pathological tumoral tissues have been assumed to be characterized by a higher stiffness compared with the surrounding healthy tissue [10]. Moreover, falx cerebri has been modelled by considering a Young's modulus six times greater than the average value characterizing the surrounding parenchyma [13]. Ventricles, fulfilled with cerebrospinal fluid (CSF), have been simply modelled as a soft material whose Young's modulus is about 1/10 of the average value considered for the surrounding brain tissue. Finally, skull bones are considered as rigid elements, since their stiffness is about six orders of magnitude greater than that of other tissues [14].
C. Boundary conditions (i) Skull-brain interaction is described via a frictionless unilateral contact model; (ii) Falx cerebri is a fold of the dura mater, which adheres strongly to the skull, therefore its upper surface has been considered as fully restrained [7]. (iii) Linearly elastic springs have been applied to the base of the spinal cord to simulate the interaction with surrounding spinal tissues.
III. RESULTS
As a case study the brain herniation induced by craniotomy for surgical treatment of a glioblastoma is simulated. The glioblastoma has been simply described as a sphere located in the left hemisphere. Numerical results are obtained, highlighting the coupled influence of intracranial pressure (ICP) and of tumor radius (R) on brain shift. Figure 2 displays some exemplary numerical results in terms of displacement spatial distribution in a frontal cross section, for different values of R and for ICP = 18 mmHg.
Fig. 2: Exemplary numerical results. Displacement field for different values of tumor radius (from 0 to 30 mm) and for an intracranial pressure of 18 mmHg.
IV. CONCLUSION
The effectiveness of the implemented model has been verified by reproducing, as a first case study, a craniotomy intervention. The results obtained show that the proposed model, allowing to reproduce brain shift process, may be a useful tool in the phases of planning and management of
surgical treatments. Moreover, the effects of intracranial pressure (ICP) and tumour size on brain shift have been investigated. Finally, with the aim of providing a contribution to the current state of the art, the developed model can be retained as a first step towards the conception and realization of an advanced neuronavigation system that integrates imaging methodologies with computational biomechanical models. In this way, the integrated use of these aspects will allow to develop innovative technology in the context of biomedical instrumentation and clinical practice.
ACKNOWLEDGEMENT
D. Bianchi, G. Vairo: Italian Minister of University and Research, MIUR (Consolidate the Foundations 2015-BIOART).
REFERENCES [1] Ian J. Gerard, Marta Kersten-Oertel, Kevin Petrecca, Denis Sirhan,
Jeffery A. Hall, L. D. Collins, “Brain Shift in Neuronavigation of Brain Tumors: A review”, Medical Image Analysis, 2017, pp 403-420.
[2] Reinges M.H., Nguyen H., Krings T., Hutter B.O., Rohde V., Gilsbach J. , “Course of brain shift during microsurgical resection of supra-tentorial cerebral lesions: limits of conventional neuronavigation”, Acta Neurochirurgica, 2004, pp 369-377.
[3] F. Esposito, F. Di Rocco, G.l Zada, G. Cinalli, H. W.S. Schroeder, C. Mallucci, L. M. Cavallo, P. Decq, C. Chiaromonte, P. Cappabianca., “Intraventricular and Skull Base NeuroEndoscopy in 2012: A Global Survey of Usage Patterns and the role of intraoperative neuronavigation”, World Neurosurgery, 2013, pp 709-716.
[4] Kay Sun, T. S. Pheiffer, A. L. Simpson, J. A. Weis, R. C. Thompson, M. I. Miga, “Near Real-Time Computer Assisted Surgery for Brain Shift Correction Using Biomechanical Models”, IEEE Journal of Translational Engineering in Health and Medicine, 2014.
[5] I. Reinertsen, M. Descoteaux, S. Drouin, L. Collins, “Vessel Driven Correction of Brain Shift”, Lecture Notes in Computer Science, 2004, pp 208-216.
[6] G. Taubin, 1994,Curve and surface smoothing without shrinkage, Technical Report, RC-19563, IBM-Research.
[7] L. Xiaogai, H. von Holst, K. Svein, “Influences of brain tissue poroelastic constants on intracranial pressure (ICP) during constant-rate infusion”, Computer Methods in Biomechanics and Biomedical Engineering, 2013, pp 1330-1343.
[8] M. Biot, “General Theory of Three-Dimensional Consolidation”, Journal of Applied Physics, 1941, pp 155-164.
[9] K. Miller, K. Chinzei, G. Orssengo, P. Bednarz., “Mechanical properties of brain tissue in-vivo: experiment and computer simulation”, Journal of Biomechanics, 2000, pp 1369-1376.
[10] R. Sinkus, M. Tanter, T. Xydeas, S. Catheline, J. Bercoff, M. Fink, “Viscoelastic shear properties of in vivo breast lesions measured by MR elastography”, Magnetic Resonance Imaging, 2005, pp 159-165.
[11] S. Mehdizadeh, M. Khoshgoftar, S. Najarian, F. Farmanzad, S. A. H. Ahmadi, “Comparison between Brain Tissue Gray and White Matters in Tension Including Necking Phenomenon”, American Journal of Applied Sciences, 2008, pp 1701-170.
[12] B. Rashid, M. Destrade, M. D. Gilchrist, “Hyperelastic and Viscoelastic Properties of Brain Tissue in Tension”, Proceedings of the ASME 2012 International Mechanical Engineering Congress and Exposition, 2012.
[13] M. I. Miga, K. D. Paulsen, F. E. Kennedy, A. Hartov, D. W. Roberts., “Model-Updated Image-Guided Neurosurgery Using the Finite Element Method: Incorporation of the Falx Cerebri”, Medical Image Computing and Computer-Assisted Intervention, 1999, pp 900-910.
[14] J. A. Motherway, P. Verschueren, G. Van der Perre, J. V. Sloten, M. D. Gilchrist., “The mechanical properties of cranial bone: The effect of loading rate and cranial sampling position”, Journal of Biomechanics, 2009, pp 2129-2135.
Proceedings VII Meeting Italian Chapter of the European Society of Biomechanics (ESB-ITA 2017) 28-29 September 2017, Rome - Italy
130
ISBN: 978-88-6296-000-7

ESB-ITA 2017, September 28-29 2017, Roma, Italy 1
Abstract— In this study a computational model, formulated by means of a nonlinear finite-element strategy, is developed for the evaluation of mechanical behaviour of dental treatments. The proposed computational framework is employed to analyse different techniques in the field of prosthodontics practice, in order to highlight the influence of dental preparation on the mechanical response of treated teeth. To this aim, a comparative analysis between the anatomical-functional-geometry (AFG) preparation and the standard one is carried out. Proposed results disclose soundness and effectiveness of the computational approach in order to highlight possible drawbacks in load transfer mechanisms induced by the dental preparation.
Keywords - Dental treatment, finite element modelling, anatomic-functional-geometry technique.
I. INTRODUCTION HE aim of this study was to evaluate the influence of preparation geometry and design of the tooth on
stress/strain distribution. Considering that failure rates of posterior all-ceramic crowns are significantly higher than anterior ones, this study tries to furnish a contribution towards the improvement of mechanical performances in posterior teeth by changing the framework design. The improved physical properties of newer ceramics enabled reduced axial preparation depth and new preparation design [1]. The inspiration of the new shape design comes from the anatomic-functional-geometry (AFG) modelling technique [2]. By extrapolating the geometric basis of this modelling technique, a framework design standardized and reproducible from each clinical has been developed. One of the advantages of such an approach is associated to the fact that, the presence of standardized anatomical landmarks allows preparing teeth in a more conservative and anatomical way.
In this context and in order to assess effectiveness of AFG technique and/or possible related criticisms, finite-element-based numerical analysis (FE) can be retained a proper tool for the multi-causal evaluation of mechanical performances of all-ceramic restorations [3]. Specifically, in this study FE has been adopted to assess the influence of the preparation shape on stress/strain distributions in all-ceramic crowns.
II. MATERIAL AND METHODS
A. Sample preparation for geometry reconstruction Out of 112 human extracted teeth, including first and
second premolars and first molars, 12 were selected. The exclusion criteria were the presence of caries and several occlusal abrasions. Selected teeth were extracted because of
periodontal disease or orthodontics reasons. The study group included one first premolar, one second premolar and one first molar from each quadrant. Each selected tooth was duplicated two times by using a stainless-steal master die filled with polymethyl-metacrylate resin. The 24 duplicate teeth were divided in two groups (A and B) and prepared to receive a complete crown restoration (group A and group B including one first premolar, one second premolar and one first molar from each quadrant).
One operator with a constant water spray and using the same specific sequence of burs executed all preparations manually. In the group A, the preparation design chosen was considered the typical one of the minimal preparation suggested for ceramic crowns. A 1 mm groove was cut along the central fissure. A line was marked on the buccal and palatal cusps from the cusp tips. This line was connected to the bottom of the groove prepared in the first step with a tapered diamond bur [4]. A wall taper of 6 degrees was applied to the preparation until the CEJ that was completed with a finishing margin. In the group B, the preparation design was based on the principles of AFG modelling. The first phase included the identification of the anatomical details and of geometric landmarks belonging of AFG modelling technique. The second step consisted with the elimination of the superficial anatomical design and the preparation of triangles on the sides of the primary crests, which have a very repetitive pattern. One millimetre grooves were cut on the top of the crests and on the furrows according to the AFG modelling guidelines. The same lines were applied to the axial walls until the CEJ. After the elimination of undercuts the preparation was completed with a finishing margin.
B. Numerical modelling Each selected tooth is regarded as a continuum body, i.e. a
regular region in the Euclidean space. The solid domain is composed of three subregions: prepared tooth, ceramic crown and cement region. The cement region, is defined as the volume region separating tooth and crown. The three-dimensional geometry of each sample is reconstructed in an automatic way, by combining CAD techniques and optical scanner technology, and by employing –for generating surface meshes of each sample– Rhinoceros, Optical RevEng and Exocad software. Each material region is assumed homogeneous and to behave as a linearly-elastic material with isotropic constitutive symmetry, whose mechanical properties are set fully in agreement with the specialized literature [5]. All interfaces are assumed perfectly bonded.
Mechanical behaviour of dental treatments based on an anatomic-functional geometry (AFG) technique
D. Bianchi1, C. Lorenzi2, D. Severino3, L. Arcuri2, A. Dolci2 and G. Vairo1 1University of Rome "Tor Vergata"- Department of Civil Engineering & Computer Science (DICII), Rome - Italy, e-mail:
[email protected], [email protected] of Rome "Tor Vergata"- Department of Clinical Science and Translational Medicine, Rome - Italy, e-mail:
[email protected], [email protected], [email protected] 3Private Practice in Rome, Rome - Italy, e-mail:[email protected]
T
Proceedings VII Meeting Italian Chapter of the European Society of Biomechanics (ESB-ITA 2017) 28-29 September 2017, Rome - Italy
131
ISBN: 978-88-6296-000-7

ESB-ITA 2017, September 28-29 2017, Roma, Italy 2
Numerical simulations are carried out by considering the tooth model undergoing physiological load conditions (as sketched in Fig. 1), and accounting for the presence of the periodontal ligament (PDL). In detail, following the modelling strategy proposed in [5], PDL nonlinearities and anisotropy are described via a discretized distribution of non-linearly elastic spring elements, acting along the normal direction to the constrained tooth surface (Fig. 1) and whose tangent stiffness value locally depends on the local level of strain. In particular, the PDL nonlinear modelling is based on the multiscale formulation proposed in [6,7].
As a result, nonlinear numerical simulations are performed by adopting an incremental approach, based on an updated Lagrangian formulation and implemented via a home-made Matlab code which exploits the finite-element capabilities of COMSOL Multiphysics.
Figure 1: Schematic representation of loading conditions and of PDL-based boundary conditions considered in the present study.
III. RESULTS
In order to carry out a comparative analysis of different dental preparations, the mechanical interaction between ceramic crown and prepared tooth is mainly assessed by evaluating the stress distribution at the crown-tooth interface (namely, into the cement region). As an example, the spatial distribution of Von Mises stress measure at the crown-tooth interface, in the first molar and for both standard and AFG preparation techniques, is shown in Fig. 2(a). Moreover, Fig. 2(b) highlights differences in terms of surface area at the crown/prepared-tooth interface in both cases, such a measure being able to be considered as an index of stability for the treated tooth.
IV. CONCLUSION
In this work, a computational model formulated by means of a nonlinear finite-element strategy is developed. A comparative study between two different dental preparation (standard and AFG-based) is presented. Proposed model integrates a fine description of periodontal ligament obtained via a multiscale approach. Moreover, different physiological load patterns are investigated in order to contribute towards the proper assessment of the influence of dental preparation type on the mechanical response arising in tooth-bone load-transfer mechanisms.
Figure 2: (a) Spatial Von Mises stress distribution in first molar for both standard and AFG preparation; (b) surface area between crown and prepared tooth in standard and AFG preparations.
ACKNOWLEDGEMENT
D. Bianchi and G. Vairo acknowledge the Italian Minister of University and Research, MIUR (Research program: “Consolidate the Foundations 2015”; Project: BIOART; Grant number (CUP): E82F16000850005).
REFERENCES
[1] Sorensen J. A., Cruz M., Mito W., Raffeiner O., Foser H. P., 1998. A clinical investigation on three-unit fixed partial dentures fabricat- ed with a lithium disilicate glass-ceramic, Pract. Periodontics Aesthet. Dent. 11, 95-106.
[2] Battistelli A., Severino D., La Manna O., 2010, AFG Modelling, Team work Media.
[3] Jager N. D., Pallav P., Feilzer A. J., 2005, The influence of design parameters on the FEA-determined stress distribution in CAD-CAM produced all-ceramic dental crowns., Dent. Mater. 21, 242-251.
[4] McLean J. W., Hughes T. H., 1965, The reinforcement of dental porcelain with ceramic oxides. Br. Dent. J. 119, 251-267.
[5] F. Maceri, M. Martignoni, and G. Vairo, 2007, Mechanical behaviour of endodontic restorations with multiple prefabricated posts: a finite-element approach. J. Biomech. 40(11): 2386-2398.
[6] F. Maceri, M. Marino, and G. Vairo, 2010, A unified multiscale mechanical model for soft collagenous tissues with regular fiber arrangement. J. Biomech. 43:355-363.
[7] M. Marino, G. Vairo, 2013, Multiscale elastic models of collagen bio-structures: from cross-linked molecules to soft tissues. A., Gefen (Ed.), Studies in Mechanobiology, Tissue Engineering and Biomaterials, vol.14, pp. 73-102, Springer, Berlin.
Proceedings VII Meeting Italian Chapter of the European Society of Biomechanics (ESB-ITA 2017) 28-29 September 2017, Rome - Italy
132
ISBN: 978-88-6296-000-7

Abstract— Biomaterials have an intrinsic viscoelastic behaviour. However, their elasticity is actually the most studied aspect of these materials and different techniques to modulate stiffening have been developed. In order to address the viscous component, agarose gels in dextran solutions with different concentrations were tested using the epsilon-dot method. Our results show that varying the viscosity of the liquid phase influences the mechanical behaviour of the gels and also enables modulation of material viscoelasticity.
Keywords—viscoelasticity, biomaterials, epsilon-dot.
I. INTRODUCTION issues and biomaterials are characterised by a biphasic structure: a solid network, responsible for elastic
properties, surrounded by an aqueous solution, related with the viscous properties [1]. Despite the intrinsic viscoelasticity of these materials, most of the studies in the literature are focused on the control and modulation of the elastic behaviour using different stiffening techniques (i.e. physical, chemical, enzymatic) [1]. The few works in the literature on the modulation of viscoelasticity are based on rheological measurements. The resultant dynamic modulus reflects the elastic storage modulus G’) and viscous behaviour (loss modulus G’’). For example, in [2], nanoparticles (NP) containing gels resulted in an increasing yield stress with increasing NP concentration. Moreover, as described in [3] the macroscopic viscoelastic properties of a physical hydrogel are reversibly modulated by tuning the microscopic hydrogen bonding interactions with pH. As a result, the yield stress of the hydrogel is greatly enhanced reducing the pH from 7.0 to 5.0, and also G′ and G″ indicate an enhanced rigidity and stability of the gel. Mensitieri et al. show that auto-crosslinked polysaccharide (ACP) polymers can be modulated both by varying the degree of crosslinking and the weight concentration [4]. At a fixed concentration, the elasticity can be increased by increasing the level of chemical crosslinking substantially without increasing the viscous dissipation. However, these studies are not focused on a specific modulation of the viscous component, but on the measurement of the resultant effect on both the elastic and viscous component. To address this gap, our aim was to modulate material viscoelasticity by acting on the damping component, i.e. through tuning of the liquid phase viscosity of alginate gels with different dextran concentrations.
II. MATERIAL AND METHODS
A. Sample Preparation Agarose powder was dissolved in water and aqueous
solutions of 2 and 5% w/v dextran respectively to give a final agarose concentration of 1% w/v. The solution was stirred under boiling and then cast into custom moulds, obtaining 13mm diameter-8mm heights cylindrical samples.
B. Viscosity Measurements The viscosity of the different dextran solutions was
measured with an AMVN Automated micro-viscosimeter.
C. Mechanical Testing The viscoelastic properties of the gels were tested using
the epsilon-dot method [5]. Unconfined bulk compression tests were performed at different strain rates (0.0005 – 0.001 – 0.005 and 0.01s-1) with a ProLine Z005 Zwick/Roell.
The mean stress-time curves were globally fitted using the relative equation for the standard linear solid model (Fig. 1), obtaining E1, E2 and η and consequently the equilibrium modulus Eeq, the instantaneous modulud Eist and the relaxation time τ as described in [5].
Figure 1. SLS model
III. RESULTS AND DISCUSSIONS
A. Viscosity Measurements In Table I, the measured density and viscosity for water
(control) and the 2% and 5% dextran solution measured at different temperatures (16, 21 and 26°C) are shown. As
Engineering viscoelasticity in biomaterials L.Cacopardo1, N.Guazzelli1, R. Nossa1, G.Mattei1,2, and A. Ahluwalia1
1 Research Center ‘E. Piaggio’, Department of Information Engineering, University of Pisa, Italy; email:[email protected]; [email protected].
2 Optics11, The Netherlands.
T
Proceedings VII Meeting Italian Chapter of the European Society of Biomechanics (ESB-ITA 2017) 28-29 September 2017, Rome - Italy
133
ISBN: 978-88-6296-000-7

ESB-ITA 2017, September 28-29 2017, Roma, Italy
expected, viscosity increases with increasing dextran concentration.
B. Viscoelastic Properties The results in Figure 2 show how the increased viscosity of the liquid phase is reflected in a reduction of both instantaneous and equilibrium moduli and in a reduction of the relaxation time. As expected, a variation of one component, in this case the viscous element, implies the variation of the other. In fact, in biomaterials viscoelastic and elastic properties are intrinsically related through the time constant. Thus it is possible to modulate the mechanical behaviour of the material acting only on the damping component instead of on the crosslinking of the ‘elastic network’. In particular, the more significant variations of the instantaneous elastic modulus, Eist and the time constant, τ with respect to the equilibrium modulus, Eeq reflect the action on E2 and η, which are placed in series in the SLS parallel model.
Figure 2. Viscoelastic measurements: a) Instantaneous and Equilibrium modulus; b) Relaxation time.
IV. CONCLUSION
Considering the importance of the viscous component in tissues and biomaterials, in this study the viscosity of the liquid phase of agarose samples was modulated. Specifically, the liquid phase viscosity was varied by adding increasing concentrations of dextran to the aqueous medium. Mechanical tests showed that the modulation of the liquid phase is reflected in the viscoelastic properties of the gels. Increasing the viscosity of the solution resulted in an increase of the viscous component and a reduction of elastic one. Therefore, this method is suitable to specifically modulate material viscoelasticity.
.
REFERENCES [1] A. Hoffman,. "Hydrogels for biomedical applications." Advanced drug
delivery reviews, vol. 64, pp. 18-23, 2012. [2] S. Bhattacharya, S. Aasheesh Srivastava and P. Asish Pal. "Modulation of
viscoelastic properties of physical gels by nanoparticle doping: Influence of the nanoparticle capping agent" Angewandte Chemie vol. 118.18, pp.3000-3003, 2016.
[3] N. E Shi, H Dong. G. Yin, Z. Xu, and S.H. Li. “A Smart Supramolecular Hydrogel Exhibiting pH. Modulated Viscoelastic Properties” Advanced Functional Materials, vol. 17, pp. 1837-1843, 2007.
[4] M, Mensitieri, L. Ambrosio, L. Nicolais, D. Bellini and M. O'Regan ‘’Viscoelastic properties modulation of a novel autocrosslinked hyaluronic acid polymer”. Journal of Materials Science: Materials in Medicine, vol. 7, pp. 695-698, 1996.
[5] A. Tirella, G. Mattei, and A. Ahluwalia. “Strain rate viscoelastic analysis of soft and highly hydrated biomaterials” Journal of Biomedical Materials Research vol. 102(10), pp. 3352-3360, 2014.
TABLE I VISCOSITY MEASUREMENTS
Dextran (%w/v) Density [g/cm^3] Viscosity [mPa*s]
0% - 16°C 0,9989 1,1039
0% - 21°C 0,9979 0,9774
0% - 26°C 0,9967 0,8729
2% - 16°C 1,0062 2,6775
2% - 21°C 1,00523 2,347
2% - 26°C 1,0039 2,0761
5% - 16°C 1,0163 6,8656
5% - 21°C 1,0152 5,9734
5% - 26°C 1,014 5,2314
A
B
Proceedings VII Meeting Italian Chapter of the European Society of Biomechanics (ESB-ITA 2017) 28-29 September 2017, Rome - Italy
134
ISBN: 978-88-6296-000-7

SPECIAL SESSION
Master Thesis Award


Modelling and simulation of fluid-structure interaction in arterial vessels via a multiscale constitutive
framework
Elisabetta Monaldo
Master Thesis in Medical Engineering Department of Civil Engineering and Computer Science, University of Rome “Tor Vergata”, Italy Email: [email protected] Supervisor: Giuseppe Vairo ([email protected]) Extract from the Supervisor’s reference letter … Within the context of the Master Thesis project, Elisabetta Monaldo has developed a computational tool for simulating fluid-structure interaction processes in arterial segments. The project aimed to furnish a contribution towards the understanding of dominant mechanisms related to the aetiology, the onset and the evolution of some vascular diseases (e.g., aneurysm), developing some computational methodologies and techniques useful for supporting clinicians in choosing the optimal patient-specific therapeutic strategy.
Fluid-structure interaction in arterial vessels has been described by combining the double multiscale nature of vascular physiopathology in terms of both tissue properties and blood flow. Addressing the mechanical response of arterial tissues, it is modelled via a nonlinear anisotropic multiscale constitutive rationale, based on parameters having a clear histological and biochemical meaning only, without any phenomenological description. In detail, by adopting the novel constitutive approach recently conceived by my research group in cooperation with the Leibnitz University in Hannover, the hierarchical arrangement of collagenous constituents is described via a homogenized multiscale technique, able to account for both geometrical and material nonlinearities at different scales, by modelling: entropic and enthalpic mechanisms at molecular level; straightening, interaction and stretching mechanisms of collagen fibrils and fibers; interaction and coupling mechanisms occurring among layers constituting the lamellar structure of the vascular tissue. Moreover, pulsatile blood flow is described by coupling a three-dimensional fluid domain (undergoing physiological inflow conditions) with a zero-dimensional Windkessel-type model, which allows reproducing the influence of the downstream vasculature, furnishing a realistic description of the outflow proximal pressure.
The proposed formulation has been implemented in a nonlinear finite-element scheme, able to simulate the fluid-structure interaction via an Arbitrary-Lagrangian-Eulerian (ALE) approach. As a result, the proposed computational tool allows assessing the risk of thrombus deposition induced by alterations with respect to homeostatic conditions in wall shear stresses (WSS). To this aim, the WSS evaluation has been performed via a dedicated post-processing phase based on the Three-Band-Decomposition method, recently proposed by a research group of the University Campus Bio-Medico of Rome.
The computational tool developed by Elisabetta Monaldo has been firstly applied to perform a parametric investigation on different ideal geometries of aneurysmatic segments, highlighting model capability to detect vessel configurations characterized by high clinical risks related to altered WSS and to possible localization mechanisms, thereby resulting in the identification of geometries much more prone to onset and evolution of pathological processes. Afterwards, a case study associated to a patient-specific aortic abdominal aneurysmatic geometry has been numerically investigated, highlighting advantages gained from the proposed multiscale strategy, as well as showing the effectiveness in integrating the proposed computational tool with both imaging techniques and clinic-oriented post processing procedures.
In conclusion, the Master Thesis of Elisabetta Monaldo has provided, in my opinion, a significant insight in the field of cardiovascular biomechanics, moving towards a refined in silico assessment of vessel mechanics, in terms of reliable quantities to be employed in therapeutic decisions and clinical/surgical planning.
…
Proceedings VII Meeting Italian Chapter of the European Society of Biomechanics (ESB-ITA 2017) 28-29 September 2017, Rome - Italy
137
ISBN: 978-88-6296-000-7

Towards the knee on a chip: development of a microfluidic platform for the mechanical
stimulation of three dimensional cartilaginous constructs
Andrea Mainardi
Master Thesis in Biomedical Engineering Department of Electronics, Information and Bioengineering, Politecnico di Milano, Italy Email: [email protected] Supervisor: Marco Rasponi ([email protected]) Extract from the Supervisor’s reference letter … Osteoarthritis (OA) is currently the most prevalent musculoskeletal disease. Even if it was estimated [1] that 60% of people aged 55 and older have radiographic evidence of OA, no satisfactory treatment is currently available for the pathology and its origin is still not clear. In this framework, the generation of adequate models both to study the basic mechanisms underlying the disease and to evaluate possible pharmacological or cellular therapies is a great need.
A proper mechanical stimulation, in particular, is instrumental in properly replicating the environment of human joints. For this reason, this master thesis dealt with the design, validation and biological exploitation of a microfluidic platform to mechanically stimulate cartilaginous constructs. Microfluidics, with its intrinsic advantages allows in fact an unprecedented control over experimental condition thus permitting the creation of the so-called Organs on a chip. Building on an existing patented technology used to provide cardiac cells with biaxial strains, a microfluidic device was designed to provide chondrocytes, encased in a novel PEG gel both cross-linked and biodegraded through enzymatic reactions, with a controlled state of confined compression either physiological (10%) or hyper-physiological (30%). The platform consists in three layers: a top layer, an actuation membrane and an actuation chamber. The top layer is made of a central channel containing the 3D cell laden hydrogel and two side channels for the culture media. The three channels are separated by two rows of overhanging pillars designed to properly confine the gel both during injection, preventing leakage in the side channels, and upon compression. The gap between overhanging pillars and the actuation membrane provides the compression level. An increased pressure in the actuation chamber indeed causes the actuation membrane to bend upwards
until it reaches the mechanical stop provided by the pillars. Both analytical and computational methods were adopted in the design phase. In particular, Abaqus standard was used introducing a finite element model of the device to predict the effective strain field upon compression. A biphasic poroelastic constitutive relation was adopted for the cell-laden hydrogel, a Mooney Rivlin description was used for the hyperelastic PDMS. After computational validation and design, the device was subsequently fabricated through soft lithography and micro-molding and functionally validated checking the accuracy of the fabrication process and adherences of the performances to design criteria. The biological validation comprised an optimization of PEG gel formulation to achieve an optimal trade-off between gel stability and behavior in terms of cell proliferation and degradation rate. The device was subsequently exploited to i) generate a micro-cartilaginous tissue form human primary nasal chondrocytes and to subsequently ii) investigate its response to physiological and hyper-physiological compression. Upon 14 days of culture within the device under static condition, a shift towards a cartilage-like phenotype was observed. This was demonstrated by an increase in Glycosamminoglycans both accumulated within the constructs and released in the medium, and by a high deposition of Aggrecan and Collagen 2, proteins characterizing articular cartilage. Rt-qPCR also suggested an increase in COL2A1 expression over time up to 21 days of static culture. Subsequently the device was adopted to apply the over-cited levels of mechanical compression, namely 10% and 30%. After 14 days of static culture, stimulation was applied to the mature constructs, in two cycles of 2 hours separated by a 4 hour of break for 7 consecutive days. A custom-made control system was realized for the purpose. Compression applied after a period of static culture of 14 days caused a decrease in COL1A1 expression, proper of undifferentiated fibrocartilage, if applied at the 10% level and a statistically significant increase in MMP13 expression if applied at the hyperphysiological 30% level. Notably MMP13 is a collagenase involved in the matrix degradation proper of OA. In conclusion, a novel microfluidic platform, able to provide cells with a 3D culture environment and customized level of mechanical compression was designed and validated. The platform was successfully adopted in a preliminary assessment of the level-dependent effect of compression on cartilaginous micro- constructs, providing a first step towards the creation of a knee on a chip. …
Proceedings VII Meeting Italian Chapter of the European Society of Biomechanics (ESB-ITA 2017) 28-29 September 2017, Rome - Italy
138
ISBN: 978-88-6296-000-7

Modelling of leukocyte motion in hepatic sinusoids using the Volume of
Fluid (VOF) method
Claudia Atzeni
Master Thesis in Biomedical Engineering Department of Chemistry, Materials and Chemical Engineering "Giulio Natta", Politecnico di Milano, Italy Email: [email protected] Supervisor: Gabriele Dubini ([email protected]) Extract from the Supervisor’s reference letter … Leucocytes are hematic cells with a complex internal structure, which determines their mechanical behavior. Viscosity and deformability are key parameters when it comes to the cell dynamic behavior inside the microcirculation system. The Volume of Fluid (VOF) method is a free-surface modelling technique for tracking and locating fluid-fluid interfaces. The main goal of the project is to use the VOF method as a tool to generate a model for the motion of the leukocyte inside hepatic capillaries (sinusoids) - reproducing a totally physiological state - by modelling the hematic compartment as a biphasic fluid. Starting from a 3D model of a portion of the hepatic micro-circulation system, obtained as a reconstruction from in vivo images, the Poiseuille law was used to define a lumped-parameter (l-p) model of the whole liver microcirculation system (3-Matic, Materialise). Then a simplified model was created, in which only one physical vessel was taken into account and the resistive components were embedded into the previous l-p model. Steady-state CFD simulation were carried out to analyze the hemodynamics behavior in the liver microcirculation (Fluent 16.0, Ansys).
The VOF method was used to investigate the motion of a cell inside hepatic sinusoids. The influence of the characteristic parameters of the model was separately investigated, setting the velocity of the primary phase, the channel diameter, and the viscosity of the cell to their physiological values (v = 300 μm/s, d = 12 μm, μ = 100 Pa⋅ s). Two different kind of cells were modelled in order to analyze the effect of cellular viscosity on quantitative outputs: red blood cells (RBCs), with cellular viscosity of 0.0045 Pa s in accordance with the computational studies found in literature, and leukocytes, with cellular viscosity of 100Pa s in accordance with the experimental evidences.
The similitude theory (π-theorem) was applied to create a scaled model aiming at reducing the computational cost of the simulations while
maintaining the same flow regime as in the case study. Both Reynolds and Capillary numbers were used to characterize the flow regime. The system parameters were modified to guarantee the same values for these characteristic numbers. Once geometric, kinematic and dynamic similitudes are respected, a hemodynamic analysis can legitimately be run on the scaled model.
The outputs of the two models of liver microcirculation were compared both qualitatively and quantitatively. Quantitative outputs of the simplified l-p model are consistent with the physiological ones: the proposed model therefore correctly represents a complete lobular microcirculation system. It can be used to simulate sinusoidal hemodynamics and to study the system response for a number of regime situations.
After the evaluation of the sinusoidal hemodynamics, the applicability of the similitude theory to model biphasic fluids with the VOF method was verified. The outputs of the base model were compared to those of its scaled version: the velocity field of the scaled model is exactly equal to the real one multiplied by the scale factor and the cellular dynamics of the scaled model is identical to the one observed in the base model, at the same dimensionless time T.
The effect of cellular diameter and viscosity and the velocity of the primary phase on the proposed model were investigated; outputs were compared to similar situations from the literature. The results are similar to those found in literature, proving the efficiency of the VOF method to analyze different kinds of situations.
Then, two computational models representing in-vivo conditions were defined, and the effect of the different cell viscosity on quantitative outputs was carefully studied.
In the RBC-model (μ = 0.0045 Pa⋅ s) a low-viscosity cell, dragged by the primary phase, follows a rectilinear trajectory, at a constant distance from the central axis. The cell also warps into a “parachute” configuration, which is consistent with the physiological behavior of red blood cells. In the Leukocyte model (μ = 100 Pa⋅ s), the cell migrates towards the channel wall, reaching a position of ‘quasi-adhesion’ and preserving its typical spherical shape. These results are consistent with the physiological behavior: in the case of reasonably large vessel diameter, and in the absence of any inflammatory response, in-vivo leukocytes remain spherical.
…
Proceedings VII Meeting Italian Chapter of the European Society of Biomechanics (ESB-ITA 2017) 28-29 September 2017, Rome - Italy
139
ISBN: 978-88-6296-000-7
Endothelial cells response to combined loading from flow
and substrate deformation: A quantitative analysis
Martina Genta
Master Thesis in Biomedical Engineering Department of Mechanical and Aerospace Engineering, Politecnico di Torino, Italy Email: [email protected] Supervisor: Umberto Morbiducci ([email protected]) Extract from the Supervisor’s reference letter … Master Thesis project was focused on the study of endothelial cells response to combined loading from flow and substrate deformation. Martina’s thesis work was carried out within an experimental in vitro framework and was integrated by a computational study aimed at the simulation of the substrate deformation under stretching condition. Part of Martina’s thesis project was developed at ETH (Zurich, Switzerland) within the Zürich Heart project …
Martina’s Master Thesis has been developed in the cardiovascular framework with the aim of developing a new innovative ventricular assist device. This specific need is due to the drastic increase of the percentage of population affected by cardiovascular diseases in the next decades. Indeed, along this trend, the development of new and innovative solutions has become the next step towards the decrease of health problems. Within this context, the Zürich Heart project focused on the development of a new left ventricular assist device (LVAD) based on a hyperelastic hybrid membrane. Thanks to the deformation of the membrane, the blood is pulsed from the ventricle directly to the aorta allowing the patience to receive the correct cardiac output. Compared with the state of art, the disruptive and challenging idea of this project is to cover with autologous endothelial cells the inner part of the device, and in particular the membrane, in order to have a full integration and a total hemocompatibility of the device inside the human body.
Martina’s work focused on this specific challenge, that is the study and the analysis of endothelial cells response to combined loads from flow and substrate deformation.
The in vivo reaction of endothelial cells to different loads is well known, but, on the other side, few studies in vitro have been performed in a complex environment. As a consequence this Master
Thesis was essential for the investigation of cells behaviour under complex loading conditions and for the definition of their survival limits.
In order to achieve this goal a systemic study of cells behaviour under different environmental conditions is required. Martina dealt with this problem from two different perspectives: a pure biological cells behaviour and a mechanical analysis of the flow conditions and deformation of the membrane.
Regarding the first part, a bioreactor has been used in order to simulate the conditions that cells will experience inside the device. Firstly, the two loads, shear stress and deformation of the membrane, were applied separately and then different combinations were tested aiming at determining the survival limits of cells and the threshold above which one stimulus, either shear stress or stretching, prevails on the other.
Moreover, from a more mechanical point of view, a complementary computational study of the membrane has been performed aimed at investigating the influence of initial conditions on the final applied stretch, and also the influence of boundary conditions (clamping) applied to the system. Finally, a pure mechanical characterization of the material of the membrane, PDMS, has been performed in order to extract the exact law that describes the hyperelastic material, allowing to obtain the precise values that cells experience inside the bioreactor.
Overall, the results obtained combining the biological study and the mechanical tests, allowed to identify not only the different behaviour of cells in complex environments, but also to determine which is the most detrimental area of the membrane for their survival. As a consequence, Martina’s Master Thesis was fundamental to define the right values needed to obtain a healthy and confluent monolayer of cells, paving the way for a new era of ventricular assist devices.
…
Proceedings VII Meeting Italian Chapter of the European Society of Biomechanics (ESB-ITA 2017) 28-29 September 2017, Rome - Italy
140
ISBN: 978-88-6296-000-7

141

142

Index of Authors
A Agur A. 125 Ahluwalia A. 133 Akhtar R. 3, 4, 5, 49 Aldieri A. 83 Alessio G. 5 Allegretti D. 53, 55, 103 Amodeo A. 123 Andersen M.S. 77 Angelillo M. 7 Arcuri L. 131 Ariza-Gracia M.A. 5, 7 Atzeni C. 139 Audenino A.L. 69, 83, 99 Auricchio F. 31, 37, 43 Aurigemma C. 13
B Bancone C. 41 Barrett S. 3 Belkacemi D. 23 Bellucci D. 115 Berni M. 115 Berni M. 115, 127 Berti F. 53, 55, 103 Berti S. 57, 59 Bertini A. 55 Bianchi D. 45, 47, 93, 129, 131 Bianchi M. 115 Biancolini M.E. 25 Bignardi C. 69, 83, 99 Bijari P. 15 Bisegna P. 119
Bisi M.C. 65, 71 Boi M. 115 Bolesani E. 113 Bologna E. 127 Bologna M. 13 Boschetti F. 8 Boyle L. 107 Bozzetto M. 21 Brambilla P. 21 Braniste T. 113 Buchler P. 3 Burzotta F. 13
C Cacopardo L. 133 Caimi A. 23 Calò K. 17 Calvo B. 5, 7 Camarda L. 127 Cannillo V. 115 Capelli C. 35 Capellini K. 25, 57 Cardani A. 4 Carminati M. 23 Casalini N. 39 Caselli F. 119 Cattaneo I. 109 Cecchini M. 117 Celi S. 25, 35, 57, 59 Cereda M. 8 Cerillo A.G. 57 Chang Z. 5, 49 Chen P.-Y. 49
143

Cheng X. 9 Chiastra C. 13 Comerford E. 3 Cominoli B. 91 Conti M. 37, 43 Costa E. 25 Costa P. 99 Costantino M.L. 4 Crenna F. 79 Cristofolini L. 101, 107
D D'Avenio G. 19, 97, 123 Daniele C. 97 Dario P. 67 Davvalo Khongar P. 9 De Beaufort H.W.L. 43 De Ninno A. 119 de Tullio M.D. 27 Dell'Isola A. 77 Della Corte A. 41 Dellegrottaglie S. 41 Di Lascio N. 35 Di Marco R. 75 Dimasi A. 29 Dolci A. 131 Drager G. 113 Dubini G. 13, 139 Dvoriashyna M. 8
E Ene-Iordache B. 21
F Faggian G. 61 Faita F. 35 Falcinelli C. 125 Fanni B.M. 35 Fantozzi S. 73 Ferrante R. 129 Ferroni M. 8 Figliuzzi M. 109 Filippi S. 47
Finotello A. 31 Fiore G.B. 29 Focarete M.L. 107, 115 Formato G.M. 37 Foss A. 8 Frigiola A. 37 Fusini L. 29
G Gaffney E. 8 Gallo D. 15, 17 Gasparotti E. 35, 57, 59 Gastaldi D. 89 Gastaldi L. 69 Genta M. 140 Giansanti D. 97 Gionni M. 97 Gizzi A. 6 Gizzi A. 47, 111 Greiser A. 23 Grigioni M. 19, 97, 123 Grigolo B. 115 Gualandi C. 107, 115 Guazzelli N. 133 Guidoboni G. 3, 4, 6, 8
H Haabets D. 15 Halloin C. 113 Hansen M.L. 49 Harms V. 113 Harris A. 4, 6
I Innocenti B. 85, 87 Isu G. 113
J Jensen O. 8
K Kaye S. 5 Kazaili A. 4 Kempf H. 113 Kharaz Y.A. 3
144

Kropp C. 113 L
La Barbera L. 101, 103 Lam W. 125 Landini L. 25, 35, 57, 59 Lanzarone E. 43 Lenarda P. 111 Levis H. 5 Li Z. 125 Liggieri L. 6 Lipari E. 5 Lopomo N.F. 127 Lorenzi C. 131 Luraghi G. 39
M Maccioni G. 97 Mainardi A. 138 Mainardi L. 13 Malve M. 7 Mannisi M. 77 Marchiori G. 115 Marchiori G. 127 Marconi S. 31, 43 Mariani M. 59 Marino M. 45, 47, 93 Martin U. 113 Massai D. 113 Mastropasqua L. 5 Matas J.F.R. 39 Mattei G. 133 Mauri A.G. 4 Mazzà C. 75 Mazzoleni S. 67 Meskin M. 29 Messenio D. 4 Micera S. 117 Migliavacca F. 13, 39, 55 Migliori S. 13 Monaldo E. 47, 137 Montanino A. 7
Montin E. 13 Montorsi P. 29 Morbiducci U. 15, 17, 113, 140 Morelli S. 97 Morganti S. 31 Muratori M. 29
N Nepita I. 6 Nithiarasu P. 53 Nossa R. 133 Nubile M. 5
O Onorati F. 61 Osella G. 83 Ottardi C. 103 Owais Khan M. 17
P Pacini Panebianco G. 73 Paggi M. 111 Palanca M. 101 Palazzo A. 79 Palermo E. 75 Paletti S. 91 Pandolfi A. 6, 7 Panero E. 69 Pant S. 53 Paoletti P. 49 Pappalardo O.A. 61 Pastorelli S. 69 Pennati G. 53, 55, 103 Pepi M. 29 Petretta M. 115 Petrini L. 53, 55 Pianigiani S. 85, 87 Piatti F. 23 Piloni D. 29 Pinero D.P. 5 Pinsky P. 6, 9 Piovesan A. 103 Pitocchi J. 91
145

Pluchinotta F. 23 Positano V. 25, 35, 57, 59 Pralits J.O. 6, 9 Priola A.M. 83 Prud'homme C. 3, 4, 6 Putame G. 99
Q Qiao Y. 15
R Rasmussen L.M. 49 Rasponi M. 138 Ravera F. 6 Reale R. 119 Recrosi F. 8 Redaelli A. 23, 29, 41, 61 Reilly G. 107 Remuzzi A. 21, 109 Repetto R. 3, 6, 8, 9 Rezzaghi M. 59 Ridolfi L. 17 Rizzo A. 129 Robles Diaz D. 113 Rodriguez J.F. 5, 7 Romano M. 6, 9 Romano V. 5 Romarowski R. 31 Rosellini G. 87 Rossi G.B. 79 Rossini G. 41 Ruspi M.L. 101 Russo G.M. 129 Russo M. 129
S Sabbatini M. 41 Sacco R. 4 Sala L. 3 Salerni F. 6 Santini E. 6 Sard A. 69 Sborgia A. 5
Scalona E. 75 Scarsoglio S. 17 Schievano S. 35 Schileo E. 91 Selmi M. 61 Sensini A. 107 Sergi P.N. 117 Severino D. 131 Siesky B.A. 4 Silvani S. 109 Soleri P. 9 Spadaro D. 127 Spreafico L. 29 Stagni R. 65, 71, 73 Stanisz G. 125 Stefanoni F. 4 Steger B. 5 Steinman D.A. 15, 17 Stocchino A. 9 Sturla F. 23, 41, 61 Szopos M. 3, 4, 6
T Taddei F. 91 Tamburini P. 71 Tatone A. 8 Terzini M. 69, 83, 99 Tonazzini I. 117 Totaro P. 31 Tozzi G. 107 Tran V.-D. 67 Trimarchi S. 43
V Vairo G. 45, 47, 93, 129, 131, 137 Vasta M. 6 Veltri A. 83 Vena P. 89 Vignali E. 25, 57 Vignali E. 57 Villa T. 101, 103 Villani G. 93
146

Vismara R. 29 Vivoli G. 57, 59 Votta E. 29, 41, 61
W Wasserman B. 15 Whyne C. 125 Woodburn J. 77 Wriggers P. 45 Wu W. 7
X Xie Y. 15
Z Zanetti E. 69, 99 Zhuola 3, 5 Zingales M. 127 Zucchelli A. 107 Zweigerdt R. 113
147

148


Copyright © 2022 FDOKUMEN