Magneto-transport of high TCR (temperature coefficient of resistance) La 2/3Ca 1/3MnO 3 : Ag...
16
1 Magneto Transport of high TCR (temperature coefficient of resistance) La 2/3 Ca 1/3 MnO 3 : Ag Polycrystalline Composites V.P.S. Awana 1,* , Rahul Tripathi 1 , S. Balamurugan 2 , H. Kishan 1 and E. Takayama- Muromachi 2 1 Superconducity and Cryogenics Division, National Physical Laboratory, Dr. K.S. Krishnan Marg, New Delhi –110012, India 2 Advanced Nano Materials Laboratory, National Institute for Materials Science (NIMS), 1-1 Namiki, Tsukuba, Ibaraki, 305-0044, Japan We report the synthesis, (micro)structural, magneto-transport and magnetization of polycrystalline La 2/3 Ca 1/3 MnO 3 :Ag x composites with x = 0.0, 0.1, 0.2, 0.3 and 0.4. The temperature coefficient of resistance (TCR) near ferromagnetic (FM) transition is increased significantly with addition of Ag. The FM transition temperature (T FM ) is also increased slightly with Ag addition. Magneto-transport measurements revealed that magneto-resistance MR is found to be maximum near T FM . Further the increased MR of up to 60% is seen above 300 K for higher silver added samples in an applied field of 7 Tesla. Sharp TCR is seen near T FM with highest value of up to 15 % for Ag (0.4) sample, which is an order of magnitude higher than as for present pristine sample and best value yet reported for any polycrystalline LCMO compound. Increased TCR, T FM and significant above room temperature MR of La 2/3 Ca 1/3 MnO 3 :Ag x composites is explained on the basis of improved grains size and connectivity with silver addition in the matrix. Better coupled FM domains and nearly conducting grain boundaries give rise to improved physical properties of the La 2/3 Ca 1/3 MnO 3 manganites. Key Words: La 2/3 Ca 1/3 MnO 3 :Ag x composites, Magneto-transport, and Magnetization * Corresponding Author- e-mail: [email protected] Fax No. 0091-11-25726938
-
Upload
independent -
Category
Documents
-
view
5 -
download
0
Transcript of Magneto-transport of high TCR (temperature coefficient of resistance) La 2/3Ca 1/3MnO 3 : Ag...
1
Magneto Transport of high TCR (temperature coefficient of resistance) La2/3Ca1/3MnO3: Ag Polycrystalline Composites V.P.S. Awana1,*, Rahul Tripathi1, S. Balamurugan2, H. Kishan1 and E. Takayama-Muromachi2 1 Superconducity and Cryogenics Division, National Physical Laboratory, Dr. K.S. Krishnan
Marg, New Delhi –110012, India 2 Advanced Nano Materials Laboratory, National Institute for Materials Science (NIMS), 1-1
Namiki, Tsukuba, Ibaraki, 305-0044, Japan
We report the synthesis, (micro)structural, magneto-transport and magnetization of
polycrystalline La2/3Ca1/3MnO3:Agx composites with x = 0.0, 0.1, 0.2, 0.3 and 0.4. The
temperature coefficient of resistance (TCR) near ferromagnetic (FM) transition is increased
significantly with addition of Ag. The FM transition temperature (TFM) is also increased
slightly with Ag addition. Magneto-transport measurements revealed that magneto-resistance
MR is found to be maximum near TFM. Further the increased MR of up to 60% is seen above
300 K for higher silver added samples in an applied field of 7 Tesla. Sharp TCR is seen near
TFM with highest value of up to 15 % for Ag (0.4) sample, which is an order of magnitude
higher than as for present pristine sample and best value yet reported for any polycrystalline
LCMO compound. Increased TCR, TFM and significant above room temperature MR of
La2/3Ca1/3MnO3:Agx composites is explained on the basis of improved grains size and
connectivity with silver addition in the matrix. Better coupled FM domains and nearly
conducting grain boundaries give rise to improved physical properties of the La2/3Ca1/3MnO3
manganites.
Key Words: La2/3Ca1/3MnO3:Agx composites, Magneto-transport, and Magnetization
* Corresponding Author- e-mail: [email protected] Fax No. 0091-11-25726938
2
INTRODUCTION Mangenites with formula RE1-xAxMnO3 (RE = trivalent rare earth and A = divalent
alkali metal viz. Ca, Ba, Sr, Pb or Bi etc.) were widely studied for their unusual magneto-
transport properties, please see couple of review and references there in [1-3]. These
materials gave rise to huge magneto-resistance (MR) just below room temperature. For any
practical viability, it is important to realize the MR at above 300 K (room temperature). In
particular they can be used as the magnetic switch devices. Magnetically these compounds
undergo paramagnetic (PM) to ferromagnetic (FM) transition coupled with near insulator to
metal change over. The MR is basically seen at metal insulator transition temperature (TMI),
which is close to the para-FM transition temperature (TFM). Not only the higher T, but the
sharpness of TFM and TMI are desirable for sharp high MR. The sharpness of TMI is in general
judged from temperature coefficient of resistance (TCR). Further, the sharper TMI is generally
seen in vicinity of sharp PM to FM transition.
The ultimate aim is to get sharp TMI/higher TCR at elevated temperature i.e., above
room temperature, without reducing the MR. In these regards there had been some trials in
literature [4-6]. For example by increasing the amount of Mn4+ through substitutions like
RE/Ag [4,5], or increase in overall oxygen content [1,7], one could shift the TMI and TFM
above/close to the room temperature. However one needs not only the room temperature TMI
and TFM but sharper MI and FM transitions for meaningful MR at these temperature.
Sharpness of MI transition is defined by the TCR. Hence in general one needs to employ an
strategy, where by both higher content of Mn4+ and reasonable TCR could be achieved. The
former guarantees the above room temperature TMI and the later high MR. The highest TCR
values yet obtained were around 20% for Ag implanted LCMO laser ablated thin films [6,8]
and 50% for La2/3(Ca,Pb)1/3MnO3 single crystals [9]. For polycrystalline LCMO or similar
compounds the TCR values yet seen had always been below 10%. Also important is not only
to observe high TCR but it should be like a sharp peak with temperature, with in say 2-5 K
for practical bolometers. In principle small temperature variation should be able to generate a
significant drop across the bolometer [10]. For large applications, in certain cases one might
require bulk large area rod like high TCR material instead of thin films or single crystals.
Hence the high TCR polycrystalline large LCMO composites were warranted. In this
direction we thought of improving the grains connectivity of the bulk mangenite material for
3
better TCR by Ag additions to the widely studied mangenites La2/3Ca1/3MnO3 (LCMO). The
Ag additions in HTSC (High Tc cuprate superconductors) compounds had proved to be very
useful in terms of the improved grain boundaries [11]. In this article, we report the results of
magnetization and magneto-transport for LCMO:Agx composites with x = 0.0, 0.1, 0.2, 0.3
and 0.4. We found both increased TCR, TFM and significant above room temperature MR for
LCMO:Agx composites. The scanning electron micrograph (SEM) pictures of the
LCMO:Agx composites showed remarkable improvement in the grains morphology with Ag
addition. Our results have direct implications towards the practical use of magneto-resistive
mangenites.
EXPERIMENTAL
La2/3Ca1/3MnO3 (LCMO): Ag composites were synthesized by solid-state reaction
route with ingredients La2O3, CaCO3, Mn2O3 and metallic Ag. The mixed powders were
calcined at 1000 �C, 1100 �C and 1200 �C in air for 24 hours each. Finally the palletized
ceramics were annealed in air for 48 hours at 1300 �C. For further loading of oxygen the
final pellets were annealed in flow of oxygen at 800 �C for 48 hours and subsequently slow
cooled to room temperature over a span of 12 hours. The structure and phase purity of the
La2/3Ca1/3MnO3 (LCMO): Ag composites were checked by powder X–ray diffraction (XRD)
performed on a diffractometer (Rigaku RINT2200HF-Ultima) using the Ni–filtered Cu Kα
radiation at 40 kV and 50 mA. The data were obtained between 20 and 80° 2θ in steps of
0.02°. Magnetization measurements were carried out in a commercial magnetometer with the
superconducting quantum interference device (Quantum Design: MPMS-5S) between 5 K
and 400 K under the applied field of 10 kOe. An isothermal magnetization curves were
obtained with applied fields up to �50 kOe at fixed (different) temperatures (T = 5, 50, 100,
300, 350 K). The transport and magneto-transport measurements were carried out in a
commercial apparatus (PPMS–6600, Quantum Design) between 5 and 400 K in magnetic
fields up to 70 kOe. SEM studies were carried out on these samples using a Leo 440 (Oxford
Microscopy: UK) instrument.
4
RESULTS
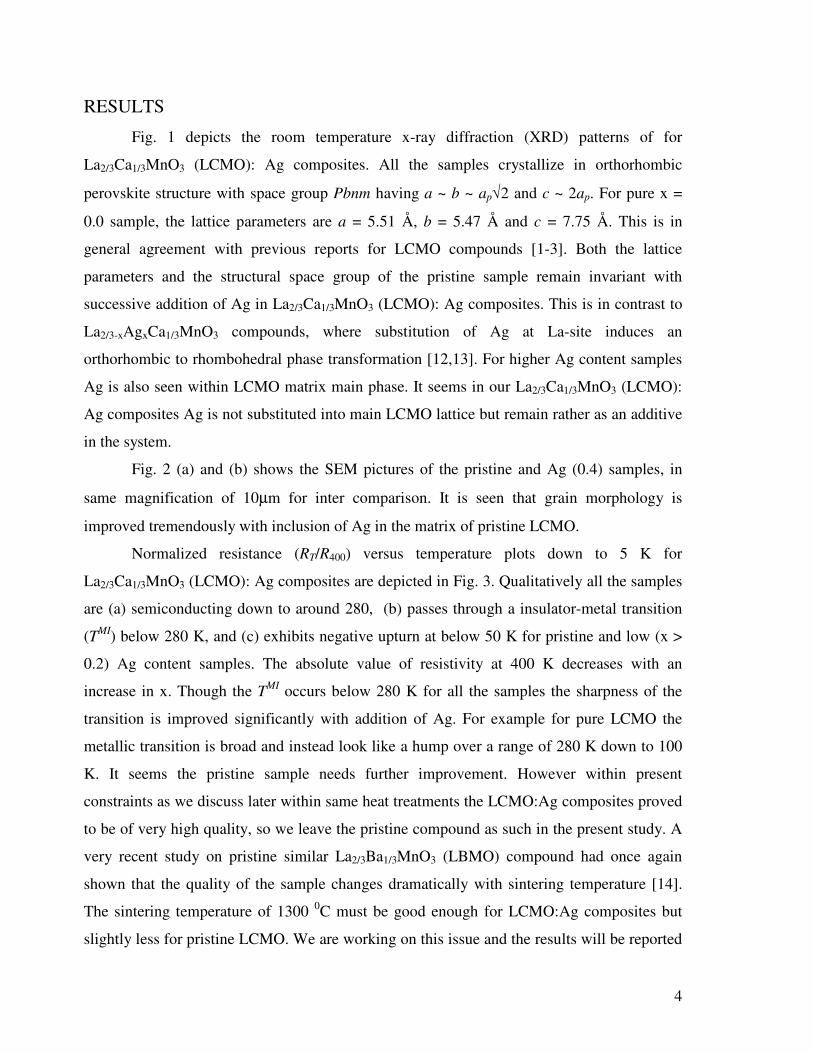
Fig. 1 depicts the room temperature x-ray diffraction (XRD) patterns of for
La2/3Ca1/3MnO3 (LCMO): Ag composites. All the samples crystallize in orthorhombic
perovskite structure with space group Pbnm having a ~ b ~ ap√2 and c ~ 2ap. For pure x =
0.0 sample, the lattice parameters are a = 5.51 Å, b = 5.47 Å and c = 7.75 Å. This is in
general agreement with previous reports for LCMO compounds [1-3]. Both the lattice
parameters and the structural space group of the pristine sample remain invariant with
successive addition of Ag in La2/3Ca1/3MnO3 (LCMO): Ag composites. This is in contrast to
La2/3-xAgxCa1/3MnO3 compounds, where substitution of Ag at La-site induces an
orthorhombic to rhombohedral phase transformation [12,13]. For higher Ag content samples
Ag is also seen within LCMO matrix main phase. It seems in our La2/3Ca1/3MnO3 (LCMO):
Ag composites Ag is not substituted into main LCMO lattice but remain rather as an additive
in the system.
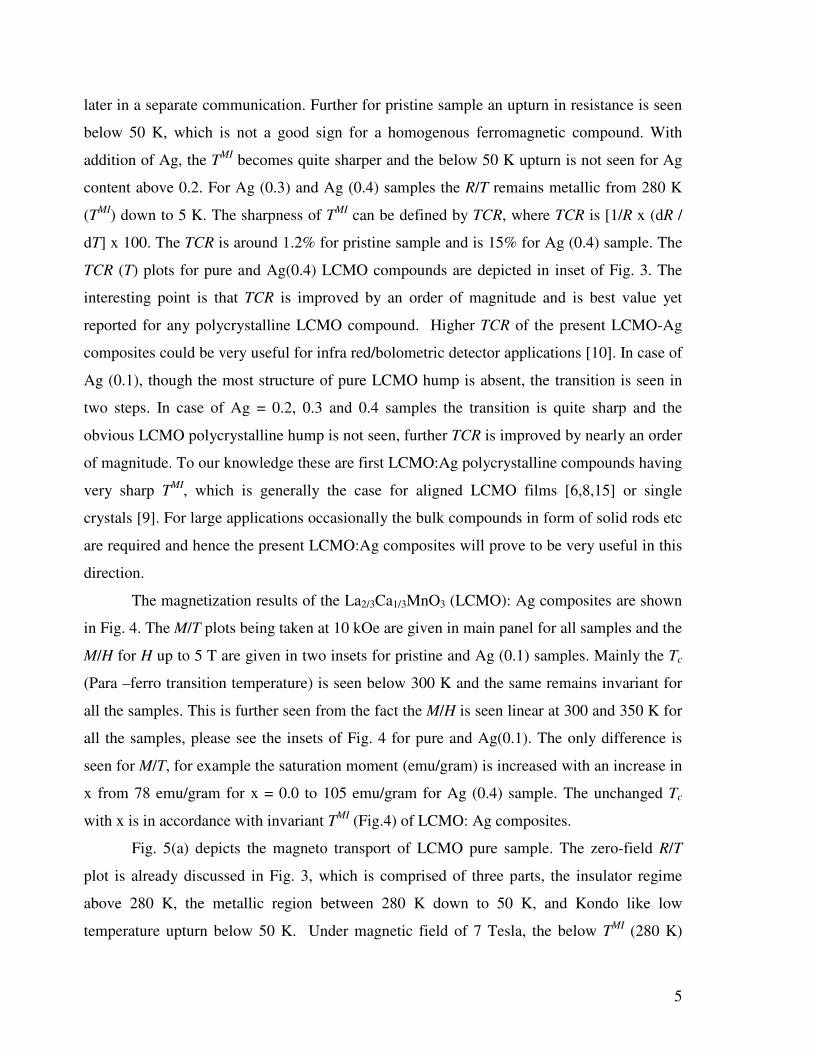
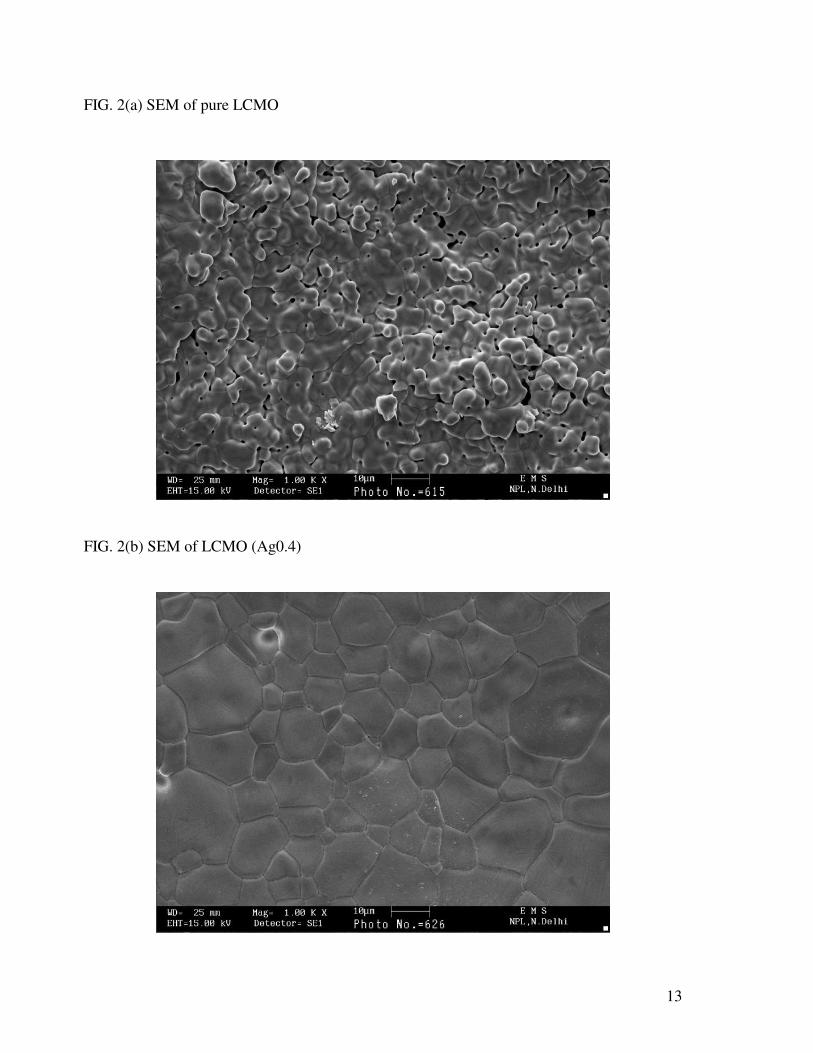
Fig. 2 (a) and (b) shows the SEM pictures of the pristine and Ag (0.4) samples, in
same magnification of 10µm for inter comparison. It is seen that grain morphology is
improved tremendously with inclusion of Ag in the matrix of pristine LCMO.
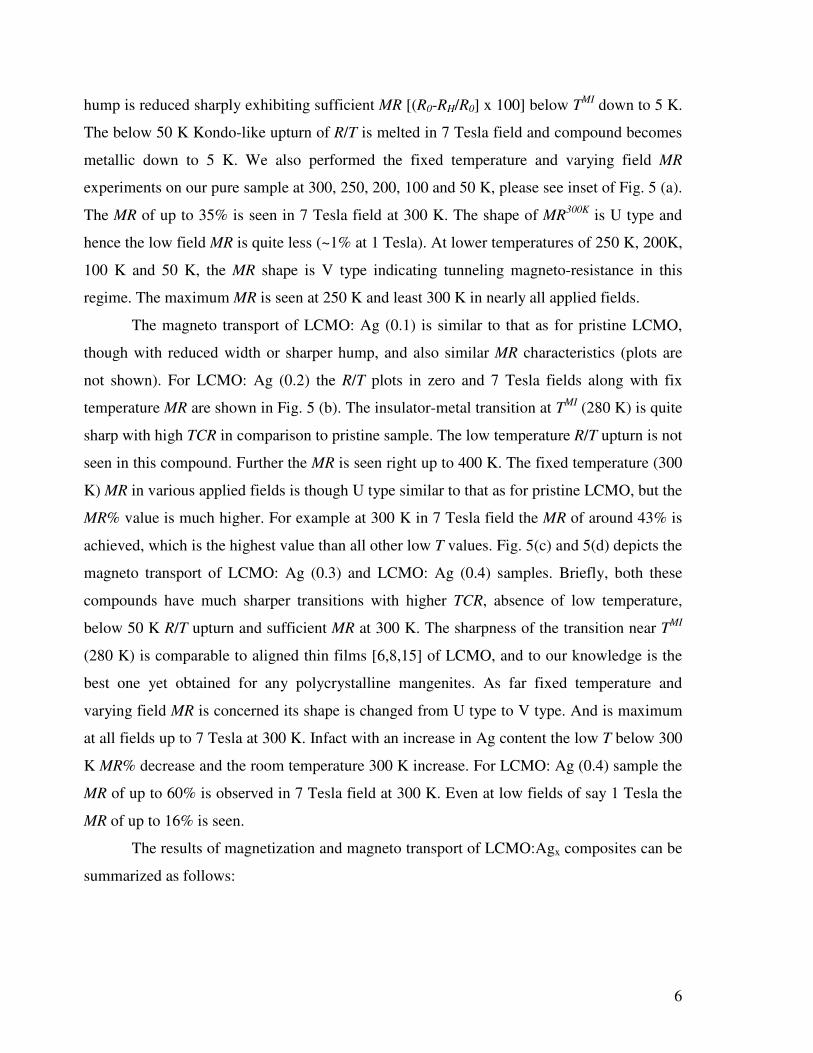
Normalized resistance (RT/R400) versus temperature plots down to 5 K for
La2/3Ca1/3MnO3 (LCMO): Ag composites are depicted in Fig. 3. Qualitatively all the samples
are (a) semiconducting down to around 280, (b) passes through a insulator-metal transition
(TMI) below 280 K, and (c) exhibits negative upturn at below 50 K for pristine and low (x >
0.2) Ag content samples. The absolute value of resistivity at 400 K decreases with an
increase in x. Though the TMI occurs below 280 K for all the samples the sharpness of the
transition is improved significantly with addition of Ag. For example for pure LCMO the
metallic transition is broad and instead look like a hump over a range of 280 K down to 100
K. It seems the pristine sample needs further improvement. However within present
constraints as we discuss later within same heat treatments the LCMO:Ag composites proved
to be of very high quality, so we leave the pristine compound as such in the present study. A
very recent study on pristine similar La2/3Ba1/3MnO3 (LBMO) compound had once again
shown that the quality of the sample changes dramatically with sintering temperature [14].
The sintering temperature of 1300 0C must be good enough for LCMO:Ag composites but
slightly less for pristine LCMO. We are working on this issue and the results will be reported
5
later in a separate communication. Further for pristine sample an upturn in resistance is seen
below 50 K, which is not a good sign for a homogenous ferromagnetic compound. With
addition of Ag, the TMI becomes quite sharper and the below 50 K upturn is not seen for Ag
content above 0.2. For Ag (0.3) and Ag (0.4) samples the R/T remains metallic from 280 K
(TMI) down to 5 K. The sharpness of TMI can be defined by TCR, where TCR is [1/R x (dR /
dT] x 100. The TCR is around 1.2% for pristine sample and is 15% for Ag (0.4) sample. The
TCR (T) plots for pure and Ag(0.4) LCMO compounds are depicted in inset of Fig. 3. The
interesting point is that TCR is improved by an order of magnitude and is best value yet
reported for any polycrystalline LCMO compound. Higher TCR of the present LCMO-Ag
composites could be very useful for infra red/bolometric detector applications [10]. In case of
Ag (0.1), though the most structure of pure LCMO hump is absent, the transition is seen in
two steps. In case of Ag = 0.2, 0.3 and 0.4 samples the transition is quite sharp and the
obvious LCMO polycrystalline hump is not seen, further TCR is improved by nearly an order
of magnitude. To our knowledge these are first LCMO:Ag polycrystalline compounds having
very sharp TMI, which is generally the case for aligned LCMO films [6,8,15] or single
crystals [9]. For large applications occasionally the bulk compounds in form of solid rods etc
are required and hence the present LCMO:Ag composites will prove to be very useful in this
direction.
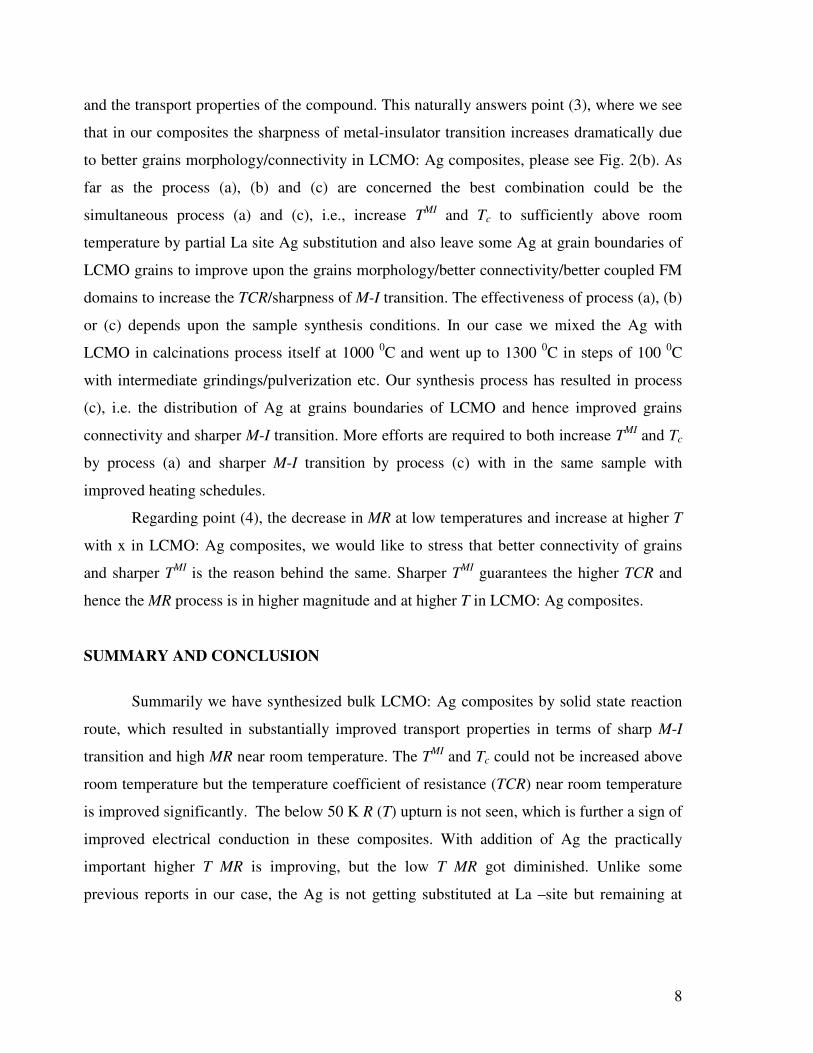
The magnetization results of the La2/3Ca1/3MnO3 (LCMO): Ag composites are shown
in Fig. 4. The M/T plots being taken at 10 kOe are given in main panel for all samples and the
M/H for H up to 5 T are given in two insets for pristine and Ag (0.1) samples. Mainly the Tc
(Para –ferro transition temperature) is seen below 300 K and the same remains invariant for
all the samples. This is further seen from the fact the M/H is seen linear at 300 and 350 K for
all the samples, please see the insets of Fig. 4 for pure and Ag(0.1). The only difference is
seen for M/T, for example the saturation moment (emu/gram) is increased with an increase in
x from 78 emu/gram for x = 0.0 to 105 emu/gram for Ag (0.4) sample. The unchanged Tc
with x is in accordance with invariant TMI (Fig.4) of LCMO: Ag composites.
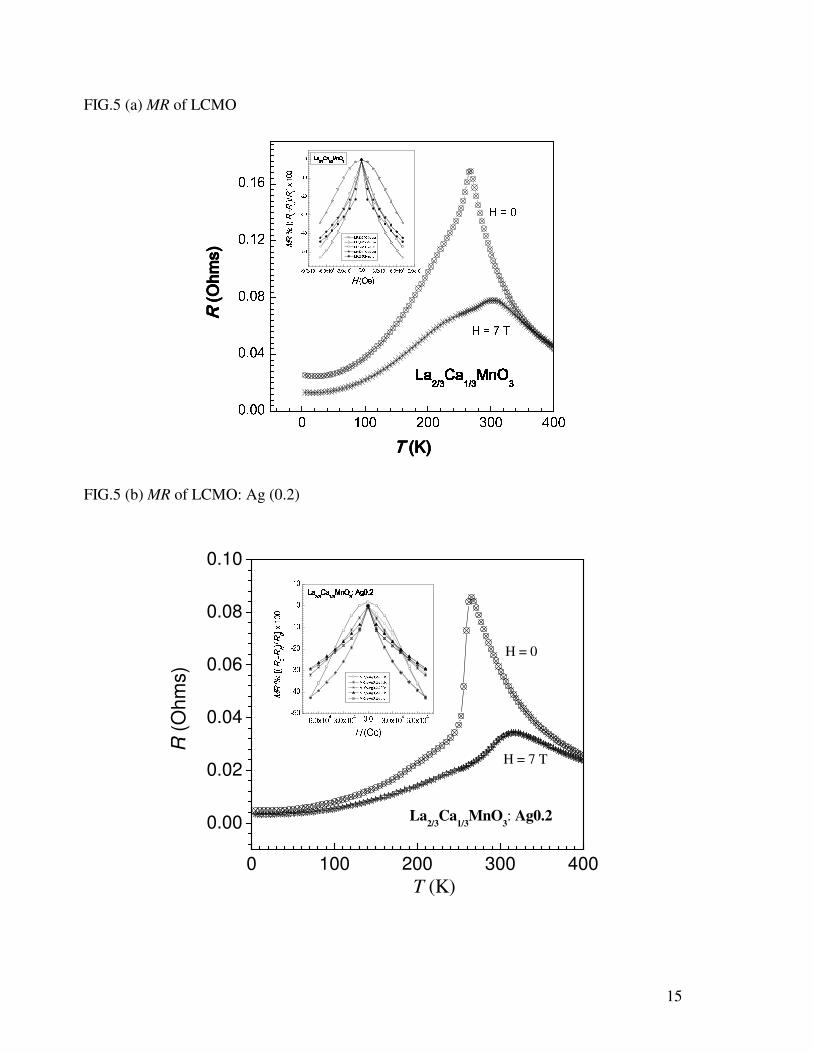
Fig. 5(a) depicts the magneto transport of LCMO pure sample. The zero-field R/T
plot is already discussed in Fig. 3, which is comprised of three parts, the insulator regime
above 280 K, the metallic region between 280 K down to 50 K, and Kondo like low
temperature upturn below 50 K. Under magnetic field of 7 Tesla, the below TMI (280 K)
6
hump is reduced sharply exhibiting sufficient MR [(R0-RH/R0] x 100] below TMI down to 5 K.
The below 50 K Kondo-like upturn of R/T is melted in 7 Tesla field and compound becomes
metallic down to 5 K. We also performed the fixed temperature and varying field MR
experiments on our pure sample at 300, 250, 200, 100 and 50 K, please see inset of Fig. 5 (a).
The MR of up to 35% is seen in 7 Tesla field at 300 K. The shape of MR300K is U type and
hence the low field MR is quite less (~1% at 1 Tesla). At lower temperatures of 250 K, 200K,
100 K and 50 K, the MR shape is V type indicating tunneling magneto-resistance in this
regime. The maximum MR is seen at 250 K and least 300 K in nearly all applied fields.
The magneto transport of LCMO: Ag (0.1) is similar to that as for pristine LCMO,
though with reduced width or sharper hump, and also similar MR characteristics (plots are
not shown). For LCMO: Ag (0.2) the R/T plots in zero and 7 Tesla fields along with fix
temperature MR are shown in Fig. 5 (b). The insulator-metal transition at TMI (280 K) is quite
sharp with high TCR in comparison to pristine sample. The low temperature R/T upturn is not
seen in this compound. Further the MR is seen right up to 400 K. The fixed temperature (300
K) MR in various applied fields is though U type similar to that as for pristine LCMO, but the
MR% value is much higher. For example at 300 K in 7 Tesla field the MR of around 43% is
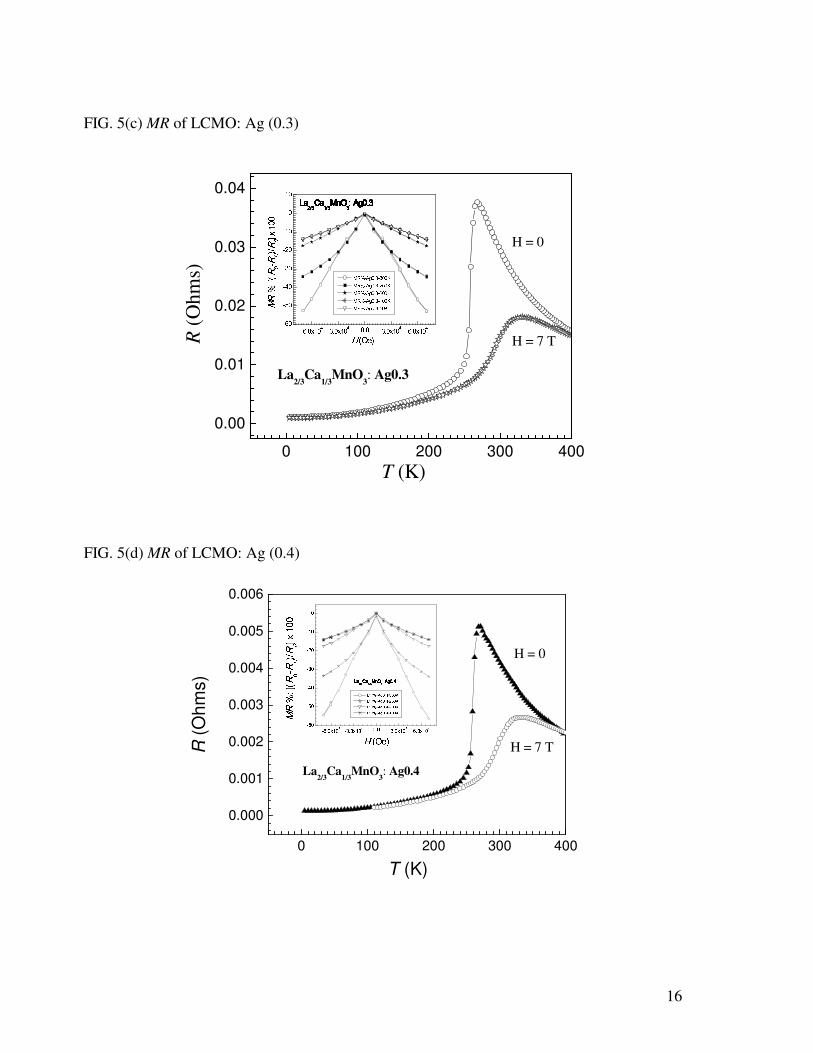
achieved, which is the highest value than all other low T values. Fig. 5(c) and 5(d) depicts the
magneto transport of LCMO: Ag (0.3) and LCMO: Ag (0.4) samples. Briefly, both these
compounds have much sharper transitions with higher TCR, absence of low temperature,
below 50 K R/T upturn and sufficient MR at 300 K. The sharpness of the transition near TMI
(280 K) is comparable to aligned thin films [6,8,15] of LCMO, and to our knowledge is the
best one yet obtained for any polycrystalline mangenites. As far fixed temperature and
varying field MR is concerned its shape is changed from U type to V type. And is maximum
at all fields up to 7 Tesla at 300 K. Infact with an increase in Ag content the low T below 300
K MR% decrease and the room temperature 300 K increase. For LCMO: Ag (0.4) sample the
MR of up to 60% is observed in 7 Tesla field at 300 K. Even at low fields of say 1 Tesla the
MR of up to 16% is seen.
The results of magnetization and magneto transport of LCMO:Agx composites can be
summarized as follows:

7
1. Ag does not substitute into host LCMO matrix in our polycrystalline
LCMO:Agx composites but improved significantly the grain morphology of
the host.
2. The TMI and Tc remain nearly invariant with increase in x (Ag content).
3. The sharpness of insulator-metal transition increases dramatically with
increase in x (Ag content) and high (15%) sharp TCR is observed for Ag
composites
4. Though the MR is seen in all the samples right from 300 K down to 5 K, the
same is negligible at 300 K and more at lower T for pure sample and is
maximum at 300 K and least at 5 K for Ag (0.4) containing compounds.
DISCUSSION
Now we try to explain in broad sense the main results summarized above, as far as (1)
is concerned there are some very recent reports in literature, which deals with the LCMO
composites viz. LCMO/ZnO [16], LCMO/CuO [17], LPbMO/Fe2O3 [18], LCMO/NiO [19]
and LCMO/ZrO2 [20]. In all these composites the quality of the LCMO was deteriorated. In
case of LCMO:Ag there is a good probability of Ag being distributed at grain boundaries and
hence providing better connectivity of grains, which is seen in Fig. 2(b). In most of other
composites [16-20] the additives either got substituted in some quantity in the lattice or got
segregated as clusters in the matrix of LCMO. This gave rise to the poor quality of LCMO
composite.
As far as point (2) is concerned the TMI and Tc remain nearly invariant with increase
in x, primarily due to the fact that in our composites the La/Ag substitution [4,5], which
could increase the effective amount of Mn4+ and hence TMI and Tc has not taken place. In case
of Ag substitution at La-site, instead of remaining as additive in the matrix, though the TMI
and Tc increased but the electrical conduction was not improved significantly, in fact the
same got detoriated in some cases [4,5]. In our opinion the Ag addition in LCMO could
results in (a) as La-site substitution, (b) remain as clusters in the matrix and (c) distributes
finely at grain boundaries of LCMO. As we told earlier (a) results in increased TMI and Tc due
to increase in Mn4+ content, (b) neither affects TMI and Tc nor does improve the conduction,
and (c) though does not improve upon the TMI and Tc but improves the grains morphology
8
and the transport properties of the compound. This naturally answers point (3), where we see
that in our composites the sharpness of metal-insulator transition increases dramatically due
to better grains morphology/connectivity in LCMO: Ag composites, please see Fig. 2(b). As
far as the process (a), (b) and (c) are concerned the best combination could be the
simultaneous process (a) and (c), i.e., increase TMI and Tc to sufficiently above room
temperature by partial La site Ag substitution and also leave some Ag at grain boundaries of
LCMO grains to improve upon the grains morphology/better connectivity/better coupled FM
domains to increase the TCR/sharpness of M-I transition. The effectiveness of process (a), (b)
or (c) depends upon the sample synthesis conditions. In our case we mixed the Ag with
LCMO in calcinations process itself at 1000 0C and went up to 1300 0C in steps of 100 0C
with intermediate grindings/pulverization etc. Our synthesis process has resulted in process
(c), i.e. the distribution of Ag at grains boundaries of LCMO and hence improved grains
connectivity and sharper M-I transition. More efforts are required to both increase TMI and Tc
by process (a) and sharper M-I transition by process (c) with in the same sample with
improved heating schedules.
Regarding point (4), the decrease in MR at low temperatures and increase at higher T
with x in LCMO: Ag composites, we would like to stress that better connectivity of grains
and sharper TMI is the reason behind the same. Sharper TMI guarantees the higher TCR and
hence the MR process is in higher magnitude and at higher T in LCMO: Ag composites.
SUMMARY AND CONCLUSION
Summarily we have synthesized bulk LCMO: Ag composites by solid state reaction
route, which resulted in substantially improved transport properties in terms of sharp M-I
transition and high MR near room temperature. The TMI and Tc could not be increased above
room temperature but the temperature coefficient of resistance (TCR) near room temperature
is improved significantly. The below 50 K R (T) upturn is not seen, which is further a sign of
improved electrical conduction in these composites. With addition of Ag the practically
important higher T MR is improving, but the low T MR got diminished. Unlike some
previous reports in our case, the Ag is not getting substituted at La –site but remaining at
9
grain boundaries and hence improving upon significantly the electrical transport via better
grains connectivity.
ACKNOWLEDGEMENT
Authors from NPL appreciate the interest and advice of Prof. Vikram Kumar
(Director) NPL in the present work. One of us Rahul Tripathi acknowledges the financial
help in form of JRF-NET fellowship from the UGC-India.

10
FIGURE CAPTIONS
Figure 1. X-ray diffraction patterns of LCMO: Ag composites at room temperature.
Figure 2. SEM pictures of pure LCMO and LCMO: Ag(0.4) samples at same magnification.
Figure 3. R(T) plots of LCMO: Ag composites, the inset shows the TCR% for pure and Ag
(0.4) samples.
Figure 4. Magnetization –Temperature (M/T) plots for LCMO: Ag composites, the insets
show the M/H for pristine and Ag(0.1) samples.
Figure 5 (a). R(T) plots of pristine LCMO in 0 and 7 Tesla applied fields, the inset
shows the MR at various T in applied fields of ± 7 Tesla.
Figure 5 (b). R(T) plots of LCMO (Ag0.2) in 0 and 7 Tesla applied fields, the
inset shows the MR at various T in applied fields of ± 7 Tesla.
Figure 5 (c). R(T) plots of LCMO (Ag0.3) in 0 and 7 Tesla applied fields, the
inset shows the MR at various T in applied fields of ± 7 Tesla.
Figure 5 (d). R(T) plots of LCMO (Ag0.4) in 0 and 7 Tesla applied fields, the
inset shows the MR at various T in applied fields of ± 7 Tesla.
11
REFERENCES
1. C. N. R. Rao and B. Raveau, Colossal Magnetoresistance Charge Ordering and Related
Properties of Manganese oxides (World Scientific, Singapore, 1998).
2. Y. Tokura and N. Nagaosa, Science 288, 468 (2000).
3. S. Sachdev, Science 288, 475 (2000).
4. Yun-Hui Huang, Chun Hua Yan, Feng Luo, Wei Song, Zhe-Ming Wang and Chn-Sheng
Liao, Appl. Phys. Lett. 81, 76 (2002).
5. T. Tang, Q.Q. Cao, K. M. Gu, H.Y. Xu, S.Y. Zhang and Y.W. Du, Appl. Phys. Lett. 77, 723
(2000).
6. R. Shreekala, M. Rajeshwari, S. P. Pai, S.E. Lofland, V. Smolyaninova, K. Ghosh, S.B.
Ogale, S.M. Bhagat, M.J. Downes, R.L. Greene, R. Ramesh and T. Venkatesan, Appl. Phys.
Lett. 74, 2857 (1999).
7. W. Prellier, Ph. Lecoeur and B. Mercey. J. Phys. Cond.. Matt. 13, R915 (2001).
8. Ravi Bathe, K.P. Adhi, S.I. Patil, G. Marest, B. Hannoyer and S.B. Ogle, Appl. Phys. Lett.
76, 2104 (2000).
9. Young Sun, M.B. Salamon and S.H. Chun, J. Appl. Phys. 92, 3235 (2002).
10. Alvydas Lisauskas, S.I. Khartsev and Alex Grishin, Appl. Phys. Lett. 77, 756 (2000).
11. D. Cohen, C.C. Sorrell, S.X. Dou and M. Apperley, J. Am. Ceram. Soc. 74, 1541 (1991).
12. L. Pi, M. Hervieu, A. Maugnan, C. Martin and B. Raveau, Solid State Commun. 126, 229
(2003).
13. S. Bhattacharya, A. Banerjee, S. Pal, P. Chatterjee, R. K. Mukherjee, and B.K. Chaudhuri, J.
Phys. Cond. Matt. 14, 10221 (2002).
14. L. W. Lei, Z.Y. Fu, J.Y. Zhang and H. Wang, Solid State Commun. (2006),
doi:10.1016/j.ssc2006.07.025
15. H. L. Ju, J. Gopalakrishnan, J. L. Peng, Qi Li, G. C. Xiong, T. Venkatesan, and R. L.
Greene Phys. Rev. B 51, 6143 (1995).
16. L.W. Lei, Z. Y. Fu, J. Y. Zhang, H. Wang, Mat. Sc. And Engg. B 128, 70 (2006).
17. J.H. Miao, L. Yuan, Y. Q. Wang, J.L. Shang, G. Q. Yu, G.M. Ren, X. Xiao, and S.L. Yuan,
Matt. Letts. 60, 2214 (2006).
18. S. L. Young, C.C. Lin, J.B. Shi, H.Z. Chen, L. Horng, Matt. Letts. 60, 1682 (2006).
19. S. Chen, H. Lai, Y. Lin, W. Ke, F. Zheng, Z. Huang, and Y. Du, J.Mag. Mag. Matts. 303,
e308 (2006).
20. B. X. Huang, Y.H Liu, R.Z. Zhang, and X. Yuan, C. J. Wang, and L.M. Mei, J. Phys. D.
Appl. Phys. 36, 1923 (2003).

12
FIG. 1 XRD of LCMO: Agx
��� ��� ��� ����� �
�� ��� ����
��� ��� �� �
�� ��� ����
�� ��� �� �
�� ��� ����
�� ��� ����
� �
������ �
������ �
������ �
�������
�������
� �
� �
�� "! # � � $ ! # � � � # � � � � � � � � � � � �
Inte
nsity
(Cou
nts)
2 (Theta)
13
FIG. 2(a) SEM of pure LCMO
FIG. 2(b) SEM of LCMO (Ag0.4)

14
FIG.3 R/T of LCMO: Agx composites
% &�%% '(%% )%% *�%%%
&
'
)
*
+-, + +/.0+ +21 + +/30+ +4 1+156, ., 7 8 98 98 98 9 : ; <: ; <: ; <: ; < = 9= 9= 9= 9 > ; <> ; <> ; <> ; < ?A@ B?A@ B?A@ B?A@ BA<< << = C DAE C F G H I F= C DAE C F G H I F= C DAE C F G H I F= C DAE C F G H I F
JKLM
NPO QSR
T U VAW�X Y ZT U V W�X Y Z [ \
]_^]_^]_^]_^P`Aa b`Aa b`Aa b`Aa bdc�^c�^c�^c�^fe a be a be a be a bhgjilkgjilkgjilkgjilk�bb bbnmSofprqtsvuxw�svytz { ymSofprqtsvuxw�svytz { ymSofprqtsvuxw�svytz { ymSofprqtsvuxw�svytz { y
RT /
(R) 40
0
T (K)
|}h~���� ~��
FIG.4 M/T of LCMO: Agx
� ����� ����� ����� ������
�f�
��
���
���
�����
�_�f� ���������������� ���� ���� ���� �d�������������� � �� � �� � �� � ������������������������� ��"�v���r���_���r ¡��¢l£ ¤�¥l¢���r���_���r ¡��¢l£ ¤�¥l¢���r���_���r ¡��¢l£ ¤�¥l¢���r���_���r ¡��¢l£ ¤�¥l¢
¦ § ¨ ¨ ¨ ¨¦ © ¨ ¨ ¨ ¨ª¨«© ¨ ¨ ¨ ¨¬§ ¨ ¨ ¨ ¨¦ ¨ ¨¦ ® ¨¨® ¨ ¨ ¨
¯ °A± ¨ ¨ ² ± ® ¨�³¯ ° ® ² ® ¨ ² ¨ ¨�³
´ µ´ µ´ µ´ µ ¶ · ¸¶ · ¸¶ · ¸¶ · ¸ ¹ µ¹ µ¹ µ¹ µ º · ¸º · ¸º · ¸º · ¸ »0¼ ½»0¼ ½»0¼ ½»0¼ ½A¸¸ ¸¸ ¾ ¿ À Á  ÿ À Á  ÿ À Á  ÿ À Á  Ã
ÄPÅ ÆnÇ È
ÉÊ ËÌ ÍÎ ÏÐÑÌÒ
Ó Ô Õ Õ Õ Õ�Ó Ö Õ Õ Õ Õ×ÕØÖ Õ Õ Õ ÕÙÔ Õ Õ Õ ÕÓ Ú ÕÓ Ô ÕÕÔ ÕÚ Õ Û ÜÛ ÜÛ ÜÛ ÜAÝ Þ ßÝ Þ ßÝ Þ ßÝ Þ ß àhÜàhÜàhÜàhÜ�á Þ ßá Þ ßá Þ ßá Þ ß â"ã äâ"ã äâ"ã äâ"ã ä"ßß ßß
åæ çè éê ëìíèî
ïPð ñdò ó
ô õô ö õ÷ ö ö õø ö ö õù ö ö õù ô ö õ
M (e
mu/
gram
)
T (K)
úüûüý þÿ������ �ÿ������ �ÿ������ �ÿ������
15
FIG.5 (a) MR of LCMO
�� ��� �� �����
�� ��
�� �
������
������
� � � � ! � "#� $ � � ! � "�� % � � ! � " � � � % � � ! � "&$ � � ! � "&� � � ! � "� ' �� ( �� % �� ) �� ! ��
*+, -./ +102+134 5+167 89::
; <; <; <; < = > ?= > ?= > ?= > ? @ <@ <@ <@ < A > ?A > ?A > ?A > ? BDC EBDC EBDC EBDC ED?? ??
FHG IKJML
N O P Q R S S T Q U V W XN O P Q Y Z S T Q U V W XN O P Q Y S S T Q U V W XN O P Q [ S S T Q U V W XN O P Q Z S T Q U V W X
\^]`_ba
\^]`c
d�ed�ed�ed�e�fhg ifhg ifhg ifhg iKjkejkejkejkeml�g il�g il�g il�g i�nporqnporqnporqnporqsii ii
�� �����
����
�����
�����
����
�����
��
��������������������
FIG.5 (b) MR of LCMO: Ag (0.2)
0 100 200 300 400
0.00
0.02
0.04
0.06
0.08
0.10
H = 7 T
H = 0
t u#v w x�y w z t {�v w x�y w z w#v w {�v w x�y w z1u#v w x�y w zt | wt }Dwt { wt ~Dwt y wwy w � �� �� �� �D� � �� � �� � �� � � �h��h��h��h�M� � �� � �� � �� � � �&� ��&� ��&� ��&� �&�� �� � �1� ��� ��1� ��� ��1� ��� ��1� ��� �
��� ����K���K����K�� ����
�¡ ¢�£1¤
¥ ¦ § ¨ © ª « ¬ ¨ ® « « ¯¥ ¦ § ¨ © ª « ¬ ¨ ° « ¯¥ ¦ § ¨ © ª « ¬ ¨ « « ¯¥ ¦ § ¨ © ª « ¬ ¨ ± « « ¯¥ ¦ § ¨ © ª « ¬ ¨ ° « ¯
La2/3Ca1/3MnO3: Ag0.2
R (O
hms)
T (K)
16
FIG. 5(c) MR of LCMO: Ag (0.3)
0 100 200 300 400
0.00
0.01
0.02
0.03
0.04
H = 0
H = 7 T
La2/3Ca1/3MnO3: Ag0.3
² ³ ´ µ ¶D· µ ¸�² ¹ ´ µ ¶D· µ ¸ µ ´ µ ¹ ´ µ ¶D· µ ¸º³ ´ µ ¶D· µ ¸² ³ µ² » µ² ¼ µ² ¹ µ² ½ µ² · µµ· µ ¾#¿¾#¿¾#¿¾#¿�À Á ÂÀ Á ÂÀ Á ÂÀ Á  ÃÄ¿ÃÄ¿ÃÄ¿ÃÄ¿hÅ Á ÂÅ Á ÂÅ Á ÂÅ Á  ÆÈÇ#ÉÆÈÇ#ÉÆÈÇ#ÉÆÈÇ#É�  ÊDËÄÌMÍÏÎ ÐËÄÌMÍÏÎ ÐËÄÌMÍÏÎ ÐËÄÌMÍÏÎ Ð
ÑÒÓ ÔÕÖ Ò�×ØÒ�ÙÚ ÛÒ�ÜÝ Þßàà
á�â ã�ä�å
æ#ç èDé ê ë ì í î é î ì ì ïæ#ç èDé ê ë ì í î é ð ñ ì ïæ#ç èDé ê ë ì í î é ð ì ì ïæ#ç èDé ê ë ì í î é ò ì ì ïæ#ç èDé ê ë ì í î é ñ ì ï
R (O
hms)
T (K)
FIG. 5(d) MR of LCMO: Ag (0.4)
0 100 200 300 400
0.000
0.001
0.002
0.003
0.004
0.005
0.006
H = 0
H = 7 T
La2/3
Ca1/3
MnO3: Ag0.4
ó ô õ ö ÷ ø ö ùÈó ú õ ö ÷ ø ö ù ö õ ö ú õ ö ÷ ø ö ù ô õ ö ÷ ø ö ùó ô öó û öó ü öó ú öó ý öó ø öö
þ ÿþ ÿþ ÿþ ÿ � � �� � �� � �� � � � ÿ� ÿ� ÿ� ÿ � � �� � �� � �� � � � � �� � �� � �� � � �� �� � � � � � � � � �
��� �����
��� ��� ������� !��"# $%&&
' ( ) * + , - . / * 0 - - 1' ( ) * + , - . / * 2 3 - 1' ( ) * + , - . / * 2 - - 1' ( ) * + , - . / * 4 - - 1
R (O
hms)
T (K)