Immunophenotypic characterization of TCR γδ T cells and ...
15
RESEARCH ARTICLE Open Access Immunophenotypic characterization of TCR γδ T cells and MAIT cells in HIV-infected individuals developing Hodgkin’s lymphoma Christina K. S. Muller 1 , Julian Spagnuolo 2 , Annette Audigé 3 , Andrew Chancellor 2 , Doris Russenberger 1 , Alexandra U. Scherrer 1 , Matthias Hoffmann 4 , Roger Kouyos 1 , Manuel Battegay 2 , Gennaro De Libero 2 , Roberto F. Speck 1* and the Swiss HIV Cohort Study Abstract Background: Despite successful combined antiretroviral therapy (cART), the risk of non-AIDS defining cancers (NADCs) remains higher for HIV-infected individuals than the general population. The reason for this increase is highly disputed. Here, we hypothesized that T-cell receptor (TCR) γδ cells and/or mucosal-associated invariant T (MAIT) cells might be associated with the increased risk of NADCs. γδ T cells and MAIT cells both serve as a link between the adaptive and the innate immune system, and also to exert direct anti-viral and anti-tumor activity. Methods: We performed a longitudinal phenotypic characterization of TCR γδ cells and MAIT cells in HIV-infected individuals developing Hodgkin’s lymphoma (HL), the most common type of NADCs. Cryopreserved PBMCs of HIV- infected individuals developing HL, matched HIV-infected controls without (w/o) HL and healthy controls were used for immunophenotyping by polychromatic flow cytometry, including markers for activation, exhaustion and chemokine receptors. Results: We identified significant differences in the CD4 + T cell count between HIV-infected individuals developing HL and HIV-infected matched controls within 1 year before cancer diagnosis. We observed substantial differences in the cellular phenotype mainly between healthy controls and HIV infection irrespective of HL. A number of markers tended to be different in Vδ1 and MAIT cells in HIV + HL + patients vs. HIV + w/o HL patients; notably, we observed significant differences for the expression of CCR5, CCR6 and CD16 between these two groups of HIV + patients. Conclusion: TCR Vδ1 and MAIT cells in HIV-infected individuals developing HL show subtle phenotypical differences as compared to the ones in HIV-infected controls, which may go along with functional impairment and thereby may be less efficient in detecting and eliminating malignant cells. Further, our results support the potential of longitudinal CD4 + T cell count analysis for the identification of patients at higher risk to develop HL. Keywords: HIV, Hodgkin’s lymphoma, MAIT cells, T-cell receptor (TCR) γδ cells © The Author(s). 2021 Open Access This article is licensed under a Creative Commons Attribution 4.0 International License, which permits use, sharing, adaptation, distribution and reproduction in any medium or format, as long as you give appropriate credit to the original author(s) and the source, provide a link to the Creative Commons licence, and indicate if changes were made. The images or other third party material in this article are included in the article's Creative Commons licence, unless indicated otherwise in a credit line to the material. If material is not included in the article's Creative Commons licence and your intended use is not permitted by statutory regulation or exceeds the permitted use, you will need to obtain permission directly from the copyright holder. To view a copy of this licence, visit http://creativecommons.org/licenses/by/4.0/. The Creative Commons Public Domain Dedication waiver (http://creativecommons.org/publicdomain/zero/1.0/) applies to the data made available in this article, unless otherwise stated in a credit line to the data. * Correspondence: [email protected] 1 Department of Infectious Diseases and Hospital Epidemiology, University Hospital of Zurich, University of Zurich, Zurich, Switzerland Full list of author information is available at the end of the article Muller et al. Infectious Agents and Cancer (2021) 16:24 https://doi.org/10.1186/s13027-021-00365-4
-
Upload
khangminh22 -
Category
Documents
-
view
2 -
download
0
Transcript of Immunophenotypic characterization of TCR γδ T cells and ...
RESEARCH ARTICLE Open Access
Immunophenotypic characterization of TCRγδ T cells and MAIT cells in HIV-infectedindividuals developing Hodgkin’slymphomaChristina K. S. Muller1, Julian Spagnuolo2, Annette Audigé3, Andrew Chancellor2, Doris Russenberger1,Alexandra U. Scherrer1, Matthias Hoffmann4, Roger Kouyos1, Manuel Battegay2, Gennaro De Libero2,Roberto F. Speck1* and the Swiss HIV Cohort Study
Abstract
Background: Despite successful combined antiretroviral therapy (cART), the risk of non-AIDS defining cancers(NADCs) remains higher for HIV-infected individuals than the general population. The reason for this increase ishighly disputed. Here, we hypothesized that T-cell receptor (TCR) γδ cells and/or mucosal-associated invariant T(MAIT) cells might be associated with the increased risk of NADCs. γδ T cells and MAIT cells both serve as a linkbetween the adaptive and the innate immune system, and also to exert direct anti-viral and anti-tumor activity.
Methods: We performed a longitudinal phenotypic characterization of TCR γδ cells and MAIT cells in HIV-infectedindividuals developing Hodgkin’s lymphoma (HL), the most common type of NADCs. Cryopreserved PBMCs of HIV-infected individuals developing HL, matched HIV-infected controls without (w/o) HL and healthy controls wereused for immunophenotyping by polychromatic flow cytometry, including markers for activation, exhaustion andchemokine receptors.
Results: We identified significant differences in the CD4+ T cell count between HIV-infected individuals developingHL and HIV-infected matched controls within 1 year before cancer diagnosis. We observed substantial differences inthe cellular phenotype mainly between healthy controls and HIV infection irrespective of HL. A number of markerstended to be different in Vδ1 and MAIT cells in HIV+HL+ patients vs. HIV+ w/o HL patients; notably, we observedsignificant differences for the expression of CCR5, CCR6 and CD16 between these two groups of HIV+ patients.
Conclusion: TCR Vδ1 and MAIT cells in HIV-infected individuals developing HL show subtle phenotypicaldifferences as compared to the ones in HIV-infected controls, which may go along with functional impairment andthereby may be less efficient in detecting and eliminating malignant cells. Further, our results support the potentialof longitudinal CD4+ T cell count analysis for the identification of patients at higher risk to develop HL.
Keywords: HIV, Hodgkin’s lymphoma, MAIT cells, T-cell receptor (TCR) γδ cells
© The Author(s). 2021 Open Access This article is licensed under a Creative Commons Attribution 4.0 International License,which permits use, sharing, adaptation, distribution and reproduction in any medium or format, as long as you giveappropriate credit to the original author(s) and the source, provide a link to the Creative Commons licence, and indicate ifchanges were made. The images or other third party material in this article are included in the article's Creative Commonslicence, unless indicated otherwise in a credit line to the material. If material is not included in the article's Creative Commonslicence and your intended use is not permitted by statutory regulation or exceeds the permitted use, you will need to obtainpermission directly from the copyright holder. To view a copy of this licence, visit http://creativecommons.org/licenses/by/4.0/.The Creative Commons Public Domain Dedication waiver (http://creativecommons.org/publicdomain/zero/1.0/) applies to thedata made available in this article, unless otherwise stated in a credit line to the data.
* Correspondence: [email protected] of Infectious Diseases and Hospital Epidemiology, UniversityHospital of Zurich, University of Zurich, Zurich, SwitzerlandFull list of author information is available at the end of the article
Muller et al. Infectious Agents and Cancer (2021) 16:24 https://doi.org/10.1186/s13027-021-00365-4

IntroductionCombined antiretroviral therapy (cART) is highly effi-cient in suppressing HIV replication with life expectan-cies of HIV-infected individuals nowadays being almostsimilar to the general population [1–4]. In particular, asignificant decline of AIDS-defining cancers (ADCs),such as Kaposi Sarcoma and non-Hodgkin’s lymphoma,has been observed upon cART [5–7]. Strikingly, the per-centage of cancer-induced death increased from approxi-mately 10% in the pre-cART era to 28% in the era ofcART [8, 9]. The increased cancer burden observed isassociated with a higher risk of HIV-infected individualsto develop non-AIDS defining cancers (NADCs) includ-ing lung cancer, colorectal cancer, hepatocellular carcin-oma, anal cancer, and Hodgkin’s lymphoma (HL) [10–14]. The overall risk of those cancers is three-fold higherfor HIV-infected individuals than for the general popula-tion and even 5 to 30-fold higher for HL, the most com-mon type of NADCs [10, 15–17].NADCs are associated with many factors including
antiretroviral drug toxicity, aging, and known risk factorssuch as alcohol and tobacco smoking, but they do notfully explain the higher risk of HIV-infected people tosuffer from NADCs [18–20]. Moreover, chronic immuneactivation, persistent immunodeficiency, as well as co-infections seem to contribute to this increased risk [10,21–23]. In HIV-infected individuals, for example, almostall cases of HL are associated with EBV infection versus40% in the general population [24]. In addition, they arealso more likely to develop mixed cellular andlymphocyte-depleted subtypes of HL, which are associ-ated with a less favorable outcome than the nodularsclerosis subtype, which is predominant in the generalpopulation [25, 26]. The higher incidence rate and devel-opment of subtypes with less favorable outcome mightbe linked to HIV-associated immune dysfunction suchas the depletion and/or functional impairment of cellsinvolved in immune surveillance against cancer [24, 27].Even though the age-specific rates are projected to de-crease through 2030 for a number of tumor types, mostlikely due to the timely treatment of HIV, we are cur-rently challenged with a still increased incidence rate ofHL [28]. In fact, in a recent study by Cornejo-Juarezet al., HL figured as the most frequent NADCs in an on-cology unit [29].Strong associations of low CD4+ T cell counts and
ADCs are well proven, while associations of CD4+ T cellcounts and NADCs are weaker or not observed for allNADCs [17, 19, 23, 30–32]. Further, the immediate initi-ation of cART reduces serious AIDS-related and non-AIDS related events [33, 34]. The START study, for ex-ample, showed a reduced risk for cancers (ADCs andNADCs) when cART was initiated immediately and irre-spective of CD4+ T cell count but there was no evidence
that this beneficial effect was associated with CD4+ Tcell count or viral load [34, 35]. Thus, the higher risk forNADCs is not simply an equation of CD4+ T cell countsbut likely involves more complex mechanisms of im-mune activation and immune surveillance.TCR γδ cells and mucosal-associated invariant T
(MAIT) cells are innate-like T lymphocytes with import-ant functions in both innate and adaptive immune re-sponse [36–39]. TCR γδ cells express an invariant T cellreceptor (TCR), composed of a gamma (γ) and a delta(δ) chain. They usually comprise 0.5–16% of all CD3+ Tcells in the peripheral blood (PB) but can expand to upto 60% during bacterial and viral infections [40–42].Based on their TCR Vδ chain usage, they can be dividedinto two major sub-populations; namely, Vδ1- and Vδ2-expressing cells. A minority of TCR γδ cells instead ex-press Vδ chains other than these two. Tissue-associatedTCR γδ T cells mostly express the TCR Vδ1 chain,whereas cells expressing the Vδ2 chain (usually pairedwith the Vγ9 chain, and therefore also called Vγ9Vδ2cells) are the predominant population in the PB [43].Upon HIV infection, an expansion of Vδ1 cells accom-panied by a depletion of Vδ2 cells in the PB is observed,resulting in an inversion of the Vδ1/ Vδ2 ratio [44–47].TCR γδ cells perform diverse functions and are also in-volved in anti-viral and anti-tumor activity [48]. Theycan rapidly secrete large amounts of IFN-γ, TNF-α, IL-4and IL-17, and can act as potent cytotoxic effector cellsagainst virus-infected and malignant cells through therelease of perforin and granzyme-B [49–52]. These cellsmay also have a regulatory function via secretion of IL-10 and TGF-β with potential suppressive effects on anti-tumor function [53]. The role of TCR γδ cells in tumorimmunity is not fully understood, and further analysis ofindividual populations based on the TCR-repertoire andfunctional heterogeneity is needed [54].MAIT cells, which are abundant in the PB, mesenteric
lymph nodes, liver and intestinal mucosa, are also in-volved in tumor immunity [55–58]. They express thesemi-invariant TCR Vα7.2, paired with a limited Vβ rep-ertoire and the C-type lectin CD161 [59, 60]. Similar toTCR γδ cells, MAIT cells can rapidly secrete cytokines,including IFN-γ, TNF-α, IL-17, and IL-22, and may alsokill target cells [55, 59, 61, 62]. Early during HIV infec-tion, MAIT cells are depleted and functionally impairedand like TCR γδ cells, do not fully recover upon long-term cART [63–65].As MAIT and TCR γδ cells are involved in antitumor
immunity, we hypothesized that the extent of their de-pletion and/or their phenotype differ between HIV-infected patients developing HL (prior to the diagnosisof HL) and HIV-infected matched controls. Notably, ex-tensive characterization of immune cells in the PB ofHIV-infected individuals over time may provide detailed
Muller et al. Infectious Agents and Cancer (2021) 16:24 Page 2 of 15
insight on their immune reconstitution and on thephenotype of cellular populations with distinct functions,and could also provide useful predictors of disease pro-gression. To address this possibility, we performed a de-tailed phenotypic characterization of TCR γδ and MAITcells in the PB of HIV-infected individuals enrolled inthe Swiss HIV Cohort Study (SHCS).
Material and methodsSwiss HIV cohort study (SHCS)The SHCS (www.shcs.ch) is a prospective cohort studywith ongoing enrollment of HIV-infected adults inSwitzerland since 1988 [66]. It includes 73% of all diag-nosed HIV-infections in Switzerland [67]. Representa-tion has remained stable throughout the study duration.Detailed information on demographics, mode of HIV ac-quisition, risk behavior, clinical events, co-infections,and treatment is collected using a standard protocol atregistration and at intervals of 6 months. Plasma samplesare collected every 6–12months in all study participants.Local ethical committees of all participating study sitesapproved the study and written consent was obtainedfrom all participants.
SamplesBlood was obtained from healthy controls and HIV-infected patients with and without HL, which were en-rolled in the Swiss HIV Cohort Study (SHCS). Peripheralblood mononuclear cells (PBMCs) were isolated usingLymphoprep gradients and cryopreserved. Within theSHCS demographic, clinical, laboratory and behavioraldata are recorded at enrolment and at follow-up visitsevery 6 months. Samples were selected based on the fol-lowing inclusion criteria: i) male, ii) ≥ 18 years, iii) Cau-casian, iv) HIV RNA copies > 400 copies/ml, v) sampleavailability before cART, 1–2 years after suppression,and 0–1 years prior to HL diagnosis, i.e., for the HIV-patients w/o HL we chose the samples closest to thetimes of the corresponding matching HIV+ HL+ patients.Matching of cancer-free HIV-infected individual wasdone according to: i) gender, ii) ethnicity, iii) age, iv)sample availability, v) CD4+ T cell count (before cART),vi) HIV RNA copy number (before cART).
Flow CytometryFrequencies and cell count of conventional CD4+ andCD8+ T cells were determined throughout the study andprovided by the SHCS, frequencies of unconventional γδT cells and MAIT cells were determined retrospectively.Samples were analyzed on two consecutive days. To en-sure comparability of the samples, all time points andmatched control samples were stained and acquired onthe same day. We checked for technical performance byanalyzing one healthy control sample on both days.
Cryopreserved PBMCs were thawed, washed, and resus-pended in phosphate buffered saline (PBS). Cell numberafter thawing was determined with the COULTER® Ac ·T diff™ Analyzer (Beckman Coulter). Three differentpolychromatic flow cytometry panels were used for theidentification and characterization of γδ T cells andMAIT cells. Each staining step included incubation for20 min at 4 °C. One million PBMCs were used per paneland stained with purified anti-TCRγδ (BD Bioscience)and the Zombie NIR Fixable Viability dye (BioLegend)in PBS with 2mM. PBMCs were washed 2x and thenstained with anti-mouse IgG (H + L) – Pacific Orange(Thermo Fisher Scientific) in FACS buffer (PBS contain-ing 2% FBS and 0.05% sodium azide). PBMCs werewashed 2x, followed by a 20min blocking step withmouse serum (Thermo Fisher Scientific) at 4 °C. Afterblocking, cells were washed and surface staining withthree different panels was performed. Each panel in-cluded anti-TCRVδ1 - PE-Vio770 (Miltenyi Biotec),anti-TCRVδ2 - PerCP (BioLegend), anti-CD161 - BV711(BD Bioscience) and anti-TCRVα7.2 – BV785 (BioLe-gend), plus, Panel 1: anti-CCR5 – APC, anti-CCR6 – PE,anti-CXCR3 – PE-Dazzle, anti-CXCR4 – BV421, anti-CD38 – BV605, and anti-CD69 – FITC (all BioLegend);Panel 2: anti-NKG2D –BV605 (BD Bioscience), anti-CD94 – FITC, anti-Tim3 – PE-Dazzle, anti-PD-1 –BV421, anti-ILT2 – PE, anti-CD158b – APC (all BioLe-gend); and Panel 3: anti-CD16 – FITC (BD Bioscience),anti-KLRG1 – PE, anti-CTLA4 – BV421, anti-CD57 –PE-Dazzle, anti-CD56 – APC (all BioLegend). Before ac-quisition, cells were fixed with 1% paraformaldehyde.Samples were acquired on a BD LSR II Fortessa (BDBioscience). Ultra Comp eBeads (Thermo Fisher Scien-tific) were used for compensation, except for anti-CD57– PE-Dazzle and the Zombie NIR Fixable Viability dye,for which compensation was done with PBMCs. Anti-TCRVδ1 - PE-Vio770 was compensated using theMACS Comp bead Kit, anti REA (Miltenyi Biotec). Datawere analyzed using FlowJo software (TreeStar). All re-sults shown included gating on lymphocytes, single cells,and live cells. Detailed subset analysis of γδ T cells wasperformed by gating on TCRγδ+/TCRVδ1+ or onTCRγδ+/TCRVδ2+ cells. MAIT cells gated based onTCRVα7.2+/CD161+. Subset analysis was only performedwhen a threshold of 100 detected events for the parentalpopulation was reached.
Quantification and statistical analysisResults on frequencies of δγ T cells, Vδ1, Vδ2 cells, andMAIT cells were extracted from all three panels. Themean frequency was calculated and used for further ana-lysis. Data was only plotted when results were availablefor four or more patients per group. Statistical data ana-lyses were performed using GraphPad Prism 8 software
Muller et al. Infectious Agents and Cancer (2021) 16:24 Page 3 of 15
(GraphPad). The ROUT method was used for the identifi-cation of outliers. Data were subjected to a Wilcoxon signed-rank test or Kruskal-Wallis with Dunn’s multiple comparisontest. P values were considered as significant at p < 0.05.All analysis was performed within the R statistical
computing environment, version 3.6.3 [68]. FACS datafrom the three panels (CCR, Exhaustion and NK) andpopulation (MAIT, Gamma-delta VdX, Vd1 and Vd2)were analyzed independently, using a common analyticalframework described here. Data was first zero-centeredon gate-values for each marker and arcsin transformedbefore dimensional reduction and clustering using Rphe-nograph [69]. The proportions of HC, HIV+ w/o HL andHIV+ HL+ cells and median marker expression withineach cluster were calculated and heatmapped to visualizephenotypic signatures. To train the SVM classifier, atraining set containing equal numbers of cells from eachof the three conditions was obtained by sampling usingthe caret package [70]. Training data for each population(MAIT, Gamma-delta VdX, Vd1 and Vd2) were used tobuild separate SVM model using the e1071 package [71]under default parameters. These models were then usedto predict condition (HC, HIV+ w/o HL or HIV+ HL+) foreach cell in the dataset with probabilities for each condi-tion. The median predicted condition probability was cal-culated for each phenograph cluster. Similarly, down-sampled datasets were presented to the DDRTree andSlingshot [72, 73] algorithms for pseudotemporal orderingbased on phenotypic markers (i.e., non-lineage) alone.
ResultsPatient characteristicsWe screened the entire SHCS cohort for cryopreservedPBMC samples of HIV-infected individuals developing
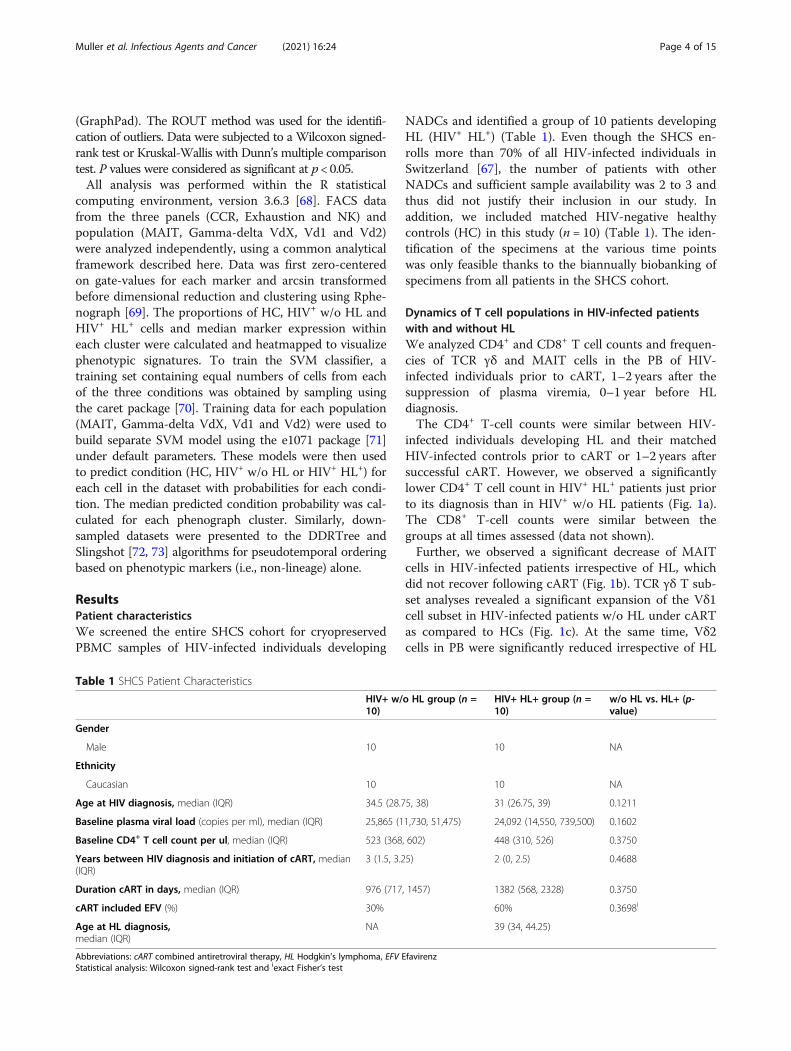
NADCs and identified a group of 10 patients developingHL (HIV+ HL+) (Table 1). Even though the SHCS en-rolls more than 70% of all HIV-infected individuals inSwitzerland [67], the number of patients with otherNADCs and sufficient sample availability was 2 to 3 andthus did not justify their inclusion in our study. Inaddition, we included matched HIV-negative healthycontrols (HC) in this study (n = 10) (Table 1). The iden-tification of the specimens at the various time pointswas only feasible thanks to the biannually biobanking ofspecimens from all patients in the SHCS cohort.
Dynamics of T cell populations in HIV-infected patientswith and without HLWe analyzed CD4+ and CD8+ T cell counts and frequen-cies of TCR γδ and MAIT cells in the PB of HIV-infected individuals prior to cART, 1–2 years after thesuppression of plasma viremia, 0–1 year before HLdiagnosis.The CD4+ T-cell counts were similar between HIV-
infected individuals developing HL and their matchedHIV-infected controls prior to cART or 1–2 years aftersuccessful cART. However, we observed a significantlylower CD4+ T cell count in HIV+ HL+ patients just priorto its diagnosis than in HIV+ w/o HL patients (Fig. 1a).The CD8+ T-cell counts were similar between thegroups at all times assessed (data not shown).Further, we observed a significant decrease of MAIT
cells in HIV-infected patients irrespective of HL, whichdid not recover following cART (Fig. 1b). TCR γδ T sub-set analyses revealed a significant expansion of the Vδ1cell subset in HIV-infected patients w/o HL under cARTas compared to HCs (Fig. 1c). At the same time, Vδ2cells in PB were significantly reduced irrespective of HL
Table 1 SHCS Patient Characteristics
HIV+ w/o HL group (n =10)
HIV+ HL+ group (n =10)
w/o HL vs. HL+ (p-value)
Gender
Male 10 10 NA
Ethnicity
Caucasian 10 10 NA
Age at HIV diagnosis, median (IQR) 34.5 (28.75, 38) 31 (26.75, 39) 0.1211
Baseline plasma viral load (copies per ml), median (IQR) 25,865 (11,730, 51,475) 24,092 (14,550, 739,500) 0.1602
Baseline CD4+ T cell count per ul, median (IQR) 523 (368, 602) 448 (310, 526) 0.3750
Years between HIV diagnosis and initiation of cART, median(IQR)
3 (1.5, 3.25) 2 (0, 2.5) 0.4688
Duration cART in days, median (IQR) 976 (717, 1457) 1382 (568, 2328) 0.3750
cART included EFV (%) 30% 60% 0.3698i
Age at HL diagnosis,median (IQR)
NA 39 (34, 44.25)
Abbreviations: cART combined antiretroviral therapy, HL Hodgkin’s lymphoma, EFV EfavirenzStatistical analysis: Wilcoxon signed-rank test and iexact Fisher’s test
Muller et al. Infectious Agents and Cancer (2021) 16:24 Page 4 of 15
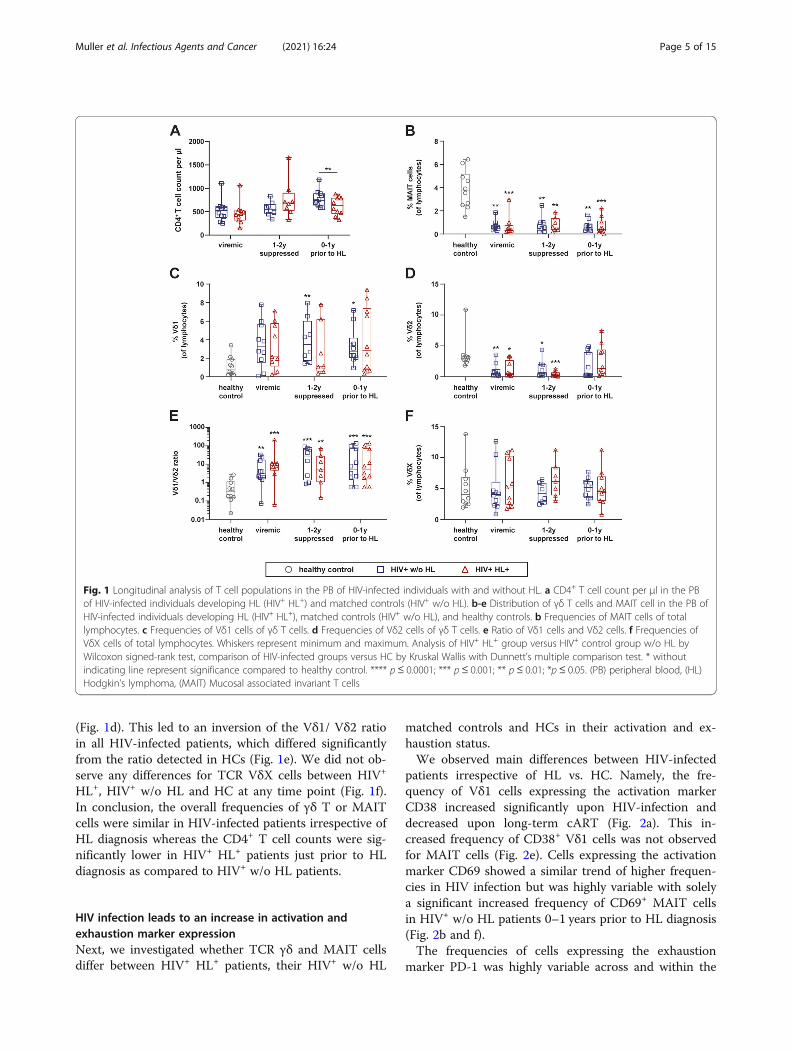
(Fig. 1d). This led to an inversion of the Vδ1/ Vδ2 ratioin all HIV-infected patients, which differed significantlyfrom the ratio detected in HCs (Fig. 1e). We did not ob-serve any differences for TCR VδX cells between HIV+
HL+, HIV+ w/o HL and HC at any time point (Fig. 1f).In conclusion, the overall frequencies of γδ T or MAITcells were similar in HIV-infected patients irrespective ofHL diagnosis whereas the CD4+ T cell counts were sig-nificantly lower in HIV+ HL+ patients just prior to HLdiagnosis as compared to HIV+ w/o HL patients.
HIV infection leads to an increase in activation andexhaustion marker expressionNext, we investigated whether TCR γδ and MAIT cellsdiffer between HIV+ HL+ patients, their HIV+ w/o HL
matched controls and HCs in their activation and ex-haustion status.We observed main differences between HIV-infected
patients irrespective of HL vs. HC. Namely, the fre-quency of Vδ1 cells expressing the activation markerCD38 increased significantly upon HIV-infection anddecreased upon long-term cART (Fig. 2a). This in-creased frequency of CD38+ Vδ1 cells was not observedfor MAIT cells (Fig. 2e). Cells expressing the activationmarker CD69 showed a similar trend of higher frequen-cies in HIV infection but was highly variable with solelya significant increased frequency of CD69+ MAIT cellsin HIV+ w/o HL patients 0–1 years prior to HL diagnosis(Fig. 2b and f).The frequencies of cells expressing the exhaustion
marker PD-1 was highly variable across and within the
Fig. 1 Longitudinal analysis of T cell populations in the PB of HIV-infected individuals with and without HL. a CD4+ T cell count per μl in the PBof HIV-infected individuals developing HL (HIV+ HL+) and matched controls (HIV+ w/o HL). b-e Distribution of γδ T cells and MAIT cell in the PB ofHIV-infected individuals developing HL (HIV+ HL+), matched controls (HIV+ w/o HL), and healthy controls. b Frequencies of MAIT cells of totallymphocytes. c Frequencies of Vδ1 cells of γδ T cells. d Frequencies of Vδ2 cells of γδ T cells. e Ratio of Vδ1 cells and Vδ2 cells. f Frequencies ofVδX cells of total lymphocytes. Whiskers represent minimum and maximum. Analysis of HIV+ HL+ group versus HIV+ control group w/o HL byWilcoxon signed-rank test, comparison of HIV-infected groups versus HC by Kruskal Wallis with Dunnett’s multiple comparison test. * withoutindicating line represent significance compared to healthy control. **** p≤ 0.0001; *** p ≤ 0.001; ** p ≤ 0.01; *p ≤ 0.05. (PB) peripheral blood, (HL)Hodgkin’s lymphoma, (MAIT) Mucosal associated invariant T cells
Muller et al. Infectious Agents and Cancer (2021) 16:24 Page 5 of 15
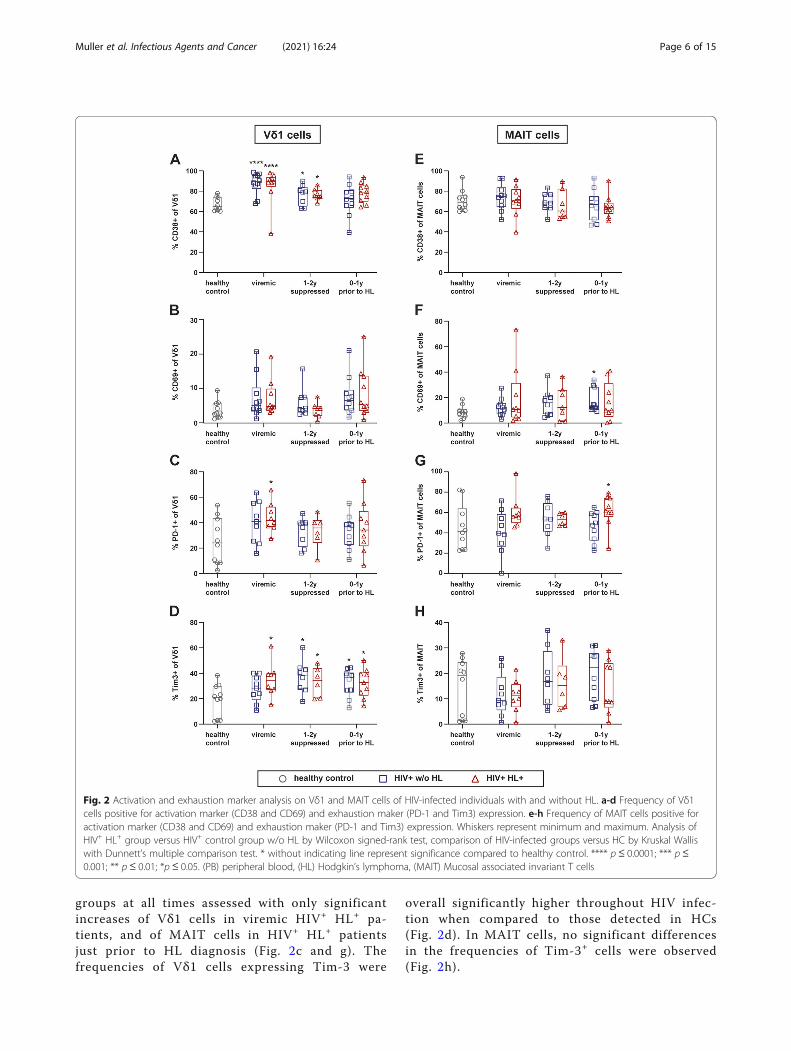
groups at all times assessed with only significantincreases of Vδ1 cells in viremic HIV+ HL+ pa-tients, and of MAIT cells in HIV+ HL+ patientsjust prior to HL diagnosis (Fig. 2c and g). Thefrequencies of Vδ1 cells expressing Tim-3 were
overall significantly higher throughout HIV infec-tion when compared to those detected in HCs(Fig. 2d). In MAIT cells, no significant differencesin the frequencies of Tim-3+ cells were observed(Fig. 2h).
Fig. 2 Activation and exhaustion marker analysis on Vδ1 and MAIT cells of HIV-infected individuals with and without HL. a-d Frequency of Vδ1cells positive for activation marker (CD38 and CD69) and exhaustion maker (PD-1 and Tim3) expression. e-h Frequency of MAIT cells positive foractivation marker (CD38 and CD69) and exhaustion maker (PD-1 and Tim3) expression. Whiskers represent minimum and maximum. Analysis ofHIV+ HL+ group versus HIV+ control group w/o HL by Wilcoxon signed-rank test, comparison of HIV-infected groups versus HC by Kruskal Walliswith Dunnett’s multiple comparison test. * without indicating line represent significance compared to healthy control. **** p ≤ 0.0001; *** p≤0.001; ** p ≤ 0.01; *p ≤ 0.05. (PB) peripheral blood, (HL) Hodgkin’s lymphoma, (MAIT) Mucosal associated invariant T cells
Muller et al. Infectious Agents and Cancer (2021) 16:24 Page 6 of 15
Overall, Vδ1 cells and MAIT cells with an activatedand exhausted phenotype were more frequent upon HIVinfection, which was only partially reverted upon long-term cART.
Expression of tissue homing receptors on γδ T cells andMAIT cells is altered upon HIV infectionWe also determined the expression of different tissuehoming receptors in our cohort, including CXCR3,CCR6, as well as CXCR4 and CCR5, with the latter twoserving as viral co-receptors during entry of HIV. Not-ably, homing is a very critical function for immunosur-veillance and its dysfunction a potential indication forinsufficient control of infections or tumors.The frequency of CCR5+ Vδ1 cells was significantly
higher in HIV+ w/o HL vs. HIV+ HL+ 0–1 years prior toHL diagnosis (Fig. 3a). Instead, a slight but significantdecrease in the frequency of CCR5+ MAIT cells was ob-served upon infection with HIV irrespective of HL (Fig.3d).Overall, the frequencies of CXCR4+ Vδ1 and CXCR4+
MAIT cells were very heterogeneous in HCs and HIV-infected individuals (Fig. 3b and e). Notably, the frequen-cies of CXCR4+ MAIT cells tended to be higher in HIVinfection with a significant increase during the viremicphase and 1–2 years after HIV suppression (Fig. 3e). Fur-ther, we found a trend towards a decrease of CXCR3+
Vδ1 and MAIT cells in HIV infection (Fig. 3c and datanot shown). CCR6+ Th17-like Vδ1 cells were barely de-tectable in all groups (data not shown). In MAIT cells,the majority displayed a CCR6+ Th17-like phenotype,and the frequency of these cells was significantly re-duced upon HIV-infection (Fig. 3f).
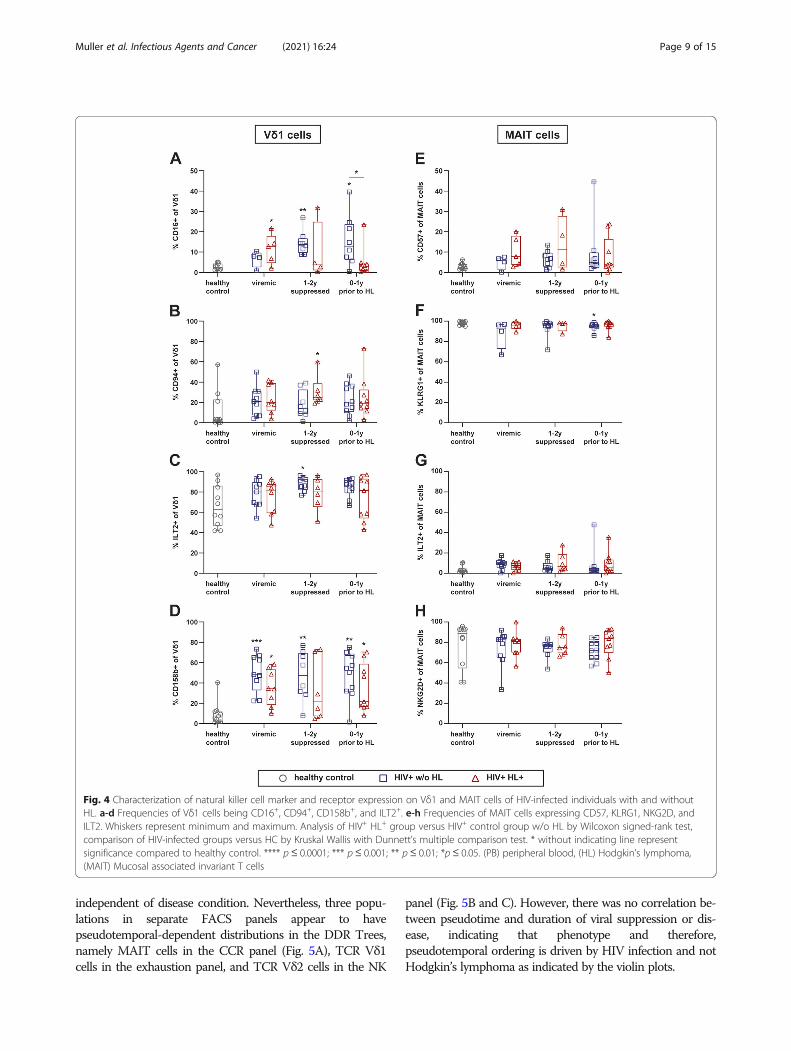
Characterization of natural killer cell markers expressionThe phenotype of TCR γδ and MAIT cells was furtherassessed by investigation of different natural killer (NK)cell-associated receptors. We detected a significantlyhigher frequency of CD16+ Vδ1 and Vδ2 cells in the PBof HIV+ w/o HL as compared to HC and to HIV+ HL+
at various time points (Fig. 4a and Supp. 1E). MAIT cellsdid not express CD16 (data not shown).The NK cell-associated receptors CD94 and ILT-2
were expressed by a substantial fraction of Vδ1 cellsupon HIV infection (Fig. 4b and c). The percentages ofCD94+ Vδ1 cells tended to remain elevated despite long-term cART (Fig. 4b). The inhibitory ILT2 receptor wasexpressed by the majority of TCR Vδ1 cells in HCs andthe frequency of these cells tended to increase furtherupon HIV infection (Fig. 4c). In contrast, only a smallfraction of MAIT cells were ILT-2+ (Fig. 4g).The frequencies of Vδ1 cells expressing inhibitory
killer cell immunoglobulin-like receptor (KIR) CD158bwere significantly increased upon HIV infection.
Frequencies of CD158b+ Vδ1 cells tended to be higherin HIV+ w/o HL individuals than in HIV+ HL+ patients(Fig. 4d). CD94 and CD158b expression was barely de-tectable on MAIT cells (data not shown). KLRG1 andNKG2D were expressed by the majority of MAIT cellsin HC and HIV+ individuals (Fig. 4f and h), but barelydetectable on Vδ1 cells.Taken together, these findings showed a long-term im-
pact of HIV-infection on the frequencies of TCR Vδ1cells expressing particular NK cell markers, and theirfrequencies remained even under successful cART.
Analyses of Vδ2 and the VδX cellsNotably, we also extracted the data for the TCR Vδ2and TCR VδX cells from our flow cytometric analyses(Suppl. Figures 1 and 2). The overall number of TCRVδ2 cells were rather limited, and the expression patternof TCR VδX did reveal only for a few significant differ-ences, thus we only present a subset of the data. Similarto the data in TCR Vδ1 cells, we observed a higher fre-quency of TCR Vδ2 cells with an activated phenotypeand with a decrease in the homing molecule CXCR3 inHIV infection (Suppl. Figure 1A and B). Notably, theTCR Vδ2 cells in patients w/o HL presented a higherfrequency of CD16+ and KLRG1+ cells as compared toHIV+ HL+ patients. In synopsis, HIV+ w/o HL havemore terminally differentiated cells (Suppl. Figure 1Fand G) and cells expressing CD16 (Suppl. Figure 1E)than HIV+ HL+ patients. We also observed similaritiesbetween TCR Vδ1 and VδX cells. Namely, the higherfrequency of CCR5+ cells in HIV+ w/o HL patients 1–2years suppression and prior to diagnosis and the in-creased frequencies of CD158b+ cells in viremic HIV+
w/o HL patients (Suppl. Figure 2A and D). Further,HIV-infected patients irrespective of HL presented lowerfrequencies of CCR6+ VδX at all times assessed (Suppl.Figure 2B) and CXCR4+ VδX cells during the viremicstate compared to healthy controls (Suppl. Figure 2C).Apart from those findings, the cell frequencies did notdiffer significantly between the three groups analyzed.
Clustering and phenotypic signature analysis of FACSpanelsTo identify discrete phenotypes within MAIT, TCR Vδx,Vδ1 or Vδ2 populations that distinguish or predict HLwithin HIV+ patients, we used PhenoGraph [74] forvisualization and clustering of high-dimensional FACSdata. We sought to identify clusters containing a highmajority of cells from HIV+ HL+ patients, indicating apopulation of cells specific to HIV+ HL+ vs. HIV+ w/oHL patients or HC. In general, the clustering analysis in-dicated that MAIT and TCR Vδx, Vδ1 or Vδ2 popula-tions in both HIV+ HL+ and HIV+ w/o HL patientsshared phenotypes and clustering is most likely driven
Muller et al. Infectious Agents and Cancer (2021) 16:24 Page 7 of 15

by differences caused by HIV infection and not HL(Suppl. Figures 3, 4, 5).Given the complexity of the clustering and difficulty in
identifying populations with phenotypic signaturesunique to HIV+ HL+ patients, we trained support vectormachine (SVM) classifier models to predict whether acell comes from HC, HIV+ HL+ or HIV+ w/o HL.Ideally, the probability distributions for the SVM’s pre-diction should show discrete peaks of high-probabilityfor each of the three groups (HIV+ HL+, HIV+ w/o HLand HC). Instead, we observed that in each populationthe probability curves for both HIV+ HL+ and HIV+ w/oHL predictions overlapped and the models yielded rela-tively poor predictions overall, suggesting that pheno-types in both groups were too similar to bedistinguished (Suppl. Figures 6, 7, 8) and no phenotypic
signatures could be attributed to HIV infection with orwithout HL.Since the data contained two time-variables (duration
of infection and duration of treatment), we nextattempted to establish whether there was any time-dependent effect on phenotypes. Therefore, we per-formed pseudotime analysis using DDRTree trained onthe expression data [73, 75](Suppl. Figures 9, 10, 11). Ifany time-dependent effects on the phenotype werepresent, a gradient in infection-duration or treatment-duration in relation to the predicted trajectories wouldhave been clearly observed. However, in agreement withthe clustering and SVM classifier, cells from HIV+ HL+
and HIV+ w/o HL patients and HC were generallyevenly distributed across the tree, indicating that thephenotype of these cell populations in these panels was
Fig. 3 Tissue homing receptor expression on Vδ1 and MAIT cells of HIV-infected individuals with and without HL. a-c Frequencies of Vδ1 cellsexpression CCR5, CXCR3, and CXCR4. d-f Frequencies of MAIT cells expression CCR5, CXCR4, and CCR6. Whiskers represent minimum andmaximum. Comparison of HIV-infected groups versus HC by Kruskal Wallis with Dunnett’s multiple comparison test. * without indicating linerepresent significance compared to healthy control. **** p≤ 0.0001; *** p≤ 0.001; ** p≤ 0.01; *p≤ 0.05. (PB) peripheral blood, (HL) Hodgkin’slymphoma, (MAIT) Mucosal associated invariant T cells
Muller et al. Infectious Agents and Cancer (2021) 16:24 Page 8 of 15
independent of disease condition. Nevertheless, three popu-lations in separate FACS panels appear to havepseudotemporal-dependent distributions in the DDR Trees,namely MAIT cells in the CCR panel (Fig. 5A), TCR Vδ1cells in the exhaustion panel, and TCR Vδ2 cells in the NK
panel (Fig. 5B and C). However, there was no correlation be-tween pseudotime and duration of viral suppression or dis-ease, indicating that phenotype and therefore,pseudotemporal ordering is driven by HIV infection and notHodgkin’s lymphoma as indicated by the violin plots.
Fig. 4 Characterization of natural killer cell marker and receptor expression on Vδ1 and MAIT cells of HIV-infected individuals with and withoutHL. a-d Frequencies of Vδ1 cells being CD16+, CD94+, CD158b+, and ILT2+. e-h Frequencies of MAIT cells expressing CD57, KLRG1, NKG2D, andILT2. Whiskers represent minimum and maximum. Analysis of HIV+ HL+ group versus HIV+ control group w/o HL by Wilcoxon signed-rank test,comparison of HIV-infected groups versus HC by Kruskal Wallis with Dunnett’s multiple comparison test. * without indicating line representsignificance compared to healthy control. **** p ≤ 0.0001; *** p≤ 0.001; ** p≤ 0.01; *p≤ 0.05. (PB) peripheral blood, (HL) Hodgkin’s lymphoma,(MAIT) Mucosal associated invariant T cells
Muller et al. Infectious Agents and Cancer (2021) 16:24 Page 9 of 15

DiscussionIn the present study, we investigated whether TCR γδand MAIT cells differ in HIV-infected individuals devel-oping HL from HIV-infected individuals, which
otherwise are healthy. The main findings were: i) an as-sociation of a lower CD4+ T cell count and HL risk 0–1year before HL diagnosis, and ii) prominent phenotypicchanges between HIV infected patients irrespective of
Fig. 5 Pseudotemporal ordering of MAIT, Vδ1 and Vδ2 populations. Data for each population, down-sampled evenly over patients, conditionsand time-points to 1e4 cells, was used to predict phenotype trajectories using DDRTree and Slingshot. Predicted trajectories, labelled within eachtree, show imbalanced distributions of cells from HC, HIV and HIV HL patients in response to CCR expression in MAIT cells (A), exhaustion markerexpression in Vδ1 (B) and NK marker expression in Vδ2 cells (C). Asterisks indicate significance of permutation tests (*** p < 0.001)
Muller et al. Infectious Agents and Cancer (2021) 16:24 Page 10 of 15
HL vs. HC. We observed subtle phenotypic changes inTCR Vδ1 and MAIT cells potentially going along with agreater functional impairment in HIV-infected individ-uals developing HL. However, clustering and SVM ana-lyses of the data did not identify the presence/loss ofunique cell populations associated with HL develop-ment. In fact the DDRtree algorithm also supported thatthe phenotypes observed was driven by HIV infectionand not by HL.Even though we screened the entire SHCS cohort, we
only identified a limited number of HIV-infected pa-tients developing HL. For each HIV+ HL+ patient, wehad a matched control.The CD4+ T-cell count, prior to cART, and its initial
increase in response to cART were similar in both HIV-infected patient groups. In contrast, the CD4+ T cellcounts 0–1 year prior to HL diagnosis were lower in pa-tients with HL. This is in line with studies by the FrenchHospital Database on HIV and Collaboration of Obser-vational HIV Epidemiological Research in Europe (CO-HERE), strengthening the potential of the CD4+ T cellcount as a surrogate marker to identify HIV+ patientswith a high risk to develop HL [17, 76–78]. The declinein the CD4+ T cell count might be explained by the se-questration of lymphocytes to the growing tumor, or bya lack of continuing T-cell recovery, which might resultin a lack of EBV-specific CD4+ T cells, which are im-portant for the immune surveillance of EBV-infection[79–83].In addition to the CD4+ T cell count, Powls et al. iden-
tified an association between the treatment with thenon-nucleoside reverse transcriptase inhibitor efavirenzand HL risk, whereas more recent investigations did notidentify an association between EFV and HL risk [84–86]. In our study, 6 out of 10 HIV+ HL+ patients re-ceived EFV versus 3 out of 10 of HIV-infected matchedcontrols. However, our sample size did not permit anyreasonable statistical analysis.We did not observe any difference of the overall frequency
of TCR γδ T or MAIT cells between HIV-infected patients± HL. The overall effect of HIV infection on γδ T cells inthe PB is in agreement with previous studies, reporting anexpansion of TCR Vδ1 cells and a decline of TCR Vδ2 cells,resulting in an inverted Vδ1/Vδ2 ratio [42, 44, 46], and lackof recovery of the altered Vδ1 and Vδ2 distribution uponcART [45]. Similarly, we found a non-reversible reduction ofMAIT cells in the PB as previously reported [64].As cell frequencies and total cell counts alone are not
sufficient to determine the involvement of each T cellpopulation in the disease progression, we performed adetailed phenotypic analysis of TCR γδ and MAIT cellsin our cohort. The phenotypic analysis comprised im-mune activation, exhaustion, homing, NK receptor aswell as inhibitory markers.
The longitudinal analysis of TCR Vδ1 cells expressingthe activation marker CD38 showed an HIV-associatedincrease similar to what is described for its expressionon TCR αβ cells, and in some studies on total TCR γδcells or on the TCR Vγ9Vδ2 population [87–93]. The in-crease in the frequency of CD69+ MAIT cells was verysubtle and in line with earlier observations [63–65, 94].The frequencies of TCR Vδ1 cells expressing the inhibi-tory receptors PD-1 and TIM-3 and of MAIT cells ex-pressing PD-1 were overall increased in HIV-infectedindividuals. Thus, we observed an activated and anexhausted phenotypic profile of these innate immunecells in HIV-infected patients. In fact, HIV-associated Tcell activation persists in all kinds of investigated T cellsubsets, even in successfully treated HIV-infected pa-tients without detectable viremia, and whether it ham-pers T cell functions and contributes to T cellimmunosenescence remains to be further investigated[95–97].We also investigated the homing capacities of TCR γδ
and MAIT cells in the same patient cohort by studyingthe expression pattern of CXCR3, CXCR4, CCR5 andCXCR6. The chemokine receptors CXCR3 and CCR5guide T cells to sites of infection, inflammation and tu-mors in response to chemokines released by inflamma-tory tissue and tumor cells [98–100]. CXCR4 isimportant for homing to the bone marrow [101], andCCR6 is also involved in regulating mucosal immunity,as well as homing of lymphatic cells to the gut mucosallymphoid tissue [102] and correlates with a Th17-likefunctional phenotype [55]. TCR γδ cells showed onlyminor differences between HIV+ patients and HC. In-stead, MAIT cells expressing CCR5 and CCR6 showedlower frequencies in HIV infection as compared to HCsand their frequencies remained significantly lower evenduring cART. These results suggest that MAIT cells inHIV-infected individuals might be compromised in theirability to produce IL-17 as well as their homing capacityto specific tissues and sites of inflammation as comparedto HCs [55, 103]. We noted a higher frequency of TCRVδ1 cell and MAIT cells expressing CCR5 and CXCR4,respectively, in HIV+ patients w/o HL as compared toHIV+ HL+ patients just prior to the diagnosis of HL.These findings might point to a particular dysfunction ofthose cells in the latter group.We next determined the frequency of cells expressing
NK markers and co-stimulatory or inhibitory receptors.A large number of TCR Vδ1 cells expressed CD16 inHIV+ w/o HL patients and their frequency was higher incART treated HIV+ w/o HL patients than in HIV+ HL+
patients. As CD16a is the Fcγ IIIa receptor involved inantibody dependent cytotoxicity and phagocytosis, theobserved discrepancy could point to a causal role in thepathogenesis of HL.
Muller et al. Infectious Agents and Cancer (2021) 16:24 Page 11 of 15

TCR Vδ1 cells expressing the inhibitory KIR moleculeCD158b also showed a higher frequency in HIV+ w/oHL patients compared to HC. Previous studies showed apotent inhibitory effect of KIR molecules on antigenstimulation of TCR γδ cells [104]. Furthermore, in HIV-infected patients an upregulation of KIR expression onCD8+ T cells was found, which inhibited their TCR-dependent stimulation [105].When we performed clustering of high-dimensional
FACS data, we found a similar distribution in HIV+ w/oHL and HIV+ HL+ individuals of all TCR γδ populationsand MAIT cells. Notably, different clustering was insteadobserved in healthy controls, thus indicating that the ob-served differences are driven by differences caused byHIV infection and not HL. The analysis performed witha support vector machine classifier also showed overlap-ping probability curves for both HIV+ w/o HL and HIV+
HL+ patients. Clear differences were instead observedbetween HIV-infected and HC and only for the TCRVδ1 population. Finally, when we analyzed a possibletime-dependent effect on phenotypes, we did not see dif-ferences between the two groups of HIV+-patients, con-firming the SVM analysis.In conclusion, our study provides additional evidence
for the ambiguous lower CD4+ cell counts just prior toHL as compared to their matched controls even thoughpatients were treated successfully with cART. Our re-sults showed subtle differences between populations ofTCR γδ and MAIT cells in HIV+-patients with vs. with-out HL. To what extent these subtle differences contrib-ute to the pathogenesis of HL remains unknown. Futurestudies need to address their potential role in the devel-opment of NADCs in HIV-infected individuals, andwhether they might be exploited in novel types of celltherapy.
AbbreviationsADCs: AIDS defining cancers; cART: Combined anti-retroviral treatment;HC: Healthy controls; HL: Hodgkin’s lymphoma; MAIT cells: Mucosal-associated invariant T-cells; NADCs: Non-AIDS defining cancers; NKcells: Natural killer cells; PB: Peripheral blood; PBMC: Peripheral bloodmononuclear cell; PBS: Phosphate buffered saline; SHCS: Swiss HIV CohortStudy; SVM: Support vector machine; TCR: T-cell receptor
Supplementary InformationThe online version contains supplementary material available at https://doi.org/10.1186/s13027-021-00365-4.
Additional file 1.
AcknowledgmentsWe thank Sandra Chaudron for extracting and providing patient data fromthe SHCS databank. We thank Stephan Benke for support in panel designand data analysis and Stefan Kuster for support in statistical analysis.Members of the Swiss HIV Cohort Study:Aebi-Popp K, Anagnostopoulos A, Battegay M, Bernasconi E, Böni J, BraunDL, Bucher HC, Calmy A, Cavassini M, Ciuffi A, Dollenmaier G, Egger M, Elzi L,Fehr J, Fellay J, Furrer H, Fux CA, Günthard HF (President of the SHCS), Haerry
D (deputy of “Positive Council”), Hasse B, Hirsch HH, Hoffmann M, Hösli I,Huber M, Kahlert CR (Chairman of the Mother & Child Substudy), Kaiser L,Keiser O, Klimkait T, Kouyos RD, Kovari H, Ledergerber B, Martinetti G,Martinez de Tejada B, Marzolini C, Metzner KJ, Müller N, Nicca D, Paioni P,Pantaleo G, Perreau M, Rauch A (Chairman of the Scientific Board), Rudin C,Scherrer AU (Head of Data Centre), Schmid P, Speck R, Stöckle M (Chairmanof the Clinical and Laboratory Committee), Tarr P, Trkola A, Vernazza P,Wandeler G, Weber R, Yerly S.
DisclaimerThe founders had no role in the study design, data collection, analysis andinterpretation of the data, writing of the manuscript and the decision tosubmit for publication.
Authors’ contributionsThe study was conceptualized, designed by R.F.S. A.A, GL and MB. R.F.S.supervised the study. A.A. and C.K.S.M. designed polychromatic panels. A.A.,A.U.S., and C.K.S.M., identified patient samples within the SHCS database.Data acquisition was done by D.R. and C.K.S.M. MH and RK provided criticalinput into the overall concept. Data analysis and first draft of manuscript byC.K.S.M., J.S., RK, and A.C. G.L. and R.F.S. reviewed manuscript. The authorsread and approved the final manuscript.
FundingThis study has been financed within the framework of the Swiss HIV CohortStudy, supported by the Swiss National Science Foundation (grant #177499),by SHCS project #804 and by the SHCS research foundation. The data aregathered by the Five Swiss University Hospitals, two Cantonal Hospitals, 15affiliated hospitals and 36 private physicians (listed in Http://www.shcs.ch/180-health-care-providers). We thank the healthy volunteers for donatingblood.
Availability of data and materialsThe SHCS (www.shcs.ch) is a prospective cohort study with ongoingenrollment of HIV-infected adults in Switzerland since 1988 [66]. It includes73% of all diagnosed HIV-infections in Switzerland [67]. Representation hasremained stable throughout the study duration. Detailed information ondemographics, mode of HIV acquisition, risk behavior, clinical events, co-infections, and treatment is collected using a standard protocol at registra-tion and at intervals of 6 months. Plasma samples are collected every 6–12months in all study participants.
Declarations
Ethics approval and consent to participateLocal ethical committees of all participating study sites approved the study,i.e., the ethical committee of both Basel, Berne (21/88), Geneva (01–142),Canton de Vaud (131/01), Ticino (CE 813); St. Gallen (EKSG 12/003) andZurich (KEK-ZH-NR: EK-793) (http://www.shcs.ch/206-ethic-committee-approval-and-informed-consent) and written consent was obtained from allparticipants.
Consent for publicationAll authors consented for the publication.
Competing interestsThe authors declare that they have no competing interests.
Author details1Department of Infectious Diseases and Hospital Epidemiology, UniversityHospital of Zurich, University of Zurich, Zurich, Switzerland. 2Department ofInfectious Diseases and Hospital Hygiene, University Hospital of Basel, Basel,Switzerland. 3Institute of Medical Virology, University of Zurich, Zurich,Switzerland. 4Division of Infectious Diseases and Infection Control, CantonalHospital, St. Gallen, Switzerland.
Muller et al. Infectious Agents and Cancer (2021) 16:24 Page 12 of 15

Received: 14 December 2020 Accepted: 8 April 2021
References1. Palella FJ Jr, et al. Declining morbidity and mortality among patients with
advanced human immunodeficiency virus infection. HIV Outpatient StudyInvestigators. N Engl J Med. 1998;338(13):853–60.
2. Ledergerber B, Egger M, Erard V, Weber R, Hirschel B, Furrer H, et al. AIDS-related opportunistic illnesses occurring after initiation of potentantiretroviral therapy: the Swiss HIV cohort study. JAMA. 1999;282(23):2220–6. https://doi.org/10.1001/jama.282.23.2220.
3. Gueler A, Moser A, Calmy A, Günthard HF, Bernasconi E, Furrer H, et al. Lifeexpectancy in HIV-positive persons in Switzerland: matched comparisonwith general population. AIDS. 2017;31(3):427–36. https://doi.org/10.1097/QAD.0000000000001335.
4. Egger M, et al. Impact of new antiretroviral combination therapies in HIVinfected patients in Switzerland: prospective multicentre study. Swiss HIVCohort Study. BMJ. 1997;315(7117):1194–9.
5. Ledergerber B, Telenti A, Egger M. Risk of HIV related Kaposi's sarcoma andnon-Hodgkin's lymphoma with potent antiretroviral therapy: prospectivecohort study. Swiss HIV Cohort Study. BMJ. 1999;319(7201):23–4.
6. International Collaboration on, H.I.V. and Cancer. Highly active antiretroviraltherapy and incidence of cancer in human immunodeficiency virus-infectedadults. J Natl Cancer Inst. 2000;92(22):1823–30.
7. Jacobson LP, et al. Impact of potent antiretroviral therapy on the incidenceof Kaposi's sarcoma and non-Hodgkin's lymphomas among HIV-1-infectedindividuals. Multicenter AIDS Cohort Study. J Acquir Immune Defic Syndr.1999;21(Suppl 1):S34–41.
8. Bonnet F, Lewden C, May T, Heripret L, Jougla E, Bevilacqua S, et al.Malignancy-related causes of death in human immunodeficiency virus-infected patients in the era of highly active antiretroviral therapy. Cancer.2004;101(2):317–24. https://doi.org/10.1002/cncr.20354.
9. Bower M, Palmieri C, Dhillon T. AIDS-related malignancies: changingepidemiology and the impact of highly active antiretroviral therapy. CurrOpin Infect Dis. 2006;19(1):14–9. https://doi.org/10.1097/01.qco.0000200295.30285.13.
10. Grulich AE, van Leeuwen MT, Falster MO, Vajdic CM. Incidence of cancers inpeople with HIV/AIDS compared with immunosuppressed transplantrecipients: a meta-analysis. Lancet. 2007;370(9581):59–67. https://doi.org/10.1016/S0140-6736(07)61050-2.
11. Deeken JF, Tjen-A-Looi A, Rudek MA, Okuliar C, Young M, Little RF, et al. Therising challenge of non-AIDS-defining cancers in HIV-infected patients. ClinInfect Dis. 2012;55(9):1228–35. https://doi.org/10.1093/cid/cis613.
12. Palella FJ Jr, et al. Mortality in the highly active antiretroviral therapy era:changing causes of death and disease in the HIV outpatient study. J AcquirImmune Defic Syndr. 2006;43(1):27–34. https://doi.org/10.1097/01.qai.0000233310.90484.16.
13. Brugnaro P, Morelli E, Cattelan F, Petrucci A, Panese S, Eseme F, et al. Non-AIDS definings malignancies among human immunodeficiency virus-positive subjects: epidemiology and outcome after two decades of HAARTera. World J Virol. 2015;4(3):209–18. https://doi.org/10.5501/wjv.v4.i3.209.
14. Cobucci RN, et al. Assessing the impact of HAART on the incidence ofdefining and non-defining AIDS cancers among patients with HIV/AIDS: asystematic review. J Infect Public Health. 2015;8(1):1–10. https://doi.org/10.1016/j.jiph.2014.08.003.
15. Newnham A, Harris J, Evans HS, Evans BG, Møller H. The risk of cancer inHIV-infected people in Southeast England: a cohort study. Br J Cancer. 2005;92(1):194–200. https://doi.org/10.1038/sj.bjc.6602273.
16. Grulich AE, Li Y, McDonald A, Correll PKL, Law MG, Kaldor JM. Rates of non-AIDS-defining cancers in people with HIV infection before and after AIDSdiagnosis. AIDS. 2002;16(8):1155–61. https://doi.org/10.1097/00002030-200205240-00009.
17. Clifford GM, Rickenbach M, Lise M, Dal Maso L, Battegay M, Bohlius J, et al.Hodgkin lymphoma in the Swiss HIV cohort study. Blood. 2009;113(23):5737–42. https://doi.org/10.1182/blood-2009-02-204172.
18. Boffetta P, Hashibe M. Alcohol and cancer. Lancet Oncol. 2006;7(2):149–56.https://doi.org/10.1016/S1470-2045(06)70577-0.
19. Clifford GM, Polesel J, Rickenbach M, on behalf of the Swiss HIV CohortStudy, Dal Maso L, Keiser O, et al. Cancer risk in the Swiss HIV cohort study:associations with immunodeficiency, smoking, and highly active
antiretroviral therapy. J Natl Cancer Inst. 2005;97(6):425–32. https://doi.org/10.1093/jnci/dji072.
20. Deeks SG, Phillips AN. HIV infection, antiretroviral treatment, ageing, andnon-AIDS related morbidity. BMJ. 2009;338(jan26 2):a3172. https://doi.org/10.1136/bmj.a3172.
21. Bedimo RJ, McGinnis KA, Dunlap M, Rodriguez-Barradas MC, Justice AC.Incidence of non-AIDS-defining malignancies in HIV-infected versusnoninfected patients in the HAART era: impact of immunosuppression. JAcquir Immune Defic Syndr. 2009;52(2):203–8. https://doi.org/10.1097/QAI.0b013e3181b033ab.
22. Franzetti M, Adorni F, Parravicini C, Vergani B, Antinori S, Milazzo L, et al.Trends and predictors of non-AIDS-defining cancers in men and womenwith HIV infection: a single-institution retrospective study before and afterthe introduction of HAART. J Acquir Immune Defic Syndr. 2013;62(4):414–20.https://doi.org/10.1097/QAI.0b013e318282a189.
23. Silverberg MJ, Chao C, Leyden WA, Xu L, Horberg MA, Klein D, et al. HIVinfection, immunodeficiency, viral replication, and the risk of cancer. CancerEpidemiol Biomark Prev. 2011;20(12):2551–9. https://doi.org/10.1158/1055-9965.EPI-11-0777.
24. Dolcetti R, Boiocchi M, Gloghini A, Carbone A. Pathogenetic andhistogenetic features of HIV-associated Hodgkin's disease. Eur J Cancer.2001;37(10):1276–87. https://doi.org/10.1016/S0959-8049(01)00105-8.
25. Biggar RJ, Jaffe ES, Goedert JJ, Chaturvedi A, Pfeiffer R, Engels EA, et al.Hodgkin lymphoma and immunodeficiency in persons with HIV/AIDS.Blood. 2006;108(12):3786–91. https://doi.org/10.1182/blood-2006-05-024109.
26. Hasenclever D, Diehl V. A prognostic score for advanced Hodgkin's disease.International prognostic factors project on advanced Hodgkin's disease. NEngl J Med. 1998;339(21):1506–14. https://doi.org/10.1056/NEJM199811193392104.
27. Franzetti M, Ricci E, Bonfanti P. The pattern of non-AIDS-defining cancers inthe HIV population: epidemiology, risk factors and prognosis. A review. CurrHIV Res. 2019;17(1):1–12. https://doi.org/10.2174/1570162X17666190327153038.
28. Shiels MS, Islam JY, Rosenberg PS, Hall HI, Jacobson E, Engels EA. ProjectedCancer incidence rates and burden of incident Cancer cases in HIV-infectedadults in the United States through 2030. Ann Intern Med. 2018;168(12):866–73. https://doi.org/10.7326/M17-2499.
29. Cornejo-Juarez P, Cavildo-Jeronimo D, Volkow-Fernandez P. Non-AIDSdefining cancer (NADC) among HIV-infected patients at an oncologytertiary-care center in Mexico. AIDS Res Ther. 2018;15(1):16. https://doi.org/10.1186/s12981-018-0202-2.
30. Prosperi MC, Cozzi-Lepri A, Castagna A, Mussini C, Murri R, Giacometti A,et al. Incidence of malignancies in HIV-infected patients and prognostic roleof current CD4 cell count: evidence from a large Italian cohort study. ClinInfect Dis. 2010;50(9):1316–21. https://doi.org/10.1086/651688.
31. Franceschi S, et al. Kaposi sarcoma incidence in the Swiss HIV cohort studybefore and after highly active antiretroviral therapy. Br J Cancer. 2008;99(5):800–4. https://doi.org/10.1038/sj.bjc.6604520.
32. Polesel J, Clifford GM, Rickenbach M, Dal Maso L, Battegay M, Bouchardy C,et al. Non-Hodgkin lymphoma incidence in the Swiss HIV cohort studybefore and after highly active antiretroviral therapy. AIDS. 2008;22(2):301–6.https://doi.org/10.1097/QAD.0b013e3282f2705d.
33. Group, T.A.S, et al. A trial of early Antiretrovirals and isoniazid preventivetherapy in Africa. N Engl J Med. 2015;373(9):808–22.
34. Group, I.S.S, et al. Initiation of antiretroviral therapy in early asymptomaticHIV infection. N Engl J Med. 2015;373(9):795–807.
35. Borges AH, Neuhaus J, Babiker AG, Henry K, Jain MK, Palfreeman A, et al.Immediate antiretroviral therapy reduces risk of infection-related Cancerduring early HIV infection. Clin Infect Dis. 2016;63(12):1668–76. https://doi.org/10.1093/cid/ciw621.
36. Bonneville M, O'Brien RL, Born WK. Gammadelta T cell effector functions: ablend of innate programming and acquired plasticity. Nat Rev Immunol.2010;10(7):467–78. https://doi.org/10.1038/nri2781.
37. Napier RJ, et al. The role of mucosal associated invariant T cells inantimicrobial immunity. Front Immunol. 2015;6:344.
38. Zheng J, Liu Y, Lau YL, Tu W. Gammadelta-T cells: an unpolished sword inhuman anti-infection immunity. Cell Mol Immunol. 2013;10(1):50–7. https://doi.org/10.1038/cmi.2012.43.
39. Mori L, Lepore M, De Libero G. The immunology of CD1- and MR1-restricted T cells. Annu Rev Immunol. 2016;34(1):479–510. https://doi.org/10.1146/annurev-immunol-032414-112008.
Muller et al. Infectious Agents and Cancer (2021) 16:24 Page 13 of 15
40. Balbi B, Valle MT, Oddera S, Giunti O, Manca F, Rossi GA, et al. T-lymphocytes with gamma delta+ V delta 2+ antigen receptors are presentin increased proportions in a fraction of patients with tuberculosis or withsarcoidosis. Am Rev Respir Dis. 1993;148(6 Pt 1):1685–90. https://doi.org/10.1164/ajrccm/148.6_Pt_1.1685.
41. Chien YH, Meyer C, Bonneville M. gammadelta T cells: first line of defenseand beyond. Annu Rev Immunol. 2014;32(1):121–55. https://doi.org/10.1146/annurev-immunol-032713-120216.
42. De Maria A, et al. Selective increase of a subset of T cell receptor gammadelta T lymphocytes in the peripheral blood of patients with humanimmunodeficiency virus type 1 infection. J Infect Dis. 1992;165(5):917–9.https://doi.org/10.1093/infdis/165.5.917.
43. Kalyan S, Kabelitz D. Defining the nature of human gammadelta T cells: abiographical sketch of the highly empathetic. Cell Mol Immunol. 2013;10(1):21–9. https://doi.org/10.1038/cmi.2012.44.
44. Autran B, Triebel F, Katlama C, Rozenbaum W, Hercend T, Debre P. T cellreceptor gamma/delta+ lymphocyte subsets during HIV infection. Clin ExpImmunol. 1989;75(2):206–10.
45. Poles MA, Barsoum S, Yu W, Yu J, Sun P, Daly J, et al. Humanimmunodeficiency virus type 1 induces persistent changes in mucosal andblood gammadelta T cells despite suppressive therapy. J Virol. 2003;77(19):10456–67. https://doi.org/10.1128/JVI.77.19.10456-10467.2003.
46. De Paoli P, et al. A subset of gamma delta lymphocytes is increased duringHIV-1 infection. Clin Exp Immunol. 1991;83(2):187–91. https://doi.org/10.1111/j.1365-2249.1991.tb05612.x.
47. Hermier F, Comby E, Delaunay A, Petitjean J, Favennec L, Bazin C, et al.Decreased blood TcR gamma delta+ lymphocytes in AIDS and p24-antigenemic HIV-1-infected patients. Clin Immunol Immunopathol. 1993;69(2):248–50. https://doi.org/10.1006/clin.1993.1176.
48. Vantourout P, Hayday A. Six-of-the-best: unique contributions ofgammadelta T cells to immunology. Nat Rev Immunol. 2013;13(2):88–100.https://doi.org/10.1038/nri3384.
49. Morita CT, Verma S, Aparicio P, Martinez-A. C, Spits H, Brenner MB.Functionally distinct subsets of human gamma/delta T cells. Eur J Immunol.1991;21(12):2999–3007. https://doi.org/10.1002/eji.1830211215.
50. Fenoglio D, Poggi A, Catellani S, Battaglia F, Ferrera A, Setti M, et al. Vdelta1T lymphocytes producing IFN-gamma and IL-17 are expanded in HIV-1-infected patients and respond to Candida albicans. Blood. 2009;113(26):6611–8. https://doi.org/10.1182/blood-2009-01-198028.
51. Wallace M, et al. Gamma delta T lymphocyte responses to HIV. Clin ExpImmunol. 1996;103(2):177–84. https://doi.org/10.1046/j.1365-2249.1996.d01-625.x.
52. Silva-Santos B, Serre K, Norell H. gammadelta T cells in cancer. Nat RevImmunol. 2015;15(11):683–91. https://doi.org/10.1038/nri3904.
53. Zhao Y, Niu C, Cui J. Gamma-delta (gammadelta) T cells: friend or foe incancer development? J Transl Med. 2018;16(1):3. https://doi.org/10.1186/s12967-017-1378-2.
54. Wu D, Wu P, Qiu F, Wei Q, Huang J. Human gammadeltaT-cell subsets andtheir involvement in tumor immunity. Cell Mol Immunol. 2017;14(3):245–53.https://doi.org/10.1038/cmi.2016.55.
55. Dusseaux M, Martin E, Serriari N, Péguillet I, Premel V, Louis D, et al. HumanMAIT cells are xenobiotic-resistant, tissue-targeted, CD161hi IL-17-secretingT cells. Blood. 2011;117(4):1250–9. https://doi.org/10.1182/blood-2010-08-303339.
56. Martin E, Treiner E, Duban L, Guerri L, Laude H, Toly C, et al. Stepwisedevelopment of MAIT cells in mouse and human. PLoS Biol. 2009;7(3):e54.https://doi.org/10.1371/journal.pbio.1000054.
57. Treiner E, Duban L, Bahram S, Radosavljevic M, Wanner V, Tilloy F, et al.Selection of evolutionarily conserved mucosal-associated invariant T cells byMR1. Nature. 2003;422(6928):164–9. https://doi.org/10.1038/nature01433.
58. Vacchini A, Chancellor A, Spagnuolo J, Mori L, de Libero G. MR1-restricted Tcells are unprecedented Cancer fighters. Front Immunol. 2020;11:751.https://doi.org/10.3389/fimmu.2020.00751.
59. Lepore M, Kalinichenko A, Colone A, Paleja B, Singhal A, Tschumi A, et al.Parallel T-cell cloning and deep sequencing of human MAIT cells revealstable oligoclonal TCRbeta repertoire. Nat Commun. 2014;5(1):3866. https://doi.org/10.1038/ncomms4866.
60. Reantragoon R, Kjer-Nielsen L, Patel O, Chen Z, Illing PT, Bhati M, et al.Structural insight into MR1-mediated recognition of the mucosal associatedinvariant T cell receptor. J Exp Med. 2012;209(4):761–74. https://doi.org/10.1084/jem.20112095.
61. Kurioka A, Ussher JE, Cosgrove C, Clough C, Fergusson JR, Smith K, et al.MAIT cells are licensed through granzyme exchange to kill bacteriallysensitized targets. Mucosal Immunol. 2015;8(2):429–40. https://doi.org/10.1038/mi.2014.81.
62. Sundstrom P, et al. Tumor-infiltrating mucosal-associated invariant T (MAIT)cells retain expression of cytotoxic effector molecules. Oncotarget. 2019;10(29):2810–23. https://doi.org/10.18632/oncotarget.26866.
63. Cosgrove C, Ussher JE, Rauch A, Gärtner K, Kurioka A, Hühn MH, et al. Earlyand nonreversible decrease of CD161++ /MAIT cells in HIV infection. Blood.2013;121(6):951–61. https://doi.org/10.1182/blood-2012-06-436436.
64. Eberhard JM, Hartjen P, Kummer S, Schmidt RE, Bockhorn M, Lehmann C,et al. CD161+ MAIT cells are severely reduced in peripheral blood andlymph nodes of HIV-infected individuals independently of diseaseprogression. PLoS One. 2014;9(11):e111323. https://doi.org/10.1371/journal.pone.0111323.
65. Leeansyah E, Ganesh A, Quigley MF, Sönnerborg A, Andersson J, Hunt PW,et al. Activation, exhaustion, and persistent decline of the antimicrobialMR1-restricted MAIT-cell population in chronic HIV-1 infection. Blood. 2013;121(7):1124–35. https://doi.org/10.1182/blood-2012-07-445429.
66. Swiss HIVCS, et al. Cohort profile: the Swiss HIV cohort study. Int JEpidemiol. 2010;39(5):1179–89.
67. Kohler P, Schmidt AJ, Cavassini M, Furrer H, Calmy A, Battegay M, et al. TheHIV care cascade in Switzerland: reaching the UNAIDS/WHO targets forpatients diagnosed with HIV. AIDS. 2015;29(18):2509–15. https://doi.org/10.1097/QAD.0000000000000878.
68. R Development Core Team. R: A language and environment for statisticalcomputing. Vienna: R Foundation for Statistical Computing; 2010.
69. Chen H. Rphenograph: R implementation of the phenograph algorithm;2015.
70. Kuhn M. caret: Classification and Regression Training; 2020.71. Meyer DD, Evgenia, Hornik K, Weingessel A, Leisch F. e1071: Misc Functions
of the Department of Statistics, Probability Theory Group (Formerly: E1071):TU Wien; 2019. https://www.scienceopen.com/document?vid=fc1a25fa-4c7b-4b91-a707-1ce7ce33659e.
72. Qiu XT, Cole, Mao Q, Wang L. DDRTree: Learning Principal Graphs withDDRTree; 2017.
73. Street K, Risso D, Fletcher RB, Das D, Ngai J, Yosef N, et al. Slingshot: celllineage and pseudotime inference for single-cell transcriptomics. BMCGenomics. 2018;19(1):477. https://doi.org/10.1186/s12864-018-4772-0.
74. Levine JH, Simonds EF, Bendall SC, Davis KL, Amir EAD, Tadmor MD, et al.Data-driven phenotypic dissection of AML reveals progenitor-like cells thatcorrelate with prognosis. Cell. 2015;162(1):184–97. https://doi.org/10.1016/j.cell.2015.05.047.
75. Mao Q, et al. Dimensionality Reduction Via Graph Structure Learning. In:Proceedings of the 21th ACM SIGKDD International Conference onKnowledge Discovery and Data Mining; 2015. p. 765–74.
76. Bohlius J, Schmidlin K, Boué F, Fätkenheuer G, May M, Caro-Murillo AM,et al. HIV-1-related Hodgkin lymphoma in the era of combinationantiretroviral therapy: incidence and evolution of CD4(+) T-cell lymphocytes.Blood. 2011;117(23):6100–8. https://doi.org/10.1182/blood-2010-08-301531.
77. Guiguet M, Boué F, Cadranel J, Lang JM, Rosenthal E, Costagliola D, et al. Effectof immunodeficiency, HIV viral load, and antiretroviral therapy on the risk ofindividual malignancies (FHDH-ANRS CO4): a prospective cohort study. LancetOncol. 2009;10(12):1152–9. https://doi.org/10.1016/S1470-2045(09)70282-7.
78. Shepherd L, Ryom L, Law M, Hatleberg CI, de Wit S, Monforte A'A, et al.Differences in Virological and immunological risk factors for non-Hodgkinand Hodgkin lymphoma. J Natl Cancer Inst. 2018;110(6):598–607. https://doi.org/10.1093/jnci/djx249.
79. Bickham K, Münz C, Tsang ML, Larsson M, Fonteneau JF, Bhardwaj N, et al.EBNA1-specific CD4+ T cells in healthy carriers of Epstein-Barr virus areprimarily Th1 in function. J Clin Invest. 2001;107(1):121–30. https://doi.org/10.1172/JCI10209.
80. Murray RJ, Kurilla MG, Brooks JM, Thomas WA, Rowe M, Kieff E, et al. Identification oftarget antigens for the human cytotoxic T cell response to Epstein-Barr virus (EBV):implications for the immune control of EBV-positive malignancies. J Exp Med. 1992;176(1):157–68. https://doi.org/10.1084/jem.176.1.157.
81. Rickinson AB, Moss DJ. Human cytotoxic T lymphocyte responses toEpstein-Barr virus infection. Annu Rev Immunol. 1997;15(1):405–31. https://doi.org/10.1146/annurev.immunol.15.1.405.
82. Romagnani S, del Prete G, Maggi E, Bosi A, Bernardi F, Ponticelli P, et al.Displacement of T lymphocytes with the 'Helper/Inducer' phenotype from
Muller et al. Infectious Agents and Cancer (2021) 16:24 Page 14 of 15
peripheral blood to lymphoid organs in untreated patients with Hodgkin'sdisease. Scand J Haematol. 1983;31(4):305–14. https://doi.org/10.1111/j.1600-0609.1983.tb00658.x.
83. van den Berg A, Visser L, Poppema S. High expression of the CC chemokineTARC in reed-Sternberg cells. A possible explanation for the characteristic T-cell infiltratein Hodgkin's lymphoma. Am J Pathol. 1999;154(6):1685–91.https://doi.org/10.1016/S0002-9440(10)65424-7.
84. Powles T, Robinson D, Stebbing J, Shamash J, Nelson M, Gazzard B, et al.Highly active antiretroviral therapy and the incidence of non-AIDS-definingcancers in people with HIV infection. J Clin Oncol. 2009;27(6):884–90.https://doi.org/10.1200/JCO.2008.19.6626.
85. Chao C, Leyden WA, Xu L, Horberg MA, Klein D, Towner WJ, et al. Exposureto antiretroviral therapy and risk of cancer in HIV-infected persons. AIDS.2012;26(17):2223–31. https://doi.org/10.1097/QAD.0b013e32835935b3.
86. Krishnan S, Schouten JT, Jacobson DL, Benson CA, Collier AC, Koletar SL,et al. Incidence of non-AIDS-defining cancer in antiretroviral treatment-naive subjects after antiretroviral treatment initiation: an ACTG longitudinallinked randomized trials analysis. Oncology. 2011;80(1–2):42–9. https://doi.org/10.1159/000328032.
87. Day CL, Kaufmann DE, Kiepiela P, Brown JA, Moodley ES, Reddy S, et al. PD-1 expression on HIV-specific T cells is associated with T-cell exhaustion anddisease progression. Nature. 2006;443(7109):350–4. https://doi.org/10.1038/nature05115.
88. Paiardini M, Muller-Trutwin M. HIV-associated chronic immune activation.Immunol Rev. 2013;254(1):78–101. https://doi.org/10.1111/imr.12079.
89. Jones RB, Ndhlovu LC, Barbour JD, Sheth PM, Jha AR, Long BR, et al. Tim-3expression defines a novel population of dysfunctional T cells with highlyelevated frequencies in progressive HIV-1 infection. J Exp Med. 2008;205(12):2763–79. https://doi.org/10.1084/jem.20081398.
90. Belkina AC, Starchenko A, Drake KA, Proctor EA, Pihl RMF, Olson A, et al.Multivariate computational analysis of Gamma Delta T cell inhibitoryreceptor signatures reveals the divergence of healthy and ART-suppressedHIV+ aging. Front Immunol. 2018;9:2783. https://doi.org/10.3389/fimmu.2018.02783.
91. Iwasaki M, Tanaka Y, Kobayashi H, Murata-Hirai K, Miyabe H, Sugie T, et al.Expression and function of PD-1 in human gammadelta T cells thatrecognize phosphoantigens. Eur J Immunol. 2011;41(2):345–55. https://doi.org/10.1002/eji.201040959.
92. Jouen-Beades F, Gilbert D, Ramzaoui S, Borsa-Lebas F, Humbert G, Tron F.Similarity of expression of activation markers and CD28 on gamma deltaand alpha beta-receptor T cells in HIV infection. Clin ImmunolImmunopathol. 1996;79(2):189–93. https://doi.org/10.1006/clin.1996.0066.
93. Bhatnagar N, Girard PM, Lopez-Gonzalez M, Didier C, Collias L, Jung C, et al.Potential role of Vdelta2(+) gammadelta T cells in regulation of immuneactivation in primary HIV infection. Front Immunol. 2017;8:1189. https://doi.org/10.3389/fimmu.2017.01189.
94. Saeidi A, et al. Attrition of TCR Valpha7.2+ CD161++ MAIT cells in HIV-tuberculosis co-infection is associated with elevated levels of PD-1expression. PLoS One. 2015;10(4):e0124659.
95. Jain V, Hartogensis W, Bacchetti P, Hunt PW, Hatano H, Sinclair E, et al.Antiretroviral therapy initiated within 6 months of HIV infection isassociated with lower T-cell activation and smaller HIV reservoir size. J InfectDis. 2013;208(8):1202–11. https://doi.org/10.1093/infdis/jit311.
96. Vinikoor MJ, Cope A, Gay CL, Ferrari G, McGee KS, Kuruc JD, et al.Antiretroviral therapy initiated during acute HIV infection fails to preventpersistent T-cell activation. J Acquir Immune Defic Syndr. 2013;62(5):505–8.https://doi.org/10.1097/QAI.0b013e318285cd33.
97. Sokoya T, et al. HIV as a cause of immune activation andImmunosenescence. Mediat Inflamm. 2017;2017:6825493.
98. Moser B, Loetscher P. Lymphocyte traffic control by chemokines. NatImmunol. 2001;2(2):123–8. https://doi.org/10.1038/84219.
99. Proost P, Wuyts A, van Damme J. The role of chemokines in inflammation.Int J Clin Lab Res. 1996;26(4):211–23. https://doi.org/10.1007/BF02602952.
100. Spagnolo P, Renzoni EA, Wells AU, Copley SJ, Desai SR, Sato H, et al. C-Cchemokine receptor 5 gene variants in relation to lung disease insarcoidosis. Am J Respir Crit Care Med. 2005;172(6):721–8. https://doi.org/10.1164/rccm.200412-1707OC.
101. Burger JA, Burkle A. The CXCR4 chemokine receptor in acute and chronicleukaemia: a marrow homing receptor and potential therapeutic target. Br JHaematol. 2007;137(4):288–96. https://doi.org/10.1111/j.1365-2141.2007.06590.x.
102. Ito T, Carson WF IV, Cavassani KA, Connett JM, Kunkel SL. CCR6 as amediator of immunity in the lung and gut. Exp Cell Res. 2011;317(5):613–9.https://doi.org/10.1016/j.yexcr.2010.12.018.
103. Billerbeck E, Kang YH, Walker L, Lockstone H, Grafmueller S, Fleming V, et al.Analysis of CD161 expression on human CD8+ T cells defines a distinctfunctional subset with tissue-homing properties. Proc Natl Acad Sci U S A.2010;107(7):3006–11. https://doi.org/10.1073/pnas.0914839107.
104. Carena I, Shamshiev A, Donda A, Colonna M, Libero GD. Majorhistocompatibility complex class I molecules modulate activation thresholdand early signaling of T cell antigen receptor-gamma/delta stimulated bynonpeptidic ligands. J Exp Med. 1997;186(10):1769–74. https://doi.org/10.1084/jem.186.10.1769.
105. Alter G, Rihn S, Streeck H, Teigen N, Piechocka-Trocha A, Moss K, et al.Ligand-independent exhaustion of killer immunoglobulin-like receptor-positive CD8+ T cells in human immunodeficiency virus type 1 infection. JVirol. 2008;82(19):9668–77. https://doi.org/10.1128/JVI.00341-08.
Publisher’s NoteSpringer Nature remains neutral with regard to jurisdictional claims inpublished maps and institutional affiliations.
Muller et al. Infectious Agents and Cancer (2021) 16:24 Page 15 of 15