Conformational changes within the HLA‐A1: MAGE‐A1 complex induced by binding of a recombinant...
13
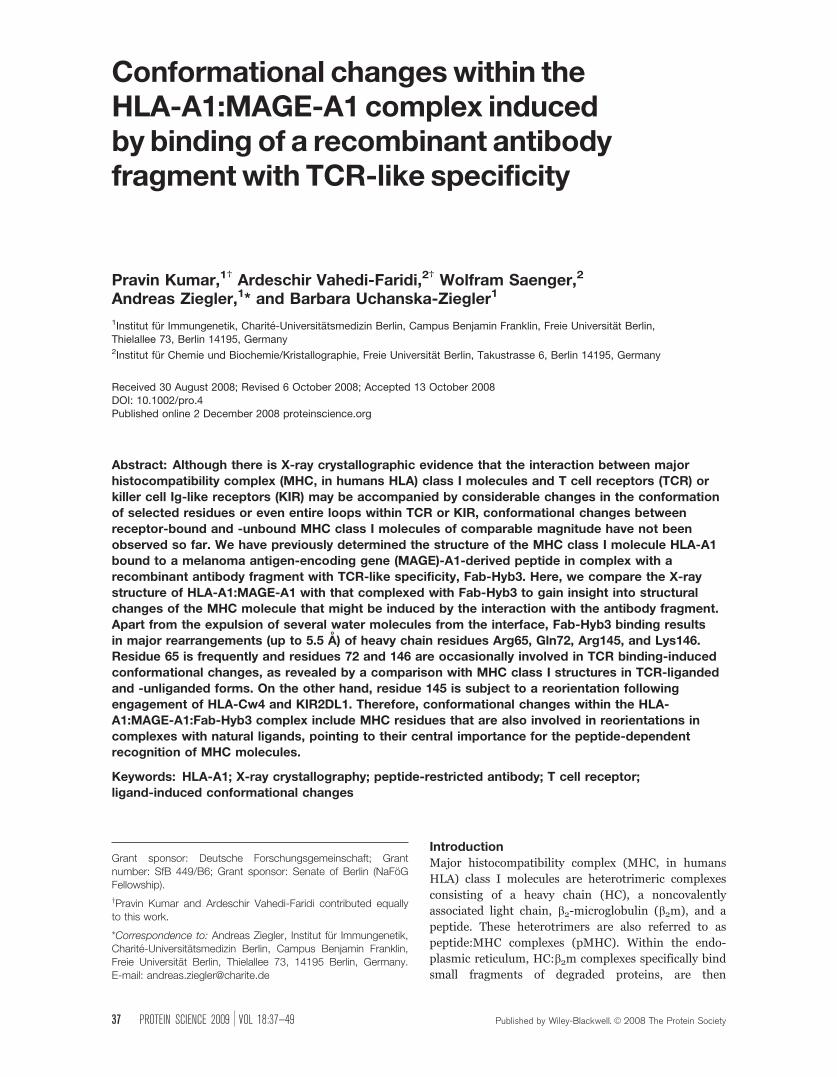
Conformational changes within the HLA-A1:MAGE-A1 complex induced by binding of a recombinant antibody fragment with TCR-like specificity Pravin Kumar, 1† Ardeschir Vahedi-Faridi, 2† Wolfram Saenger, 2 Andreas Ziegler, 1 * and Barbara Uchanska-Ziegler 1 1 Institut fu ¨ r Immungenetik, Charite ´ -Universita ¨ tsmedizin Berlin, Campus Benjamin Franklin, Freie Universita ¨ t Berlin, Thielallee 73, Berlin 14195, Germany 2 Institut fu ¨ r Chemie und Biochemie/Kristallographie, Freie Universita ¨ t Berlin, Takustrasse 6, Berlin 14195, Germany Received 30 August 2008; Revised 6 October 2008; Accepted 13 October 2008 DOI: 10.1002/pro.4 Published online 2 December 2008 proteinscience.org Abstract: Although there is X-ray crystallographic evidence that the interaction between major histocompatibility complex (MHC, in humans HLA) class I molecules and T cell receptors (TCR) or killer cell Ig-like receptors (KIR) may be accompanied by considerable changes in the conformation of selected residues or even entire loops within TCR or KIR, conformational changes between receptor-bound and -unbound MHC class I molecules of comparable magnitude have not been observed so far. We have previously determined the structure of the MHC class I molecule HLA-A1 bound to a melanoma antigen-encoding gene (MAGE)-A1-derived peptide in complex with a recombinant antibody fragment with TCR-like specificity, Fab-Hyb3. Here, we compare the X-ray structure of HLA-A1:MAGE-A1 with that complexed with Fab-Hyb3 to gain insight into structural changes of the MHC molecule that might be induced by the interaction with the antibody fragment. Apart from the expulsion of several water molecules from the interface, Fab-Hyb3 binding results in major rearrangements (up to 5.5 A ˚ ) of heavy chain residues Arg65, Gln72, Arg145, and Lys146. Residue 65 is frequently and residues 72 and 146 are occasionally involved in TCR binding-induced conformational changes, as revealed by a comparison with MHC class I structures in TCR-liganded and -unliganded forms. On the other hand, residue 145 is subject to a reorientation following engagement of HLA-Cw4 and KIR2DL1. Therefore, conformational changes within the HLA- A1:MAGE-A1:Fab-Hyb3 complex include MHC residues that are also involved in reorientations in complexes with natural ligands, pointing to their central importance for the peptide-dependent recognition of MHC molecules. Keywords: HLA-A1; X-ray crystallography; peptide-restricted antibody; T cell receptor; ligand-induced conformational changes Introduction Major histocompatibility complex (MHC, in humans HLA) class I molecules are heterotrimeric complexes consisting of a heavy chain (HC), a noncovalently associated light chain, b 2 -microglobulin (b 2 m), and a peptide. These heterotrimers are also referred to as peptide:MHC complexes (pMHC). Within the endo- plasmic reticulum, HC:b 2 m complexes specifically bind small fragments of degraded proteins, are then Grant sponsor: Deutsche Forschungsgemeinschaft; Grant number: SfB 449/B6; Grant sponsor: Senate of Berlin (NaFo ¨G Fellowship). y Pravin Kumar and Ardeschir Vahedi-Faridi contributed equally to this work. *Correspondence to: Andreas Ziegler, Institut fu ¨ r Immungenetik, Charite ´ -Universita ¨ tsmedizin Berlin, Campus Benjamin Franklin, Freie Universita ¨ t Berlin, Thielallee 73, 14195 Berlin, Germany. E-mail: [email protected] 37 PROTEIN SCIENCE 2009 VOL 18:37—49 Published by Wiley-Blackwell. V C 2008 The Protein Society
-
Upload
independent -
Category
Documents
-
view
1 -
download
0
Transcript of Conformational changes within the HLA‐A1: MAGE‐A1 complex induced by binding of a recombinant...
Conformational changeswithin theHLA-A1:MAGE-A1 complex inducedby binding of a recombinant antibodyfragmentwith TCR-like specificity
Pravin Kumar,1† Ardeschir Vahedi-Faridi,2† Wolfram Saenger,2
Andreas Ziegler,1* and Barbara Uchanska-Ziegler1
1Institut fur Immungenetik, Charite-Universitatsmedizin Berlin, Campus Benjamin Franklin, Freie Universitat Berlin,
Thielallee 73, Berlin 14195, Germany2Institut fur Chemie und Biochemie/Kristallographie, Freie Universitat Berlin, Takustrasse 6, Berlin 14195, Germany
Received 30 August 2008; Revised 6 October 2008; Accepted 13 October 2008DOI: 10.1002/pro.4Published online 2 December 2008 proteinscience.org
Abstract: Although there is X-ray crystallographic evidence that the interaction between major
histocompatibility complex (MHC, in humans HLA) class I molecules and T cell receptors (TCR) or
killer cell Ig-like receptors (KIR) may be accompanied by considerable changes in the conformationof selected residues or even entire loops within TCR or KIR, conformational changes between
receptor-bound and -unbound MHC class I molecules of comparable magnitude have not been
observed so far. We have previously determined the structure of the MHC class I molecule HLA-A1bound to a melanoma antigen-encoding gene (MAGE)-A1-derived peptide in complex with a
recombinant antibody fragment with TCR-like specificity, Fab-Hyb3. Here, we compare the X-ray
structure of HLA-A1:MAGE-A1 with that complexed with Fab-Hyb3 to gain insight into structuralchanges of the MHC molecule that might be induced by the interaction with the antibody fragment.
Apart from the expulsion of several water molecules from the interface, Fab-Hyb3 binding results
in major rearrangements (up to 5.5 A) of heavy chain residues Arg65, Gln72, Arg145, and Lys146.Residue 65 is frequently and residues 72 and 146 are occasionally involved in TCR binding-induced
conformational changes, as revealed by a comparison with MHC class I structures in TCR-liganded
and -unliganded forms. On the other hand, residue 145 is subject to a reorientation followingengagement of HLA-Cw4 and KIR2DL1. Therefore, conformational changes within the HLA-
A1:MAGE-A1:Fab-Hyb3 complex include MHC residues that are also involved in reorientations in
complexes with natural ligands, pointing to their central importance for the peptide-dependentrecognition of MHC molecules.
Keywords: HLA-A1; X-ray crystallography; peptide-restricted antibody; T cell receptor;ligand-induced conformational changes
IntroductionMajor histocompatibility complex (MHC, in humans
HLA) class I molecules are heterotrimeric complexes
consisting of a heavy chain (HC), a noncovalently
associated light chain, b2-microglobulin (b2m), and a
peptide. These heterotrimers are also referred to as
peptide:MHC complexes (pMHC). Within the endo-
plasmic reticulum, HC:b2m complexes specifically bind
small fragments of degraded proteins, are then
Grant sponsor: Deutsche Forschungsgemeinschaft; Grantnumber: SfB 449/B6; Grant sponsor: Senate of Berlin (NaFoGFellowship).
yPravin Kumar and Ardeschir Vahedi-Faridi contributed equallyto this work.
*Correspondence to: Andreas Ziegler, Institut fur Immungenetik,Charite-Universitatsmedizin Berlin, Campus Benjamin Franklin,Freie Universitat Berlin, Thielallee 73, 14195 Berlin, Germany.E-mail: [email protected]
37 PROTEIN SCIENCE 2009 VOL 18:37—49 Published by Wiley-Blackwell. VC 2008 The Protein Society
transported as intact heterotrimers to the surface of
antigen presenting cells and subsequently serve as tar-
gets for receptors on effector cells such as T or natural
killer (NK) cells.1 Although typical affinities of individ-
ual interactions are low, in the micromolar range, the
recognition process is highly specific. It permits T cell
receptors (TCR) on T cells to distinguish peptides
derived from self-antigens and foreign, for example,
viral, molecules.2 In contrast, the binding of killer cell
Ig-like receptors (KIR) on NK cells is more promiscu-
ous, because only residues in the vicinity of the pep-
tide C-terminus of a pMHC are involved in the interac-
tion.3,4 However, the general principles are not yet
fully understood that govern recognition or lack of
interaction between pMHC and TCR or KIR and deter-
mine the biological outcome of an encounter between
an effector cell and its target. Particularly puzzling is
the occasionally drastic influence of subtle conforma-
tional changes of residues within a pMHC complex or
a TCR on the response of T cells.2,5–7
The polymorphic nature of MHC class I antigens
enables them to present a diverse range of peptides,
generally varying between 8 and 12 residues in length.
These peptides are anchored in the peptide binding
groove that is formed by HC residues through specific
interactions between side chains of the peptide and
residues shaping the peptide-binding pockets of an
MHC molecule.1,8 The specificity of peptide presenta-
tion is usually determined by only one or two of such
pockets that accommodate primary anchor residues of
a peptide,9 with one or more secondary anchors that
fine tune the binding motifs for a given MHC class I
antigen.10 For example, HLA-A*010101 is a human
MHC class I allele whose product preferentially binds
nonapeptides with the anchor residues Asp or Glu at
position 3 and Tyr at position 9. Thr or Ser at position
2 and Leu at position 7 are auxiliary anchor resi-
dues.11–13
We have previously determined the structure of a
recombinant antibody fragment, Fab-Hyb3 (Hyb3 in
short), that reacts with HLA-A1 in a peptide-depend-
ent fashion.14 Within this complex, HLA-A1 is bound
to the peptide MAGE-A1 (EADPTGHSY), which is
derived from the melanoma antigen-encoding gene
(MAGE)-A1 molecule (residues 161–169). To some
extent, the binding of the in vitro affinity-matured
Hyb3 resembles that of a soluble TCR or KIR, but
Hyb3 exhibits a �1000 times higher affinity toward its
target than a typical TCR or KIR.2–4,15 In attempting
to understand the basis for this finding, we focus here
on changes induced by Hyb3 in the conformation of
pMHC residues by comparing the Hyb3-liganded
structure (A1:MAGE-A1:Fab-Hyb3, AMF) with that of
the newly determined, unliganded HLA-A1:MAGE-A1
complex (AM). The results reveal that four residues, at
positions 65, 72, 145, and 146 of the HC, undergo
highly significant changes in their side chain orienta-
tions because of the interaction with Hyb3. All of these
residues are also involved in TCR or KIR binding-
induced conformational changes in selected other
pMHC.
Results
Structural features of the HLA-A1:MAGE-A1
complexThe HLA-A1 (AM) complex crystallized in space group
P212121 (Table I) with one molecule of the complex in
the asymmetric unit. The structure was determined at
1.8 A resolution and refinement converged at Rcryst of
0.194. The electron density map for the structure is of
high quality, as shown for the MAGE-A1 peptide
[Fig. 1(A)]. Several nonspecific contacts between HLA-
A1 complexes stabilize the crystal lattice. However, the
bound MAGE-A1 peptide does not participate in these
crystal contacts, thereby permitting a detailed compar-
ison with the peptide in the AMF complex. The overall
structure of HLA-A1 exhibits the typical HLA class I
topography.1
The MAGE-A1 peptide was modeled unambigu-
ously into the electron density, revealing relatively
inflexible side chain orientations of peptide residues as
seen in the qualitative B factor plot [Fig. 1(B)], with
the exception of pHis7. Apart from this residue and
residues pPro4, pThr5, and pGly6, which are slightly
more flexible in HLA-A1, as well as pGlu1, which
exhibits higher flexibility in the AMF [Fig. 1(C)] than
in the AM complex [Fig. 1(B)], the B factor values of
peptide residues are very similar in both structures.
The MAGE-A1 peptide is buried in the peptide binding
groove [Fig. 1(D,E)] and provides only a relatively flat
surface for recognition by a TCR or Hyb3. A large
number of polar and nonpolar interactions between
the MAGE-A1 peptide and HC residues that line the
peptide binding groove as well as water-mediated
intrapeptide hydrogen bonds stabilize this conforma-
tion (not shown). The peptide residues pGlu1, pAla2,
pAsp3, pHis7, and pPhe9 are accommodated, respec-
tively, in the A, B, D, E, and F pockets of the peptide
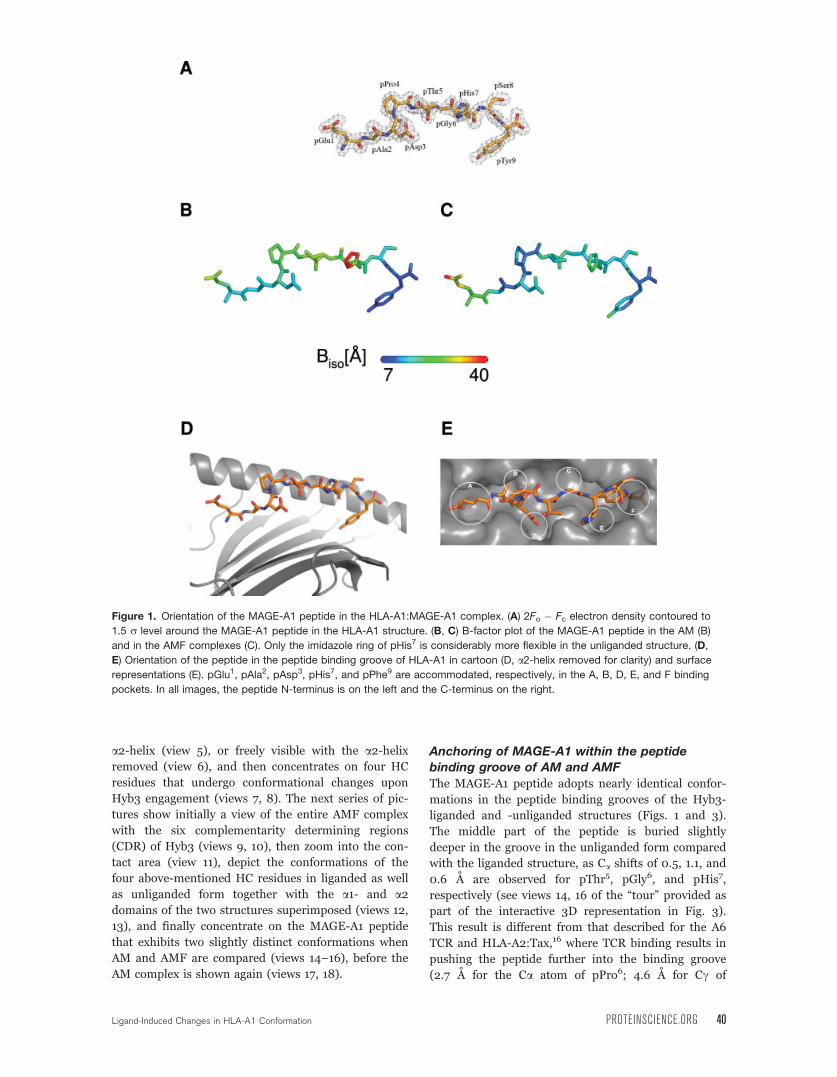
binding groove [Fig. 1(E)]. The solvent accessibility of
the MAGE-A1 peptide residues demonstrates varying
degrees of solvent exposure for peptide residues, with
pPro4, pThr5, pGly6, and pSer8 being the most
‘‘exposed’’ residues (solvent accessible surface area
(SASA) values per residue: 89.6, 39.7, 43.5, and 52.4
A2, respectively) and pAla2, as well as the anchor resi-
dues pAsp3 and pTyr9 being the most ‘‘occluded’’ resi-
dues (SASA values per residue: 3.9, 10.2, and 7.0 A2,
respectively).
3D comparison of the AM
and the AMF structures
A comparison of HLA-A1 with the liganded complex14
reveals a number of differences, although the overall
structures are very similar. The root mean square
(rms) deviation values obtained upon Ca overlay of
Ligand-Induced Changes in HLA-A1 Conformation PROTEINSCIENCE.ORG 38
the two complexes are 0.56 A (for the entire complex),
0.58 A (only HC), 0.30 A (only b2m), and 0.37 A (only
peptide). Independent superposition of individual
domains of the HLA-A1 HC shows that the a3 domain
exhibits slightly more differences (Ca rms deviation of
0.40 A) when compared with the a1/a2 domains (Carms deviation of 0.38 A). To observe main chain dif-
ferences in the peptide binding groove, we overlaid the
main chain atoms of the a1- and a2-domains, includ-
ing all peptide binding groove residues (1–180) of the
AMF complex over the corresponding residues of the
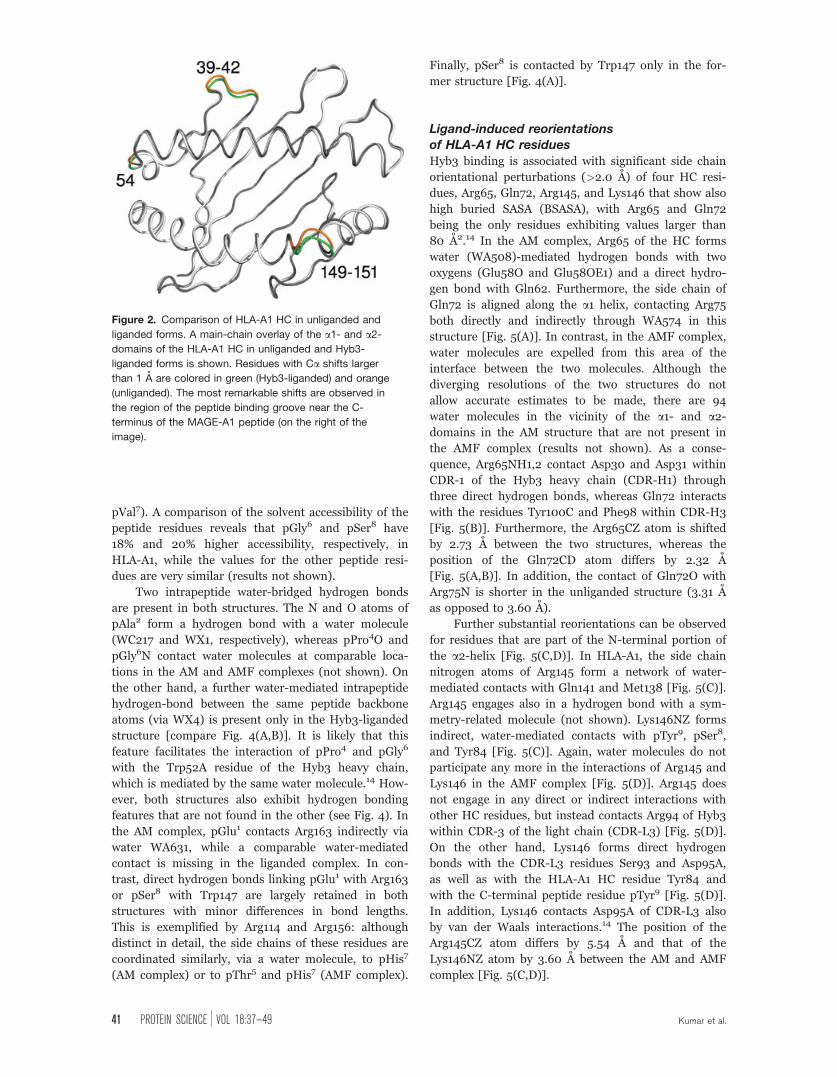
AM structure (see Fig. 2). This analysis reveals that,
for certain locations, particularly in loop regions such
as residues 39–42 of the a1-domain and a conspicuous
stretch of three residues (149–151) within the N-termi-
nal region of the a2-helix, the positions of the Caatoms in the two structures differ by more than 1.0 A.
Similar domain-wise analyses of other regions of the
structure show Ca shifts larger than 0.5 A at several
positions in the a3 domain and at residues 46–49, 59,
and 96–99 in b2m. The comparison demonstrates also
that the a3-domain has most main chain shifts (0.50–
1.13 A) and differences in side chain orientations,
although nearly all residues having such differences
are part of loop regions.
By clicking on any part of the conventional 2D
Figure 3 in the PDF, access to the 3D feature is
obtained through the freely available Adobe Reader
(Version 9) on any Windows-based computer with a
modern graphic card (128þ MB memory) and suffi-
cient RAM (1024þ MB). The ‘‘Help’’ option within the
program provides an introduction into the possibilities
that are offered. Zoom, rotation in freely chosen direc-
tions, or hiding of structural elements (b2m, HC, pep-
tide, each in one or both of the two structures) permit
an interactive access. A better understanding of many
structural features is thus provided. In the present
case, it is particularly helpful to compare the peptide
conformations by zooming in and by rotating the two
structures with the HC component hidden (by toggling
its visibility off in the model tree) or by comparing the
conformation of the HC residues Arg65, Gln72,
Arg145, and Lys146, all of which are contacted by
Hyb3 (see later).
The preset views permit the reader to follow a
‘‘tour’’ of the molecule resembling a prerendered video
file of the structures. However, other than a film, the
tour presented here still permits full interaction with
the structures at any stage. It begins by depicting the
entire HLA-A1 complex from different angles (views
1–3 of the model tree). It then shows a top view of the
a1- and a2-domains that form the peptide binding
groove with the peptide (view 4) followed by a side
view with the peptide, still partially hidden behind the
Table I. Crystal Data Collection and Refinement Statistics for the HLA-A1:MAGE-A1 Complex
Data collectionSpace group P212121Unit cella (A), b (A), c (A) 51.176, 74.060, 125.940Resolution (A) 63.89–1.80 (1.84–1.80)Unique reflections 41526 (2954)Redundancy 4.0 (4.2)Completeness (%) 96.78 (94.75)I/r 17.3 (3.82)Rsym
a 0.071 (0.337)RefinementResolution (A) 63.89–1.80 (1.84–1.80)Reflections 41526 (2954)Rcryst
b 0.194 (0.280)Rfree
c 0.224 (0.337)HLA-A1 heavy chain, no. of atoms/average B value (A2) (chain A) 2241/16.73b2-microglobulin, no. of atoms/average B value (A2) (chain B) 853/17.39MAGE-A1 peptide, no. of atoms/average B value (A2) (chain C) 69/19.35Water, no. of molecules/average B value (A2) 587/30.44Glycerol, no. of molecules/average B value (A2) 3/35.53Estimated overall coordinate error (A) 0.136Root mean square deviation from ideal geometryBond length (A) 0.015Bond angles (�) 1.451
Ramachandran plotMost favored regions (%) 92.8Additionally allowed regions (%) 6.9Generously allowed regions (%) 0.3Disallowed regions (%) 0.0
Values for highest resolution shell are indicated in parentheses.a Rsym ¼ RhRi|Ih,i � hIhi|/RhRiIh,i.b Rcryst ¼ Rh |Fo � Fc|/RFo (working set, no r cutoff applied).c Rfree is calculated the same way as Rcryst, but for 5% of the data excluded from refinement.
39 PROTEIN SCIENCE VOL 18:37—49 Kumar et al.
a2-helix (view 5), or freely visible with the a2-helixremoved (view 6), and then concentrates on four HC
residues that undergo conformational changes upon
Hyb3 engagement (views 7, 8). The next series of pic-
tures show initially a view of the entire AMF complex
with the six complementarity determining regions
(CDR) of Hyb3 (views 9, 10), then zoom into the con-
tact area (view 11), depict the conformations of the
four above-mentioned HC residues in liganded as well
as unliganded form together with the a1- and a2domains of the two structures superimposed (views 12,
13), and finally concentrate on the MAGE-A1 peptide
that exhibits two slightly distinct conformations when
AM and AMF are compared (views 14–16), before the
AM complex is shown again (views 17, 18).
Anchoring of MAGE-A1 within the peptidebinding groove of AM and AMF
The MAGE-A1 peptide adopts nearly identical confor-
mations in the peptide binding grooves of the Hyb3-
liganded and -unliganded structures (Figs. 1 and 3).
The middle part of the peptide is buried slightly
deeper in the groove in the unliganded form compared
with the liganded structure, as Ca shifts of 0.5, 1.1, and
0.6 A are observed for pThr5, pGly6, and pHis7,
respectively (see views 14, 16 of the ‘‘tour’’ provided as
part of the interactive 3D representation in Fig. 3).
This result is different from that described for the A6
TCR and HLA-A2:Tax,16 where TCR binding results in
pushing the peptide further into the binding groove
(2.7 A for the Ca atom of pPro6; 4.6 A for Cc of
Figure 1. Orientation of the MAGE-A1 peptide in the HLA-A1:MAGE-A1 complex. (A) 2Fo � Fc electron density contoured to
1.5 r level around the MAGE-A1 peptide in the HLA-A1 structure. (B, C) B-factor plot of the MAGE-A1 peptide in the AM (B)
and in the AMF complexes (C). Only the imidazole ring of pHis7 is considerably more flexible in the unliganded structure. (D,
E) Orientation of the peptide in the peptide binding groove of HLA-A1 in cartoon (D, a2-helix removed for clarity) and surface
representations (E). pGlu1, pAla2, pAsp3, pHis7, and pPhe9 are accommodated, respectively, in the A, B, D, E, and F binding
pockets. In all images, the peptide N-terminus is on the left and the C-terminus on the right.
Ligand-Induced Changes in HLA-A1 Conformation PROTEINSCIENCE.ORG 40
pVal7). A comparison of the solvent accessibility of the
peptide residues reveals that pGly6 and pSer8 have
18% and 20% higher accessibility, respectively, in
HLA-A1, while the values for the other peptide resi-
dues are very similar (results not shown).
Two intrapeptide water-bridged hydrogen bonds
are present in both structures. The N and O atoms of
pAla2 form a hydrogen bond with a water molecule
(WC217 and WX1, respectively), whereas pPro4O and
pGly6N contact water molecules at comparable loca-
tions in the AM and AMF complexes (not shown). On
the other hand, a further water-mediated intrapeptide
hydrogen-bond between the same peptide backbone
atoms (via WX4) is present only in the Hyb3-liganded
structure [compare Fig. 4(A,B)]. It is likely that this
feature facilitates the interaction of pPro4 and pGly6
with the Trp52A residue of the Hyb3 heavy chain,
which is mediated by the same water molecule.14 How-
ever, both structures also exhibit hydrogen bonding
features that are not found in the other (see Fig. 4). In
the AM complex, pGlu1 contacts Arg163 indirectly via
water WA631, while a comparable water-mediated
contact is missing in the liganded complex. In con-
trast, direct hydrogen bonds linking pGlu1 with Arg163
or pSer8 with Trp147 are largely retained in both
structures with minor differences in bond lengths.
This is exemplified by Arg114 and Arg156: although
distinct in detail, the side chains of these residues are
coordinated similarly, via a water molecule, to pHis7
(AM complex) or to pThr5 and pHis7 (AMF complex).
Finally, pSer8 is contacted by Trp147 only in the for-
mer structure [Fig. 4(A)].
Ligand-induced reorientationsof HLA-A1 HC residues
Hyb3 binding is associated with significant side chain
orientational perturbations (>2.0 A) of four HC resi-
dues, Arg65, Gln72, Arg145, and Lys146 that show also
high buried SASA (BSASA), with Arg65 and Gln72
being the only residues exhibiting values larger than
80 A2.14 In the AM complex, Arg65 of the HC forms
water (WA508)-mediated hydrogen bonds with two
oxygens (Glu58O and Glu58OE1) and a direct hydro-
gen bond with Gln62. Furthermore, the side chain of
Gln72 is aligned along the a1 helix, contacting Arg75
both directly and indirectly through WA574 in this
structure [Fig. 5(A)]. In contrast, in the AMF complex,
water molecules are expelled from this area of the
interface between the two molecules. Although the
diverging resolutions of the two structures do not
allow accurate estimates to be made, there are 94
water molecules in the vicinity of the a1- and a2-domains in the AM structure that are not present in
the AMF complex (results not shown). As a conse-
quence, Arg65NH1,2 contact Asp30 and Asp31 within
CDR-1 of the Hyb3 heavy chain (CDR-H1) through
three direct hydrogen bonds, whereas Gln72 interacts
with the residues Tyr100C and Phe98 within CDR-H3
[Fig. 5(B)]. Furthermore, the Arg65CZ atom is shifted
by 2.73 A between the two structures, whereas the
position of the Gln72CD atom differs by 2.32 A
[Fig. 5(A,B)]. In addition, the contact of Gln72O with
Arg75N is shorter in the unliganded structure (3.31 A
as opposed to 3.60 A).
Further substantial reorientations can be observed
for residues that are part of the N-terminal portion of
the a2-helix [Fig. 5(C,D)]. In HLA-A1, the side chain
nitrogen atoms of Arg145 form a network of water-
mediated contacts with Gln141 and Met138 [Fig. 5(C)].
Arg145 engages also in a hydrogen bond with a sym-
metry-related molecule (not shown). Lys146NZ forms
indirect, water-mediated contacts with pTyr9, pSer8,
and Tyr84 [Fig. 5(C)]. Again, water molecules do not
participate any more in the interactions of Arg145 and
Lys146 in the AMF complex [Fig. 5(D)]. Arg145 does
not engage in any direct or indirect interactions with
other HC residues, but instead contacts Arg94 of Hyb3
within CDR-3 of the light chain (CDR-L3) [Fig. 5(D)].
On the other hand, Lys146 forms direct hydrogen
bonds with the CDR-L3 residues Ser93 and Asp95A,
as well as with the HLA-A1 HC residue Tyr84 and
with the C-terminal peptide residue pTyr9 [Fig. 5(D)].
In addition, Lys146 contacts Asp95A of CDR-L3 also
by van der Waals interactions.14 The position of the
Arg145CZ atom differs by 5.54 A and that of the
Lys146NZ atom by 3.60 A between the AM and AMF
complex [Fig. 5(C,D)].
Figure 2. Comparison of HLA-A1 HC in unliganded and
liganded forms. A main-chain overlay of the a1- and a2-domains of the HLA-A1 HC in unliganded and Hyb3-
liganded forms is shown. Residues with Ca shifts larger
than 1 A are colored in green (Hyb3-liganded) and orange
(unliganded). The most remarkable shifts are observed in
the region of the peptide binding groove near the C-
terminus of the MAGE-A1 peptide (on the right of the
image).
41 PROTEIN SCIENCE VOL 18:37—49 Kumar et al.
Most of the HC residues that contact the peptide
via hydrogen bonds in the AM structure have similar
BSASA values also in the AMF complex (not shown).
However, there are a number of exceptions: Asn66,
Ala69, Thr73, Tyr84, Lys146, and Gln 155 show signifi-
cant differences in BSASA values due to peptide con-
tacts in the two structures. The BSASA values diverge
particularly strongly for Thr73 and Lys146. Each of
these two residues contributes �40 A2 of the total
HLA-A1 HC surface area that is buried due to peptide
binding in HLA-A1, but these values are more than
50% lower in the AMF complex. Gln155, one of the
five residues that exhibits >50 A2 BSASA in the AM
complex, shows a 32.6% reduced BSASA in the AMF
structure. Finally, Ala69 and Tyr84, although only
small contributors to BSASA (10.2 and 8.3 A2, respec-
tively), reveal BSASA values that are about 80% lower
in the Hyb3-liganded structure. Overall, the reduction
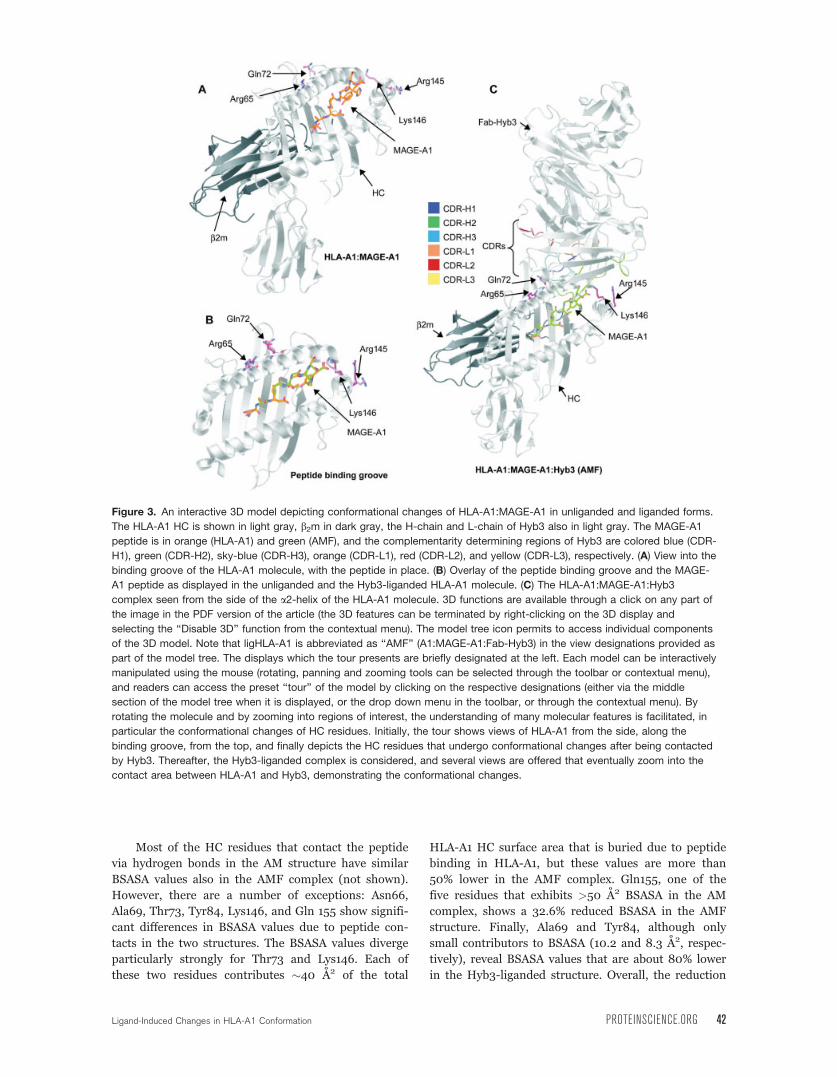
Figure 3. An interactive 3D model depicting conformational changes of HLA-A1:MAGE-A1 in unliganded and liganded forms.
The HLA-A1 HC is shown in light gray, b2m in dark gray, the H-chain and L-chain of Hyb3 also in light gray. The MAGE-A1
peptide is in orange (HLA-A1) and green (AMF), and the complementarity determining regions of Hyb3 are colored blue (CDR-
H1), green (CDR-H2), sky-blue (CDR-H3), orange (CDR-L1), red (CDR-L2), and yellow (CDR-L3), respectively. (A) View into the
binding groove of the HLA-A1 molecule, with the peptide in place. (B) Overlay of the peptide binding groove and the MAGE-
A1 peptide as displayed in the unliganded and the Hyb3-liganded HLA-A1 molecule. (C) The HLA-A1:MAGE-A1:Hyb3
complex seen from the side of the a2-helix of the HLA-A1 molecule. 3D functions are available through a click on any part of
the image in the PDF version of the article (the 3D features can be terminated by right-clicking on the 3D display and
selecting the ‘‘Disable 3D’’ function from the contextual menu). The model tree icon permits to access individual components
of the 3D model. Note that ligHLA-A1 is abbreviated as ‘‘AMF’’ (A1:MAGE-A1:Fab-Hyb3) in the view designations provided as
part of the model tree. The displays which the tour presents are briefly designated at the left. Each model can be interactively
manipulated using the mouse (rotating, panning and zooming tools can be selected through the toolbar or contextual menu),
and readers can access the preset ‘‘tour’’ of the model by clicking on the respective designations (either via the middle
section of the model tree when it is displayed, or the drop down menu in the toolbar, or through the contextual menu). By
rotating the molecule and by zooming into regions of interest, the understanding of many molecular features is facilitated, in
particular the conformational changes of HC residues. Initially, the tour shows views of HLA-A1 from the side, along the
binding groove, from the top, and finally depicts the HC residues that undergo conformational changes after being contacted
by Hyb3. Thereafter, the Hyb3-liganded complex is considered, and several views are offered that eventually zoom into the
contact area between HLA-A1 and Hyb3, demonstrating the conformational changes.
Ligand-Induced Changes in HLA-A1 Conformation PROTEINSCIENCE.ORG 42
in BSASA between the unliganded and the liganded
structures is about 16% when HC residues involved in
hydrogen-mediated contacts to the bound peptide are
considered.
Discussion
The HLA-A1:MAGE-A1 (AM) complex, whose structure
is described here, has been employed as a prime target
for melanoma-specific cytotoxic T cells, using studies
in vitro as well as in vivo.17–19 The expression of this
antigen is strictly tumor-associated, because the only
cells that are able to display HLA class I or II mole-
cules on their surface together with the MAGE-A1 pep-
tide are malignant cells.20 It was therefore of consider-
able interest to acquire not only cellular reagents, but
also soluble molecules directed against this highly spe-
cific target. We have previously pointed out21 why
recombinant, affinity-matured antibodies mimicking
TCR specificity such as Hyb3 are preferable to soluble
TCR22 or conventional monoclonal antibodies (for
example, see Refs. 23–31) that interact in a peptide-
dependent manner with a pMHC: although a major
obstacle to the application of soluble TCR molecules is
to increase their affinity (at least 100-fold), necessitat-
ing cumbersome in vitro-affinity maturation proce-
dures, the major problem with TCR-like monoclonal
antibodies is to obtain them at all. Consequently, very
few such reagents are currently available, forcing us to
employ recombinant antibodies.14,32
A number of factors that characterize the binding
mode of Hyb3 to its target are likely to contribute to
the vastly increased affinity (�1000-fold) when com-
pared with a typical interaction between a pMHC and
a natural ligand. This includes strict shape comple-
mentarity between the AM complex and Hyb3, associ-
ated with burial of large areas of interaction surface
together with the exclusion of water molecules that
contributes entropically to structural stabilization.
Whether the unusual tilt with regard to the main axes
of the binding partners (45�) and the diagonal binding
mode of Hyb3 (see Fig. 3) play a role as well is
unclear, but it is unlikely that a single factor is respon-
sible for the improved affinity of Hyb3 in comparison
to that of TCR or KIR.14 In addition, a Hyb3-induced
fit on the structure of HLA-A1 remained to be studied,
as the structure of this pMHC in unliganded form was
not known before. To shed light on some of these
questions, we focus here on conformational changes
induced by Hyb3 and natural HLA class I ligands. In
comparison to other pMHC structures,1 the AM com-
plex does not show any unusual features. Possibly, the
only conspicuous property is that the structure lacks
any particularly remarkable attributes. In the absence
of long peptide side chains, the surface which the com-
plex presents to a ligand is rather flat, necessitating
strict shape complementarity between the two binding
partners and expulsion of water molecules from the
interface, as mentioned earlier.
Only four peptide residues are involved in direct
interactions with Hyb3, and nearly always peptide
main chain atoms are contacted by this ligand.14 With
regard to the HC, five a1-helix residues (65, 69, 72, 73,
80) as well as three a2-helix residues (145, 146, 155)
engage in H-bonds with Hyb3, whereas three residues
(76, 80, 146) are recognized through van der Waals
interactions. A comparison of those residues under-
going pronounced conformational changes (>2.0 A)
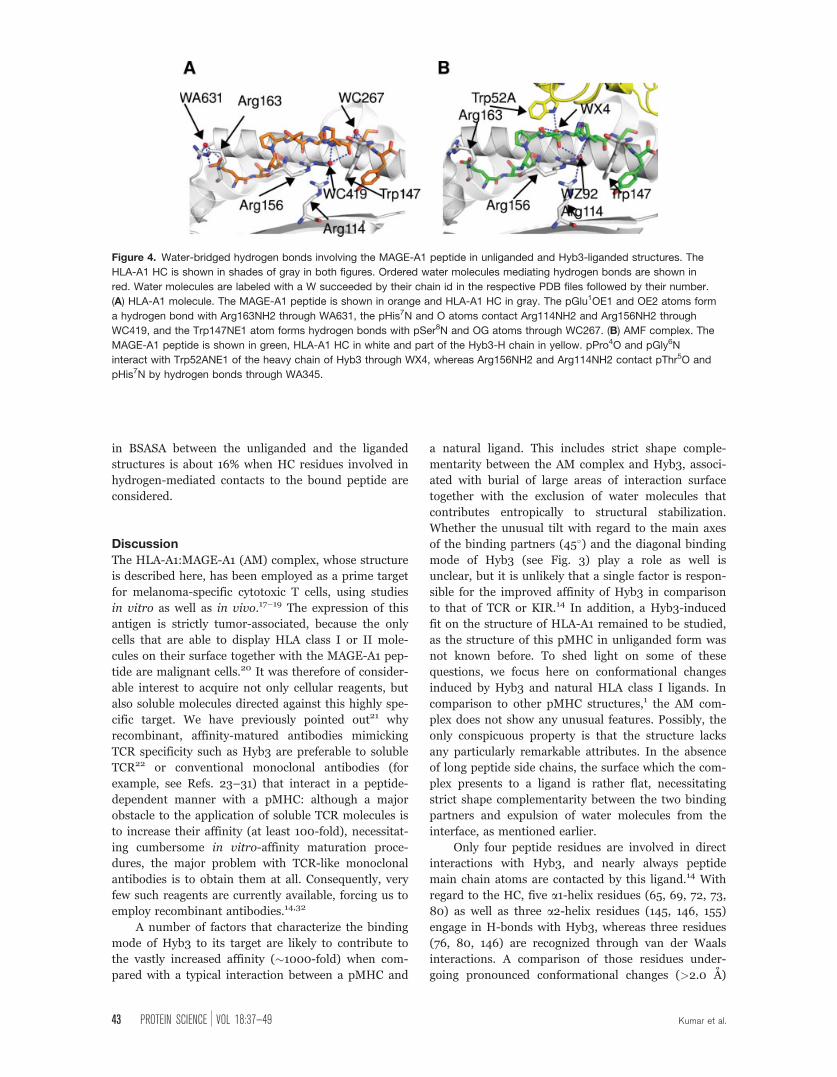
Figure 4. Water-bridged hydrogen bonds involving the MAGE-A1 peptide in unliganded and Hyb3-liganded structures. The
HLA-A1 HC is shown in shades of gray in both figures. Ordered water molecules mediating hydrogen bonds are shown in
red. Water molecules are labeled with a W succeeded by their chain id in the respective PDB files followed by their number.
(A) HLA-A1 molecule. The MAGE-A1 peptide is shown in orange and HLA-A1 HC in gray. The pGlu1OE1 and OE2 atoms form
a hydrogen bond with Arg163NH2 through WA631, the pHis7N and O atoms contact Arg114NH2 and Arg156NH2 through
WC419, and the Trp147NE1 atom forms hydrogen bonds with pSer8N and OG atoms through WC267. (B) AMF complex. The
MAGE-A1 peptide is shown in green, HLA-A1 HC in white and part of the Hyb3-H chain in yellow. pPro4O and pGly6N
interact with Trp52ANE1 of the heavy chain of Hyb3 through WX4, whereas Arg156NH2 and Arg114NH2 contact pThr5O and
pHis7N by hydrogen bonds through WA345.
43 PROTEIN SCIENCE VOL 18:37—49 Kumar et al.
upon Hyb3 binding (Arg65, Gln72, Arg145, and
Lys146; Fig. 5) with comparable reorientations of HC
residues in structures of classical pMHC molecules for
which information on a1/a2-domain-liganded and
unliganded forms is available can thus be performed.
Apart from the AMF complex, this comparison
includes a recently determined second complex
between a pMHC and an antibody, nine complexes of
pMHC:TCR and one pMHC:KIR structure (Table II,
which provides also the respective references). We
have refrained from including the HLA-B*3501:EPL-
P:ELS4 complex in the comparison because of the
atypical flattening of the highly bulged 11-mer EPLP
peptide which is induced by the binding of the ELS4
TCR.49 In 10 of the complexes listed in Table II, pepti-
des in the liganded and unliganded forms overlay with
rms deviation values of less than 0.5 A, indicating that
there exist only marginal ligand binding-induced con-
formational changes for peptide residues. The only ele-
vated rms deviation values (1.01 A and 0.63 A) for a
bound peptide are noted when the unliganded and the
liganded forms of HLA-A2:Tax and H-2Kb:dEV8 are
compared (Table II). In the latter case, a reorientation
of the side chain of residue pTyr6 appears mainly re-
sponsible. A similar overlay of HC residues belonging
to the a1- and a2-domains of unliganded and liganded
pMHC structures gave a much wider spectrum of rms
deviation values (Table II). They varied from 0.38 A
(for AMF) to 0.99 A (for H-2Kb with the pBM1 pep-
tide). Although far-reaching effects of conformational
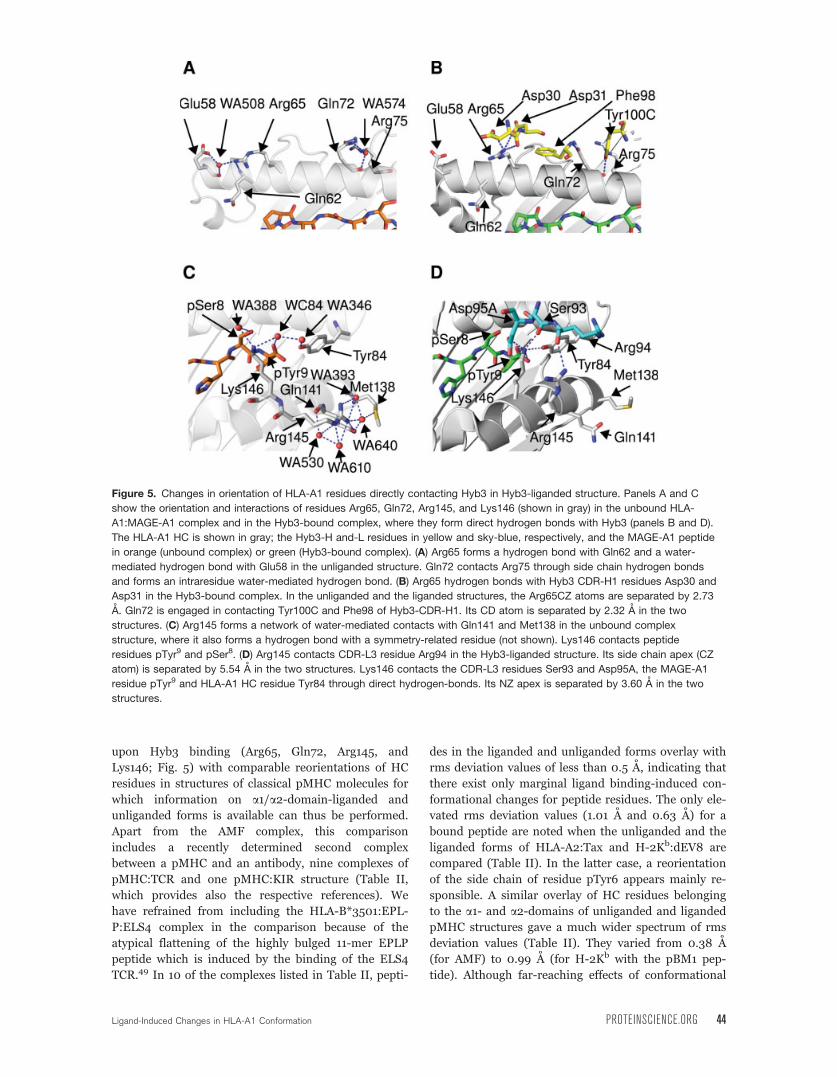
Figure 5. Changes in orientation of HLA-A1 residues directly contacting Hyb3 in Hyb3-liganded structure. Panels A and C
show the orientation and interactions of residues Arg65, Gln72, Arg145, and Lys146 (shown in gray) in the unbound HLA-
A1:MAGE-A1 complex and in the Hyb3-bound complex, where they form direct hydrogen bonds with Hyb3 (panels B and D).
The HLA-A1 HC is shown in gray; the Hyb3-H and-L residues in yellow and sky-blue, respectively, and the MAGE-A1 peptide
in orange (unbound complex) or green (Hyb3-bound complex). (A) Arg65 forms a hydrogen bond with Gln62 and a water-
mediated hydrogen bond with Glu58 in the unliganded structure. Gln72 contacts Arg75 through side chain hydrogen bonds
and forms an intraresidue water-mediated hydrogen bond. (B) Arg65 hydrogen bonds with Hyb3 CDR-H1 residues Asp30 and
Asp31 in the Hyb3-bound complex. In the unliganded and the liganded structures, the Arg65CZ atoms are separated by 2.73
A. Gln72 is engaged in contacting Tyr100C and Phe98 of Hyb3-CDR-H1. Its CD atom is separated by 2.32 A in the two
structures. (C) Arg145 forms a network of water-mediated contacts with Gln141 and Met138 in the unbound complex
structure, where it also forms a hydrogen bond with a symmetry-related residue (not shown). Lys146 contacts peptide
residues pTyr9 and pSer8. (D) Arg145 contacts CDR-L3 residue Arg94 in the Hyb3-liganded structure. Its side chain apex (CZ
atom) is separated by 5.54 A in the two structures. Lys146 contacts the CDR-L3 residues Ser93 and Asp95A, the MAGE-A1
residue pTyr9 and HLA-A1 HC residue Tyr84 through direct hydrogen-bonds. Its NZ apex is separated by 3.60 A in the two
structures.
Ligand-Induced Changes in HLA-A1 Conformation PROTEINSCIENCE.ORG 44
changes or particular residues cannot be excluded (for
e.g., see Ref. 50), changes in the a3-domain and b2mare not considered further here, because Hyb3, TCR,
and KIR do not bind to these parts of a pMHC.
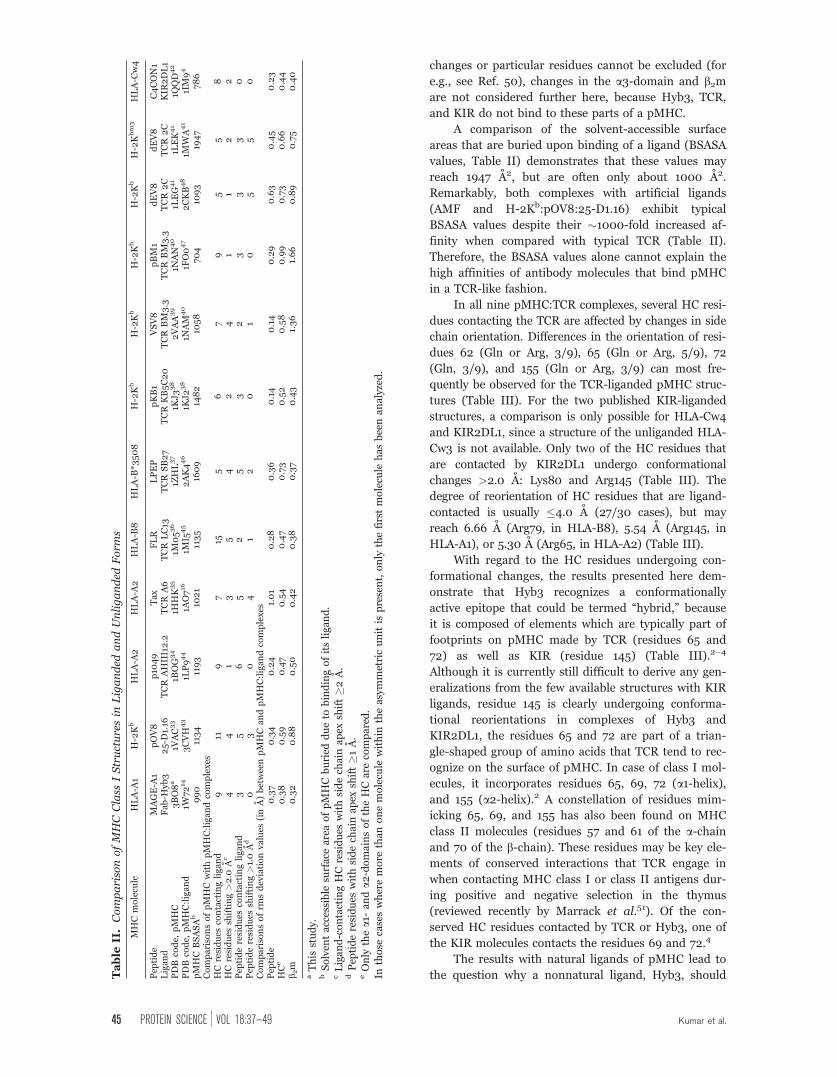
A comparison of the solvent-accessible surface
areas that are buried upon binding of a ligand (BSASA
values, Table II) demonstrates that these values may
reach 1947 A2, but are often only about 1000 A2.
Remarkably, both complexes with artificial ligands
(AMF and H-2Kb:pOV8:25-D1.16) exhibit typical
BSASA values despite their �1000-fold increased af-
finity when compared with typical TCR (Table II).
Therefore, the BSASA values alone cannot explain the
high affinities of antibody molecules that bind pMHC
in a TCR-like fashion.
In all nine pMHC:TCR complexes, several HC resi-
dues contacting the TCR are affected by changes in side
chain orientation. Differences in the orientation of resi-
dues 62 (Gln or Arg, 3/9), 65 (Gln or Arg, 5/9), 72
(Gln, 3/9), and 155 (Gln or Arg, 3/9) can most fre-
quently be observed for the TCR-liganded pMHC struc-
tures (Table III). For the two published KIR-liganded
structures, a comparison is only possible for HLA-Cw4
and KIR2DL1, since a structure of the unliganded HLA-
Cw3 is not available. Only two of the HC residues that
are contacted by KIR2DL1 undergo conformational
changes >2.0 A: Lys80 and Arg145 (Table III). The
degree of reorientation of HC residues that are ligand-
contacted is usually �4.0 A (27/30 cases), but may
reach 6.66 A (Arg79, in HLA-B8), 5.54 A (Arg145, in
HLA-A1), or 5.30 A (Arg65, in HLA-A2) (Table III).
With regard to the HC residues undergoing con-
formational changes, the results presented here dem-
onstrate that Hyb3 recognizes a conformationally
active epitope that could be termed ‘‘hybrid,’’ because
it is composed of elements which are typically part of
footprints on pMHC made by TCR (residues 65 and
72) as well as KIR (residue 145) (Table III).2–4
Although it is currently still difficult to derive any gen-
eralizations from the few available structures with KIR
ligands, residue 145 is clearly undergoing conforma-
tional reorientations in complexes of Hyb3 and
KIR2DL1, the residues 65 and 72 are part of a trian-
gle-shaped group of amino acids that TCR tend to rec-
ognize on the surface of pMHC. In case of class I mol-
ecules, it incorporates residues 65, 69, 72 (a1-helix),and 155 (a2-helix).2 A constellation of residues mim-
icking 65, 69, and 155 has also been found on MHC
class II molecules (residues 57 and 61 of the a-chainand 70 of the b-chain). These residues may be key ele-
ments of conserved interactions that TCR engage in
when contacting MHC class I or class II antigens dur-
ing positive and negative selection in the thymus
(reviewed recently by Marrack et al.51). Of the con-
served HC residues contacted by TCR or Hyb3, one of
the KIR molecules contacts the residues 69 and 72.4
The results with natural ligands of pMHC lead to
the question why a nonnatural ligand, Hyb3, shouldTable
II.ComparisonofMHCClass
IStructuresin
Liganded
andUnliganded
Form
s
MHCmolecu
leHLA-A
1H-2Kb
HLA-A
2HLA-A
2HLA-B
8HLA-B
*3508
H-2Kb
H-2Kb
H-2Kb
H-2Kb
H-2Kbm3
HLA-C
w4
Pep
tide
MAGE-A
1pOV8
p10
49
Tax
FLR
LPEP
pKB1
VSV8
pBM1
dEV8
dEV8
C4CON1
Ligan
dFab
-Hyb
325-D
1.16
TCR
AHIII12.2
TCR
A6
TCR
LC13
TCR
SB27
TCR
KB5C20
TCR
BM3.3
TCR
BM3.3
TCR
2C
TCR
2C
KIR
2DL1
PDBcode,
pMHC
3BO8a
1VAC33
1BOG34
1HHK35
1M0536
1ZHL37
1KJ338
2VAA39
1NAN
40
1LEG41
1LEK41
1QQD
42
PDBcode,
pMHC:ligan
d1W
7214
3CVH
43
1LP944
1AO71
61M
I545
2AK446
1KJ238
1NAM
40
1FO047
2CKB48
1MWA41
1IM94
pMHCBSASAb
990
1134
1193
1021
1135
1609
1482
1058
704
1093
1947
786
ComparisonsofpMHCwithpMHC:ligan
dcomplexes
HCresidues
contactingliga
nd
911
97
155
67
95
58
HCresidues
shifting>2.0
Ac
44
13
54
24
11
22
Pep
tideresidues
contactingliga
nd
35
65
25
32
33
30
Pep
tideresidues
shifting>1.0Ad
03
04
12
01
05
50
Comparisonsofrm
sdeviationvalues
(inA)betweenpMHCan
dpMHC:ligan
dcomplexes
Pep
tide
0.37
0.34
0.24
1.01
0.28
0.36
0.14
0.14
0.29
0.63
0.45
0.23
HCe
0.38
0.59
0.47
0.54
0.47
0.73
0.52
0.58
0.99
0.73
0.66
0.44
b 2m
0.32
0.88
0.50
0.42
0.38
0.37
0.43
1.36
1.66
0.89
0.75
0.40
aThis
study.
bSolven
taccessible
surfacearea
ofpMHCburied
dueto
bindingofitsliga
nd.
cLigan
d-contactingHCresidues
withsidech
ainap
exsh
ift�2
A.
dPep
tideresidues
withsidech
ainap
exsh
ift�1
A.
eOnly
thea1-
anda2-domainsoftheHCarecompared
.In
those
caseswheremore
than
onemolecu
lewithin
theasym
metricunitis
present,only
thefirstmolecu
lehas
beenan
alyzed
.
45 PROTEIN SCIENCE VOL 18:37—49 Kumar et al.
rely at least partly also on residues for interaction that
are crucial docking points for TCR and KIR. It has
been argued that the environments of residues 65, 69,
and 155 (class I) as well as those of the corresponding
residues of class II antigens permit TCR to interact
particularly well with main chain atoms of these amino
acids, whereas peptide residues are typically recog-
nized by side chain interactions.52,53 Predominantly,
Hyb3 employs a different strategy to achieve its speci-
ficity: of 13 direct H-bonded contacts �3.5 A between
HC and Hyb3 residues, only two (with Ala69 and
Gln72) are with HC main-chain atoms. Both contacts
are very short (2.6 and 2.5 A, respectively). In con-
trast, of four such contacts with the MAGE-A1 peptide,
only one (with pHis7NE2) is not with a main-chain
atom.14 Very likely, the nonnatural way in which Hyb3
was produced (selection of a low-affinity Fab fragment
from a phage display library, phage display-based af-
finity maturation) releases this reagent from biological
constraints that appear to govern the interaction of
pMHC with TCR or KIR. For example, it has been pro-
posed that the commonly observed diagonal interac-
tion between pMHC and TCR is influenced by the
presence of CD8 molecules within the interaction com-
plex in vivo.44 It is therefore the more remarkable that
Hyb3 shares several residues that are often subject to
conformational changes upon binding of natural
ligands. It could be that the chemical nature of the
side chains of residues 65, 72, and 145 (twice Arg, and
Gln in case of the HLA-A1 HC) is particularly well
suited for an interaction with ligands, irrespective of
whether they are natural or artificial.
Although TCR usually assume a diagonal binding
mode, there seems, however, a priori no good reason
why Hyb3 should not recognize its target from one of
the ends of the peptide-binding groove without loss of
specificity and affinity. Even a TCR that interacts via
such an unorthodox binding mode has recently been
described in case of the nonclassical MHC molecule
T22 and the cdTCR G8.54 In conclusion, the recogni-
tion of HLA-A1 by Hyb3 resembles in many respects
those which have been observed for various pMHC
and natural ligands, and this is also the case when
conformational reorientations of HC residues due to
binding of the different ligands are evaluated. A fur-
ther understanding of the very high affinity between
HLA-A1 and Hyb3 may come from structures of unli-
ganded Hyb3 or HLA-A1 complexed with Fab-G8, the
low-affinity ancestor of Hyb3.32
Methods
Protein expression, complexation,
and purificationThe HLA-A1 HC and b2m were separately expressed in
Escherichia coli and purified in the form of inclusion
bodies. The MAGE-A1 peptide (EADPTGHSY) was
purchased from Alta Biosciences, UK. Inclusion bodies
of HLA-A1 HC and b2m were unfolded, mixed with the
MAGE-A1 peptide in a refolding buffer (1:2:10 molar
ratio), and reconstituted for 7–10 days at 4�C to form
the HLA-A1:b2m:MAGE-A1 complex (AM) as detailed
previously.32,55 The complex was purified by size
exclusion chromatography on a Superdex 75HR gel fil-
tration column (Amersham Biosciences) using a pH
7.5 buffer containing 20 mM Tris-HCl, 150 mM NaCl,
and 0.1% NaN3, concentrated to 15–17 mg/mL and
used for crystallization screens.
Crystallization and data collection
The AM complex was crystallized using the PEG-ion
screen of Hampton Research, USA in a sitting drop
vapor diffusion setup at 18�C, with a reservoir volume
of 100 lL and drops made up of 1.1 lL protein and 1.1
lL reservoir solution. A single AM crystal was
obtained in a well containing 20% PEG3350 and
0.2 M NaF as reservoir after 18 days. Visible satellite
crystals were removed by cutting the crystals into
smaller pieces. Following flash-cooling in liquid nitro-
gen after brief soaking in a cryo-buffer composed of
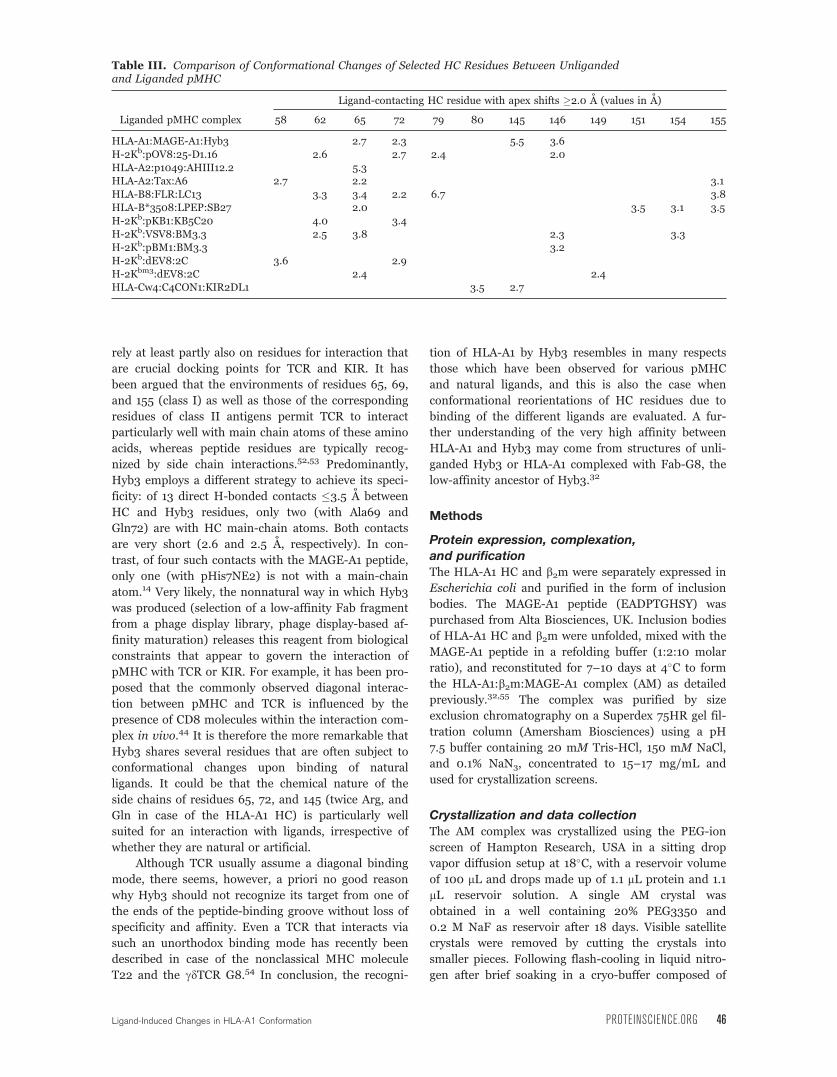
Table III. Comparison of Conformational Changes of Selected HC Residues Between Unligandedand Liganded pMHC
Liganded pMHC complex
Ligand-contacting HC residue with apex shifts �2.0 A (values in A)
58 62 65 72 79 80 145 146 149 151 154 155
HLA-A1:MAGE-A1:Hyb3 2.7 2.3 5.5 3.6H-2Kb:pOV8:25-D1.16 2.6 2.7 2.4 2.0HLA-A2:p1049:AHIII12.2 5.3HLA-A2:Tax:A6 2.7 2.2 3.1HLA-B8:FLR:LC13 3.3 3.4 2.2 6.7 3.8HLA-B*3508:LPEP:SB27 2.0 3.5 3.1 3.5H-2Kb:pKB1:KB5C20 4.0 3.4H-2Kb:VSV8:BM3.3 2.5 3.8 2.3 3.3H-2Kb:pBM1:BM3.3 3.2H-2Kb:dEV8:2C 3.6 2.9H-2Kbm3:dEV8:2C 2.4 2.4HLA-Cw4:C4CON1:KIR2DL1 3.5 2.7
Ligand-Induced Changes in HLA-A1 Conformation PROTEINSCIENCE.ORG 46
reservoir and 15% glycerol, X-ray diffraction data was
collected at Protein Structure Factory beamline BL-1
of Freie Universitat Berlin installed at the BESSY II
synchrotron in Berlin. The crystal diffracted to a reso-
lution limit of 1.8 A, and the collected X-ray data was
indexed and integrated using MOSFLM,56 and then
scaled and merged using program SCALA.57
Structure determination and analysis
The HLA-A1 molecule was localized in the crystal unit
cell by molecular replacement using programs MOL-
REP58 and PHASER,59 with HLA-A1:MAGE-A1:Hyb3
(PDB code 1W72) as search model from which Hyb3,
water molecules, and peptide were stripped off. The
obtained model was subjected to iterative cycles of re-
strained-maximum likelihood refinement including iso-
tropic temperature factor adjustment using REFMAC,60
followed by manual rebuilding using COOT.61 Water
molecules were positioned using CNS.62 The SASA and
BSASA of residues of the structures were calculated
with AREAIMOL63 using a probe radius of 1.4 A. All
superpositions and root mean square (rms) deviation
calculations were performed using LSQKAB.64,67
The atomic coordinates and structure factors
(code 3BO8) have been deposited in the Protein Data
Bank (www.pdb.org).
Preparation of 2D and 3D figures
The 2D figures showing structural details were pre-
pared using PyMOL.65 To view conformational
changes and further differences between the two struc-
tures (see 3D comparison of the AM and the AMF
structures in the results section), we employ here, for
the first time in a novel description of the structure of
a protein, fully interactive three-dimensional (3D) rep-
resentations in the electronic version of this article
that were created using PyMOL and Adobe Systems’
‘‘Acrobat 9 Pro Extended’’ software. The procedure to
create 3D models of a molecular complex has recently
been described.66 Initially, the raw PDB files (3BO8
and 1W72) were opened using PyMOL version 1.0r1.
The components to be shown in the final 3D model
were selected and each exported separately as VRML2
worlds with appropriate designations (e.g., beta2m.wrl)
followed by import into Adobe 3D Reviewer (Adobe
Systems, San Jose, CA). The model, complete with all
components, was exported as a PDF model with tessel-
lation compression export format. The PDF model was
then opened in Adobe Acrobat 9 Pro Extended and an
object hierarchy (i.e., model tree) created. Different col-
ors were then assigned to each component followed by
saving the complete model as a PDF file.
The three images shown in Figure 3(A–C) as 2D
images (‘‘posters’’) were created from TIFF format
desktop screenshots of the desired model views and
modified in Corel Draw 11 to show the desired infor-
mation (i.e., cropped to size, etc) and exported to PDF
format as a single file. The previously saved PDF
model was opened in Adobe Acrobat 9 Pro Extended
and the 2D PDF poster included in the model.
After combining the 2D and 3D files, all final viewing
settings were fixed, and preset views were selected
using the camera tool followed by defining a standard
view that would be shown after activation of the 3D
mode. Finally, the model was saved as a PDF file. A
step-by-step guide to creating PDF-integrated 3D
models is available at www.charite.de/immungenetik/
model3d.
Acknowledgments
The authors are grateful to Ms. Claudia Alings for help
with the crystallization trials and the beamline staff at
Bessy II, Berlin for valuable assistance. The authors
thank Dr. Jonathan Tyzack (London) for commenting on
the 3Dmodel.
References1. Madden DR (1995) The three-dimensional structure of
peptide-MHC complexes. Annu Rev Immunol 13:587–622.
2. Rudolph MG, Stanfield RL, Wilson IA (2006) How TCRsbind MHCs, peptides, and coreceptors. Annu Rev Immu-nol 24:419–466.
3. Boyington JC, Motyka SA, Schuck P, Brooks AG, Sun PD(2000) Crystal structure of an NK cell immunoglobulin-like receptor in complex with its class I MHC ligand. Na-ture 405:537–543.
4. Fan QR, Long EO, Wiley DC (2001) Crystal structure ofthe human natural killer cell inhibitory receptorKIR2DL1-HLA-Cw4 complex. Nat Immunol 2:452–460.
5. Krogsgaard M, Davis MM (2005) How T cells ‘see’ anti-gen. Nat Immunol 6:239–245.
6. Deng L, Mariuzza RA (2007) Recognition of self-peptide-MHC complexes by autoimmune T-cell receptors. TrendsBiochem Sci 32:500–508.
7. Godfrey DI, Rossjohn J, McCluskey J (2008) The fidelity,occasional promiscuity, and versatility of T cell receptorrecognition. Immunity 28:304–314.
8. Falk K, Rotzschke O, Stevanovic S, Jung G, RammenseeHG (1991) Allele-specific motifs revealed by sequencingof self-peptides eluted from MHC molecules. Nature 351:290–296.
9. Guo HC, Madden DR, Silver ML, Jardetzky TS, GorgaJC, Strominger JL, Wiley DC (1993) Comparison of theP2 specificity pocket in three human histocompatibilityantigens: HLA-A*6801, HLA-A*0201, and HLA-B*2705.Proc Natl Acad Sci USA 90:8053–8057.
10. Rammensee HG, Falk K, Rotzschke O (1993) Peptidesnaturally presented by MHC class I molecules. Annu RevImmunol 11:213–244.
11. DiBrino M, Tsuchida T, Turner RV, Parker KC, ColiganJE, Biddison WE (1993) HLA-A1 and HLA-A3 T cellepitopes derived from influenza virus proteins predictedfrom peptide binding motifs. J Immunol 151:5930–5935.
12. Falk K, Rotzschke O, Takiguchi M, Grahovac B, Gnau V,Stevanovic S, Jung G, Rammensee HG (1994) Peptidemotifs of HLA-A1, -A11, -A31, and -A33 molecules. Immu-nogenetics 40:238–241.
13. Kubo RT, Sette A, Grey HM, Appella E, Sakaguchi K,Zhu NZ, Arnott D, Sherman N, Shabanowitz J, MichelH (1994) Definition of specific peptide motifs for fourmajor HLA-A alleles. J Immunol 152:3913–3924.
47 PROTEIN SCIENCE VOL 18:37—49 Kumar et al.
14. Hulsmeyer M, Chames P, Hillig RC, Stanfield RL, Held G,Coulie PG, Alings C, Wille G, Saenger W, Uchanska-Zie-gler B, Hoogenboom HR, Ziegler A (2005) A major histo-compatibility complex-peptide-restricted antibody and Tcell receptor molecules recognize their target by distinctbinding modes: crystal structure of human leukocyte anti-gen (HLA)-A1-MAGE-A1 in complex with Fab-Hyb3. JBiol Chem 280:2972–2980.
15. Armstrong KM, Insaidoo FK, Baker BM (2008) Thermo-dynamics of T-cell receptor-peptide/MHC interactions:progress and opportunities. J Mol Recognit 21:275–287.
16. Garboczi DN, Ghosh P, Utz U, Fan QR, Biddison WE,Wiley DC (1996) Structure of the complex betweenhuman T-cell receptor, viral peptide and HLA-A2. Nature384:134–141.
17. van der Bruggen P, Traversari C, Chomez P, Lurquin C,De Plaen E, Van den Eynde B, Knuth A, Boon T (1991)A gene encoding an antigen recognized by cytolytic Tlymphocytes on a human melanoma. Science 254:1643–1647.
18. Chomez P, De Backer O, Bertrand M, De Plaen E, BoonT, Lucas S (2001) An overview of the MAGE gene familywith the identification of all human members of the fam-ily. Cancer Res 61:5544–5551.
19. Boon T, Coulie PG, Van den Eynde BJ, van der BruggenP (2006) Human T cell responses against melanoma.Annu Rev Immunol 24:175–208.
20. Renkvist N, Castelli C, Robbins PF, Parmiani G (2001) Alisting of human tumor antigens recognized by T cells.Cancer Immunol Immunother 50:3–15.
21. Ziegler A, Coulie PG, Uchanska-Ziegler B (2007)Monoclonal and recombinant antibodies with T cell re-ceptor-like reactivity. Recent Results Cancer Res 176:229–241.
22. Chlewicki LK, Holler PD, Monti BC, Clutter MR, KranzDM (2005) High-affinity, peptide-specific T cell receptorscan be generated by mutations in CDR1, CDR2 or CDR3.J Mol Biol 346:223–239.
23. Abastado JP, Darche S, Jouin H, Delarbre C, Gachelin G,Kourilsky P (1989) A monoclonal antibody recognizes asubset of the H-2Dd mouse major class I antigens. ResImmunol 140:581–594.
24. Aharoni R, Teitelbaum D, Arnon R, Puri J (1991) Immu-nomodulation of experimental allergic encephalomyelitisby antibodies to the antigen-Ia complex. Nature 351:147–150.
25. Murphy DB, Rath S, Pizzo E, Rudensky AY, George A,Larson JK, Janeway CA, Jr (1992) Monoclonal antibodydetection of a major self peptide. MHC class II complex.J Immunol 148:3483–3491.
26. Uchanska-Ziegler B, Nossner E, Schenk A, Ziegler A,Schendel DJ (1993) Soluble T cell receptor-like propertiesof an HLA-B35-specific monoclonal antibody (TU165).Eur J Immunol 23:734–738.
27. Wang J, Yu DT, Fukazawa T, Kellner H, Wen J,Cheng XK, Roth G, Williams KM, Raybourne RB (1994)A monoclonal antibody that recognizes HLA-B27 inthe context of peptides. J Immunol 152:1197–1205.
28. Eastman S, Deftos M, DeRoos PC, Hsu DH, Teyton L,Braunstein NS, Hackett CJ, Rudensky A (1996) A studyof complexes of class II invariant chain peptide: majorhistocompatibility complex class II molecules using anew complex-specific monoclonal antibody. Eur J Immu-nol 26:385–393.
29. Dadaglio G, Nelson CA, Deck MB, Petzold SJ, UnanueER (1997) Characterization and quantitation of peptide-MHC complexes produced from hen egg lysozyme usinga monoclonal antibody. Immunity 6:727–738.
30. Porgador A, Yewdell JW, Deng Y, Bennink JR, GermainRN (1997) Localization, quantitation, and in situ detec-tion of specific peptide-MHC class I complexes using amonoclonal antibody. Immunity 6:715–726.
31. Rehm A, Rohr A, Seitz C, Wonigeit K, Ziegler A, Uchan-ska-Ziegler B (2000) Structurally diverse forms of HLA-B27 molecules are displayed in vivo in a cell type-depend-ent manner. Hum Immunol 61:408–418.
32. Chames P, Hufton SE, Coulie PG, Uchanska-Ziegler B,Hoogenboom HR (2000) Direct selection of a humanantibody fragment directed against the tumor T-cell epi-tope HLA-A1-MAGE-A1 from a nonimmunized phage-Fablibrary. Proc Natl Acad Sci USA 97:7969–7974.
33. Fremont DH, Stura EA, Matsumura M, Peterson PA, Wil-son IA (1995) Crystal structure of an H-2Kb-ovalbuminpeptide complex reveals the interplay of primary and sec-ondary anchor positions in the major histocompatibilitycomplex binding groove. Proc Natl Acad Sci USA 92:2479–2483.
34. Zhao R, Loftus DJ, Appella E, Collins EJ (1999) Struc-tural evidence of T cell xeno-reactivity in the absence ofmolecular mimicry. J Exp Med 189:359–370.
35. Madden DR, Garboczi DN, Wiley DC (1993) The anti-genic identity of peptide-MHC complexes: a comparisonof the conformations of five viral peptides presented byHLA-A2. Cell 75:693–708.
36. Kjer-Nielsen L, Clements CS, Brooks AG, Purcell AW, FontesMR, McCluskey J, Rossjohn J (2002) The structure of HLA-B8 complexed to an immunodominant viral determinant:peptide-induced conformational changes and a mode ofMHC class I dimerization. J Immunol 169:5153–5160.
37. Tynan FE, Borg NA, Miles JJ, Beddoe T, El-Hassen D,Silins SL, van Zuylen WJ, Purcell AW, Kjer-Nielsen L,McCluskey J, Burrows SR, Rossjohn J (2005) High reso-lution structures of highly bulged viral epitopes bound tothe major histocompatibility complex class I. Implicationsfor T-cell receptor engagement and T-cell immunodomi-nance. J Biol Chem 280:23900–23909.
38. Reiser JB, Gregoire C, Darnault C, Mosser T, GuimezanesA, Schmitt-Verhulst AM, Fontecilla-Camps JC, Mazza G,Malissen B, Housset D (2002) A T cell receptorCDR3beta loop undergoes conformational changes of un-precedented magnitude upon binding to a peptide/MHCclass I complex. Immunity 16:345–354.
39. Fremont DH, Matsumura M, Stura EA, Peterson PA, Wil-son IA (1992) Crystal structures of two viral peptides incomplex with murine MHC class I H-2Kb. Science 257:919–927.
40. Reiser JB, Darnault C, Gregoire C, Mosser T, Mazza G,Kearney A, van der Merwe PA, Fontecilla-Camps JC,Housset D, Malissen B (2003) CDR3 loop flexibility con-tributes to the degeneracy of TCR recognition. NatImmunol 4:241–247.
41. Luz JG, Huang M, Garcia KC, Rudolph MG, Apostolopou-los V, Teyton L, Wilson IA (2002) Structural comparisonof allogeneic and syngeneic T cell receptor-peptide-majorhistocompatibility complex complexes: a buried alloreac-tive mutation subtly alters peptide presentation substan-tially increasing V(beta) interactions. J Exp Med 195:1175–1186.
42. Fan QR, Wiley DC (1999) Structure of human histocom-patibility leukocyte antigen (HLA)-Cw4, a ligand for theKIR2D natural killer cell inhibitory receptor. J Exp Med190:113–123.
43. Mareeva T, Martinez-Hackert E, Sykulev Y (2008) How aTCR-like antibody recognizes MHC-bound peptide. J BiolChem 283:29053–29059.
44. Buslepp J, Wang H, Biddison WE, Appella E, Collins EJ(2003) A correlation between TCR Valpha docking on
Ligand-Induced Changes in HLA-A1 Conformation PROTEINSCIENCE.ORG 48
MHC and CD8 dependence: implications for T cell selec-tion. Immunity 19:595–606.
45. Kjer-Nielsen L, Clements CS, Purcell AW, Brooks AG,Whisstock JC, Burrows SR, McCluskey J, Rossjohn J(2003) A structural basis for the selection of dominantalphabeta T cell receptors in antiviral immunity. Immu-nity 18:53–64.
46. Tynan FE, Burrows SR, Buckle AM, Clements CS, BorgNA, Miles JJ, Beddoe T, Whisstock JC, Wilce MC, SilinsSL, Burrows JM, Kjer-Nielsen L, Kostenko L, Purcell AW,McCluskey J, Rossjohn J (2005) T cell receptor recogni-tion of a ‘super-bulged’ major histocompatibility complexclass I-bound peptide. Nat Immunol 6:1114–1122.
47. Reiser JB, Darnault C, Guimezanes A, Gregoire C, MosserT, Schmitt-Verhulst AM, Fontecilla-Camps JC, MalissenB, Housset D, Mazza G (2000) Crystal structure of a Tcell receptor bound to an allogeneic MHC molecule. NatImmunol 1:291–297.
48. Garcia KC, Degano M, Pease LR, Huang M, Peterson PA,Teyton L, Wilson IA (1998) Structural basis of plasticityin T cell receptor recognition of a self peptide-MHC anti-gen. Science 279:1166–1172.
49. Tynan FE, Reid HH, Kjer-Nielsen L, Miles JJ, Wilce MC,Kostenko L, Borg NA, Williamson NA, Beddoe T, PurcellAW, Burrows SR, McCluskey J, Rossjohn J (2007) A Tcell receptor flattens a bulged antigenic peptide pre-sented by a major histocompatibility complex class Imolecule. Nat Immunol 8:268–276.
50. Narzi D, Winkler K, Saidowsky J, Misselwitz R, Ziegler A,Bockmann RA, Alexiev U (2008) Molecular determinantsof major histocompatibility complex class I complexstability: shaping antigenic features through short andlong range electrostatic interactions. J Biol Chem 283:23093–23103.
51. Marrack P, Rubtsova K, Scott-Browne J, Kappler JW(2008) T cell receptor specificity for major histocompati-bility complex proteins. Curr Opin Immunol 20:203–207.
52. Huseby ES, White J, Crawford F, Vass T, Becker D,Pinilla C, Marrack P, Kappler JW (2005) How the T cellrepertoire becomes peptide and MHC specific. Cell 122:247–260.
53. Huseby ES, Kappler JW, Marrack P (2008) Thymic selec-tion stifles TCR reactivity with the main chain structureof MHC and forces interactions with the peptide sidechains. Mol Immunol 45:599–606.
54. Adams EJ, Chien YH, Garcia KC (2005) Structure of agammadelta T cell receptor in complex with the nonclass-ical MHC T22. Science 308:227–231.
55. Garboczi DN, Hung DT, Wiley DC (1992) HLA-A2-pep-tide complexes: refolding and crystallization of moleculesexpressed in Escherichia coli and complexed with singleantigenic peptides. Proc Natl Acad Sci USA 89:3429–3433.
56. Leslie A. MOSFLM users guide. Cambridge, UK: MRCLaboratory of Molecular Biology; 1995.
57. Kabsch W (1988) Evaluation of single-crystal X-ray dif-fraction data from a position-sensitive detector. J ApplCrystallogr 21:916–924.
58. Vagin A, Teplyakov A (1997) MOLREP: an automatedprogram for molecular replacement. J Appl Crystallogr30:1022–1025.
59. McCoy AJ, Grosse-Kunstleve RW, Storoni LC, Read RJ(2005) Likelihood-enhanced fast translation functions.Acta Crystallogr D Biol Crystallogr 61:458–464.
60. Murshudov GN, Vagin AA, Dodson EJ (1997) Refinementof macromolecular structures by the maximum-likelihoodmethod. Acta Crystallogr D Biol Crystallogr 53:240–255.
61. Emsley P, Cowtan K (2004) Coot: model-building toolsfor molecular graphics. Acta Crystallogr D Biol Crystallogr60:2126–2132.
62. Brunger AT, Adams PD, Clore GM, DeLano WL, GrosP, Grosse-Kunstleve RW, Jiang JS, Kuszewski J, NilgesM, Pannu NS, Read RJ, Rice LM, Simonson T, WarrenGL (1998) Crystallography & NMR system: a newsoftware suite for macromolecular structure determina-tion. Acta Crystallogr D Biol Crystallogr 54:905–921.
63. Lee B, Richards FM (1971) The interpretation of proteinstructures: estimation of static accessibility. J Mol Biol55:379–400.
64. Kabsch W, Kabsch H, Eisenberg D (1976) Packing in anew crystalline form of glutamine synthetase from Esche-richia coli. J Mol Biol 100:283–291.
65. DeLano W. The PyMOL molecular graphics system. SanCarlos, CA: DeLano Scientific; 2002.
66. Kumar P, Ziegler A, Ziegler J, Uchanska-Ziegler B, Ziegler A(2008) Grasping molecular structures through publication-integrated 3Dmodels. Trends BiochemSci 33:408–412.
67. Kabsch W (1976) A solution for the best rotation to relatetwo sets of vectors. Acta Crystallogr Sect A 32:2.
49 PROTEIN SCIENCE VOL 18:37—49 Kumar et al.