"La Gramática – primera ‘operación encubierta’ de la guerra" . Butt, Lukin & Matthiessen
Upload
khangminh22Category
view
2download
0
MAGNETICALLY IMPELLED ARC BUTT (MIAB) WELDING OF CHROMIUM-
PLATED STEEL TUBULAR COMPONENTS UTILIZING ARC VOLTAGE MONITORING TECHNIQUES
DISSERTATION
Presented in Partial Fulfillment of the Requirements for the Degree Doctor of
Philosophy in the Graduate School of The Ohio State University
By
David H. Phillips, M.S.W.E
*****
The Ohio State University 2008
Dissertation Committee:
Professor Charley Albright, Advisor Approved by
Professor Dave Dickinson _________________________________ Professor John Lippold Advisor Welding Engineering Graduate Program

ii
ABSTRACT
Magnetically Impelled Arc Butt (MIAB) welding is a forge welding technique
which generates uniform heating at the joint through rapid rotation of an arc. This
rotation results from forces imposed on the arc by an external magnetic field. MIAB
welding is used extensively in Europe, but seldom utilized in the United States. The
MIAB equipment is robust and relatively simple in design, and requires low upset
pressures compared to processes like Friction welding.
In the automotive industry, tubular construction offers many advantages due
to the rigidity, light weight, and materials savings that tubes provide. In the case of
automotive suspension components, tubes may be chromium-plated on the ID to
reduce the erosive effects of a special damping fluid. Welding these tubes using the
MIAB welding process offers unique technical challenges, but with potential for
significant cost reduction vs. other welding options such as Friction welding. Based
on published literature, this research project represented the first attempt to MIAB
weld chromium-plated steel tubes, and to utilize voltage monitoring techniques to
assess weld quality.

iii
Optical and SEM microscopy, tensile testing, and an ID bend test technique
were all used to assess the integrity of the MIAB weldments. This analysis revealed
the potential for chromium-enriched regions, most likely chromium oxides, to
become trapped at the weld interface resulting in severe degradation of mechanical
properties. Voltage plots generated during the arc monitoring were analyzed and
correlated with Design of Experiment (DOE) statistical results and high speed video
images.
The DOE results revealed the individual and interactive importance of arc
heating (referred to as level II) time, expulsion (referred to as level III) current, and
arc gap on weld quality. Correlations were established between specific features of
the arc voltage plots and weld quality. Based on arc physics theory, it was proposed
that these three variables affected arc pressure, which contributed to improved
expulsion and a reduction in chromium entrapment in the joint. As a result,
feasibility for MIAB welding chrome-plated suspension components was established,
and voltage monitoring methodology was identified as a potential quality control
technique for producing this joint.

iv
Dedicated to my parents, whose guidance and unwavering support has always propelled me through the difficult times in my life, and my sister Barbara, who has
been my “guiding light” throughout adulthood

v
ACKNOWLEDGMENTS
I would like to thank my advisor, Professor Charley Albright, for first
providing me with the opportunity to pursue a PhD, and then supporting and
encouraging me throughout the process, while always allowing me some measure of
independence.
I am grateful to my good friend, Dr. Anthony Ananthanarayanan, for all of his
moral, technical, and financial support throughout most of my PhD studies, and for
allowing me the flexibility to pursue this degree while simultaneously working at
Delphi.
I am thankful to Delphi for providing most of the financial support during my
PhD. A special thank you goes out to Tom McCray and Jule Hegwood, who spent
countless hours helping me with the DOE and statistical analysis aspect of this
research.
I would also like to thank Dr. Vladimir Kachinskiy who provided valuable
technical insight.

vi
VITA March 6, 1961 ……………..................... Born – Chillicothe, Ohio
1984 ……………………………………. B.S. Welding Engineering, The Ohio State University
1986 ……………………………………. M.S. Welding Engineering, The Ohio State University
1986 - 1987 …………………………….. Corporate Welding Engineer Motor Wheel Corporation Lansing, Michigan 1987 - 1992 ……………………………... Welding Engineer GE Aircraft Engines Cincinnati, Ohio 1992 - 2004 …………………………….. Market Leader, Aerospace Edison Welding Institute Columbus, Ohio 2004 – present …………………………... Senior Weld Research Engineer Delphi Kettering, Ohio
PUBLICATIONS
1. D.H. Phillips, W.A. Baeslack III, “Selection and Weldability of Advanced Titanium-Base Alloys”, ASM Handbook Volume 6, Welding, Brazing, and Soldering, 524-528, (1993)

vii
2. W.A. Baeslack III, D.H. Phillips, G.K. Scarr, “Characterization of the Weld Heat Affected Zone in an Alpha-Two Titanium Aluminide”, Materials Characterization, Vol. 28, no. 1, 61-73 (1992) 3. W.A. Baeslack III, D.H. Phillips, C. English, A.P. Woodfield, “Inertia-Friction Welding of an Advanced Rapidly Solidified Titanium Alloy”, Journal of Materials Science Letters 10, 1401-1408 (1991) 4. L.C. Mallory, W.A. Baeslack III, D.H. Phillips, “Evolution of the Weld Heat-Affected Zone Microstructure in a Ti-48Al-2Cr-2Nb Gamma Titanium Aluminide”, Journal of Materials Science Letters 13, 1061-1065 (1994) 5. L.C. Mallory, W.A. Baeslack III, D.H. Phillips, T.J. Kelly, “Gas Tungsten Arc Welding of a Ti-48Al-2Cr-2Nb Gamma Titanium Aluminide”, Titanium ’92 Science and Technology, Proceedings, Symposium at 7th World Titanium Conference, San Diego, Vol.2; 29 June-2 July 1992, 1115-1122, (1993) 6. S.A. David, J.A. Horton, G.M. Goodwin, D.H. Phillips, R.W. Reed, “Weldability and Microstructure of a Titanium Aluminide”, Welding Journal, Vol. 69, no. 4, 133s-140s, (April, 1990) 7. M.C. Juhas et. al., “Interface Characteristics of Solid Phase Welds Between Ti-6Al-2Sn-4Zr-2Mo-0.1Si and 14Al-21Nb Titanium Aluminide” Titanium ’92 Science and Technology, Proceedings, Symposium at 7th World Titanium Conference, San Diego, Vol.2; 29 June-2 July 1992, 1453-1460, (1993) 8. K.N. Hou, et. al., “An Electron Microscopy Study of Inertia-Friction Welds in Ti-48Al-2Cr-2Nb Gamma Titanium Aluminide”, International Trends in Welding Science and Technology, Gatlinburg, Tennessee, 1-5 June 1992, 1135-1137, (1993)
FIELDS OF STUDY
Major Field: Welding Engineering
viii
TABLE OF CONTENTS
ABSTRACT .................................................................................................................................................. ii ACKNOWLEDGMENTS.............................................................................................................................v VITA..............................................................................................................................................................vi LIST OF FIGURES ......................................................................................................................................x LIST OF TABLES .....................................................................................................................................xvi
CHAPTERS:
1. INTRODUCTION....................................................................................................................................1 1.1 MIAB WELD PROCESS DESCRIPTION ........................................................................................... 1
1.1.1 MIAB Welding Principles .................................................................................................... 3 1.1.2 Comparison to other Welding Processes............................................................................. 6
1.2 ARC MONITORING SYSTEMS......................................................................................................... 7 1.3 MOTIVATION FOR WELDING CHROMIUM-PLATED STEEL TUBES .................................................. 7 1.4 OBJECTIVES OF THE RESEARCH .................................................................................................... 9
2. TECHNICAL REVIEW ........................................................................................................................10 2.1 MAGNETIC FLUX AT THE MIAB WELD JOINT............................................................................. 10 2.2 ARC BEHAVIOR AT THE MIAB WELD JOINT............................................................................... 12 2.3 ARC ROTATION VELOCITY ......................................................................................................... 19 2.4 MIAB WELDING OF NON-FERROUS MATERIALS........................................................................ 23 2.5 SHIELDING GAS EFFECTS............................................................................................................ 25 2.6 HEAT FLOW IN THE MIAB WELDING PROCESSES....................................................................... 28 2.7 MIAB APPLICATIONS ................................................................................................................. 30 2.8 GENERAL WELDABILITY OF CHROMIUM-PLATED STEEL............................................................ 32
3. EXPERIMENTAL PROCEDURE .......................................................................................................36 3.1 MIAB EQUIPMENT ..................................................................................................................... 37 3.2 DESCRIPTION OF COMPONENTS AND WELD SET-UP ................................................................... 41 3.3 MECHANICAL TEST METHODS.................................................................................................... 42 3.4 METALLURGICAL EVALUATION METHODS................................................................................. 45 3.5 HIGH SPEED VIDEO MONITORING ............................................................................................... 47 3.6 DOE METHODOLOGY ................................................................................................................. 49 3.7 ARC MONITORING....................................................................................................................... 54

ix
4. RESULTS................................................................................................................................................55 4.1 METALLURGICAL ANALYSIS....................................................................................................... 56 4.2 MECHANICAL ANALYSIS ............................................................................................................ 63 4.3 ANODE/CATHODE EXPERIMENTS................................................................................................ 65 4.4 L12 DOE BASED ON ID BEND TEST CRACK LENGTH ................................................................ 66 4.5 ARC MONITORING PLOTS ........................................................................................................... 70 4.6 HIGH SPEED VIDEO IMAGES ....................................................................................................... 72
5. DISCUSSION .........................................................................................................................................74 5.1 METALLURGICAL ANALYSIS....................................................................................................... 74
5.1.1 Optical Microscopy of Tubes without Chromium-plating.................................................. 74 5.1.2 Optical Microscopy of Tubes with Chromium-plating....................................................... 75 5.1.3 SEM Fractography of MIAB Welds with Chromium-plating............................................. 76 5.1.4 Microhardness Testing ...................................................................................................... 77
5.2 MECHANICAL ANALYSIS ............................................................................................................ 78 5.3 ANODE/CATHODE (JOINT POSITION WITHIN THE MAGNETIC FIELD) EXPERIMENTS.................... 79 5.4 L12 DOE.................................................................................................................................... 82
5.4.1 Individual Effect of Variables on ID Bend Test Crack Length........................................... 83 5.4.2 Interactive Effect of Variables on ID Bend Test Crack Length.......................................... 84 5.4.3 Effect of Variables and the Concept of Arc Force and Arc Pressure ................................ 87 5.4.4 Effect of Arc Gap Setting ................................................................................................... 95
5.5 HIGH SPEED VIDEO IMAGE INTERPRETATION ............................................................................. 98 5.6 ANALYSIS OF ARC MONITORING VOLTAGE PLOTS - CORRELATION WITH DOE RESULTS ........ 100
5.6.1 Analysis of Voltage Plots – Interpretation of Characteristic Features............................. 100 5.6.2 Analysis of Voltage Plots – Effect of Level II Time........................................................... 102 5.6.3 Analysis of Voltage Plots - Effect of Level III Current .................................................... 106 5.6.4 Analysis of Voltage Plots - Effect of Gap Setting............................................................. 109 5.6.5 Summary of Arc Monitoring Voltage Plot Analysis......................................................... 112
5.7 CONCLUSIONS..................................................................................................................... 113 5.8 FUTURE WORK .................................................................................................................... 115
5.8.1 Further Characterization of Fracture Surfaces............................................................... 115 5.8.2 Shielding Gas Effects....................................................................................................... 115 5.8.3 Anode/Cathode Experiments ........................................................................................... 116 5.8.4 Effect of Initial Gap Setting ............................................................................................. 116 5.8.5 Ratio of Solid-State Weld Interface Length to Overall Weld Interface Length................ 117 5.8.6 Further Analysis of Weld Voltage “Signatures” ............................................................. 117 5.8.7 Continuation of High Speed Video and Arc Pressure Analysis ....................................... 118
REFERENCES..........................................................................................................................................119 APPENDIX A ............................................................................................................................................122
A.1 22 MM COMPONENT - RESULTS................................................................................................ 122 A.1.1 Metallurgical Analysis..................................................................................................... 122 A.1.2 Mechanical Analysis........................................................................................................ 126 A.1.3 L16 DOE Based on Weld Interface Length Measurement............................................... 129
A.2 22 MM COMPONENT – DISCUSSION .......................................................................................... 133 A.2.1 Metallurgical Analysis ..................................................................................................... 133 A.2.2 Mechanical Analysis........................................................................................................ 134 A.2.3 L16 DOE ......................................................................................................................... 135
A.3 ARC MONITORING VOLTAGE PLOTS ........................................................................................ 138 A.4 40 MM CHROME-PLATED COMPONENT PRELIMINARY DEVELOPMENT RAW DATA................. 145

x
LIST OF FIGURES
Figure Page 1 Basic Schematic of the MIAB Welding Process……………………………...2 2 Interaction Between Current and an Applied Magnetic Field ………..............3 3 Aligned Magnetic Flux Lines Create Force on Conductor……………………4 4 Radial Component of Arc Current Affects Arc Movement……………….......5 5 Arc Monitoring System Detects GMAW Defect………………………….......8 6 Method for Measuring Magnetic Flux Density……………………………...11 7 Maximum Flux Density Occurs at 5 mm from Pipe Surface………………...11 8 Melting Patterns of Thick-Walled Tube Reveal Melting on ID……………..14 9 Magnetic Flux in Tube-to-Plate Joint Pushes Arc Outward…………………16 10 Arc Trace on Tube End Shows Movement from OD to ID………………….17 11 Magnetic Arc Blow due to Tube Geometry Effects…………………………18 12 Spontaneous Magnetization of Iron as a Function of Temperature………….18 13 Movement of the Arc Toward Tube OD…………………………………......19 14 Speed of Arc Affected by Heating (1) and Arc Gap (2)……………………..20 15 Arc Velocity vs. Time Plot Reveals Three Distinct Regions………………...22 16 Variations in Flux Density at the Joint………………………………………24

xi
Figure Page 17 Magnetic Flux Lines Between Two Aluminum Tubes………………………25 18 Ar-H2 Shielding Gas Increases Process Window for Al-Cu Joints……….....27 19 Good Fit Between Predicted (Dashed Line) and Actual (Solid Line) Heat
Flow in a MIAB Weld……………………………………………………….30 20 MIAB (Magnetarc) Weld Joint of Cast Iron-to-Steel………………………..32 21 Cr-Fe Phase Diagram Shows High Temperature Solid Solubility Between the
Two Metals…………………………………………………………………..33 22 Extensive Cracking in Laser-Welded Chromium-plated Steel………………34 23 MD-101 Pneumatic MIAB Welding Machine……………………………….37 24 Overall Set-up: MD-101, Miller Power Supply, and Control Unit…………..38 25 Close-Up View of Control Unit……………………………………………...38 26 40 mm Components Loaded in Machine Prior to Clamping………………...39 27 Voltage Monitoring Connections for ARCAgent System…………………...40 28 Torroid for Monitoring Current on ARCAgent System……………………..40 29 22 mm Hollow Rod, Tenon, and Holding Fixture…………………………...41 30 40 mm Tenon-Tube Joint Details……………………………………………42 31 ID Bend or "Tulip Test" Technique………………………………………….43 32 ID Bend Test Showing an Acceptable Weld on a 40 mm part………………44 33 Acceptable Tensile Test of 40 mm Component as Indicated by Failure
in Tenon……………………………………………………………………...45 34 Measurement of MIAB Weld Interface Length……………………………...46 35 Concept of Altering Joint Position within Applied Magnetic Field…………48 36 Typical High Speed Video Image……………………………………………49

xii
Figure Page 37 40 mm MIAB Tube-to-Tube Weldment Reveals Plastic Flow……………...57
38 40 mm Tube-to-Tenon Weld Interface………………………………………58 39 40 mm Chromium-plated Tube-to-Tenon Joint Reveals Evidence of Poor
Bonding………………………………………………………………………59 40 SEM Fractograph of Tensile Test Weld Interface Fracture Surface…………60
41 SEM EDS Analysis of Region of Decohesive Rupture on Fracture Surface..61 42 Microhardness of Typical 40 mm Tube-to-Tenon MIAB Weld Joint……….62 43 Failed ID Bend Test of MIAB Weldment Utilizing Chromium-plated
Tube……………………………………………………………………….....63 44 Evidence of Joint Position within Magnetic Field Affecting Arc Location…66 45 Individual Variable Effect of Joint Position, Level III Current, and Level II
Time on Crack Length on 40 mm MIAB Weldments……………………….68 46 Interactive Variable Effects of Joint Position, Level III Current, and Level II
Time on 40 mm MIAB Weldments………………………………………….69 47 Two Typical Arc Monitoring Plots of 40 mm Tube-to-Tenon MIAB Welds………………………………………………………………………...71 48 High Speed Video Image - Joint Centered in Magnetic Field…………….72 49 Joint Shifted Toward Anode Side of Arc…………………………………….73 50 Joint Shifted Toward Cathode Side of Arc…………………………………..73 51 Typical GTAW Arc Results in Much More Heating on Anode Side [22]......80 52 Thermionic Emission of Fe Greatly Exceeds Melting Temperature at
Typical Arc Currents…………………………………………………………80 53 Interactive Variable Effect of Level II Time and Level III Current…………85 54 Magnetic Pinching Effect on GTAW Arc…………………………………...88
xiii
Figure Page 55 Pinching Effect Creates Downward Flow Which Exerts Pressure on
Weld Puddle Depressing It………………………………………………….88 56 Plot of Arc Pressure vs. Radial Distance in a GTAW Arc Reveals
Significant Arc Pressures………………………………………………….....89 57 Plot of Arc Pressure vs. Weld Current in the GTAW Process Shows a
Linear Relationship between Pressure and Current……………………….....90 58 Arc Gap can have Significant Effect on Pressure Depending on
Shielding Gas………………………………………………………………...91 59 Flared Arc Shape in MIAB Welding Creates Outward Pressure
Induced Flow………………………………………………………………...93 60 Individual Variable Effects Including Effect of Gap on Crack Length……...97 61 Interactive Variable Gap Effects on Crack Length – Level III Current……..98 62 Common Features Observed in the Voltage Plots………………………….102 63 Increase in Level II (Arc Heating) Time at a Constant Low Level III Current
Results in Voltage Plateau Prior to Upset………………………………….103 64 Level II Time Effect at Higher Level III Current………………………….104 65 Arc Pressure Variations at Various Arc Lengths for a GTAW Arc……….105 66 Level III Current Has Significant Effect on Expulsion at Short Times……107 67 Expulsion at Long Level II Times is Increased at High Level III Currents…………………………………………………………………….107 68 Arc Force vs. Current……………………………………………………….108 69 Gap Setting Affects Level of Voltage Plateau and Time of Arc
Stabilization………………………………………………………………...110 70 Paschen’s Law……………………………………………………………...111 71 Microhardness Traverse from Tube (left) to Tenon (right)………………...123
xiv
Figure Page 72 Optical Micrograph of a Typical MIAB Weld……………………………..124 73 Macrosection of 22 mm Tenon-to-Tube MIAB Weld……………………...124 74 MIAB Weld Joint Reveals Insufficient Upset……………………………...125 75 Voids Along Weld Interface Can Result from Insufficient Upset…………125 76 Portion of Acceptable 22 mm ID Bend (“Tulip”) Test Coupon……………126 77 Acceptable 22 mm Tensile Test Results in Base Metal (Tenon) Failure…..127 78 22 mm Failed Tensile Test Due to Improper Parameters from Electrical Short
in Controller………………………………………………………………...128 79 Weld Interface Length Measurement Technique Using Pax-It Software….129 80 MIAB Weld Variables Weld Current, Weld Time, and Upset Pressure
Increase Length of MIAB Weld Interface…………………………………131 81 Interactive Variable Effects of MIAB Weld Parameters on Weld Interface
Length………………………………………………………………………132 82 Linear Relationship of Melt Rate vs. Current for GMAW Process………...137 83 L12 Condition #1…………………………………………………………...138 84 L12 Condition #2…………………………………………………………...139 85 L12 Condition #3…………………………………………………………...139 86 L12 Condition #4…………………………………………………………...140 87 L12 Condition #5…………………………………………………………...140 88 L12 Condition #6…………………………………………………………...141 89 L12 Condition #7…………………………………………………………...141 90 L12 Condition #8…………………………………………………………...142

xv
Figure Page 91 L12 Condition #9…………………………………………………………...142 92 L12 Condition #10………………………………………………………….143 93 L12 Condition #11………………………………………………………….143 94 L12 Condition #12………………………………………………………….144

xvi
LIST OF TABLES
Table Page 1 L16 Experimental Layout……………………………………………………51 2 Typical Data From Initial 40 mm Component Development Work…………64 3 L12 Experiment with ID Bend Test Crack Length (mm) Results…………. .67 4 Table 4 – Portion of the 40 mm Preliminary Development Raw Data……..149

1
CHAPTER 1
INTRODUCTION
Magnetically Impelled Arc Butt (MIAB) welding is a unique process in that it
utilizes relatively simple equipment, but relies on very complex interactions between
an arc and both an applied and induced magnetic field. This interaction is made even
more complex by the changes that occur during the heating of the parts being welded.
In this chapter the MIAB weld process is described and compared to other welding
processes which might be considered for the same application. Arc monitoring
methodology is introduced and the motivation for this research program is discussed.
1.1 MIAB Weld Process Description
The MIAB welding process was initially investigated by the E.O. Paton
Electric Welding Institute during the 1950's and 1960's. It was later developed for
commercial applications by Kuka Welding systems, who named it the Magnetarc
process. Today, MIAB welding is used for a variety of applications throughout
Europe and the Ukraine, and Paton continues its MIAB research and development
efforts.
2
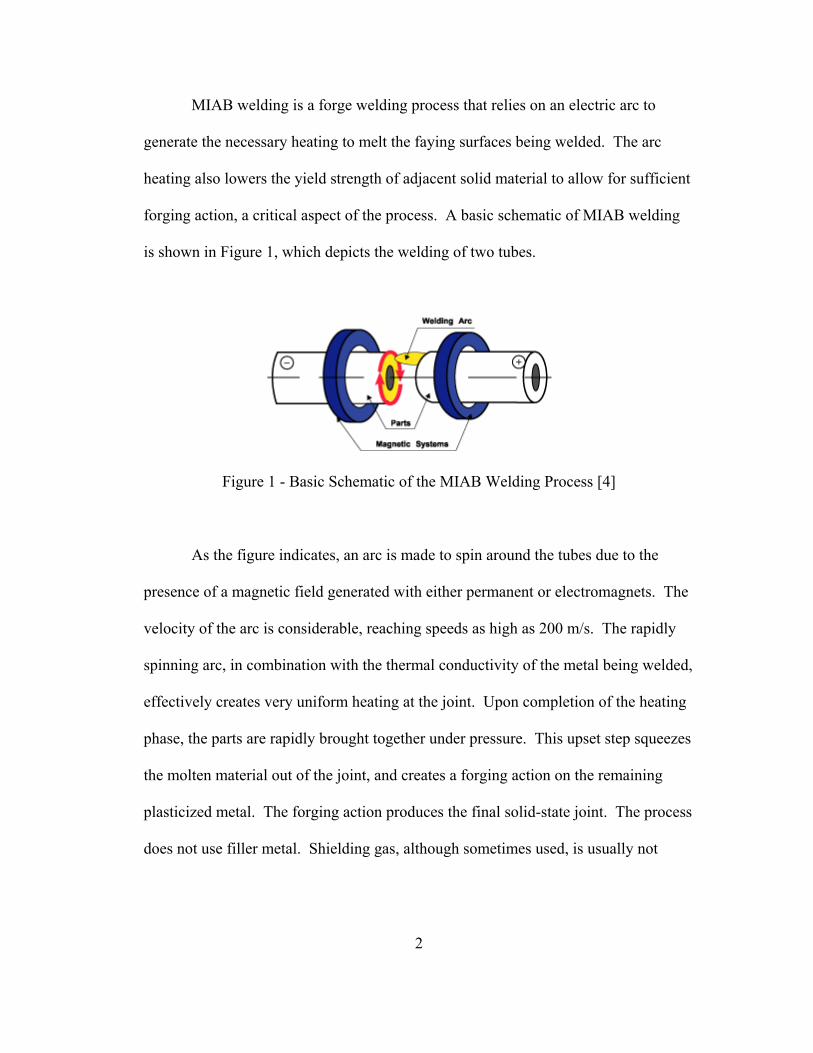
MIAB welding is a forge welding process that relies on an electric arc to
generate the necessary heating to melt the faying surfaces being welded. The arc
heating also lowers the yield strength of adjacent solid material to allow for sufficient
forging action, a critical aspect of the process. A basic schematic of MIAB welding
is shown in Figure 1, which depicts the welding of two tubes.
Figure 1 - Basic Schematic of the MIAB Welding Process [4]
As the figure indicates, an arc is made to spin around the tubes due to the
presence of a magnetic field generated with either permanent or electromagnets. The
velocity of the arc is considerable, reaching speeds as high as 200 m/s. The rapidly
spinning arc, in combination with the thermal conductivity of the metal being welded,
effectively creates very uniform heating at the joint. Upon completion of the heating
phase, the parts are rapidly brought together under pressure. This upset step squeezes
the molten material out of the joint, and creates a forging action on the remaining
plasticized metal. The forging action produces the final solid-state joint. The process
does not use filler metal. Shielding gas, although sometimes used, is usually not

3
required. When shielding gas is not used, as in the case of this research, a short pulse
of high current is added which expels contaminated molten metal prior to upset.
1.1.1 MIAB Welding Principles
As shown in Figure 2, the MIAB welding process relies on the interaction
between electrical current flowing through the arc and a magnetic field. Upon
Figure 2 - Interaction Between Current and an Applied Magnetic Field [29]
initiation of a drawn arc, an electromagnetic force, FL, is generated on the arc. The
force is due to the axial component of current flow in the arc, IL, crossing the radial
component of the applied magnetic field, BL. This electromagnetic force on the
flowing current is referred to as a Lorentz force, and given by: f = J x B,
where f = electromagnetic force density, J = current density, and B = magnetic flux
density. The magnitude of the force, F, is proportional to the magnetic flux density,
B, the arc current I, and the arc length L and given by: F ~ B·I·L
4
The force exerted on the flowing current affects the acceleration of the
rotating arc. Therefore, it is clear that by adjusting the strength of the magnetic field,
the magnitude of the arc current, or the width of the arc gap, the speed of the arc can
be altered. The ability to alter the speed of the arc by changing arc current can play
an important role in the process. In particular, by sharply increasing the current for a
very short time just prior to upset, a rapid expulsion of molten metal occurs which
provides cleaning action. This eliminates the need for shielding gas.
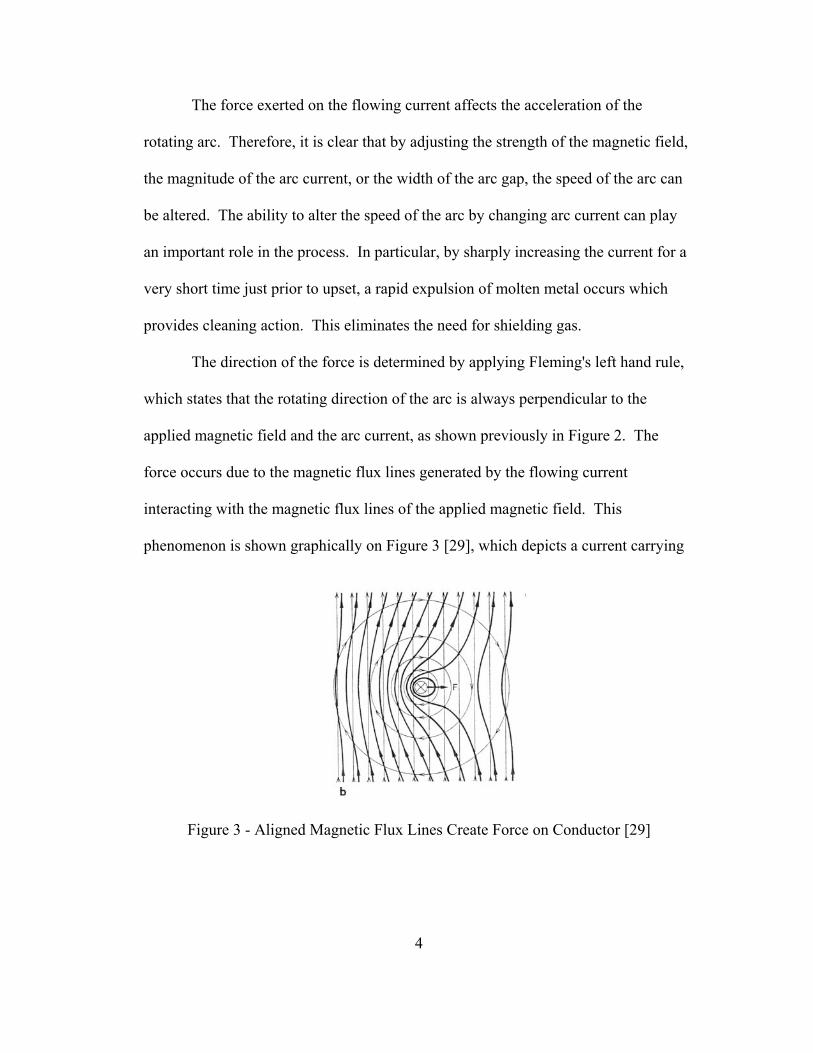
The direction of the force is determined by applying Fleming's left hand rule,
which states that the rotating direction of the arc is always perpendicular to the
applied magnetic field and the arc current, as shown previously in Figure 2. The
force occurs due to the magnetic flux lines generated by the flowing current
interacting with the magnetic flux lines of the applied magnetic field. This
phenomenon is shown graphically on Figure 3 [29], which depicts a current carrying
Figure 3 - Aligned Magnetic Flux Lines Create Force on Conductor [29]
5
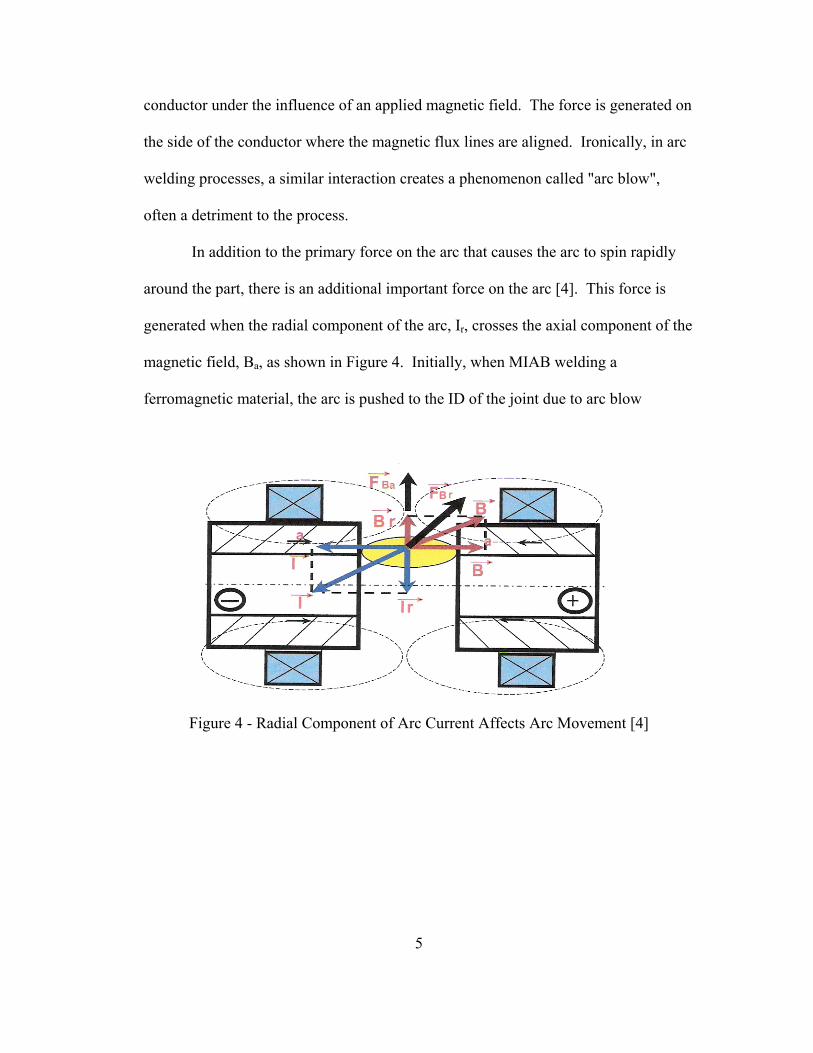
conductor under the influence of an applied magnetic field. The force is generated on
the side of the conductor where the magnetic flux lines are aligned. Ironically, in arc
welding processes, a similar interaction creates a phenomenon called "arc blow",
often a detriment to the process.
In addition to the primary force on the arc that causes the arc to spin rapidly
around the part, there is an additional important force on the arc [4]. This force is
generated when the radial component of the arc, Ir, crosses the axial component of the
magnetic field, Ba, as shown in Figure 4. Initially, when MIAB welding a
ferromagnetic material, the arc is pushed to the ID of the joint due to arc blow
Figure 4 - Radial Component of Arc Current Affects Arc Movement [4]

6
effects. Upon heating, the curie temperature is first reached on the ID of the tube,
altering the distribution of magnetic flux in the joint and pushing the arc outward.
The outward movement of the arc can play an important role in generating uniform
heating at the joint.
1.1.2 Comparison to other Welding Processes The MIAB welding process can be compared to both Friction welding and
Flash welding. Much like Friction welding, MIAB welding is ideal for round parts
(especially tubes and pipes). It produces a solid-state bond at the joint which is
conducive to excellent mechanical properties. Processes which produce solid-state
bonds also provide for the possibility of welding dissimilar metal joints. Unlike
Friction welding, MIAB welding equipment is much simpler and less expensive,
since no part rotation is required and upset pressures are much lower. Other potential
benefits of MIAB welding vs. Friction welding include less internal flash, shorter
weld times, less metal loss, and reduced machine maintenance.
Flash welding does not actually generate a true arc, but relies on the creation
of shorts between the parts being welded, and subsequent rapid expulsion of the metal
at the localized shorting points. This results in considerable loss of material during
the flashing process. Flash welding also does not utilize a magnetic field to control
the movement of the arc, which promotes very uniform heating in the MIAB welding
process. For these reasons, Flash welding is not an ideal process for welding tubular
automotive components.

7
1.2 Arc Monitoring Systems
Arc weld monitoring techniques are effectively used for real-time quality
control in high production Gas Metal Arc Welding (GMAW) applications [30]. They
are easily automated and require minimal maintenance. They can be used to monitor
individual in-process weld faults, as well as overall part and weld tracking. IMPACT
Engineering manufactures and sells such a monitoring system called the ARCAgent.
An example of how the ARCAgent system and associated software can be used to
monitor GMAW quality is shown in Figure 5. This example shows a lap joint
weldment that exhibits lack of fusion toward the left side of the weld, and the
associated current/voltage signature recorded by the ARCAgent monitoring system
that clearly detects this defect. There is no known documentation that indicates such
a system has been used for monitoring MIAB welding prior to this research.
1.3 Motivation for Welding Chromium-Plated Steel Tubes
Tubes continue to become more and more important in the construction of an
automobile. Tubes provide light weight, excellent rigidity, and low cost. In
particular, tubular suspension components are becoming more sophisticated in their
design, and often require a weld joint in their construction. Tubular joints represent
an ideal application for MIAB since the tube geometry plays a significant role in
controlling the arc path, which promotes uniform heating of the joint.
A current important Delphi suspension component, called an MR
(Magnetorheological) Damper, provides for a continuously variable suspension

8
Figure 5 - Arc Monitoring System Detects GMAW Defect
mechanism. This is achieved through the ability to vary the viscosity of an MR fluid
by altering the magnetic field surrounding the fluid. By changing the viscosity of the
fluid, the yield force of the damper can be controlled. The MR fluid contains
Highlighted region indicative of lack of fusion observed in weld below
Region of poor fusion

9
particles that are erosive, leading to the requirement for the interior of the damper
tube receiving a chromium-plating treatment to resist the erosive effects of the fluid.
The construction of this damper requires that a threaded fitting called a tenon be
welded to the chromium-plated tube. Friction welding is one alternative for
producing this joint, but as stated previously, has several potential disadvantages vs.
MIAB welding.
1.4 Objectives of the Research
The primary objectives of this research project are as follows:
1) To establish feasibility for MIAB welding chromium-plated tube-to-tenon joints
utilizing DOE methodology.
2) To understand the effects of critical MIAB weld variables for producing this joint.
3) To develop an approach for monitoring the MIAB welding process, and therefore
the quality of the chromium-plated tube-to-tenon weldment, utilizing arc monitoring
techniques.
4) To develop correlations between arc physics and arc welding theories, the arc
monitoring methodology, and the effect of important MIAB weld variables on the
quality of the chromium-plated tube-to-tenon MIAB weldments.

10
CHAPTER 2
TECHNICAL REVIEW
Relative to other welding processes, the amount of published research on
MIAB welding is very limited. Also, many of the papers are translated from Russian.
In some cases the translations are not clear, adding to the difficulty of understanding
what is already a very complex process. This chapter summarizes the papers which
were considered most relevant to this research. This summary also illustrates the
considerable disagreement among the authors on a variety of MIAB welding
concepts. Particular discrepancies pertain to the interaction between the arc and the
applied and induced magnetic field.
2.1 Magnetic Flux at the MIAB Weld Joint
Kim and Choi [1] developed a two-dimensional finite element model for the
analysis of magnetic flux density distributions produced by electromagnets at the
MIAB weld joint. The primary objective was to establish a relationship between the
strength of the radial magnetic field at the joint and the quality of the weld joint

11
between two steel pipes. This concept was based on the knowledge that a stronger
magnetic field produces a higher force on the arc, resulting in faster arc speeds and
more uniform heating. Their experimental approach, shown in Figure 6, utilized a
Gauss-meter at the center of the joint, and flux density was plotted vs. distance from
the outer surface of the pipes at various distances from the exciting coil. Figure 7
reveals the resulting plot developed when the exciting coils were located 10 mm from
Figure 6 - Method for Measuring Magnetic Flux Density
Figure 7 - Maximum Flux Density Occurs at 5 mm from Pipe Surface

12
the probe. This plot shows a maximum flux density approximately 5 mm from the
pipe surfaces, and also reveals the accuracy of the finite element model developed.
The authors concluded that it was important to maintain maximum flux density at the
joint for best weld quality. Therefore, the design of the electromagnet system for each
application is very important, as is the exciting current applied to the electromagnets.
Gap size between the two pipes and relative permeability both had an effect on the
magnetic flux at the joint. In summary, they showed that magnetic flux density
increases with increasing permeability, decreasing distance from the magnets, and
decreasing gap size. They also proposed that their numerical analysis model could be
used in the design of electromagnet systems.
2.2 Arc Behavior at the MIAB Weld Joint
Steffen and Welz [2] investigated a variety of conditions and their effect on
arc behavior, including the use of internal and external magnets and different power
sources. Steel tubes of various dimensions were utilized. A high speed video camera
and an electronic image converter were used to study the arc. Images from this set-up
revealed the major differences between the action of the arc at the anode vs. the
cathode side of the joint. The arc was seen to move freely on the anode side of the
joint, but was constricted on the cathode side. As a result, when the arc is forced to
move in the presence of a magnetic field, the anode spot is blown ahead while the
cathode spot trails.

13
The arc was also seen to always initiate along the ID of the tube edges. They
proposed this was due to the fact that the arc prefers regions that heat up the most
quickly, and where the induced magnetic field surrounding the arc encounters the
least magnetic resistance from the applied field. They postulated that as the steel
melts on the ID edges, the arc length increases. The longer arc, combined with
centrifugal forces pushing the arc outward, results in the arc moving toward the OD
as the weld progresses. Internal magnets resulted in faster starting of the weld, but
external magnets provided for a more controlled rotation of the magnet.
Several DC rectified power sources were evaluated and compared to power
generated from a bank of batteries. This study revealed a marked improvement in arc
characteristics when using the batteries. The batteries provided much more consistent
power due to the small amount of inductance in the system vs. the power supply
inductance. Although batteries are of course impractical for this application, the
authors noted the importance of this information regarding the future development of
low inductance power supplies. It was also shown that arc voltage was mostly
independent of the power source used, but highly dependent on the arc gap.
Nentwig and Ludwig [3] also studied and contrasted the effect of an internal
vs. an external magnetic coil on arc behavior during MIAB welding of tubes. It was
determined that the maximum radial flux density in the weld gap is always along the
edge of the tube closest to the coil. When welding ferromagnetic materials, the
magnetic flux density drops sharply across the wall thickness of the tube. This
mainly affects the arc starting characteristics immediately following arc initiation.

14
Interestingly, the arc was always observed to initiate on the ID of the tube, regardless
of whether or not an external or internal coil was used. But arc stabilization occurred
much more quickly with an internal coil, leading the authors to conclude that, when
possible, it is always more desirable to utilize an internal vs. an external magnetic
coil.
At the E.O. Paton Electric Welding Institute, Kachinskiy et. al. [4]
investigated arc behavior during the welding of hollow parts with very thick (> 6 mm)
wall thicknesses. In general, it becomes very difficult to MIAB weld thick walled
components due to the tendency of the arc to concentrate on the ID of the component,
resulting in uneven heating. Kachinskiy also postulated that the anode and cathode
spot sizes of an arc should be relatively large relative to the wall thickness to achieve
even heating. As shown in Figure 8, arc column traces consume the ID of the thick-
walled tubes during the initial stages of welding. Upon further heating, the arc
Figure 8 - Melting Patterns of Thick-Walled Tube Reveal Melting on ID [4]
Melting patterns evident along tube ID

15
column moves to the OD, but the large wall thicknesses prevent stable movement of
the arc to the region of higher magnetic field induction leading to non-uniform
heating.
In order to improve this situation, the authors adjusted the position of the
magnetic field in such a way to emphasize the axial component vs. the radial
component of the applied magnetic field. With this new approach, a larger axial
magnetic flux component crosses the radial current component of the arc. This, in
turn, produces a greater force on the arc pushing, it toward the OD of the tube. This
force was shown previously on Figure 4.
Additional research at Paton by Kuchuk-Yatsenko et. al. [5] focused on arc
behavior during MIAB welding of a tube to a plate. In this type of joint, the
displacement of the arc from the ID to the OD discussed previously is much more
pronounced due to the magnetic blow resulting from the interaction of the arc and the
induced magnetic field. This creates a greater concentration of magnetic lines of
force on the ID of the tube, which pushes the arc outward as shown in Figure 9.
This situation can again lead to uneven heating and a poor quality weld. As
with Kachinskiy's work, the importance of controlling the axial component of the
magnetic field was emphasized. The ability to alter the axial component of the
magnetic field allowed for more precise control of the radial position of the arc in the
joint. This produces more uniform heating, and thus, better quality welds. Such
adjustments can be made by changing the magnetic field strength on one side of the

16
Figure 9 - Magnetic Flux in Tube-to-Plate Joint Pushes Arc Outward [5]
joint relative to the other side. A rotating electromagnet with an elliptical shape on
the plate side of the joint was also shown to be beneficial in controlling the radial
displacement of the arc.
Sato, Katayama, Ioka, and Otani [6] studied the phenomenon of the arc
initiating on the ID of steel pipes and then moving to the OD, especially when
welding thick cross-sections. Photo-transistors were used to assess the movement of
the arc. Arc traces of the pipe ends were conducted when the arc was initiated on the
OD in the presence of an applied magnetic field, and also, in the absence of an
applied magnetic field. In both cases, the arc moved to the ID of the pipe. One
example of this movement is shown in Figure 10. Thus, the authors showed that the
initial movement of the arc along the ID during the initial arcing phase was not due to
the arc initiating there, nor was it due to the applied magnetic field pushing it toward

17
the ID. Instead, the authors postulated and later verified, that a magnetic arc blow
event is created due to the tube geometry interacting with the magnetic field of the
Figure 10 - Arc Trace on Tube End Shows Movement from OD to ID [6]
arc. This creates stronger lines of force on the OD of the tube which pushes the arc
toward the ID. This concept is shown on Figure 11.
Upon further heating, the authors theorized that the movement of the arc from
the ID to the OD of the tube was due to the magnetic variations of the tube ends as
the temperature rises. Specifically, as Figure 12 indicates, spontaneous magnetism of
iron drops with temperature, and at the Curie temperature (770ºC), iron is no longer
considered magnetic. This creates a condition in which the magnetic arc blow pushes
the arc toward the OD. The authors further verified this by plotting arc movement
from the ID to the OD as a function of heating time and arc current. These results are
shown on Figure 13 which clearly indicates a strong relationship between movement
of the arc toward the OD and arc time and current.
Arc trace

18
Figure 11 - Magnetic Arc Blow due to Tube Geometry Effects [6]
Figure 12 - Spontaneous Magnetization of Iron as a Function of Temperature [6]

19
Figure 13 - Movement of the Arc Toward Tube OD [6]
2.3 Arc Rotation Velocity
Yatsenko, Syrovatka, and Kuznetsov [7] studied the velocity of the arc
moving in the gap between a tube and a plate. Specifically, they evaluated the affect
of weld parameters and arc gap variations. Photoelectric cells and galvanometers
were utilized to study the arc movement. It was determined that the speed of the arc
depends on welding current, the magnetic field intensity, the arc gap, and the
temperature of the metals being welded. Figure 14 summarizes their results, showing
the effect of arc gap and heating (arcing time) on the speed of the arc. Scale and
oxides on the faying surfaces at the joint played a role in arc velocity and mobility.
The arc was also observed to become highly mobile if scale was removed from the
plate and tube ends. Distinctions between the anode (tube side) and cathode (plate
Higher voltages indicate movement of arc toward OD of joint
20
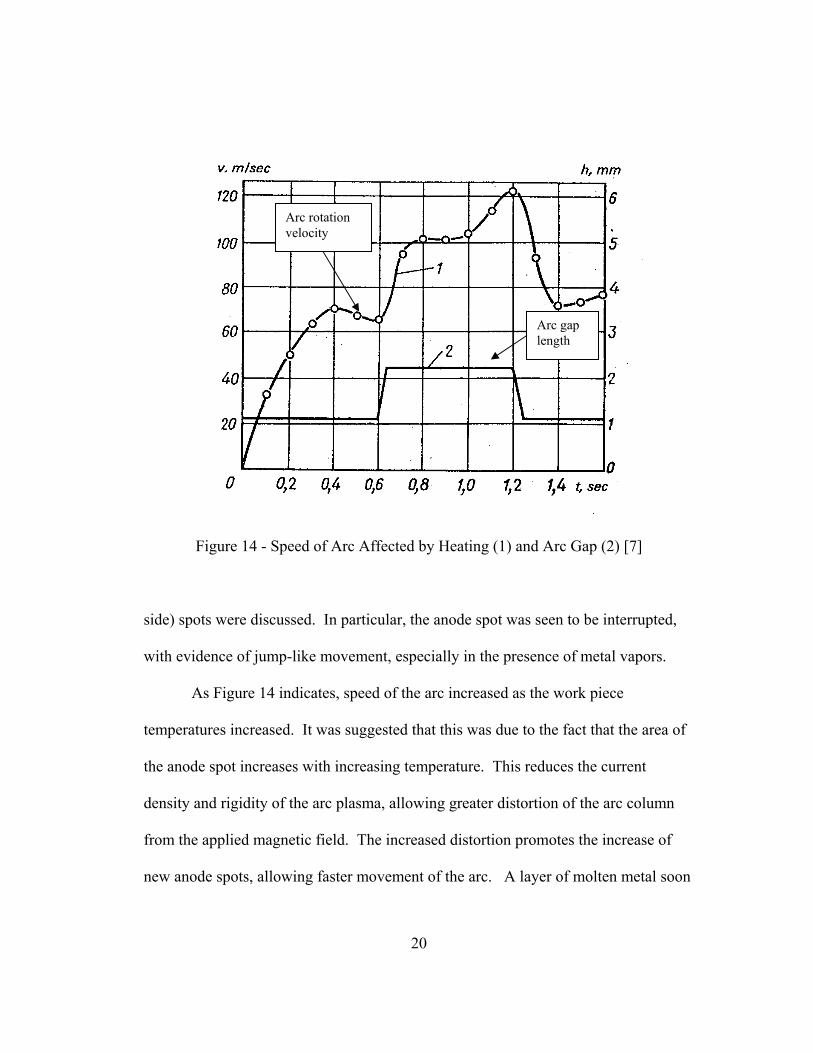
Figure 14 - Speed of Arc Affected by Heating (1) and Arc Gap (2) [7]
side) spots were discussed. In particular, the anode spot was seen to be interrupted,
with evidence of jump-like movement, especially in the presence of metal vapors.
As Figure 14 indicates, speed of the arc increased as the work piece
temperatures increased. It was suggested that this was due to the fact that the area of
the anode spot increases with increasing temperature. This reduces the current
density and rigidity of the arc plasma, allowing greater distortion of the arc column
from the applied magnetic field. The increased distortion promotes the increase of
new anode spots, allowing faster movement of the arc. A layer of molten metal soon
Arc gap length
Arc rotation velocity
21
forms on the tube end which reduces the gap and consequently, the arc length. The
reduced arc length causes a stiffer arc plasma, which is more difficult to move by the
applied magnetic field. This explains the drop in arc velocity after the first peak of
the figure.
The effect of the gap increase then causes another jump in arc velocity. This
is due again to the decrease in arc stiffness described above. Upon further heating of
the work pieces, the arc speed increases again due in part to electromagnetic forces
expelling more molten material. Again, the plasma rigidity is reduced resulting in the
velocity increase. The highest arc speeds resulted in large amounts of molten metal
which formed bridges and an unstable arc, resulting in the final drop in arc velocity
shown on the figure.
Taneko, Arakida, and Takagi [8] used a voltage detector at various locations
inside a carbon steel pipe, an oscilloscope, and a high speed video camera to measure
arc velocities and arc angles. In particular, they studied the relationship between arc
velocity and angle, and position at which power was supplied to the tubes. They were
able to conclude that due to the arc blow effect and electrical resistance of the tube,
current increases in the arc closer to the power supply connection on the tube. This
increases the magnetic blow effect and decelerates the arc. As the arc moves away
from the power supply point it then accelerates. The authors concluded that as a
result, in order to support a stable moving arc, it is important to have numerous
uniform contact points on the tube.

22
Plots of arc velocity vs. time showed three distinct regions: 1) the low velocity
region I, 2) the high velocity region II, and 3) the rotation velocity fluctuation region
III. A typical plot is shown in Figure 15. From these plots, the authors theorized that
the transition from region I to region II occurs due to the ends of the pipe reaching the
Figure 15 - Arc Velocity vs. Time Plot Reveals Three Distinct Regions [8]
Curie temperature (760°). Once this temperature is reached, the applied magnetic
field begins to dominate control of the arc vs. as opposed to the induced magnetic
field of the arc. This, in turn, causes the arc velocity to increase. The formation of
excessive molten material later in the process causes the arc velocity to fluctuate
(region III).
The three regions were shown to be separated by two distinct and important
times: 1) th - time for the area 1 mm from the pipe ends to reach the Curie
temperature, and 2) tf - time for the entire surface of the pipe ends to reach the
Time (seconds)
Vel
ocity
(m/s
)
Low velocity region
High velocity region
Velocity fluctuation region
23
melting temperature. Time th separated region I from region II and time tf separated
region II from region III. In summary, it was suggested that optimum welding
conditions could be achieved when applying upset pressure immediately after
reaching time tf.
2.4 MIAB Welding of Non-Ferrous Materials
Mori and Yasuda [9] evaluated the feasibility of the MIAB welding process
with aluminum and aluminum-copper joints. It is a lot more difficult to achieve the
required flux density at the joint with non-ferrous materials vs. ferrous materials. As
a result, an iron core is often inserted inside the pipe. Variations in flux density with
steel, aluminum, and aluminum with an iron core are graphically shown in Figure 16.
The importance of weld upset distance was emphasized in the welding of the
aluminum joints. The use of shielding gas was important in producing the aluminum-
copper joints, as was placing the aluminum on the cathode side of the joint to achieve
oxide cleaning action.
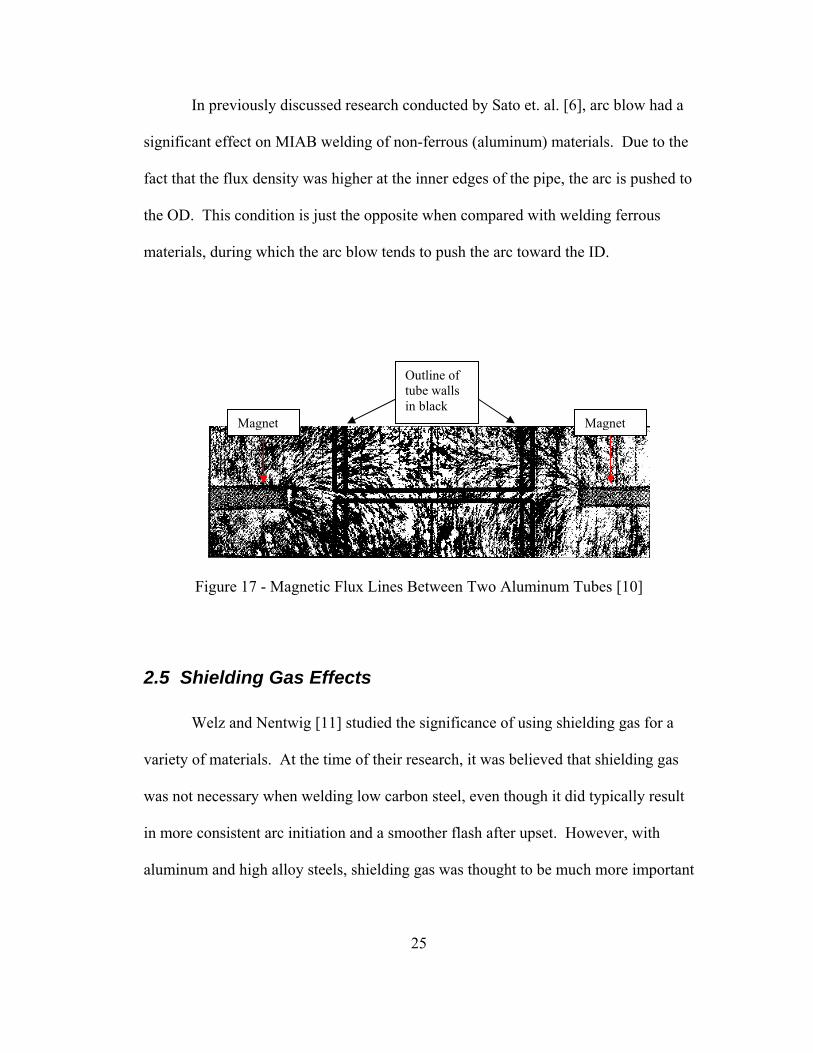
Nentwig and Schmidt [10] used iron filings to study and contrast the radial
and axial magnetic field lines in the joint of ferrous and non-ferrous materials. These
experiments showed that the location of the joint relative to the applied magnetic field
can have a large impact on whether the axial or radial portion of the magnetic field
dominates at the joint. They also observed irregularities in the distribution of the
magnetic field in the presence of ferrous materials. They concluded that with non-

24
ferrous materials, it is possible to arrange the magnetic coils in such away to create
the proper magnetic flux at the joint, although the magnetic flux density will be
Figure 16 - Variations in Flux Density at the Joint [9]
less than with ferrous materials. Figure 17 shows the results of one of their
experiments in which the magnetic flux lines generated at an aluminum tube joint are
clearly visible.
25
In previously discussed research conducted by Sato et. al. [6], arc blow had a
significant effect on MIAB welding of non-ferrous (aluminum) materials. Due to the
fact that the flux density was higher at the inner edges of the pipe, the arc is pushed to
the OD. This condition is just the opposite when compared with welding ferrous
materials, during which the arc blow tends to push the arc toward the ID.
Figure 17 - Magnetic Flux Lines Between Two Aluminum Tubes [10]
2.5 Shielding Gas Effects
Welz and Nentwig [11] studied the significance of using shielding gas for a
variety of materials. At the time of their research, it was believed that shielding gas
was not necessary when welding low carbon steel, even though it did typically result
in more consistent arc initiation and a smoother flash after upset. However, with
aluminum and high alloy steels, shielding gas was thought to be much more important
Magnet Magnet
Outline of tube walls in black

26
due to the formation and low mobility of oxides that can form if gas is not used. In
this research program, the authors evaluated a wide range of shielding gases including
argon and argon blends, carbon dioxide, nitrogen and nitrogen blends, and helium.
There were no specific conclusions as to which shielding gases were the best.
However, the authors did observe the importance of the effect on surface tension of
the molten metal and arc voltage depending on the shielding gas chosen. Gases
which produced high surface tensions tended to restrict arc mobility, causing lack of
fusion problems. They also discussed the difficulty of obtaining good shielding due
to the turbulence of the rotating arc, and the importance of using shielding gas (argon)
when welding aluminum.
Johnson et. al. [12] evaluated the MIAB welding process for joining steel
tubes, and included in their research the effect of carbon dioxide as a shielding gas.
They concluded that fewer bend test defects resulted from weldments produced with
this shielding gas. They postulated that carbon dioxide offered some protection
against oxidation during the welding cycle. Metallography revealed less pro-
eutectoid ferrite, probably due to the reduction in small oxide inclusions. The
shielding gas also provided for a 10% larger current range operating window.
Research on MIAB welding of non-magnetic, austenitic stainless steel
conducted by Welz, Nentwig, and Schwarzkopf [13] showed the importance of using
shielding gas for these materials. They compared various gases and concluded that
argon with 20% helium, argon with 5-6% hydrogen, and argon with 2.5% carbon
dioxide all produced acceptable bend and tensile test results. Pure argon and argon

27
with less than 15% helium shielding gases performed poorly due to excessively slow
arc rotation speeds and uneven melting. The research showed that without proper
shielding, oxides can remain at the joint interface resulting in poor mechanical
properties.
Previously discussed research by Mori and Yasuda [9] evaluated the effects of
different shielding gases when MIAB welding aluminum to copper joints. As
indicated in Figure 18, an argon-hydrogen (5%) blend produced a much larger
process window for welding than a pure argon shielding gas. With the hydrogen
Figure 18 - Ar-H2 Shielding Gas Increases Process Window for Al-Cu Joints [9]
28
blend, shorter arcing times and upset lengths still resulted in satisfactory welds
compared to pure argon. This result was attributed to the fact that the addition of
hydrogen raises the arc temperature resulting in more efficient heating at the copper
side of the joint.
2.6 Heat Flow in the MIAB Welding Processes
There is a relatively small amount of published research on the subject of heat
flow during MIAB welding. This is surprising considering the importance of heat
flow in this process. A successful weld typically requires a good balance between the
localized heating from the arc at the joint, and conduction of heat into the part to
minimize the thickness of the liquid layer formed. In addition to the liquid layer
formation, proper heating reduces the yield strength of the adjacent solid metal to
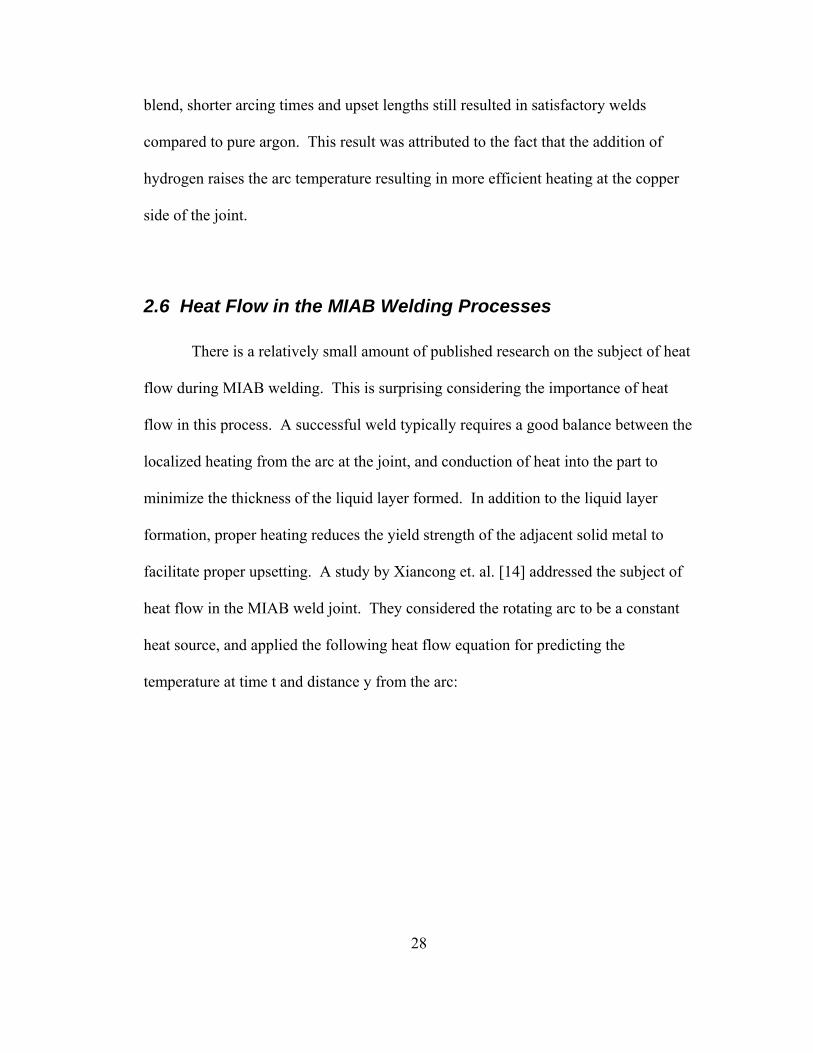
facilitate proper upsetting. A study by Xiancong et. al. [14] addressed the subject of
heat flow in the MIAB weld joint. They considered the rotating arc to be a constant
heat source, and applied the following heat flow equation for predicting the
temperature at time t and distance y from the arc:
29
⎪⎭
⎪⎬⎫
⎪⎩
⎪⎨⎧
⎥⎦
⎤⎢⎣
⎡⎥⎦⎤
⎢⎣⎡ Φ−−−=
aty
aty
yatqytyT
4(1)
4exp(4
2),(
2
πλπ
Where:
T = temperature (ºC)
t = arc rotation time (s)
q = heat input of the arc (cal/cm ºC)
y = distance from arc along the tube (cm)
λ = coefficient of thermal conduction (cal/cms ºC)
a = coefficient of temperature conduction (cm2/s)
)4
(at
yΦ = function of Gauss probability
It was determined that acceptable welds could be achieved at T = 1200 ºC at
y = 0.1 cm or at T = 900 ºC at y = 0.4 cm. Therefore, the optimum relationship
between heat input (q) and arc rotation time (t) could be calculated from this formula
for a given temperature (T) and distance (y). The formula can also be used to
calculate the width of the heat-affected zone.
Kalev et. al. [15] suggested that a MIAB welding arc is not a constant,
uniform heat source since a typical weld cycle involves different levels of current
from the beginning to the end. They were able to develop mathematical equations
based on heat flow theory that incorporated the concept of current, or power, varying
with time. They then compared the analytical results with thermal cycles of actual

30
weldments, which were determined through the use of thermocouples. The resulting
plot, shown in Figure 19, reveals a good fit between the predicted and measured
temperatures taken at various distances from the end of the tube.
Figure 19 - Good Fit Between Predicted (Dashed Line) and Actual (Solid Line) Heat Flow in a MIAB Weld [15]
2.7 MIAB Applications
P.N. Hone [16] of The Welding Institute in Abington, England summarized
MIAB activity there and the numerous potential applications for this process.
Research on extremely thick (up to 12 mm) steel tubes is discussed. These
thicknesses required orbiting one tube axis relative to the other in order to sufficiently
heat the complete wall thickness of the tubes. Success welding a variety of aluminum
Thermal cycles at three different distances from tube ends
Dashed lines represent analytical result
T (°
C)

31
alloys as well as non-circular tubes was reported. In some cases, the non-circular
tubes required specially shaped magnets, but this was not always necessary.
A variety of production applications were sited, including propeller shafts,
automobile axles, fuel tank vent pipes, drive shafts, shock absorbers, and gas-filled
struts. The Ford Transit van axle utilized a large rectangular MIAB weld to join the
axle tube to the center housing. The rear axle on the Vauxhall Astramax is MIAB
welded. The process is also used in the construction of suburban gas distribution
systems.
Hagan and Riley [17] of the Ford Motor Company summarized their use of
MIAB welding in the manufacturing of the Fiesta rear axle cross tube assembly. In
selecting MIAB welding, they first considered other more common welding methods:
Friction, Flash, and GMAW. Friction was not acceptable because of the difficulty
maintaining the radial relationship between the shaped flange spindles and the axle
tube. Flash welding was known to leave clamping marks on parts, and presented
problems regarding maintaining part alignment. GMAW was considered a more
expensive process to operate and created more alignment problems due to distortion.
As a result, they decided to pursue MIAB welding for this application. After
optimizing the welding variables, conducting all the necessary testing, and developing
the weld quality monitoring procedures, the process was successfully implemented in
mass production.
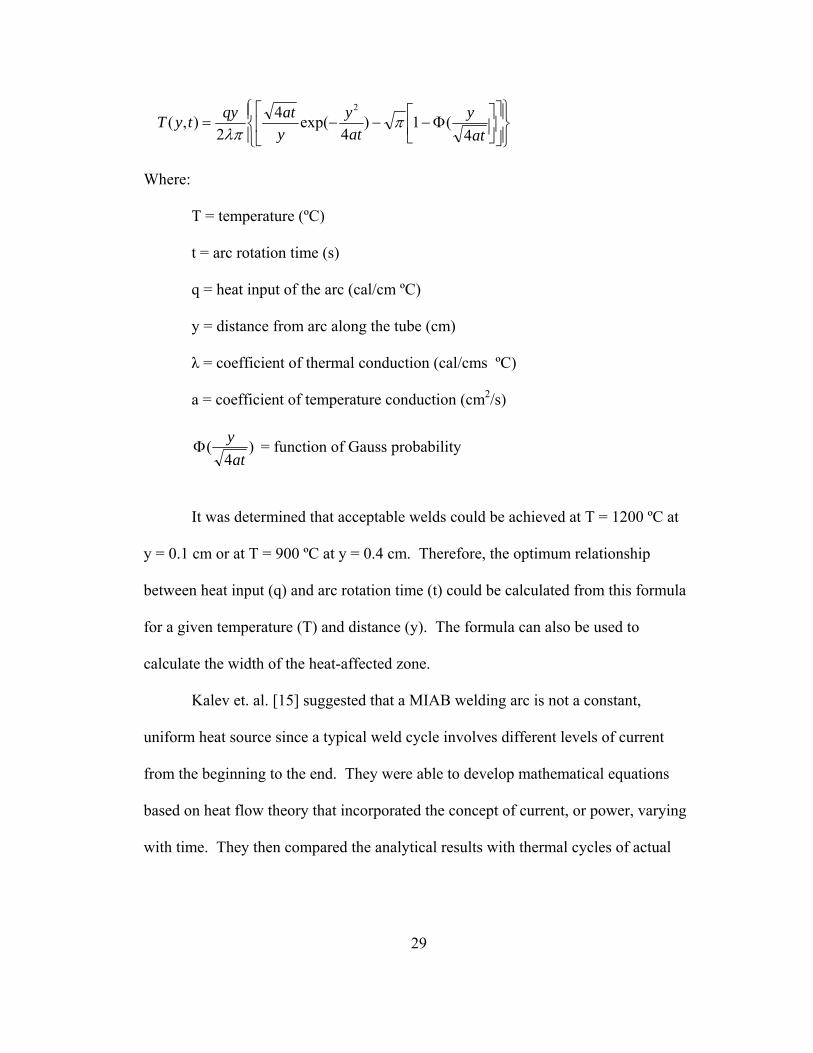
The use of MIAB (in this case, Magnetarc) welding in the production of truck
cab suspension components was described by Hiller, Schmidt, and Breiksch [18] of
32
ThyssenKrupp Automotive Systems. This application involved MIAB welding a cast
iron lever to an extruded steel torsion tube to produce the welded assembly shown in
Figure 20. The authors commented on the many advantages of this process,
including short welding times and the excellent mechanical properties of the solid-
state joint produced between cast iron and steel.
Figure 20 - MIAB (Magnetarc) Weld Joint of Cast Iron-to-Steel [18]
2.8 General Weldability of Chromium-Plated Steel
It is important to emphasize that there is an extremely limited amount of
published research in the area of welding of chromium-plated steels. The obvious
reason for this is that in most cases, chromium-plating is applied for decorative
purposes, which in turn would mandate that any welding operation be conducted prior
to the plating operation to avoid the degradation to the appearance of the chromed
surface from the welding process. The Cr-Fe phase diagram [19] of Figure 21 shows
complete solid solubility between iron and chromium at high temperatures, in
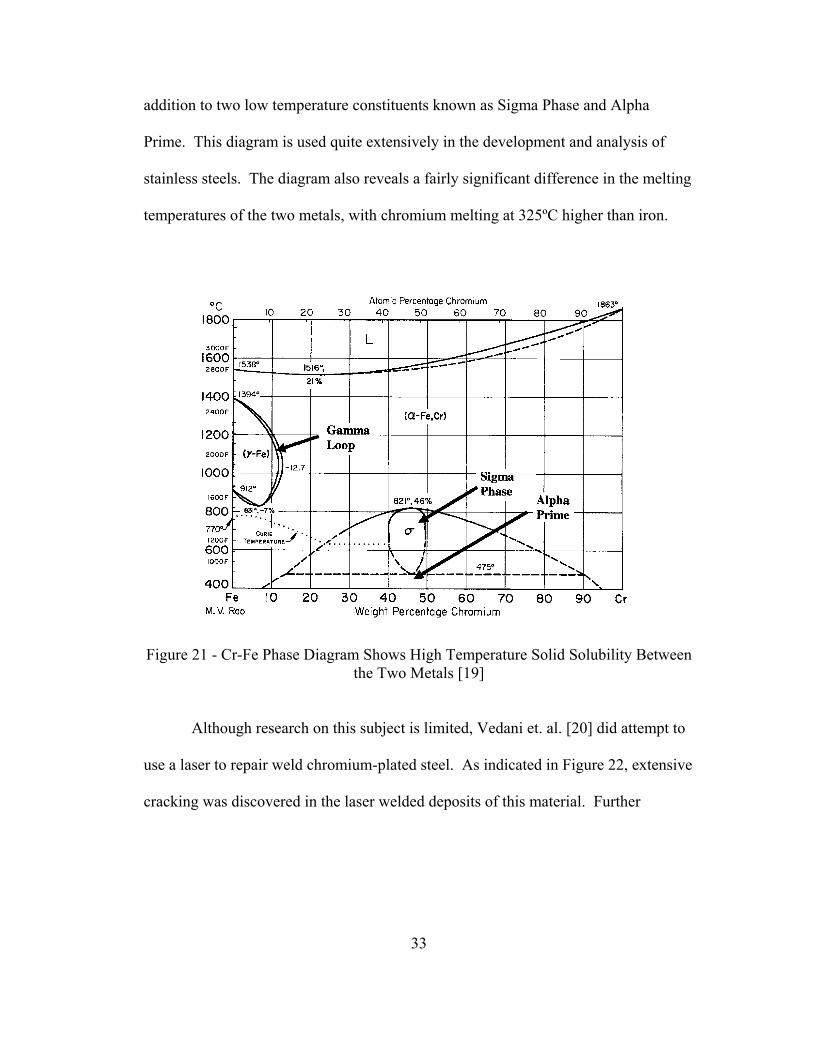
33
addition to two low temperature constituents known as Sigma Phase and Alpha
Prime. This diagram is used quite extensively in the development and analysis of
stainless steels. The diagram also reveals a fairly significant difference in the melting
temperatures of the two metals, with chromium melting at 325ºC higher than iron.
Figure 21 - Cr-Fe Phase Diagram Shows High Temperature Solid Solubility Between the Two Metals [19]
Although research on this subject is limited, Vedani et. al. [20] did attempt to
use a laser to repair weld chromium-plated steel. As indicated in Figure 22, extensive
cracking was discovered in the laser welded deposits of this material. Further
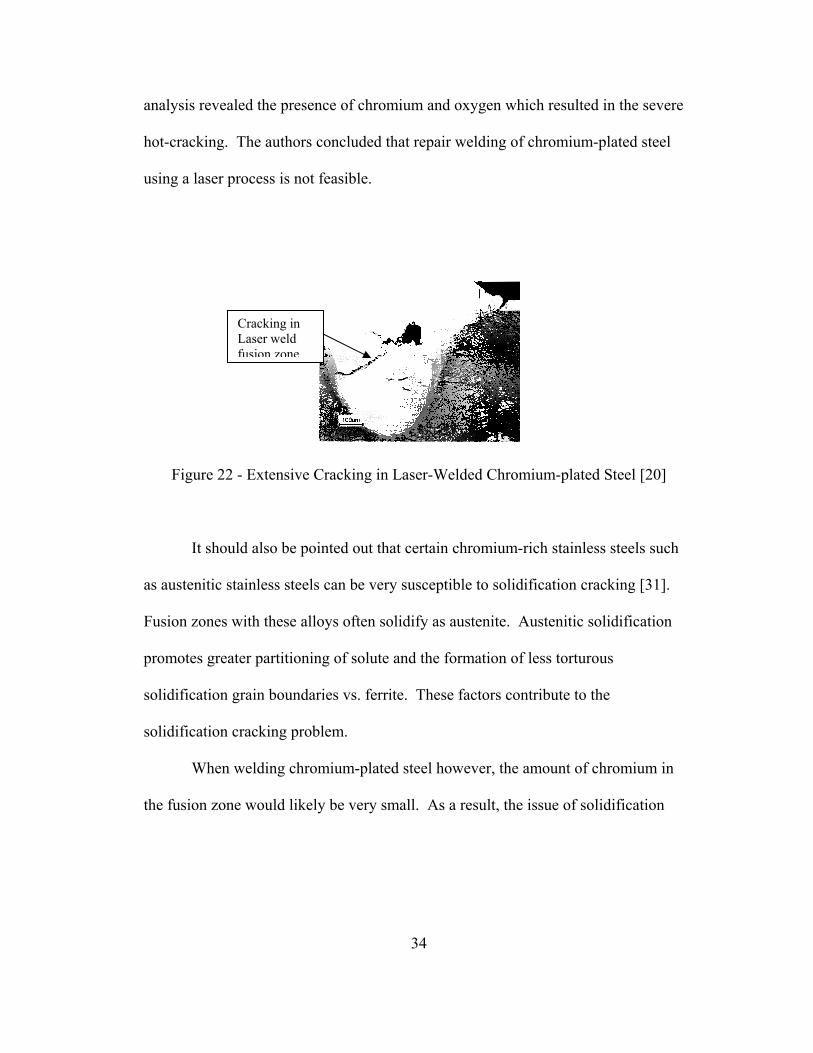
34
analysis revealed the presence of chromium and oxygen which resulted in the severe
hot-cracking. The authors concluded that repair welding of chromium-plated steel
using a laser process is not feasible.
Figure 22 - Extensive Cracking in Laser-Welded Chromium-plated Steel [20]
It should also be pointed out that certain chromium-rich stainless steels such
as austenitic stainless steels can be very susceptible to solidification cracking [31].
Fusion zones with these alloys often solidify as austenite. Austenitic solidification
promotes greater partitioning of solute and the formation of less torturous
solidification grain boundaries vs. ferrite. These factors contribute to the
solidification cracking problem.
When welding chromium-plated steel however, the amount of chromium in
the fusion zone would likely be very small. As a result, the issue of solidification
Cracking in Laser weld fusion zone

35
cracking known to be a problem when welding austenitic stainless steels probably
does not apply. Vedani et. al. did not comment on whether or not the cracking they
observed was related to the formation of a susceptible solidification structure.
36
CHAPTER 3
EXPERIMENTAL PROCEDURE
The experimental procedure involved several levels of experiments designed
to first develop a knowledge base for MIAB welding steel tubes-to-tenons prior to
conducting the main component of the research. Since there is very little information
in the textbooks on MIAB welding, this knowledge base was deemed critical to the
success of the research project. Once a solid understanding of MIAB welding of the
tubes to tenons was established, the primary research of MIAB welding chromium-
plated tubes-to-tenons utilizing arc monitoring equipment was conducted.
The initial development work was conducted on 22 mm steel tube-to-tenon
joints. This was followed by 40 mm tube-to-tube joints, then 40 mm tubes-to-tenons,
and finally, 40 mm chromium-plated tubes-to-tenons. Wall thicknesses for all
components were approximately 2 mm. Design of Experiments (DOE)
methodologies were deployed during two phases of the development work, first with
the 22 mm components, and then with the 40 mm chromium-plated tubes. Several
evaluation methods were utilized, including optical and SEM microscopy, tensile

37
testing, and a bend test called and ID bend or Tulip test. This chapter provides details
on the MIAB welding equipment, the components that were welded, and the
evaluation and monitoring techniques used throughout this research.
3.1 MIAB Equipment
The research conducted in this project utilized an MD-101 pneumatic MIAB
welding machine supplied by KSET, and manufactured by the Paton Institute in the
Ukraine. A picture of the machine is shown in Figure 23, the overall set-up
including controller and weld power supply in Figure 24, and closer views of the
controller and the MIAB machine with parts loaded for welding in Figures 25 and 26
respectively.
Figure 23 - MD-101 Pneumatic MIAB Welding Machine
Parts loaded in MD-101 MIAB welding machine
Clamps are open to reveal top half of the dies

38
Figure 24 - Overall Set-up: MD-101, Miller Power Supply, and Control Unit
Figure 25 - Close-Up View of Control Unit
MD-101 MIAB welding machine with clamps closed
Controller for MD-101 machine
Miller constant current power supply
Current controls
Time controls
MD-101 Control Unit
39
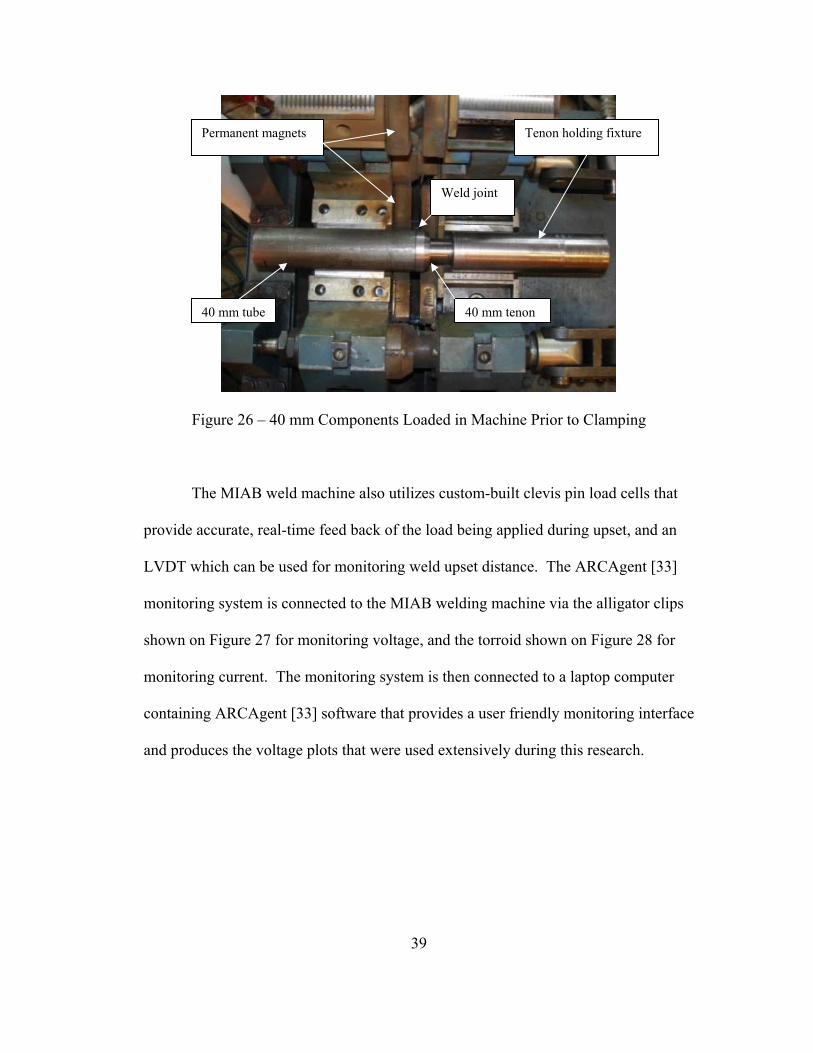
Figure 26 – 40 mm Components Loaded in Machine Prior to Clamping
The MIAB weld machine also utilizes custom-built clevis pin load cells that
provide accurate, real-time feed back of the load being applied during upset, and an
LVDT which can be used for monitoring weld upset distance. The ARCAgent [33]
monitoring system is connected to the MIAB welding machine via the alligator clips
shown on Figure 27 for monitoring voltage, and the torroid shown on Figure 28 for
monitoring current. The monitoring system is then connected to a laptop computer
containing ARCAgent [33] software that provides a user friendly monitoring interface
and produces the voltage plots that were used extensively during this research.
40 mm tube
Tenon holding fixture
40 mm tenon
Permanent magnets
Weld joint

40
Figure 27 - Voltage Monitoring Connections for ARCAgent System
Figure 28 - Torroid for Monitoring Current on ARCAgent System
Voltage leads connected to MD-101 machine
Torroid

41
3.2 Description of Components and Weld Set-Up
The research was comprised of two separate DOE experiments involving two
component sizes. In both cases, the MIAB weld joint being produced joined a hollow
rod made of 1035 mild steel to a 1018 mild steel threaded tenon. Initial development
work and the first DOE was conducted with 22 mm diameter parts which were not
chromium-plated. The intent of this initial research was to assess the feasibility for
producing the tube-to-tenon joint, to study the effect of MIAB weld process
parameters, and to establish methods for determining integrity of the joint. The 22
mm hollow rod and tenon, with a tool to hold the tenon during welding are shown on
Figure 29.
Figure 29 - 22 mm Hollow Rod, Tenon, and Holding Fixture
In the second DOE, 40 mm tubes and tenons which are used in the
construction of the MR damper discussed previously, were utilized. A schematic of
Threaded fixture holds the tenon during
22 mm diameter tube, 2 mm wall thickness
22 mm diameter tenon, 2 mm wall thickness

42
these parts is shown in Figure 30. Since current production of these components
utilizes Friction welding, this drawing depicts a Friction welded part. Initially,
welding trials on tubes with no chromium-plating were conducted to establish
Figure 30 - 40 mm Tenon-Tube Joint Details
weld parameters for the larger sized parts. Tubes for the main experiment (second
DOE) were chromium-plated on the ID utilizing an electrodeposition process. This
produced a hard wear-resistant surface approximately 10 mils thick. The arc
monitoring system was also introduced in the second DOE.
3.3 Mechanical Test Methods
Two destructive mechanical test methods were deployed for this research.
One test, called an ID bend or "Tulip Test", involves cutting a series of longitudinal
slots through the weld joint, and bending the individual "petals" backward to
tenon tube Current production
part is Friction welded
Tubes are chromium-plated
ID l

43
approximately 90º relative to the axis of the tube. This places severe tensile stresses
along the ID portion of the joint, which is then visually examined for any cracking.
Figure 31 represents a schematic of a typical ID bend test procedure and Figure 32 is
a picture of an actual ID bend test coupon of a MIAB weldment after testing.
WELD
Figure 31 – ID Bend or "Tulip Test" Technique

44
Figure 32 – ID Bend Test Showing an Acceptable Weld on a 40 mm part
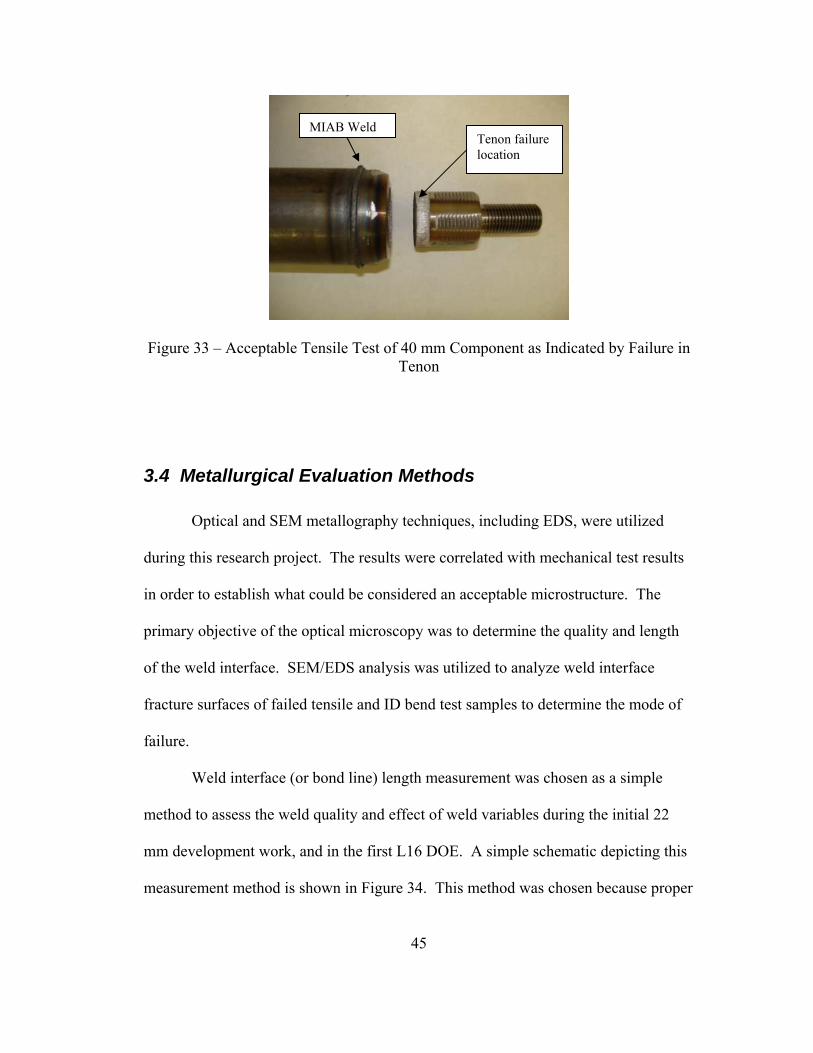
Uniaxial tensile testing was the other mechanical test method used to assess
the integrity of the welds. Ultimate loads at failure were monitored, but the primary
indicator of an acceptable weld was whether or not failure occurred along the weld
interface. Figure 33 is a picture of a typical acceptable tensile test which failed in the
tenon and not in the weld joint. These tensile failures typically exceeded 30,000
pounds of load, which means the stress on the welds was usually between 50 and 55
ksi at the time of the tenon failure.
ID of MIAB weld is crack-free following ID bend test Tenon
Tube cut into “petals” parallel to tube axis prior to bending
45
Figure 33 – Acceptable Tensile Test of 40 mm Component as Indicated by Failure in Tenon
3.4 Metallurgical Evaluation Methods
Optical and SEM metallography techniques, including EDS, were utilized
during this research project. The results were correlated with mechanical test results
in order to establish what could be considered an acceptable microstructure. The
primary objective of the optical microscopy was to determine the quality and length
of the weld interface. SEM/EDS analysis was utilized to analyze weld interface
fracture surfaces of failed tensile and ID bend test samples to determine the mode of
failure.
Weld interface (or bond line) length measurement was chosen as a simple
method to assess the weld quality and effect of weld variables during the initial 22
mm development work, and in the first L16 DOE. A simple schematic depicting this
measurement method is shown in Figure 34. This method was chosen because proper
Tenon failure location
MIAB Weld

46
Figure 34 – Measurement of MIAB Weld Interface Length
heating and forging action is critical to the MIAB process, and a properly forged joint
will result in sufficiently long weld interface lengths. Lengths less than the thickness
of the tube were considered unacceptable since the strength of the joint is
compromised. The measurements were made microscopically utilizing standard
microscopy software.
Although weld interface length provides a good measure of the amount of
upset, it should be pointed out that excessively long weld interface lengths are not
desirable. While this condition doesn't reduce weld quality, it wastes material and
drives up the cost of the component. So although the limitations of this method were
noted, weld interface length was chosen as the best, and easiest to quantify method
for assessing the effects of MIAB weld variables on the 22 mm component.
Attempts were made to determine whether or not there were remnants of
molten metal along the weld interface, and also measure how far the previously
Tube wall MIAB weld
Weld interface length measurement

47
molten metal had been pushed outward into the flash. However, although there is
some macrostructural evidence of previously molten material, it is typically very
difficult to microstructurally distinguish these regions in a steel weldment. This is
because the molten metal in low carbon steels initially solidifies as BCC delta ferrite.
The BCC structure has high diffusion rates which minimize segregation during
solidification. Without segregation, it is difficult to see dendritic structure which is
indicative of material that melted.
In addition, upon further cooling, the delta ferrite transforms to austenite, and
later to other phases/constituents, further masking any evidence of previously melted
material. As a result, this type of analysis was not practical, and therefore, not
included in this research. However, this information could be useful in future work,
especially considering MIAB weldments produced without shielding gas. Since
molten material in these welds is exposed to an oxidizing environment, it is likely that
if it is not sufficiently squeezed out of the weld interface, mechanical properties will
be degraded.
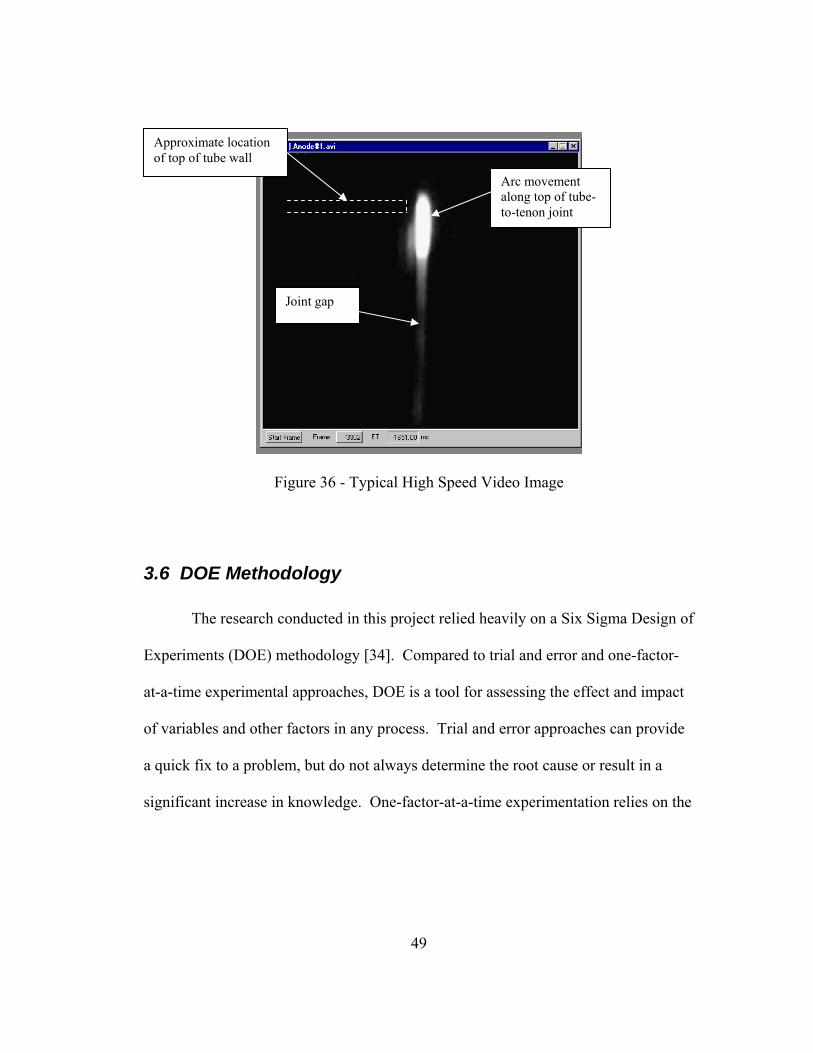
3.5 High Speed Video Monitoring
An Image Lake high speed video system was used to study the shape of the
arc, as well as the effects of altering the joint position within the applied magnetic
field. The picture in Figure 35 illustrates the concept of moving the joint position.
The high speed video equipment is required to view the arc since it is moving so

48
Figure 35 – Concept of Altering Joint Position within Applied Magnetic Field
rapidly. Video clips were typically taken at 2000 frames per second. This frame rate
turned out to be insufficient to study the arc in any detail, but did provide information
regarding the shape and action of the arc during the welding process. It also revealed
differences in the arc shape as a result of different joint locations. A typical frame
taken from the high speed video camera is shown in Figure 36.
Joint Location
Anode SideCathode Side
For some experiments, the parts were moved closer to the anode side or cathode side prior to welding to change the joint location within the applied magnetic field
49
Figure 36 - Typical High Speed Video Image
3.6 DOE Methodology
The research conducted in this project relied heavily on a Six Sigma Design of
Experiments (DOE) methodology [34]. Compared to trial and error and one-factor-
at-a-time experimental approaches, DOE is a tool for assessing the effect and impact
of variables and other factors in any process. Trial and error approaches can provide
a quick fix to a problem, but do not always determine the root cause or result in a
significant increase in knowledge. One-factor-at-a-time experimentation relies on the
Arc movement along top of tube-to-tenon joint
Joint gap
Approximate location of top of tube wall

50
often mistaken belief that one factor can be held constant without affecting others.
This approach also does not provide information regarding interactive effects of two
or more variables.
Full factorial designs test every possible combination of factors (variables)
over a given range and provide an extensive amount of information about the process
or problem being investigated. For a given process, the number of levels of factors
raised to the power of the number of factors to be studied determines the size of the
DOE experiment. A response variable is chosen to assess the effect of the factors.
To determine the impact of a factor or variable, the difference between the average of
the results at each level is calculated. To determine the effect of the interaction
between factors, the factors are first coded (high or low, + or -), and then the
difference between the two coded levels is calculated. Analysis of variance
calculations can then be made to determine whether or not a particular factor is
statistically significant in affecting a response.
Two DOE trials were conducted during this research. The first trial utilized
the 22 mm components with no chromium-plating. The purpose of this DOE was to
develop a good understanding of the effect of the MIAB weld variables on the quality
of the tube-to-tenon weld joint. The response variable in this case was weld interface
length measurement. The design for this trial was an L16: four variables at two levels
each produces 16 possible combinations. The four variables studied were weld
current, weld time, current before upset, and upset pressure. The experimental layout
of the L16 is shown in Table 1.

51
The second DOE trial, the most important part of this research, utilized
chromium-plated 40 mm components, and incorporated the arc monitoring system.
In this case, a smaller, L12 (12 combinations of variables) experiment was designed
Table 1 - L16 Experimental Layout
Full factorial experiment (Four factor, two level)
Center
Axials (Run and measure only if center points show evidence of non-linearity)
A B C D
tc Weld Current Weld Time Upset Current Upset Pressure
1 1=175 amps 1=1.5 sec 1= 400 amps 1=12 psi2 1=175 amps 1=1.5 sec 1= 400 amps 2=24 psi3 1=175 amps 1=1.5 sec 2=600 amps 1=12 psi4 1=175 amps 1=1.5 sec 2=600 amps 2=24 psi5 1=175 amps 2= 3.0 sec 1= 400 amps 1=12 psi6 1=175 amps 2= 3.0 sec 1= 400 amps 2=24 psi7 1=175 amps 2= 3.0 sec 2=600 amps 1=12 psi8 1=175 amps 2= 3.0 sec 2=600 amps 2=24 psi9 2=225 amps 1=1.5 sec 1= 400 amps 1=12 psi
10 2=225 amps 1=1.5 sec 1= 400 amps 2=24 psi11 2=225 amps 1=1.5 sec 2=600 amps 1=12 psi12 2=225 amps 1=1.5 sec 2=600 amps 2=24 psi13 2=225 amps 2= 3.0 sec 1= 400 amps 1=12 psi14 2=225 amps 2= 3.0 sec 1= 400 amps 2=24 psi15 2=225 amps 2= 3.0 sec 2=600 amps 1=12 psi16 2=225 amps 2= 3.0 sec 2=600 amps 2=24 psi
17 1.5=200 amps 1.5=2.25 sec 1.5=500 amps 1.5=18 psi18 1.5=200 amps 1.5=2.25 sec 1.5=500 amps 1.5=18 psi
19 1=175 amps 1.5=2.25 sec 1.5=500 amps 1.5=18 psi20 2=225 amps 1.5=2.25 sec 1.5=500 amps 1.5=18 psi21 1.5=200 amps 1=1.5 sec 1.5=500 amps 1.5=18 psi22 1.5=200 amps 2= 3.0 sec 1.5=500 amps 1.5=18 psi23 1.5=200 amps 1.5=2.25 sec 1= 400 amps 1.5=18 psi24 1.5=200 amps 1.5=2.25 sec 2=600 amps 1.5=18 psi25 1.5=200 amps 1.5=2.25 sec 1.5=500 amps 1=12 psi26 1.5=200 amps 1.5=2.25 sec 1.5=500 amps 2=24 psi
26 Run 4 factor Central Composite Design

52
to specifically focus on MIAB welding variables expected to play a significant role
when welding chromium-plated tubes. Variables were selected which were expected
to be at the very edge of the MIAB weld process window. The results were
correlated with the arc monitoring results.
As discussed, in the L16 22 mm experiment, weld interface length was chosen
as the response variable, or the measurable dependent variable used to assess the
effect of the independent variables (parameters). For this experiment, weld interface
length proved to be an effective choice as a response variable. However, there are
two primary disadvantages in using this response variable. The first drawback is that
longer weld interface lengths imply stronger welds, but extremely long lengths are
indicative of excessive upset. As discussed previously, while excessive upset does
not reduce weld quality, it wastes material which adds unnecessary cost to the part.
The second problem with weld interface length as a response variable is that it does
not provide any evidence of chromium presence along the bond line, the primary
issue with the 40 mm tube-to-tenon joint. Therefore, another mechanism for
assessing the degrading effect of chromium presence along the weld interface had to
be developed for the L12 experiment.
Tensile testing was considered as a potential response variable. However,
tensile tests of these weldments typically did not provide a wide range of variable,
quantifiable results, which are generally considered important to the success of a
DOE. As discussed previously, tensile testing tended to result in either base metal
failures (“go”) or weld interface failures (“no-go”). This was primarily due to the fact

53
that component design resulted in base metal tensile failures in the tenon at loads that
were approximately 20% below the tensile strength of the tube. Therefore, in a
tensile test, the welds never experienced full loading. Tenon failures were considered
acceptable for production purposes, but did not provide for a full range of testing of
the weld joint.
In effect, tensile testing provided a response of good or bad without much
variation in between. Such variation is important to a successful DOE.
ID bend testing, however, can provide wide range of results including partial failure
of the petals. Lengths of the cracked weld interfaces along the petals can easily be
measured with a caliper, thus providing variable, quantifiable information. It is
important to note that in a production environment any cracking of an ID bend test
would be considered unacceptable. But for the purposes of the L12 experiment, this
response variable provided necessary quantifiable evidence of mechanical property
degradation due to the presence of chromium along the weld interface.
Once the response variable decision was made, the second DOE was devised
for the investigation of the 40 mm chromium-plated tube-to-tenon joint. This DOE
incorporated knowledge gained from the previous L16 DOE regarding basic effects
of MIAB weld process parameters on the tube-to-tenon joint. In this case, however,
the DOE was primarily designed to assess the effect of two variables expected to play
an important role in the cleaning action (and therefore, action affecting chromium
presence along the weld interface) of the process: level III (expulsion) current and
level II (arc heating) time.
54
Information gained from the anode/cathode experiments described above
resulted in the addition of a joint location variable as well. Three joint locations were
evaluated: 1) centered, 2) shifted toward the anode side, and 3) shifted toward the
cathode side. Combining all these factors, the DOE became an L12 arrangement with
three joint locations, two level III currents, and two level II times (3 x 2 x 2 = 12).
The L12 layout with the resulting ID bend test crack length (mm) measurements is
shown in on Table 3.
3.7 Arc Monitoring The ARClient [33] arc monitoring system was utilized for the 40 mm MIAB
chromium-plated tube-to-tenon weld trials. This is most likely the first attempt to use
such a system for monitoring MIAB weld quality. ARCAgent [33] software, used in
conjunction with the monitoring system, provides a user friendly interface for
interpreting, organizing, and displaying the results. Voltage and current vs. time plots
were recorded for each weld. Since all welding was conducted in the constant current
mode, the current plots did not provide significant information about the process
other than to confirm the current output of the power supply. The voltage plots,
however, revealed a vast amount of information about the process. Analysis and
interpretation of the voltage plots for each weld condition, and correlation of the plots
to the L12 statistical results was a very important component of this research.

55
CHAPTER 4
RESULTS
This chapter describes the results of the research on the 40 mm chromium-
plated component which represents the core of this investigation. Discussion and
analysis of these results follows in the next chapter. Preliminary weld development
work on smaller 22 mm components was conducted for the purpose of building a
knowledge base for MIAB welding tubes-to-tenons in preparation for the research on
the 40 mm components. Since the 22 mm work was considered preliminary and not
part of the core research, the 22 mm results and discussion sections are included in
the Appendices section. Following the 22 mm development work, preliminary 40
mm component weld trials had to be conducted in order to identify appropriate ranges
of weld variables for the larger sized components
Once variable ranges were identified on 40 mm components without
chromium-plating, chromium-plated (ID only) tube-to-tenon weldments were
produced. Tensile and ID bend test cracking observed along the weld interface of
these weldments provided the first evidence of the technical challenges associated

56
with welding chromium-plated material. Much of this raw data is also included in
the Appendices section. Following the preliminary trials, the L12 experiment was
developed and run utilizing the voltage monitoring methodology.
4.1 Metallurgical Analysis Optical and SEM techniques revealed the presence of an unacceptable weld
interface following the initial weld trials with the chromium-plated tubes. This
information helped guide the decisions toward the development of the second DOE.
These results, as well as the metallurgical analysis from tubes without chromium-
plating are discussed.
4.1.1 Optical Microscopy of Tubes Without Chromium-plating Initial 40 mm trials were restricted to welding two tubes, as shown in the
photomicrograph of Figure 37. Although this particular joint exhibits excessive
upset, it provides strong evidence of the plastic flow that occurs during the upset
phase of the MIAB welding process. Tube-to-tenon joints were then produced and
analyzed optically. Figure 38 shows a typical joint with a closer view of the bond
line. The tenon is oriented on the right side of this joint.
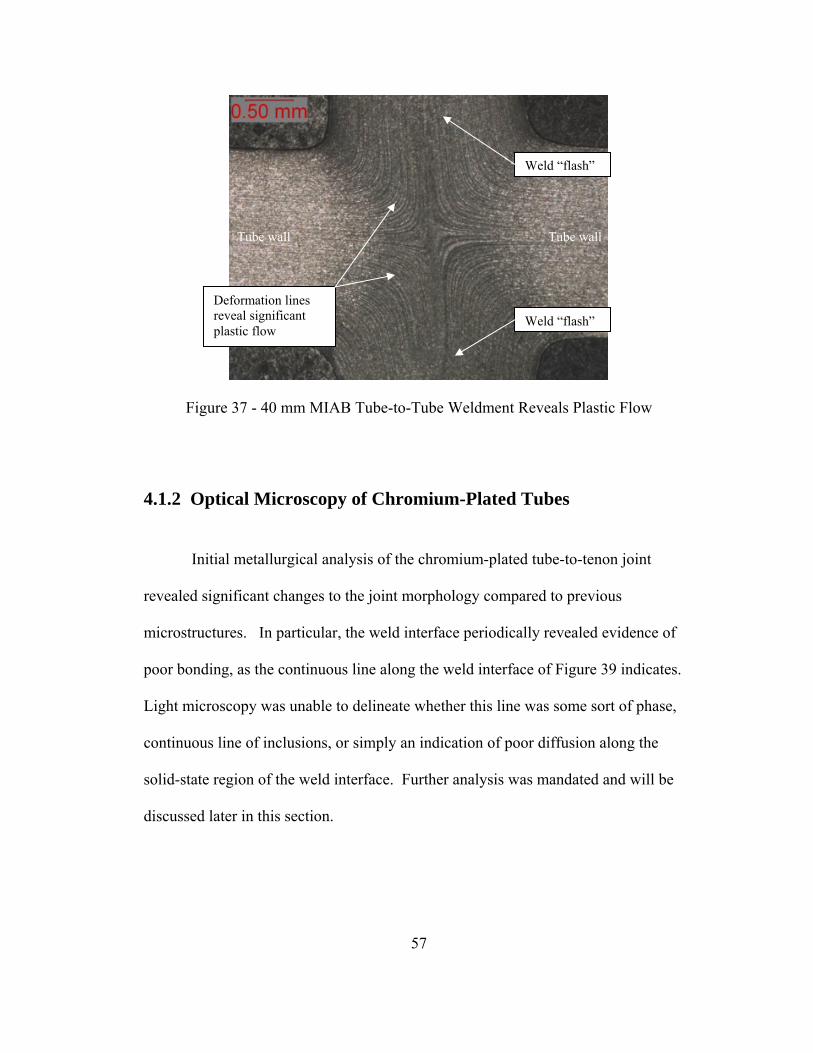
57
Figure 37 - 40 mm MIAB Tube-to-Tube Weldment Reveals Plastic Flow
4.1.2 Optical Microscopy of Chromium-Plated Tubes
Initial metallurgical analysis of the chromium-plated tube-to-tenon joint
revealed significant changes to the joint morphology compared to previous
microstructures. In particular, the weld interface periodically revealed evidence of
poor bonding, as the continuous line along the weld interface of Figure 39 indicates.
Light microscopy was unable to delineate whether this line was some sort of phase,
continuous line of inclusions, or simply an indication of poor diffusion along the
solid-state region of the weld interface. Further analysis was mandated and will be
discussed later in this section.
Deformation lines reveal significant plastic flow
Weld “flash”
Weld “flash”
Tube wall Tube wall

58
Figure 38 - 40 mm Tube-to-Tenon Weld Interface
Tenon - 1018 Tube - 1035
Weld Interface
Weld Interface
500X
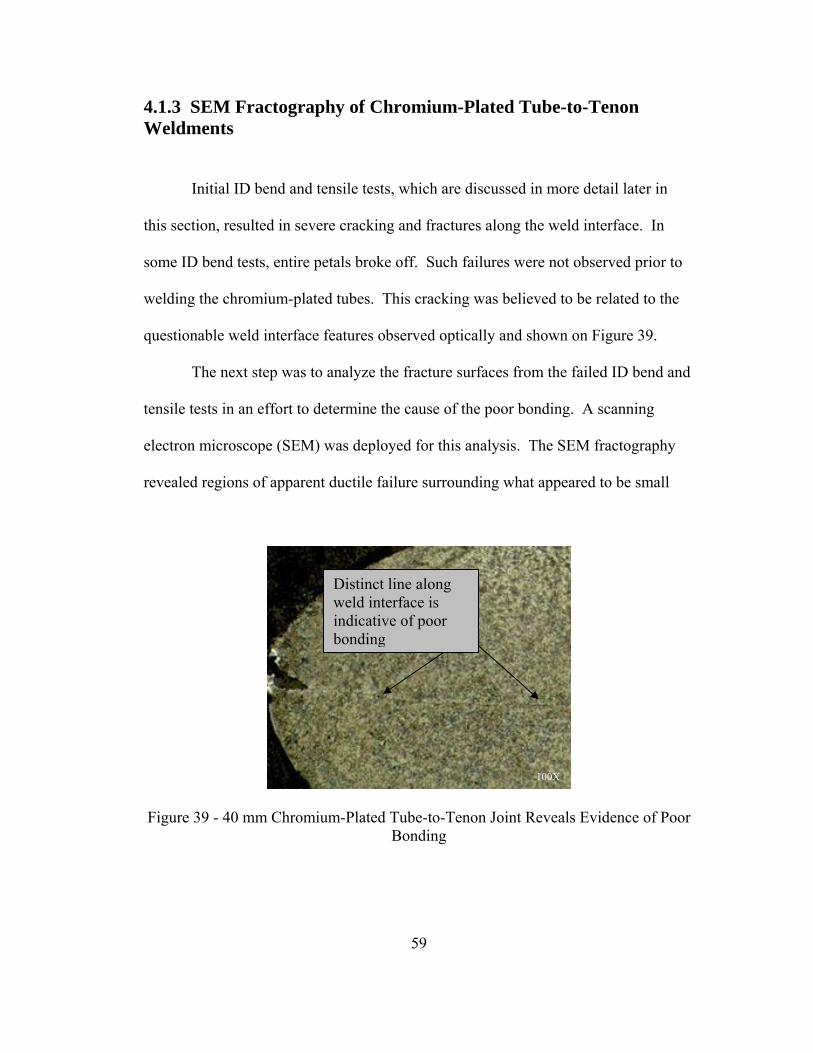
59
4.1.3 SEM Fractography of Chromium-Plated Tube-to-Tenon Weldments
Initial ID bend and tensile tests, which are discussed in more detail later in
this section, resulted in severe cracking and fractures along the weld interface. In
some ID bend tests, entire petals broke off. Such failures were not observed prior to
welding the chromium-plated tubes. This cracking was believed to be related to the
questionable weld interface features observed optically and shown on Figure 39.
The next step was to analyze the fracture surfaces from the failed ID bend and
tensile tests in an effort to determine the cause of the poor bonding. A scanning
electron microscope (SEM) was deployed for this analysis. The SEM fractography
revealed regions of apparent ductile failure surrounding what appeared to be small
Figure 39 - 40 mm Chromium-Plated Tube-to-Tenon Joint Reveals Evidence of Poor Bonding
Distinct line along weld interface is indicative of poor bonding
100X

60
inclusions that were smooth in appearance. Figure 40 is a typical SEM fractograph
showing the characteristic fracture surface from a failed tensile test. As the figure
indicates, the fracture surfaces showed evidence of dimple rupture or microvoid
coalescence, combined with numerous smooth, featureless regions indicative of a
decohesive type rupture mode [32].
Further SEM analysis of these smooth regions on the fracture surface was
conducted using EDS (Electron Dispersive Spectroscopy) techniques. Figure 41
reveals the results of this analysis, clearly indicating high chromium concentrations at
these regions. Similar EDS analysis along the regions of dimple rupture showed no
such evidence of chromium. Subsequent semi-quantitative analysis of these
chromium-enriched regions revealed a chromium content of approximately
Figure 40 - SEM Fractograph of Tensile Test Weld Interface Fracture Surface
Decohesive Rupture Mode Fracture Features
Dimple Rupture Mode Fracture Features
50 µm

61
Figure 41 - SEM EDS Analysis of Region of Decohesive Rupture on Fracture Surface
70 % (atomic). Unfortunately, these methods were not capable of analyzing
interstitials such as oxygen and nitrogen, but clearly established a relationship
between the poor bond quality and the presence of chromium.
4.1.4 Microhardness Testing A typical 40 mm component microhardness result is shown on Figure 42. It
should be pointed out that while this particular microhardness testing was conducted
on tube-to-tenon joints that utilized forged tenons, the majority of the research was
conducted on machined tenons. The significance of utilizing forged tenons will be
discussed in the next section.

62
Figure 42 - Microhardness of Typical 40 mm Tube-to-Tenon MIAB Weld Joint

63
4.2 Mechanical Analysis As discussed above, both tensile and ID bend testing of MIAB weldments
produced with the chromium-plated tubing resulted in severe cracking along the weld
interface during the initial weld trials with this material. A typical failed ID bend test
is shown in Figure 43. In many cases during these initial trials, entire “petals” of the
ID bend tests broke off.
Figure 43 - Failed ID Bend Test of MIAB Weldment Utilizing Chromium-plated Tube
Closer examination of the fracture surfaces of figure 43 reveals dark gray
shaded regions along the fracture surface. These regions were analyzed with SEM
EDS analysis and determined to consist of the high concentrations of chromium
discussed previously. Tensile testing conducted on random samples resulted in
similar fractures along the weld interface. Table 2 shows a small portion of the data
collected during the initial trials. This development work provided the foundation of
knowledge which guided the decision making in the subsequent L12 Design of
Experiments, in which the arc monitoring methodology was introduced.
Weld interface fractures

64
Trial # Arc current (level II) time
Upset current (level III) time
Level II current
Level III current
ID bend test result –
cracking?
1 3.3 0.21 190 630 Yes
2 3.3 0.26 190 630 Yes
3 3.3 0.21 190 630 Yes
4 3.5 0.21 190 630 Yes
5 3.5 0.21 190 630 Yes
6 3.5 0.21 190 630 Yes
7 3.5 0.21 190 630 Yes
8 3.5 0.21 190 630 Yes
9 3.5 0.21 190 630 Yes
10 3.85 0.21 200 640 Yes
11 3.85 0.21 220 630 Yes
12 3.85 0.21 240 630 Yes
13 3.85 0.21 240 630 Yes
14 3.85 0.21 240 630 Yes
15 3.85 0.21 240 630 Yes
16 3.85 0.21 240 630 Yes
17 3.85 0.21 240 630 Yes
18 3.85 0.21 240 630 Yes
Table 2 – Typical Data From Initial 40 mm Component Development Work
65
4.3 Anode/Cathode Experiments
Previous research [6] established that arc blow effects, and the interaction
between the applied magnetic field and the magnetic field created by the arc,
significantly affect arc location. In particular, position of the arc relative to the ID or
OD of the tubes is influenced by these factors as the arc rotates around the tubes. It
was postulated for this research that since the chromium-plating on the 40 mm tubes
was located on the ID only, arc location along the tube walls during rotation could
play a role in the amount of chromium ending up along the weld interface.
In order to assess the feasibility of influencing arc location along the tube
walls by altering joint position within the applied magnetic field, an experiment was
devised with 40 mm tubes. The experiment involved shifting both parts (Figure 35),
and therefore the joint location, to two extremes within the applied magnetic field. A
shift to the right effectively moved the joint toward the anode side of the current path,
and a shift to the left toward the cathode side.
The arc was then initiated for a short period of time (less than a second) in an
attempt to allow only a few arc rotations, and power was shut off before significant
heating or upset could occur. This procedure was repeated for both joint locations.
The surfaces of the tube ends were then examined under an optical stereoscope for
evidence of the arcing location along the wall thickness. The results, shown in Figure
44, provide evidence that the location of the arc relative to the wall thickness of the

66
Figure 44 - Evidence of Joint Position within Magnetic Field Affecting Arc Location
tube can be altered by moving the parts outside of the center position within the
applied magnetic field. As a result, it was decided that joint position would become
one of the variables investigated in the second DOE for the 40 mm chromium-plated
tube-to-tenon joint.
4.4 L12 DOE Based on ID Bend Test Crack Length
As in the L16 experiment, the data was analyzed statistically and presented in
graphic form. Figure 45, the Y bar Marginal Means Plot, reveals the individual
variable effects of joint location, level III current, and level II time on ID bend test
crack length. As the figure shows, increases in level III current and level II time
Anode Side Cathode Side
Extensive Melting on ID of tube wall
Inside wall (ID) of tube
Melting shifted toward OD of tube wall
Edge of machining lines
Edge of machining lines

67
significantly reduced ID bend crack lengths while joint position had a marginal effect.
Figure 46 provides evidence of the interactive effects among these three MIAB weld
variables. These results and the significance of the interactive effects are discussed in
the following section.
Table 3 - L12 Experiment with ID Bend Test Crack Length (mm) Results
ID Bend Weld Interface Crack Length (mm)

68
Figure 45 – Individual Variable Effect of Joint Position, Level III Current, and Level II Time on Crack Length on 40 mm MIAB Weldments
Y bar Marginal Means Plot
Effect Levels
Cra
ck L
engt
h (m
m)
Level II Time
Level III Current
Joint Position
Centered
Cathode
Anode

69
Figure 46 – Interactive Variable Effects of Joint Position, Level III Current, and Level II Time on 40 mm MIAB Weldments
70
4.5 Arc Monitoring Plots
The voltage plots produced a characteristic weld “signature” for each weld.
Since current levels are controlled by the weld power source which is operating in the
constant current (drooping) mode, voltage is allowed to fluctuate during the MIAB
welding process. These fluctuations are due to changes in arc position and arc gap,
heating of the part and subsequent thermal expansion, expulsion, and other factors
which are discussed later. As a result, the voltage vs. time plots provided a
significant amount of information uniquely for each weld. Two typical voltage
“signatures” are shown in Figure 47. The characteristic “signatures” contained
specific features that could be correlated to weld variable effects from the L12
experiment, and therefore, weld quality. These correlations, as well as interpretation
and analysis of all the plots is provided in the following Discussion section.

71
Figure 47 - Two Typical Arc Monitoring Plots of 40 mm Tube-to-Tenon MIAB Welds
Voltage
Current
Voltage
Current Vol
ts
Vol
ts
Time (s)
Time (s)
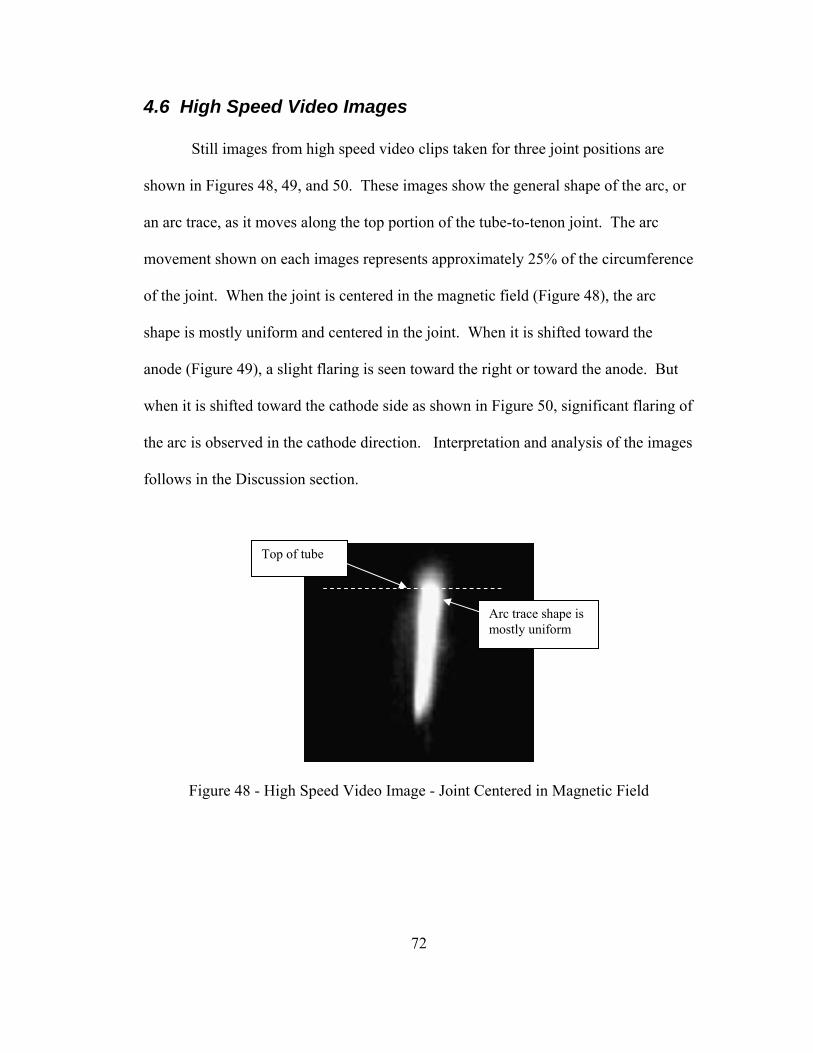
72
4.6 High Speed Video Images Still images from high speed video clips taken for three joint positions are
shown in Figures 48, 49, and 50. These images show the general shape of the arc, or
an arc trace, as it moves along the top portion of the tube-to-tenon joint. The arc
movement shown on each images represents approximately 25% of the circumference
of the joint. When the joint is centered in the magnetic field (Figure 48), the arc
shape is mostly uniform and centered in the joint. When it is shifted toward the
anode (Figure 49), a slight flaring is seen toward the right or toward the anode. But
when it is shifted toward the cathode side as shown in Figure 50, significant flaring of
the arc is observed in the cathode direction. Interpretation and analysis of the images
follows in the Discussion section.
Figure 48 - High Speed Video Image - Joint Centered in Magnetic Field
Top of tube
Arc trace shape is mostly uniform

73
Figure 49 - Joint Shifted Toward Anode Side of Arc
Figure 50 - Joint Shifted Toward Cathode Side of Arc
Top of tube
Top of tube
Slight flaring of arc toward the right, or anode side
Significant flaring of arc toward the left, or cathode side

74
CHAPTER 5
DISCUSSION
The results of the 40 mm chromium-plated tube-to-tenon weld trials are
discussed and analyzed in this chapter. In particular, arc voltage monitoring plots
for the 40 mm chromium-plated tube-to-tenon weldments are interpreted, and
correlated with the DOE results. Arc welding and arc physics principles are
proposed as an explanation for some of the results, and also correlated with the
voltage plots. Finally, the relationship between weld quality and certain features of
the voltage plots is proposed. As before, the 22 mm component development work
discussion is provided in the Appendices section.
5.1 Metallurgical Analysis
5.1.1 Optical Microscopy of Tubes without Chromium-plating
Figure 37 is a photomicrograph from the initial weld development trials of 40
mm tube-to-tube joints utilizing tubes that were not chromium-plated. The

75
photomicrograph provides strong evidence of the forging action of the MIAB weld
process. As discussed above, successful MIAB welds depend on the proper expelling
of the contaminated liquid metal from the joint followed by forging of the plasticized
region in order to create intimate metallurgical contact. This results in the diffusion
required to achieve a sound solid-state weld joint. Figure 38 shows the result of good
diffusion, namely, no evidence of a distinct bond line.
5.1.2 Optical Microscopy of Tubes with Chromium-plating
Initial weld trials on 40 mm chromium-plated tube-to-tenons immediately
showed a severe weld interface failure mechanism not seen on previous weldments
produced with non-chromium-plated tubes. Optical metallography was first deployed
to try to better understand the mechanism. The photomicrograph of Figure 39
represents a region along the weld interface adjacent to an ID bend test petal that
fractured along the weld interface. A distinct bond line can clearly be seen. In
comparison with Figure 38, the distinct bond line of Figure 39 provides strong
evidence of poor diffusion. This joint appears to be sufficiently upset, so the presence
of the bond line was indicative of another phenomenon which resulted in the poor ID
bend test results. However, light microscopy techniques were unable to provide
further information regarding the potential cause of the bond line failure so SEM
techniques were deployed.

76
5.1.3 SEM Fractography of MIAB Welds with Chromium-plating
The fracture surfaces from the failed ID bend tests contained contrasting
regions of darker gray and lighter silver which were easily detected with the naked
eye as shown in Figure 43. When analyzed with the SEM, the dark gray regions
turned out to be the portions of the fracture surface which failed via the decohesive
mode, while the light silver regions showed evidence of ductile tearing via a dimple
rupture mode (Figure 40). Decohesive ruptures involve little or no plastic
deformation and usually occur as a result of impurities [32], while dimple ruptures
occur due to overload and are usually associated with ductile failures.
EDS analysis (Figure 41) revealed the presence of significant amounts of
chromium (approximately 70 atomic %) in the regions of decohesive rupture. It is
important to mention that the EDS spot analyzes material at the surface, as well as
slightly below the surface. Therefore, it is possible that the percentage of chromium
along the decohesive rupture regions of the fracture surface was even greater than
70%, as there could have been a dilution effect from iron beneath the chromium.
Furthermore, this analysis is considered semi-quantitative, and not intended to be
precise. Nonetheless, the chromium presence was very clear, and the origin
(chromium-plating) was obvious.
The SEM fractograph of Figure 40 seems to indicate that these regions of
enriched chromium may be some form of an inclusion, but optical microscopy did not
show any such evidence. The Chromium-Iron phase diagram of Figure 21 indicates
there are no intermetallics formed between chromium and iron so intermetallic

77
formation is not a likely scenario. However, the phase diagram does reveal a
considerable melting point variance between chromium and iron, with chromium
melting 325ºC higher than iron. It is possible that the melting temperature difference
plays a role in the resulting chromium contamination of the bond line. During the arc
heating and subsequent arc cleaning phase, it is possible to envision a scenario where
the slower-to-melt chromium-plating on the ID of the tube could be expelled into the
joint just prior to upset, and then become trapped there.
Chromium is also known to have a high affinity for interstitials oxygen and
nitrogen. In the presence of an unshielded arc, melted chromium would potentially
easily absorb these interstitials and remain along the weld interface as a chromium
oxide, severely affected the diffusion required to achieve a good solid state weld.
Unfortunately, the microscopy techniques deployed did not provide information
regarding interstitial content. In summary, these are only theories worthy of further
study which were beyond the scope of this research. The most important point from
the SEM analysis was that chromium presence along the weld interface fracture
surfaces was confirmed, and was clearly the reason for the poor ID bend and tensile
test results.
5.1.4 Microhardness Testing
As was the case with the microhardness analysis of the 22 mm component, the
40 mm MIAB weldments revealed an increase in hardness along the weld interface
(Figure 42). As discussed previously, this region of elevated hardness is most likely

78
due to a high concentration of dislocations as a consequence of the significant forging
action at the joint. In the case of the 40 mm joint, the peak hardness is slightly shifted
toward the tube side of the joint. This is probably due to the fact that the 40 mm
tenons were produced via a forging process, and therefore, experienced significant
softening via recrystallization in the HAZ. In summary, other than the HAZ
softening in the forged 40 mm tenon, the microhardness results for both the 22 mm
and 40 mm components did not reveal any information that would suggest any
significant degradation in properties as a result of the MIAB welding process.
5.2 Mechanical Analysis The ID bend and tensile test results from the initial weld trials provided
immediate evidence of the severe degradation in mechanical properties as a result of
the presence of chromium. In some cases, the degradation was so severe that all the
“petals” of the ID bend test broke off with minimal resistance to the person
conducting the test. Such severe failures obviously suggest a profound impact on the
mechanical properties as a result of welding chromium-plated tubes if the chromium
is not sufficiently expelled from the joint. These mechanical test results during the
initial 40 mm chromium-plated tube-to-tenon welding trials provided strong
justification for the need to develop a unique MIAB welding quality control
methodology through arc monitoring techniques.

79
5.3 Anode/Cathode (Joint Position within the Magnetic Field) Experiments
The purpose of the anode/cathode experiments was to establish the effect on
the arc position (closer to the ID or OD) as a result of shifting the joint toward the
anode or cathode side of the circuit. It was believed that if the rotating arc position
relative to the thickness of the pipe could be altered, it might have an effect on the
extent of chromium ending up in the joint.
Another possible factor that may play a role in arc position is the issue of
anode heating vs. cathode heating since the rate of heating will affect how quickly the
curie temperature is reached. This, will in turn, affect the deflection of the arc by
both the applied and induced magnetic fields. A significant amount of research has
been conducted over the years regarding the anode and cathode heating mechanisms
in typical welding arcs, such as GTAW. It is well established in the GTAW process
that the anode side of the joint, which receives the electrons emitted from the cathode,
experiences considerably more heating than the cathode side. This is illustrated in
Figure 51 [22].
However, in the GTAW arc, the cathode is a tungsten (or tungsten alloy)
electrode which readily emits electrons at typical arc temperatures and currents via a
thermionic emission process. Therefore, it is “easy” for the cathode to emit the
electrons, resulting in the majority of the heating occurring on the anode side. In the
case of MIAB welding, however, both sides of the circuit are steel. As shown in
Figure 52 [22], in order for iron to emit electrons at typical welding currents, it must

80
Figure 51 - Typical GTAW Arc Results in Much More Heating on Anode Side [22]
Figure 52 - Thermionic Emission of Fe Greatly Exceeds Melting Temperature at Typical Arc Currents [22]
Volts

81
be heated well above its melting temperature. So iron vaporizes long before
thermionic emission can occur. Therefore, the anode/cathode heating mechanisms,
which are well understood with other arc welding processes such as GTAW and
GMAW, cannot be applied here.
In summary, although it was beyond the scope of this research to investigate
anode vs. cathode heating effects during MIAB welding, it is likely there is a
difference in the rate of heating between the two sides. As a result, one side of the
joint would be expected to reach the curie temperature faster than the other side of the
joint, and therefore, be affected differently by the applied magnetic field. Upon
reaching the curie temperature, that portion of steel is no longer magnetic and will
behave similar to air or non-ferrous materials regarding its ability to transfer magnetic
flux. This being the case, the joint position within the magnetic field could be
expected to play a role in how the applied magnetic field influences arc location,
especially during the initial heating stage.
This effect was clearly evident in Figure 44, which provides evidence of the
arc traces along the tube walls during the initial stages of arcing. The tube on the left
was shifted toward the anode side of the joint, while the tube on the right was shifted
toward the cathode side. It is clear that the forces acting on the arc cause it to
concentrate more on the ID of the tube when it is shifted toward the anode. However,
once the arc is stabilized and significant heating on both sides of the joint occurs, it is

82
likely that these differences will be reduced. In order to explore this effect in more
depth, joint position within the applied magnetic field was included as a variable in
the L12 DOE.
5.4 L12 DOE
The L12 DOE was designed to assess relationships among the variables of
joint position, level II time (arc heating time), and level III current (current just prior
to upset) with ID bend test crack length. ID bend test cracking was determined
previously to be a direct result of the chromium presence along the weld interface.
Therefore, it was theorized that any influence these variables had on the amount of
chromium along the weld interface would reveal itself in the form of ID bend test
total crack length. In order to provide a wide range of crack length data, parameters
were chosen that were expected to push the extreme edges of the MIAB welding
process window for this component.
Table 3 shows the raw data for the L12 experiment. Three weldments were
produced per condition. Upon initial evaluation of the data, it was clear that none of
the conditions resulted in all three specimens experiencing a zero ID bend test crack
length. Of particular interest, condition number 4 produced the extreme range of ID
bend test results in which one specimen experienced no cracking while another
specimen resulted in 100% “petal fractures” (crack length = 102.8 mm). Clearly,

83
statistical analysis was required to better interpret these results. These results will be
discussed first. Analysis of the results and correlations of the results with the arc
monitoring voltage plots will then be discussed.
5.4.1 Individual Effect of Variables on ID Bend Test Crack Length
Figure 45 graphically displays the effects of the individual parameters on ID
bend test crack length. Within the range of parameters chosen, higher level III
currents and level II times show a clear effect toward reduced crack lengths. Since
the level III current is the primary parameter affecting the expulsion (cleaning action)
of molten material just prior to upset, this result indicates that the lower level III
current chosen was not sufficient for expelling chromium from the joint. The positive
effect of higher level II time suggests that the lower level II time did not provide
sufficient heating for proper upset. The joint position effect was less significant than
the other two parameters evaluated, but there was a small negative effect as a result of
shifting the joint toward the anode side (position -1 on the plot).
The joint position result was interesting considering the previously discussed
arc position experiment, which revealed a tendency for the arc to concentrate on the
tube ID when the joint was shifted toward the anode side. Since the chromium-
plating is on the ID, it is possible that a joint shifted toward the anode side of the
circuit could produce more melting of the chrome which could eventually end up in
the joint. However, this theory also suggests a beneficial effect of shifting the joint
toward the cathode side (relative to the center position), a concept not supported by

84
the data in this experiment. As discussed previously, however, interpretation of
individual parameter effects in any experiment can sometimes be risky, so it is
important to consider the interactive effects among the variables.
5.4.2 Interactive Effect of Variables on ID Bend Test Crack Length
The interactive plots of Figure 46 reveal two significant interactive effects
between level II time and level III current. The first result is that at the longer level II
time, there is minimal effect of level III current, but at the shorter level II time the
effect of the level III current is significant. The second interactive effect between
these two variables is that higher level III currents are insensitive to level II times,
whereas lower level III currents produce less cracking with longer level II times. The
interactive plots also seem to indicate that there is no significant interaction between
joint position and either of the other two variables.
The first interactive effect will be explained and discussed. The effect is
shown in Figure 53 which is a diagram extracted from Figure 46. This figure shows
two simple plots with each plot revealing the effect of level II time on average ID
bend test crack length. However, one plot shows this effect when the level III current
is high while the other plot reveals the effect when the level III current is low. In
summary, the level II time effect is significant and beneficial when the level III
current is low, but has no apparent effect when the level III current is high.

85
Level II Time vs Level III Current
10.43
98.67
3.00 4.50
Level IIICurrent =400Level IIICurrent =800
Figure 53 - Interactive Variable Effect of Level II Time and Level III Current
There are several possible ways to interpret this result of longer level II times
being insensitive to level III currents. The first is that longer level II (weld heating)
times will produce a larger plasticized zone adjacent to the molten material. A larger
region of plasticized material will result in a greater amount of upset of solid-state
material during the forging stage of the process, which could in turn, more effectively
squeeze any contaminated or chrome-enriched material outward into the flash.
The second possible interpretation is that excessively long heating times will
result in thermal expansion of the parts being welded, reducing the gap and
subsequently, the voltage just prior to upset. It is possible that a smaller gap results in
Ave
rage
Cra
ck L
engt
h (m
m)
Level II Time (s)

86
more effective expulsion of molten material just prior to upset. A third possibility is
that a larger volume of molten material is produced by the longer times which is less
affected by surface tension and more easily expelled from the weld zone.
The second interactive effect revealed minimal effect of level II times at the
high level III current, but improvement at the lower level III current as a result of the
higher level II time. This result correlates with the results discussed above, but
presents a slightly different way to interpret the data, providing at least one more
argument for consideration. In this case, the data suggests that high level III currents
may provide enough expulsion before upset to overcome less than ideal weld
conditions, such as a level II (weld heating) time that is either border line excessive or
insufficient.
Previous research on this subject showed that higher level III currents result in
higher Lorentz forces on the arc, producing a greater arc rotation speed [1]. Others
have argued that a faster rotation speed of the arc creates a greater centrifugal force
pushing the molten metal outward. When welding without shielding gas, this force is
utilized to expel the molten material outward toward the OD of the parts being
welded, providing the necessary cleaning action prior to upset.
The problem with this concept is that it implies that if centrifugal forces on the
molten metal were the primary forces playing a role in the cleaning action, then there
would little or no expulsion toward the ID which is not the case. During this
research, it could therefore be argued that greater forces which expel molten material
outward could reduce the quality of the weld. This is because there is potential for

87
more chromium, which is only present on the ID of the tube, to be expelled into the
joint. This at least suggests that in addition to gravity and surface tension, there may
other forces involved on the liquid metal just prior to upset.
5.4.3 Effect of Variables and the Concept of Arc Force and Arc Pressure Another factor that is likely playing a significant role in the cleaning action of
MIAB welding of tubes which has not been discussed in the published literature is the
force created by the pressure of the arc. Arc pressure is often described as an
important phenomenon in the GTAW process. It occurs as a result of the magnetic
pinching effect incurred on the current flowing within the surrounding magnetic field
it creates.
In the case of GTAW, the arc flares from the sharp point of the tungsten
electrode to the work piece. Since the same amount of current is flowing through the
narrow portion of the arc as is flowing in the flared portion of the arc, the result is a
higher current density and greater pinching effect or pressure on the arc near the
electrode. The resulting pressure gradient from high to low creates a plasma flow
from the constricted portion of the arc downward into the flared portion of arc. This
plasma flow exerts pressure on the molten puddle. This phenomenon is shown in
Figures 54 [21] and 55 [22].

88
Figure 54 - Magnetic Pinching Effect on GTAW Arc [22]
Figure 55 - Pinching Effect Creates Downward Flow Which Exerts Pressure on Weld Puddle Depressing It [22]

89
Pressure measurements in GTAW arcs have confirmed that significant
pressures can be developed [21]. Figure 56 shows a typical plot of arc pressure vs.
Figure 56 - Plot of Arc Pressure vs. Radial Distance in a GTAW Arc Reveals Significant Arc Pressures [21]
radial distance from the center of the arc. The units of pressure, KN/m2, are
equivalent to about 1/100th of an atmosphere, or 4 inches of water. Since molten steel
is about 8 times as dense as water, 1 KN/m2 of pressure can be equated to 0.5 inches
of molten steel. This implies that even small pressures can support a significant
amount of molten material, and therefore, provide a considerable depressing effect on
the molten weld puddle.
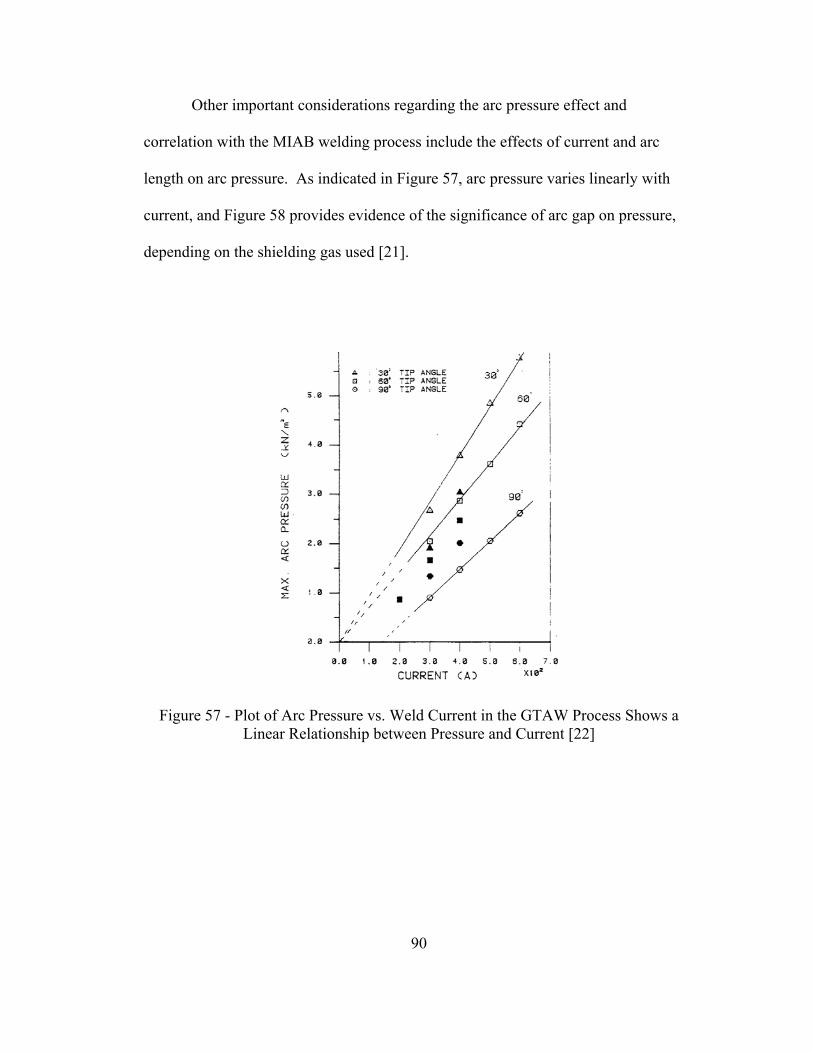
90
Other important considerations regarding the arc pressure effect and
correlation with the MIAB welding process include the effects of current and arc
length on arc pressure. As indicated in Figure 57, arc pressure varies linearly with
current, and Figure 58 provides evidence of the significance of arc gap on pressure,
depending on the shielding gas used [21].
Figure 57 - Plot of Arc Pressure vs. Weld Current in the GTAW Process Shows a Linear Relationship between Pressure and Current [22]
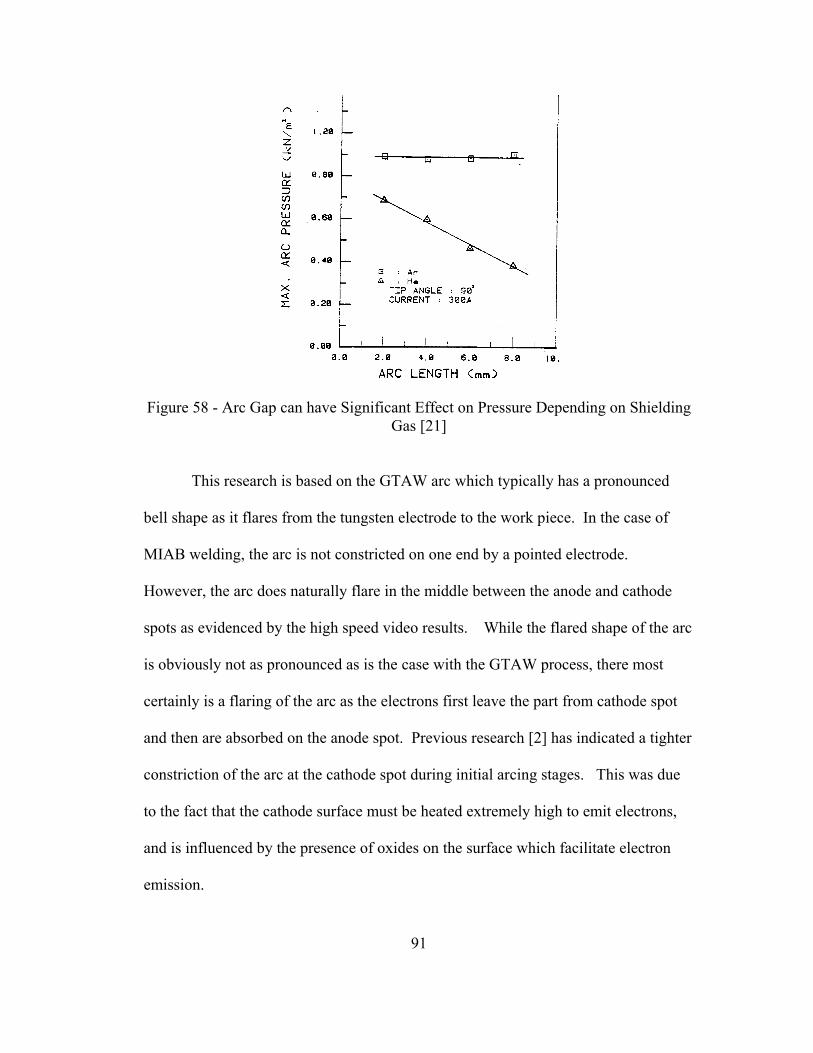
91
Figure 58 - Arc Gap can have Significant Effect on Pressure Depending on Shielding Gas [21]
This research is based on the GTAW arc which typically has a pronounced
bell shape as it flares from the tungsten electrode to the work piece. In the case of
MIAB welding, the arc is not constricted on one end by a pointed electrode.
However, the arc does naturally flare in the middle between the anode and cathode
spots as evidenced by the high speed video results. While the flared shape of the arc
is obviously not as pronounced as is the case with the GTAW process, there most
certainly is a flaring of the arc as the electrons first leave the part from cathode spot
and then are absorbed on the anode spot. Previous research [2] has indicated a tighter
constriction of the arc at the cathode spot during initial arcing stages. This was due
to the fact that the cathode surface must be heated extremely high to emit electrons,
and is influenced by the presence of oxides on the surface which facilitate electron
emission.

92
It was beyond the scope of this research to attempt to quantify the shape of the
MIAB arc. However, it is reasonable to assume that any flaring of an arc, which most
certainly occurs during the MIAB welding process, will create a pressure differential
from the constricted portion of the arc to the flared portion of the arc. If the arc is
wider at the center than at either ends as the high speed video indicates, an outward
flow would be created as a result of the pressure differential. The schematic of Figure
59 illustrates this concept.
If it were possible to accurately determine the shape and size of the MIAB arc,
calculations could be made based on previous research [21] to determine the arc force
pushing outward that is developed during this process. In particular, the following
equation could be applied:
⎟⎟⎠
⎞⎜⎜⎝
⎛+= 1ln2
8 1
22
RRIF o
πμ
Where:
F = arc force µo = permeability in free space I = current R2 = maximum arc radius R1 = minimum arc radius

93
This equation is the same equation developed for the GTAW arc force calculation
[21] except the radius of the arc at the cathode (R1) is replaced by the minimum arc
radius of the MIAB arc, and the radius of the arc at the anode (R2) is replaced by the
maximum arc radius of the MIAB arc.
As discussed previously in the analysis of the GTAW arc, current plays a
significant role in the amount of arc pressure created. Figure 57 shows that doubling
the current effectively doubles the arc pressure. Although this relationship is likely
different for the MIAB welding arc due to its different shape, it is clear that by
increasing current, arc pressure is increased, thereby increasing the outward flow of
the arc described in Figure 59.
Figure 59 - Flared Arc Shape in MIAB Welding Creates Outward Pressure Induced Flow
It is proposed, therefore, that the outward flow created by the pressure
differential in the arc plays an important role in the cleaning (expulsion) action of
Arc
Tube Center Line
Pressure Induced Arc Flow
Pressure Induced Arc Flow
Tube Wall Tenon Wall
Chrome Plating

94
level III in the MIAB welding process, and therefore, affects the amount of chromium
entrapment at the joint. This would also explain why there is molten material
expelled toward both the ID and OD, as opposed to the centrifugal force concept
which would tend to expel molten material toward the OD only. If expulsion
occurred in the OD direction only, it could be argued that more chromium (from the
plating on the tube ID) would end up at the weld interface with greater expulsion.
The arc pressure theory proposes that chromium from the plating on the ID would be
pushed inward, away from the weld interface, as suggested in Figure 59. These
arguments support one of the major results of the L12 experiment which showed a
reduction in ID bend test cracking from chromium contamination as a result of a
higher level III current.
Figure 58 reveals that in some cases, short arc gaps can significantly increase
arc pressure in the GTAW process. This observation may relate to one of the other
important interactive effects from the L12 experiment, namely that longer level II
(weld heating) times are insensitive to level III (expulsion) currents. As discussed
previously, longer weld times result in greater thermal expansion of the components
being welded which produces a shorter weld gap as the arc heating proceeds. If the
smaller gap produces higher arc pressures as the previous research suggests, it
follows that the need for increased level III currents to produce the required expulsion
would be diminished.
95
5.4.4 Effect of Arc Gap Setting As discussed previously, the MIAB process utilizes a constant current power
supply to provide the arcing current. As a result, the arc voltage is highly dependent
on the setting of the arc gap between the two components being welded. Since
voltage plays such an important role in the MIAB welding process, it was decided to
also statistically analyze the effect of the gap setting on the ID bend test cracking
lengths. The gap setting refers to the gap that was set when the parts were loaded into
the machine. This gap becomes the arc gap upon initiation of the arc. Whereas the
gap distance was not considered an input variable and therefore not tightly controlled,
it was measured and recorded for each weld produced. Previous welding experiments
had indicated that for optimum arc stability, it was important to keep the gap at
approximately 1.5 mm. For this L12 experiment, the gap was therefore maintained
between 1.4 mm and 1.6 mm measurements since the configuration of the machine
did not allow much more precision than this. But this range of gap variation provided
for the possibility to assess the gap effect, the results of which are shown in Figures
60 and 61.
The first interesting result is the individual effect of initial arc gap on crack
length (Figure 60). Within the 2 mm gap range utilized for the research, the smaller
gaps produced the least amount of cracking. The most important interactive variable
effect involving the initial arc gap setting is shown on Figure 61. This effect reveals
that smaller gaps (closest to 1.4 mm) were not as sensitive to the effects of longer

96
level III current. This result correlates well with the previous discussion suggesting
that smaller gaps produce higher arc pressures, which may assist in the cleaning
action during the application of the level III current.
It should be mentioned however, that as Figure 60 indicates, there is a wide
variation in the number of data points for the gap setting. This is due to the fact that
gap was not chosen as an input variable for the L12, but analyzed later after the
experiment was completed. As a result, whereas it does reveal a very interesting
trend regarding the effect of the gap, the statistical relevance of the data would have
to be considered marginal. Further studies are suggested, and are discussed in the
Future Work section later in this report. The L12 results and subsequent analysis of
the results will now be correlated with the high speed video images, and finally, the
arc monitoring plots later in this section.

97
Y bar Marginal Means Plot
0
20
40
60
80
100
120
-1 0 1 400 800 3 4.5 1.4 1.45 1.5 1.55 1.6
Effect Levels
Joint PositionLev III CurrentLevel II TimeGap
6 data pts
14 data pts
2 data pts1 of these points is the outlier from TC 4
10 data pts
4 data pts
Figure 60 – Individual Variable Effects Including Effect of Gap on Crack Length
ID B
end
Test
Cra
ck L
engt
h (m
m)
Joint Position
Level III Current
Level II Time
Arc Gap

98
Lev III Current vs Gap
4.10
102.80
400.00 800.00
Gap = 1.4Gap = 1.45Gap = 1.5Gap = 1.55Gap = 1.6
Figure 61 – Interactive Variable Gap Effects on Crack Length – Level III Current
5.5 High Speed Video Image Interpretation
The high speed video images of Figures 48, 49, and 50 reveal the general
shape of the arc as it moves along the top portion of the tube-to-tenon joint. The
resolution of this camera and relatively slow 2000 frames/second frame rate was not
sufficient for in-depth analysis of the arc motion and shape. However, the variation
in the overall arc profile as a result of placing the joint in different positions within
the applied magnetic field is evident. Figure 50 represents a MIAB weld shifted
toward the cathode side. In this case, the arc can be seen to be flaring out of the joint.
This shows that the arc is rotating along the OD edge of the joint, and correlates well
Ave
rage
ID B
end
Cra
ck L
engt
h (m
m)
Level III Current
99
with the arc tracing experiment (Figure 44) which revealed a tendency for the arc to
move toward the OD of the tube wall when the joint was shifted toward the cathode
side.
In Figure 48 the arc movement is obscured by the joint, indicating that arc
rotation is oriented more toward the ID of the tube wall, also confirming the results of
the arc tracing experiment. Compared to the arc tracing experiments which provided
evidence of arc position at the very early stages of arcing, the video images were shot
well after the arc stabilized. These images verified that the tendency for the arc
position to be altered by joint position continues even after the parts are heated and
the arcing is stable. Considering the obvious differences in arc position and shape for
different joint locations within the magnetic field, it is surprising that the L12 data did
not result in a stronger trend toward joint position affecting ID bend crack length.
Figure 50 also reveals a tendency for the arc to flare toward the left (cathode)
when it is shifted toward the cathode. During the weld trials, the chromium-plated
tubes were always placed on this side with the tenons on the right (anode) side. In the
centered joint of Figure 49, the arc seems to show a very slight bias toward the
cathode side, but it is difficult to say conclusively considering the resolution of these
pictures. Again, further work is suggested in which the chromium-plated tubes be
placed on the anode side.
100
5.6 Analysis of Arc Monitoring Voltage Plots - Correlation with DOE Results The arc monitoring methodology produced voltage vs. time plots which
represented voltage “signatures” for each weldment producing during the L12 DOE.
Most of the plots contained similar generic characteristics, but also revealed unique
features which could be related to critical variable effects and subsequent weld
quality. In this section, the generic characteristics of the voltage vs. time plots are
discussed first. This is followed by a discussion and analysis of the voltage plots for
each important weld condition produced during the L12 experiment, and correlation
of these plots with the statistical results of the L12. In this way, relationships are
proposed between chromium-plated tube-to-tenon MIAB weldment quality, and
specific features of the voltage plots.
5.6.1 Analysis of Voltage Plots – Interpretation of Characteristic Features Several characteristic features of features of the voltage plots were observed
in most welds. Figure 62 shows a typical plot that contains all of the most common
features. The first observation to be made is the initial rise in voltage that occurs.
This is most likely due to the arc initiating along the ID of the tube-to-tenon joint due
to the arc blow effects shown previously on Figure 12, and then moving toward the
OD of the joint as localized heating results in the curie temperature being exceeded.
As the curie temperature is reached locally, that region along the tube wall no longer
easily conducts the magnetic flux lines surrounding the flow of current, and as a

101
result, the arc blow effect begins to push the rotating arc outward. This phenomenon
was observed by previous researchers [6] and was discussed in the Technical Review
section. As the arc moves toward the OD, it flares out of the joint as evidenced by the
high speed video images. When the arc flares outward, its length is effectively
increased, resulting in higher recorded voltages. The outward movement of the
rotating arc eventual results in a more uniform heat distribution across the wall
thickness of the tube and tenon. At this point, the arc can be considered stabilized as
evidenced by the peak voltage peak. Initial melting of the parts may also widen the
gap and contribute to the rise of voltage. This effect is evident to some degree on
every plot analyzed.
A second important and interesting observation from the plots is the overall
drop of the voltage that occurs with time following the initial rise. In some cases, the
drop results in a voltage “plateau” that may be an important feature in terms of
predicting weld quality and the effect of important variables. This feature is
discussed later in this section. The pronounced drop in voltage is occurring due to
heat flow into the parts. As heating progresses, thermal expansion in the axial
direction of both the tenon and the tube results in a narrowing of the arc gap. Just
before upset, a voltage spike is observed. This spike occurs due to the rapid increase
in the applied current which results in expulsion of molten metal and an increase in
the arc gap just prior to upset. The voltage spike may be another important feature in
terms of predicting weld quality and is also discussed later.

102
Figure 62 - Common Features Observed in the Voltage Plots
5.6.2 Analysis of Voltage Plots – Effect of Level II Time
The statistical results of the individual variable effects from the L12
experiment revealed that longer level II (arc heating) times resulted in a reduction in
ID bend test crack length. Analysis of the interaction between variables revealed that
the positive benefit of longer level II times only occurred when the level III current
was low. These results will now be correlated with the appropriate voltage plots
Arc Initiates
Current in Black
Voltage in Red
Expulsion Prior to Upset Increases Arc Gap
Thermal Expansion Reduces Arc Gap
Rotating Arc Moves Toward OD of Joint
Vol
ts
Time (s)
Arc Stabilization

103
shown in Figures 63 and 64. Figure 63 shows the effect of level II time when the
level III current is low, and Figure 64 shows the same effect when the level III time is
high.
The first observation that can be made is the effect of the longer level II time
in both plots. In each case, the longer times resulted in a lower voltage or voltage
“plateau” of 22-23 volts just prior to the expulsion stage. The “plateau” suggests that
a steady-state heat flow condition has been achieved in which there is no further
significant thermal expansion of the parts. It also suggests that a minimal arc gap has
Figure 63 - Increase in Level II (Arc Heating) Time at a Constant Low Level III Current Results in Voltage Plateau Prior to Upset
Level II Time = 4.5s Level III Current = 400a
Level II Time = 3.0s Level III Current = 400a
Voltage Plateau
Thermal Expansion
Expulsion No Expulsion

104
Figure 64 - Level II Time Effect at Higher Level III Current
been achieved since there is no further drop in voltage. Both of these conditions also
produced a larger voltage spike prior to upset, indicative of a greater amount of
expulsion. This voltage spike occurs as the molten metal is expelled rapidly from the
joint, creating an increase in the arc gap just prior to upset.
As discussed previously and shown on Figure 58, with the GTAW arc,
increases in arc pressure can result from decreases in arc gap distances [22]. This
phenomenon is also shown in Figure 65, which reveals how arc pressure in a helium-
shielded GTAW arc increases with smaller arc gaps and decreasing distances from
the center of the arc. Furthermore, arc pressure has been shown to be proportional to
I2/R2 [2], where I = arc current (amps), and R = radius of the arc. Smaller gaps would
likely have smaller diameter arcs, contributing to increases in pressure. These
concepts suggest that the smallest gaps resulting from thermal expansion of the parts
Level II Time = 3.0s Level III Current = 800a
Level II Time = 4.5s Level III Current = 800a
Voltage Plateau
Significant Expulsion
Minimal Expulsion
Vol
ts
Vol
ts
Time (s) Time (s)

105
Figure 65 – Arc Pressure Variations at Various Arc Lengths for a GTAW Arc
may allow for the greatest expulsion of chromium from the joint prior to upset. These
results correlate well with the statistical results of the L12 experiment which revealed
a beneficial individual variable effect due to longer level II times.
Of particular interest from the L12 statistical analysis was the interactive
effect between level II time and level III current (Figure 46), which indicated that
level III current had a minimal effect when the level II times were at the high levels.
But level III current had a strong effect when level II times were low. The voltage
plots of Figures 63 and 64 display graphic evidence of this interaction. On the low
106
level III current plots of Figure 63, only the high level II time plot reveals evidence of
expulsion. In Figure 64, the high level III current plots, expulsion is evident with
both level II times.
Therefore, it can be concluded that when the level II times were low, a higher
level III current was required to achieve expulsion. When the level II times were
high, expulsion was achieved in both cases. This implies that the smaller gaps
created with the longer times resulted in greater arc pressure and subsequent
expulsion regardless of the magnitude of the level III current. So if the arc gap is
sufficiently small prior to the application of the level III current, the process
potentially could be considered more robust and less sensitive to the level III current.
5.6.3 Analysis of Voltage Plots - Effect of Level III Current In this case, level III current effects are compared and contrasted for given
level II times. Figure 66 shows the low level II time plots and Figure 67 the high
level II time plots. These results reveal the impact of level III current on arc pressure.
At the lower times (Figure 66), higher level III currents were required to achieve any
expulsion, whereas at the higher times (Figure 67), expulsion was evident in both
cases but significantly increased with the higher level III current. As discussed
previously, current also plays a significant role in arc pressure. Figure 68 is a plot of
arc force vs. current which summarizes the results from several research projects on
this subject [22]. This data was gathered from actual arc force measurements. It is
easy to see from this plot that for some researchers as much as a five-fold difference

107
Figure 66 - Level III Current Has Significant Effect on Expulsion at Short Times
Figure 67 - Expulsion at Long Level II Times is Increased at High Level III Currents
in arc force produced between 400 and 800 amps (the two level II currents utilized in
this research) was observed. Again, although this data is for a bell-shaped GTAW
arc, it seems likely that similar trends would exist for the MIAB arc, but perhaps
Level III Current = 400a Level II Time = 3.0s
Level III Current = 800a Level II Time = 3.0s
No Expulsion
Expulsion
Level III Current = 400a Level II Time = 4.5s
Level III Current = 800a Level II Time = 4.5s
Minimal Expulsion Significant Expulsion

108
Figure 68 – Arc Force vs. Current
would not be as pronounced. This analysis again supports the statistical evidence
from the L12 experiment, which showed reduced cracking at higher level III currents.
It could also be surmised that higher level III currents make the process more robust
to variations in level II times by creating sufficiently high pressures even if the gap is
large. This again supports the theory of the importance of arc pressure, and the
relationship between arc pressure and arc gap.

109
5.6.4 Analysis of Voltage Plots - Effect of Gap Setting Finally, the effect of initial gap setting on the voltage plots is discussed. As
shown in Figures 60 and 61, smaller initial gap settings resulted in a trend toward
reduced cracking. Again, it is important to note that gap settings were not controlled
input variables in the L12 experiment, but represent measurements taken and
recorded during the welding trials. As a result, there was no attempt to generate
specific numbers of data points at different gap settings. Therefore, the L12 analysis,
which showed a beneficial effect from smaller gap settings, would require more data
points to be considered statistically relevant. Nonetheless, the trend was very
interesting and the voltage plots were analyzed for the various gap settings and
correlated with the L12 results.
Figure 69 shows the typical plot profiles of two gap setting extremes. These
plots represent welds that were made using the same parameters, but the weld on the
left utilized a 1.4 mm gap and the weld on the right utilized a 1.6 mm gap. This range
represented the extremes of the gap settings used during the L12 experiment. The
gap setting determines the arc gap distance at the beginning of the arc cycle. As the
plots indicate, the smaller gaps resulted in lower voltages throughout the welding
cycle. The most interesting difference, however, was that the voltages just prior to
the application of level III current were consistently 1-2 volts lower with the 1.4 mm
gap vs. the 1.6 mm gap. This occurred even though the voltage plateaus were usually
reached in both cases. This suggests that even with a steady-state heat flow condition
stabilizing the thermal expansion effect, the initial gap setting may play a role in the

110
Figure 69 - Gap Setting Affects Level of Voltage Plateau and Time of Arc Stabilization
size of the gap just prior to the application of level III current. Per previous
discussions, smaller gaps may result in higher pressures and more efficient cleaning
action. This may explain one of the benefits from the smaller gap settings.
Further analysis of the plots of Figure 69 reveals another interesting difference
between the two voltage plots. With the smaller 1.4 mm gap setting, arc stabilization
is achieved earlier in the weld cycle. This is evidenced by the fact that the voltage
peak on this plot occurs almost 1 second earlier than the voltage peak on the plot
produced with the 1.6 mm gap. Earlier stabilization of the arc will result in
significant heating of the parts to occur earlier in the cycle.
Arc physics can again be applied to explain this observation [22]. In order to
achieve an arc, electrical breakdown must first occur in the atmosphere between the
parts being welded. When breakdown occurs, the gas (air) in the joint becomes a
Gap Setting = 1.4 mm Gap Setting = 1.6 mm
Voltage Plateau = 21 volts Voltage Plateau = 23 volts
Arc Stabilization Arc
Stabilization

111
conductor. Breakdown results when an electron is sufficiently accelerated in the gap
such that it has enough kinetic energy to ionize an atom in the gas. Ionization occurs
when the electron collides with the gas atom, resulting in a separation between the
positively charged atom nucleus (ion) and the negatively charged electron. Paschen’s
Law states that the breakdown is related to voltage, arc gap, and gas pressure given
by: Vs = kph, where Vs = voltage required for breakdown, k = Paschen constant
which depends on the gas, p = pressure of the gas, and h = gap distance. These
relationships are shown graphically on Figure 70 [22].
Figure 70 – Paschen’s Law [22]
Paschen’s Law also relates electrical breakdown of a gas to the electric field,
defined as: E = V/h. It is the electric field that accelerates the electron across the gap
creating the required kinetic energy for ionization. As this relationship shows, for a

112
given applied voltage, smaller gaps result in greater electric fields. As a result,
electrical breakdown and stabilization of the arc can occur more easily, explaining the
beneficial result of smaller gaps in the MIAB welding process shown on Figure 80.
5.6.5 Summary of Arc Monitoring Voltage Plot Analysis
The voltage plots clearly provided a significant amount of information
regarding the effects of critical MIAB weld variables for this application. Correlation
of specific features from these plots with the weld variable effects analyzed
statistically in the L12 experiment was usually very good. It should be mentioned,
however, that not all of the plots that contained features thought to be indicative of a
good weld produced crack-free welds. One of the possible reasons is that the MIAB
weld variables chosen for the L12 experiment were expected to be on the extreme
edges of the process window for the 40 mm chromium-plated tube-to-tenon joints.
This was required in order to produce a wide range of weld interface crack lengths to
enhance the subsequent statistical analysis of the results. In summary, this research
showed the feasibility for producing MIAB welded chromium-plated tube-to-tenon
joints, revealed the effect of critical variables, and proposed a method for monitoring
the quality of these weldments. Undoubtedly though, much more development work,
interpretation, and analysis of this methodology is required before applying it to a
production environment.

113
5.7 CONCLUSIONS The MIAB welding process proved to be an effective welding technique for
the tubes-to-tenon joint. Feasibility for MIAB welding chromium-plated tubes-to-
tenons was established, although significant technical challenges to producing this
joint were discovered. The effect of critical MIAB weld variables was established for
this application. The use of arc monitoring equipment, in combination with high
speed video, metallurgical and mechanical analysis, and a Design of Experiment
statistical approach, provided significant insight into producing this joint. Specific
conclusions from this research program are as follows:
1) Feasibility for MIAB welding the chromium-plated tube-to-tenon joint was
established.
2) The potential for MIAB weld interface failures as a result of the presence
of chromium enriched regions at the weld interface was discovered. The chromium
enriched regions were most likely oxides that formed during arcing process and later
became trapped in the joint.
3) Beneficial effects of level II time, level III current, and arc gap toward
reducing the chromium-induced weld interface cracking was established. Each of
these effects played a role in improving the expulsion process, which more effectively
removed chromium from the joint.

114
4) A methodology for monitoring MIAB weld quality of chromium-plated
tube-to-tenon joints through the use of voltage monitoring, and the subsequent
interpretation of voltage “signatures” was proposed

115
5.8 FUTURE WORK
5.8.1 Further Characterization of Fracture Surfaces
While the presence of chromium along the MIAB weld interface was clearly
established during this research, the precise chemical composition and the
morphology of the chromium-enriched regions was not. This is because the SEM
EDS analysis techniques utilized in this research are semi-quantitative, and do not
provide much precision. These techniques are also not capable of detecting
interstitials such as oxygen. It is therefore proposed that more extensive chemical
characterization techniques be deployed to more precisely analyze the chromium-
enriched regions.
5.8.2 Shielding Gas Effects
If it is determined that the chromium-enriched regions along the weld
interface are actually chromium oxides, the use of shielding gas may provide some
benefit by not allowing oxygen to interact with the chromium. Future work should
include a variety of shielding gases, and there impact on chromium presence along
the weld interface.

116
5.8.3 Anode/Cathode Experiments
During this research, the chromium-plated tube was always placed on the
anode side (left side facing the machine) and the tenon on the cathode side. Since the
behavior of the arc at the anode spot has been shown to be different than at the
cathode spot, a switch in joint orientation may provide further insight regarding
chromium presence at the weld interface. A simple initial experiment would be to
weld a group of parts with each orientation, and determine any differences with the
metallographic and mechanical techniques used in this research.
5.8.4 Effect of Initial Gap Setting
The initial gap setting proved to be an important variable in this experiment.
This setting determines the arc length during the initiation of the arc. During this
research, only a small range of gap setting lengths were analyzed. The results for this
analysis provided insight regarding the importance of the initial gap, but were not
considered statistically relevant since gap variations were not part of the DOE, but
interpreted later. Future work on chromium-plated tube-to-tenon joints should focus
specifically on a wide range of gaps do determine whether or not gap length plays an
important role in chromium presence at the weld interface.

117
5.8.5 Ratio of Solid-State Weld Interface Length to Overall Weld Interface Length
The MIAB weld interface consists of a solid-state bond region which
transitions to the previously molten material which is squeezed outward into the flash.
This transition is not easy to see microstructurally but can be seen when viewing the
weld macrostructure. This molten material is most likely oxidized during MIAB
weldments that are made without shielding gas. The molten material also most likely
contains the chromium that produced the poor welds during this research. It is
possible, therefore, that a higher ratio of previous molten material to solid state bond
length along the entire weld interface might be degrading to mechanical properties,
and is worthy of further study.
5.8.6 Further Analysis of Weld Voltage “Signatures”
This research program established the possibility for real-time MIAB weld
quality monitoring through the use of arc monitoring to produce weld voltage
“signatures”. However, much more research on this approach is required before such
a methodology can be utilized in production. In particular, the importance of the
voltage “plateau” as it was suggested during this research program needs further
exploration. It is also possible that pattern recognition techniques could be deployed
for a more thorough analysis of the voltage plots toward the establishment of MIAB
weld quality acceptance criteria.

118
5.8.7 Continuation of High Speed Video and Arc Pressure Analysis
The high speed video analysis of this research provided insight regarding the
general shape of position of the arc as it rotated around the joint. However, the frame
rate of this equipment was limited, and most of the video clips were shot at 2000
frames/per second. This frame rate was insufficient for detailed observation of the
arc. Further research utilizing much higher frame rates and better resolution is
suggested. This capability could provide for accurate measurements of the arc profile
and determinations of arc pressures.
119
REFERENCES
[1] Kim, Choi, "A Study on the Numerical Analysis of Magnetic Flux Density by a Solenoid for Magnetically Impelled Arc Butt Welding", Proc. Instn. Mech. Engrs. Vol.217 Part B:J. Engineering Manufacture [2] Steffen, Welz, "Pressure Welding of Tubes with a Magnetically Displaced Arc", Schweißen und Schneiden Translation, 4/1982, E70-E72 [3] Nentwid, Appel, "Coil Systems, Magnetic Field Distribution and Arc Behaviour in Pressure Welding with Magnetically Impelled Arc", Welding and Cutting, 1/1995, E9-E11 [4] Kachinskiy, Krivenko, Ignatenko, "Magnetically Impelled Arc Butt Welding of Hollow and Solid Parts", Welding in the World, Vol. 46, no. 7/8, 2002, 49-56 [5] Kuchuk-Yatsenko, et. al., "Control of the Arc Moving in a Narrow Gap Under the Effect of a Magnetic Field in Press Welding of Pipes", Welding International, 1988, no. 11, 965-968 [6] Sato, Katayama, Ioka, Otani, "An Experimental Study of Rotational Behaviour of the Arc During Magnetically Impelled Arc Butt Welding", Welding International, 1991, 5(1), 5-10 [7] Kuchuk-Yatsenko, Syrovatka, Kuznetsov, "Speed of Movement by an Arc in the Gap Between a Tube and a Plate Under the Action of a Magnetic Field", Automatic Welding, November, 1983, 23-26 [8] Taneko, Arakida, Takagi, "Analysis of Arc Rotation Velocity in Magnetically Impelled Arc Butt Welding", Welding International, 1987, Vol. 3, 247-253 [9] Mori, Yasuda, "Magnetically Impelled Arc Butt Welding of Aluminum Pipes", Transactions of the Japan Welding Society, Vol. 21, No. 1, April 1990, 3-10

120
[10] Nentwig, Schmidt, "Magnetic Field Distribution During Pressure Welding of Magnetic and Non-Magnetic Components with a Magnetically Controlled Arc", Welding and Cutting, 10/1986, E169-E171 [11] Welz, Nentwig, "Effects of Shielding Gas, of the Heating and Upsetting Process in Pressure Welding Using a Magnetically Moved Arc", Welding and Cutting, 4/1988, E65-E68 [12] Johnson, Carter, Dinsdale, Threadgill, Wright, "Magnetically Impelled Arc Butt Welding of Mild Steel Tubing", Welding Journal, November 1979, 17-27 [13] Welz, Nentwig, Schwarzkopf, "Magnetically Impelled Arc Pressure Welding of Non-Magnetic Steels", Welding and Cutting 2/1990, E24-E26 [14] Xiancong, Ruilin, et. al., "A Study of Magnetically Impelled Arc Butt Welding", The Welding Institution of The Chinese Mechanical Engineering Society, 6-8 September, 1984, 1-6 [15] Kalev, Mikhailov, V'lchev, "Calculation of Temperature Fields in Welding with a Magnetically Controlled Arc with the Power Changing with Time", Welding Production, October 1986, 28-29 [16] Hone, "Magnetically Impelled Arc Butt Welding", Production Engineer, February 1989, 38-40 [17] Hagan, Riley, "An Industrial Application of MIAB Welding of Tubes: A Rear Axle Cross Tube Assembly", Second International Conference on Pipe Welding, London, 20-22 November 1979, Volume 1 - Papers, Paper 17, 51-58 [18] Hiller, Schmidt, Breiksch, "Use of the Magnetarc Welding Process in the Production of Truck Cab Suspension Systems", ThyssenKrupp Techforum, December 2003, 40-43 [19] ASM Handbook, Volume 8, 8th Edition, "Metallography, Structures, and Phase Diagrams", 1973 [20] Vedani, Previtali, Vimercati, Sanvito, Somaschini, "Problems in Laser Repair-Welding a Surface-Treated Tool Steel", Surface and Coatings Technology 201 (2007), 4518-4525 [21] Lin, Eagar, "Pressures Produced by Gas Tungsten Arcs", Metallurgical Transactions B, Volume 17B, September 1986, 601-607

121
[22] Richardson, "Physics of Arc Welding", The Ohio State University, Welding Engineering 801 Class Notes, Copyright 2005 [23] "Precision Butt Welding of Axle Tubes at Vauxhall", no author listed, Sheet Metal Industries, October 1987, 520 [24] "Magnetarc Welding Technology", no author listed, Welding and Metal Fabrication, May/June 1987, 186 [25] Haman, "Welding Process Meets Modern Production Line Demands", Welding Journal, May 2001, 37-40 [26] Loebner, "Magnetarc Welding Theory and Practice", Second International Conference on Pipe Welding, London - 20-22 November 1979, Volume 1 - Papers, Paper 18, 29-37 [27] Black, "Magnetically Impelled Welds Join Tubular Sections", Advanced Materials & Processes, 12/99, 11 [28] Welz, Nentwig, Schwarzkopf, "Experiments in Selective Control of Arc Movement when Welding with a Magnetically Impelled Arc", Welding and Cutting 5, 1989, E82-E84 [29] Ganowski, "The Magnetarc Welding Process", Welding and Metal Fabrication, June 1974, 206-213 [30] Ivkovich, “Arc-Weld Monitoring with Coordinated Part Tracking”, 5th Robotics Conference, February 2001, presentation only [31] Lippold, “Welding Metallurgy II”, The Ohio State University, Welding Engineering 612 Class Notes [32] Lippold, “Special Topics in Welding Engineering”, The Ohio State University, Welding Engineering 715 Class Notes [33] Arc monitoring equipment and software provided by IMPACT Engineering, Inc. [34] Hegwood, McCray, “Six Sigma Green Belt training”, Delphi, November 2007

122
APPENDIX A
A.1 22 mm Component - Results
As discussed previously, the primary purpose of MIAB welding the 22 mm
tubes-to-tenons was to first establish feasibility for MIAB welding tubes-to-tenons,
and then to develop a MIAB welding knowledge base to help guide the 40 mm
chromium-plated tube-to-tenon research which followed. Feasibility for producing
the tube-to-tenon joint was established, as were metallurgical and mechanical
techniques for assessing weld integrity. A critical variable was identified
inadvertently as a result of an electrical malfunction in the MIAB weld controller.
Finally, significant knowledge was gained about the process and the effect of specific
variables through a Design of Experiments approach.
A.1.1 Metallurgical Analysis Microhardness and optical metallography were the metallurgical analysis
techniques initially utilized in the 22 mm development work. Only a small amount of
microhardness testing was conducted since the materials being welded are not known
to have high hardenability.
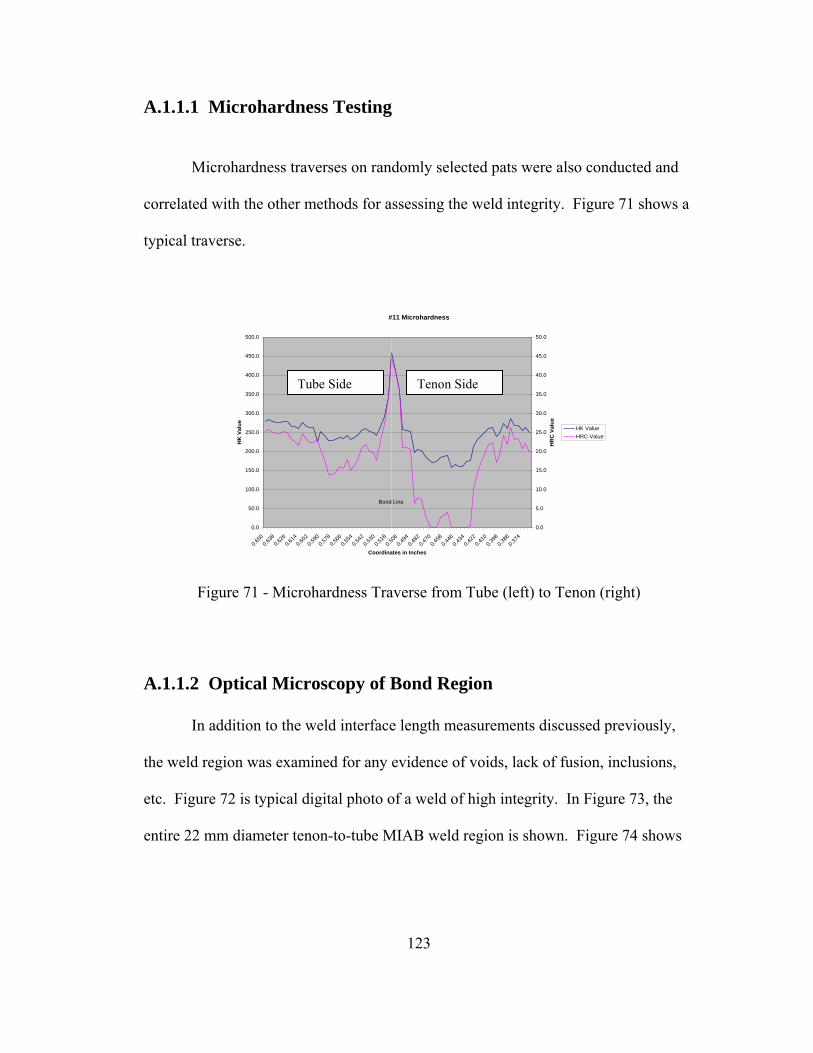
123
A.1.1.1 Microhardness Testing
Microhardness traverses on randomly selected pats were also conducted and
correlated with the other methods for assessing the weld integrity. Figure 71 shows a
typical traverse.
#11 Microhardness
0.0
50.0
100.0
150.0
200.0
250.0
300.0
350.0
400.0
450.0
500.0
0.650
0.638
0.626
0.614
0.602
0.590
0.578
0.566
0.554
0.542
0.530
0.518
0.506
0.494
0.482
0.470
0.458
0.446
0.434
0.422
0.410
0.398
0.386
0.374
Coordinates in Inches
HK
Val
ue
0.0
5.0
10.0
15.0
20.0
25.0
30.0
35.0
40.0
45.0
50.0
HR
C V
alue
HK ValueHRC Value
Bond Line
Figure 71 - Microhardness Traverse from Tube (left) to Tenon (right)
A.1.1.2 Optical Microscopy of Bond Region
In addition to the weld interface length measurements discussed previously,
the weld region was examined for any evidence of voids, lack of fusion, inclusions,
etc. Figure 72 is typical digital photo of a weld of high integrity. In Figure 73, the
entire 22 mm diameter tenon-to-tube MIAB weld region is shown. Figure 74 shows
Tube Side Tenon Side

124
an example of a weld in which sufficient upset was not achieved at the end of the
weld cycle, and a closer view of such a weld in Figure 75 reveals voids that can be
seen along the weld interface.
Figure 72 - Optical Micrograph of a Typical MIAB Weld
Figure 73 - Macrosection of 22 mm Tenon-to-Tube MIAB Weld
Tube
Tenon
Weld interface
Evidence of previously molten material
Tenon
Tube walls

125
Figure 74 - MIAB Weld Joint Reveals Insufficient Upset
Figure 75 - Voids Along Weld Interface Can Result from Insufficient Upset
Evidence of previously molten material in joint
Voids along weld interface

126
A.1.2 Mechanical Analysis
ID bend and tensile test results are discussed. These methods were
determined to be effective methods for assessing weld integrity, although tensile did
not provide the range of results that ID bend testing did. As a result, tensile testing
was not used in the DOE’s.
A.1.2.1 ID Bend Testing
Figure 76 is an example of an ID bend test coupon which was cut in half to
reveal its features. ID bend testing was not used in the L16 DOE analysis, but was
Figure 76 - Portion of Acceptable 22 mm ID Bend (“Tulip”) Test Coupon
No visible cracking along weld ID
Cracking at tenon shoulder not close to weld

127
conducted on random weldments with tensile testing to support the metallographic
results. All ID bend tests conducted on MIAB weldments produced with the
optimum L16 parameters were crack-free in the weld region.
A.1.2.2 Tensile Testing As discussed above, tensile tests were conducted in conjunction with ID bend
testing in order to support the bond length measurement analysis. The test results
were not used in the L16 analysis. Although ultimate tensile loads at failure were
monitored, the tensile test was basically considered to be “go” or “no-go”. An
acceptable (“go”) tensile test was considered one in which the failure occurred in the
base metal as shown in Figure 77. Any evidence of weld interface fractures as a
Figure 77 - Acceptable 22 mm Tensile Test Results in Base Metal (Tenon) Failure
Tensile test failed in tenon away from the
ld

128
a result of the tensile test were considered to be unacceptable (“no-go”) tensile tests.
All tensile tests on MIAB weldments made with the optimum L16 conditions failed in
the base metal.
After the completion of the L16 experiment, more MIAB welded parts were
produced for validation testing. This type of testing, which includes tensile testing, is
designed to assess the parts worthiness as a potential production suspension
component. Optimal parameters from the L16 experiment were used to weld the
parts. Early in the testing, it was discovered that some of the parts were failing
catastrophically along the weld interface during tensile testing in a manner not seen
before. Figure 78 shows a typical failure. Since no such failures occurred during any
of the previous L16 analysis, these results were extremely puzzling. It was
Figure 78 - 22 mm Failed Tensile Test Due to Improper Parameters from Electrical Short in Controller
Tensile Failure Along Weld Interface

129
subsequently determined that a malfunction in the control unit due to an electrical
short was resulting in an excessively low current delivered to the parts just prior to
upset. This unintentional result provided insight regarding the importance of the
“pre-upset” current, later referred to as level III current.
A.1.3 L16 DOE Based on Weld Interface Length Measurement As discussed previously, the initial development work on MIAB welding of
the tube-to-tenon joint was based on an L16 DOE methodology. In this experiment,
the length of the weld interface, as viewed on an optical microscope, was established
as the primary criterion for assessing weld quality and the effect of MIAB weld
variables. A commercially available metallographic software package called Pax-It
provided the tool for conducting the weld interface length measurements. An
example of this measurement technique is shown in Figure 79.
Figure 79 – Weld Interface Length Measurement Technique Using Pax-It Software
Metallographic software program provides accurate measurement of weld interface lengths
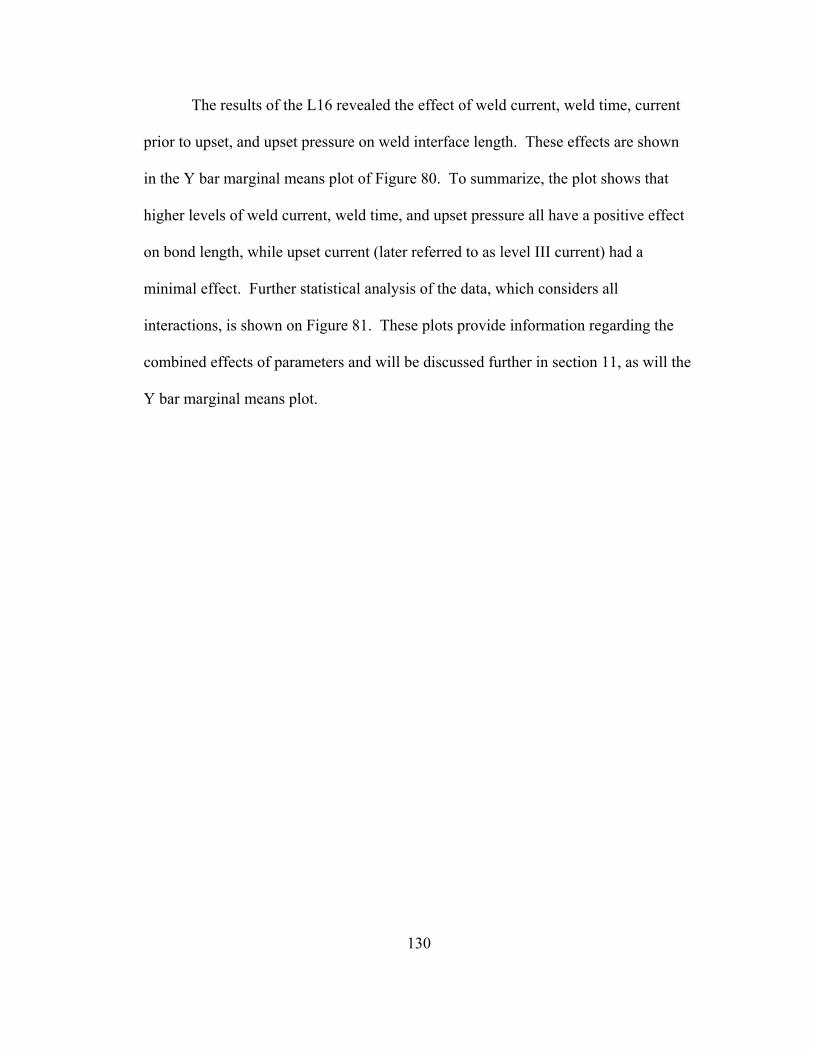
130
The results of the L16 revealed the effect of weld current, weld time, current
prior to upset, and upset pressure on weld interface length. These effects are shown
in the Y bar marginal means plot of Figure 80. To summarize, the plot shows that
higher levels of weld current, weld time, and upset pressure all have a positive effect
on bond length, while upset current (later referred to as level III current) had a
minimal effect. Further statistical analysis of the data, which considers all
interactions, is shown on Figure 81. These plots provide information regarding the
combined effects of parameters and will be discussed further in section 11, as will the
Y bar marginal means plot.

131
Y bar Marginal Means Plot
0
0.5
1
1.5
2
2.5
3
3.5
4
4.5
-1 1 -1 1 -1 1 -1 1
Effect Levels
Weld CurrentWeld TimeUpset CurrentUpset Pressure
Bond Length
Figure 80 – MIAB Weld Variables Weld Current, Weld Time, and Upset Pressure Increase Length of MIAB Weld Interface

132
Figure 81 – Interactive Variable Effects of MIAB Weld Parameters on Weld Interface Length
Weld Current vs Upset Current
2.76
4.62
-1.00 1.00
UpsetCurrent = -1
UpsetCurrent = 0
UpsetCurrent = 1
Weld Current vs Upset Pressure
2.76
4.62
-1.00 1.00
UpsetPressure = -1
UpsetPressure =0
UpsetPressure = 1
Weld Time vs Weld Current
2.76
4.62
-1.00 1.00
WeldCurrent = -1
WeldCurrent = 0
WeldCurrent = 1
Weld Time vs Upset Current
2.76
4.62
-1.00 1.00
UpsetCurrent = -1
UpsetCurrent = 0
UpsetCurrent = 1
Upset Current vs Weld Current
2.76
4.62
-1.00 1.00
WeldCurrent = -1
WeldCurrent = 0
WeldCurrent = 1
Upset Current vs Weld Time
2.76
4.62
-1.00 1.00
Weld Time =-1
Weld Time =0
Weld Time =1
Upset Pressure vs Weld Current
2.76
4.62
-1.00 1.00
WeldCurrent = -1
WeldCurrent = 0
WeldCurrent = 1
Upset Pressure vs Weld Time
2.76
4.62
-1.00 1.00
Weld Time =-1
Weld Time =0
Weld Time =1
Upset Pressure vs Upset Current
2.76
4.62
-1.00 1.00
UpsetCurrent = -1
UpsetCurrent = 0
UpsetCurrent = 1
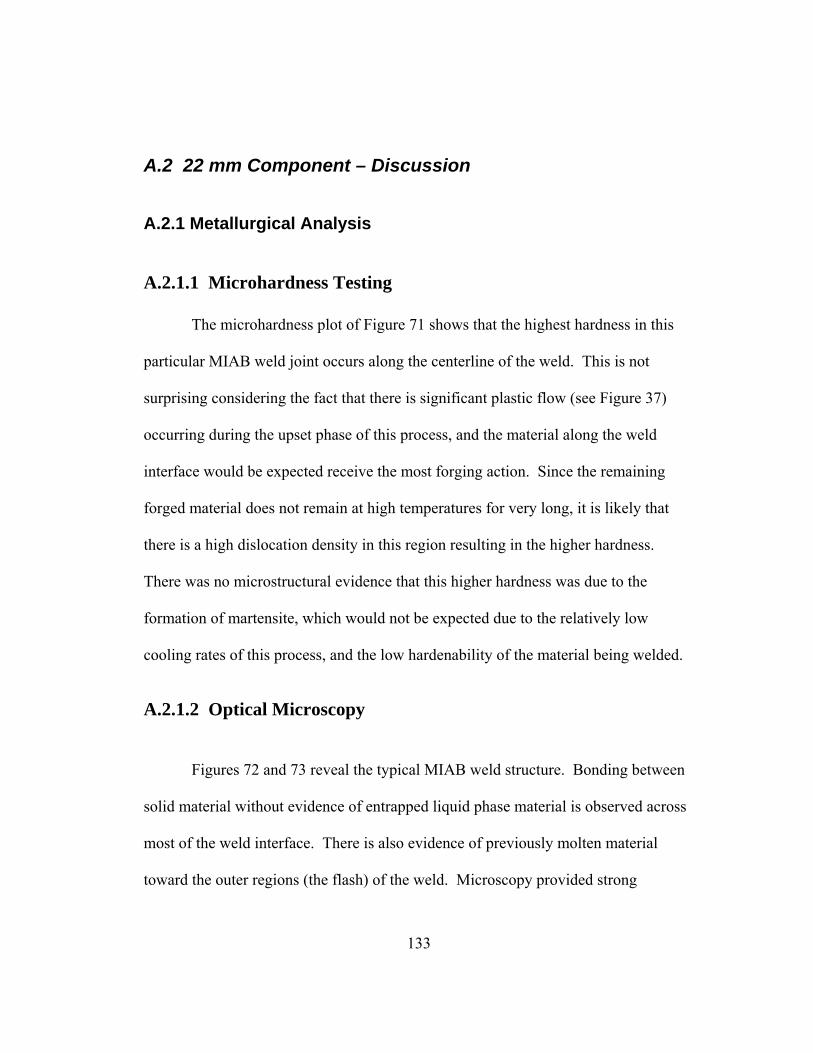
133
A.2 22 mm Component – Discussion
A.2.1 Metallurgical Analysis
A.2.1.1 Microhardness Testing The microhardness plot of Figure 71 shows that the highest hardness in this
particular MIAB weld joint occurs along the centerline of the weld. This is not
surprising considering the fact that there is significant plastic flow (see Figure 37)
occurring during the upset phase of this process, and the material along the weld
interface would be expected receive the most forging action. Since the remaining
forged material does not remain at high temperatures for very long, it is likely that
there is a high dislocation density in this region resulting in the higher hardness.
There was no microstructural evidence that this higher hardness was due to the
formation of martensite, which would not be expected due to the relatively low
cooling rates of this process, and the low hardenability of the material being welded.
A.2.1.2 Optical Microscopy
Figures 72 and 73 reveal the typical MIAB weld structure. Bonding between
solid material without evidence of entrapped liquid phase material is observed across
most of the weld interface. There is also evidence of previously molten material
toward the outer regions (the flash) of the weld. Microscopy provided strong

134
evidence of the requirement for proper upset pressures. As shown in Figures 74 and
75, without proper upset, the molten material is not squeezed sufficiently out of the
joint. This can result in voids and a weld interface which can no longer be considered
solid-state.
Since the MIAB weldments produced during this research did not utilize
shielding gas, any molten material remaining in the joint would likely be highly
oxidized. Such a joint would most likely suffer from a severe degradation in
mechanical properties. In summary, in a proper MIAB weld, optical microscopy
should reveal a solid-state weld interface free of voids with evidence that the molten
material was sufficiently squeezed out of the weld region into the flash.
A.2.2 Mechanical Analysis The combination of ID bend and tensile testing proved to be a viable method
for establishing MIAB weldment integrity. As discussed in the previous section, a
particular group of welds resulted in tensile failures through the weld interface
(Figure 78). These welds were produced with parameters that previously resulted in
excellent quality welds. More welds were then produced after the initial tensile
failures with similar results. Arc monitoring equipment was deployed which revealed
a serious controller malfunction, resulting in the delivery of insufficient current prior
to upset, also referred to as step III current. It was determined that there was an
electrical short in the controller that was later repaired and the problem resolved.

135
However, the malfunction did reveal the significance of the step III current.
The step III current is a short pulse of elevated current delivered just prior to upset.
The surge of current has the effect of rapidly increasing arc rotation speed and arc
pressure (discussed later) for the purpose of expelling oxidized molten material from
the weld zone prior to the forging action. This step effectively eliminates the need for
shielding gas, and is critical to the MIAB welding process when shielding gas is not
being used. With chromium-plated tubes, this step potentially takes on further
importance and complexity due to the requirement to remove chromium from the
joint. Further analysis of the step III current, and correlation of this step with weld
quality and the arc monitoring plots follows later in this section.
A.2.3 L16 DOE The initial L16 DOE was developed and conducted for the primary purposes
of establishing feasibility for producing tube-to-tenon weld joints with the MIAB
welding process, and to develop an understanding of the individual as well as
interactive parameter effects. As discussed previously, weld interface length (see
Figure 79) was chosen as the quantifiable measurement (response variable) for
assessing these effects. Figures 80 and 81 graphically represent the statistical results
from the DOE. The individual parameter effects on weld interface length of weld
current, weld time, current prior to upset, and upset pressure are shown in Figure 80.
Not surprisingly, higher weld currents, longer weld times, and higher upset pressures
all have a positive effect on weld interface length for the range of parameters chosen.

136
Higher weld currents and longer weld times produce more part heating, resulting in a
greater amount of molten and plasticized material. This in turn results in a greater
amount of material forged outward into the flash during the upset phase.
In addition, higher pressure creates greater forging forces and larger amounts
of upset material. The current prior to upset is applied for the purpose of creating the
cleaning action (rapid expulsion) of oxidized molten metal, and was shown to have
minimal effect on the weld interface length. However, as mentioned, the cleaning
action step is a critical part of the MIAB welding process when shielding gas is not
being used, and is discussed in more detail later in this section.
More interesting, and potentially more significant, is the information which
can be derived from the parameter interaction plots of Figure 81. These plots give an
indication of how the various parameters studied interact with each other. For
example, the plot of Weld Time vs. Weld Current discloses that the positive effect of
weld time on bond length is more pronounced when the weld current is lower. This
relationship reveals important aspects of the MIAB welding process, namely heat
flow and heat balance. Higher currents for a given time produce more intense heating
(P = VI) at the surfaces, and therefore, more melting. Figure 82 [22], while not a true
representation of the heating and melting processes occurring during the MIAB
welding process, does reveal the linear relationship between GMAW electrode

137
Figure 82 – Linear Relationship of Melt Rate vs. Current for GMAW Process [22]
melting rate and current, and provides some indication of the anticipated effect of
current on MIAB weld melt rate. It should be pointed out that the linear part of this
plot represents the arc heating effect of most importance to MIAB welding, while the
curved portion comes from the resistive heating effect due to electrode extension in
GMAW, not relevant for the MIAB discussion. In summary, higher currents at a
given time tend to produce more melting at the faying surfaces. Subsequent analysis
of the arc monitoring voltage plots showed that larger amounts of molten material
produce arc instability, and also result in molten material dropping out of the joint
due to the effects of gravity.
Lower currents and longer times tend to result in a thinner layer of molten
material at the tube and tenon ends, and more extensive heating into the parts. As
discussed previously in the Technical Review section, proper heat flow in the MIAB
Mel
ting
Rat
e

138
weld process provides for sufficient plasticizing (or yield strength reduction) of
material adjacent to the melt layer without producing excessive melting. Upon upset,
the plasticized material will form the solid-state region at the weld interface. This
effect explains the relationship of longer bond lengths with longer weld times being
more pronounced at lower relative currents, as indicated in the Weld Time vs. Weld
Current on the interactive L16 plot of Figure 81.
A.3 Arc Monitoring Voltage Plots
One plot is shown for each 12 of the conditions in the L12 DOE. Refer to
Table 3 for the details of each condition.
Figure 83 – L12 Condition #1
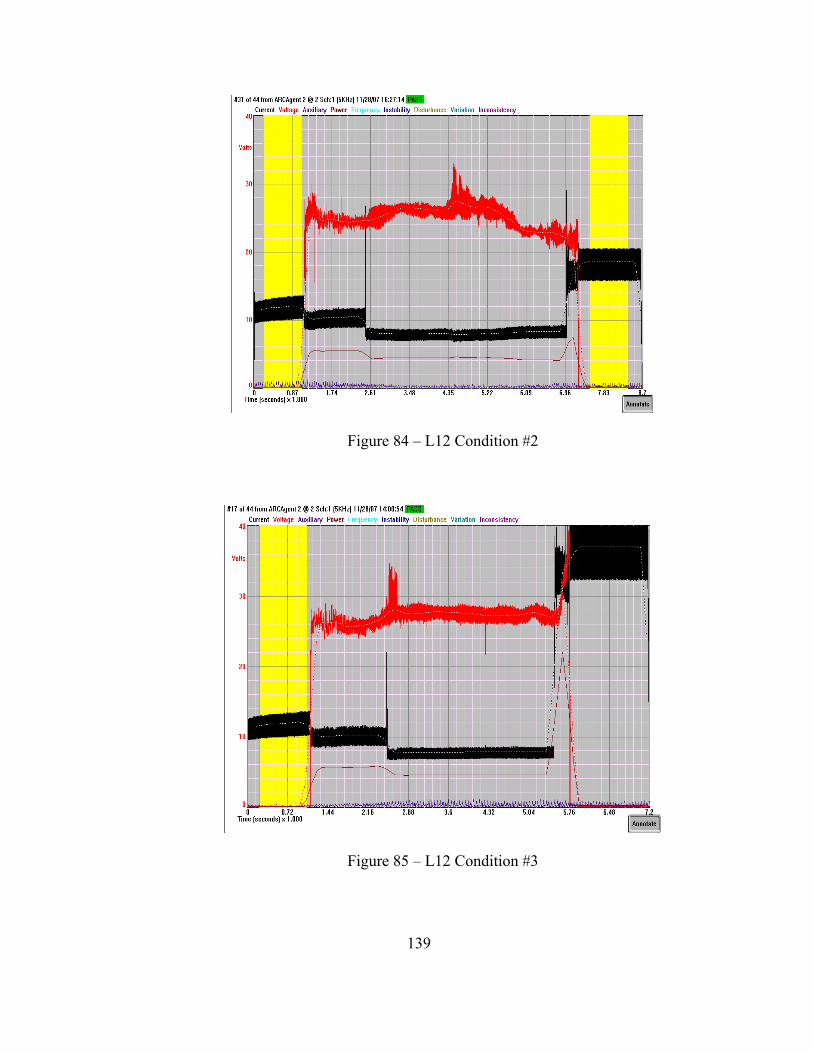
139
Figure 84 – L12 Condition #2
Figure 85 – L12 Condition #3

140
Figure 86 – L12 Condition #4
Figure 87 – L12 Condition #5
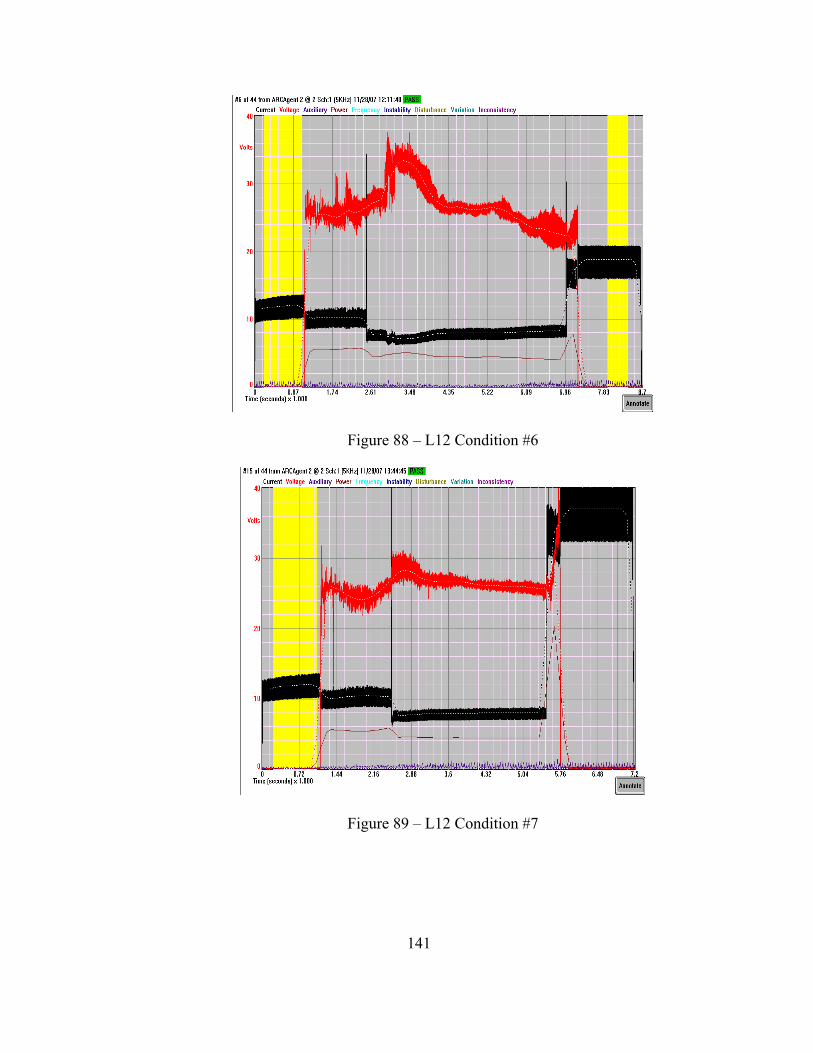
141
Figure 88 – L12 Condition #6
Figure 89 – L12 Condition #7

142
Figure 90 – L12 Condition #8
Figure 91 – L12 Condition #9

143
Figure 92 – L12 Condition #9
Figure 93 – L12 Condition #11

144
Figure 94 – L12 Condition #12
145
A.4 40 mm Chrome-Plated Component Preliminary Development Raw Data
Table 4 below represents a portion of the 40 mm chromium-plated component
preliminary development raw data. The preliminary development work identified the
technical challenges associated with MIAB welding chrome-plated components, and
provided future guidance regarding the effects of various MIAB weld variables. This
information was subsequently used to develop the L12 arc monitored DOE which was
the primary component of this research. In the raw data spreadsheet of Table 4, t3
represents arc heating (level II) time and Step 3 represents level III (current).
The gap measurement is shown under the mm column, but the technique used
to measure these gaps was slightly different than what was used during the L12
experiment, so the values cannot be compared directly. Under the tulip test column, a
NOK or nok means that the Tulip Test or ID bend test resulted in visible cracking and
ok means no cracking was observed. If the column is blank it means cracking was
observed. Also, t1 is a preset time on the controller, t2 is the arc initiation time, Step
1 is arc initiation current and Step 2 is arc heating current. Pressure is upset pressure
measured in bars.
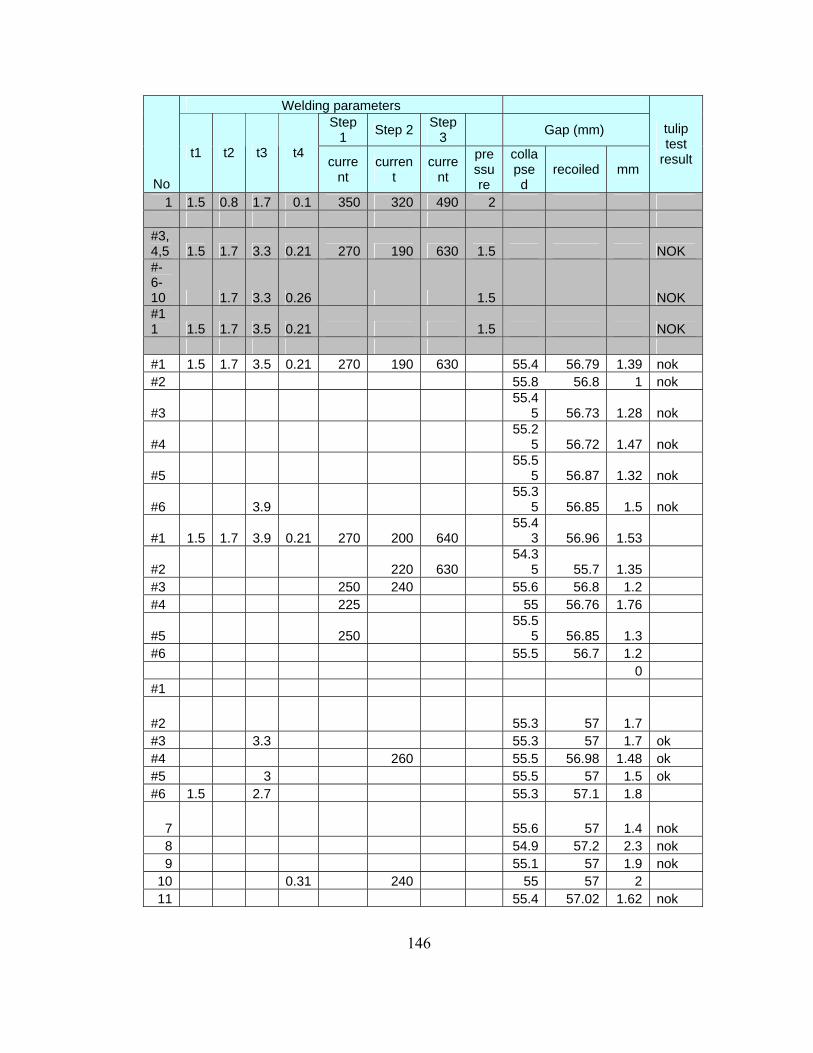
146
Welding parameters Step
1 Step 2 Step 3 Gap (mm)
No
t1 t2 t3 t4 curre
nt curren
t curre
nt
pressure
collapsed
recoiled mm
tulip test
result
1 1.5 0.8 1.7 0.1 350 320 490 2 #3,4,5 1.5 1.7 3.3 0.21 270 190 630 1.5 NOK #-6-10 1.7 3.3 0.26 1.5 NOK #11 1.5 1.7 3.5 0.21 1.5 NOK #1 1.5 1.7 3.5 0.21 270 190 630 55.4 56.79 1.39 nok #2 55.8 56.8 1 nok
#3 55.4
5 56.73 1.28 nok
#4 55.2
5 56.72 1.47 nok
#5 55.5
5 56.87 1.32 nok
#6 3.9 55.3
5 56.85 1.5 nok
#1 1.5 1.7 3.9 0.21 270 200 640 55.4
3 56.96 1.53
#2 220 630 54.3
5 55.7 1.35 #3 250 240 55.6 56.8 1.2 #4 225 55 56.76 1.76
#5 250 55.5
5 56.85 1.3 #6 55.5 56.7 1.2 0 #1
#2 55.3 57 1.7 #3 3.3 55.3 57 1.7 ok #4 260 55.5 56.98 1.48 ok #5 3 55.5 57 1.5 ok #6 1.5 2.7 55.3 57.1 1.8
7 55.6 57 1.4 nok 8 54.9 57.2 2.3 nok 9 55.1 57 1.9 nok
10 0.31 240 55 57 2 11 55.4 57.02 1.62 nok

147
12 54.9 57.1 2.2 nok 13 nok 14 3 260 400 55.3 57.02 1.72 nok
15 660 55.4
5 56.95 1.5 nok 16
#1 3.3 0.21 260 630 55.3
5 56.87 1.52 ok
#2 55.3
7 56.88 1.51 ok #3 55.2 56.88 1.68 ok
#4 3.2 55.4
3 56.93 1.5 ok
#5 3 55.4
6 56.93 1.47 nok #6 3.3 0 0
#1 1.5 1.7 3.3 0.21 250 247 630 55.5
6 56.96 1.4 nok
#2 55.5
8 57.03 1.45 ok
#3 250 55.4
3 56.88 1.45
#4 250 55.4
6 56.93 1.47
Welding parameters Step
1 Step 2 Step 3
No
t1 t2 t3 t4 curre
nt curren
t curre
nt
pressure
Start recoiled mm
tulip test
result
#5 1.5 1.7 3.3 0.21 250 240 630 #6 #7 #8 0.15 0
1 0.21 55.5
5 56.77 1.22 nok
2 55.5
3 56.69 1.16 ok
3 235 55.5
3 56.7 1.17 nok 4 55.5 56.66 1.16 nok
5 230 235 5803.3 bar
55.57 56.75 1.18
6 245 55.5
2 56.74 1.22 7 230 2.8 55.4 56.68 1.21

148
7
8 55.5
4 56.68 1.14
9 0
10 1.5 1.7 3.3 0.21 250 235 580 2.655.6
4 56.68 1.04
11 55.8
7 56.65 0.78 nok
12 3.5 250 215 55.7
1 56.63 0.92 ok
13 55.7
6 56.67 0.91
14 630 55.6
5 56.69 1.04 nok
15 650 55.6
6 56.55 0.89 nok
16 55.7
5 56.68 0.93 nok 17 2.8 0
18 55.6
6 56.63 0.97 nok 19 615 55.7 56.73 1.03 nok
20 3.3 0.21 260 630 2.655.5
2 56.75 1.23 ok 21 ok
22 2.5 300 55.8
2 56.78 0.96 ok
23 55.7
8 56.75 0.97 nok
24 4.1 233 55.7
7 56.71 0.94 ok
25 4.1 55.4
4 56.71 1.27 ok
26 55.5
1 56.73 1.22
27 55.4
4 56.65 1.21
1 3.3 0.21 260 630 355.7
5 56.76 1.01 ok
2 3.355.7
7 56.7 0.93 ok
3 3.355.7
4 56.72 0.98 ok
4 3.655.7
3 56.74 1.01 ok
5 355.8
1 56.88 1.07 6 3 55.8 56.67 0.82

149
5
7 250 3.355.9
1 56.6 0.69 nok
8 55.7
9 56.75 0.96 nok
9 750 55.7
9 56.84 1.05 ok
10 750 55.7
2 56.77 1.05 nok
11 0.18 250 825 55.8
3 56.91 1.08 ok
12 55.7
7 56.72 1.08 ok
13 240 55.9
1 56.92 0.81 ok
14 55.7
3 56.69 0.96 ok
15 230 55.8
4 55.9 0.06 ok
16 55.7
8 56.73 0.95 ok 1 1.5 1.5 3.3 0.18 350 320 825 0 ok 2 1.5 1.5 3.3 0.18 350 320 825 0 nok
1 1.5 1.7 3 0.12 250 260 900 1.855.5
5 56.25 0.7 nok
2 1.5 1.7 1.7 0.12 250 320 900 55.3
6 56.3 0.94
3 1.5 1.7 1.7 0.12 250 320 900 1.855.3
6 56.33 0.97
4 1.5 1.7 1.5 0.12 250 375 900 1.855.3
5 56.23 0.88
5 1.5 1.7 3.5 0.12 250 220 900 1.855.3
2 56.25 0.93
6 250 225 700 55.7
2 56.46 0.74 ok 7 2.5 275 55.9 56.65 0.75
Table 4 – Portion of the 40 mm Preliminary Development Raw Data
Copyright © 2022 FDOKUMEN