A study of the physics of pellet injection in magnetically ...
168
7(6,6 '2&725$/ $ VWXG\ RI WKH SK\VLFV RI SHOOHW LQMHFWLRQ LQ PDJQHWLFDOO\ FRQILQHG SODVPDV LQ VWHOODUDWRUV $XWRUD 1HUHD 3DQDGHUR ÈOYDUH] 'LUHFWRU 'U .LHUDQ -RVHSK 0F&DUWK\ 7XWRU -RVp 5DPyQ 0DUWtQ 6ROtV 352*5$0$ '( '2&725$'2 (1 3/$60$6 < )86,Ï1 18&/($5 /HJDQpV DEULO
-
Upload
khangminh22 -
Category
Documents
-
view
2 -
download
0
Transcript of A study of the physics of pellet injection in magnetically ...


(a entregar en la Oficina de Postgrado, una vez nombrado el Tribunal evaluador, para preparar el documento para la defensa de tesis)


A mi familia y amigos.
“Puede ser que sin vosotros duela más”
“«De aquí solo se sale con los pies por delante Y con humareda en la frente». Así pues, goza a cada instante y nos veremos en el infierno. Y que no sea lo que escribes sepulturero de tu ánimo, Sino la comadrona que te ayude a dar a luz a ti mismo.
Que causes dolor en todo el que te lea. Que se vean reflejados en el lago todos los hijos de puta.”
Mi particular carrera, Canción de Bruma (Santi Balmes, 2017)


_________________________________________________________________________________
Contents
i
CONTENTS Contents .............................................................................................................................. i
Abstract .............................................................................................................................. i
Acknowledgments ........................................................................................................... iii
1. Introduction ................................................................................................................ 1
1.1. Introduction to fusion as a power source ............................................................ 1
1.1.1 Fusion Energy ................................................................................................... 3
1.1.2 Magnetic-confinement devices ......................................................................... 6
1.1.3 Issues on the path to steady-state operation ...................................................... 7
1.2. Key concepts of plasma physics and nuclear fusion .......................................... 8
1.2.1. Description of plasma ..................................................................................... 10
1.2.2. Motion of a charge particle in the presence of magnetic and electric fields .. 10
1.2.3. The rotational transform and other key concepts ........................................... 12
1.2.4. Three-dimensional configurations .................................................................. 15
1.3. Description of the goals of the thesis ................................................................ 15
2. Review of pellet injection experiments and modelling ............................................ 17
2.1. Fuelling needs and the particular case of stellarators ....................................... 17
2.2. Review of pellet injection experiments and relevant developments ................ 18
2.3. Review of ablation models ............................................................................... 20
2.3.1. Neutral Gas Shielding Models ........................................................................ 21
2.3.2. Neutral Gas and Plasma Shielding Models .................................................... 23
2.3.3. Comparison with experimental results ........................................................... 26
2.4. Review of homogenization models .................................................................. 26
2.4.1. Comparison with experimental results ........................................................... 31
2.4.2. Additional points for non-axisymmetric devices ............................................ 32
2.5. Present status .................................................................................................... 34
3. Description of experimental systems ....................................................................... 37
3.1. The TJ-II Stellarator ......................................................................................... 37
3.2. TJ-II Pellet Injector and associated diagnostics ............................................... 39
3.2.1. Pellet injector and in-line diagnostics ............................................................. 39
3.2.2. Detection of light from pellet ablation ............................................................ 44
3.2.3. Pellet ablation fast imaging system ................................................................ 46
3.3. The Wendelstein 7-X Stellarator ...................................................................... 46
3.4. Pellet Injection Plans for the Wendelstein 7-X Stellarator ............................... 49
3.5. Plasma diagnostics ............................................................................................ 50
3.5.1. Plasma diagnostics relevant for pellet studies ................................................ 50
3.5.2. Other plasma diagnostics ................................................................................ 52
4. Pellet injection studies in the stellarator TJ-II ......................................................... 55
4.1. Analysis of photodiode signals ......................................................................... 55
4.2. Analysis of fast camera images ........................................................................ 58
4.3. Representative pellet discharges in TJ-II: plasma response ............................. 60
4.4. Ablation studies ................................................................................................ 61
4.4.1. Ablation in ECRH plasmas ............................................................................. 62
4.4.2. Ablation in NBI-heated plasmas ..................................................................... 63
4.4.3. Striations ......................................................................................................... 65
4.4.4. Pellet penetration and lifetime dependence on plasma and pellet parameters 66
4.4.5. Influence of plasma heating method on pellet ablation .................................. 68
4.4.6. Influence of suprathermal particles on ablation .............................................. 69
4.5. Pellet dynamics studies ..................................................................................... 70
4.5.1. Radial acceleration of the pellet ..................................................................... 70
4.5.2. Toroidal and poloidal pellet deflections ......................................................... 72
4.6. Plasmoid drift measurements ............................................................................ 76
4.6.1. Plasmoid radial drift ....................................................................................... 76
4.6.2. Plasmoid poloidal drift ................................................................................... 80
4.7. Fuelling efficiency studies ................................................................................ 82
4.7.1. Relation between plasmoid drift and fuelling efficiency ................................ 85
5. Pellet injection simulations in stellarators ............................................................... 87
5.1. A Neutral-Gas-Shielding-based code to simulate pellet ablation in TJ-II ........ 87
5.1.1. Predicted ablation profiles for TJ-II pellets and comparisons: ....................... 89
5.1.2. Discussion of model limitations ..................................................................... 98
5.2. Ablation and deposition simulations: the HPI2 code ....................................... 98
5.2.1. Simulation of pellet injection in TJ-II .......................................................... 104
5.2.2. Simulation of pellet injection in W7-X ........................................................ 113
5.3. Discussion of limitations of models used in HPI2 ......................................... 125
6. Conclusions and future work ................................................................................. 127
6.1. Summary of conclusions from experimental work in TJ-II ........................... 127
6.2. Summary of conclusions from pellet simulations .......................................... 129
6.3. Future Work .................................................................................................... 131
Publications and contributions to conferences .............................................................. 135
_________________________________________________________________________________
Contents
iii
References ..................................................................................................................... 139

_________________________________________________________________________________
Abstract
i
ABSTRACT Plasma core fuelling is a key issue for the development of steady-state scenarios in large
magnetically-confined fusion devices. This is of particular importance for helical-type machines, due to hollow density profiles predicted by neoclassical theory for on-axis microwave-heated plasmas. At present, cryogenic pellet injection is the most promising technique for efficient fuelling. However, further experimental and theoretical studies are necessary to fully understand all the mechanisms involved in pellet ablation and in the subsequent particle deposition, since a complete understanding of experimental results from non-axisymmetric devices remains outstanding.
In this work, pellet ablation and fuelling efficiency experiments, using a pipe-gun type cryogenic pellet injector, are carried out in electron cyclotron resonance (ECRH) and neutral beam injection (NBI) heated hydrogen plasmas of the stellarator TJ-II. Here, all injections are made from the outer plasma side (inner plasma side injections are not possible for technical reasons). Ablation profiles are reconstructed from light emitted by the cloud that surrounds an ablating solid hydrogen pellet and collected by silicon photodiodes and a fast-frame camera system, under the assumptions that such emissions are loosely related to the ablation rate and that pellet radial acceleration in the plasma is negligible. Light emissions are also used to study the pellet penetration dependence on pellet and plasma parameters, such as pellet velocity, pellet mass, and plasma density for pellet injections from the outer plasma side of TJ-II. Pellet penetration in TJ-II, as in other magnetically confined plasma devices, increases with increasing pellet mass and velocity as well as for high plasma density and low temperature. However, if suprathermal electrons are present in the plasma core, they can limit pellet penetration due a sudden excess of ablation. In addition, pellet dynamics inside the plasma are analysed employing fast-camera images. Pellet radial acceleration is found to be zero or negligible. In addition, it is found that pellet injected into unbalance NBI-heated plasmas are deflected toroidally and poloidally.
Furthermore, the drift direction and magnitude of the ionized fraction of the cloud, or plasmoid, is investigated using this fast-camera system. Plasmoids drifting, at between 0.5 and 20 km/s, towards the outer and lower plasma edge are observed. However, when pellets penetrate beyond the magnetic axis, plasmoids seem to drift towards the plasma centre. A dependence between plasmoid drift and plasmoid detachment position, related to rational surfaces, is observed. Also, pellet particle deposition profiles and fuelling efficiency are determined using pre- and post-injection density profiles provided by a Thomson Scattering (TS) system. Moreover, the influence of plasma heating methods on pellet ablation and material deposition is considered. Efficiency is found to depend significantly on pellet penetration depth. This is especially noted for NBI plasmas, since pellets penetrate beyond the plasma axis.
In order to attain a deeper understanding of pellet injection physics in the TJ-II, experimental results are compared with theoretical predictions. In first instance, a neutral gas shielding-based code is adapted for TJ-II to compare experimental ablation rates for pellets injected into both ECRH and NBI-heated plasmas with simulated rates. Although penetration depths are well predicted by this model, ablation profiles only agree with experimental results for injections into ECRH plasmas. In addition, the Hydrogen Pellet Injection (HPI2) code, in its stellarator version, is used to simulate pellet injections into ECRH plasmas in TJ-II. With this code, using TS electron density and temperature profiles as input, ablation and material
__________________________________________________________________________________
A study of the physics of pellet injection in magnetically confined plasma in stellarators
ii
deposition predictions are compared with experimental measurements. Good agreement between experiment and simulations for pellet injections in TJ-II (ECRH) is obtained, except when suprathermal electrons are present in the plasma core. This agreement gives confidence in codes for stellarators, allowing predictions to be made with some sureness for the large W7-X device.
The HPI2 code is then used to predict ablation and deposition profiles for pellets injected into relevant ECRH plasma scenarios in the stellarator W7-X, in particular corresponding to the second part of its initial operational phase, OP 1.2. Furthermore, comparisons with preliminary experimental results from OP 1.2 are presented. Predicted density profiles cannot reproduced experimental results, this being mainly attributed to the presence of suprathermal electrons. Finally, the HPI2 code is also used to simulate ablation and deposition profiles for pellets of different sizes and velocities injected into future relevant W7-X plasma scenarios, while estimating the plasmoid drift and the fuelling efficiency of injections made from two W7-X ports. These simulations allow identifying an advantageous port for efficient pellet injections into W7-X.
The thesis presented here is divided into five chapters; of these, experimental and simulated results reported in Chapters 4 and 5 partially coincide with the main published contributions derived from this work [1–4].

_________________________________________________________________________________
Acknowledgments
iii
ACKNOWLEDGMENTS Esta tesis condensa en poco más de cien páginas el trabajo de cuatro años. Han sido muchas
las personas que durante este tiempo me han ayudado, directa o indirectamente. Sin olvidar a todos los que antes contribuyeron a que llegara a dar los primeros pasos en investigación. Por eso, sin duda, encontrar las palabras adecuadas para expresar lo agradecida que estoy es una de las partes más complicadas de este trabajo.
Quiero empezar agradeciéndole a mi director de tesis, Kieran McCarthy, toda la atención, el esfuerzo y la ayuda que me ha prestado a lo largo de estos cuatro años. Supongo que no hay palabras suficientes para agradecer el que siempre hayas creído en mí y hayas apoyado mi trabajo.
Además del papel clave del director de tesis, son muchos los compañeros del Ciemat que en algún momento me han ayudado. Me gustaría agradeceros a todos vuestro tiempo y apoyo durante estos últimos cuatro años. En especial, gracias a José Luis Velasco, Eduardo de la Cal, Antonio López Fraguas, José María Fontdecaba, Julio Hernández Sánchez, Paco Castejón y a todo el grupo de TJ-II por las discusiones, comentarios y ayuda.
I cannot forget those from outside Ciemat that have played an important role in the development of this thesis. I would like to thank Naoki Tamura for giving me the chance of participating in TESPEL experiments in TJ-II. Also, I would like to thank all the W7-X team for the opportunity of collaborating with them. The time I spent in Greifswald was invaluable for my scientific career and, also, a priceless personal experience. Particularly, I would like to thank Jürgen Baldzuhn and Hannes Damm. Special thanks to my office colleges and all the people that made me want to come back to Greifswald, despite all my complaints.
Volviendo a España, y antes de pasar a la parte más personal de los agradecimientos, no puedo olvidar que sin muchos de los profesores que alguna vez me dieron clase, desde el colegio a la universidad, quizá ni siquiera hubiera estudiado física. Así que este es mi pequeño y humilde homenaje a todos ellos y a la educación pública, porque sin ella nada es posible. La inversión en educación e investigación debe ser la base de la sociedad y no puedo dejar pasar la oportunidad de incluirlo aquí. “Alerta, hay un testigo. Nos han dejado vivos. Fue un atraco perfecto, excepto por esto: nos queda garganta, puño y pies” (Vetusta Morla, Golpe Maestro, La Deriva, 2014).
Supongo que ya no me queda más remedio que pasar a esa parte de los agradecimientos que no hago más que evitar, Sonará absurdo (y puede que lo sea), pero hay tanto que quiero decir que ni sé cómo empezar. Como he repetido hasta la saciedad canciones de este disco mientras escribía la tesis, no se me ocurre mejor forma que diciendo que “por eso estoy aquí otra vez, rebuscando en mi almacén esa palabra, cónsul de mi timidez. Ojalá encuentre la forma, más me vale, tengo un tema que acabar” (Love of Lesbian, El Poeta Halley, El Peta Halley, 2016). No es un tema, son unos agradecimientos, pero los tengo que acabar. Y sí, tengo que dar las gracias a los grupos que me han motivado a seguir escribiendo cuando no podía más (Love of Lesbian, Vetusta Morla: he rayado vuestros discos estos últimos meses; culpa de la tesis). Como tengo que dar las gracias a Mininots; qué hubiera hecho estos meses en casa sin esas patitas peludas…
__________________________________________________________________________________
A study of the physics of pellet injection in magnetically confined plasma in stellarators
iv
Los primeros que se merecen estar aquí son mis padres, mi hermano y el resto de mi familia, porque sin ellos seguro que no estaría aquí. Papá, mamá, por supuesto que podéis sentiros orgullosos de todo lo que consigo, porque jamás lo hubiera hecho si no me hubierais enseñado a esforzarme y a luchar siempre por lo que quiero y me hace feliz. Gracias a vosotros adoro leer y aprender cosas nuevas; sin esas dos cosas jamás me hubiera planteado hacer de la ciencia mi profesión.
Después de mi familia, le toca a la otra familia; esa que se elige, con la que no se comparten lazos de sangre, pero sí todo lo demás que es importante. La verdad, con todo lo que me habéis aguantado y ayudado, os merecéis mucho más que unas cuantas frases. Ana, Bea, Cleis (juro que le orden alfabético no es a propósito), Paula, María, Elena, Maxi, Mony, Adri, Vicent: no sé qué hubiera hecho sin vosotros, las conversaciones absurdas de WhatsApp, los conciertos, las cenas y todas las noches en las que hemos desconectado de todo con unos gin-tonics. Mis compis de la carrera: no nos hemos visto mucho (culpa de las tesis y los trabajos), pero siempre me acuerdo de vosotros. También a Alex y a Aser: apenas nos hemos visto desde que acabamos el máster, pero siempre nos queda internet. María, Paula, Cleis: a vosotras gracias en especial; muchas gracias. Han sido unos meses muy largos para todas, de quejas y lamentos compartidos, pero siempre habéis estado para animar y para aconsejar. Quién sabe qué pasará cuando acabemos todas las tesis, pero siempre, siempre seréis unas amigas maravillosas. Ani: nada de lo que pueda escribir va a ser suficiente para agradecerte que siempre hayas estado ahí, para absolutamente todo, desde una duda absurda por WhatsApp hasta los “por favor, necesito una copa”. Eres la mejor amiga que se puede tener. Igual lo de que nos pregunten tan a menudo si somos primas o hermanas es porque, aunque (que sepamos) no tenemos ningún parentesco, es como si lo fueras. Bea: por muy lejos que vivas, siempre estás cuando hace falta; las gracias por papel y en la distancia se me quedan muy cortas. ¡Ojalá pudieras celebrar con nosotros cuando por fin acabe esto y darte las gracias como te mereces! Elena: tú también eres como una hermana; gracias por el apoyo, tu optimismo y animarme siempre a ver el lado bueno de todo. Dear Alena: thanks for all your support, our tea parties (banana-hair dryer!) and all the time we spent in Greifswald (and in Madrid)!
Os dejo para el final, pero ni mucho menos sois los últimos en importancia. El edificio 20 será lo más parecido a un viaje al pasado que pueda existir y, a veces, puede que dé hasta miedo, pero en cuatro años ha llegado a ser como otra casa. Gracias a todos los que habéis pasado por él durante este tiempo (Fran, Adri, Sadig, Fontde, Luis, Alfonso y muchos más) por haber hecho del trabajo un placer. Muchísimas gracias a Alfonso por haber sido el mejor compañero de despacho que se puede tener y por estar siempre dispuesto a ayudar en lo que sea. Millones de gracias a Jose y a Álvaro. No sé qué hubiera sido de mí sin vosotros estos últimos meses. Supongo que más que daros las gracias, debería pediros perdón por haber pasado más tiempo en vuestro despacho que en el mío. Parte de esta tesis es más vuestra que mía.
Para acabar, no se me ocurre mejor forma que con una canción que habla del fin de una etapa, de despedidas y de esperar a lo nuevo: “Fin de la temporada, adiós, queridos. Guardaos bien que viene el frío. Ya nos veremos por allá” (Vetusta Morla, Puntos Suspensivos, Puntos Suspensivos/Profetas de la Mañana, 2015).
_________________________________________________________________________________
Introduction
1
1. INTRODUCTION
1.1. INTRODUCTION TO FUSION AS A POWER SOURCE Human development has been coupled with energy consumption since the origin of the
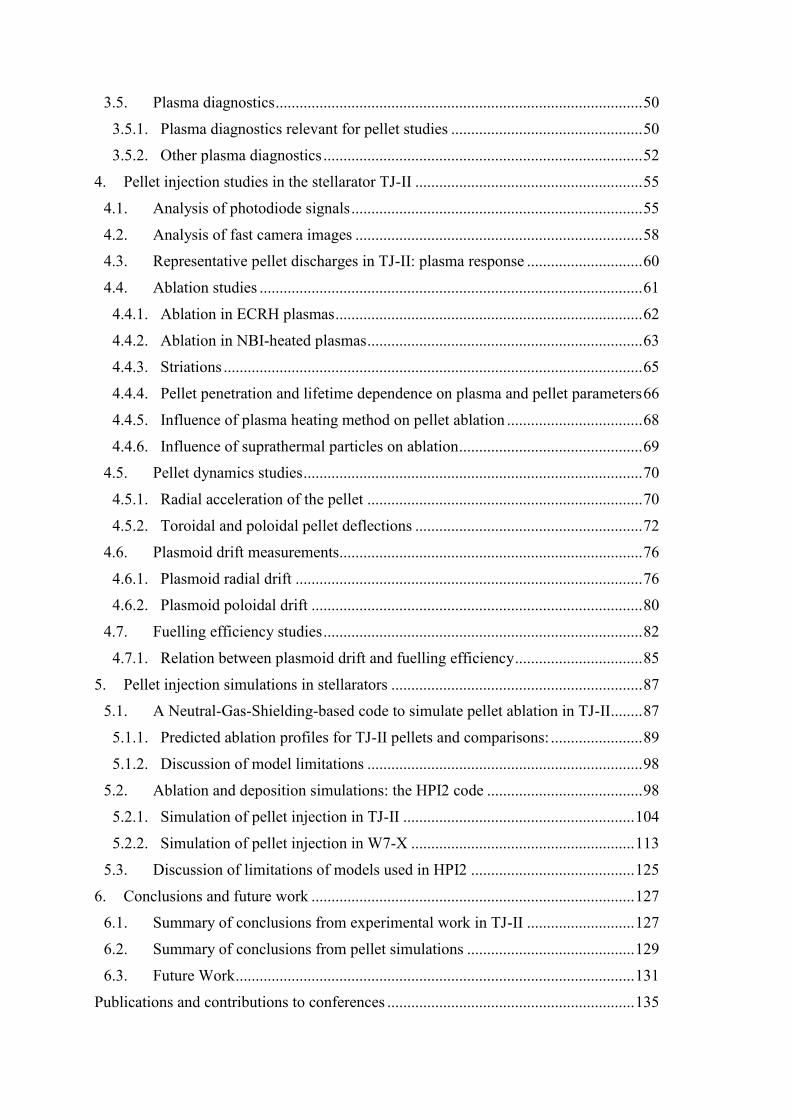
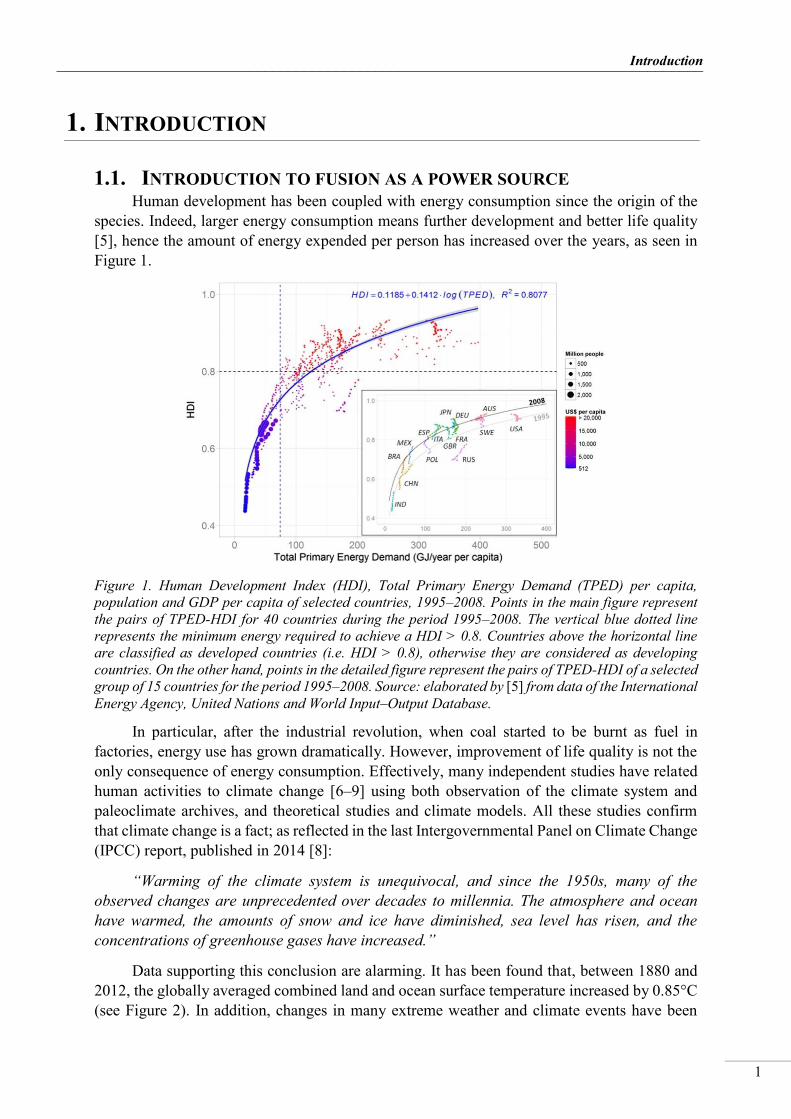
species. Indeed, larger energy consumption means further development and better life quality [5], hence the amount of energy expended per person has increased over the years, as seen in Figure 1.
Figure 1. Human Development Index (HDI), Total Primary Energy Demand (TPED) per capita, population and GDP per capita of selected countries, 1995–2008. Points in the main figure represent the pairs of TPED-HDI for 40 countries during the period 1995–2008. The vertical blue dotted line represents the minimum energy required to achieve a HDI > 0.8. Countries above the horizontal line are classified as developed countries (i.e. HDI > 0.8), otherwise they are considered as developing countries. On the other hand, points in the detailed figure represent the pairs of TPED-HDI of a selected group of 15 countries for the period 1995–2008. Source: elaborated by [5] from data of the International Energy Agency, United Nations and World Input–Output Database.
In particular, after the industrial revolution, when coal started to be burnt as fuel in factories, energy use has grown dramatically. However, improvement of life quality is not the only consequence of energy consumption. Effectively, many independent studies have related human activities to climate change [6–9] using both observation of the climate system and paleoclimate archives, and theoretical studies and climate models. All these studies confirm that climate change is a fact; as reflected in the last Intergovernmental Panel on Climate Change (IPCC) report, published in 2014 [8]:
“Warming of the climate system is unequivocal, and since the 1950s, many of the observed changes are unprecedented over decades to millennia. The atmosphere and ocean have warmed, the amounts of snow and ice have diminished, sea level has risen, and the concentrations of greenhouse gases have increased.”
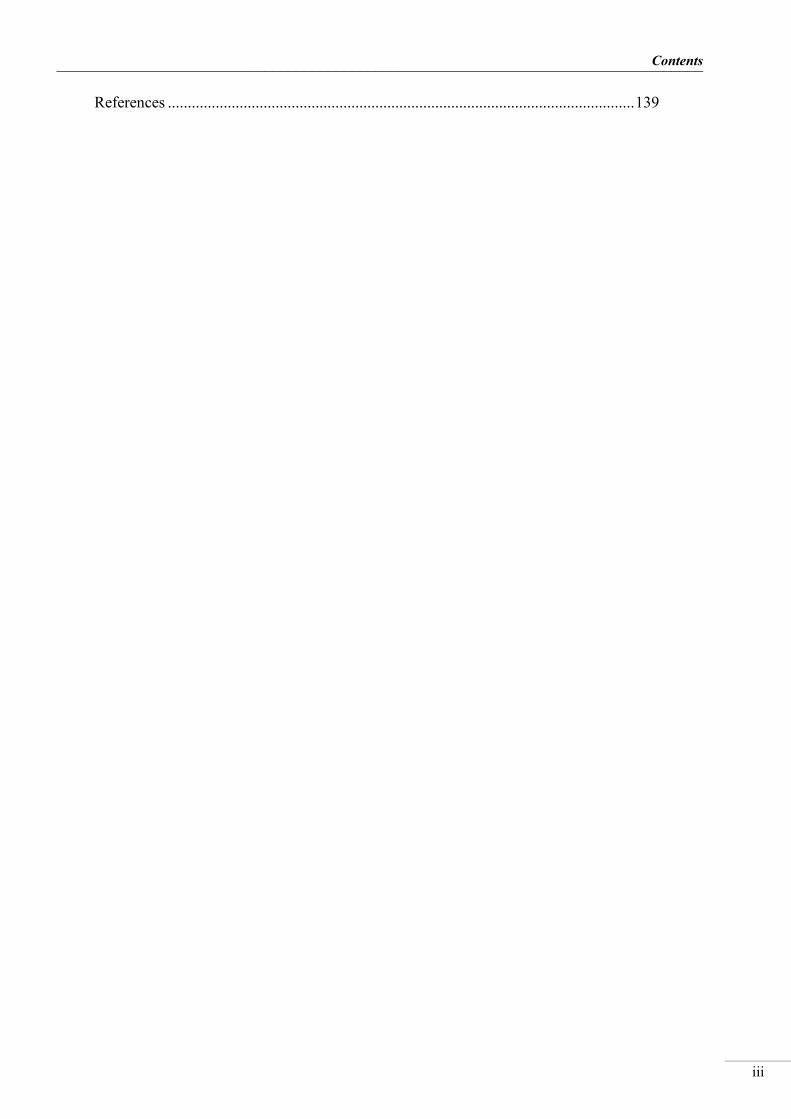
Data supporting this conclusion are alarming. It has been found that, between 1880 and 2012, the globally averaged combined land and ocean surface temperature increased by 0.85°C (see Figure 2). In addition, changes in many extreme weather and climate events have been

__________________________________________________________________________________
A study of the physics of pellet injection in magnetically confined plasma in stellarators
2
observed since the 1950s. Moreover, ice sheets are losing mass, glaciers are shrinking and the rate of sea level rise since the mid-19th century has been larger than the mean rate during the previous two millennia. During this period, the atmospheric concentrations of carbon dioxide, CO2, methane, CH4, and nitrous oxide, NO, have increased to levels unprecedented in, at least, the last 800.000 years; specifically, the pre-industrial levels have increased about 40 %, 150 % and 20 %, respectively. An additional consequence of the increment of CO2 in the atmosphere is ocean acidification, since oceans have absorbed about 30 % of the emitted anthropogenic CO2. Even if the energy rate consumption decreases, effects on climate, ocean level and biodiversity are expected to be drastic. Not only that, the cost, both social and economic, of the political, or even military, conflicts related to fossil fuels reservoirs is unbearably high. In addition, fossil fuels are limited; estimations from 2009 predict that oil, coal and gas will be only available for 35, 107 and 37 years, respectively [10], although uncertainties are large [11].
Figure 2. Observed trend for a) annually and globally averaged combined land and ocean surface temperature over the period 1986 to 2005; b) annually and globally averaged sea level change relative to the average over the period 1986 to 2005, c) atmospheric concentrations of the greenhouse gases carbon dioxide (CO2, green), methane (CH4, orange) and nitrous oxide (N2O, red) determined from ice core data (dots) and from direct atmospheric measurements (lines); and d) global anthropogenic CO2 emissions from forestry and other land use, as well as from burning of fossil fuel, cement production and flaring. Cumulative emissions of CO2 from these sources and their uncertainties are shown as bars and whiskers, respectively, on the right-hand side. Note: quantitative information of CH4 and N2O emission time series from 1850 to 1970 is limited [8]
Hence, real and sustainable alternatives to fossil fuels are mandatory, i.e., it is necessary to change the energy production system. Renewable energies have proved themselves to be, at least, a complement to the energy production. However, storage capability problems and

_________________________________________________________________________________
Introduction
3
production intermittence prevent from increasing the percentage of renewable energy in the grid [12, 13]. In addition to renewable energies, nuclear fission is a strong candidate to substitute fossil fuels due to its high energy density and low price comparing to renewable energies. However, fission energy is the least accepted energy among society due to safety and radioactive waste issues. Indeed, fission plants accidents, like Chernobyl or Fukushima, have a high cost both in human lives and economical. In addition, nuclear waste remains highly active for very long periods and requires long term storage, with the consequent impact on human health and environment.
Fission is not the only nuclear process that allows energy production. Nuclear fusion, the energy source of stars, is an intrinsically safe process of energy production with high energy density. Moreover, it is a relatively clean energy source with no greenhouse-gas emission and reduced radioactive waste. However, some technological and physical problems are still unresolved. Hence, fusion energy is a key research topic in the path to a clean and sustainable energy that does not damage the Environment or health and that, at the same time, is economically feasible.
1.1.1 Fusion Energy Fusion is the nuclear reaction that takes place in the core of stars. Well-known
mechanisms underlie the fact that net energy is released in fusion reactions. The first one is related to the fact that the binding energy varies with the mass number of the nuclei (see Figure 3). Hence, when two light nuclei fuse together, the mass of the new nucleus, Mmeasured, is lower than the sum of the two individual masses, Mexpected; the difference is the mass defect, ΔM, and corresponds, taking into account the second mentioned physical mechanism, to the binding energy, Ebinding (in J), since, from Einstein energy equation, it is known that mass and energy are equivalent. Mathematically, it is expressed as:
𝑀𝑒𝑥𝑝𝑒𝑐𝑡𝑒𝑑(𝐴, 𝑍) = 𝑍 · 𝑚𝑝 + (𝐴 − 𝑍) · 𝑚𝑛 > 𝑀𝑚𝑒𝑎𝑠𝑢𝑟𝑒𝑑(𝐴, 𝑍) (1-1)
Δ𝑀(𝐴, 𝑍) = 𝑀𝑚𝑒𝑎𝑠𝑢𝑟𝑒𝑑(𝐴, 𝑍) − 𝑍 · 𝑚𝑝 − (𝐴 − 𝑍) · 𝑚𝑛 > 0 (1-2)
𝐸𝑏𝑖𝑛𝑑𝑖𝑛𝑔 = Δ𝑀(𝐴, 𝑍) · 𝑐2 (1-3)
In these relations, Z is the atomic number and A the mass number. In addition, mp and mn are the proton and neutron masses (in kg), respectively, and c is the speed of light (in m/s). Then, two light nuclei fused to form a heavier nucleus release an amount of energy, in form of kinetic energy of the product nuclei, that is equivalent to the binding energy and that can be used to produce electric energy.


_________________________________________________________________________________
Introduction
5
Figure 4. Fusion cross-sections of various possible fusion reactions as a function of the kinetic energy of the reagents. It should be noted that the curve for D-D represents a sum over the cross-sections of the different reaction branches [15].
It is the most suitable because it has the highest cross-section at the lowest temperature; hence, it is the easiest to achieve. In addition, deuterium is a very abundant element; it is found in sea water as heavy water in 30 g/m3 proportion. On the other hand, tritium is not naturally found on Earth since its half-life is only 12.32 years. However, it can be produced from lithium, Li, which is a very abundant element that is found all over the planet. The reaction of tritium production from lithium has two possible branches:
𝑛 + 𝐿𝑖6 → 𝑇 + 𝐻𝑒4
𝑛 + 𝐿𝑖7 → 𝑇 + 𝐻𝑒4 + 𝑛∗ (1-8)
Thus, the general idea is that a lithium blanket covers the inner wall of the reactor with the purpose of generating tritium by colliding neutrons; this will mean that the unwanted product of the fusion reactor will be used to generate the fuel. In addition, the blanket has a second important purpose, that is preventing the neutrons escaping from the vacuum chamber and protecting radiation sensitive outer components, such as the superconducting coils. Furthermore, it is also expected that, since the collisions between the blanket and fusion neutrons will heat the blanket, this may be a way to extract the produced energy so it can it be transformed into electric energy (see Figure 5).
Figure 5 Artistic impression of a fusion power plant (Courtesy: EFDA) [16]
__________________________________________________________________________________
A study of the physics of pellet injection in magnetically confined plasma in stellarators
6
Atoms, deuterium and tritium in this case, at temperatures that fulfil the requirements of the Triple Product criterion are ionized, i.e., they are in plasma state. Plasma, the fourth state of matter and the most abundant in the Universe, has some characteristics that differentiate it from the gas state, such as collective behaviour and electrical conductivity. Strong gravitational forces in the innermost part of stars enable nuclei to overcome the repulsive electrostatic forces. Since such strong gravitational forces are absent on Earth, an alternative needs to be found. Moreover, a way to confine a material at millions of Kelvin needs to be uncovered. At present, there are two main research lines, inertial [14] and magnetic-confined fusion. In the case of this thesis, magnetic-confined fusion, which takes advantage of the particular properties of plasma to confine it, is the concept under consideration. In effect, the fact that charge particles describe a helical trajectory along magnetic field lines can be used to trap plasma electrons and ions if an appropriate magnetic field geometry is chosen. This magnetic field geometry is the result of a toroidal field, and a poloidal field added to compensate the ExB drift that displaces plasma particles in the major-radius direction of the torus. Hence, the resultant helical field, which must have nested magnetic surfaces, is able to confine the plasma and isolate it from the wall of the vessel.
Since fusion has proved to be feasible in magnetic confinement devices, even though there are some pending issues, it is expected that future fusion power plants will be based on the magnetic confinement approach.
1.1.2 Magnetic-confinement devices Magnetic confinement devices can be divided into two different lines of research. The
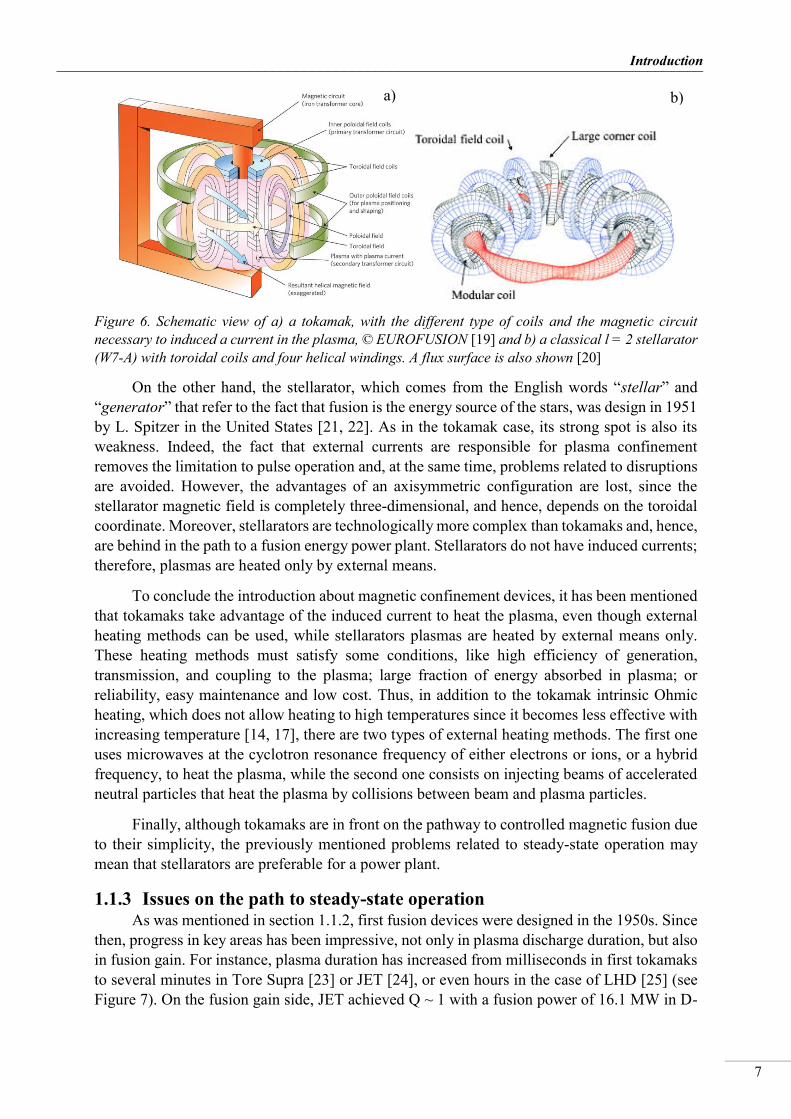
main difference is how the poloidal component of the magnetic field is created. The simplest way to create a poloidal magnetic field in a torus is to induce a toroidal current in the plasma that generates a poloidal magnetic field. In contrast, the second approach, technically more complex, uses external coils with the appropriate shape to create the helical magnetic field, hence no induced current is necessary to confine the plasma. Devices that confine plasma by the former method are called “tokamaks” [14, 17], while those whose use the latter are called “stellarators” [14, 17, 18]. Each type has advantages and disadvantages, which are related to the poloidal field generation (see Figure 6).
The tokamak, whose name comes from the Russian acronym токамак and means “toroidal chamber with magnetic coils”, was invented by the Soviet Physicists I. Tamm and A. Sakharov in 1952, based on an idea from O. Lavrentiev [14, 17]. The main characteristic that differentiates tokamaks from stellarators is that, due to the way the poloidal component is created, the resultant magnetic field is axisymmetric. In addition, the toroidal current heats the plasma due to Joule’s effect, though relatively low temperatures can be reached, and additional heating methods should be used to achieve temperatures that fulfil the Triple Product criterion. However, the induced poloidal component is also the weak spot of the tokamak, since the fact that confinement is non-linear – plasmas and confinement field are coupled – can lead to disruptions, which are a sudden loss of plasmas control that is very dangerous and harmful to the vessel walls. Moreover, steady-state operation is not possible since a varying induced current cannot be sustained indefinitely.
_________________________________________________________________________________
Introduction
7
Figure 6. Schematic view of a) a tokamak, with the different type of coils and the magnetic circuit necessary to induced a current in the plasma, © EUROFUSION [19] and b) a classical l = 2 stellarator (W7-A) with toroidal coils and four helical windings. A flux surface is also shown [20]
On the other hand, the stellarator, which comes from the English words “stellar” and “generator” that refer to the fact that fusion is the energy source of the stars, was design in 1951 by L. Spitzer in the United States [21, 22]. As in the tokamak case, its strong spot is also its weakness. Indeed, the fact that external currents are responsible for plasma confinement removes the limitation to pulse operation and, at the same time, problems related to disruptions are avoided. However, the advantages of an axisymmetric configuration are lost, since the stellarator magnetic field is completely three-dimensional, and hence, depends on the toroidal coordinate. Moreover, stellarators are technologically more complex than tokamaks and, hence, are behind in the path to a fusion energy power plant. Stellarators do not have induced currents; therefore, plasmas are heated only by external means.
To conclude the introduction about magnetic confinement devices, it has been mentioned that tokamaks take advantage of the induced current to heat the plasma, even though external heating methods can be used, while stellarators plasmas are heated by external means only. These heating methods must satisfy some conditions, like high efficiency of generation, transmission, and coupling to the plasma; large fraction of energy absorbed in plasma; or reliability, easy maintenance and low cost. Thus, in addition to the tokamak intrinsic Ohmic heating, which does not allow heating to high temperatures since it becomes less effective with increasing temperature [14, 17], there are two types of external heating methods. The first one uses microwaves at the cyclotron resonance frequency of either electrons or ions, or a hybrid frequency, to heat the plasma, while the second one consists on injecting beams of accelerated neutral particles that heat the plasma by collisions between beam and plasma particles.
Finally, although tokamaks are in front on the pathway to controlled magnetic fusion due to their simplicity, the previously mentioned problems related to steady-state operation may mean that stellarators are preferable for a power plant.
1.1.3 Issues on the path to steady-state operation As was mentioned in section 1.1.2, first fusion devices were designed in the 1950s. Since
then, progress in key areas has been impressive, not only in plasma discharge duration, but also in fusion gain. For instance, plasma duration has increased from milliseconds in first tokamaks to several minutes in Tore Supra [23] or JET [24], or even hours in the case of LHD [25] (see Figure 7). On the fusion gain side, JET achieved Q ~ 1 with a fusion power of 16.1 MW in D-
a) b)

__________________________________________________________________________________
A study of the physics of pellet injection in magnetically confined plasma in stellarators
8
T plasmas in 1997 [26]; and, in JT-60U an equivalent Q ~1.25 was achieved for D plasmas in 1998 [27]. Nowadays, plasma physics knowledge and technology are mature enough to design and start the construction of ITER, which is expected to demonstrated the feasibility of fusion as an energy source, achieving Q ~ 10 (Q ~5 for steady-state plasmas) [28]. The next step before a commercial plant can be built, after ITER demonstrates it viability and with all the new knowledge and experience that ITER will bring, will be DEMO, which is expected to achieved Q ~25. However, the steady-state operation of magnetically fusion plasmas is still an enormous challenge, since highly complex physics must be combined with the steady-state technological constraints, like plasma heating, current drive methods for tokamaks, fuelling, pumping, plasma diagnostics, superconducting magnet technology or cooled plasma facing components among others. In order to achieve steady-state burning fusion plasmas, it is necessary to establish, and maintain, simultaneously under stable conditions the magnetic configuration, the kinetic configuration, the device safety and a solution for the fuel cycle. Achieving the desire kinetic configuration includes attaining the pertinent density, temperature and rotation profiles. Thus, maintaining the appropriate plasma density profile to achieve the expected fusion power, i.e. a highly peaked density profile, is of high relevance for the steady-state operation of a fusion reactor. Hence, efficient fuelling capability is mandatory, in particular for helical devices. The injection of cryogenic hydrogen pellets is currently the best candidate to refuel the plasma core in large fusion devices, since the achieved fuel penetrations are deeper than those achieved with other techniques. Thus, efficient and reliable pellet injection technology that allows density profile control is one of the requirements to achieve steady-state operation in fusion devices. Further research and development, both in the physics and the technological sides, are therefore necessary.
Figure 7. Achieved plasma durations as a function of injected heating power for present and future devices [28].
1.2. KEY CONCEPTS OF PLASMA PHYSICS AND NUCLEAR FUSION Plasma is a fully ionized gas characterized by collective behaviour, dominated by long-
range electric and magnetic fields. Therefore, plasmas are exceptionally good conductors of electricity, due to the little resistance to the flow of current. However, an ionized gas is
_________________________________________________________________________________
Introduction
9
considered a plasma only if some relations are satisfied, related to the three parameters that characterize a plasma [17]:
• Characteristic scale length or Debye length, λD, i.e., the distance that a plasma is able to shield out an electric field:
1
𝜆𝐷2 =
𝑒2𝑛0
𝜀0𝑇𝑒 +
𝑒2𝑛0
𝜀0𝑇𝑖
(1-9) Where e is the electron charge, n0 is the particle density, Te and Ti are the electron and ion temperatures, respectively, and ε0 is the vacuum permittivity. Inside the sphere of radius equal to the Debye length (the Debye sphere) global neutrality, i.e., quasineutrality, is approximately maintained: 𝑛𝑒 ≈ 𝑛𝑖. The relationship that the ionized gas must satisfied to be considered a plasma is that the typical geometric dimension of the system, L, is much larger than the Debye length: 𝜆𝐷 ≪ 𝐿 .
• Characteristic inverse time scale, ωp, or critical transition frequency of the electrons for the shielding of electric fields:
𝜔𝑝 = (𝑛0𝑒
𝑚𝑒𝜀0)
12 = √2
𝜆𝐷𝑒
𝑣𝑇𝑒
(1-10) Here, me is the electron mass, λDe is the electron Debye length and νTe is the electron thermal velocity. The characteristic thermal frequency of the ionized gas, ωT, i.e., the inverse thermal transit time for a particle to move across the system, must be much lower than the plasma frequency: 𝜔𝑝 ≫ 𝜔𝑇.
• Characteristic collisionallity parameter, ΛD, that represents the number of charge particles located within the Debye sphere:
Λ𝐷 ≡4𝜋
3 𝑛𝑒𝜆𝐷𝑒
3 =4𝜋
3
𝜀0
32⁄
𝑒3
𝑇𝑒
32⁄
𝑛𝑒
12⁄
(1-11) The last relationship to be satisfied by the ionized gas is a large value of the plasma parameter, i.e., a large number of particles inside the Debye Sphere.
Magnetic confined plasmas have additional characteristics, since the confining magnetic field dramatically changes the energy transport properties of the plasma [17]. Indeed, transport in the direction perpendicular to the magnetic field is around ten times higher than in the parallel direction, i.e., transport is anisotropic. The first additional requirement for fusion plasmas is related to the characteristic frequency at which the charge particles spiral around a field line, the gyro-frequency, defined as:
𝜔𝑐𝑒,𝑖 =𝑒𝐵
𝑚𝑒,𝑖
(1-12) Here B is the strength of the magnetic field and mi is the ion mass. While the second is related to the size of the orbit associated with the gyromotion, the Larmor radius, rLe,i :
__________________________________________________________________________________
A study of the physics of pellet injection in magnetically confined plasma in stellarators
10
𝑟𝐿𝑒,𝑖 =𝜈𝑇𝑒,𝑖
𝜔𝑐𝑒,𝑖=
(2𝑚𝑒,𝑖𝑇𝑒,𝑖)12
𝑒𝐵
(1-13) The additional requirements for a plasma to be magnetically confined are that the
gyrofrequency must be large compared to the corresponding inverse thermal transit time and that the Larmor radius must be small compared to the typical macroscopic dimension of the plasma. Both relations imply that particles must make many gyrations before there is any macroscopic motion of the plasma [17].
1.2.1. Description of plasma Various levels of description are possible when describing a plasma. The most accurate
models are based on kinetic theory, which consists of determining the particle distribution functions, fe(r,v,t) and fi(r,v,t), which depend on the position, r; the velocity, v; and the time, t [29]. Less accurate descriptions are given by macroscopic fluid models, whose unknows are functions of only space and time. A reasonably description of macroscopic equilibrium and stability, transport, and heating and current drive is obtained with these types of models.
Fluid Models A fluid model is based on dividing the medium of interest into a large number of small
elements, each of them containing a large number of particles and being described by certain average macroscopic properties. However, for a fluid model to be valid, it must be possible to define a range of sizes for each element that satisfies that, at the same time, the elements are not too small to not contain enough particles, and not too large, so spatial resolution is not lost [17, 30]. In the case of plasmas, it is possible to use a fluid description in the direction perpendicular to the magnetic field, since it provides coherence to the particles in a fluid element. However, the parallel motion must be treated kinetically [17, 30].
The closed system describing a fusion plasma is formed by the conservation of mass, momentum and energy, coupled to Maxwell’s equations. It is possible to consider either two species (electrons and ions, since alpha particles are neglected) – Two-Fluid model [17, 30]– or a single one – MHD model [17, 30]– to describe the system of electrons and ions moving under the influence of magnetic and electric fields, depending on the desire accuracy of the phenomena of interest.
1.2.2. Motion of a charge particle in the presence of magnetic and electric fields
A plasma is made of a large number of charge particles, interacting with both electric and magnetic fields. It is a complex problem to describe their behaviour, thus, the motion of a single charge particle interacting with both kind of fields is revised in this subsection. The motion of a charged particle under the influence of both magnetic, B(r,t), and electric, E(r,t), fields is obtained from the exact equations of motion [17]:
𝑚𝑑�⃗�
𝑑𝑡= 𝑞(�⃗⃗� + �⃗� × �⃗⃗�)
𝑑𝑟
𝑑𝑡= �⃗�
(1-14)

_________________________________________________________________________________
Introduction
11
Here, m and q are the mass and the charge of the particle, respectively, whereas v is its velocity. E and B refer to the electric and magnetic fields. The concept of magnetic confinement is based on the behaviour of a charged particle in a uniform, time independent, magnetic field. However, while confinement in the direction perpendicular to the magnetic field is good, there is no confinement in the direction parallel to the magnetic field. Indeed, the charged particle rotates with an angular frequency equal to the gyrofrequency in the perpendicular direction, whereas along a field line, the particle has a constant uniform motion. Focussing on the perpendicular motion, the trajectory is given by the following set of equations, where it is considered that electrons and ions, due to their different charges, rotate in opposite directions (here on, the upper sign will correspond to the electron):
𝑥(𝑡) = 𝑥𝑔 + 𝑟𝐿 sin(𝜔𝑐𝑡 ± 𝜙)
𝑦(𝑡) = 𝑦𝑔 ∓ 𝑟𝐿 cos(𝜔𝑐𝑡 ± 𝜙) (1-15)
Here, rL is the Larmor radius, ωc is the gyrofrequency and ϕ is the initial phase of the charged particle; while xg and yg represent the guiding centre position of the particle:
𝑥𝑔 ≡ 𝑥0 + 𝑟𝐿𝑠𝑖𝑛𝜙
𝑦𝑔 ≡ 𝑦0 − 𝑟𝐿𝑐𝑜𝑠𝜙 (1-16)
Where x0 and y0 represent the initial position of the particle. The concept of guiding centre is used to build the so-called “Guiding Center Theory”, which consists of following the velocity and position of the guiding centre of the particle. By this, an accurate picture of the average particle location is obtained, differing from the exact orbit by only a small deviation of the order of the gyroradius [17].
The combined effect of the parallel and perpendicular motions results in a helical trajectory; hence, charged particles spiral unconstrained along field lines, with a small perpendicular movement equal to the gyroradius [17]. This has important consequences for a magnetic fusion reactor, since it determines the particular magnetic field geometry capable of confining plasmas. However, this is not the only consideration in the confinement of plasma particles. Indeed, the presence of electric fields, the inhomogeneity of the magnetic field or the curvature of the magnetic field lines should be taken into account, since they modify the helical trajectory of the charged particles under the influence of a magnetic field.
First, the effect of electric fields is considered. The combined effect of electric and magnetic fields results in a new drift, perpendicular to both fields. This so-called ExB-drift, VD, is independent of the mass or the charge of the particle, thus, electrons and ions drift with the same velocity, given by [17]:
�⃗⃗�𝐷 =�⃗⃗� × �⃗⃗�
𝐵2
(1-17) In addition, any inhomogeneity of the fields will modify the gyromotion. On one hand,
inhomogeneous electric fields cause small shifts on the gyro-frequency. On the other hand, magnetic field inhomogeneities result in an additional drift perpendicular to both the magnetic field, B, and its gradient, B, and of equal magnitude but opposite direction for electrons and ions (causing a net flow of current). The B-drift is given by [17]:

__________________________________________________________________________________
A study of the physics of pellet injection in magnetically confined plasma in stellarators
12
�⃗⃗�∇𝐵 = ∓𝑣⊥
2
2𝜔𝑐 �⃗⃗� × ∇�⃗⃗�
𝐵2
(1-18) In this expression, v is the component of the velocity perpendicular to the magnetic field and ωc is the gyrofrequency.
Moreover, the curvature of magnetic field lines produces a new guiding centre drift, driven by the centrifugal force felt by a charged particle due to its free parallel motion along a curved field line. This new drift is perpendicular to both the magnetic field and the curvature vector, small compared to the thermal velocity and comparable in magnitude for electrons and ions of similar temperature. It supposes an important contribution to the flow of current. It is given, in terms of the curvature vector, Rc [17]:
�⃗⃗�𝑅 = ∓𝑣∥
2
𝜔𝑐 �⃗⃗�𝑐 × �⃗⃗�
𝑅𝑐2�⃗⃗�
(1-19) Here, v|| is the component of the velocity parallel to the magnetic field, and the curvature vector
is obtained from: �⃗⃗� · ∇�⃗⃗� = −�⃗⃗�𝑐
𝑅𝑐2, where b is the normalized magnetic field vector, �⃗⃗� ≡
�⃗⃗�
𝐵
Finally, the case of time-varying fields should also be considered. An additional drift velocity, in the direction of the electric fields, arises in the presence of time-dependent electric fields. Since it has opposite directions for electrons and ions, it produces a charge polarization in the electric field direction. The expression of this drift velocity, the polarization drift, is of the form [17]:
𝑉𝑝 = ∓1
𝜔𝑐𝐵
𝑑𝐸𝑡
𝑑𝑡
(1-20)
1.2.3. The rotational transform and other key concepts The MHD model is applied to calculate the combination of externally applied and
internally induced magnetic fields that provide an equilibrium force balance that holds the plasma together and isolated it from the first wall vacuum chamber. MHD equilibria in a toroidal geometry is separated into two pieces: radial pressure balance and toroidal force balance. On one hand, since plasmas tend to expand uniformly along the minor radius, r, magnetic fields and currents must exist to balance this radial expansion force. There are two basic magnetic configurations that can produce radial pressure balance: the “θ-pinch” and the “Z-pinch”. On the other hand, the plasma is pushed horizontally outwards along the direction of the major radius, R, due to the unavoidable forces generated by both the toroidal and poloidal magnetic fields. To determine the appropriate magnetic configuration, the MHD equilibrium model bases on two basic assumptions. The first is that, in equilibrium, all quantities are independent of time, whereas the second is that plasma is static. The set of equations that define the MHD equilibrium model, which describes all magnetic configurations of fusion interest, is [30]:
𝐽 × �⃗⃗� = ∇𝑝
∇ × �⃗⃗� = 𝜇0𝐽
_________________________________________________________________________________
Introduction
13
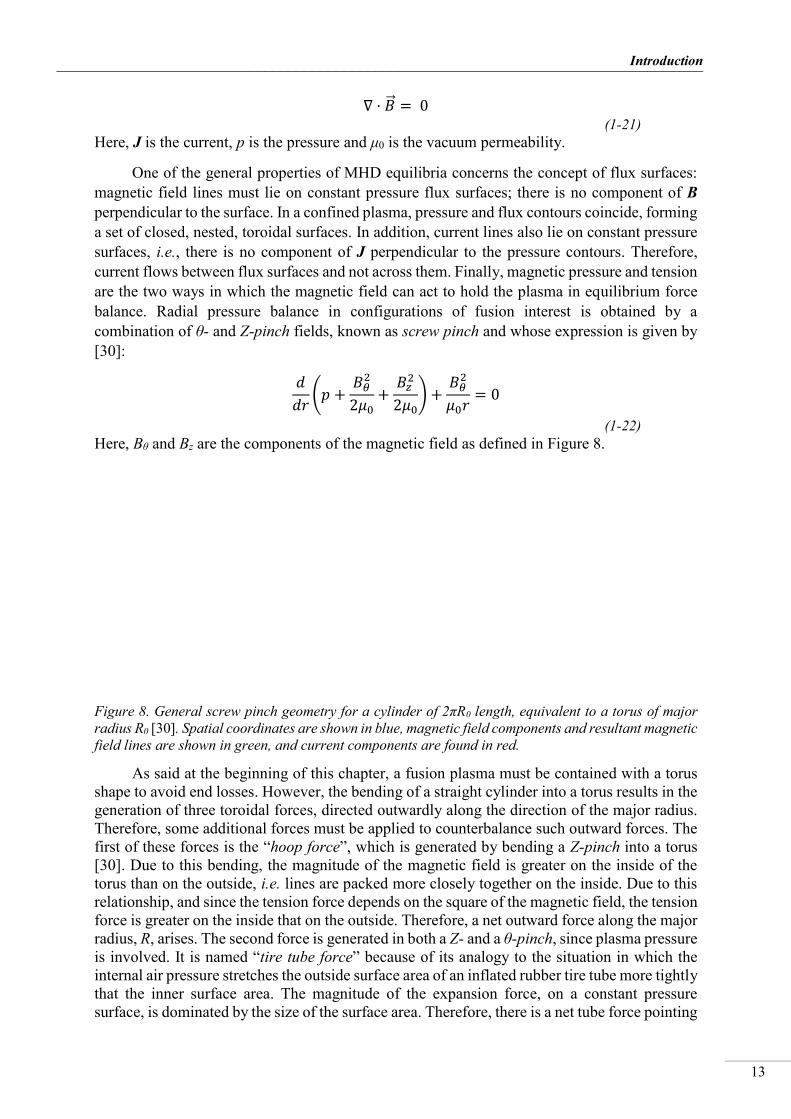
∇ · �⃗⃗� = 0 (1-21)
Here, J is the current, p is the pressure and μ0 is the vacuum permeability.
One of the general properties of MHD equilibria concerns the concept of flux surfaces: magnetic field lines must lie on constant pressure flux surfaces; there is no component of B perpendicular to the surface. In a confined plasma, pressure and flux contours coincide, forming a set of closed, nested, toroidal surfaces. In addition, current lines also lie on constant pressure surfaces, i.e., there is no component of J perpendicular to the pressure contours. Therefore, current flows between flux surfaces and not across them. Finally, magnetic pressure and tension are the two ways in which the magnetic field can act to hold the plasma in equilibrium force balance. Radial pressure balance in configurations of fusion interest is obtained by a combination of θ- and Z-pinch fields, known as screw pinch and whose expression is given by [30]:
𝑑
𝑑𝑟(𝑝 +
𝐵𝜃2
2𝜇0+
𝐵𝑧2
2𝜇0) +
𝐵𝜃2
𝜇0𝑟= 0
(1-22) Here, Bθ and Bz are the components of the magnetic field as defined in Figure 8.
Figure 8. General screw pinch geometry for a cylinder of 2πR0 length, equivalent to a torus of major radius R0 [30]. Spatial coordinates are shown in blue, magnetic field components and resultant magnetic field lines are shown in green, and current components are found in red.
As said at the beginning of this chapter, a fusion plasma must be contained with a torus shape to avoid end losses. However, the bending of a straight cylinder into a torus results in the generation of three toroidal forces, directed outwardly along the direction of the major radius. Therefore, some additional forces must be applied to counterbalance such outward forces. The first of these forces is the “hoop force”, which is generated by bending a Z-pinch into a torus [30]. Due to this bending, the magnitude of the magnetic field is greater on the inside of the torus than on the outside, i.e. lines are packed more closely together on the inside. Due to this relationship, and since the tension force depends on the square of the magnetic field, the tension force is greater on the inside that on the outside. Therefore, a net outward force along the major radius, R, arises. The second force is generated in both a Z- and a θ-pinch, since plasma pressure is involved. It is named “tire tube force” because of its analogy to the situation in which the internal air pressure stretches the outside surface area of an inflated rubber tire tube more tightly that the inner surface area. The magnitude of the expansion force, on a constant pressure surface, is dominated by the size of the surface area. Therefore, there is a net tube force pointing

__________________________________________________________________________________
A study of the physics of pellet injection in magnetically confined plasma in stellarators
14
outwardly along R [30]. Finally, the “1/R force”, generated in the θ-pinch configurations, arises because of the 1/R dependence of the toroidal field. The toroidal force depends quadratically on B and, since the fields are larger in the inner part of the plasma due to the 1/R-dependence in the diamagnetic situation (the opposite is true for the paramagnetic situation), there is a net outward toroidal force along R. Due to the presence of these outward toroidal forces along R, an inwardly pointing force is required to establish toroidal force balance [30]. An additional property of screw pinch configurations should be mentioned, the rotational transform, ι. It is produced by the combination of toroidal and poloidal magnetic fields, and it has the ability of preventing the build-up of charge on the top and bottom of the plasma that occurs in a pure θ-pinch configuration. This property is associated with the fact that, in a confined equilibrium, the combination of toroidal and poloidal magnetic fields causes the magnetic lines to wrap around the plasma; it is defined as the average valued of the angle between two toroidal transits, Δθ, over an infinite number of toroidal transits [30]:
𝜄 = ⟨Δ𝜃⟩ (1-23)
Toroidal force balance is provided by the rotational transform, since it averages out vertical B and curvature drifts as a particle moves freely along the field line. Therefore, no charge accumulation occurs, and, hence, the radially outward ExB drift cannot develop. The rotational transform allows defining a new quantity, the safety factor, q(r), connected to MHD stability, and defined as [30]:
𝑞(𝑟) ≡2𝜋
𝜄(𝑟)
(1-24) In an axisymmetric torus, the rotational transform and the safety factor for a flux surface
labelled by r0 are given by the following expressions:
𝜄(𝑟0)
2𝜋= [
1
2𝜋∫
𝑟𝐵𝜙
𝑅𝐵𝜃𝑑𝜃
2𝜋
0
]
−1
𝑞(𝑟0) =1
2𝜋∫
𝑟𝐵𝜙
𝑅𝐵𝜃𝑑𝜃
2𝜋
0
(1-25) However, for the stellarator case, in which the required rotational transform for toroidal
force balance is applied externally by means of a helical magnetic field, is different, since the toroidal configuration of stellarators is not axisymmetric, i.e., some quantities do vary with the toroidal angle ϕ. In conclusion, the combination of a pure toroidal field plus a superimposed helical field produces an external rotational transform capable of providing toroidal force balance without the need for a net induced toroidal current.
Some additional quantities must be considered, regarding stability of magnetically confined plasmas. The first of these quantities is the shear, related to the radial gradient of the rotational transform and able to provide stability [30]. The magnetic shear, s, is defined as:
𝑠 =𝑟
𝑞
𝑑𝑞
𝑑𝑟= −
𝑟
𝜄
𝑑𝜄
𝑑𝑟
(1-26)

_________________________________________________________________________________
Introduction
15
The second quantity is the magnetic well, related to the average magnetic field line curvature. Its vacuum value is given by an average of the magnetic pressure over a flux surface [30]:
𝑊 = 2𝑉
⟨𝐵2⟩
𝑑
𝑑𝑉⟨𝐵
2
2⁄ ⟩
(1-27) In this expression, V() is the volume of the nested flux surface labelled by .
1.2.4. Three-dimensional configurations Three-dimensional configurations have the potential of providing toroidal confinement
without a net toroidal current. Moreover, these configurations possess nondegenerate flux surfaces even in the absence of plasma pressure and current. Three-dimensional configurations are described as axisymmetric torus with superimposed helical fields. In stellarators, toroidicity plays a major role in determining the overall behaviour of the plasma; in particular, it is crucial in the creation of a favourable magnetic well and in the establishment of equilibrium limits associated with toroidal force balance [17, 30, 31].
Stellarator configurations are low to moderate , large aspect ratio devices in which the magnetic field consists of a large vacuum toroidal field, a moderate vacuum helical field and a small induced poloidal dipole field, with no net toroidal current, although such a current is allowed to flow. From the point of view of stability, stellarators, being fully three-dimensional configurations, are complicated systems. Since they are current-free, stability in stellarators is dominated by pressure-driven instabilities. Of them, interchanges, stabilized by a combination of shear and magnetic well, are the most unstable perturbations [17, 30, 31].
1.3. DESCRIPTION OF THE GOALS OF THE THESIS Theoretical and experimental studies have been devoted to the study of pellet injection
into magnetically confined plasmas for more than four decades. During this time, both the understanding of the several physical mechanisms involved in the ablation of the pellet and the deposition of the material, and the technology of pellet injection have improved notably. As a matter of fact, first pellets, whose size was 0.07 – 0.21 mm, were accelerated only up to 80 – 100 m/s [32, 33]; hence, they penetrated only a few centimetres into the plasma. However, at present, pellets are injected at much higher velocities (>1000 m/s) and their size has also increased. The enhance pellet injection system installed in ASDEX-Upgrade [34, 35] is one example of this progress, since it is able to inject pellets at 240 m/s and up to 1000 m/s, while the available sizes are 1.5 mm, 1.75 mm and 2 mm. Another case of the improvement of the pellet injection technology is the JET pellet injector [36], capable of injecting 4 mm pellets with high frequency (up to 14 Hz) at 300 m/s.
On the other hand, along with the deeper comprehension of the experimental results, theoretical developments have allowed improving the estimation of the pellet fuelling requirements for reactor-type devices. For instance, in [33], 3 mm pellets at 9000 m/s were predicted to be necessary to fuel a reactor of 2 m minor radius, central electron temperature Te(0) = 20 keV and central electron density ne(0) = 3.3x10²⁰ m-3. Nowadays, it is planned to inject 5 mm pellets at 300 m/s into ITER plasmas [37]; moreover, it is predicted that pellet velocities around 1000 m/s are enough to fuel DEMO plasmas [38]. This relaxation in the requisites is partly due to displacement of the deposited material in the direction of the magnetic
__________________________________________________________________________________
A study of the physics of pellet injection in magnetically confined plasma in stellarators
16
field gradient, which favours injection from the High Field Side (HFS) of the device [39, 40]. However, HFS injection has a drawback: while pellet source extruder techniques and pellet accelerators are considered to be mature enough technologies, capable of fulfilling reach fusion-reactor fuelling requirements, the bended pellet guiding systems necessary for HFS injection are a challenge [37, 38]. This challenge comes from the fact that high speed pellets may not be able to survive friction of internal guide tube walls if the shape is not carefully design, thus the geometry of the injection line limits pellet velocity and injection location. In addition to the technological constraints, the magnetic configuration is expected to play a role in the maximum achievable fuelling efficiency [41]. Not only that, dominant mechanisms are not the same for injections into non-axisymmetric devices [42, 43]. Even though an enormous effort has been made to comprehend all the involved mechanisms, some experimental results are not fully understood. Hence, further studies are mandatory to optimize both the location of the injector and the pellet parameters.
In this thesis, the physics related to the injection of cryogenic hydrogen pellets in stellarators is studied. In particular, the dependence of ablation, deposition and fuelling efficiency on relevant plasma parameters and characteristics is investigated for two stellarators, TJ-II and W7-X. The goals of this work are: (1) Establish the relationship between pellet penetration, ablation rate, particle deposition or
fuelling efficiency, and pellet characteristics, magnetic field (plasma configuration), plasma heating type, and plasma temperature and density for TJ-II and W7-X.
(2) Develop a code that simulates the ablation of a pellet injected into TJ-II plasmas. (3) Compared experimental data with theoretical results from a well-stablished code for these
devices and with data from an international pellet database.
In order to fulfil these goals, a pellet injector, recently installed in the TJ-II stellarator, is used as the main tool to carry out experimental studies of ablation and fuelling efficiency for different pellet and plasma parameters. In parallel, a pellet simulation code, which was developed and benchmarked for tokamaks, is adapted to the TJ-II and W7-X environments. The experimental results from TJ-II are then used to benchmark this code so that predictions can be made for W7-X. Such work is organized as follows in this thesis. In Chapter 2, theoretical models and pellet experiments are summarized, along with the unresolved issues. TJ-II, its pellet injector and their diagnostics are described in Chapter 3. In addition, an overview of W7-X is also given in Chapter 3, where its pellet injection plans are outline. Experiments carried out in TJ-II are described and results are review in Chapter 4. In Chapter 5, the ablation and deposition code Hydrogen Pellet Injection (HPI2) is described; simulations for TJ-II and Wendelstein 7-X stellarators are shown, together with a summary of the adaption of the code to both devices. Finally, Chapter 6 is devoted to the obtained conclusion and future work.
_________________________________________________________________________________
Review of pellet injection experiments and modelling
17
2. REVIEW OF PELLET INJECTION EXPERIMENTS AND MODELLING
2.1. FUELLING NEEDS AND THE PARTICULAR CASE OF STELLARATORS The ultimate goal of magnetic-confined plasmas research is energy production. When
analysing the power produced by a future fusion reactor, the plasma density and temperature radial profiles must be considered, since their shapes have an important effect on plasma behaviour. In particular, peaked density profiles at fixed beta, , lead to an average increment of the fusion power density, where is defined as the ratio between the plasma pressure, p, and
the magnetic pressure, 𝑝𝑚𝑎𝑔 =𝐵2
2𝜇0. Moreover, it is found that the maximum power density
occurs at reduced average plasma temperatures for more peaked profiles. In addition, peaked density profiles often lead to improved confinement regimes, which imply valuable benefits for reactor performance. Peaked density profiles have additional advantages for tokamaks, such as an increment of the total bootstrap current, an improvement of the current profile ‘alignment’ or saw-tooth suppression. Achieving such peaked density profiles requires that fuel reaches the plasma core [42, 44]. Core fuelling is expected to have additional benefits for a fusion reactor, since it might reduce pumping requirements or the tritium inventory in the gas processing system.
Core fuelling is also of primary importance for helical devices, since the neoclassical outward-pinch, related to the temperature gradient with T’ < 0, leads to a particle outward-pinch [45]. This implies that strongly hollow density profiles, which may even lead to hollow pressure profiles, are expected for central heating [45]. In the particular case of configurations with magnetic well, V’’<0, the inversion of the pressure profile originates a destabilizing term, p’V’’ < 0, in the stability criterion for resistive interchange modes [45]:
𝑝′𝑉′ − ⟨𝑗⊥2⟩ − ⟨𝑗∥
2⟩ > 0 (2-1)
Here j and jǁ are the flux-average surface diamagnetic (the diamagnetic current, due to the flows in the various plasma charge species, is defined as 𝑗⊥ ≡
𝑩×∇𝑃
𝐵2 . Here P is the plasma pressure) and Pfirsch-Schlüter (produced by the short-circuiting of toroidal drift polarization charges along magnetic field lines [46]) current densities, respectively. This implies that, if p’ > 0 in the region where power is deposited, strong resistive interchange modes will appear. Because of that, temperature and density profiles will flatten, degrading the central energy confinement. Hence, in order to avoid a hollow density profile and its disastrous consequences, central particle fuelling is mandatory for electron and/or ion cyclotron resonance (ECRH, ICRH) heated plasmas in helical devices. Moreover, the particle source strength must be nearly proportional to the heating power [45]. Indeed, assuming a purely neoclassical particle flux
density, 𝑆𝑝 (𝑟) =𝑟−1𝑑(𝑟𝑇)
𝑑𝑟 , and taking into account additional losses in the energy balance,
𝑃∗(𝑟) = 𝑃ℎ − 𝑃𝑙 −𝑟−1𝑑(𝑟𝑄𝑎𝑛)
𝑑𝑟, (Ph is the heating power density profile, Pl are radiative losses
__________________________________________________________________________________
A study of the physics of pellet injection in magnetically confined plasma in stellarators
18
(both in W), and Qan is an additional energy flux density due to anomalous heat diffusivity) one obtains an expression for the particle source profile as follows:
𝑆𝑝 =𝑃∗
𝑇Ξ− (
𝑇′
𝑇+
Ξ′
Ξ)Γ
(2-2) Here, r is the plasma radial coordinate (in m), T is the plasma temperature (it is assumed that T ≡Te ≈Ti; in eV), is the total neoclassical energy flux density, and Γ is the ambipolar particle flux density. For the assumed conditions, ’ = 0; neglecting the T’ term, and if the additional energy losses – i.e. radiation losses and “anomalous” heat diffusivity in the expression for P* - are also negligible (reasonable for peaked central heating), the resultant needed particle flux, Sp(r) (in s-1), is similar to the power deposited profile, Ph(r). Therefore, a central particle source is necessary for ECRH and ICRH central heating. These estimations are independent of the specific magnetic configuration as long as the electron and ion transport coefficients are comparable in magnitude, which is the case of the plasma core due to the high temperatures [45].
The injection of cryogenic hydrogen pellets is currently the best candidate to refuel the plasma core in large fusion devices, since the achieved fuel penetration is deeper than those attained with other techniques. Indeed, fuelling particles are deposited inside the edge transport barrier [45] when pellet injection is used, whereas, for gas injection, they are deposited at the plasma edge. Moreover, the fact that the gas is deposited and ionized at the plasma edge leads to high particle losses. Hence, fuelling efficiency, defined as the ratio between the total number of deposited particles in the confined plasma and the number of injected particles, is much higher for pellet injection than for gas injection [47]. In addition, the injection of a pellet does not have an associated energy source, as is the case of Neutral Beam Injection (NBI), which may be detrimental to density control, particularly in stellarators, due to the energy and particle transport coupling that may lead to hollow density profiles, increasing hence the need for central fuelling and, therefore, worsening the situation [47].
2.2. REVIEW OF PELLET INJECTION EXPERIMENTS AND RELEVANT DEVELOPMENTS Pellet injection was firstly proposed as a feasible method for plasma refuelling by L.
Spitzer in the early 1950s [48]. First pellet injections were made into magnetically confined plasmas in the 1970s [32, 33]. Since then, numerous experimental studies have been carried out. Initially, these studies were focussed on the measurement of the ablation rate and the penetration depth of the pellet, usually by recording the Balmer Hα light emitted by the pellet cloud, a method that was proposed in [33]. These have been carried out in a number of tokamaks [42, 44] and, in addition, in a limited number of helical devices [49]. Penetration studies led to the formation of an inter-machine database for pellet penetration as a function of pellet velocity and mass as well as of plasma parameters, such as electron density and temperature, magnetic configuration and heating method [50]. It was observed that high-energy electrons and ions from additional heating power, lead to over-ablation of the pellet, for instance, at the plasma edge, and, thus, to reduced penetration [51–55]. It was also found that, for similar plasma parameters, pellets penetrate deeper for higher magnetic fields [56]. In addition, experimental results show that ablation mechanisms for stellarator plasmas are equivalent to those for
_________________________________________________________________________________
Review of pellet injection experiments and modelling
19
tokamaks [49]. The characteristics of the shielding cloud, such as density, temperature or size, have also been studied by different procedures, mainly involving spectroscopy methods, in different devices [42, 44], including the helical devices Heliotron-E [57] and LHD [54, 58]. Studies with fast framing cameras or Charge Coupled Device (CCD) cameras revealed a filamentary structure of the cloud, so that it consists on bright and dark cigar-shaped zones that extend along magnetic field lines [40, 59–63]. Electron temperatures of 1-4 eV and neutral densities of 1024 – 1026 m-3 in the neutral cloud and electron densities of 1023-1024 m-3 in the cigar-shaped emitting region were found [40, 60, 64–68]. Later measurements showed that at the beginning of the homogenization phase, the electron temperature increases up to 20-25 eV and the electron density decreases to 1022 m-3 [40]. In addition, expansion velocities of 104 – 105 m/s were reported [60].
At the same time, fuelling experiments were performed in several machines [44, 53]. The dependence of the fuelling efficiency on different plasma parameters, including density, temperature and heating method, and with pellet velocity and mass was studied. First attempts resulted in a large scatter and underestimated efficiency since mass lost during pellet acceleration and erosion along the injection tubes were not taken into account. Additional fuelling studies, carried out in several tokamaks [44], showed increased efficiency to be related to deeper penetration [69] and, on the other hand, decreased efficiency with auxiliary heating [42, 44]. More recently, in ASDEX-U, it was found that fuelling efficiency depends on the pellet injection location, being higher for injections made from the High Field Side (HFS) of the machine [39]. After that, comparisons of Low Field Side (LFS) and HFS injections have been carried out in other devices, confirming these differences in tokamaks, such as JET [70] or DIII-D [71, 72]; in contrast, results from LHD were not conclusive [43, 73]. In addition, the dependence of efficiency on confinement regime was studied in ASDEX-U and DIII-D. It was found that the efficiency for the ELM-free H-mode shows the same dependence on penetration and injection location, but that efficiency is lower for ELMy H-mode for the same penetration depth [74–76]. In parallel, improved energy confinement due to pellet injection was identified in several tokamaks [44], and later, the extension of the operation regimen was achieved using pellet injection in LHD [53, 77, 78] and in Heliotron-E [79]. Also, in the mid-1980s, a deflection in the toroidal direction of the pellet trajectory was observed for the first time [42, 44, 59]. Sometimes, poloidal deflections were also observed [42]. In addition, an associated radial acceleration of the pellet was observed for pellets undergoing large toroidal deflections [59]. These deflections are related to an unbalanced ablation on both sides of the pellet due to heating asymmetries, sometimes called the Rocket Effect [42].
Differences between predicted electron density profiles after ablation and measured profiles, which revealed significant outward displacements of the material in the major radius direction, led to detailed studies of the homogenization of the ablatant in the background plasma. For instance, the parallel expansion of the plasmoid was studied in TFTR using an X-ray camera and a FIR interferometer [80], and later further studies were made in Tore Supra [81] and LHD [53]. Velocities of the order of 105 m/s were found to occur at the beginning of the homogenization phase, which lasted up to 1 ms, while velocities of around 104 m/s afterwards were reported [82]. In other works, the radial displacement of the material and the velocity of this displacement were measured, using arrays of optical fibres, in RTP [83], ASDEX-U [40, 84], JT60-U [85] and JET [86]. Indeed, drift velocities of the order of 103 - 104 m/s were found, along with a net outward displacement of the material for injections from the LFS, whereas inward displacements towards the core were observed for HFS injections, in all

__________________________________________________________________________________
A study of the physics of pellet injection in magnetically confined plasma in stellarators
20
tokamaks. In some cases, an acceleration of the pellet along the major radius direction was found to be related to material displacement [40, 87]. Material drift has also been studied in LHD. However, due to the complexity of the magnetic field and to some averaging effects – the magnetic field and its gradient vary extremely along the plasmoid length – the interpretation of the measurements is more difficult and the difference between LFS and HFS injection is not as clear as for tokamaks [42, 53]. In addition, modifications of the plasma potential after pellet injection have been studied in some tokamaks, both in the edge with Langmuir probes, where it was observed that its value becomes more negative with pellet injection [88], and deeper in the plasma with HIBP [89]. In the latter case, it was found that the sign of the potential perturbation depends on whether the pellet is injected above or under the magnetic axis.
The developments outlined above show that pellet ablation is well understood and that involved mechanisms are equivalent for tokamaks and stellarators. However, plasmoid evolution and particle deposition are not fully comprehended in helical devices. These two mechanisms are of most importance here since they are studied both experimentally and theoretically. For instance, plasmoid drift is analysed for different plasma conditions using fast-camera images, and particle deposition profiles, obtained from Thomson Scattering electron density and temperature measurements, are compared to theoretical predictions.
It can be seen that, due to its importance for future reactors, most devices have, or had, a pellet injector and studies of pellet ablation and homogenization have been carried out with them. However, even though core fuelling is essential for stellarators due to the previously mentioned core particle depletion, the situation for this type of devices was different. In the past, few pellet experiments were carried out in stellarators. In contrast, the importance of pellet injection for helical devices is now highlighted by the fact that the largest current stellarators (Heliotron-J, TJ-II, LHD and, more recently, W7-X) are equipped with a pellet injector. Despite this, further studies of pellet ablation, and, in particular, of the homogenization of the material, are of vital importance for a complete understanding of the different mechanisms involved, to validate the current models and to optimize both the location(s) of the injector(s) and the plasma and pellet parameters.
2.3. REVIEW OF ABLATION MODELS When a cryogenic hydrogen pellet is injected into a magnetically confined plasma,
plasma particles (thermal and non-thermal electrons and ions) transfer their energy flux to the pellet, ablating it. The rate at which the incident particles ablate the pellet is given by the balance between the energy flux of the incoming particles and the energy required to ablate, dissociate, ionized and accelerate the pellet particles. Hence, the ablated particles expand around the pellet, protecting it from further interactions with the ambient plasma. Therefore, the pellet lifetime is increased, thus allowing it to penetrate deeper into the plasma. Moreover, the ablation depends on the efficiency of these shielding mechanisms; it is a self-regulated process, i.e., the shielding cloud self-adapts in such a way that the heat flux reaching the pellet surface is just enough to maintain an adequate shielding of the cloud. There are three different phenomena that protect the pellet, the dynamics of the cloud being the most important. Indeed, the heat flux is strongly reduced due to collisions with the cloud particles, shielding the pellet almost completely. The second mechanism, known as electrostatic shielding, is related to the fact that the cloud is negatively charged with respect to the background plasma; thus, there is an associated negative potential that accelerates plasma ions and decelerates electrons. Since ions dissipate their
_________________________________________________________________________________
Review of pellet injection experiments and modelling
21
energy in the shielding cloud, the heat flux at the pellet surface is significantly reduced by this negative sheath at the plasma-cloud interface. Finally, the ionized fraction of the cloud, or plasmoid, partially expels the magnetic field. Thus, the incident heat flux is also reduced by magnetic shielding. These mechanisms are considered in the different pellet ablation models developed to date. In the following subsection these models and the way such mechanisms are handled are further explained.
2.3.1. Neutral Gas Shielding Models The first models that attempted to reproduce the ablation of the pellet assumed a steady-
state, spherically symmetric expansion and shock-free transition flow. The gas dynamics was the only shielding mechanism considered in these models and the plasma electron distribution was replaced by a mono-energetic beam. These early models that only considered the neutral part of the shielding cloud are known as Neutral Gas Shielding (NGS) models [44, 90–93]. Since only the neutral cloud was included, its behaviour was modelled by a set of hydrodynamics conservation equations, an equation of state and an expression for the heat deposition in the cloud. Under the previously mentioned assumptions, the conservation of mass, momentum and energy were written as [91, 92]:
𝑑
𝑑𝑟(𝜌𝑣𝑟2) = 0
𝑑
𝑑𝑟(𝜌𝑣2𝑟2) + 𝑟2
𝑑𝑝
𝑑𝑟 = 0
1
𝑟2
𝑑
𝑑𝑟[𝜌𝑣𝑟2 (ℎ +
1
2𝑣2)] = �̇�
(2-3) Here, is the mass density (in kg/m3), v the velocity of the neutrals (in m/s), p is the fluid pressure (in Pa), h is the specific enthalpy (in J/kg), and �̇� is the rate of volumetric heat generation (in W/m3). In the expression for the heat deposition in the cloud, the plasma electron flux was firstly approximated by a mono-energetic beam. Two different approaches were adopted to approximate the electron heat flux, Γe. In the first, from Parks and Turnbull, the effect of elastic collisions was included, and the system was solved as an eigenvalue problem, with 𝜆∗ = 𝑛𝑎𝑏𝑙∗Γ∗Λ∗ as the eigenvalue [90]. Λ is defined as an effective collisional cross-section that accounts for both the elastic and the inelastic collisions (in m2). The * refers to the values at the sonic radius. In both models, the boundary conditions at the pellet surface were negligible heat flux and temperature. In the second, from Milora and Foster, only inelastic collisions with the cloud particles were taken into account; hence, the electron flux was approximated by Γ𝑒 =
𝑛𝑒𝑣𝑒 (ne is the electron density in m-3), and the expressions for the energy reduction and the rate of heat generations were written as:
𝑑𝐸𝑒
𝑑𝑟= 𝑛𝑎𝑏𝑙𝐿𝑒(𝐸𝑒)
𝑞 ̇ ≈ Γ𝑒𝐿𝑒(𝐸𝑒) (2-4)
Here, Le is the stopping cross-section of electrons in a neutral gas due to inelastic collisions (in eV·m2) and nabl in the density of neutral particles (in m-3) [94]. In addition, some models were developed with slab [95] or cylindrical [96] geometries.
__________________________________________________________________________________
A study of the physics of pellet injection in magnetically confined plasma in stellarators
22
Later, the effects of atomic processes on the ablated material or ablatant were included. The dissociation, excitation, ionization and radiative losses were added in references [93, 96]. Some models assumed LTE conditions [97–99]; these models showed that the energy sink corresponding to the ionization of the ablated material is responsible for a shock front in the flow [98, 99]. Additional modifications to the NGS model were done by different groups. For instance, the effect of a realistic energy distribution was taken into account in references [100–103], where the incident electron heat flux was assumed to be Maxwellian. In some of them, an accurate description of the cloud heating, estimated from direct calculations, of the evolution of the electron distribution function was given [97, 98, 104]. In particular, in Kuteev’s model, the variation of the impact parameter, p; the angle of incidence of the particles, θ; and the particles energy distribution faction, f(E,h,θ) were considered [101]. However, this model was limited due to the assumption of spherical symmetry expansion and sonic velocity in the whole cloud.
In addition, the effect of suprathermal particles was added in several models. The influence of fast ions from NBI were firstly added to Milora’s model, in which heating terms representing the weighted averaged of electron and fast ions heat sources were included [105]. A different approach was used by Nakamura, who reformulated the eigenvalue problem to include the effect of suprathermal ions. In this model, two different mono-energetic beams were considered, the thermal electron beam and the suprathermal ions; hence, two eigenvalues were necessary. A cloud whose parameters were not monotonic functions of the radial coordinate was obtained with this method [106]. A similar model was developed by Ho and Perkins to account for the effect of fusion alpha particles [107]. Finally, the effect of suprathermal electrons was included by Pégourié and Peysson, who showed that, because of the presence of fast electrons, the pellet is heated in volume, while the cloud hydrodynamics are not significantly modified [108].
The effect of the confining magnetic field was partially addressed in some models, which accounted for the resultant anisotropic heat flux. MacAulay considered in his model the two-dimensional modification of the cloud shape, as well as the modified heat flux distribution at the pellet surface. However, the pellet was assumed to remain spherical, and only an average radius regression rate was used [97]. Parks et al. also considered the modification of the heat flux and, therefore, of the ablation, due to the presence of a magnetic field, but without imposing any ad-hoc boundary condition at the pellet-cloud interface. In this model, the pellet, due to the stress produced by a non-uniform pressure distribution, was found to be fluidized and flattened, leading to an increase of the pellet surface and, hence, of the ablation rate [98, 99]. Moreover, a time-dependent NGS model was presented in [97]; atomic physics effects, Maxwellian electron distribution and two-dimensional gas dynamics were included. Lastly, in references [98, 99, 104], the regression of the pellet radius was considered in order to calculate the cloud expansion, but with the limitation of constant incident heat flux.
The NGS models have been compared with a number of experimental results. Good agreement between the modelled ablation rate and pellet penetration depth, as well as the measured Hα emission, has been found [50, 109]. A simple code based in the NGS model, with the effect of NBI fast ions [106], has been adapted for the TJ-II and compared with the experimental results, as described in Chapter 5. This model considers the dynamics of the neutral cloud, with thermal electrons and suprathermal ions as heat sources, to calculate ablation. In addition, it assumes radial symmetry and a spherical pellet. Also, plasma particle

_________________________________________________________________________________
Review of pellet injection experiments and modelling
23
elastic and inelastic collisions in the cloud are included. Moreover, assuming LTE conditions, the hydrodynamics system is treated as an eigenvalue problem. Other additional effects, such the effect of the magnetic field or a realistic electron flux shape, are not considered since this code purpose is being a simple tool that provides ablation without large computational time. Indeed, including additional effects increases the computational time, but, as will be seen in section 2.3.3, results are not significantly improved.
2.3.2. Neutral Gas and Plasma Shielding Models NGS models are able to reproduce considerably well experimental pellet penetration
depths. However, they describe in a very simplified way all processes associated with pellet ablation, since they did not take into account the shielding effect of the ionized fraction of the cloud. Therefore, this type of models needs to be completed by adding the shielding effect of the ionized ablated material. Early estimations of the effect of the ionized fraction of the cloud – parallel expansion of the cloud once it becomes ionized - can be found in [110–112], where the transverse size of the cloud was quantitatively estimated. Several models, known as Neutral Gas and Plasma Shielding (NGPS), have been proposed to describe the additional shielding provided by the ionized fraction of the cloud. The first example was the model proposed by M. Kaufmann et al. [111] in which the temporal evolution of the ablatant flow along the magnetic field lines was described with a single-velocity, two-temperature, partially-ionized and compressible, ideal gas approximation. In addition, the particle source, d(nabl)/dt, was assumed to be given by the NGS model of Parks and Turnbull [91]. Here abl denotes the ablated material. Under the previously mentioned assumptions, and considering electrons, ions and neutrals, denoted as e, i and a respectively, the following relationships between the different kinds of particles are used:
𝑣𝑎 = 𝑣𝑖 = 𝑣𝑒 ≡ 𝑣
𝑛𝑖 = 𝑛𝑒 , 𝑛𝐻 = 𝑛𝑎 + 𝑛𝑖 = ℎ𝑒𝑎𝑣𝑦 𝑝𝑎𝑟𝑡𝑖𝑐𝑙𝑒𝑠
𝑇𝑎 = 𝑇𝑖 = 𝑇𝐻
𝜌 = 𝑛𝐻𝑚𝐻, 𝑝𝐻,𝑒 = 𝑛𝐻,𝑒𝜅𝑇𝐻,𝑒 , 𝑚𝐻 = 𝑚𝑎 ≅ 𝑚𝑖 (2-5)
Here, as in the last subsection, v denotes the velocity, n is the atomic density, T is the temperature, ρ is the mass density, and p is the pressure, of the corresponding kinds of particle. Moreover, constant flux tube cross-sections and slab symmetry were assumed. Hence, the conservation equations were written in the following way:
𝜕𝑛𝐻
𝜕𝑡+
𝜕
𝜕𝑥𝑛𝐻𝑣 = �̇�𝑎𝑏𝑙
𝜕𝑛𝑒
𝜕𝑡+
𝜕
𝜕𝑥𝑛𝑒𝑣 = �̇�𝑒 = 𝛼3𝑏𝑛𝑒(𝑛𝑒𝑆
2 − 𝑛𝑒2)
𝜕
𝜕𝑡 𝜌𝑣 +
𝜕
𝜕𝑥(𝜌𝑣2) = −
𝜕
𝜕𝑥(𝑝𝐻 + 𝑝𝑒) = 𝑚𝐻𝑣𝑎𝑏𝑙�̇�𝑎𝑏𝑙
𝜕
𝜕𝑡(3
2𝑝𝐻 +
1
2𝜌𝑣2) +
𝜕
𝜕𝑥𝑣 (
5
2𝑝𝐻 +
1
2𝜌𝑣2) =

__________________________________________________________________________________
A study of the physics of pellet injection in magnetically confined plasma in stellarators
24
−𝑣 𝜕
𝜕𝑥𝑝𝑒 −
𝜕
𝜕𝑥 (𝑞𝑎 + 𝑞𝑖) + �̇�𝑒𝑎 + �̇�𝑒𝑖 + 𝑚𝐻�̇�𝑎𝑏𝑙 (
3
2𝜅𝑇𝑎𝑏𝑙 +
1
2𝑣𝑎𝑏𝑙
2 )
𝜕
𝜕𝑡
3
2𝑝𝑒 +
𝜕
𝜕𝑥𝑣
5
2𝑝𝑒 =
𝑣 𝜕
𝜕𝑥𝑝𝑒 −
𝜕
𝜕𝑥𝑞𝑒 − �̇�𝑒𝑎 − �̇�𝑒𝑖 − 𝜖𝑖�̇�𝑒
(2-6) In these expressions, x is the spatial coordinate along the flux tube (in m), as defined in reference [111]; 𝜖𝑖 is the ionization energy per particle, 𝑞𝑒.𝑖,𝑎 are the conductive heat fluxes and �̇�𝑖𝑗 is the classical energy transfer from species i to species j. Also, �̇�𝑒 is the source strength, α3b is the three-body recombination rate, and neS is the Saha equilibrium electron density (SI units are used here) [111].
Several years later, W. A. Houlberg et al. [113] proposed an extension of the NGS model [92] that included the plasma shielding and where the “NGPS” name appeared for the first time. In this collisionless model, the incident plasma electron and fast-ion energy distributions are modelled by multiple energy groups. The self-limiting ablation was taken into account, as well as the additional shielding provided by the pile-up of the ionized pellet particles in the confining flux tube. However, the cloud radius, which plays a major role in determining the ablation rate, is empirically chosen to fit experimental pellet penetrations depths. In [105], two options for the cloud radius, Rcloud (in m), were given:
𝑅𝑐𝑙𝑜𝑢𝑑 = 𝑐𝑜𝑛𝑠𝑡𝑎𝑛𝑡 (2-7)
And
𝑅𝑐𝑙𝑜𝑢𝑑 = 𝑟𝑝𝑒𝑙𝑙𝑒𝑡 + Δ, Δ = 𝑒𝑚𝑝𝑖𝑟𝑖𝑐𝑎𝑙 𝑠ℎ𝑖𝑒𝑙𝑑 𝑡ℎ𝑖𝑐𝑘𝑛𝑒𝑠𝑠 (2-8)
Instead of using an empirical value, Lengyel computed the value of the cloud radius at every energy flux surface [114], basing on a single-cell Lagrangian model that described the ionization and the expansion of a plasmoid in a magnetic field [115]. Afterwards, a time-dependent quasi two-dimensional MHD ablation model was proposed by Lengyel and Spathis [116, 117]. In this model, the ablation rate, the expansion of the cloud and the distortion of the magnetic field were calculated in a self-consistent way. For that, two hydrodynamics codes, one one-dimensional and another 1.5-dimensional, were coupled. The former calculated the ablation rate for a given cloud radius; the electrostatic shielding was included in the stopping length calculations of the cloud heating and, thus, of the ablation rate. In addition, the conductive redistribution of the deposited energy and the magnetic shielding were considered. On the other hand, in the latter code, the cross-field expansion dynamics of the ablatant, the values of the confinement radius and the 𝐵
𝐵0 magnetic shielding factor were calculated for a
given ablation rate. Thus, the local ablation rate was calculated by averaging its time dependent value over the residence time of the pellet in its shielding cloud. Moreover, the radius of the cloud was obtained as a function of the local background plasma parameters and the magnetic field strength.
In addition, Pégourié et al. developed a model [56, 118], based on Houlberg’s NGPS model [113], in which the cloud radius, along with cloud temperature and density, is calculated with a single cell Lagrangian scheme equivalent to [114, 115]. Thereafter, several models were

_________________________________________________________________________________
Review of pellet injection experiments and modelling
25
proposed to remove different limitations of these initial NGPS versions, such as the assumption of homogenous heat flux or steady-state. Firstly, a more accurate description of the electron distribution function was included in [119], where a Maxwellian distribution function was used and the cloud heating was obtained from stopping length calculations. An equivalent description was later included in [120]. Both models took into account the full spatial distribution of the ionization and, hence, of the conductivity, in the cloud. In addition, the potential distribution in the whole cloud was calculated in a self-consistent way. In the former model, one fluid with weighted properties was considered, whereas in the latter, neutrals and ions were treated separately with a collisional coupling between them. Moreover, in [119], it was assumed that the pellet sheds periodically its shielding cloud and the instantaneous ablation rate was calculated as a function of the cloud development, removing, hence, the steady-state approximation. On the other hand, in [120], the dynamics of the cross-field deceleration was obtained by MHD calculations.
Afterwards, the effect of the background magnetic field in the plasma heat flux distribution was included in Kuteev’s model [121]. Therein, the approximation of a spherical pellet was removed, although the cloud was assumed to be spherical and to expand at the sonic velocity. Under these assumptions, the pellet became lentil-shaped, due to the larger surface regression rate for areas perpendicular to the magnetic field. An additional improvement of the model consisted in including the effect of high-energy particles. Moreover, the possibility of volume heating due to suprathermal electrons was also included. Furthermore, the electrostatic shielding, albeit in the single-sheath approximation, was also taken into account. Nevertheless, this approximation was removed in [122], where the double-sheath was described in detailed and the return flux of electrons towards the plasma was considered. Afterwards, the drift of the plasmoid down the magnetic field gradient was included in the calculations of the residence time of the pellet inside the ablation cloud and, thus, in the estimations of the parallel size of the cloud. The Maxwellian distribution of the plasma electrons was also included in the stopping length calculations for the cloud heating. In addition, the single sheath approximation was used to estimate the electrostatic shielding. At a later date, both the geometrical effects related to the fast ions orbits, and the possibility of heating in volume were included in a steady-state model with a detailed description of the double-layer plasma sheath [55]. In this model, it was assumed that the ablatant is frozen in the magnetic field when the ionized fraction is high enough. Under this assumption, the residence time of the pellet was calculated, along with the parallel dimension of the cloud, which is estimated as 𝑍0 ~ 𝑟0
𝑣0
𝑣𝑝 . Finally, in [123], the change
of the flow geometry due to the ExB force was included in a two-fluid, MHD electrostatic model. However, it was assumed that cloud 𝛽 =
𝑝0
𝑝𝑚𝑎𝑔 is weak enough for the magnetic field to
be uniform and constant outside and inside the ablatant channel, i.e., the plasmoid does not disturb the background magnetic field.
Comparisons between models described here and in Section 2.3.1, and experimental results are reviewed in the following subsection. In addition, the most important effects are highlighted. Finally, it should be noted that the ablation model used in the Hydrogen Pellet Injection (HPI2) code, which is the well-established code used in this work to simulate pellet injections into the TJ-II and W7-X, is based in the enhanced NGPS model developed by Pégourié et al. in [55]. This is a further improve of models in references [56, 118].

__________________________________________________________________________________
A study of the physics of pellet injection in magnetically confined plasma in stellarators
26
2.3.3. Comparison with experimental results Results obtained with these NGPS models have been compared with experimental results
from different devices. For instance, Lengyel’s early model [114, 115] was used to reproduce several pellet injections in TFR, PLT, T-10, ASDEX and JET [114]; in addition, the model was validated for ASDEX [124, 125], showing that the predictions were within the range of measured values. Pégourié’s model [56, 118] was compared with Tore Supra experimental results; the model was able to reproduce particle deposition profiles and pellet penetration depths. Lengyel`s and Spathis`s model [116, 117] was also found to agree with penetrations depths measured in ASDEX-U [117]. Later, the effect of fast particles included in [55] was tested and a reasonable agreement was found between the predictions and the measurements in ICRH and Lower Hybrid Current Drive (LHCD) experiments. Despite the fact the NGPS models are more sophisticated and realistic, since they describe in detail all the shielding mechanisms and include accurate distributions for plasma and fast particles, the agreement between NGPS model predictions and experimental measurements are not significantly better when compared with NGS predictions. Moreover, NGS models are able to reproduce successfully the experiments, even though the cloud dynamics is the only shielding mechanisms taken into account. The reason is that the different additional shielding mechanisms are balanced [55, 109, 126] (see Table 1).
Additional Effect Modification of the ablation rate Maxwellian distribution of electrons x4 Non-uniform heat flux distribution x0.5
Electrostatic shielding x0.5 Atomic physics x0.75-0.7
Table 1. Additional shielding mechanisms contributing to the pellet ablation rate
However, the NGS model is not able to calculate parameters of the ionized fraction of the cloud, such as dimensions, ionization degree, temperature and density. Moreover, neither NGS nor NGPS models can explain the difference between the measured ablation and deposition profiles. For that, a model for the time evolution of the ionized fraction of the cloud that takes into account the complete ExB drift is necessary, i.e., a homogenization model of the plasmoid. Proposed homogenization models are described in the next subsection. In addition, the effects suggested to explain the differences found between expected and measured density profiles are reviewed.
2.4. REVIEW OF HOMOGENIZATION MODELS Once the pellet material has been ablated and ionized, several phenomena take place until,
finally, plasma temperature and density radial profiles recover. During the homogenization phase, the ionized material expands in the direction parallel to magnetic field lines until plasma and plasmoid pressures are equilibrated. During this expansion, the plasma potential distribution is modified, as is the poloidal rotation profile. At the same time, this material drifts down the magnetic field gradient. A number of homogenization models has been proposed to explain these phenomena. The origin of the latter phenomenon, the drift of the ionized material, is explained in [127, 128] for tokamaks. The vertical motion of plasmoid electrons and ions in the non-uniform magnetic field generates an uncompensated current, jB (see Figure 9):
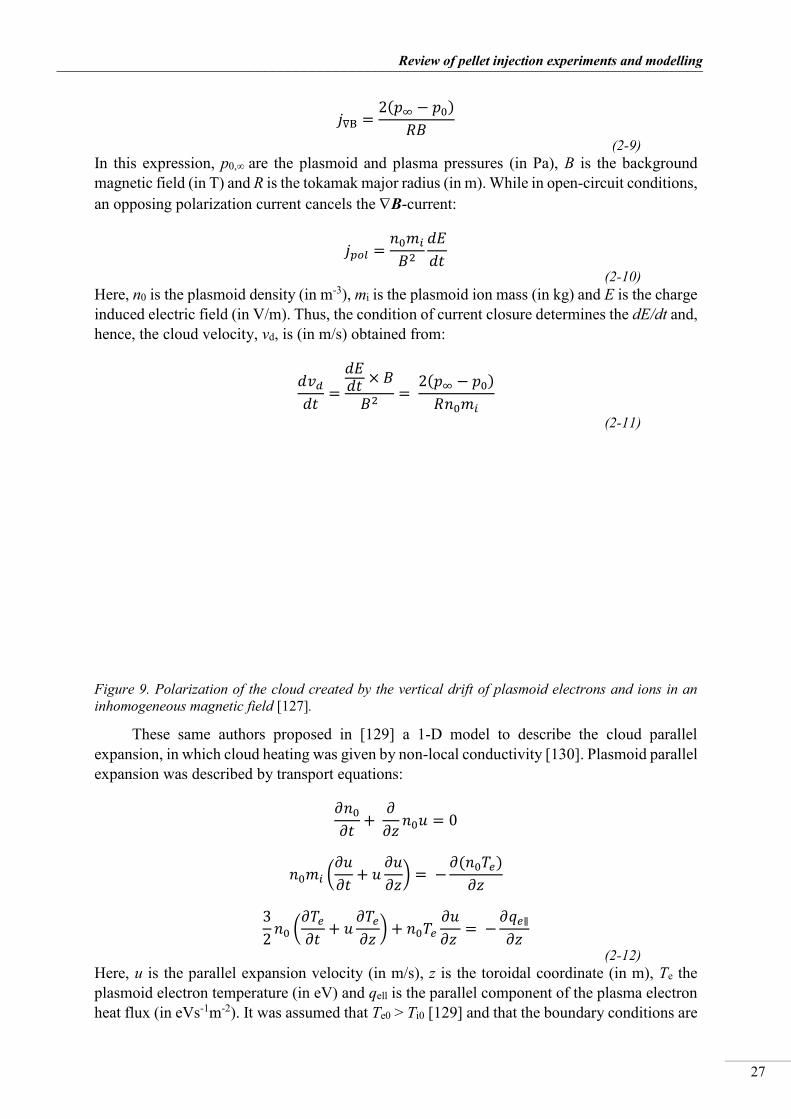
_________________________________________________________________________________
Review of pellet injection experiments and modelling
27
𝑗∇B =2(𝑝∞ − 𝑝0)
𝑅𝐵
(2-9) In this expression, p0,∞ are the plasmoid and plasma pressures (in Pa), B is the background magnetic field (in T) and R is the tokamak major radius (in m). While in open-circuit conditions, an opposing polarization current cancels the B-current:
𝑗𝑝𝑜𝑙 =𝑛0𝑚𝑖
𝐵2
𝑑𝐸
𝑑𝑡
(2-10) Here, n0 is the plasmoid density (in m-3), mi is the plasmoid ion mass (in kg) and E is the charge induced electric field (in V/m). Thus, the condition of current closure determines the dE/dt and, hence, the cloud velocity, vd, is (in m/s) obtained from:
𝑑𝑣𝑑
𝑑𝑡=
𝑑𝐸𝑑𝑡
× 𝐵
𝐵2=
2(𝑝∞ − 𝑝0)
𝑅𝑛0𝑚𝑖
(2-11)
Figure 9. Polarization of the cloud created by the vertical drift of plasmoid electrons and ions in an inhomogeneous magnetic field [127].
These same authors proposed in [129] a 1-D model to describe the cloud parallel expansion, in which cloud heating was given by non-local conductivity [130]. Plasmoid parallel expansion was described by transport equations:
𝜕𝑛0
𝜕𝑡+
𝜕
𝜕𝑧𝑛0𝑢 = 0
𝑛0𝑚𝑖 (𝜕𝑢
𝜕𝑡+ 𝑢
𝜕𝑢
𝜕𝑧) = −
𝜕(𝑛0𝑇𝑒)
𝜕𝑧
3
2𝑛0 (
𝜕𝑇𝑒
𝜕𝑡+ 𝑢
𝜕𝑇𝑒
𝜕𝑧) + 𝑛0𝑇𝑒
𝜕𝑢
𝜕𝑧 = −
𝜕𝑞𝑒∥
𝜕𝑧
(2-12) Here, u is the parallel expansion velocity (in m/s), z is the toroidal coordinate (in m), Te the plasmoid electron temperature (in eV) and qell is the parallel component of the plasma electron heat flux (in eVs-1m-2). It was assumed that Te0 > Ti0 [129] and that the boundary conditions are

__________________________________________________________________________________
A study of the physics of pellet injection in magnetically confined plasma in stellarators
28
the density and the temperature in the unperturbed plasma. Different regimes were studied as a function of the plasma temperature.
Pégourié proposed in [131] a two-cell four-fluid Lagrangian model, derived from [110], where density and temperature were assumed to be constant (see Figure 10). In this model, the compression of the plasma by the expanding plasmoid was taken into account, along with the expansion by the viscosity forces that develop at the cloud-plasma interface. In addition, the increment in the cloud lateral surface due to magnetic shear (see Figure 11) was considered, as well as the increase of the inertia of the system from the plasma that is put into motion by the expanding plasmoid. Furthermore, in this model, the plasma potential perturbation was attributed to the fact that the temperature difference between plasma and plasmoid vanishes faster than the difference in density. Therefore, electrons propagate much faster than ions for a given temperature and so leave the cloud, which is positively charged, whereas the plasmoid is negatively charged.
Figure 10. Geometry used in reference [131] to compute the expansion dynamics of the plasmoid (containing a number of electrons and ions, e0 and i0 respectively) in a flux tube of length Lφ (containing a number of electrons and ions, e∞ and i∞ respectively). Z0 is the length of half-plasmoid, while La and Lb are plasmoid dimensions in radial and poloidal directions, respectively. B indicates the direction of the magnetic field. L||and L are the parallel and the perpendicular to the poloidal symmetry plane surfaces of the plasmoid.
Figure 11. Transformation of the plasmoid surface parallel to the poloidal plane of symmetry from an initial rectangular shape to a parallelogram shape due to shear during plasmoid expansion [131].
Later, Parks et al. developed a one-dimensional Lagrangian model [132] for the plasmoid parallel expansion in which the heating of the cloud was obtained from kinetic calculations of the energy deposited by incident electrons. It was shown that pressure equilibration is rapid, and much faster than temperature equilibration. Moreover, the coupling between the cloud expansion, which causes pressure relaxation, and the drift was studied. Hence, the resultant drift velocity is determined by the balance between the compensation of the curvature current by the polarization current, which is a driving term, and Alfvén wave emission from both ends of the cloud, which reduces the drift. Strauss and Parks also proposed a plasmoid drift model. In this
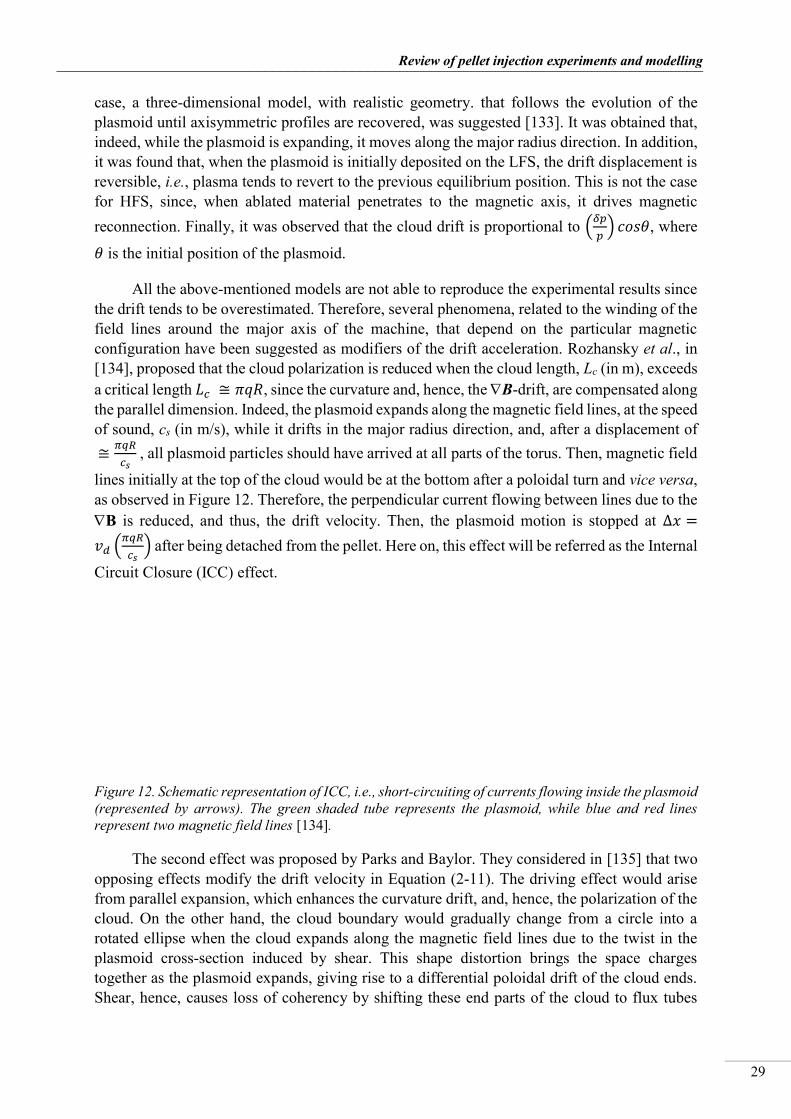
_________________________________________________________________________________
Review of pellet injection experiments and modelling
29
case, a three-dimensional model, with realistic geometry. that follows the evolution of the plasmoid until axisymmetric profiles are recovered, was suggested [133]. It was obtained that, indeed, while the plasmoid is expanding, it moves along the major radius direction. In addition, it was found that, when the plasmoid is initially deposited on the LFS, the drift displacement is reversible, i.e., plasma tends to revert to the previous equilibrium position. This is not the case for HFS, since, when ablated material penetrates to the magnetic axis, it drives magnetic reconnection. Finally, it was observed that the cloud drift is proportional to (𝛿𝑝
𝑝) 𝑐𝑜𝑠𝜃, where
𝜃 is the initial position of the plasmoid.
All the above-mentioned models are not able to reproduce the experimental results since the drift tends to be overestimated. Therefore, several phenomena, related to the winding of the field lines around the major axis of the machine, that depend on the particular magnetic configuration have been suggested as modifiers of the drift acceleration. Rozhansky et al., in [134], proposed that the cloud polarization is reduced when the cloud length, Lc (in m), exceeds a critical length 𝐿𝑐 ≅ 𝜋𝑞𝑅, since the curvature and, hence, the B-drift, are compensated along the parallel dimension. Indeed, the plasmoid expands along the magnetic field lines, at the speed of sound, cs (in m/s), while it drifts in the major radius direction, and, after a displacement of ≅
𝜋𝑞𝑅
𝑐𝑠 , all plasmoid particles should have arrived at all parts of the torus. Then, magnetic field
lines initially at the top of the cloud would be at the bottom after a poloidal turn and vice versa, as observed in Figure 12. Therefore, the perpendicular current flowing between lines due to the B is reduced, and thus, the drift velocity. Then, the plasmoid motion is stopped at Δ𝑥 =
𝑣𝑑 (𝜋𝑞𝑅
𝑐𝑠) after being detached from the pellet. Here on, this effect will be referred as the Internal
Circuit Closure (ICC) effect.
Figure 12. Schematic representation of ICC, i.e., short-circuiting of currents flowing inside the plasmoid (represented by arrows). The green shaded tube represents the plasmoid, while blue and red lines represent two magnetic field lines [134].
The second effect was proposed by Parks and Baylor. They considered in [135] that two opposing effects modify the drift velocity in Equation (2-11). The driving effect would arise from parallel expansion, which enhances the curvature drift, and, hence, the polarization of the cloud. On the other hand, the cloud boundary would gradually change from a circle into a rotated ellipse when the cloud expands along the magnetic field lines due to the twist in the plasmoid cross-section induced by shear. This shape distortion brings the space charges together as the plasmoid expands, giving rise to a differential poloidal drift of the cloud ends. Shear, hence, causes loss of coherency by shifting these end parts of the cloud to flux tubes

__________________________________________________________________________________
A study of the physics of pellet injection in magnetically confined plasma in stellarators
30
outside the influence of the electrostatic shielding. Under these circumstances, these parts of the plasmoids do not participate in the coherent drift motion. Therefore, the outside elements are peeled off and deposited in the plasma.
Finally, Pégourié et al. proposed a model in which the finite size of the plasma was taken into account [136]. A difference in potential between the two extremities of the flux tube results from the rotational transform and the winding of the field lines around the major axis of the torus. The potential distribution, associated with the plasmoid polarization, invades very rapidly the whole toroidal shell in which the plasmoid is located, since Alfvén waves propagate much faster than the pressure expansion. Hence, flux tubes of opposite polarization become overlapped, i.e. for a part of the cloud cross-section, some field lines connect, through the plasma, regions of opposite polarization. Therefore, cloud polarization is reduced, as is the drift velocity. From this point forward, this effect will be denoted as the External Circuit Closure (ECC) effect.
The influence of low-order rational q surfaces on the deposition profile was studied in [41]. The relation between q and deposition profiles is explained by the dependence of the drift displacement on magnetic-field lines connection length, which in turns depend on the local value of the q factor. Indeed, in the vicinity of q-rational values, where the connection length is significantly reduced, the ECC mechanism is more efficient in reducing the value of the drift acceleration. This implies that ablated material tends to be further accumulated near these rational surfaces. Considering this, the drift acceleration is given by:
𝑑𝑣𝑑
𝑑𝑡=
1
1 + (1 − 𝑃𝐴𝑙𝑓 − 𝑃𝑐𝑜𝑛) (𝐿𝑐𝑜𝑛′ 𝑛∞
𝑍0𝑛0)
× [2(𝑝0 − 𝑝∞)
𝑛0𝑚𝑖𝑅−
𝑣𝑑𝐵∞2
𝑛0𝑚𝑖𝑍0]
×
[
𝑃𝐴𝑙𝑓
2
𝜇0𝑣𝐴+ 𝑃𝑐𝑜𝑛
[1 − 𝑒−
𝑡𝜏𝑐𝑜𝑙𝑙𝑒 +𝜏𝑠𝑒𝑙𝑓] 𝜋𝑅0
2𝜎∥∞
𝐿𝑐𝑜𝑛
]
(2-13) Here, R0 and Z0 are plasmoid radius and parallel length, respectively (all in m); R is the plasmoid location in major radius coordinates (m), and B∞ is the background magnetic field (in T). μ0 is the vacuum permeability (4πx10-7 Wb/A), vA (in m/s) is the Alfvén speed, defined as 𝑣𝐴 ≡
𝐵∞
√𝑛∞𝜇0𝑚𝑖; and σ||∞ is the external plasma conductivity (in Ω-1m-1). Lcon, (in m) is the flux tube
effective length, different from L’con (in m), which is the flux tube length. On the other hand, Pcon is the fraction of the cloud cross-section for which connection between regions of opposite polarization happens, whereas PAlf is the fraction for which the potential propagates along the cloud at Alfvén speed. Finally, 𝜏𝑐𝑜𝑙𝑙
𝑒 is the electron collision time, while 𝜏𝑠𝑒𝑙𝑓 is the ratio between the self-inductance and the resistance of the equivalent circuit formed by the connecting flux tubes (both in s). It was shown that, since integer q-surfaces are characterized
_________________________________________________________________________________
Review of pellet injection experiments and modelling
31
by small values of con and Lcon, the plasmoid drift is more efficiently reduced and, therefore, integer q-surfaces act as drift barriers [41].
All the proposed effects, outlined above, have been compared with experimental results from different devices. In the next subsection, these comparisons, and conclusions extracted, are reviewed.
2.4.1. Comparison with experimental results
All homogenization models mentioned in the previous subsection have been compared with measurements done on several tokamaks. For instance, Rozhansky’s first model of the plasmoid time evolution and drift in [127, 128] was compared with experimental results in [60]. The results of the simulations carried out by the group reproduced the experimentally observed shift of the deposited material outwards along the plasma major radius with respect to ablation. In addition, striations observed with CCD cameras were explained by this model. The calculations of the model proposed by the same group in [129] to describe parallel expansion, carried out for present-day tokamaks plasma temperatures, reproduced qualitatively the observations for TFTR [137]. Pégourié’s Lagrangian model of the plasmoid temporal-evolution [131] was compared with Tore Supra experimental results. Post-injection density profiles predicted by the model agreed well with measurements done for a wide range of experimental conditions. In addition, predictions compared well with density increments measured on TFTR [82, 137]. Moreover, potential perturbations observed in HL-1M [88] using probes qualitatively agreed with model predictions. However, experimental results for JIPPT-IIU [138, 139] cannot be reproduced by this model. The model developed by Parks et al. [130] explaining plasmoid parallel expansion and the coupling between plasmoid expansion and drift was compared with DIII-D experimental results. Theoretical predictions were found to be consistent with density measurements. The simulations carried out with the Strauss and Parks drift model [133] were in accord with experimental observations done in several devices. Finally, the different mechanisms proposed as ExB-drift modifiers were contrasted with several measurements. The drift predicted when the ICC effect, i.e., short-circuiting of internal currents [140], was compared with the drift measured on DIII-D [71] and ASDEX-U [141], and was found to be four times larger than the experimental ones. Considering the critical length as a free parameter to correct errors coming from the fact that jB compensation is a three-dimensional phenomenon, which is simplified in the model, resulted in predictions that were in qualitatively agreement with post-injection density profiles from ASDEX-U. Calculations carried out considering the effects proposed by Parks and Baylor [135] were compared with pellet injection results from DIII-D. It was shown that the predicted dispersion of cloud material is necessary to obtain a qualitatively agreement between both results. Lastly, simulation results including the ECC effect were compared with experimental results from JET, T-10, DIII-D and Tore Supra [136]. The agreement between measurements and calculations was reasonable. However, when compared with observations from FTU, it was found that some individual cases presented a simulated deposition profile narrower than the experimental one. Simulations taking into account the effect of integer q-surfaces were compared with experimental results from DIII-D and Tore Supra [41]. It was seen that the calculations reasonably reproduced the measured total drift displacement. However, it was observed that the effect of low-order rational surfaces could be underestimated for HFS injections. In addition, a q-profile scan was performed in Tore Supra and compared with simulations obtained with the Hydrogen Pellet Injection (HPI2) code [142],
__________________________________________________________________________________
A study of the physics of pellet injection in magnetically confined plasma in stellarators
32
which is able to describe the ablation (with an enhanced version of the NGPS model) and the subsequent material deposition of the ablated material considering the drift damping effects outlined in Section 2.4, i.e., damping produced by Alfvén wave emission [132], internal currents [134] and external currents flowing along magnetic field lines [136, 143]. It was observed that the final drift position depends on the q-profile, a fact that is well reproduced by simulations carried out with the HPI2 code. Because of the HPI2 ability to reproduced experimental results, it is a reference code for tokamaks.
From all the results reviewed above, it can be concluded that it is necessary to include all the proposed mechanisms to correctly estimate the plasmoid drift and, hence, the deposition profiles. Otherwise, drifts are under- or overestimated.
2.4.2. Additional points for non-axisymmetric devices
The main phenomena responsible for the parallel expansion of the plasmoid and its drift down magnetic field gradient are well known. However, all the models and the experimental results that have been mentioned to this point are for tokamaks. The fact that the drift mechanisms depend on the magnetic configuration means that the resultant drift may be different for non-axisymmetric devices. Indeed, experimental results from the Large Helical Device (LHD) showed that HFS injection does not have the beneficial inwards drift observed in tokamaks. Having this in mind, a set of simulations was carried out by R. Ishizaki and N. Nakajima [144]. Results confirmed that plasmoid motion is different for tokamaks and LHD configurations. It was found that different connection lengths determine the dominant force in the plasmoid drift, and that this may explain the different observations in tokamaks and LHD. Later, A. Matsuyama et al. extended the already mentioned HPI2 code to non-axisymmetric configurations and performed a series of simulations focussed on the mechanisms responsible for the direction and magnitude of the drift motion of plasmoids [43]. Here, the ExB-drift for an arbitrary magnetic field geometry was inferred:
𝑗∇𝐵 =2(𝑝0 − 𝑝∞)𝐵∞ × ∇𝐵∞
𝐵∞3
(2-14)
𝑗𝑝𝑜𝑙 =𝑛0𝑚𝑖
𝐵∞2
𝑑𝐸
𝑑𝑡
(2-15) From the condition 𝑗∇𝐵 + 𝑗𝑝𝑜𝑙 = 0, the electric field time derivative is deduced, and hence the drift velocity is:
𝑑𝑣𝑑
𝑡=
𝑑 (𝐸 × 𝐵∞
𝐵∞2 )
𝑑𝑡= −
2(𝑝0 − 𝑝∞)∇⊥𝐵∞
𝑛0𝑚𝑖𝐵∞
(2-16) According to Equation (2-16), acceleration is proportional to the inverse magnitude of
the magnetic field gradient length, 𝐿𝐵 =𝐵∞
|∇⊥𝐵∞|, and it vanishes when plasma and plasmoid
pressures are equilibrated.
For a non-axisymmetric configuration, which is the case of LHD, the magnetic field structure is fully three-dimensional. Therefore, the drift acceleration has an additional
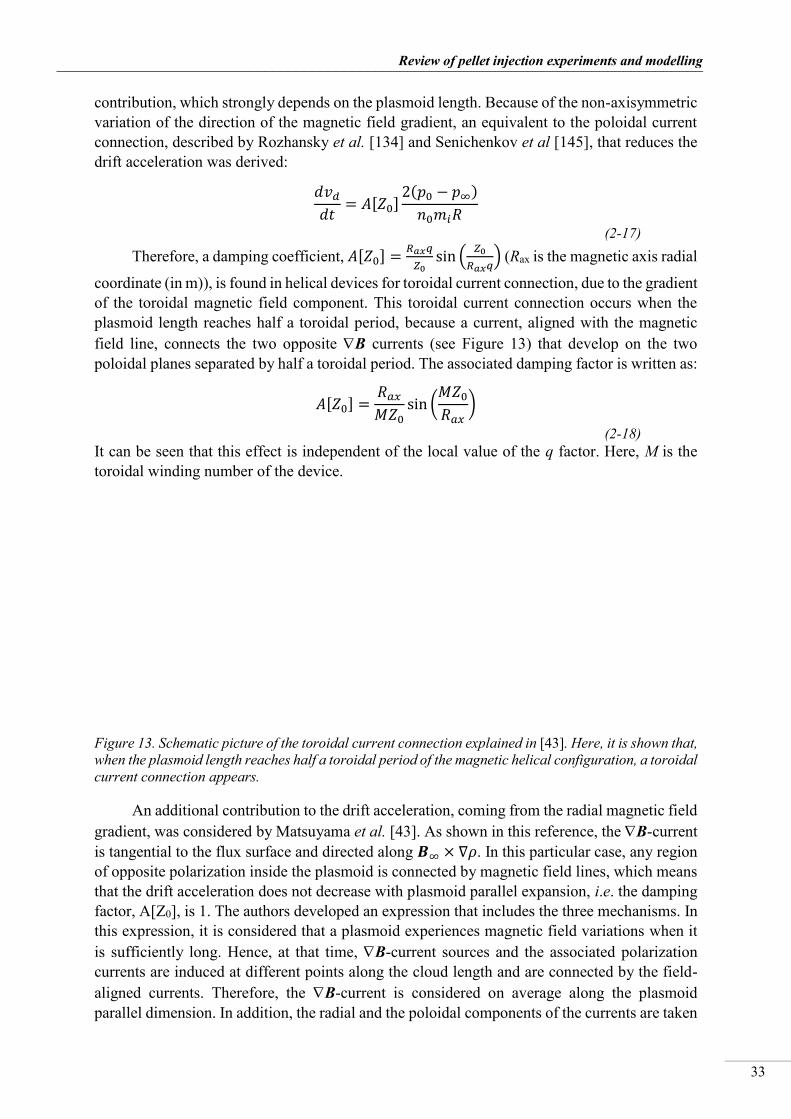
_________________________________________________________________________________
Review of pellet injection experiments and modelling
33
contribution, which strongly depends on the plasmoid length. Because of the non-axisymmetric variation of the direction of the magnetic field gradient, an equivalent to the poloidal current connection, described by Rozhansky et al. [134] and Senichenkov et al [145], that reduces the drift acceleration was derived:
𝑑𝑣𝑑
𝑑𝑡= 𝐴[𝑍0]
2(𝑝0 − 𝑝∞)
𝑛0𝑚𝑖𝑅
(2-17) Therefore, a damping coefficient, 𝐴[𝑍0] =
𝑅𝑎𝑥𝑞
𝑍0sin (
𝑍0
𝑅𝑎𝑥𝑞) (Rax is the magnetic axis radial
coordinate (in m)), is found in helical devices for toroidal current connection, due to the gradient of the toroidal magnetic field component. This toroidal current connection occurs when the plasmoid length reaches half a toroidal period, because a current, aligned with the magnetic field line, connects the two opposite B currents (see Figure 13) that develop on the two poloidal planes separated by half a toroidal period. The associated damping factor is written as:
𝐴[𝑍0] =𝑅𝑎𝑥
𝑀𝑍0sin (
𝑀𝑍0
𝑅𝑎𝑥)
(2-18) It can be seen that this effect is independent of the local value of the q factor. Here, M is the toroidal winding number of the device.
Figure 13. Schematic picture of the toroidal current connection explained in [43]. Here, it is shown that, when the plasmoid length reaches half a toroidal period of the magnetic helical configuration, a toroidal current connection appears.
An additional contribution to the drift acceleration, coming from the radial magnetic field gradient, was considered by Matsuyama et al. [43]. As shown in this reference, the B-current is tangential to the flux surface and directed along 𝑩∞ × ∇𝜌. In this particular case, any region of opposite polarization inside the plasmoid is connected by magnetic field lines, which means that the drift acceleration does not decrease with plasmoid parallel expansion, i.e. the damping factor, A[Z0], is 1. The authors developed an expression that includes the three mechanisms. In this expression, it is considered that a plasmoid experiences magnetic field variations when it is sufficiently long. Hence, at that time, B-current sources and the associated polarization currents are induced at different points along the cloud length and are connected by the field-aligned currents. Therefore, the B-current is considered on average along the plasmoid parallel dimension. In addition, the radial and the poloidal components of the currents are taken
__________________________________________________________________________________
A study of the physics of pellet injection in magnetically confined plasma in stellarators
34
into account independently, since they are not connected with each other. From the average of the short-circuit condition 𝑗∇𝐵 + 𝑗𝑝𝑜𝑙 = 0, it was obtained:
2(𝑝0 − 𝑝∞)⟨𝐽𝜌⟩ + 𝑛0𝑚𝑖⟨𝐵∞2 ⟩
𝑑𝐸𝜌
𝑑𝑡= 0
(2-19)
2(𝑝0 − 𝑝∞)⟨𝐽𝛼⟩ + 𝑛0𝑚𝑖⟨𝐵∞2 ⟩
𝑑𝐸𝛼
𝑑𝑡= 0
(2-20)
Here, Jρ,α are the geometric projections of the B currents in the ρ- and α- directions:
𝐽𝜌,𝛼 =�⃗⃗� × ∇𝐵∞ · 𝑒𝜌,𝛼
𝐵∞2
(2-21) Solving Equations (2-19) and (2-20), the two components of the plasmoid drift are obtained:
𝑑𝑣𝑑𝜌
𝑑𝑡= −
2(𝑝0 − 𝑝∞)⟨𝐽𝛼⟩
𝑛0𝑚𝑖⟨𝐵∞⟩ ⟨𝐵∞−2⟩
𝑑𝑣𝑑𝛼
𝑑𝑡=
2(𝑝0 − 𝑝∞)⟨𝐽𝜌⟩
𝑛0𝑚𝑖⟨𝐵∞⟩ ⟨𝐵∞−2⟩
(2-22)
This model was included in the HPI2 code and compared with LHD experimental results from pellet injections into NBI-heated plasmas from both LFS and HFS [43, 73]. The predictions agreed well with the measured pellet penetrations and deposition profiles. However, plasmoid drifts for HFS injection were not well understood.
To date, LHD is the only non-axisymmetric device whose pellet injection results have been compared with material drift theoretical predictions. Therefore, due to the critical importance of pellet injection and material deposition for steady-state operation, particularly for helical devices, further theoretical studies are vital, so the difference in drift mechanisms with respect to tokamaks can be determined. A new version of the HPI2 code, developed for W7-X, is used in this work to study pellet ablation and material deposition in the TJ-II and W7-X. This version considers all the drift mechanisms described in Section 2.4. In addition, it includes a generalized calculation of the exact magnetic and geometric quantities. Moreover, the magnetic field variation along plasmoid length (parallel to magnetic field lines) is taken into account, although in a simplified manner. A detailed description of the mechanisms considered in this stellarator version of the code is given in Section 5.2.
2.5. PRESENT STATUS The physics underlying pellet ablation is well understood and current models are able to
reproduce experimental penetration depths and ablation profiles for both tokamaks and stellarators. Hence, the physical mechanisms are the same for both type of devices. However, the situation is different regarding material homogenization. Even though the processes of plasmoid expansion and drift are well understood for tokamaks and simulation results agree satisfactorily with measurements done in several of these devices, the mechanisms responsible for the drift of the plasmoid in non-axisymmetric devices are not fully understood. That fact
_________________________________________________________________________________
Review of pellet injection experiments and modelling
35
that the magnetic field is completely three-dimensional and the related average effects make the analysis of the experimental results more difficult than in the case of tokamaks, along with the fact that the number of helical devices where pellet injection experiments have been carried out is reduced, do not help to improve the disadvantageous situation of stellarators. Further experimental studies are thus of vital importance to accomplish the necessary understanding, and to benchmark the available codes, or to create new ones, that allow achieving density profiles and values required to prove that stellarators are a solid, or even better, alternative to tokamaks in the path to attained thermonuclear fusion as an energy source. Moreover, when a complete understanding of the dependence of drift mechanisms on the magnetic configuration is achieved, it will be possible to take advantage of this dependence and use it to optimize the material penetration and deposition profile, also for tokamaks, like ITER or DEMO.
A pellet injector has been recently installed in the stellarator TJ-II, where several penetration and fuelling studies have been carried out during the elaboration of this thesis. The results of this research will help enlighten some of the pending issues of pellet injection processes in stellarators. In addition, pellet injection studies have been performed for the recently commissioned stellarator Wendelstein 7-X. Simulations have been carried out during the progress of this work, which will help to understand the dependence on injection location in stellarators and to optimize the injection into W7-X plasmas. Moreover, theoretical studies and simulations have been carried out for ITER pellet injector using the same code used for W7-X, the already mentioned HPI2 code [146, 147]. ITER will rely on pellet injection to achieve the high density that will permit it to reach its fusion power objective. Due to the high plasma temperature, shallow penetration is expected. Thus, the required material penetration will be only achieved by taking advantage of the material drift. Hence, any improvement in the understanding of drift mechanisms and the dependence on the magnetic configuration and the injection location will help ITER in its task of proving the feasibility of fusion.

__________________________________________________________________________________
A study of the physics of pellet injection in magnetically confined plasma in stellarators
36
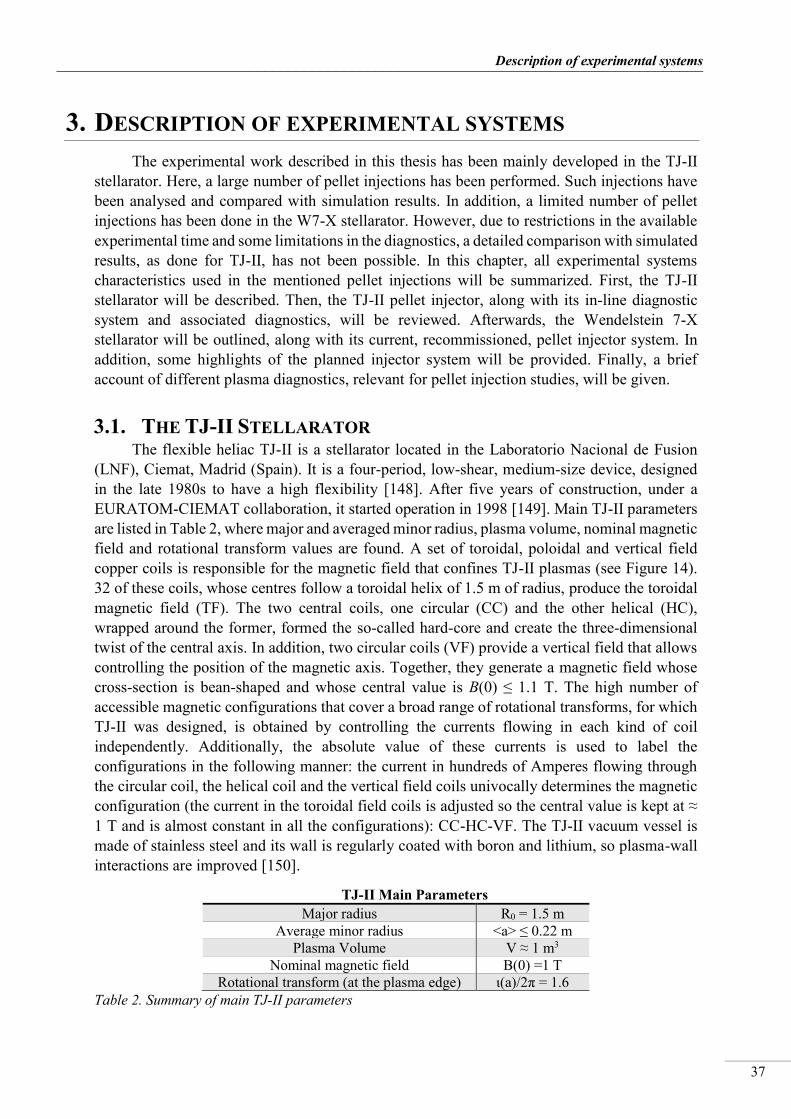
_________________________________________________________________________________
Description of experimental systems
37
3. DESCRIPTION OF EXPERIMENTAL SYSTEMS The experimental work described in this thesis has been mainly developed in the TJ-II
stellarator. Here, a large number of pellet injections has been performed. Such injections have been analysed and compared with simulation results. In addition, a limited number of pellet injections has been done in the W7-X stellarator. However, due to restrictions in the available experimental time and some limitations in the diagnostics, a detailed comparison with simulated results, as done for TJ-II, has not been possible. In this chapter, all experimental systems characteristics used in the mentioned pellet injections will be summarized. First, the TJ-II stellarator will be described. Then, the TJ-II pellet injector, along with its in-line diagnostic system and associated diagnostics, will be reviewed. Afterwards, the Wendelstein 7-X stellarator will be outlined, along with its current, recommissioned, pellet injector system. In addition, some highlights of the planned injector system will be provided. Finally, a brief account of different plasma diagnostics, relevant for pellet injection studies, will be given.
3.1. THE TJ-II STELLARATOR The flexible heliac TJ-II is a stellarator located in the Laboratorio Nacional de Fusion
(LNF), Ciemat, Madrid (Spain). It is a four-period, low-shear, medium-size device, designed in the late 1980s to have a high flexibility [148]. After five years of construction, under a EURATOM-CIEMAT collaboration, it started operation in 1998 [149]. Main TJ-II parameters are listed in Table 2, where major and averaged minor radius, plasma volume, nominal magnetic field and rotational transform values are found. A set of toroidal, poloidal and vertical field copper coils is responsible for the magnetic field that confines TJ-II plasmas (see Figure 14). 32 of these coils, whose centres follow a toroidal helix of 1.5 m of radius, produce the toroidal magnetic field (TF). The two central coils, one circular (CC) and the other helical (HC), wrapped around the former, formed the so-called hard-core and create the three-dimensional twist of the central axis. In addition, two circular coils (VF) provide a vertical field that allows controlling the position of the magnetic axis. Together, they generate a magnetic field whose cross-section is bean-shaped and whose central value is B(0) ≤ 1.1 T. The high number of accessible magnetic configurations that cover a broad range of rotational transforms, for which TJ-II was designed, is obtained by controlling the currents flowing in each kind of coil independently. Additionally, the absolute value of these currents is used to label the configurations in the following manner: the current in hundreds of Amperes flowing through the circular coil, the helical coil and the vertical field coils univocally determines the magnetic configuration (the current in the toroidal field coils is adjusted so the central value is kept at ≈ 1 T and is almost constant in all the configurations): CC-HC-VF. The TJ-II vacuum vessel is made of stainless steel and its wall is regularly coated with boron and lithium, so plasma-wall interactions are improved [150].
TJ-II Main Parameters Major radius R0 = 1.5 m
Average minor radius <a> ≤ 0.22 m Plasma Volume V ≈ 1 m3
Nominal magnetic field B(0) =1 T Rotational transform (at the plasma edge) ι(a)/2π = 1.6
Table 2. Summary of main TJ-II parameters

__________________________________________________________________________________
A study of the physics of pellet injection in magnetically confined plasma in stellarators
38
Figure 14. Artistic TJ-II model, where the sets of poloidal, toroidal and vertical coils are shown in blue, the helical coil in yellow, the plasma in purple, and some of the viewports in grey. http://fusionwiki.ciemat.es/wiki/File:TJII_model.jpg
TJ-II possesses two different heating methods: the Electron Cyclotron Resonance Heating (ECRH) and the Neutral Beam Injection (NBI) systems. The two gyrotrons that constitute the ECRH system operate at 53.2 GHz, the second harmonic of the electron cyclotron resonance frequency, in the X-mode [151]. Each of them is able to inject < 250 kW from the outboard side of the vessel for a discharge time of ≤ 140 ms [152]. On the other hand, the two tangential NBI injectors allow for ≤ 300 ms pulses of accelerated neutral hydrogen (ENBI ≤ 34 keV, PNBI ≤ 0.7 MW), one of them parallelly to the magnetic field (NBI 1, co-injection), while the other in the opposite direction (NBI 2, counter-injection), as observed in Figure 15. During normal TJ-II operation, plasmas are created by means of ECR-heating and, in some cases, further heated with NBI. Central electron plasma densities achieved during the ECRH phase are ne(0) ≤ 6x10¹⁸ m-3, while central electron and ion temperatures are Te (0) ≤ 2 keV and Ti(0) ≈ 80-100 eV, respectively. NBI heating results in higher central densities, ne(0) ≤ 5x10¹⁹ m-3, but lower central electron temperatures, Te(0) ≤ 400 eV, while the ion temperatures are slightly higher, Ti(0) ≈ 140 eV. However, plasmas can also be created and maintained by the injection of neutral beams only. In this particular operational mode, the plasma is generated by one neural beam and the initial toroidal electric fields, induced when coil currents increase during the ramp-up. Attained densities and temperatures are similar to those obtained with normal operation during the NBI-heating phase when a lithium coating is applied to the inner wall of the vacuum vessel [153].
Figure 15. TJ-II vacuum vessel and access ports (in yellow), together with the two NBI injectors (in grey). On the left, NBI 1 is found, while NBI 2 is on the right. http://www.fusion.ciemat.es/files/2014/01/tjiiNBI.png

_________________________________________________________________________________
Description of experimental systems
39
During TJ-II experimental campaigns, hydrogen, deuterium and helium can be used as working gas, though, for this particular work, only hydrogen plasmas have been studied. Working gas fuelling is usually accomplished by a set of piezoelectric valves and driven by pre-programmed voltage signals. These valves, toroidally distributed around the whole vacuum vessel, provides ≤ 3.5x10¹⁹ particles/s. These signal profiles are mainly defined by the desired density inside the vacuum vessel. The system provides both the pre-filling before the discharge, and active fuelling during it to maintain the plasma density profile [154].
3.2. TJ-II PELLET INJECTOR AND ASSOCIATED DIAGNOSTICS The pellet injection system operating in TJ-II since 2014 is a four-barrel pipe gun device
with a cryogenic refrigerator for in-situ pellet formation (10 K), fast propellant valves for pellet acceleration (velocities between 800 m/s and 1200 m/s can be achieved) and straight delivery lines. This system, which will be used during all the experiments discussed in this work, is described, together with the two key diagnostics found along the injection lines, which provide timing signals, one of them proportional to the mass of the pellet. In addition, TJ-II pellet injection system has two associated diagnostics that are described after the in-line diagnostics, a photodiode light detection system and an ultra-fast CMOS camera.
3.2.1. Pellet injector and in-line diagnostics The pellet injector (PI) operating in TJ-II is the result of a collaboration between Oak
Ridge National Laboratory (ORNL), Tennessee, USA and the Laboratorio Nacional de Fusión, Ciemat. The type of pellet injector chosen for TJ-II is one class of ORNL injectors referred as “pellet injector in a suitcase” because of its compact size, which makes it relatively easy to relocate [155]. Designed to provide a flexible means of plasma fuelling on a wide range of devices, it is ideally suited for the TJ-II applications [156–158]. The prototype, a pipe gun device with a four-barrel capability and a cryogenic refrigerator for in situ pellet formation, was installed on the Madison Symmetric Torus (MST) in early 2002 [159]. In this ORNL-Ciemat collaboration, ORNL provided most of the hardware and instrumentation, the in-line pellet diagnostics and pellet transport tubes; thus, pellet formation, acceleration, guide-line diagnostics, delivery and control systems were developed, built and tested at the laboratories of the Fusion Energy Division of the ORNL. Whereas, on the other hand, Ciemat provided the injector stand/interfaced to the stellarator, the cryogenic refrigerator, vacuum pumps and ballast volumes; the gas manifolds, remote operations, plasma diagnostics and data acquisition systems [158].
Pellet type
Nominal Diameter (mm)
Nominal Length (mm)
Nominal Volume (mm3)
Mass (mg)
Particle content (H atoms)
1 0.42 0.42 0.058 0.005 3.08x10¹⁸
2 0.66 0.66 0.226 0.02 1.20x10¹⁹ 3 0.76 0.76 0.345 0.03 1.83x10¹⁹
4 1.00 1.00 0.785 0.069 4.16x10¹⁹
Table 3. Summary of nominal characteristics of TJ-II pellets.
In order to increase the flexibility of the system, different pellet sizes were chosen for each of the four barrels. For that, a NGS pellet ablation code was used to estimate the necessary particle content and the velocity of the pellet. As a result, gun barrel bores of 0.42 mm (Type-1 pellet), 0.66 mm (Type-2 pellet), 0.76 mm (Type-3 pellet) and 1 mm (Type-4 pellet) were selected. Small cylindrical pellets (Types-1 and -2, containing ≤ 4x10¹⁸ and ≤ 1.2x10¹⁹
__________________________________________________________________________________
A study of the physics of pellet injection in magnetically confined plasma in stellarators
40
hydrogen atoms, respectively) are necessary for experiments in which the gyrotron cut-off density limit (~ 1.7x10¹⁹ m-3), and so plasma collapse, must be avoided. Larger pellets (Types-3 and -4, containing ≤ 1.8x10¹⁹ and ≤ 4.1x10¹⁹ H atoms, respectively) are used to penetrate deeper into high-density NBI-heated plasmas. The NGS code also predicted that pellets should be accelerated to several times 102 m/s for good penetration [157]. Nominal pellet parameters are reviewed in Table 3. The TJ-II PI system consists of a gun box where pellets are created and a gas propellant system for pellet acceleration (see Figure 16). In addition, the four injection lines are equipped with two diagnostics that provide timing signals and allow for particle accountability [157, 160]. A single homogeneous pellet is frozen in each stainless-steel gun barrel. Since the triple point of hydrogen is 13.9 K, pipe guns must operate at temperatures lower than 10 K to reliably form and accelerate solid pellets. For that, a double-stage cryogenic cooler (model Coolpower 10MD by Leybold Vacuum GmbH, Cologne, Germany), with cooling capability up to 4 W at 10 K is used; it allows four pellets to be created in sequence between TJ-II discharges (7 – 9 min) [157, 160]. Each barrel is attached to a copper assembly section that, in turn, joins to the cold head of the cryogenic refrigerator. Both the section of the barrels and the cold head are placed inside a vacuum vessel for thermal insulation. Additionally, each barrel is equipped with two thermal shorts, one downstream and other upstream the cryostat, to room-temperature injector walls to precisely limit the length of the freezing cell, by the temperature gradient [160]. The reduced size of TJ-II pellets requires the use of capillary-like tubes and specially designed gun barrels. For such small pellets, long length tubes are not practical; hence, 90 mm tubes, with the cryostat attached at the centre, are used [157, 160]. In order to create a single pellet, the gun barrel region and its associated volume (< 100 cm3) are filled to a pressure in the range of 5 to 50 torr, depending on the size of the pellet to be created (higher pressure is required for larger pellets) and isolated, while the cryostat is maintained at ~ 30 K with a 25 W heater. A gas manifold is used to supply the low-pressure gas (< 100 mbar) required to make a pellet. This gas manifold, as the one required for pellet acceleration that will be later mentioned, is equipped with remote controlled valves and the instrumentation to monitor and control pressure and valve levels. In particular, both gas manifolds consist of valves, pressure transducers, volumetric tanks and tubes to supply gas. Afterwards, the heater is turn off, and, when, the cryostat cools to 10 K, the gas freezes in the cold cell of the barrel, so the pellet, whose length is directly proportional to the pressure decrease in the isolated barrel volume, forms [157, 160].

_________________________________________________________________________________
Description of experimental systems
41
Figure 16. Cross-sectional sketch of the TJ-II vacuum chamber, magnetic surfaces, and the pellet injector. The relative locations of pellet Lines #1 through #4 are indicated with respect to the rear of the PI. Reproduced courtesy of IAEA. Figure from [2]. © 2017 Centro de Investigaciones Energéticas Medioambientales y Tecnológicas.
Once a pellet is created, a small isolated valve, situated downstream, is opened, so any residual hydrogen gas can be evacuated, and, after the propulsion system is activated, the pellet can be guided, through larger individual guide 1.5 mm-tubes, downstream. This acceleration system consists of four fast propellant valves, which operate with room-temperature hydrogen gas at ~70 bar provided by a high-pressure gas manifold, one for each guide tube. The amount of gas used for pellet acceleration can be adjusted by varying the pulse width of the trigger supplied to the solenoid valve (~1 to 3 ms) [157, 160]. Operation with close-couple valves in the four injection tubes was chosen due the lack of reliability of mechanical punches, owing to the extra heat load that the punch tip adds to the barrel. Close-couple valves have the additional advantage of allowing very precise pellet arrival times at the plasma, which should not vary more than a few hundred microseconds [160]. Pellets are accelerated to 800 – 1200 m/s; lower speeds correspond to smaller pellets, since the pressure on the base of small pellets cannot be kept as high as for the larger ones, due to higher pressure drop and, hence, lower gas flow, through the tubes with smaller bores. After acceleration, pellets travel through the guide tubes to the TJ-II vacuum vessel. These guide tubes are straight since, at such velocities, pellets will not survive the stress from centrifugal and impact forces associated to curves tubes [161]. The total distance that pellets travel from the freezing cell to the plasma centre is ~ 2.7 m (see Figure 16). These short and straight tubes have the advantage of maintaining mass losses due to friction at the minimum.
Injection lines are equipped with two key diagnostics through which pellets pass before reaching the TJ-II, as shown in Figure 16 [157, 160, 162]. The first one is a light gate that provides a timing signal. It consists on a light emitting diode and a light sensitive diode, forming a light barrier that procures a positive peak pulse when the pellet passes the light beam. This peak only facilitates timing information since it is merely approximately proportional to the pellet size due to random pellet orientation as it passes through the light gate. The second in-

__________________________________________________________________________________
A study of the physics of pellet injection in magnetically confined plasma in stellarators
42
line diagnostic is a microwave cavity that provides a mass-dependent timing signal, based on the fact that the pellet causes a perturbation in the cavity electric field, due to the dielectric perturbation of the pellet. Hence, measuring the frequency change due to the pellet, its mass can be determined. Assuming that the perturbation to the cavity electric field is small and that the power absorbed by the pellet can be neglected, the change in the resonance frequency, f, due to the pellet mass is expressed as [163]:
𝛥𝑓
𝑓=
−∫ ∫ ∫ (𝜀 − 𝜀0)|𝐸0||𝐸|𝑑𝑉𝛥𝑉
2∫ ∫ ∫ 𝜀0|𝐸0|2𝑑𝑉𝛥𝑉
(3-1) In this expression, E0 and E are the unperturbed and the perturbed electric fields in the cavity (in V/m), respectively. While ε0 is the vacuum dielectric constant and ε is the dielectric constant of the pellet. The electric field shape in the cavity depends on the operation mode of the cavity. The TJ-II PI microwave cavity is a single, toroidally shaped microwave cavity that simultaneously monitors all four injection lines, operated in the TEM001 toroidal cavity mode at a frequency of 10.92 GHz; this allows pellets in the range of 0.4 – 1 mm to be detected. In addition to the 10.92 GHz dielectric resonance oscillator (DRO) source, the microwave system consists of a Schottky barrier detector with low noise amplifier, low-loss coaxial cable, a vacuum flange with two coaxial microwave feedthroughs, and the vacuum spool piece that holds the cavity [160]. The microwave cavity gives a negative peak signal directly proportional to the pellet mass, with a 10 % accuracy, which is a key quantity for particle accountability in fuelling and deposition studies. This second timing signal, along with the signal from the light gate, allows accurately determining the speed of the pellet, knowing that the distance between two diagnostics is 0.585 m. In principle, the pellet speed could be estimated from analysis of the microwave cavity signal. Indeed, since the theoretical distribution of the electric field inside the cavity is cosine-shaped and the mass is proportional to the square of the electric field, the location in the cavity where the microwave signal is at half of its minimum value corresponds to the point in the cavity where the pellet has traversed one-quarter of its length. Therefore, the full-width at half-maximum (FWHM) of the microwave detector curve roughly corresponds to the location in the cavity where the pellet has travelled half microwave cavity length, which is 13.74 mm, i.e. FWHM length is 6.87 mm for the TJ-II microwave cavity; and, hence, the pellet speed can be estimated as the FWHM length divided by the FWHM time. However, the electric field distribution is slightly broader than a cosine distribution due to the penetration of the electric field into the pellet guide tubes, thus, speeds estimated from this analysis represent a lower limit [160].
In addition, a turbo molecular pump based vacuum system ensures that the system pressure is below 10-7 mbar so that the PI can be opened to the TJ-II vacuum chamber. Surge tanks, and gaps along the injection lines, ensure that the flow to the TJ-II chamber from the gas propulsion is minimal. First, a four-way vacuum cross provides vacuum flange ports that allow mounting the turbo- molecular pump and the first 25 L-surge tank. Downstream, a six-way cross is found; it provides mounts for the second 25 L-tank, a target plate mounted on vacuum linear manipulator and two viewports for visual access (see Figure 16). The target plate, a thin plate that can be lowered into and raised out of the line, provides a way for testing firing pellets when the mini-pneumatic gate valves on the TJ-II vacuum port are closed [157, 160].
Finally, a specially designed coupling system ensures a suitable interface between the PI and the TJ-II, so accelerated pellets can enter the vacuum vessel. It consists of four guides fitted
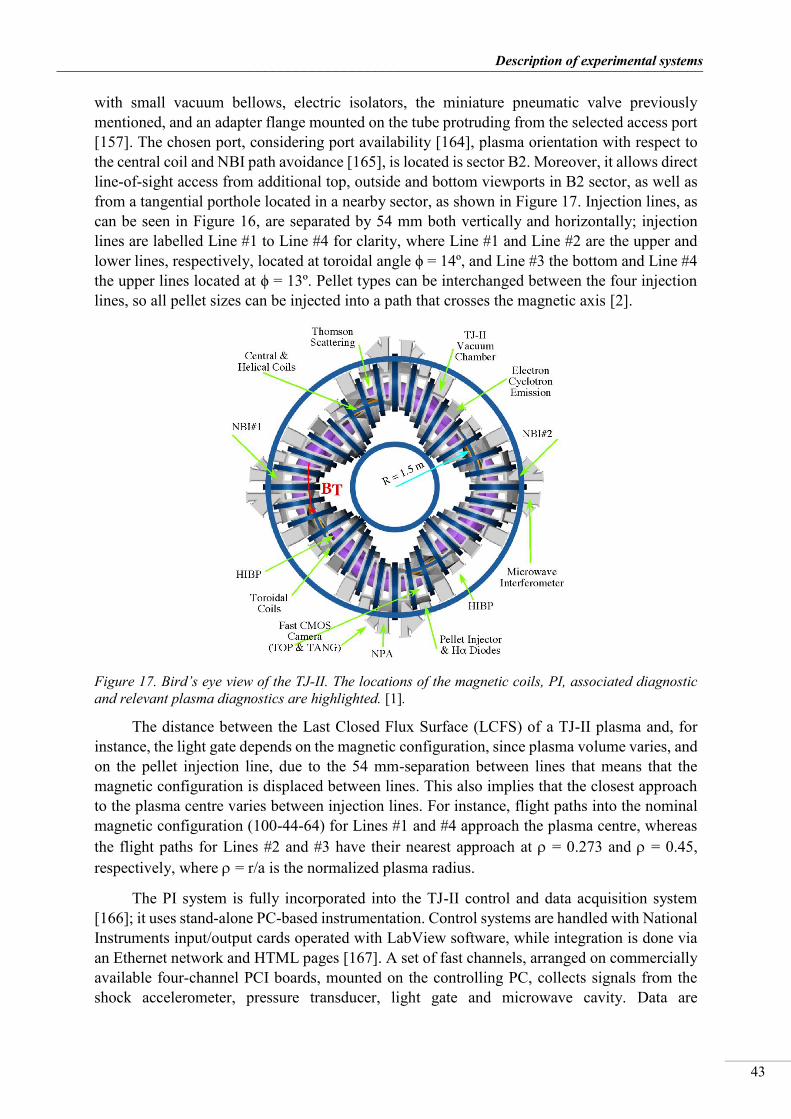
_________________________________________________________________________________
Description of experimental systems
43
with small vacuum bellows, electric isolators, the miniature pneumatic valve previously mentioned, and an adapter flange mounted on the tube protruding from the selected access port [157]. The chosen port, considering port availability [164], plasma orientation with respect to the central coil and NBI path avoidance [165], is located is sector B2. Moreover, it allows direct line-of-sight access from additional top, outside and bottom viewports in B2 sector, as well as from a tangential porthole located in a nearby sector, as shown in Figure 17. Injection lines, as can be seen in Figure 16, are separated by 54 mm both vertically and horizontally; injection lines are labelled Line #1 to Line #4 for clarity, where Line #1 and Line #2 are the upper and lower lines, respectively, located at toroidal angle ϕ = 14º, and Line #3 the bottom and Line #4 the upper lines located at ϕ = 13º. Pellet types can be interchanged between the four injection lines, so all pellet sizes can be injected into a path that crosses the magnetic axis [2].
Figure 17. Bird’s eye view of the TJ-II. The locations of the magnetic coils, PI, associated diagnostic and relevant plasma diagnostics are highlighted. [1].
The distance between the Last Closed Flux Surface (LCFS) of a TJ-II plasma and, for instance, the light gate depends on the magnetic configuration, since plasma volume varies, and on the pellet injection line, due to the 54 mm-separation between lines that means that the magnetic configuration is displaced between lines. This also implies that the closest approach to the plasma centre varies between injection lines. For instance, flight paths into the nominal magnetic configuration (100-44-64) for Lines #1 and #4 approach the plasma centre, whereas the flight paths for Lines #2 and #3 have their nearest approach at = 0.273 and = 0.45, respectively, where = r/a is the normalized plasma radius.
The PI system is fully incorporated into the TJ-II control and data acquisition system [166]; it uses stand-alone PC-based instrumentation. Control systems are handled with National Instruments input/output cards operated with LabView software, while integration is done via an Ethernet network and HTML pages [167]. A set of fast channels, arranged on commercially available four-channel PCI boards, mounted on the controlling PC, collects signals from the shock accelerometer, pressure transducer, light gate and microwave cavity. Data are
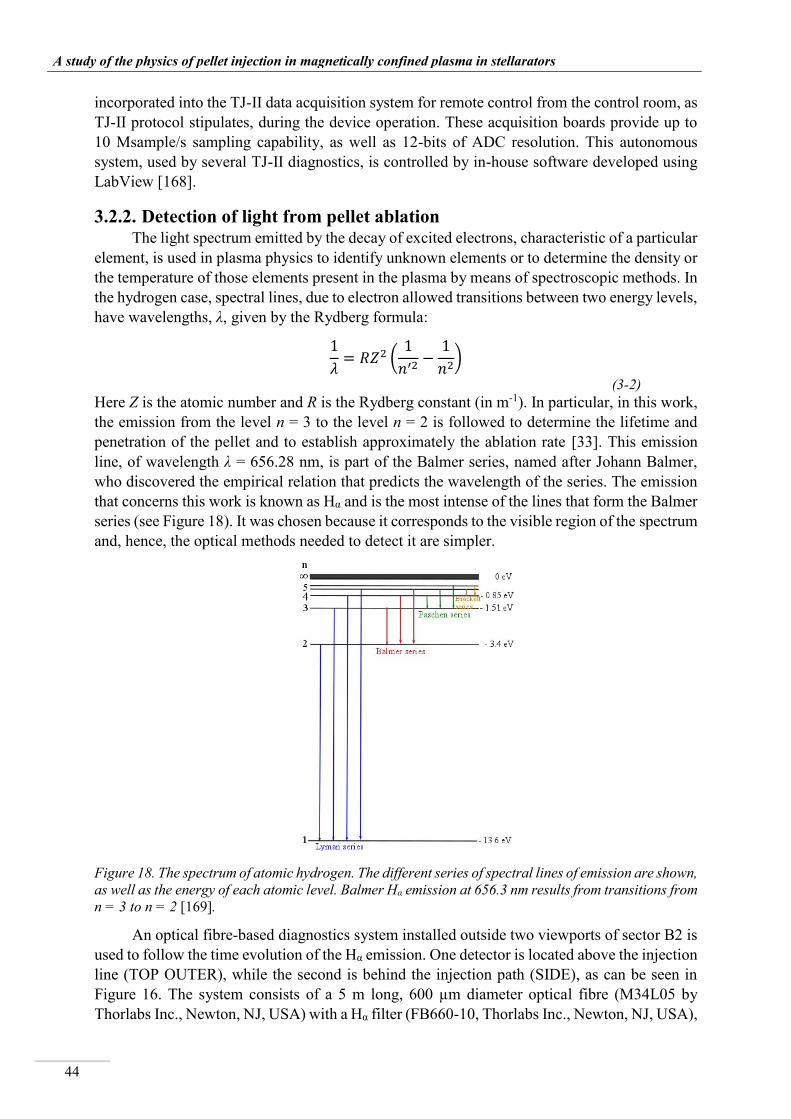
__________________________________________________________________________________
A study of the physics of pellet injection in magnetically confined plasma in stellarators
44
incorporated into the TJ-II data acquisition system for remote control from the control room, as TJ-II protocol stipulates, during the device operation. These acquisition boards provide up to 10 Msample/s sampling capability, as well as 12-bits of ADC resolution. This autonomous system, used by several TJ-II diagnostics, is controlled by in-house software developed using LabView [168].
3.2.2. Detection of light from pellet ablation The light spectrum emitted by the decay of excited electrons, characteristic of a particular
element, is used in plasma physics to identify unknown elements or to determine the density or the temperature of those elements present in the plasma by means of spectroscopic methods. In the hydrogen case, spectral lines, due to electron allowed transitions between two energy levels, have wavelengths, λ, given by the Rydberg formula:
1
𝜆= 𝑅𝑍2 (
1
𝑛′2−
1
𝑛2)
(3-2) Here Z is the atomic number and R is the Rydberg constant (in m-1). In particular, in this work, the emission from the level n = 3 to the level n = 2 is followed to determine the lifetime and penetration of the pellet and to establish approximately the ablation rate [33]. This emission line, of wavelength λ = 656.28 nm, is part of the Balmer series, named after Johann Balmer, who discovered the empirical relation that predicts the wavelength of the series. The emission that concerns this work is known as Hα and is the most intense of the lines that form the Balmer series (see Figure 18). It was chosen because it corresponds to the visible region of the spectrum and, hence, the optical methods needed to detect it are simpler.
Figure 18. The spectrum of atomic hydrogen. The different series of spectral lines of emission are shown, as well as the energy of each atomic level. Balmer Hα emission at 656.3 nm results from transitions from n = 3 to n = 2 [169].
An optical fibre-based diagnostics system installed outside two viewports of sector B2 is used to follow the time evolution of the Hα emission. One detector is located above the injection line (TOP OUTER), while the second is behind the injection path (SIDE), as can be seen in Figure 16. The system consists of a 5 m long, 600 µm diameter optical fibre (M34L05 by Thorlabs Inc., Newton, NJ, USA) with a Hα filter (FB660-10, Thorlabs Inc., Newton, NJ, USA),

_________________________________________________________________________________
Description of experimental systems
45
which has central wavelength of 660 nm ± 2 nm, full-width at half maximum (FWHM) of 10 ± 2 nm, and peak transmission of ≤ 50 %; and a switchable-gain amplified silicon photodiode detector, where the collected light is directed, model PDA36A by Thorlabs Inc., Newton, NJ, USA. These Si detectors are designed to detect light signals in the wavelength range of 350 nm to 1100 nm [162]. Their responsivity, ℜ(λ), defined as the ratio of the generated photocurrent, Ipd, and the incident light power, P, is found in reference [170]. The relation between the output signal of the photodetector and the input power is given by the following relation:
𝑉𝑂𝑈𝑇 = ℜ(𝜆)𝑥 𝐺𝑎𝑖𝑛 𝑥 𝐼𝑛𝑝𝑢𝑡 𝑝𝑜𝑤𝑒𝑟 (𝑊) (3-3)
Terms in this expression can be found in Table 4, where the detector specifications for 40 dB and 50 dB are listed. It should be noted that, as the gain increases, the bandwidth is reduced.
40 dB 50 dB Gain (Hi-Z) 1.51 x 10⁵ V/A ± 2 % 4.75 x 10⁵ V/A ± 2 % Gain (50 Ω) 0.75 x 10⁵ V/A ± 2 % 2.38 x 10⁵ V/A ± 2 % Bandwidth 150 kHz 45 kHz
Noise (RMS) 340 µV 400 µV Offset 4 mV (10 mV max) 4 mV (10 mV max)
Table 4. Summary of performance specifications of the two PDA36A Si detectors used to follow the Hα emitted by the pellet cloud. Values are shown for the two gain values used in pellet experiments (40 dB and 50 dB).
The pellet path through the plasma is ≤ 0.4 m, while the distance from the fibre to the pellet path varies from ~ 0.75 m to ~ 0.9 m for the TOP OUTER port, and from 0.6 m to 1.05 m for SIDE, so the light is incident on the fibre to within ~ 16º and ~ 6º, respectively (see Figure 16). Therefore, since the acceptance angle of the fibre with respect the pellet flight path is ~ 27º FWHM, it is possible to collect light along the whole path and, hence, no lenses are necessary. Nonetheless, correction is needed to compensate for light loss due to angle. Since the system is intended to follow the temporal evolution of the pellet cloud light emission, the detector bandwidth is set to a value that depends on the time the pellet needs to cross the plasma outer minor radius, which is ≤ 200 µs, and the photon flux incident on the photodiode, typically a few times 1012 photons/s. Hence, the detector bandwidth is set to a few 100’s of kHz. However, if high frequency signal variations, which can be up to 1 MHz, are to be detected, increased bandwidth signal is necessary. In this case, one of the Si photodetectors can be replaced by an avalanche silicon photodiode, model LCSA3000-01 by Laser Components, GmbH, Olching, Germany, with a neutral density filter (O.D. = 2.5 to 4.0), combined with the Hα filter, to avoid signal saturation. This type of avalanche photodiode, of active area of 3 mm, has a built-in pre-amplifier and high voltage supply. The current generated by incident photons is obtained from:
𝐼 = ℜ(𝜆) 𝑥 𝐼𝑛𝑡𝑒𝑟𝑛𝑎𝑙 𝐺𝑎𝑖𝑛 𝑥 𝐼𝑛𝑝𝑢𝑡 𝑝𝑜𝑤𝑒𝑟 (𝑊) (3-4)
The internal gain of an avalanche photodiode detector (APD) depends on the reverse bias voltage applied. The output of the avalanche photodiode at 656 nm is 3.6x10⁸ V/W. This type of detector has the disadvantage of a temperature-dependent gain, which results in reduced signal-to-noise ratio.
Finally, an ultra-high-speed multifunction board with 4 analogue inputs and 20 Msamples/s sampling rate capability (model PCI-DAS4020/12 by Measurement Computing Corporation, Norton, MA), located in a nearby PC is used for data acquisition. The data is

__________________________________________________________________________________
A study of the physics of pellet injection in magnetically confined plasma in stellarators
46
automatically transferred to the TJ-II data system, so it can be used for analysis of pellet ablation during TJ-II operation and for subsequent detailed studies.
3.2.3. Pellet ablation fast imaging system The TJ-II pellet injection system possesses an additional diagnostic to follow the
evolution of the light emitted by the ablated material, as well as the pellet acceleration and trajectory. It consists of a fast-visible camera with a Complementary Metal Oxide Semiconductor (CMOS) sensor; this type of camera is formed by an integrated circuit that contains an array of pixel sensors, each pixel including a photodetector and an active amplifier. Their main advantage is their capability to achieve high sampling speeds, which is possible due to the relative ease of parallel readout of a voltage matrix, compared to the sequential charge-to-voltages required by Charged Coupled Device (CCD) cameras [171]. In contrast, a general disadvantage of CMOS cameras is the recovery of the sensor information, implying that, for high frame rates, the sensor size is effectively reduced, i.e., the number of available pixels is reduced.
The ultra-fast CMOS camera used in TJ-II for pellet studies is a monochrome FASTCAM APX-RS by Photron Inc., San Diego, CA, USA (Figure 19) that records the ablating pellet from a nearby viewport located above (TOP INNER), behind (SIDE) or tangential (TANG) to the pellet flight path (see Figure 16 and Figure 17). This camera has a 2 GBytes digital memory and it is able to record at frame rates of between 50 frames/s at full frame (1024x1024 pixels) and 250 kframes/s at reduced frame (128x16 pixels). In addition, it is possible to control the exposure time of the electronic shutter independently, from 1/v s, where v is the frame rate (in frame/s), to 1 µs. Moreover, the FASTCAM APX-RS possesses a calibration function, i.e., a shading correction function, that allows correcting the non-uniformity in output of each pixel, based on a black level. The system is also equipped with a 4.5 m long coherent fibre bundle of squared section of 6x6 mm2 and 50 lines/mm, which corresponds to 300x300 fibres, custom-made by Schott AG, Mainz, Germany, with a transmission of > 20% at 656.3 nm [172]. Moreover, machine-vision type camera lenses are included in the system; in all the experiments described in this work a 12.5 mm lens model HF12.5SA-1 by Fujinon, Tokyo, Japan has been used.
Figure 19. Photron FASTCAM APX-RX, used in TJ-II for pellet injection studies, seen from a) front and b) behind [173].
3.3. THE WENDELSTEIN 7-X STELLARATOR The superconducting device Wendelstein 7-X is an optimized stellarator, belonging to the
HELIAS line [18], located in the Max-Planck-Institute für Plasmaphysik (IPP), Greifswald, Germany. It is a five-period, low-shear, drift-optimized stellarator designed to demonstrate that
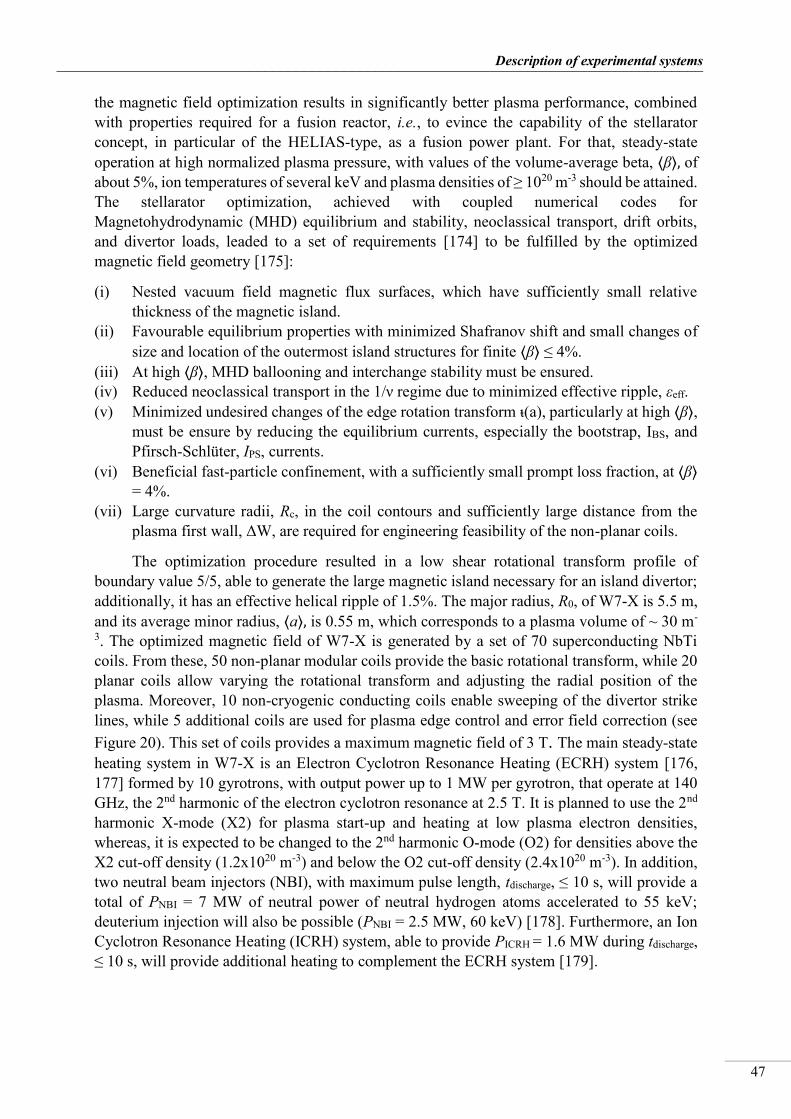
_________________________________________________________________________________
Description of experimental systems
47
the magnetic field optimization results in significantly better plasma performance, combined with properties required for a fusion reactor, i.e., to evince the capability of the stellarator concept, in particular of the HELIAS-type, as a fusion power plant. For that, steady-state operation at high normalized plasma pressure, with values of the volume-average beta, ⟨β⟩, of about 5%, ion temperatures of several keV and plasma densities of ≥ 1020 m-3 should be attained. The stellarator optimization, achieved with coupled numerical codes for Magnetohydrodynamic (MHD) equilibrium and stability, neoclassical transport, drift orbits, and divertor loads, leaded to a set of requirements [174] to be fulfilled by the optimized magnetic field geometry [175]:
(i) Nested vacuum field magnetic flux surfaces, which have sufficiently small relative thickness of the magnetic island.
(ii) Favourable equilibrium properties with minimized Shafranov shift and small changes of size and location of the outermost island structures for finite ⟨β⟩ ≤ 4%.
(iii) At high ⟨β⟩, MHD ballooning and interchange stability must be ensured. (iv) Reduced neoclassical transport in the 1/ν regime due to minimized effective ripple, εeff. (v) Minimized undesired changes of the edge rotation transform ᵼ(a), particularly at high ⟨β⟩,
must be ensure by reducing the equilibrium currents, especially the bootstrap, IBS, and Pfirsch-Schlüter, IPS, currents.
(vi) Beneficial fast-particle confinement, with a sufficiently small prompt loss fraction, at ⟨β⟩ = 4%.
(vii) Large curvature radii, Rc, in the coil contours and sufficiently large distance from the plasma first wall, ΔW, are required for engineering feasibility of the non-planar coils.
The optimization procedure resulted in a low shear rotational transform profile of boundary value 5/5, able to generate the large magnetic island necessary for an island divertor; additionally, it has an effective helical ripple of 1.5%. The major radius, R0, of W7-X is 5.5 m, and its average minor radius, ⟨a⟩, is 0.55 m, which corresponds to a plasma volume of ~ 30 m-
3. The optimized magnetic field of W7-X is generated by a set of 70 superconducting NbTi coils. From these, 50 non-planar modular coils provide the basic rotational transform, while 20 planar coils allow varying the rotational transform and adjusting the radial position of the plasma. Moreover, 10 non-cryogenic conducting coils enable sweeping of the divertor strike lines, while 5 additional coils are used for plasma edge control and error field correction (see Figure 20). This set of coils provides a maximum magnetic field of 3 T. The main steady-state heating system in W7-X is an Electron Cyclotron Resonance Heating (ECRH) system [176, 177] formed by 10 gyrotrons, with output power up to 1 MW per gyrotron, that operate at 140 GHz, the 2nd harmonic of the electron cyclotron resonance at 2.5 T. It is planned to use the 2nd harmonic X-mode (X2) for plasma start-up and heating at low plasma electron densities, whereas, it is expected to be changed to the 2nd harmonic O-mode (O2) for densities above the X2 cut-off density (1.2x10²⁰ m-3) and below the O2 cut-off density (2.4x10²⁰ m-3). In addition, two neutral beam injectors (NBI), with maximum pulse length, tdischarge, ≤ 10 s, will provide a total of PNBI = 7 MW of neutral power of neutral hydrogen atoms accelerated to 55 keV; deuterium injection will also be possible (PNBI = 2.5 MW, 60 keV) [178]. Furthermore, an Ion Cyclotron Resonance Heating (ICRH) system, able to provide PICRH = 1.6 MW during tdischarge, ≤ 10 s, will provide additional heating to complement the ECRH system [179].
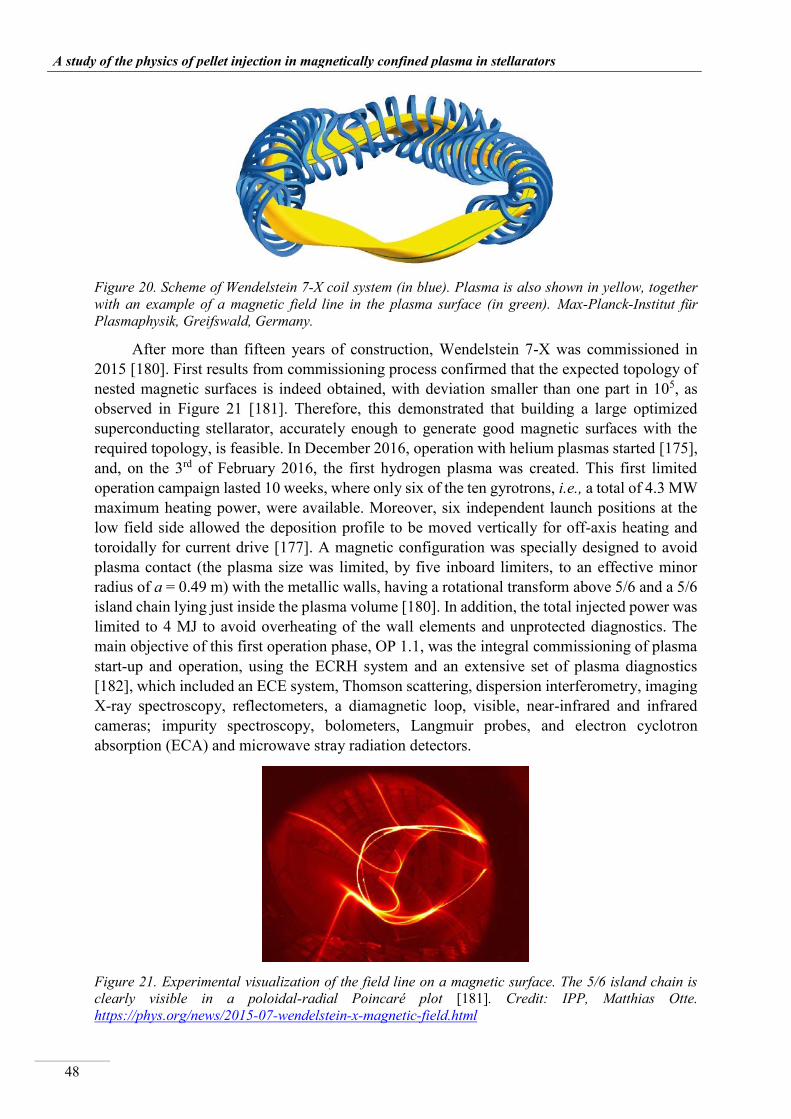
__________________________________________________________________________________
A study of the physics of pellet injection in magnetically confined plasma in stellarators
48
Figure 20. Scheme of Wendelstein 7-X coil system (in blue). Plasma is also shown in yellow, together with an example of a magnetic field line in the plasma surface (in green). Max-Planck-Institut für Plasmaphysik, Greifswald, Germany.
After more than fifteen years of construction, Wendelstein 7-X was commissioned in 2015 [180]. First results from commissioning process confirmed that the expected topology of nested magnetic surfaces is indeed obtained, with deviation smaller than one part in 105, as observed in Figure 21 [181]. Therefore, this demonstrated that building a large optimized superconducting stellarator, accurately enough to generate good magnetic surfaces with the required topology, is feasible. In December 2016, operation with helium plasmas started [175], and, on the 3rd of February 2016, the first hydrogen plasma was created. This first limited operation campaign lasted 10 weeks, where only six of the ten gyrotrons, i.e., a total of 4.3 MW maximum heating power, were available. Moreover, six independent launch positions at the low field side allowed the deposition profile to be moved vertically for off-axis heating and toroidally for current drive [177]. A magnetic configuration was specially designed to avoid plasma contact (the plasma size was limited, by five inboard limiters, to an effective minor radius of a = 0.49 m) with the metallic walls, having a rotational transform above 5/6 and a 5/6 island chain lying just inside the plasma volume [180]. In addition, the total injected power was limited to 4 MJ to avoid overheating of the wall elements and unprotected diagnostics. The main objective of this first operation phase, OP 1.1, was the integral commissioning of plasma start-up and operation, using the ECRH system and an extensive set of plasma diagnostics [182], which included an ECE system, Thomson scattering, dispersion interferometry, imaging X-ray spectroscopy, reflectometers, a diamagnetic loop, visible, near-infrared and infrared cameras; impurity spectroscopy, bolometers, Langmuir probes, and electron cyclotron absorption (ECA) and microwave stray radiation detectors.
Figure 21. Experimental visualization of the field line on a magnetic surface. The 5/6 island chain is clearly visible in a poloidal-radial Poincaré plot [181]. Credit: IPP, Matthias Otte. https://phys.org/news/2015-07-wendelstein-x-magnetic-field.html

_________________________________________________________________________________
Description of experimental systems
49
Plasma breakdown was easily achieved during OP 1.1, with the available ECRH power, and discharges lasted up to 6 s, for moderated heating power. Plasmas were characterized by low densities (line-integrated densities up to 3x10¹⁹ m-2), electron temperatures in the core up to 10 keV, exceeding the ion temperature by a factor of ~ 5. Preliminary studies showed energy confinement times in line with the ISS04 scaling [183], which, considering the unwanted energy loss channels present, is a promising result. In particular, the exponent for the density is, within the error bars, similar to the value of the scaling, whereas the dependence on the power degradation seems to be weaker [184].
The next part of the initial operational first, OP 1.2a, took place during fall 2017. This second operational campaign, less limited than OP 1.1, lasted 15 weeks. During this time, both technical and physical experiments were performed, and more diagnostics were successfully commissioned. Hydrogen and helium plasmas were obtained with heating power up to ~5 MW (of 6.6 MW available). Higher densities than in OP 1.1 were achieved, particularly in helium plasmas (densities up to ~ 7x10¹⁹ m-3 and ~ 3x10¹⁹ m-3 were achieved in helium and hydrogen, respectively). This was allowed by the successful testing of the O2-mode heating scheme. Also, on- and off-axis ECR-heating were employed in different experiments. In addition, new magnetic configurations were used, in addition to the standard one (the high-iota and the high-mirror configurations). Moreover, the blower gun was commissioned, and it was available in several plasma experiments, with different working gases, target densities, heating schemes and magnetic configurations. Preliminary LFS-HFS comparisons were carried out, along with first fuelling efficiency studies. OP 1.2 will be completed in summer/fall 2018 (OP 1.2b). During OP 1.2b, the blower gun will be operational again and pellet studies will advance. Afterwards, the second operational phase, OP 2, will take place. During OP 2, it is foreseen to operate with an actively-cooled divertor and steady-state plasmas (30 min/10 MW).
3.4. PELLET INJECTION PLANS FOR THE WENDELSTEIN 7-X STELLARATOR Pellet injection into Wendelstein 7-X plasma is an essential tool to achieve its scientific
goal of steady-state operation at high plasma densities and, hence, demonstrate the viability of stellarators as fusion power plants. During the first part of the first phase of W7-X operation, OP 1.1, pellet injections were not available [180]. Nonetheless, a recommissioned blower-type injector [185] has been employed during the OP 1.2 phase; while a new extrusion type injector will be available at a later date.
Hydrogen pellets have been injected into W7-X plasmas during the second part of its first operational phase, OP 1.2a, using the ASDEX Upgrade blower-type injector [186, 187]. This same injector will be used during OP 1.2b. Its purpose is to clarify the impact of pellet injection, from both the Low and the High Field Sides, and, hence, determine whether injection location is critical to achieve the required efficient core fuelling, as in tokamaks, or if the beneficial inwards drift is present in W7-X for HFS injection, unlike the LHD case. With this first injector, 2 mm diameter and 2 mm long cylindrical hydrogen pellets are injected at velocities around 250 m/s, and at a repetition rate up to 30 Hz, through two different injections ports, one located in the HFS part (AEL41) of the vessel and the other on the LFS (AEK41). The injection ports are located at toroidal positions HFS = -2.22 rad and LFS = -2.24 rad, respectively. Pellets are

__________________________________________________________________________________
A study of the physics of pellet injection in magnetically confined plasma in stellarators
50
injected with angles of 0.13 rad for HFS and -3.0 rad for LFS, with respect to the horizontal plane.
Pellets are formed inside the extrusion cryostat of the ASDEX-U blower gun, which is cooled to ~ 5 K by liquid helium, so hydrogen is immediately frozen to the wall of the cryostat. Afterwards, the cryostat is slightly heated, and a pneumatic piston scraped the ice of the wall, so it is pushed through a narrow nozzle. Then, a thin rod of compressed hydrogen is formed, which is pushed into the storage cryostat, also cooled with liquid helium, but at ~ 10 K. The storage cryostat, able to hold an ice rod of 124 mm in length (around 62 pellets), can preserve the frozen hydrogen up to 10 min. When a pellet needs to be injected into the plasma, the rod is cut off by a lever that moves into the storage cryostat; it is then pushed out of the cryostat and into the shuttle. Following this, the shuttle cuts a pellet off the ice rod and moves it in front of the fast gas valve. The valve is then opened, and, with a short pulse of propellant gas, the pellet is accelerated into the barrel. The acceleration is produced by the drag between the pellet and the propellant gas; since the pellet is shot through a barrel of inner diameter slightly larger than the pellet outer diameter, the small gap allows the propellant gas to flow around the pellet and to smoothly accelerate it. However, heat transfer to the pellet is increased due to the complete enclosure of the pellet inside the gas. The blower gun system is completed with microwave cavities for timing and particle accountability. Due to the complex geometry of the injection tubes, particularly of the HFS tube, a considerable portion of the initial pellet mass can be lost due to evaporation.
3.5. PLASMA DIAGNOSTICS An important number of plasma diagnostics has been developed to date. This is of vital
importance, since a deep understanding of all the physical processes taking place inside a plasma is key to lead fusion from experimental devices to commercial power plants. To achieve this, many plasma parameters need to be measured with both spatial and time resolution. This implies that a wide set of plasma techniques is necessary. These plasma diagnostics are generally divided into two groups: active and passive diagnostics. The latter category collects, without perturbing the plasma, the electromagnetic radiation or the scaping particles. On the other hand, active diagnostics externally perturb the plasma and measure its reaction or the effect of the interaction with the plasma. The TJ-II stellarator possesses several of these plasma diagnostics. In particular, the pellet injector system is well equipped, as mentioned in Section 3.2. In addition to these, other diagnostics are used for pellet studies. These are reviewed in the following subsections.
3.5.1. Plasma diagnostics relevant for pellet studies Pellet studies require not only an accurate measurement of pellet mass and velocity or
following the temporal evolution of the light emitted by the pellet ablated material, but also, an accurate knowledge of plasma density and temperature evolution. A brief outline of the diagnostics used in these studies to characterize the target plasma before and after pellet injection is given here.
3.5.1.1. Thomson Scattering A Thomson Scattering (TS) system provides profiles of both the electron density and the
electron temperature, along the full plasma diameter, with spatial and time resolutions. These capabilities convert the TS in a powerful tool, employed in almost all fusion devices. This
_________________________________________________________________________________
Description of experimental systems
51
technique is based on the electron temperature and density dependence of the elastic scattering of electromagnetic radiation by free charge particles, i.e., Thomson scattering. Scattered light from a high-powered laser is collected by a dedicated detection system. Analysis of this light provides profiles of electron density and temperature [188].
The TJ-II Thomson Scattering system (located in sector D2, ϕ = 14.5°, as seen in Figure 17), generally used in pellet injection experiments, provides electron temperature, density and pressure profile for a single time instance along a plasma discharge. This is a high resolution and high accuracy, multi position system. Electron temperature and density are measured at 160 spatial positions, along a 360 mm laser (a ruby laser is used) chord inclined 17º from the vertical, i.e., with ~ 2 mm spatial resolution [189–193]. The profile collected is limited to with ρ = 0.8 due to geometric considerations.
3.5.1.2. Interferometer Interferometry allows measuring the temporal evolution of the plasma line-averaged
density. It is based on the dependence density of the refractive index of electromagnetic waves on the electron. Therefore, if an electromagnetic wave is launched into a plasma, the interaction between plasma and wave causes a phase shift that depends on the plasma line-averaged density. Measuring this phase shift, the plasma line-averaged density can be obtained.
The TJ-II interferometer, located in sector B8 (ϕ = 264.4°, see Figure 17), is able to follow the line-integrated electron density along a TJ-II discharge with 10 µs of temporal resolution. The probing beam frequency is 140 GHz, i.e., its wavelength is 2.14 mm, and it has an inclination of 18.7° with respect to the vertical.
3.5.1.3. Electron Cyclotron Emission The Electron Cyclotron Emission (ECE) diagnostic is used for time and space resolved
electron temperature measurements. It is based on the relationship between the electron temperature and the intensity of the radiation emitted by electrons due to their gyrations around magnetic field lines.
In the TJ-II case, a 11-channel heterodyne radiometer (between sectors C4 and C5, ϕ = 315°), which covers the frequency range 50-60 GHz, i.e., the second harmonic of the electron cyclotron emission in X-mode polarization at 0.95 T, is used to measure electron temperature profiles [194–196]. The spatial resolution is about 1 cm, while the typical sampling rate is 100 kHz.
3.5.1.4. Neutral Particle Analyzer A Neutral Particle Analyzer (NPA) allows ion temperatures to be estimated. It measures
the energy distribution function of the neutral particles that scape form the plasma, since such distribution is related to the ion energy distribution, due to charge exchange collisions between hot ions and cold neutrals.
In TJ-II, a Compact Neutral Particle Analyzer (CNPA), located in sector B1 (see Figure 17) is used to obtain ion temperature profiles. With its 16 channels, it is able to detect hydrogen atoms in the range of 1 to 44 keV [197–199].

__________________________________________________________________________________
A study of the physics of pellet injection in magnetically confined plasma in stellarators
52
3.5.2. Other plasma diagnostics To attain a deep and complete understanding of all the physical mechanisms involved in
pellet ablation and ablatant homogenization, other diagnostics, besides those already mentioned, have been employed in several experiments. In the following subsection, the characteristics of these diagnostics are outlined.
3.5.2.1. X-ray detectors X-ray detectors, of different types, are used to study a wide range of plasma aspects, as
impurity transport or MHD activity, and to detect suprathermal electrons.
In TJ-II, a multichannel soft X-ray system, consisting of five cameras with 16 channels each, is located in sector A2 (ϕ = 104.5°). This system allows the tomographic reconstruction of plasma emissions [200–202]. In addition, soft X-ray emissions can be used to measure electron temperature, assuming a Maxwellian electron energy distribution, from the ratio of soft X-ray fluxes passing through filters of different thicknesses [203–205]. Moreover, hard X-ray detectors are used to detect the presence of suprathermal electron populations in TJ-II plasmas [200, 201].
3.5.2.2. Rogowski Coil A Rogowski coil consists of a helical coil of wire and is used to measure the current
flowing in a plasma by detecting the induced magnetic field.
In TJ-II, two Rogowski coils are installed in sectors A5 (ϕ = 148.7°) and B4 (ϕ = 211.3°), under the protecting tiles of the groove that runs toroidally all along its vacuum vessel. This way, net plasma current is measured in both sectors.
3.5.2.3. Diamagnetic loop Diamagnetic loops are able to measure the plasma energy content. In TJ-II, two internal
diamagnetic loops are installed in sectors A5 (ϕ = 135°) and B4 (ϕ = 225°). This system consists of a main loop encircling the plasma column and a compensating loop which measures only the vacuum magnetic flux. The energy content of the plasma is obtained from this system measurements, with a correction for the net plasma current [206].
3.5.2.4. Heavy Ion Beam Probe The Heavy Ion Beam Probe (HIBP) is able to measure the plasma electric potential, even
in the plasma core region. This magnitude is obtained by injecting a beam of highly accelerated heavy ions into the plasma. Some of these ions become doubly ionized, are deflected from their original path by the magnetic field and are then collected by an analyser system. The energy of these secondary ions depends on the electric potential in the plasma volume crossed by the beam.
TJ-II possesses a unique system formed by two HIBPs, located in sector B4 and A4 (see Figure 17), which uses caesium ions accelerated to 150 keV. The first system can simultaneously measure the plasma electric potential, the electron density and the poloidal component of the magnetic field [207–213]. In addition, it allows investigating the spatial structure of plasma turbulence [214]. On the other hand, the second injector is used to study plasma potential asymmetries, as well as turbulence long range correlations [215].

_________________________________________________________________________________
Description of experimental systems
53
3.5.2.5. Langmuir Probes Langmuir probes allow determining the electron temperature, density and potential of a
plasma. However, they are limited to relatively cold plasmas, i.e., of few eV. This technique involves inserting one or more electrodes into the plasma edge and measuring the current in the system as a function of its voltage, allowing the determination of the mentioned plasma magnitudes.

__________________________________________________________________________________
A study of the physics of pellet injection in magnetically confined plasma in stellarators
54

_________________________________________________________________________________
Pellet injection studies in the stellarator TJ-II
55
4. PELLET INJECTION STUDIES IN THE STELLARATOR TJ-II
Hydrogen pellet injection experiments have been performed in on-/off- axis ECRH and NBI heated hydrogen plasmas for a range of target densities and for different magnetic configurations since the commissioning of the Pellet Injector (PI) system in 2014. A number of pellet ablation and plasmoid drift experiments have been carried out in TJ-II to clarify the influence of heating method, magnetic configuration and plasma parameters on pellet dynamics and fuelling efficiency. Representative experimental results are discussed here, and conclusions are extracted. First, the methods used to analyse photodiode signals and fast-camera images are described. For this, a representative pellet plasma discharge is shown, and main features are explained. Then, results obtained from ablation studies are presented, along with the analysis of pellet trajectories from fast camera data. Moreover, fast-camera images are used to investigate the ExB drift of pellet plasmoids. Results and deductions are presented afterwards. Finally, fuelling efficiency studies are described, together with findings and the explanation of the relationship between plasmoid drift and fuelling efficiency in the TJ-II.
4.1. ANALYSIS OF PHOTODIODE SIGNALS Light emissions detected by the system of photodiodes described in Chapter 3,
corresponding to Balmer Hα radiation emitted by the ablatant cloud surrounding the pellet, need to be corrected for light collection solid angle, collection angle with respect to the fibre normal, interference filter transmission, detector efficiency and amplifier gain [2]. For this, the time when a pellet enters the plasma needs to be accurately determined. Since pellet velocity is calculated using signals from the light-gate and microwave cavity diagnostics (with time resolution of 1 μs), which are 0.585 m apart (see Figure 16), it is sufficient to know the distance between the light-gate and the plasma edge to calculate the pellet entry time in the plasma. This distance, as explained in Chapter 3, depends on the pellet injection line and on the magnetic configuration; the same is true for the distance of nearest approach to plasma centre. As can be seen in Figure 17, as reference, the distance between the light-gate and the TJ-II central coil (CC) is 3 m. Therefore, knowing the distance from CC to plasma edge allows determining the distance between the light-gate and plasma edge, and thus, the time when a pellet enters the plasma. Consequently, the time, with respect to the discharge start time, when a pellet enters the plasma (in seconds) is given by:
𝑡𝑝𝑙𝑎𝑠𝑚𝑎 = 𝑡𝐿𝐺 +3 − 𝑑𝐶𝐶−𝐿𝐺
𝑣𝑝
(4-1) Here tLG is the time when the pellet crosses the light gate, in s; dCC-LG is the distance between the plasma edge and the central coil, in m; and vp is the pellet velocity, in m/s, calculated as:
𝑣𝑝 =0.585
𝑡𝜇𝑤 − 𝑡𝐿𝐺
(4-2) Here tw is the time when the pellet crosses the microwave cavity, in s. It should be noted that the reference times are with respect to the start time of the ramp-up of the currents in the coils.

__________________________________________________________________________________
A study of the physics of pellet injection in magnetically confined plasma in stellarators
56
The distance from CC to plasma edge is obtained for each injection line and configuration using technical drawings of TJ-II with calculated equilibrium magnetic flux surfaces superimposed, as can be seen in Figure 22 for Lines #1 and #2, i.e., at ϕ =14º, and the standard configuration. It should be recalled that the microwave cavity signal, Vw (in V), is also used to estimate the pellet mass. This signal has been calibrated as:
𝑚𝑝 = 8.8𝑥10−8Δ𝑉𝜇𝑤 [𝐾𝑔] (4-3)
Figure 22. Closed magnetic flux surfaces of the TJ-II 100-44-64 magnetic configuration for toroidal angle, φ, 14°. Pellet flight paths through the plasma for injection Lines #1 and #2 are shown, together with the distance from central coil to plasma edge. (in boxes).
Once the pellet velocity is known, the voltage signal obtained with the photodiode system can be corrected, so ablation studies and comparison with theoretical predictions are possible. Firstly, the measured voltage is converted into photons per second that arrive at the photodetector, considering the detector efficiency and the amplifier gain. The input power for both photodetectors is:
𝑃 (𝑡) =𝑉 (𝑡) + 𝑉0
𝑅 · 𝐺 [𝑊]
(4-4) Here, R, the detector response in A/W for the wavelength of interest, Hα emission (λ = 656.3 nm), is 0.44 A/W, while G is the photodetector gain (V/A), set to the desirable value (see Chapter 3).
Next, the incident power is transformed to photons per second – photon rate, ℜγ – arriving at the photodetector:
ℜ𝛾(𝑡) = 𝑃 (𝑡) ·𝜆
ℎ · 𝑐
(4-5) Here h = 6.626x10⁻³⁴ Js is the Planck constant and c is the speed of light. The wavelength, λ, of the Hα emission is in m. After, since the time of entrance into the plasma is known, it is possible to make all corrections that depend on pellet position, assuming that the pellet is not radially accelerated, i.e., that the pellet velocity during ablation corresponds to the injection velocity. Later, it will be shown that this assumption is correct.
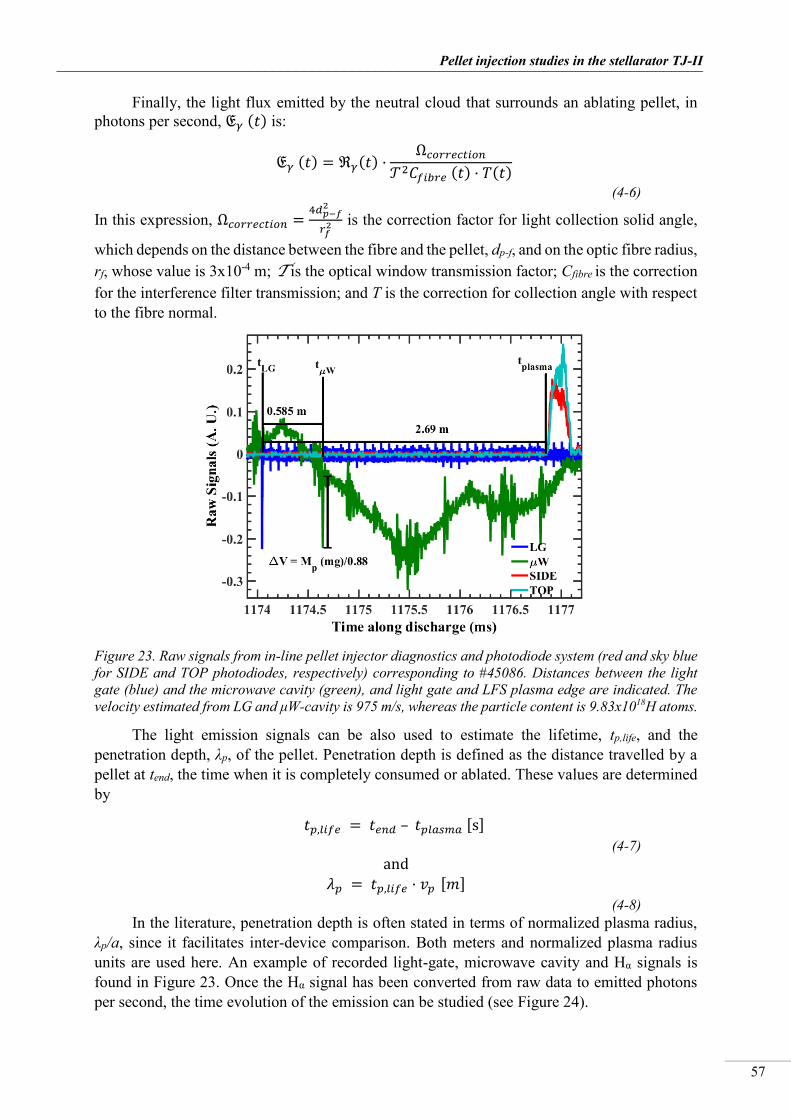
_________________________________________________________________________________
Pellet injection studies in the stellarator TJ-II
57
Finally, the light flux emitted by the neutral cloud that surrounds an ablating pellet, in photons per second, 𝔈𝛾 (𝑡) is:
𝔈𝛾 (𝑡) = ℜ𝛾(𝑡) ·Ω𝑐𝑜𝑟𝑟𝑒𝑐𝑡𝑖𝑜𝑛
𝒯2𝐶𝑓𝑖𝑏𝑟𝑒 (𝑡) · 𝑇(𝑡)
(4-6)
In this expression, Ω𝑐𝑜𝑟𝑟𝑒𝑐𝑡𝑖𝑜𝑛 =4𝑑𝑝−𝑓
2
𝑟𝑓2 is the correction factor for light collection solid angle,
which depends on the distance between the fibre and the pellet, dp-f, and on the optic fibre radius, rf, whose value is 3x10⁻⁴ m; T is the optical window transmission factor; Cfibre is the correction for the interference filter transmission; and T is the correction for collection angle with respect to the fibre normal.
Figure 23. Raw signals from in-line pellet injector diagnostics and photodiode system (red and sky blue for SIDE and TOP photodiodes, respectively) corresponding to #45086. Distances between the light gate (blue) and the microwave cavity (green), and light gate and LFS plasma edge are indicated. The velocity estimated from LG and μW-cavity is 975 m/s, whereas the particle content is 9.83x10¹⁸H atoms.
The light emission signals can be also used to estimate the lifetime, tp,life, and the penetration depth, λp, of the pellet. Penetration depth is defined as the distance travelled by a pellet at tend, the time when it is completely consumed or ablated. These values are determined by
𝑡𝑝,𝑙𝑖𝑓𝑒 = 𝑡𝑒𝑛𝑑 – 𝑡𝑝𝑙𝑎𝑠𝑚𝑎 [s]
(4-7) and
𝜆𝑝 = 𝑡𝑝,𝑙𝑖𝑓𝑒 · 𝑣𝑝 [𝑚] (4-8)
In the literature, penetration depth is often stated in terms of normalized plasma radius, λp/a, since it facilitates inter-device comparison. Both meters and normalized plasma radius units are used here. An example of recorded light-gate, microwave cavity and Hα signals is found in Figure 23. Once the Hα signal has been converted from raw data to emitted photons per second, the time evolution of the emission can be studied (see Figure 24).
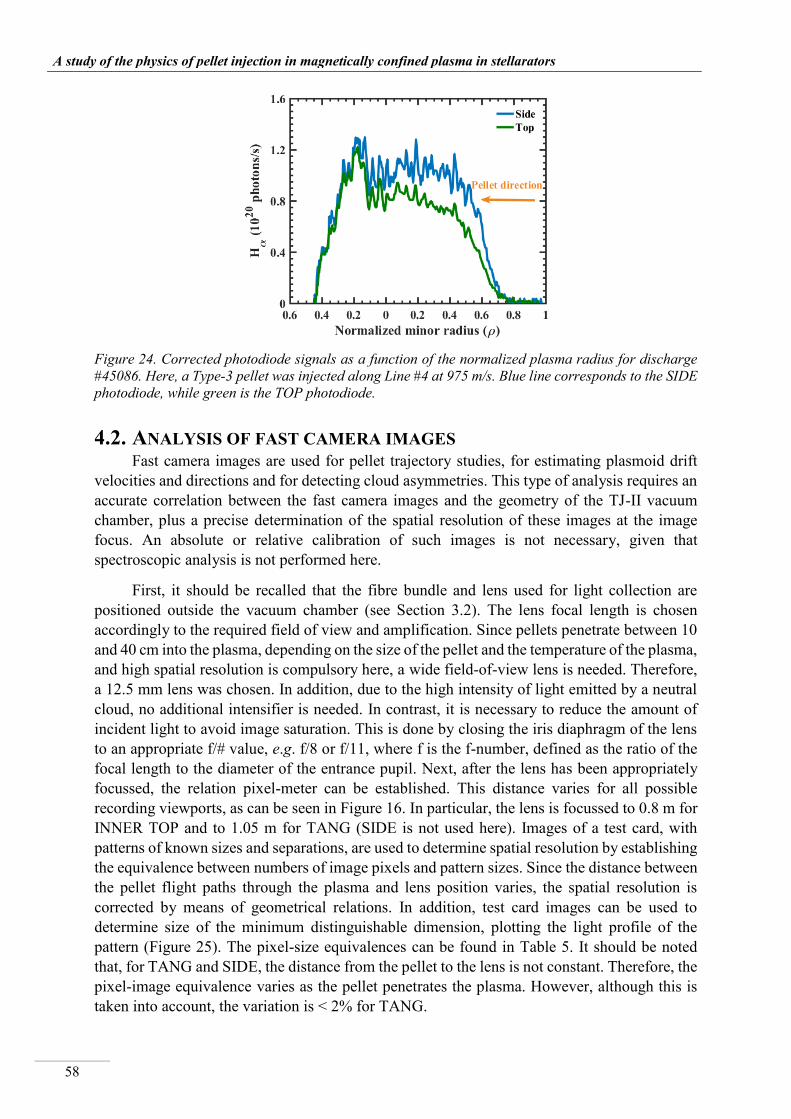
__________________________________________________________________________________
A study of the physics of pellet injection in magnetically confined plasma in stellarators
58
Figure 24. Corrected photodiode signals as a function of the normalized plasma radius for discharge #45086. Here, a Type-3 pellet was injected along Line #4 at 975 m/s. Blue line corresponds to the SIDE photodiode, while green is the TOP photodiode.
4.2. ANALYSIS OF FAST CAMERA IMAGES Fast camera images are used for pellet trajectory studies, for estimating plasmoid drift
velocities and directions and for detecting cloud asymmetries. This type of analysis requires an accurate correlation between the fast camera images and the geometry of the TJ-II vacuum chamber, plus a precise determination of the spatial resolution of these images at the image focus. An absolute or relative calibration of such images is not necessary, given that spectroscopic analysis is not performed here.
First, it should be recalled that the fibre bundle and lens used for light collection are positioned outside the vacuum chamber (see Section 3.2). The lens focal length is chosen accordingly to the required field of view and amplification. Since pellets penetrate between 10 and 40 cm into the plasma, depending on the size of the pellet and the temperature of the plasma, and high spatial resolution is compulsory here, a wide field-of-view lens is needed. Therefore, a 12.5 mm lens was chosen. In addition, due to the high intensity of light emitted by a neutral cloud, no additional intensifier is needed. In contrast, it is necessary to reduce the amount of incident light to avoid image saturation. This is done by closing the iris diaphragm of the lens to an appropriate f/# value, e.g. f/8 or f/11, where f is the f-number, defined as the ratio of the focal length to the diameter of the entrance pupil. Next, after the lens has been appropriately focussed, the relation pixel-meter can be established. This distance varies for all possible recording viewports, as can be seen in Figure 16. In particular, the lens is focussed to 0.8 m for INNER TOP and to 1.05 m for TANG (SIDE is not used here). Images of a test card, with patterns of known sizes and separations, are used to determine spatial resolution by establishing the equivalence between numbers of image pixels and pattern sizes. Since the distance between the pellet flight paths through the plasma and lens position varies, the spatial resolution is corrected by means of geometrical relations. In addition, test card images can be used to determine size of the minimum distinguishable dimension, plotting the light profile of the pattern (Figure 25). The pixel-size equivalences can be found in Table 5. It should be noted that, for TANG and SIDE, the distance from the pellet to the lens is not constant. Therefore, the pixel-image equivalence varies as the pellet penetrates the plasma. However, although this is taken into account, the variation is < 2% for TANG.
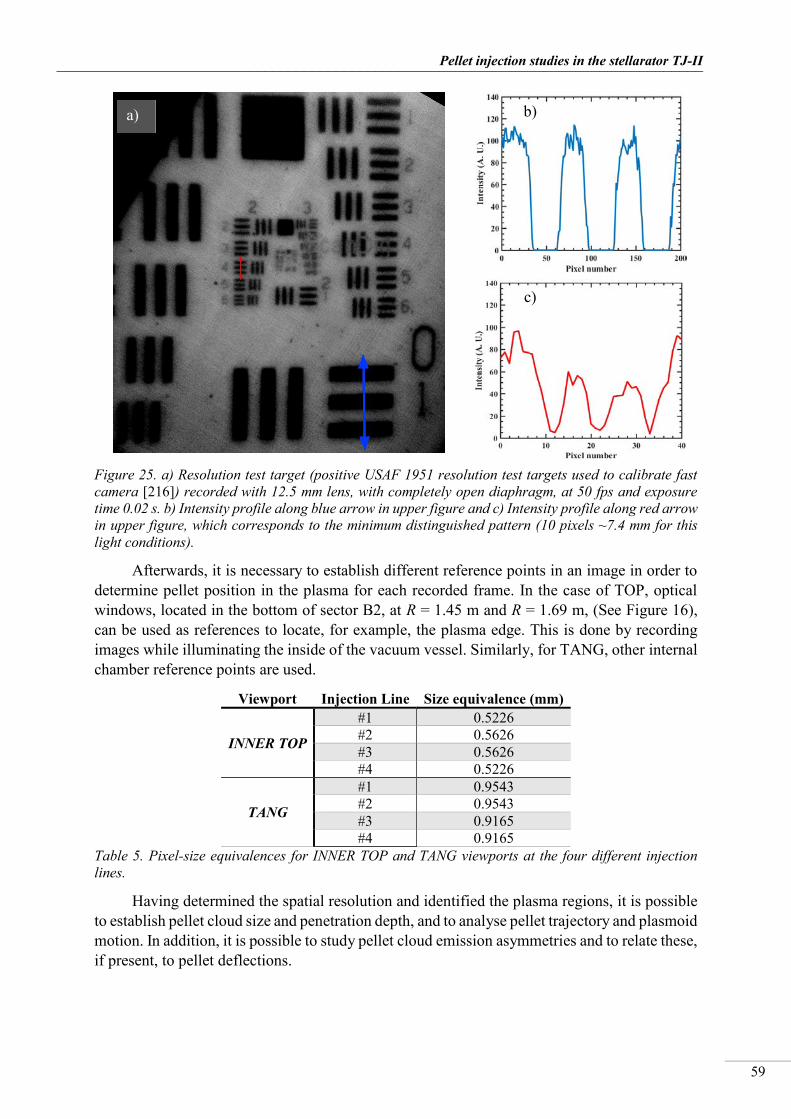

__________________________________________________________________________________
A study of the physics of pellet injection in magnetically confined plasma in stellarators
60
4.3. REPRESENTATIVE PELLET DISCHARGES IN TJ-II: PLASMA RESPONSE Pellet injection has a very rapid and dramatic effect on the plasma. First, an almost
instantaneous drop in electron temperature occurs due to pellet ablation, H2 dissociation and neutral H ionization. This is followed by a further drop in temperature and by an increase in density as cold pellet electrons enter the plasma. In addition, the plasma current can be momentarily modified when the pellet enters the plasma. Such change may be related to the deconfinement of suprathermal electrons. An additional explanation to this modification could be that the solid pellet behaves as a probe inserted into a plasma, i.e., if electrons accumulate around the pellet, ion current increases to maintain quasineutrality. At the same time, the energy content of the plasma decreases due to the above processes (see Figure 26 and Figure 27). The sharp and sudden peaks in these graphs correspond to pellet ablation. This is a transient effect; after a time, whose duration depends on the plasma parameters before injection and on the penetration of the pellet, the density and temperature values return to pre-injection values because of particle confinement time, i.e., the particle confinement time for TJ-II plasmas increases with plasma density from 5 to 15 ms, being ~ 10 ± 3 ms when the line-averaged density goes above a critical density, i.e., ~ 61018 m-3 [217]. Generally, pellets that penetrate deeper into the plasma provoke a larger density increment, this being due to higher fuelling efficiency [2]. Moreover, the density perturbation lasts longer due to longer confinement at higher densities. Additionally, a burst of hard X-ray emission is sometimes observed when the pellet reaches the plasma. This is associated with the deconfinement of suprathermal electrons (this will be discussed in Chapter 5).
Figure 26. NBI heated plasma TJ-II discharge #43853 showing the evolution of the line-averaged electron density (blue), plasma energy (green), Hα emission (orange) and plasma current (sky blue), plus central electron and ion temperatures (yellow and purple, respectively). Here, the pellet enters the plasma at 1215.8 ms. Note: the Hα emission also shows the Hα emitted by the pellet.
In Figure 26, time traces from different TJ-II diagnostics show the effect of pellet injection in a NBI-heated plasma. As mentioned, it is seen how the line-averaged electron density, in green, increases within a few milliseconds after the pellet enters the plasma, while electron and ion temperatures decrease. The plasma energy decreases, and subsequently increases, but slower than the plasma density. In addition, it is shown how the electron temperature recovers its pre-injection value within a few milliseconds. However, the value of the central ion temperature recovers more slowly. The percentage drop in all injections is ⩾
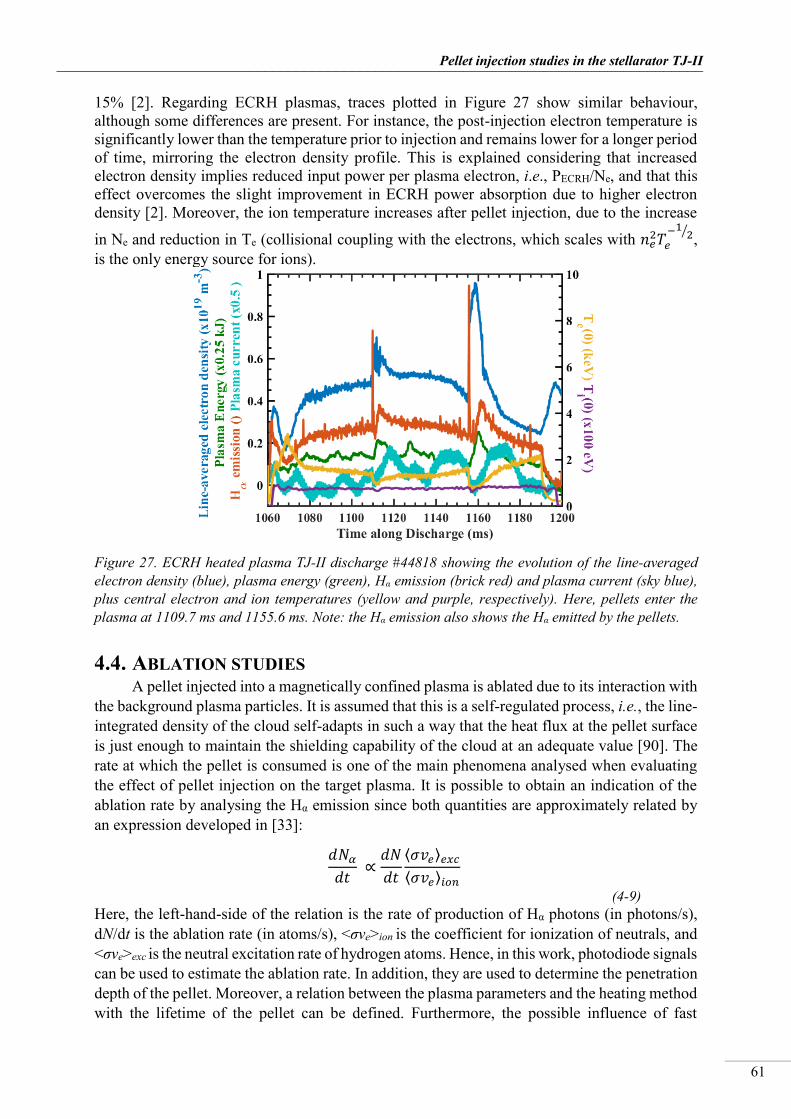
_________________________________________________________________________________
Pellet injection studies in the stellarator TJ-II
61
15% [2]. Regarding ECRH plasmas, traces plotted in Figure 27 show similar behaviour, although some differences are present. For instance, the post-injection electron temperature is significantly lower than the temperature prior to injection and remains lower for a longer period of time, mirroring the electron density profile. This is explained considering that increased electron density implies reduced input power per plasma electron, i.e., PECRH/Ne, and that this effect overcomes the slight improvement in ECRH power absorption due to higher electron density [2]. Moreover, the ion temperature increases after pellet injection, due to the increase
in Ne and reduction in Te (collisional coupling with the electrons, which scales with 𝑛𝑒2𝑇𝑒
−12⁄ ,
is the only energy source for ions).
Figure 27. ECRH heated plasma TJ-II discharge #44818 showing the evolution of the line-averaged electron density (blue), plasma energy (green), Hα emission (brick red) and plasma current (sky blue), plus central electron and ion temperatures (yellow and purple, respectively). Here, pellets enter the plasma at 1109.7 ms and 1155.6 ms. Note: the Hα emission also shows the Hα emitted by the pellets.
4.4. ABLATION STUDIES A pellet injected into a magnetically confined plasma is ablated due to its interaction with
the background plasma particles. It is assumed that this is a self-regulated process, i.e., the line-integrated density of the cloud self-adapts in such a way that the heat flux at the pellet surface is just enough to maintain the shielding capability of the cloud at an adequate value [90]. The rate at which the pellet is consumed is one of the main phenomena analysed when evaluating the effect of pellet injection on the target plasma. It is possible to obtain an indication of the ablation rate by analysing the Hα emission since both quantities are approximately related by an expression developed in [33]:
𝑑𝑁𝛼
𝑑𝑡 ∝
𝑑𝑁
𝑑𝑡
⟨𝜎𝑣𝑒⟩𝑒𝑥𝑐
⟨𝜎𝑣𝑒⟩𝑖𝑜𝑛
(4-9) Here, the left-hand-side of the relation is the rate of production of Hα photons (in photons/s), dN/dt is the ablation rate (in atoms/s), <σve>ion is the coefficient for ionization of neutrals, and <σve>exc is the neutral excitation rate of hydrogen atoms. Hence, in this work, photodiode signals can be used to estimate the ablation rate. In addition, they are used to determine the penetration depth of the pellet. Moreover, a relation between the plasma parameters and the heating method with the lifetime of the pellet can be defined. Furthermore, the possible influence of fast
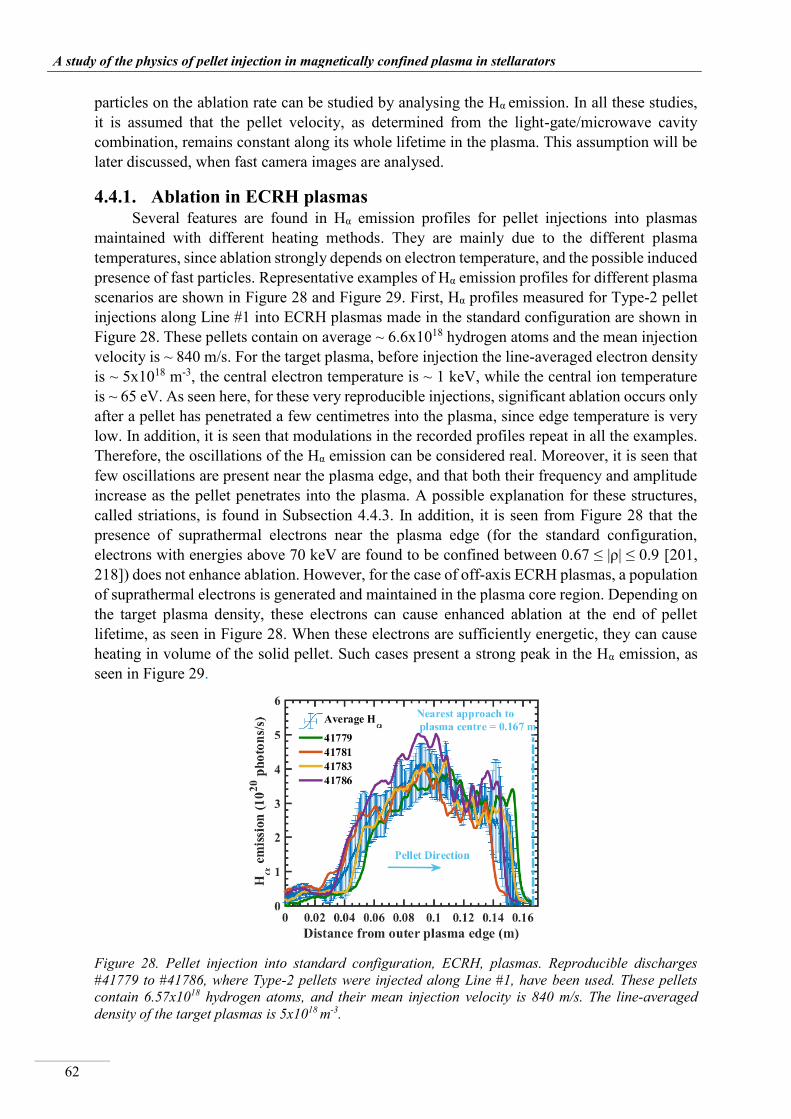
__________________________________________________________________________________
A study of the physics of pellet injection in magnetically confined plasma in stellarators
62
particles on the ablation rate can be studied by analysing the Hα emission. In all these studies, it is assumed that the pellet velocity, as determined from the light-gate/microwave cavity combination, remains constant along its whole lifetime in the plasma. This assumption will be later discussed, when fast camera images are analysed.
4.4.1. Ablation in ECRH plasmas Several features are found in Hα emission profiles for pellet injections into plasmas
maintained with different heating methods. They are mainly due to the different plasma temperatures, since ablation strongly depends on electron temperature, and the possible induced presence of fast particles. Representative examples of Hα emission profiles for different plasma scenarios are shown in Figure 28 and Figure 29. First, Hα profiles measured for Type-2 pellet injections along Line #1 into ECRH plasmas made in the standard configuration are shown in Figure 28. These pellets contain on average ~ 6.6x10¹⁸ hydrogen atoms and the mean injection velocity is ~ 840 m/s. For the target plasma, before injection the line-averaged electron density is ~ 5x10¹⁸ m-3, the central electron temperature is ~ 1 keV, while the central ion temperature is ~ 65 eV. As seen here, for these very reproducible injections, significant ablation occurs only after a pellet has penetrated a few centimetres into the plasma, since edge temperature is very low. In addition, it is seen that modulations in the recorded profiles repeat in all the examples. Therefore, the oscillations of the Hα emission can be considered real. Moreover, it is seen that few oscillations are present near the plasma edge, and that both their frequency and amplitude increase as the pellet penetrates into the plasma. A possible explanation for these structures, called striations, is found in Subsection 4.4.3. In addition, it is seen from Figure 28 that the presence of suprathermal electrons near the plasma edge (for the standard configuration, electrons with energies above 70 keV are found to be confined between 0.67 ≤ |ρ| ≤ 0.9 [201, 218]) does not enhance ablation. However, for the case of off-axis ECRH plasmas, a population of suprathermal electrons is generated and maintained in the plasma core region. Depending on the target plasma density, these electrons can cause enhanced ablation at the end of pellet lifetime, as seen in Figure 28. When these electrons are sufficiently energetic, they can cause heating in volume of the solid pellet. Such cases present a strong peak in the Hα emission, as seen in Figure 29.
Figure 28. Pellet injection into standard configuration, ECRH, plasmas. Reproducible discharges #41779 to #41786, where Type-2 pellets were injected along Line #1, have been used. These pellets contain 6.57x10¹⁸ hydrogen atoms, and their mean injection velocity is 840 m/s. The line-averaged density of the target plasmas is 5x10¹⁸ m-3.

_________________________________________________________________________________
Pellet injection studies in the stellarator TJ-II
63
Figure 29. Hα emission corresponding to Type-3 pellets, injected along Line #4, into off-axis ECRH plasmas. Discharge #44817 is represented by the green line; this pellet contains 1.28x10¹⁹ H atoms and its velocity is 1024 m/s; while for discharge #44818, the blue line, the particle content was 1.27x10¹⁹ H atoms and the velocity 1051 m/s.
4.4.2. Ablation in NBI-heated plasmas Now, the case of pellets injected into plasmas created with ECRH and maintained with
NBI is shown. Injections into plasmas heated with NBI 1 and with NBI 2 are plotted in different figures, Figure 30 and Figure 31, respectively. It should be noted that no significant differences in H emissions are found between both cases. Indeed, it can be observed that pellets penetrate beyond the plasma centre due to the lower plasma target temperature, i.e., ablation rate is more strongly dependent on plasma temperature than on plasma density [219]. Moreover, the H emission reduces after the pellet crosses the magnetic axis, since all magnetic surfaces have already been cooled. As in the ECRH case, the oscillations in the Hα emission are reproducible, and, additionally, both their frequency and amplitude vary along the pellet trajectory inside the plasma
Figure 30. Pellet injections into standard configuration, NBI-2 heated, plasmas in TJ-II. Reproducible discharges #41385 to #41397, where Type-2 pellets were injected along Line #2, have been used. These pellets contain 7.1 ± 1.7x10¹⁸ hydrogen atoms, and were injected at 1012 ± 206 m/s. The line-averaged density of the target plasmas is 219 m-3. The nearest approach to plasma centre (the flight path of Line #2 does not cross the magnetic axis) is at 0.172 m into the plasma.
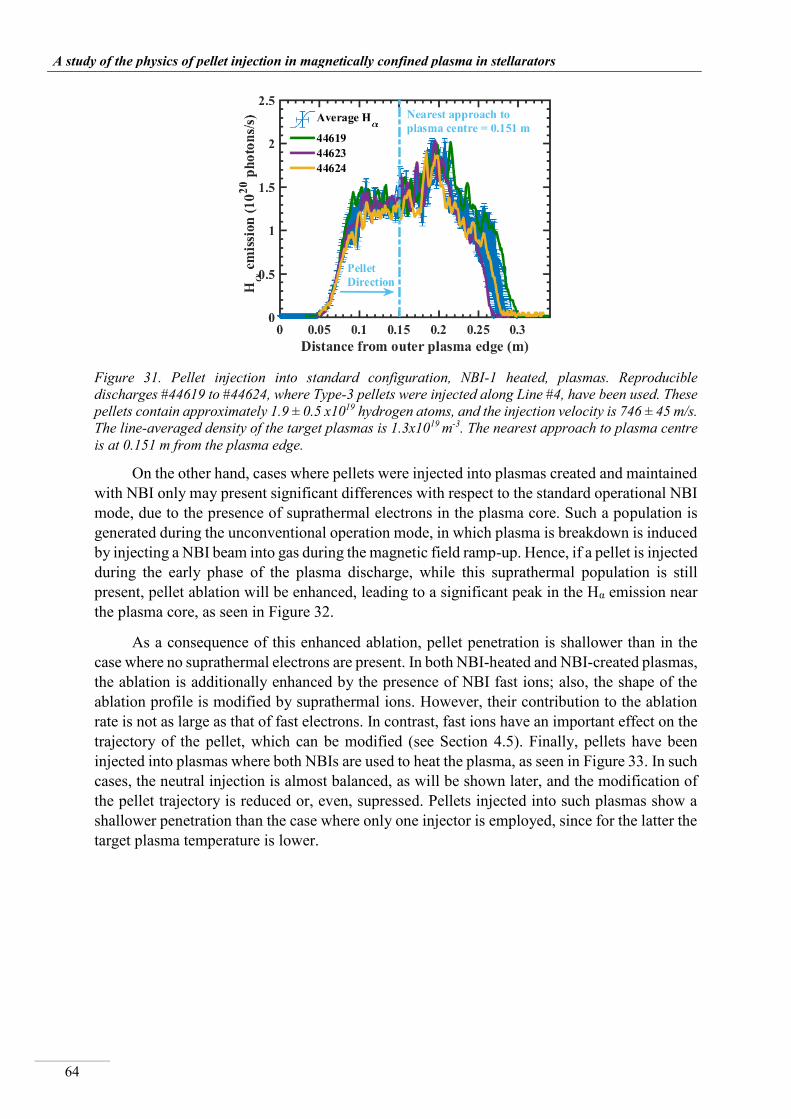
__________________________________________________________________________________
A study of the physics of pellet injection in magnetically confined plasma in stellarators
64
Figure 31. Pellet injection into standard configuration, NBI-1 heated, plasmas. Reproducible discharges #44619 to #44624, where Type-3 pellets were injected along Line #4, have been used. These pellets contain approximately 1.9 ± 0.5 x10¹⁹ hydrogen atoms, and the injection velocity is 746 ± 45 m/s. The line-averaged density of the target plasmas is 1.3x10¹⁹ m-3. The nearest approach to plasma centre is at 0.151 m from the plasma edge.
On the other hand, cases where pellets were injected into plasmas created and maintained with NBI only may present significant differences with respect to the standard operational NBI mode, due to the presence of suprathermal electrons in the plasma core. Such a population is generated during the unconventional operation mode, in which plasma is breakdown is induced by injecting a NBI beam into gas during the magnetic field ramp-up. Hence, if a pellet is injected during the early phase of the plasma discharge, while this suprathermal population is still present, pellet ablation will be enhanced, leading to a significant peak in the Hα emission near the plasma core, as seen in Figure 32.
As a consequence of this enhanced ablation, pellet penetration is shallower than in the case where no suprathermal electrons are present. In both NBI-heated and NBI-created plasmas, the ablation is additionally enhanced by the presence of NBI fast ions; also, the shape of the ablation profile is modified by suprathermal ions. However, their contribution to the ablation rate is not as large as that of fast electrons. In contrast, fast ions have an important effect on the trajectory of the pellet, which can be modified (see Section 4.5). Finally, pellets have been injected into plasmas where both NBIs are used to heat the plasma, as seen in Figure 33. In such cases, the neutral injection is almost balanced, as will be shown later, and the modification of the pellet trajectory is reduced or, even, supressed. Pellets injected into such plasmas show a shallower penetration than the case where only one injector is employed, since for the latter the target plasma temperature is lower.
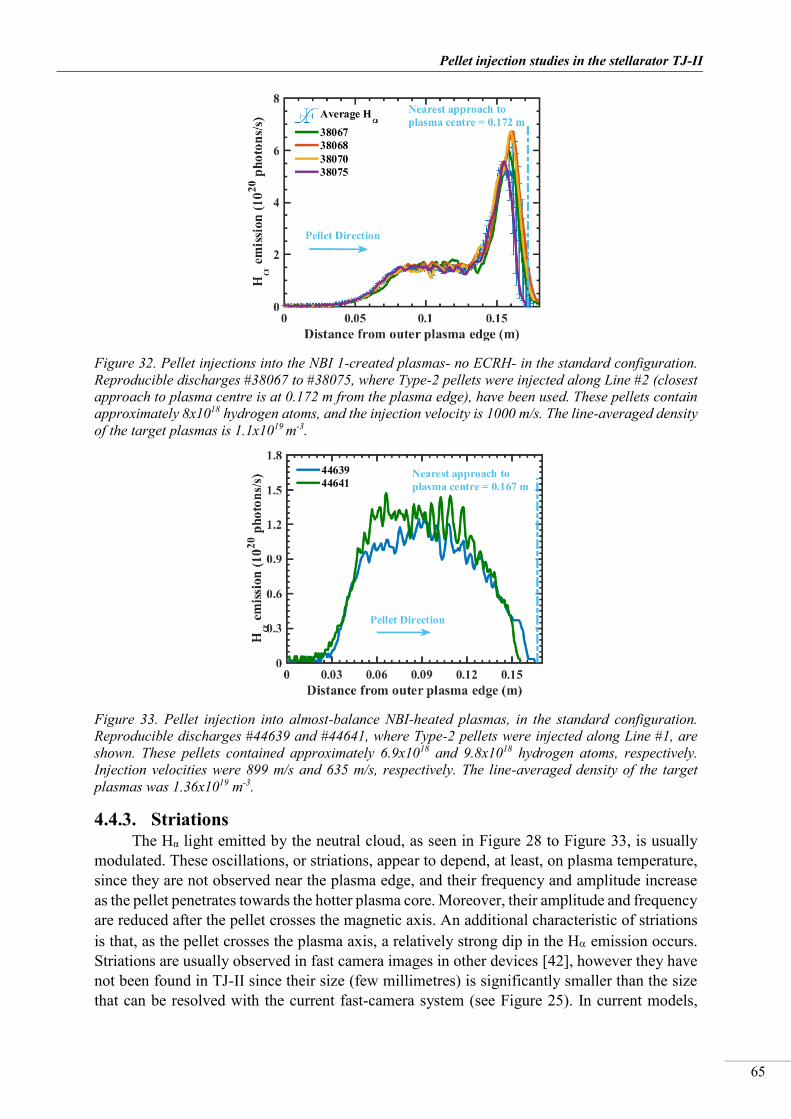
_________________________________________________________________________________
Pellet injection studies in the stellarator TJ-II
65
Figure 32. Pellet injections into the NBI 1-created plasmas- no ECRH- in the standard configuration. Reproducible discharges #38067 to #38075, where Type-2 pellets were injected along Line #2 (closest approach to plasma centre is at 0.172 m from the plasma edge), have been used. These pellets contain approximately 8x10¹⁸ hydrogen atoms, and the injection velocity is 1000 m/s. The line-averaged density of the target plasmas is 1.1x10¹⁹ m-3.
Figure 33. Pellet injection into almost-balance NBI-heated plasmas, in the standard configuration. Reproducible discharges #44639 and #44641, where Type-2 pellets were injected along Line #1, are shown. These pellets contained approximately 6.9x10¹⁸ and 9.8x10¹⁸ hydrogen atoms, respectively. Injection velocities were 899 m/s and 635 m/s, respectively. The line-averaged density of the target plasmas was 1.36x10¹⁹ m-3.
4.4.3. Striations The Hα light emitted by the neutral cloud, as seen in Figure 28 to Figure 33, is usually
modulated. These oscillations, or striations, appear to depend, at least, on plasma temperature, since they are not observed near the plasma edge, and their frequency and amplitude increase as the pellet penetrates towards the hotter plasma core. Moreover, their amplitude and frequency are reduced after the pellet crosses the magnetic axis. An additional characteristic of striations is that, as the pellet crosses the plasma axis, a relatively strong dip in the H emission occurs. Striations are usually observed in fast camera images in other devices [42], however they have not been found in TJ-II since their size (few millimetres) is significantly smaller than the size that can be resolved with the current fast-camera system (see Figure 25). In current models,

__________________________________________________________________________________
A study of the physics of pellet injection in magnetically confined plasma in stellarators
66
striations are linked to two different mechanisms. In the first one, the relative motion between the plasmoid and the pellet is considered to be responsible for striations, since, due to this motion, the pellet periodically loses its shielding cloud (this corresponds to an increase of the ablation) [40, 60, 220]. The second model is based on the Rayleigh-Taylor instability [221, 222], driven by the ExB rotation of the plasmoid about its symmetry axis parallel to B. According to this model, striation frequency depends on the ratio between the electron temperature and the magnetic field, and they appear only for a threshold rotation frequency, i.e., for a threshold electron temperature (about 100 eV for TJ-II). Observations in TJ-II, in agreement with results for ASDEX [59], support this theory, since striations are not present in the plasma edge and their frequency and amplitude increase with pellet penetration. In addition, for pellets penetrating beyond the magnetic axis, i.e., for pellets that crossed cooled magnetic surfaces, striations are reduced.
Now that the main features of ablation and the differences found for injections into different type of plasmas have been discussed, the relationship between the pellet penetration depth and its lifetime, as well as plasma and pellet parameters, can be introduced. After that, the influence of the heating method on ablation is further explained and the influence of fast particles is addressed.
4.4.4. Pellet penetration and lifetime dependence on plasma and pellet parameters
Pellets injected into TJ-II plasmas penetrate to radial positions that depend on different target plasma parameters, such as electron temperature or density, and on pellet characteristics, like mass or velocity [2]. In addition, all the mechanisms that modify the ablation rate, as suprathermal particles, contribute to increase, or reduce, pellet penetration. Since the main objective of pellet injection is to achieve peaked plasma density profiles (deep pellet penetration usually facilitates obtaining such profiles), knowing and understanding in detail all the parameters that affect penetration will facilitate achieving this objective. In this section, the dependence on plasma electron density and temperature, as well as on pellet mass and pellet velocity, are evaluated for TJ-II.
First, the dependence on the line-averaged electron density of target plasmas is studied. Line-averaged electron density is considered here since it is more representative of the overall plasma density than, for instance, central density. In addition, it is continually measured along a plasma discharge. Results for ECRH and NBI plasmas are plotted in independent figures to facilitate the interpretation. The penetration depth as a function of the target density for NBI scenarios is plotted in Figure 34, respectively, where all injections are for the Type-2 pellets into the TJ-II standard configuration. In addition, discharges in which hard X-rays (HXR), which indicate the presence of suprathermal electrons, are absent and others where they are detected are analysed independently. They are treated separately because fast electrons increase considerably the ablation rate, and hence, reduce significantly pellet penetration. It can be determined from the figure that pellet penetration increases, in general, with line-averaged density, i.e., pellets penetrate deeper into low temperature target plasma. However, this is not the case when a HXR flux is present. In such discharges, it is observed that penetration does not increase with target density, instead it remains almost constant around the position where suprathermal electrons, which destroy the pellet, are confined. This position is close to the plasma core and this is a behaviour typically observed, as previously mentioned, in the unusual


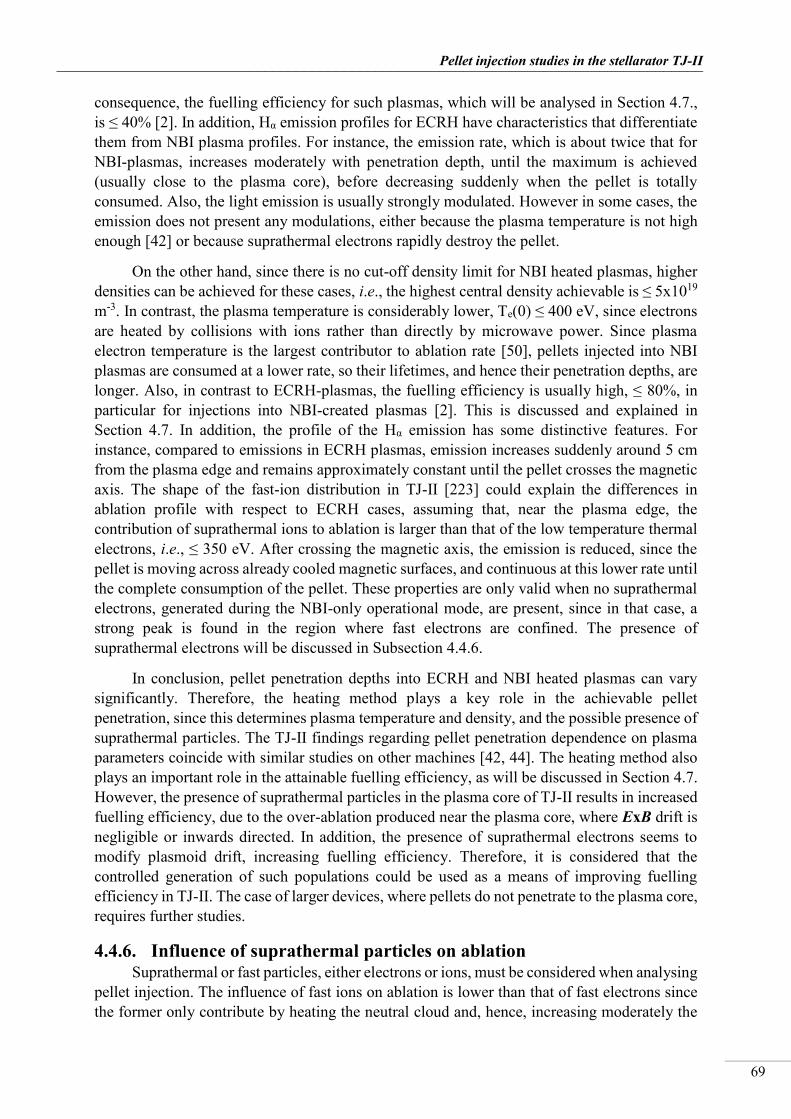
_________________________________________________________________________________
Pellet injection studies in the stellarator TJ-II
69
consequence, the fuelling efficiency for such plasmas, which will be analysed in Section 4.7., is ≤ 40% [2]. In addition, Hα emission profiles for ECRH have characteristics that differentiate them from NBI plasma profiles. For instance, the emission rate, which is about twice that for NBI-plasmas, increases moderately with penetration depth, until the maximum is achieved (usually close to the plasma core), before decreasing suddenly when the pellet is totally consumed. Also, the light emission is usually strongly modulated. However in some cases, the emission does not present any modulations, either because the plasma temperature is not high enough [42] or because suprathermal electrons rapidly destroy the pellet.
On the other hand, since there is no cut-off density limit for NBI heated plasmas, higher densities can be achieved for these cases, i.e., the highest central density achievable is ≤ 5x10¹⁹ m-3. In contrast, the plasma temperature is considerably lower, Te(0) ≤ 400 eV, since electrons are heated by collisions with ions rather than directly by microwave power. Since plasma electron temperature is the largest contributor to ablation rate [50], pellets injected into NBI plasmas are consumed at a lower rate, so their lifetimes, and hence their penetration depths, are longer. Also, in contrast to ECRH-plasmas, the fuelling efficiency is usually high, ≤ 80%, in particular for injections into NBI-created plasmas [2]. This is discussed and explained in Section 4.7. In addition, the profile of the Hα emission has some distinctive features. For instance, compared to emissions in ECRH plasmas, emission increases suddenly around 5 cm from the plasma edge and remains approximately constant until the pellet crosses the magnetic axis. The shape of the fast-ion distribution in TJ-II [223] could explain the differences in ablation profile with respect to ECRH cases, assuming that, near the plasma edge, the contribution of suprathermal ions to ablation is larger than that of the low temperature thermal electrons, i.e., ≤ 350 eV. After crossing the magnetic axis, the emission is reduced, since the pellet is moving across already cooled magnetic surfaces, and continuous at this lower rate until the complete consumption of the pellet. These properties are only valid when no suprathermal electrons, generated during the NBI-only operational mode, are present, since in that case, a strong peak is found in the region where fast electrons are confined. The presence of suprathermal electrons will be discussed in Subsection 4.4.6.
In conclusion, pellet penetration depths into ECRH and NBI heated plasmas can vary significantly. Therefore, the heating method plays a key role in the achievable pellet penetration, since this determines plasma temperature and density, and the possible presence of suprathermal particles. The TJ-II findings regarding pellet penetration dependence on plasma parameters coincide with similar studies on other machines [42, 44]. The heating method also plays an important role in the attainable fuelling efficiency, as will be discussed in Section 4.7. However, the presence of suprathermal particles in the plasma core of TJ-II results in increased fuelling efficiency, due to the over-ablation produced near the plasma core, where ExB drift is negligible or inwards directed. In addition, the presence of suprathermal electrons seems to modify plasmoid drift, increasing fuelling efficiency. Therefore, it is considered that the controlled generation of such populations could be used as a means of improving fuelling efficiency in TJ-II. The case of larger devices, where pellets do not penetrate to the plasma core, requires further studies.
4.4.6. Influence of suprathermal particles on ablation Suprathermal or fast particles, either electrons or ions, must be considered when analysing
pellet injection. The influence of fast ions on ablation is lower than that of fast electrons since the former only contribute by heating the neutral cloud and, hence, increasing moderately the

__________________________________________________________________________________
A study of the physics of pellet injection in magnetically confined plasma in stellarators
70
ablation rate and modifying the shape of the ablation profile. However, the effect of suprathermal electrons on ablation can be dramatic, see Figure 32. As mentioned before, fast electrons, with energy ≥ 70 keV, are confined to the plasma edge region, 0.67 ≤ |ρ| ≤ 0.9, in the case of ECRH plasmas [201, 218]. However, there is no evidence that this population enhances ablation, as seen in Figure 28. On the other hand, in some specific cases, enhanced ablation is observed in the plasma core region. For instance, in some cases pellets injected into plasmas created and maintained with NBI-only reveal a zone of local ablation enhancement near the plasma centre. Such enhancement occurs for pellets injected when the plasma current is, typically, ≥ 1 kA; this current is a residual of that induced during magnetic field ramp-up to generate the plasmas in the non-standard operation mode [201, 218]. As the plasma density increases along such discharges, the current decreases and this enhancement is reduced considerably. Similar features are observed for injections into low-density off-axis ECRH plasmas, since a population of suprathermal electrons is also generated in the plasma core. An example of this is found in Figure 29.
4.5. PELLET DYNAMICS STUDIES Up to this point, it has been considered that the pellet trajectory remains straight,
following the original injection path. Moreover, it has been assumed that pellet speed is constant, i.e., that radial acceleration is zero or negligible. In this section, fast camera images are used to verify the assumption of constant pellet velocity and to study pellet trajectory after entering the plasma. Finally, the possible mechanisms involved in trajectory deflections are discussed.
4.5.1. Radial acceleration of the pellet The possible radial acceleration of pellets inside the plasma is studied using fast camera
images. Only ECRH discharges are used in order to avoid possible additional phenomena related to the presence of fast ions in NBI heated plasmas. These calculations require high image recording rates and very short exposure times in order to reduce the uncertainty in the pellet position. Ideally, frame rate and exposure time should be set in such a way that the pellet moves within a single pixel during the whole exposure time. For pellet velocities around 1 km/s and pixel-size equivalences shown in Table 5, the corresponding frame rate and exposure time are outside the system capabilities. However, frame rates ≥ 150 kfps and exposure times ≤ 4 μs are sufficient for this type of analysis. For instance, a snap-shot image of a Type-2 pellet injected along Line #1 is shown in Figure 37, where the shielding cloud, expanding along the magnetic field lines can be seen. In this image that is not saturated, the pellet is assumed to be radially located inside the region of most intense recorded light emission.
Snap-shot series of similar images can be used to estimate pellet velocity. For instance, see Figure 38a), where a Type-2 pellet, injected from Line #1, is recorded during its whole lifetime. The positions of maximum light intensity in each frame of Figure 38a), determined from each light profile along the radial direction (see Figure 38b), are used to calculate the pellet velocity, as observed in Figure 39. Although snap-shot images corresponding to end of pellet lifetime in Figure 38 are saturated, error bars are not significantly affected, since the principal contributor to calculated uncertainties is camera calibration, i.e., the pixel-meter equivalence. It can be concluded here that radial acceleration is zero or negligible. Therefore, the assumption of constant radial velocity in the reconstruction of the Hα profile is considered valid. For this particular case, the velocity obtained is 849 ± 20 m/s.
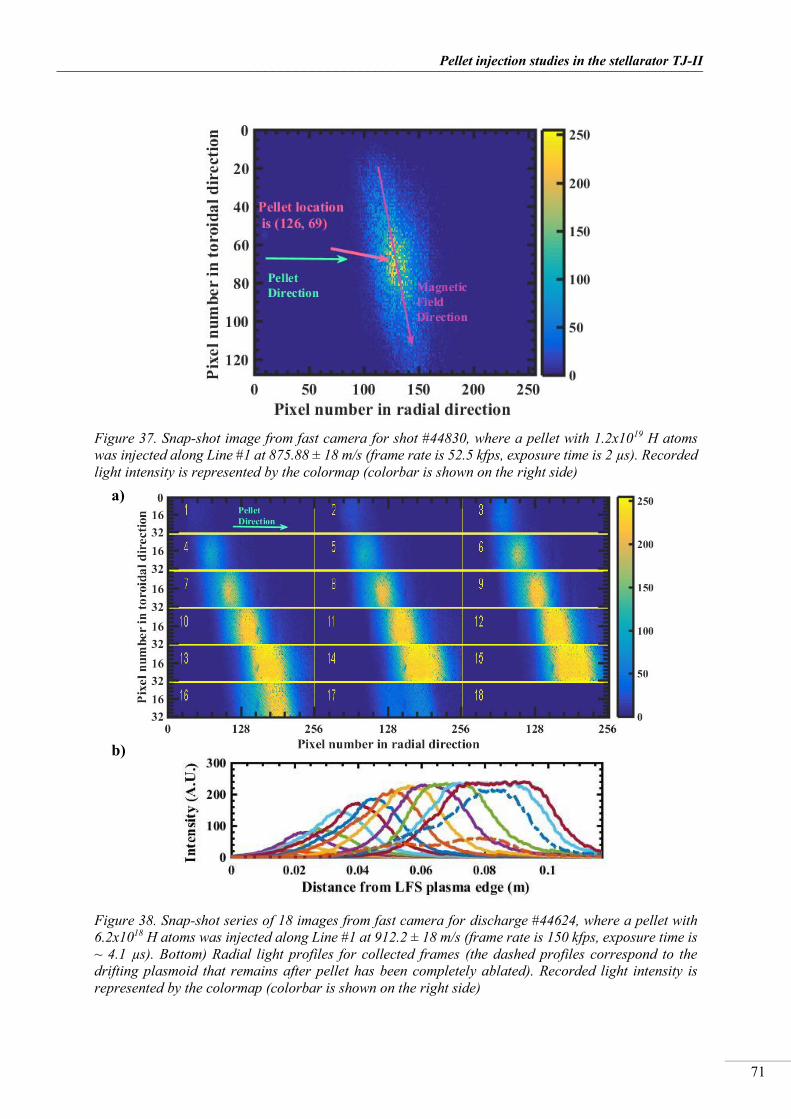
_________________________________________________________________________________
Pellet injection studies in the stellarator TJ-II
71
Figure 37. Snap-shot image from fast camera for shot #44830, where a pellet with 1.2x10¹⁹ H atoms was injected along Line #1 at 875.88 ± 18 m/s (frame rate is 52.5 kfps, exposure time is 2 µs). Recorded light intensity is represented by the colormap (colorbar is shown on the right side)
Figure 38. Snap-shot series of 18 images from fast camera for discharge #44624, where a pellet with 6.2x10¹⁸ H atoms was injected along Line #1 at 912.2 ± 18 m/s (frame rate is 150 kfps, exposure time is ~ 4.1 µs). Bottom) Radial light profiles for collected frames (the dashed profiles correspond to the drifting plasmoid that remains after pellet has been completely ablated). Recorded light intensity is represented by the colormap (colorbar is shown on the right side)
a)
b)
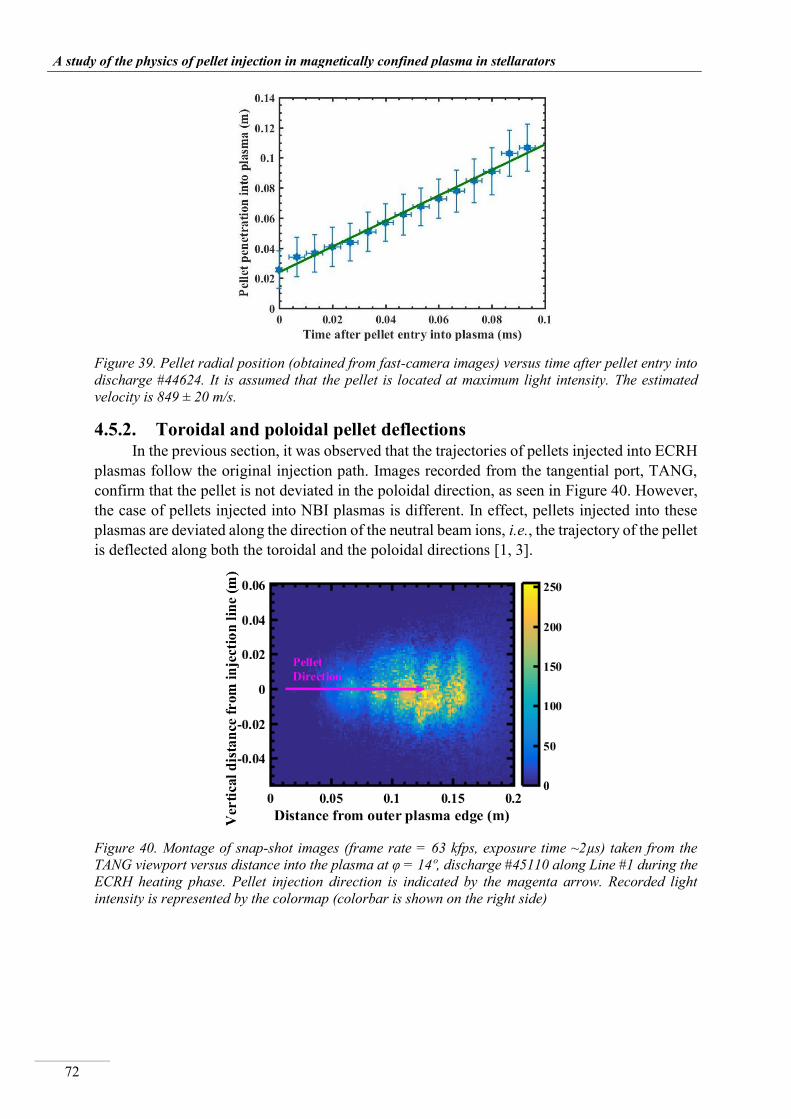
__________________________________________________________________________________
A study of the physics of pellet injection in magnetically confined plasma in stellarators
72
Figure 39. Pellet radial position (obtained from fast-camera images) versus time after pellet entry into discharge #44624. It is assumed that the pellet is located at maximum light intensity. The estimated velocity is 849 ± 20 m/s.
4.5.2. Toroidal and poloidal pellet deflections In the previous section, it was observed that the trajectories of pellets injected into ECRH
plasmas follow the original injection path. Images recorded from the tangential port, TANG, confirm that the pellet is not deviated in the poloidal direction, as seen in Figure 40. However, the case of pellets injected into NBI plasmas is different. In effect, pellets injected into these plasmas are deviated along the direction of the neutral beam ions, i.e., the trajectory of the pellet is deflected along both the toroidal and the poloidal directions [1, 3].
Figure 40. Montage of snap-shot images (frame rate = 63 kfps, exposure time ~2µs) taken from the TANG viewport versus distance into the plasma at φ = 14º, discharge #45110 along Line #1 during the ECRH heating phase. Pellet injection direction is indicated by the magenta arrow. Recorded light intensity is represented by the colormap (colorbar is shown on the right side)

_________________________________________________________________________________
Pellet injection studies in the stellarator TJ-II
73
Figure 41. Montages of snap-shot images of pellet ablation taken from INNER TOP viewport versus distance into the plasma at φ= 14º for a) Shot #44628 during its unbalance NBI 1 phase (frame rate = 31.5 kfps, exposure time 1/v s) for a pellet with 8.02x10¹⁸ H atoms injected at 889 m/s along Line #1 b) Shot #44634 during its unbalanced NBI 2 heating phase (frame rate = 37.5 kfps, exposure time 1/v) for a pellet with 6.85x10¹⁸ H atoms injected at 891 m/s along Line #1. Recorded light intensity is represented by the colormap (colorbar is shown on the right side)
An example of deflections in the toroidal direction can be seen in Figure 41. It is observed here, from the INNER TOP viewport, that the pellet direction deviates from its original path, following the neutral beam injection direction, i.e., it is co-counter for NBI 1 and counter for NBI 2 (see Figure 17). Deflections in the poloidal direction can be observed from the TANG viewport, as represented in Figure 42. However, these deviations are not a large as toroidal deflections. In addition, although poloidal deflections can be observed easily for NBI 1 plasmas, they are not easily distinguished for the NBI 2 case [1].
Figure 42. Montage of snap-shot images (frame rate = 63 kfps, exposure time ~2 µs) taken from the TANG viewport versus distance into the plasma at φ = 13º, for a pellet with 1.38x10¹⁹ H atoms injected into discharge #45091 at 1008.6 m/s along Line #4 during an unbalanced NBI 1 heating phase. Recorded light intensity is represented by the colormap (colorbar is shown on the right side)
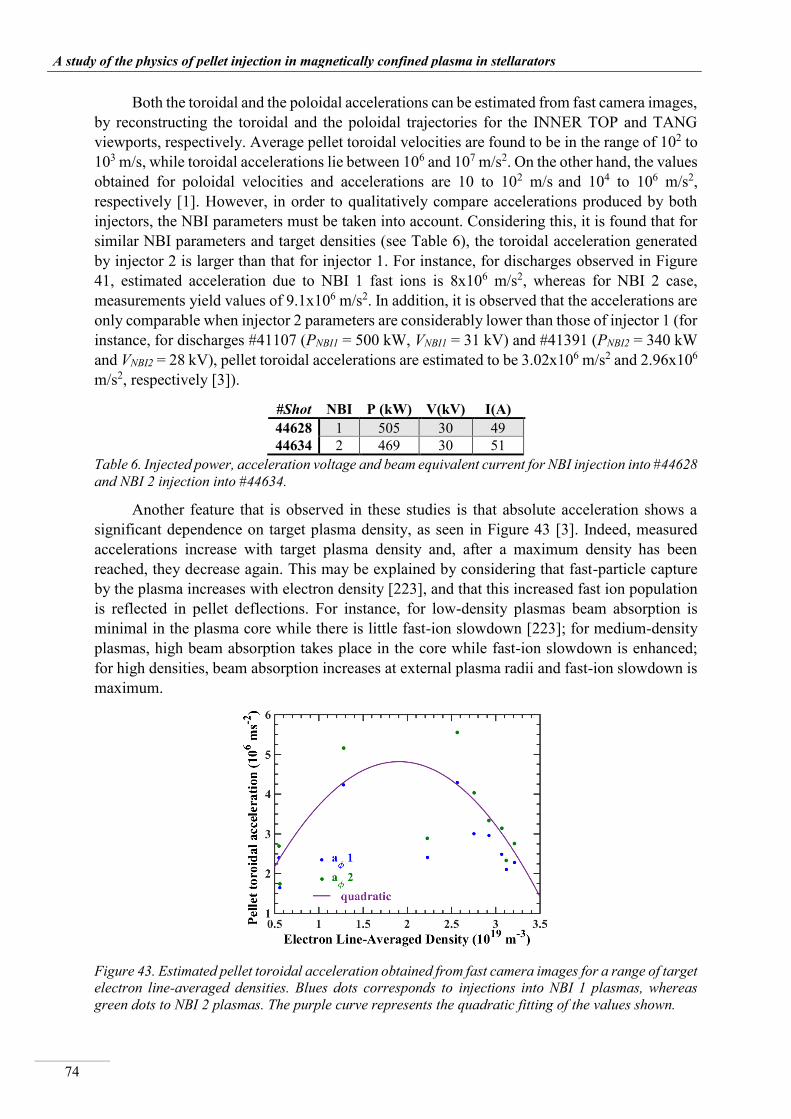
__________________________________________________________________________________
A study of the physics of pellet injection in magnetically confined plasma in stellarators
74
Both the toroidal and the poloidal accelerations can be estimated from fast camera images, by reconstructing the toroidal and the poloidal trajectories for the INNER TOP and TANG viewports, respectively. Average pellet toroidal velocities are found to be in the range of 102 to 103 m/s, while toroidal accelerations lie between 106 and 107 m/s2. On the other hand, the values obtained for poloidal velocities and accelerations are 10 to 102 m/s and 104 to 106 m/s2, respectively [1]. However, in order to qualitatively compare accelerations produced by both injectors, the NBI parameters must be taken into account. Considering this, it is found that for similar NBI parameters and target densities (see Table 6), the toroidal acceleration generated by injector 2 is larger than that for injector 1. For instance, for discharges observed in Figure 41, estimated acceleration due to NBI 1 fast ions is 8x10⁶ m/s2, whereas for NBI 2 case, measurements yield values of 9.1x10⁶ m/s2. In addition, it is observed that the accelerations are only comparable when injector 2 parameters are considerably lower than those of injector 1 (for instance, for discharges #41107 (PNBI1 = 500 kW, VNBI1 = 31 kV) and #41391 (PNBI2 = 340 kW and VNBI2 = 28 kV), pellet toroidal accelerations are estimated to be 3.02x10⁶ m/s2 and 2.96x10⁶ m/s2, respectively [3]).
#Shot NBI P (kW) V(kV) I(A) 44628 1 505 30 49 44634 2 469 30 51
Table 6. Injected power, acceleration voltage and beam equivalent current for NBI injection into #44628 and NBI 2 injection into #44634.
Another feature that is observed in these studies is that absolute acceleration shows a significant dependence on target plasma density, as seen in Figure 43 [3]. Indeed, measured accelerations increase with target plasma density and, after a maximum density has been reached, they decrease again. This may be explained by considering that fast-particle capture by the plasma increases with electron density [223], and that this increased fast ion population is reflected in pellet deflections. For instance, for low-density plasmas beam absorption is minimal in the plasma core while there is little fast-ion slowdown [223]; for medium-density plasmas, high beam absorption takes place in the core while fast-ion slowdown is enhanced; for high densities, beam absorption increases at external plasma radii and fast-ion slowdown is maximum.
Figure 43. Estimated pellet toroidal acceleration obtained from fast camera images for a range of target electron line-averaged densities. Blues dots corresponds to injections into NBI 1 plasmas, whereas green dots to NBI 2 plasmas. The purple curve represents the quadratic fitting of the values shown.

_________________________________________________________________________________
Pellet injection studies in the stellarator TJ-II
75
Pellet deflections are usually associated with an asymmetric over-ablation, related to plasma heating, i.e., to an asymmetric electron or ion distribution function. Such over-ablation produces an acceleration of the pellet in the direction opposite to the over-heating. This effect is commonly known as the Rocket Effect [42]. In the case of TJ-II unbalance-NBI plasmas, the deflection of the pellet trajectory can be associated to a suprathermal ion population with an asymmetric spatial distribution. However, using the current fast-camera system, it is not possible to univocally determine the trajectory of the pellet, since three-dimensional measurements are not available. Therefore, it is not possible to determine the actual direction of the pellet acceleration to verify whether such acceleration is parallel to the neutral beam injection direction [1]. In addition, estimations of the acceleration produced by the Rocket Effect show that it cannot explain by itself the observed acceleration. An additional explanation for pellet acceleration is a momentum exchange with NBI fast ions. Calculations show that momentum exchange, or a rather a combination of both Rocket Effect and momentum exchange, is responsible for the observed acceleration. For instance, toroidal accelerations estimated for momentum exchange are in the range 105 to 108 m/s2, whereas for the Rocket Effect are in the range 105 to 106 m/s2. Accelerations predicted for momentum exchange cover a wider range of values since its dependence on pellet mass is larger than in the Rocket Effect case [3].
An additional analysis regarding pellet heat asymmetries is the study of the cloud emission profile. Light emitted by the cloud surrounding injected pellets into plasmas heated with different methods, and of several densities and temperatures, has been analysed. Some representative examples can be found in Figure 44. Here, it is seen that no asymmetry in the light emission along field lines is found [3]. However, the absence of observable emission asymmetries does not exclude the possibility of heating asymmetries.
Figure 44. Light emission along field lines from fast camera images for four different snap-shot images (blue, magenta, orange and green), corresponding to Type-2 a pellet injected along Line #2 into the TJ-II standard configuration during NBI 2 heating phase, discharge #41391. Pellet in assumed to be located at the point of maximum measured light intensity for each line. Note: Cloud 1 corresponds to the beginning of pellet lifetime (close to plasma edge) and Cloud 4 to the end of pellet lifetime (inner plasma)

__________________________________________________________________________________
A study of the physics of pellet injection in magnetically confined plasma in stellarators
76
4.6. PLASMOID DRIFT MEASUREMENTS An ExB drift of the partially ionized ablated material (plasmoid) is expected from
theoretical predictions [127–136] and has been seen in experimental observations in other devices [40, 53, 80, 81, 83–86]. Fast camera images, recorded at low exposure times, can be used to estimate the direction and the speed of such drifting in the TJ-II. This drift is predicted to be about one order of magnitude higher than the pellet speed. Therefore, any error associated with the pellet displacement during the exposure time is insignificant; for instance, for a pellet injected at 900 m/s and for an exposure time of 2 μs, the uncertainty is smaller than 2 pixels ≈ 1.1 mm for TANG images, and smaller than 3 pixels ≈ 2.9 mm for INNER TOP. Hence, images taken from the INNER TOP viewport allow estimating the radial drift, whereas from the TANG port, both radial and poloidal drifts can be studied.
4.6.1. Plasmoid radial drift Plasmoid radial drifts can be observed from both the INNER TOP viewport and the
TANG port. Starting with TOP images, two different ways of estimating the radial drift are possible. In the first method, the radial asymmetry observed in individual images of the shielding cloud, with reduced exposure times (for τexp ≤ 12 μs, images are not saturated, although τexp ≤ 4 μs is preferable), can be used to estimate this velocity. For instance, for non-saturated images, a radial asymmetry is observed. Then by fitting the radial profile with two Gaussian, one representing the emitting shielding cloud, centred on the pellet position, and the other representing the drifting plasmoid, the required velocity is obtained (see Figure 45) [1]. In addition, in some images, the whole plasmoid is observed to be detached from the cloud, drifting towards the outer plasma edge. For these situations, a second estimation of the plasmoid velocity can be obtained and an indication of the time evolution of the drift velocity can be deduced, i.e. the drift acceleration.
Figure 45. Integrated light emission profile from fast camera images (yellow), which corresponds to the light emitted by the neutral cloud surrounding the ablating pellet plus the emission from a drifting plasmoid for discharge #44624. The ablation (blue) and plasmoid (red) contributions are obtained by fitting two Gaussian profiles to the yellow profile.
For instance, for the ECRH plasma of discharge #44624, a pellet Type-2 was injected along Line #1. The pellet contained 6.21 ± 0.3x10¹⁸ hydrogen atoms and the injection velocity was 912 ± 9 m/s. The radial profiles of the recorded images are shown in Figure 38b), and the fitting of one these profiles is shown in Figure 45. The average radial drift velocity for this
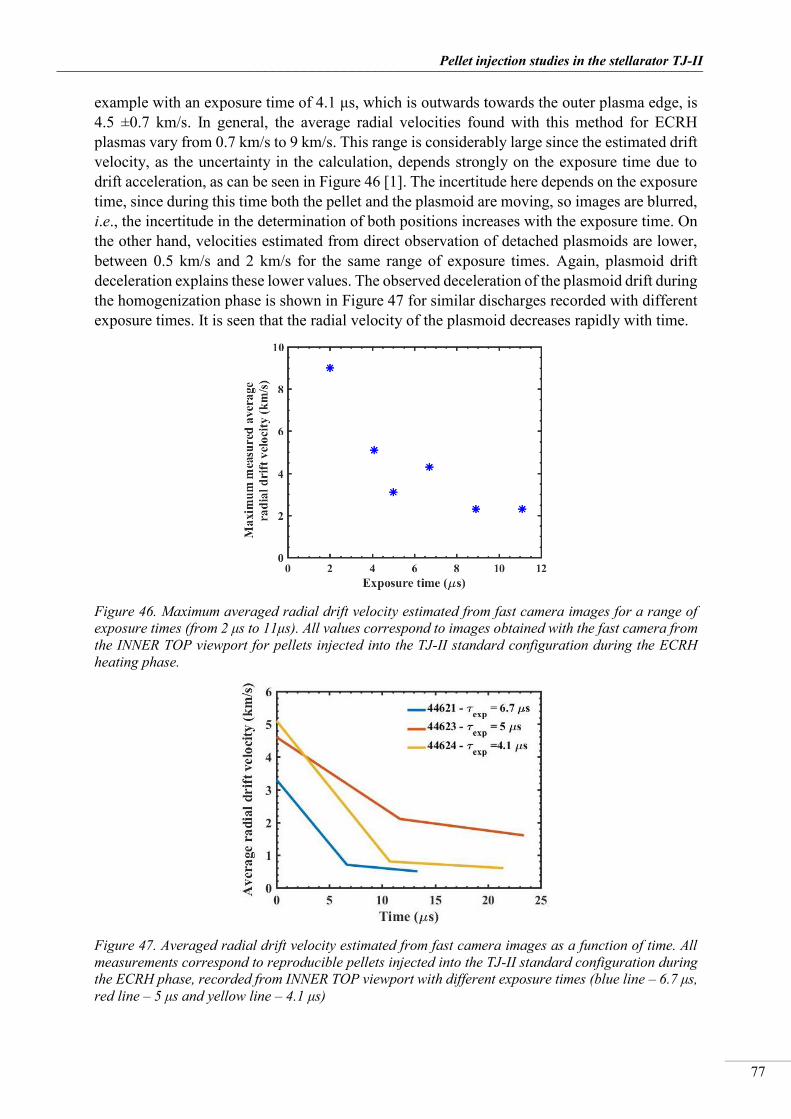
_________________________________________________________________________________
Pellet injection studies in the stellarator TJ-II
77
example with an exposure time of 4.1 μs, which is outwards towards the outer plasma edge, is 4.5 ±0.7 km/s. In general, the average radial velocities found with this method for ECRH plasmas vary from 0.7 km/s to 9 km/s. This range is considerably large since the estimated drift velocity, as the uncertainty in the calculation, depends strongly on the exposure time due to drift acceleration, as can be seen in Figure 46 [1]. The incertitude here depends on the exposure time, since during this time both the pellet and the plasmoid are moving, so images are blurred, i.e., the incertitude in the determination of both positions increases with the exposure time. On the other hand, velocities estimated from direct observation of detached plasmoids are lower, between 0.5 km/s and 2 km/s for the same range of exposure times. Again, plasmoid drift deceleration explains these lower values. The observed deceleration of the plasmoid drift during the homogenization phase is shown in Figure 47 for similar discharges recorded with different exposure times. It is seen that the radial velocity of the plasmoid decreases rapidly with time.
Figure 46. Maximum averaged radial drift velocity estimated from fast camera images for a range of exposure times (from 2 μs to 11μs). All values correspond to images obtained with the fast camera from the INNER TOP viewport for pellets injected into the TJ-II standard configuration during the ECRH heating phase.
Figure 47. Averaged radial drift velocity estimated from fast camera images as a function of time. All measurements correspond to reproducible pellets injected into the TJ-II standard configuration during the ECRH phase, recorded from INNER TOP viewport with different exposure times (blue line – 6.7 μs, red line – 5 μs and yellow line – 4.1 μs)
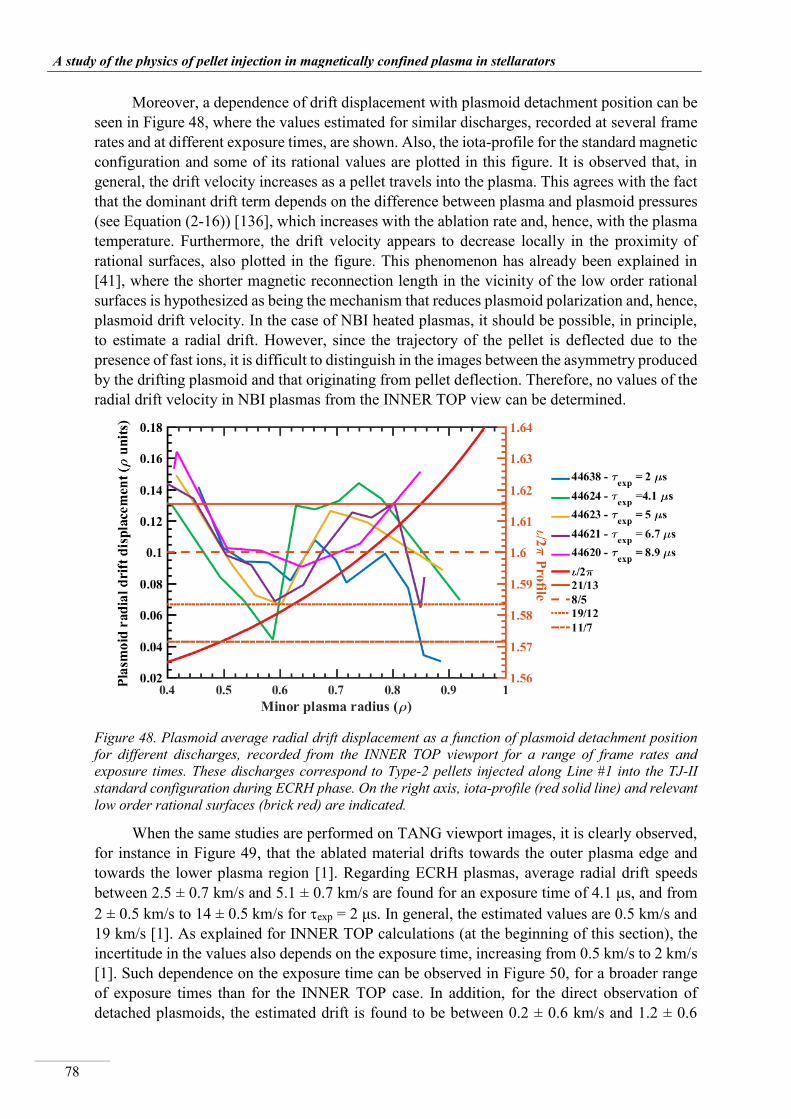
__________________________________________________________________________________
A study of the physics of pellet injection in magnetically confined plasma in stellarators
78
Moreover, a dependence of drift displacement with plasmoid detachment position can be seen in Figure 48, where the values estimated for similar discharges, recorded at several frame rates and at different exposure times, are shown. Also, the iota-profile for the standard magnetic configuration and some of its rational values are plotted in this figure. It is observed that, in general, the drift velocity increases as a pellet travels into the plasma. This agrees with the fact that the dominant drift term depends on the difference between plasma and plasmoid pressures (see Equation (2-16)) [136], which increases with the ablation rate and, hence, with the plasma temperature. Furthermore, the drift velocity appears to decrease locally in the proximity of rational surfaces, also plotted in the figure. This phenomenon has already been explained in [41], where the shorter magnetic reconnection length in the vicinity of the low order rational surfaces is hypothesized as being the mechanism that reduces plasmoid polarization and, hence, plasmoid drift velocity. In the case of NBI heated plasmas, it should be possible, in principle, to estimate a radial drift. However, since the trajectory of the pellet is deflected due to the presence of fast ions, it is difficult to distinguish in the images between the asymmetry produced by the drifting plasmoid and that originating from pellet deflection. Therefore, no values of the radial drift velocity in NBI plasmas from the INNER TOP view can be determined.
Figure 48. Plasmoid average radial drift displacement as a function of plasmoid detachment position for different discharges, recorded from the INNER TOP viewport for a range of frame rates and exposure times. These discharges correspond to Type-2 pellets injected along Line #1 into the TJ-II standard configuration during ECRH phase. On the right axis, iota-profile (red solid line) and relevant low order rational surfaces (brick red) are indicated.
When the same studies are performed on TANG viewport images, it is clearly observed, for instance in Figure 49, that the ablated material drifts towards the outer plasma edge and towards the lower plasma region [1]. Regarding ECRH plasmas, average radial drift speeds between 2.5 ± 0.7 km/s and 5.1 ± 0.7 km/s are found for an exposure time of 4.1 μs, and from 2 ± 0.5 km/s to 14 ± 0.5 km/s for exp = 2 μs. In general, the estimated values are 0.5 km/s and 19 km/s [1]. As explained for INNER TOP calculations (at the beginning of this section), the incertitude in the values also depends on the exposure time, increasing from 0.5 km/s to 2 km/s [1]. Such dependence on the exposure time can be observed in Figure 50, for a broader range of exposure times than for the INNER TOP case. In addition, for the direct observation of detached plasmoids, the estimated drift is found to be between 0.2 ± 0.6 km/s and 1.2 ± 0.6
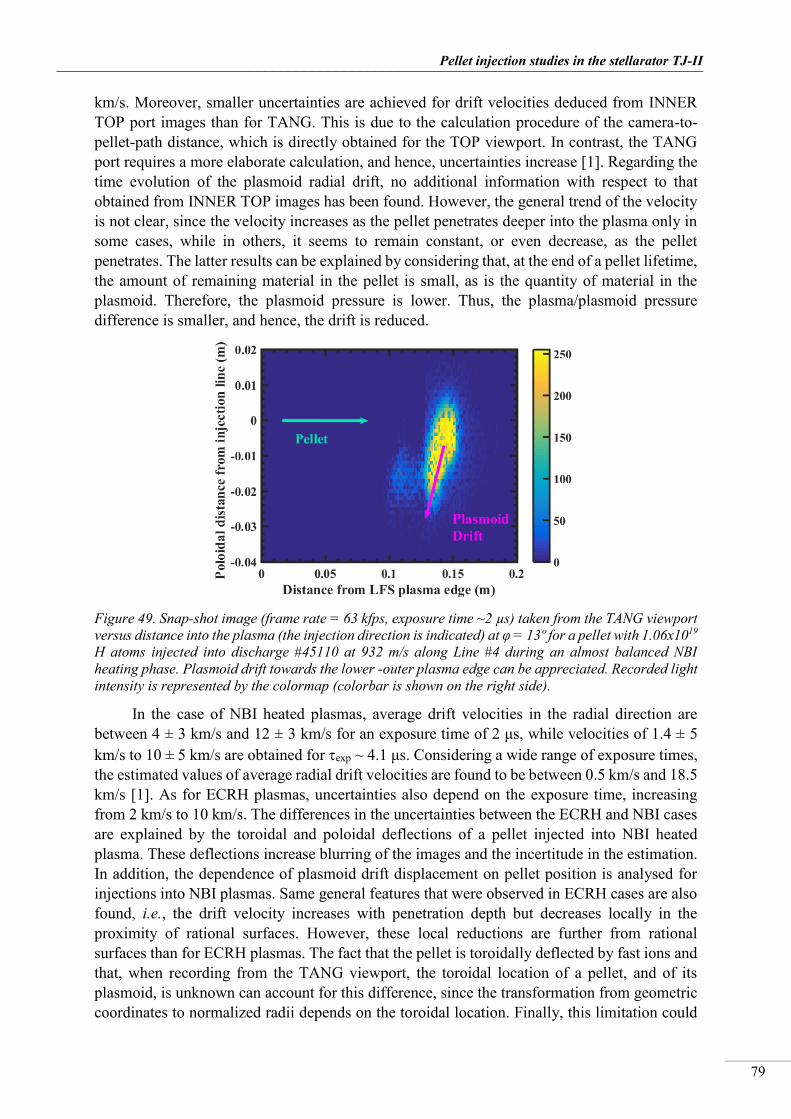
_________________________________________________________________________________
Pellet injection studies in the stellarator TJ-II
79
km/s. Moreover, smaller uncertainties are achieved for drift velocities deduced from INNER TOP port images than for TANG. This is due to the calculation procedure of the camera-to-pellet-path distance, which is directly obtained for the TOP viewport. In contrast, the TANG port requires a more elaborate calculation, and hence, uncertainties increase [1]. Regarding the time evolution of the plasmoid radial drift, no additional information with respect to that obtained from INNER TOP images has been found. However, the general trend of the velocity is not clear, since the velocity increases as the pellet penetrates deeper into the plasma only in some cases, while in others, it seems to remain constant, or even decrease, as the pellet penetrates. The latter results can be explained by considering that, at the end of a pellet lifetime, the amount of remaining material in the pellet is small, as is the quantity of material in the plasmoid. Therefore, the plasmoid pressure is lower. Thus, the plasma/plasmoid pressure difference is smaller, and hence, the drift is reduced.
Figure 49. Snap-shot image (frame rate = 63 kfps, exposure time ~2 µs) taken from the TANG viewport versus distance into the plasma (the injection direction is indicated) at φ = 13º for a pellet with 1.06x10¹⁹ H atoms injected into discharge #45110 at 932 m/s along Line #4 during an almost balanced NBI heating phase. Plasmoid drift towards the lower -outer plasma edge can be appreciated. Recorded light intensity is represented by the colormap (colorbar is shown on the right side).
In the case of NBI heated plasmas, average drift velocities in the radial direction are between 4 ± 3 km/s and 12 ± 3 km/s for an exposure time of 2 μs, while velocities of 1.4 ± 5 km/s to 10 ± 5 km/s are obtained for exp ~ 4.1 μs. Considering a wide range of exposure times, the estimated values of average radial drift velocities are found to be between 0.5 km/s and 18.5 km/s [1]. As for ECRH plasmas, uncertainties also depend on the exposure time, increasing from 2 km/s to 10 km/s. The differences in the uncertainties between the ECRH and NBI cases are explained by the toroidal and poloidal deflections of a pellet injected into NBI heated plasma. These deflections increase blurring of the images and the incertitude in the estimation. In addition, the dependence of plasmoid drift displacement on pellet position is analysed for injections into NBI plasmas. Same general features that were observed in ECRH cases are also found, i.e., the drift velocity increases with penetration depth but decreases locally in the proximity of rational surfaces. However, these local reductions are further from rational surfaces than for ECRH plasmas. The fact that the pellet is toroidally deflected by fast ions and that, when recording from the TANG viewport, the toroidal location of a pellet, and of its plasmoid, is unknown can account for this difference, since the transformation from geometric coordinates to normalized radii depends on the toroidal location. Finally, this limitation could
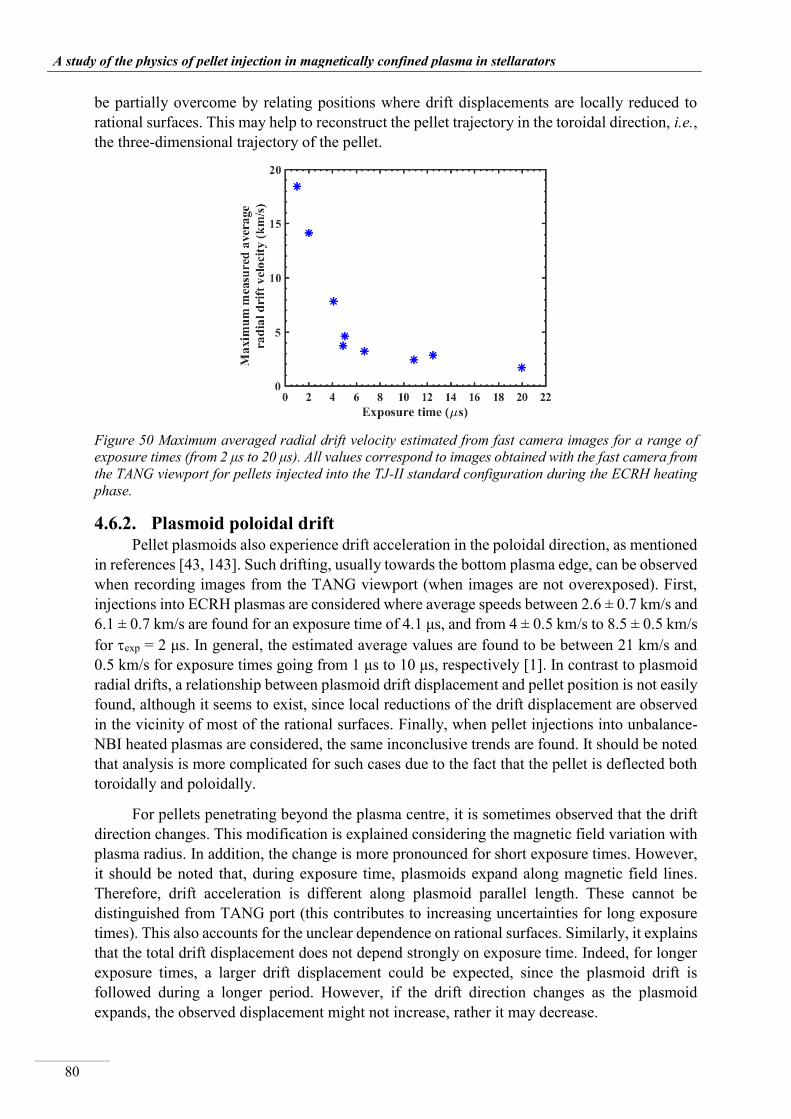
__________________________________________________________________________________
A study of the physics of pellet injection in magnetically confined plasma in stellarators
80
be partially overcome by relating positions where drift displacements are locally reduced to rational surfaces. This may help to reconstruct the pellet trajectory in the toroidal direction, i.e., the three-dimensional trajectory of the pellet.
Figure 50 Maximum averaged radial drift velocity estimated from fast camera images for a range of exposure times (from 2 μs to 20 μs). All values correspond to images obtained with the fast camera from the TANG viewport for pellets injected into the TJ-II standard configuration during the ECRH heating phase.
4.6.2. Plasmoid poloidal drift Pellet plasmoids also experience drift acceleration in the poloidal direction, as mentioned
in references [43, 143]. Such drifting, usually towards the bottom plasma edge, can be observed when recording images from the TANG viewport (when images are not overexposed). First, injections into ECRH plasmas are considered where average speeds between 2.6 ± 0.7 km/s and 6.1 ± 0.7 km/s are found for an exposure time of 4.1 μs, and from 4 ± 0.5 km/s to 8.5 ± 0.5 km/s for exp = 2 μs. In general, the estimated average values are found to be between 21 km/s and 0.5 km/s for exposure times going from 1 μs to 10 μs, respectively [1]. In contrast to plasmoid radial drifts, a relationship between plasmoid drift displacement and pellet position is not easily found, although it seems to exist, since local reductions of the drift displacement are observed in the vicinity of most of the rational surfaces. Finally, when pellet injections into unbalance-NBI heated plasmas are considered, the same inconclusive trends are found. It should be noted that analysis is more complicated for such cases due to the fact that the pellet is deflected both toroidally and poloidally.
For pellets penetrating beyond the plasma centre, it is sometimes observed that the drift direction changes. This modification is explained considering the magnetic field variation with plasma radius. In addition, the change is more pronounced for short exposure times. However, it should be noted that, during exposure time, plasmoids expand along magnetic field lines. Therefore, drift acceleration is different along plasmoid parallel length. These cannot be distinguished from TANG port (this contributes to increasing uncertainties for long exposure times). This also accounts for the unclear dependence on rational surfaces. Similarly, it explains that the total drift displacement does not depend strongly on exposure time. Indeed, for longer exposure times, a larger drift displacement could be expected, since the plasmoid drift is followed during a longer period. However, if the drift direction changes as the plasmoid expands, the observed displacement might not increase, rather it may decrease.

_________________________________________________________________________________
Pellet injection studies in the stellarator TJ-II
81
Figure 51. Plasmoid average drift displacement as a function of plasmoid detachment position
for different discharges, recorded from the TANG viewport for a range of frame rates and exposure times. These discharges correspond to Type-3 pellets injected along Line #4 into the TJ-II standard configuration during NBI 1 heating phase. On the right axis, iota-profile (red solid line) and relevant low-order rational surfaces (brick red) are indicated.
Above all, it should be noted that drift displacement is only considered for one of the two directions, while the other is neglected. In reality, it is necessary to consider drift in both directions to correctly analyse the evolution of plasmoid drift along a pellet trajectory. For instance, total displacements considering both radial and poloidal drifts are found in Figure 51 for NBI 1 heated plasmas. Considering drifts in both directions, it is seen that for ECRH and almost-balanced NBI heating, i.e., cases of non, or negligible, pellet toroidal deflection, a dependence between local drift decrease and rational surfaces is clearly observed. However, for unbalanced NBI heating, for which the pellet position changes toroidally, such local reductions in drift displacement cannot be linked to rational surface positions along the original injection path. This is explained, as mentioned, by the fact that the exact toroidal position of a deflected pellet is unknown, as is the position of rational surfaces, due to the strong twisting of the magnetic flux surfaces with toroidal angle. If it is assumed that these local minima in the drift displacement indicate the radial locations of rational surfaces, then this might allow reconstructing of the toroidal pellet trajectory.
Finally, an almost-balanced NBI heating case (discharge #45110) is further analysed by considering a montage of snap-shot images, see Figure 52. From this analysis, it is seen that, once the pellet has crossed the magnetic axis, the direction of the drift seems to change. This change could be an indication of the inwards-directed drift predicted by current homogenization models [132, 136, 224]. Such changes have been observed in tokamaks [40], but not in non-axisymmetric devices [225]. However, such images are limited to this discharge of balanced-NBI heating, i.e., very deep penetration with images free of blurring due to pellet trajectory deflections. Thus, it is not possible to compare different exposure times. When more injections into such discharges are available, the existence of inwards drifts in TJ-II could be confirmed and studied without the need of HFS injections. Drift displacements, considering the sum of radial and poloidal drifts, for this case are shown in Figure 53.

__________________________________________________________________________________
A study of the physics of pellet injection in magnetically confined plasma in stellarators
82
Figure 52. Montage of snap-shot images recorded with exp = 2 μs from TANG viewport during pellet injection into discharge #45110. It corresponded to a Type-3 pellet injected along Line #4 into the TJ-II standard configuration, during almost balanced NBI (NBI 1 + NBI 2) heating phase (note: neutral absorption is not symmetric). Pellet direction is indicated by a magenta arrow, and pellet nearest approach to plasma edge is indicated by a dotted-magenta line. In addition, plasmoid drift directions are indicated by purple arrows. Recorded light intensity is represented by the colormap (colorbar is shown on the right side)
Figure 53. Plasmoid average drift displacement as a function of plasmoid detachment position for #45110 discharge, recorded from the TANG viewport with an exposure time exp = 2 μs. This discharge corresponds to a Type-3 pellet injected along Line #4 into the TJ-II standard configuration during an almost balanced NBI (NBI 1 +NBI 2) heating phase. On the right axis, iota-profile (red solid line) and relevant rational surfaces (brick red) are indicated.
4.7. FUELLING EFFICIENCY STUDIES Pellet fuelling efficiency, defined as the ratio between the number of particles deposited
in the plasma and the pellet particle content, is one of the quantities that must be optimized in future fusion reactors. Therefore, fuelling efficiency studies have been carried out in the TJ-II,

_________________________________________________________________________________
Pellet injection studies in the stellarator TJ-II
83
for both ECRH and NBI heated plasmas, to broaden the knowledge of fuelling efficiency dependence on plasma and pellet parameters. For this, the plasma electron content is determined, using the Thomson Scattering (TS) profiles, for several time instances after pellet injections, until pellet electrons have completely diffused about the plasma. During this time, the neutral cloud is completely ionized and homogenized in the background plasma, i.e., it expands until plasmoid and plasma pressures equilibrate. The shot-to-shot technique is employed to reconstruct the density evolution after pellet injections, i.e., a single TS measurement per discharge is done, at different times after pellet injection, for several reproducible injections into reproducible discharges. Using this method, the electron density evolution, as shown in Figure 54 a) and b) for ECRH and NBI plasmas, respectively, is obtained. It can be observed here that density increment moves inwards with time after injection, resulting in a substantial increment of the density core and a smaller, or even negligible, increment of the edge density [2]. In addition, deposition profile evolution can be studied and compared to the Hα emission profile [2]. It can be noticed here that pellet electron deposition is outwardly shifted with respect to the Hα emission, the latter giving an indication of the ablation profile. This difference is related to the ExB drift of the ionized material, highlighted in previous subsections of this chapter using fast camera images; it has also been detected in other devices.
Figure 54. TS electron density profiles measured before (red solid line) and at several time points after pellet injection into reproducible discharges created with the standard magnetic configuration a) #41777 to #41786 (solid lines, Type-2 pellets along Line #1), corresponding to ECR-heated plasmas. In addition, profiles of the net increase in electron density for the same time points are shown (dash-lines); and b) #39047 to #39049 (dot-dash for 2.7 ms and dash for 18.7 ms; Type-2 pellets along Line #2), corresponding to NBI-heated plasmas; Hα emission (yellow solid line) and distribution of pellet electrons (dash-line) localized between surfaces with 1 mm separation, at 2.7 ms as a function of distance from the plasma edge are included. Images from [2].
Regarding fuelling efficiencies, measured values are compared and analysed for a broad range of target plasma densities. For this, pellet particle contents are determined from microwave cavity signals. Pellet masses are obtained from these signals knowing the hydrogen atom mass and the density of solid hydrogen (1.637x10⁻²⁷ kg and 89 kg/m3, respectively). In addition, it is assumed that mass losses, due to friction with the inner guide tube walls, between the cavity and the plasma are negligible since guiding tubes are short (1.1 m) and straight. On
a) b)
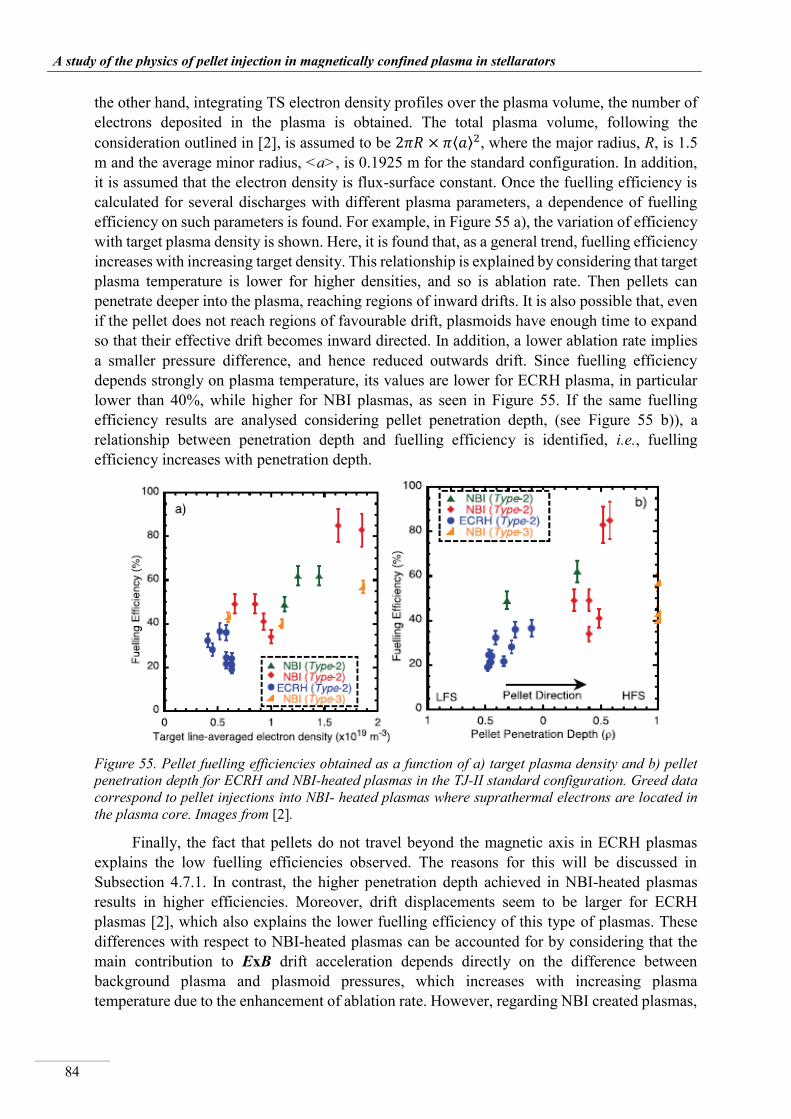
__________________________________________________________________________________
A study of the physics of pellet injection in magnetically confined plasma in stellarators
84
the other hand, integrating TS electron density profiles over the plasma volume, the number of electrons deposited in the plasma is obtained. The total plasma volume, following the consideration outlined in [2], is assumed to be 2𝜋𝑅 × 𝜋⟨𝑎⟩2, where the major radius, R, is 1.5 m and the average minor radius, <a>, is 0.1925 m for the standard configuration. In addition, it is assumed that the electron density is flux-surface constant. Once the fuelling efficiency is calculated for several discharges with different plasma parameters, a dependence of fuelling efficiency on such parameters is found. For example, in Figure 55 a), the variation of efficiency with target plasma density is shown. Here, it is found that, as a general trend, fuelling efficiency increases with increasing target density. This relationship is explained by considering that target plasma temperature is lower for higher densities, and so is ablation rate. Then pellets can penetrate deeper into the plasma, reaching regions of inward drifts. It is also possible that, even if the pellet does not reach regions of favourable drift, plasmoids have enough time to expand so that their effective drift becomes inward directed. In addition, a lower ablation rate implies a smaller pressure difference, and hence reduced outwards drift. Since fuelling efficiency depends strongly on plasma temperature, its values are lower for ECRH plasma, in particular lower than 40%, while higher for NBI plasmas, as seen in Figure 55. If the same fuelling efficiency results are analysed considering pellet penetration depth, (see Figure 55 b)), a relationship between penetration depth and fuelling efficiency is identified, i.e., fuelling efficiency increases with penetration depth.
Figure 55. Pellet fuelling efficiencies obtained as a function of a) target plasma density and b) pellet penetration depth for ECRH and NBI-heated plasmas in the TJ-II standard configuration. Greed data correspond to pellet injections into NBI- heated plasmas where suprathermal electrons are located in the plasma core. Images from [2].
Finally, the fact that pellets do not travel beyond the magnetic axis in ECRH plasmas explains the low fuelling efficiencies observed. The reasons for this will be discussed in Subsection 4.7.1. In contrast, the higher penetration depth achieved in NBI-heated plasmas results in higher efficiencies. Moreover, drift displacements seem to be larger for ECRH plasmas [2], which also explains the lower fuelling efficiency of this type of plasmas. These differences with respect to NBI-heated plasmas can be accounted for by considering that the main contribution to ExB drift acceleration depends directly on the difference between background plasma and plasmoid pressures, which increases with increasing plasma temperature due to the enhancement of ablation rate. However, regarding NBI created plasmas,
_________________________________________________________________________________
Pellet injection studies in the stellarator TJ-II
85
a core-localized population of suprathermal electrons enhances ablation in this region and destroys the remaining pellet. Although this over-ablation in the plasma core limits pellet penetration, it results in higher fuelling efficiencies with respect to injections into similar target plasmas with no suprathermal electrons in the core. These higher fuelling efficiencies are explained by a combination of two different mechanisms. On one hand, the outwards-directed drift acceleration in the core region is expected to be small or negligible, and, in addition, to rapidly become inwards-directed as the plasmoid expands. Therefore, the amount of lost material due to plasmoid drift is reduced. On the other hand, the presence of suprathermal electrons appears to modify the drift acceleration. However, a complete understanding for this effect is still needed. It should be considered also that for cases where a pellet crosses completely the plasma without being fully ablated, fuelling efficiencies are reduced.
4.7.1. Relation between plasmoid drift and fuelling efficiency It has already been outlined in Figure 55b) that fuelling efficiency depends significantly
on pellet penetration. The improvement of fuelling efficiency with penetration depth can be explained by considering plasmoid ExB drift. Plasmoid drift is given, for an arbitrary magnetic configuration, by the inverse curvature radius, 1/Rc. Considering this, the radial, vD
rad, and poloidal, vD
pol, components of the drift velocity are obtained from [43]:
𝑑𝑣𝐷𝑟𝑎𝑑
𝑑𝑡= −
2(𝑝0 − 𝑝∞)
𝑛0𝑚𝑖⟨�⃗⃗�⟩ ⟨1
|𝐵|2⟩
⟨𝛻|𝐵|
|𝐵|2𝛻𝜌
|𝛻𝜌| ⟩
𝑑𝑣𝐷𝑝𝑜𝑙
𝑑𝑡= −
2(𝑝0 − 𝑝∞)
𝑛0𝑚𝑖⟨�⃗⃗�⟩ ⟨1
|𝐵|2⟩
⟨𝛻𝜌
|𝛻𝜌|2×
𝛻|𝐵| × 𝛻𝜌
|𝐵|2 ⟩
(4-11) Here, p0 and p∞ are the pressure of the plasmoid and the background plasma (in units of Pa), respectively; B is the background magnetic field (in units of T), n0 is the plasmoid density (in units of m−3), mi is the plasmoid ion mass (in units of kg) and ρ is the constant flux surface label. Then, for regions of unfavourable curvature, where the drift is outwards directed, a significant fraction of plasmoid particles can be lost. On the contrary, for regions of propitious curvature, in which plasmoid particles drift inwards, particles remain inside the Last Closed Flux Surface (LCFS). In addition, as a plasmoid expands, particles will be located in regions of different curvatures, and hence, a fraction of its particles will drift outwards and other inwards. This implies that, even if a plasmoid is detached from the pellet in a region of unfavourable curvature, if it expands fast enough, so that its extremities reach regions of favourable curvature before arriving at the plasma edge, the effective drift acceleration can change its direction, and a fraction of the plasmoid may remain inside the LCFS. For LFS injection in TJ-II, the local inverse curvature radius vector fields corresponding to injection Lines #1 and #4, where arrow directions agree with what is explained here, are shown in Figure 56.
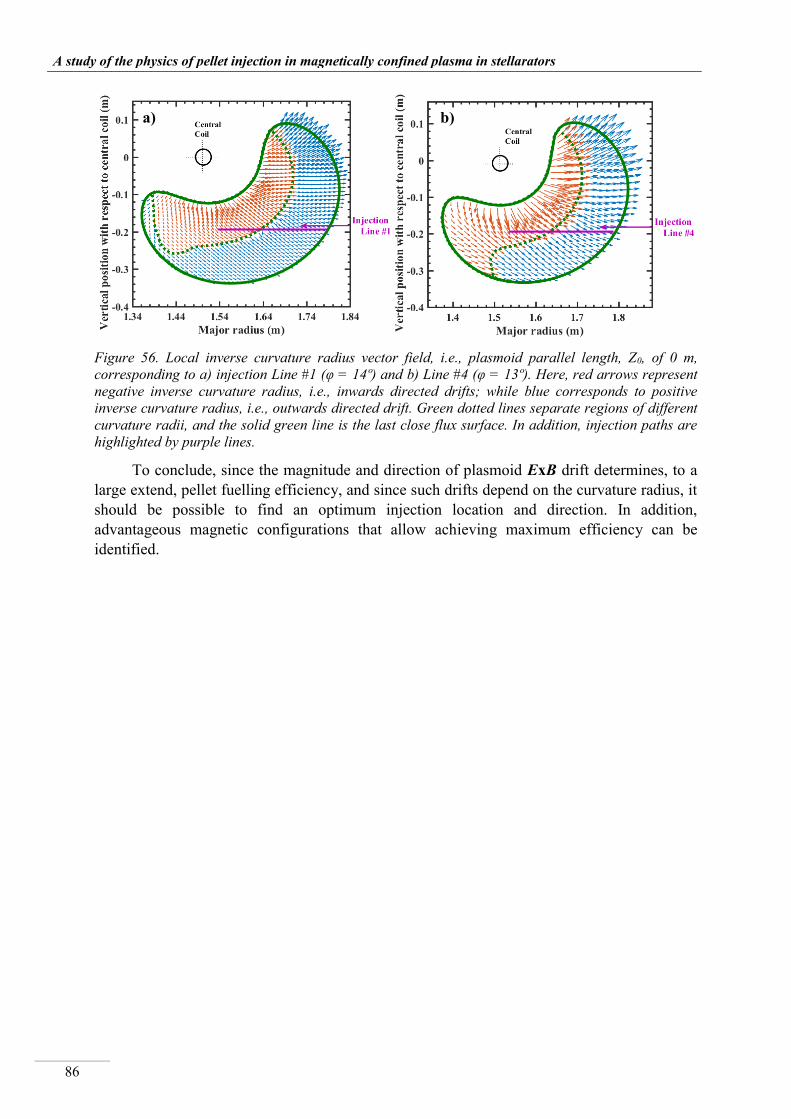
__________________________________________________________________________________
A study of the physics of pellet injection in magnetically confined plasma in stellarators
86
Figure 56. Local inverse curvature radius vector field, i.e., plasmoid parallel length, Z0, of 0 m, corresponding to a) injection Line #1 (φ = 14º) and b) Line #4 (φ = 13º). Here, red arrows represent negative inverse curvature radius, i.e., inwards directed drifts; while blue corresponds to positive inverse curvature radius, i.e., outwards directed drift. Green dotted lines separate regions of different curvature radii, and the solid green line is the last close flux surface. In addition, injection paths are highlighted by purple lines.
To conclude, since the magnitude and direction of plasmoid ExB drift determines, to a large extend, pellet fuelling efficiency, and since such drifts depend on the curvature radius, it should be possible to find an optimum injection location and direction. In addition, advantageous magnetic configurations that allow achieving maximum efficiency can be identified.
b) a)

_________________________________________________________________________________
Pellet injection simulations in stellarators
87
5. PELLET INJECTION SIMULATIONS IN STELLARATORS For a cryogenic pellet injected in a magnetically confined plasma, several effects are
involved in its ablation and in the evolution of the ablated material, which determine post-injection density and temperature profiles. A deep understanding of these mechanisms is mandatory, not only to truly comprehend experimental results, but to be able to make accurate predictions that allow designing new pellet injectors and determining the most appropriate injection scenario, which will be fundamental to achieve high density and effective fuelling in large experimental devices and future reactors. Considering these needs, a simple ablation model [90, 106] has been used to adapt a code that simulates pellet ablation in TJ-II, for both microwave and neutral-beam heated plasmas. The basis of this code is presented in Section 5.1. Then, some representative cases of pellet injection in TJ-II are simulated using Thomson Scattering (TS) measurements as input. These predictions are compared to experimental results, and afterwards, comments are made about the identified limitations of this model. Given these limitations, a stellarator version of the Hydrogen Pellet Injection (HPI2) code was developed. Here, it is adapted for the TJ-II and the W7-X. A summary of ablation and homogenization models used in HPI2 is found in Section 5.2. Moreover, a brief comment about modifications made to this new version is given. Next, simulations of pellet injections into ECRH plasmas in TJ-II are shown and compared with experimental results. Later, simulations are made for W7-X. Finally, the limitations of models used by this code are discussed.
5.1. A NEUTRAL-GAS-SHIELDING-BASED CODE TO SIMULATE PELLET ABLATION IN TJ-II The Neutral Gas Shielding (NGS) model, described in Subsection 2.3.1, was the first
attempt to explain pellet ablation. Despite its simplicity, it succeeded in reproducing many of the experimental penetration depths and/or pellet lifetimes. As mentioned, the spatial distribution of the neutral part of the cloud is described by hydrodynamic conservation equations, assuming steady-state conditions. Here, a simple code based on Y. Nakamura’s et al. [106] extension of the Parks and Turnbull model [90] to NBI-heated plasmas has been adapted. In this model, the spatial distribution of the neutral cloud is modelled using fluid equations for a transonic flow, with the additional heat source of suprathermal ions. These equations, for steady-state, and assuming spherical expansion, are [106]:
𝜌𝑣𝑟2 = 𝑐𝑜𝑛𝑠𝑡𝑎𝑛𝑡 ≡𝐺
4𝜋, 𝐺 ≡ 𝑎𝑏𝑙𝑎𝑡𝑖𝑜𝑛 𝑟𝑎𝑡𝑒 (
kg
s)
(5-1)
𝜌𝑣𝑑𝑣
𝑑𝑟+
𝑑𝑝
𝑑𝑑𝑟= 0
(5-2)
𝜌𝑣𝑑
𝑑𝑟(
𝛾𝑒𝑇
(𝛾 − 1)𝑚+
𝑣2
2) = 𝑒𝜌(𝑊𝑒 + 𝑊𝑓)
(5-3) Here, m (kg) is the average molecular mass and ρ (kg/m3) is the cloud mass density; while v (m/s) is the fluid velocity, p is the cloud pressure and T (eV) is the neutral cloud temperature. The radial distance from the centre of the spherical pellet is given by r (m), whereas γ is the ratio of specific heats (7/5 for molecular hydrogen). The system is closed by an equation of state for the cloud, which in this case is the ideal gas equation of state:

__________________________________________________________________________________
A study of the physics of pellet injection in magnetically confined plasma in stellarators
88
𝑝 =𝜌𝑒𝑇
𝑚
(5-4) The heat sources, We and Wf (eV/Kg·s), due to thermal electrons and fast ions, respectively, are defined, for the slab approximation:
𝑊𝑒 =𝑓𝐵𝑒
𝜌
𝑑𝑞𝑒
𝑑𝑟
(5-5)
𝑊𝑓 =𝑓𝐵𝑓
𝜌
𝑑𝑞𝑓
𝑑𝑟
(5-6) In these expressions, fBe and fBf are the fractions of the heat flux deposited for net cloud heating, obtained from atomic processes and the geometry of the incident flux, for thermal electrons and fast ions, respectively. While qe and qf are the electron and fast-ion fluxes to the pellet, respectively. A detailed definition of these quantities is given in [106].
After defining all the quantities of the system, it should be noted that a transonic flow in the cloud is imposed in this model. Taking advantage of such flow, all the quantities in the system are normalized by their values at the sonic value, designated by *, to make the system suitable for numerical calculations. Therefore, the following changes are done:
𝑟 → 𝑟′ =𝑟
𝑟∗
𝑣 → 𝑣′ =𝑣
𝑣∗, 𝑣∗ = 𝐶𝑠 = √
𝛾𝑒𝑇∗
𝑚
𝑇 → 𝑇′ =𝑇
𝑇∗→ Θ′ ≡ 𝑇′
12
𝜌 = 𝜌′ =𝜌
𝜌∗=
1
𝑣′𝑟′2
𝑝 → 𝑝′ =𝑝
𝑝∗=
𝑇′
𝑣′𝑟′2
(5-7) Considering these new variables (5-7), the system (5-1)-(5-4) is rewritten as:
𝑑𝑣′
𝑑𝑟′=
2
𝛩′2 − 𝑣′2(𝑊′𝑒 + 𝑊′𝑓 −
𝛩′2𝑣′
𝑟)
𝑑𝛩′
𝑑𝑟′=
𝑊′𝑒 + 𝑊′𝑓
𝑣′𝛩′+
(1 − 𝛾)𝑣′
2𝛩′
𝑑𝑣′
𝑑𝑟′
𝑑𝐸′𝑒𝑑𝑟′
= 𝐿′
𝑒
𝑟′2𝑣′·𝐿𝑒∗𝜆∗
𝐸𝑒∗
𝑑𝑞′𝑒𝑑𝑟′
= 𝑞′𝑒𝛬
′𝑒
𝑟′2𝑣′· 𝛬𝑒∗𝜆∗
𝑑𝐸′𝑓
𝑑𝑟′=
𝐿′𝑓
𝑟′2𝑣′·
𝐿𝑓∗𝜆∗
𝐸𝑓∗

_________________________________________________________________________________
Pellet injection simulations in stellarators
89
𝑑𝑞′𝑓
𝑑𝑟′=
𝑞′𝑓𝛬′
𝑓
𝑟′2𝑣′· 𝛬𝑓∗𝜆∗
(5-8) Here, the normalized heat fluxes are:
𝑊𝑒′ =
𝑊𝑒∗
𝑊𝑒∗ + 𝑊𝑓∗𝑞𝑒
′𝛬𝑒′
(5-9)
𝑊𝑓′ =
𝑊𝑓∗
𝑊𝑒∗ + 𝑊𝑓∗𝑞𝑓
′ 𝛬𝑓′
(5-10) While the parameter λ* is defined as:
𝜆∗ ≡ 𝜌∗𝑟∗𝑚
(5-11) With appropriate boundary conditions, and for fixed Ee* and Ef*, this normalized system
can be treated as an eigenvalue problem of eigenvalue λ* [106]. Therefore, it can be solved numerically from r’ = 1 to the pellet surface, i.e., for normalized cloud radius smaller than the sonic radius, r’< 1. The mentioned boundary conditions, at the pellet surface, are:
𝑞𝑒′ + 𝑞𝑓
′ = 0 (5-12)
𝑣′ = 0 𝑜𝑟 𝛩′ ≈ 0 (5-13)
Afterwards, the solution for r’ > 1 is obtained by integrating the solutions from r’ = 1 until the change in the heat sources tends to zero, i.e., dqe’/dr, dqf’/dr 0.
Finally, once the system is solved, ablation and radius regression rates can be determined from Equation (5-1) [106]:
𝐺 = 4𝜋𝜌∗𝑣∗𝑟∗2
(5-14) 𝑑𝑟𝑝
𝑑𝑡= −
1
4𝜋𝜌𝑠𝑟𝑝2𝐺 = −
𝜌∗𝑣∗
𝜌𝑠�̂�𝑝2
(5-15) With this, by providing plasma electron density and temperature profiles, and fast ion
profiles in the NBI case, if available, it is possible to obtain an approximate ablation profile. Some examples of these profiles are compared with experimental profiles in the following subsection, together with a discussion of the limitation of this type of ablation models.
5.1.1. Predicted ablation profiles for TJ-II pellets and comparisons The previously described NGS-based code is used to simulate pellet ablation in both
ECRH and NBI TJ-II plasmas. The over-ablation produced by fast ions is considered in the latter case. Two representative cases for each heating method are selected and shown here. In addition, predicted ablation profiles are compared to the Hα emission measured by the photodiode system, which gives an indication of the ablation rate.
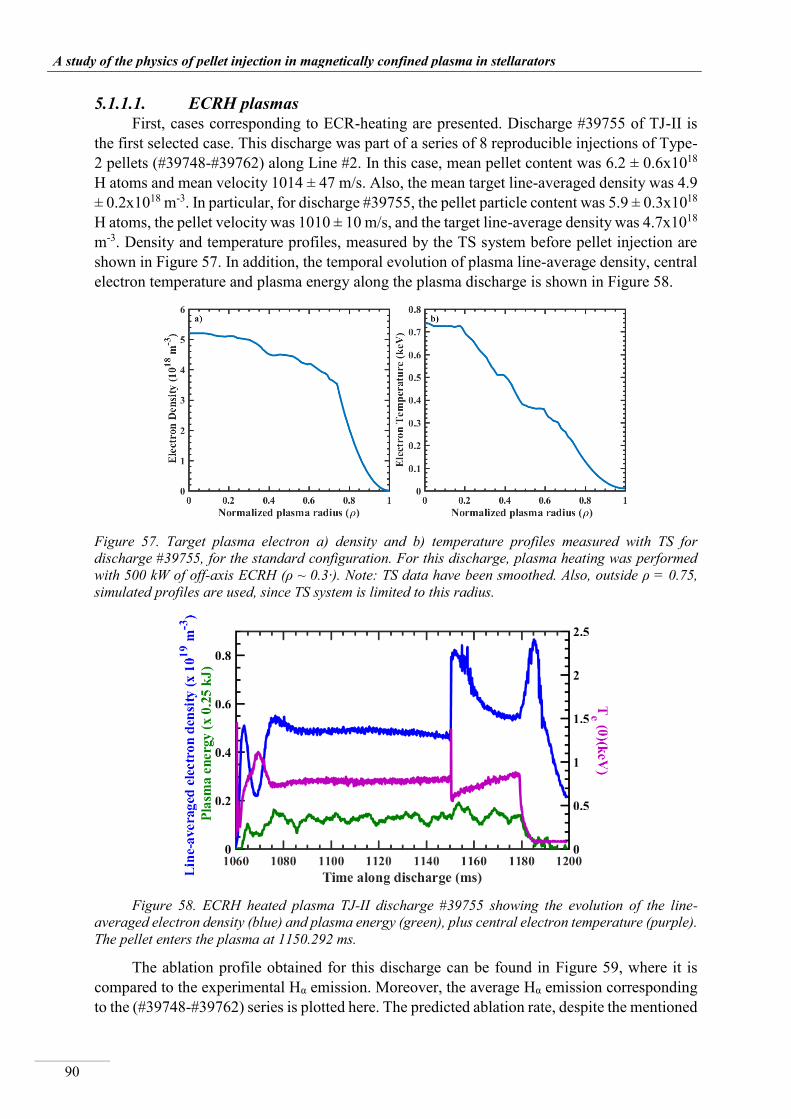
__________________________________________________________________________________
A study of the physics of pellet injection in magnetically confined plasma in stellarators
90
5.1.1.1. ECRH plasmas First, cases corresponding to ECR-heating are presented. Discharge #39755 of TJ-II is
the first selected case. This discharge was part of a series of 8 reproducible injections of Type-2 pellets (#39748-#39762) along Line #2. In this case, mean pellet content was 6.2 ± 0.6x10¹⁸ H atoms and mean velocity 1014 ± 47 m/s. Also, the mean target line-averaged density was 4.9 ± 0.2x10¹⁸ m-3. In particular, for discharge #39755, the pellet particle content was 5.9 ± 0.3x10¹⁸ H atoms, the pellet velocity was 1010 ± 10 m/s, and the target line-average density was 4.7x10¹⁸ m-3. Density and temperature profiles, measured by the TS system before pellet injection are shown in Figure 57. In addition, the temporal evolution of plasma line-average density, central electron temperature and plasma energy along the plasma discharge is shown in Figure 58.
Figure 57. Target plasma electron a) density and b) temperature profiles measured with TS for discharge #39755, for the standard configuration. For this discharge, plasma heating was performed with 500 kW of off-axis ECRH (ρ ~ 0.3·). Note: TS data have been smoothed. Also, outside ρ = 0.75, simulated profiles are used, since TS system is limited to this radius.
Figure 58. ECRH heated plasma TJ-II discharge #39755 showing the evolution of the line-
averaged electron density (blue) and plasma energy (green), plus central electron temperature (purple). The pellet enters the plasma at 1150.292 ms.
The ablation profile obtained for this discharge can be found in Figure 59, where it is compared to the experimental Hα emission. Moreover, the average Hα emission corresponding to the (#39748-#39762) series is plotted here. The predicted ablation rate, despite the mentioned
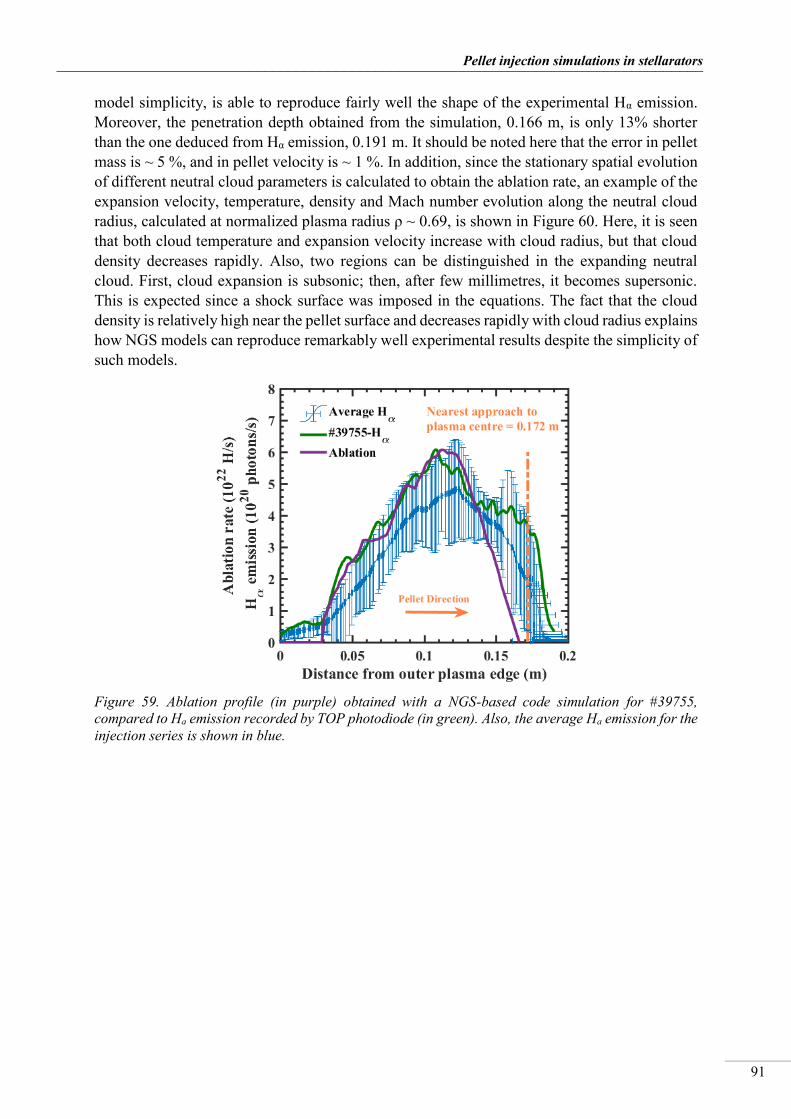
_________________________________________________________________________________
Pellet injection simulations in stellarators
91
model simplicity, is able to reproduce fairly well the shape of the experimental Hα emission. Moreover, the penetration depth obtained from the simulation, 0.166 m, is only 13% shorter than the one deduced from Hα emission, 0.191 m. It should be noted here that the error in pellet mass is ~ 5 %, and in pellet velocity is ~ 1 %. In addition, since the stationary spatial evolution of different neutral cloud parameters is calculated to obtain the ablation rate, an example of the expansion velocity, temperature, density and Mach number evolution along the neutral cloud radius, calculated at normalized plasma radius ρ ⁓ 0.69, is shown in Figure 60. Here, it is seen that both cloud temperature and expansion velocity increase with cloud radius, but that cloud density decreases rapidly. Also, two regions can be distinguished in the expanding neutral cloud. First, cloud expansion is subsonic; then, after few millimetres, it becomes supersonic. This is expected since a shock surface was imposed in the equations. The fact that the cloud density is relatively high near the pellet surface and decreases rapidly with cloud radius explains how NGS models can reproduce remarkably well experimental results despite the simplicity of such models.
Figure 59. Ablation profile (in purple) obtained with a NGS-based code simulation for #39755, compared to Ha emission recorded by TOP photodiode (in green). Also, the average Ha emission for the injection series is shown in blue.

__________________________________________________________________________________
A study of the physics of pellet injection in magnetically confined plasma in stellarators
92
Figure 60 Modelled steady-state spatial distributions of the neutral cloud a) expansion velocity, b) temperature, c) density and d) Mach number for discharge #39755. Values have been obtained for when the pellet is located at ρ = 0.69 (Te(ρ = 0.69) = 266 eV, ne(ρ = 0.69) = 3.83x10¹⁸ m-3). The lilac shading represents the solid pellet (rp(ρ = 0.69) = 0.31 mm), assuming spherical shape. Original spherical pellet radius is 0.38 mm.
Discharge #45079 is the second selected case for ECRH plasmas. This discharge was part of a series of 6 injections of Type-2 pellets (#45079-#45098) along Line #1, whose mean pellet content was 6.7 ± 0.8x10¹⁸ H atoms and mean velocity was 944 ± 29 m/s. Also, the mean target line-averaged density was 5 ± 0.2x10¹⁸ m-3 In particular for discharge #45079, the pellet particle content was 6.98 ± 0.3x10¹⁸ H atoms, and pellet velocity was 941 ± 9 m/s. Density and electron temperature profiles, measured by the TS system before pellet injection, are shown in Figure 61. The ablation profile obtained for this discharge and the experimental Hα emission can be found in Figure 62, along with the average Hα emission corresponding to the (#45079-#45098) series. As in the previous example, the predicted ablation rate reproduces considerably well the shape of the experimental Hα emission. Also, according to the simulation, the pellet penetrates into the plasma to 0.128 m, a distance that is only a 6% smaller than that deduced from Hα emission, 0.136 m. Again, this difference can be explained by uncertainties in pellet mass and velocity.
a) b)
c) d)
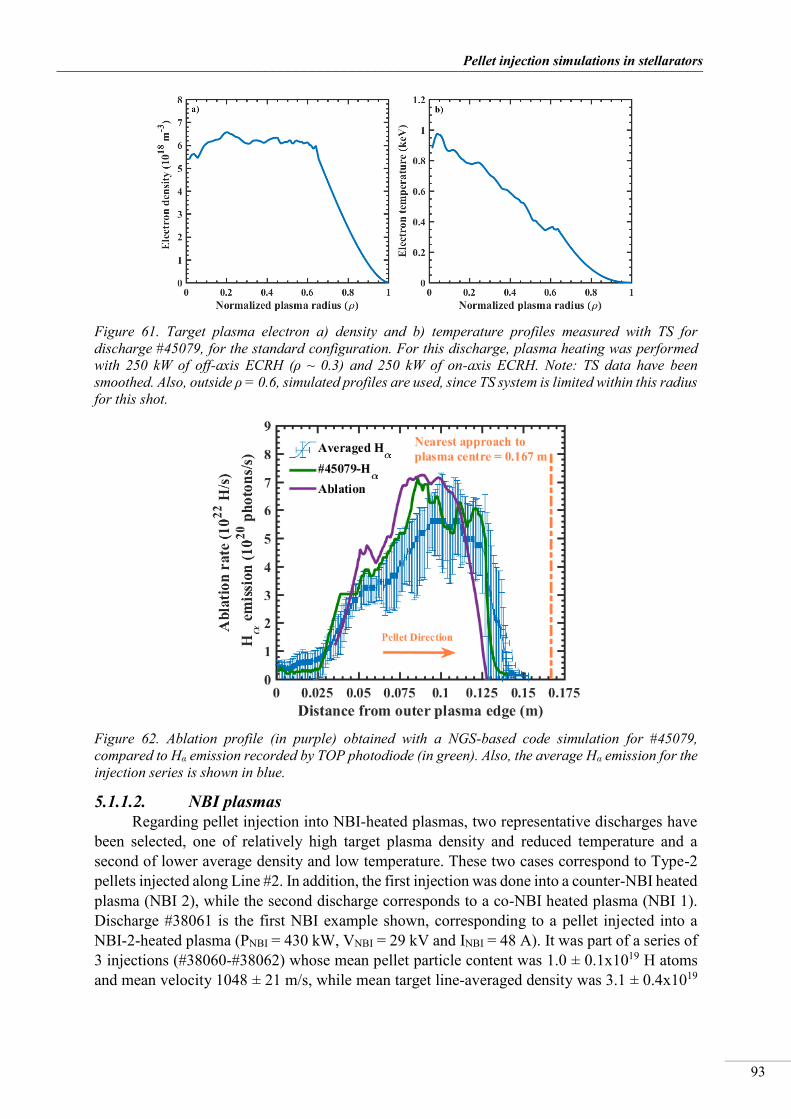
_________________________________________________________________________________
Pellet injection simulations in stellarators
93
Figure 61. Target plasma electron a) density and b) temperature profiles measured with TS for discharge #45079, for the standard configuration. For this discharge, plasma heating was performed with 250 kW of off-axis ECRH (ρ ~ 0.3) and 250 kW of on-axis ECRH. Note: TS data have been smoothed. Also, outside ρ = 0.6, simulated profiles are used, since TS system is limited within this radius for this shot.
Figure 62. Ablation profile (in purple) obtained with a NGS-based code simulation for #45079, compared to Hα emission recorded by TOP photodiode (in green). Also, the average Hα emission for the injection series is shown in blue.
5.1.1.2. NBI plasmas Regarding pellet injection into NBI-heated plasmas, two representative discharges have
been selected, one of relatively high target plasma density and reduced temperature and a second of lower average density and low temperature. These two cases correspond to Type-2 pellets injected along Line #2. In addition, the first injection was done into a counter-NBI heated plasma (NBI 2), while the second discharge corresponds to a co-NBI heated plasma (NBI 1). Discharge #38061 is the first NBI example shown, corresponding to a pellet injected into a NBI-2-heated plasma (PNBI = 430 kW, VNBI = 29 kV and INBI = 48 A). It was part of a series of 3 injections (#38060-#38062) whose mean pellet particle content was 1.0 ± 0.1x10¹⁹ H atoms and mean velocity 1048 ± 21 m/s, while mean target line-averaged density was 3.1 ± 0.4x10¹⁹

__________________________________________________________________________________
A study of the physics of pellet injection in magnetically confined plasma in stellarators
94
m-3. In particular for discharge #38061, the pellet particle content was 1.1 ± 0.1x10¹⁹ H atoms, and pellet velocity was 1032 ± 10 m/s.
Figure 63. Target plasma electron a) density and b) temperature profiles measured with TS for discharge #38061, for the standard configuration. For this discharge, plasma heating was performed with 430 kW of counter-NBI (NBI 2). Note: TS data have been smoothed. Also, outside ρ = 0.65, simulated profiles are used, since TS system is limited to within this radius for this shot.
Figure 64. NBI heated plasma TJ-II discharge #38061 showing the evolution of the line-averaged electron density (blue) and plasma energy (green), plus central electron temperature (purple). The pellet enters the plasma at 1095.284 ms. Note: the plasma was created and maintained by NBI heating only.
As for the previous examples, electron density and temperature profiles before pellet injection are seen in Figure 63; also, the temporal evolution of plasma parameters is shown Figure 64, together with the duration of NBI heating phases. In addition, assumed energy and density profiles of suprathermal ions are plotted in Figure 65. The simulated ablation profile and the experimental Hα emission are plotted in Figure 66, along with the average Hα emission of the pellet series (note: light signal reaching TOP fall once pellets penetrate beyond ~ 0.28 m, since TOP view is limited by the TJ-II hardcore. Therefore, SIDE signal is also used to show the full penetration). Here, the predicted ablation rate does not reproduce the shape of the Hα or the average emissions. Regarding the penetration depth, it is predicted that the pellet crosses the whole plasma without being completely ablated, with 1.1x10¹⁸ particles remaining in the pellet; this may be also the case in the real injection [2]. This can be explained by considering
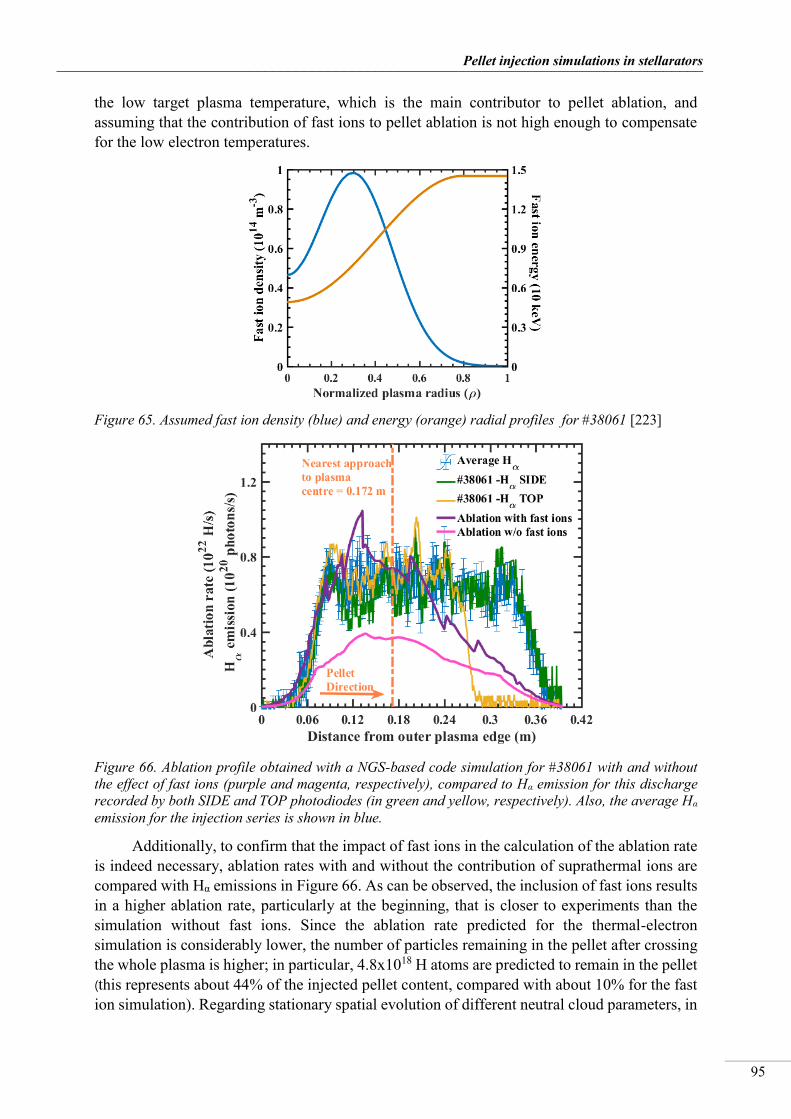
_________________________________________________________________________________
Pellet injection simulations in stellarators
95
the low target plasma temperature, which is the main contributor to pellet ablation, and assuming that the contribution of fast ions to pellet ablation is not high enough to compensate for the low electron temperatures.
Figure 65. Assumed fast ion density (blue) and energy (orange) radial profiles for #38061 [223]
Figure 66. Ablation profile obtained with a NGS-based code simulation for #38061 with and without the effect of fast ions (purple and magenta, respectively), compared to Hα emission for this discharge recorded by both SIDE and TOP photodiodes (in green and yellow, respectively). Also, the average Hα emission for the injection series is shown in blue.
Additionally, to confirm that the impact of fast ions in the calculation of the ablation rate is indeed necessary, ablation rates with and without the contribution of suprathermal ions are compared with Hα emissions in Figure 66. As can be observed, the inclusion of fast ions results in a higher ablation rate, particularly at the beginning, that is closer to experiments than the simulation without fast ions. Since the ablation rate predicted for the thermal-electron simulation is considerably lower, the number of particles remaining in the pellet after crossing the whole plasma is higher; in particular, 4.8x10¹⁸ H atoms are predicted to remain in the pellet (this represents about 44% of the injected pellet content, compared with about 10% for the fast ion simulation). Regarding stationary spatial evolution of different neutral cloud parameters, in

__________________________________________________________________________________
A study of the physics of pellet injection in magnetically confined plasma in stellarators
96
Figure 67, it shows the same general tendencies as for injections into ECRH plasmas. The main difference, in addition to the absolute values, is that two cloud regions can be distinguished in expansion velocity, temperature and density. The outer region corresponds to part of the cloud heated by both thermal electrons and suprathermal ions; while the inner one corresponds to the region heated by suprathermal ions only.
Figure 67. Modelled steady-state spatial distributions of the neutral cloud a) expansion velocity, b) temperature, c) density and d) Mach number for discharge #38061. Values have been obtained for when the pellet is located at ρ = 0.69 (Te(ρ = 0.69) = 96.9, ne(ρ = 0.69) = 1.33x10¹⁹ m-3). The lilac shading represents the solid pellet (rp(ρ = 0.69) = 0.33 mm), assuming spherical shape. Original spherical pellet radius is 0.38 mm.
Here, the case corresponding to co-injection heating (PNBI = 580 kW, VNBI = 32 kV and INBI = 56 A) is presented. The selected discharge is #39060, which was part of a series of 4 injections (#39060-#39067) with mean pellet content equal to 6.2 ± 0.1x10¹⁸ H atoms, mean velocity equal to 1012 ± 81 m/s, and mean target line-averaged density 1.0 ± 0.2x10¹⁹ m-3. For this specific series, the dispersion in target density is larger (25 %) than in other studied cases, since the purpose of these experiments was to study density increases after pellet injection for a range of targets, and hence, plasmas were not intended to be reproducible. For discharge #39060, the pellet particle content was 6.2 ± 0.3x10¹⁸ H atoms, and pellet velocity was 1098 ± 11 m/s. Plasma profiles before pellet injection are shown in Figure 68.
a) b)
d) c)

_________________________________________________________________________________
Pellet injection simulations in stellarators
97
Figure 68. Target plasma electron a) density and b) temperature profiles measured with TS for discharge #39060, for the standard configuration. For this discharge, plasma heating was performed with 580 kW of NBI 1. Note: TS data have been smoothed. Also, outside ρ = 0.6, simulated profiles are used, since TS system is limited to within this radius for this discharge.
The predicted ablation profile and the experimental Hα emission, together with the average Hα emission of the pellet series, are plotted in Figure 69. The predicted ablation rate reproduces, in this case, quite satisfactorily the shape of the experimental Hα emission, despite a predicted higher ablation between 0.025 m and 0.09 m from the outer plasma edge. In addition, the comparison improves when the average Hα emission is considered. Finally, pellet penetration depth is reasonably well predicted, 0.301 m in contrast to 0.276 m of the experimental one (8% deeper than the measured penetration depth). As in the ECRH cases, this difference can be explained partially by uncertainties in pellet mass and velocity. Moreover, assumptions in fast ion profile and energy contribute significantly to the differences found between experimental and simulated results.
Figure 69 Ablation profile obtained with a NGS-based code simulation for #39060 with and without the effect of fast ions (purple and magenta, respectively), compared to Ha emission recorded by TOP photodiode (in green). Also, the average Ha emission for the injection series is shown in blue.

__________________________________________________________________________________
A study of the physics of pellet injection in magnetically confined plasma in stellarators
98
5.1.2. Discussion of model limitations NGS-based models are able to describe pellet ablation rates rather well, considering that
such a model is a significantly simplified vision of the complex processes involved in pellet ablation. For instance, NGS models reproduce considerably well pellet penetrations in different devices presented in [50]. However, this type of model is very limited, for instance, plasmoid evolution is not described, and hence, the deposition of the ablated material cannot be calculated. This means that a NGS model cannot be used to describe or to predict the evolution of background plasma profiles after pellet injection or the fuelling efficiency. Therefore, a model capable of providing the post-injection density profiles is mandatory, i.e., a model that describes the homogenization of the ablated material, including plasmoid parallel expansion and plasmoid ExB drift. This also implies that the shielding provided by the ionized fraction of the cloud, i.e., the plasmoid, should be considered in the calculation of the ablation rate; not only the background plasma heat flux reduction produced by collisions with the expanding cloud, as used in NGS (Section 5.1).
As has been shown previously, the NGS-based code is able to reproduce ablation profiles fairly well, and pellet penetration depths within 15% for ECRH plasmas in the TJ-II. On the other hand, results for injections into NBI plasmas are less satisfactory; especially, the shape of the ablation profile is only approximately reproduced, while pellet penetration depths are reasonably well predicted (to ≤ 10%). In both cases, differences in pellet penetration depth are partially explained by uncertainties in pellet mass and velocity. In addition, for injections into NBI plasmas, where the effect of suprathermal ions is included to appropriately describe ablation, the incertitude in the assumed fast ion energy and density profiles contribute, to a large extend, to explain the differences with the measured Hα emission.
In conclusion, NGS-based codes have been demonstrated to be useful tools for calculating pellet penetration depths and ablation rates, since results are satisfactory and the computational time required is very short [42, 50]. However, for a detailed ablation rate and for the prediction of post-injection plasma profiles, models that include the shielding effects associated with the ionized fraction of the ablatant and the homogenization of such material in the background plasma are necessary. For instance, the HPI2 code, which will be discussed in the following section, includes these shielding effects and, in addition, the homogenization of the plasmoid is calculated by a 0-dimension fluid model [55, 136, 143].
5.2. ABLATION AND DEPOSITION SIMULATIONS: THE HPI2 CODE The Hydrogen Pellet Injection (HPI2) code was developed by B. Pégourié, F. Köchl et
al. [55, 136, 143] to simulate the ablation of a cryogenic pellet (hydrogen, deuterium or a mixture of deuterium and tritium) injected into a magnetic confined plasma created in a tokamak device, and in addition, the evolution of the resultant pellet plasmoid, considering all the known mechanisms involved in the plasmoid drift. The code takes into account specific machine geometrical data, as well as plasma energy, density profiles and magnetic field configuration under consideration. A simplified diagram of the HPI2 code can be found in Scheme 1, where the main steps in the calculation of ablation and deposition profiles are shown.

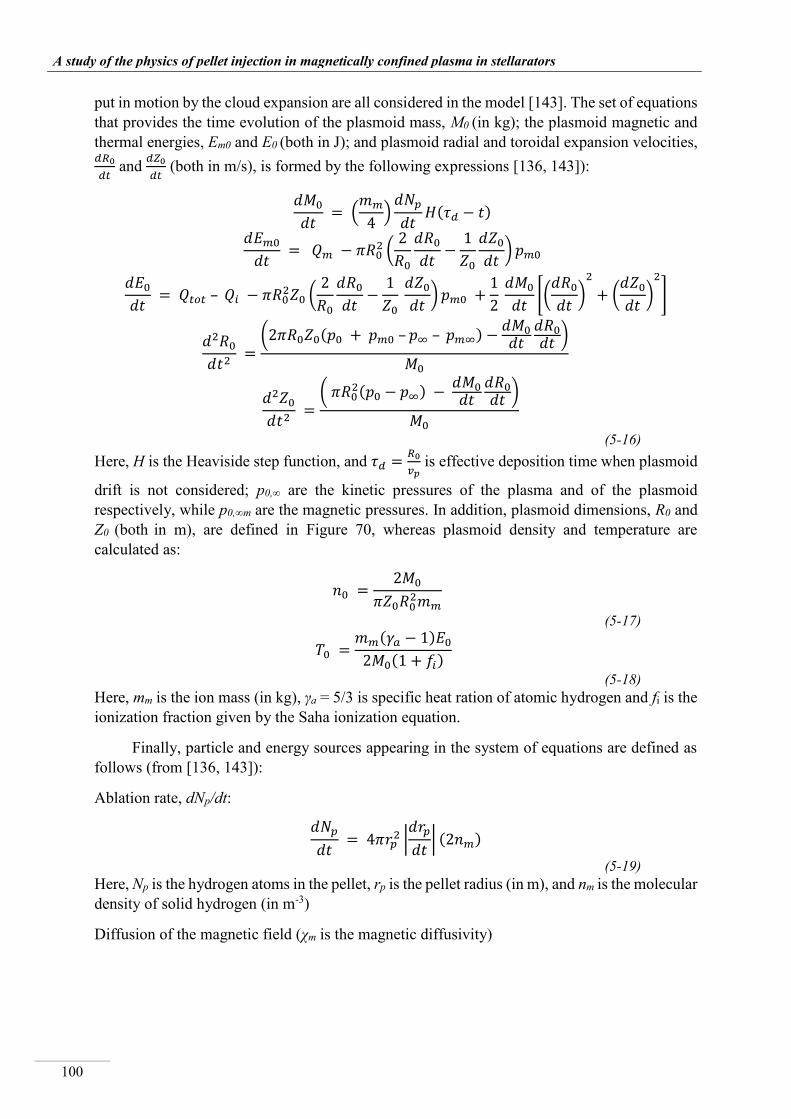
__________________________________________________________________________________
A study of the physics of pellet injection in magnetically confined plasma in stellarators
100
put in motion by the cloud expansion are all considered in the model [143]. The set of equations that provides the time evolution of the plasmoid mass, M0 (in kg); the plasmoid magnetic and thermal energies, Em0 and E0 (both in J); and plasmoid radial and toroidal expansion velocities, 𝑑𝑅0
𝑑𝑡 and 𝑑𝑍0
𝑑𝑡 (both in m/s), is formed by the following expressions [136, 143]):
𝑑𝑀0
𝑑𝑡 = (
𝑚𝑚
4)𝑑𝑁𝑝
𝑑𝑡𝐻(𝜏𝑑 − 𝑡)
𝑑𝐸𝑚0
𝑑𝑡 = 𝑄𝑚 − 𝜋𝑅0
2 (2
𝑅0
𝑑𝑅0
𝑑𝑡−
1
𝑍0
𝑑𝑍0
𝑑𝑡) 𝑝𝑚0
𝑑𝐸0
𝑑𝑡 = 𝑄𝑡𝑜𝑡 – 𝑄𝑖 − 𝜋𝑅0
2𝑍0 (2
𝑅0
𝑑𝑅0
𝑑𝑡−
1
𝑍0 𝑑𝑍0
𝑑𝑡) 𝑝𝑚0 +
1
2 𝑑𝑀0
𝑑𝑡[(
𝑑𝑅0
𝑑𝑡)
2
+ (𝑑𝑍0
𝑑𝑡)2
]
𝑑2𝑅0
𝑑𝑡2 =
(2𝜋𝑅0𝑍0(𝑝0 + 𝑝𝑚0 – 𝑝∞ – 𝑝𝑚∞) −𝑑𝑀0
𝑑𝑡𝑑𝑅0
𝑑𝑡)
𝑀0
𝑑2𝑍0
𝑑𝑡2 =
( 𝜋𝑅02(𝑝0 − 𝑝∞) −
𝑑𝑀0
𝑑𝑡𝑑𝑅0
𝑑𝑡)
𝑀0
(5-16) Here, H is the Heaviside step function, and 𝜏𝑑 =
𝑅0
𝑣𝑝 is effective deposition time when plasmoid
drift is not considered; p0,∞ are the kinetic pressures of the plasma and of the plasmoid respectively, while p0,∞m are the magnetic pressures. In addition, plasmoid dimensions, R0 and Z0 (both in m), are defined in Figure 70, whereas plasmoid density and temperature are calculated as:
𝑛0 =2𝑀0
𝜋𝑍0𝑅02𝑚𝑚
(5-17)
𝑇0 =𝑚𝑚(𝛾𝑎 − 1)𝐸0
2𝑀0(1 + 𝑓𝑖)
(5-18) Here, mm is the ion mass (in kg), γa = 5/3 is specific heat ration of atomic hydrogen and fi is the ionization fraction given by the Saha ionization equation.
Finally, particle and energy sources appearing in the system of equations are defined as follows (from [136, 143]):
Ablation rate, dNp/dt:
𝑑𝑁𝑝
𝑑𝑡 = 4𝜋𝑟𝑝
2 |𝑑𝑟𝑝
𝑑𝑡| (2𝑛𝑚)
(5-19) Here, Np is the hydrogen atoms in the pellet, rp is the pellet radius (in m), and nm is the molecular density of solid hydrogen (in m-3)
Diffusion of the magnetic field (χm is the magnetic diffusivity)


__________________________________________________________________________________
A study of the physics of pellet injection in magnetically confined plasma in stellarators
102
Under this premiss, when plasma and plasmoid pressures balance, the drift stops. However, some additional mechanisms that modify the amount of accumulated charge particles and, therefore, the acceleration drift are included in the HPI2 code. For instance, the coupling between plasmoid expansion and drift is accounted for by an additional driving term for change in the particle velocity distribution due to the plasmoid parallel expansion. In addition, the effect of Alfvén-waves propagating from both ends of the plasmoid is considered. Moreover, the reduction of drift acceleration due to short-circuit external (External Circuit Closure, ECC) [136] and internal (Internal Circuit Closure, ICC) [134, 224] currents is included in the calculation of drift displacement. Therefore, the expression for the drift acceleration becomes, for a plasmoid section La·Lb = (π1/2R0)2 (assuming slab geometry, as seen in Figure 70):
𝑑𝑣𝐷
𝑑𝑡=
1
𝑀0,𝑖𝑛𝑐𝑟(2𝑀0(𝑝𝑖 + 𝑝𝑒 − 𝑝𝑖∞ − 𝑝𝑒∞)
𝑅𝑚𝑖𝑛0
− 𝑣𝐷 [2(1 − 𝑃𝑐𝑜𝑛 − 𝑃𝑐𝑜𝑛2) 𝐵∥
2𝐿𝑎𝐿𝑏
𝜇0𝑣𝐴
+𝛩(𝑡 − 𝜏𝑐𝑜𝑛)𝑃𝑐𝑜𝑛𝜎∥∞𝐵∥
2𝐿𝑎𝐿𝑏2𝐿𝐽𝜙
𝐿𝑐𝑜𝑛𝐻 − 𝑍0(1 − 𝑒
−∫𝑑𝑡′
𝜏(𝑡′)𝑡𝜏𝑐𝑜𝑛 )])
(5-24) Here, La, Lb and Z0 are plasmoid dimensions (all in m), defined in Figure 70; R is the plasmoid location in major radius coordinates (m), and B|| is the toroidal component of the background magnetic field (in T). μ0 is the vacuum permeability (4πx10-7 Wb/A), vA is the Alfvén speed, defined as 𝑣𝐴 ≡
𝐵∞
√𝑛∞𝜇0𝑚𝑖; and σ||∞ is the external plasma conductivity. LJ is the radial width of
the external parallel current channel (in m), while LconH is the harmonic average of the plasmoid reconnection length, Lcon, (in m), i.e., the average length of the ECC current channel. On the other hand, Pcon is the fraction of externally reconnected plasmoid charges of opposite sign, whereas Pcon2 is the fraction of externally reconnected plasmoid charges of the same sign. Finally, con (s) is the time of first connection between regions of opposite charge, i.e., the characteristic time for the start of the ECC effect. It should be noted that the Alfvén-wave effect only applies to the fraction of non-externally reconnected charges. 𝑀0,𝑖𝑛𝑐𝑟 is the increased inertial mass (in kg) [143]:
𝑀0 = 𝐿𝑎𝐿𝑏𝑍0𝑛0𝑚𝑖 →
𝑀0,𝑖𝑛𝑐𝑟 = 𝑀0 +1
2𝑃𝑐𝑜𝑛2𝐿𝑎𝐿𝑏𝐿𝑐𝑜𝑛𝐴2𝑛∞𝑚𝑖
(5-25) The background plasma density is obtained from the background plasma particle content,
N∞(ρ):
𝑛∞ =𝑁∞
𝐿𝑎𝐿𝑏(𝐿𝜙 − 𝑍0)
(5-26) Here, L is the average plasmoid self-connection length, also defined in Figure 70. Also, it is taken into account that the ECC depends on the poloidal position of the plasmoid, since the distribution of charges inside the plasmoid can be asymmetric, hence:
𝑃𝑐𝑜𝑛 (𝛼)~ 𝑃𝑐𝑜𝑛(𝛼 = 0)𝑐𝑜𝑠2(𝛼) (5-27)
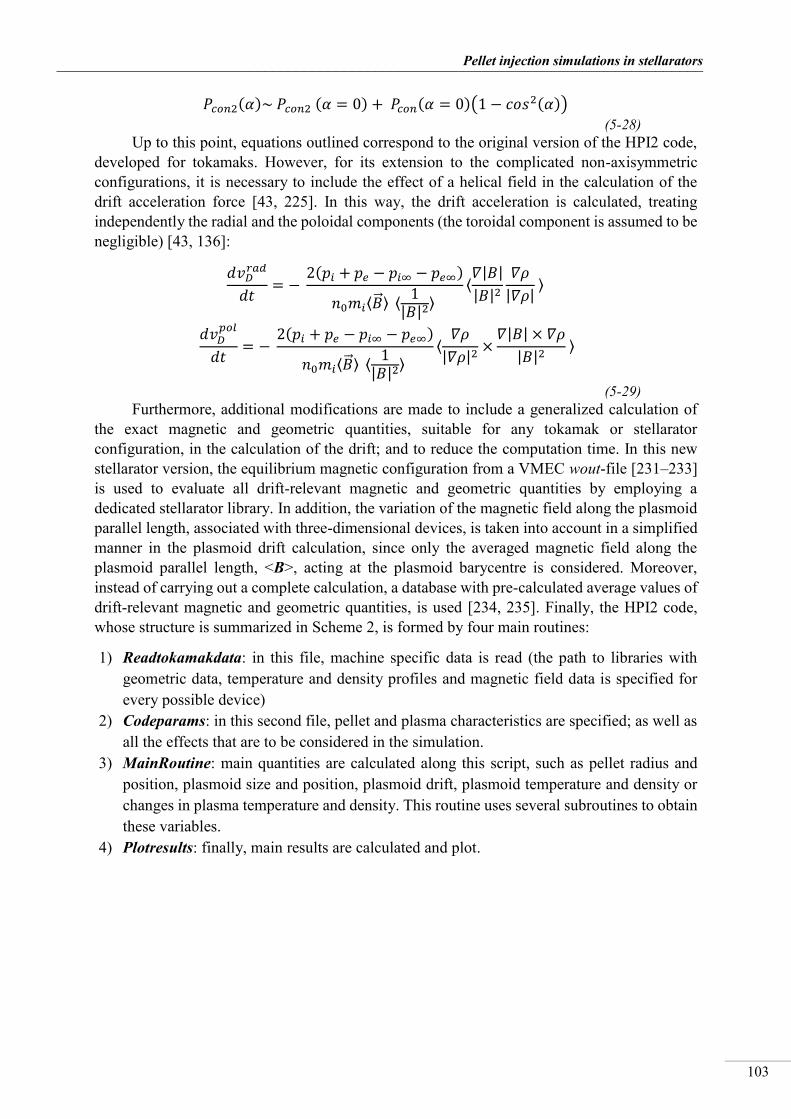
_________________________________________________________________________________
Pellet injection simulations in stellarators
103
𝑃𝑐𝑜𝑛2(𝛼)~ 𝑃𝑐𝑜𝑛2 (𝛼 = 0) + 𝑃𝑐𝑜𝑛(𝛼 = 0)(1 − 𝑐𝑜𝑠2(𝛼)) (5-28)
Up to this point, equations outlined correspond to the original version of the HPI2 code, developed for tokamaks. However, for its extension to the complicated non-axisymmetric configurations, it is necessary to include the effect of a helical field in the calculation of the drift acceleration force [43, 225]. In this way, the drift acceleration is calculated, treating independently the radial and the poloidal components (the toroidal component is assumed to be negligible) [43, 136]:
𝑑𝑣𝐷𝑟𝑎𝑑
𝑑𝑡= −
2(𝑝𝑖 + 𝑝𝑒 − 𝑝𝑖∞ − 𝑝𝑒∞)
𝑛0𝑚𝑖⟨�⃗⃗�⟩ ⟨1
|𝐵|2⟩
⟨𝛻|𝐵|
|𝐵|2𝛻𝜌
|𝛻𝜌| ⟩
𝑑𝑣𝐷𝑝𝑜𝑙
𝑑𝑡= −
2(𝑝𝑖 + 𝑝𝑒 − 𝑝𝑖∞ − 𝑝𝑒∞)
𝑛0𝑚𝑖⟨�⃗⃗�⟩ ⟨1
|𝐵|2⟩
⟨𝛻𝜌
|𝛻𝜌|2×
𝛻|𝐵| × 𝛻𝜌
|𝐵|2 ⟩
(5-29) Furthermore, additional modifications are made to include a generalized calculation of
the exact magnetic and geometric quantities, suitable for any tokamak or stellarator configuration, in the calculation of the drift; and to reduce the computation time. In this new stellarator version, the equilibrium magnetic configuration from a VMEC wout-file [231–233] is used to evaluate all drift-relevant magnetic and geometric quantities by employing a dedicated stellarator library. In addition, the variation of the magnetic field along the plasmoid parallel length, associated with three-dimensional devices, is taken into account in a simplified manner in the plasmoid drift calculation, since only the averaged magnetic field along the plasmoid parallel length, <B>, acting at the plasmoid barycentre is considered. Moreover, instead of carrying out a complete calculation, a database with pre-calculated average values of drift-relevant magnetic and geometric quantities, is used [234, 235]. Finally, the HPI2 code, whose structure is summarized in Scheme 2, is formed by four main routines:
1) Readtokamakdata: in this file, machine specific data is read (the path to libraries with geometric data, temperature and density profiles and magnetic field data is specified for every possible device)
2) Codeparams: in this second file, pellet and plasma characteristics are specified; as well as all the effects that are to be considered in the simulation.
3) MainRoutine: main quantities are calculated along this script, such as pellet radius and position, plasmoid size and position, plasmoid drift, plasmoid temperature and density or changes in plasma temperature and density. This routine uses several subroutines to obtain these variables.
4) Plotresults: finally, main results are calculated and plot.
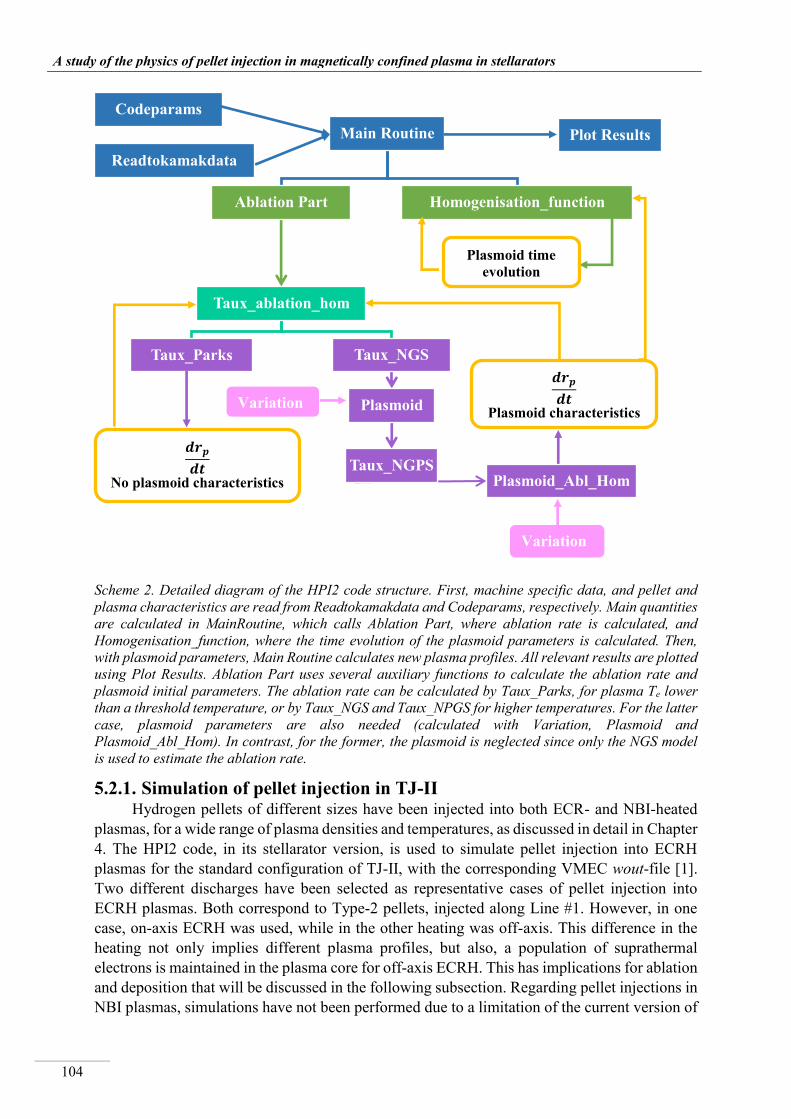
__________________________________________________________________________________
A study of the physics of pellet injection in magnetically confined plasma in stellarators
104
Scheme 2. Detailed diagram of the HPI2 code structure. First, machine specific data, and pellet and plasma characteristics are read from Readtokamakdata and Codeparams, respectively. Main quantities are calculated in MainRoutine, which calls Ablation Part, where ablation rate is calculated, and Homogenisation_function, where the time evolution of the plasmoid parameters is calculated. Then, with plasmoid parameters, Main Routine calculates new plasma profiles. All relevant results are plotted using Plot Results. Ablation Part uses several auxiliary functions to calculate the ablation rate and plasmoid initial parameters. The ablation rate can be calculated by Taux_Parks, for plasma Te lower than a threshold temperature, or by Taux_NGS and Taux_NPGS for higher temperatures. For the latter case, plasmoid parameters are also needed (calculated with Variation, Plasmoid and Plasmoid_Abl_Hom). In contrast, for the former, the plasmoid is neglected since only the NGS model is used to estimate the ablation rate.
5.2.1. Simulation of pellet injection in TJ-II Hydrogen pellets of different sizes have been injected into both ECR- and NBI-heated
plasmas, for a wide range of plasma densities and temperatures, as discussed in detail in Chapter 4. The HPI2 code, in its stellarator version, is used to simulate pellet injection into ECRH plasmas for the standard configuration of TJ-II, with the corresponding VMEC wout-file [1]. Two different discharges have been selected as representative cases of pellet injection into ECRH plasmas. Both correspond to Type-2 pellets, injected along Line #1. However, in one case, on-axis ECRH was used, while in the other heating was off-axis. This difference in the heating not only implies different plasma profiles, but also, a population of suprathermal electrons is maintained in the plasma core for off-axis ECRH. This has implications for ablation and deposition that will be discussed in the following subsection. Regarding pellet injections in NBI plasmas, simulations have not been performed due to a limitation of the current version of
Readtokamakdata
CodeparamsMain Routine
Ablation Part
Taux_ablation_hom
Taux_Parks Taux_NGS
Plasmoid
Taux_NGPSPlasmoid_Abl_Hom
Homogenisation_function
Plot Results
Variation
𝒅𝒓𝒑
𝒅𝒕
No plasmoid characteristics
𝒅𝒓𝒑
𝒅𝒕
Plasmoid characteristics
Plasmoid time evolution
Variation

_________________________________________________________________________________
Pellet injection simulations in stellarators
105
HPI2. This is because pellet injections where toroidal position is not constant cannot be simulated. Indeed, that is the case for injections into unbalance-NBI plasmas due to the toroidal deflection of pellet trajectory provoked by NBI originating ions, as seen in Chapter 4. On the other hand, for almost-balanced NBI plasmas, i.e., plasmas where both co-and counter-injectors are employed, pellet trajectory deflection is negligible, and hence, this limitation of the HPI2 version can be overcome for this particular case. However, the effect of fast ions in the calculation of pellet ablation is nonetheless necessary, as was concluded in Section 4.4. Such an effect is not included either in the stellarator version of the code.
The following subsections are organized as follows. First, ablation profiles predicted by the HPI2 code are compared with Hα emission profiles obtained from signals recorded by the photodiode system. In addition, plasma density and temperature evolutions obtained by the simulation are compared to those reconstructed from Thomson Scattering (TS) measurements. Moreover, drift direction and acceleration calculated by this code are compared to images from the fast camera system and values estimated from the analysis of these images.
5.2.1.1. Simulation of pellet ablation rate Two representative cases of pellets injected into ECRH TJ-II plasmas have been selected
and simulated with the HPI2 code. In both examples, a pellet Type-2 was injected along Line #1 into plasma created in the standard magnetic configuration (100-44-64). The first pellet, corresponding to plasma discharge #41777, contained 6.1 ± 0.3x10¹⁸ H atoms and was accelerated to 808 ± 8 m/s; while the second, corresponding to #44614, contained 6.6 ± 0.3x10¹⁸ H atoms and was accelerated to 900 ± 9 m/s. The Hα emission collected by photodiodes is plotted in Figure 71 for both cases. In addition, plasma electron density and temperature profiles, measured with the Thomson Scattering (TS) system, corresponding to these cases are shown in Figure 72. It should be noted that the peak observed close to the edge of the TS target temperature profile (Figure 72a), at ρ = 0.75) is also observed in the Hα profile (see Figure 71). Therefore, it may not be an artefact of the diagnostic, but real, possibly related to a rational surface (8/5) at that radial position [236].
Figure 71. Hα emission as measured by TOP photodiode during discharges #41777 (blue) and #44614 (green), as a function of plasma radius.
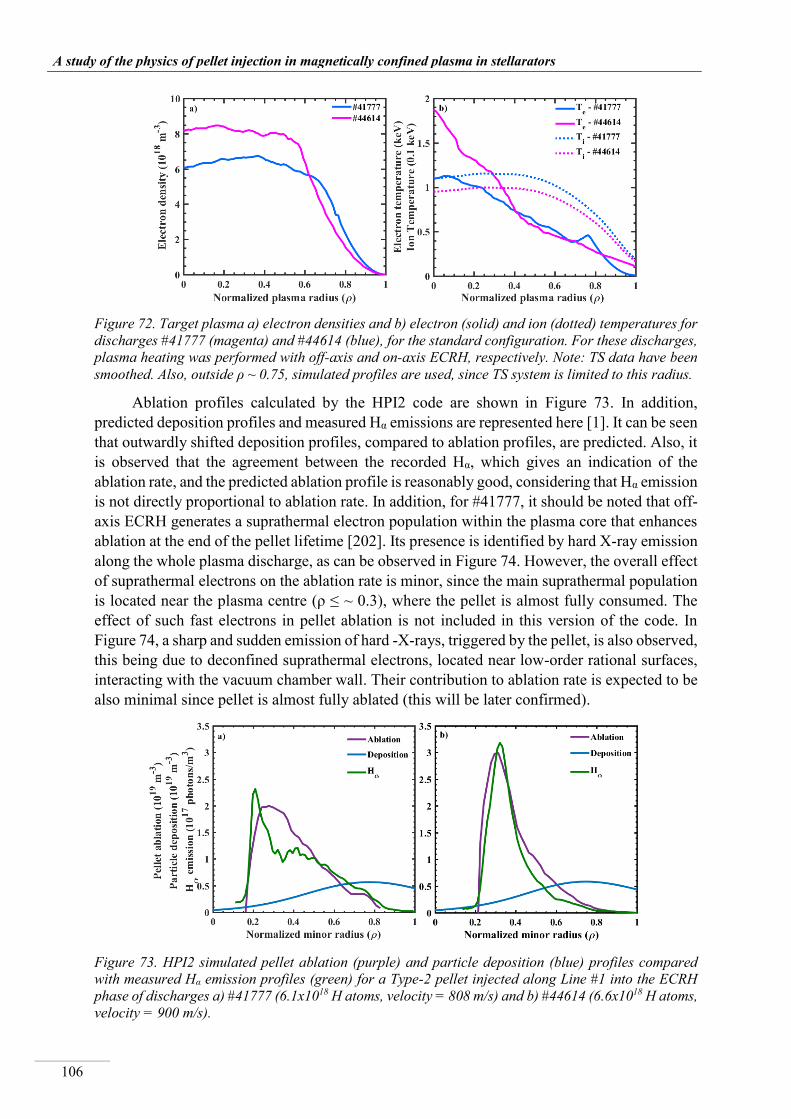
__________________________________________________________________________________
A study of the physics of pellet injection in magnetically confined plasma in stellarators
106
Figure 72. Target plasma a) electron densities and b) electron (solid) and ion (dotted) temperatures for discharges #41777 (magenta) and #44614 (blue), for the standard configuration. For these discharges, plasma heating was performed with off-axis and on-axis ECRH, respectively. Note: TS data have been smoothed. Also, outside ρ ~ 0.75, simulated profiles are used, since TS system is limited to this radius.
Ablation profiles calculated by the HPI2 code are shown in Figure 73. In addition, predicted deposition profiles and measured Hα emissions are represented here [1]. It can be seen that outwardly shifted deposition profiles, compared to ablation profiles, are predicted. Also, it is observed that the agreement between the recorded Hα, which gives an indication of the ablation rate, and the predicted ablation profile is reasonably good, considering that Hα emission is not directly proportional to ablation rate. In addition, for #41777, it should be noted that off-axis ECRH generates a suprathermal electron population within the plasma core that enhances ablation at the end of the pellet lifetime [202]. Its presence is identified by hard X-ray emission along the whole plasma discharge, as can be observed in Figure 74. However, the overall effect of suprathermal electrons on the ablation rate is minor, since the main suprathermal population is located near the plasma centre (ρ ≤ ~ 0.3), where the pellet is almost fully consumed. The effect of such fast electrons in pellet ablation is not included in this version of the code. In Figure 74, a sharp and sudden emission of hard -X-rays, triggered by the pellet, is also observed, this being due to deconfined suprathermal electrons, located near low-order rational surfaces, interacting with the vacuum chamber wall. Their contribution to ablation rate is expected to be also minimal since pellet is almost fully ablated (this will be later confirmed).
Figure 73. HPI2 simulated pellet ablation (purple) and particle deposition (blue) profiles compared with measured Hα emission profiles (green) for a Type-2 pellet injected along Line #1 into the ECRH phase of discharges a) #41777 (6.1x10¹⁸ H atoms, velocity = 808 m/s) and b) #44614 (6.6x10¹⁸ H atoms, velocity = 900 m/s).

_________________________________________________________________________________
Pellet injection simulations in stellarators
107
Figure 74. Temporal evolution of the hard X-ray flux for discharges #41777 (sky blue) and #44614 (purple). The temporal evolution of line-averaged densities of both discharges (dark blue for #41777 and magenta for #44614) are also shown to facilitate the identification of pellet injection time. A pellet is injected into #44614 at 1108.988 ms and into #41777 at 1133.225 ms.
Afterwards, calculated ablation profiles are compared to the average Hα emission for a complete series of reproducible discharges. Discharge #41777 was part of a series of 8 injections of Type-2 pellets (#41777 - #41787), whose mean pellet content was 6.3 ± 0.6x10¹⁸ H atoms and mean velocity 838 ± 30 m/s. Similarly, of the 27 injections made in the series (#44607 - #44639), the mean pellet content and velocity were 6.3 ± 0.8x10¹⁸ H atoms and 900 ± 18 m/s, respectively. It should be noted that 5 of the latter pellets suffered friction losses or were broken upon plasma entry. Also, for the discharge series (#41777 - #41787), the target line-averaged densities were 5.2 ± 0.2x10¹⁸ m-3, albeit for simulation the chosen discharges had a smaller difference (≤ 0.1x10¹⁸ m-3). While for series (#44607 - #44639), the target line-averaged densities were 4.9 ± 0.1x10¹⁸ m-3. Such average emission profiles are shown in Figure 75.
Figure 75. HPI2 simulated pellet ablation (purple) profile compared with measured Hα emission profiles (green), together with the average emission and the dispersion for a number of reproducible discharges, for a Type-2 pellet injected along Line #1 into the ECRH phase of discharges a) #41777 (6.1x10¹⁸ H atoms, velocity = 808 m/s) and b) #44614 (6.6x10¹⁸ H atoms, velocity = 900 m/s). In addition, b) shows, in yellow, the light emission profile obtained from fast-camera snap-shot images for #44738 (from the series of reproducible discharges).
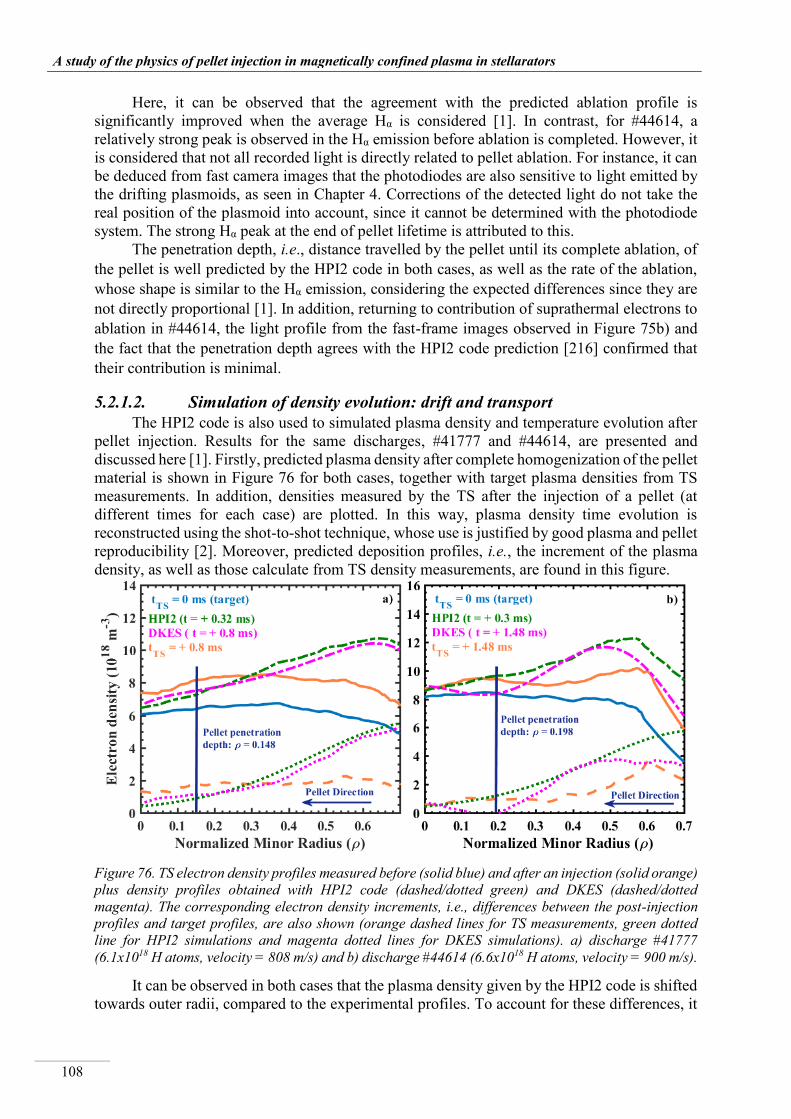
__________________________________________________________________________________
A study of the physics of pellet injection in magnetically confined plasma in stellarators
108
Here, it can be observed that the agreement with the predicted ablation profile is significantly improved when the average Hα is considered [1]. In contrast, for #44614, a relatively strong peak is observed in the Hα emission before ablation is completed. However, it is considered that not all recorded light is directly related to pellet ablation. For instance, it can be deduced from fast camera images that the photodiodes are also sensitive to light emitted by the drifting plasmoids, as seen in Chapter 4. Corrections of the detected light do not take the real position of the plasmoid into account, since it cannot be determined with the photodiode system. The strong Hα peak at the end of pellet lifetime is attributed to this.
The penetration depth, i.e., distance travelled by the pellet until its complete ablation, of the pellet is well predicted by the HPI2 code in both cases, as well as the rate of the ablation, whose shape is similar to the Hα emission, considering the expected differences since they are not directly proportional [1]. In addition, returning to contribution of suprathermal electrons to ablation in #44614, the light profile from the fast-frame images observed in Figure 75b) and the fact that the penetration depth agrees with the HPI2 code prediction [216] confirmed that their contribution is minimal.
5.2.1.2. Simulation of density evolution: drift and transport The HPI2 code is also used to simulated plasma density and temperature evolution after
pellet injection. Results for the same discharges, #41777 and #44614, are presented and discussed here [1]. Firstly, predicted plasma density after complete homogenization of the pellet material is shown in Figure 76 for both cases, together with target plasma densities from TS measurements. In addition, densities measured by the TS after the injection of a pellet (at different times for each case) are plotted. In this way, plasma density time evolution is reconstructed using the shot-to-shot technique, whose use is justified by good plasma and pellet reproducibility [2]. Moreover, predicted deposition profiles, i.e., the increment of the plasma density, as well as those calculate from TS density measurements, are found in this figure.
Figure 76. TS electron density profiles measured before (solid blue) and after an injection (solid orange) plus density profiles obtained with HPI2 code (dashed/dotted green) and DKES (dashed/dotted magenta). The corresponding electron density increments, i.e., differences between the post-injection profiles and target profiles, are also shown (orange dashed lines for TS measurements, green dotted line for HPI2 simulations and magenta dotted lines for DKES simulations). a) discharge #41777 (6.1x10¹⁸ H atoms, velocity = 808 m/s) and b) discharge #44614 (6.6x10¹⁸ H atoms, velocity = 900 m/s).
It can be observed in both cases that the plasma density given by the HPI2 code is shifted towards outer radii, compared to the experimental profiles. To account for these differences, it
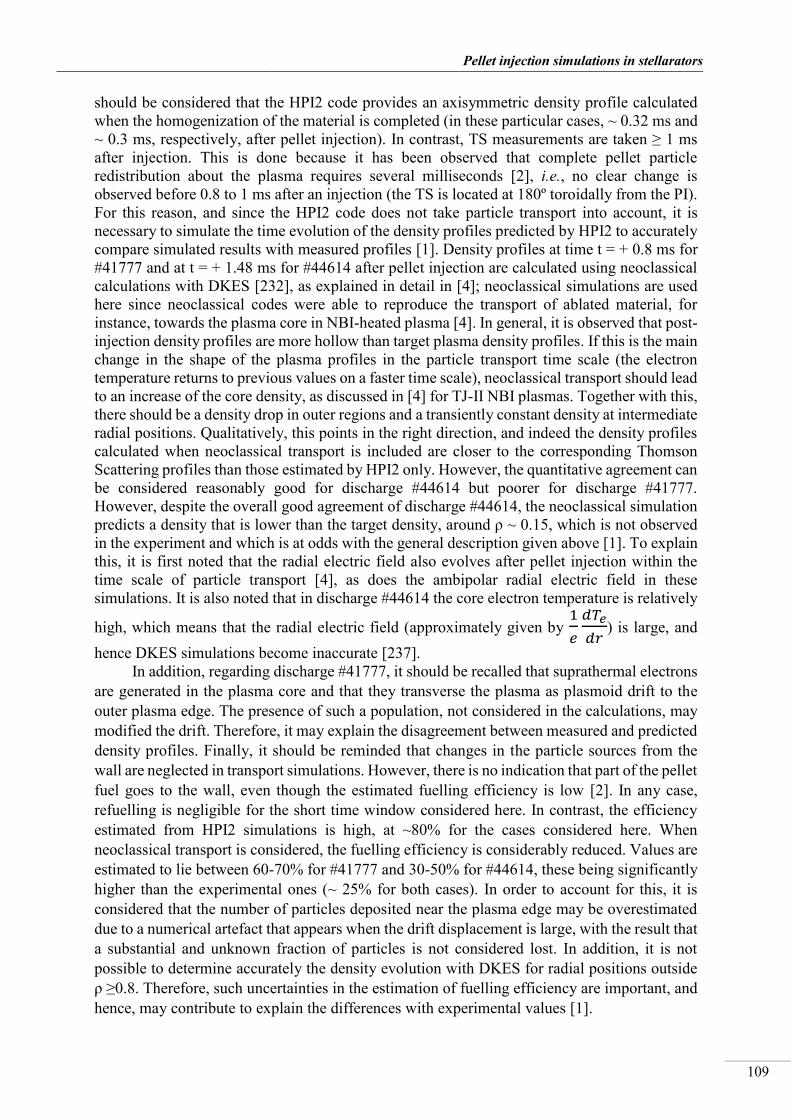
_________________________________________________________________________________
Pellet injection simulations in stellarators
109
should be considered that the HPI2 code provides an axisymmetric density profile calculated when the homogenization of the material is completed (in these particular cases, ~ 0.32 ms and ~ 0.3 ms, respectively, after pellet injection). In contrast, TS measurements are taken ≥ 1 ms after injection. This is done because it has been observed that complete pellet particle redistribution about the plasma requires several milliseconds [2], i.e., no clear change is observed before 0.8 to 1 ms after an injection (the TS is located at 180º toroidally from the PI). For this reason, and since the HPI2 code does not take particle transport into account, it is necessary to simulate the time evolution of the density profiles predicted by HPI2 to accurately compare simulated results with measured profiles [1]. Density profiles at time t = + 0.8 ms for #41777 and at t = + 1.48 ms for #44614 after pellet injection are calculated using neoclassical calculations with DKES [232], as explained in detail in [4]; neoclassical simulations are used here since neoclassical codes were able to reproduce the transport of ablated material, for instance, towards the plasma core in NBI-heated plasma [4]. In general, it is observed that post-injection density profiles are more hollow than target plasma density profiles. If this is the main change in the shape of the plasma profiles in the particle transport time scale (the electron temperature returns to previous values on a faster time scale), neoclassical transport should lead to an increase of the core density, as discussed in [4] for TJ-II NBI plasmas. Together with this, there should be a density drop in outer regions and a transiently constant density at intermediate radial positions. Qualitatively, this points in the right direction, and indeed the density profiles calculated when neoclassical transport is included are closer to the corresponding Thomson Scattering profiles than those estimated by HPI2 only. However, the quantitative agreement can be considered reasonably good for discharge #44614 but poorer for discharge #41777. However, despite the overall good agreement of discharge #44614, the neoclassical simulation predicts a density that is lower than the target density, around ρ ~ 0.15, which is not observed in the experiment and which is at odds with the general description given above [1]. To explain this, it is first noted that the radial electric field also evolves after pellet injection within the time scale of particle transport [4], as does the ambipolar radial electric field in these simulations. It is also noted that in discharge #44614 the core electron temperature is relatively
high, which means that the radial electric field (approximately given by 1
𝑒
𝑑𝑇𝑒
𝑑𝑟) is large, and
hence DKES simulations become inaccurate [237]. In addition, regarding discharge #41777, it should be recalled that suprathermal electrons
are generated in the plasma core and that they transverse the plasma as plasmoid drift to the outer plasma edge. The presence of such a population, not considered in the calculations, may modified the drift. Therefore, it may explain the disagreement between measured and predicted density profiles. Finally, it should be reminded that changes in the particle sources from the wall are neglected in transport simulations. However, there is no indication that part of the pellet fuel goes to the wall, even though the estimated fuelling efficiency is low [2]. In any case, refuelling is negligible for the short time window considered here. In contrast, the efficiency estimated from HPI2 simulations is high, at ~80% for the cases considered here. When neoclassical transport is considered, the fuelling efficiency is considerably reduced. Values are estimated to lie between 60-70% for #41777 and 30-50% for #44614, these being significantly higher than the experimental ones (~ 25% for both cases). In order to account for this, it is considered that the number of particles deposited near the plasma edge may be overestimated due to a numerical artefact that appears when the drift displacement is large, with the result that a substantial and unknown fraction of particles is not considered lost. In addition, it is not possible to determine accurately the density evolution with DKES for radial positions outside ρ ≥0.8. Therefore, such uncertainties in the estimation of fuelling efficiency are important, and hence, may contribute to explain the differences with experimental values [1].
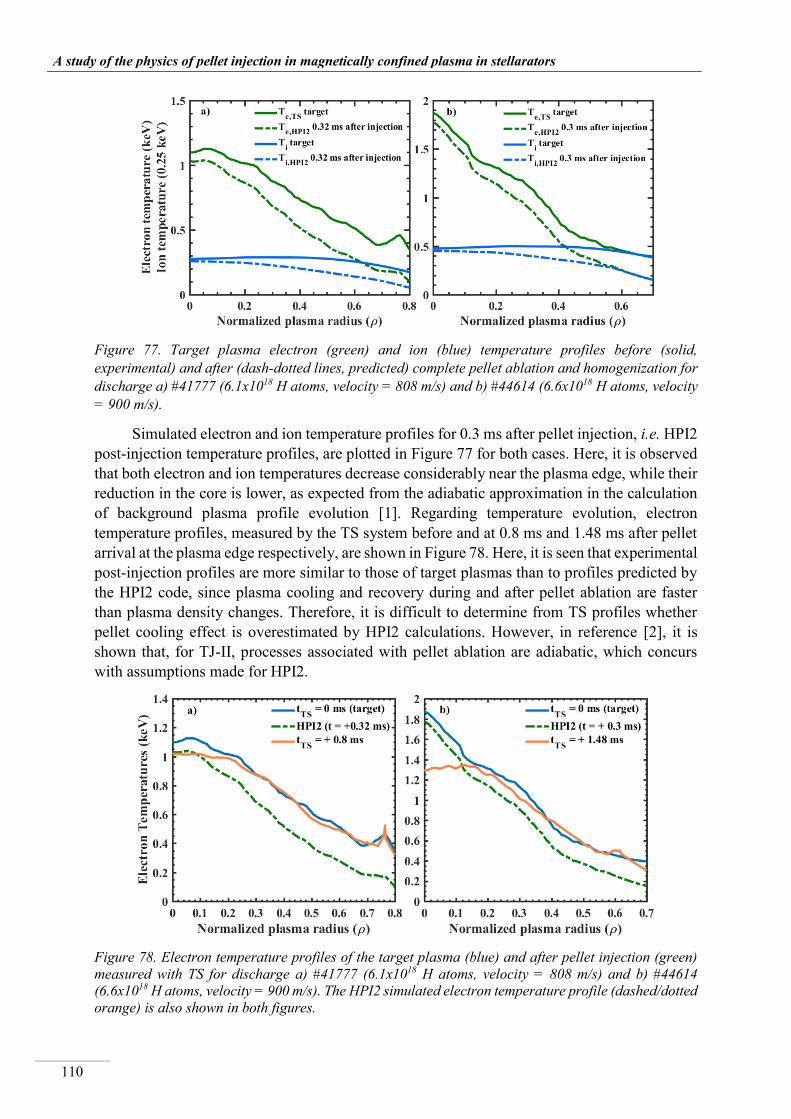
__________________________________________________________________________________
A study of the physics of pellet injection in magnetically confined plasma in stellarators
110
Figure 77. Target plasma electron (green) and ion (blue) temperature profiles before (solid, experimental) and after (dash-dotted lines, predicted) complete pellet ablation and homogenization for discharge a) #41777 (6.1x10¹⁸ H atoms, velocity = 808 m/s) and b) #44614 (6.6x10¹⁸ H atoms, velocity = 900 m/s).
Simulated electron and ion temperature profiles for 0.3 ms after pellet injection, i.e. HPI2 post-injection temperature profiles, are plotted in Figure 77 for both cases. Here, it is observed that both electron and ion temperatures decrease considerably near the plasma edge, while their reduction in the core is lower, as expected from the adiabatic approximation in the calculation of background plasma profile evolution [1]. Regarding temperature evolution, electron temperature profiles, measured by the TS system before and at 0.8 ms and 1.48 ms after pellet arrival at the plasma edge respectively, are shown in Figure 78. Here, it is seen that experimental post-injection profiles are more similar to those of target plasmas than to profiles predicted by the HPI2 code, since plasma cooling and recovery during and after pellet ablation are faster than plasma density changes. Therefore, it is difficult to determine from TS profiles whether pellet cooling effect is overestimated by HPI2 calculations. However, in reference [2], it is shown that, for TJ-II, processes associated with pellet ablation are adiabatic, which concurs with assumptions made for HPI2.
Figure 78. Electron temperature profiles of the target plasma (blue) and after pellet injection (green) measured with TS for discharge a) #41777 (6.1x10¹⁸ H atoms, velocity = 808 m/s) and b) #44614 (6.6x10¹⁸ H atoms, velocity = 900 m/s). The HPI2 simulated electron temperature profile (dashed/dotted orange) is also shown in both figures.

_________________________________________________________________________________
Pellet injection simulations in stellarators
111
As mentioned, post-injection profiles are calculated considering all known driving and damping drift effects. For such effects, the magnitude of the predicted drift velocity for #41777 is between 0.6 km/s and 3.8 km/, when the plasmoid is detached from the pellet; while for #44614, predicted velocities are between 0.4 km/s and 5.1 km/s. In addition, simulated plasmoid drift velocities when the plasmoid is completely ionized are between 1.4 km/s and 3.8 km/s for #41777, whereas, they are between 0.9 km/s and 5.1 km/s for #44614. Moreover, during the homogenization phase, radial drift velocities up to 2.5 km/s to 20 km/s are reached, while poloidal drift velocities of between 1 km/s and 10 km/s are attained for #41777. Similarly, for #44614, the maximum velocities obtained are between 1.4 km/s and 23 km/s for the radial direction and between 0.7 km/s and 14 km/s for the poloidal direction [1].
The time evolution of the drift velocity for a particular plasmoid can also be studied. For instance, the drift velocity, during the complete homogenization phase, for a plasmoid detached when the pellet is at ρ ~ 0.8 is shown in Figure 79, for both experimental cases. Here, radial and poloidal components are plotted, and it is observed that both components are initially accelerated (until t ~ 35 μs). After this time, they decelerate until the motion is completely stopped. The initial acceleration and subsequent deceleration concur with the exposure time dependency found with fast-camera images. Furthermore, the values of the drift velocities, in both the radial and the poloidal direction, calculated with the HPI2 code agree reasonably well with the averaged values estimated from fast camera images (see 4.6) [1].
Figure 79. Simulated evolution of the plasmoid drift velocity, during the homogenization phase, in the radial (blue) and poloidal (green) directions plus the total (pink) for plasmoid #12 (originating at ρ ~ 0.8) for discharges a) #41777 and b) #44614. Negatives poloidal velocities indicate down-directed drifts, while positive radial velocities represent outwards-directed drifts.
Finally, regarding the direction of the drift, it should be recalled that it is defined by the confining magnetic field, in particular by the inverse curvature radius. This implies that, since TJ-II is a fully three-dimensional device, the drift direction of the plasmoid depends on its parallel length. So, in HPI2, as mentioned in the description of the code, the inverse curvature radius is averaged along the whole plasmoid length and, this value is used to calculate the effective drift of the plasmoid. Examples of the inverse curvature radius vector field are plotted for plasmoids whose dimension parallel to the magnetic field lines, Z0, is 0.8 m and 10 m in Figure 80.
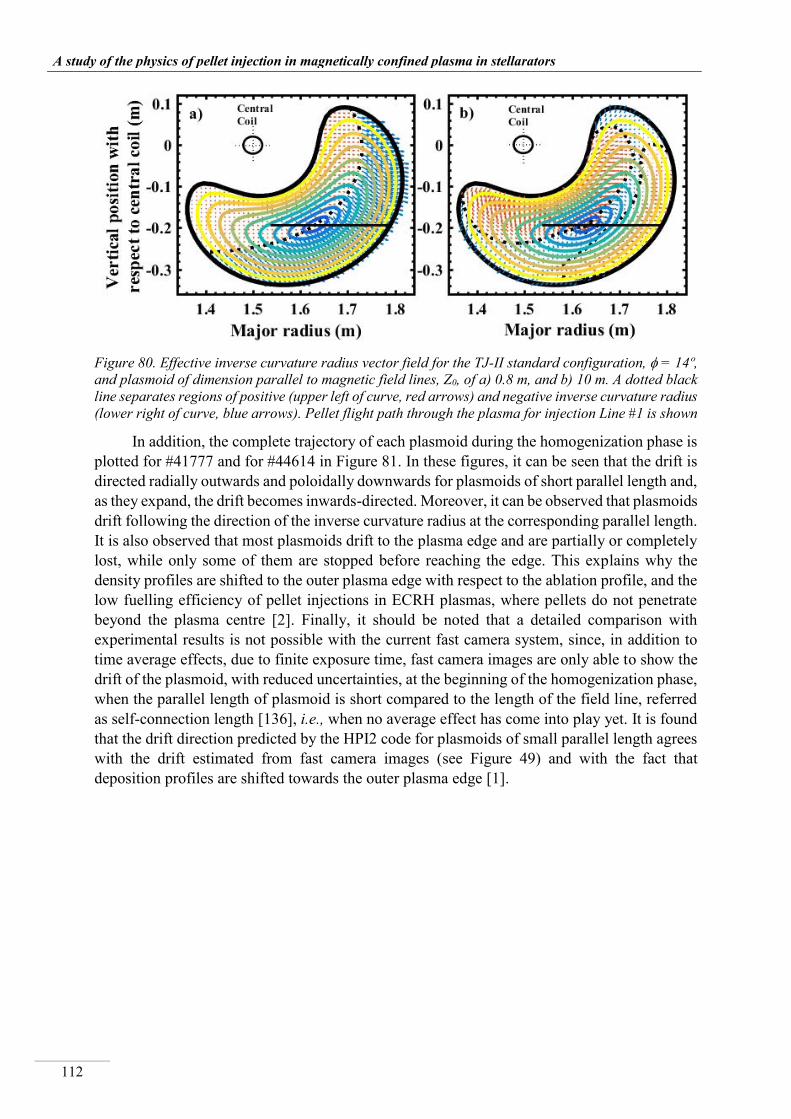
__________________________________________________________________________________
A study of the physics of pellet injection in magnetically confined plasma in stellarators
112
Figure 80. Effective inverse curvature radius vector field for the TJ-II standard configuration, = 14º, and plasmoid of dimension parallel to magnetic field lines, Z0, of a) 0.8 m, and b) 10 m. A dotted black line separates regions of positive (upper left of curve, red arrows) and negative inverse curvature radius (lower right of curve, blue arrows). Pellet flight path through the plasma for injection Line #1 is shown
In addition, the complete trajectory of each plasmoid during the homogenization phase is plotted for #41777 and for #44614 in Figure 81. In these figures, it can be seen that the drift is directed radially outwards and poloidally downwards for plasmoids of short parallel length and, as they expand, the drift becomes inwards-directed. Moreover, it can be observed that plasmoids drift following the direction of the inverse curvature radius at the corresponding parallel length. It is also observed that most plasmoids drift to the plasma edge and are partially or completely lost, while only some of them are stopped before reaching the edge. This explains why the density profiles are shifted to the outer plasma edge with respect to the ablation profile, and the low fuelling efficiency of pellet injections in ECRH plasmas, where pellets do not penetrate beyond the plasma centre [2]. Finally, it should be noted that a detailed comparison with experimental results is not possible with the current fast camera system, since, in addition to time average effects, due to finite exposure time, fast camera images are only able to show the drift of the plasmoid, with reduced uncertainties, at the beginning of the homogenization phase, when the parallel length of plasmoid is short compared to the length of the field line, referred as self-connection length [136], i.e., when no average effect has come into play yet. It is found that the drift direction predicted by the HPI2 code for plasmoids of small parallel length agrees with the drift estimated from fast camera images (see Figure 49) and with the fact that deposition profiles are shifted towards the outer plasma edge [1].
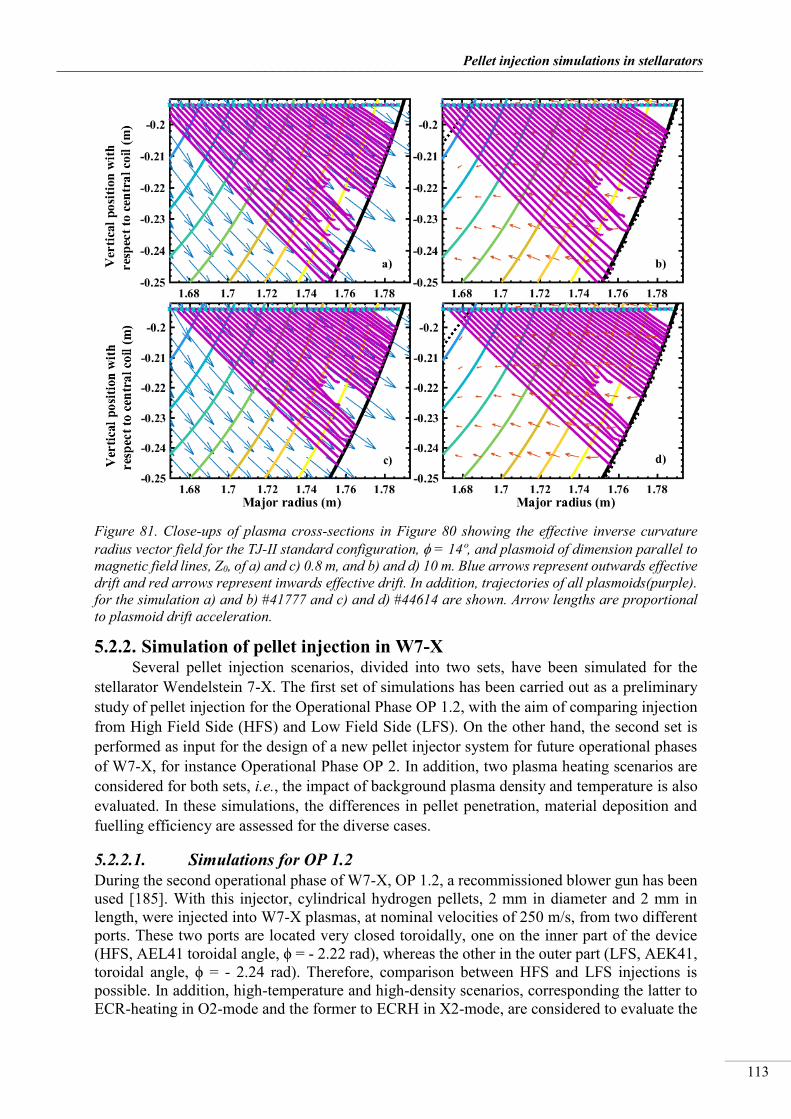
_________________________________________________________________________________
Pellet injection simulations in stellarators
113
Figure 81. Close-ups of plasma cross-sections in Figure 80 showing the effective inverse curvature radius vector field for the TJ-II standard configuration, = 14º, and plasmoid of dimension parallel to magnetic field lines, Z0, of a) and c) 0.8 m, and b) and d) 10 m. Blue arrows represent outwards effective drift and red arrows represent inwards effective drift. In addition, trajectories of all plasmoids(purple). for the simulation a) and b) #41777 and c) and d) #44614 are shown. Arrow lengths are proportional to plasmoid drift acceleration.
5.2.2. Simulation of pellet injection in W7-X Several pellet injection scenarios, divided into two sets, have been simulated for the
stellarator Wendelstein 7-X. The first set of simulations has been carried out as a preliminary study of pellet injection for the Operational Phase OP 1.2, with the aim of comparing injection from High Field Side (HFS) and Low Field Side (LFS). On the other hand, the second set is performed as input for the design of a new pellet injector system for future operational phases of W7-X, for instance Operational Phase OP 2. In addition, two plasma heating scenarios are considered for both sets, i.e., the impact of background plasma density and temperature is also evaluated. In these simulations, the differences in pellet penetration, material deposition and fuelling efficiency are assessed for the diverse cases.
5.2.2.1. Simulations for OP 1.2 During the second operational phase of W7-X, OP 1.2, a recommissioned blower gun has been used [185]. With this injector, cylindrical hydrogen pellets, 2 mm in diameter and 2 mm in length, were injected into W7-X plasmas, at nominal velocities of 250 m/s, from two different ports. These two ports are located very closed toroidally, one on the inner part of the device (HFS, AEL41 toroidal angle, ϕ = - 2.22 rad), whereas the other in the outer part (LFS, AEK41, toroidal angle, ϕ = - 2.24 rad). Therefore, comparison between HFS and LFS injections is possible. In addition, high-temperature and high-density scenarios, corresponding the latter to ECR-heating in O2-mode and the former to ECRH in X2-mode, are considered to evaluate the

__________________________________________________________________________________
A study of the physics of pellet injection in magnetically confined plasma in stellarators
114
effect of background plasma density and temperature in pellet ablation and material deposition. Plasma cross-sections of the mentioned ports can be found in Figure 82 a) and b), while density and temperature profiles of the two plasma scenarios are plotted in Figure 83.
Figure 82. Poloidal cross-sections of the closed magnetic flux surfaces for the standard W7-X configuration at three injection port locations a) AEL41 (ϕ = - 2.22 rad); b) AEK41 (ϕ = - 2.24 rad), and c) AEE41 (ϕ = - 2.39 rad). Pellet injection flight paths are shown in magenta (the injection angles, with respect to the horizontal plane, are 0.13 rad for AEL41, -3.0 rad for AEK41, and π rad for AEE41). Note: origin of magnetic axis considered for ϕ = 0 rad
Figure 83. Profiles of a) electron density and b) electron and ion temperature, corresponding to high-temperature (ECRH in X2-Mode) and high-density (ECRH in O2-Mode) scenarios in W7-X.
In the first instance, a series of simulations with nominal pellet parameters, i.e., 2 mm in length, and 1.5 mm in diameter (instead of 2 mm to account for erosion along injection tubes), and 250 m/s are carried out. These pellets contain approximately 1.9x10²⁰ hydrogen atoms, in contrast to 3.2x10²⁰ particles in a 2 mm x 2 mm pellet. In these simulations, plasma density and temperatures expected for full-power ECRH are used as input. Simulated ablation and deposition profiles obtained in this initial set are shown in Figure 84, while fuelling efficiencies are found in Table 7.
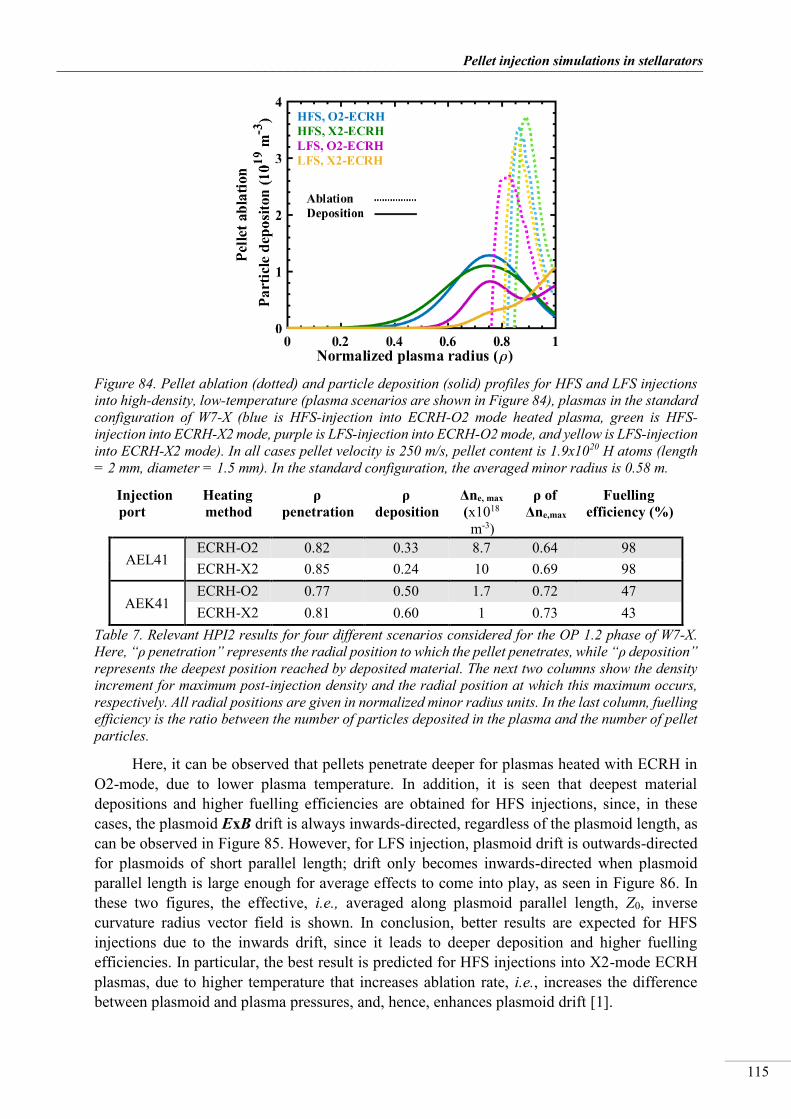
_________________________________________________________________________________
Pellet injection simulations in stellarators
115
Figure 84. Pellet ablation (dotted) and particle deposition (solid) profiles for HFS and LFS injections into high-density, low-temperature (plasma scenarios are shown in Figure 84), plasmas in the standard configuration of W7-X (blue is HFS-injection into ECRH-O2 mode heated plasma, green is HFS-injection into ECRH-X2 mode, purple is LFS-injection into ECRH-O2 mode, and yellow is LFS-injection into ECRH-X2 mode). In all cases pellet velocity is 250 m/s, pellet content is 1.9x10²⁰ H atoms (length = 2 mm, diameter = 1.5 mm). In the standard configuration, the averaged minor radius is 0.58 m.
Injection port
Heating method
ρ penetration
ρ deposition
Δne, max
(x1018
m-3)
ρ of Δne,max
Fuelling efficiency (%)
AEL41 ECRH-O2 0.82 0.33 8.7 0.64 98 ECRH-X2 0.85 0.24 10 0.69 98
AEK41 ECRH-O2 0.77 0.50 1.7 0.72 47 ECRH-X2 0.81 0.60 1 0.73 43
Table 7. Relevant HPI2 results for four different scenarios considered for the OP 1.2 phase of W7-X. Here, “ρ penetration” represents the radial position to which the pellet penetrates, while “ρ deposition” represents the deepest position reached by deposited material. The next two columns show the density increment for maximum post-injection density and the radial position at which this maximum occurs, respectively. All radial positions are given in normalized minor radius units. In the last column, fuelling efficiency is the ratio between the number of particles deposited in the plasma and the number of pellet particles.
Here, it can be observed that pellets penetrate deeper for plasmas heated with ECRH in O2-mode, due to lower plasma temperature. In addition, it is seen that deepest material depositions and higher fuelling efficiencies are obtained for HFS injections, since, in these cases, the plasmoid ExB drift is always inwards-directed, regardless of the plasmoid length, as can be observed in Figure 85. However, for LFS injection, plasmoid drift is outwards-directed for plasmoids of short parallel length; drift only becomes inwards-directed when plasmoid parallel length is large enough for average effects to come into play, as seen in Figure 86. In these two figures, the effective, i.e., averaged along plasmoid parallel length, Z0, inverse curvature radius vector field is shown. In conclusion, better results are expected for HFS injections due to the inwards drift, since it leads to deeper deposition and higher fuelling efficiencies. In particular, the best result is predicted for HFS injections into X2-mode ECRH plasmas, due to higher temperature that increases ablation rate, i.e., increases the difference between plasmoid and plasma pressures, and, hence, enhances plasmoid drift [1].

__________________________________________________________________________________
A study of the physics of pellet injection in magnetically confined plasma in stellarators
116
Figure 85. Effective inverse curvature radius vector field corresponding to injection port AEL41, i.e. HFS injection, and plasmoid parallel length, Z0, of a) 0 m, b) 1 m, c) 5 m and d) 20 m. Here, red arrows represent negative inverse curvature radius, i.e., inwards directed drifts; while blue corresponds to positive inverse curvature radius, i.e., outwards directed drift. Green dotted lines separate regions of different curvature radii, and the solid green line is the last close flux surface.

_________________________________________________________________________________
Pellet injection simulations in stellarators
117
Figure 86. Effective inverse curvature radius vector field corresponding to injection port AEK41, i.e. LFS injection, and plasmoid parallel length, Z0, of a) 0 m, b) 1 m, c) 5 m and d) 20 m. Here, red arrows represent negative inverse curvature radius, i.e., inwards directed drifts; while blue corresponds to positive inverse curvature radius, i.e., outwards directed drift. Green dotted lines separate regions of different curvature radii, and the solid green line is the last close flux surface.
5.2.2.1.1. First pellet injections in W7-X and comparison with HPI2 predictions Hydrogen pellets were injected into ECRH plasmas created in W7-X during its
operational phase OP 1.2a. These injections were performed into plasmas, with hydrogen or helium as the working gas, for a broad range of densities (both X2- and O2-mode heating schemes were employed). When the data is analysed, the pellet velocities are estimated to be between 202 m/s and 286 m/s, whereas the particle content when arriving at the plasma edge are in the range of 1019 to 3x10²⁰ hydrogen atoms per pellet (masses, due to friction with the guide tube inner walls, are ~ 50% to 90% of the nominal masses, depending on the injection direction, i.e., LFS or HFS).
As an example of such injections, 30 pellets were injected into the 20171123_37 program. Eleven of these pellets (7 for the LFS and 4 for the HFS) survived their passage along the injection tubes and arrived at the plasma. For instance, the fourth pellet in the series, with 2.1x10²⁰ H atoms and 215 m/s, reached the plasma at ~ 1.876 s from the LFS. Electron temperature and density profiles, measured with the TS system, before pellet injection (see Figure 87), are used as input parameters for a HPI2 simulation.
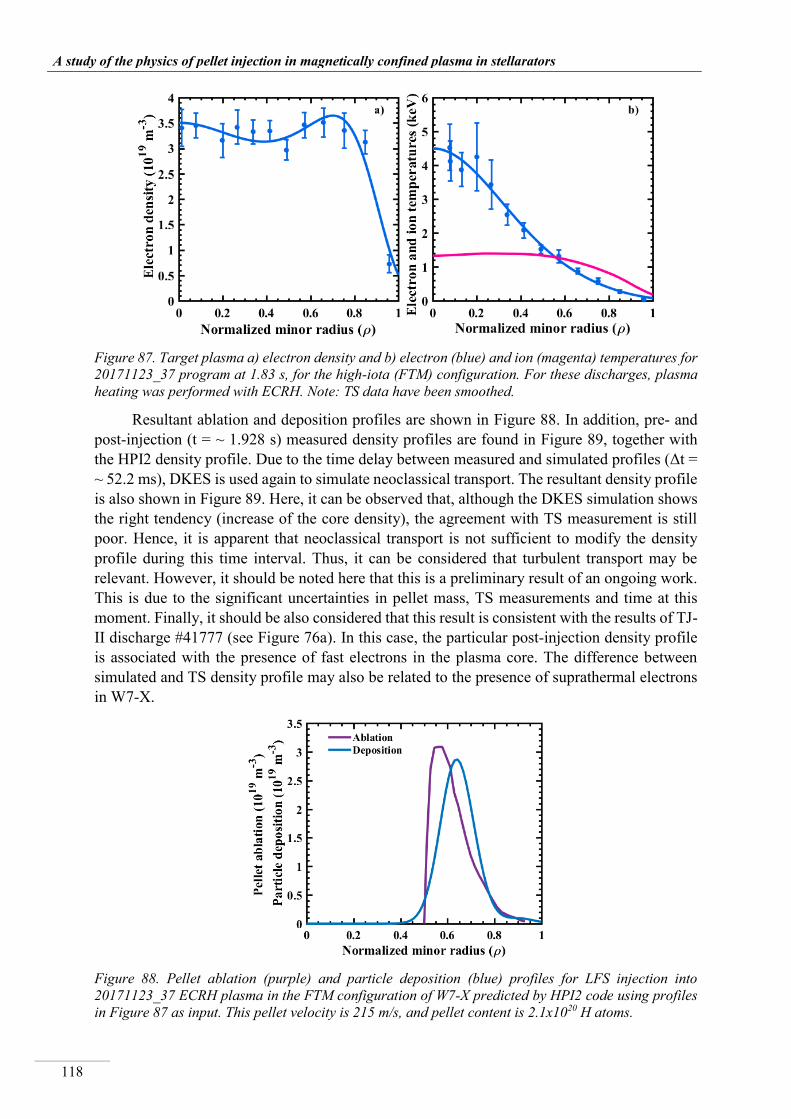
__________________________________________________________________________________
A study of the physics of pellet injection in magnetically confined plasma in stellarators
118
Figure 87. Target plasma a) electron density and b) electron (blue) and ion (magenta) temperatures for 20171123_37 program at 1.83 s, for the high-iota (FTM) configuration. For these discharges, plasma heating was performed with ECRH. Note: TS data have been smoothed.
Resultant ablation and deposition profiles are shown in Figure 88. In addition, pre- and post-injection (t = ~ 1.928 s) measured density profiles are found in Figure 89, together with the HPI2 density profile. Due to the time delay between measured and simulated profiles (Δt = ~ 52.2 ms), DKES is used again to simulate neoclassical transport. The resultant density profile is also shown in Figure 89. Here, it can be observed that, although the DKES simulation shows the right tendency (increase of the core density), the agreement with TS measurement is still poor. Hence, it is apparent that neoclassical transport is not sufficient to modify the density profile during this time interval. Thus, it can be considered that turbulent transport may be relevant. However, it should be noted here that this is a preliminary result of an ongoing work. This is due to the significant uncertainties in pellet mass, TS measurements and time at this moment. Finally, it should be also considered that this result is consistent with the results of TJ-II discharge #41777 (see Figure 76a). In this case, the particular post-injection density profile is associated with the presence of fast electrons in the plasma core. The difference between simulated and TS density profile may also be related to the presence of suprathermal electrons in W7-X.
Figure 88. Pellet ablation (purple) and particle deposition (blue) profiles for LFS injection into 20171123_37 ECRH plasma in the FTM configuration of W7-X predicted by HPI2 code using profiles in Figure 87 as input. This pellet velocity is 215 m/s, and pellet content is 2.1x10²⁰ H atoms.

_________________________________________________________________________________
Pellet injection simulations in stellarators
119
Figure 89. TS electron density profiles measured before (solid blue) and after an injection (solid orange) plus density profiles obtained with HPI2 code (dashed/dotted green) and DKES (dashed/dotted magenta). The corresponding electron density increments, i.e., differences between the post-injection profiles and target profiles, are also shown (orange dashed lines for TS measurements, green dotted line for HPI2 simulations and magenta dotted lines for DKES simulations).
5.2.2.2. Simulations for OP 2 The design of a new pellet injector, optimized for W7-X characteristics, such as size,
plasma profiles or magnetic configuration, is planned for future operational phases (for instance, Operational Phase 2, OP 2). Such a design requires simulations that evaluate the injection for different pellet sizes and velocities, and plasma conditions. For that, a set of simulations has been carried out, and is analysed here. In particular, in these simulations, pellet velocity is varied from 200 m/s to 1000 m/s, while pellet sizes are 2.5 mm (small) and 3 mm (large) in length, and 2.3 mm and 2.8 mm in diameter, respectively, to include pellet erosion due to friction along the injection tubes. The two plasma scenarios used for OP 1.2 simulations, the high-temperature and the high-density, are also used. In addition, two different LFS injections ports are compared, in order to identify the most appropriate. These ports are the AEK41 and the AEE41, located in the bean-shaped cross-section; the plasma cross-section corresponding to these ports is shown in Figure 82b) and c), respectively.
Ablation and deposition predictions corresponding to representative cases of this set of simulations are shown in Figure 90. The effect of pellet injection velocity for the two different pellet sizes, different plasmas scenarios and injection ports can be observed here. In addition, fuelling efficiency values obtained for the whole set of simulations can be found in Table 8 (see also Figure 91). It is observed that, as expected, larger and faster pellets penetrate deeper in the plasma, and hence, in general, the deposition of ablated material is also deeper. However, as can be seen in Figure 90, differences in deposition and maximum density position are bigger for low speed pellets, while these differences become smaller for high speed pellets. For instance, considering the AEK41 case, the radial position of maximum density is 7.1 % (11.4 % for AEE41) deeper for 400 m/s, small pellets than for 200 m/s, small pellets, while the difference, also for small pellets, between 1000 m/s and 800 m/s is 6.1 % (5.7% for AEE41). Moreover, for small pellets, the density increment is 82 % (61 % for AEE41) higher for 400

__________________________________________________________________________________
A study of the physics of pellet injection in magnetically confined plasma in stellarators
120
m/s-pellets than for 200 m/s-pellets, while the difference between 1000 m/s and 800 m/s is 6.5 % (24 % for AEE41). However, the case of large pellets injected from AEE41 port is an exception, as seen in Figure 90d). In this specific example, deposition improves with pellet velocity, i.e., ablated material is deposited deeper into the plasma and a larger amount of this material remains inside the plasma for faster pellets, only up to injection velocities of 600 m/s. In contrast, for faster pellets (800 m/s and 1000 m/s), even though pellets do penetrate deeper into the plasma, material deposition does not improve. Moreover, it worsens with pellet velocity. These results, associated to the ExB drift, will be discussed later.
Figure 90. Pellet ablation (dotted) and particle deposition (solid) profiles for some representative cases simulated for the design of a new pellet injector system for W7-X: a) small (length =2.5 mm, diameter = 2.3 mm) pellets injected into X2-ECRH heated plasmas from AEK41 port at different velocities; b) small pellets injected into X2-ECRH heated plasmas from AEE41 port at different velocities; c) large (length =3 mm, diameter = 2.8 mm) pellets injected into O2-ECRH heated plasmas from AEK41 port a different velocities; and d) large pellets injected into O2-ECRH heated plasmas from AEE41 port a different velocities. Particle content of small pellets is 5.56x10²⁰ H atoms, while it is 8.9x10²⁰ for large pellets.

_________________________________________________________________________________
Pellet injection simulations in stellarators
121
Table 8. Relevant HPI2 results for all different scenarios considered for the OP 2 phase of W7-X. Here, “ρ penetration” represents the radial position to which the pellet penetrates, while “ρ deposition” represents the deepest position reached by deposited material. The next two columns show the density increment for maximum post-injection density and the radial position at which this maximum occurs, respectively. All radial positions are given in normalized minor radius units. In the last column, fuelling efficiency is the ratio between the number of particles deposited in the plasma and the number of pellet particles
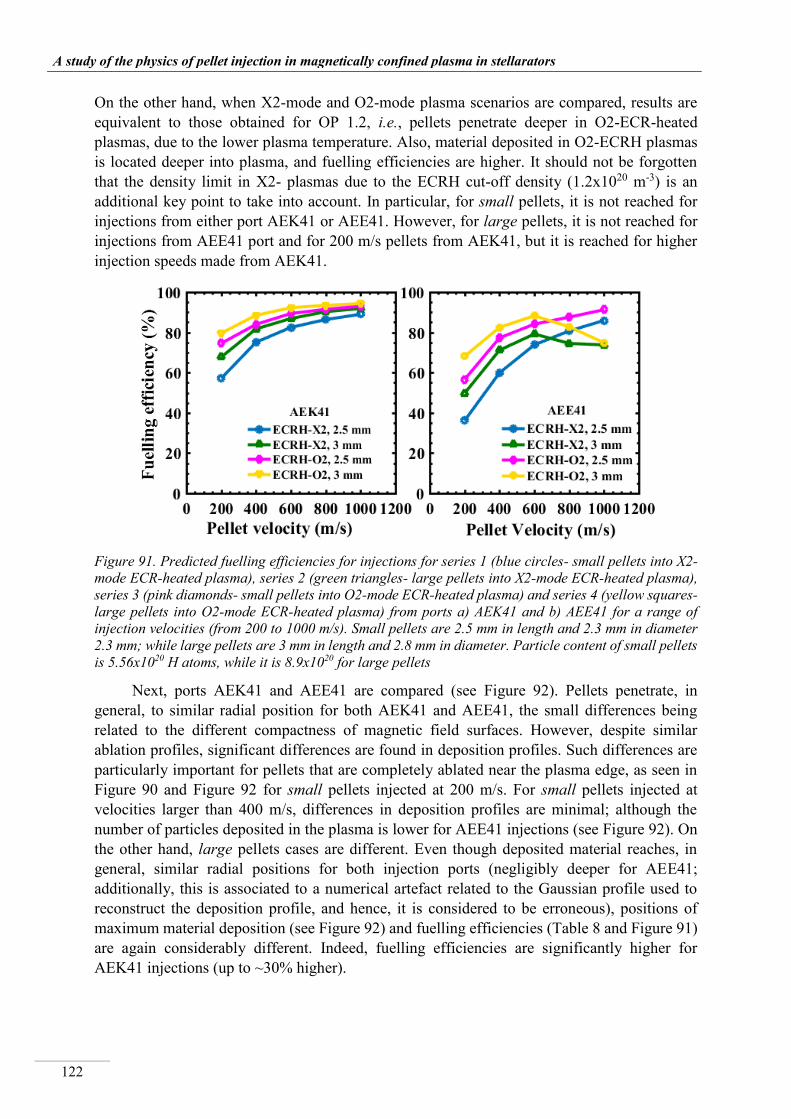
__________________________________________________________________________________
A study of the physics of pellet injection in magnetically confined plasma in stellarators
122
On the other hand, when X2-mode and O2-mode plasma scenarios are compared, results are equivalent to those obtained for OP 1.2, i.e., pellets penetrate deeper in O2-ECR-heated plasmas, due to the lower plasma temperature. Also, material deposited in O2-ECRH plasmas is located deeper into plasma, and fuelling efficiencies are higher. It should not be forgotten that the density limit in X2- plasmas due to the ECRH cut-off density (1.2x10²⁰ m-3) is an additional key point to take into account. In particular, for small pellets, it is not reached for injections from either port AEK41 or AEE41. However, for large pellets, it is not reached for injections from AEE41 port and for 200 m/s pellets from AEK41, but it is reached for higher injection speeds made from AEK41.
Figure 91. Predicted fuelling efficiencies for injections for series 1 (blue circles- small pellets into X2-mode ECR-heated plasma), series 2 (green triangles- large pellets into X2-mode ECR-heated plasma), series 3 (pink diamonds- small pellets into O2-mode ECR-heated plasma) and series 4 (yellow squares- large pellets into O2-mode ECR-heated plasma) from ports a) AEK41 and b) AEE41 for a range of injection velocities (from 200 to 1000 m/s). Small pellets are 2.5 mm in length and 2.3 mm in diameter 2.3 mm; while large pellets are 3 mm in length and 2.8 mm in diameter. Particle content of small pellets is 5.56x10²⁰ H atoms, while it is 8.9x10²⁰ for large pellets
Next, ports AEK41 and AEE41 are compared (see Figure 92). Pellets penetrate, in general, to similar radial position for both AEK41 and AEE41, the small differences being related to the different compactness of magnetic field surfaces. However, despite similar ablation profiles, significant differences are found in deposition profiles. Such differences are particularly important for pellets that are completely ablated near the plasma edge, as seen in Figure 90 and Figure 92 for small pellets injected at 200 m/s. For small pellets injected at velocities larger than 400 m/s, differences in deposition profiles are minimal; although the number of particles deposited in the plasma is lower for AEE41 injections (see Figure 92). On the other hand, large pellets cases are different. Even though deposited material reaches, in general, similar radial positions for both injection ports (negligibly deeper for AEE41; additionally, this is associated to a numerical artefact related to the Gaussian profile used to reconstruct the deposition profile, and hence, it is considered to be erroneous), positions of maximum material deposition (see Figure 92) and fuelling efficiencies (Table 8 and Figure 91) are again considerably different. Indeed, fuelling efficiencies are significantly higher for AEK41 injections (up to ~30% higher).
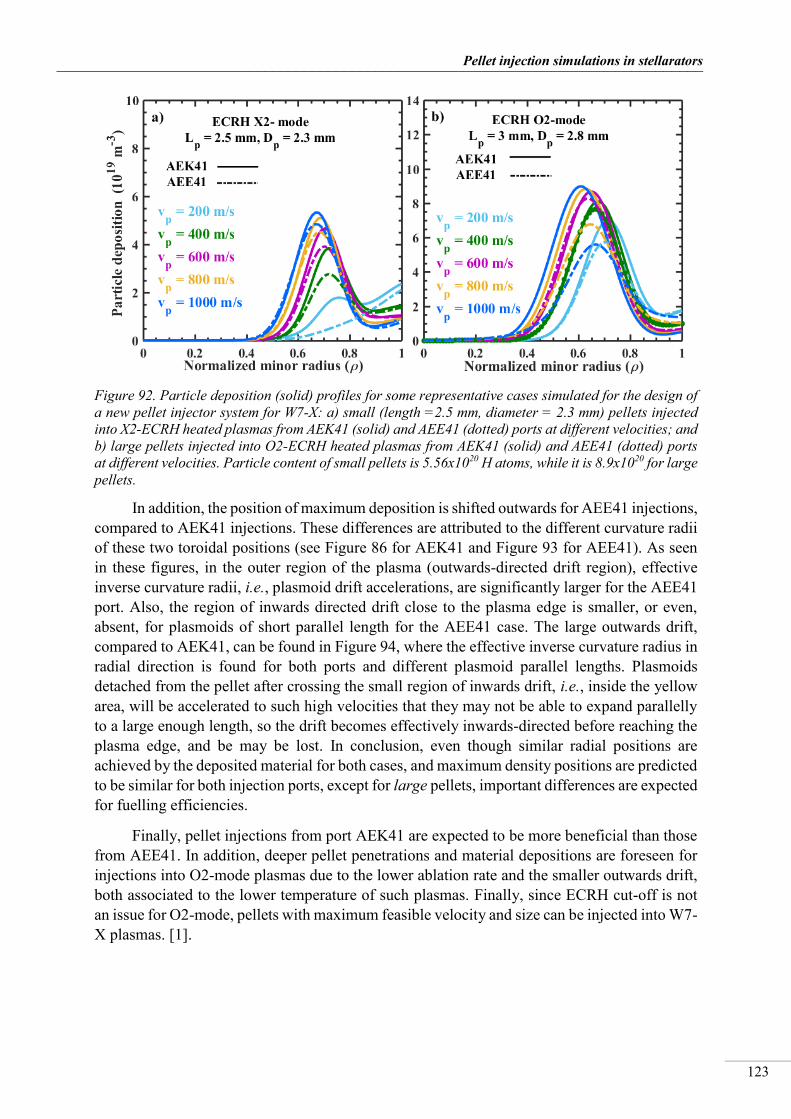
_________________________________________________________________________________
Pellet injection simulations in stellarators
123
Figure 92. Particle deposition (solid) profiles for some representative cases simulated for the design of a new pellet injector system for W7-X: a) small (length =2.5 mm, diameter = 2.3 mm) pellets injected into X2-ECRH heated plasmas from AEK41 (solid) and AEE41 (dotted) ports at different velocities; and b) large pellets injected into O2-ECRH heated plasmas from AEK41 (solid) and AEE41 (dotted) ports at different velocities. Particle content of small pellets is 5.56x10²⁰ H atoms, while it is 8.9x10²⁰ for large pellets.
In addition, the position of maximum deposition is shifted outwards for AEE41 injections, compared to AEK41 injections. These differences are attributed to the different curvature radii of these two toroidal positions (see Figure 86 for AEK41 and Figure 93 for AEE41). As seen in these figures, in the outer region of the plasma (outwards-directed drift region), effective inverse curvature radii, i.e., plasmoid drift accelerations, are significantly larger for the AEE41 port. Also, the region of inwards directed drift close to the plasma edge is smaller, or even, absent, for plasmoids of short parallel length for the AEE41 case. The large outwards drift, compared to AEK41, can be found in Figure 94, where the effective inverse curvature radius in radial direction is found for both ports and different plasmoid parallel lengths. Plasmoids detached from the pellet after crossing the small region of inwards drift, i.e., inside the yellow area, will be accelerated to such high velocities that they may not be able to expand parallelly to a large enough length, so the drift becomes effectively inwards-directed before reaching the plasma edge, and be may be lost. In conclusion, even though similar radial positions are achieved by the deposited material for both cases, and maximum density positions are predicted to be similar for both injection ports, except for large pellets, important differences are expected for fuelling efficiencies.
Finally, pellet injections from port AEK41 are expected to be more beneficial than those from AEE41. In addition, deeper pellet penetrations and material depositions are foreseen for injections into O2-mode plasmas due to the lower ablation rate and the smaller outwards drift, both associated to the lower temperature of such plasmas. Finally, since ECRH cut-off is not an issue for O2-mode, pellets with maximum feasible velocity and size can be injected into W7-X plasmas. [1].

__________________________________________________________________________________
A study of the physics of pellet injection in magnetically confined plasma in stellarators
124
Figure 93. Effective inverse curvature radius vector field corresponding to injection port AEE41, i.e. LFS injection, and plasmoid parallel length, Z0, of a) 0 m, b) 1 m, c) 5 m and d) 20 m. Here, red arrows represent negative inverse curvature radius, i.e., inwards directed drifts; while blue corresponds to positive inverse curvature radius, i.e., outwards directed drift. Green dotted lines separate regions of different curvature radii, and the solid green line is the last close flux surface.
Figure 94. Magnitude of effective inverse curvature radii in radial direction corresponding to injection ports AEK41 (upper) and AEE41 (lower) for different plasmoid parallel lengths, Z0, of a) and d) 0 m; b) and e) 2 m; and c) and f) 5 m. Black dotted lines separate regions of different curvature radii, and the solid black line is the last close flux surface.
_________________________________________________________________________________
Pellet injection simulations in stellarators
125
5.3. DISCUSSION OF LIMITATIONS OF MODELS USED IN HPI2 The HPI2 code has been used to simulate pellet injection in several tokamaks, achieving a
satisfactory agreement with the experimental results [136, 226–229]. In addition, it has been used to simulate both LFS and HFS pellet injections in LHD, after modifications made to include the effect of a fully three-dimensional magnetic field in the calculation of the drift acceleration [43, 225]. Recently, additional modifications have been done to include a generalized calculation of the exact magnetic field and reduce the computational time [1, 234]. These modifications resulted in the stellarator version used and benchmarked here [1]. However, there exist two main limitations for this stellarator version. The first one is related to the presence of suprathermal particles, either electrons or ions; while the second is the approximation in the drift calculation. Regarding the latter, it should be noted that, due to the finite rotational transform in a tokamak, the magnetic field strength also varies along the magnetic field line. Indeed, even for relatively small iota, due to the relative compactness, the variation of B on a flux surface is typically larger than in large-aspect ratio stellarators. Therefore, the magnetic field also varies along the plasmoid parallel length for tokamaks. Since HPI2 predictions have been validated for tokamaks, this provides confidence for stellarators. Indeed, for the experimental cases discussed here, this does not seem to be a problem.
On the other hand, the current inability to simulate pellet injection into plasmas where suprathermal particles are present is in fact an important limitation. Considering first the case of fast ions, present in NBI plasmas, it has already been mentioned that, in the version used here, their presence is not included in the ablation calculation. This implies that the accuracy of the prediction is reduced, since fast ions are known to have a relatively important effect in the ablation rate. In addition, the deflection of the pellet trajectory provoked by fast ions in unbalanced NBI-heated plasmas cannot be simulated, since the current HPI2 code version only allows simulations for constant toroidal position. This can be overcome to a certain degree, since, as mentioned, the change in pellet toroidal position for almost-balanced NBI plasmas is negligible. Finally, for suprathermal electrons, it has been seen in Subsection 5.2.1 that its essential to include their effects in the calculation of the ablation rate, since they produce an over-ablation that may be very significant. Moreover, their presence seems to have a substantial effect on plasmoid drift, modifying noticeably post-injection density profiles, which cannot be reproduced by the current model. Therefore, this effect must be included. The possible effects of suprathermal electrons on plasmoid drift, highlighted by this work, will require future effort to understand and account for them.

__________________________________________________________________________________
A study of the physics of pellet injection in magnetically confined plasma in stellarators
126
_________________________________________________________________________________
Conclusions and future work
127
6. CONCLUSIONS AND FUTURE WORK In this work, pellet injection physics has been studied, since pellets are the best candidate
to refuel the plasma core in large fusion devices. It should be pointed out that core fuelling is key to achieve peaked density profiles, this being this of primary importance for helical devices, since neoclassical theory predicts that on-axis electron and/or ion cyclotron resonance heating (ECRH, ICRH) leads to strongly hollow profiles, which degrades the central energy confinement, having disastrous consequences. Keeping this in mind, further studies of pellet ablation and plasmoid homogenization are of vital importance for a complete understanding of the involved mechanisms, to validate current models and to optimized both the location(s) of the injector(s) and the pellet and plasma parameters for helical devices. Thereby, proving that stellarators are a solid alterative to tokamaks as a commercial power plant. Results of this research, summarized here, intent to help enlighten some of the pending issues of pellet injection processes in stellarators, outlined in Chapters 1 and 2, such as plasmoid drift. The same way experimental and simulation results have been presented independently (see Chapter 4 and 5), in this chapter the experimental results in TJ-II are firstly summarized and conclusions are highlighted. Next, conclusions extracted from simulations in TJ-II and W7-X are presented. Finally, possible future lines of work are outlined.
6.1. SUMMARY OF CONCLUSIONS FROM EXPERIMENTAL WORK IN TJ-II Solid hydrogen pellet injection experiments have been performed in the stellarator TJ-II
to clarify the influence of heating method, magnetic configuration and plasma parameters on pellet dynamics and fuelling efficiency in this helical device. The main conclusions extracted from these experiments are summarized here.
• The effects of pellet injection on plasmas have been studied. The rapid and dramatic effect of pellet injection, i.e., electron temperature drop, and density increment, is a transient effect whose duration depends on plasma parameters before the injection, since they determine pellet penetration depth and particle confinement time (deeper penetration implies a larger density increment, while a higher post injection density means longer particle confinement).
• The temporal evolution of the Balmer Hα light emitted by the neutral cloud surrounding a pellet gives an indication of the ablation rate (both quantities are approximately related). For ECRH plasmas, it is found that significant ablation, which strongly depends on plasma temperature, occurs only after a pellet has penetrated a few centimetres into the plasma and that it increases moderately as it penetrates deeper into the plasma, until a maximum is achieved (usually close to the plasma core), before decreasing suddenly when the pellet is totally consumed. In addition, the lifetimes of pellets injected into ECRH is short, and penetration is shallow (typically ≤~12 cm), due to the relatively high temperatures. On the other hand, pellets injected into the low-temperature NBI plasmas are ablated at a lower rate (about half), so their lifetimes, and hence their penetration depths, are longer. Regarding the ablation profile, emission increases suddenly around five centimetres from the plasma edge and remains approximately constant until the pellet crosses the magnetic axis; afterwards, the emission is reduced, and continuous at this lower rate until the complete consumption of

__________________________________________________________________________________
A study of the physics of pellet injection in magnetically confined plasma in stellarators
128
the pellet. These differences are attributed to the shape of the suprathermal ion distribution in TJ-II.
• The presence of suprathermal electrons in the plasma core, sometimes found in off-axis ECRH and NBI-only heated plasmas, can result in enhanced ablation at the end of a pellet lifetime, depending on the target plasma density. This leads to a significant peak in the Hα emission near the region where these fast electrons are confined.
• The Hα emission is seen to be modulated for both ECRH and NBI injections. These oscillations or striations, repeated in all the examples, can be considered to have a physical origin. In addition, it is observed that few oscillations are present near the plasma edge, and that both their frequency and amplitude increase as the pellet penetrates into plasma. Moreover, striations are reduced after a pellet has penetrated beyond the magnetic axis. These observations agree with the striation model based on the Rayleigh-Taylor instability, according to which their frequency depends on the ratio between the electron temperature and the magnetic field, and the appear only for a threshold rotation frequency, i.e., for a threshold electron temperature (about 100 eV for TJ-II).
• Pellet penetration dependence on several plasma and pellet parameters is analysed. It is found that pellet penetration increases, in general, with line-averaged density, pellet velocity and pellet particle content (the electron temperature dependency has not been included due to a data limitation, although it is known that pellet penetration strongly depends on electron temperature). However, the presence of suprathermal electrons limits penetration by destroying the pellet around the position where these are confined. From these analysis, the following relationship is obtained:
𝜆𝑝(𝑚) = 𝐶 · (𝑚𝑝0.1944 · 𝑣𝑝
1.5057 · ⟨𝑛𝑒⟩0.2727) (4-10)
• The plasma heating method plays a key role in the achievable pellet penetration, since it determines plasma temperature and density, and the possible presence of suprathermal electrons, which can destroy the pellet.
• Pellet dynamics have been studied by analysing fast-frame camera images. First, it is concluded that radial acceleration is zero or negligible. Second, it is found that pellets injected into ECRH plasmas follow the original injection path. This implies that there are no heating asymmetries producing a Rocket Effect acceleration. In contrast, it is observed that pellets injected into NBI plasmas are deflected in both toroidal and poloidal directions (along the direction of the neutral beam ions). In addition, it is seen that toroidal deflections are larger than poloidal ones (toroidal accelerations lie between 106 and 107 m/s2; while poloidal accelerations are estimated to be 104 to 106 m/s2). Moreover, it is observed that, for similar NBI parameters, accelerations generated by anti-parallel NBI injection are larger than those for parallel NBI injection. Furthermore, absolute accelerations are found to depend on target plasma density (measured accelerations increase with target plasma density and, after a maximum density has been reached, they decrease again). This is explained by considering that fast-particle capture by the plasma increases with electron density. Also, estimated accelerations are compared to accelerations predicted by the Rocket Effect and by momentum exchange. It is concluded that the Rocket Effect alone cannot explain the observed accelerations and that a combination of both Rocket Effect and momentum exchange is responsible for the observed accelerations.
• Plasmoid drifts, both in radial and poloidal directions, are studied by analysing light emissions recorded by the fast camera system for ECRH and NBI plasmas. Plasmoid drifts
_________________________________________________________________________________
Conclusions and future work
129
towards the outer and lower plasma edge are found (outward drift). Average radial velocities between ~ 0.5 km/s and ~ 19 km/s are estimated, while average poloidal velocities between ~ 0.5 km/s and ~ 21 km/s are calculated. It is observed that the obtained values strongly depend on the exposure time, since drift velocity decreases rapidly with time, i.e., there is significant deceleration. In addition, a dependence between averaged drift displacement and plasmoid detachment position is found: drift velocity increases as the pellets travels into the plasma (dominant drift term depends on the difference between plasma and plasmoid pressures, which increases with plasma temperature.). Moreover, a dependence between decreased local drift and rational surfaces is observed. Also, once the pellet has crossed the magnetic axis, plasmoids seem to drift towards the plasma centre (inward drift). This change could be an indication of the inward-directed drift predicted by current homogenization models.
• Finally, fuelling efficiency studies have been carried out. It is found that fuelling efficiency increases with increasing target density and with increasing pellet penetration depth. In addition, fuelling efficiencies are lower for ECRH plasma (≤ 40%), while higher for NBI plasmas (≤ 85%). These results are explained by considering the plasmoid ExB drift, which is outwardly-directed for the outer plasma region and whose magnitude is related to the plasma-plasmoid pressure difference. On the contrary, injections into plasmas where a core-localized population of suprathermal electrons is present, result in higher fuelling efficiencies, although fast-electron over-ablation in the plasma core limits pellet penetration. This is attributed to two different mechanisms. On the one hand, the outwards-directed drift acceleration in the core region is expected to be small or negligible, and, in addition, to rapidly become inward-directed as the plasmoid expands. Thus, total drift is small and, hence, the amount of lost material due to plasmoid drift is reduced. On the other hand, the presence of suprathermal electrons appears to modify the drift acceleration. Therefore, it is considered that the controlled generation of such populations could be used as a means of improving fuelling efficiency in TJ-II.
6.2. SUMMARY OF CONCLUSIONS FROM PELLET SIMULATIONS A Neutral Gas Shielding (NGS)-based code has been adapted for pellet ablation
simulations. TJ-II experimental results have been compared with NGS simulations. In addition, the HPI2 code, in its stellarator version, has been used to simulate pellet ablation and material deposition in TJ-II and W7-X. Obtained results and conclusions are:
• The NGS-based code is able to reproduce fairly well ablation profiles, and pellet penetration depths, within ≤ 15%, for ECRH TJ-II plasmas. On the other hand, results for injections into NBI TJ-II plasmas are less satisfactory; especially, the shape of the ablation profile is only approximately reproduced, while pellet penetration depths are reasonably well predicted (to 10%). In both cases, differences in pellet penetration depth are partially explained by uncertainties in pellet mass and velocity. In addition, for injections into NBI plasmas, assumptions in fast ion profile and energy contribute significantly to the differences found. It is concluded that this is a useful tool for calculating pellet penetration depths and ablation rates in TJ-II, since the result is satisfactory, and the required computational time is very short.
• The HPI2 code is used to simulate pellet injection into ECRH plasmas for the TJ-II standard configuration. The agreement between the recorded Hα and the predicted ablation profile is reasonably good, considering that Hα emission is not directly proportional to ablation rate.

__________________________________________________________________________________
A study of the physics of pellet injection in magnetically confined plasma in stellarators
130
This agreement improves when the average Hα emission for a complete series of reproducible discharges or the light profile obtained from the montage of snap-shot fast camera images, if available, are considered. In addition, it is found that suprathermal electrons present in the plasma core enhance ablation at the end of the pellet lifetime. This is shown here for discharge #41777. The effect of such fast electrons is not included in this version of the code. However, the pellet is almost fully ablated near the plasma core. Therefore, the effect of suprathermal electrons in pellet ablation is reduced, as is the difference with the simulated ablation rate. Thus, pellet penetration depths are well predicted by the HPI2 code in both cases.
• Post-injection plasma density profiles predicted by the HPI2 code are compared with Thomson Scattering (TS) measurements in TJ-II. These are found to be shifted towards outer radii when compared to the experimental profiles. Thus, since experimental profiles are obtained several milliseconds after injections (HPI2 code predictions are for 0.3 ms after injection), it has been necessary to use a transport code to follow the temporal evolution of the simulate profiles. For this a neoclassical code is used (DKES). As a result, predicted density profiles that include neoclassical transport are closer to the corresponding Thomson Scattering profiles than those estimated by HPI2 only. However, the quantitative agreement can be considered reasonably good for the on-axis ECRH case (discharge #44614) but poorer for the off-axis ECRH case (discharge #41777), due to the presence of suprathermal electrons, which is not considered in the code.
• Fuelling efficiencies estimated from HPI2 simulations are high (~ 80% for the TJ-II ECRH cases considered here). When neoclassical transport is considered, fuelling efficiencies are significantly reduced (60-70% for #41777 and 30-50% for #44614). In all cases, these values are considerably higher than the experimental ones (~ 25% for both cases). Differences are partly attribute to a numerical artefact that appears when plasmoid drift displacement is large. Because of this, a substantial and unknown fraction of particles, that may be lost in real injection, is considered to remain inside the plasma. In addition, it is not possible to determine accurately the density evolution with DKES for radial positions outside ρ ≥ 0.8, which may contribute to explain the differences with experimental values.
• When post-injection plasma electron temperature profiles, simulated by the HPI2 code, are compared with experimental TJ-II ones, it is found that experimental ones are closer to those of target plasmas than to HPI2 profiles. It is note that plasma cooling and recovery, during and after pellet ablation, respectively, occurs on shorter timescales than plasma density changes. Therefore, it is difficult to determine from TS profiles if the pellet cooling effect is overestimated by HPI2 calculations. However, for TJ-II, processes associated with pellet ablation are found to be adiabatic, which concurs with assumptions made for HPI2.
• Plasmoid drift magnitudes and directions predicted by HPI2 are compared with TJ-II experimental results. Firstly, the predicted drift direction for plasmoids of short parallel length (occurring towards the outer and bottom plasma edge) agrees with fast-camera observations. In addition, the values of the drift velocities, in both the radial and poloidal directions, calculated with the HPI2 code agree reasonably well with the averaged values estimated from fast camera images. Moreover, the time evolution of both radial and poloidal plasmoid drifts is obtained with HPI2. It is observed that both components are initially accelerated, and then they are decelerated until their motion is completely stopped. This concurs with the fact that the estimated average drift from fast camera images depends on exposure time. Considering trajectories of all plasmoids, it is also observed that a large majority of plasmoids drift to the plasma outer edge, where they are partially or completely

_________________________________________________________________________________
Conclusions and future work
131
lost, while the remainders are stopped before reaching the edge. This explains why density profiles are shifted towards the outer plasma edge with respect to the ablation profile, and the low fuelling efficiency of pellet injections in ECRH plasmas.
• A set of simulations is carried out, using HPI2, as a preliminary study for pellet injection during the OP 1.2 experimental phase of W7-X. It is predicted that better fuelling can be attained for HFS injections due to the inwards drift, since it leads to deeper deposition and less particle losses. In particular, the best result is predicted for HFS injections into X2-mode ECRH plasmas, due to higher temperature that increases ablation i.e., increases the difference between plasmoid and plasma pressures, and, hence, enhances plasmoid drift.
• A preliminary example of density profile prediction comparison with experimental results (OP 1.2a phase) from W7-X is made. The DKES code is also used here to follow the post-injection temporal evolution of simulated density profiles and to allow comparison with experimental TS profiles. Although the DKES prediction shows a consistent tendency with the experimental results (increase of the core density), the agreement in absolute terms with TS measurement is poor. However, the significant current uncertainties in pellet mass, TS measurements and times for W7-X can partially account for these differences. In addition, it is possible that turbulent transport is relevant. Nonetheless, it should be highlighted that this result is consistent with TJ-II results (for instance, discharge #41777). For #41777, its post-injection density profile is associated with the presence of fast electrons in the plasma core, which seems to have a substantial effect on plasmoid drift. Indeed, the differences between simulated and TS density profiles can also be related to the possible presence of suprathermal electrons in W7-X plasmas.
• A second set of simulations has been carried out for W7-X for two candidate injection ports (AEK41 and AEE41), with the aim of providing input for the design of a new pellet injector. It is predicted that large and fast pellets penetrate deeper in the plasma, and hence, in general, the expected deposition of ablated material is also deeper, and the predicted fuelling efficiency is higher. Also, pellets are prognosticated to penetrate deeper into O2-ECRH plasmas than into X2-ECRH plasmas, and hence, material is expected to be deposited deeper into the plasma and fuelling efficiencies are predicted to be higher for O2-ECRH plasmas. However, for large pellets injected from the AEE41 port, deposition is expected to improve with pellet velocity only up to 600 m/s. In contrast, for faster pellets (800 m/s and 1000 m/s), material deposition predictions worsen with pellet velocity. Regarding the comparison between AEK41 and AEE41 ports, it is found that pellets penetrate, in general, to similar radial position for both ports. However, the position of maximum deposition is shifted outwardly and fuelling efficiencies are significantly lower for AEE41 injections, compared to AEK41 injections. These differences are attribute to the different curvature radii of these two toroidal positions.
6.3. FUTURE WORK The experiments and simulations carried out during the development of this thesis have
helped broadened the knowledge of the complex mechanisms involved in pellet ablation and material homogenization, particularly in stellarators. However, in some cases, new questions have arisen. Thus, further experimental studies and simulations are required. In addition, some effects or mechanisms noted here require additional investigation. These future lines of work are presented and briefly described below. First, further experiments in TJ-II are outlined, followed by some theoretical studies and simulations with HPI2. Next, some additional work
__________________________________________________________________________________
A study of the physics of pellet injection in magnetically confined plasma in stellarators
132
related to pellet injection in W7-X is explained. Finally, possible further studies and comparison with other non-axisymmetric devices are commented.
• Plasmoid drift has been observed to be locally reduced in the vicinity of rational surfaces in fast camera images recorded either from INNER TOP or TANG ports. However, for unbalanced NBI heating, such local reductions in drift displacement cannot be linked to rational surface positions along the original injection path, since the pellet position changes toroidally and poloidally. Therefore, its exact position is unknown (the poloidal position for TOP images, while the toroidal for TANG). Assuming that these local minima in the drift displacement indicate the radial locations of rational surfaces, then this might allow reconstructing the pellet trajectory.
• Related to the local reduction of the drift displacement in the vicinity of rational discussed in the previous point, it is deduced that the iota-profile, and hence the confining magnetic configuration, plays a key role in the magnitude of the plasmoid drift displacement, and hence on the efficiency of the fuelling and in the shape of the deposition profile. Although drift displacement reduction has been directly observed in fast camera images in TJ-II, iota-profile scans have not been performed and, hence, comparison of plasmoid drift and its local minima for different magnetic configurations has not been carried out. In addition, such scans, complemented with simulations with HPI2, should allow identifying advantageous magnetic configurations that allow maximum efficiency.
• The current TJ-II fast-camera system does not allow univocally determining the trajectory of the pellet, since three-dimensional measurements are not available. Therefore, for injection into NBI-heated plasmas, it is not possible to determine the actual direction of the pellet acceleration to verify if it is parallel to the neutral beam injection direction. To overcome this limitation, it is planned to install a double-bundle fast-camera system, so recording from two viewports simultaneously will be possible.
• The almost-balanced NBI heating cases analysed in Chapter 4, shows that, once the pellet has crossed the magnetic axis, plasmoids seem to drift towards the plasma centre. This change could be an indication of inwards-directed drift. Further analysis of injections into such discharges may confirm the existence of plasmoid inwards drifts in TJ-II without the need of HFS injections.
• The presence of suprathermal electrons in the TJ-II plasma core results in increased fuelling efficiencies and density profiles that cannot be reproduced by HPI2. The increase in fuelling efficiency is partly explained by considering the over-ablation produced near the plasma core. Here ExB drift is negligible or directed to the plasma core (inward-directed), which results in short outwards or inwards, respectively, drift displacements and, hence, reduces the number of lost particles. However, the presence of suprathermal electrons seems to modify plasmoid drift. Thus, further experiments are necessary to understand the effect of fast electrons in plasmoid drift. In addition, complementary simulations need to be carried out with HPI2. Moreover, the effects of suprathermal electrons in both the pellet ablation, which is known, and in the material deposition, must be added to the HPI2 model.
• Regarding stellarator-version HPI2 limitations to pellet injections of constant toroidal position, which does not allow simulating injections into NBI plasmas, it can be overcome without modifying substantially the code. Indeed, for almost-balanced NBI TJ-II plasmas, pellet trajectory deflection is negligible, and hence, these cases can be simulated, providing that the effect of fast ions in the calculation of pellet ablation is included.
_________________________________________________________________________________
Conclusions and future work
133
• Comparison of experimental results and HPI2 predictions in W7-X requires significant further work, since currently all results are preliminary. For instance, considering the effect of suprathermal electrons in pellet ablation, studying their effect on plasmoid drift or analysing the effect of magnetic islands on both ablation and plasmoid drift.
• Finally, an inter-device comparison of ablation and deposition predictions using the same code, in this case HPI2, is planned for all the non-axisymmetric devices that possess a pellet injector.

__________________________________________________________________________________
A study of the physics of pellet injection in magnetically confined plasma in stellarators
134

_________________________________________________________________________________
Publications and contributions to conferences
135
PUBLICATIONS AND CONTRIBUTIONS TO CONFERENCES Publications • N. Panadero, K. J. McCarthy, F. Köchl, J. Baldzuhn, J. L. Velasco, S. K. Combs, E. de la
Cal, J. Hernández Sánchez, D. Silvagni, Y. Turkin and the TJ-II and W7-X teams, “Experimental studies and simulations of hydrogen pellet ablation in the stellarator TJ-II,” Nucl. Fusion, vol. 58, no. 2, p. 26025, 2018
• K. J. McCarthy, N. Panadero, A. López-Fraguas, J. Hernández, and B. van Milligen, “A Spectrally Resolved Motional Stark Effect Diagnostic for the TJ-II Stellarator,” Contrib. to Plasma Phys., vol. 55, no. 6, 2015
• K. J. McCarthy, N. Panadero, J. L:Velasco, S. K. Combs, J. B. O. Caughman, J. M.
Fontdecaba, C. R. Foust, R. García, J. Hernández Sánchez, M. Navarro, I. Pastor, A. Soleto and the TJ-II Team, “Plasma fuelling with cryogenic pellets in the stellarator TJ-II,” Nucl. Fusion, vol. 57, no. 5, p. 56039, 2017
• J. L. Velasco, K. J. McCarthy, N. Panadero, S. Satake, D. López-Bruna, A. Alonso, I.
Calvo, A. Dinklage, T. Estrada, J. M. Fontdecaba, J. Hernández, R. García, F. Medina, M. Ochando, I. Pastor, S. Perfilov, E. Sánchez, A. Soleto, B. Ph. Van Milligen and A. Zhezhera, “Particle transport after pellet injection in the TJ-II stellarator,” Plasma Phys. Control. Fusion, vol. 58, no. 8, p. 84004, 2016
• K. J. McCarthy, N. Tamura, S. K. Combs, N. Panadero, E. Ascasíbar, T. Estrada, R. García,
J. Hernández Sánchez, A. López Fraguas, M. Navarro, I. Pastor and A. Soleto, “Comparison of cryogenic (hydrogen) and TESPEL (polystyrene) pellet particle deposition in a magnetically confined plasma,” EPL, vol. 120, no. 2, 2017
• N. Tamura, K. J. McCarthy, H. Hayashi, S. K. Combs, C. R. Foust, R. García, N. Panadero,
E. Pawelec, J. Hernández Sánchez, M. Navarro and A. Soleto, “Tracer-Encapsulated Solid Pellet (TESPEL) injection system for the TJ-II stellarator,” Rev. Sci. Instrum., vol. 87, no. 11, 2016
• K. J. McCarthy, N. Tamura, S. K. Combs, R. García, J. Hernández Sánchez, M. Navarro,
N. Panadero, I. Pastor and A. Soleto, “Identification of S VIII through S XIV emission lines between 17.5 and 50 nm in a magnetically confined plasma,” Phys. Scr., vol. 93, no. 3, p. 35601, 2018
• T. Sunn Pedersen et al., “Confirmation of the topology of the Wendelstein 7-X magnetic
field to better than 1:100,000,” Nat. Commun., vol. 7, p. 13493, 2016 • F. Castejón et al., “3D effects on transport and plasma control in the TJ-II stellarator,”
Nucl. Fusion, vol. 57, no. 10, 1020220, 2017 • R. C. Wolf et al., “Major results from the first plasma campaign of the Wendelstein 7-X
stellarator,” Nucl. Fusion, vol. 57, no. 10, 102020, 2017
__________________________________________________________________________________
A study of the physics of pellet injection in magnetically confined plasma in stellarators
136
Oral contributions to conferences • N. Panadero, F. Köchl, J. Baldzuhn, K. J. McCarthy, Y. Turkin, S. K. Combs, E. de la Cal,
R. García, J. Hernández Sánchez, J. L. Velasco, D. Silvagni and the TJ-II and W7-X teams, “Pellet injection simulations for the stellarators W7-X and TJ-II using the HPI2 code”, 21st International Stellarator-Heliotron Workshop (ISHW 2017), Kyoto. October 2017
• K. J. McCarthy, N. Tamura, N. Panadero, J. Hernández Sánchez, and TJ-II team, “Collaborative pellet injection experiments in TJ-II and other stellarator devices”, Proceedings XXXV Bienal de la RSEF y XXV Encuentro Ibérico para la Enseñanza de la Física, Gijón, Spain, July 2015
• J. L. Velasco, K. J. McCarthy, N. Panadero, S. Satake, D. López-Bruna, A. Alonso, I.
Calvo, A. Dinklage, T. Estrada, J. M. Fontdecaba, J. Hernández, R. García, F. Medina, M. Ochando, I. Pastor, S. Perfilov, E. Sánchez, A. Soleto, B. Ph. Van Milligen and A. Zhezhera,, “Study of neoclassical transport and zonal-flow-damping properties of non-axisymmetric configurations with pellet injection,” in 43rd European Physical Society Conference on Plasma Physics, EPS 2016, , Leuven, Belgium, July 2016
• K. J. McCarthy, N. Tamura, S. K. Combs, N. Panadero, D. Silvagni, J. L. Velasco, A.
Chmyga, G. N. Deshko, L. G. Eliseev, R. García, J. Hernández Sánchez, S. M. Khrebtov, A. D. Komarov, A.S. Kozachek, L. I. Krupnik, J. Lopez, G. Martin, A. V. Melnikov, M. Navarro, J. L. de Pablos, A. B. Portas, A. Soleto, V. N. Zenin, A. Zhezhera and the TJ-II team. “New insights into plasma physics in the stellarator TJ-II using pellet injection”, XXXVI Bienal de la RSEF, Santiago de Compostela, Spain, July 2017
Invited oral contributions to conferences
• K. J. McCarthy, S. K. Combs, N. Panadero, N. Tamura, J. L. Velasco, E. Ascasíbar, J. Baldzuhn, E. de la Cal, D. Silvagni, T. Estrada, R. García, J. M. Fontdecaba, J. Hernández Sánchez, F. Köchl, M. Liners, A. López-Fraguas, A. V. Melnikov, M. Navarro, J. L. de Pablos, I. Pastor, E. Sánchez, A. Soleto, A. Zhezhera, TJ-II team and W7-X team. “Pellet Injection in the Stellarator TJ-II”, 45th EPS Conference on Plasma Physics (2018), Prague, Czech Republic
Poster contributions to conferences • N. Panadero, K. J. McCarthy, S. K. Combs, C. Foust, R. García, J. Hernández Sánchez, F.
Martín and M. Navarro, “First hydrogen pellet injections in the TJ-II stellarator”, XXXV Bienal de la RSEF y XXV Encuentro Ibérico para la Enseñanza de la Física, Gijón, Spain, July 2015
• N. Panadero, K. J. McCarthy, E. de la Cal, J. Hernández Sánchez, R. García, and M. Navarro, “Observation of Cryogenic Hydrogen Pellet Ablation with a Fast-frame Camera System in the TJ-II Stellarator,” in 43rd European Physical Society Conference on Plasma Physics, EPS 2016, Leuven, Belgium, July 2016
• K. J. McCarthy, N. Panadero, I. Arapoglou, S. K. Combs, J. B. O. Caughman, E. de la Cal, C. Foust, R. García, J. Hernández Sánchez, F. Martín, M. Navarro, I. Pastor, M. C.
_________________________________________________________________________________
Publications and contributions to conferences
137
Rodríguez and J. L. Velasco, “The pellet injector and its associated diagnostics for performing plasma studies on the TJ-II stellarator,” in 1st EPS Conference on Plasma Diagnostics (ECPD), Villa Mondragone , Frascati (Rome) Italy, April 2015
• K. J. Mccarthy, N. Panadero, J. L. Velasco, J. Hernández, R. García, D. López-Bruna, J.
Baldzuhn, A. Dinklage, R. Sakamoto, and E. Ascasíbar, “Plasma Core Fuelling by Cryogenic Pellet Injection in the TJ-II Stellarator,” in 26th IAEA Fusion Energy Conference, Kyoto, Japan, October 2016
• K. J. McCarthy, N. Tamura, J. L. Velasco, N. Panadero, I. García-Cortés, V. Tribaldos, E.
Blanco, J. M. Fontdecaba, J. Hernández Sánchez, P. Medina and E. Pawelec, “Electron temperature evolution in the plasma core of the TJ-II stellarator during and after cryogenic and TESPEL pellet injection,” in 43rd European Physical Society Conference on Plasma Physics, EPS 2016, Leuven, Belgium, July 2016
• K. J. McCarthy, J. Baldzuhn, R. Sakamoto, A. Dinklage, S. Cats, G. Motojima, N.
Panadero, B. Pégouriè, H. Yamada, E. Ascasíbar, LHD team, W7-X team and TJ-II team, “Comparative Study of Pellet Fuelling in 3-D Magnetically Confined Plasma Devices”, 20th International Stellarator Heliotron Workshop, Greifswald, Germany (2015)
• N. Tamura, K. J. McCarthy, H. Hayashi, S. K. Combs, C. Foust, R. García, N. Panadero,
E. Pawelec, J. Hernández Sánchez, M. Navarro, A. Soleto and TJ-II team, “Tracer-Encapsulated Solid Pellet (TESPEL) Injection System for the TJ-II stellarator”, 21st Topical Conference on High-Temperature Plasma Diagnostics, Madison, Winconsin, USA, April 2016
Coordinated Working Group Meetings (CWGM – oral contributions) • N. Panadero, F. Köchl, J. Baldzuhn, Y. Turkin, K. J. McCarthy, J. L Velasco, “HPI2
simulations for pellet injection in W7-X and TJ-II”, 16th Coordinated Working Group Meeting, Madrid, Spain, January 2017
• N. Panadero, J. Baldzuhn, K.J. McCarthy, F. Köchl, J.L. Velasco, Y. Turkin, W7-X and
TJ-II teams, “Progress on Pellet Injection Simulations for W7-X”, 18th Coordinated Working Group Meeting, Princeton, New Jersey, USA, April 2018
• K. J. McCarthy, J. L. Velasco, N. Panadero, S.K. Combs, N. Tamura, A. Zhezhera, J.
Hernández Sánchez, R. García, I. Pastor, J. M. Fontdecaba, plus TJ-II & HIBP teams, “Pellet Fuelling in the stellarator TJ-II”, 16th Coordinated Working Group Meeting, Madrid, Spain, January 2017
• K. J. McCarthy, N. Tamura, N. Panadero, J. Hernández-Sánchez, E. Ascasíbar, T.
Estrada, B. López, I. Pastor, B. Zurro, TJ-II & LHD teams, “Comparative Study of Cryogenic/TESPEL Pellet Injections in the TJ-II”, 18th Coordinated Working Group Meeting, Princeton, New Jersey, USA, April 2018

__________________________________________________________________________________
A study of the physics of pellet injection in magnetically confined plasma in stellarators
138

_________________________________________________________________________________
References
139
REFERENCES [1] N. Panadero et al., “Experimental studies and simulations of hydrogen pellet ablation in
the stellarator TJ-II,” Nucl. Fusion, vol. 58, no. 2, p. 26025, Feb. 2018.
[2] K. J. McCarthy et al., “Plasma fuelling with cryogenic pellets in the stellarator TJ-II,” Nucl. Fusion, vol. 57, no. 5, p. 56039, 2017.
[3] N. Panadero, K. J. McCarthy, E. de la Cal, J. Hernández Sánchez, R. García, and M. Navarro, “Observation of Cryogenic Hydrogen Pellet Ablation with a Fast-frame Camera System in the TJ-II Stellarator,” in ECA Vol. 40A (43rd European Physical Society Conference on Plasma Physics, EPS 2016), 2016, p. P1.008.
[4] J. L. Velasco et al., “Particle transport after pellet injection in the TJ-II stellarator,” Plasma Phys. Control. Fusion, vol. 58, no. 8, p. 84004, 2016.
[5] I. Arto, I. Capellán-Pérez, R. Lago, G. Bueno, and R. Bermejo, “The energy requirements of a developed world,” Energy Sustain. Dev., vol. 33, pp. 1–13, 2016.
[6] J. T. Hardy, Climate change: causes, effects, and solutions. J. Wiley, 2003.
[7] E. Maibach, T. Myers, and A. Leiserowitz, “Climate scientists need to set the record straight: There is a scientific consensus that human-caused climate change is happening,” Earth’s Futur., vol. 2, no. 5, pp. 295–298, May 2014.
[8] R. K. Pachauri et al., “Climate Change 2014 Synthesis Report,” IPCC, 2014.
[9] A. Stips, D. Macias, C. Coughlan, E. Garcia-Gorriz, and X. S. Liang, “On the causal structure between CO2 and global temperature,” Sci. Rep., vol. 6, no. 1, p. 21691, Apr. 2016.
[10] S. Shafiee and E. Topal, “When will fossil fuel reserves be diminished?,” Energy Policy, vol. 37, no. 1, pp. 181–189, Jan. 2009.
[11] J. Speirs, C. McGlade, and R. Slade, “Uncertainty in the availability of natural resources: fossil fuels, critical metals and biomass,” Energy Policy, vol. 87, pp. 654–664, Dec. 2015.
[12] G. Crabtree et al., “Integrating renewable electricity on the grid,” 2010.
[13] L. Bird, M. Milligan, and D. Lew, “Integrating variable renewable energy: challenges and solutions,” 2013.
[14] M. Kikuchi, K. Lackner, and M. Q. Tran, Fusion physics. International Atomic Energy Agency, 2012.
[15] A. J. Barr, “Prof Alan J. Barr, Particle Physics, Oxford.” [Online]. Available: http://www-pnp.physics.ox.ac.uk/~barra/teaching.shtml. [Accessed: 15-Feb-2018].
[16] “Fusion For Energy - Understanding Fusion - Demonstration Power Plants.” [Online]. Available: http://fusionforenergy.europa.eu/understandingfusion/demo.aspx. [Accessed: 15-Feb-2018].
[17] J. P. Freidberg, Plasma physics and fusion energy, 1st ed. Cambridge University Press, 2008.
[18] M. Wakatani, Stellarator and heliotron devices. Oxford University Press, 1998.
__________________________________________________________________________________
A study of the physics of pellet injection in magnetically confined plasma in stellarators
140
[19] D. Mazon, C. Fenzi, and R. Sabot, “As hot as it gets,” Nat. Phys., vol. 12, no. 1, pp. 14–17, Jan. 2016.
[20] F. Wagner et al., “W7-AS: One step of the Wendelstein stellarator line,” Phys. Plasmas, vol. 12, no. 7, p. 72509, Jul. 2005.
[21] L. J. Spitzer, “The Stellarator Concept,” Phys. Fluids, vol. 1, no. 4, p. 253, Nov. 1958.
[22] L. J. Spitzer, “The Stellarator,” Sci. Am., vol. 199, no. 4, pp. 28–35, 1958.
[23] J. Jacquinot, “Steady-state operation of tokamaks: key experiments, integrated modelling and technology developments on Tore Supra,” Nucl. Fusion, vol. 45, no. 10, pp. S118–S131, Oct. 2005.
[24] The JET Team, “Physics and Controlled Nuclear Fusion Research,” in Plasma Physics and Controlled Nuclear Fusion Research (Wurzburg, Germany, 1992) IAEA-CN-56/A-7-7, 1992, vol. 1, p. 197.
[25] O. Motojima et al., “Extended steady-state and high-beta regimes of net-current free heliotron plasmas in the Large Helical Device,” Nucl. Fusion, vol. 47, no. 10, pp. S668–S676, Oct. 2007.
[26] M. Keilhacker et al., “High fusion performance from deuterium-tritium plasmas in JET,” Nucl. Fusion, vol. 39, no. 2, p. 209, 1999.
[27] T. Fujita et al., “High performance experiments in JT-60U reversed shear discharges,” Nucl. Fusion, vol. 39, no. 11Y, pp. 1627–1636, Nov. 1999.
[28] A. Bécoulet and G. T. Hoang, “The technology and science of steady-state operation in magnetically confined plasmas,” Plasma Phys. Control. Fusion, vol. 50, no. 12, 2008.
[29] D. G. Swanson, Plasma kinetic theory. Taylor & Francis, 2008.
[30] J. P. Freidberg, Ideal MHD. Cambridge University Press, 2014.
[31] P. Helander, “Theory of plasma confinement in non-axisymmetric magnetic fields,” Reports Prog. Phys., vol. 77, no. 8, pp. 87001–35, 2014.
[32] L. W. Jorgensen, A. H. Sillesen, and F. Oster, “Ablation of hydrogen pellets in hydrogen and helium plasmas,” Plasma Phys., vol. 17, no. 6, pp. 453–461, Jun. 1975.
[33] C. A. Foster, R. J. Colchin, S. L. Milora, K. Kim, and R. J. Turnbull, “Solid hydrogen pellet injection into the Ormak tokamak,” Nucl. Fusion, vol. 17, no. 5, pp. 1067–1075, Oct. 1977.
[34] B. Plöckl, P. T. Lang, G. Sellmair, J. K. Stober, W. Treutterer, and I. Vinyar, “The enhanced high speed inboard pellet fuelling system at ASDEX Upgrade,” Fusion Eng. Des., vol. 88, no. 6–8, pp. 1059–1063, 2013.
[35] B. Plöckl, C. Day, P. Lamalle, P. T. Lang, V. Rohde, and E. Viezzer, “The enhanced pellet centrifuge launcher at ASDEX Upgrade: Advanced operation and application as technology test facility for ITER and DEMO,” Fusion Eng. Des., vol. 96–97, pp. 155–158, 2015.
[36] A. Géraud et al., “Status of the JET high frequency pellet injector,” Fusion Eng. Des., vol. 88, no. 6–8, pp. 1064–1068, 2013.
[37] S. K. Combs, L. R. Baylor, S. J. Meitner, J. B. O. Caughman, D. A. Rasmussen, and S.
_________________________________________________________________________________
References
141
Maruyama, “Overview of recent developments in pellet injection for ITER,” Fusion Eng. Des., vol. 87, no. 5–6, pp. 634–640, 2012.
[38] P. T. Lang et al., “Considerations on the DEMO pellet fuelling system,” Fusion Eng. Des., vol. 96–97, pp. 123–128, 2015.
[39] P. T. Lang et al., “High-Efficiency Plasma Refuelling by Pellet Injection from the Magnetic High-Field Side into ASDEX Upgrade,” Phys. Rev. Lett., vol. 79, no. 8, pp. 1487–1490, Aug. 1997.
[40] H. W. Müller et al., “High β plasmoid formation, drift and striations during pellet ablation in ASDEX Upgrade,” Nucl. Fusion, vol. 42, no. 3, pp. 301–309, Mar. 2002.
[41] N. Commaux et al., “Influence of the low order rational q surfaces on the pellet deposition profile,” Nucl. Fusion, vol. 50, no. 2, p. 25011, 2010.
[42] B. Pégourié, “Review: Pellet injection experiments and modelling,” Plasma Phys. Control. Fusion, vol. 49, no. 8, p. R87, 2007.
[43] A. Matsuyama, F. Köchl, B. Pégourié, R. Sakamoto, G. Motojima, and H. Yamada, “Modelling of the pellet deposition profile and ∇ B -induced drift displacement in non-axisymmetric configurations,” Nucl. Fusion, vol. 52, no. 12, p. 123017, 2012.
[44] S. L. Milora, V. Mertens, W. A. Houlberg, and L. Lengyel, “Review Paper: Pellet Fuelling,” Nucl. Fusion, vol. 35, no. 6, pp. 657–754, 1995.
[45] H. Maaßberg, C. D. Beidler, and E. . E. Simmet, “Density control problems in large stellarators with neoclassical transport,” Plasma Phys. Control. Fusion, vol. 41, no. 9, pp. 1135–1153, Sep. 1999.
[46] R. Decoste, S. E. Bodner, B. H. Ripin, E. A. McLean, S. P. Obenschain, and C. M. Armstrong, “Ablative Acceleration of Laser-Irradiated Thin-Foil Targets,” Phys. Rev. Lett., vol. 42, no. 25, pp. 1673–1677, Jun. 1979.
[47] M. R. Mikkelsen et al., “Core fuelling to produce peaked density profiles in large tokamaks,” Nucl. Fusion, vol. 35, no. 5, pp. 521–533, 1995.
[48] L. Spitzer, D. J. Grove, W. E. Johnson, L. Tonks, and W. F. Westendorp, Problems of the Stellarator as a Useful Power Source. Princeton University Plasma Physics Laboratory, 1954.
[49] J. Baldzuhn, L. R. Baylor, and J. F. Lyon, “Penetration Studies for Deuterium Pellets in Wendelstein 7-AS,” Fusion Sci. Technol., vol. 46, no. 2, pp. 348–354, Sep. 2004.
[50] L. R. Baylor et al., “An international pellet ablation database,” Nucl. Fusion, vol. 37, no. 4, pp. 445–450, 1997.
[51] S. L. Milora et al., “Results of hydrogen pellet injection into ISX-B,” Nucl. Fusion, vol. 20, no. 12, pp. 1491–1514, Dec. 1980.
[52] H. W. Drawin and A. Geraud, “Pellet injection into ohmically heated and electron cyclotron resonance heated tokamak plasmas,” Nucl. Fusion, vol. 29, no. 10, pp. 1681–1695, Oct. 1989.
[53] R. Sakamoto et al., “Impact of pellet injection on extension of the operational region in LHD,” Nucl. Fusion, vol. 41, no. 4, pp. 381–386, Apr. 2001.
__________________________________________________________________________________
A study of the physics of pellet injection in magnetically confined plasma in stellarators
142
[54] R. Sakamoto et al., “Observation of pellet ablation behaviour on the large helical device,” Nucl. Fusion, vol. 44, no. 5, pp. 624–630, May 2004.
[55] B. Pégourié et al., “Modelling of pellet ablation in additionally heated plasmas,” Plasma Phys. Control. Fusion, vol. 47, no. 1, pp. 17–35, 2005.
[56] B. Pegourie, J. M. Picchiottino, H. W. Drawin, A. Geraud, and M. Chatelier, “Pellet ablation studies on TORE SUPRA,” Nucl. Fusion, vol. 33, no. 4, pp. 591–600, 1993.
[57] K. Kondo et al., “Visible and VUV spectroscopic diagnostics on Heliotron E,” Rev. Sci. Instrum., vol. 59, no. 8, pp. 1533–1535, Aug. 1988.
[58] R. Sakamoto and H. YAMADA, “Observation of cross-field transport of pellet plasmoid in LHD,” Plasma Fusion Res., vol. 6, no. 2011, pp. 1–5, Jun. 2011.
[59] G. A. Wurden et al., “Pellet imaging techniques in the ASDEX tokamak,” Rev. Sci. Instrum., vol. 61, no. 11, pp. 3604–3608, Nov. 1990.
[60] R. D. Durst et al., “Experimental observations of the dynamics of pellet ablation on the Texas Experimental Tokamak (TEXT),” Nucl. Fusion, vol. 30, no. 1, pp. 3–9, Jan. 1990.
[61] B. Pégourié and M. A. Dubois, “Diagnostic of the current density profile in the vicinity of q = 1: The H α emission of ablated pellets,” Nucl. Fusion, vol. 30, no. 8, pp. 1575–1584, Aug. 1990.
[62] D. K. Mansfield et al., “Observation of rational magnetic surfaces in TFTR using the emission from ablating deuterium pellets,” Nucl. Fusion, vol. 33, no. 1, pp. 150–156, Jan. 1993.
[63] J. Baldzuhn and W. Sandmann, “Analysis of luminescence signals observed during pellet injection,” Plasma Phys. Control. Fusion, vol. 35, no. 10, pp. 1413–1431, Oct. 1993.
[64] C. E. Thomas, Bull. Am. Phys. Soc., vol. 24, p. 1035, 1979.
[65] D. H. McNeill, G. J. Greene, and D. D. Schuresko, “Parameters of the Luminous Region Surrounding Deuterium Pellets in the Princeton Large Torus Tokamak,” Phys. Rev. Lett., vol. 55, no. 13, pp. 1398–1401, Sep. 1985.
[66] TFR Group, “Deuterium Pellet Injection into Plasmas of the Fontenay-aux-Roses Tokamak TFR: Photographic and Spectroscopic Measurements of the Ablation Zone,” Europhys. Lett., vol. 2, no. 4, pp. 267–273, Aug. 1986.
[67] D. H. McNeill, G. J. Greene, J. D. Newburger, and D. K. Owens, “Spectroscopic measurements of the parameters of the ablation clouds of deuterium pellets injected into tokamaks,” Phys. Fluids B Plasma Phys., vol. 3, no. 8, pp. 1994–2009, Aug. 1991.
[68] V. Y. Sergeev, A. Y. Kostrukov, and S. A. Shibaev, “Measurement of cloud parameters near hydrogen and deuterium pellets injected into T-10 plasma,” Fusion Eng. Des., vol. 34–35, pp. 323–327, Mar. 1997.
[69] D. K. Owens, “Pellet injection and toroidal confinement,” IAEA(Proc. Tech. Comm. Mtg. Gut Ising, 1988) TEC-DOC-534, p. 191, 1989.
[70] P. T. Lang et al., “Optimization of pellet scenarios for long pulse fuelling to high densities at JET,” Nucl. Fusion, vol. 42, no. 4, p. 303, Apr. 2002.
[71] L. R. Baylor et al., “Improved core fueling with high field side pellet injection in the
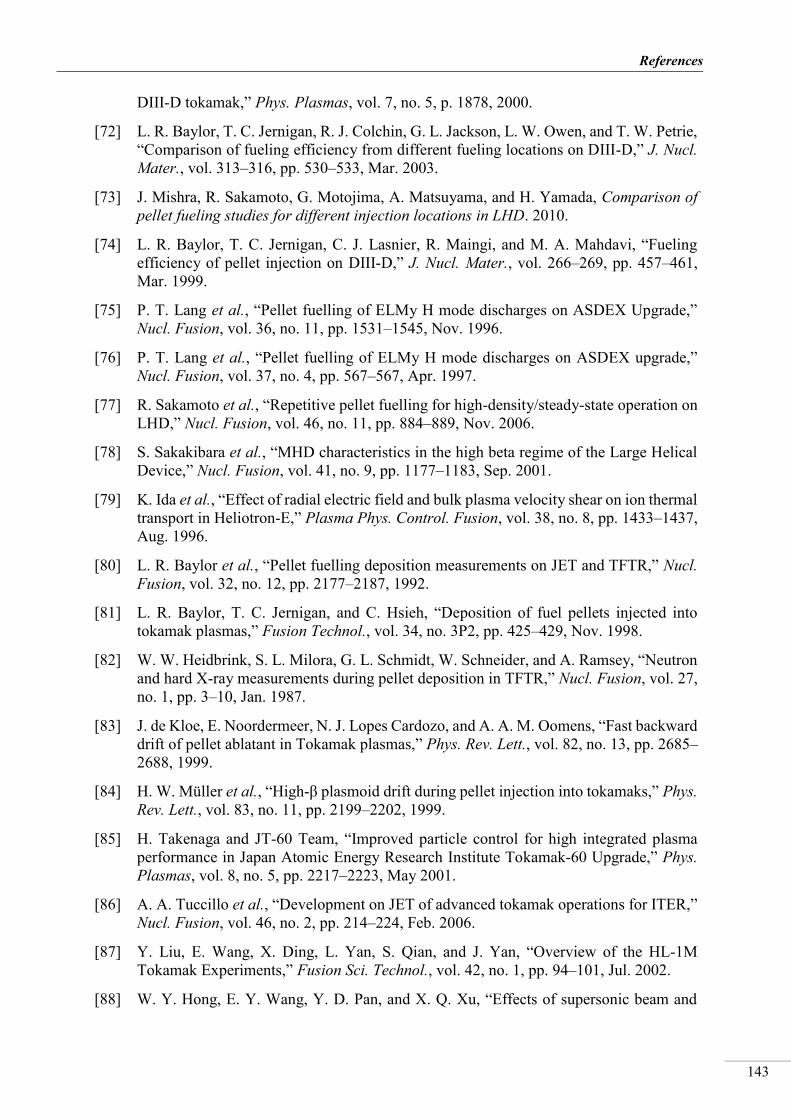
_________________________________________________________________________________
References
143
DIII-D tokamak,” Phys. Plasmas, vol. 7, no. 5, p. 1878, 2000.
[72] L. R. Baylor, T. C. Jernigan, R. J. Colchin, G. L. Jackson, L. W. Owen, and T. W. Petrie, “Comparison of fueling efficiency from different fueling locations on DIII-D,” J. Nucl. Mater., vol. 313–316, pp. 530–533, Mar. 2003.
[73] J. Mishra, R. Sakamoto, G. Motojima, A. Matsuyama, and H. Yamada, Comparison of pellet fueling studies for different injection locations in LHD. 2010.
[74] L. R. Baylor, T. C. Jernigan, C. J. Lasnier, R. Maingi, and M. A. Mahdavi, “Fueling efficiency of pellet injection on DIII-D,” J. Nucl. Mater., vol. 266–269, pp. 457–461, Mar. 1999.
[75] P. T. Lang et al., “Pellet fuelling of ELMy H mode discharges on ASDEX Upgrade,” Nucl. Fusion, vol. 36, no. 11, pp. 1531–1545, Nov. 1996.
[76] P. T. Lang et al., “Pellet fuelling of ELMy H mode discharges on ASDEX upgrade,” Nucl. Fusion, vol. 37, no. 4, pp. 567–567, Apr. 1997.
[77] R. Sakamoto et al., “Repetitive pellet fuelling for high-density/steady-state operation on LHD,” Nucl. Fusion, vol. 46, no. 11, pp. 884–889, Nov. 2006.
[78] S. Sakakibara et al., “MHD characteristics in the high beta regime of the Large Helical Device,” Nucl. Fusion, vol. 41, no. 9, pp. 1177–1183, Sep. 2001.
[79] K. Ida et al., “Effect of radial electric field and bulk plasma velocity shear on ion thermal transport in Heliotron-E,” Plasma Phys. Control. Fusion, vol. 38, no. 8, pp. 1433–1437, Aug. 1996.
[80] L. R. Baylor et al., “Pellet fuelling deposition measurements on JET and TFTR,” Nucl. Fusion, vol. 32, no. 12, pp. 2177–2187, 1992.
[81] L. R. Baylor, T. C. Jernigan, and C. Hsieh, “Deposition of fuel pellets injected into tokamak plasmas,” Fusion Technol., vol. 34, no. 3P2, pp. 425–429, Nov. 1998.
[82] W. W. Heidbrink, S. L. Milora, G. L. Schmidt, W. Schneider, and A. Ramsey, “Neutron and hard X-ray measurements during pellet deposition in TFTR,” Nucl. Fusion, vol. 27, no. 1, pp. 3–10, Jan. 1987.
[83] J. de Kloe, E. Noordermeer, N. J. Lopes Cardozo, and A. A. M. Oomens, “Fast backward drift of pellet ablatant in Tokamak plasmas,” Phys. Rev. Lett., vol. 82, no. 13, pp. 2685–2688, 1999.
[84] H. W. Müller et al., “High-β plasmoid drift during pellet injection into tokamaks,” Phys. Rev. Lett., vol. 83, no. 11, pp. 2199–2202, 1999.
[85] H. Takenaga and JT-60 Team, “Improved particle control for high integrated plasma performance in Japan Atomic Energy Research Institute Tokamak-60 Upgrade,” Phys. Plasmas, vol. 8, no. 5, pp. 2217–2223, May 2001.
[86] A. A. Tuccillo et al., “Development on JET of advanced tokamak operations for ITER,” Nucl. Fusion, vol. 46, no. 2, pp. 214–224, Feb. 2006.
[87] Y. Liu, E. Wang, X. Ding, L. Yan, S. Qian, and J. Yan, “Overview of the HL-1M Tokamak Experiments,” Fusion Sci. Technol., vol. 42, no. 1, pp. 94–101, Jul. 2002.
[88] W. Y. Hong, E. Y. Wang, Y. D. Pan, and X. Q. Xu, “Effects of supersonic beam and
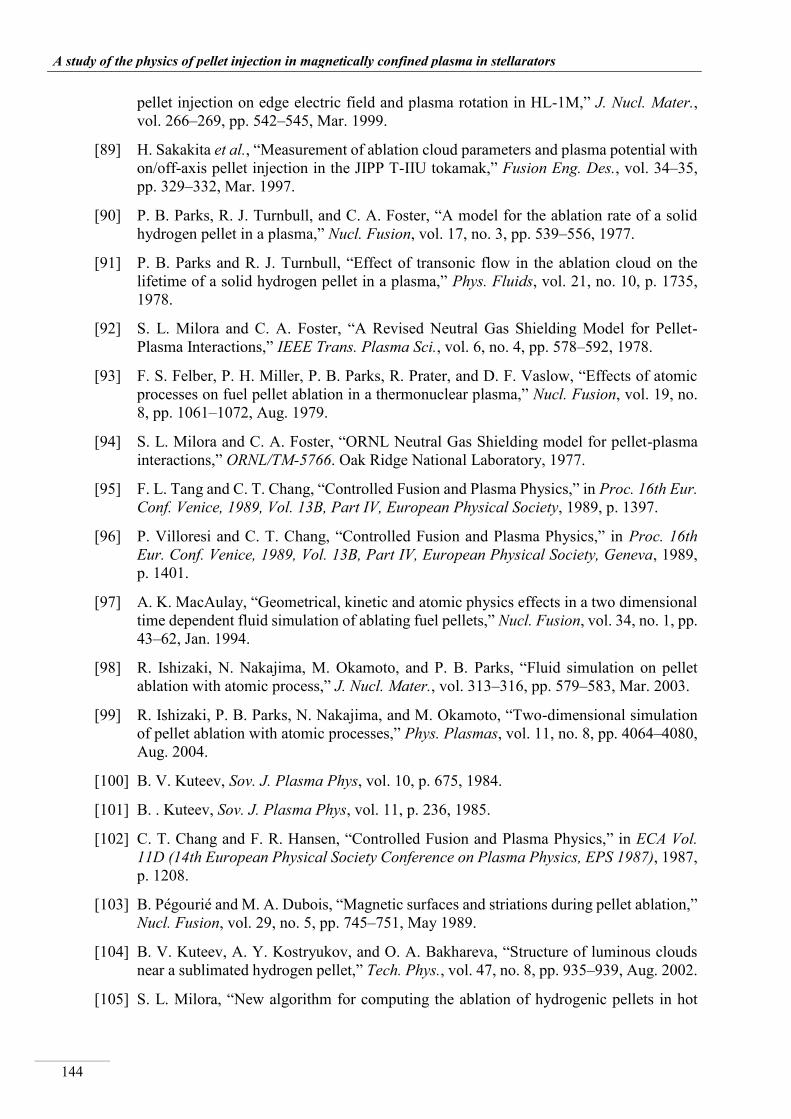
__________________________________________________________________________________
A study of the physics of pellet injection in magnetically confined plasma in stellarators
144
pellet injection on edge electric field and plasma rotation in HL-1M,” J. Nucl. Mater., vol. 266–269, pp. 542–545, Mar. 1999.
[89] H. Sakakita et al., “Measurement of ablation cloud parameters and plasma potential with on/off-axis pellet injection in the JIPP T-IIU tokamak,” Fusion Eng. Des., vol. 34–35, pp. 329–332, Mar. 1997.
[90] P. B. Parks, R. J. Turnbull, and C. A. Foster, “A model for the ablation rate of a solid hydrogen pellet in a plasma,” Nucl. Fusion, vol. 17, no. 3, pp. 539–556, 1977.
[91] P. B. Parks and R. J. Turnbull, “Effect of transonic flow in the ablation cloud on the lifetime of a solid hydrogen pellet in a plasma,” Phys. Fluids, vol. 21, no. 10, p. 1735, 1978.
[92] S. L. Milora and C. A. Foster, “A Revised Neutral Gas Shielding Model for Pellet-Plasma Interactions,” IEEE Trans. Plasma Sci., vol. 6, no. 4, pp. 578–592, 1978.
[93] F. S. Felber, P. H. Miller, P. B. Parks, R. Prater, and D. F. Vaslow, “Effects of atomic processes on fuel pellet ablation in a thermonuclear plasma,” Nucl. Fusion, vol. 19, no. 8, pp. 1061–1072, Aug. 1979.
[94] S. L. Milora and C. A. Foster, “ORNL Neutral Gas Shielding model for pellet-plasma interactions,” ORNL/TM-5766. Oak Ridge National Laboratory, 1977.
[95] F. L. Tang and C. T. Chang, “Controlled Fusion and Plasma Physics,” in Proc. 16th Eur. Conf. Venice, 1989, Vol. 13B, Part IV, European Physical Society, 1989, p. 1397.
[96] P. Villoresi and C. T. Chang, “Controlled Fusion and Plasma Physics,” in Proc. 16th Eur. Conf. Venice, 1989, Vol. 13B, Part IV, European Physical Society, Geneva, 1989, p. 1401.
[97] A. K. MacAulay, “Geometrical, kinetic and atomic physics effects in a two dimensional time dependent fluid simulation of ablating fuel pellets,” Nucl. Fusion, vol. 34, no. 1, pp. 43–62, Jan. 1994.
[98] R. Ishizaki, N. Nakajima, M. Okamoto, and P. B. Parks, “Fluid simulation on pellet ablation with atomic process,” J. Nucl. Mater., vol. 313–316, pp. 579–583, Mar. 2003.
[99] R. Ishizaki, P. B. Parks, N. Nakajima, and M. Okamoto, “Two-dimensional simulation of pellet ablation with atomic processes,” Phys. Plasmas, vol. 11, no. 8, pp. 4064–4080, Aug. 2004.
[100] B. V. Kuteev, Sov. J. Plasma Phys, vol. 10, p. 675, 1984.
[101] B. . Kuteev, Sov. J. Plasma Phys, vol. 11, p. 236, 1985.
[102] C. T. Chang and F. R. Hansen, “Controlled Fusion and Plasma Physics,” in ECA Vol. 11D (14th European Physical Society Conference on Plasma Physics, EPS 1987), 1987, p. 1208.
[103] B. Pégourié and M. A. Dubois, “Magnetic surfaces and striations during pellet ablation,” Nucl. Fusion, vol. 29, no. 5, pp. 745–751, May 1989.
[104] B. V. Kuteev, A. Y. Kostryukov, and O. A. Bakhareva, “Structure of luminous clouds near a sublimated hydrogen pellet,” Tech. Phys., vol. 47, no. 8, pp. 935–939, Aug. 2002.
[105] S. L. Milora, “New algorithm for computing the ablation of hydrogenic pellets in hot
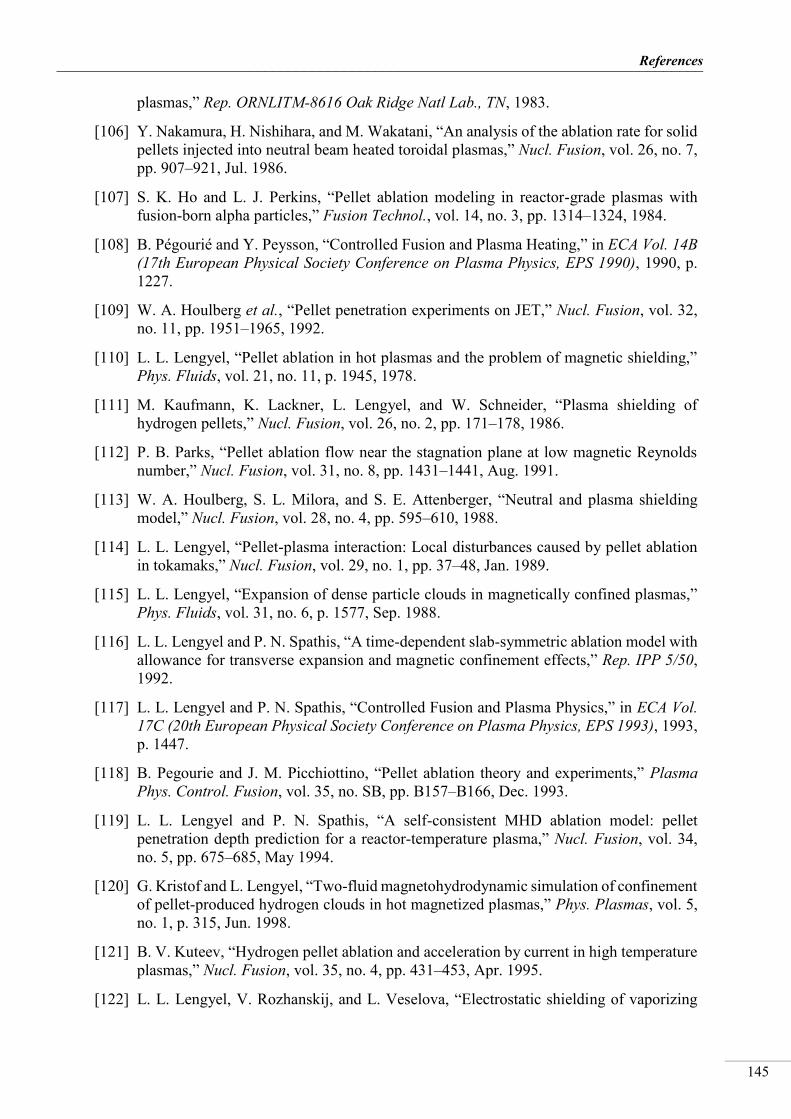
_________________________________________________________________________________
References
145
plasmas,” Rep. ORNLITM-8616 Oak Ridge Natl Lab., TN, 1983.
[106] Y. Nakamura, H. Nishihara, and M. Wakatani, “An analysis of the ablation rate for solid pellets injected into neutral beam heated toroidal plasmas,” Nucl. Fusion, vol. 26, no. 7, pp. 907–921, Jul. 1986.
[107] S. K. Ho and L. J. Perkins, “Pellet ablation modeling in reactor-grade plasmas with fusion-born alpha particles,” Fusion Technol., vol. 14, no. 3, pp. 1314–1324, 1984.
[108] B. Pégourié and Y. Peysson, “Controlled Fusion and Plasma Heating,” in ECA Vol. 14B (17th European Physical Society Conference on Plasma Physics, EPS 1990), 1990, p. 1227.
[109] W. A. Houlberg et al., “Pellet penetration experiments on JET,” Nucl. Fusion, vol. 32, no. 11, pp. 1951–1965, 1992.
[110] L. L. Lengyel, “Pellet ablation in hot plasmas and the problem of magnetic shielding,” Phys. Fluids, vol. 21, no. 11, p. 1945, 1978.
[111] M. Kaufmann, K. Lackner, L. Lengyel, and W. Schneider, “Plasma shielding of hydrogen pellets,” Nucl. Fusion, vol. 26, no. 2, pp. 171–178, 1986.
[112] P. B. Parks, “Pellet ablation flow near the stagnation plane at low magnetic Reynolds number,” Nucl. Fusion, vol. 31, no. 8, pp. 1431–1441, Aug. 1991.
[113] W. A. Houlberg, S. L. Milora, and S. E. Attenberger, “Neutral and plasma shielding model,” Nucl. Fusion, vol. 28, no. 4, pp. 595–610, 1988.
[114] L. L. Lengyel, “Pellet-plasma interaction: Local disturbances caused by pellet ablation in tokamaks,” Nucl. Fusion, vol. 29, no. 1, pp. 37–48, Jan. 1989.
[115] L. L. Lengyel, “Expansion of dense particle clouds in magnetically confined plasmas,” Phys. Fluids, vol. 31, no. 6, p. 1577, Sep. 1988.
[116] L. L. Lengyel and P. N. Spathis, “A time-dependent slab-symmetric ablation model with allowance for transverse expansion and magnetic confinement effects,” Rep. IPP 5/50, 1992.
[117] L. L. Lengyel and P. N. Spathis, “Controlled Fusion and Plasma Physics,” in ECA Vol. 17C (20th European Physical Society Conference on Plasma Physics, EPS 1993), 1993, p. 1447.
[118] B. Pegourie and J. M. Picchiottino, “Pellet ablation theory and experiments,” Plasma Phys. Control. Fusion, vol. 35, no. SB, pp. B157–B166, Dec. 1993.
[119] L. L. Lengyel and P. N. Spathis, “A self-consistent MHD ablation model: pellet penetration depth prediction for a reactor-temperature plasma,” Nucl. Fusion, vol. 34, no. 5, pp. 675–685, May 1994.
[120] G. Kristof and L. Lengyel, “Two-fluid magnetohydrodynamic simulation of confinement of pellet-produced hydrogen clouds in hot magnetized plasmas,” Phys. Plasmas, vol. 5, no. 1, p. 315, Jun. 1998.
[121] B. V. Kuteev, “Hydrogen pellet ablation and acceleration by current in high temperature plasmas,” Nucl. Fusion, vol. 35, no. 4, pp. 431–453, Apr. 1995.
[122] L. L. Lengyel, V. Rozhanskij, and L. Veselova, “Electrostatic shielding of vaporizing

__________________________________________________________________________________
A study of the physics of pellet injection in magnetically confined plasma in stellarators
146
surfaces exposed to hot plasmas,” Nucl. fusion, vol. 38, no. 12, pp. 1679–1690, 1996.
[123] R. Samulyak, T. Lu, and P. Parks, “A magnetohydrodynamic simulation of pellet ablation in the electrostatic approximation,” Nucl. Fusion, vol. 47, pp. 103–118, 2007.
[124] L. L. Lengyel and P. S. Lalousis, “Pellet Injection and Toroidal Confinement,” in IAEA(Proc. Tech. Comm. Mtg. Gut Ising, 1988) TEC-DOC-534, 1988, p. 225.
[125] L. L. Lengyel, “Controlled Fusion and Plasma Physics,” in ECA Vol. 13B (16th European Physical Society Conference on Plasma Physics, EPS 1989), 1989, p. 179.
[126] L. Garzotti, B. Pegourie, A. Geraud, D. Frigione, and L. R. Baylor, “Neutral gas and plasma shielding scaling law for pellet ablation in Maxwellian plasmas,” Nucl. Fusion, vol. 37, no. 8, pp. 1167–1175, Aug. 1997.
[127] V. Rozhansky, I. Veselova, and S. Voskoboynikov, “Evolution and stratification of a plasma cloud surrounding a pellet,” Plasma Phys. Control. Fusion, vol. 37, no. 4, pp. 399–414, Apr. 1995.
[128] I. Y. Veselova and V. A. Rozhansky, “Veselova I Yu and Rozhansky V A 1991 Sov. J. Plasma Phys. 17 817,” Sov. J. Plasma Phys, vol. 17, p. 817, 1991.
[129] V. A. Rozhanskij and I. Y. Veselova, “Plasma propagation along magnetic field lines after pellet injection,” Nucl. Fusion, vol. 34, no. 5, pp. 665–674, May 1994.
[130] J. F. Luciani, P. Mora, and J. Virmont, “Nonlocal Heat Transport Due to Steep Temperature Gradients,” Phys. Rev. Lett., vol. 51, no. 18, pp. 1664–1667, Oct. 1983.
[131] B. Pégourié and J. M. Picchiottino, “Plasma density buildup after pellet injection,” Phys. Plasmas, vol. 3, no. 12, pp. 4594–4605, 1996.
[132] P. B. Parks, W. D. Sessions, and L. R. Baylor, “Radial displacement of pellet ablation material in tokamaks due to the grad-B effect,” Phys. Plasmas, vol. 7, no. 5, pp. 1968–1975, 2000.
[133] H. R. Strauss and W. Park, “Magnetohydrodynamic effects on pellet injection in tokamaks,” Phys. Plasmas, vol. 5, no. 7, pp. 2676–2686, 1998.
[134] V. Rozhansky, I. Senichenkov, I. Veselova, and R. Schneider, “Mass deposition after pellet injection into a tokamak,” Plasma Phys. Control. Fusion, vol. 46, no. 4, pp. 575–591, 2004.
[135] P. B. Parks and L. R. Baylor, “Effect of parallel flows and toroidicity on cross-field transport of pellet ablation matter in tokamak plasmas,” Phys. Rev. Lett., vol. 94, no. 12, pp. 1–4, 2005.
[136] B. Pegourie, V. Waller, H. Nehme, L. Garzotti, and A. Geraud, “Homogenization of the pellet ablated material in tokamaks taking into account the ∇B-induced drift,” Nucl. Fusion, vol. 47, no. 1, pp. 44–56, 2007.
[137] D. K. Mansfield et al., “Local-density increment from an ablated deuterium pellet in the TFTR tokamak,” Phys. Rev. Lett., vol. 66, no. 24, pp. 3140–3143, Jun. 1991.
[138] K. H. Finken et al., “Studies on basic phenomena during the pellet injection into high-temperature plasmas,” Plasma Phys. Control. Fusion, vol. 39, no. 5A, pp. A351–A360, May 1997.
_________________________________________________________________________________
References
147
[139] Y. Hamada et al., “Large potential change induced by pellet injection in JIPP T-IIU tokamak plasmas,” Nucl. Fusion, vol. 36, no. 8, pp. 1047–1052, Aug. 1996.
[140] D. Jia-Fu, W. Shi-Qing, and L. Wen-Zhong, “Observation of hydrogen pellet ablation material flow by tomography,” Chinese Phys., vol. 15, no. 10, pp. 2368–2373, Oct. 2006.
[141] P. T. Lang et al., “Refuelling performance improvement by high speed pellet launch from the magnetic high field side,” Nucl. Fusion, vol. 41, no. 8, pp. 1107–1112, Aug. 2001.
[142] R. Sakamoto et al., “Cross-field dynamics of the homogenization of the pellet deposited material in Tore Supra,” Nucl. Fusion, vol. 53, no. 6, p. 63007, 2013.
[143] F. Köchl et al., “Modelling of Pellet Particle Ablation and Deposition : The Hydrogen Pellet Injection code HPI2,” Prepr. EFDA–JET–PR(12)57, p. 82.
[144] R. Ishizaki and N. Nakajima, “Pellet ablation in helical plasmas,” J. Plasma Fusion Res, vol. 9, pp. 471–478, 2010.
[145] I. Y. Senichenkov, I. Y. Veselova, V. A. Rozhansky, and R. Schneider, “Modelling of the pellet cloud evolution and mass deposition with an account of ∇B induced drift,” Nucl. Fusion, vol. 46, no. 8, pp. 788–796, Aug. 2006.
[146] L. Garzotti et al., “Simulations of density profiles, pellet fuelling and density control in ITER,” Nucl. Fusion, vol. 52, no. 1, p. 13002, 2011.
[147] Y. S. Na et al., “On Benchmarking of Particle Transport Simulations in ITER,” EUROFUSION WPJET1-CP(16) 15339, p. 8.
[148] C. Alejaldre, J. J. A. Gozalo, J. B. Perez, and F. C. Magana, “TJ-II Project: A Flexible Heliac Stellarator,” Fusion Sci. Technol., vol. 17, no. 1, pp. 131–139, 1990.
[149] C. Alejaldre et al., “First plasmas in the TJ-II flexible Heliac,” Plasma Phys. Control. Fusion, vol. 41, no. 3A, pp. A539–A548, 1999.
[150] J. Sánchez et al., “Transport, stability and plasma control studies in the TJ-II stellarator,” Nucl. Fusion, vol. 55, no. 10, p. 104014, 2015.
[151] F. Castejon and J. Guasp, “Microwave injection in heliac device TJ-II,” Plasma Phys. Control. Fusion, vol. 30, no. 7, pp. 907–911, 1988.
[152] Á. Cappa et al., “Second harmonic ECRH breakdown experiments in the TJ-II stellarator,” Nucl. Fusion, vol. 55, no. 4, 2015.
[153] F. L. Tabarés et al., “Energy and particle balance studies under full boron and lithium-coated walls in TJ-II,” Contrib. to Plasma Phys., vol. 50, no. 6–7, pp. 610–615, 2010.
[154] L. Pacios, I. Labrador, A. de la Pera, R. Carrasco, and F. Lapayese, “Gas inlet control system for the stellarator TJ-II,” in 1999 IEEE Conference on Real-Time Computer Applications in Nuclear Particle and Plasma Physics. 11th IEEE NPSS Real Time Conference. Conference Record (Cat. No.99EX295), pp. 243–245.
[155] S. K. Combs, S. L. Milora, and C. R. Foust, “Simple pipe gun for hydrogen pellet injection,” Rev. Sci. Instrum., vol. 57, p. 2636, 1986.
[156] K. McCarthy et al., “A compact flexible pellet injector for the TJ-II stellarator,” in 21st IEEE/NPS Symposium on Fusion Engineering (SOFE), 2005, pp. 1–4.
__________________________________________________________________________________
A study of the physics of pellet injection in magnetically confined plasma in stellarators
148
[157] K. J. McCarthy et al., “A compact flexible pellet injector for the TJ-II stellarator,” Rev. Sci. Instrum., vol. 79, no. 10, pp. 1–4, Sep. 2008.
[158] S. K. Combs et al., “A new four-barrel pellet injection system for the TJ-II stellarator,” in 24th IEEE/NPS Symposium on Fusion Engineering (SOFE), 2011.
[159] S. K. Combs et al., “New ORNL Pellet Injection System and Installation/Initial Operations on MST,” Fusion Sci. Technol., vol. 44, no. 2, pp. 513–517, Sep. 2003.
[160] S. K. Combs et al., “Results from laboratory testing of a new four-barrel pellet injector for the TJ-II stellarator,” Fusion Sci. Technol., vol. 64, no. 3, pp. 513–520, 2013.
[161] S. K. Combs et al., “High-Field-Side Pellet Injection Technology,” Fusion Technol., vol. 34, 2000.
[162] K. J. McCarthy et al., “The pellet injector and its associated diagnostics for performing plasma studies on the TJ-II stellarator,” in Proceedings of Science (ECPD2015), 2015, vol. 134, pp. 1–7.
[163] S. K. Combs, J. B. O. Caughman, and J. B. Wilgen, “Technique for measuring pellet mass loss through a curved guide tube using two microwave cavity detectors,” Rev. Sci. Instrum., vol. 77, p. 73503, 2006.
[164] J. Sanchez, E. Ascasibar, and P. Acedo, “Diagnostic systems for the TJ-II flexible heliac,” Japan Soc. Plasma Sci. Nucl. Fusion Res., no. ISC-11, pp. 338–341, 1998.
[165] J. Guasp, M. Liniers, C. Fuentes, and G. Barrera, “Thermal load calculations at TJ-II vacuum vessel under neutral beam injection,” Fusion Technol., vol. 35, no. 1, pp. 32–41, 1999.
[166] L. Pacios, A. de la Pena, I. Labrador, R. Carrasco, and F. Lapayese, “A versatile Timing System based on OS9 for the Spanish stellarator TJ-II,” in Proceedings of 16th International Symposium on Fusion Engineering, 1995, vol. 2, pp. 1074–1077.
[167] A. López et al., “Software and hardware developments for remote participation in TJ-II operation. Proof of concept using the NPA diagnostic,” Fusion Eng. Des., vol. 60, pp. 487–492, 2002.
[168] E. Sánchez et al., “Autonomous acquisition systems for TJ-II: controlling instrumentation with a fourth generation language,” Fusion Eng. Des., vol. 71, pp. 123–127, 2004.
[169] B. H. Bransden and C. J. Joachain, Physics of atoms and molecules, 2nd Editio. Prentice Hall, 2003.
[170] “Thorlabs PDA36A manual.” [Online]. Available: https://www.colorado.edu/physics/phys3340/phys3340_sp12/manuals_and_datasheets/Thorlabs PDA36A Switchable gain amplified photodiode.PDF.
[171] Z. A. Weinberg, “Charge coupled device,” US3656011A, 02-Feb-1971.
[172] E. de la Cal et al., “The Visible Intensified Cameras for Plasma Imaging in the TJ-II Stellarator,” Contrib. to Plasma Phys., vol. 51, no. 8, pp. 742–753, Sep. 2011.
[173] Photron Inc., “FASTCAM-APX RS Hardware Manual,” San Diego, CA, USA, 2006. [Online]. Available: http://www.highspeedimaging.com/media/photron_manuals/FASTCAM-

_________________________________________________________________________________
References
149
APX_RS_HW_Manual.pdf. [Accessed: 14-Feb-2018].
[174] G. Grieger et al., “Physics optimization of stellarators,” Phys. Fluids B Plasma Phys., vol. 4, no. 7, p. 2081, 1992.
[175] T. Klinger et al., “Performance and properties of the first plasmas of Wendelstein 7-X,” Plasma Phys. Control. Fusion, vol. 59, no. 1, p. 14018, 2017.
[176] J. Geiger et al., “Aspects of steady-state operation of the Wendelstein 7-X stellarator,” Plasma Phys. Control. Fusion, vol. 55, no. 1, p. 14006, 2013.
[177] V. Erckmann et al., “Electron Cyclotron Heating for W7-X: Physics and Technology,” Fusion Sci. Technol., vol. 52, no. 2, pp. 291–312, Aug. 2007.
[178] P. McNeely et al., “Current status of the neutral beam heating system of W7-X,” Fusion Eng. Des., vol. 88, no. 6–8, pp. 1034–1037, Oct. 2013.
[179] J. Ongena et al., “The dedicated ICRH system for the stellarator Wendelstein 7-X,” in AIP Conference Proceedings, 2014, pp. 105–112.
[180] T. Sunn Pedersen et al., “Plans for the first plasma operation of Wendelstein 7-X,” Nucl. Fusion, vol. 55, no. 12, p. 126001, Nov. 2015.
[181] T. Sunn Pedersen et al., “Confirmation of the topology of the Wendelstein 7-X magnetic field to better than 1:100,000,” Nat. Commun., vol. 7, p. 13493, 2016.
[182] R. König et al., “The Set of Diagnostics for the First Operation Campaign of the Wendelstein 7-X Stellarator,” in 2015 JINST 10 P10002, 2015.
[183] H. Yamada et al., “Characterization of energy confinement in net-current free plasmas using the extended International Stellarator Database,” Nucl. Fusion, vol. 45, pp. 1684–1693, 2005.
[184] R. C. Wolf et al., “Major results from the first plasma campaign of the Wendelstein 7-X stellarator,” Nucl. Fusion, vol. 57, no. 10, p. 102020, 2017.
[185] M. Dibon et al., “Blower Gun pellet injection system for W7-X,” Fusion Eng. Des., vol. 98–99, pp. 1759–1762, 2015.
[186] P. T. Lang et al., “A pellet launcher tool optimized for the control of edge localized modes in ASDEX Upgrade H-mode plasmas,” Fusion Eng. Des., vol. 82, no. 5–14, pp. 1073–1080, Oct. 2007.
[187] P. T. Lang et al., “Cryogenic pellet launcher adapted for controlling of tokamak plasma edge instabilities,” Rev. Sci. Instrum., vol. 78, no. 2, p. 23504, Feb. 2007.
[188] N. J. Peacock, D. C. Robinson, M. J. Forrest, P. D. Wilcock, and V. V. Sannikov, “Measurement of the Electron Temperature by Thomson Scattering in Tokamak T3,” Nature, vol. 224, no. 5218, pp. 488–490, Nov. 1969.
[189] C. J. Barth, F. J. Pijper, H. J. v. d. Meiden, J. Herranz, and I. Pastor, “High-resolution multiposition Thomson scattering for the TJ-II stellarator,” Rev. Sci. Instrum., vol. 70, no. 1, p. 763, Jan. 1999.
[190] J. Herranz et al., “Profile Structures of TJ-II Stellarator Plasmas,” Phys. Rev. Lett., vol. 85, no. 22, pp. 4715–4718, Nov. 2000.
[191] C. J. Barth, C. C. Chu, M. N. A. Beurskens, and H. J. v. d. Meiden, “Calibration

__________________________________________________________________________________
A study of the physics of pellet injection in magnetically confined plasma in stellarators
150
procedure and data processing for a TV Thomson scattering system,” Rev. Sci. Instrum., vol. 72, no. 9, pp. 3514–3527, Sep. 2001.
[192] J. Herranz, F. Castejón, I. Pastor, and K. J. McCarthy, “The spectrometer of the high-resolution multiposition Thomson scattering diagnostic for TJ-II,” Fusion Eng. Des., vol. 65, no. 4, pp. 525–536, Jul. 2003.
[193] B. P. van Milligen, I. G. J. Classen, and C. J. Barth, “Revision of TV Thomson scattering data analysis and detection of profile structure,” Rev. Sci. Instrum., vol. 74, no. 9, pp. 3998–4011, Sep. 2003.
[194] E. de la Luna, J. Sánchez, V. Tribaldos, and T. Estrada, “Multichannel electron cyclotron emission radiometry in TJ-II stellarator,” Rev. Sci. Instrum., vol. 72, no. 1, pp. 379–382, Jan. 2001.
[195] E. de la Luna et al., “Electron cyclotron emission measurements on TJ-II stellarator plasmas,” Fusion Eng. Des., vol. 53, no. 1–4, pp. 147–151, Jan. 2001.
[196] V. Tribaldos and B. P. van Milligen, “Electron cyclotron emission calculations for TJ-II stellarator,” Nucl. Fusion, vol. 36, no. 3, pp. 283–293, Mar. 1996.
[197] F. Chernyshev et al., “Compact Neutral Particle Analyzer for Plasma Diagnostics,” in ECA Vol. 27A (30th European Physical Society Conference on Plasma Physics, EPS 2003), 2003, p. P-4.71.
[198] F. V. Chernyshev et al., “A Compact Neutral-Particle Analyzer for Plasma Diagnostics,” Instruments Exp. Tech., vol. 47, no. 2, pp. 214–220, Mar. 2004.
[199] J. M. Fontdecaba et al., “Upgrade of the neutral particle analyzers for the TJ-II stellarator,” Rev. Sci. Instrum., vol. 85, no. 11, p. 11E803, Nov. 2014.
[200] F. Medina, L. Rodrı́guez-Rodrigo, J. Encabo-Fernández, A. López-Sánchez, P. Rodrı́guez, and C. Rueda, “X-ray diagnostic systems for the TJ–II flexible heliac,” Rev. Sci. Instrum., vol. 70, no. 1, p. 642, Jan. 1999.
[201] F. Medina et al., “Filamentary current detection in stellarator plasmas,” Rev. Sci. Instrum., vol. 72, no. 1, pp. 471–474, Jan. 2001.
[202] F. Medina, M. A. Ochando, A. Baciero, and J. Guasp, “Characterization of ripple-trapped suprathermal electron losses by their bremsstrahlung emission in the soft x-ray range at the TJ-II stellarator,” Plasma Phys. Control. Fusion, vol. 49, pp. 385–394, 2007.
[203] D. Baião, F. Medina, M. A. Ochando, C. Varandas, A. Molinero, and J. Chércoles, “Implementation of multifilter based twin-prototypes for core electron temperature measurements in the TJ-II stellarator,” Rev. Sci. Instrum., vol. 81, no. 10, p. 10D711, Oct. 2010.
[204] D. Baião et al., “Central electron temperature estimations of TJ-II neutral beam injection heated plasmas based on the soft X-ray multi-foil technique,” Rev. Sci. Instrum., vol. 83, no. 5, p. 53501, May 2012.
[205] D. Baião et al., “Implementation of a multichannel soft X-ray diagnostic for electron temperature measurements in TJ-II high-density plasmas,” Rev. Sci. Instrum., vol. 83, no. 10, p. 10E104, Oct. 2012.
[206] E. Ascasíbar et al., “Energy content and magnetic configuration scan in TJ-II Plasmas,” in 12th International Stellarator Workshop (1999).
_________________________________________________________________________________
References
151
[207] I. S. Bondarenko et al., “Installation of an advanced heavy ion beam diagnostic on the TJ-II stellarator,” Rev. Sci. Instrum., vol. 72, no. 1, pp. 583–585, Jan. 2001.
[208] L. I. Krupnik et al., “The first operation of the advanced heavy ion beam probing diagnostic on the TJ-II flexible heliac,” Fusion Eng. Des., vol. 56–57, pp. 935–939, Oct. 2001.
[209] I. S. Bondarenko et al., “High intensity alkali ion sources for plasma diagnostics,” Rev. Sci. Instrum., vol. 75, no. 5, pp. 1826–1828, May 2004.
[210] L. I. Krupnik et al., “Radial electric fields and confinement in the TJ-II stellarator,” Czechoslov. J. Phys., vol. 55, no. 3, pp. 317–339, Mar. 2005.
[211] L. Pereira et al., “Control and data acquisition system for the multiple cell array detector of the TJ-II heavy ion beam diagnostic,” Fusion Eng. Des., vol. 81, no. 15–17, pp. 1885–1889, Jul. 2006.
[212] A. V. Melnikov et al., “Plasma Potential Evolution Study by HIBP Diagnostic During NBI Experiments in the TJ-II Stellarator,” Fusion Sci. Technol., vol. 51, no. 1, pp. 31–37, Jan. 2007.
[213] A. V. Melnikov et al., “Diagnostic advances in Heavy Ion Beam Probing in the T-10 tokamak and TJ-II stellarator,” in ECA Vol. 37D (40th European Physical Society Conference on Plasma Physics, EPS 2013), 2013, p. O6.505.
[214] B. Gonçalves et al., “Operation of a multiple cell array detector in plasma experiments with a heavy ion beam diagnostic,” Rev. Sci. Instrum., vol. 75, no. 10, pp. 3511–3513, Oct. 2004.
[215] A. V. Melnikov et al., “Heavy ion beam probing-diagnostics to study potential and turbulence in toroidal plasmas,” Nucl. Fusion, vol. 57, no. 7, p. 72004, Jul. 2017.
[216] “LaserSoft Imaging Color Calibration Tools buy at Adorama.” [Online]. Available: https://www.adorama.com/l/Printers-and-Scanners/Printer-Color-Calibration/LaserSoft-Imaging~Color-Calibration-Tools. [Accessed: 10-Jan-2018].
[217] F. L. Tabarés, B. Brañas, I. García-Cortés, D. Tafalla, T. Estrada, and V. Tribaldos, “Edge characteristics and global confinement of electron cyclotron resonance heated plasmas in the TJ-II Stellarator,” Plasma Phys. Control. Fusion, vol. 43, no. 8, pp. 1023–1037, Aug. 2001.
[218] M. A. Ochando, F. Medina, and TJ-II Team, “Emissivity toroidal asymmetries induced by ECRH driven convective fluxes in the TJ-II stellarator,” Plasma Phys. Control. Fusion, vol. 45, no. 4503, pp. 221–231, 2003.
[219] L. R. Baylor et al., “Pellet fuelling and control of burning plasmas in ITER,” Nucl. Fusion, vol. 47, pp. 443–448, 2007.
[220] J. L. Terry, E. S. Marmar, J. A. Snipes, D. Garnier, V. Y. Sergeev, and V. Y. Sergeev, “Imaging of lithium pellet ablation trails and measurement of q profiles in TFTR,” Rev. Sci. Instrum., vol. 63, no. 10, pp. 5191–5194, Oct. 1992.
[221] P. B. Parks, “Theory of pellet cloud oscillation striations,” Plasma Phys. Control. Fusion, vol. 38, no. 4, pp. 571–591, Apr. 1996.
[222] L. L. Lengyel, “Comment on ‘Theory of pellet cloud oscillation striations’ by P Parks,” Plasma Phys. Control. Fusion, vol. 39, no. 4, pp. 647–649, Apr. 1997.
__________________________________________________________________________________
A study of the physics of pellet injection in magnetically confined plasma in stellarators
152
[223] A. Bustos et al., “Kinetic simulations of fast ions in stellarators,” Nucl. Fusion, vol. 51, no. 8, p. 83040, Aug. 2011.
[224] I. Y. Senichenkov, I. Y. Veselova, V. A. Rozhansky, and R. Schneider, “Modeling of the pellet cloud structure in the presence of ∇ B induced drift,” J. Nucl. Mater., vol. 337–339, pp. 446–450, 2005.
[225] A. Matsuyama, F. Köchl, B. Pégourié, R. Sakamoto, G. Motojima, and H. Yamada, “Modeling of drift displacement of the pellet ablated material for outboard side injection in large helical device,” Plasma Fusion Res., vol. 7, p. 1303006, 2012.
[226] D. Frigione et al., “Particle deposition, transport and fuelling in pellet injection experiments at JET,” Prepr. EFDA–JET–CP(10)08/48 D.
[227] F. Köchl et al., “Integrated Modelling of Pellet Experiments at JET,” in ECA Vol. 34A (37th European Physical Society Conference on Plasma Physics, EPS 2010), 2010, p. O4.123.
[228] L. Garzotti et al., “Pellet fuelling physics studies on MAST,” in ECA Vol. 38F (41st European Physical Society Conference on Plasma Physics, EPS 2014), 2014, p. O4.131.
[229] P. Klaywittaphat, T. Onjun, and R. Picha, “Effect of magnetic field on pellet penetration and deposition in ohmic Tore Supra discharges.,” in ECA Vol. 35G (38th European Physical Society Conference on Plasma Physics, EPS 2011), 2011, p. P4.135.
[230] A. Matsuyama, B. Pégourié, R. Sakamoto, J. S. Mishra, G. Motojima, and H. Yamada, “Over-ablation and deflection of hydrogen pellets injected into neutral beam injection heated plasmas in the Large Helical Device,” Plasma Phys. Control. Fusion, vol. 54, no. 3, p. 35007, 2012.
[231] S. P. Hirshman, “Steepest-descent moment method for three-dimensional magnetohydrodynamic equilibria,” Phys. Fluids, vol. 26, no. 12, p. 3553, 1983.
[232] S. P. Hirshman, K. C. Shaing, W. I. van Rij, C. O. Beasley, and E. C. Crume, “Plasma transport coefficients for nonsymmetric toroidal confinement systems,” Phys. Fluids, vol. 29, no. 9, pp. 2951–2959, Sep. 1986.
[233] S. P. Hirshman and O. Betancourt, “Preconditioned descent algorithm for rapid calculations of magnetohydrodynamic equilibria,” J. Comput. Phys., vol. 96, no. 1, pp. 99–109, Sep. 1991.
[234] F. Köchl, “Private communication,” 2016.
[235] F. Köchl, “Private Communication,” 2017.
[236] B. P. van Milligen et al., “A global resonance phenomenon at the TJ-II stellarator,” Nucl. Fusion, vol. 51, p. 13005, 2011.
[237] M. Landreman, H. M. Smith, A. Mollén, and P. Helander, “Comparison of particle trajectories and collision operators for collisional transport in nonaxisymmetric plasmas,” Phys. Plasmas, vol. 21, no. 4, p. 42503, Apr. 2014.