Application of Magnetically Stabilized Fluidized Beds for Cell Suspension Filtration from Aqueous...
19
This article was downloaded by:[Canadian Research Knowledge Network] [Canadian Research Knowledge Network] On: 26 April 2007 Access Details: [subscription number 770938029] Publisher: Taylor & Francis Informa Ltd Registered in England and Wales Registered Number: 1072954 Registered office: Mortimer House, 37-41 Mortimer Street, London W1T 3JH, UK Separation Science and Technology Publication details, including instructions for authors and subscription information: http://www.informaworld.com/smpp/title~content=t713708471 Application of Magnetically Stabilized Fluidized Beds for Cell Suspension Filtration from Aqueous Solutions To cite this Article: , 'Application of Magnetically Stabilized Fluidized Beds for Cell Suspension Filtration from Aqueous Solutions', Separation Science and Technology, 42:2, 421 - 438 To link to this article: DOI: 10.1080/01496390600997807 URL: http://dx.doi.org/10.1080/01496390600997807 PLEASE SCROLL DOWN FOR ARTICLE Full terms and conditions of use: http://www.informaworld.com/terms-and-conditions-of-access.pdf This article maybe used for research, teaching and private study purposes. Any substantial or systematic reproduction, re-distribution, re-selling, loan or sub-licensing, systematic supply or distribution in any form to anyone is expressly forbidden. The publisher does not give any warranty express or implied or make any representation that the contents will be complete or accurate or up to date. The accuracy of any instructions, formulae and drug doses should be independently verified with primary sources. The publisher shall not be liable for any loss, actions, claims, proceedings, demand or costs or damages whatsoever or howsoever caused arising directly or indirectly in connection with or arising out of the use of this material. © Taylor and Francis 2007
-
Upload
independent -
Category
Documents
-
view
5 -
download
0
Transcript of Application of Magnetically Stabilized Fluidized Beds for Cell Suspension Filtration from Aqueous...

This article was downloaded by:[Canadian Research Knowledge Network][Canadian Research Knowledge Network]
On: 26 April 2007Access Details: [subscription number 770938029]Publisher: Taylor & FrancisInforma Ltd Registered in England and Wales Registered Number: 1072954Registered office: Mortimer House, 37-41 Mortimer Street, London W1T 3JH, UK
Separation Science and TechnologyPublication details, including instructions for authors and subscription information:http://www.informaworld.com/smpp/title~content=t713708471
Application of Magnetically Stabilized Fluidized Beds forCell Suspension Filtration from Aqueous Solutions
To cite this Article: , 'Application of Magnetically Stabilized Fluidized Beds for CellSuspension Filtration from Aqueous Solutions', Separation Science and Technology,42:2, 421 - 438To link to this article: DOI: 10.1080/01496390600997807URL: http://dx.doi.org/10.1080/01496390600997807
PLEASE SCROLL DOWN FOR ARTICLE
Full terms and conditions of use: http://www.informaworld.com/terms-and-conditions-of-access.pdf
This article maybe used for research, teaching and private study purposes. Any substantial or systematic reproduction,re-distribution, re-selling, loan or sub-licensing, systematic supply or distribution in any form to anyone is expresslyforbidden.
The publisher does not give any warranty express or implied or make any representation that the contents will becomplete or accurate or up to date. The accuracy of any instructions, formulae and drug doses should beindependently verified with primary sources. The publisher shall not be liable for any loss, actions, claims, proceedings,demand or costs or damages whatsoever or howsoever caused arising directly or indirectly in connection with orarising out of the use of this material.
© Taylor and Francis 2007

Dow
nloa
ded
By: [
Can
adia
n R
esea
rch
Know
ledg
e N
etw
ork]
At:
14:0
5 26
Apr
il 20
07
Application of Magnetically StabilizedFluidized Beds for Cell SuspensionFiltration from Aqueous Solutions
Z. Al-Qodah and M. Al-Shannag
Department of Chemical Engineering, Faculty of Engineering
Technology, Al-Balqa Applied University, Marka, Amman, Jordan
Abstract: A magnetically stabilized fluidized bed (MSFBs) utilizing a transverse
magnetic field was used to retain cells from cell suspension. The magnetic field
permits bed expansion without mixing of the magnetic particles. The bed porosity
increased by 75% when the magnetic field intensity increases to 110 mT. The effect
of the magnetic field, suspension flow rate, bed height, initial concentration, and pH
on the breakthrough curves was studied. According to the experimental results, increas-
ing the initial concentration, flow rate, and pH leads to early breakthrough and inefficient
deposition. Additionally, increasing the field intensity and bed height delays the
breakthrough point.
Keywords: Magnetic stabilization, magnetically stabilized fluidized beds, cell
suspension, magnetic field, cell filtration
INTRODUCTION
Liquid effluents of many biochemical and biomedical processes utilizing
cellular materials such as whole cell fermentation processes usually contain
appreciable amounts of washed out cells, cell aggregates, or cell debris.
Even in the case of immobilized cell bioprocesses, significant amounts of
detached cells are usually eluted from the support and appeared in the
Received 4 April 2006, Accepted 29 August 2006
Address correspondence to Z. Al-Qodah, Department of Chemical Engineering,
Faculty of Engineering Technology, Al-Balqa Applied University, P.O. Box 340558,
Marka, Amman 11134, Jordan. E-mail: [email protected] or z_alqodah@
hotmail.com
Separation Science and Technology, 42: 421–438, 2007
Copyright # Taylor & Francis Group, LLC
ISSN 0149-6395 print/1520-5754 online
DOI: 10.1080/01496390600997807
421

Dow
nloa
ded
By: [
Can
adia
n R
esea
rch
Know
ledg
e N
etw
ork]
At:
14:0
5 26
Apr
il 20
07
reactor effluent. If the target products are soluble in these liquid effluents, then
the removal of the cellular materials from these effluents is of primary concern
prior to any further downstream processes required for the recovery of the
products. In addition, in biomass producing processes such as single cell
protein, the cells are the desired product and in some cases suitable solid-
liquid separation devices must adequately dewater the cell suspension.
Currently, there are a wide variety of bioseparation techniques used in
different biotechnological applications. These techniques include: centrifu-
gation, filtration, sedimentation, flocculation, floatation, and adsorption.
Among these techniques centrifugation and filtration are the most widely
used bioseparation techniques. However, centrifugation is usually accom-
panied with heat generation and high shear forces that may damage the
cells, whereas filtration using membranes suffers from a clogging problems.
Furthermore, sedimentation which is a very simple technique should be
coupled with the flocculation process in the case of small cells processing
in order to reduce the relatively long sedimentation time.
Another versatile separation technique used to separate solid particles
from liquid effluents is the packed bed usually called deep-bed filter. The
solid suspensions in the liquid streams passing through these beds usually
deposit throughout the entire surface of the filter media until the whole
surface area of the bed granules is covered by the retained solids (1). At
that moment, the bed usually suffers from high pressure drop and clogging
from specific and/or nonspecific binding (2). Consequently, the bed should
be regenerated by removing the collected solid particles. For ideal behavior,
i.e., minimizing drawbacks while maintaining the advantages, improvement
in the performance of deep-filters is needed. The above two drawbacks
should be eliminated and the retention capacity of the bed could be
increased by increasing the void fraction in the bed. The deep-bed filter is
expected to be modified to that behavior by providing a solid-phase of
magnetic particles and applying the principle of magnetic stabilization (3).
The application of a magnetic field to a bed of ferromagnetic particles
induces magnetic cohesive forces among the particles and tends to imposes
anisotropy in their arrangement along the field lines (4–9). The passage of
a liquid stream through the magnetized system transfers the bed to a more
expanded state usually called magnetically stabilized fluidized bed (MSFB).
The bed expansion usually increases as the liquid velocity increases until
the bed height becomes as much as the magnetic system height (10).
In biotechnology, there has been a variety of separation approaches under
the effect of magnetic field (11–13). However, the two-phase magnetically
stabilized fluidized bed (MSFB) has recently emerged as an efficient and
promising separation technique in many biochemical and biomedical appli-
cations. It has successfully been used as a filter or adsorber to separate
nucleic acids, cells, cell debris, protein molecules, and antibodies from
different liquid effluents (3, 13–15). In a more recent study and to allow for
wider operating conditions than conventional filters, Putnam et al. (2) used
Z. Al-Qodah and M. Al-Shannag422
Dow
nloa
ded
By: [
Can
adia
n R
esea
rch
Know
ledg
e N
etw
ork]
At:
14:0
5 26
Apr
il 20
07
MSFBs to accomplish fractionation of Erythrocyte subpopulation. The above
studies show that (MSFB) exhibits very desired characteristics such as high
liquid throughputs, improved contact between the liquid and solid phases,
elimination of bed clogging, and low pressure drop. In addition, these contactors
are characterized by low shear rates due to the expanded and fluid-like structure
of the bed and the ability to firmly control and retain low density magnetic
particles (6, 16–18). It was found that the bed was very gentle towards
highly viscous mediums such as blood or mediums containing living cells or
large protein molecules. As a consequence no cell or large molecules damage
takes place in the bed even at very high convective transport rates (2, 13).
Nevertheless, the orientation of the magnetic field applied in most previous
studies is axial and generated from powered wire coils which surrounded the
separation vessel. In addition, the resultant magnetic field from such a system
could be non-homogenous and the magnetic coils temperature could increase
to unsafe values if the coils are too close to the working vessel (17, 19–21).
Moreover, the limited studies used transverse to the flow fields installed two
permanent magnets and the magnetic field intensity was adjusted according
to tedious procedures by varying the distance between the two magnets and
changing the vertical position of the vessel (22). For these reasons, the
primary objective of this study is to remove cells from aqueous solutions
using magnetically stabilized fluidized beds employing an improved design
of the magnetic system overtaking most of the above limitations.
Since cell removal mechanism in MSFBs is dominated by intra particle
diffusion followed by sedimentation on the outer surface of the bed
particles rather than diffusion in the pores of the particles (1), bed porosity
is considered as one of the major parameters affecting the bed performance.
The effect of some hydrodynamic and operational parameters affecting cell
removal efficiency, h, collision efficiency, a, and breakthrough curves
will be investigated in the presence of the applied magnetic field. These
parameters include: bed expansion and porosity, liquid flow rate, initial bed
height, pH, and inlet concentration.
MATERIAL AND METHODS
Materials
Yeast cells (Saccharomyces cerevisiae) were purchased from Astrico (Jordan).
Double distilled water was used to prepare cell suspensions at different concen-
trations. Magnetic particles were prepared in the same manner as described
earlier (23). The characteristics of these particles are shown in Table 1. The
nonporous magnetic particles used consist of a ferromagnetic core of
magnetite (Fe3O4) covered by a stable layer of activated carbon or zeolite by
using epoxy resin as an adhesive. These particles are normally fluidized in
the absence of the magnetic field and they are considered as non-porous
MSFBs for Cell Suspension Filtration 423

Dow
nloa
ded
By: [
Can
adia
n R
esea
rch
Know
ledg
e N
etw
ork]
At:
14:0
5 26
Apr
il 20
07
particles with good adhesion properties for cells (23). The activated carbon
magnetic particles have black color. This color facilitates visual observations
in the hydrodynamic study.
A schematic diagram of the experimental setup is shown in Fig. 1. Column
(1) was made of transparent Plexiglas with an inner diameter of 0.045 m and
height H of 0.75 m. A perforated non-magnetic stainless steel grid (2) of
0.0003 m pore diameter was mounted on the base of the column to support
the solid phase (3) and distribute the influent cell suspension coming from the
tank (10), which is equipped with a mixer (6) via a centrifugal pump (11).
The magnetic system (13) is made of a cast steel core which consists of 180
painted cast steel sheets of 9 � 1023 m thickness. A copper coil consisting of
Table 1. Characteristics of the magnetic particles used in this study
Material used to
cover magnetite
rb
(kg/m3)
rs
(kg/m3)
Shape
factor
dp
(mm)
Ulmfo
(m/s)
Bs
(mT)
Porosity
1o (2)
Activated
carbon
1600 2760 0.9 0.7 1.05 590 0.42
Figure 1. Schematic of the experimental apparatus. 1. Column, 2. Supporting grid,
3. Magnetic particles, 4. Power supply, 5. Feed tank, 6. Mixer, 7. Effluent stream,
8. Peristaltic pump, 9. Effluent receiver, 10. Distilled water, 11. Centrifugal pump,
12. Valve, 13. Magnetic system.
Z. Al-Qodah and M. Al-Shannag424

Dow
nloa
ded
By: [
Can
adia
n R
esea
rch
Know
ledg
e N
etw
ork]
At:
14:0
5 26
Apr
il 20
07
1500 turns of a copper wire of 9 � 1023 m diameter. Glass wool was used as an
insulator between the layers of the core. The shape of the cast steel sheets and
the resultant shape of the magnetic core were suitable to house the column and
are described elsewhere (10, 18). The net height of the magnetic system is
0.20 m and its net weight is 40 kg. The DC current was supplied from a
power supply (4) can be varied from 0 to 5 Ampere and the corresponding
magnetic field intensity changes from zero to 200 mT. As mentioned before,
this magnetic system produces concentrated and homogeneous magnetic field
as indicated by Hall probe. In addition, it minimizes electrical energy losses
in the form of heat when compared to electromagnets made of solenoids only
(10). The evidence of this fact was that the temperature of the magnetic
system has not arisen above 358C for one hour of continuous operation.
Methods
The cell concentration in the inlet feed to the stabilized bed and in the leaving
stream was determined continuously by absorbance measurements using
spectrophotometer (Philips) at a wave length of 610 nm. A calibration curve
between cell concentration (ppm) and turbidity is shown in Fig. 2. The
leaving stream (7) was collected in tank (9) in order to calculate the cell
removal efficiency, cell loading, and the collision efficiency under the effect of
a selected parameter such as initial concentration, flow rate, pH, or bed height.
The removal efficiency, h, the cell loading on the magnetic particles, q, and
the collision efficiency, a, (24) were calculated using the following equations:
h ¼ ðCo � CÞ=Co ð1Þ
q ¼VðCo � CÞ
mð2Þ
a ¼ �4=3rp
1� 1b
hL
� �lnðC=CoÞ ð3Þ
Figure 2. Calibration curve between cell concentration and turbidity.
MSFBs for Cell Suspension Filtration 425

Dow
nloa
ded
By: [
Can
adia
n R
esea
rch
Know
ledg
e N
etw
ork]
At:
14:0
5 26
Apr
il 20
07
Where Co and C are cell concentration in the inlet feed and the collected
effluent, V is the volume treated and equals to 4 liters in all experiments
unless stated and m is mass of the bed (g), L is the bed height (m), 1b is the
bed porosity, rp is the radius of the bed particles (m).
The flow regimes (bed behavior) were classified based on visual observation
in the same manner as described before (6, 8, 10). The bed height was determined
visually, using a ruler attached to the column wall. Liquid was pumped to the
column using a peristaltic pump (GallenKamp, UK). The magnetic field
intensity was measured using Hall probe (Leybolo-Heraeus, Germany).
The following equations hold for the initial solid holdup, 1so, and solid
holdup after bed expansion 1s and the bed porosity, 1, respectively:
1so ¼W=rs
AHbo
ð4Þ
1s ¼ 1�Hbo
Hb
1so ð5Þ
1s ¼ 1� 1s ð6Þ
Both 1s and 1b are affected by the intensity of the applied magnetic field.
Experiments in this study were conducted in the mode “Magnetizing first”
(6, 19). In this mode of operation, the magnetic field was set at the desired
value and applied to the packed bed. After that distilled water was fed to
the column in order to transfer the bed from the initial packed to the stabilized
expanded state. The water flow rate was increased until the strings of the bed
start to fluidize. Then the water flow rate was gradually reduced until it was
finally turned off. Then the liquid cell suspension was started with the
desired flow rate. The run continued until the exit cell suspension reaches a
constant value. At that point, the cell solution and magnetic field were
switched off and high distilled water flow rate was started to empty the
column from the cell loaded particles in order to regenerate them according
to the procedure of Terranova and Burns (3). In this mode of operation and
before carrying out each experiment, the bed was fluidized with distilled
water in the absence of the magnetic field for 5 minutes in order to expel
possible gas bubbles, followed by gradual decrease of the water flow rate
until it diminishes and the bed returns to its initial packed state.
RESULTS AND DISCUSSION
Hydrodynamics of Two-Phase MSFBs
Phase Diagram
In magnetizing the first mode, the phase diagram of MSFBs usually consists of
three subsequent flow regimes. These are: the initial packed bed, the stable
Z. Al-Qodah and M. Al-Shannag426

Dow
nloa
ded
By: [
Can
adia
n R
esea
rch
Know
ledg
e N
etw
ork]
At:
14:0
5 26
Apr
il 20
07
expanded bed, and the fluidized bed, respectively. These regimes correspond to
the case where the applied magnetic field intensity is more than 10 mT to
induce sufficient cohesion forces between the magnetic particles. Figure 3
shows an experimentally determined phase diagram for the magnetic
particles of Ulmfo ¼ 0.009 m/s. It can be seen from Fig. 3 that the bed exists
in the initial packed bed regime if Ul is less than what is called the minimum
expansion velocity, Ue. When Ul becomes greater than Ue the bed starts to
expand. Ue remains constant and equal to 0.009 m/s at all values of the
magnetic field. Beyond Ue, the bed begins to stably expand but without
particle movement. This uniform expansion continues until the liquid
velocity exceeds a second transition velocity named the minimum fluidization
velocity, Umf (the upper curve of Fig. 3). The magnetized system operating at
Ue , Ul , Umf is magnetically stabilized (4–8, 10). The bed in this regime
expands as Ul increases in a piston like slow and regular expansion. Further-
more, arrangement of the particle strings or chains along the field lines can
be clearly observed in this regime. In addition, only in situ vibrations of the
strings (chains-of-particles) were observed in the stabilized regime. The bed
properties in these three phases are summarized in Table 2.
With further increase of Ul, the bed breaks down at the minimum fluidiza-
tion velocity, Umf. Above this transition velocity, the bed exists in the fluidized
regime. In this regime, the fluidized system consists of strings (Chains-
of-particles). It can be seen from Fig. 3 that Umf increases as the applied
field increases. For instance, Umf increases from 0.009 to 0.042 m/s as the
magnetic field intensity increases from 0 to 113 mT. The correlation
between Umf and B is shown in the following relation:
Umf ¼ Umfoe0:0003B ð7Þ
Figure 3. Phase diagram of two-phase liquid-solid magnetically stabilized fluidized
beds.
MSFBs for Cell Suspension Filtration 427

Dow
nloa
ded
By: [
Can
adia
n R
esea
rch
Know
ledg
e N
etw
ork]
At:
14:0
5 26
Apr
il 20
07
Where B is the magnetic field intensity (mT). This equation covers B
values from 0 to 113 mT and R2 ¼ 0.91.
As mentioned above, the magnetically stabilized regime bounded
between Ue and Umf is preferred for process operation owing to its desired
properties mentioned above. For this reason, cell removal from the solution
will be conducted in this regime.
Bed Expansion
Bed expansion is an important property of a fluidized system. It affects the size
of the fluid-bed equipment and residence time of the liquid phase in the
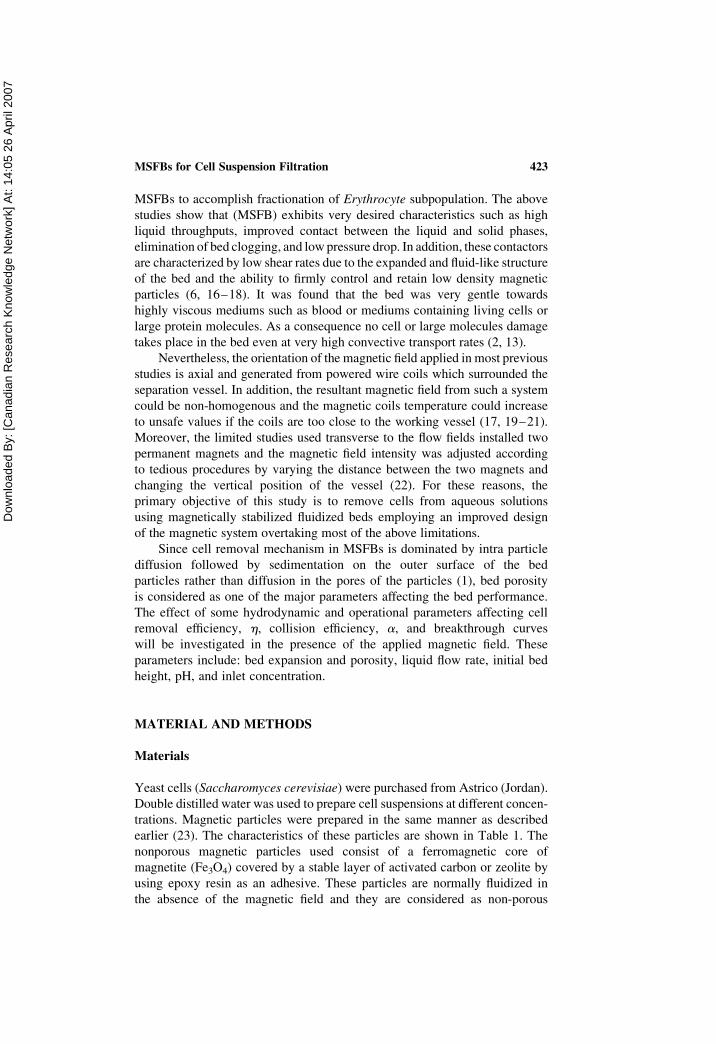
contactor. Figure 4 shows the bed porosity as a function of liquid velocity
at different magnetic field intensities. It can be seen from Fig. 4 that an
initial expansion occurs to the packed bed after the application of the
magnetic field and in the absence of liquid flow as previously reported
(8, 10, 19). Then beyond Ue, the bed regularly expands. The bed porosity at
the onset of fluidization is the maximum porosity i.e. 1max that the stabilized
bed can attain.
It should be noted that a significant part of the particles surface is flat and
the contact area between them in the packed regime is relatively high. This
suggests that the effective surface area of the particles available for cell depo-
sition or sedimentation is quite smaller than the total surface area of the
particles. On the contrary, the bed in the stabilized regime is expanded and
consists of horizontal layers of strings (6, 9, 10, 25). As a result of this new
arrangement of particles, 1max exceeds 0.7 as Fig. 4 indicates. This means
that the bed height is almost doubled and the particles are just touching
each other. Consequently, the effective outer surface area of the particles is
improved and more cell deposition is expected in this regime.
Table 2. The main properties of MSFBs and the flow regimes in magnetizing first
mode
Regime
Property
Ranges of gas
velocities
Bed
state
Pressure
drop
Bed
height
Solid
mixing
Packed
bed
0 � Ul , Ue Randomly
packed
High Constant None
Stabilized
bed
Ue � Ul , Umfo Expanded
with hori-
zontal
strings
Low Increases
as Ul
increases
None but the
bed is
flowable
Fluidized
bed
Umf � Ul , Upt Strings then
particulate
fluidization
Low Increases
as Ul
increases
Slow then
intensive
Z. Al-Qodah and M. Al-Shannag428
Dow
nloa
ded
By: [
Can
adia
n R
esea
rch
Know
ledg
e N
etw
ork]
At:
14:0
5 26
Apr
il 20
07
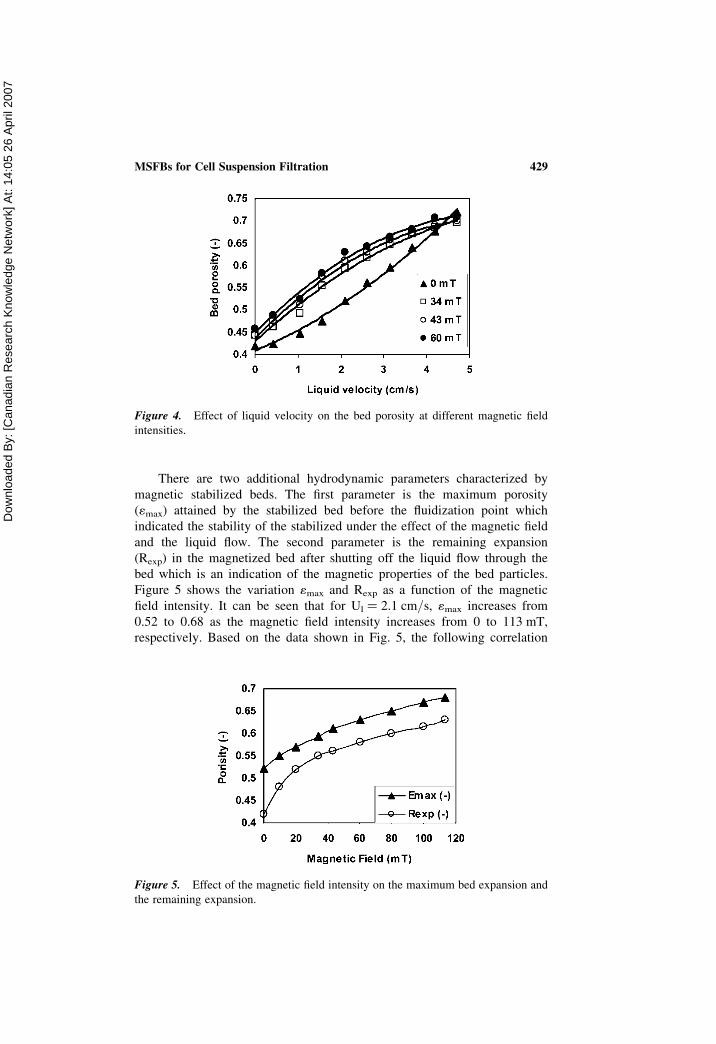
There are two additional hydrodynamic parameters characterized by
magnetic stabilized beds. The first parameter is the maximum porosity
(1max) attained by the stabilized bed before the fluidization point which
indicated the stability of the stabilized under the effect of the magnetic field
and the liquid flow. The second parameter is the remaining expansion
(Rexp) in the magnetized bed after shutting off the liquid flow through the
bed which is an indication of the magnetic properties of the bed particles.
Figure 5 shows the variation 1max and Rexp as a function of the magnetic
field intensity. It can be seen that for Ul ¼ 2.1 cm/s, 1max increases from
0.52 to 0.68 as the magnetic field intensity increases from 0 to 113 mT,
respectively. Based on the data shown in Fig. 5, the following correlation
Figure 4. Effect of liquid velocity on the bed porosity at different magnetic field
intensities.
Figure 5. Effect of the magnetic field intensity on the maximum bed expansion and
the remaining expansion.
MSFBs for Cell Suspension Filtration 429
Dow
nloa
ded
By: [
Can
adia
n R
esea
rch
Know
ledg
e N
etw
ork]
At:
14:0
5 26
Apr
il 20
07
relates the maximum porosity of the bed (1max) to the magnetic field intensity:
1max
1bo
¼ �2� 10�5B2 þ 0:0053Bþ 1:216 ð8Þ
Where 1bo is the initial bed porosity. Note that in the above correlation, the
values of the magnetic field intensity range from 0 to 113 mT and the value
of correlation coefficient, R2 ¼ 0.997.
When Ul was gradually reduced while keeping the applied magnetic
intensity constant, the bed contracts and shows hysteresis. Even when the
fluid throughputs were shut off, the new reformed packed bed remained in a
more expanded state than at the beginning of the experiment because the
lines of magnetic field have the ability to hold the magnetic strings in an
expanded state.
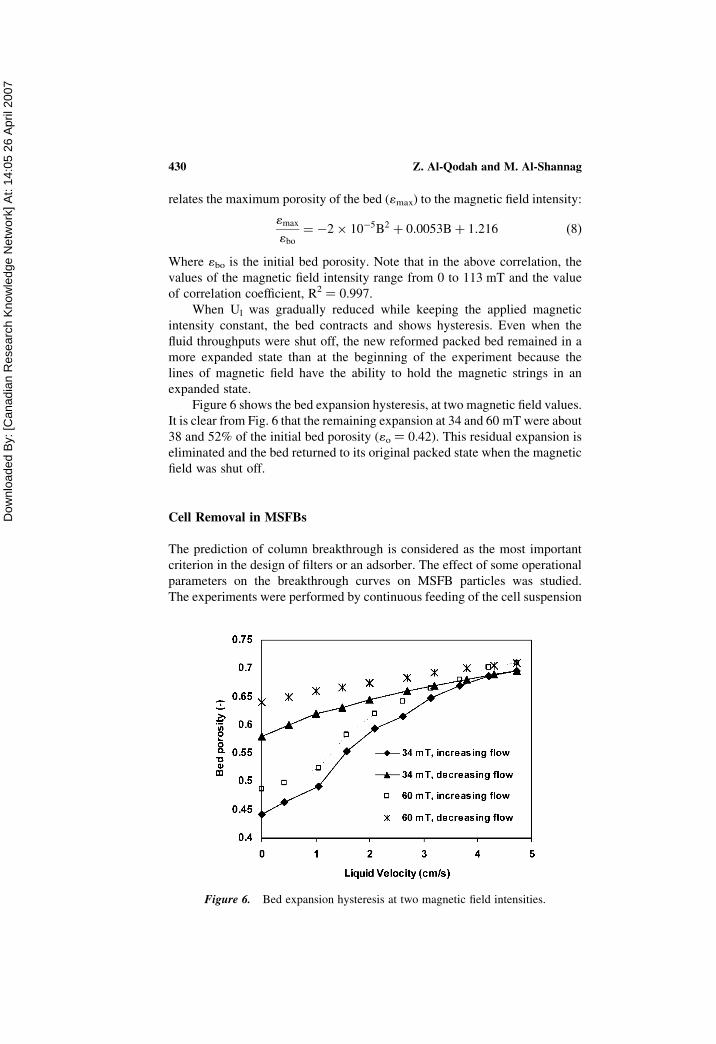
Figure 6 shows the bed expansion hysteresis, at two magnetic field values.
It is clear from Fig. 6 that the remaining expansion at 34 and 60 mT were about
38 and 52% of the initial bed porosity (1o ¼ 0.42). This residual expansion is
eliminated and the bed returned to its original packed state when the magnetic
field was shut off.
Cell Removal in MSFBs
The prediction of column breakthrough is considered as the most important
criterion in the design of filters or an adsorber. The effect of some operational
parameters on the breakthrough curves on MSFB particles was studied.
The experiments were performed by continuous feeding of the cell suspension
Figure 6. Bed expansion hysteresis at two magnetic field intensities.
Z. Al-Qodah and M. Al-Shannag430

Dow
nloa
ded
By: [
Can
adia
n R
esea
rch
Know
ledg
e N
etw
ork]
At:
14:0
5 26
Apr
il 20
07
to the bed and varying one of the operational parameters while keeping the
others constant.
Effect of Magnetic Field Intensity
As shown above, one of the important consequences of the application of a
magnetic field to a bed of magnetic particles is the increased bed height or
porosity. This increase mainly depends on the intensity of the applied
magnetic field, B, and the liquid flow rate (see Fig. 4). This implies that
under the effect of these two parameters, the bed employed for filtration
simultaneously manifested itself macroscopically by the overall bed
expansion (10, 19). Figure 7 shows a plot of the normalized cell concentration
against the volume treated, Vt at different magnetic field intensities. It can be
seen from Fig. 7 that C/Co variation with the Vt is not identical in the cases
of packed (B ¼ 0) and stabilized bed (B . 0). For instance, the values of
C/Co after treating 4 liters of the cell solution were 0.98, 0.83, 0.77, and
0.71 when B values were 0, 34, 60, and 80 mT, respectively. This means
that cell deposition increases by 27% as B increases from 0 to 80 mT.
These results can be understood by considering the bed porosity at these B
values, which are 0.42, 0.55, 0.58, and 0.60, respectively. Since the cell
solution flow rate was held constant at 40 ml/min in this part of the experi-
ment, this implies that the interstitial liquid velocity decreases and the
residence time increases as B increases. As a consequence, the liquid turbu-
lence decreases whereas the cell deposition rate increases. Another reason
for the enhancement of cell deposition in the MSFBs is related to the
contact area between the bed particles. It is expected that as the bed
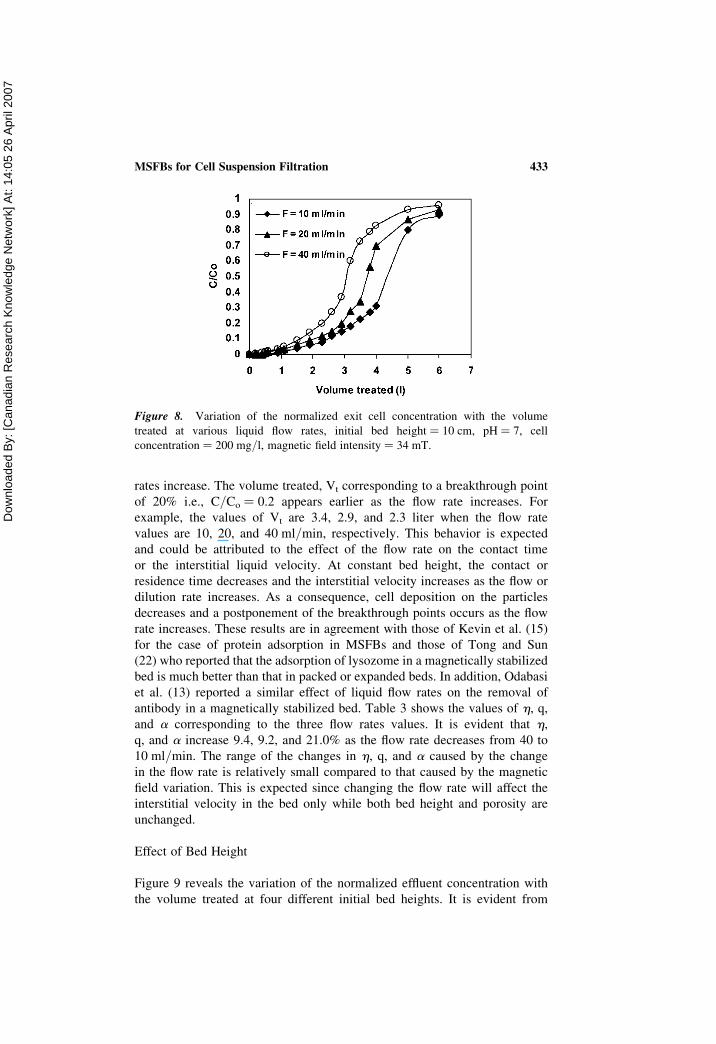
Figure 7. Variation of the normalized exit cell concentration with the volume
treated at various magnetic field intensities, initial bed height ¼ 10 cm, flow rate ¼
40 ml/min, pH ¼ 7, cell concentration ¼ 200 mg/l.
MSFBs for Cell Suspension Filtration 431

Dow
nloa
ded
By: [
Can
adia
n R
esea
rch
Know
ledg
e N
etw
ork]
At:
14:0
5 26
Apr
il 20
07
expands, the contact area between the bed particles decreases and the overall
projected area for cell deposition increases. Accordingly, cell deposition
becomes more efficient and easier as the bed porosity increases taking into
account the absence of channels or preferential paths for liquid flow. These
results are in agreement with those of Kevin et al. (15) who found the effi-
ciency of solute removal by adsorption in magnetically stabilized bed
increased significantly in the stabilized regime.
The effect of magnetic field intensity on h, q, and a is shown in Table 3.
Table 3 reveals that the removal efficiency, h, the cell loading, q and the
collision efficiency, a increase by 31.5, 26.8, and 282%, respectively as B
increases from 0 to 80 mT. The reason for this behavior is as before, being
attributed to the effect of the magnetic field on the bed porosity and conse-
quently on the interstitial liquid velocity or the residence time. The large
increase in the collision efficiency a is referred to nature of equation (3)
used to evaluate it. All the parameters L, (1/1 2 1b), h and (2ln C/Co) are
strongly affected and increased as B increases.
Effect of Flow Rate
The breakthrough curves at different cell suspension flow rates are shown in
Fig. 8. It is evident from Fig. 8 that cell deposition decreases as the flow
Table 3. Effect of operational parameters on the removal efficiency h, particle cell
loading q, and collision efficiency a
Variable Value h q (mg/g) a (�105)
Magnetic field mT 0 0.49 1.6 5.625
34 0.585 1.84 13.75
60 0.615 1.94 18.6
80 0.645 2.03 21.52
Flow rate ml/min 10 0.64 2.01 17.48
20 0.61 1.93 15.36
40 0.585 1.84 13.75
Bed height cm 6 0.5 1.57 4.55
8 0.53 1.67 8.56
10 0.585 1.84 13.75
12 0.645 2.02 16.43
Initial conc. mg/l 100 0.815 1.28 36.77
150 0.65 1.53 18.24
200 0.585 1.84 13.35
250 0.525 2.07 10.75
pH 5 0.59 1.86 14.06
7 0.585 1.84 11.51
9 0.515 1.62 9.96
Z. Al-Qodah and M. Al-Shannag432
Dow
nloa
ded
By: [
Can
adia
n R
esea
rch
Know
ledg
e N
etw
ork]
At:
14:0
5 26
Apr
il 20
07
rates increase. The volume treated, Vt corresponding to a breakthrough point
of 20% i.e., C/Co ¼ 0.2 appears earlier as the flow rate increases. For
example, the values of Vt are 3.4, 2.9, and 2.3 liter when the flow rate
values are 10, 20, and 40 ml/min, respectively. This behavior is expected
and could be attributed to the effect of the flow rate on the contact time
or the interstitial liquid velocity. At constant bed height, the contact or
residence time decreases and the interstitial velocity increases as the flow or
dilution rate increases. As a consequence, cell deposition on the particles
decreases and a postponement of the breakthrough points occurs as the flow
rate increases. These results are in agreement with those of Kevin et al. (15)
for the case of protein adsorption in MSFBs and those of Tong and Sun
(22) who reported that the adsorption of lysozome in a magnetically stabilized
bed is much better than that in packed or expanded beds. In addition, Odabasi
et al. (13) reported a similar effect of liquid flow rates on the removal of
antibody in a magnetically stabilized bed. Table 3 shows the values of h, q,
and a corresponding to the three flow rates values. It is evident that h,
q, and a increase 9.4, 9.2, and 21.0% as the flow rate decreases from 40 to
10 ml/min. The range of the changes in h, q, and a caused by the change
in the flow rate is relatively small compared to that caused by the magnetic
field variation. This is expected since changing the flow rate will affect the
interstitial velocity in the bed only while both bed height and porosity are
unchanged.
Effect of Bed Height
Figure 9 reveals the variation of the normalized effluent concentration with
the volume treated at four different initial bed heights. It is evident from
Figure 8. Variation of the normalized exit cell concentration with the volume
treated at various liquid flow rates, initial bed height ¼ 10 cm, pH ¼ 7, cell
concentration ¼ 200 mg/l, magnetic field intensity ¼ 34 mT.
MSFBs for Cell Suspension Filtration 433

Dow
nloa
ded
By: [
Can
adia
n R
esea
rch
Know
ledg
e N
etw
ork]
At:
14:0
5 26
Apr
il 20
07
Fig. 9 that C/Co in a bed of 6 cm initial height reaches 0.97 at a volume
treated of 4 liters, whereas in the bed of 12 cm initial height it is only
0.71. In addition the 20% breakthrough point appears earlier in short
beds. For instance, the volume treated corresponding to 20% breakthrough
point for beds of 6, 8, 10, and 12 cm initial heights are 1.7, 2.05, 2.4, and
2.8, respectively. This behavior is expected because when the initial bed
height decreases this implies decreasing the contact time and also decreas-
ing the cell deposition sites in the bed forcing the cells to leave the bed at
relatively shorter contact time. This fact suggests that the deposition of cells
requires beds of large aspect ratio (height/diameter) in order to increase the
contact time in the bed. These results are in agreement with those of Kevin
et al. (15) for the case of adsorption of protein adsorption in MSFB and
those of Ding and Sun (26) who reported that as the bed height increases
its adsorption efficiency increases.
Table 3 shows the values of h, q, and a in these four beds. Table 3 depicts
that h, q, and a increase as the bed height increases. The values of these
variables increase by 29, 10, and 202% as the bed height increases from 6
to 12 cm. There is an important remark regarding the enhancement of the
cell loading, q on the magnetic particles as the initial bed height increases.
It was found to increase 10% when the bed height was doubled. This means
that increasing the bed height will increase the overall bed loading in
addition to the specific cell loading, q. This behavior could be attributed to
the fact that as the bed height increases the friction between the cells and
the bed particles increases to the extent that the interaction between them
dominates and forces cell deposition.
Figure 9. Variation of the normalized exit cell concentration with the volume treated
at various bed heights, magnetic field intensity ¼ 34 mT, flow rate ¼ 40 ml/min,
pH ¼ 7, cell concentration ¼ 200 mg/l, magnetic field intensity ¼ 34 mT.
Z. Al-Qodah and M. Al-Shannag434

Dow
nloa
ded
By: [
Can
adia
n R
esea
rch
Know
ledg
e N
etw
ork]
At:
14:0
5 26
Apr
il 20
07
Effect of Initial Cell Concentration
Figure 10 shows the effect of initial cell concentration on the breakthrough
curves. Four different initial cell concentrations of 100, 150, 200, and
250 mg/l were used at the same flow rate of 40 ml/min and a bed of 10 cm
initial height. As presented in this figure, the slope of the breakthrough
curve increases as the concentration increases. As a consequence, the break-
through point is earlier at higher concentrations. The 20% breakthrough
point for the above four concentrations was reached when the volume
treated values were 3.6, 2.8, 2.3, and 1.9 liters, respectively. The effect of
Co on the values of h, q, and a is shown in Table 3. It is clear that as the
concentration increases from 100 to 250 mg/lh decreases by 35.6%, q
increases by 61.7%, and a decreases by 70.8%. These values are reasonable
since the exit normalized concentration C/Co is strongly affected by the
initial concentration as presented in Fig. 10. C/Co values, when the volume
treated is 4 liters, are 0.37 and 0.95 corresponding to Co values of 100 and
250 mg/l, respectively. The decrease in the removal efficiency at high concen-
trations could be referred to the hindrance effect which reduces cell depo-
sition. On the other hand, q increases by 61.7% because Co increases while
the bed mass does not change.
Effect of pH
The deposition of the cells from the liquid phase on the magnetic particle
surface depends on the interaction between these cells and the activated
carbon covering the magnetic cores. This interaction and accordingly the
Figure 10. Variation of the normalized exit cell concentration with the volume
treated at various initial cell concentrations, magnetic field intensity ¼ 34 mT, initial
bed height ¼ 10 cm, flow rate ¼ 40 ml/min, pH ¼ 7.
MSFBs for Cell Suspension Filtration 435

Dow
nloa
ded
By: [
Can
adia
n R
esea
rch
Know
ledg
e N
etw
ork]
At:
14:0
5 26
Apr
il 20
07
deposition are expected to vary according to the value of the solution pH.
Figure 11 shows the variation of the normalized cell concentration with the
treated volume of three solutions of three different pHs. It is clearly shown
in Fig. 11 that as the pH increases the normalized concentration at the exit
increases for the same treated volume. For pH values of 5, 7, and 9 the 20%
breakthrough point is 2.9, 2.3, and 1.9 liters, respectively. This suggests that
the interaction between the cells and the magnetic particles and consequently
the deposition is enhanced by lowering the pH value of the cell suspension.
It was estimated that as the pH increased from 5 to 9, the values of h, q,
and a decrease by 12.7, 12.9, and 29.2% respectively. These values indicate
that the collision efficiency was most affected by increasing the solution pH.
CONCLUSIONS
In this study, the application of a transverse magnetic field to a bed of
magnetic particles was investigated. The resulting magnetically stabilized
bed was used to remove yeast cells from cell suspension. The effect of the
magnetic field on some hydrodynamic parameters affecting the cell deposition
process such as bed expansion and remaining expansion was studied. The
following conclusions can be drawn:
1. The bed porosity and remaining expansion increase as the magnetic field
increases. This implies that at constant flow rate the interstitial velocity
decreases and the contact time between the cell solution and bed
particles increases.
Figure 11. Variation of the normalized exit cell concentration with the volume
treated at various pH, magnetic field intensity ¼ 34 mT initial bed height ¼ 10 cm,
flow rate ¼ 40 ml/min, cell concentration ¼ 200 mg/l.
Z. Al-Qodah and M. Al-Shannag436

Dow
nloa
ded
By: [
Can
adia
n R
esea
rch
Know
ledg
e N
etw
ork]
At:
14:0
5 26
Apr
il 20
07
2. The results indicate that the deposition breakthrough curve was strongly
affected by the magnetic field intensity and the other studied variables
such as bed height, cell concentration flow rate and pH.
3. According to the results, increasing the magnetic field and bed height
leads to an early breakthrough curves and enhances the removal efficiency.
4. Increasing the initial concentration, flow rate, and pH delays the break-
through point and reduces the removal efficiency.
REFERENCES
1. Putnam, D. and Burns, M.A. (1997) Predicting the filtration of noncoagulatingparticles in depth filters. Chem. Eng. Sci., 52: 93.
2. Putnam, D., Namasivayam, V., and Burns, M.A. (2003) Cell affinity separationsusing magnetically stabilized fluidized beds, erythrocyte subpopulation fraction-ation utilizing a lectin-magnetite support. Biotechnol. Bioeng., 81: 650.
3. Terranova, B.E. and Burns, M.A. (1991) Continuous cell suspension processingusing magnetically stabilized fluidized beds. Biotechnol. Bioeng., 37: 110.
4. Kirko, I.M. and Filippov, M.V. (1960) Standard correlations for a fluidized bed offerromagnetic particles in a magnetic field. Zn Tekhniko Fizika., 30: 1081.
5. Rosensweig, R.E. (1979) Fluidization: hydrodynamic stabilization with a magneticfield. Science, 204: 57.
6. Seigell, J.H. (1987) Liquid fluidized magnetically stabilized beds. PowderTechnol., 52: 139.
7. Lee, S.L.P. and Lasa, H. (1988) Radial dispersion model for bubble phenomenonin three phase fluidized beds. Chem. Eng. Sci., 43: 2445.
8. Penchev, I.P. and Hristov, J.Y. (1990) Fluidization of ferromagnetic particles in atransverse magnetic field. Powder Technol., 62: 1.
9. Hristov, J.H. (1996) Fluidization of ferromagnetic a magnetic field. Part 1: Theeffect of fields lines on the bed stability. Powder Technol., 87: 59.
10. Al-Qodah, Z. (2000) Hydrodynamic behavior of a magneto airlift column in atransverse magnetic field. Can. J. Chem. Eng., 78: 458.
11. Safarik, I. and Safarikova, M. (1999) Use of magnetic techniques for the isolationof cells. Journal of Chromatography B., 722: 33.
12. Safarik, I. and Safarikova, M. (2004) Magnetic techniques for the isolation andpurification of proteins and peptides. BioMagnetic Research and Technol., 2: 1.
13. Odabasi, M., Ozkayar, N., Ozkara, S., Unal, S., and Denizli, A. (2005) Pathogenicantibody removal using magnetically stabilized fluidized bed. Journal of Chroma-tography B, 826: 507.
14. Hultman, T., Stal, S., Hornes, E., and Uhlen, M. (1989) Direct phase sequencing ofgenomic and plasmid DNA using magnetic beads as solid support. Nucleic AcidResearch, 17: 4937.
15. Kevin, D., Seibert, K.D., and Burns, M.A. (1998) Effect of hydrodynamic andmagnetic stabilization on fluidized bed adsorption. Biotechnol. Prog., 14: 749.
16. Hristov, J.H. and Ivanova, V.N. (1999) Magnetic field assisted bioreactors. InRecent Research Development in Fermentation and Bio-Engineering 2; SignPostResearch: Trvadrum, India; 41.
17. Zhang, Z.H., O’Sullivan, D.A., and Lyddiatt, A. (1999) Magnetically stabilizedfluidized bed adsorption. Practical benefit of uncoupling bed expansion from
MSFBs for Cell Suspension Filtration 437

Dow
nloa
ded
By: [
Can
adia
n R
esea
rch
Know
ledg
e N
etw
ork]
At:
14:0
5 26
Apr
il 20
07
liquid velocities in the purification of a recombinant protein from Escherichia coli.J. Chem. Technol. Biotechnol., 74: 270.
18. Al-Qodah, Z. and Al-Hassan, M. (2000) Phase holdup and gas-to-liquid masstransfer coefficient in magnet stabilized G-L-S airlift fermenter. Chem. Eng. J.,79: 41.
19. Hristov, J.H. (2002) Magnetic field assisted fluidization—A unified approach. Part1. Fundamentals and relevant hydrodynamics. Reviews in Chemical Engineering,18: 295.
20. Hristov, J.H. (2005) External loop airlift with magnetically controlled liquid circu-lation. Powder Technol., 149: 180.
21. Hristov, J.H. (2005) External-loop airlift magnetically stabilized bed-minimumstabilization and fluidization conditions. China Particulogy, 3: 197.
22. Tong, X.D. and Sun, Y. (2003) Application of magnetic agarose in liquid magne-tically stabilized fluidized bed for protein adsorption. Biotechnol. Prog., 19: 1721.
23. Al-Qodah, Z., Ivanova, V., Dobreva, E., Penchev, I., Hristov, J., and Petrov, R.(1991) Non-porous magnetic support for cell immobilization. J. Ferment.Bioeng., 71: 114.
24. Deshpande, P.A. and Shonnnard, D.R. (2000) An improved spectrophotometricmethods to study the transport, attachment, and breakthrough of bacteriathrough porous media. Applied and Environmental Microbiol., 66: 763.
25. Hristov, J.H. (1999) Comments on gas fluidized magnetizable beds in a magneticfield, part 2: Magnetization last mode and relevant phenomena. Thermal Science,2: 15.
26. Ding, Y. and Sun, Y. (2005) Small-sized dense magnetic pellicular support formagnetically stabilized fluidized bed adsorption. Chem. Eng. Sci., 60: 917.
Z. Al-Qodah and M. Al-Shannag438