Magnetic and Geoelectric characteristics of East Rosetta sand placer deposits, Egypt
16
Geologic Resources in the Arab World Conference, 24-29 Feb., 2007, Cairo University 1 Magnetic and Geoelectric characteristics of East Rosetta sand placer deposits, Egypt Ahmed A. Ammar*, Mohamed A. Elsadek* Abbas M. Sharaky**, Ahmed N. Shahein**, and Sayed A. Elkhateeb* *Exploration Division, Nuclear Materials Authority, Cairo, Egypt **Department of Natural Resources, Institute of African Research and Studies, Cairo University, Giza 12613, Egypt ABSTRACT The black-sand beach deposits are known for many decades of years as a source of strategic and economic heavy minerals. The present study deals with the analysis and interpretation of the results of field geophysical survey and laboratory geophysical measurements conducted on Koam Mashaal area, east Rosetta Mediterranean Sea coast Egypt. These include field measurements of total magnetic- field intensity and laboratory geoelectric measurements including resistivity and chargeability. The analysis and interpretation of the field and laboratory magnetic and geoelectric maps demonstrated that the studied black-sand beach deposits of Koam Mashaal area can be subdivided according to their geophysical response into three main zones striking nearly parallel to the shoreline of the Mediterranean Sea. The deep-seated magnetic response was interpreted at an average depth of 239.6 m. Meanwhile, the near-surface magnetic responses were interpreted at average depths of 9.1, 57.9 and 81.8 m, respectively. 1. INTRODUCTION 1.1. General The black-sand beach deposits are known for many decades of years as a source of strategic and economic heavy minerals that are considered as raw materials for nuclear energy. Besides, they are considered of thorough importance in many of the metallurgical and engineering industries. The mineralogical analyses identified six main minerals accompanied by some other minor ones. According to their relative frequencies and economic importance, the six main minerals are: ilmenite, magnetite, zircon, monazite, garnet and rutile. Traces of cassiterite and gold as well as some rare earth minerals are also present.
Transcript of Magnetic and Geoelectric characteristics of East Rosetta sand placer deposits, Egypt

Geologic Resources in the Arab World Conference, 24-29 Feb., 2007, Cairo University
1
Magnetic and Geoelectric characteristics of East Rosetta sand placer deposits, Egypt
Ahmed A. Ammar*, Mohamed A. Elsadek* Abbas M. Sharaky**, Ahmed N. Shahein**,
and Sayed A. Elkhateeb* *Exploration Division, Nuclear Materials Authority, Cairo, Egypt
**Department of Natural Resources, Institute of African Research and Studies, Cairo University, Giza 12613, Egypt
ABSTRACT
The black-sand beach deposits are known for many decades of years as a source
of strategic and economic heavy minerals. The present study deals with the analysis
and interpretation of the results of field geophysical survey and laboratory
geophysical measurements conducted on Koam Mashaal area, east Rosetta
Mediterranean Sea coast Egypt. These include field measurements of total magnetic-
field intensity and laboratory geoelectric measurements including resistivity and
chargeability.
The analysis and interpretation of the field and laboratory magnetic and
geoelectric maps demonstrated that the studied black-sand beach deposits of Koam
Mashaal area can be subdivided according to their geophysical response into three
main zones striking nearly parallel to the shoreline of the Mediterranean Sea. The
deep-seated magnetic response was interpreted at an average depth of 239.6 m.
Meanwhile, the near-surface magnetic responses were interpreted at average depths of
9.1, 57.9 and 81.8 m, respectively.
1. INTRODUCTION
1.1. General
The black-sand beach deposits are known for many decades of years as a source
of strategic and economic heavy minerals that are considered as raw materials for
nuclear energy. Besides, they are considered of thorough importance in many of the
metallurgical and engineering industries. The mineralogical analyses identified six
main minerals accompanied by some other minor ones. According to their relative
frequencies and economic importance, the six main minerals are: ilmenite, magnetite,
zircon, monazite, garnet and rutile. Traces of cassiterite and gold as well as some rare
earth minerals are also present.

Geologic Resources in the Arab World Conference, 24-29 Feb., 2007, Cairo University
2
The main objectives of the present study are:
1) Evaluation of surface extensions of the black-sand beach deposits in the Koam
Mashaal area, using ground total magnetic survey, and laboratory geoelectric
measurements.
2) Mapping the spatial distribution patterns of the heavy mineral concentrations in the
study area.
3) Identifying various depositional phases
4) delineation of the subsurface (shallow and deep-seated) magnetic sources.
1.2. LOCATION OF THE STUDY AREA
Koam Mashaal area lies on the coastal plain of the Mediterranean Sea, 15 km to
the east of Rosetta mouth of the River Nile, Egypt (Fig. 1). It is located between
longitudes 30 32′ 10″ E and 30 34′ 08″ E and latitudes 31 26′ 59″ N and
31 27 ′ 59″ N). The study area extends for about 3.0 km along the coast, 1.8 km.
inland and forms 5.4 km2 in surface area that is mostly covered by beach sands.
Cairo
Location of study area
Figure 1. Part of northern Egypt showing location of the study area, Koam Mashaal, east Rosetta,
Mediterranean Sea coast.
1.3. Geology
Black sand deposits in the northern Nile Delta, especially in Koam Mashaal area
have received the attention of several researchers since early 20th century. The most
recent researches carried out on the black sands include Elhadary (1998), Abu-Diab
(2001), Abdelhady et al. (2002), Elsadek and Elkhateeb (2002), Abdelhady et al.
(2004), Mahmoud et al. (2004), Bakheit (2004) and Elkhateeb (2005) . The black-sand
deposit east Rosetta has high mineral productivity. These minerals could be easily

Geologic Resources in the Arab World Conference, 24-29 Feb., 2007, Cairo University
3
mined. Alaskary and Freihy (1986) identified three depositional phases in the upper
30 m at Rosetta and Damietta promontories. These are from base to top: transgression,
regression and erosional transgression phases. The beach is generally flat in the
Rosetta area where seawater crosses the beach during winter stormy conditions and
high tide periods (Elhadary, 1988).
2. METHODOLOGY
2.1. SURVAY PROCEDURE AND SAMPLING
The ground magnetic survey was conducted along a set of equally-spaced (100 m)
parallel traverses oriented N-S, a direction which is perpendicular to the general
extension of the Mediterranean Sea coast in the area. The general strike of the
lithological units in the study area was determined according to the general elongation
of the black-sand lenses, occurring along the Mediterranean Sea coast, which
approximately extends in an E-W direction. Magnetic measurements were made at
regular intervals of 10 m. The survey data were tied along one tie line perpendicular
to the direction of the survey traverses. A base station (reference point), far from
artificial magnetic disturbances within the surveyed area, was chosen. The total
magnetic-intensity measurements, collected at the survey stations, were regarded as
positive or negative deviations from that at the reference point. The ground raw
magnetic survey measurements in Koam Mashaal area were magnetic data, since the
surveyed area is characterized by smooth terrain and the elevation differences
between the survey stations are not significant. The geomagnetic correction was
calculated at the central point of the study area, where IGRF equals 43,519.12 nT,
inclination angle equals 45.89○, declination angle equals 2.78○ at a latitude of 31.46○N
and a longitude of 30.55○E and the date was Oct. 30, 2001 (GM. SYS. Program,
1997). The IGRF value was subtracted from the readings of the whole survey stations.
The survey data were transformed from the field magnetometer to a desk top
computer, where data reduction was performed using a set of computer programs
(Microsoft Excel, MDA1-Ver.1.97 and MDA2-Ver.1.97).
A 12-channal Global Positioning System (GPS) instrument was used to set up the
survey grid with a Universal Transverse Mercator (UTM) coordinate system, using
World Grid (WG84) as datum. All samples were put in plastic bags and labelled by
their UTM positions.
The laboratory geoelectric (resistivity and chargeability) measurements were
applied to 966 quartered samples taken from large samples collected at depths up to
Geologic Resources in the Arab World Conference, 24-29 Feb., 2007, Cairo University
4
50 cm. The large samples were taken along 32 equally-spaced (100 m apart) profiles,
at equally-spaced (50 m apart) stations. These profiles were oriented in a N-S
direction covering an area reaching about 5.4 km2. The samples were taken by
bushing a rigid plastic tube, with a diameter of 5 cm and a length of 70 cm till 50 cm
mark on the tube, in the ground. The collected samples were quartered by John's
splitter.
2.2. INSTRUMENTATION
2.2.1. Total Magnetic Field Instruments
The total magnetic field intensity measurements were performed using a portable
proton-precession magnetometer, model PMG-1, Geofyzika Brno, Czeck Republic,
having a sensitivity of 0.1 nT and a measuring range from 25,000 to 100,000 nT.
(PMG-1 Manual, 1997).
Another magnetometer of the same type has been used as a base station for
automatic monitoring and recording of diurnal variations in the Earth’s magnetic
field. The measuring time was set for one minute at the base station as a matter of
diurnal variation and storage capacity of the instrument.
2.2.2. Geoelectric Instruments
The used IP-L system is a sample resistivity and IP testing system, manufactured
by IRIS Instruments, France. It has been designed to measure the electric resistivity
and induced polarization (IP) parameters on rock samples or drill-hole cores. It
consists of three units: a sample holder frame, an IP-L low power time domain
transmitter, and an ELREC-2 as a time-domain IP receiver (IRIS Instruments, 1993).
The sample holder was modified to be compatible with friable sand samples. The
new holder is a rigid plastic tube, with a plastic piston to compress the friable sand.
This plastic tube possesses four minute holes at equal distances (4 cm) as a Wenner
array and four electrode terminals for connecting the electric current. The two current
electrodes are connected to the external holes and the two potential electrodes to the
central holes.
3. INTERPRETATION OF THE GROUND MAGNETIC SURVEY DATA
3.1. General
The intensity of magnetization of a rock is largely dependent upon the amount,
size, shape and distribution of its content of ferromagnetic minerals, that usually
represent only a small proportion of its mineralogic composition. Much qualitative
information may be derived from magnetic contour maps. Such qualitative
Geologic Resources in the Arab World Conference, 24-29 Feb., 2007, Cairo University
5
interpretation may be greatly facilitated by the use of digital image-processing
techniques similar to those used in the display of remotely-sensed data (Kearey and
Brooks, 1998).
The corrected ground magnetic data were subjected to various techniques of
analysis in order to get qualitative and quantitative parameters, which can describe
well the subsurface magnetic sources and consequently guide the exploratory drilling
for the buried heavy mineral lenses in the study area. These techniques involved the
application of spectral analysis and matched filtering.
In the present study, the analysis of ground magnetic survey data including
spectral frequency analysis and isolation of magnetic anomalies have been carried out
using the Magnetic Data Analysis (MDA2-Ver 1.97) software (Badokhon, 1998),
which is based on Filon Fourier Transform. This program designs the suitable filter
and separates the regional and residual components.
3.2. Total Magnetic-Field Intensity Map
The correlation between the magnetic features recorded on the total magnetic field
intensity contour map (Fig. 2) and the electric resestivity, IP chargeability and
calculated metal factor maps of the study area (Figs. 8, 9 and 10) was found to agree
to some extent. Due to the existence of magnetite and other magnetic minerals in the
black-sands on the surface and at very shallow depths, and near surface depth, the
magnetic response is mainly due to these sands. Therefore, the magnetic response is
chiefly, and for the most part, due to the black-sand beach and lenses dunes. On the
total magnetic field intensity contour map (Fig. 2), the magnetic high and low
responses are arranged parallel to the Mediterranean Sea shore and more or less in the
northwestern direction.
The magnetic field intensity registered over the area under consideration ranges
from 35 to 115 nT. It can be divided into two main zones: the first zone is located in
its northern part parallel to the Mediterranean Sea coast and the other is located in its
southern part. The northern part contains the expected major black-sand beach lens
and the Koam Mashaal old sand dunes. This part is mainly magnetically high, while
the southern part is mainly magnetically low.
3.3. Regional Magnetic-Field Intensity Map
Frequencies of magnetic anomalies could reveal the depths of their magnetic
sources. The regional magnetic intensity contour map (Fig. 3) represents the relatively
deep-seated magnetic response of the black-sand beach and dune deposits, at an

Geologic Resources in the Arab World Conference, 24-29 Feb., 2007, Cairo University
6
average depth of 239.6 m. This map shows that the Koam Mashaal area could be
divided into two main zones according to magnetic causative sources. The first zone,
located in the northern part of the study area, is characterized by high magnetic-
amplitude anomalies with low frequencies and long wavelengths, which refer to deep-
seated black-sand deposits in the form of lenses. It is also characterized by high to
very high magnetic response, ranging in amplitude from 76 to 88 nT. The second
zone, located in the southern part of the study area, is characterized by low, medium,
high and very high magnetic responses with higher frequencies and longer
wavelengths which may refer lesser depth values. They range intensity from 64 to
88 nT. The high and low magnetic areas within the second zone are arranged in
elongated shapes having two major trends in the NE- and NW- directions.
3.4. Residual Magnetic-Field Intensity Map
An important interpreting technique in geophysical exploration is residual
mapping, in which local anomalies are separated from regional ones. According to
Burger (1992), the definition of residual depends on the exploration target. Generally,
on the magnetic maps of local areas, the regional trend may show uniform variations
represented by parallel, evenly-spaced contours. A local anomaly, which ordinary
would be indicated by closed contours, appears as a "nose" on the regional anomaly
field (Sharma, 1976).
266000 m 266500 m 267000 m 267500 m 268000 m 268500 m 269000 m
3482
200
m34
8270
0 m
3483
200
m34
8370
0 m
0 250 500 750 1000 mUnsurveyed Area
35
45
55
65
75
85
95
30° 32' 15" E 30° 32' 45" E 30° 33' 15" E 30° 33' 45" E
31° 27' 45" N31° 27' 15" N
Figure 5: Filled gray-tone contour map of the total magnetic field intensity, Koam-Mashaal area, east Rosetta, Mediterranean Sea coast, Egypt. Contour interval = 5 nT.
nT
Figure 2: Filled gray-tone contour map of the total magnetic field intensity, Koam-Mashaal area, east Rosetta, Mediterranean Sea coast, Egypt. Contour interval = 5nT

Geologic Resources in the Arab World Conference, 24-29 Feb., 2007, Cairo University
7
266000 m 266500 m 267000 m 267500 m 268000 m 268500 m 269000 m
3482
200
m34
8270
0 m
3483
200
m34
8370
0 m
0 250 500 750 1000 mUnsurveyed Area
40
44
48
52
56
60
64
68
72
76
80
30° 32' 15" E 30° 32' 45" E 30° 33' 15" E 30° 33' 45" E
31° 27' 45" N31° 27' 15" N
Figure 6: Filled gray-tone contour map of the regional component of magnetic-field intensity, at an average depth (h) of 239.6 m, Koam-Mashaal area, east Rosetta, Mediterranean Sea coast, Egypt. Contour interval = 2 nT
nT
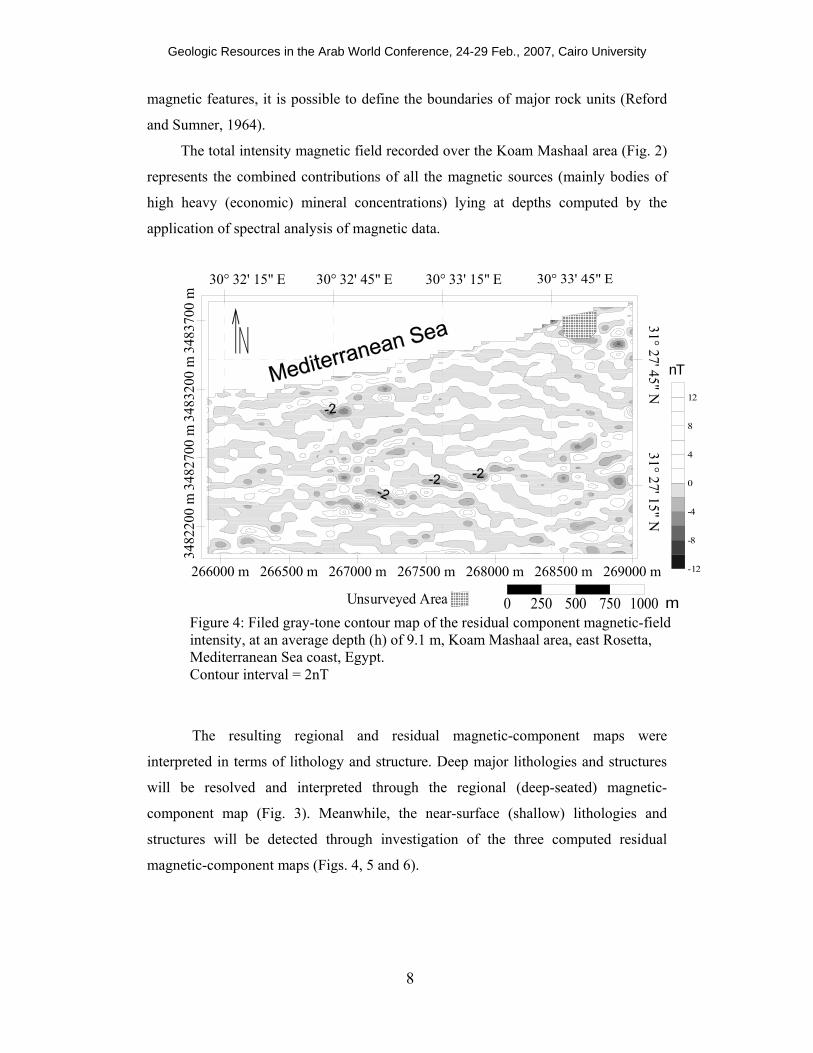
The residual magnetic intensity contour maps (Fig. 4, 5 and 6) represent the
near-surface magnetic responses of the black-sand deposits at average depths of 9.1,
57.9 and 81.8 m, respectively. The contour lines are either elongated parallel to the
Mediterranean Sea shore (i.e., ENE – WSW) or in the NW- and NE- directions,
representing the sedimentation and concentration agents of black-sands, either due to
wave or wind actions, respectively. Near the Mediterranean Sea coast, the contours
are elongated parallel to the coast, due to the dominance of wave action. Away from
the Sea shore, the influence of wind action increases and the contours take the
direction of the prevailing wind, following either the NW or the NE directions. The
great similarity between the three maps at the three computed near-surface depths
might be due to the continuity of sedimentation and concentration environments. The
magnetic intensity over these three residual magnetic component maps ranges from
-25 to 45 nT on the shallowest map (9.1 m), from -40 to 30 nT on the intermediate
one (57.9 m) and from -16 to 12 nT on the deepest one (81.8 m).
3.5. Depth Estimation of the Subsurface Magnetic Sources
The general object of ground magnetic interpretation is the delineation of buried
contacts, locations of probable areas of rock differentiation or mineralization. By
following bands of steep gradients across the magnetic maps and distinct types of
Figure 3: Filled gray-tone contour map of the regional component of magnetic-field intensity, at an average depth (h) of 239.6 m, Koam-Mashaal area, east Rosetta, Mediterranean Sea coast, Egypt. Contour interval = 2nT
Geologic Resources in the Arab World Conference, 24-29 Feb., 2007, Cairo University
8
magnetic features, it is possible to define the boundaries of major rock units (Reford
and Sumner, 1964).
The total intensity magnetic field recorded over the Koam Mashaal area (Fig. 2)
represents the combined contributions of all the magnetic sources (mainly bodies of
high heavy (economic) mineral concentrations) lying at depths computed by the
application of spectral analysis of magnetic data.
266000 m 266500 m 267000 m 267500 m 268000 m 268500 m 269000 m
3482
200
m34
8270
0 m
3483
200
m34
8370
0 m
0 250 500 750 1000 mUnsurveyed Area
-12
-8
-4
0
4
8
12
30° 32' 15" E 30° 32' 45" E 30° 33' 15" E 30° 33' 45" E
31° 27' 45" N31° 27' 15" N
Figure 7 A: Filled gray-tone contour map of the residual component magnetic-field intensity, at an average depth (h) of 9.1 m, Koam Mashaal area, east Rosetta, Mediterranean Sea coast, Egypt. Contour interval = 2 nT
nT
The resulting regional and residual magnetic-component maps were
interpreted in terms of lithology and structure. Deep major lithologies and structures
will be resolved and interpreted through the regional (deep-seated) magnetic-
component map (Fig. 3). Meanwhile, the near-surface (shallow) lithologies and
structures will be detected through investigation of the three computed residual
magnetic-component maps (Figs. 4, 5 and 6).
Figure 4: Filed gray-tone contour map of the residual component magnetic-field intensity, at an average depth (h) of 9.1 m, Koam Mashaal area, east Rosetta, Mediterranean Sea coast, Egypt. Contour interval = 2nT

Geologic Resources in the Arab World Conference, 24-29 Feb., 2007, Cairo University
9
266000 m 266500 m 267000 m 267500 m 268000 m 268500 m 269000 m
3482
200
m34
8270
0 m
3483
200
m34
8370
0 m
0 250 500 750 1000 mUnsurveyed Area
-12
-8
-4
0
4
8
12
30° 32' 15" E 30° 32' 45" E 30° 33' 15" E 30° 33' 45" E
31° 27' 45" N31° 27' 15" N
Figure 7 B: Filled gray-tone contour map of the residual component magnetic-field intensity, at an average depth (h) of 57.9 m, Koam Mashaal area, east Rosetta, Mediterranean Sea coast, Egypt. Contour interval = 2 nT
nT
266000 m 266500 m 267000 m 267500 m 268000 m 268500 m 269000 m
3482
200
m34
8270
0 m
3483
200
m34
8370
0 m
0 250 500 750 1000 mUnsurveyed Area
-18
-14
-10
-6
-2
2
6
10
14
30° 32' 15" E 30° 32' 45" E 30° 33' 15" E 30° 33' 45" E
31° 27' 45" N31° 27' 15" N
nT
Figure 7 C: Filled gray-tone contour map of the residual component magnetic-field intensity, at an average depth (h) of 81.8 m, Koam Mashaal area, east Rosetta, Mediterranean Sea coast, Egypt. Contour interval = 2 nT
Figure 5: Filed gray-tone contour map of the residual component magnetic-field intensity, at an average depth (h) of 57.9 m, Koam Mashaal area, east Rosetta, Mediterranean Sea coast, Egypt. Contour interval = 2nT
Figure 6: Filed gray-tone contour map of the residual component magnetic-field intensity, at an average depth (h) of 81.8 m, Koam Mashaal area, east Rosetta, Mediterranean Sea coast, Egypt.
Contour interval = 2nT

Geologic Resources in the Arab World Conference, 24-29 Feb., 2007, Cairo University
10
Review of the estimated depths values indicates that the magnetic signals in the
studied area originate from four average depth levels attaining 239.6 m, 81.8 m, 57.9
m and 9.1 m from the mean measuring surface. The ore bodies in the study area might
take the form of a series of thin lenses and thus, the average depths of burial could be
calculated to the top surface of these bodies. These average depths are denoted as h1,
h2, h3 and h4, respectively (Table 1).
Regarding the heavy mineral exploration in the investigated area, spectral
analysis of the ground magnetic survey data provided useful information about the
lateral changes in the depths to the bodies of high heavy (economic) mineral
concentrations within this zone (Table 1 and Fig. 7).
The interpreted depths (Fig. 7) might represent three shallow and one deep
sedimentation cycles of black-sand beach deposits. The near-surface (more recent)
cycle, with a depth (h4) is the more interesting horizon for its relatively small depth
(ranging from 7.8 m to 10.7 m.), which takes a big lens shape or a series of lenses.
The heavy mineral concentrations at the two other near-surface depths could be
checked and used later, due to their relatively depths (from 12.5 m to 118.5 m and
from 37.2 to 137.5 m, respectively). The residual magnetic intensity maps (Fig 4, 5
and 6) represent the most probable occurrence and distribution of the black-sand
deposits on and near the surface. The deepest calculated level (ranging from 174.7 m
to 334.4 m)) represents the more ancient cycle of sedimentation of black-sand beach
deposits. It wroths mention that the configuration of the Sea shore was really different
at that time. The comuted arithmetic mean values of four depths reach 239.6 m, 81.8
m, 57.9 m and 9.1 m, respectively.
Calculated Depths
050
100150200250300350400
265900 266400 266900 267400 267900 268400 268900
Destance, in m
Dep
th, i
n m
h 1 h2 h3 h4
Figure 7: The spatial subsurface configuration of the computed depth estimates to the magnetic sources, Koam Mashaal area, east Rosetta, Mediterranean Sea coast, Egypt.
E

Geologic Resources in the Arab World Conference, 24-29 Feb., 2007, Cairo University
11
Table 1: Summary of the depth levels as estimated from the application of spectral analysis technique to the individual magnetic survey profiles, Koam Mashaal area, east Rosetta, Mediterranean Sea Coast, Egypt
Depth (m) Depth (m) Profile
No. h1
(239.6) h2
(81.8) h3
(57.9) h4
(9.1)
Profile No h1
(239.6) h2
(81.8) h3
(57.9) h4
(9.1) 265900 174.7 63.6 50.5 9.6 267700 258.9 137.5 118.5 8.3
266000 195.8 82.2 71.6 7.8 267800 223.7 125.3 84.3 7.8
266100 203.4 37.2 29.6 10.4 267900 213.5 83.4 53.1 8.4
266200 198.3 44.5 12.5 9.3 268000 230.8 67.3 57.6 9.4
266300 191.0 122.1 69.4 10.2 268100 334.4 63.3 38.4 8.4
266400 215.3 75.3 44.4 9.3 268200 240.8 93.4 64.1 9.4
266500 242.2 107.6 61.3 9.4 268300 253.2 128.9 112.6 8.2
266600 206.3 86.3 53.1 9.8 268400 229.2 91.5 85.0 8.3
266700 221.9 45.2 20.9 10.7 268500 277.0 107.4 77.3 9.7
266800 250.9 68.0 31.1 8.7 268600 282.3 65.4 37.9 8.6
266900 254.7 50.4 19.7 9.1 268700 324.3 105.3 91.8 8.5
267000 243.8 100.8 67.1 10.1 268800 212.3 51.9 42.5 9.6
267100 229.4 49.2 27.5 9.5 268900 255.8 69.2 48.0 9.1
267200 238.1 44.9 30.7 9.1 269000 265.9 68.1 66.0 9.3
267300 232.0 68.4 46.9 10 Minimum 174.7 37.2 12.5 7.8
267400 244.4 108.4 88.9 8.6 Maximum 334.4 137.5 118.5 10.7
267500 260.3 80.7 70.2 8.3 Mean 239.6 81.8 57.9 9.1
267600 261.0 125.3 81.0 9.4Standard deviation
34.9 28.3 26.3 0.7
4. INTERPRETATION OF THE LABORATORY GEOELECTRIC
MEASUREMENTS
4.1. General
Electrical measurements are among the most difficult of all geophysical methods
to interpret quantitatively, because of the complex theoretical bases of the technique.
Electric IP quantitative interpretation is considerably more complex than the electric
resistivity method. Much electric IP interpretation is, however, only qualitative
(Kearey and Brooks, 1998).
Data of the measured and calculated electric resistivity and IP chargeability as
well as metal factor were finally displayed in the form of filled colour contour maps,
with a scale of 1:25,000 (Figs. 8, 9, and 10). The electric resistivity measurements
were found to range from 0.1 to 200 Ohm m. To avoid this wide variation and, hence,

Geologic Resources in the Arab World Conference, 24-29 Feb., 2007, Cairo University
12
the wide range of electric resistivity measurements, logarithmic, contours were
computed and drawn for both the electric resistivity and metal factor maps (Figs. 8
and 10).
4.2. Electric Resistivity Laboratory Measurements
The electric resistivity filled-colour contour map (Fig. 18) indicates the presence
of one prominent broad zone of low resistivity values, occupying major part of the
study area. This zone coincides quite well with the economic (heavy) mineral deposits
in the study area. A central high resistivity zone – parallel to the Mediterranean Sea
shore - separates this prominent low resistivity zone into two subzones. This central
zone takes the form of a narrow strip of an elongated shape, and shows very high
electric resistivity values more than 100 Ohm.m, especially in its eastern part, which
trends perpendicularly , i.e., in the NNW direction. This zone represents an old
excavated drainage channel as well as the western part of some old sand dunes. There
is also a relatively moderate to high electric resistivity zone delimiting the northern
part of the study area, running parallel to the Mediterranean Sea shore.
266000 m 266500 m 267000 m 267500 m 268000 m 268500 m 269000 m
3482
200
m34
8270
0 m
3483
200
m34
8370
0 m
0 250 500 750 1000
Ohm.m
munsurveyed area
-0.5
-0.3
-0.1
0.1
0.3
0.5
0.7
0.9
1.1
1.3
1.5
1.7
1.9
2.1
30° 32' 15" E 30° 32' 45" E 30° 33' 15" E 30° 33' 45" E
31° 27' 45" N31° 27' 15" N
Figure 18: Filled-colour contour map of the electric resistivity ( ) laboratory measurements, Koam-Mashaal area, east Rosetta, Mediterranean Sea coast, Egypt. logarethmic contour interval. = 0.1 Ohm.m

Geologic Resources in the Arab World Conference, 24-29 Feb., 2007, Cairo University
13
4.3. Electric (IP) Chargeability Laboratory Measurements
The electric IP chargeability filled gray-tone contour map (Fig. 9) indicates that
the low electric IP chargeability values agree well with the high electric resistivity
values at the narrow zone located in both the central and eastern parts of the study
area as well as its northern parts. The moderate and high electric IP chargeability
zones are also well agreeable with the moderate and low electric resistivity zones,
which are associated with the economic (heavy) mineral deposits.
Two relatively high electric IP chargeability zones can be distinguished at the
central northern and southern parts of the study area, with electric IP chargeability
values reaching more than 11 mV/ V and coincide well with the zones of very high
content of heavy minerals.
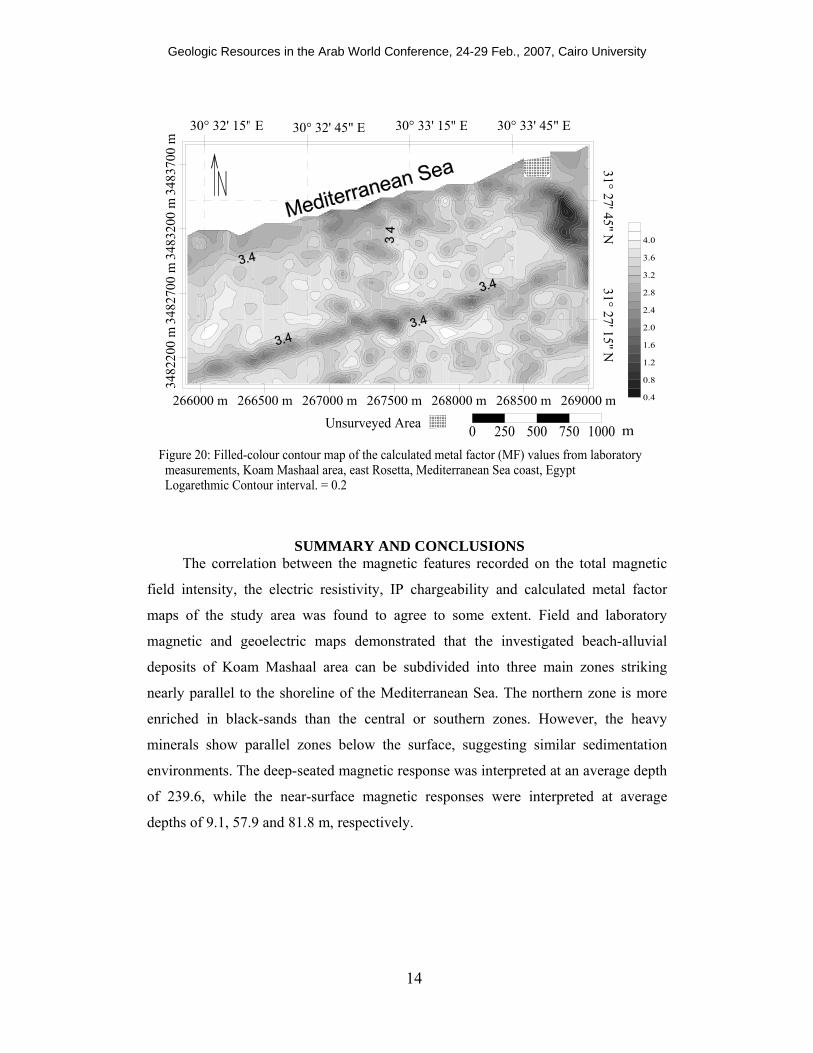
4.4. Calculated Metal Factor
The calculated metal factor filled-colour contour map (Fig. 10) indicates high
values that agree well with high electric IP chargeability and low electric resistivity
values. Moreover, the three figures (8, 9 and 10) show the same results and confirm
the existence of the anomalous zones that occur at the central, northern and southern
parts of the study area, which agree well with the zones of anomalous content of
heavy (economic) minerals.
266000 m 266500 m 267000 m 267500 m 268000 m 268500 m 269000 m
3482
200
m34
8270
0 m
3483
200
m34
8370
0 m
0 250 500 750 1000 mUnsurveyed Area
0
2
4
6
8
30° 32' 15" E 30° 32' 45" E 30° 33' 15" E 30° 33' 45" E
31° 27' 45" N31° 27' 15" N
Figure 19: Filled-colour contour map of the electric chargeability (M ) laboratory measurements. Koam Mashaal area, east Rosetta, Mediterranean Sea coast, Egypt Contour interval = 1 mV/V
mV/V
M
Geologic Resources in the Arab World Conference, 24-29 Feb., 2007, Cairo University
14
SUMMARY AND CONCLUSIONS The correlation between the magnetic features recorded on the total magnetic
field intensity, the electric resistivity, IP chargeability and calculated metal factor
maps of the study area was found to agree to some extent. Field and laboratory
magnetic and geoelectric maps demonstrated that the investigated beach-alluvial
deposits of Koam Mashaal area can be subdivided into three main zones striking
nearly parallel to the shoreline of the Mediterranean Sea. The northern zone is more
enriched in black-sands than the central or southern zones. However, the heavy
minerals show parallel zones below the surface, suggesting similar sedimentation
environments. The deep-seated magnetic response was interpreted at an average depth
of 239.6, while the near-surface magnetic responses were interpreted at average
depths of 9.1, 57.9 and 81.8 m, respectively.
266000 m 266500 m 267000 m 267500 m 268000 m 268500 m 269000 m
3482
200
m34
8270
0 m
3483
200
m34
8370
0 m
0 250 500 750 1000 mUnsurveyed Area
0.4
0.8
1.2
1.6
2.0
2.4
2.8
3.2
3.6
4.0
30° 32' 15" E 30° 32' 45" E 30° 33' 15" E 30° 33' 45" E
31° 27' 45" N31° 27' 15" N
Figure 20: Filled-colour contour map of the calculated metal factor (MF) values from laboratory measurements, Koam Mashaal area, east Rosetta, Mediterranean Sea coast, Egypt Logarethmic Contour interval. = 0.2

Geologic Resources in the Arab World Conference, 24-29 Feb., 2007, Cairo University
15
REFERENCES
Abdelhady, H. M., Hossny, A. A., Gharieb, A. G., Elsadek, M. A., Elkhateeb, S.
A., Abdelrazik, M. I., Eltarras M. M., and Mostafa, A. M. (2002): Analysis
and interpretation of the ground radiospectrometric and magnetic survey data of
the black-sand beach deposits of Abu Khashaba/Alburullus estuary, east Rosetta
area, Mediterranean Sea coast, Egypt. Internal Report Series, NMA-IRS-
4/2002, Nuclear Materials Authority, Cairo, Egypt, 29 p.
________________, Elsadek, M. A., Gharieb, A. G., Elkhateeb, S. A., Zaeimah,
M. A., and Gaafar, I. M., (2004): Analysis and interpretation of the ground
radiospectrometric and magnetic survey data of the black-sand beach deposits of
Abu Khashaba/Alburullus estuary, east Rosetta area, Mediterranean Sea coast,
Egypt. Final Stage, Internal Report, Nuclear Materials Authority, Cairo, Egypt
38 p.
Abu-Diab, A., A. (2001): Sedimentological studies and economic evaluation of the
coastal sand dunes between Elgadia and Idko, Rosetta, Egypt. M.Sc. Thesis, Fac. Sci., Mansuora Univ., Mansuora, Egypt 137p.
Alaskary, M. A. and Freihy, O. E. (1986): Depositional phases of Rosetta and
Damietta promontories on the Nile Delta coast., J. African Earth Sci., 5: pp.627- 633.
Badokhon, F. O. (1998): Geophysical exploration for oolitic iron deposit extensions
in the northern part of Wadi Ash-Shumaysi, Saudi Arabia. M. Sc. Thesis, King Abdulaziz University, Jeddah, Saudi Arabia, 276 P.
Bakheit, A.F. (2004): Mineralogy and concentration of economic heavy minerals,
northern Delta, Egypt. Ph.D. Thesis, Institute of African Research and Studies, Cairo University, Geiza, Egypt, 131 p.
Burger, H. R. (1992): Exploration geophysics of the shallow subsurface. Prentice
Hall International, Inc., London, UK, 489 p.
Elkhateeb S. A. (2005): Geophysical evaluation of some sand beach and alluvial deposits in northeastern Africa. Unpub. M.Sc. Thesis, institute of African research and studies, Cairo University, Giza, Egypt, 190 p.

Geologic Resources in the Arab World Conference, 24-29 Feb., 2007, Cairo University
16
Elsadek, M. A., and Elkhateeb S. A. (2002): Magnetic susceptibility of black-sand
beach deposits, Koam Mashaal area, east Rosetta, Egypt. Internal Report Series,
NMA-IRS-3/2002, Cairo, Egypt, 27 p.
GM. SYS. Program (1997): Definitive International Geomagnetic Reference Field.
Version 1.5, January 21, 1997, Computation Routines by Mike Gemperle and Rowland B. French, Interface by Pierre Doguin, Northwest Geophysical Associates Inc..
IRIS Instruments (1993): ELREC 2 Operating Manual, Revised. BRGM & OYO
Joint Venture, IRIS Instruments, Orleans, Cedex 2, France, 69 p. Kearey, P., and Brooks, M. (1998): An introduction to geophysical exploration.
Geoscience Texts, Second edition, Blackwell Science Ltd., London, UK, 254 p. Mahmoud, A. A., Moustafa, M. I., and Mahdy, A. I. (2004): Integrated geophysical
and mineralogical studies on the mineral sand deposits of Koam Mashaal beach,
east of Rosetta distributary, Egypt. Journal of Applied Geophysics, Vol. 3,
Egyption Society of Applied Petrophysics, Cairo, Egypt, pp.185-204.
Reford, M. S., and Sumner, J. S., (1964): Review article, Aeromagnetics. Vol. 29,
No. 4, pp. 482-516. Sharma, P. V. (1976): Geophysical methods in geology. Elsevier Scientific
Publishing Company, Amsterdam-Oxford-New York, 428 p.