
Madagascar field survey after the December 2004 Indian Ocean tsunami
21
Madagascar Field Survey after the December 2004 Indian Ocean Tsunami Emile A. Okal, a… Hermann M. Fritz, b… Ranto Raveloson, c… Garo Joelson, c… Petra Pančošková, a… and Gérard Rambolamanana c… The effects of the 26 December 2004 Indian Ocean tsunami on the island of Madagascar were surveyed in July and August of 2005. Runup and inundation were obtained at 52 sites, covering most of the eastern coast of the country, ranging from a maximum runup of 5.4 m in the south to locations where the tsunami was not observed by eyewitnesses present on the day of the event. The data set is characterized by significant heterogeneity, suggesting the importance of local factors in controlling runup. The report of a 50-m vessel breaking its moorings in the port of Toamasina several hours after the maximum visible activity of the wave underscores the complexity of harbor responses and the need to re-evaluate civil defense policies in port environments. Important factors are how the Malagasy population responded to the warning issued during the Nias earthquake, on 28 March 2005, and the hazard posed to Madagascar by possible future mega-earthquakes in south Sumatra. DOI: 10.1193/1.2202646 INTRODUCTION AND BACKGROUND This paper reports the findings of an International Tsunami Survey Team ITST that visited Madagascar in July and August of 2005, in order to map the effect of the 26 December 2004 Indian Ocean tsunami on the island. This disastrous event resulted in approximately 250,000 deaths and was the first tsunami involving casualties and cata- strophic destruction in the far field since the 1964 Alaska earthquake Synolakis et al. 2005. Its source, the Great Sumatra earthquake, featured the largest seismic moment in the last 40 years M 0 = 1.0 10 30 dyne-cm, surpassed only by the 1960 Chile earth- quake, and perhaps by the 1964 Alaska earthquake Stein and Okal 2005, Nettles et al. 2005. Although most of the devastation from the tsunami took place in the eastern part of the Indian Ocean Indonesia, Thailand, Sri Lanka, and India, its western shore was not spared, and substantial damage was wrought in Somalia, where about 300 deaths were reported Fritz and Borrero 2006, this issue. Even though the island country of Mada- gascar Figure 1 was little affected by the tsunami only one casualty was reported, and damage amounted to marginally flooded houses and an unspecified but low number of a Department of Geological Sciences, Northwestern University, Evanston, IL 60208 b School of Civil & Environmental Engineering, Georgia Institute ofTechnology, Savannah, GA 31407 c Institut & Observatoire Géophysique d’Antananarivo, Université d’Antananarivo, Boîte Postale 3843, 101- Antananarivo, Madagascar S263 Earthquake Spectra, Volume 22, No. S3, pages S263–S283, June 2006; © 2006, Earthquake Engineering Research Institute
Transcript of Madagascar field survey after the December 2004 Indian Ocean tsunami

Madagascar Field Survey after theDecember 2004 Indian Ocean Tsunami
Emile A. Okal,a… Hermann M. Fritz,b… Ranto Raveloson,c… Garo Joelson,c…Petra Pančošková,a… and Gérard Rambolamananac…
The effects of the 26 December 2004 Indian Ocean tsunami on the islandof Madagascar were surveyed in July and August of 2005. Runup andinundation were obtained at 52 sites, covering most of the eastern coast of thecountry, ranging from a maximum runup of 5.4 m in the south to locationswhere the tsunami was not observed by eyewitnesses present on the day of theevent. The data set is characterized by significant heterogeneity, suggesting theimportance of local factors in controlling runup. The report of a 50-m vesselbreaking its moorings in the port of Toamasina several hours after themaximum visible activity of the wave underscores the complexity of harborresponses and the need to re-evaluate civil defense policies in portenvironments. Important factors are how the Malagasy population respondedto the warning issued during the Nias earthquake, on 28 March 2005, and thehazard posed to Madagascar by possible future mega-earthquakes in southSumatra. �DOI: 10.1193/1.2202646�
INTRODUCTION AND BACKGROUND
This paper reports the findings of an International Tsunami Survey Team �ITST� thatvisited Madagascar in July and August of 2005, in order to map the effect of the 26December 2004 Indian Ocean tsunami on the island. This disastrous event resulted inapproximately 250,000 deaths and was the first tsunami involving casualties and cata-strophic destruction in the far field since the 1964 Alaska earthquake �Synolakis et al.2005�. Its source, the Great Sumatra earthquake, featured the largest seismic moment inthe last 40 years �M0=1.0�1030 dyne-cm�, surpassed only by the 1960 Chile earth-quake, and perhaps by the 1964 Alaska earthquake �Stein and Okal 2005, Nettles et al.2005�.
Although most of the devastation from the tsunami took place in the eastern part ofthe Indian Ocean �Indonesia, Thailand, Sri Lanka, and India�, its western shore was notspared, and substantial damage was wrought in Somalia, where about 300 deaths werereported �Fritz and Borrero 2006, this issue�. Even though the island country of Mada-gascar �Figure 1� was little affected by the tsunami �only one casualty was reported, anddamage amounted to marginally flooded houses and an unspecified but low number of
a� Department of Geological Sciences, Northwestern University, Evanston, IL 60208b� School of Civil & Environmental Engineering, Georgia Institute of Technology, Savannah, GA 31407c� Institut & Observatoire Géophysique d’Antananarivo, Université d’Antananarivo, Boîte Postale 3843, 101-Antananarivo, Madagascar
S263Earthquake Spectra, Volume 22, No. S3, pages S263–S283, June 2006; © 2006, Earthquake Engineering Research Institute

damaged or lost fishing boats�, it was deemed important to fully document and quantifyits effects in order to provide a full coverage by surveys around the entire Indian OceanBasin.
In particular, and because of the prima facie evidence of a strong variability betweenthe effects of the tsunami on such relatively close shores as Somalia and Madagascar, itis important to build a complete, homogeneous database of runup and inundation pa-rameters, which can serve as a benchmark for simulation models aimed at understandingthe distal or local parameters controlling the development and amplification of waves atthe beach.
In addition, we regard as particularly important the examination of the response ofthe Madagascar shoreline to an incident tsunami, and the assessment of the population’sawareness of tsunami risk, in view of the possibility of future mega-earthquakes in theIndian Ocean Basin. Specifically, it has been shown that stress release during large earth-quakes can modify the Coulomb stresses in neighboring regions, to the extent that it canbring adjoining fault segments to rupture. This concept, known as “stress transfer” �e.g.,Harris 1998�, has been most spectacularly illustrated along the North Anatolian fault inTurkey, where a group of damaging earthquakes has followed a stepwise westward pro-gression from Erzincan in 1939 to Izmit in 1999 �Stein et al. 1997, Harris et al. 2002�,with a devastating event widely expected under the Sea of Marmara in the next years or
Figure 1. Madagascar and the surrounding region. The stars show, from north to south, thecentroid of the 26 December 2004 earthquake, the centroid of the 28 March 2005 earthquake,and the epicenter of the 1833 mega-earthquake along the southern coast of Sumatra �Zachari-asen et al. 1999�, which could be a model for a future tsunamigenic earthquake threateningMadagascar. The letters S, O, and RMR identify the areas of companion field surveys in So-malia �Fritz and Borrero 2006, this issue�, Oman �Okal et al. 2006b, this issue�, and the Mas-carene Islands of Réunion, Mauritius, and Rodrigues �Okal et al. 2006a, this issue�.
S264 E. A. OKAL, H. M. FRITZ, R. RAVELOSON, G. JOELSON, P. PANCOŠKOVÁ, AND G. RAMBOLAMANANA

decades �Yalçıner et al. 2002�. Within weeks of the 26 December earthquake, McClos-key et al. �2005� argued that stress transfer could trigger a large earthquake immediatelyto the southeast of the 26 December rupture zone. Indeed, such an event occurred on 28March 2005 �Figure 1�, and its size �M0=1.15�1029 dyne-cm� would have made it thelargest earthquake since 1965, if not for the 26 December shock. Its rupture area hasgenerally been described as equivalent to that of the large 1861 event in the same area.Although the 28 March earthquake did not generate an observable tsunami in the farfield, its rupture has presumably modified the regional Coulomb stresses, to the extentthat a large earthquake could now be expected along the next segment of the subductionzone further to the southeast �Nalbant et al. 2005�. This was the site of a mega-event in1833 �Figure 1�, recently quantified by Zachariasen et al. �1999� through the study ofuplifted coral reefs on the islands fringing the central Sumatran coast. They estimated itsmoment at M0�8�1029 dyne-cm or Mw=9.2, i.e., essentially in the same league as the26 December event. If we assume that the future earthquake in southern Sumatra wouldreach a comparable size, then it would have the potential to create a lethal transoceanictsunami. In their classic study of the interference patterns of far-field tsunamis due to thefiniteness of earthquake sources, Ben-Menahem and Rosenman �1972� justified a maxi-mum lobe of directivity in the direction perpendicular to fault rupture, which in this par-ticular case would put the southwestern Indian Ocean Basin—including Madagascar �ly-ing only 14° from that direction�, Rodrigues, and Réunion—in a zone of increased risk.This further warrants a close examination of the effect of the 26 December event on therelevant coasts.
In this context, surveys were carried out in March 2005 on the Mascarene Islands ofRodrigues, Mauritius, and Réunion and in July and August 2005 on Madagascar and inOman. The present paper reports on the Madagascar survey, and companion paperscover the Mascarenes and Oman �Okal et al. 2006a, this issue; Okal et al. 2006b, thisissue�.
LOGISTICS AND METHODOLOGY
After the team assembled on 25 July 2005 at the University Observatory in Antanan-arivo, it was decided to split the team into two groups working independently, in order tocover the maximum distance along the shoreline. The northern group, consisting ofOkal, Raveloson, and Pančošková, worked between Vohemar and Manahoro, while thesouthern group, consisting of Fritz and Joelson, worked between Mananjary and Betanty�Figure 2�. The team traveled along the shoreline by 4WD vehicles and thus was limitedto coastal sections that were readily accessible by road. This limitation explains the gapsin coverage evident in Figure 2, reflecting either the absence of roads �around MasoalaPeninsula �M� in the north�, or their unimproved character, which prevented travel withinthe time constraints of the survey �e.g., along the Manahoro-Mananjary gap, between thenorthern and southern segments�.
The team used the traditional ITST procedures to map the penetration of tsunamis inthe far field, as described by Synolakis and Okal �2005�. In the present situation, werelied primarily on the identification and interviewing of eyewitnesses, and on the re-cording of their testimony, followed by topographic measurements based on their de-
MADAGASCAR FIELD SURVEY AFTER THE DECEMBER 2004 INDIAN OCEAN TSUNAMI S265

scriptions. On a few occasions, we also identified permanent marks of the tsunami ac-tion, such as watermarks on buildings �Site 46�, scouring and erosion of a road �Site 6�,or algae deposits �Sites 32 and 33�. In this context, we recall the following definitions:
• Inundation is the measure of the maximum extent of horizontal penetration of thewave.
• Flow depth is the measure of the altitude, relative to unperturbed sea level, of thecrest of the wave at a location close to the beach.
• Runup is the measure of the altitude, relative to unperturbed sea level, of thepoint of maximum inland penetration of the wave, where inundation �as definedabove� is, in principle, measured.
Figure 2. Maximum runup or flow depth values �in meters� surveyed at various localities inMadagascar. The light-colored triangle denotes the city of Nosy Varika, which we recommendfor a complementary survey to close the gap between the two groups of data; it also separatesthe regions covered by the northern and southern ITST groups. The letter M identifies the Ma-soala Peninsula, bounded by the Bay of Antongil.
S266 E. A. OKAL, H. M. FRITZ, R. RAVELOSON, G. JOELSON, P. PANCOŠKOVÁ, AND G. RAMBOLAMANANA

Flow depth and runup were measured by using surveying rods and a combination oflaser and eye levels; inundation was measured by differential GPS. The exact dates andtimes of individual surveys were recorded for subsequent tidal corrections, to allow flowdepth and runup measurements to be related to sea level at the time of the tsunami ar-rival. Preliminary computations using the web site of the French Service Hy-drographique et Océanographique de la Marine �www.shom.fr� indicate a tidal range ofonly 10 cm in the south �Tolagnaro�, 50 cm in Toamasina, and 1.1 m in the north �Vo-hemar�. Thus tidal corrections would be expected to be minimal. To our knowledge,there exists no maregraph record of the Indian Ocean tsunami in Madagascar.
RESULTS
Table 1 gives the full data set gathered during the survey. Fifty-two measurementswere retained, principally runup values obtained from eyewitness reports. The map inFigure 2 summarizes the data set. In order to streamline the presentation, it features foreach locality the maximum vertical penetration �flow depth or runup, in meters� amongsites in its immediate vicinity.
PRINCIPAL CHARACTERISTICS
The maximum heights compiled in Table 1 and plotted in Figure 2 are typically onthe order of 2–4 m, reaching a maximum of 5.4 m at Betanty. Thus they are comparableto those reported further east on Réunion and Rodrigues islands �Okal et al. 2006a, thisissue� but remain significantly smaller than the 5–9 m surveyed along the coast of So-malia �Fritz and Borrero 2006, this issue�, where systematic structural damage was in-flicted on ports and buildings, a level of destruction that was not reported in Madagascar.Similarly, only one drowning was reported in Madagascar, as opposed to about 300 tsu-nami casualties in Somalia.
Surveyed values feature a large lateral variability along the coast. In practice, onecan outline a general trend, with large runup values regrouped at the extremities of thesurveyed area, i.e., in the vicinity of Tolagnaro �about 4 m� and north of Sambava �about3.5 m�, with significantly lower values in the central region. Because the nature of thebeaches in the various regions varies widely and cannot be directly correlated with theabove trends, it is probable that this variability expresses a combination of generationand propagation effects, as suggested by an early simulation of the tsunami �Titov 2005�,which does show enhanced amplitudes at the northern and southern extremities ofMadagascar.
The physical properties of the waves described to the ITST by eyewitnesses, and thearrival times of the waves, feature fluctuations that are typical of ITST campaigns. Aconsensus among eyewitnesses indicates that they were alerted to the tsunami by an ini-tial recess of the sea, over distances difficult to quantify, but generally interpreted asreaching or exceeding 100 m. It is suggested that this depression may have been pre-ceded by a small positive wave, too weak to have been universally observed, which
MADAGASCAR FIELD SURVEY AFTER THE DECEMBER 2004 INDIAN OCEAN TSUNAMI S267

Tab
le1.
Dat
ase
tga
ther
edby
the
ITS
Tin
Mad
agas
car,
July
–Aug
ust
2005
Num
ber
Sit
eL
atit
ude
�°N
�L
ongi
tude
�°E
�
Ver
tica
lsu
rvey
Inun
dati
onD
ate
and
tim
esu
rvey
ed
Not
es�m
�N
atur
ea�m
�D
ate
GM
T
Nor
ther
nTe
am1a
Am
ding
ozab
e−
15.0
6193
50.3
5913
1.65
F10
228
Jul
2005
07:1
1C
rate
insi
desh
op1b
Am
ding
ozab
e−
15.0
6193
50.3
5913
1.14
R13
628
Jul2
005
07:1
1R
unup
tofr
onto
fch
urch
2A
mbo
diha
mpa
na−
15.0
8158
50.3
7212
2.52
R80
28Ju
l200
507
:50
Top
ofst
ilta
thou
se3
Ant
alah
a−
14.9
0050
50.2
8227
2.10
F28
Jul2
005
10:5
5F
low
dept
hat
pier
onpo
rt4
Ant
alah
a−
14.9
0037
50.2
8148
2.30
R28
28Ju
l200
511
:09
Palm
tree
onbe
ach
oppo
site
hote
l5
Am
paha
na−
14.7
6483
50.2
2443
2.53
R50
28Ju
l200
512
:25
Run
upon
beac
hne
xtto
infi
rmar
y6
Sam
bava
−14
.269
9050
.181
631.
77R
7129
Jul2
005
08:5
0E
rode
dro
ad,A
mpa
ndro
zona
naB
each
7S
amba
va−
14.2
7062
50.1
8073
1.91
R30
29Ju
l200
509
:00
Sun
kca
rlo
cati
on,
Am
pand
rozo
nana
Bea
ch8
Voh
emar
−13
.353
3550
.007
871.
60R
1029
Jul2
005
13:0
7B
each
atpo
rtca
ptai
n’s
offi
ce9
Voh
emar
−13
.357
6550
.003
571.
48R
929
Jul2
005
13:3
2W
este
ndof
beac
h—fi
sher
man
10V
ohem
ar−
13.3
5360
50.0
1563
3.19
R24
29Ju
l200
514
:10
Loc
alre
side
ntat
Hia
ram
abaz
ana
Bea
ch11
*Ta
nam
bao-
Dao
ud−
13.9
250
.135
2.50
R30
Jul2
005
* Ext
rapo
late
des
tim
ate
atM
onor
okel
yB
each
12B
enar
evik
a−
14.1
1560
50.1
5953
3.51
R29
30Ju
l200
513
:56
Bet
avda
Pla
ntat
ion
Bea
ch13
Man
ahor
o−
19.9
0248
48.8
1275
Nil
1A
ug20
05Fo
urw
itne
sses
14V
atom
andr
y−
19.3
1948
.986
Nil
1A
ug20
05S
ever
alw
itne
sses
onbe
ach
15A
mbi
la−
18.8
4417
49.1
5388
2.35
R30
2A
ug20
0509
:18
Bea
chin
fron
tof
hote
l16
Toam
asin
a−
18.1
5672
49.4
2477
0.90
F3
Aug
2005
06:3
0M
ark
onti
real
ong
wha
rfin
port
17To
amas
ina
−18
.157
6849
.422
770.
78R
553
Aug
2005
07:4
0R
unup
onbe
ach
acro
ssfr
ompo
rt18
Mah
avel
ona
�Fou
lPoi
nte�
−17
.690
1749
.519
950.
77R
133
Aug
2005
10:1
5S
outh
beac
h,ac
ross
from
reef
19M
ahav
elon
a�F
oulP
oint
e�−
17.6
8528
49.5
1823
0.72
R13
3A
ug20
0510
:35
Cen
tral
beac
h,ac
ross
from
reef
S268 E. A. OKAL, H. M. FRITZ, R. RAVELOSON, G. JOELSON, P. PANCOŠKOVÁ, AND G. RAMBOLAMANANA

Tab
le1.
�con
t.�
Num
ber
Sit
eL
atit
ude
�°N
�L
ongi
tude
�°E
�
Ver
tica
lsu
rvey
Inun
dati
onD
ate
and
tim
esu
rvey
ed
Not
es�m
�N
atur
ea�m
�D
ate
GM
T
20M
ahav
elon
a�F
oulP
oint
e�−
17.6
7457
49.5
1608
0.79
R4
3A
ug20
0511
:01
Nor
thbe
ach,
beyo
ndre
efen
d
21M
aham
bo−
17.4
7523
49.4
6362
1.17
R7
3A
ug20
0512
:02
Bun
galo
wat
Hot
elL
eR
éif
22a
Soa
nier
ana-
Ivon
go−
16.9
1903
49.5
8707
2.23
F20
4A
ug20
0505
:47
Flo
wde
pth
atho
use
onbe
ach
22b
Soa
nier
ana-
Ivon
go−
16.9
1903
49.5
8707
2.00
R46
4A
ug20
0505
:47
Run
upbe
hind
hous
e23
Soa
nier
ana-
Ivon
go−
16.9
2005
49.5
8700
1.30
R12
4A
ug20
0506
:00
Run
upat
stum
pon
beac
h24
Man
akat
afan
a−
17.0
6165
49.5
2432
1.92
R22
4A
ug20
0506
:40
Run
upat
beac
hne
arro
adsi
desh
op25
Feno
ariv
o�F
énér
ive�
−17
.380
9349
.415
232.
50R
64
Aug
2005
07:4
4B
each
acro
ssfr
omto
wn
squa
re
Sou
ther
nTe
am26
Tola
gnar
o−
25.0
2695
46.9
9611
2.90
R75
26Ju
l200
513
:17
Tri
mli
neon
clif
fin
side
port
—ey
ewit
ness
confi
rmed
27To
lagn
aro
−25
.036
2746
.992
602.
00R
726
Jul2
005
13:5
5T
rim
line
ingr
ass—
eyew
itne
ssco
nfirm
ed28
Man
afiaf
y�S
aint
eL
uce�
−24
.776
5047
.199
873.
10R
3427
Jul2
005
05:0
9E
yew
itne
ss—
site
of12
-yea
r-ol
dfa
tali
ty29
Ank
aram
any
−24
.433
1747
.306
772.
70R
3527
Jul2
005
09:0
6E
yew
itne
ss30
Am
pasi
mas
ay−
24.3
2108
47.3
4549
3.20
R29
27Ju
l200
511
:04
Eye
wit
ness
31B
etan
ty−
25.5
6941
45.5
3209
4.40
R34
28Ju
l200
513
:38
Eye
wit
ness
32B
etan
ty−
25.5
6817
45.5
3433
2.30
R30
28Ju
l200
514
:15
Alg
ae—
eyew
itne
ssco
nfirm
ed33
Bet
anty
−25
.565
0845
.538
814.
80R
3728
Jul2
005
14:2
7A
lgae
—ey
ewit
ness
confi
rmed
34B
etan
ty−
25.5
6952
45.5
3097
5.40
R28
29Ju
l200
504
:30
Eye
wit
ness
35B
eani
ky−
25.2
7869
46.0
6108
2.90
R19
29Ju
l200
508
:48
Eye
wit
ness
36To
lagn
aro
−25
.038
7846
.995
584.
10R
2630
Jul2
005
05:4
0E
yew
itne
ss37
Tola
gnar
o−
25.0
3487
46.9
8299
2.20
R44
30Ju
l200
506
:08
Eye
wit
ness
MADAGASCAR FIELD SURVEY AFTER THE DECEMBER 2004 INDIAN OCEAN TSUNAMI S269

Tab
le1.
�con
t.�
Num
ber
Sit
eL
atit
ude
�°N
�L
ongi
tude
�°E
�
Ver
tica
lsu
rvey
Inun
dati
onD
ate
and
tim
esu
rvey
ed
Not
es�m
�N
atur
ea�m
�D
ate
GM
T
38a
Man
anja
ry−
21.2
4501
48.3
4824
2.20
F28
1A
ug20
0505
:22
Dun
eov
erto
pped
38b
Man
anja
ry−
21.2
4501
48.3
4824
1.00
R68
1A
ug20
0505
:22
Run
upat
inun
dati
onli
mit
39a
Man
anja
ry−
21.2
6137
48.3
4547
2.20
R43
1A
ug20
0506
:14
Eye
wit
ness
—1s
twav
e39
bM
anan
jary
−21
.261
3748
.345
472.
40R
431
Aug
2005
06:1
4E
yew
itne
ss—
2nd
wav
e40
Man
anja
ry−
21.2
2907
48.3
5131
2.40
R21
1A
ug20
0507
:17
Eye
wit
ness
41M
anak
ara
Nor
th−
22.1
3989
48.0
2431
2.30
R43
1A
ug20
0513
:21
Nor
thof
rive
r;ey
ewit
ness
42M
anak
ara
Be
−22
.149
4248
.022
024.
20R
611
Aug
2005
14:1
6E
yew
itne
ss43
Man
akar
aB
e−
22.1
6200
48.0
1556
3.50
R59
1A
ug20
0514
:44
Eye
wit
ness
44Fa
rafa
ngan
a−
22.8
1895
47.8
3588
1.60
R32
2A
ug20
0508
:52
Inla
goon
—ey
ewit
ness
45Fa
rafa
ngan
a−
22.8
0939
47.8
3716
2.40
F25
2A
ug20
0509
:36
Dun
eov
erto
pped
46M
anak
ara
Be
−22
.143
6248
.024
301.
50F
382
Aug
2005
14:2
5W
allo
fbu
ngal
ow—
eyew
itne
ssan
dvi
deo
confi
rmed
47M
anak
ara
Be
−22
.145
1548
.023
954.
00R
303
Aug
2005
06:0
3Po
olw
all—
eyew
itne
ssan
dvi
deo
confi
rmed
48M
anak
ara
Be
−22
.147
1848
.023
093.
50R
343
Aug
2005
06:1
2Pa
lmtr
ee—
vide
oco
nfirm
ed49
aM
anak
ara
Be
−22
.143
4448
.022
862.
00F
103
Aug
2005
06:5
1W
ater
line
onho
use—
vide
oco
nfirm
ed49
bM
anak
ara
Be
−22
.143
4448
.022
861.
50F
213
Aug
2005
06:5
1R
unup
atex
tent
ofin
unda
tion
50M
anak
ara
Port
−22
.141
2648
.020
571.
60F
3A
ug20
0507
:16
Qua
yw
all—
boat
cutl
oose
51M
anak
ara
Be
�22
.146
3148
.023
243.
80R
583
Aug
2005
11:0
5R
oad
hole
due
toer
osio
n52
Man
akar
aN
orth
−22
.033
5248
.071
162.
10R
253
Aug
2005
12:0
712
kmno
rth
ofM
anak
ara—
eyew
itne
ss
aF
=fl
owde
pth,
R=
runu
p
S270 E. A. OKAL, H. M. FRITZ, R. RAVELOSON, G. JOELSON, P. PANCOŠKOVÁ, AND G. RAMBOLAMANANA

would be in agreement with results obtained from global simulations �e.g., Titov 2005�.This was followed by a series of positive waves �typically three or more�, of which thesecond was generally described as the largest.
Temporal estimates �the time of arrival and the period of the waves� are traditionallyamong the least precise kinds of information obtained from eyewitnesses; however, mostdescriptions indicate a phenomenon starting around noon, local time �09:00 UTC�, andlasting the whole day �with dusk falling at about 19:30 at that time of the year�. Givenepicentral distances varying from 5,300 km in Vohemar to 6,200 km in Betanty, and tak-ing into account the variable depth of the Indian Ocean Basin, travel times are expectedto be 8–8.5 hours �Titov 2005�. With a seismic origin time of 00:58:50 UTC, this pre-dicts first arrivals around 12:00 noon in the north of the island and 12:30 P.M. in thesouth, in good agreement with the eyewitness reports.
The periods of the waves were generally estimated to be in the range of 15–20 min-utes.
SPECIFIC SITES
In the following sections, we highlight the sites where the most significant observa-tions were made, arranged geographically from north to south.
Site 6, Sambava
The tsunami was well observed along the Ampandrozonana beach, located on thesoutheastern side of this city of 28,000 and particularly well patronized on the Sundayafter Christmas. The most remarkable effect of the tsunami was the permanent destruc-tion, by scouring, of a section of unimproved road along the beach, over a length ofabout 40 m. As documented by the individuals providing a scale in Figure 3, the depthof scouring is approximately 30 cm at a distance of 71 m from the unperturbed sea-shore. This amounts to a runup of 1.8 m. Eyewitnesses estimated an arrival time of12:30 P.M. local time �09:30 UTC� and described two large waves, the second one beinglarger, with a period of 15–20 minutes. At the nearby Site 7, which is 125 m away alongthe beach, eyewitnesses described how a Nissan Patrol 4WD vehicle, which was beingused to tow a jet boat out of the ocean and onto a trailer, was caught by the tsunami waveand buried axle-deep in the sand by the retreating flow.
Site 1, Amdingozabe, and Site 2, Ambodihampana
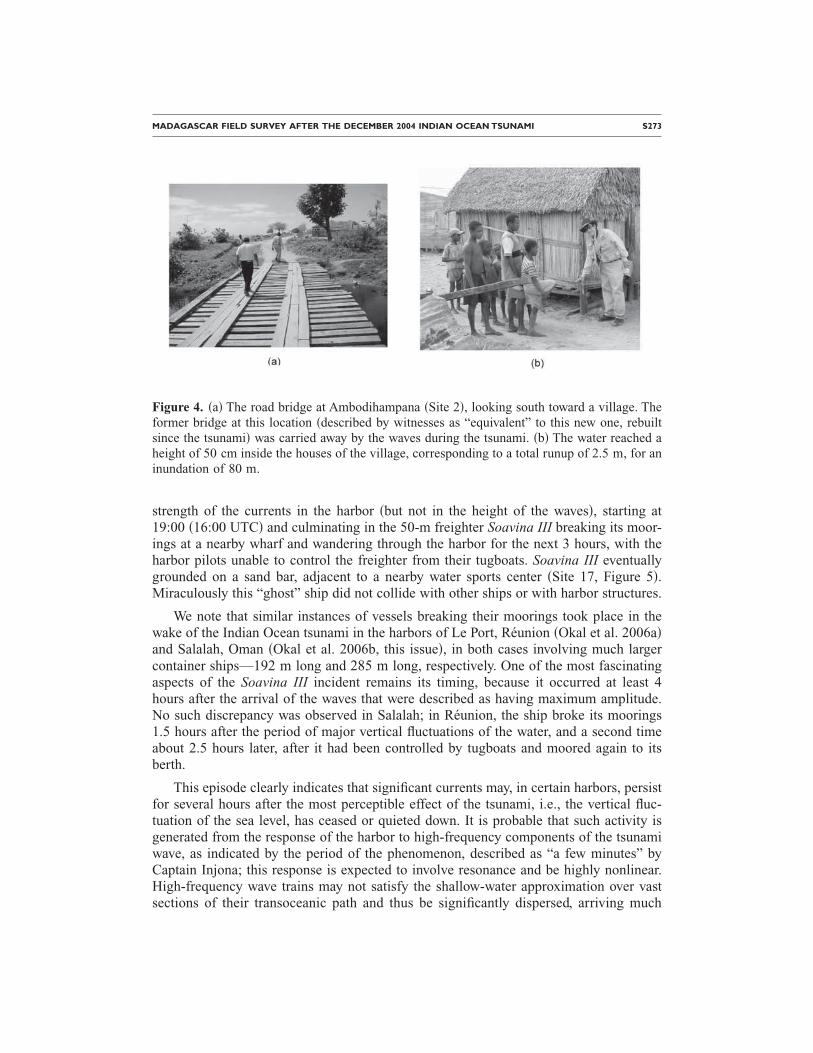
These two villages are about 35 km South of Antalaha; Site 2 represents the south-ernmost extension of the survey north of the Masoala Peninsula. Both locations were thesite of the destruction of unimproved bridges, even though runup was moderate at Site 1�1.1 m�. At Site 2, shown in Figure 4, it reached 2.5 m in the nearby village, suggestingthat the bridge may have been overflowed by more than 1 m.
MADAGASCAR FIELD SURVEY AFTER THE DECEMBER 2004 INDIAN OCEAN TSUNAMI S271

Site 16, Eddies in the Port of Toamasina
With a population of 180,000, Toamasina �formerly Tamatave� is the largest port inthe country. Its harbor was the site of an intriguing phenomenon, related to us by Cap-tain Jami Injona, a port pilot, and �in part� by Captain Talainy, the skipper of thefreighter Ludovic. The latter explained to us that, as early as 12:30 P.M. local time �09:30UTC�, his ship had been subject to wave activity in the harbor as it lay moored to thewharf. On the basis of Captain Injona’s testimony, we measured a flow depth of 0.90 mat Site 16 inside the harbor, which, after tidal correction, would suggest an amplitude ofoscillation of 0.6 m. However, by 17:00 �14:00 UTC�, this activity had ceased, as well asany visible fluctuations of sea surface elevation in the harbor, to the extent that CaptainTalainy left the ship in the command of his second officer and intended to spend theevening in town. Captain Injona then reported a considerable amplification in the
Figure 3. Scouring of a road along Ampandrozonana Beach in Sambava �Site 6�. �a� Generalview of the beach, with the eroded road segment to the left, 71 m from the water line. �b� and�c� Close-up of the scouring. Note the advance of the beach, identified by sand deposits, overthe previous location of the road.
S272 E. A. OKAL, H. M. FRITZ, R. RAVELOSON, G. JOELSON, P. PANCOŠKOVÁ, AND G. RAMBOLAMANANA
strength of the currents in the harbor �but not in the height of the waves�, starting at19:00 �16:00 UTC� and culminating in the 50-m freighter Soavina III breaking its moor-ings at a nearby wharf and wandering through the harbor for the next 3 hours, with theharbor pilots unable to control the freighter from their tugboats. Soavina III eventuallygrounded on a sand bar, adjacent to a nearby water sports center �Site 17, Figure 5�.Miraculously this “ghost” ship did not collide with other ships or with harbor structures.
We note that similar instances of vessels breaking their moorings took place in thewake of the Indian Ocean tsunami in the harbors of Le Port, Réunion �Okal et al. 2006a�and Salalah, Oman �Okal et al. 2006b, this issue�, in both cases involving much largercontainer ships—192 m long and 285 m long, respectively. One of the most fascinatingaspects of the Soavina III incident remains its timing, because it occurred at least 4hours after the arrival of the waves that were described as having maximum amplitude.No such discrepancy was observed in Salalah; in Réunion, the ship broke its moorings1.5 hours after the period of major vertical fluctuations of the water, and a second timeabout 2.5 hours later, after it had been controlled by tugboats and moored again to itsberth.
This episode clearly indicates that significant currents may, in certain harbors, persistfor several hours after the most perceptible effect of the tsunami, i.e., the vertical fluc-tuation of the sea level, has ceased or quieted down. It is probable that such activity isgenerated from the response of the harbor to high-frequency components of the tsunamiwave, as indicated by the period of the phenomenon, described as “a few minutes” byCaptain Injona; this response is expected to involve resonance and be highly nonlinear.High-frequency wave trains may not satisfy the shallow-water approximation over vastsections of their transoceanic path and thus be significantly dispersed, arriving much
Figure 4. �a� The road bridge at Ambodihampana �Site 2�, looking south toward a village. Theformer bridge at this location �described by witnesses as “equivalent” to this new one, rebuiltsince the tsunami� was carried away by the waves during the tsunami. �b� The water reached aheight of 50 cm inside the houses of the village, corresponding to a total runup of 2.5 m, for aninundation of 80 m.
MADAGASCAR FIELD SURVEY AFTER THE DECEMBER 2004 INDIAN OCEAN TSUNAMI S273

later than the main tsunami waves. While this remark remains qualitative, it could ex-plain differences in timing relative to the main tsunami waves between the incidents, asthe shapes of the harbors in Réunion, Madagascar, and Oman vary widely. Note in par-ticular �Figure 5� the complex geometry of the inner harbor in Toamasina, which shouldincrease its eigenfrequencies and hence delay its response. At any rate, the incidents inthe three west Indian Ocean harbors, and especially in Toamasina, indicate that the haz-ard posed by the arrival of a distal tsunami may last much longer than suggested by thevisual observation of anomalous vertical oscillations of the sea surface. This warrants areassessment of civil defense policies in this respect.
Figure 5. �a� The 50-m freighter Soavina III, on 2 August 2005 in the port of Toamasina. �b�The port of Toamasina, showing its complex geometry; the dark circle shows where thefreighter Soavina III became grounded. �c� Captain Injona points to Channel 3B, where theSoavina III broke its moorings at about 7:00 P.M., wandering in the channels up to the locationof the darker circle before eventually grounding in front of the Water-Sports Club Beach �thewhite circle, Site 17�.
S274 E. A. OKAL, H. M. FRITZ, R. RAVELOSON, G. JOELSON, P. PANCOŠKOVÁ, AND G. RAMBOLAMANANA

Site 13, Manahoro, and Site 14, Vatomandry
An intriguing result is that the tsunami was not observed in the two towns of Mana-horo and Vatomandry, where we failed to obtain a single eyewitness report of an anoma-lous wave, despite interviewing over a dozen residents who had been present at thebeaches on 26 December 2004. This was confirmed by the local gendarmerie unit inManahoro �population 33,000�. The flow depth and runup in these two localities are la-beled “Nil” in Table 1 and Figure 2. Our experience in the Toamasina area indicates thatrunup as small as 0.70 m was recognized, and thus we propose that the amplitude of thetsunami in the two localities must not have exceeded 0.50 m. Unfortunately, there existsa 150-km gap in our data set between the northernmost datum of the southern group�with runup reaching 2.4 m at Mananjary� and Manahoro, which is the southernmostdatum of the northern group, where the tsunami was not observed; this gap could not beclosed in the framework of the present survey, because of logistical constraints. We rec-ommend complementing the survey in the future at the town of Nosy Varika, which maybe reachable from Mananjary along a difficult 100-km track, which is reported to bemarginally passable by a 4WD vehicle.
Sites 46–48, Manakara Be
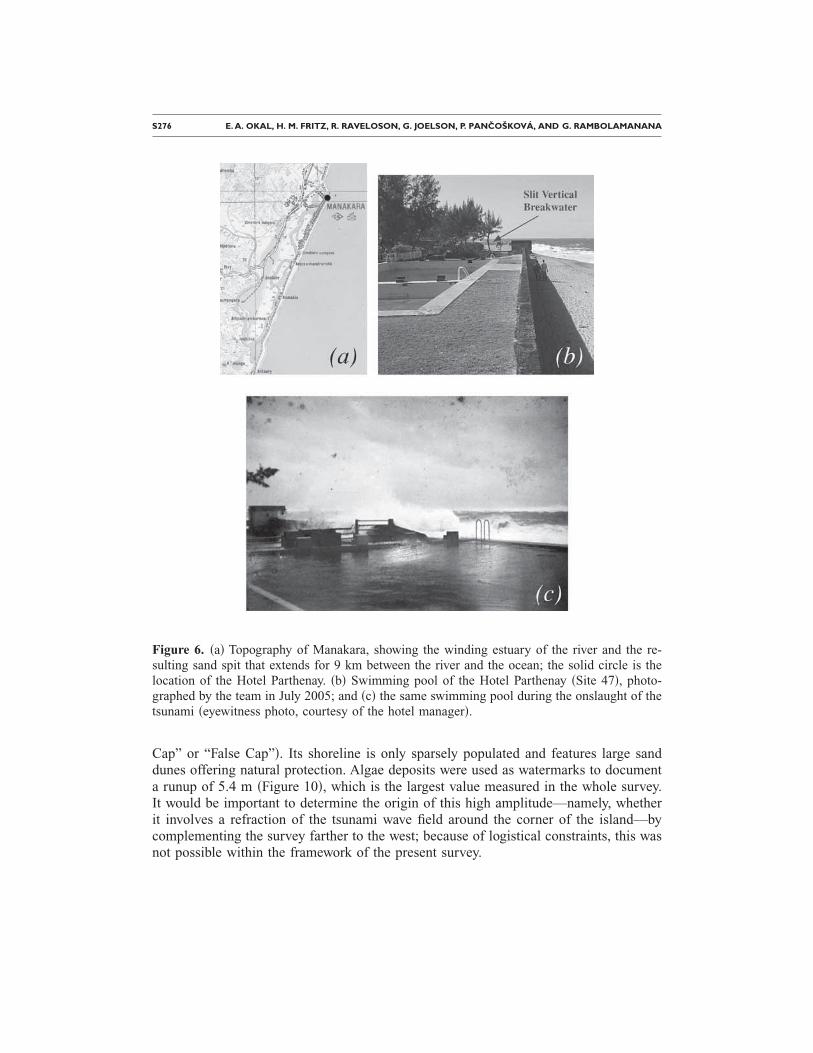
The city of Manakara �population 31,500� lies at the mouth of the Manakara River,whose winding estuary creates a lagoon separated from the sea by a narrow, 9-km-longsand spit at the end of which is the seaside district of Manakara Be �Figure 6�. The teamwas fortunate to recover videotapes and photos documenting the penetration of the tsu-nami. At the Hotel Parthenay, located at the northern extremity of the sand spit separat-ing the ocean and the lagoon, the owner described the crashing of the first wave againstthe 1.5-m swimming pool wall and the subsequent flooding of the pool, 4 m above sealevel �Site 47, Figure 6c�. Seven hotel bungalows were then flooded from the backthrough a slit vertical breakwater at the river mouth, which extends the sand spit into theestuary by over 300 m �Site 46, Figure 7�. Figure 8 shows palm trees felled at the nearbybeach during the main wave activity and the resulting permanent beach erosion �Site48�.
Sites 26 and 36, Tolagnaro „Formerly Fort-Dauphin…The city of Tolagnaro �population 39,000� is the capital of the southernmost province
of the country. It is built on a headland surrounded on three sides by the ocean, so mostof the city is naturally protected from inundation by its elevation �Figure 9�; the port wasflooded up to the 2-m-high quay, and it drained completely between the first and secondwave. Beach erosion and damaged vegetation were used to document tsunami penetra-tion at Site 36, 1.3 km away. One casualty was reported at Manafiafy �Site 28, 35 km tothe northeast�, where a 12-year-old boy was pulled offshore while swimming anddrowned.
Site 34, Betanty
Betanty, which is the southernmost site visited, approaches the southern tip of theisland �which it was long thought to be by early explorers, hence its former name “Faux
MADAGASCAR FIELD SURVEY AFTER THE DECEMBER 2004 INDIAN OCEAN TSUNAMI S275
Cap” or “False Cap”�. Its shoreline is only sparsely populated and features large sanddunes offering natural protection. Algae deposits were used as watermarks to documenta runup of 5.4 m �Figure 10�, which is the largest value measured in the whole survey.It would be important to determine the origin of this high amplitude—namely, whetherit involves a refraction of the tsunami wave field around the corner of the island—bycomplementing the survey farther to the west; because of logistical constraints, this wasnot possible within the framework of the present survey.
Figure 6. �a� Topography of Manakara, showing the winding estuary of the river and the re-sulting sand spit that extends for 9 km between the river and the ocean; the solid circle is thelocation of the Hotel Parthenay. �b� Swimming pool of the Hotel Parthenay �Site 47�, photo-graphed by the team in July 2005; and �c� the same swimming pool during the onslaught of thetsunami �eyewitness photo, courtesy of the hotel manager�.
S276 E. A. OKAL, H. M. FRITZ, R. RAVELOSON, G. JOELSON, P. PANCOŠKOVÁ, AND G. RAMBOLAMANANA

SOCIAL ASPECTS: TSUNAMI ALERT AND EVACUATION ON 28 MARCH 2005
As mentioned in the introduction to this paper, we recall that the Great Sumatraearthquake of 26 December 2004 was followed on 28 March 2005 by a very strongearthquake, occurring to the southeast of the 26 December faulting area and most prob-ably triggered by stress transfer. This second event resulted in a tsunami alert in somefar-field locations, and in particular along the coast of Madagascar, even though in the
Figure 7. �a� Bungalows at the Hotel Parthenay flooded by a tsunami wave coming from theestuary of the Manakara River, after breaking through a perforated seawall �photo: M. Jolce�.�b� Watermark preserved on the wall of a bungalow at Site 46. The runup is 1.50 m, for aninundation of 38 m.
Figure 8. �a� Palm trees felled by tsunami activity at Manakara Beach �Site 48� �photo: M.Jolce�. �b� The same location on 2 August 2005, showing permanent beach erosion.
MADAGASCAR FIELD SURVEY AFTER THE DECEMBER 2004 INDIAN OCEAN TSUNAMI S277

end it did not generate a noticeable far-field tsunami. This most probably resulted fromits occurrence in much shallower seas than the 26 December shock, with the rupture areaeven involving a number of large islands �Kerr 2005�.
The Malagasy population was therefore exposed to an unannounced event on 26 De-cember, resulting in an observable, if weak, tsunami, and to an alert on 28 March �EasterMonday�, which eventually did not materialize into a detectable wave. As a result, therewas a certain level of confusion between the two events in the minds of numerous eye-witnesses. Fortunately, we were able to resolve this confusion, given the very differenttime of day for the two events: the tsunami of 26 December reached Madagascar inbroad daylight, at about 12:30 P.M. local time, whereas the alert for the second event�origin time 16:09 UTC� was issued at about 21:00 local time, i.e., at night, for an ex-pected arrival of the waves in the middle of the night, at about 03:00 the next day. Thisallowed us to clarify and validate the reports from many eyewitnesses.
Several important lessons can be learned from the 28 March earthquake and the re-sulting warning in Madagascar, even though the warning ended up being a false alarm.First, we want to stress the exceptional size of the 28 March event, whose moment waslarger than those of many earthquakes that generated damaging tsunamis in the far field,such as the 1946 Aleutian event �López and Okal 2006�. In this context, we do not re-
Figure 9. �a� The port and city of Tolagnaro: note the natural protection of the main settlementon an elevated headland. �b� Beach erosion and damaged vegetation at the local maximumrunup of 4.1 m �Site 36�.
S278 E. A. OKAL, H. M. FRITZ, R. RAVELOSON, G. JOELSON, P. PANCOŠKOVÁ, AND G. RAMBOLAMANANA

gard the eventual false alarm as a failure, but rather as a necessary exercise in precau-tionary civil defense, within the level of what has to be deemed acceptable. The trigger-ing of the tsunami alert indicates an adequate awareness of tsunami risk on the part ofthe local authorities and of the population, most of whom responded by evacuating. Inparticular, we can only applaud the fact that the large majority of the coastal populationwhom we met had indeed been alerted, which proves the existence and functionality ofa means of warning �essentially, commercial radio�.
On the other hand, the response of the population to the tsunami alert was generallyerratic and often disastrous. Most coastal residents sought to evacuate over excessivedistances, in motor vehicles, and often along the main available road, i.e., in a directionparallel to the coastline, which is obviously inefficient in terms of evacuation. As a re-sult, there was chaos in densely populated areas such as Toamasina, where the gendarm-erie reported numerous traffic accidents, with six fatalities.
The ITST members strove to remind the population in all villages visited that an ef-ficient evacuation is carried out on foot over distances on the order of hundreds ofmeters, and to stress the value of vertical evacuation, personally pointing out, where pos-sible, the sturdy multistory buildings located at elevations a few meters above sea levelas adequate shelters in this respect �Figure 11�. We regard as an important and necessaryeffort the education of the population about sound evacuation procedures, especiallygiven the strong possibility of a new mega-earthquake striking the southern part of
Figure 10. �a� Surveying at Betanty; note the large dunes providing natural protection to thevillage. �b� At Site 34, an eyewitness displays algae that indicate the extent of penetration of thewave. This is the point of maximum runup in the survey �5.4 m�.
MADAGASCAR FIELD SURVEY AFTER THE DECEMBER 2004 INDIAN OCEAN TSUNAMI S279

Sumatra in the future. This could take the form of a repeat of the 1833 earthquake,whose geometry would generate a lobe of maximum tsunami energy in an azimuth closeto that of Madagascar and the nearby islands �Réunion, Mauritius, and Rodrigues�.
Similarly, in many instances, eyewitnesses described how local residents had takenthe uneducated and very dangerous step of venturing onto downdrawn beaches and ex-posed reef platforms during the initial recess of the sea on 26 December 2004 �Figure12�. The team members repeatedly warned all interviewed residents against such haz-ardous reactions to any anomalous recess of the ocean: the only safe response to anyirregularity in sea level must be to seek immediate refuge at higher elevations. Examplesof successful self-evacuations during the 26 December tsunami, widely publicized bothin the general media �Anonymous 2005� and across the scientific community �Chapman2005�, illustrate that lives can indeed be saved even in areas subjected to catastrophiclevels of destruction. By publishing Figure 12 and its highlighted messages, we wish toemphasize once again the need for continued education of the population of all seashorecommunities worldwide in this respect.
Figure 11. Interview at Ambila �Site 15�. The eyewitness at left is the manager of the touristhotel in the background, which is about 5 m above sea level and 60 m from the seashore. At aheight of 10 m, its rooftop terrace could serve as a platform for vertical evacuation in this lo-cality, which is along a narrow spit between the Indian Ocean and the Pangalanes intracoastalwaterway.
S280 E. A. OKAL, H. M. FRITZ, R. RAVELOSON, G. JOELSON, P. PANCOŠKOVÁ, AND G. RAMBOLAMANANA

CONCLUSION
The interviewing of over 100 eyewitnesses of the December 2004 Indian Ocean tsu-nami in Madagascar has resulted in the compilation of a homogeneous data set of inun-dation and runup values at 52 sites along a stretch of 950 km of the island’s easterncoast. While runup values are expectedly lower than in the eastern half of the IndianOcean, they do reach a maximum of 5.4 m at the southern tip of the island, and theyshow a strong pattern of variability along the shoreline, to the extent that the tsunamiwas not observed along a segment of coast measuring at least 80 km. It will be impor-tant to determine the origin of such variations, in order to gain insight into the possibleeffects of future distant tsunamis along the shores of Madagascar. The delayed breakingof the moorings of the freighter Soavina III in the harbor of Toamasina, where the tsu-nami had otherwise been benign, indicates the potential for considerable hazard in port
Figure 12. Initial downdraw upon the arrival of the tsunami at Manakara Be, photographed byan eyewitness, showing two residents stepping onto the exposed beach, with the normally in-visible coral reef in the background. As emphasized by the labels superimposed on the picture,this is a classic example of what not to do when facing an unexpected recess of the sea. Rather,these residents should be wasting no time self-evacuating to higher ground.
MADAGASCAR FIELD SURVEY AFTER THE DECEMBER 2004 INDIAN OCEAN TSUNAMI S281

facilities over time windows extending significantly beyond those for conventional waveactivity.
The warning issued after the 28 March earthquake illustrates the awareness of tsu-nami hazards by the authorities and the population. However, the erratic nature of theresponse of the coastal community highlights the need for continued education in thisrespect, as do the numerous reported instances of residents yielding to curiosity and ven-turing to explore beaches and reefs exposed by downdraw during the initial episodes ofthe 26 December tsunami.
ACKNOWLEDGMENTS
Field work by the ITST was supported by the National Science Foundation underSGER number EAR-05-43300 to Northwestern University. We acknowledge supportfrom Commissariat à l’Energie Atomique �France�. We thank the wonderful people ofMadagascar for sharing their memories of the tsunami, and especially their photos andvideos. We are grateful to James Goff for his careful review. Maps were drafted viaGMT software �Wessel and Smith 1991�.
REFERENCES
Anonymous, 2005. “Award for girl whose tsunami lesson saved lives,” Reuters, London, 9 Sep-tember.
Ben-Menahem, A., and Rosenman, M., 1972. Amplitude patterns of tsunami waves from sub-marine earthquakes, J. Geophys. Res. 77, 3097–3128.
Chapman, C. H., 2005. The Asian tsunami in Sri Lanka: A personal experience, EOS Trans. Am.Geophys. Union 86, 13–14.
Fritz, H. M., and Borrero, J. C., 2006. Somalia field survey after the December 2004 IndianOcean tsunami, Great Sumatra Earthquakes and Indian Ocean Tsunamis of December 26,2004 and March 28, 2005, Earthquake Spectra 22 �S3�, June �this issue�.
Harris, R. A., 1998. Stress triggers, stress shadows, and implications for seismic hazard, J. Geo-phys. Res. 103, 24347–24358.
Harris, R. A., Dolan, J. F., Hartleb, R. D., and Day, S. M., 2002. The 1999 Izmit, Turkey, earth-quake: A 3-D dynamic stress transfer model of intraearthquake triggering, Bull. Seismol.Soc. Am. 92, 245–255.
Kerr, R. A., 2005. Model shows islands muted tsunami after latest Indonesian quake, Science308, 341.
López, A. M., and Okal, E. A., 2006. A seismological reassessment of the source of the 1946Aleutian “tsunami” earthquake, Geophys. J. Int. 165, 835–849.
McCloskey, J., Nalbant, S. S., and Steacy, S., 2005. Earthquake risk from co-seismic stress,Nature 434, 291.
Nalbant, S. S., Steacy, S., Sieh, K., Natawidjaja, D., and McCloskey, J., 2005. Updated earth-quake hazard in Sumatra, Nature 435, 756–757.
S282 E. A. OKAL, H. M. FRITZ, R. RAVELOSON, G. JOELSON, P. PANCOŠKOVÁ, AND G. RAMBOLAMANANA

Nettles, M., Ekström, G., Dziewonski, A., and Maternovskaya, N., 2005. Source characteristicsof the great Sumatra earthquake and its aftershocks, EOS Trans. Am. Geophys. Union 86�18�, JA11, abstract.
Okal, E. A., Sladen, A., and Okal, E.A.-S., 2006a, Rodrigues, Mauritius, and Réunion Islandsfield survey after the December 2004 Indian Ocean tsunami, Great Sumatra Earthquakesand Indian Ocean Tsunamis of December 26, 2004 and March 28, 2005, Earthquake Spectra22 �S3�, June �this issue�.
Okal, E. A., Fritz, H. M., Synolakis, C. E., Raad, P. E., Al-Shijbi, Y., and Al-Saifi, M., 2006b.Oman field survey after the December 2004 Indian Ocean tsunami, Great Sumatra Earth-quakes and Indian Ocean Tsunamis of December 26, 2004 and March 28, 2005, EarthquakeSpectra 22 �S3�, June �this issue�.
Stein, R. S., Barka, A. A., and Dieterich, J. H., 1997. Progressive failure on the North Anatolianfault since 1939 by earthquake stress triggering, Geophys. J. Int. 128, 594–604.
Stein, S., and Okal, E. A., 2005. Size and speed of the Sumatra earthquake, Nature 434, 581–582.
Synolakis, C. E., and Okal, E. A., 2005. 1992–2002: Perspective on a decade of post-tsunamisurveys, in Tsunamis: Case Studies and Recent Developments, edited by K. Satake, Vol. 23,Advances in Natural and Technological Sciences Series, pp. 1–30, Springer, New York.
Synolakis, C. E., Okal, E. A., and Bernard, E. N., 2005. The mega-tsunami of December 26,2004, The Bridge 35 �2�, 26–35.
Titov, V. V., 2005. Modeling of the Indian Ocean tsunami: Lessons for warning and hazard miti-gation, Proceedings, Ann. Meeting Europ. Un. Geosci., Vienna, Austria, p. 230, abstract.
Wessel, P., and Smith, W.H.F., 1991. Free software helps map and display data, EOS Trans. Am.Geophys. Union 72, 441 and 445–446.
Yalçıner, A. C., Alpar, B., Altınok, Y., Özbay, I., and Imamura, F., 2002. Tsunamis in the Seaof Marmara: Historical documents for the past, models for the future, Mar. Geol. 190, 445–463.
Zachariasen, J., Sieh, K., Taylor, F., Edwards, R., and Hantoro, W., 1999. Submergence and up-lift associated with the giant 1833 Sumatran subduction earthquake: Evidence from coralmicroatolls, J. Geophys. Res. 104, 895–919.
�Received 25 October 2005; accepted 4 April 2006�
MADAGASCAR FIELD SURVEY AFTER THE DECEMBER 2004 INDIAN OCEAN TSUNAMI S283