Reproducibility of Vibrionaceae population structure in coastal bacterioplankton
Upload
independentCategory
view
2download
0
Macular Ganglion Cell–Inner Plexiform Layer:Automated Detection and Thickness Reproducibilitywith Spectral Domain–Optical Coherence Tomographyin Glaucoma
Jean-Claude Mwanza,1 Jonathan D. Oakley,2 Donald L. Budenz,1 Robert T. Chang,1,3
O’Rese J. Knight,1,4 and William J. Feuer1
PURPOSE. To demonstrate the capability of SD-OCT to measuremacular retinal ganglion cell–inner plexiform layer (GCIPL)thickness and to assess its reproducibility in glaucomatouseyes.
METHODS. Fifty-one glaucomatous eyes (26 mild, 11 moderate,14 severe) of 51 patients underwent macular scanning usingthe Cirrus HD-OCT (Carl Zeiss Meditec, Dublin, CA) macula200�200 acquisition protocol. Five scans were obtained on 5days within 2 months. The ganglion cell analysis (GCA) algo-rithm was used to detect the macular GCIPL and to measurethe thickness of the overall average, minimum, superotempo-ral, superior, superonasal, inferonasal, inferior, and inferotem-poral GCIPL. The reproducibility of the measurements wasevaluated with intraclass correlation coefficients (ICCs), coef-ficients of variation (COVs), and test-retest standard deviations(TRTSDs).
RESULTS. Segmentation and measurement of GCIPL thicknesswere successful in 50 of 51 subjects. All ICCs ranged between0.94 and 0.98, but ICCs for average and superior GCIPL param-eters (0.97–0.98) were slightly higher than for inferior GCIPLparameters (0.94–0.97). All COVs were �5%, with 1.8% foraverage GCIPL and COVs for superior GCIPL parameters(2.2%–3.0%) slightly lower than those for inferior GCIPL pa-rameters (2.5%–3.6%). The TRTSD was lowest for averageGCIPL (1.16 �m) and varied from 1.43 to 2.15 �m for sectoralGCIPL
CONCLUSIONS. The Cirrus HD-OCT GCA algorithm can success-fully segment macular GCIPL and measure GCIPL thicknesswith excellent intervisit reproducibility. Longitudinal monitor-
ing of GCIPL thickness may be possible with Cirrus HD-OCTfor assessing glaucoma progression. (Invest Ophthalmol VisSci. 2011;52:8323–8329) DOI:10.1167/iovs.11-7962
Although glaucoma is classified as an optic nerve disease,pathologically it is characterized by the death of retinal
ganglion cells (RGCs) and their axons. Traditionally, loss ofRGCs has been judged based on damage to the optic nervehead (ONH) and visual field (VF) deficits. Because these assess-ments do not exactly reflect the extent to which the RGCpopulation is affected, it became evident that any methodenabling measurement of RGCs would advance both earlydetection and longitudinal monitoring of glaucoma. Advancesin ocular imaging techniques, particularly the advent of opticalcoherence tomography (OCT), have enabled assessment ofRGC axons by measuring the thickness of the peripapillaryretinal nerve fiber layer (RNFL). In addition to peripapillaryRNFL, OCT devices can measure the thickness of the wholeretina, particularly in the macular area. Decreases in macularthickness that are believed to be due to loss of RGCs and thatcorrelate with both RNFL thickness and VF defects have beenreported in glaucomatous eyes.1–8 However, measuring thewhole macular thickness as a surrogate for glaucoma has thedisadvantage of taking into account cell layers (i.e., outerretinal layers) that are not affected in glaucoma, thus obscuringthe actual contribution of the RGC layer to the process.
Since its introduction, OCT has undergone several improve-ments, the latest of which is spectral domain (SD) technology.More recent advances in segmentation algorithms by severalresearch groups have made possible the visualization and mea-surement of individual retinal layers with OCT in the macularregion.6,9–18 Anatomically, the human retina contains morethan 1 million RGCs, with substantial interindividual variability;approximately 50% of the cells are concentrated within 4.5mm of the fovea.19 Although there is no variability in the RGCpopulation in this small parafoveal area, there is, in contrast,considerable variability in the entire retina, resulting in vari-ability in the number of axons in the peripapillary region.19
Glaucoma preferentially affects the ganglion cell complex(GCC), which is the sum of the three innermost layers: theRNFL, which is composed of axons; the ganglion cell layer(GCL), which is composed of cell bodies; and the inner plex-iform layer (IPL), which contains the RGC dendrites. A fewrecent studies20–22 have shown that measurement of macularGCC thickness has the same glaucoma diagnostic performanceas RNFL thickness. However, it is possible that including theRNFL in the measurement may affect the diagnostic ability ofGCC thickness. An underlying assumption here is that theganglion cell structure differs less in a normal population thando other diagnostically important structures such as the RNFL
From the 1Bascom Palmer Eye Institute, Miller School of Medicine,University of Miami, Miami, Florida; and 2Voxeleron, LLC, Pleasanton,California.
Present affiliations: 3Department of Ophthalmology, Stanford Uni-versity, Palo Alto, California; and 4Department of Ophthalmology, CaseWestern University, Cleveland, Ohio.
Presented in part at the annual meeting of the Association forResearch in Vision and Ophthalmology, Fort Lauderdale, Florida, May2011.
Supported by National Institutes of Health Grant P30 EY014801,an unrestricted grant from the Research to Prevent Blindness, andresearch support from Carl Zeiss Meditec, Inc.
Submitted for publication May 30, 2011; revised July 28 andSeptember 4, 2011; accepted September 8, 2011.
Disclosure: J.-C. Mwanza, Carl Zeiss Meditec (F); J.D. Oakley,Carl Zeiss Meditec (E); D.L. Budenz, Carl Zeiss Meditec (F); R.T.Chang, Carl Zeiss Meditec (F); O.J. Knight, Carl Zeiss Meditec (F);W.J. Feuer, Carl Zeiss Meditec (F)
Corresponding author: Donald L. Budenz, Bascom Palmer Eye Insti-tute, 900 NW 17th Street, Miami, FL 33136; [email protected].
Glaucoma
Investigative Ophthalmology & Visual Science, October 2011, Vol. 52, No. 11Copyright 2011 The Association for Research in Vision and Ophthalmology, Inc. 8323
and the ONH. As such, the potential sensitivity of a measure-ment that is compared with that in a normal population couldbe higher because the difference would more likely be theresult of pathologic change than of normal variation. This is aworking hypothesis because until the advent of SD-OCT, wehave been unable to study this in a reliable way. Furthermore,it is also hypothesized that the normal ganglion cell structurehas symmetries that could be exploited in attempting to detectloss; an example would be a temporal defect in the anatomycorresponding to a nasal step in the VF. Including the RNFL inthe measurement would make exploiting such symmetries inthe analyses impossible.
The purpose of this study was to demonstrate the capabilityof the ganglion cell analysis (GCA) developed for Cirrus HD-OCT (Carl Zeiss Meditec, Dublin, CA) to automatically segmentmacular layers, to measure the thickness of the complex gan-glion cell–inner plexiform layer, referred to in this study asGCIPL, and to assess its intervisit reproducibility.
PATIENTS AND METHODS
Patients
The study protocol was approved by the Institutional Review Board ofthe University of Miami Miller School of Medicine and was conductedin accordance with the tenets of the Declaration of Helsinki. Subjectswere 51 volunteers with glaucoma who were between 46 and 87 yearsof age (mean age, 70.9 � 11.2 years) and had various degrees of diseaseseverity based on the mean deviation grouping of the Hodapp-Parrish-Anderson scale.23 Inclusion criteria were best-corrected visual acuity of�20/40 in the study eye and no history or evidence of retinal (diabeticretinopathy, macular degeneration, retinal detachment, epiretinalmembrane) or nonglaucomatous optic nerve diseases, treatment thatmight be toxic to the retina or optic nerve (e.g., chloroquine, etham-butol), laser therapy, or ocular surgery within 1 month of enrollment.Each patient had a definite diagnosis of glaucoma based on glaucoma-tous damage to the optic disc and abnormal VF with or withoutelevated IOP. At least two VF analyzer (Humphrey; Carl Zeiss Meditec,Inc.) tests using the SITA standard 24–2 program were required, withthe most recent within 12 months of enrollment. VFs were abnormalat the time of diagnosis if any of the following was true: glaucomahemifield test result reliably outside normal limits; pattern standard
deviation (PSD) P � 5%; cluster of three or more points in the PSD plotin the superior or inferior hemifield with P � 5%, including one ormore with P � 1%. Only one eye was randomly selected per patient.
Optical Coherence Tomography ImageAcquisition and Processing
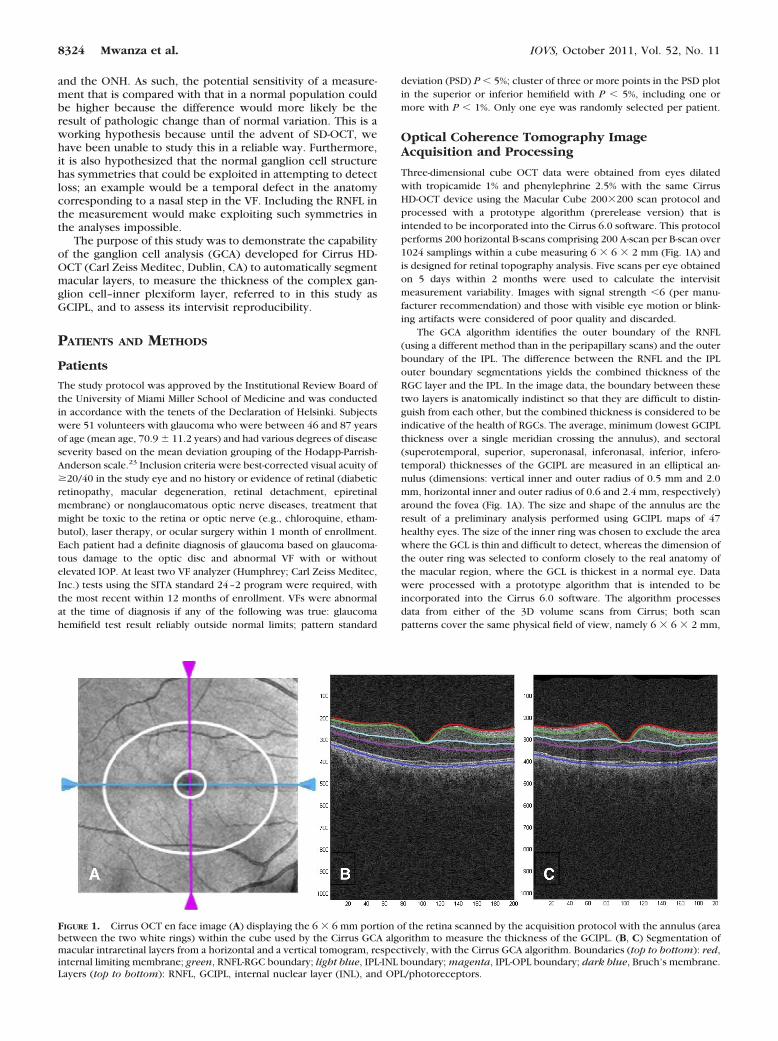
Three-dimensional cube OCT data were obtained from eyes dilatedwith tropicamide 1% and phenylephrine 2.5% with the same CirrusHD-OCT device using the Macular Cube 200�200 scan protocol andprocessed with a prototype algorithm (prerelease version) that isintended to be incorporated into the Cirrus 6.0 software. This protocolperforms 200 horizontal B-scans comprising 200 A-scan per B-scan over1024 samplings within a cube measuring 6 � 6 � 2 mm (Fig. 1A) andis designed for retinal topography analysis. Five scans per eye obtainedon 5 days within 2 months were used to calculate the intervisitmeasurement variability. Images with signal strength �6 (per manu-facturer recommendation) and those with visible eye motion or blink-ing artifacts were considered of poor quality and discarded.
The GCA algorithm identifies the outer boundary of the RNFL(using a different method than in the peripapillary scans) and the outerboundary of the IPL. The difference between the RNFL and the IPLouter boundary segmentations yields the combined thickness of theRGC layer and the IPL. In the image data, the boundary between thesetwo layers is anatomically indistinct so that they are difficult to distin-guish from each other, but the combined thickness is considered to beindicative of the health of RGCs. The average, minimum (lowest GCIPLthickness over a single meridian crossing the annulus), and sectoral(superotemporal, superior, superonasal, inferonasal, inferior, infero-temporal) thicknesses of the GCIPL are measured in an elliptical an-nulus (dimensions: vertical inner and outer radius of 0.5 mm and 2.0mm, horizontal inner and outer radius of 0.6 and 2.4 mm, respectively)around the fovea (Fig. 1A). The size and shape of the annulus are theresult of a preliminary analysis performed using GCIPL maps of 47healthy eyes. The size of the inner ring was chosen to exclude the areawhere the GCL is thin and difficult to detect, whereas the dimension ofthe outer ring was selected to conform closely to the real anatomy ofthe macular region, where the GCL is thickest in a normal eye. Datawere processed with a prototype algorithm that is intended to beincorporated into the Cirrus 6.0 software. The algorithm processesdata from either of the 3D volume scans from Cirrus; both scanpatterns cover the same physical field of view, namely 6 � 6 � 2 mm,
FIGURE 1. Cirrus OCT en face image (A) displaying the 6 � 6 mm portion of the retina scanned by the acquisition protocol with the annulus (areabetween the two white rings) within the cube used by the Cirrus GCA algorithm to measure the thickness of the GCIPL. (B, C) Segmentation ofmacular intraretinal layers from a horizontal and a vertical tomogram, respectively, with the Cirrus GCA algorithm. Boundaries (top to bottom): red,internal limiting membrane; green, RNFL-RGC boundary; light blue, IPL-INL boundary; magenta, IPL-OPL boundary; dark blue, Bruch’s membrane.Layers (top to bottom): RNFL, GCIPL, internal nuclear layer (INL), and OPL/photoreceptors.
8324 Mwanza et al. IOVS, October 2011, Vol. 52, No. 11
but the image data dimensionality is either 512 � 128 � 1024 or 200 �200 � 1024. The input image data are initially segmented using theexisting Cirrus inner limiting membrane (ILM) and RPE segmentationalgorithms to create a region of interest within which lie the intrareti-nal layers. The algorithm continues in such a hierarchical approach,segmenting first the outer boundary of the outer plexiform layer (OPL),followed by the outer boundary of the IPL, and last the outer boundaryof the RNFL. The segmentation procedure operates entirely in threedimensions and uses a graph-based algorithm to identify each layer.Image data are transformed into cost images such that the graphalgorithm can find the lowest cost surface. To do this, the input dataare initially median filtered to reduce speckle noise. They then createcost images based on directional edge-filtered images that have beenenhanced to highlight specific boundary intensity changes using asigmoid function. These are combined with positional cost images toform a single representation that is partitioned by the graph segmen-tation algorithm. The segmentation that results is globally optimal interms of its cumulative cost for each of the layers.
The software analyzes the values, compares them to the device’sinternal normative database, and generates a thickness map, a devia-tion map, and a significance map color-coded to match RNFL thick-ness, with values within the normal range in green (P � 5%–95%),borderline values in yellow (1% � P � 5%), and values outside thenormal range in red (P � 1%). The normative database contains datafrom 282 healthy subjects (133 men, 149 women) aged 19 to 84 years(mean age, 48.2 � 16.9 years). Ethnicity breakdown of the Cirrus RNFLand macula normative databases was as follows: 43% Caucasian, 24%Asian, 18% African American, 12% Hispanic, 1% Indian, and 6% mixedethnicity. Mean values were as follows: axial length, 23.94 � 1.06 mm(range, 20–28 mm); IOP, 14.0 � 2.4 mm Hg (range, 8–20 mm Hg);refraction expressed as spherical equivalent, �0.9 � 2.1 D (range,�10.6 to �6.25 D); central corneal thickness (CCT), 549.58 � 36.67�m (mean, 449–662 �m); and VF field mean deviation, 0.02 � 1.04 dB(range, �2.07 to �2.58 dB). All ILM and RNFL scans and those poste-rior to the IPL and OPL boundaries were manually reviewed for accu-racy. The segmentation result was overlaid onto the OCT volume dataand visualized in computing software (MatLab; MathWorks, Natick,MA), which often allows visualizing algorithm errors in the en facethickness maps. Any scan with an apparent segmentation error de-tected during this process was excluded from the study. More specif-ically, each B-scan was reviewed to check that the segmentation errorof the ILM, OPL, or inner segment/outer segment boundary was �10pixels for �75% of all A-scans within the annulus region. Any scan thatdid not meet this criterion was excluded.
Statistical Analysis
The statistical significance of differences between VF severity groupswas assessed with ANOVA and subsequent post hoc least significantdifference tests as appropriate. The total variability of all measurementswas partitioned into variance components because of differences be-tween patients and between days within patients (test-retest). Repro-ducibility was assessed with intraclass correlation coefficient (ICC),coefficient of variation (COV), and pooled within-subject test-retest SD(TRTSD). The numerator of the between-visit COV was the intervisitTRTSD, the square root of the pooled within-patient test-retest vari-ance component.
RESULTS
Demographic Characteristics
A total of 51 glaucomatous eyes, including 26 with mild, 11with moderate, and 14 with severe glaucoma, were studied.One patient with mild glaucoma was excluded from the finalstatistical analysis because of algorithm segmentation failurethat resulted in erroneous measurements. Thus, only data from50 patients were analyzed. Patients’ ages ranged from 46 to 87years (mean, 73.4 � 11.4 years). Glaucoma severity groups did
not differ with regard to age (73.60 � 11.39 years for mild,70.82 � 11.78 years for moderate, and 75.21 � 6.81 years forsevere glaucoma; P � 0.64), but they significantly differed fromeach other with regard to VF mean deviation (�2.96 � 1.41dB, �8.84 � 1.22 dB, and �18.01 � 6.94 dB, respectively; P �0.001).
Segmentation of Macular Layers, Measurement,and Reproducibility of GCIPL Thickness
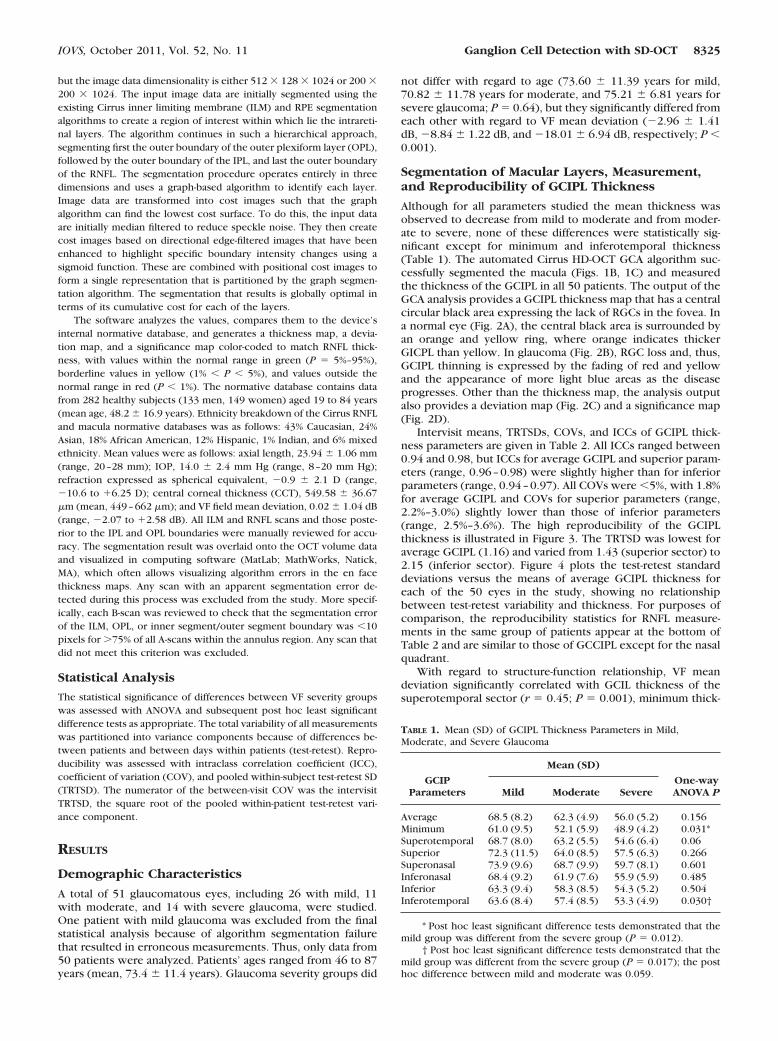
Although for all parameters studied the mean thickness wasobserved to decrease from mild to moderate and from moder-ate to severe, none of these differences were statistically sig-nificant except for minimum and inferotemporal thickness(Table 1). The automated Cirrus HD-OCT GCA algorithm suc-cessfully segmented the macula (Figs. 1B, 1C) and measuredthe thickness of the GCIPL in all 50 patients. The output of theGCA analysis provides a GCIPL thickness map that has a centralcircular black area expressing the lack of RGCs in the fovea. Ina normal eye (Fig. 2A), the central black area is surrounded byan orange and yellow ring, where orange indicates thickerGICPL than yellow. In glaucoma (Fig. 2B), RGC loss and, thus,GCIPL thinning is expressed by the fading of red and yellowand the appearance of more light blue areas as the diseaseprogresses. Other than the thickness map, the analysis outputalso provides a deviation map (Fig. 2C) and a significance map(Fig. 2D).
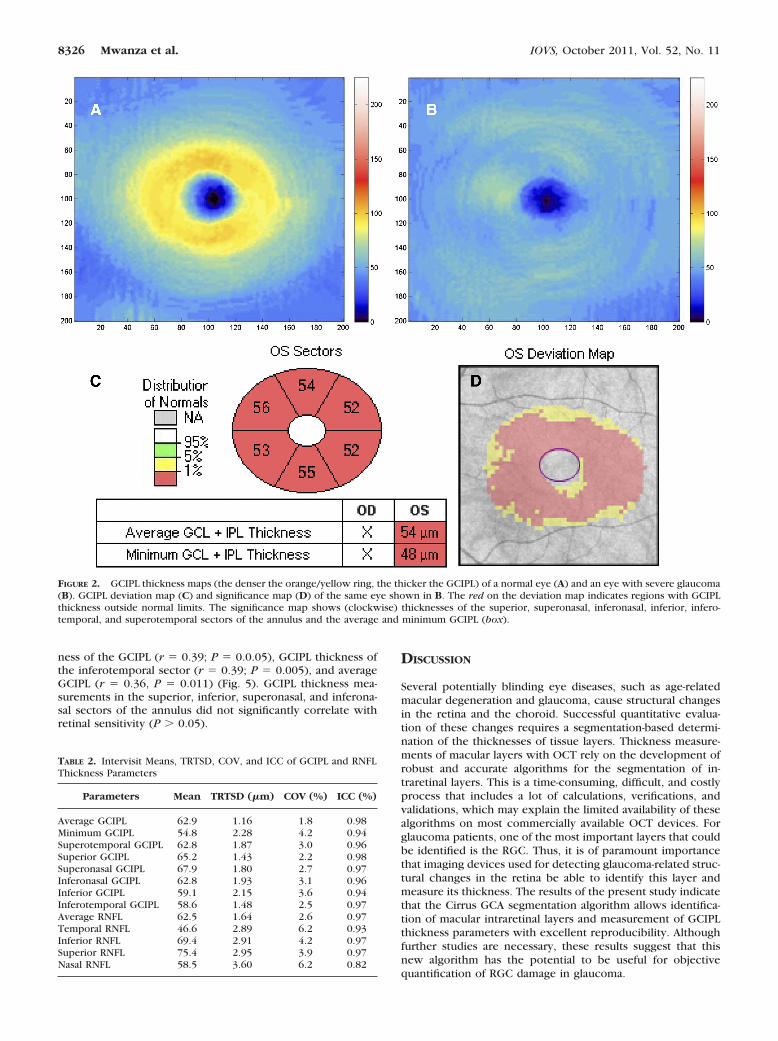
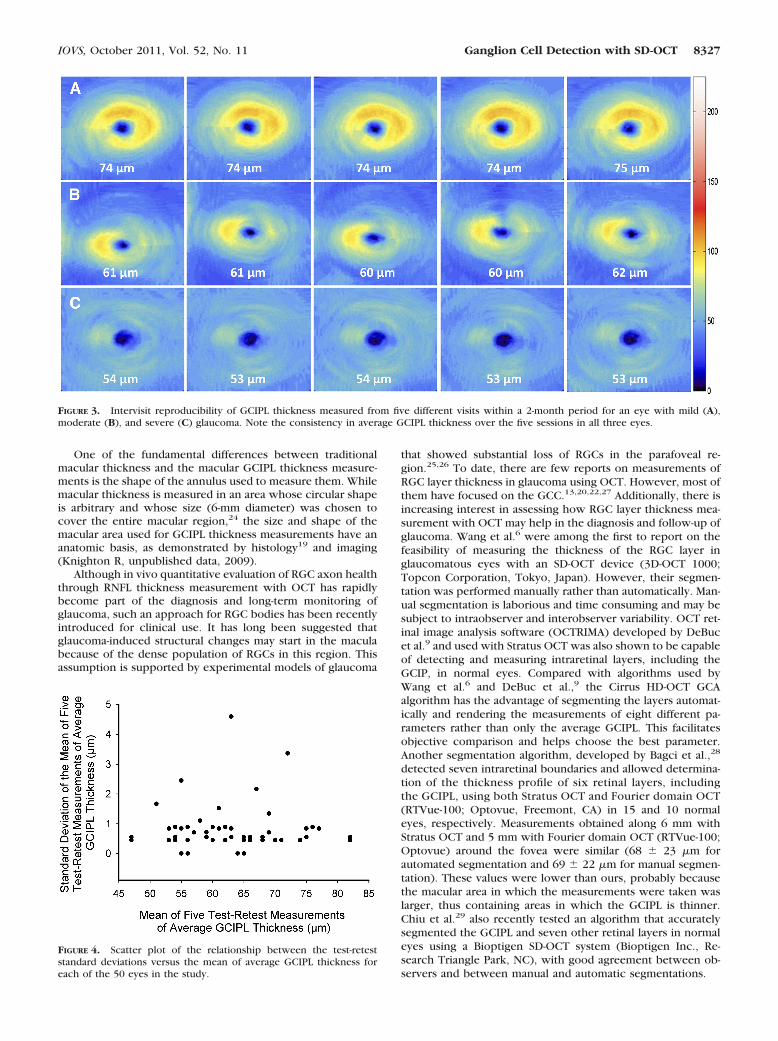
Intervisit means, TRTSDs, COVs, and ICCs of GCIPL thick-ness parameters are given in Table 2. All ICCs ranged between0.94 and 0.98, but ICCs for average GCIPL and superior param-eters (range, 0.96–0.98) were slightly higher than for inferiorparameters (range, 0.94–0.97). All COVs were �5%, with 1.8%for average GCIPL and COVs for superior parameters (range,2.2%–3.0%) slightly lower than those of inferior parameters(range, 2.5%–3.6%). The high reproducibility of the GCIPLthickness is illustrated in Figure 3. The TRTSD was lowest foraverage GCIPL (1.16) and varied from 1.43 (superior sector) to2.15 (inferior sector). Figure 4 plots the test-retest standarddeviations versus the means of average GCIPL thickness foreach of the 50 eyes in the study, showing no relationshipbetween test-retest variability and thickness. For purposes ofcomparison, the reproducibility statistics for RNFL measure-ments in the same group of patients appear at the bottom ofTable 2 and are similar to those of GCCIPL except for the nasalquadrant.
With regard to structure-function relationship, VF meandeviation significantly correlated with GCIL thickness of thesuperotemporal sector (r � 0.45; P � 0.001), minimum thick-
TABLE 1. Mean (SD) of GCIPL Thickness Parameters in Mild,Moderate, and Severe Glaucoma
GCIPParameters
Mean (SD)
One-wayANOVA PMild Moderate Severe
Average 68.5 (8.2) 62.3 (4.9) 56.0 (5.2) 0.156Minimum 61.0 (9.5) 52.1 (5.9) 48.9 (4.2) 0.031*Superotemporal 68.7 (8.0) 63.2 (5.5) 54.6 (6.4) 0.06Superior 72.3 (11.5) 64.0 (8.5) 57.5 (6.3) 0.266Superonasal 73.9 (9.6) 68.7 (9.9) 59.7 (8.1) 0.601Inferonasal 68.4 (9.2) 61.9 (7.6) 55.9 (5.9) 0.485Inferior 63.3 (9.4) 58.3 (8.5) 54.3 (5.2) 0.504Inferotemporal 63.6 (8.4) 57.4 (8.5) 53.3 (4.9) 0.030†
* Post hoc least significant difference tests demonstrated that themild group was different from the severe group (P � 0.012).
† Post hoc least significant difference tests demonstrated that themild group was different from the severe group (P � 0.017); the posthoc difference between mild and moderate was 0.059.
IOVS, October 2011, Vol. 52, No. 11 Ganglion Cell Detection with SD-OCT 8325
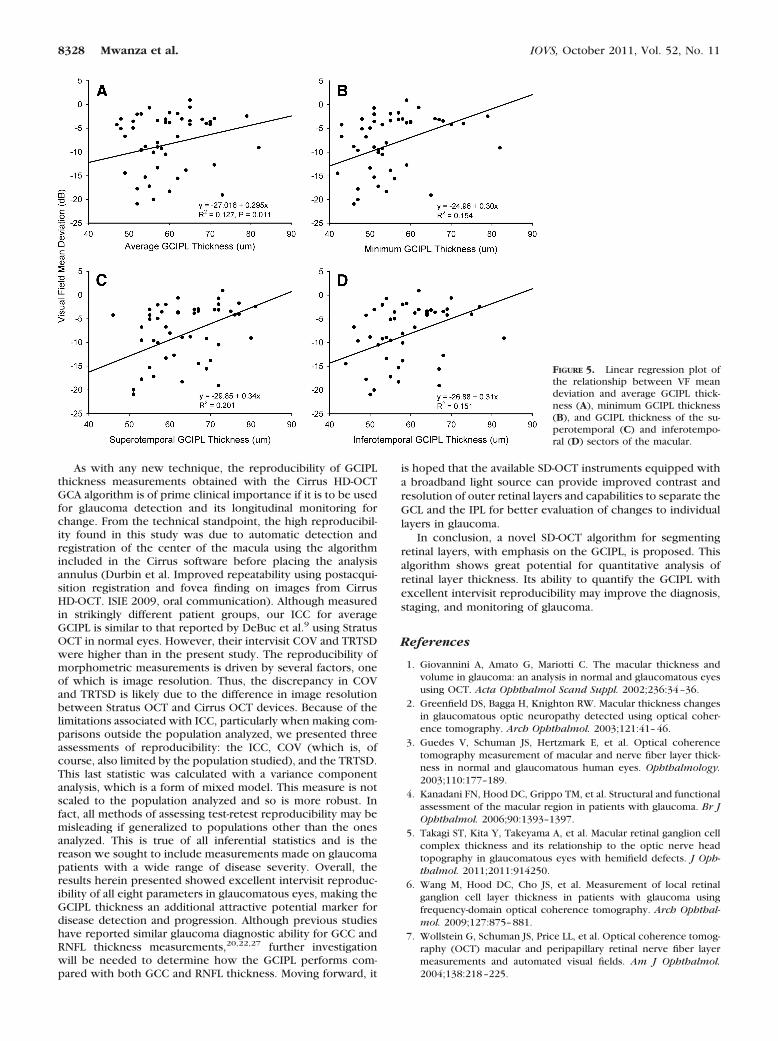
ness of the GCIPL (r � 0.39; P � 0.0.05), GCIPL thickness ofthe inferotemporal sector (r � 0.39; P � 0.005), and averageGCIPL (r � 0.36, P � 0.011) (Fig. 5). GCIPL thickness mea-surements in the superior, inferior, superonasal, and inferona-sal sectors of the annulus did not significantly correlate withretinal sensitivity (P � 0.05).
DISCUSSION
Several potentially blinding eye diseases, such as age-relatedmacular degeneration and glaucoma, cause structural changesin the retina and the choroid. Successful quantitative evalua-tion of these changes requires a segmentation-based determi-nation of the thicknesses of tissue layers. Thickness measure-ments of macular layers with OCT rely on the development ofrobust and accurate algorithms for the segmentation of in-traretinal layers. This is a time-consuming, difficult, and costlyprocess that includes a lot of calculations, verifications, andvalidations, which may explain the limited availability of thesealgorithms on most commercially available OCT devices. Forglaucoma patients, one of the most important layers that couldbe identified is the RGC. Thus, it is of paramount importancethat imaging devices used for detecting glaucoma-related struc-tural changes in the retina be able to identify this layer andmeasure its thickness. The results of the present study indicatethat the Cirrus GCA segmentation algorithm allows identifica-tion of macular intraretinal layers and measurement of GCIPLthickness parameters with excellent reproducibility. Althoughfurther studies are necessary, these results suggest that thisnew algorithm has the potential to be useful for objectivequantification of RGC damage in glaucoma.
FIGURE 2. GCIPL thickness maps (the denser the orange/yellow ring, the thicker the GCIPL) of a normal eye (A) and an eye with severe glaucoma(B). GCIPL deviation map (C) and significance map (D) of the same eye shown in B. The red on the deviation map indicates regions with GCIPLthickness outside normal limits. The significance map shows (clockwise) thicknesses of the superior, superonasal, inferonasal, inferior, infero-temporal, and superotemporal sectors of the annulus and the average and minimum GCIPL (box).
TABLE 2. Intervisit Means, TRTSD, COV, and ICC of GCIPL and RNFLThickness Parameters
Parameters Mean TRTSD (�m) COV (%) ICC (%)
Average GCIPL 62.9 1.16 1.8 0.98Minimum GCIPL 54.8 2.28 4.2 0.94Superotemporal GCIPL 62.8 1.87 3.0 0.96Superior GCIPL 65.2 1.43 2.2 0.98Superonasal GCIPL 67.9 1.80 2.7 0.97Inferonasal GCIPL 62.8 1.93 3.1 0.96Inferior GCIPL 59.1 2.15 3.6 0.94Inferotemporal GCIPL 58.6 1.48 2.5 0.97Average RNFL 62.5 1.64 2.6 0.97Temporal RNFL 46.6 2.89 6.2 0.93Inferior RNFL 69.4 2.91 4.2 0.97Superior RNFL 75.4 2.95 3.9 0.97Nasal RNFL 58.5 3.60 6.2 0.82
8326 Mwanza et al. IOVS, October 2011, Vol. 52, No. 11
One of the fundamental differences between traditionalmacular thickness and the macular GCIPL thickness measure-ments is the shape of the annulus used to measure them. Whilemacular thickness is measured in an area whose circular shapeis arbitrary and whose size (6-mm diameter) was chosen tocover the entire macular region,24 the size and shape of themacular area used for GCIPL thickness measurements have ananatomic basis, as demonstrated by histology19 and imaging(Knighton R, unpublished data, 2009).
Although in vivo quantitative evaluation of RGC axon healththrough RNFL thickness measurement with OCT has rapidlybecome part of the diagnosis and long-term monitoring ofglaucoma, such an approach for RGC bodies has been recentlyintroduced for clinical use. It has long been suggested thatglaucoma-induced structural changes may start in the maculabecause of the dense population of RGCs in this region. Thisassumption is supported by experimental models of glaucoma
that showed substantial loss of RGCs in the parafoveal re-gion.25,26 To date, there are few reports on measurements ofRGC layer thickness in glaucoma using OCT. However, most ofthem have focused on the GCC.13,20,22,27 Additionally, there isincreasing interest in assessing how RGC layer thickness mea-surement with OCT may help in the diagnosis and follow-up ofglaucoma. Wang et al.6 were among the first to report on thefeasibility of measuring the thickness of the RGC layer inglaucomatous eyes with an SD-OCT device (3D-OCT 1000;Topcon Corporation, Tokyo, Japan). However, their segmen-tation was performed manually rather than automatically. Man-ual segmentation is laborious and time consuming and may besubject to intraobserver and interobserver variability. OCT ret-inal image analysis software (OCTRIMA) developed by DeBucet al.9 and used with Stratus OCT was also shown to be capableof detecting and measuring intraretinal layers, including theGCIP, in normal eyes. Compared with algorithms used byWang et al.6 and DeBuc et al.,9 the Cirrus HD-OCT GCAalgorithm has the advantage of segmenting the layers automat-ically and rendering the measurements of eight different pa-rameters rather than only the average GCIPL. This facilitatesobjective comparison and helps choose the best parameter.Another segmentation algorithm, developed by Bagci et al.,28
detected seven intraretinal boundaries and allowed determina-tion of the thickness profile of six retinal layers, includingthe GCIPL, using both Stratus OCT and Fourier domain OCT(RTVue-100; Optovue, Freemont, CA) in 15 and 10 normaleyes, respectively. Measurements obtained along 6 mm withStratus OCT and 5 mm with Fourier domain OCT (RTVue-100;Optovue) around the fovea were similar (68 � 23 �m forautomated segmentation and 69 � 22 �m for manual segmen-tation). These values were lower than ours, probably becausethe macular area in which the measurements were taken waslarger, thus containing areas in which the GCIPL is thinner.Chiu et al.29 also recently tested an algorithm that accuratelysegmented the GCIPL and seven other retinal layers in normaleyes using a Bioptigen SD-OCT system (Bioptigen Inc., Re-search Triangle Park, NC), with good agreement between ob-servers and between manual and automatic segmentations.
FIGURE 3. Intervisit reproducibility of GCIPL thickness measured from five different visits within a 2-month period for an eye with mild (A),moderate (B), and severe (C) glaucoma. Note the consistency in average GCIPL thickness over the five sessions in all three eyes.
FIGURE 4. Scatter plot of the relationship between the test-reteststandard deviations versus the mean of average GCIPL thickness foreach of the 50 eyes in the study.
IOVS, October 2011, Vol. 52, No. 11 Ganglion Cell Detection with SD-OCT 8327
As with any new technique, the reproducibility of GCIPLthickness measurements obtained with the Cirrus HD-OCTGCA algorithm is of prime clinical importance if it is to be usedfor glaucoma detection and its longitudinal monitoring forchange. From the technical standpoint, the high reproducibil-ity found in this study was due to automatic detection andregistration of the center of the macula using the algorithmincluded in the Cirrus software before placing the analysisannulus (Durbin et al. Improved repeatability using postacqui-sition registration and fovea finding on images from CirrusHD-OCT. ISIE 2009, oral communication). Although measuredin strikingly different patient groups, our ICC for averageGCIPL is similar to that reported by DeBuc et al.9 using StratusOCT in normal eyes. However, their intervisit COV and TRTSDwere higher than in the present study. The reproducibility ofmorphometric measurements is driven by several factors, oneof which is image resolution. Thus, the discrepancy in COVand TRTSD is likely due to the difference in image resolutionbetween Stratus OCT and Cirrus OCT devices. Because of thelimitations associated with ICC, particularly when making com-parisons outside the population analyzed, we presented threeassessments of reproducibility: the ICC, COV (which is, ofcourse, also limited by the population studied), and the TRTSD.This last statistic was calculated with a variance componentanalysis, which is a form of mixed model. This measure is notscaled to the population analyzed and so is more robust. Infact, all methods of assessing test-retest reproducibility may bemisleading if generalized to populations other than the onesanalyzed. This is true of all inferential statistics and is thereason we sought to include measurements made on glaucomapatients with a wide range of disease severity. Overall, theresults herein presented showed excellent intervisit reproduc-ibility of all eight parameters in glaucomatous eyes, making theGCIPL thickness an additional attractive potential marker fordisease detection and progression. Although previous studieshave reported similar glaucoma diagnostic ability for GCC andRNFL thickness measurements,20,22,27 further investigationwill be needed to determine how the GCIPL performs com-pared with both GCC and RNFL thickness. Moving forward, it
is hoped that the available SD-OCT instruments equipped witha broadband light source can provide improved contrast andresolution of outer retinal layers and capabilities to separate theGCL and the IPL for better evaluation of changes to individuallayers in glaucoma.
In conclusion, a novel SD-OCT algorithm for segmentingretinal layers, with emphasis on the GCIPL, is proposed. Thisalgorithm shows great potential for quantitative analysis ofretinal layer thickness. Its ability to quantify the GCIPL withexcellent intervisit reproducibility may improve the diagnosis,staging, and monitoring of glaucoma.
References
1. Giovannini A, Amato G, Mariotti C. The macular thickness andvolume in glaucoma: an analysis in normal and glaucomatous eyesusing OCT. Acta Ophthalmol Scand Suppl. 2002;236:34–36.
2. Greenfield DS, Bagga H, Knighton RW. Macular thickness changesin glaucomatous optic neuropathy detected using optical coher-ence tomography. Arch Ophthalmol. 2003;121:41–46.
3. Guedes V, Schuman JS, Hertzmark E, et al. Optical coherencetomography measurement of macular and nerve fiber layer thick-ness in normal and glaucomatous human eyes. Ophthalmology.2003;110:177–189.
4. Kanadani FN, Hood DC, Grippo TM, et al. Structural and functionalassessment of the macular region in patients with glaucoma. Br JOphthalmol. 2006;90:1393–1397.
5. Takagi ST, Kita Y, Takeyama A, et al. Macular retinal ganglion cellcomplex thickness and its relationship to the optic nerve headtopography in glaucomatous eyes with hemifield defects. J Oph-thalmol. 2011;2011:914250.
6. Wang M, Hood DC, Cho JS, et al. Measurement of local retinalganglion cell layer thickness in patients with glaucoma usingfrequency-domain optical coherence tomography. Arch Ophthal-mol. 2009;127:875–881.
7. Wollstein G, Schuman JS, Price LL, et al. Optical coherence tomog-raphy (OCT) macular and peripapillary retinal nerve fiber layermeasurements and automated visual fields. Am J Ophthalmol.2004;138:218–225.
FIGURE 5. Linear regression plot ofthe relationship between VF meandeviation and average GCIPL thick-ness (A), minimum GCIPL thickness(B), and GCIPL thickness of the su-perotemporal (C) and inferotempo-ral (D) sectors of the macular.
8328 Mwanza et al. IOVS, October 2011, Vol. 52, No. 11
8. Zeimer R, Asrani S, Zou S, et al. Quantitative detection of glauco-matous damage at the posterior pole by retinal thickness mapping:a pilot study. Ophthalmology. 1998;105:224–231.
9. DeBuc DC, Somfai GM, Ranganathan S, et al. Reliability and repro-ducibility of macular segmentation using a custom-built opticalcoherence tomography retinal image analysis software. J BiomedOpt. 2009;14:064023.
10. Fabritius T, Makita S, Miura M, et al. Automated segmentation ofthe macula by optical coherence tomography. Opt Express. 2009;17:15659–15669.
11. Garvin MK, Abramoff MD, Kardon R, et al. Intraretinal layer seg-mentation of macular optical coherence tomography images usingoptimal 3-D graph search. IEEE Trans Med Imaging. 2008;27:1495–1505.
12. Garvin MK, Abramoff MD, Wu X, et al. Automated 3-D intraretinallayer segmentation of macular spectral-domain optical coherencetomography images. IEEE Trans Med Imaging. 2009;28:1436–1447.
13. Ishikawa H, Stein DM, Wollstein G, et al. Macular segmentationwith optical coherence tomography. Invest Ophthalmol Vis Sci.2005;46:2012–2017.
14. Kajic V, Povazay B, Hermann B, et al. Robust segmentation ofintraretinal layers in the normal human fovea using a novel statis-tical model based on texture and shape analysis. Opt Express.2010;18:14730–14744.
15. Mishra A, Wong A, Bizheva K, et al. Intra-retinal layer segmentationin optical coherence tomography images. Opt Express. 2009;17:23719–23728.
16. Quellec G, Lee K, Dolejsi M, et al. Three-dimensional analysis ofretinal layer texture identification of fluid-filled regions in SD-OCTof the macula. IEEE Trans Med Imaging. 2010;29:1321–1330.
17. Rossant F, Ghorbel I, Bloch I, et al. Automated segmentation ofretinal layers in OCT imaging and derived ophthalmic measures.IEEE Trans Med Imaging. 2009;28:1370–1373.
18. Yazdanpanah A, Hamarneh G, Smith B, et al. Intra-retinal layersegmentation in optical coherence tomography using an active
contour approach. Med Image Comput Comput Assist Interv.2009;12:649–656.
19. Curcio CA, Allen KA. Topography of ganglion cells in humanretina. J Comp Neurol. 1990;300:5–25.
20. Kim NR, Lee ES, Seong GJ, et al. Structure-function relationshipand diagnostic value of macular ganglion cell complex measure-ment using Fourier-domain OCT in glaucoma. Invest OphthalmolVis Sci. 2010;51:4646–4651.
21. Seong M, Sung KR, Choi EH, et al. Macular and peripapillary retinalnerve fiber layer measurements by spectral domain optical coher-ence tomography in normal-tension glaucoma. Invest OphthalmolVis Sci. 2010;51:1446–1452.
22. Tan O, Chopra V, Lu AT, et al. Detection of macular ganglion cellloss in glaucoma by Fourier-domain optical coherence tomogra-phy. Ophthalmology. 2009;116:2305–2314.
23. Hodapp E, Parrish RKI, Anderson DR. Clinical Decisions in Glau-coma. St. Louis: Mosby-Year Book; 1993.
24. Klein R, Davis MD, Magli YL, et al. The Wisconsin age-relatedmaculopathy grading system. Ophthalmology. 1991;98:1128–1134.
25. Desatnik H, Quigley HA, Glovinsky Y. Study of central retinalganglion cell loss in experimental glaucoma in monkey eyes. JGlaucoma. 1996;5:46–53.
26. Frishman LJ, Shen FF, Du L, et al. The scotopic electroretinogramof macaque after retinal ganglion cell loss from experimentalglaucoma. Invest Ophthalmol Vis Sci. 1996;37:125–141.
27. Tan O, Li G, Lu AT, et al. Mapping of macular substructures withoptical coherence tomography for glaucoma diagnosis. Ophthal-mology. 2008;115:949–956.
28. Bagci AM, Shahidi M, Ansari R, et al. Thickness profiles of retinallayers by optical coherence tomography image segmentation.Am J Ophthalmol. 2008;146:679–687.
29. Chiu SJ, Li XT, Nicholas P, et al. Automatic segmentation of sevenretinal layers in SDOCT images congruent with expert manualsegmentation. Opt Express. 2010;18:19413–19428.
IOVS, October 2011, Vol. 52, No. 11 Ganglion Cell Detection with SD-OCT 8329
Copyright © 2022 FDOKUMEN