
Reproducibility of magnetic resonance fingerprinting-based ...
Upload
independentCategory
view
4download
0
C
Original article 1993
Reproducibility of the ambula
tory arterial stiffness index inhypertensive patientsDirk G. Decheringa,b, Marijke S. van der Steena, Ahmet Adiyamana,Lutgarde Thijsb, Jaap Deinuma, Yan Lic, Eamon Doland,Reinier P.M. Akkermansa, Tom Richartb,e, Tine W. Hansenf, Masahiro Kikuyag,Jiguang Wangc, Eoin O’Brienh, Theo Thiena and Jan A. Staessenb,eBackground We studied the repeatability of the ambulatory
arterial stiffness index (AASI), which can be computed from
24-h blood pressure (BP) recordings as unity minus the
regression slope of diastolic on systolic BP.
Methods One hundred and fifty-two hypertensive
outpatients recruited in Nijmegen (mean age U 46.2 years;
76.3% with systolic and diastolic hypertension) and 145
patients enrolled in the Systolic Hypertension in Europe
(Syst-Eur) trial (71.0 years) underwent 24-h BP monitoring
at a median interval of 8 and 31 days, respectively. We used
the repeatability coefficient, which is twice the SD of the
within-participant differences between repeat recordings,
and expressed it as a percentage of four times the SD of the
mean of the paired measurements.
Results Mean AASI (crude or derived by time-weighted or
robust regression) and 24-h pulse pressure (PP) were
similar on repeat recordings in both cohorts. In Nijmegen
patients, repeatability coefficients of AASI and PP were
�50%. In Syst-Eur trial patients, repeatability coefficient
was �60% for AASI and �40% for PP. For comparison,
repeatability coefficients for 24-h systolic and diastolic BP
were�30%. Differences in AASI between paired recordings
were correlated with differences in the goodness of fit (r2) of
the AASI regression line as well as with differences in the
night-to-day BP ratio. However, in sensitivity analyses
stratified for type of hypertension, r2, or dipping status,
repeatability coefficients for AASI did not widely depart from
50 to 60% range.
opyright © Lippincott Williams & Wilkins. Unauth
0263-6352 � 2008 Wolters Kluwer Health | Lippincott Williams & Wilkins
Conclusion Estimates of mean AASI were not different
between repeat recordings, and repeatability coefficients
were within the 50–60% range. J Hypertens 26:1993–2000 Q
2008 Wolters Kluwer Health | Lippincott Williams & Wilkins.
Journal of Hypertension 2008, 26:1993–2000
Keywords: ambulatory arterial stiffness index, ambulatory blood pressuremonitoring, arterial stiffness, diurnal blood pressure profile, reproducibility
Abbreviations: AASI, ambulatory arterial stiffness index; baPWV, brachial-ankle pulse wave velocity; cAIX, carotid augmentation index; IDACO,International Database on Ambulatory BP monitoring in relation toCardiovascular Outcomes; IQR, interquartile range; QKD, QRS-Korotkoffdelay; SDD, standard deviation of differences; Syst-Eur, SYSTolichypertension in EURope trial
aDepartment of General Internal Medicine, University Medical Centre StRadboud, Radboud University, Nijmegen, The Netherlands, bStudiesCoordinating Centre, Division of Hypertension and Cardiovascular Rehabilitation,Department of Cardiovascular Diseases, University of Leuven, Leuven, Belgium,cCenter for Epidemiological Studies and Clinical Trials, Ruijin Hospital, ShanghaiJiaotong University School of Medicine, Shanghai, China, dCambridge UniversityHospitals, Addenbrook’s Hospital, Cambridge, UK, eGenetic Epidemiology Unit,Department of Epidemiology, Maastricht University, The Netherlands, fResearchCenter for Prevention and Health, and Department of Clinical Physiology,Hvidovre University Hospital, Copenhagen, Denmark, gTohoku UniversityGraduate School of Pharmaceutical Sciences and Medicine, Sendai, Japan andhConway Institute of Biomolecular and Biomedical Research, University CollegeDublin, Dublin, Ireland
Correspondence to Jan Staessen, Division of Hypertension and CardiovascularRehabilitation, Department of Cardiovascular Diseases, University of Leuven,Campus Gasthuisberg, Herestraat 49, Box 702, B-3000 Leuven, BelgiumTel: +32 16 34 7104; fax: +32 16 34 7106;e-mail: [email protected]
Received 14 February 2008 Revised 7 May 2008Accepted 23 May 2008
IntroductionIncreased arterial stiffness of the large arteries predicts
cardiovascular complications over and beyond blood pres-
sure (BP) and classical cardiovascular risk factors [1].
Nevertheless, risk stratification based on arterial stiffness
remains underused in clinical practice because most
techniques to measure arterial properties require expens-
ive equipment and highly trained observers. We recently
proposed the ambulatory arterial stiffness index (AASI) as
a measure reflecting arterial stiffness [2,3]. This novel
index, defined as one minus the regression slope of
diastolic on systolic BP in individual subjects, can be
determined from 24-h ambulatory BP recordings [2,3].
To date, several cross-sectional studies [4,5] and at least
three prospective cohort studies [3,6,7] demonstrated an
association of AASI either with signs of target organ
damage in never-treated hypertensive patients [4] or with
the incidence of cardiovascular mortality and morbidity
[3,6,7]. When adjusted for pulse pressure (PP) [3,6,7] or
aortic pulse wave velocity [8], AASI remained predictive,
in particular of stroke.
To our knowledge, no previous publication has addressed
the reproducibility of AASI as determined from repeat
ambulatory BP recordings. We investigated the reprodu-
cibility of AASI in patients with systolic and/or diastolic
orized reproduction of this article is prohibited.
DOI:10.1097/HJH.0b013e328309ee4c
C
1994 Journal of Hypertension 2008, Vol 26 No 10
hypertension recruited in Nijmegen and in older patients
with isolated systolic hypertension enrolled in a substudy
to the Systolic Hypertension in Europe (Syst-Eur) trial.
MethodsStudy populationPatients referred to the outpatient clinic of the University
Medical Centre St Radboud, Nijmegen, the Netherlands
[9], and patients enrolled in the substudy on ambulatory
BP measurement to the Syst-Eur trial [10] qualified for
the present analysis, if they had undergone repeat 24-h
ambulatory recordings within 2 months, while being
untreated [9,10] or minimally treated [9] with no change
in treatment status between the first and repeat recording.
Nijmegen cohort
At the Nijmegen outpatient clinic, doctors discontinued
BP-lowering drugs in newly referred patients, except
when there was a compelling indication, such as the
use of b-blockers in patients with angina pectoris (‘mini-
mal treatment’). The office BP was then reassessed by
obtaining three consecutive measurements at two to
three follow-up visits. Of 1325 consecutive patients
attending the Nijmegen clinic, 275 underwent repeat
ambulatory BP measurement within 2 months. Of those,
we excluded 33 (12.0%) from analysis because their
treatment status changed between the first and repeat
recording, and 56 (20.4%) because over the whole day the
mean interval between the ambulatory BP readings was
shorter than 15 min or longer than 45 min.
The Systolic Hypertension in Europe trial cohort
Previous publications describe the protocol of the Syst-
Eur trial in detail [10]. Eligible patients were aged 60 years
or older. They had a sitting BP ranging from 160 to
219 mmHg systolic and less than 95 mmHg diastolic.
The standing systolic BP had to be at least 140 mmHg.
Of 837 patients [10] enrolled in the substudy on ambu-
latory BP monitoring, 153 (18.3%) had repeat recordings
within 2 months, while taking placebo.
Blood pressure measurementTrained observers measured the patients’ office BP at
repeated visits. To describe the patients’ conventional
BP, we used the average of six to nine readings (three
readings at two to three visits) in the Nijmegen cohort [9]
and the average of six readings (two readings at three
visits) in Syst-Eur trial patients [10]. For the definition of
hypertension in the sensitivity analyses, we applied cur-
rent guidelines [11]. Isolated systolic hypertension was a
BP of 140 mmHg systolic or higher with diastolic BP
below 90 mmHg.
For analysis, we considered ambulatory BP recordings with
the interval between successive readings programmed at
intervals from 15 to 30 min during daytime and from 30 to
60 min during nighttime. We only analysed recordings
opyright © Lippincott Williams & Wilkins. Unautho
with at least five readings between midnight and
06:00 h. In addition, we required that the recordings
included at least 15 daytime readings. On the basis of
these quality criteria, we excluded 34 patients from the
Nijmegen cohort (12.4%) and eight Syst-Eur trial patients
(5.2%). Thus, the number of patients analysed totalled
297, that is 152 patients from Nijmegen and 145 Syst-Eur
trial patients.
The validated monitors used in Nijmegen were the
auscultatory Oxford Medilog (Oxford Medical Systems
Ltd, Oxford, UK [12]) in 54 patients (35.5%), the oscillo-
metric Mobil O Graph (I.E.M., Stolberg, Germany [13])
in 43 patients (28.3%), and the oscillometric SpaceLabs
90207 (SpaceLabs Inc., Redmond, Washington, USA
[14]) in 55 patients (36.2%). The monitors fitted to
Syst-Eur trial patients were the oscillometric SpaceLabs
90202 [14] or 90207 [15] in 49 patients (35.5%) and
78 patients (56.5%), respectively, and the auscultatory
Takeda TM2420 (A&D, Tokyo, Japan [16]) in 11 patients
(3.7%).
The same SAS macro processed all ambulatory record-
ings, which stayed unedited. For the sensitivity analysis
involving dipping status, we defined daytime and night-
time in both cohorts as the intervals ranging from 10:00 to
20:00 h and from midnight to 06:00 h, respectively
[17,18]. We weighted the individual means of the ambu-
latory BP by the interval between readings.
From individual 24-h recordings, we computed the
regression slope of diastolic on systolic BP. We defined
the AASI as one minus the regression slope (crude AASI).
We used the coefficient of determination (r2) as a
measure of the goodness of fit of the AASI regression
line. We also computed AASI, using time-weighted or
robust regression (least trimmed squares).
Statistical methodsFor database management and statistical analysis, we
used SAS software (version 9.1.3; SAS Institute, Cary,
North Carolina, USA). For comparison of means, we
applied the Student’s t-test for paired or unpaired obser-
vations, as appropriate. For comparison of proportions
between groups, we applied the x2-statistic. Statistical
significance was an a-level of 0.05 on two-sided tests.
We assessed the agreement between paired ambulatory
recordings by Bland and Altman’s approach [19,20]. For
the evaluation of reproducibility, we used the repeat-
ability coefficient, which is twice the SD of the within-
participant differences between repeat recordings (repeat
minus first) [21]. This measure is specifically designed to
evaluate within-participant reproducibility. To take into
consideration the normal biological variation of a
measure, we expressed the repeatability coefficient as
a percentage of close to maximal variation (four times the
rized reproduction of this article is prohibited.
C
Reproducibility of AASI Dechering et al. 1995
Table 1 Characteristics of patients at first ambulatory recording
Characteristic Nijmegen Syst-Eur P
Number of participants 152 145Mean (SD) of characteristic
Age (years) 46.2�13.6 71.0�6.5 <0.0001Weight (kg) 77.9�15.3 69.4�13.6 <0.0001Height (cm) 170�9 162�10 <0.0001Body mass index (kg/m2) 26.8�4.7 26.4�4.2 0.46Office systolic BP (mmHg) 168.6�25.1 178.4�16.6 <0.0001Office diastolic BP (mmHg) 101.2�11.4 85.4�9.0 <0.0001Pulse rate (beats per minute) 72.9�12.5 73.5�11.1 0.35
Number of participants (%) with characteristicWomen, n (%) 89 (58.6) 89 (61.4) 0.62Smokers, n (%) 21 (14.2) 15 (10.3) 0.32Drinking alcohol, n (%) 22 (14.5) 34 (23.8) 0.05On BP lowering drugs, n (%) 18 (11.8) 0 (0.0) <0.0001Diabetes mellitus, n (%) 11 (7.2) 11 (7.6) 0.99
Classification of hypertensiona
Isolated systolic, n (%) 17 (11.2) 100 (69.0) <0.0001Isolated diastolic, n (%) 12 (7.9) 0 (0.0) 0.001Mixed, n (%) 116 (76.3) 44 (30.3) <0.0001
History of cardiovascular disease, n (%) 22 (14.5) 44 (30.3) 0.001
P values are for the differences between the patients enrolled in the Nijmegencohort and in the Syst-Eur trial. AASI, ambulatory arterial stiffness index. a A total ofseven patients in Nijmegen and one from the Systolic Hypertension in Europe(Syst-Eur) trial were not hypertensive on clinic blood pressure (BP) measurementwhen taking into account current hypertension guidelines.
SD of the mean of the duplicate measurements). By this,
a reasonable comparison of the repeatability of different
measures can be undertaken.
We also applied single and multiple regression analysis.
In stepwise regression, we set the P-value for indepen-
dent variables to enter and to stay into models at 0.15. We
studied the coincidence of regression lines by analysis of
covariance, as described by Kleinbaum et al. [22].
ResultsPatient characteristicsTable 1 lists the main clinical characteristics of the two
study cohorts. Both groups of patients included nearly
60% of women. Compared with Syst-Eur trial patients,
the Nijmegen patients were younger (46.2 versus 71.0
opyright © Lippincott Williams & Wilkins. Unauth
Table 2 Differences between repeat minus first ambulatory measurem
First Repeat P
Nijmegen (n¼152)Crude AASI 0.47�0.16 0.45�0.17 0.13Time-weighted AASI 0.47�0.16 0.43�0.17 0.10Robust AASI 0.43�0.17 0.42�0.19 0.2824-h systolic BP (mmHg) 150.1�19.2 148.6�18.4 0.0924-h diastolic BP (mmHg) 94.2�13.1 92.7�12.6 0.0024-h PP (mmHg) 56.0�12.1 55.9�12.5 0.88
Syst-Eur trial (n¼145)Crude AASI 0.52�0.19 0.51�0.20 0.40Time-weighted AASI 0.52�0.20 0.51�0.20 0.29Robust AASI 0.55�0.16 0.54�0.15 0.6624-h systolic BP (mmHg) 154.7�15.4 153.4�15.7 0.0924-h diastolic BP (mmHg) 81.1�9.7 80.4�8.9 0.1224-h PP (mmHg) 73.6�12.2 73.0�12.9 0.24
Plus–minus values are mean�SD. Absolute differences (D) were computed as repeat mdifferences between the duplicate measurements. RC was also expressed as a percambulatory arterial stiffness index; BP, blood pressure; CI, confidence interval; PP, pu
years), taller (170 versus 162 cm), heavier (77.9 versus
69.4 kg), but had similar body mass index (26.8 versus
26.4 kg/m2).
In line with the recruitment criteria based on office BP,
Syst-Eur compared with Nijmegen patients (Table 1)
had higher systolic BP (178.4 versus 168.6 mmHg) on
conventional measurement, but lower diastolic BP (85.4
versus 101.2 mmHg). A history of cardiovascular disease
was more prevalent among the older Syst-Eur trial
patients (30.3 versus 14.5%). Table 2 shows that Syst-
Eur trial patients on average had higher AASI than
Nijmegen patients, irrespective of the way AASI was
computed (all P< 0.008).
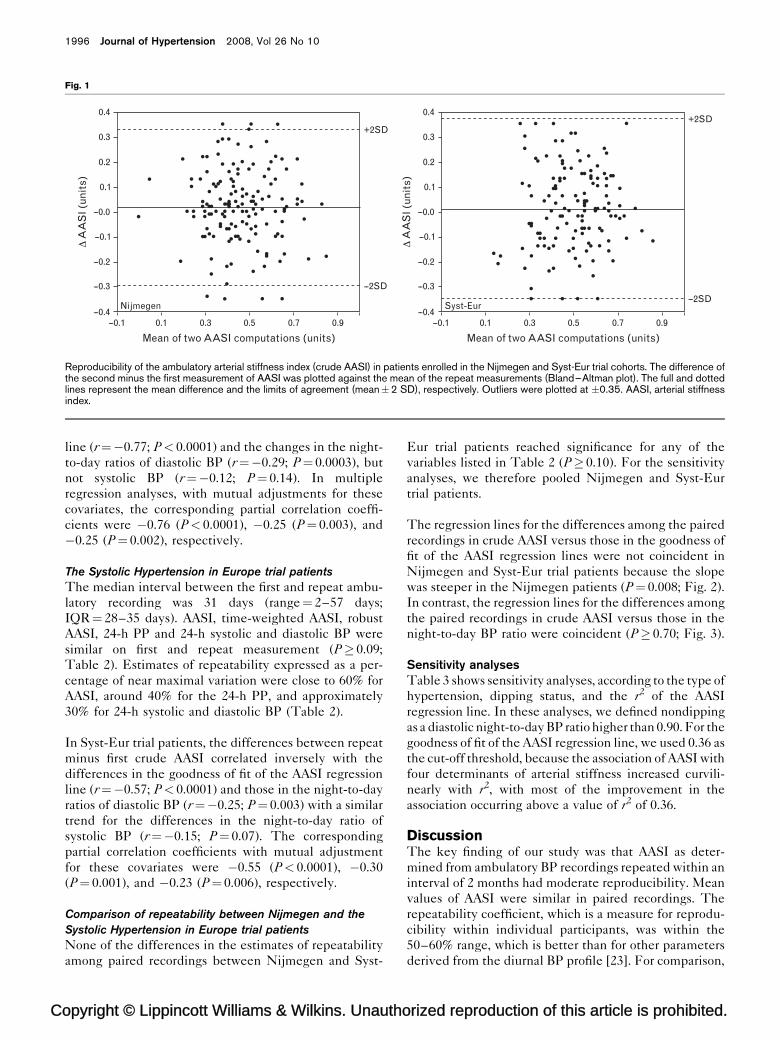
Repeatability of ambulatory measurementsFigure 1 provides Bland and Altman plots for the crude
AASI in Nijmegen and Syst-Eur trial patients, respect-
ively. Detailed repeatability statistics appear in Table 2.
Nijmegen cohort
The median interval between the first and repeat ambu-
latory recording was 8 days [range¼ 4–60 days; interquar-
tile range (IQR)¼ 7–15 days]. AASI, time-weighted AASI,
robust AASI and 24-h PP were similar on first and repeat
measurement (P� 0.10; Table 2). The 24-h diastolic BP
was significantly lower on repeat than first recording
(�1.43 mmHg; P¼ 0.009) with a similar trend for the
24-h systolic BP (�1.51 mmHg; P¼ 0.09). The repeatabil-
ity of AASI and 24-h PP expressed as a percentage of the
near maximal variation in these measurements (the inter-
val corresponding with �2SD around the mean of the
repeat recordings) ranged from approximately 45 to 55%.
The corresponding repeatability estimate for the 24-h
systolic and diastolic BP was around 30% (Table 2).
In Nijmegen patients, the differences between repeat
minus first crude AASI correlated inversely with the
differences in the goodness of fit of the AASI regression
orized reproduction of this article is prohibited.
ent
DAbsolute 95% CI RC pMV (%)
�0.02�0.16 �0.04 to 0.01 0.32 55�0.02�0.16 �0.05 to 0.01 0.32 55�0.01�0.15 �0.04 to 0.01 0.30 46�1.51�10.7 �3.23 to 0.21 21.4 30
9 �1.43�6.69 �2.50 to �0.36 13.4 27�0.08�7.00 �1.15 to 0.99 14.0 52
�0.02�0.20 �0.05 to 0.02 0.40 61�0.02�0.20 �0.05 to 0.02 0.40 61�0.01�0.16 �0.03 to 0.02 0.32 62�1.30�9.11 �2.79 to 0.20 18.2 31�0.71�5.95 �1.68 to 0.19 11.9 33�1.45�9.21 �1.71 to 0.32 18.4 37
inus first recording. The repeatability coefficient (RC) is twice the SD of the signedentage of four times the SD of the mean of the paired recordings (pMV). AASI,lse pressure; Syst-Eur, Systolic Hypertension in Europe.
C
1996 Journal of Hypertension 2008, Vol 26 No 10
Fig. 1
0.4
0.3+2SD
--2SD
0.2
0.1
Δ A
AS
I (un
its)
--0.0
--0.1
--0.2
--0.3
--0.4--0.1 0.1
Nijmegen
Mean of two AASI computations (units)
0.4
0.3
+2SD
--2SD
0.2
0.1
Δ A
AS
I (un
its)
--0.0
--0.1
--0.2
--0.3
--0.4Syst-Eur
Mean of two AASI computations (units)0.3 0.5 0.7 0.9 --0.1 0.1 0.3 0.5 0.7 0.9
Reproducibility of the ambulatory arterial stiffness index (crude AASI) in patients enrolled in the Nijmegen and Syst-Eur trial cohorts. The difference ofthe second minus the first measurement of AASI was plotted against the mean of the repeat measurements (Bland–Altman plot). The full and dottedlines represent the mean difference and the limits of agreement (mean�2 SD), respectively. Outliers were plotted at �0.35. AASI, arterial stiffnessindex.
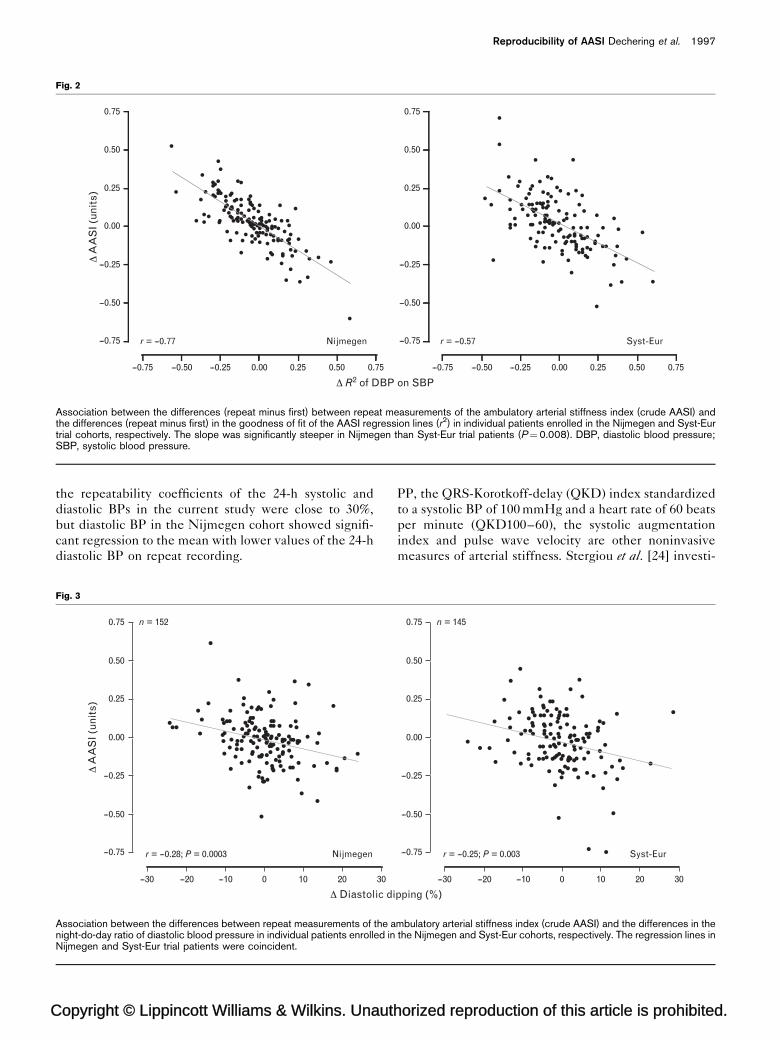
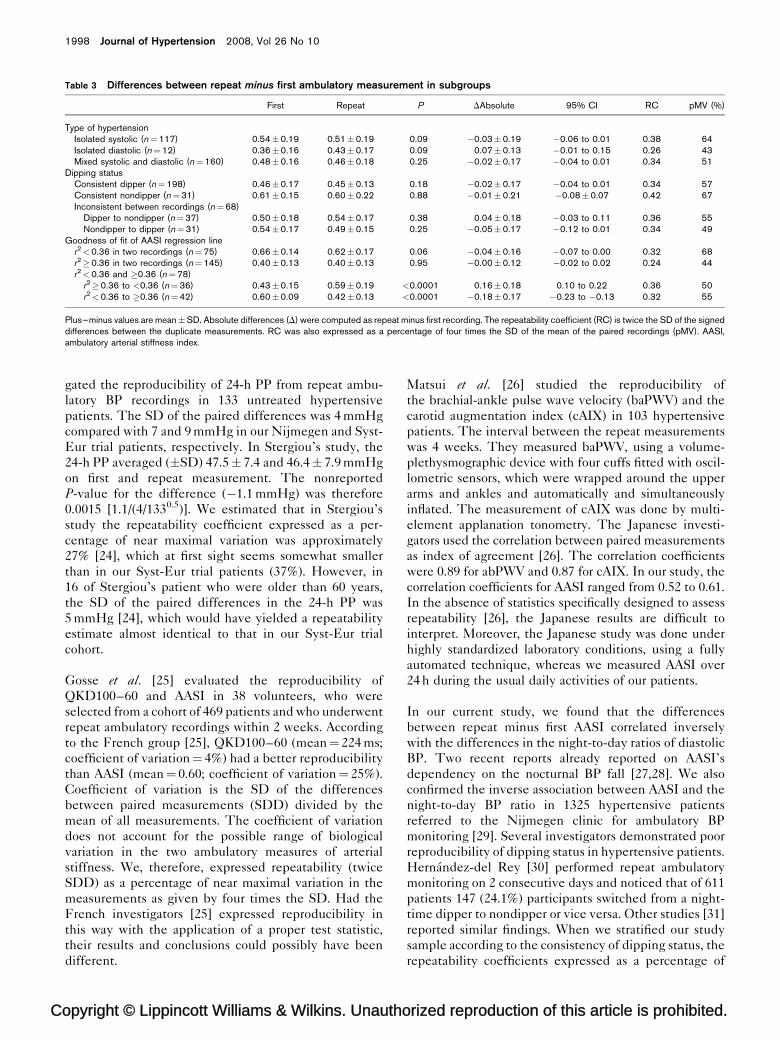
line (r¼�0.77; P< 0.0001) and the changes in the night-
to-day ratios of diastolic BP (r¼�0.29; P¼ 0.0003), but
not systolic BP (r¼�0.12; P¼ 0.14). In multiple
regression analyses, with mutual adjustments for these
covariates, the corresponding partial correlation coeffi-
cients were �0.76 (P< 0.0001), �0.25 (P¼ 0.003), and
�0.25 (P¼ 0.002), respectively.
The Systolic Hypertension in Europe trial patients
The median interval between the first and repeat ambu-
latory recording was 31 days (range¼ 2–57 days;
IQR¼ 28–35 days). AASI, time-weighted AASI, robust
AASI, 24-h PP and 24-h systolic and diastolic BP were
similar on first and repeat measurement (P� 0.09;
Table 2). Estimates of repeatability expressed as a per-
centage of near maximal variation were close to 60% for
AASI, around 40% for the 24-h PP, and approximately
30% for 24-h systolic and diastolic BP (Table 2).
In Syst-Eur trial patients, the differences between repeat
minus first crude AASI correlated inversely with the
differences in the goodness of fit of the AASI regression
line (r¼�0.57; P< 0.0001) and those in the night-to-day
ratios of diastolic BP (r¼�0.25; P¼ 0.003) with a similar
trend for the differences in the night-to-day ratio of
systolic BP (r¼�0.15; P¼ 0.07). The corresponding
partial correlation coefficients with mutual adjustment
for these covariates were �0.55 (P< 0.0001), �0.30
(P¼ 0.001), and �0.23 (P¼ 0.006), respectively.
Comparison of repeatability between Nijmegen and the
Systolic Hypertension in Europe trial patients
None of the differences in the estimates of repeatability
among paired recordings between Nijmegen and Syst-
opyright © Lippincott Williams & Wilkins. Unautho
Eur trial patients reached significance for any of the
variables listed in Table 2 (P� 0.10). For the sensitivity
analyses, we therefore pooled Nijmegen and Syst-Eur
trial patients.
The regression lines for the differences among the paired
recordings in crude AASI versus those in the goodness of
fit of the AASI regression lines were not coincident in
Nijmegen and Syst-Eur trial patients because the slope
was steeper in the Nijmegen patients (P¼ 0.008; Fig. 2).
In contrast, the regression lines for the differences among
the paired recordings in crude AASI versus those in the
night-to-day BP ratio were coincident (P� 0.70; Fig. 3).
Sensitivity analysesTable 3 shows sensitivity analyses, according to the type of
hypertension, dipping status, and the r2 of the AASI
regression line. In these analyses, we defined nondipping
as a diastolic night-to-day BP ratio higher than 0.90. For the
goodness of fit of the AASI regression line, we used 0.36 as
the cut-off threshold, because the association of AASI with
four determinants of arterial stiffness increased curvili-
nearly with r2, with most of the improvement in the
association occurring above a value of r2 of 0.36.
DiscussionThe key finding of our study was that AASI as deter-
mined from ambulatory BP recordings repeated within an
interval of 2 months had moderate reproducibility. Mean
values of AASI were similar in paired recordings. The
repeatability coefficient, which is a measure for reprodu-
cibility within individual participants, was within the
50–60% range, which is better than for other parameters
derived from the diurnal BP profile [23]. For comparison,
rized reproduction of this article is prohibited.
C
Reproducibility of AASI Dechering et al. 1997
Fig. 2
0.75
0.50
0.25
Δ A
AS
I (un
its)
0.00
--0.25
--0.50
--0.75
--0.75 --0.50 --0.25 0.00 0.25 0.50 0.75
Δ R2 of DBP on SBP
Nijmegenr = --0.77
0.75
0.50
0.25
0.00
--0.25
--0.50
--0.75
--0.75 --0.50 --0.25 0.00 0.25 0.50 0.75
Syst-Eurr = --0.57
Association between the differences (repeat minus first) between repeat measurements of the ambulatory arterial stiffness index (crude AASI) andthe differences (repeat minus first) in the goodness of fit of the AASI regression lines (r2) in individual patients enrolled in the Nijmegen and Syst-Eurtrial cohorts, respectively. The slope was significantly steeper in Nijmegen than Syst-Eur trial patients (P¼0.008). DBP, diastolic blood pressure;SBP, systolic blood pressure.
the repeatability coefficients of the 24-h systolic and
diastolic BPs in the current study were close to 30%,
but diastolic BP in the Nijmegen cohort showed signifi-
cant regression to the mean with lower values of the 24-h
diastolic BP on repeat recording.
opyright © Lippincott Williams & Wilkins. Unauth
Fig. 3
0.75
Δ A
AS
I (un
its)
n = 152
r = --0.28; P = 0.0003 Nijmegen
0.50
0.25
0.00
--0.25
--0.50
--0.75
--30 --20 --10 0 10 20
Δ Diastolic di30
Association between the differences between repeat measurements of the anight-do-day ratio of diastolic blood pressure in individual patients enrolled inNijmegen and Syst-Eur trial patients were coincident.
PP, the QRS-Korotkoff-delay (QKD) index standardized
to a systolic BP of 100 mmHg and a heart rate of 60 beats
per minute (QKD100–60), the systolic augmentation
index and pulse wave velocity are other noninvasive
measures of arterial stiffness. Stergiou et al. [24] investi-
orized reproduction of this article is prohibited.
pping (%)
0.75 n = 145
r = --0.25; P = 0.003 Syst-Eur
0.50
0.25
0.00
--0.25
--0.50
--0.75
--30 --20 --10 0 10 20 30
mbulatory arterial stiffness index (crude AASI) and the differences in thethe Nijmegen and Syst-Eur cohorts, respectively. The regression lines in
C
1998 Journal of Hypertension 2008, Vol 26 No 10
Table 3 Differences between repeat minus first ambulatory measurement in subgroups
First Repeat P DAbsolute 95% CI RC pMV (%)
Type of hypertensionIsolated systolic (n¼117) 0.54�0.19 0.51�0.19 0.09 �0.03�0.19 �0.06 to 0.01 0.38 64Isolated diastolic (n¼12) 0.36�0.16 0.43�0.17 0.09 0.07�0.13 �0.01 to 0.15 0.26 43Mixed systolic and diastolic (n¼160) 0.48�0.16 0.46�0.18 0.25 �0.02�0.17 �0.04 to 0.01 0.34 51
Dipping statusConsistent dipper (n¼198) 0.46�0.17 0.45�0.13 0.18 �0.02�0.17 �0.04 to 0.01 0.34 57Consistent nondipper (n¼31) 0.61�0.15 0.60�0.22 0.88 �0.01�0.21 �0.08�0.07 0.42 67Inconsistent between recordings (n¼68)
Dipper to nondipper (n¼37) 0.50�0.18 0.54�0.17 0.38 0.04�0.18 �0.03 to 0.11 0.36 55Nondipper to dipper (n¼31) 0.54�0.17 0.49�0.15 0.25 �0.05�0.17 �0.12 to 0.01 0.34 49
Goodness of fit of AASI regression liner2<0.36 in two recordings (n¼75) 0.66�0.14 0.62�0.17 0.06 �0.04�0.16 �0.07 to 0.00 0.32 68r2�0.36 in two recordings (n¼145) 0.40�0.13 0.40�0.13 0.95 �0.00�0.12 �0.02 to 0.02 0.24 44r2<0.36 and �0.36 (n¼78)
r2�0.36 to <0.36 (n¼36) 0.43�0.15 0.59�0.19 <0.0001 0.16�0.18 0.10 to 0.22 0.36 50r2<0.36 to �0.36 (n¼42) 0.60�0.09 0.42�0.13 <0.0001 �0.18�0.17 �0.23 to �0.13 0.32 55
Plus–minus values are mean�SD. Absolute differences (D) were computed as repeat minus first recording. The repeatability coefficient (RC) is twice the SD of the signeddifferences between the duplicate measurements. RC was also expressed as a percentage of four times the SD of the mean of the paired recordings (pMV). AASI,ambulatory arterial stiffness index.
gated the reproducibility of 24-h PP from repeat ambu-
latory BP recordings in 133 untreated hypertensive
patients. The SD of the paired differences was 4 mmHg
compared with 7 and 9 mmHg in our Nijmegen and Syst-
Eur trial patients, respectively. In Stergiou’s study, the
24-h PP averaged (�SD) 47.5� 7.4 and 46.4� 7.9 mmHg
on first and repeat measurement. The nonreported
P-value for the difference (�1.1 mmHg) was therefore
0.0015 [1.1/(4/1330.5)]. We estimated that in Stergiou’s
study the repeatability coefficient expressed as a per-
centage of near maximal variation was approximately
27% [24], which at first sight seems somewhat smaller
than in our Syst-Eur trial patients (37%). However, in
16 of Stergiou’s patient who were older than 60 years,
the SD of the paired differences in the 24-h PP was
5 mmHg [24], which would have yielded a repeatability
estimate almost identical to that in our Syst-Eur trial
cohort.
Gosse et al. [25] evaluated the reproducibility of
QKD100–60 and AASI in 38 volunteers, who were
selected from a cohort of 469 patients and who underwent
repeat ambulatory recordings within 2 weeks. According
to the French group [25], QKD100–60 (mean¼ 224 ms;
coefficient of variation¼ 4%) had a better reproducibility
than AASI (mean¼ 0.60; coefficient of variation¼ 25%).
Coefficient of variation is the SD of the differences
between paired measurements (SDD) divided by the
mean of all measurements. The coefficient of variation
does not account for the possible range of biological
variation in the two ambulatory measures of arterial
stiffness. We, therefore, expressed repeatability (twice
SDD) as a percentage of near maximal variation in the
measurements as given by four times the SD. Had the
French investigators [25] expressed reproducibility in
this way with the application of a proper test statistic,
their results and conclusions could possibly have been
different.
opyright © Lippincott Williams & Wilkins. Unautho
Matsui et al. [26] studied the reproducibility of
the brachial-ankle pulse wave velocity (baPWV) and the
carotid augmentation index (cAIX) in 103 hypertensive
patients. The interval between the repeat measurements
was 4 weeks. They measured baPWV, using a volume-
plethysmographic device with four cuffs fitted with oscil-
lometric sensors, which were wrapped around the upper
arms and ankles and automatically and simultaneously
inflated. The measurement of cAIX was done by multi-
element applanation tonometry. The Japanese investi-
gators used the correlation between paired measurements
as index of agreement [26]. The correlation coefficients
were 0.89 for abPWV and 0.87 for cAIX. In our study, the
correlation coefficients for AASI ranged from 0.52 to 0.61.
In the absence of statistics specifically designed to assess
repeatability [26], the Japanese results are difficult to
interpret. Moreover, the Japanese study was done under
highly standardized laboratory conditions, using a fully
automated technique, whereas we measured AASI over
24 h during the usual daily activities of our patients.
In our current study, we found that the differences
between repeat minus first AASI correlated inversely
with the differences in the night-to-day ratios of diastolic
BP. Two recent reports already reported on AASI’s
dependency on the nocturnal BP fall [27,28]. We also
confirmed the inverse association between AASI and the
night-to-day BP ratio in 1325 hypertensive patients
referred to the Nijmegen clinic for ambulatory BP
monitoring [29]. Several investigators demonstrated poor
reproducibility of dipping status in hypertensive patients.
Hernandez-del Rey [30] performed repeat ambulatory
monitoring on 2 consecutive days and noticed that of 611
patients 147 (24.1%) participants switched from a night-
time dipper to nondipper or vice versa. Other studies [31]
reported similar findings. When we stratified our study
sample according to the consistency of dipping status, the
repeatability coefficients expressed as a percentage of
rized reproduction of this article is prohibited.

C
Reproducibility of AASI Dechering et al. 1999
maximal variation were not substantially different. Thus,
although there is a significant inverse association between
AASI and the night-to-day BP ratio, this relation does not
affect intra-individual repeatability of AASI to a large
extent in stratified analyses.
In the present analysis, differences in the goodness of fit
of the AASI regression line had an impact on the repeat-
ability of AASI. Similar to recent observations by Gavish
et al. [32], we demonstrated in 7604 participants enrolled
in the International Database on Ambulatory BP monitor-
ing in relation to Cardiovascular Outcomes (IDACO [33])
that the association of AASI with four main determinants
of arterial stiffness (age, height, 24-h mean arterial pres-
sure and 24-h heart rate) increased curvilinearly with the
goodness of fit of the AASI regression line with most of
the improvement in these associations occurring when
the r2 of the AASI regression line was 0.36 or higher. In
line with these still unpublished observations, the repeat-
ability of AASI was 68% and 44% in patients who in
repeat recordings consistently had an r2, respectively,
below or above this 0.36 threshold.
The results of our study have to be interpreted in the
context of its potential limitations. First, the Nijmegen
cohort included 11.8% who were on antihypertensive
medications. However, treatment remained unchanged
between the first and repeat recording. Second, we did
not standardize the ambulatory BP recordings across
centres in terms of device type and intervals between
readings. However, within patients, we used the same
monitor and intervals in the first and repeat recordings.
Moreover, we did not find any significant differences in
repeatability between the five device types or between
oscillometric versus auscultatory machines. To minimize
heterogeneity, we additionally used the same programme
to compute BP means and used time-weighted and
robust regression.
In conclusion, estimates of group mean AASI were not
different between repeat recordings. Within individual
participants, the repeatability coefficients of AASI
expressed as a percentage of near maximum variation
were within the 50–60% range. These findings were
consistent in older patients with isolated systolic hyper-
tension and in a younger patient group with predomi-
nantly mixed hypertension. To our knowledge, this study
is the first to report on the repeatability of AASI in
hypertensive patients.
AcknowledgementsThe authors gratefully acknowledge the expert sec-
retarial assistance of Mrs Sandra Covens and Mrs Ya
Zhu (Studies Coordinating Centre).
The European Union (grants IC15-CT98-0329-EPOGH,
LSHM-CT-2006-037093 InGenious HyperCare, and
opyright © Lippincott Williams & Wilkins. Unauth
HEALTH-2007-201550 HyperGenes), the Fonds voor
Wetenschappelijk Onderzoek Vlaanderen, Ministry of
the Flemish Community, Brussels, Belgium (grants
G.0424.03, G.0453.05 and G.0575.06), and the University
of Leuven, Belgium (grants OT/99/28, OT/00/25 and
OT/05/49) gave support to the Studies Coordinating
Centre. J.A.S. is holder of the Pfizer Chair for Hyperten-
sion and Cardiovascular Research (http://www.kuleuven.
be/mecenaat/leerstoelen/overzicht.htm) at the Univer-
sity of Leuven. The Dutch Heart Foundation (Dr E.
Dekker grant), Den Haag, The Netherlands, supported
the fellowships of D.G.D. and A.A. in Leuven.
The authors have no conflicts of interest.
References1 Hansen TW, Staessen JA, Torp-Pedersen C, Rasmussen S, Thijs L, Ibsen
H, et al. Prognostic value of aortic pulse wave velocity as index of arterialstiffness in the general population. Circulation 2006; 113:664–670.
2 Li Y, Wang JG, Dolan E, Gao PJ, Guo HF, Nawrot T, et al. Ambulatoryarterial stiffness index derived from 24-h ambulatory blood pressuremonitoring. Hypertension 2006; 47:359–364.
3 Dolan E, Thijs L, Li Y, Atkins N, McCormack P, McClory S, et al. Ambulatoryarterial stiffness index as a predictor of cardiovascular mortality in theDublin Outcome Study. Hypertension 2006; 47:365–370.
4 Leoncini G, Ratto E, Viazzi F, Vaccaro V, Parodi A, Falqui V, et al. Increasedarterial stiffness index is associated with target organ damage in primaryhypertension. Hypertension 2006; 48:397–403.
5 Ratto E, Leoncini G, Viazzi F, Vaccaro V, Falqui V, Parodi A, et al.Ambulatory arterial stiffness index and renal abnormalities in primaryhypertension. J Hypertens 2006; 24:2033–2038.
6 Hansen TW, Staessen JA, Torp-Pedersen C, Rasmussen S, Li Y, Dolan E,et al. Ambulatory arterial stiffness index predicts stroke in a generalpopulation. J Hypertens 2006; 24:2247–2253.
7 Kikuya M, Staessen JA, Ohkubo T, Thijs L, Metoki H, Asayama K, et al.Ambulatory arterial stiffness index and 24-h ambulatory pulse pressureas predictors of mortality in Ohasama, Japan. Stroke 2007; 38:1161–1166.
8 Hansen TW, Li Y, Staessen JA, Jeppesen J, Rasmussen S, Wang JG, et al.Independent prognostic value of the ambulatory arterial stiffness index andaortic pulse wave velocity in a general population. J Hum Hypertens 2008;22:214–216.
9 van der Steen MS, Pleijers AM, Lenders JW, Thien T. Influence of differentsupine body positions on blood pressure: consequences for night bloodpressure/dipper-status. J Hypertens 2000; 18:1731–1736.
10 Staessen JA, Thijs L, Fagard R, O’Brien ET, Clement D, de Leeuw PW, et al.Predicting cardiovascular risk using conventional vs ambulatory bloodpressure in older patients with systolic hypertension. J Am Med Assoc1999; 282:539–546.
11 Mancia G, De Backer G, Dominiczak A, Cifkova R, Fagard R, Germano G,et al. 2007 Guidelines for the management of arterial hypertension. TheTask Force for the management of arterial hypertension of the EuropeanSociety of Hypertension (ESH) and of the European Society of Cardiology(ESC). J Hypertens 2007; 25:1105–1187.
12 Hope SL, Alun-Jones E, Sleight P. Validation of the accuracy of theMedilog ABP noninvasive blood-pressure monitor. J Ambul Monit 1988;1:39–51.
13 Jones CR, Taylor K, Chowienczyk P, Poston L, Shennan AH. A validation ofthe Mobil O Graph (version 12) ambulatory blood pressure monitor. BloodPress Monit 2000; 5:233–238.
14 O’Brien E, Mee F, Atkins N, O’Malley K. Evaluation of the SpaceLabs90202 noninvasive ambulatory recorder according to the AAMI standardand BHS criteria. J Hum Hypertens 1991; 5:223–226.
15 O’Brien E, Mee F, Atkins N, O’Malley K. Accuracy of the SpaceLabs 90207determined by the British Hypertension Society Protocol. J Hypertens1991; 9:573–574.
16 O’Brien E, Mee F, Atkins N, O’Malley K. Accuracy of the Takeda TM-2420/TM-2020 determined by the British Hypertension Society Protocol.J Hypertens 1991; 9:571–572.
17 Fagard R, Brguljan J, Thijs L, Staessen J. Prediction of the actual awake andasleep blood pressures by various methods of 24 h pressure analysis.J Hypertens 1996; 14:557–563.
orized reproduction of this article is prohibited.

C
2000 Journal of Hypertension 2008, Vol 26 No 10
18 Li Y, Wang JG, Gao HF, Nawrot T, Wang GL, Qian YS, et al. Are publishedcharacteristics of the ambulatory blood pressure generalizable to ruralChinese ? The JingNing population study. Blood Press Monit 2005;10:125–134.
19 Bland JM, Altman DG. Statistical methods for assessing agreementbetween two methods of clinical measurement. Lancet 1986; 2:307–310.
20 Dewitte K, Fierens C, Stockl D, Thienpont LM. Application of the Bland–Altman plot for interpretation of method-comparison studies: a criticalinvestigation of its practice. Clin Chem 2002; 48:799–801.
21 Staessen J, Bulpitt CJ, O’Brien E, Cox J, Fagard R, Stanton A, et al. Thediurnal blood pressure profile. A population study. Am J Hypertens 1992;5:386–392.
22 Kleinbaum DG, Kupper LL, Muller KE. Applied regression analysis andother multivariate methods, 2nd ed. Boston, Massachusetts: PWS-KentPublishing Company; 1988.
23 Thijs L, Staessen J, Fagard R, Zachariah P, Amery A. Number ofmeasurements required for the analysis of diurnal blood pressure profile.J Hum Hypertens 1994; 8:239–244.
24 Stergiou GS, Efstathiou SP, Argyraki CK, Gantzarou AP, Roussias LG,Mountokalakis TD. Clinic, home and ambulatory pulse pressure:comparison and reproducibility. J Hypertens 2002; 20:1987–1993.
25 Gosse P, Papaioanou G, Coulon P, Reuter S, Lemetayer P, Safar M. Canambulatory blood-pressure monitoring provide reliable indices of arterialstiffness? Am J Hypertens 2007; 20:831–838.
26 Matsui Y, Kario K, Ishikawa J, Eguchi K, Hoshide S, Shimada K.Reproducibility of arterial stiffness indices (pulse wave velocity andaugmentation index) simultaneously assessed by automated pulse waveanalysis and their associated risk factors in essential hypertensive patients.Hypertens Res 2004; 27:851–857.
27 Schillaci G, Parati G, Pirro M, Pucci G, Mannarino MR, Sperandini L, et al.Ambulatory arterial stiffness index is not a specific marker of reducedarterial compliance. Hypertension 2007; 49:986–991.
28 Adiyaman A, Boggia J, Li Y, Wang JG, O’Brien E, Richart T, et al. Dippingdeeper into the ambulatory arterial stiffness index. Hypertension 2007;50:e59–e60.
29 Dechering DG, Adiyaman A, van der Steen M, Thien T. Interstudy variabilityin the ambulatory arterial stiffness index. Hypertension 2007; 50:e65.
30 Hernandez-del Rey R, Martin-Baranera M, Sobrino J, Gorostidi M, VinyolesE, Sierra C, et al. Reproducibility of the circadian blood pressure pattern in24-h versus 48-h recordings: the Spanish Ambulatory Blood PressureMonitoring Registry. J Hypertens 2007; 25:2406–2412.
31 Cuspidi C, Meani S, Valerio C, Sala C, Fusi V, Masaidi M, et al.Reproducibility of dipping/nondipping pattern in untreated essentialhypertensive patients: impact of sex and age. Blood Press Monit 2007;12:101–106.
32 Gavish B, Ben-Dov IZ, Bursztyn M. Linear relationship between systolic anddiastolic blood pressure monitored over 24 h: assessment and correlates.J Hypertens 2008; 26:199–208.
33 Thijs L, Hansen TW, Kikuya M, Bjorklund-Bodegard K, Li Y, Dolan E, et al.The International Database of Ambulatory blood pressure in relation toCardiovascular Outcome (IDACO): protocol and research perspectives.Blood Press Monit 2007; 12:255–262.
opyright © Lippincott Williams & Wilkins. Unauthorized reproduction of this article is prohibited.
Copyright © 2022 FDOKUMEN