Prognostic accuracy of day versus night ambulatory blood pressure: a cohort study
11
Articles www.thelancet.com Vol 370 October 6, 2007 1219 Prognostic accuracy of day versus night ambulatory blood pressure: a cohort study José Boggia,* Yan Li,* Lutgarde Thijs, Tine W Hansen, Masahiro Kikuya, Kristina Björklund-Bodegård, Tom Richart, Takayoshi Ohkubo, Tatiana Kuznetsova, Christian Torp-Pedersen, Lars Lind, Hans Ibsen, Yutaka Imai, Jiguang Wang, Edgardo Sandoya, Eoin O’Brien, Jan A Staessen, on behalf of the International Database on Ambulatory blood pressure monitoring in relation to Cardiovascular Outcomes (IDACO) investigators† Summary Background Few studies have formally compared the predictive value of the blood pressure at night over and beyond the daytime value. We investigated the prognostic significance of the ambulatory blood pressure during night and day and of the night-to-day blood pressure ratio. Methods We did 24-h blood pressure monitoring in 7458 people (mean age 56·8 years [SD 13·9]) enrolled in prospective population studies in Denmark, Belgium, Japan, Sweden, Uruguay, and China. We calculated multivariate-adjusted hazard ratios for daytime and night-time blood pressure and the systolic night-to-day ratio, while adjusting for cohort and cardiovascular risk factors. Findings Median follow-up was 9·6 years (5th to 95th percentile 2·5–13·7). Adjusted for daytime blood pressure, night-time blood pressure predicted total (n=983; p<0·0001), cardiovascular (n=387; p<0·01), and non-cardiovascular (n=560; p<0·001) mortality. Conversely, adjusted for night-time blood pressure, daytime blood pressure predicted only non-cardiovascular mortality (p<0·05), with lower blood pressure levels being associated with increased risk. Both daytime and night-time blood pressure consistently predicted all cardiovascular events (n=943; p<0·05) and stroke (n=420; p<0·01). Adjusted for night-time blood pressure, daytime blood pressure lost prognostic significance only for cardiac events (n=525; p≥0·07). Adjusted for the 24-h blood pressure, night-to-day ratio predicted mortality, but not fatal combined with non-fatal events. Antihypertensive drug treatment removed the significant association between cardiovascular events and the daytime blood pressure. Participants with systolic night-to-day ratio value of 1 or more were older, at higher risk of death, and died at an older age than those whose night-to-day ratio was normal (≥0·80 to <0·90). Interpretation In contrast to commonly held views, daytime blood pressure adjusted for night-time blood pressure predicts fatal combined with non-fatal cardiovascular events, except in treated patients, in whom antihypertensive drugs might reduce blood pressure during the day, but not at night. The increased mortality in patients with higher night-time than daytime blood pressure probably indicates reverse causality. Our findings support recording the ambulatory blood pressure during the whole day. Introduction In 1988, O’Brien and colleagues 1 reported for the first time that an abnormal circadian blood-pressure profile with a less marked decrease in night-time blood pressure led to an increased risk of stroke. Subsequent studies of populations 2–5 and hypertensive cohorts 6–12 generally corroborated that a raised nocturnal blood pressure predicted a higher rate of cardiovascular complications. Despite the apparent agreement between these previously published large-scale studies, 2–12 several potential limitations need further clarification of the prognostic accuracy of day versus night ambulatory blood pressure. Many studies considered only fatal outcomes 2,3,10,11 or did not have the power to study cause-specific cardiovascular endpoints. 2,3,5,9 Investigators dichotomised the night-to-day blood pressure ratio, and applied different definitions of dipping status or different daytime and night-time intervals. Few reports formally compared the predictive value of the blood pressure at night over and beyond the daytime value. Finally, in cohorts of patients with hypertension, antihypertensive drug treatment attenuated the association between outcome and blood pressure. 7 An international consortium constructed a database of prospective population studies with the goal to advance research on the prognostic accuracy of the ambulatory blood pressure. 13,14 We aimed to report risk estimates that were independently associated with the daytime and night-time blood pressures. Additionally, we investigated in categorical and continuous analyses whether the night-to-day blood pressure ratio contained any prognostic information over and beyond the 24-h blood pressure. Methods Study population We constructed the International Database on Ambulatory blood pressure monitoring in relation to Cardiovascular Outcomes (IDACO). 13,14 Studies were eligible for inclusion if they included a random population sample, if information about the conventional and ambulatory blood pressures and cardiovascular risk Lancet 2007; 370: 1219–29 See Comment page 1192 *José Boggia and Yan Li contributed equally to this manuscript †IDACO investigators listed at end of article Studies Coordinating Centre, Division of Hypertension and Cardiovascular Rehabilitation, Department of Cardiovascular Diseases, University of Leuven, Leuven, Belgium (L Thijs MSc, T Richart MD, T Kuznetsova MD, Prof J A Staessen MD); Departamento de Fisiopatología, Hospital de Clínicas, Universidad de la República, Montevideo, Uruguay (J Boggia MD); Center for Epidemiological Studies and Clinical Trials, Ruijin Hospital, Shanghai Jiaotong University School of Medicine, Shanghai, China (Y Li MD, Prof J Wang MD); Research Center for Prevention and Health, Copenhagen, Denmark (T W Hansen MD); Tohoku University Graduate School of Pharmaceutical Sciences and Medicine, Sendai, Japan (M Kikuya MD, T Ohkubo MD, Prof Y Imai MD); Section of Geriatrics, Department of Public Health and Caring Sciences, Uppsala University, Uppsala, Sweden (K Björklund-Bodegård MD, Prof L Lind MD); Copenhagen University Hospital, Copenhagen, Denmark (T W Hanssen MD, Prof C Torp-Pedersen MD, Prof H Ibsen MD); Asociación Española Primera de Socorros Mutuos, Montevideo, Uruguay (Prof E Sandoya MD); and Conway Institute of Biomolecular and Biomedical Research, University College Dublin, Dublin, Ireland (Prof E O’Brien MD)
Transcript of Prognostic accuracy of day versus night ambulatory blood pressure: a cohort study
Articles
www.thelancet.com Vol 370 October 6, 2007 1219
Prognostic accuracy of day versus night ambulatory blood pressure: a cohort study José Boggia,* Yan Li,* Lutgarde Thijs, Tine W Hansen, Masahiro Kikuya, Kristina Björklund-Bodegård, Tom Richart, Takayoshi Ohkubo, Tatiana Kuznetsova, Christian Torp-Pedersen, Lars Lind, Hans Ibsen, Yutaka Imai, Jiguang Wang, Edgardo Sandoya, Eoin O’Brien, Jan A Staessen, on behalf of the International Database on Ambulatory blood pressure monitoring in relation to Cardiovascular Outcomes (IDACO) investigators†
Summary Background Few studies have formally compared the predictive value of the blood pressure at night over and beyond the daytime value. We investigated the prognostic signifi cance of the ambulatory blood pressure during night and day and of the night-to-day blood pressure ratio.
Methods We did 24-h blood pressure monitoring in 7458 people (mean age 56·8 years [SD 13·9]) enrolled in prospective population studies in Denmark, Belgium, Japan, Sweden, Uruguay, and China. We calculated multivariate-adjusted hazard ratios for daytime and night-time blood pressure and the systolic night-to-day ratio, while adjusting for cohort and cardiovascular risk factors.
Findings Median follow-up was 9·6 years (5th to 95th percentile 2·5–13·7). Adjusted for daytime blood pressure, night-time blood pressure predicted total (n=983; p<0·0001), cardiovascular (n=387; p<0·01), and non-cardiovascular (n=560; p<0·001) mortality. Conversely, adjusted for night-time blood pressure, daytime blood pressure predicted only non-cardiovascular mortality (p<0·05), with lower blood pressure levels being associated with increased risk. Both daytime and night-time blood pressure consistently predicted all cardiovascular events (n=943; p<0·05) and stroke (n=420; p<0·01). Adjusted for night-time blood pressure, daytime blood pressure lost prognostic signifi cance only for cardiac events (n=525; p≥0·07). Adjusted for the 24-h blood pressure, night-to-day ratio predicted mortality, but not fatal combined with non-fatal events. Antihypertensive drug treatment removed the signifi cant association between cardiovascular events and the daytime blood pressure. Participants with systolic night-to-day ratio value of 1 or more were older, at higher risk of death, and died at an older age than those whose night-to-day ratio was normal (≥0·80 to <0·90).
Interpretation In contrast to commonly held views, daytime blood pressure adjusted for night-time blood pressure predicts fatal combined with non-fatal cardiovascular events, except in treated patients, in whom antihypertensive drugs might reduce blood pressure during the day, but not at night. The increased mortality in patients with higher night-time than daytime blood pressure probably indicates reverse causality. Our fi ndings support recording the ambulatory blood pressure during the whole day.
Introduction In 1988, O’Brien and colleagues1 reported for the fi rst time that an abnormal circadian blood-pressure profi le with a less marked decrease in night-time blood pressure led to an increased risk of stroke. Subsequent studies of populations2–5 and hypertensive cohorts6–12 generally corroborated that a raised nocturnal blood pressure predicted a higher rate of cardiovascular complications. Despite the apparent agreement between these previously published large-scale studies,2–12 several potential limitations need further clarifi cation of the prognostic accuracy of day versus night ambulatory blood pressure. Many studies considered only fatal outcomes2,3,10,11 or did not have the power to study cause-specifi c cardiovascular endpoints.2,3,5,9 Investigators dichotomised the night-to-day blood pressure ratio, and applied diff erent defi nitions of dipping status or diff erent daytime and night-time intervals. Few reports formally compared the predictive value of the blood pressure at night over and beyond the daytime value. Finally, in cohorts of patients with hypertension,
antihypertensive drug treatment attenuated the association between outcome and blood pressure.7
An international consortium constructed a database of prospective population studies with the goal to advance research on the prognostic accuracy of the ambulatory blood pressure.13,14 We aimed to report risk estimates that were independently associated with the daytime and night-time blood pressures. Additionally, we investigated in categorical and continuous analyses whether the night-to-day blood pressure ratio contained any prognostic information over and beyond the 24-h blood pressure.
Methods Study population We constructed the International Database on Ambulatory blood pressure monitoring in relation to Cardiovascular Outcomes (IDACO).13,14 Studies were eligible for inclusion if they included a random population sample, if information about the conventional and ambulatory blood pressures and cardiovascular risk
Lancet 2007; 370: 1219–29
See Comment page 1192
*José Boggia and Yan Li contributed equally to this manuscript
†IDACO investigators listed at end of article
Studies Coordinating Centre, Division of Hypertension and Cardiovascular Rehabilitation, Department of Cardiovascular Diseases, University of Leuven, Leuven, Belgium (L Thijs MSc, T Richart MD, T Kuznetsova MD, Prof J A Staessen MD); Departamento de Fisiopatología, Hospital de Clínicas, Universidad de la República, Montevideo, Uruguay (J Boggia MD); Center for Epidemiological Studies and Clinical Trials, Ruijin Hospital, Shanghai Jiaotong University School of Medicine, Shanghai, China (Y Li MD, Prof J Wang MD); Research Center for Prevention and Health, Copenhagen, Denmark (T W Hansen MD); Tohoku University Graduate School of Pharmaceutical Sciences and Medicine, Sendai, Japan (M Kikuya MD, T Ohkubo MD, Prof Y Imai MD); Section of Geriatrics, Department of Public Health and Caring Sciences, Uppsala University, Uppsala, Sweden (K Björklund-Bodegård MD, Prof L Lind MD); Copenhagen University Hospital, Copenhagen, Denmark (T W Hanssen MD, Prof C Torp-Pedersen MD, Prof H Ibsen MD); Asociación Española Primera de Socorros Mutuos, Montevideo, Uruguay (Prof E Sandoya MD); and Conway Institute of Biomolecular and Biomedical Research, University College Dublin, Dublin, Ireland (Prof E O’Brien MD)
Articles
1220 www.thelancet.com Vol 370 October 6, 2007
factors were available at baseline, and if the subsequent follow-up included fatal and non-fatal outcomes. We did an electronic search of studies written in English, using the search terms “ambulatory blood pressure monitoring” and “population”, which identifi ed 11 studies.2–5,15–21 We excluded fi ve because at the time of writing they were still in progress15,18,21 or had not yet been organised,20 or because follow-up did not include non-fatal events.5
For our analysis, we included 2311 residents from Copenhagen, Denmark;3 2542 from Noorderkempen, Belgium;16 1535 from Ohasama, Japan;2 1859 from Montevideo, Uruguay;19 360 from the JingNing county, China;17 and 1221 70-year-old men from Uppsala, Sweden.4 All studies included in IDACO received ethical approval2–4,16,17,19 and have previously been described in detail.2–4,16,17,19 All participants provided informed written consent. Of the 9828 participants, we excluded 2370 (24%), because they were younger than 18 years old at enrolment (n=15), because their conventional blood pressure had not been measured (n=217), or because their daytime (n=229) or night-time (n=1909) blood pressure had not been registered or were averages of fewer than ten daytime or fi ve night-time readings. Thus, 7458 people were included in the analysis.
ProceduresTrained observers measured the conventional blood pressure with a mercury sphygmomanometer3,4,16,17 or with validated auscultatory22,23 (USM-700F, UEDA Electronic Works, Tokyo, Japan)2 or oscillometric (OMRON HEM-705CP, Omron Corporation, Tokyo, Japan)19 devices, using the appropriate cuff size, with participants in the sitting2,3,16,17,19 or supine4 position. Conventional blood pressure was the average of two consecutive readings obtained either at the persons’ home16,17,19 or at an examination centre.2–4 We defi ned hypertension as a conventional blood pressure of at least 140 mm Hg systolic or 90 mm Hg diastolic, or as use of antihypertensive drugs.
We initiated portable blood-pressure monitors to obtain readings every 30-min throughout the whole day2 or at intervals ranging from 15 min3 to 30 min4 during daytime, and from 30 min3 to 60 min4 at night. The devices implemented an auscultatory algorithm (Accutracker II, Suntech Medical Instruments Inc, Morrisville, USA24) in Uppsala4 or an oscillometric technique (SpaceLabs 90202 and 90207, SpaceLabs Inc, Redmond, USA25) in Noorderkempen,16 Montevideo,19 and JingNing.17 The Takeda TM-2421 recorders (A&D, Tokyo, Japan26) used in Copenhagen3 and the ABPM-630 devices (Nippon Colin, Komaki, Japan27) used in Ohasama2 implemented both techniques, but we only analysed the oscillometric readings.
The same SAS macro processed all ambulatory recordings, which generally stayed unedited. The Ohasama recordings were edited sparsely according to previously published criteria.28 When accounting for the daily pattern of activities of the participants, we defi ned daytime as the interval ranging from 1000 h to 2000 h in people from Europe3,4,16 and South America,19 and from 0800 h to 1800 h in those from Asia.2,17 The corresponding night-time intervals ranged from midnight to 0600 h3,4,16,19 and from 2200 h to 0400 h.2,17 These fi xed intervals eliminate the transition periods in the morning and evening when blood pressure changes rapidly, resulting in daytime and night-time blood pressure levels that are within 1–2 mm Hg of the awake and asleep levels.17,29 We weighted the individual means of the ambulatory blood pressure by the interval between readings.
In categorical analyses, we classifi ed the participants according to the night-to-day ratio of systolic blood pressure because mean age was 56·8 years and in adults older than 50 years systolic rather than diastolic blood pressure is the predominant risk factor.30 Moreover, we previously showed that the systolic night-to-day ratio, but not the diastolic night-to-day ratio, was similar in auscultatory and oscillometric recordings.31 We also avoided divergent classifi cation of participants on the basis of systolic or diastolic blood pressure or both, using the systolic night-to-day ratio. Normal dipping, used as the reference group in categorical analyses, was a night-to-day ratio ranging from less than 0·90 to 0·80 inclusive. We
Correspondence to: Prof Jan A Staessen, Studies
Coordinating Centre, Division of Hypertension and Cardiovascular
Rehabilitation, Department of Cardiovascular Diseases, University
of Leuven, Campus Gasthuisberg, Herestraat 49, Box 702, B-3000
Leuven, Belgium [email protected]
Extreme Normal Decreased Reverse
Limits <0·80 ≥0·80 to <0·90 ≥0·90 to <1·00 ≥1·00
Total 1513 3754 1754 437
European 987 (65%)† 2299 (61%) 894 (51%)§ 178 (41%)§
Asian 317 (21%) 776 (21%) 433 (24%)‡ 140 (32%)§
South American 209 (14%)‡ 679 (18%) 427 (24%)§ 119 (27%)§
Women 670 (44%) 1728 (46%) 832 (47%) 186 (43%)
Antihypertensive treatment 336 (22%)† 698 (19%) 440 (25%)§ 163 (37%)§
Smokers 456 (30%) 1150 (31%) 455 (26%)‡ 111 (25%)*
Alcohol drinkers 809 (54%)‡ 1812 (48%) 755 (43%)‡ 164 (38%)§
Diabetes mellitus 99 (7%) 259 (7%) 131 (8%) 54 (12%) §
Cardiovascular disorder 138 (9%)* 273 (7%) 155 (9%)* 60 (14%)§
Age (years) 58·6 (12·5)§ 55·2 (13·8) 57·1 (14·5)§ 62·9 (14·0)§
Body-mass index (kg/m²) 25·6 (4·0) 25·5 (4·0) 25·6 (4·4) 25·4 (4·7)
Conventional blood pressure (mm Hg)
Systolic 134·0 (19·4)§ 131·1 (20·6) 132·7 (21·8)† 136·5 (22·5)§
Diastolic 80·9 (10·9)† 79·9 (11·6) 79·7 (12·1) 79·4 (12·3)
Ambulatory blood pressure (mm Hg)
24-h systolic 124·8 (12·6)† 123·7 (14·1) 125·6 (15·5)§ 131·0 (17·9)§
24-h diastolic 73·7 (7·6) 73·7 (8·4) 74·6 (9·2)‡ 75·4 (9·7)§
Night-time systolic 104·0 (10·7)§ 111·1 (12·9) 120·2 (15·1)§ 134·8 (19·8)§
Night-time diastolic 60·1 (6·9)§ 64·1 (8·2) 68·9 (9·5)§ 74·1 (10·8)§
Daytime systolic 137·3 (14·4)§ 130·7 (15·0) 128·1 (15·8)§ 126·8 (16·7)§
Daytime diastolic 81·7 (8·8)§ 79·0 (9·0) 77·4 (9·6)§ 75·3 (10·1)§
Serum cholesterol (mmol/L) 5·82 (1·15)† 5·72 (1·13) 5·64 (1·14)* 5·48 (1·12)§
Data are number (%) or mean (SD). p values for the diff erences with normal: *p<0·05, †p<0·01, ‡p<0·001, §p<0·0001.
Table 1: Baseline characteristics of participants by categories of the night-to-day ratio of systolic blood pressure
Articles
www.thelancet.com Vol 370 October 6, 2007 1221
labelled the other categories of dipping status as extreme (<0·80),8 decreased (≥0·90–<1·00), and reverse (≥1·00).8
In all cohorts, we administered a questionnaire to obtain baseline information about every participant’s medical history, intake of drugs, and smoking and drinking habits. Body-mass index was body weight (kg) divided by height (m) squared. Serum cholesterol and blood glucose concentrations were recorded by automated enzymatic methods. Diabetes mellitus was a self-reported diagnosis, or a fasting blood glucose concentration of at least 7·0 mmol/L or a random blood glucose concentration of 11·1 mmol/L,32 or use of antidiabetic drugs.
We ascertained vital status and incidence of fatal and non-fatal diseases from the appropriate sources in every country, as described in detail in previous publications.4,33–35 Fatal and non-fatal stroke did not include transient ischaemic attacks. Coronary events encompassed death from ischaemic heart disease, sudden death, non-fatal myocardial infarction, and coronary revascularisation. Cardiac events consisted of coronary endpoints and fatal and non-fatal heart failure. In the Swedish cohort, the diagnosis of heart failure required admission to hospital. In the other cohorts,17,19,33–35 heart failure was either a clinical diagnosis or the diagnosis on the death certifi cate, but all cases were validated against hospital fi les or the records held by family doctors. The composite cardiovascular endpoint included all these endpoints plus cardiovascular mortality. In all outcome analyses we considered only the fi rst event within every category.
Statistical analysis For database management and statistical analysis, we used SAS software (version 9.1.3; SAS Institute, Cary NC, USA). For comparison of means we applied the Z test for large samples and for comparison of proportions we applied the χ²-statistic. After stratifi cation for cohort and sex, we interpolated missing values of body-mass index (n=10) and total serum cholesterol (n=52) from the regression slope on age. In participants with unknown drinking (n=34) or smoking habits (n=445 in Swedish men4 and 167 in other cohorts17,19,33–35), we set the design variable to the cohort-specifi c and sex-specifi c mean of the codes (0,1). Statistical signifi cance was an α-level of 0·05 on two-sided tests.
We used Cox regression to compute standardised hazard ratios. We checked the proportional hazards assumption by the Kolmogorov-type supremum test, as implemented in the PROC PHREG procedure of the SAS package and by testing the interaction terms between follow-up duration and either blood pressure or the night-to-day blood pressure ratio. We fi rst plotted incidence rates by quintiles of the blood pressure distributions, while standardising by the direct method for cohort, sex, and age (≤40, 40–60, and ≥60 years). In adjusted models, we treated age as a continuous variable
and additionally accounted for body-mass index, smoking and drinking, serum total cholesterol, history of cardiovascular disease, diabetes mellitus, and treatment with antihypertensive drugs. Fully adjusted models for the daytime blood pressure additionally included the corresponding night-time blood pressure, and vice versa, and for the night-to-day ratio they additionally included the 24-h systolic blood pressure. We adjusted for cohort by introducing fi ve design variables in the Cox models. We analysed the night-to-day blood pressure ratios both as continuous and categorical variables. In the categorical analyses, we plotted Kaplan-Meier survival function estimates according to present recommendations.36 We tested heterogeneity in the hazard ratios across subgroups by introduction of the appropriate interaction term in the Cox model.
Role of the funding source The sponsor of the study had no role in study design, data extraction, data analysis, data interpretation, or writing of the report. The corresponding author had full access to all the data in the study and had responsibility for the decision to submit for publication.
Total Non-cardiovascular Cardiovascular
Number of deaths (%) 983 (13%) 560 (8%) 387 (5%)
Daytime blood pressure
Systolic
Adjusted 1·09 (1·02–1·16)* 0·96 (0·88–1·05) 1·29 (1·17–1·42)§
Fully adjusted 0·94 (0·87–1·03) 0·84 (0·75–0·94)† 1·11 (0·98–1·27)
Diastolic
Adjusted 1·06 (0·99–1·14) 0·97 (0·89–1·06) 1·24 (1·12–1·37)§
Fully adjusted 0·94 (0·87–1·03) 0·88 (0·79–0·98)* 1·07 (0·94–1·22)
Night-time blood pressure
Systolic
Adjusted 1·18 (1·11–1·25)§ 1·10 (1·01–1·19)* 1·29 (1·19–1·41)§
Fully adjusted 1·22 (1·13–1·31)§ 1·21 (1·10–1·33)‡ 1·22 (1·09–1·36)‡
Diastolic
Adjusted 1·16 (1·09–1·24)§ 1·09 (1·00–1·19)* 1·29 (1·18–1·42)§
Fully adjusted 1·20 (1·11–1·30)§ 1·18 (1·06–1·31)† 1·24 (1·10–1·40)‡
Night-to-day blood pressure ratio
Systolic
Adjusted 1·15 (1·09–1·21)§ 1·16 (1·08–1·24)§ 1·13 (1·04–1·23)†
Fully adjusted 1·13 (1·07–1·19)§ 1·16 (1·08–1·25)§ 1·08 (0·99–1·17)
Diastolic
Adjusted 1·13 (1·07–1·20)§ 1·14 (1·05–1·23)† 1·13 (1·03–1·24)†
Fully adjusted 1·12 (1·06–1·19)‡ 1·14 (1·05–1·23)† 1·10 (1·00–1·21)*
Data are number (%) or standardised hazard ratios (95% CI), which express the risk per SD increase in the blood-pressure variables. Systolic/diastolic SDs were 15·52/9·33 mm Hg and 15·53/9·25 mm Hg for the day and night blood pressures and 0·08/0·09 for the night-to-day blood pressure ratio. The cause of death was unknown in 36 cases. All hazard ratios were adjusted for cohort, sex, age, body-mass index, smoking and drinking, serum cholesterol, history of cardiovascular disease, diabetes mellitus, and antihypertensive drug treatment. In fully adjusted models, the daytime blood pressure was additionally adjusted for the night-time blood pressure (and vice versa), and the night-to-day ratio was additionally adjusted for the 24-h blood pressure. *p<0·05. †p<0·01. ‡p<0·001. §p<0·0001.
Table 2: Adjusted standardised hazard ratios for mortality
Articles
1222 www.thelancet.com Vol 370 October 6, 2007
Results The study population consisted of 4358 (58%) people from Europe, 1666 (22%) from Asia, and 1434 (19%) from South America. 3416 (46%) of the participants were women, and 3436 (46%) had hypertension on conventional blood pressure measurement, 1637 (48%) of whom were taking drugs to lower their blood pressure.
Mean age was 56·8 (SD 13·9) years. The mean conventional blood pressure was 132·4 (20·8) mm Hg systolic and 80·1 (11·6) mm Hg diastolic. For the 24-h blood pressure, these values were 124·8 (14·5) mm Hg and 74·0 (8·5) mm Hg, respectively. At enrolment, 2172 (29%) participants were current smokers and 3540 (48%) reported drinking alcohol. Table 1 shows the
Mortality—daytimeA B C D
115
74
32
110 120 130 140 150 160 90 100 110 120 130 140 90
Systolic blood pressure (mm Hg)
Even
ts p
er 1
000
pers
on-y
ears
100 110 120 130 140110 120 130 140 150 1600
0 0 0 0
5
10
15
20
25
30
4273 83
146
92
157
107141
140184
234
310
TotalNon-CVCV
All CV eventsCardiac eventsStroke
Mortality—night-time CV events—daytime CV events—night-time
73
43
5797
130
8869
4925
108
167
219
376
189
198
184
215
152
101 129
87
816047
84
33 39
77
391
168
354
233
133
169
105
56
134
88
40
93
59
29
94175
208
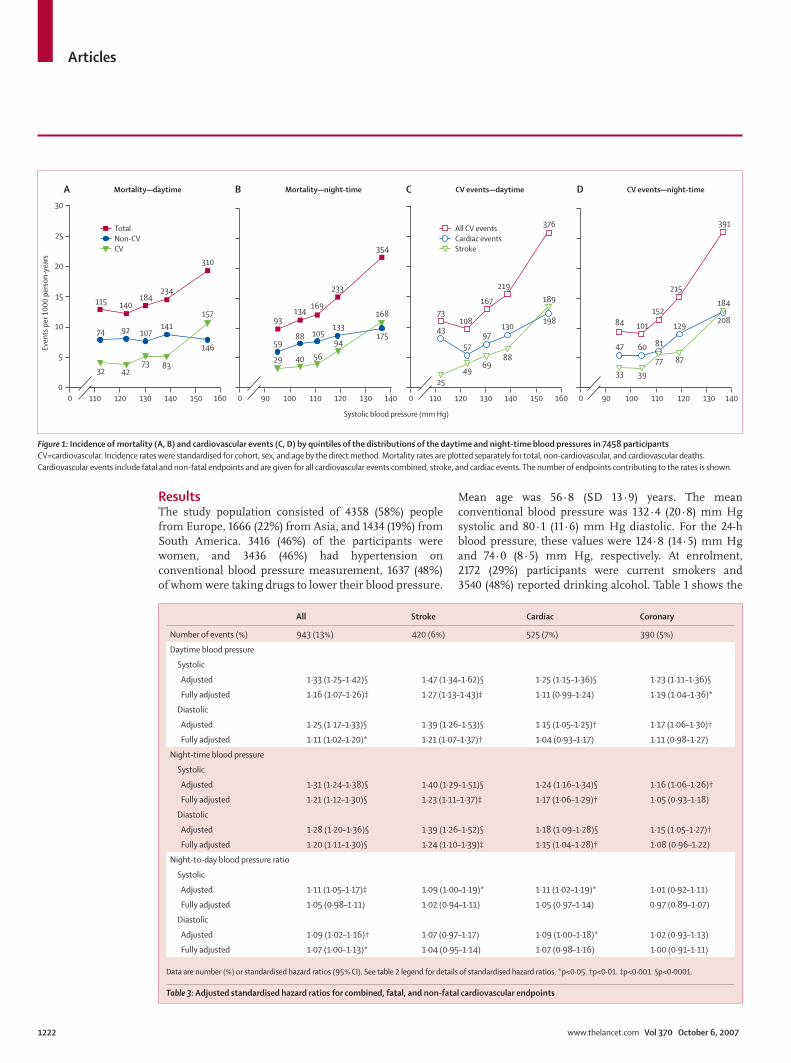
Figure 1: Incidence of mortality (A, B) and cardiovascular events (C, D) by quintiles of the distributions of the daytime and night-time blood pressures in 7458 participants CV=cardiovascular. Incidence rates were standardised for cohort, sex, and age by the direct method. Mortality rates are plotted separately for total, non-cardiovascular, and cardiovascular deaths. Cardiovascular events include fatal and non-fatal endpoints and are given for all cardiovascular events combined, stroke, and cardiac events. The number of endpoints contributing to the rates is shown.
All Stroke Cardiac Coronary
Number of events (%) 943 (13%) 420 (6%) 525 (7%) 390 (5%)
Daytime blood pressure
Systolic
Adjusted 1·33 (1·25–1·42)§ 1·47 (1·34–1·62)§ 1·25 (1·15–1·36)§ 1·23 (1·11–1·36)§
Fully adjusted 1·16 (1·07–1·26)‡ 1·27 (1·13–1·43)‡ 1·11 (0·99–1·24) 1·19 (1·04–1·36)*
Diastolic
Adjusted 1·25 (1·17–1·33)§ 1·39 (1·26–1·53)§ 1·15 (1·05–1·25)† 1·17 (1·06–1·30)†
Fully adjusted 1·11 (1·02–1·20)* 1·21 (1·07–1·37)† 1·04 (0·93–1·17) 1·11 (0·98–1·27)
Night-time blood pressure
Systolic
Adjusted 1·31 (1·24–1·38)§ 1·40 (1·29–1·51)§ 1·24 (1·16–1·34)§ 1·16 (1·06–1·26)†
Fully adjusted 1·21 (1·12–1·30)§ 1·23 (1·11–1·37)‡ 1·17 (1·06–1·29)† 1·05 (0·93–1·18)
Diastolic
Adjusted 1·28 (1·20–1·36)§ 1·39 (1·26–1·52)§ 1·18 (1·09–1·28)§ 1·15 (1·05–1·27)†
Fully adjusted 1·20 (1·11–1·30)§ 1·24 (1·10–1·39)‡ 1·15 (1·04–1·28)† 1·08 (0·96–1·22)
Night-to-day blood pressure ratio
Systolic
Adjusted 1·11 (1·05–1·17)‡ 1·09 (1·00–1·19)* 1·11 (1·02–1·19)* 1·01 (0·92–1·11)
Fully adjusted 1·05 (0·98–1·11) 1·02 (0·94–1·11) 1·05 (0·97–1·14) 0·97 (0·89–1·07)
Diastolic
Adjusted 1·09 (1·02–1·16)† 1·07 (0·97–1·17) 1·09 (1·00–1·18)* 1·02 (0·93–1·13)
Fully adjusted 1·07 (1·00–1·13)* 1·04 (0·95–1·14) 1·07 (0·98–1·16) 1·00 (0·91–1·11)
Data are number (%) or standardised hazard ratios (95% CI). See table 2 legend for details of standardised hazard ratios. *p<0·05. †p<0·01. ‡p<0·001. §p<0·0001.
Table 3: Adjusted standardised hazard ratios for combined, fatal, and non-fatal cardiovascular endpoints
Articles
www.thelancet.com Vol 370 October 6, 2007 1223
baseline characteristics by category of the systolic night-to-day ratio. Across the four groups, all characteristics diff ered signifi cantly (table 1) with the exception of the proportion of women (p=0·16), body-mass index (p=0·08), and the conventional diastolic blood pressure (p=0·88). Table 1 also shows signifi cance levels for the comparison of the night-to-day ratio categories with the subgroup with a normal night-to-day ratio (≥0·80 to <0·90). Participants with a night-to-day ratio of 1·00 or higher were older, were more likely to come from Asia and South America, and have a history of diabetes mellitus or previous cardiovascular compli-cations, than those with a normal night-to-day ratio.
In the overall study population, the median follow-up was 9·6 years (5th to 95th percentile 2·5–13·7). Across cohorts, median follow-up ranged from 2·5 years (2·3–2·6) in JingNing to 13·1 years (1·1–15·7) in Noorderkempen. 983 participants died (14·1 per 1000 person-years) and 943 had a fatal or non-fatal cardiovascular complication (13·6 per 1000 person-years). There were more non-cardiovascular than cardiovascular deaths (table 2). Of the cause-specifi c fi rst cardiovascular events, 51 were fatal strokes and 369 were non-fatal strokes. Cardiac events consisted of 146 fatal and 379 non-fatal events, including 65 fatal and 186 non-fatal cases of acute myocardial infarction, 30 deaths from ischaemic heart disease, 30 sudden deaths, 21 fatal and 142 non-fatal cases of heart failure, and 51 cases of surgical or percutaneous coronary revascularisation. Of the coronary revascularisation procedures, 18 took place in Noorderkempen, one in Copenhagen, and 32 in Montevideo.
Night-to-day ratio
p<0·0001
Age at death (years)
Cum
ulat
ive d
istrib
utio
n (%
)
350
20
40
60
80
100
45 55 65 75 85 95
≥1·0 (reverse)≥0·9–<1·0 (decreased)≥0·8–<0·9 (normal)<0·8 (extreme)
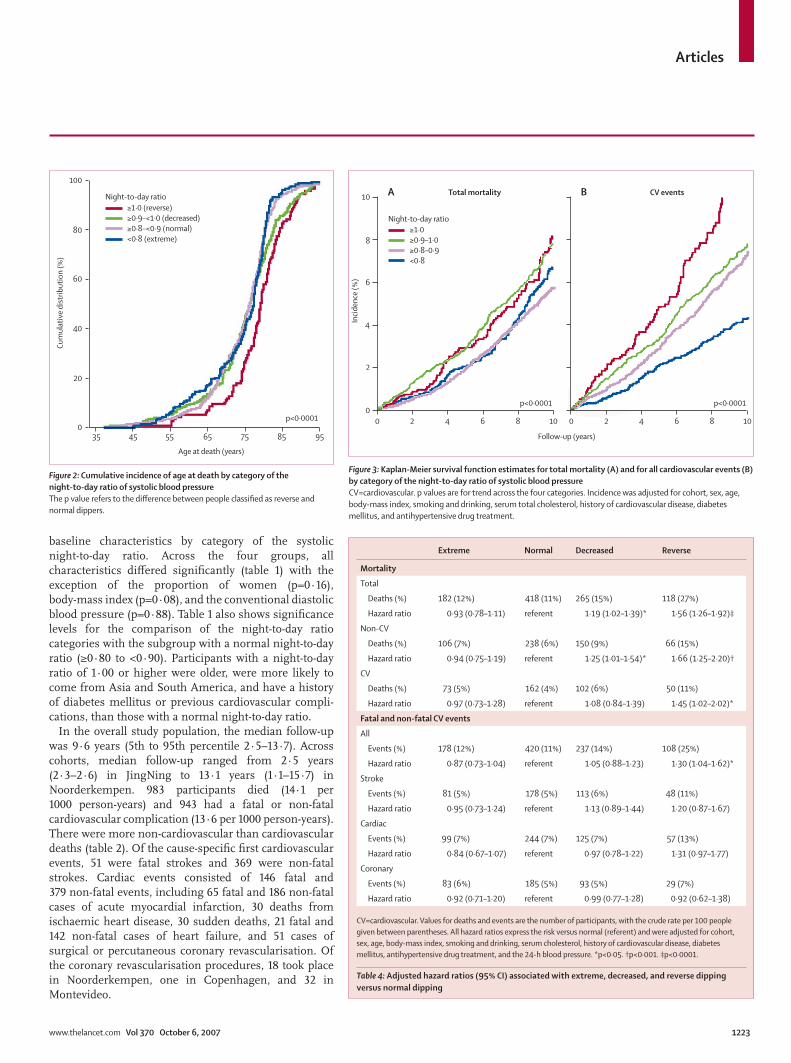
Figure 2: Cumulative incidence of age at death by category of the night-to-day ratio of systolic blood pressure The p value refers to the diff erence between people classifi ed as reverse and normal dippers.
Follow-up (years)
Incid
ence
(%)
Total mortalityA B CV events
00
2
2
4
4
6
6
8
8
10
10
0 2 4 6 8 10
Night-to-day ratio
p<0·0001 p<0·0001
≥1·0≥0·9–1·0≥0·8–0·9<0·8
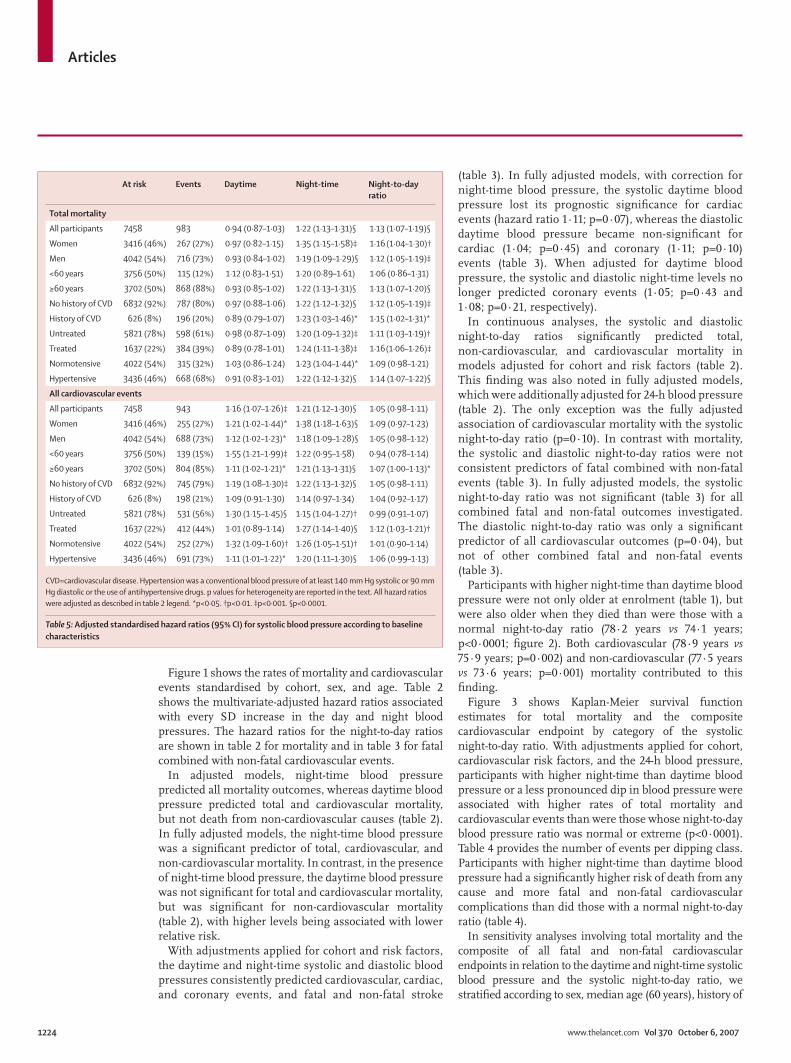
Figure 3: Kaplan-Meier survival function estimates for total mortality (A) and for all cardiovascular events (B) by category of the night-to-day ratio of systolic blood pressure CV=cardiovascular. p values are for trend across the four categories. Incidence was adjusted for cohort, sex, age, body-mass index, smoking and drinking, serum total cholesterol, history of cardiovascular disease, diabetes mellitus, and antihypertensive drug treatment.
Extreme Normal Decreased Reverse
Mortality
Total
Deaths (%) 182 (12%) 418 (11%) 265 (15%) 118 (27%)
Hazard ratio 0·93 (0·78–1·11) referent 1·19 (1·02–1·39)* 1·56 (1·26–1·92)‡
Non-CV
Deaths (%) 106 (7%) 238 (6%) 150 (9%) 66 (15%)
Hazard ratio 0·94 (0·75–1·19) referent 1·25 (1·01–1·54)* 1·66 (1·25–2·20)†
CV
Deaths (%) 73 (5%) 162 (4%) 102 (6%) 50 (11%)
Hazard ratio 0·97 (0·73–1·28) referent 1·08 (0·84–1·39) 1·45 (1·02–2·02)*
Fatal and non-fatal CV events
All
Events (%) 178 (12%) 420 (11%) 237 (14%) 108 (25%)
Hazard ratio 0·87 (0·73–1·04) referent 1·05 (0·88–1·23) 1·30 (1·04–1·62)*
Stroke
Events (%) 81 (5%) 178 (5%) 113 (6%) 48 (11%)
Hazard ratio 0·95 (0·73–1·24) referent 1·13 (0·89–1·44) 1·20 (0·87–1·67)
Cardiac
Events (%) 99 (7%) 244 (7%) 125 (7%) 57 (13%)
Hazard ratio 0·84 (0·67–1·07) referent 0·97 (0·78–1·22) 1·31 (0·97–1·77)
Coronary
Events (%) 83 (6%) 185 (5%) 93 (5%) 29 (7%)
Hazard ratio 0·92 (0·71–1·20) referent 0·99 (0·77–1·28) 0·92 (0·62–1·38)
CV=cardiovascular. Values for deaths and events are the number of participants, with the crude rate per 100 people given between parentheses. All hazard ratios express the risk versus normal (referent) and were adjusted for cohort, sex, age, body-mass index, smoking and drinking, serum cholesterol, history of cardiovascular disease, diabetes mellitus, antihypertensive drug treatment, and the 24-h blood pressure. *p<0·05. †p<0·001. ‡p<0·0001.
Table 4: Adjusted hazard ratios (95% CI) associated with extreme, decreased, and reverse dipping versus normal dipping
Articles
1224 www.thelancet.com Vol 370 October 6, 2007
Figure 1 shows the rates of mortality and cardiovascular events standardised by cohort, sex, and age. Table 2 shows the multivariate-adjusted hazard ratios associated with every SD increase in the day and night blood pressures. The hazard ratios for the night-to-day ratios are shown in table 2 for mortality and in table 3 for fatal combined with non-fatal cardiovascular events.
In adjusted models, night-time blood pressure predicted all mortality outcomes, whereas daytime blood pressure predicted total and cardiovascular mortality, but not death from non-cardiovascular causes (table 2). In fully adjusted models, the night-time blood pressure was a signifi cant predictor of total, cardiovascular, and non-cardiovascular mortality. In contrast, in the presence of night-time blood pressure, the daytime blood pressure was not signifi cant for total and cardiovascular mortality, but was signifi cant for non-cardiovascular mortality (table 2), with higher levels being associated with lower relative risk.
With adjustments applied for cohort and risk factors, the daytime and night-time systolic and diastolic blood pressures consistently predicted cardiovascular, cardiac, and coronary events, and fatal and non-fatal stroke
(table 3). In fully adjusted models, with correction for night-time blood pressure, the systolic daytime blood pressure lost its prognostic signifi cance for cardiac events (hazard ratio 1·11; p=0·07), whereas the diastolic daytime blood pressure became non-signifi cant for cardiac (1·04; p=0·45) and coronary (1·11; p=0·10) events (table 3). When adjusted for daytime blood pressure, the systolic and diastolic night-time levels no longer predicted coronary events (1·05; p=0·43 and 1·08; p=0·21, respectively).
In continuous analyses, the systolic and diastolic night-to-day ratios signifi cantly predicted total, non-cardiovascular, and cardiovascular mortality in models adjusted for cohort and risk factors (table 2). This fi nding was also noted in fully adjusted models, which were additionally adjusted for 24-h blood pressure (table 2). The only exception was the fully adjusted association of cardiovascular mortality with the systolic night-to-day ratio (p=0·10). In contrast with mortality, the systolic and diastolic night-to-day ratios were not consistent predictors of fatal combined with non-fatal events (table 3). In fully adjusted models, the systolic night-to-day ratio was not signifi cant (table 3) for all combined fatal and non-fatal outcomes investigated. The diastolic night-to-day ratio was only a signifi cant predictor of all cardiovascular outcomes (p=0·04), but not of other combined fatal and non-fatal events (table 3).
Participants with higher night-time than daytime blood pressure were not only older at enrolment (table 1), but were also older when they died than were those with a normal night-to-day ratio (78·2 years vs 74·1 years; p<0·0001; fi gure 2). Both cardiovascular (78·9 years vs 75·9 years; p=0·002) and non-cardiovascular (77·5 years vs 73·6 years; p=0·001) mortality contributed to this fi nding.
Figure 3 shows Kaplan-Meier survival function estimates for total mortality and the composite cardiovascular endpoint by category of the systolic night-to-day ratio. With adjustments applied for cohort, cardiovascular risk factors, and the 24-h blood pressure, participants with higher night-time than daytime blood pressure or a less pronounced dip in blood pressure were associated with higher rates of total mortality and cardiovascular events than were those whose night-to-day blood pressure ratio was normal or extreme (p<0·0001). Table 4 provides the number of events per dipping class. Participants with higher night-time than daytime blood pressure had a signifi cantly higher risk of death from any cause and more fatal and non-fatal cardiovascular complications than did those with a normal night-to-day ratio (table 4).
In sensitivity analyses involving total mortality and the composite of all fatal and non-fatal cardiovascular endpoints in relation to the daytime and night-time systolic blood pressure and the systolic night-to-day ratio, we stratifi ed according to sex, median age (60 years), history of
At risk Events Daytime Night-time Night-to-day ratio
Total mortality
All participants 7458 983 0·94 (0·87–1·03) 1·22 (1·13–1·31)§ 1·13 (1·07–1·19)§
Women 3416 (46%) 267 (27%) 0·97 (0·82–1·15) 1·35 (1·15–1·58)‡ 1·16 (1·04–1·30)†
Men 4042 (54%) 716 (73%) 0·93 (0·84–1·02) 1·19 (1·09–1·29)§ 1·12 (1·05–1·19)‡
<60 years 3756 (50%) 115 (12%) 1·12 (0·83–1·51) 1·20 (0·89–1·61) 1·06 (0·86–1·31)
≥60 years 3702 (50%) 868 (88%) 0·93 (0·85–1·02) 1·22 (1·13–1·31)§ 1·13 (1·07–1·20)§
No history of CVD 6832 (92%) 787 (80%) 0·97 (0·88–1·06) 1·22 (1·12–1·32)§ 1·12 (1·05–1·19)‡
History of CVD 626 (8%) 196 (20%) 0·89 (0·79–1·07) 1·23 (1·03–1·46)* 1·15 (1·02–1·31)*
Untreated 5821 (78%) 598 (61%) 0·98 (0·87–1·09) 1·20 (1·09–1·32)‡ 1·11 (1·03–1·19)†
Treated 1637 (22%) 384 (39%) 0·89 (0·78–1·01) 1·24 (1·11–1·38)‡ 1·16 (1·06–1·26)‡
Normotensive 4022 (54%) 315 (32%) 1·03 (0·86–1·24) 1·23 (1·04–1·44)* 1·09 (0·98–1·21)
Hypertensive 3436 (46%) 668 (68%) 0·91 (0·83–1·01) 1·22 (1·12–1·32)§ 1·14 (1·07–1·22)§
All cardiovascular events
All participants 7458 943 1·16 (1·07–1·26)‡ 1·21 (1·12–1·30)§ 1·05 (0·98–1·11)
Women 3416 (46%) 255 (27%) 1·21 (1·02–1·44)* 1·38 (1·18–1·63)§ 1·09 (0·97–1·23)
Men 4042 (54%) 688 (73%) 1·12 (1·02–1·23)* 1·18 (1·09–1·28)§ 1·05 (0·98–1·12)
<60 years 3756 (50%) 139 (15%) 1·55 (1·21–1·99)‡ 1·22 (0·95–1·58) 0·94 (0·78–1·14)
≥60 years 3702 (50%) 804 (85%) 1·11 (1·02–1·21)* 1·21 (1·13–1·31)§ 1·07 (1·00–1·13)*
No history of CVD 6832 (92%) 745 (79%) 1·19 (1·08–1·30)‡ 1·22 (1·13–1·32)§ 1·05 (0·98–1·11)
History of CVD 626 (8%) 198 (21%) 1·09 (0·91–1·30) 1·14 (0·97–1·34) 1·04 (0·92–1·17)
Untreated 5821 (78%) 531 (56%) 1·30 (1·15–1·45)§ 1·15 (1·04–1·27)† 0·99 (0·91–1·07)
Treated 1637 (22%) 412 (44%) 1·01 (0·89–1·14) 1·27 (1·14–1·40)§ 1·12 (1·03–1·21)†
Normotensive 4022 (54%) 252 (27%) 1·32 (1·09–1·60)† 1·26 (1·05–1·51)† 1·01 (0·90–1·14)
Hypertensive 3436 (46%) 691 (73%) 1·11 (1·01–1·22)* 1·20 (1·11–1·30)§ 1·06 (0·99–1·13)
CVD=cardiovascular disease. Hypertension was a conventional blood pressure of at least 140 mm Hg systolic or 90 mm Hg diastolic or the use of antihypertensive drugs. p values for heterogeneity are reported in the text. All hazard ratios were adjusted as described in table 2 legend. *p<0·05. †p<0·01. ‡p<0·001. §p<0·0001.
Table 5: Adjusted standardised hazard ratios (95% CI) for systolic blood pressure according to baseline characteristics
Articles
www.thelancet.com Vol 370 October 6, 2007 1225
cardiovascular disease, treatment status, and the presence or absence of hypertension on conventional blood pressure measurement (table 5). The results across these strata were consistent with those in the whole study population with few exceptions. Women had higher hazard ratios for cardiovascular events in relation to the daytime blood pressure than did men (1·21 vs 1·12; p=0·06), and higher hazard ratios for both total mortality (1·35 vs 1·19; p=0·02) and cardiovascular events (1·38 vs 1·18; p=0·006) in relation to the night-time blood pressure. In participants younger than 60 years and in those who were untreated, the hazard ratios for cardiovascular events in relation to the daytime blood pressure were signifi cantly larger than were those in participants older than 60 years (1·55 vs 1·11;
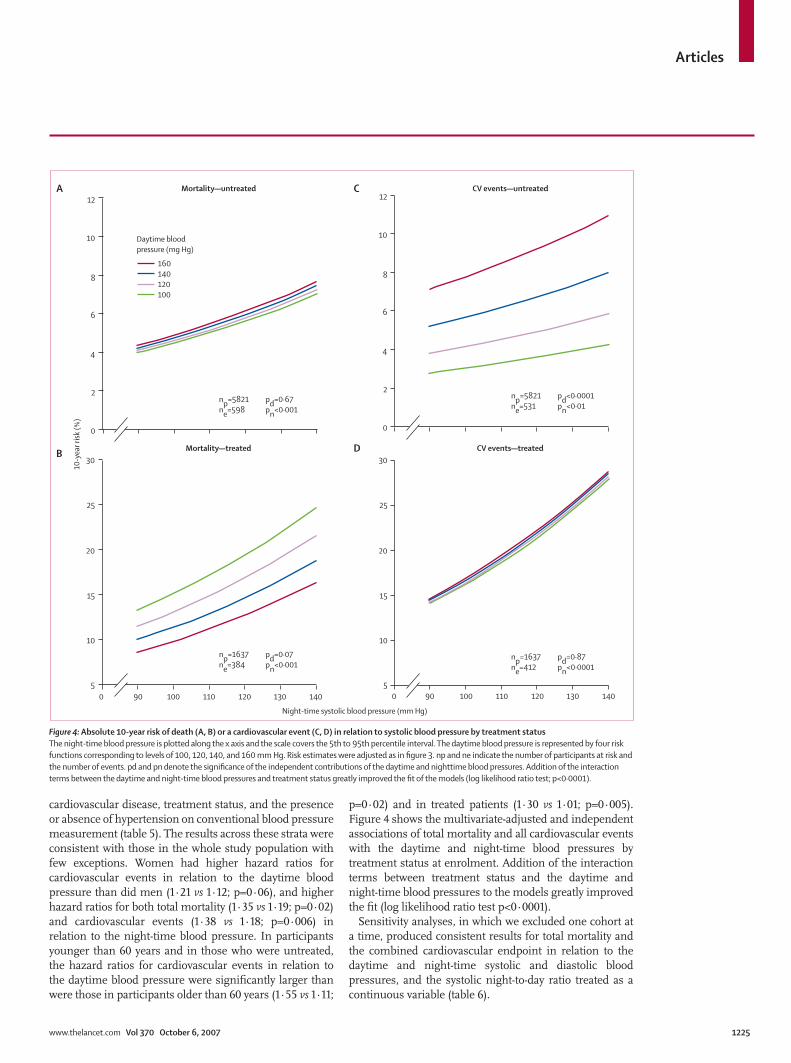
p=0·02) and in treated patients (1·30 vs 1·01; p=0·005). Figure 4 shows the multivariate-adjusted and independent associations of total mortality and all cardiovascular events with the daytime and night-time blood pressures by treatment status at enrolment. Addition of the interaction terms between treatment status and the daytime and night-time blood pressures to the models greatly improved the fi t (log likelihood ratio test p<0·0001).
Sensitivity analyses, in which we excluded one cohort at a time, produced consistent results for total mortality and the combined cardiovascular endpoint in relation to the daytime and night-time systolic and diastolic blood pressures, and the systolic night-to-day ratio treated as a continuous variable (table 6).
Night-time systolic blood pressure (mm Hg)
5900 100 110
A
B
C
D
120 130 140900 100 110 120 130 140
10
15
20
25
30
5
10
15
20
25
30CV events—treated
CV events—untreated
Mortality—treated
np=5821ne=598
pd=0·67pn<0·001
np=1637ne=384
pd=0·07pn<0·001
np=5821ne=531
pd<0·0001pn<0·01
np=1637ne=412
pd=0·87pn<0·0001
Mortality—untreated
Daytime bloodpressure (mg Hg)
12
160140120100
10
8
6
4
2
0
12
10
8
6
4
2
0
10-y
ear r
isk (%
)
Figure 4: Absolute 10-year risk of death (A, B) or a cardiovascular event (C, D) in relation to systolic blood pressure by treatment status The night-time blood pressure is plotted along the x axis and the scale covers the 5th to 95th percentile interval. The daytime blood pressure is represented by four risk functions corresponding to levels of 100, 120, 140, and 160 mm Hg. Risk estimates were adjusted as in fi gure 3. np and ne indicate the number of participants at risk and the number of events. pd and pn denote the signifi cance of the independent contributions of the daytime and nighttime blood pressures. Addition of the interaction terms between the daytime and night-time blood pressures and treatment status greatly improved the fi t of the models (log likelihood ratio test; p<0·0001).
Articles
1226 www.thelancet.com Vol 370 October 6, 2007
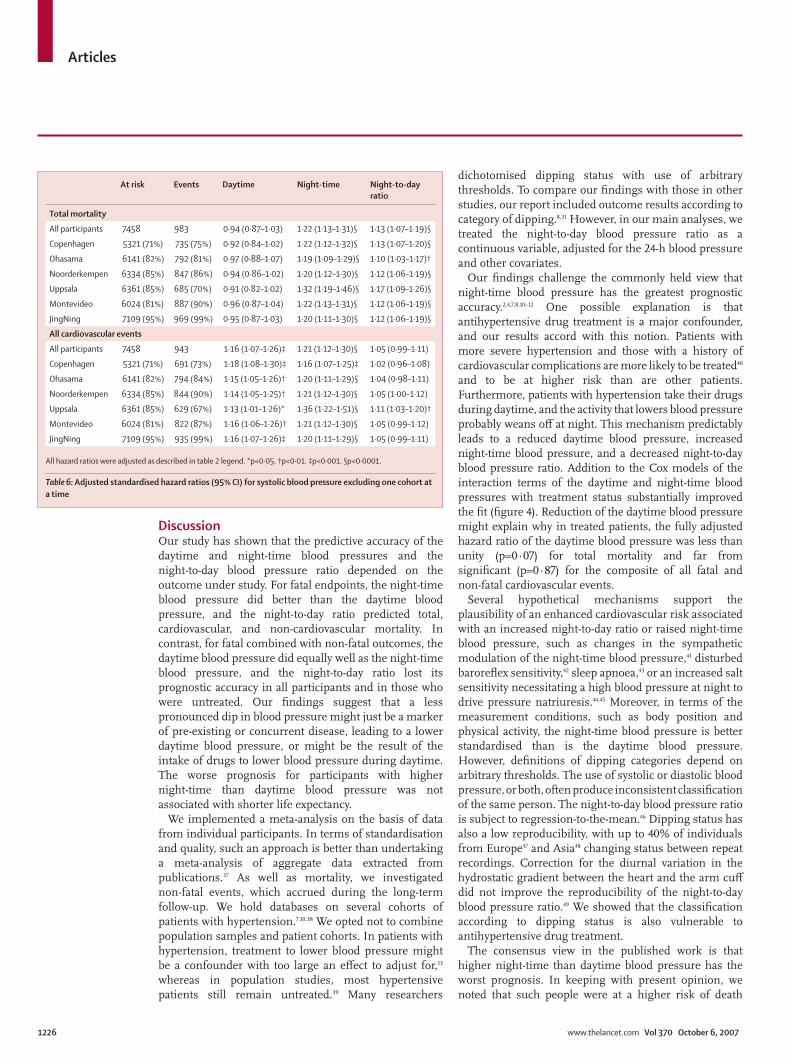
Discussion Our study has shown that the predictive accuracy of the daytime and night-time blood pressures and the night-to-day blood pressure ratio depended on the outcome under study. For fatal endpoints, the night-time blood pressure did better than the daytime blood pressure, and the night-to-day ratio predicted total, cardiovascular, and non-cardiovascular mortality. In contrast, for fatal combined with non-fatal outcomes, the daytime blood pressure did equally well as the night-time blood pressure, and the night-to-day ratio lost its prognostic accuracy in all participants and in those who were untreated. Our fi ndings suggest that a less pronounced dip in blood pressure might just be a marker of pre-existing or concurrent disease, leading to a lower daytime blood pressure, or might be the result of the intake of drugs to lower blood pressure during daytime. The worse prognosis for participants with higher night-time than daytime blood pressure was not associated with shorter life expectancy.
We implemented a meta-analysis on the basis of data from individual participants. In terms of standardisation and quality, such an approach is better than undertaking a meta-analysis of aggregate data extracted from publications.37 As well as mortality, we investigated non-fatal events, which accrued during the long-term follow-up. We hold databases on several cohorts of patients with hypertension.7,10,38 We opted not to combine population samples and patient cohorts. In patients with hypertension, treatment to lower blood pressure might be a confounder with too large an eff ect to adjust for,13 whereas in population studies, most hypertensive patients still remain untreated.39 Many researchers
dichotomised dipping status with use of arbitrary thresholds. To compare our fi ndings with those in other studies, our report included outcome results according to category of dipping.8,31 However, in our main analyses, we treated the night-to-day blood pressure ratio as a continuous variable, adjusted for the 24-h blood pressure and other covariates.
Our fi ndings challenge the commonly held view that night-time blood pressure has the greatest prognostic accuracy.2,4,7,8,10–12 One possible explanation is that antihypertensive drug treatment is a major confounder, and our results accord with this notion. Patients with more severe hypertension and those with a history of cardiovascular complications are more likely to be treated40 and to be at higher risk than are other patients. Furthermore, patients with hypertension take their drugs during daytime, and the activity that lowers blood pressure probably weans off at night. This mechanism predictably leads to a reduced daytime blood pressure, increased night-time blood pressure, and a decreased night-to-day blood pressure ratio. Addition to the Cox models of the interaction terms of the daytime and night-time blood pressures with treatment status substantially improved the fi t (fi gure 4). Reduction of the daytime blood pressure might explain why in treated patients, the fully adjusted hazard ratio of the daytime blood pressure was less than unity (p=0·07) for total mortality and far from signifi cant (p=0·87) for the composite of all fatal and non-fatal cardiovascular events.
Several hypothetical mechanisms support the plausibility of an enhanced cardiovascular risk associated with an increased night-to-day ratio or raised night-time blood pressure, such as changes in the sympathetic modulation of the night-time blood pressure,41 disturbed barorefl ex sensitivity,42 sleep apnoea,43 or an increased salt sensitivity necessitating a high blood pressure at night to drive pressure natriuresis.44,45 Moreover, in terms of the measurement conditions, such as body position and physical activity, the night-time blood pressure is better standardised than is the daytime blood pressure. However, defi nitions of dipping categories depend on arbitrary thresholds. The use of systolic or diastolic blood pressure, or both, often produce inconsistent classifi cation of the same person. The night-to-day blood pressure ratio is subject to regression-to-the-mean.46 Dipping status has also a low reproducibility, with up to 40% of individuals from Europe47 and Asia48 changing status between repeat recordings. Correction for the diurnal variation in the hydrostatic gradient between the heart and the arm cuff did not improve the reproducibility of the night-to-day blood pressure ratio.49 We showed that the classifi cation according to dipping status is also vulnerable to antihypertensive drug treatment.
The consensus view in the published work is that higher night-time than daytime blood pressure has the worst prognosis. In keeping with present opinion, we noted that such people were at a higher risk of death
At risk Events Daytime Night-time Night-to-day ratio
Total mortality
All participants 7458 983 0·94 (0·87–1·03) 1·22 (1·13–1·31)§ 1·13 (1·07–1·19)§
Copenhagen 5321 (71%) 735 (75%) 0·92 (0·84–1·02) 1·22 (1·12–1·32)§ 1·13 (1·07–1·20)§
Ohasama 6141 (82%) 792 (81%) 0·97 (0·88–1·07) 1·19 (1·09–1·29)§ 1·10 (1·03–1·17)†
Noorderkempen 6334 (85%) 847 (86%) 0·94 (0·86–1·02) 1·20 (1·12–1·30)§ 1·12 (1·06–1·19)§
Uppsala 6361 (85%) 685 (70%) 0·91 (0·82–1·02) 1·32 (1·19–1·46)§ 1·17 (1·09–1·26)§
Montevideo 6024 (81%) 887 (90%) 0·96 (0·87–1·04) 1·22 (1·13–1·31)§ 1·12 (1·06–1·19)§
JingNing 7109 (95%) 969 (99%) 0·95 (0·87–1·03) 1·20 (1·11–1·30)§ 1·12 (1·06–1·19)§
All cardiovascular events
All participants 7458 943 1·16 (1·07–1·26)‡ 1·21 (1·12–1·30)§ 1·05 (0·99–1·11)
Copenhagen 5321 (71%) 691 (73%) 1·18 (1·08–1·30)‡ 1·16 (1·07–1·25)‡ 1·02 (0·96–1·08)
Ohasama 6141 (82%) 794 (84%) 1·15 (1·05–1·26)† 1·20 (1·11–1·29)§ 1·04 (0·98–1·11)
Noorderkempen 6334 (85%) 844 (90%) 1·14 (1·05–1·25)† 1·21 (1·12–1·30)§ 1·05 (1·00–1·12)
Uppsala 6361 (85%) 629 (67%) 1·13 (1·01–1·26)* 1·36 (1·22–1·51)§ 1·11 (1·03–1·20)†
Montevideo 6024 (81%) 822 (87%) 1·16 (1·06–1·26)† 1·21 (1·12–1·30)§ 1·05 (0·99–1·12)
JingNing 7109 (95%) 935 (99%) 1·16 (1·07–1·26)‡ 1·20 (1·11–1·29)§ 1·05 (0·99–1·11)
All hazard ratios were adjusted as described in table 2 legend. *p<0·05. †p<0·01. ‡p<0·001. §p<0·0001.
Table 6: Adjusted standardised hazard ratios (95% CI) for systolic blood pressure excluding one cohort at a time
Articles
www.thelancet.com Vol 370 October 6, 2007 1227
from all causes than were those with normal night-to-day ratio. However, the fully adjusted night-to-day ratio of systolic blood pressure was a weak predictor of fatal combined with non-fatal endpoints in continuous as well as categorical analyses. Both antihypertensive treatment and reverse causality might explain this discrepancy. Elderly patients (≥60 years) enrolled in the Systolic Hypertension in Europe trial7 had their ambulatory blood pressure measured after a 3-month run-in period on placebo. In patients subsequently randomly assigned to a placebo, the night-time systolic blood pressure was a better predictor of cardiovascular mortality and morbidity than was the daytime level. A 10% increase in the systolic night-to-day blood pressure ratio was also associated with a 41% increased cardiovascular risk, which was independent of the 24-h ambulatory blood pressure. Randomisation to active treatment attenuated these associations to non-signifi cance.
Furthermore, in keeping with present IDACO results (table 1), people with higher night-time than daytime blood pressure in other studies were not only more frequently on antihypertensive drug treatment,8,11 but they were also older,8,11,50 and more likely to have a history of diabetes mellitus50 or previous cardiovascular disease8,50 than were those whose night-to-day blood pressure ratio was normal. The night-to-day blood pressure ratio increases as age increases.31 In our analyses, people with higher night-time than daytime blood pressure died at an older age than did those with a night-time dip in blood pressure. Thus, higher night-time than daytime blood pressure might be a marker rather than a cause of a poor outcome. The fully-adjusted inverse associations between non-cardiovascular mortality and the daytime blood pressure in all people (table 2) and between total mortality and the daytime blood pressure in those who were untreated (fi gure 4) also lend support to the interpretation of reverse causality.
Our study should be interpreted within the context of its potential limitations. First, the IDACO database consists of six population-based cohorts from three continents,2–4,16,17,19 but our results might not yet be generally applicable. Therefore, we are presently collecting outcome results in additional cohorts.15,18,19,21 Second, the six populations diff ered in anthropometric characteristics and lifestyle. Our analyses were multivariate-adjusted at the level of individual people, but we cannot exclude residual confounding. Sensitivity analyses showed that no one cohort had a disproportionately large eff ect. Third, in long-term international surveys, the defi nition of clinical events, such as coronary heart disease, is probably less precise than it is in short-term studies or randomised clinical trials, in which endpoints are obtained via a single channel of information. However, we used only hard outcomes, excluding transient ischaemic attacks and angina pectoris. Fourth, experts usually regard the asleep and awake blood pressures to be the best standards to analyse the diurnal blood pressure profi le.51,52 However,
we previously noticed in people from Europe29 and China17
that short fi xed clock-time intervals, which eliminate the transition periods in the morning and evening when blood pressure rapidly changes, result in daytime and night-time blood pressure means that are within 1–2 mm Hg of the awake and asleep levels.17,29 Fifth, ambulatory blood pressure monitoring was not standardised across the six contributing studies in terms of device type and intervals between readings. However, we used the same programme to compute blood pressure means that were time weighted across cohorts. Finally, we could not adjust for antihypertensive drug treatment as a time-dependent covariate, because this information was only available for individuals in the Belgian cohort.16,34 However, the proportion of our patients on antihypertensive treatment at baseline was only 22%. During the course of follow-up, the proportion of treated patients, in view of the poor rates of treatment in the general population39 and the bad persistence of treatment in some clinical studies,40 should have been greatly lower than in cohorts of referred patients with hypertension, who were followed up at specialised hypertension centres6,38 or started on antihypertensive treatment at enrolment.9
Our fi ndings have implications for clinical practice and research. The night-time blood pressure predicted mortality and non-fatal outcomes, irrespective of treatment status. The daytime blood pressure independently predicted the composite of all fatal and non-fatal cardiovascular events, especially in untreated participants. Our fi ndings therefore support recording the ambulatory blood pressure during the whole day. The proposed thresholds for the 24-h blood pressure,14 rather than the dipping pattern, should inform clinical decisions. Chronotherapy53 means timing the administration of antihypertensive drugs in such a way that the blood pressure is lowered over 24 h, while a normal night-to-day blood pressure ratio is preserved. However, there is no evidence supporting the effi cacy of chronotherapy in terms of blood pressure control54 or outcome.47 Furthermore, the classifi cation of patients according to the night-to-day blood pressure ratio greatly depends on arbitrary criteria, is poorly reproducible,47,48 and has a diff erent prognostic meaning according to the disease outcome under study, the prevailing 24-h blood pressure level, and treatment status. We would therefore recommend that in future publications any categorical representation of the night-to-day ratio be supported by continuous analyses adjusted for the 24-h blood pressure and be stratifi ed for treatment status.Contributors EO’B introduced the concept that a non-dipping diurnal profi le is a harbinger of worse prognosis. JAS planned and coordinated the IDACO project. JB, TWH, MK, and YL constructed the IDACO database and did the statistical analyses under supervision of LT at the Studies Coordinating Centre in Leuven, Belgium. Responsibility for the integrity of the local datasets rests with: TWH, CT-P, and HI (Copenhagen, Denmark); TR, TK, and JAS (Noorderkempen, Belgium);
Articles
1228 www.thelancet.com Vol 370 October 6, 2007
MK, TO, and YI (Ohasama, Japan); KB-B and LL (Uppsala, Sweden); JB and ES (Montevideo, Uruguay); and YL and JW (JingNing, China). JB, YL, and JAS wrote the fi rst draft of the paper. All authors interpreted the results and approved the fi nal version of the manuscript.
IDACO centres and investigators Belgium (Noorderkempen): R Fagard, T Kuznetsova, T Richart, J A Staessen, L Thijs; China (JingNing): Y Li, J Wang; the Czech Republic (Pilsen): J Filipovský, J Seidlerová, M Tichá; Denmark (Copenhagen): T W Hansen, H Ibsen, J Jeppesen, S Rasmussen, C Torp-Pedersen; Italy (Padua): E Casiglia, A Pizzioli, V Tikhonoff ; Ireland (Dublin): E Dolan, E O’Brien; Japan (Ohasama): K Asayama, J Hashimoto, H Hoshi, Y Imai, R Inoue, M Kikuya, H Metoki, T Obara, T Ohkubo, H Satoh, K Totsune; Poland (Cracow): A Adamkiewicz-Piejko, M Cwynar, J Gąsowski, T Grodzicki, K Kawecka-Jaszcz, W Lubaszewski, A Olszanecka, K Stolarz, B Wizner, W Wojciechowska, J Zyczkowska; the Russian Federation (Novosibirsk): T Kuznetsova, S Malyutina, Y Nikitin, E Pello, G Simonova, M Voevoda; Sweden (Uppsala): B Andrén, L Berglund, K Björklund-Bodegård, L Lind, B Zethelius; Uruguay (Montevideo): M Bianchi, J Boggia, V Moreira, E Sandoya, C Schettini, E Schwedt, H Senra.
Database management and coordination J Boggia, T W Hansen, M Kikuya, Y Li, J A Staessen (project coordinator), and L Thijs (supervisor database management) constructed the IDACO database at the Studies Coordinating Centre in Leuven, Belgium.
Confl ict of interest statementWe declare that we have no confl ict of interest.
Acknowledgments The European Union (grants IC15-CT98-0329-EPOGH and LSHM-CT-2006-037093); the Fonds voor Wetenschappelijk Onderzoek Vlaanderen, Ministry of the Flemish Community, Brussels, Belgium (grants G.0424.03 and G.0575.06); and the Katholieke Universiteit Leuven, Belgium (grants OT/99/28, OT/00/25 and OT/05/49) gave support to the Studies Coordinating Centre. JAS is holder of the Pfi zer Chair for Hypertension and Cardiovascular Research. The Danish Heart Foundation (grant 01-2-9-9A-22914), the Beckett Fonden, and the Lundbeck Fonden supported the studies in Copenhagen. The Bilateral Scientifi c and Technological Collaboration between China and Flanders, Ministry of the Flemish Community, Brussels (grant BIL02/10) supported the fellowship of Y Li in Leuven. The Ministries of Education, Culture, Sports, Science and Technology (grants 15790293, 17790381, 18390192, and 18590587) and of Health, Labour and Welfare (Health Science Research Grants and Medical Technology Evaluation Research Grants), Grant-in-Aid from the Japanese Society for the Promotion of Science (16.54041 and 18.54042), the Japan Atherosclerosis Prevention Fund, the Uehara Memorial Foundation, and the Takeda Medical Research Foundation supported research in Japan. The National Natural Science Foundation of China (grant 30571607), Beijing, China, and the Shanghai Commissions of Science and Technology (the “Rising Star” programme 06QA14043) and Education (the “Dawn” project) supported the JingNing study in China. We thank Sandra Covens, Katrien Staessen, and Renilde Wolfs (Leuven, Belgium) for their expert assistance.
References 1 O’Brien E, Sheridan J, O’Malley K. Dippers and non-dippers. Lancet
1988; 332: 397. 2 Ohkubo T, Hozawa A, Yamaguchi J, et al. Prognostic signifi cance of
the nocturnal decline in blood pressure in individuals with and without high 24-h blood pressure: the Ohasama study. J Hypertens 2002; 20: 2183–89.
3 Hansen TW, Jeppesen J, Rasmussen F, Ibsen H, Torp-Pedersen C. Ambulatory blood pressure monitoring and mortality: a population-based study. Hypertension 2005; 45: 499–504.
4 Ingelsson E, Björklund K, Lind L, Ärnlöv J, Sundström J. Diurnal blood pressure pattern and risk of congestive heart failure. JAMA 2006; 295: 2859–66.
5 Mancia G, Facchetti R, Bombelli M, Grassi G, Sega R. Long-term risk of mortality associated with selective and combined elevation in offi ce, home, and ambulatory blood pressure. Hypertension 2006; 47: 846–53.
6 Verdecchia P, Porcellati C, Schillaci G, et al. Ambulatory blood pressure. An independent predictor of prognosis in essential hypertension. Hypertension 1994; 24: 793–801.
7 Staessen JA, Thijs L, Fagard R, et al. Predicting cardiovascular risk using conventional vs ambulatory blood pressure in older patients with systolic hypertension. JAMA 1999; 282: 539–46.
8 Kario K, Pickering TG, Matsuo T, Hoshide S, Schwartz JE, Shimada K. Stroke prognosis and abnormal nocturnal blood pressure falls in older hypertensives. Hypertension 2001; 38: 852–57.
9 Clement DL, De Buyzere ML, De Bacquer DA, et al. Prognostic value of ambulatory blood-pressure recordings in patients with treated hypertension. N Engl J Med 2003; 348: 2407–15.
10 Dolan E, Stanton A, Thijs L, et al. Superiority of ambulatory over clinic blood pressure measurement in predicting mortality. The Dublin Outcome Study. Hypertension 2005; 46: 156–61.
11 Ben-Dov IZ, Kark JD, Ben-Ishay D, Mekler J, Ben-Arie L, Bursztyn M. Predictors of all-cause mortality in clinical ambulatory monitoring. Unique aspects of blood pressue during sleep. Hypertension 2007; 49: 1235–41.
12 Schwartz GL, Bailey KR, Mosley T, et al. Association of ambulatory blood pressure with ischemic brain injury. Hypertension 2007; 49: 1228–34.
13 Thijs L, Hansen TW, Kikuya M, et al. The International Database of Ambulatory blood pressure in relation to Cardiovascular Outcome (IDACO): protocol and reseacrh perspectives. Blood Press Monit 2007; 12: 255–62.
14 Kikuya M, Hansen TW, Thijs L, et al. Diagnostic thresholds for ambulatory blood pressure monitoring based on 10-year cardiovascular risk. Circulation 2006; 115: 2145–52.
15 Kuznetsova T, Malyutina S, Pello E, Thijs L, Nikitin Y, Staessen JA. Ambulatory blood pressure of adults in Novosibirsk, Russia: interim report on a population study. Blood Press Monit 2000; 5: 291–96.
16 Staessen JA, Bieniaszewski L, O’Brien ET, Imai Y, Fagard R. An epidemiological approach to ambulatory blood pressure monitoring: the Belgian population study. Blood Press Monit 1996; 1: 13–26.
17 Li Y, Wang JG, Gao HF, et al. Are published characteristics of the ambulatory blood pressure generalizable to rural Chinese? The JingNing population study. Blood Press Monit 2005; 10: 125–34.
18 O’Brien E, Murphy J, Tyndall A, et al. Twenty-four-hour ambulatory blood pressure in men and women aged 17 to 80 years: the Allied Irish Bank Study. J Hypertens 1991; 9: 355–60.
19 Schettini C, Bianchi M, Nieto F, Sandoya E, Senra H, Hypertension Working Group. Ambulatory blood pressure. Normality and comparison with other measurements. Hypertension 1999; 34 (part 2): 818–25.
20 Shiburi CP, Staessen JA, Maseko M, et al. Reference values for SphygmoCor measurements in South Africans of African ancestry. Am J Hypertens 2006; 19: 40–46.
21 Casiglia E, Basso G, Guglielmi F, et al. German origin clusters for high cardiovascular risk in an Italian enclave. Int Heart J 2005; 46: 489–500.
22 Imai Y, Nagai K, Sakuma M, et al. Ambulatory blood pressure of adults in Ohasama, Japan. Hypertension 1993; 22: 900–12.
23 O’Brien E, Mee F, Atkins N, Thomas M. Evaluation of three devices for self-measurement of blood pressure according to the revised British Hypertension Society Protocol: the Omron HEM-705 CP, Philips HP5332 and Nissei DS-175. Blood Press Monit 1996; 1: 55–62.
24 Taylor R, Chidley K, Goodwin J, Broeders M, Kirby B. Accutracker II (version 30/23) ambulatory blood pressure monitor: clinical validation using the British Hypertensin Society and Association for the Advancement of Medical Instrumentation standards. J Hypertens 1993; 11: 1275–82.
25 Groppelli A, Omboni S, Parati G, Mancia G. Evaluation of noninvasive blood pressure monitoring devices Spacelabs 90202 and 90207 versus resting and ambulatory 24-hour intra-arterial blood pressure. Hypertension 1992; 20: 227–32.
26 Imai Y, Sasaki S, Minami N, et al. The accuracy and performance of the A&D TM 2421, a new ambulatory blood pressure monitoring device based on the cuff -oscillometric method and the Korotkoff sound technique. Am J Hypertens 1992; 5: 719–26.
Articles
www.thelancet.com Vol 370 October 6, 2007 1229
27 Imai Y, Abe K, Sasaki S, et al. Determination of clinical accuracy and nocturnal blood pressure pattern by new portable device for monitoring indirect ambulatory blood pressure. Am J Hypertens 1990; 3: 293–301.
28 Ohkubo T, Imai Y, Tsuji I, et al. Reference values for 24-hour ambulatory blood pressure monitoring based on a prognositic criterion. The Ohasama Study. Hypertension 1998; 32: 255–59.
29 Fagard R, Brguljan J, Thijs L, Staessen J. Prediction of the actual awake and asleep blood pressures by various methods of 24 h pressure analysis. J Hypertens 1996; 14: 557–63.
30 Franklin SS, Larson MG, Khan SA, et al. Does the relation of blood pressure to coronary heart disease change with aging? The Framingham Heart Study. Circulation 2001; 103: 1245–49.
31 Staessen JA, Bieniaszewski L, O’Brien E, et al. Nocturnal blood pressure fall on ambulatory monitoring in a large international database. Hypertension 1997; 29: 30–39.
32 Expert Committee on the Diagnosis and Classifi cation of Diabetes Mellitus. Report of the expert committee on the diagnosis and classifi cation of diabetes mellitus. Diabetes Care 2003; 26 (suppl 1): S5–S20.
33 Ohkubo T, Kikuya K, Metoki H, et al. Prognosis of “masked” hypertension and “white-coat” hypertension detected by 24-h ambulatory blood pressure monitoring. 10-year follow-up from the Ohasama study. J Am Coll Cardiol 2005; 46: 508–15.
34 Li Y, Thijs L, Kuznetsova T, et al. Cardiovascular risk in relation to α-adducin Gly460Trp polymorphism and systolic pressure. A prospective population study. Hypertension 2005; 46: 527–32.
35 Hansen TW, Jeppesen J, Rasmussen S, Ibsen H, Torp-Pedersen C. Ambulatory blood pressure and risk of cardiovascular disease: a population based study. Am J Hypertens 2006; 19: 243–59.
36 Pocock S, Clayton TC, Altman DG. Survival plot of time-to-event outcomes in clinical trials. Lancet 2002; 359: 1686–89.
37 Stewart LA, Parmar MKB. Meta-analysis of the literature or of individual patient data: is there a diff erence? Lancet 1993; 341: 418–22.
38 Celis H, Staessen JA, Thijs L, et al. Cardiovascular risk in white-coat and sustained hypertensive patients. Blood Press 2002; 11: 352–56.
39 Weinehall L, Öhgren B, Persson M, et al. High remaining risk in poorly treated hypertension: the ‘rule of halves’ still exist. J Hypertens 2002; 20: 2081–88.
40 Chapman RH, Benner JS, Petrilla AA, et al. Predictors of adherence with antihypertensive and lipid-lowering therapy. Arch Intern Med 2005; 165: 1147–52.
41 Dodt C, Breckling U, Derad I, Fehm HL, Born J. Plasma epinephrine and norepinephrine concentrations of healthy humans associated with nighttime sleep and morning arousal. Hypertension 1997; 30 (part 1): 71–76.
42 Vaile JC, Stallard TJ, al-Ani M, Jordan PJ, Townend JN, Littler WA. Sleep and blood pressure: spontaneous barorefl ex sensitivity in dippers and non-dippers. J Hypertens 1996; 14: 1427–32.
43 Young T, Peppard PE, Gottlieb DJ. Epidemiology of obstructive sleep apnea. A population health perspective. Am J Respir Crit Care Med 2002; 165: 1217–39.
44 Staessen JA, Birkenhäger W, Bulpitt CJ, et al. The relationship between blood pressure and sodium and potassium excretion during the day and at night. J Hypertens 1993; 11: 443–47.
45 Sachdeva A, Weder AB. Nocturnal sodium excretion, blood pressure dipping, and sodium sensitivity. Hypertension 2006; 48: 527–33.
46 Staessen J, Bulpitt CJ, O’Brien E, et al. The diurnal blood pressure profi le. A population study. Am J Hypertens 1992; 5: 386–92.
47 Omboni S, Parati G, Palatini P, et al. Reproducibility and clinical value of nocturnal hypotension: prospective evidence from the SAMPLE study. J Hypertens 1998; 16: 733–38.
48 Mochizuki Y, Okutani M, Donfeng Y, et al. Limited reproducibility of circadian variation in blood pressure dippers and nondippers. Am J Hypertens 1998; 11: 403–09.
49 Parati G. Blood pressure reduction at night: sleep and beyond. J Hypertens 2000; 18: 1725–29.
50 Davidson MB, Hix JK, Vidt DG, Brotman DJ. Association of impaired diurnal blood pressure variation with a subsequent decline in glomerular fi ltration rate. Arch Intern Med 2006; 166: 846–52.
51 O’Brien E, Asmar R, Beilin L, et al. Practice guidelines of the European Society of Hypertension for clinic, ambulatory and self blood pressure measurement. J Hypertens 2005; 23: 697–701.
52 Pickering TG, Hall JE, Appel LJ, et al. Recommendations for blood pressure measurement in humans and experimental animals. Part 1: blood pressure measurement in humans. A statement for professionals from the Subcommittee of Professional and Public Education of the American Heart Association Council on High Blood Pressure Research. Hypertension 2005; 45: 142–61.
53 Scarpelli PT, Gallo M, Chiari G. Chronobiology of blood pressure. J Nephrol 2000; 13: 197–204.
54 Hermida RC, Calvo C, Ayala DE, et al. Administration time-dependent eff ects of valsartan on ambulatory blood pressure in hypertensive subjects. Hypertension 2003; 42: 283–90.