Late Night Economy Impact Assessment Report
24
ECONOMIC IMPACT ASSESSMENT Edmonton’s Late-Night Entertainment Economy
-
Upload
independent -
Category
Documents
-
view
1 -
download
0
Transcript of Late Night Economy Impact Assessment Report

ECONOMICIMPACT
ASSESSMENTEdmonton’s Late-Night Entertainment Economy

Responsible Hospitality Edmonton
Angela Turner Cindy DaviesProgram Manager Street as a Venue Coordinator – WhyteSustainable Development Sustainable Development780-944-0300 780-495-0388
Office of the Chief Economist
John Rose Milap PetigaraChief Economist Senior Economist Financial Services Financial Services780-496-6070 780-442-7086

ECONOMIC IMPACT ASSESSMENTEdmonton’s Late-Night Entertainment Economy
Table of Contents
1.0 Executive Summary ______________________________________________________ 3
Introduction ___________________________________________________________________ 4
2.1 What is the Late-Night Entertainment Economy? ___________________________ 4
2.2 Why Focus on the Late-Night Entertainment Economy? ______________________ 4
2.3 Economic Impact Assessment ___________________________________________ 5
2.4 Survey Data _________________________________________________________ 5
3.0 Industry Overview _______________________________________________________ 6
3.1 Expenditure Linkages with Other Industry Sectors _________________________ 11
3.2 Employment in the Late-Night Entertainment Economy ____________________ 11
4.0 Methodology ___________________________________________________________ 12
4.1 Estimating Total Annual Expenditures by Patrons of Late-Night Establishments __ 12
4.2 Impact Analysis _____________________________________________________ 12
4.3 Regionalizing Multipliers ______________________________________________ 13
5.0 Economic Impacts _______________________________________________________ 14
5.1 Total Economic Impacts ______________________________________________ 14
5.2 Impact Comparisons _________________________________________________ 15
5.3 Ancillary Impacts ____________________________________________________ 15
5.4 Non-Market Benefits _________________________________________________ 16
6.0 Avenues for Further Study _______________________________________________ 16
7.0 Appendix ______________________________________________________________ 17

ECONOMIC IMPACT ASSESSMENTEdmonton’s Late-Night Entertainment Economy
ECONOMIC IMPACT ASSESSMENTEdmonton’s Late-Night Entertainment Economy
Page 3
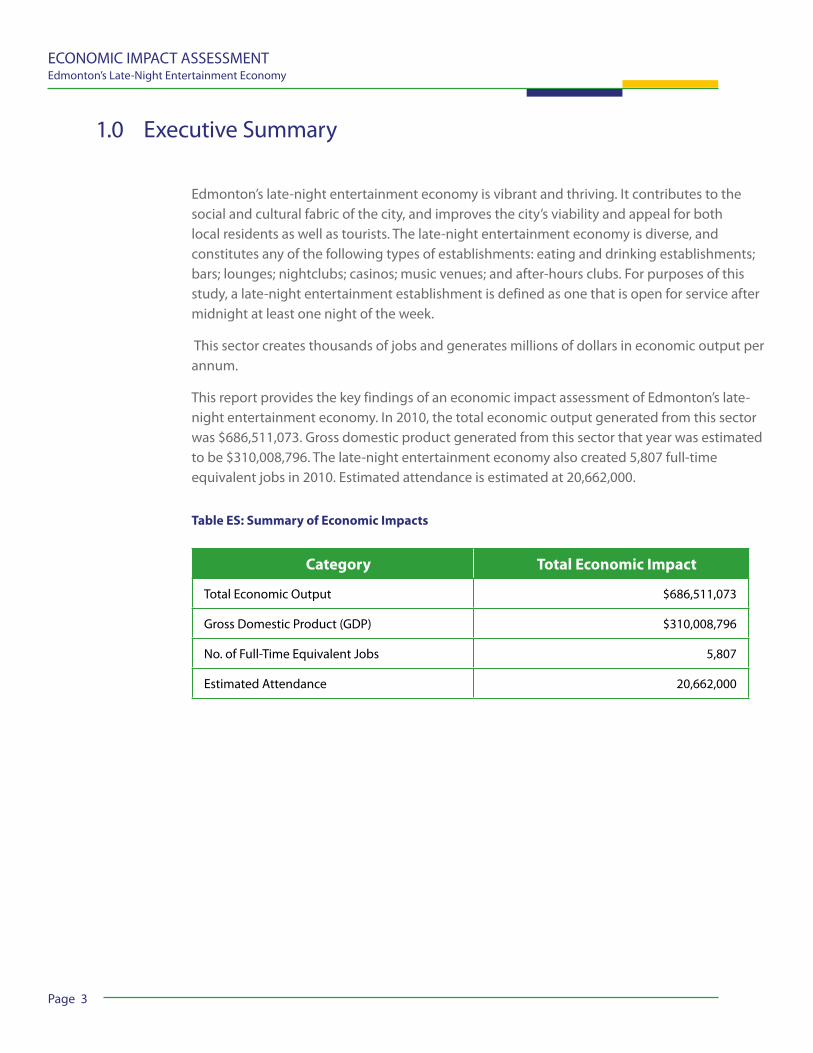
1.0 Executive Summary
Edmonton’s late-night entertainment economy is vibrant and thriving. It contributes to the social and cultural fabric of the city, and improves the city’s viability and appeal for both local residents as well as tourists. The late-night entertainment economy is diverse, and constitutes any of the following types of establishments: eating and drinking establishments; bars; lounges; nightclubs; casinos; music venues; and after-hours clubs. For purposes of this study, a late-night entertainment establishment is defined as one that is open for service after midnight at least one night of the week.
This sector creates thousands of jobs and generates millions of dollars in economic output per annum.
This report provides the key findings of an economic impact assessment of Edmonton’s late-night entertainment economy. In 2010, the total economic output generated from this sector was $686,511,073. Gross domestic product generated from this sector that year was estimated to be $310,008,796. The late-night entertainment economy also created 5,807 full-time equivalent jobs in 2010. Estimated attendance is estimated at 20,662,000.
Table ES: Summary of Economic Impacts
Category Total Economic Impact
Total Economic Output $686,511,073
Gross Domestic Product (GDP) $310,008,796
No. of Full-Time Equivalent Jobs 5,807
Estimated Attendance 20,662,000

ECONOMIC IMPACT ASSESSMENTEdmonton’s Late-Night Entertainment Economy
Page 4
Introduction
Edmonton has a vibrant nightlife and a thriving late-night entertainment economy. The nightlife economy contributes to Edmonton’s social and cultural fabric, improving the city’s viability and appeal for both local residents as well as tourists. This sector also creates thousands of jobs and generates millions of dollars in economic output. Yet, like many cities, Edmonton is not aware of, nor does it formally recognize, the contributions of the late-night-entertainment economy. This lack of formal recognition has resulted in an underprovision of municipal services and planning to this economic sector.
By conducting economic analysis, we can better understand the economic significance of this sector. This report provides the key findings of an economic impact assessment of Edmonton’s late-night entertainment economy, and is intended to spur thought and discussion on the economic role this sector plays within the city. Furthermore, this report can be used as a foundation for the ongoing growth, development, and improvement of Edmonton’s late-night entertainment economy.
2.1 What is the Late-Night Entertainment Economy?
The term “night-time economy” became prominent in the early 1990s to describe the large growth in economic activity at night across the UK. While definitions of the term vary according to context, it has been described as: “the pursuit of night-time leisure or work activities outside the home and the hosting of leisure events in the home.” Edmonton has coined the term “the other 9-5”, referring to 9 p.m.- to 9 a.m.
In this report, we focus on only the aspects of night-time economy that relate to the “late-night entertainment economy”. For purposes of this study, we define a late-night entertainment establishment as one that is open for service after midnight at least one night of the week. The late-night entertainment economy is a diverse one, and constitutes any of the following types of establishments: eating and drinking establishments; bars; lounges; nightclubs; casinos; music venues; and after-hours clubs.
2.2 Why Focus on the Late-Night Entertainment Economy?
Both day and night-time economies are important to the life of Edmonton. However, the issues and challenges facing each are significantly different from one another. In particular, the late-night entertainment economy, which operates in the late hours of the night, poses unique issues with respect to the management, planning, and municipal services it requires.
Areas of the city that host the late-night entertainment economy experience large volumes of night-time visitors, and undergo significant changes at night. These changes affect public spaces and how they are used. The types of people visiting certain neighbourhoods, as well their motives for visiting, also changes at night. Economic diversity, public transportation options, as well as the availability of other services are markedly different from day to night. Furthermore, areas of the city that host nightlife businesses can also undergo anti-social

ECONOMIC IMPACT ASSESSMENTEdmonton’s Late-Night Entertainment Economy
Page 5
behaviour due to high levels of intoxication. In many respects, Edmonton is a different city at night than in the day.
Edmonton’s late-night entertainment economy has experienced substantial growth, however much of the necessary infrastructure, municipal services, and planning have not kept abreast. As a result, areas of the city that host these economies may face public safety concerns, as well as reductions in quality of life. As the economy and population of Edmonton continue to grow, we can assume that the late-night entertainment economy will also continue to grow.
By failing to foster a healthy and vibrant late-night entertainment economy, the city jeopardizes its aspirations to become a global city. Furthermore, many tourists and residents view vibrant nightlife economies as characteristics of an enjoyable and livable city. Doing nothing to improve the functioning of this economic sector can risk the reputation of Edmonton.
2.3 Economic Impact Assessment
This economic impact assessment was undertaken by the City of Edmonton’s Office of the Chief Economist, under the direction and initiative of Responsible Hospitality Edmonton (RHE), Responsible Hospitality Institute (RHI)—who conducted similar exercises in Austin, Seattle, and New York—and local businesses. This form of assessment calculates the economy-wide impacts created from the late-night entertainment sector. Statistics Canada’s Industry Accounts Division’s input-output (I-O) multipliers were used as the basis for the analysis.
2.4 Survey Data
The survey approach consists of two separate components: the first involves the collection of primary information from licensed venues; the second involves collecting secondary information from patrons of late-night entertainment establishments. In consultation with RHI, RHE implemented the first survey component in 2011, which was a voluntary survey of businesses operating within the late-night entertainment industry. The second survey component is still underway and, as such, is not discussed in this report.
A total of 38 late-night entertainment establishments participated in the first survey component. The information collected includes employment data, patron attendance, and operational and financial values. This survey data was used to estimate the direct expenditure stimulus from patrons of late-night entertainment establishments.The second survey component will ask patrons of late-night entertainment establishments about their expenditures before and after visiting late-night venues, including, but not limited to: dining, shopping, theatre, and taxis. These types of expenditures are termed ancillary expenditures, and are an indirect result of patrons attending late-night entertainment establishments.
The economic impacts of ancillary expenditures are not included in this report. This report is an analysis of the economy-wide impacts of patrons making expenditures directly within late-night entertainment establishments.

ECONOMIC IMPACT ASSESSMENTEdmonton’s Late-Night Entertainment Economy
Page 6
3.0 Industry Overview
Late-night entertainment establishments represent a significant proportion of all licenced establishments within the city of Edmonton. In 2010, a total of 1,011 licenced establishments were in operation, with a total of 263,439 licenced seats (Table 1). Of these establishments, 23% were late-night entertainment establishments, containing 27% of all licenced seats in the City (Table 1).
Table 1: Late-Night Entertainment Establishments Versus All Licenced Establishments, 2010
Establishment TypeLate-Night
EstablishmentsAll Licenced
Establishments % of Total
Establishments 235 1,011 23%
Licenced Seats* 69,865 263,439 27%
*Licensed seats are calculated on fire occupancy loads
Edmonton boasts a total of 235 late-night entertainment establishments, with a total licenced seating capacity of 69,865 (Table 2). Entertainment establishments do not fall within clearly defined categories, as they often transcend numerous service types. For example, a business may provide food and drink in a bar/lounge environment, but also have an adjoining nightclub section. Hence, late-night entertainment establishments are categorized into four groups by business licence type: 1) bar/lounge, 2) bar/lounge/nightclub, 3) nightclub, and 4) other/unknown.
Table 2: Late-Night Entertainment Establishments in 2010, by Business Licence Type
Business Licence Type Establishments (#)Late-Night Licenced
Seats (#)Bar/Lounge 161 41,400
Bar/Lounge/Nightclub 5 1,816
Nightclub 61 25,032
Other/Unknown 8 1,617
Total 235 69,865

ECONOMIC IMPACT ASSESSMENTEdmonton’s Late-Night Entertainment Economy
Page 7
Figure 1: Breakdown of Late-Night Entertainment Establishments, by Establishment Type
The bar/lounge category comprises the lion’s share of establishments, with 161 businesses. Nightclubs are the second most numerous, with 61 establishments. The bar/lounge/nightclub and other/unknown categories comprise only a small number of establishments. However, nightclubs have the highest occupancy loads on a per-establishment basis: 26% of establishments are nightclubs, but contain 36% of all the city’s licensed seats. A comparison of the four establishment categories and their respective percentages of establishments and licenced seats are presented in Figure 3.
Figure 2: Breakdown of Late-Night Entertainment Establishments, by Licenced Seating Capacity
Bar/Lounge68.5%
Nightclub26.0%
Other/Unknown3.4%
Bar/Lounge/Nightclub
2%
Bar/Lounge59.3%
Nightclub35.8%
Bar/Lounge/Nightclub
2%
Other/Unknown2.3%

ECONOMIC IMPACT ASSESSMENTEdmonton’s Late-Night Entertainment Economy
Page 8
Figure 3: Comparison of Establishments (% of Total) with Respective Occupancy Load (% of Total)
The size of the late-night entertainment industry has shown significant growth in recent years. Figures 4 and 5 illustrate this growth trend over the four-year period, from 2007 to 2010. Figure 4 illustrates the growth trend in the number of late-night entertainment establishments. Figure 5 illustrates the growth trend in the number of licenced seats in late-night entertainment establishments.
Figure 4: Number of Late-Night Entertainment Establishments, 2007–2010
0%
10%
20%
30%
40%
50%
60%
70%
Bar/Lounge Bar/Lounge/Nightclub Nightclub Other/Unknown
Establishments (%) Licenced Seats (%)
0
50
100
150
200
250
2007 2008 2009 2010

ECONOMIC IMPACT ASSESSMENTEdmonton’s Late-Night Entertainment Economy
Page 9
Figure 5: Number of Licenced Seats in Late-Night Entertainment Establishments, 2007–2010
0
20,000
40,000
60,000
80,000
100,000
2007 2008 2009 2010

ECONOMIC IMPACT ASSESSMENTEdmonton’s Late-Night Entertainment Economy
Page 10
Figure 6: Map of Edmonton’s Licenced Establishments & Late-Night Entertainment Establishments
Figure 6 provides a map of all bars, restaurants, and other establishments with liquor licences (red dots), as well as all late-night entertainment establishments (purple diamonds) within Edmonton. As the figure indicates, late-night entertainment establishments are clustered in larger numbers within certain city regions. The downtown core, Oliver, Gateway Boulevard/Calgary Trail, Jasper Avenue, Whyte Avenue, Stony Plain Road, and West Edmonton Mall contain high concentrations of late-night entertainment establishments congregated within close proximity to one another.

ECONOMIC IMPACT ASSESSMENTEdmonton’s Late-Night Entertainment Economy
Page 11
3.1 Expenditure Linkages with Other Industry Sectors
The sales and purchases that connect industries to one another are referred to as linkages. Late-night entertainment establishments must spend money on necessary inputs to ensure their business is viable—for example: renovations, construction, furnishings, food, staff, legal fees, consultant fees, and so forth.
Figure 7 provides a glimpse into the average annual expenditure breakdown of late-night entertainment firms. As is shown, these firms spend money in numerous areas of the economy. Over half of all expenditures attribute to: 1) food and beverages, and 2) salaries and wages. In the case of wages and salaries paid to employees: these become household income, and are spent by earners in ways, including housing, clothing, food, and so on. In addition, significant expenditures are made on marketing, promotion, music and entertainment, administration, and occupancy costs (including repairs and maintenance).
Figure 7: Breakdown of Late-Night Entertainment Sector’s Annual Expenditures
3.2 Employment in the Late-Night Entertainment Economy
The late-night entertainment economy provides diverse opportunities within Edmonton’s labour market. For example, it offers many jobs for students, as well as part-time employment for individuals who do not seek full-time work. In addition to this, the nightlife economy creates a large number of entry-level jobs for young individuals, gaining them access to the workforce.
The survey of late-night entertainment businesses revealed that, on average, only 28% of all employees in this sector are full-time, with 72% maintaining part-time employment. Students also make up the lion’s share of part-time employees, comprising 60% of all part-time positions in the late-night entertainment economy. In addition, 32% of all part-time employees hold a job in addition to their nightlife economy job. This job could either be a secondary job, or a primary job—in which case the part-time nightlife job is the secondary job.
Salaries & Wages24.2%
Food, Beverage, Etc.30.1%
Municipal Costs2.1%
Other4.1%
Utilities1.6%
Direct Operating5.2%
Marketing4.8%
Promotional Costs9.9%
Occupancy Costs (Incl. Repairs & Maintenance)
9.5%
General Administration
5.1%
Charitable Contributions
0.4%
Music & Entertainment
3.2%

ECONOMIC IMPACT ASSESSMENTEdmonton’s Late-Night Entertainment Economy
Page 12
4.0 Methodology
4.1 Estimating Total Annual Expenditures by Patrons of Late-Night Establishments
The method of economic impact assessment employed in this report is entirely demand driven. Hence, in order to calculate the total economic impact of the late-night entertainment industry, an estimate of total expenditures made by all patrons of this industry over the course of one year is needed. The economic impact assessment approach treats end users, or patrons, of the late-night entertainment establishments as the catalysts for economic activity. Without their expenditures in this sector, the sector does not operate.
Because of imperfect information on the exact quantity of money spent by patrons at all of Edmonton’s late-night entertainment establishments, an estimate of this value had to be derived. This was done by calculating the average annual revenue per licenced seat from survey respondents’ food, beverage, tobacco, and coat check service sales. This estimated annual revenue per-licenced-seat was then multiplied by the total number of licenced seats (69,865; Table 2) across all of Edmonton’s late-night entertainment venues.
In this report we treat the revenue of late-night entertainment businesses as equivalent to the expenditures of late-night entertainment patrons. This assumption is not unreasonable, as the two values will be very close in reality. For example, a customer’s expenditures at a late-night venue become that business’s revenue, and the expenditures of all customers over a year become that business’s annual revenue. The estimated total expenditures made by patrons of the late-night entertainment industry over the 2010 year are $467,271,334.
Table 3: Total Annual Customer Expenditures in the Late-Night Entertainment Sector in 2010
Estimated Expenditures per Seat per Year
Total Number of Licenced Seats in Edmonton
Total Estimated Annual Customer Expenditures
$6,688.00 69,865 $467,271,334
It should be noted that the estimate of total annual expenditures in the late-night entertainment sector does not account for entertainment businesses that operate at night, but shut down before midnight. Therefore, the estimate can be interpreted as a lower bound, wherein the actual level of expenditures may be considerably higher when taking into account businesses that close prior to midnight.

ECONOMIC IMPACT ASSESSMENTEdmonton’s Late-Night Entertainment Economy
Page 13
4.2 Impact Analysis
The economic impact analysis is conducted using Statistics Canada’s 2008 input-output (I-O) multipliers for Alberta. These multipliers are tabulated by Statistics Canada through the creation of I-O models. I-O models are essentially mathematical depictions of the economy that account for the complex interrelationships between industry sectors, and between industry sectors and end-consumers.
When one industry sector is shocked in the I-O model, it takes into account how all other industries are affected, and how the total economy is impacted. For example, if a government decided to purchase a fleet of new vehicles with a cost of $1 million, there would be a demand stimulus to the automobile manufacturing industry of $1 million. However, the story does not end there. This demand stimulus would elicit a long chain of expenditures throughout the economy: the automobile manufacturing industry would have to purchase raw inputs such as steel, plastics, and vinyl from other intermediate industries in order to produce the vehicles; steel, plastics, and vinyl manufacturing industries will need to further purchase their own requisite input mix in order to produce their product—for example, plastic and vinyl manufacturers will need to purchase petrochemicals; even further down the chain, petroleum refiners will need to purchase heavy machinery and distillation equipment in order to yield the petrochemicals required by the plastic and vinyl manufacturers. This succession of expenditures continues indefinitely.
The above example illustrates how a 1$ million stimulus to the economy generates a total economic impact that is greater than $1 million. The $1 million expenditure from government represents the direct impact. The subsequent expenditures made by intermediate industries, for example the purchase of raw steel by the automobile manufacturer, constitute the indirect impact. The total economic impact is the sum of direct and indirect impact.
In addition to measuring the output effects on the economy, impact analysis also estimates various income and employment effects: 1) total gross domestic product (GDP); 2) returns to capital; 3) wages and salaries; and 4) the number of full-time-equivalent jobs created. The I-O tables generated by Statistics Canada are lagged by 28 months from the reference year, hence, 2008 is the most recent available data.

ECONOMIC IMPACT ASSESSMENTEdmonton’s Late-Night Entertainment Economy
Page 14
4.3 Regionalizing Multipliers
Statistics Canada’s I-O accounts yield a valuable source of data at both the national and provincial/territorial levels. Unfortunately, these data are not tabulated at the municipal or sub-provincial level. In order to tailor the data for municipal use, multipliers must be scaled either up or down to more accurately reflect the economic relationships of the reference region. The method used for rescaling involves multiplying impact multipliers with employment location quotie
[1]
where
[2]
By regionalizing the impact multipliers, they are more accurately representative of Edmonton, as opposed to the broad economic region of the entire province. Statistics Canada’s Labour Force Survey estimates were used to calculate location quotients. Employment data for the industry sector Accommodation and Food Services were used at both the Edmonton census metropolitan area level and the Alberta level.

ECONOMIC IMPACT ASSESSMENTEdmonton’s Late-Night Entertainment Economy
Page 15
5.0 Economic Impacts
5.1 Total Economic Impacts
The direct economic impact to the late-night entertainment industry in 2010 was $467,271,334 (Table 3). This is the amount of money spent by all patrons across all late-night entertainment establishments over that year. In effect, these are the monies that flowed directly into Edmonton’s late-night entertainment sector over the 2010 year. Moreover, as discussed in section 4.2, these patron expenditures produce an indirect economic effect, giving rise to further expenditures by the late-night entertainment sector. These monies trickle through the entire economy, generating multiple rounds of sales and purchases by numerous industries within the local economy.
The total economic output impacts are the sum of direct and indirect economic impacts. Table 4 outlines the total economic impacts over the 2010 year from the $467,271,334 spending stimulus to the late-night entertainment sector. This total impact of $686,511,073 is the value of output created across all sectors of the local economy in 2010, from a $467,271,334 stimulus to the late-night entertainment sector.
Table 4: Output Impacts
Category Total Economic ImpactsEconomic Output $686,511,073
Table 5 lists the income and employment effects experienced within Edmonton from a $467,271,334 stimulus to the late-night entertainment sector. In 2010, this stimulus created over $310 million in GDP, over $84 million in returns to capital, over $215 million in wages and salaries, and over 5,800 full-time equivalent jobs. The percent of Edmonton total is also listed in Table 5, with the exception of returns to capital.
It should be noted that full-time equivalent jobs do not necessarily imply that all the jobs are full-time. Rather, they can be either full- or part-time. Full-time equivalent jobs is defined as total hours worked, divided by the average annual hours worked in a full-time job.
Table 5: Income and Employment Impacts
Category Total Economic Impact % of Edmonton’s Economy
Gross Domestic Product (GDP) $310,008,796 0.68%
Returns to Capital $84,160,197 N/A
Wages & Salaries $215,222,314 0.77%
No. of Full-Time Equivalent Jobs 5,807 1.46%

ECONOMIC IMPACT ASSESSMENTEdmonton’s Late-Night Entertainment Economy
Page 16
5.2 Impact Comparisons
On their own, these numbers are large, and somewhat difficult to interpret. By comparing and contrasting them with the economic impacts generated by other industry sectors and events, we can form a better understanding of what these numbers mean. A study conducted in 2006 of the four Edmonton Airports—the Edmonton International, Edmonton City Centre, Villeneuve, and Cooking Lake—estimated their total annual economic impact (direct plus indirect effect) to be $1,383 million in output, $570 million in GDP, and 8,613 full-time equivalent jobs. Comparing these figures with the late-night entertainment economy, which in 2010 generated over $686 million in output, over $310 million in GDP, and over 5,800 full-time equivalent jobs, we can see the late-night entertainment economy is almost one-half the size of the Edmonton Airports, on an economic output basis.
Edmonton’s Capital Ex is a large fair held each year in Edmonton, Alberta, that generates $20 million in economic output, $11 million in GDP, and 243 full-time equivalent jobs. The Calgary Stampede is another large festival held each year in Calgary, Alberta, that generates $172 million in economic output, 83 million in GDP, and creating over 1,580 full-time equivalent jobs. On an economic output basis, Edmonton’s late-night entertainment economy is over 34 times as large as Capital Ex, and approximately 4 times as large as the Calgary Stampede.
In terms of attendance figures, numbers often quoted to measure success, the venues that participated in this survey, represent 10550 licensed seats. The reported combined estimated number of people going through their doors is 3,120,000 per year. If we extrapolate this number to the full 69,865 late night seats, estimated annual attendance is calculated to be 20,662,000 patrons.
5.3 Ancillary Impacts
The event of “going out for the night” often involves more than simply attending an entertainment venue, following by a departure for home. It is common to partake in additional activities before or after attending late-night entertainment establishments. For example, shopping for “going-out” attire, spending money on personal care and accessories, dining out, attending shows and theatre, and using taxi services are all common expenditure practices associated with a night out. The impacts that result from these expenditures are referred to as ancillary economic impacts.
These ancillary economic activities are induced by late-night entertainment establishments; without the existence of an attractive late-night entertainment sector, these activities would not occur. Hence, in addition to the direct and indirect economic impacts generated by the late-night entertainment sector, ancillary economic impacts also take place.
Ancillary impacts are not however calculated in this report, as they require the completion of the second survey component. An assessment of these values is forthcoming in a subsequent report.

ECONOMIC IMPACT ASSESSMENTEdmonton’s Late-Night Entertainment Economy
Page 17
5.4 Non-Market Benefits
In addition to direct, indirect, and ancillary economic impacts, there are many benefits to the city of Edmonton for sustaining an attractive late-night entertainment sector. These benefits are not easily captured by traditional economic metrics, and are referred to as non-market benefits.
A large number of people view the appeal of a city by its ability to support a high quality of life. A city with a diverse array of entertainment options can boost the quality of life for many different demographic groups. A thriving nightlife is not the only requirement for a great city, but it does contribute to a city’s overall viability and greatness. By supporting these types of sectors, a city can make it itself more attractive to tourists, migrant labourers, highly-skilled professionals, the creative class, students, and so forth.
A key constraint to the economic development of Edmonton is the extent to which it has a tight labour market. A fast growing economy, coupled with a considerably low unemployment rate, renders the city of Edmonton in a position where population growth and in-migration cannot keep up with the rate of economic growth. As such, employers are often straining to acquire the level of skilled human resources they need to conduct their businesses efficiently. Fostering an attractive late-night entertainment economy can help improve the perceived quality of life in Edmonton, helping to both attract skilled workers and retain graduates from our city’s post-secondary institutions.
A higher level of social offerings from a city, such as a vibrant nightlife economy, can also yield higher degrees of community attachment. Community attachment is the emotional connection residents have for their city. High levels of attachment are associated with civic pride, a positive outlook on the city’s future, happiness with one’s surroundings, and the sense that the city is the perfect place to live. High levels of attachment generate higher levels of local GDP growth, as residents are more inclined to invest in and spend money in their city.
The late-night entertainment sector can also have positive spillover effects into various other niche sectors of the economy, for example: live music, DJs, and other types of performing artists. The nightlife economy supports these types of artists by providing a vehicle for them to perform and earn income.

ECONOMIC IMPACT ASSESSMENTEdmonton’s Late-Night Entertainment Economy
Page 18
6.0 Avenues for Further Study
On completion of the second survey component, which surveys patrons of late-night entertainment establishments, an estimate of ancillary spending can be attained. These ancillary expenditures into various sectors of the economic produce an ancillary economic impact, and a similar economic impact study of these impacts is forthcoming. On completion of this second report, a more complete picture of the aggregate economic impacts resulting from the late-night entertainment sector can be obtained.

ECONOMIC IMPACT ASSESSMENTEdmonton’s Late-Night Entertainment Economy
Page 19
AppendixAppendix 1: Breakdown of NAICS Sector 72 - Accommodation and Food Services
72 Accommodation and food services721 Accommodation services
7211 Traveller accommodation
72111 Hotels (except casino hotels) and motels
721111 Hotels CAN721112 Motor hotels CAN721113 Resorts CAN721114 Motels CAN
72112 Casino hotels
721120 Casino hotels
72119 Other traveller accommodation
721191 Bed and breakfast US721192 Housekeeping cottages and cabins CAN721198 All other traveller accommodation CAN
7212 Recreational vehicle (RV) parks and recreational camps
72121 Recreational vehicle (RV) parks and recreational camps
721211 Recreational vehicle (RV) parks and campgrounds US721212 Hunting and fishing camps CAN721213 Recreational (except hunting and fishing) and vacation camps CAN
7213 Rooming and boarding houses
72131 Rooming and boarding houses
721310 Rooming and boarding houses US
722 Food services and drinking places
7223 Special food services
72231 Food service contractors
722310 Food service contractors
72232 Caterers
722320 Caterers
72233 Mobile food services
722330 Mobile food services
7224 Drinking places (alcoholic beverages)
72241 Drinking places (alcoholic beverages)
722410 Drinking places (alcoholic beverages) US
7225 Full-service restaurants and limited-service eating places
72251 Full-service restaurants and limited-service eating places
722511 Full-service restaurants US722512 Limited-service eating places CAN

ECONOMIC IMPACT ASSESSMENTEdmonton’s Late-Night Entertainment Economy
Page 20
Appendix 2: Impact Category Definitions
Category Definition
Total OutputThe value of both intermediate and final goods and services produced in a given period.
Gross Domestic Product (GDP)The value of all final goods and services produced in a given period.
Returns to CapitalThe return on the capital inputs used as factors of production by firms.
Wages & SalariesThe amount paid out to employees as remuneration for their labour.
No. of Full-Time Equivalent JobsFull-time equivalent jobs is defined as total hours worked, divided by the average annual hours worked in a full-time job.
NOTES
__________________________________________________________________________________________
__________________________________________________________________________________________
__________________________________________________________________________________________
__________________________________________________________________________________________
__________________________________________________________________________________________
__________________________________________________________________________________________
__________________________________________________________________________________________
__________________________________________________________________________________________
__________________________________________________________________________________________
__________________________________________________________________________________________