Lymphoma in rheumatoid arthritis: The effect of methotrexate and anti-tumor necrosis factor therapy...
12
ARTHRITIS & RHEUMATISM Vol. 50, No. 6, June 2004, pp 1740–1751 DOI 10.1002/art.20311 © 2004, American College of Rheumatology Lymphoma in Rheumatoid Arthritis The Effect of Methotrexate and Anti–Tumor Necrosis Factor Therapy in 18,572 Patients Frederick Wolfe 1 and Kaleb Michaud 2 Objective. The risk of lymphoma is increased in patients with rheumatoid arthritis (RA), and spontane- ous reporting suggests that methotrexate (MTX) and anti–tumor necrosis factor (anti-TNF) therapy might be associated independently with an increased risk of lymphoma. However, data from clinical trials and clin- ical practice do not provide sufficient evidence concern- ing these issues because of small sample sizes and selected study populations. The objective of this study was to determine the rate of and standardized incidence ratio (SIR) for lymphoma in patients with RA and in RA patient subsets by treatment group. Additionally, we sought to determine predictors of lymphoma in RA. Methods. We prospectively studied 18,572 pa- tients with RA who were enrolled in the National Data Bank for Rheumatic Diseases (NDB). Patients were surveyed biannually, and potential lymphoma cases received detailed followup. The SEER (Survey, Epide- miology, and End Results) cancer data resource was used to derive the expected number of cases of lym- phoma in a cohort that was comparable in age and sex with the RA cohort. Results. The overall SIR for lymphoma was 1.9 (95% confidence interval [95% CI] 1.3–2.7). The SIR for biologic use was 2.9 (95% CI 1.7–4.9) and for the use of infliximab (with or without etanercept) was 2.6 (95% CI 1.4–4.5). For etanercept, with or without infliximab, the SIR was 3.8 (95% CI 1.9–7.5). The SIR for MTX was 1.7 (95% CI 0.9–3.2), and was 1.0 (95% CI 0.4–2.5) for those not receiving MTX or biologics. Lymphoma was associ- ated with increasing age, male sex, and education. Conclusion. Lymphomas are increased in RA. Although the SIR is greatest for anti-TNF therapies, differences between therapies are slight, and confidence intervals for treatment groups overlap. The increased lymphoma rates observed with anti-TNF therapy may reflect channeling bias, whereby patients with the high- est risk of lymphoma preferentially receive anti-TNF therapy. Current data are insufficient to establish a causal relationship between RA treatments and the development of lymphoma. During the years 1992–1998, the age-adjusted US incidence rate of lymphoma was 18.3 per 100,000 (15.7 per 100,000 for non-Hodgkin’s lymphoma and 2.6 per 100,000 for Hodgkin’s lymphoma) (1). These rates in- crease with age. Between the ages of 60 and 64 years, the modal age group for patients with rheumatoid arthritis (RA), the rate of Hodgkin’s lymphoma is 3.1 per 100,000 for both sexes, 4.2 per 100,000 for males, and 2.1 per 100,000 for females; for patients in the same age group with non-Hodgkin’s lymphoma, the respective rates are 44.2 per 100,000, 51.5 per 100,000, and 37.7 per 100,000. The risk of lymphoma is increased in patients with RA in most studies. Following hospitalization for RA, at a disease duration of 5–15 years the relative risk of Hodgkin’s and non-Hodgkin’s lymphoma was 3.9 and 2.3, respectively among 20,699 patients in a Danish registry (2). In a Swedish registry of 11,683 RA patients who were seen between 1965 and 1983, the standardized incidence ratio (SIR) was 1.98 (95% confidence interval The National Data Bank for Rheumatic Diseases has received grant support from Amgen, Aventis, Bristol-Myers, Centocor, Merck, Novartis, Pharmacia, Pfizer, Squibb, and Wyeth-Australia. The Inflix- imab Safety Registry is supported by grants from Centocor. 1 Frederick Wolfe, MD: National Data Bank for Rheumatic Diseases, and University of Kansas School of Medicine, Wichita; 2 Kaleb Michaud, MS: National Data Bank for Rheumatic Diseases, Wichita, Kansas. Address correspondence and reprint requests to Frederick Wolfe, MD, National Data Bank for Rheumatic Diseases, Arthritis Research Center Foundation, 1035 North Emporia, Suite 230, Wich- ita, KS 67214. E-mail: [email protected]. Submitted for publication March 15, 2003; accepted in revised form February 23, 2004. 1740
-
Upload
independent -
Category
Documents
-
view
3 -
download
0
Transcript of Lymphoma in rheumatoid arthritis: The effect of methotrexate and anti-tumor necrosis factor therapy...

ARTHRITIS & RHEUMATISMVol. 50, No. 6, June 2004, pp 1740–1751DOI 10.1002/art.20311© 2004, American College of Rheumatology
Lymphoma in Rheumatoid Arthritis
The Effect of Methotrexate and Anti–Tumor Necrosis Factor Therapyin 18,572 Patients
Frederick Wolfe1 and Kaleb Michaud2
Objective. The risk of lymphoma is increased inpatients with rheumatoid arthritis (RA), and spontane-ous reporting suggests that methotrexate (MTX) andanti–tumor necrosis factor (anti-TNF) therapy might beassociated independently with an increased risk oflymphoma. However, data from clinical trials and clin-ical practice do not provide sufficient evidence concern-ing these issues because of small sample sizes andselected study populations. The objective of this studywas to determine the rate of and standardized incidenceratio (SIR) for lymphoma in patients with RA and in RApatient subsets by treatment group. Additionally, wesought to determine predictors of lymphoma in RA.
Methods. We prospectively studied 18,572 pa-tients with RA who were enrolled in the National DataBank for Rheumatic Diseases (NDB). Patients weresurveyed biannually, and potential lymphoma casesreceived detailed followup. The SEER (Survey, Epide-miology, and End Results) cancer data resource wasused to derive the expected number of cases of lym-phoma in a cohort that was comparable in age and sexwith the RA cohort.
Results. The overall SIR for lymphoma was 1.9(95% confidence interval [95% CI] 1.3–2.7). The SIR forbiologic use was 2.9 (95% CI 1.7–4.9) and for the use of
infliximab (with or without etanercept) was 2.6 (95% CI1.4–4.5). For etanercept, with or without infliximab, theSIR was 3.8 (95% CI 1.9–7.5). The SIR for MTX was 1.7(95% CI 0.9–3.2), and was 1.0 (95% CI 0.4–2.5) for thosenot receiving MTX or biologics. Lymphoma was associ-ated with increasing age, male sex, and education.
Conclusion. Lymphomas are increased in RA.Although the SIR is greatest for anti-TNF therapies,differences between therapies are slight, and confidenceintervals for treatment groups overlap. The increasedlymphoma rates observed with anti-TNF therapy mayreflect channeling bias, whereby patients with the high-est risk of lymphoma preferentially receive anti-TNFtherapy. Current data are insufficient to establish acausal relationship between RA treatments and thedevelopment of lymphoma.
During the years 1992–1998, the age-adjusted USincidence rate of lymphoma was 18.3 per 100,000 (15.7per 100,000 for non-Hodgkin’s lymphoma and 2.6 per100,000 for Hodgkin’s lymphoma) (1). These rates in-crease with age. Between the ages of 60 and 64 years, themodal age group for patients with rheumatoid arthritis(RA), the rate of Hodgkin’s lymphoma is 3.1 per 100,000for both sexes, 4.2 per 100,000 for males, and 2.1 per100,000 for females; for patients in the same age groupwith non-Hodgkin’s lymphoma, the respective rates are44.2 per 100,000, 51.5 per 100,000, and 37.7 per 100,000.
The risk of lymphoma is increased in patientswith RA in most studies. Following hospitalization forRA, at a disease duration of 5–15 years the relative riskof Hodgkin’s and non-Hodgkin’s lymphoma was 3.9 and2.3, respectively among 20,699 patients in a Danishregistry (2). In a Swedish registry of 11,683 RA patientswho were seen between 1965 and 1983, the standardizedincidence ratio (SIR) was 1.98 (95% confidence interval
The National Data Bank for Rheumatic Diseases has receivedgrant support from Amgen, Aventis, Bristol-Myers, Centocor, Merck,Novartis, Pharmacia, Pfizer, Squibb, and Wyeth-Australia. The Inflix-imab Safety Registry is supported by grants from Centocor.
1Frederick Wolfe, MD: National Data Bank for RheumaticDiseases, and University of Kansas School of Medicine, Wichita;2Kaleb Michaud, MS: National Data Bank for Rheumatic Diseases,Wichita, Kansas.
Address correspondence and reprint requests to FrederickWolfe, MD, National Data Bank for Rheumatic Diseases, ArthritisResearch Center Foundation, 1035 North Emporia, Suite 230, Wich-ita, KS 67214. E-mail: [email protected].
Submitted for publication March 15, 2003; accepted in revisedform February 23, 2004.
1740

[95% CI] 1.5–2.6) (3). The risk ratios (determined bydividing the observed number by the expected number)for lymphoma incidence and mortality in other largestudies included a ratio of 2.7 for incidence reported byIsomaki et al (4), a ratio of 1.9 for mortality reportedby Allebeck (5), a ratio of 1.2 for incidence reported byKatusic et al (6), a ratio of 20.0 for incidence reportedby Prior et al (7), a ratio of 3.5 for mortality reported byLaasko et al (8), ratios of 4.1 and 2.2 for rheumatolo-gists’ patients and all patients, respectively, reported byTennis et al (9,10), and a ratio of 2.0 for mortalityreported by Wolfe et al (11).
Increased rates of lymphoma have been attrib-uted to RA severity, based on detailed epidemiologicstudies (12,13) and Epstein-Barr virus studies (14,15),although there is some disagreement on this point (16).However, there has also been a general concern thatmedications, by altering immune function and immuno-logic surveillance, might lead to lymphoproliferativecancer. This concern has been applied to medicationsused in RA, including azathioprine (17–21) and metho-trexate (MTX) (22–44). In addition, discontinuation ofMTX has been followed by disappearance of lymphomain some patients (reversible lymphoma) (23,25,45,46),thus providing a temporal link between MTX and lym-phoma. Nonetheless, some studies have not found in-creased rates of lymphoma in MTX-treated patientswith RA (32,47). There is evidence for a slight increasein lymphoma rates among RA patients receiving aza-thioprine (18,48), but no epidemiologic studies havefound an increase in lymphoma in MTX-treated patientsbeyond what is expected in RA (32). Studies of cyclo-sporine have also found no increased risk (49). Theresult of these studies has been to suggest that RA andRA disease activity predispose to lymphoma, but thattreatment may also play a role. Little consideration hasbeen given to the idea that effective treatment, byreducing disease activity, might also lower lymphomarates.
Recent concern about possible treatment effectsand lymphoma has focused on anti-TNF drugs (50–53)because of their profound immunoregulatory effect.Reports from MedWatch (the postmarket adverse eventsurveillance system run by the US Food and DrugAdministration [FDA]) concerning infliximab and etan-ercept led the FDA to estimate that the crude incidencerates of lymphoma are 19 per 100,000 patients treatedwith etanercept and 6.6 per 100,000 patients treated withinfliximab (54). Given the average age of patients withRA, these rates are lower than what might be expectedin the general population. However, the MedWatch
system lacks an adequate denominator, and no associa-tion could be drawn between lymphoma and anti-TNFtherapy. In addition, given the absence of age data, it isnot known whether such rates are high or low. Ofinterest, however, is the FDA report that in a number ofcases lymphoma developed shortly after the patientstarted therapy, and that regression of lymphoma oc-curred in 2 patients following discontinuation of therapy.Recently, adalimumab, another anti-TNF agent, wasapproved for use in RA (55), and the rates of lymphomaassociated with use of this agent were increased com-pared with the rates in the general population (56).
Among the issues that remain unresolved iswhether the rate of lymphoma is increased by MTX,whether it is increased among patients receiving anti-TNF agents, and whether such increases are related tothe anti-TNF agents, the worse clinical status of patientsreceiving anti-TNF therapy, or a combination of both. Inaddition, a contrary hypothesis—that lymphoma ratesmight be lower in treated patients—has not been inves-tigated.
PATIENTS AND METHODS
Patients in the study were participants in the NationalData Bank for Rheumatic Diseases (NDB) long-term study ofthe outcomes of RA. Patients were recruited from the prac-tices of 908 US rheumatologists, as previously described (57–59), and are systematically followed up by NDB staff, usingsemiannual questionnaires. The diagnosis of RA was made bythe patient’s rheumatologist. Of the 18,572 patients in thisreport, 3,244 were enrolled at the time they started receivingleflunomide, and 5,025 were enrolled as part of an infliximabsafety registry. After the initial enrollment assessment, �8% ofpatients decline to participate each year. The NDB is an opencohort, and patients are added continuously. The current studyconcerns 18,572 RA patients without previous lymphoma whocompleted 70,732 biannual questionnaires during consecutive6-month assessment periods beginning in January 1999 andending in June 2002.
For each questionnaire assessment, patients reportdemographic and clinical variables (60–70), comorbid condi-tions, medications, and side effects of treatment. Patients alsoreport their cancer status. The identification and validationprocess for lymphoma is shown in Figure 1. At the time ofenrollment into the NDB, patients report current (last 6months) or past malignancies. They also report current malig-nancies in each biannual questionnaire they complete. If aquestionnaire is missed, patients are required to complete thepast or “ever” questionnaire again.
For patients reporting a lymphoma or a descriptionsuggestive of lymphoma, a validation process is begun (Figure1). In general, the first contact with the patient is made by atelephone call from a trained interviewer using a writtenquestionnaire. Simple misunderstandings may be identified atthis point. For example, patients may confuse lipoma with
LYMPHOMA IN RA 1741
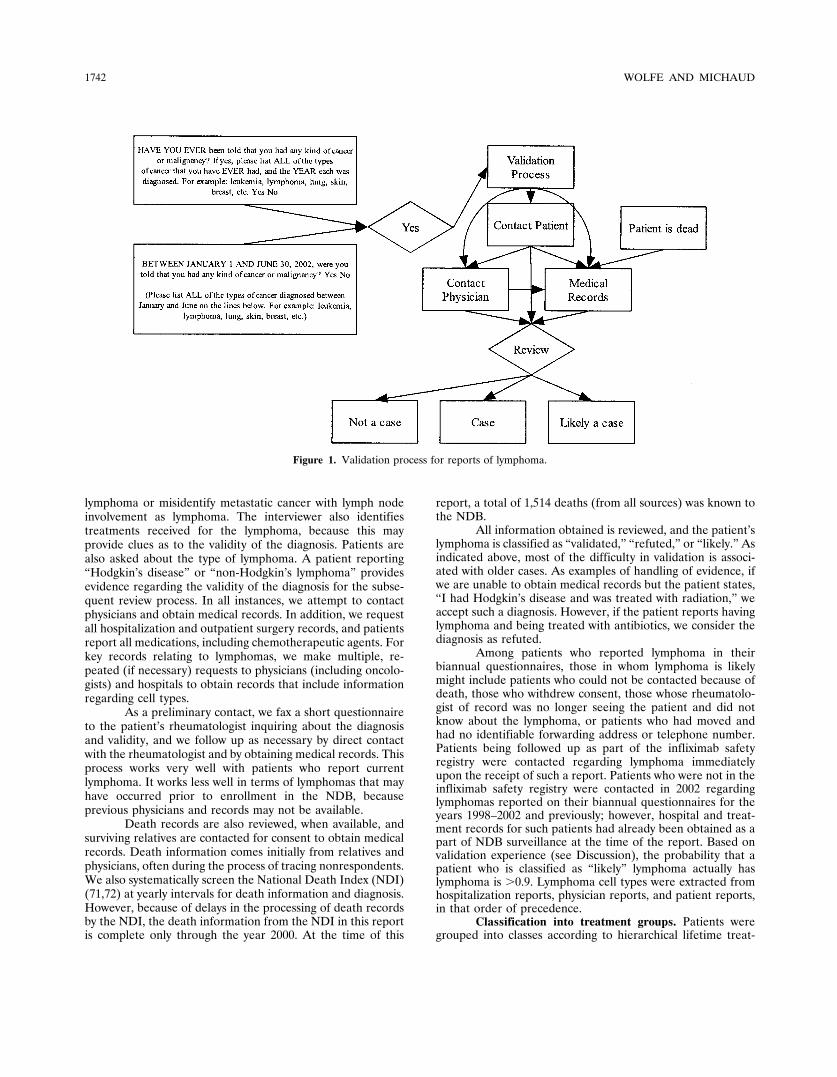
lymphoma or misidentify metastatic cancer with lymph nodeinvolvement as lymphoma. The interviewer also identifiestreatments received for the lymphoma, because this mayprovide clues as to the validity of the diagnosis. Patients arealso asked about the type of lymphoma. A patient reporting“Hodgkin’s disease” or “non-Hodgkin’s lymphoma” providesevidence regarding the validity of the diagnosis for the subse-quent review process. In all instances, we attempt to contactphysicians and obtain medical records. In addition, we requestall hospitalization and outpatient surgery records, and patientsreport all medications, including chemotherapeutic agents. Forkey records relating to lymphomas, we make multiple, re-peated (if necessary) requests to physicians (including oncolo-gists) and hospitals to obtain records that include informationregarding cell types.
As a preliminary contact, we fax a short questionnaireto the patient’s rheumatologist inquiring about the diagnosisand validity, and we follow up as necessary by direct contactwith the rheumatologist and by obtaining medical records. Thisprocess works very well with patients who report currentlymphoma. It works less well in terms of lymphomas that mayhave occurred prior to enrollment in the NDB, becauseprevious physicians and records may not be available.
Death records are also reviewed, when available, andsurviving relatives are contacted for consent to obtain medicalrecords. Death information comes initially from relatives andphysicians, often during the process of tracing nonrespondents.We also systematically screen the National Death Index (NDI)(71,72) at yearly intervals for death information and diagnosis.However, because of delays in the processing of death recordsby the NDI, the death information from the NDI in this reportis complete only through the year 2000. At the time of this
report, a total of 1,514 deaths (from all sources) was known tothe NDB.
All information obtained is reviewed, and the patient’slymphoma is classified as “validated,” “refuted,” or “likely.” Asindicated above, most of the difficulty in validation is associ-ated with older cases. As examples of handling of evidence, ifwe are unable to obtain medical records but the patient states,“I had Hodgkin’s disease and was treated with radiation,” weaccept such a diagnosis. However, if the patient reports havinglymphoma and being treated with antibiotics, we consider thediagnosis as refuted.
Among patients who reported lymphoma in theirbiannual questionnaires, those in whom lymphoma is likelymight include patients who could not be contacted because ofdeath, those who withdrew consent, those whose rheumatolo-gist of record was no longer seeing the patient and did notknow about the lymphoma, or patients who had moved andhad no identifiable forwarding address or telephone number.Patients being followed up as part of the infliximab safetyregistry were contacted regarding lymphoma immediatelyupon the receipt of such a report. Patients who were not in theinfliximab safety registry were contacted in 2002 regardinglymphomas reported on their biannual questionnaires for theyears 1998–2002 and previously; however, hospital and treat-ment records for such patients had already been obtained as apart of NDB surveillance at the time of the report. Based onvalidation experience (see Discussion), the probability that apatient who is classified as “likely” lymphoma actually haslymphoma is �0.9. Lymphoma cell types were extracted fromhospitalization reports, physician reports, and patient reports,in that order of precedence.
Classification into treatment groups. Patients weregrouped into classes according to hierarchical lifetime treat-
Figure 1. Validation process for reports of lymphoma.
1742 WOLFE AND MICHAUD

ment exposure status. Patients who ever received infliximab oretanercept were placed in separate groups. Membership inthese groups was independent of any other treatment, suchthat current or past use of MTX did not affect membership inthe 2 anti-TNF treatment groups. Patients who had everreceived MTX but not infliximab or etanercept were placed inthe MTX-only group. Patients who did not receive infliximab,etanercept, or MTX were placed in the no MTX/no biologicsgroup. Patients who received anakinra but were not in any ofthe other groups were placed in the anakinra group. Anakinrawas received by 233 of the 18,572 patients, but only 58 of thesepatients were not in any of the other groups. In the analysesdescribed in Table 4, we identified persons in the no MTX/nobiologics group who received leflunomide, but not MTX,etanercept, infliximab, or anakinra, and analyzed them sepa-rately. Treatments received by patients in the no MTX/nobiologics group at a rate of �1% were prednisone (24%),hydroxychloroquine (26%), injectable gold (4%), auranofin(1%), and leflunomide (17%). In 59 persons, lymphomadeveloped before entry into the NDB. These patients wereexcluded from analysis and are not further considered.
Definition of observation time and exposure time. Theobservation and analysis time begins at the time the patientwas first exposed to treatment while participating in the NDB.For example, if a patient enters the NDB at year 0 and startsMTX at year 1, the observation time begins at year 1. However,if a patient begins a treatment, as defined in the classificationmethod described above, at or before enrolling in the NDB,the observation time begins at the time of enrollment in theNDB (year 0). The observation time ends at the last observa-tion in the data bank. The median duration of followup for allstudy patients was 1.25 years (range 0.1–4.5 years) and was asfollows for the major treatment groups: for MTX, 1.5 years(range 0.1–4.0 years); for etanercept, 1.3 years (range 0.1–4.0years); for infliximab, 1.0 years (range 0.1–3.5 years); and forleflunomide, 1.4 years (range 0.1–4.5 years). For patients whoreceived MTX prior to their enrollment in the NDB and whowere not receiving MTX at the time of enrollment, 2 methodsof treatment classification and observation time were used inthe analyses shown in Table 1. The first method is as describedabove. The second method places all such patients in the no
MTX/no biologics group and begins the observation time atthe time of enrollment in the NDB. This second method, the“switched” method, is preferred, because it protects againstpatients who may have discontinued MTX many years in thepast being counted in the MTX group. The consequences ofusing different methods for classifying observation times willbe described in the Discussion section.
Statistical analysis. The expected number of lym-phoma cases and the SIRs were calculated based on age- andsex-matched data from the National Cancer Institute SEER(Surveillance, Epidemiology, and End Results) resource (1).The SIR analyses were used to determine the risk of lymphomaassociated with RA and with the various treatments com-pared with the risk in the US population. Incidence ratesrepresent the number of lymphomas divided by person-yearsof exposure and are expressed in 100,000 patient-years ofexposure. Differences between patients with and without lym-phoma were assessed by t-tests and logistic regression, on arandom observation for each patient. For confirmation, assess-ments were also performed using Cox regression. Analyseswere performed with Stata statistical software, version 8.0 (73).The 5% significance level was used. All tests were 2-tailed.
RESULTS
Table 1 shows the age, sex, mortality, validationstatus, and lymphoma type for the patients with lym-phoma, according to observation period and treatmentgroup. Overall, we identified 88 lymphomas, 59 of whichoccurred prior to NDB enrollment and 29 of whichoccurred after NDB enrollment and during the period ofintensive followup. In Table 1, patients are counted asbeing in the infliximab or etanercept group regardless ofwhether they received MTX (or anakinra) therapy, butpatients in the MTX group did not receive infliximab oretanercept therapy during the study followup. Patientswho received both infliximab and etanercept (n � 3) arecounted in both groups. Only 233 patients received
Table 1. Demographic and lymphoma status of patients in whom lymphoma developed during NDB participation*
Variable
Treatment category
All Infliximab† Etanercept‡ MTX/no biologic No MTX/no biologic
No. of lymphomas 29 9 8 10 5Age, mean � SD years 68.4 � 10.5 69.8 � 6.4 64.2 � 7.3 72.2 � 9.5 62.8 � 17.9% male 51.7 33.3 62.5 60.0 40.0% deceased 17.2 0.0 12.5 20.0 20.0No. (%) fully validated lymphomas§ 82.8 (24) 100.0 (9) 87.5 (7) 70.0 (7) 80.0 (4)Lymphoma type
Non-Hodgkin’s 22 9 7 6 3Hodgkin’s 1 0 1 0 0Unknown 6 0 0 4 2
* Except where indicated otherwise, values are the mean. NDB � National Data Bank. MTX � methotrexate.† Includes 3 patients who also received etanercept.‡ Includes 3 patients who also received infliximab.§ See Patients and Methods for validation details.
LYMPHOMA IN RA 1743

anakinra (an interleukin-1 receptor antagonist), and nolymphomas occurred in this group.
Of the 29 patients in whom lymphomas devel-oped after NDB enrollment, 17% were known to bedead. Death rates among patients who received MTXwithout biologics (20%), etanercept (13%), infliximab(0%), or none of these therapies (20%) reflected pri-marily the shorter duration in the data bank of patientsreceiving the newer, anti-TNF therapies. Among pa-tients in whom lymphoma developed after NDB enroll-ment, 22 cases of non-Hodgkin’s lymphoma and 1 caseof Hodgkin’s lymphoma were identified. Data on lym-phoma type were not available in 6 cases. Table 2 showsthe reported cell types. A wide variety of cells types wasreported.
Table 3 shows a comparison of the characteristicsof patients in whom lymphoma developed after enroll-
ment with those of patients in whom lymphoma did notdevelop. Patients who reported lymphoma prior to en-rollment were excluded from these analyses. Patientswith lymphoma were significantly older (67.3 years ver-sus 60.3 years), had more comorbidities (3.1 versus 2.1),were more likely to be male (51.7% versus 23.3%), hadmore education (14.2 years versus 13.2 years), and weremore likely to be non-Hispanic whites (100.0% versus89.4%; P � 0.066). Age, sex, disease duration, andeducation were entered into a multivariate logistic re-gression. The odds ratio (OR) for a 10-year increase inage was 1.7 (95% CI 1.2–2.4). Men were 2.6-fold morelikely to have lymphoma than were women (OR 2.6,95% CI 1.2–5.5), and each year of education was asso-ciated with an increase in risk (OR 1.2, 95% CI 1.0–1.4).The duration of RA remained nonsignificant (P �0.876) in the multivariate analysis. These analyses wererepeated using Cox regression, with similar results. TheCox regression hazard ratios and 95% CIs for thesevariables were as follows: for age, 1.58 per 10-yearincrease (95% CI 1.16–2.18); for male sex, 3.70 (95% CI1.79–7.68); for education level, 1.16 (95% CI 0.99–1.37);and for comorbidity, 1.30 (95% CI 1.10–1.54).
Table 4 shows the SIRs and lymphoma rates forpatients in the various treatment groups. Because ofoverlapping therapy for anti-TNF drugs, 3 methods wereused to describe these treatments. In the first method,patients who received infliximab or etanercept or bothtreatments were analyzed separately. In the secondmethod, patients who received infliximab regardless ofwhether they received etanercept were analyzed, andpatients who received etanercept regardless of whetherthey received infliximab were similarly analyzed. In thethird method, all patients who received anti-TNF ther-apy were studied as a single group.
As shown in Table 4, the overall SIR for lym-phoma, regardless of treatment, was 1.9 (95% CI 1.3–2.7). The SIR for lymphoma in patients receiving bio-logics was 2.9 (95% CI 1.7–4.9) and the SIR in thosereceiving infliximab, with or without etanercept, was 2.6(95% CI 1.4–5.0). For patients receiving etanercept,with or without infliximab, the SIR for lymphoma was3.8 (95% CI 1.9–7.5). For patients who received lefluno-mide only, the SIR was 0 (no cases of lymphoma). Inaddition, the overall SIR for lymphoma in the 6,498patients who had received leflunomide at any time andin any combination was 1.0 (95% CI 0.4–2.6). Theanalysis was also performed after restricting the sampleto patients who were not receiving infliximab or etaner-cept prior to entry into the data bank. Among 3,024“new starts” on infliximab, the SIR for lymphoma in
Table 2. Cell types in patients with lymphoma*
Treatmentgroup/patient
Lymphomatype Cell type
1 Non-Hodgkin’s Marginal zone MALT type2 Non-Hodgkin’s Sclerosing lymphoma, mixed
small/large cell3 Non-Hodgkin’s Large cell4 Non-Hodgkin’s T cell with pancytopenia5 Hodgkin’s Hodgkin’s
Etanercept/infliximab
6 Non-Hodgkin’s “Lymphocytic lymphoma”7 Non-Hodgkin’s “Low grade lymphoma”8 Non-Hodgkin’s Mixed cell
Infliximab9 Non-Hodgkin’s Large cell
10 Non-Hodgkin’s Large B cell with underlyingsmall cell
11 Non-Hodgkin’s Unknown12 Non-Hodgkin’s B cell, small cell13 Non-Hodgkin’s Diffuse, large B cell14 Non-Hodgkin’s Unknown
Methotrexate15 Non-Hodgkin’s Immunoblastic16 Non-Hodgkin’s Diffuse large cell, B cell17 Non-Hodgkin’s Large cell T cell18 Non-Hodgkin’s “Malignant lymphoma”19 Non-Hodgkin’s Large cell20 Non-Hodgkin’s Unknown21 Unknown Unknown22 Unknown Unknown23 Unknown Unknown24 Unknown Unknown
No treatment25 Non-Hodgkin’s Diffuse, large cell26 Non-Hodgkin’s Large cell lymphoma27 Non-Hodgkin’s Large cell28 Unknown Unknown29 Unknown Unknown
* MALT � mucosa-associated lymphoid tissue.
1744 WOLFE AND MICHAUD

those receiving infliximab only was 1.0 (95% CI 0.46–7.4). For new starts on etanercept only, the SIR was 0.95(95% CI 0.5–8.3).
The results for the MTX and no MTX/no bio-logics groups differed according to whether patients whowere classified in the MTX group but never receivedMTX during their followup in the NDB were “switched”to the no MTX/no biologics group. Without switching,the SIR in those receiving MTX was 1.5 (95% CI0.8–2.7); with switching the rate was 1.7 (95% CI0.9–3.2). Switching had a reciprocal effect on the no
MTX/no biologics group. Without MTX switching, theSIR in the no MTX/no biologics group was 1.3 (95% CI0.5–3.1), and with switching it was 1.0 (95% CI 0.4–2.5).
Overall, the lymphoma incidence rate per100,000 patient-years was 99 (95% CI 69–142). For thevarious durations of RA, the rates were as follows: for0–5 years, 171 (95% CI 82–360), for 5–10 years, 70 (95%CI 29–168), for 10–15 years, 20 (95% CI 3–145), and for�15 years, 121 (95% CI 74–198).
To further explain the potential differences intreatment groups, the characteristics of patients in the
Table 4. SIR and incidence rate for lymphoma in RA patients according to exposure group*
Treatment group
No. of lymphomas
SIR 95% CINo. of patients
at riskTimeat risk
IncidencerateActual Expected
All patients/treatments 29 15.5 1.9 1.3–2.7 18,572 29,314 98.9All biologics 14 4.9 2.9 1.7–4.9 8,614 10,012 139.8Infliximab or infliximab � etanercept 9 3.4 2.6 1.4–4.5 6,465 6,538 137.7Etanercept or etanercept � infliximab 8 2.1 3.8 1.9–7.5 3,381 5,099 156.9Infliximab 6 2.7 2.2 1.0–4.9 5,233 4,913 122.1Etanercept 5 1.4 3.5 1.5–8.4 2,149 3,474 143.9Infliximab � etanercept 3 0.7 4.3 1.4–13.2 1,232 1,624 184.7Anakinra 0 0.2 0.0 – 58 33 0Leflunomide only 0 0.5 0 – 758 1,024 0.0Leflunomide only (switched) 0 0.9 0 – 1,184 1,850 0.0No MTX/no biologics 5 3.9 1.3 0.5–3.1 3,504 7,122 70.2No MTX/no biologics (switched) 5 4.8 1.0 0.4–2.5 4,399 8,938 55.9MTX only 10 6.8 1.5 0.8–2.7 6,396 12,147 82.3MTX only (switched) 10 5.8 1.7 0.9–3.2 5,501 10,331 96.8
* Time at risk is expressed in years. Incidence rates are expressed per 100,000 patient-years of exposure. For leflunomide, switched means patientsin the leflunomide-only group who did not receive leflunomide during National Data Bank (NDB) followup were counted as being in the nomethotrexate (MTX)/no biologics group. For MTX, switched means patients in the MTX-only group who did not receive MTX during NDBfollowup were counted as being in the no MTX/no biologics group. SIR � standardized incidence ratio (adjusted for age and sex); RA � rheumatoidarthritis; 95% CI � 95% confidence interval.
Table 3. Characteristics of patients with or without lymphoma during NDB participation*
CharacteristicNo lymphoma(n � 18,543)
Lymphoma(n � 29) P
Age, years 60.3 � 13.4 67.3 � 10.6 0.005Male, % 23.3 51.7 0.001Disease duration, years 13.6 � 10.8 15.1 � 10.9 0.489Education, years 13.2 � 2.4 14.2 � 2.1 0.027Non-Hispanic white, % 89.4 100.0 0.066Ever smoker, % 53 59 0.875Total income, US dollars 44,074 � 28,605 48,400 � 35,757 0.451Lifetime comorbidity score (0–11 scale) 2.12 � 1.6 3.1 � 1.8 0.002HAQ (0–3 scale) 1.11 � 0.7 1.03 � 0.7 0.576Methotrexate use ever, % 77 79 0.803Biologic agent use ever, % 47 48 0.869Infliximab use ever, % 35 31 0.665Etanercept use ever, % 19 28 0.217Leflunomide use ever, % 14 36 0.014
* Except where indicated otherwise, values are the mean � SD. Patients with lymphomas prior to NationalData Bank (NDB) enrollment are excluded. Comparisons are between the first visit at which lymphomawas reported and a randomly selected visit for patients without lymphoma. See text for results of Coxregression analyses. HAQ � Health Assessment Questionnaire.
LYMPHOMA IN RA 1745

groups are presented in Table 5. In general, those in theanti-TNF groups had slightly more severe disease, asshown by increased scores for the Health AssessmentQuestionnaire (HAQ) (60), pain, and global severity,and decreased scores for quality of life. Income andeducation levels were higher in etanercept-treated pa-tients, and patient age was lower in this group than inother groups. There were no important differencesbetween groups for age (except for etanercept), sex, ordisease duration.
To further explore potential disease severity dif-ferences between groups, we compared baseline andfollowup measures of severity (Table 6). Clinic valuesrefer to data obtained in a patient’s rheumatologist’soffice at the time the patient completed a short ques-tionnaire and enrolled in the data bank. Survey valuesare those data obtained in the NDB questionnaires thatwere mailed to patients. Survey values are obtained anaverage of 3.5 months after enrollment. For patients justbeginning infliximab therapy (new starts; n � 1,644), thedifference between survey and clinic values can beconsidered to represent the effect of treatment. Asshown in Table 6, patients in the infliximab “new start”group had much worse clinical status than did the 3,140patients enrolling from the practices of US rheumatolo-gists who were not part of treatment registries. Inaddition, all infliximab-treated patients (a group thatincluded both new starts and those continuing to receiveinfliximab at the time of the rheumatologist’s evalua-tion) had more abnormal scores generally. In addition,patients in the infliximab new start group had an im-provement in the HAQ score of 0.22 units, while theHAQ score did not improve in non–registry-enrolledpatients.
To investigate the possibility that use of anti-TNF
agents was associated with an immediate risk of lym-phoma, we plotted the time from the start of therapy tothe time of lymphoma development (Figure 1). No earlypattern of lymphoma was detected.
Table 5. Characteristics of patients with rheumatoid arthritis, by exposure group*
VariableInfliximab
(n � 6,433)Etanercept(n � 2,729)
MTX(n � 5,593)
No MTX/no biologics†(n � 4,474)
Age, years 60.7 � 13.4 56.4 � 12.4 61.2 � 13.0 60.4 � 14.1% male 22.7 20.7 24.3 24.3Disease duration, years 13.7 � 10.7 14.1 � 10.2 13.5 � 10.6 13.5 � 11.3Education, years 13.1 � 2.5 13.6 � 2.2 13.2 � 2.3 13.3 � 2.5Total income, US dollars 43,057 � 27,889 49,694 � 28,792 41,375 � 26,446 44,094 � 28,439Lifetime comorbidities (0–11 scale) 2.2 � 1.5 2.6 � 1.8 2.4 � 1.8 2.5 � 1.9HAQ (0–3 scale) 1.2 � 0.7 1.2 � 0.7 1.1 � 0.7 1.0 � 0.7Pain (0–10 scale) 4.2 � 2.4 4.3 � 2.4 3.7 � 2.3 3.9 � 2.6Global severity (0–10 scale) 3.9 � 2.2 3.8 � 2.1 3.4 � 2.1 3.5 � 2.4VAS QOL scale (0–100 scale) 65.8 � 17.5 64.3 � 17.7 66.7 � 17.5 65.9 � 19.5
* Except where indicated otherwise, values are the mean � SD. Values represent statistics based on the mean for each patient. MTX �methotrexate; HAQ � Health Assessment Questionnaire; VAS � visual analog scale; QoL � quality of life.† No exposure to infliximab, etanercept, or MTX while enrolled in the National Data Bank.
Table 6. Differences in severity measures between the last clinic visitbefore NBD enrollment and the last completed NBD survey*
Patient group/variable Mean � SD P
Non–registry-enrolled patient (n � 3,140)Clinic HAQ score 1.09 � 0.72 0.763Survey HAQ score 1.09 � 0.75Clinic pain score 4.33 � 2.62 �0.000Survey pain score 3.78 � 2.74Clinic patient global score 4.03 � 2.54 �0.000Survey patient global score 3.48 � 2.52
All infliximab-treated patients (n � 2,792)Clinic HAQ score 1.32 � 0.67 �0.001Survey HAQ score 1.19 � 0.72Clinic pain score 4.66 � 2.71 �0.001Survey pain score 4.06 � 2.72Clinic patient global score 4.02 � 2.51 �0.001Survey patient global score 3.74 � 2.41
Infliximab new-start patients (n � 1,644)Clinic HAQ score 1.41 � 0.64 �0.001Survey HAQ score 1.19 � 0.71Clinic pain score 5.24 � 2.54 �0.001Survey pain score 4.15 � 2.73Clinic patient global score 4.55 � 2.41 �0.001Survey patient global score 3.81 � 2.41
* Clinic values are those obtained in the patient’s rheumatologist’soffice at the time the patient completed a short questionnaire andenrolled in the data bank. Survey values are those obtained in theNational Data Bank (NDB) questionnaires that were mailed topatients. Survey values were obtained an average of 3.5 months afterenrollment. For patients just starting infliximab therapy (new start),the difference between survey and clinic values can be considered torepresent the effect of treatment. Health Assessment Questionnaire(HAQ) scores were based on a 0–3 point scale; all other scores werebased on a 0–10-point scale.
1746 WOLFE AND MICHAUD
DISCUSSION
The results of this study show that lymphoma isincreased in RA compared with the general population.Previous studies have shown the lymphoma risk in RA(as measured by ORs and risk ratios) to be 1.98 (3), 2.7(4), 1.9 (5), 1.2 (6), 20.0 (7), 3.5 (8), 4.1 (9), 2.2 (10), and2.0 (11). The highest rates of lymphoma have beenfound in older studies, and one study did not find anincreased risk (47). In general, in the 5 largest studiesthe risk ratio for lymphoma is �2.0. These data areconsistent with the results of the current study in 18,572RA patients in the NDB, in which the overall SIR forlymphoma was 1.9 (95% CI 1.3–2.7).
We also found that the SIR for lymphoma was 2.9(95% CI 1.7–4.9) in patients receiving biologics, 2.6(95% CI 1.4–5.0) in those receiving infliximab, with orwithout etanercept, and 3.8 (95% CI 1.9–7.5) in patientstreated with etanercept, with or without infliximab.Using the “switching method” for MTX, the SIR was 1.7(95% CI 0.9–3.2), and for patients receiving none ofthese therapies the SIR was 1.0 (95% CI 0.4–2.5).
Although lymphoma following MTX treatmenthas been a concern because of a possible causal rela-tionship (22–43), the study results do not show anincreased SIR in patients receiving MTX compared withthose who were never exposed to MTX. These resultsare consistent with those in a study by Mariette et al(32), who found no increase in lymphoma in MTX-treated patients compared with a population of Frenchnationals. However, they also found no increase in therate of lymphoma in RA, and the incidence rate (�30per 100,000) was based on estimates of use of MTX inthe population.
Despite the differences among treatment groupsdescribed above, even a sample of �18,500 patientscould not demonstrate significant differences among thestudied groups, because of the rarity of lymphoma. Inthe current study, lymphoma developed in only 29 of the18,572 patients, for an incidence rate of 98.9 per 100,000patient-years. By observing the upper 95% confidenceintervals, however, a “worse-case” can be obtained,suggesting that the risk ratio for lymphoma does notexceed 3.1 for patients receiving no MTX and nobiologics, 3.2 for those receiving MTX, and 5.0 for thosebeing treated with biologics.
There is substantial evidence in support of theassociation of lymphoma and anti-TNF therapy. Inclinical trials, the SIR for lymphoma in patients receiv-ing etanercept is 2.3 (95% CI 0.9–5.0) or 3.5 (95% CI1.6–6.6) if a larger number of cases is used (56). In
infliximab-treated patients, the RA SIR is 6.4 (95% CI1.7–16.3), and among adalimumab-treated patients theSIR is 5.4 (95% CI 2.6–10.0) (56). However, do theseincreased rates reflect adverse events related to treat-ment, RA itself, or a combination of both? It is wellknown that patients in anti-TNF clinical trials representthe most severe 15–20% of RA patients (74), and thatsuch patients are at the greatest risk for lymphomadevelopment (12,13). This suggests that disease activitymight play a very important role.
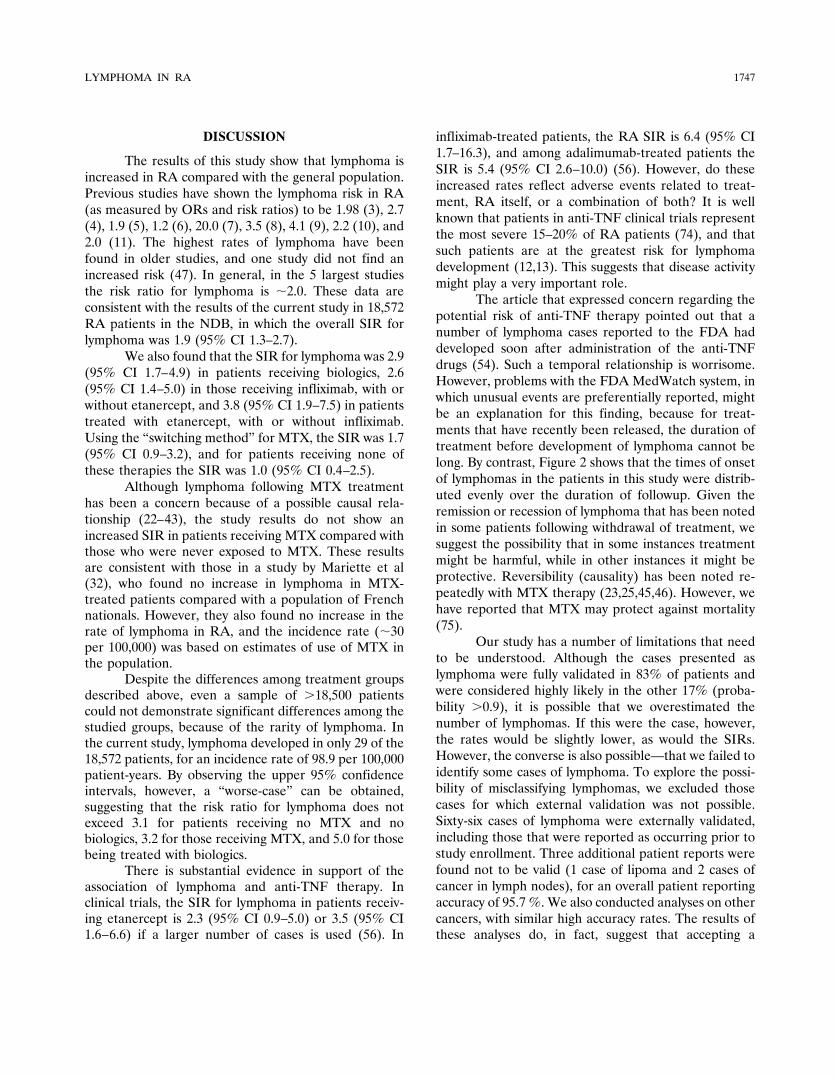
The article that expressed concern regarding thepotential risk of anti-TNF therapy pointed out that anumber of lymphoma cases reported to the FDA haddeveloped soon after administration of the anti-TNFdrugs (54). Such a temporal relationship is worrisome.However, problems with the FDA MedWatch system, inwhich unusual events are preferentially reported, mightbe an explanation for this finding, because for treat-ments that have recently been released, the duration oftreatment before development of lymphoma cannot belong. By contrast, Figure 2 shows that the times of onsetof lymphomas in the patients in this study were distrib-uted evenly over the duration of followup. Given theremission or recession of lymphoma that has been notedin some patients following withdrawal of treatment, wesuggest the possibility that in some instances treatmentmight be harmful, while in other instances it might beprotective. Reversibility (causality) has been noted re-peatedly with MTX therapy (23,25,45,46). However, wehave reported that MTX may protect against mortality(75).
Our study has a number of limitations that needto be understood. Although the cases presented aslymphoma were fully validated in 83% of patients andwere considered highly likely in the other 17% (proba-bility �0.9), it is possible that we overestimated thenumber of lymphomas. If this were the case, however,the rates would be slightly lower, as would the SIRs.However, the converse is also possible—that we failed toidentify some cases of lymphoma. To explore the possi-bility of misclassifying lymphomas, we excluded thosecases for which external validation was not possible.Sixty-six cases of lymphoma were externally validated,including those that were reported as occurring prior tostudy enrollment. Three additional patient reports werefound not to be valid (1 case of lipoma and 2 cases ofcancer in lymph nodes), for an overall patient reportingaccuracy of 95.7 %. We also conducted analyses on othercancers, with similar high accuracy rates. The results ofthese analyses do, in fact, suggest that accepting a
LYMPHOMA IN RA 1747
patient’s report of lymphoma when external validation isnot possible is an acceptable method.
It is possible that death records that are not yetavailable will show additional lymphoma cases. It is alsopossible that patients in whom lymphoma developsmight drop out of the study and not report theirlymphoma. If such were the case, we would underesti-mate the actual SIR. To understand whether such eventsoccurred in the current study, we analyzed available datato determine whether we learned of any lymphomas onlyby death records. Although the absence of cases is weaksupporting evidence of case ascertainment, we found nosuch cases. Although such misclassification might alterthe SIR, there is no evidence that differential misclassi-fication could have occurred. Therefore, we can beconfident as to the relative relationships in SIR amongthe treatment groups.
Incidence rates and SIRs can be affected by themethod we chose to calculate observation time (expo-sure). We assumed that once exposure to treatmentoccurred, the observation time should continue to theend of followup. This assumption is reasonable because,assuming there is a risk associated with anti-TNF ther-apy, 1) we do not know how long after exposure the riskcontinues, 2) lymphoma that might be caused by drugtreatment might develop after the drug is discontinued,and 3) actual exposure time is a large fraction of
observation time for the anti-TNF agents, given theirrecent introduction.
In addition, there is no really good way in whichto model MTX exposure in the current data set. Somepatients may have had long exposures to MTX yearsprior to entry into the NDB, but no exposure while inthe NDB. The alternative (switched versus nonswitched)methods for MTX indicate the effect of differing as-sumptions on SIRs for the MTX and no MTX/nobiologics groups. In spite of these differences in method,the actual SIRs do not differ substantially. Finally, itshould be noted that by definition the no MTX/nobiologics group has to have the longest observation(exposure) time, because the start of drug therapy beginsat the time of cohort enrollment. Thus, we may slightlyunderestimate the risk associated with no MTX/nobiologic therapy.
Figure 2 is included to address the issue of howsoon after the start of therapy lymphomas may occur.We did not notice a clustering of very early cases. Iflymphoma occurs soon after the start of treatment, thismay provide some evidence of a causal association, butthe lack of a temporal association provides no informa-tion on the likelihood that the medication causes lym-phoma. It also possible that inhibition of TNF� is notcausally related to lymphoma development but facili-tates the growth of tumors that are already present.
Figure 2. Number of months from the start of therapy to the development of lymphoma. Bars show the 5th and 95th percentiles.
1748 WOLFE AND MICHAUD

Because of possibilities such as this, we did not set aminimum treatment exposure time in this study.
Several methods are available to adjust for treat-ment assignment, including propensity scores and mar-ginal structural models. We did not use these methods inthis study, because baseline data that were crucial tounderstanding treatment assignment were often unavail-able. In addition, potentially key variables such as theC-reactive protein level or the ESR and the swollen jointcount were also unavailable.
Although we did not observe a relationship be-tween average disease severity among patients in whomlymphoma developed and those in whom lymphoma didnot develop, as has been shown previously when labora-tory and physical examination data were available, it ispossible that the average values of the HAQ, pain, andglobal severity scores that were measured during thesurveys (Table 5) masked the severity of disease. Weinvestigated this possibility by examining the severityscores of patients who enrolled in the NDB in theirrheumatologists’ clinics. As shown in Table 6, patientsreceiving infliximab had much worse clinical status thandid non–registry-enrolled patients. This suggests thepossibility that patients receiving infliximab had moresevere disease generally. If disease severity was a long-term process that was interrupted by infliximab, then it ispossible that the infliximab group was at a high risk forlymphoma regardless of treatment. We do not have data(HAQ, pain, etc.) from the time of etanercept initiation,but we expect that such data would not be different fromthose for patients treated with infliximab. We wish tomake clear, however, that the above discussion is con-sistent with data from the study but is, of course, notproof.
In contrast to the nonassociation with HAQscores noted in this report, we previously observed astrong association of lymphoma with ESRs (13), with anESR of �40 mm/hour having a hazard ratio of 9.2 (95%CI 2.0–42.7). In that study, however, there was noassociation with the HAQ score. Similarly, Baecklund etal, who also considered clinical and laboratory data,found an OR of 25.8 (95% CI 3.1–213.0) for patientswith high inflammatory activity compared with thosewith low inflammatory activity (12). Thus, the results ofthe current study, which did not include laboratory orswollen joint count data, should not be used as evidenceagainst the association of inflammation and lymphoma.
In summary, for 18,572 patients with RA in theNDB, the overall SIR for lymphoma was 1.9 (95% CI1.3–2.7). The SIR for those receiving biologics was 2.9(95% CI 1.7–4.9) and that for patients receiving inflix-
imab, with or without etanercept, was 2.6 (95% CI1.4–5.0). For patients being treated with etanercept, withor without infliximab, the SIR was 3.8 (95% CI 1.9–7.5).The SIR for patients receiving MTX was 1.7 (95% CI0.9–3.2), and that for patients in the no MTX/no bio-logics group was 1.0 (95% CI 0.4–2.5). Lymphoma wasassociated with increasing age, male sex, and level ofeducation. It seems possible that the apparently in-creased rates of lymphoma are, in fact, reduced bytherapy, and that the “increase” may reflect channelingbias whereby patients with the highest risk of lymphomapreferentially receive anti-TNF therapy. It appears thatneither clinical trial data nor data from the current studyare sufficient to establish a causal relationship betweenRA treatments and the development of lymphoma.
REFERENCES
1. National Cancer Institute. Surveillance, Epidemiology and EndResults page. URL: http://seer.cancer.gov/.
2. Mellemkjaer L, Linet MS, Gridley G, Frisch M, Moller H, OlsenJH. Rheumatoid arthritis and cancer risk. Eur J Cancer 1996;32A:1753–7.
3. Gridley G, McLaughlin JK, Ekbom A, Klareskog L, Adami HO,Hacker DG, et al. Incidence of cancer among patients withrheumatoid arthritis. J Natl Cancer Inst 1993;85:307–11.
4. Isomaki HA, Hakulinen T, Joutsenlahti U. Excess risk of lympho-mas, leukemia and myeloma in patients with rheumatoid arthritis.J Chronic Dis 1978;31:691–6.
5. Allebeck P. Increased mortality in rheumatoid arthritis. ScandJ Rheumatol 1982;11:81–6.
6. Katusic S, Beard CM, Kurland LT, Weis JW, Bergstralh E.Occurrence of malignant neoplasms in the Rochester, Minnesota,rheumatoid arthritis cohort. Am J Med 1985;78:50–5.
7. Prior P, Symmons DP, Hawkins CF, Scott DL, Brown R. Cancermorbidity in rheumatoid arthritis. Ann Rheum Dis 1984;43:128–31.
8. Laakso M, Mutru O, Isomaki HA, Koota K. Cancer mortality inpatients with rheumatoid arthritis. J Rheumatol 1986;13:522–6.
9. Tennis P, Andrews E, Bombardier C, Wang Y, Strand L, West R,et al. Record linkage to conduct an epidemiologic study on theassociation of rheumatoid arthritis and lymphoma in the Provinceof Saskatchewan, Canada. J Clin Epidemiol 1993;46:685–95.
10. Tennis P, Bombardier C, Malcolm E, Downey W. Validity ofrheumatoid arthritis diagnoses listed in the Saskatchewan HospitalSeparations Database. J Clin Epidemiol 1993;46:675–83.
11. Wolfe F, Mitchell DM, Sibley JT, Fries JF, Bloch DA, WilliamsCA, et al. The mortality of rheumatoid arthritis. Arthritis Rheum1994;37:481–94.
12. Baecklund E, Ekbom A, Sparen P, Feltelius N, Klareskog L.Disease activity and risk of lymphoma in patients with rheumatoidarthritis: nested case-control study. Br Med J 1998;317:180–1.
13. Wolfe F. Inflammatory activity, but not methotrexate or pred-nisone use predicts non-Hodgkin’s lymphoma in rheumatoid ar-thritis: a 25-year study of 1,767 RA patients. Arthritis Rheum1998;41 Suppl 9:S188.
14. Newkirk MM, Shiroky JB, Johnson N, Danoff D, Isenberg DA,Shustik C, et al. Rheumatic disease patients, prone to Sjogren’ssyndrome and/or lymphoma, mount an antibody response toBHRF1, the Epstein-Barr viral homologue of BCL-2. Br J Rheu-matol 1996;35:1075–81.
LYMPHOMA IN RA 1749
15. Van de Rijn M, Cleary ML, Variakojis D, Warnke RA, Chang PP,Kamel OW. Epstein-Barr virus clonality in lymphomas occurringin patients with rheumatoid arthritis. Arthritis Rheum 1996;39:638–42.
16. Kamel OW, Holly EA, van de Rijn M, Lele C, Sah A. Apopulation based, case control study of non-Hodgkin’s lymphomain patients with rheumatoid arthritis. J Rheumatol 1999;26:1676–80.
17. Urowitz MB, Lee P. The risks of antimalarial retinopathy, aza-thioprine lymphoma and methotrexate hepatotoxicity during thetreatment of rheumatoid arthritis. Baillieres Clin Rheumatol1991;4:193–206.
18. Silman AJ, Petrie J, Hazleman B, Evans SJ. Lymphoproliferativecancer and other malignancy in patients with rheumatoid arthritistreated with azathioprine: a 20 year follow up study. Ann RheumDis 1988;47:988–92.
19. Pitt PI, Sultan AH, Malone M, Andrews V, Hamilton EB.Association between azathioprine therapy and lymphoma in rheu-matoid disease. J R Soc Med 1987;80:428–9.
20. Hazleman BL. The comparative incidence of malignant disease inrheumatoid arthritics exposed to different treatment regimens.Ann Rheum Dis 1982;41 Suppl 1:12–7.
21. Van Wanghe P, Dequeker J. Compliance and long-term effect ofazathioprine in 65 rheumatoid arthritis cases. Ann Rheum Dis1982;41 Suppl 1:40–3.
22. Cobeta-Garcia JC, Ruiz-Jimeno MT, Fontova-Garrofe R. Non-Hodgkin’s lymphoma, rheumatoid arthritis and methotrexate.J Rheumatol 1993;20:200–2.
23. Kamel OW, Vanderijn M, Weiss LM, Delzoppo GJ, Hench PK,Robbins BA, et al. Reversible lymphomas associated with Epstein-Barr virus occurring during methotrexate therapy for rheumatoidarthritis and dermatomyositis. N Engl J Med 1993;328:1317–21.
24. Morris CR, Morris AJ. Localized lymphoma in a patient withrheumatoid arthritis treated with parenteral methotrexate.J Rheumatol 1993;20:2172–3.
25. Shiroky JB, Newkirk MM. Reversible lymphomas. N Engl J Med1993;329:1657–8.
26. Taillan B, Garnier G, Castanet J, Ferrari E, Pesce A, Dujardin P.Lymphoma developing in a patient with rheumatoid arthritistaking methotrexate. Clin Rheumatol 1993;12:93–4.
27. Buskila D, Thomson GT, Klein M, Keystone EC. Avascularnecrosis of bone mimicking symmetric polyarthritis in a patientwith malignant lymphoma treated with high-dose steroids. IsrJ Med Sci 1992;28:804–5.
28. Kingsmore SF, Hall BD, Allen NB, Rice JR, Caldwell DS.Association of methotrexate, rheumatoid arthritis and lymphoma:report of 2 cases and literature review. J Rheumatol 1992;19:1462–5.
29. Klein HP. Occurrence of highly malignant non-Hodgkin’s lym-phoma in correlation with Imurek therapy and later MTX therapyof chronic polyarthritis. Z Rheumatol 1992;51:256–9.
30. Ellman MH, Hurwitz H, Thomas C, Kozloff M. Lymphomadeveloping in a patient with rheumatoid arthritis taking low doseweekly methotrexate. J Rheumatol 1991;18:1741–3.
31. Thomson GT, Keystone EC, Sturgeon JF, Fornasier V. Erythemanodosum and non-Hodgkin’s lymphoma. J Rheumatol 1990;17:383–5.
32. Mariette X, Cazals-Hatem D, Warszawki J, Liote F, BalandraudN, Sibilia J. Lymphomas in rheumatoid arthritis patients treatedwith methotrexate: a 3-year prospective study in France. Blood2002;99:3909–15.
33. Starkebaum G. Rheumatoid arthritis, methotrexate, and lym-phoma: risk substitution, or cat and mouse with Epstein-Barrvirus? J Rheumatol 2001;28:2573–5.
34. Georgescu L, Paget SA. Lymphoma in patients with rheumatoidarthritis: what is the evidence of a link with methotrexate? DrugSaf 1999;20:475–87.
35. Kono H, Inokuma S, Matsuzaki Y, Nakayama H, Yamazaki J,Hishima T, et al. Two cases of methotrexate induced lymphomasin rheumatoid arthritis: an association with increased serum IgE.J Rheumatol 1999;26:2249–53.
36. Georgescu L, Quinn GC, Schwartzman S, Paget SA. Lymphoma inpatients with rheumatoid arthritis: association with the diseasestate or methotrexate treatment. Semin Arthritis Rheum 1997;26:794–804.
37. Sukenik S, Ariad S, Flusser D. Malignancy in patients withrheumatoid arthritis treated with methotrexate [letter]. J Rheu-matol 1997;24:806.
38. Usman AR, Yunus MB. Non-Hodgkin’s lymphoma in patientswith rheumatoid arthritis treated with low dose methotrexate.J Rheumatol 1996;23:1095–7.
39. Viraben R, Brousse P, Lamant L. Reversible cutaneous lymphomaoccurring during methotrexate therapy. Br J Dermatol 1996;135:116–8.
40. Kerr LD, Troy K, Isola L. Temporal association between the useof methotrexate and development of leukemia in 2 patients withrheumatoid arthritis. J Rheumatol 1995;22:2356–8.
41. Marlier S, Chagnon A, Brocq O, de Jaureguiberry JP, Jaubert D,Paris JF, et al. Lymphoma induced by low-dose methotrexate inrheumatoid arthritis with severe lymphopenia. Ann Med Interne(Paris) 1995;146:206–8.
42. Brackertz D. Occurrence of a highly malignant non-Hodgkinlymphoma in connection with azathioprine therapy and metho-trexate therapy in a patient with rheumatoid arthritis. Z Rheuma-tol 1992;51:257–9.
43. Shiroky JB, Frost A, Skelton JD, Haegert DG, Newkirk MM,Neville C. Complications of immunosuppression associated withweekly low dose methotrexate. J Rheumatol 1991;18:1172–5.
44. Bachman TR, Sawitzke AD, Perkins SL, Ward JH, Cannon GW.Methotrexate-associated lymphoma in patients with rheumatoidarthritis: report of two cases. Arthritis Rheum 1996;39:325–9.
45. Salloum E, Cooper DL, Howe G, Lacy J, Tallini G, Crouch J, et al.Spontaneous regression of lymphoproliferative disorders in pa-tients treated with methotrexate for rheumatoid arthritis and otherrheumatic diseases. J Clin Oncol 1996;14:1943–9.
46. Liote F, Pertuiset E, Cochand-Priollet B, D’Agay MF, Dombret H,Numeric P, et al. Methotrexate related B lymphoproliferativedisease in a patient with rheumatoid arthritis: role of Epstein-Barrvirus infection. J Rheumatol 1995;22:1174–8.
47. Moder KG, Tefferi A, Cohen MD, Menke DM, Luthra HS.Hematologic malignancies and the use of methotrexate in rheu-matoid arthritis: a retrospective study. Am J Med 1995;99:276–81.
48. Jones M, Symmons D, Finn J, Wolfe F. Does exposure toimmunosuppressive therapy increase the 10 year malignancy andmortality risks in rheumatoid arthritis? A matched cohort study.Br J Rheumatol 1996;35:738–45.
49. Van den Borne BE, Landewe RB, Houkes I, Schild F, van derHeyden PC, Hazes JM, et al. No increased risk of malignanciesand mortality in cyclosporin A–treated patients with rheumatoidarthritis. Arthritis Rheum 1998;41:1930–7.
50. Bathon JM, Martin RW, Fleischmann RM, Tesser JR, Schiff MH,Keystone EC, et al. A comparison of etanercept and methotrexatein patients with early rheumatoid arthritis [published erratumappears in N Engl J Med 2001;344:240]. N Engl J Med 2000;343:1586–93.
51. Targan SR, Hanauer SB, van Deventer SJ, Mayer L, Present DH,Braakman T, et al, and the Crohn’s Disease cA2 Study Group. Ashort-term study of chimeric monoclonal antibody cA2 to tumornecrosis factor � for Crohn’s disease. N Engl J Med 1997;337:1029–35.
52. Sandborn WJ, Hanauer SB. Antitumor necrosis factor therapy forinflammatory bowel disease: a review of agents, pharmacology,clinical results, and safety. Inflamm Bowel Dis 1999;5:119–33.
53. Maini R, St Clair EW, Breedveld F, Furst D, Kalden J, Weisman
1750 WOLFE AND MICHAUD
M, et al, and the ATTRACT Study Group. Infliximab (chimericanti-tumour necrosis factor � monoclonal antibody) versus pla-cebo in rheumatoid arthritis patients receiving concomitant meth-otrexate: a randomised phase III trial. Lancet 1999;354:1932–9.
54. Brown SL, Greene MH, Gershon SK, Edwards ET, Braun MM.Tumor necrosis factor antagonist therapy and lymphoma develop-ment: twenty-six cases reported to the Food and Drug Adminis-tration. Arthritis Rheum 2002;46:3151–8.
55. Weinblatt ME, Keystone EC, Furst DE, Moreland LW, WeismanMH, Birbara CA, et al. Adalimumab, a fully human anti–tumornecrosis factor � monoclonal antibody, for the treatment ofrheumatoid arthritis in patients taking concomitant methotrexate:the ARMADA trial. Arthritis Rheum 2003;48:35–45.
56. FDA. Briefing Document. US Food and Drug Administration:2003.
57. Wolfe F, Anderson J, Burke TA, Arguelles LM, Pettitt D.Gastroprotective therapy and risk of gastrointestinal ulcers: riskreduction by COX-2 therapy. J Rheumatol 2002;29:467–73.
58. Wolfe F, Flowers N, Burke TA, Arguelles LM, Pettitt D. Increasein lifetime adverse drug reactions, service utilization, and diseaseseverity among patients who will start COX-2 specific inhibitors:quantitative assessment of channeling bias and confounding byindication in 6689 patients with rheumatoid arthritis and osteoar-thritis. J Rheumatol 2002;29:1015–22.
59. Wolfe F, Flowers N, Anderson J. The National Rheumatic DiseaseData Bank: case mix and severity characteristics of patients inrheumatological practice. Arthritis Rheum 1998;41 Suppl 9:S132.
60. Fries JF, Spitz PW, Young DY. The dimensions of health out-comes: the health assessment questionnaire, disability and painscales. J Rheumatol 1982;9:789–93.
61. Fries JF, Spitz P, Kraines RG, Holman HR. Measurement ofpatient outcome in arthritis. Arthritis Rheum 1980;23:137–45.
62. Hawley DJ, Wolfe F. Depression is not more common in rheuma-toid arthritis: a 10-year longitudinal study of 6,153 patients withrheumatic disease. J Rheumatol 1993;20:2025–31.
63. Hawley DJ, Wolfe F. Anxiety and depression in patients with
rheumatoid arthritis: a prospective study of 400 patients. J Rheu-matol 1988;15:932–41.
64. Ware JE, Sherbourne CD. The MOS 36-item short-form healthsurvey (SF-36). I. Conceptual framework and item selection. MedCare 1992;30:473–83.
65. Hurst NP, Kind P, Ruta D, Hunter M, Stubbings A. Measuringhealth-related quality of life in rheumatoid arthritis: validity,responsiveness and reliability of EuroQol (EQ-5D). Br J Rheu-matol 1997;36:551–9.
66. Wolfe F, Hawley DJ. Measurement of the quality of life inrheumatic disorders using the EuroQol. Br J Rheumatol 1997;36:786–93.
67. Choi HK, Michaud K, Wolfe F. Utility measures in rheumaticdisorders [abstract]. Arthritis Rheum 2002;46 Suppl 9;S76.
68. Brazier J, Roberts J, Deverill M. The estimation of a preference-based measure of health from the SF-36. J Health Econ 2002;21:271–92.
69. Brazier J, Usherwood T, Harper R, Thomas K. Deriving apreference-based single index from the UK SF-36 Health Survey.J Clin Epidemiol 1998;51:1115–28.
70. Wolfe F, Hawley DJ, Wilson K. The prevalence and meaning offatigue in rheumatic disease. J Rheumatol 1996;23:1407–17.
71. Doody MM, Hayes HM, Bilgrad R. Comparability of nationaldeath index plus and standard procedures for determining causesof death in epidemiologic studies. Ann Epidemiol 2001;11:46–50.
72. Edlavitch SA, Baxter J. Comparability of mortality followupbefore and after the National Death Index. Am J Epidemiol1988;127:1164–78.
73. Stata statistical software: release 8.0. College Station (TX): StataCorporation; 2003.
74. Wolfe F, Pincus T, O’Dell J. Evaluation and documentation ofrheumatoid arthritis disease status in the clinic: which variablesbest predict change in therapy. J Rheumatol 2001;28:1712–7.
75. Choi HK, Hernan MA, Seeger JD, Robins JM, Wolfe F. Metho-trexate therapy and mortality in patients with rheumatoid arthritis:a prospective study. Lancet 2002;359:1173–7.
LYMPHOMA IN RA 1751