lxn REPORT - DTIC
281
lxn ANm”7cJA.Lt T’CM?KLA.I.4 CYcxdfom REPORT JOINT TYPHOON W-ARNINCi- CE?NTE3R ~.. ~ GUAM, MARIANA ISLANDS .’ ,,
-
Upload
khangminh22 -
Category
Documents
-
view
2 -
download
0
Transcript of lxn REPORT - DTIC

lxnANm”7cJA.LtT’CM?KLA.I.4CYcxdfom REPORT
JOINT TYPHOON W-ARNINCi-CE?NTE3R~.. ~ GUAM, MARIANA ISLANDS
.’,,

REPORT DOCUMENTATION PAGE Form Approved OMB No.0704-0188
Public reporting burder for this collection of information is estibated to average 1 hour per response, including the time for reviewing instructions, searching existing data sources, gathering and maintaining the data needed, and completingand reviewing this collection of information. Send comments regarding this burden estimate or any other aspect of this collection of information, including suggestions for reducing this burder to Department of Defense, WashingtonHeadquarters Services, Directorate for Information Operations and Reports (0704-0188), 1215 Jefferson Davis Highway, Suite 1204, Arlington, VA 22202-4302. Respondents should be aware that notwithstanding any other provision oflaw, no person shall be subject to any penalty for failing to comply with a collection of information if it does not display a currently valid OMB control number. PLEASE DO NOT RETURN YOUR FORM TO THE ABOVE ADDRESS.
1. REPORT DATE (DD-MM-YYYY)01-01-1995
2. REPORT TYPEAnnual Report
3. DATES COVERED (FROM - TO)xx-xx-1995 to xx-xx-1995
4. TITLE AND SUBTITLE1992 Annual Tropical Cyclone ReportUnclassified
5a. CONTRACT NUMBER5b. GRANT NUMBER5c. PROGRAM ELEMENT NUMBER
6. AUTHOR(S)Mautner, Donald A. ;Guard, Charles P. ;
5d. PROJECT NUMBER5e. TASK NUMBER5f. WORK UNIT NUMBER
7. PERFORMING ORGANIZATION NAME AND ADDRESSJoint Typhoon Warning Center425 Luapele RoadPearl Harbor, HI96860-3103
8. PERFORMING ORGANIZATION REPORTNUMBER
9. SPONSORING/MONITORING AGENCY NAME AND ADDRESSNaval Pacific Meteorology and Oceanography CenterJoint Typhoon Warning Center425 Luapele RoadPearl Harbor, HI96860-3103
10. SPONSOR/MONITOR'S ACRONYM(S)11. SPONSOR/MONITOR'S REPORTNUMBER(S)
12. DISTRIBUTION/AVAILABILITY STATEMENTAPUBLIC RELEASE,13. SUPPLEMENTARY NOTESSee Also ADM001257, 2000 Annual Tropical Cyclone Report Joint Typhoon Warning Center (CD includes 1959-1999 ATCRs). Block 1 andBlock 3 should be 1992.14. ABSTRACTThe mission of the Joint Typhoon Warning Center is multi-faceted and includes: Continuous monitoring of all tropical weather activity in theNorthern and Southern Hemispheres, from 180 degrees longitude westward to the east coast of Africa, and the prompt issuance of apropriateadvisories and alerts when tropical cyclone development is anticipated.15. SUBJECT TERMS16. SECURITY CLASSIFICATION OF: 17. LIMITATION
OF ABSTRACTPublic Release
18.NUMBEROF PAGES280
19. NAME OF RESPONSIBLE PERSONFenster, [email protected]
a. REPORTUnclassified
b. ABSTRACTUnclassified
c. THIS PAGEUnclassified
19b. TELEPHONE NUMBERInternational Area CodeArea Code Telephone Number703767-9007DSN427-9007
Standard Form 298 (Rev. 8-98)Prescribed by ANSI Std Z39.18
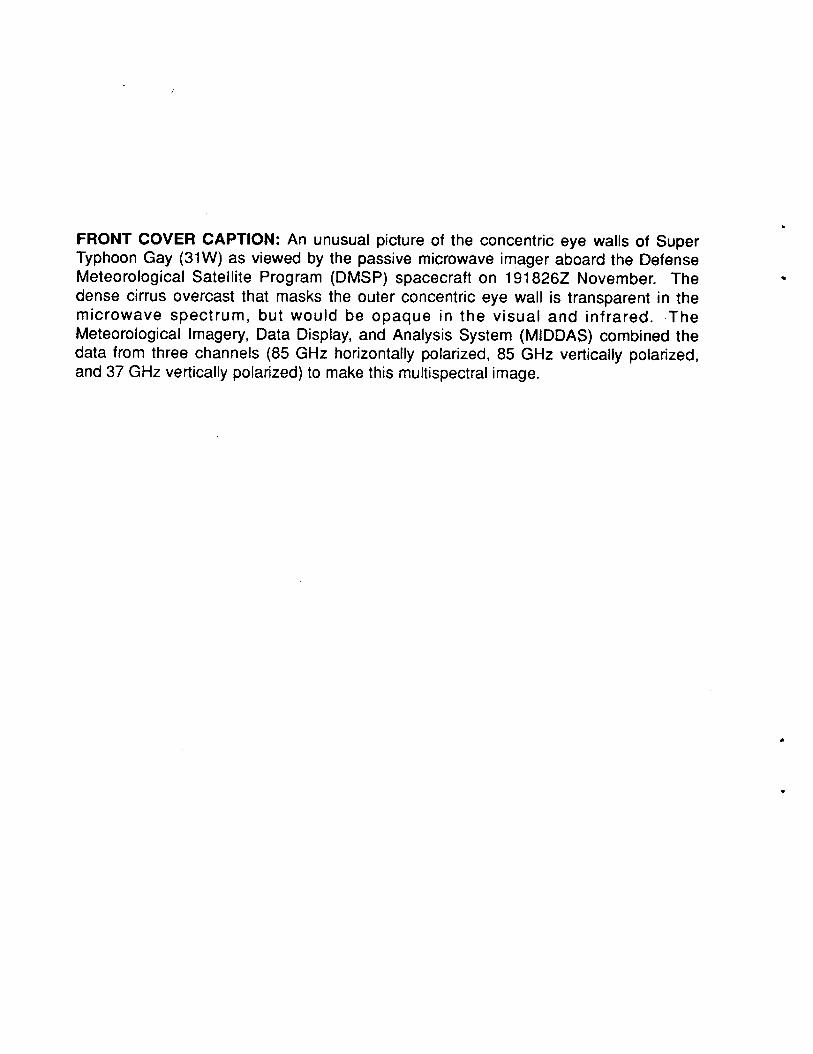
FRONT COVER CAPTION: An unusual picture of the concentric eye walls of SuperTyphoon Gay (31 W) as viewed by the passive microwave imager aboard the DefenseMeteorological Satellite Program (DMSP) spacecraft on 191826Z November. Thedense cirrus overcast that masks the outer concentric eye wall is transparent in themicrowave spectrum, but would be opaque in the visual and infrared. TheMeteorological Imagery, Data Display, and Analysis System (MIDDAS) combined thedata from three channels (85 GHz horizontally polarized, 85 GHz vertically polarized,and 37 GHz vertically polarized) to make this multispectral image.
●
✎
U. S. NAVAL OCEANOGRAPHY COMMAND CENTERJOINT TYPHOON WARNING CENTER
COMNAVMARIANASPSC 489, BOX 12
FPO AP 96536-0051
DONALD A. MAUTNER
CAPTAIN, UNITED STATES NAVYCOMMANDING OFFICER
CHARLES P. GUARD
LIEUTENANT COLONEL, UNITED STATES AIR FORCEDIRECTOR, JOINT TYPHOON WARNING CENTER
COMMANDER, DETACHMENT 1, 633d OPERATIONS SUPPORT SQUADRON
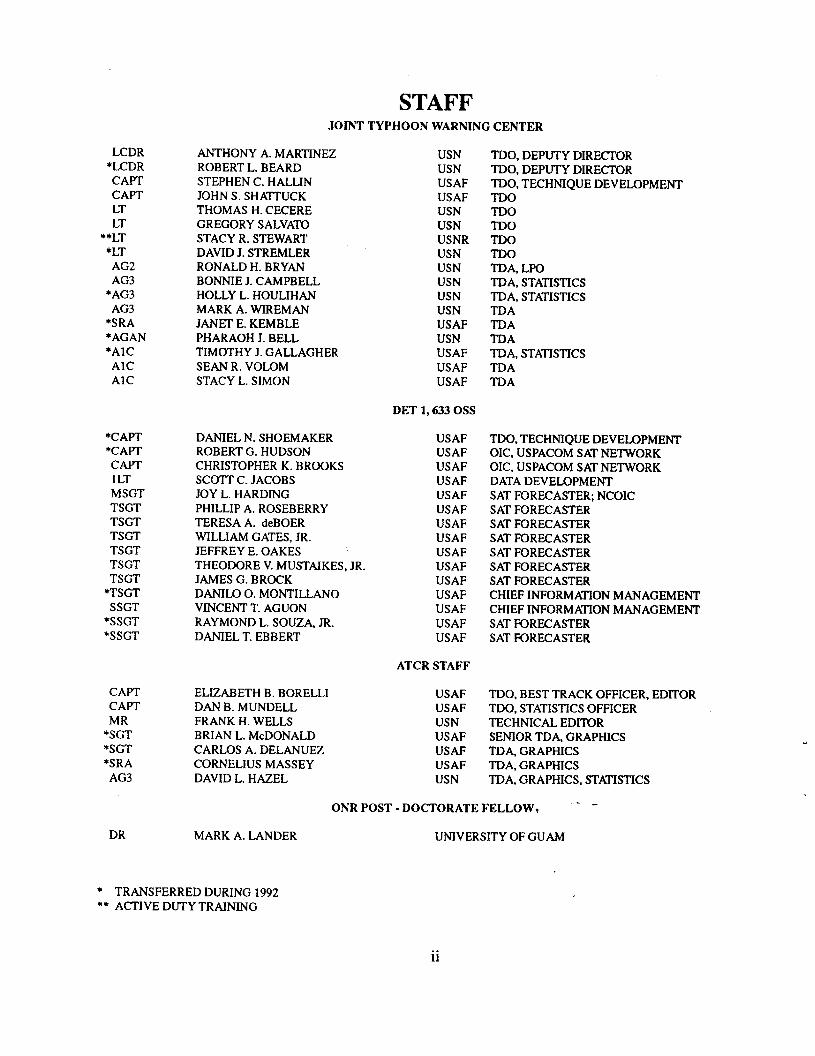
STAFFJOINT TYPHOON WARNING CENTER
LCDR*LCDR
CAPTCAPTLTLT
**LT
*LTAG2AG3
*AG3AG3
*SRA*AGAN*AIC
AICAIC
*CAPT*CAPT
CAPT1LTMSGTTSGTTSGTTSGTTSGTTSGTTSGT
*TSGTSSGT
*SSGT*SSGT
CAPTCAPTMR
*SGT*SGT*SRA
AG3
DR
ANTHONY A. MARTINEZROBERT L. BEARDSTEPHEN C. HALLINJOHN S. SHAT’IWCKTHOMAS H. CECEREGREGORY SALVATOSTACY R. STEWARTDAVID J. STREMLERRONALD H. BRYANBONNIE J. CAMPBELLHOLLY L. HOULIHANMARK A. WIREMANJANET E. KEMBLEPHARAOH J. BELLTIMOTHY J. GALLAGHERSEAN R. VOLOMSTACY L. SIMON
DANIEL N. SHOEMAKERROBERT G. HUDSONCHRISTOPHER K. BROOKSSCOTT C. JACOBSJOY L. HARDINGPHILLIP A. ROSEBERRYTERESA A. deBOERWILLIAM GATES, JR.JEFFREY E. OAKESTHEODORE V. MUSTAIKES, JR.JAMES G. BROCKDANILO O. MONTILLANOVINCENT T. AGUONRAYMOND L. SOUZA, JR.DANIEL T. EBBERT
ELIZABETH B. BORELLIDAN B. MUNDELLFRANK H. WELLSBRIAN L. McDONALDCARLOS A. DELANUEZCORNELIUS MASSEYDAVID L. HAZEL
USNUSNUSAFUSAFUSNUSNUSNRUSNUSNUSNUSNUSNUSAFUSNUSAFUSAFUSAF
DET 1, 6330SS
USAFUSAFUSAFUSAFUSAFUSAFUSAFUSAFUSAFUSAFUSAFUSAFUSAFUSAFUSAF
ATCR STAFF
USAFUSAFUSNUSAFUSAFUSAFUSN
TOO, DEPUTY DIRECrORTDO, DEPUTY DIRECTORTDO, TECHNIQUE DEVELOPMENTTDOTDoTDo
TDA, LPOTDA, STA~STICSTDA, STATISTICSTDATDATDATDA, STATISTICSTDATDA
TDO, TECHNIQUE DEVELOPMENTOIC, USPACOM SAT NETWORKOIC, USPACOM SAT NETWORKDATA DEVELOPMENTSAT FORECASTER; NCOICSAT FORECASTERSAT FORECASTERSAT FORECASTERSAT FORECASTERSAT FORECASTERSAT FORECASTERCHIEF INFORMA~ON MANAGEMENTCHIEF INFORMATION MANAGEMENTSAT FORECASTERSAT FORECASTER
TDO, BEST TRACK OFFICER, EDITORTDO, STATISTICS OFFICERTECHNICAL EDI’’i’0RSENIOR TDA, GRAPHICSTDA, GRAPHICSTDA, GRAPHICSTDA, GRAPHICS, STA~STICS
MARK A. LANDER
ONR POST - DOCTORATE FELLOWt - -
UNIVERSITY OF GUAM
* TRANSFERRED DURING 1992** ACTIVE DUTY TRAINING
ii

The Annual Tropical Cyclone Report isprepared by the staff of the Joint TyphoonWarning Center (JTWC), a combined AirForce/Navy organization operating under thecommand of the Commanding Officer, U.S.Naval Oceanography Command Center/JointTyphoon Warning Center, Guam. The JTWCwas founded 1 May 1959 when theCommander-in-Chief Pacific (USCINCPAC)forces directed that a single tropical cyclonewarning center be established for the westernNorth Pacific region. The operations of JTWCare guided by CINCPAC Instruction(CINCPACINST) 3140.lV.
The mission of JTWC is multifaceted andincludes:
1. Continuous monitoring of all tropicalweather activity in the Northern and SouthernHemispheres, from 180° east longitudewestward to the east coast of Africa, and theprompt issuance of appropriate advisories andalerts when tropical cyclone development isanticipated.
2. Issuance of warnings on all significanttropical cyclones in the above area ofresponsibility.
3. Determination of requirements fortropical cyclone reconnaissance and assignmentof appropriate priorities.
4. Post-storm analysis of significant tropicalcyclones occurring within the western NorthPacific and North Indian Oceans, whichincludes an in-depth analysis of tropicalcyclones of note and all typhoons.
5. Cooperation with the Naval ResearchLaboratory, Monterey, California on operationalevaluation of tropical cyclone models andforecast aids, and the development of newtechniques to support operational forecastscenarios.
Changes this year include: 1) wind arearadius threshold of 30kt on warnings increasedto 35kt ; and, 2) 36-hour forecasts added to
western North Pacific and North Indian Oceantropical cyclone warnings.
Special thanks to: the men and women ofthe Alternate Joint TWhoon Warning Center forstanding in for JTWC which was incapacitatedfor 11 days after Typhoon Omar’s passage; FleetNumerical Oceanography Center for theirunfaltering operational and software support;the Naval Research Laboratory for theirdedicated research and forecast improvementinitiatives; the Air Force Global WeatherCentral for continued satellite support andmicrowave development efforts; the 633dCommunications Squadron, Operating LocationCharlie and the Operations and EquipmentSupport departments of the NavalOceanography Command Center, Guam fortheir high quality support; all the men andwomen of the ships and facilities ashorethroughout the JTWC AOR, and especially onGuam, who took the observations andcommunicated them with pride that became thebasis for our analyses, forecasts and postanalyses; the staff at National Oceanic andAtmospheric Administration (NOAA) NationalEnvironmental Satellite, Data, and InformationService (NESDIS) for their tropical cycloneposition and intensity support; the personnel ofTropical Cyclone Motion-1992 (TCM-92) forsharing their data and understanding of tropicalcyclones; the personnel of the Pacific FleetAudio-Visual Center, Guam for their assistancein the reproduction of satellite imagery for thisrep?rt; the Navy Publications and PrintingService Branch Office, Guam; Dr. Bob Abbeyand the Office of Naval Research for theirsupport to the University of Guam for the Post-Doctorate Fellow at JTWC; Dr. Mark Landerfor his training efforts, suggestions and valuableinsights; and AG3 Dave Hazel for hls excellentsupport with the desktop publishing system andgraphics.
. ..111
EXECUTIVE SUMMARY
The Joint Typhoon Warning Center, Guam(JTWC) experienced the busiest year in its 33-year history during 1992, eclipsing the record-setting 1991 year by 250 warnings. In additionto the massive warning workload, the Centeralso supported several contingencies andscientific field experiments, and endured theassault of five typhoons in less than a 3-monthperiod that included Typhoon Omar whichblasted Guam with 105-kt sustained winds andcaused $457 million in damages to the island.JTWC warnings were crucial to the safedeployment of ships, aircraft and personnelinvolved with Operations RESTORE HOPE,FULL ACCOUNTING, and PROVIDECOMFORT. JTWC’S participation in suchexperiments as the TCM-92 (a NavalPostgraduate School/ONR-sponsored mini-fieldexperiment), GTE/PEM-West (a NASAatmospheric chemistry field expedition), andTOGA COARE (an international air-seainteraction field experiment) greatly c~mributed..to the success of each.
In 1992, JTWC issued 1405 warnings,significantly surpassing the 1990 and 1991records of 1139 and 1155 warnings,respectively. Of the 159 days of the year JTWCwas in warning status, 75 of those days had atleast two storms, 27 days at least three storms atthe same time, and 3 days had four stormsoccurring simultaneously. JTWC’S trackforecast performance in 1992 for the westernNorth Pacific was the third best in Center’shistory, despite the workload. When comparedto the climatology-persistence model, CLIPER,
JTWC forecasts were 24 percent better acrossthe board, indicating that JTWC forecasts werevery good despite a relatively dlfflcult forecastyear. In the Southern Hemisphere, forecasterrors for the second straight year were belownormal, and in the North Indian Ocean theforecast errors were smaller than the long termaverage for 24 hours, although for 48 and 72hours they were slightly larger. Intensityforecast errors for western North Pacifictropical cyclones were smaller than average at24 hours and 48 hours, but showed noimprovement over the long term mean at 72hours.
JTWC and its Air Force satellitereconnaissance component, Det 1, 633dOperations Support Squadron, continued toimprove capabilities through the acquisition andexploitation of new technology. TheMeteorological Imagery, Data Display, andAnalysis System (MIDDAS) gained thecapability to process and display all polarorbiting satellite data in addition togeostationary data. The Mission SensorTactical Imaging Computer (MISTIC) gainedthe capability to co-register microwave imagerdata with conventional infrared data. JTWCwas also able to routinely obtain worldwidemicrowave imager data from FNOC andmanipulate it on the MISTIC. And the NavalResearch Lab began work on theSPAWRSYSCOM-funded follow-on system tothe current Automated Tropical CycloneForecast System (ATCF).
iv
TABLE OF CONTENTS
FOREWORD ....................................................................................................................................... ..111
EXECUTIVE SUMMARY ............................ .................................................... ...................................iv1. OPERATIONAL PROCEDURES .................................................................................................... 1
1.1 General ................................................................................................................................ 11.2 Data Sources ........................................................................................................................11.3 Communications ..................................................................................................................21.4 Data Displays .......................................................................... .............................................51.5 Analyses ..............................................................................................................................51.6 Forecast Procedures .............................................................................................................51.7 Warnings ..............................................................................................................................81.8 Prognostic Reasoning Messages ..........................................................................................91.9 Tropical Cyclone Formation Alerts .....................................................................................91.10 Significant Tropical Weather Advisories .............................................................................9
2. RECONNAISSANCE AND FIXES ..............................................................................................112.1 General ................................................................................... ........................+................... 112.2 Reconnaissance Availability .............................................................................................. 112.3 Satellite Reconnaissance Summary ................................................................................... 112.4 Radar Reconnaissance Summary .......................................................................................152.5 Tropical Cyclone Fix Data ................................................................................................. 15
3. SUMMARY OF NORTHWEST PACIFIC ANDNORTH INDIAN OCEAN TROPICAL CYCLONES ..................................................................19
3.1 General ............................................................................................................................... 193.2 Western North Pacific Tropical Cyclones ..........................................................................24
Tmt)ical Cvclone
(OIW) 11’ Axel(OIC) TS Ekeka(02W) TY Bobbie(03W) TY Chuck(04W) TS Deanna(05W) TY Eli(06W) TS Faye(07W) TY Gary(08W) TS Helen(09W) TS Irving(1OW) TY Janis(IIW) TY Kent(12W) TY Lois(13W) TS Mark(14W) TS Nina(15W) TY Omar(16W) TS Po]ly
INDIVIDUAL TROPICAL CYCLONES
zm!w ~ Trcmica] cvclon~
Slremler...............36 (17W) TY Ryan
Mundell...............42 (18W) TY SibylBorelli.................44 (19W) TY TedBorelli.................48 (20W) TS ValBorelli..................51 . (21W) TS WardMartinez..............53 (22W) TS ZackCecere................. 56 (23W) STY YvetteMundell...............58 (24W) TY AngelaSalvato................ 61 (25W) TY BrianCecere................. 63 (26W) TY ColleenMartinez..............67 (27W) TS DanSalvato................ 70 (28W) STYElsieMundelL..............73 (29W) TD 29WBorelli................. 75 (30W) TY ForrestCecere................. 77 (31W) STY GayMartinez..............79 (32W) TY HuntSalvato................ 88
v
Aut!!!x pagQMundell.................92Borelli................... %Caere................. 100Salvato................ 105Mundell .............. 107Borelli................. 110Cecere................. 112&dvato. ............... 116Mundell.,............. 120Borelli................. 126MundelL.............. 130Cecere................. 136Borelli................. 139Salvato................ 141Shattuck.............. 145Borelli................. 152
&gQ3.3 North Indian Ocean Tropical Cyclones .................................. ................ 155
INDIVIDUALTROPICALCYCLONESNameTCOIB....................J...............158TC 02A ...................................160TC 03B....................................162TC 04B....................................164TC 05B....................................166TC 06A ...................................168TC 07B....................................I7OTC 08B....................................172TC 09B....................................174TC 10B...,................................176TC 11A...................................178TC 12A...................................180Forrest(30W)..........................141
4. SUMMARY OF SOUTH PACIFIC AND SOUTH INDIAN OCEANTROPICAL CYCLONES .....................................................................................l83
4.1 General ................................................................................................... 1834.2 South Pacific and South Indian Ocean Tropical Cyclones .................... 183
5. SUMMARY OF FORECAST VERIFICATION ................................... .............. 1915.1 Annual Forecast Verification ................................................................. 1695.2 Comparison of Objective Techniques ............................................ ........2O55.3 Testing and Results ................................................................................2O8
6. TROPICAL CYCLONE WARNING VERIFICATION STATISTICS ................2136.1 General ...................................................................................................2l36.2 Warning Verification Statistics ......................................................... ......213
7. TROPICAL CYCLONE SUPPORT SUMMARY ...............................................249
BIBLI~RAPHY ......................................................................................................257APPENDIX A - Definitions .......................................................................................259APPENDIX B - Names for Tropical Cyclones ..........................................................262APPENDIX C - Contractions ....................................................................................263APPENDIX D - Past Annual Tropical Cyclone Repofis ...........................................266APPENDIX E - Distribution List ..............................................................................267
1. OPERATIONAL PROCEDURES
1.1 GENERAL
The Joint Typhoon Warning Center (JTWC)provides a variety of routine products and ser-vices to the organizations within its area ofresponsibility (AOR), including:
1.1.1 SIGNIFICANT TROPICAL WEATHERADVISORY — Issued daily or more frequentlyas needed, to describe all tropical disturbancesand their potential for further development dur-ing the advisory period. A separate bulletin isissued for the western Pacific and the IndianOcean.
1.1.2 TROPICAL CYCLONE FORMATIONALERT — Issued when synoptic or satellitedata indicate that the development of a signifi-cant tropical cyclone is likely within 12 to 24hours in a specified area.
1.1.3 TROPICAL CYCLONE/ TROPICALDEPRESSION WARNING — Issued periodi-cally throughout each day to provide forecastsof position, intensity, and wind distribution fortropical cyclones in JTWC’S AOR.
1.1.4 PROGNOSTIC REASONING MES-SAGES — Issued with warnings for tropicaldepressions, tropical storms, typhoons and supertyphoons in the western North Pacific to discussthe rationale for the content of JTWC’S warn-ings.
1.1.5 PRODUCT CHANGES — The contentsand availability of the above JTWC products areset forth in USCINCPACINST 3140.1 V.Changes to USCINCPACINST 3140. lV, andJTWC products and services are proposed anddiscussed at the Annual Tropical CycloneConference.
1
1.2 DATA SOURCES
1.2.1 COMPUTER PRODUCTS — Numericaland statistical guidance are available from theUSN Fleet Numerical Oceanography Center(FNOC) at Monterey, California. These prod-ucts along with selected ones from the NationalMeteorological Center (NMC) are receivedthrough the Naval Environmental Data Network(NEDN), the Naval Environmental SatelliteNetwork (NESN), and by microcomputer dial-up connections using military and commercialtelephone lines. Numerical guidance is alsoreceived from international sources as well.
1.2.2 CONVENTIONAL DATA — These datasets are comprised of land and shipboard sur-face observations, and enroute meteorologicalobservations from commercial and military air-craft (AIREPS) recorded within six hours ofsynoptic times, and cloud-motion winds derivedfrom satellite data. The conventional data ishand- and computer-plotted, and hand-analyzedin the tropics for the surface/gradient and 200-mb levels. These analyses are prepared twicedaily from 0000Z and 1200Z synoptic data.Also, FNOC supplies JTWC with computergenerated analyses and prognoses, from 0000Zand 1200Z synoptic data, at the surface, 850-mb, 700-mb, 500-mb, 400-mb, and 200-mb lev-els, deep-layer-mean winds, wind shear, andgeopotential height change charts.
1.2.3 SATELLITE RECONNAISSANCE —Meteorological satellite imagery recorded atUSAF/USN ground sites and USN ships supplY
day and night coverage in JTWC’S AOR.Interpretation of these satellite data providestropical cyclone positions and estimates of cur-rent and forecast intensities. The USAF tacticalsatellite sites and Air Force Global WeatherCentral currently receive and analyze special

sensor microwave/imager (SSM/1) data to pro-vide locations of tropical cyclones of which thecenter is obscured by cirrus clouds and esti-mates of 35-kt (18 rdsec) wind radii near tropi-cal cyclones. Use of satellite reconnaissance isdiscussed further in section 2.3, SatelliteReconnaissance Summary.
1.2.4 RADAR RECONNAISSANCE — Land-based radar observations are used to positiontropical cyclones. Once a well-defined tropicalcyclone moves within the range of land-basedradar sites, radar reports are invaluable fordetermination of position and movement.JTWC’S use of radar reports during 1992 is dis-cussed in section 2.4, Radar ReconnaissanceSummary.
1.2.5 AIRCRAFT RECONNAISSANCE —Until the summer of 1987, dedicated aircraftreconnaissance was used routinely to locate anddetermine the wind structure of tropicalcyclones. Now aircraft fixes are only availablevia radar reports from transiting jet aircmft orfrom weather reconnaissance aircraft involvedin dedicated research. Four fixes were receivedfrom the WC- 130 supporting the TropicalCyclone Motion- 1992 (TCM-92) experiment.
1.2.6 DRIFTING METEOROLOGICALBUOYS — In 1989, the Commander, NavalOceanography Command put the NAVOCEAN-COM Integrated Drifting Buoy Plan ( 1989-1994) into action to meet USCINPACFLTrequirements that included tropical cyclonewarning support. In 1992, 19 drifting buoys,which included 16 mini-meteorological (MINI-MET) and three larger TOGA buoys, weredeployed during the WESTPAC tropicalcyclone season by a Naval OceanographicOffice-contracted C-130 aircraft.
These buoys transmit data to NOAA’sTIROS-N polar orbiting satellites, which in turnboth store and immediately retransmit the data.If the satellite retransmission can be received by
Guam, JTWC acquires the drifting buoy datadirectly via a Local User’s Terminal (LUT).Additionally, the data stored aboard the satel-lites are recovered via Service ARGOS,processed, and then distributed to operationalcenters worldwide over the GlobalTelecommunications System (GTS), andAutomated Weather Network (AWN) via theNWS Telecommunications Gateway in SilverSprings, Maryland.
1.2.7 AUTOMATED METEOROLOGICALOBSERVING STATIONS (AMOS) — Througha cooperative effort between the NavalOceanography y Command, the Department ofthe Interior, and NOAA (NWS) to increase dataavailable for tropical analysis and forecasting, anetwork of 20 AMOS stations is being installedin the Micronesia islands. (Previous to thiseffort, two sites were installed in the NorthernMariana Islands at Saipan and Rota through ajoint venture between the Navy and NOAA(NWS).) JTWC receives data from all AMOSsites via the AWN under the KWBC bulletinheaders SMPWO1, SIPWO1 and SNPWO1(SXMY1O for Tinian and Rota). SinceSeptember of 1991, the capability to transmitdata via System ARGOS and NOAA polarorbiting satellites has been available as a backupto regular data transmission to GOES West andmore recently, for sites to the west of Guam, toJapanese GMS. ARGOS upgrades to existingsites are also being accomplished astunity arises. An AMOS summaryTable 1-1.
1.3 COMMUNICATIONS
the oppor-appears in
Primary communications support is provid-ed by the Naval Telecommunications Center(NTCC), Nimitz Hill, a component of the NavalComputers and Telecommunications AreaMaster Station, Western Pacific (NCTAMSWESTPAC). In addition, JTWC uses several
other communications systems.2

1.3.1 AUTOMATED DIGITAL NETWORK(AUTODIN) — AUTODIN is used for dissemi-nation of warnings, alerts and other related bul-letins to Department of Defense (DOD) andother U.S. Government installations. Thesemessages are relayed for further transmissionover Navy Fleet Broadcasts, and Coast Guardcontinuous wave Morse code and voice broad-casts. AUTODIN messages can be relayed tocommercial telecommunications for delivery tonon-DOD users. Inbound message traffic forJTWC is received via AUTODIN addressed toNAVOCEANCOMCEN GU//JTWC// or DET1 6330SS NIMITZ HILL GU//CC//.
1.3.2 AUTOMATED WEATHER NETWORK(AWN) — The AWN provides weather dataover the Pacific Meteorological Data System(PACMEDS). The PACMEDS, operational at
JTWC since April 1988, allows Pacific-Theateragencies to receive weather information at a1200 baud rate. JTWC uses a software packagecalled AWNCOM/WINDS on a microcomputerto send and receive data via the PACMEDS.Through recent hardware and softwareupgrades, this system provides effective storageand manipulation of the large volume of mete-orological reports available from throughoutJTWC’S vast AOR. Through the AWN, JTWChas access to data available on the GlobalTelecommunications System (GTS). JTWC’SAWN station identifier is PGTW.
1.3.3 DEFENSE SWITCHED NETWORK(DSN) — DSN, formerly AUTOVON, is aworldwide, general purpose, switched telecom-munications network for the DOD. The net-work provides a rapid and vital voice link for
Table 1-1 AUTOMATED METEOROLOGICAL OB!jERVING STATIONS SUMMARY
a LoCat ion Q!k?&!l ~ Repo~ ~Saipan* 15.2”N, 145.7”E 15D151D2 ----- ARC 1986Rota 14.2”N, 145.2”E 15D 16448 91221 ARC 1987Faraulep** 8.l”N, 144.6”E FARP2 52005 C-MAN/ARGOS 1988Enewetak 11.4”N, 162,3”E ENIP2 91251 C-MAN/ARGOS 1989ujae*** 8.9”N, 165.8”E UJAP2 91365 C-MAN 1989Pagan 18.l”N, 145.8”E PAGP2 91222 C-MAN/ARGOS 1990Kosrae 5.3”N, 163.O”E KOSP2 91355 C-MAN/ARGOS 1990Mili 6.l”N, 171.8”E MILP2 91377 C-MAN 1990
Oroluk 7.6”N, 155. l“E ORKP2 91343 C-MAN 1991Pingelap 6.3”N, 160.7”E PIGP2 91352 C-MANIARGOS 1991
Ulul 8.7”N, 149.7”E ----- 91328 C-MAN/ARGOS 1992
Tinian* 15.O”N, 145.6”E 15D151D2 91231 ARC 1992
* Saipan site relocated to Tinian and commissioned on 1 June 1992.** The prototype site on Faraulep was destroyed on 28 November 1991 by Super Typhoon Owen.*** Ujae site was destroyed on 18 November 1992 by Super Typhoon Gay.
ARC = Automated Remote Collection system (via GOES West)C-MAN = Coastal-Marine Automated Network (via GOES West or GMS)ARGOS = System ARGOS data collection (via NOAA’s TIROS-N)
3
JTWC to communicate tropical cyclone infor-mation to DOD installations. The DSN tele-phone numbers for JTWC are 344-4224 or 344-5~40.
1.3.4 NAVAL ENVIRONMENTAL DATANETWORK (NEDN) — The NEDN is the pri-mary link to FNOC to obtain computer-generat-ed analyses and prognoses. It is also a backupcommunications line for requesting and receiv-ing the objective tropical cyclone forecast aidsfrom FNOC’S mainframe computers. TheNEDN allows JTWC to communicate directlyto the other Naval Oceanography CommandCenters around the world.
1.3.5 PUBLIC DATA NETWORK (PDN) —A commercial packet switching network thatprovides low-speed interactive transmission tousers of FNOC products. The PDN is now theprimary method for JTWC to request andreceive FNOC-produced objective tropicalcyclone forecast aids. The PDN allows directaccess of FNOC products via the AutomatedTropical Cyclone Forecast (ATCF) system. ThePDN also serves as an alternate method ofobtaining FNOC analyses and forecast fields.TYMNET is the contractor providing PDN ser-vices between FNOC and JTWC.
1.3.6 DEFENSE DATA NETWORK (DDN)— The DDN is a DOD computer communica-tions network utilized to exchange data files.Because the DDN has links, or gateways, tonon-military information networks, it is fre-quently used to exchange data with the researchcommunity. JTWC’S internet address is26.19.0.250 and its E-Mail account [email protected]. roil, The Det 1, 633d 0SSaddress is [email protected]. roil.
1.3.7 TELEPHONE FACSIMILE — TELE-FAX provides the capability to rapidly scan andtransmit, or receive, documents over commer-
cial telephone lines or DSN. TELEFAX is used
to disseminate tropical cyclone advisories andwarnings to key agencies on Guam and, in spe-cial situations, to DOD, other U.S. Governmentagencies, and the other Micronesia Islands.Inbound documents for JTWC are received at(671) 344-4032 or (671) 344-6143.
1.3.8 NAVAL ENVIRONMENTAL SATEL-LITE NETWORK (NESN) — The NESN’Sprimary function is to pass satellite data fromthe satellite global data base at FNOC to region-ai centers. Similarly, it can pass satellite datafrom NOCC/JTWC to FNOC or other regionalcenters. The NESNs carrier circuit serves as abackup to the NEDN.
1.3.9 AIRFIELD FIXED TELECOMMUNI-CATIONS NETWORK (AITN) — AFTN wasinstalled at JTWC in January 1990. Though itis primarily for the exchange of aviation infor-mation, weather information and warnings arealso distributed via this network. It also pro-vides point-to-point communication with otherwarning agencies not connected to the AWN orGTS. JTWC’S AFTN identifier isPGUMYMYT.
1.3.10 LOCAL USER TERMINAL (LUT) —JTWC uses a LUT, provided by the NavalOceanographic Office, as the primary means ofreceiving real-time data from drifting meteoro-logical buoys and ARGOS-equipped AMOS viathe polar orbiting NOAA TIROS-N satellites.
1.3.11 COMPUTER FACSIMILE — TheNOCC/JTWC Rapid Response Team (RRT)uses a microcomputer to automatically transmitfacsimile messages to agencies on Guam andthe Northern Marianas when a typhoon threat-ens the Mariana Islands. The RRT can bereached at (671) 344-7116 or (67 1) 344-7119.
1.3.12 TELEX — NOCC/JTWC’s address forinbound TELEX messages is 197873NOCC
GU.4

1.4 DATA DISPLAYS
1.4.1 NAVAL ENVIRONMENTAL DISPLAYSTATION (NEDS) — The NEDS receives,processes, stores, displays and prints copies ofFNOC environmental products. It drives thefleet facsimile broadcast and can also be used togenerate the requests for objective tropicalcyclone forecast techniques.
1.4.2 AUTOMATED TROPICAL CYCLONEFORECAST SYSTEM (ATCF) — The ATCFis a software program that assists the TyphoonDuty Officer (TDO) in the preparation, format-ting, and dissemination of tropical cyclonealerts and warnings. It cuts message prepara-tion time and reduces the number of correctionsto JTWC’S alerts and warnings. The ATCFautomatically displays: the working and objec-tive best tracks, forecasts of track, intensity, andwind distribution; information from computergenerated forecast aids and products from otheragencies; and computes the myriad statisticscalculated by JTWC. Links have been estab-lished through a Local Area Network (LAN) tothe NOCC Operations watch team to facilitatethe generation of tropical cyclone warninggraphics for the fleet facsimile broadcasts, forNOCC’S local metwatch program and warningproducts for Micronesia. A module permitssatellite reconnaissance fixes to be input fromDet 1, 633d 0SS into the LAN. Several othermodules are still under development including:direct links to NTCC, the LUT, andAWNCOM/WINDS.
1.4.3 NAVAL SATELLITE DISPLAY SYS-TEM (NSDS) — The NSDS functions as a dis-play of FNOC-stored Defense MeteorologicalSatellite Program (DMSP) imagery and low res-olution geostationary imagery. It is the primarymeans for JTWC to directly observe areas ofcloudiness in the western Indian Ocean.
1.4.4 NAVAL SATELLITE DISPLAY SYS-TEM-GEOSTATIONARY (NSDS-G) — TheNSDS-G is NOCC’S primary geostationaryimagery processing and display system. It canbe used to process high resolution geostationaryimagery for tropical cyclone positions andintensity estimates for the western PacificOcean should the Meteorological Imagery, DataDisplay, and Analysis System (MIDDAS) fail.
1.5 ANALYSES
The JTWC Typhoon Duty Officer (TDO)routinely performs manual streamline analysesof composite surface/gradient-level (3000 ft(914 m)) and upper-tropospheric (centered onthe 200-mb level) data for 00002 and 12002each day. Manual sea-level pressure analysesconcentrating on the mid-latitudes are availablefrom the NOCC Operations watch team.Computer analyses of the surface, 925-, 850-,700-, 500-, 400-, and 200-mb levels, deep-layer-mean winds, frontal boundaries depiction,1000-200 mb/400-200 rob/and 700-400 mbwind shear, 500 mb and 700 mb 24-hour heightchange, and a variety of other meteorologicaldisplays are available from the 00002 and12002 FNOC data bases. Additional sectionalcharts at intermediate synoptic times and auxil-iary charts, such as station-time plot diagrams,time-height cross section charts and pressure-change charts, are analyzed during periods ofsignificant tropical cyclone activity.
1.6 FORECAST PROCEDURES
1.6.1 INITIAL POSITIONING — The warn-ing position is the best estimate of the center ofthe surface circulation at synoptic time. It isestimated from an analysis of all fm informationreceived from one hour before to one and one-half hours after that synoptic time. The analysisis aided by a computer-generated objective besttrack scheme that weights fix information basedon its statistical accuracy. The T’DO includes
5
synoptic observations and other information toadjust the position, testing consistency with thepast direction, speed of movement and the influ-em e of the different scales of motions. If thefix data are not available due to reconnaissanceplatform malfunction or communication prob-lems, or are considered unrepresentative, synop-tic data and/or extrapolation from previous fixesare used.
1.6.2 TRACK FORECASTING — In prepar-ing the JTWC official forecast, the TDO evalu-ates a wide variety of information, and employsa number of objective and subjective tech-niques. Because tropical cyclone track forecast-ing has and continues to require a significantamount of subjective input from the TDO,detailed aspects of the forecast-developmentprocess will vary somewhat from TDO to TDO,particularly with respect to the weight given toany of the available guidance. JTWC uses astandardized, three-phase tropical cyclonemotion forecasting process to improve not onlytrack forecast accuracy, but also intensity fore-cast accuracy and forecast-to-forecast consisten-Cy.
1.6.2.1 Field Analysis Phase — NavyOperational Global Atmospheric PredictionSystem (NOGAPS) analyses and prognoses atvarious levels are evaluated for position, devel-opment, and movement of not only the tropicalcyclone, but also relevant synoptic features suchas: 1) subtropical ridge circulations, 2) mid-lati-tude short/long-wave troughs and associatedweaknesses in the subtropical ridge, 3) monsoonsurges, 4) influences of cyclonic cells in theTropical Upper Tropospheric Trough (TUTT),5) other tropical cyclones, and 6) the distribu-tion of sea surface temperature. This processpermits the TDO to develop an initial impres-sion of the environmental steering influences towhich the tropical cyclone is and will be sub-jected to as depicted by NOGAPS. TheNOGAPS analyses are then compared to the
hand-plotted and analyzed charts prepared bythe TDO and to the latest satellite imagery inorder to determine how well the NOGAPS ini-tialization process has conformed to the avail-able synoptic data, and how well the resultantanalysis fields agree with the synoptic situationinferred from the imagery. Finally, the TDOcompares both the computer and hand-analyzedcharts to monthly climatology in order to makea preliminary determination as to what degreethe tropical cyclone is and will continue to be(according to NOGAPS) subjected to a climato-Iogical or nonclimatological synoptic environ-ment. Noting latitudinal and longitudinal dis-placements of subtropical ridge and long-wavemid-latitude features is of particular importance,and will partially determine the relative weightsgiven to climatologically- or dynamically-basedobjective forecast guidance.
1.6.2.2 Objective Techniques Analysis Phase— After displaying the latest set of forecastsgiven by JTWC’S suite of objective techniques,the TDO then evaluates the pattern produced bythe set of forecasts according to the followingprinciples. First, the degree to which the cur-rent situation is considered to be and will con-tinue to be climatological is further refined bycomparing the forecasts of the climatology-based objective techniques, dynamically-basedtechniques, and past motion of the presentstorm. This assessment partially determines therelative weighting given the different classes ofobjective techniques. Second, the spread of thepattern determined by the set of objective fore-casts is used to provide a measure of the pre-dictability of subsequent motion, and the advis-ability of including a low or moderate probabili-ty alternate forecast scenario in the prognosticreasoning message or warning (outside thewestern North Pacific). The spread of the objec-tive techniques pattern is typically small well-before or well-after recurvature (providing highforecast confidence) and large near the decision-point of recurvature or non-recurvature, or dur-
6

ing a quasi-stationary or erratic movementphase (increasing the likelihood of alternate sce-narios).
1.6.2.3 Construct Forecast Phase — The TDOthen constructs the JTWC official forecast giv-ing due consideration to the: 1) extent to whichthe synoptic situation is, and is expected toremain, climatological, 2) past statistical perfor-mance of the various objective techniques onthe current storm, and 3) known properties ofindividual objective techniques given the pre-sent synoptic situation or geographic location.The following guidance for weighting theobjective techniques is applied:
a) Weight persistence strongly in the first 12to 24 hours of the forecast period.
b) Give significant weight to the last JTWCforecast at all forecast times, unless there is sig-nificant evidence to warrant a departure. (Alsoconsider the latest forecasts from regional warn-ing centers, if applicable.)
c) Give more weight to the techniques thathave been performing well on the current tropi-cal cyclone and/or are expected to perform wellin the current and expected synoptic situation.
d) Stay within the “envelope” determined bythe spread of objective techniques forecastsunless there is a specific reason for not doing so(e.g., all objective forecasts start out at a signifi-cant angle relative to past motion of the currenttropical cyclone).
1.6.3 INTENSITY FORECASTING — Theempirically derived Dvorak (1984) technique isused as a Ilrst guess for the intensity forecast.The TDO then adjusts the forecast after evaluat-ing climatology y and the synoptic situation. Aninteractive conditional climatology schemeallows the TDO to define a situation similar tothe system being forecast in terms of location,time of year, current intensity, and intensitytrend. Synoptic influences such as the locationof major troughs and ridges, and the positionand intensity of the TI.YIT all play a large part
in intensifying or weakening a tropical cyclone.JTWC incorporates a checklist into the intensityforecast procedure. Such criteria as upper-leveloutflow patterns, neutral points, sea-surfacetemperatures, enhanced monsoonal or cross-equatorial flow, and vertical wind shear areevaluated for their tendency to enhance orinhibit normal development, and are incorporat-ed into the intensity forecast process throughlocally developed thumb rules. In addition toclimatology and synoptic influences, the firstguess is modified for interactions with land,with other tropical cyclones; and with extratrop-ical features. Climatological and statisticalmethods are also used to assess the potential forrapid intensification (Mundell, 1990).
1.6.4 WIND-RADII FORECASTING — Sincethe loss of dedicated aircraft reconnaissance in1987, JTWC has turned to other data sources fordetermining the radii of winds around tropicalcyclones. The determination of wind radii fore-casts is a three-step process:
(a) First, low-level satellite drift winds,microwave imager 35 kt wind speed analysis(See Chapter 2), and synoptic data are used toderive the current wind distribution.
(b) Next the fiist guess of the radii is deter-mined from statistically-derived empirical windradii models. JTWC currently uses three mod-els: the Tsui model, the Huntley model, and theMartin-Holland model. The latter model usessatellite-derived parameters to determine thesize and shape of the wind profile associatedwith a particular tropical cyclone. The Martin-Holland model also incorporates latitude andspeed of motion to produce an asymmetricalwind distribution. These models provide winddistribution analyses and forecasts that are pri-marily influenced by the intensity forecasts.The analyses are then adjusted based on theactual analysis from step (a), and the forecastsare adjusted appropriately.
(c) Finally, synoptic considerations, such asthe interaction of the cyclone with mid-latitude
7
pressure cells, are used to fine-tune the forecastwind radii.
1.6.5 EXTRATROPICAL TRANSITION —When a tropical cyclone moves into the mid-lat-itudes, if often enters an environment that is
detrimental to the maintenance of the tropicalcyclone’s structure and energy-producing mech-anisms. The effects of cooler sea surface tem-peratures, cooler and dryer environmental air,and strong vertical wind shear all act to convertthe tropical cyclone into an extratropicalcyclone. JTWC indicates that this conversionprocess is occurring by stating that the tropicalcyclone is “becoming extratropical.” JTWCwill indicate that the conversion is expected tobe complete by stating that the system has“become extratropical. ” When a tropicalcycione is forecast to become extratropical,JTWC coordinates the transfer of responsibilitywith the appropriate regional NavalOceanography Command Center, whichassumes warning responsibilities for the extra-tropical system.
1.6.6 TRANSFER OF WARNING RESPONSI-BILITIES — JTWC coordinates the transfer ofwarning responsibility for tropical cyclonesentering or exiting its AOR. For tropicalcyclones crossing 180° east longitude in theNorth Pacific Ocean, JTWC coordinates withthe Central Pacific Hurricane Center (CPHC),Honolulu via the Naval Western OceanographyCenter (NWOC), Pearl Harbor, Hawaii. Fortropical cyclones crossing 180° east longitude inthe South Pacific Ocean, JTWC coordinateswith the NWOC, which has responsibility forthe Southeastern Pacific.
Whenever a tropical cyclone threatensGuam, files are electronically transfemed fromJTWC to the Alternate Joint Typhoon WarningCenter (AJTWC) collocated with NWOC. Inthe event that JTWC should become incapaci-tated, the AJTWC assumes JTWC’S functions.Assistance in determining satellite reconnais-
sance requirements, and in obtaining the resul-tant data, is provided by the weather unit sup-porting the 15th Air Base Wing, Hickam AFB,Hawaii.
1.7 WARNINGS
JTWC issues two types of warnings:Tropical Cyclone Warnings and TropicalDepression Warnings.
1.7.1 TROPICAL CYCLONE WARNINGS -These are issued when a closed circulation isevident and maximum sustained winds are fore-cast to reach 34 kt (18 m/see) within 48 hours,or when the tropical cyclone is in such a posi-tion that life or property may be endangeredwithin 72 hours.
Each Tropical Cyclone Warning is num-bered sequentially and includes the followinginformation: the current position of the surfacecenter; an estimate of the position accuracy andthe supporting reconnaissance (fix) platform(s);the direction and speed of movement during thepast six hours (past 12 hours in the SouthernHemisphere); and the intensity and radial extentof over 35-, 50-, and 100-kt (18-, 26-, and 51rn/see) surface winds, when applicable. At fore-cast intervals of 12, 24, 36, 48, and 72 hours(12, 24, and 48 hours in the SouthernHemisphere), information on the tropicalcyclone’s anticipated position, intensity andwind radii is provided. Vectors indicating themean direction and mean speed between fore-cast positions are included in all warnings. Inaddition, a 3-hour extrapolated position is pro-vided in the remarks section.
Warnings in the western North Pacific andNorth Indian Oceans are issued every six hours(unless an amendment is required) valid at stan-dard synoptic times: 0000Z, 06002, 1200Z and18002 (every 12 hours: 00002, 1200Z or
06002, 1800Z in the Southern Hemisphere).All warnings are released to the communica-tions network no earlier than synoptic time and
8
no later than synoptic time plus two and one-half hours, so that recipients are assured of hav-ing all warnings in hand by synoptic time plusthree hours (0300Z, 09002, 1500Z and 21 OOZ).By area, the warning bulletin headers are:WTI031-35 PGTW for northern latitudes from35° to 100° east longitude, WTPN31-36 PGTWfor northern latitudes from 100° to 180° eastlongitude, WTXS31-36 PGTW for southern lat-itudes from 35° to 135° east longitude, andWTPS31-35 PGTW for southern latitudes from135° to 180° east longitude.
1.7.2 TROPICAL DEPRESSION WARNINGS— These are issued only for western NorthPacific tropical depressions that are not expect-ed to reach the criteria for Tropical CycloneWarnings, as mentioned above. The depressionwarning contains the same information as aTropical Cyclone Warning except that theTropical Depression Warning is issued every 12hours (unless an amendment is required) at stan-dard synoptic times and extends in 12-hourincrements only through 36 hours.
Both Tropical Cyclone and TropicalDepression Warning forecast positions are laterverified against the corresponding best trackpositions (obtained during detailed post-stormanalyses) to determine the most probable pathand intensity of the cyclone. A summary of theverification results for 1992 is presented inChapter 5, Summary of Forecast Verification.
1.8 PROGNOSTIC REASONINGMESSAGES
These plain language messages providemeteorologists with the rationale for the JTWCforecasts for tropical cyclones in the westernNorth Pacific Ocean. They also discuss alter-nate forecast scenarios, if changing conditionsindicate such potential. Prognostic reasoningmessages (WDPN3 1-36 PGTW) are prepared tocomplement tropical cyclone (but not tropicaldepression) warnings. In addition to these mes-
sages, prognostic reasoning information is pro-vided in the remarks section of all types ofwarnings when significant forecast changes aremade or when deemed appropriate by the TDO.
1.9 TROPICAL CYCLONE FORMATIONALERTS
Tropical Cyclone Formation Alerts areissued whenever interpretation of satelliteimagery and other meteorological data indicatesthat the formation of a significant tropicalcyclone is likely. These alerts will specify avalid period, usually not exceeding 24 hours,and must either be canceled, reissued, or super-seded by a warning prior to expiration. By area,the Alert bulletin headers are: WTI02 1-25PGTW for northern latitudes from 35° to 100°east longitude, WTPN2 1-26 PGTW for northernlatitudes from 100° to 180° east longitude,WTXS21 -26 PGTW for southern latitudes from35° to 135° east longitude, and WTPS21-25PGTW for southern latitudes from 135° to 180°east longitude.
1.10 SIGNIFICANT TROPICALWEATHER ADVISORIES
This product contains a description of alltropical disturbances in JTWC’S AOR and theirpotential for further (tropical cyclone) develop-ment. In addition, all tropical cyclones in warn-ing status are briefly discussed and referenced.
Two separate messages are issued daily, andeach is valid for a 24-hour period. TheSignificant Tropical Weather Advisory for theWestern Pacific Ocean is issued by 06002. The
Significant Tropical Weather Advisory for theIndian Ocean is issued by 18002. These arereissued whenever the situation warrants. Foreach suspect area, the words “poor”, “fair”, or“good” are used to describe the potential fordevelopment. “Poor” will be used to describe a
tropical disturbance in which the meteorologicalconditions are currently unfavorable for
9

development. “Fair” will be used to describe atropical disturbance in which the meteorologicalconditions are favorable for development, butsignificant development has not commenced oris not expected to occur in the next 24 hours.
“Good” will be used to describe the potentialfor development of a disturbance covered by anAlert. By area, the advisory bulletin headersare: ABPW 10 PGTW for northern latitudesfrom 100° to 180° east longitude and southernlatitudes from 135° to 180° east longitude andABIO1O PGTW for northern latitudes from 35°to 100° east longitude and southern latitudesfrom 35° to 135° east longitude.
10
2. RECONNAISSANCE AND FIXES
2.1 GENERAL
JTWC depends primarily on two reconnais-sance platforms, satellite and radar, to providenecessary, accurate, and timely meteorologicalinformation in support of advisories, alerts andwarnings. In data-rich areas, synoptic data arealso used to supplement the above. As in pastyears, the optimal use of all available reconnais-sance resources to support JTWC’S productsremains ,a primary concern. Weighing the spe-cific capabilities and limitations of each recon-naissance platform, and the tropical cyclone’sthreat to life and property both afloat andashore, continue to be important factors in care-ful product preparation.
2.2 RECONNAISSANCE AVAILABILITY
2.2.1 SATELLITE — Fixes from AirForce/Navy ground sites and Navy ships supplyday and night coverage in JTWC’S AOR.Interpretation of this satellite imagery yieldstropical cyclone positions, and estimates of cur-rent and forecast intensities using the Dvoraktechnique. The Special SensorMicrowave/Imager (S SM/1) data are used to
determine the extent of the 35-kt (18-m/see)winds near the tropical cyclone and to aid intropical cyclone positioning, especially whenthe center is obscured by clouds.
2.2.2 IV4DAR — Interpretation of land-basedradar, which remotely senses and maps precipi-tation within tropical cyclones, provides posi-tions in the proximity (usually within 175 nm(325 km) of radar sites in the Philippine Islands,Taiwan, Hong Kong, China, Japan, SouthKorea, Kwajalein, Guam, Thailand, Australia,and India.
2.2.3 AIRCRAFI’ - Four tropical cyclone fixes
11
were received from the weather reconnaissanceaircraft associated with the TCM-92 mini-fieldexperiment conducted at JTWC from 21 July to20 August 1992.
2.2.4 SYNOPTIC — JTWC also determinestropical cyclone positions based on the analysisof surface/gradient-level synoptic data. Thesepositions are an important supplement to fixesprovided by remote sensing platforms, andbecome invaluable in situations where neithersatellite nor radar fixes are available or repre-sentative.
2.3 SATELLITE RECONNAISSANCESUMMARY
The Air Force provides satellite reconnais-sance support to JTWC through the DMSPTropical Cyclone Reporting Network (DMSPNetwork), which consists of tactical sites and acentralized facility. The personnel of Det 1,6330SS (hereafter referred to as Det 1), collocatedwith JTWC at Nimitz Hill, Guam, coordinaterequired tropical cyclone reconnaissance sup-port with the following units:
15ABW/WE,HickamAFB, Hawaii18OSS/WE,KadenaAB, Japan603 ACCS/WE,Osan AB, Republicof KoreaAir ForceGlobalWeatherCentral,
OffuttAFB, Nebraska
The tactical sites provide a combined cover-age from polar orbiting satellites that includesmost of the western North Pacific, from near theinternational date line westward to SoutheastAsia. The Naval Oceanography CommandDetachment, Diego Garcia, furnishes interpreta-tion of low resolution NOAA polar orbitingsatellite coverage in the central Indian Ocean,and Navy ships equipped for direct satellitereadout contribute supplementary support.
Also, civilian contractors with the U.S. Army atKwajalein Atoll provide satellite fixes on tropi-cal cyclones in the Marshall Islands that supple-ment Det 1‘s satellite coverage.
Additionally, DMSP low resolution satellitemosaics are available from the FNOC via theNEDN and NESN lines. These mosaics are usedto metwatch the areas not included in the areacovered by the DMSP tactical sites. They pro-vide JTWC forecasters with the capability to“see” what AFGWC’S satellite image analystshave been fixing, after the fact.
In addition to polar orbiter imagery, Det 1uses high resolution geostationary imagery tosupport the reconnaissance mission. Animationof these geostationary images is invaluable fordetermining the location of cloud system cen-ters and their motion, particularly in the format-ive stages. Animation is also valuable inassessing environmental, or ambient, changesaffecting tropical cyclone behavior. Det 1 isable to receive and process high resolution digi-tal geostationary data through itsMeteorological Imagery, Data Display andAnalysis System (MIDDAS), and through theNavy’s Geostationary Satellite ReceivingSystem (GSRS). Det 1 can process imagery ona daily basis from at least four polar orbitingand one geostationary spacecraft.
AFGWC is the centralized member of theDMSP network. In support of JTWC, AFGWCprocesses stored imagery from DMSP andNOAA spacecraft. Imagery is recorded by thevarious spacecraft as they orbit the earth, and islater relayed to AFGWC by a network of com-munication satellites and command readoutsites. This enables AFGWC to obtain therecorded coverage necessary to fix all tropicalcyclones within JTWC’S AOR.
The hub of the DMSP network is Det 1.Based on available satellite coverage, Det 1 isresponsible for coordinating satellite reconnais-sance requirements with JTWC and tasking theindividual network sites for the necessary tropi-cal cyclone fixes, current intensity estimates,
and SSM/I surface wind information. When aparticular satellite pass is selected to support thedevelopment of JTWC’S next tropical cyclonewarning, two sites are tasked to fix the tropicalcyclone from the same pass. This “dual-site”concept provides the necessary redundancy thatvirtually guarantees JTWC a satellite ilx to sup-port each warning. It also supplies independentassessments of the same data to provide JTWCforecasters a measure of confidence in the loca-tion and intensity information.
The network provides JTWC with severalproducts and services. The main service is tomonitor the AOR for indications of tropicalcyclone development. If development is sus-pected, JTWC is notified. Once JTWC issueseither a Tropical Cyclone Formation Alert or awarning, the network provides tropical cyclonepositions and current intensity estimates, with aforecast intensity estimate implied in the inten-sity estimation code. Each satellite-derived
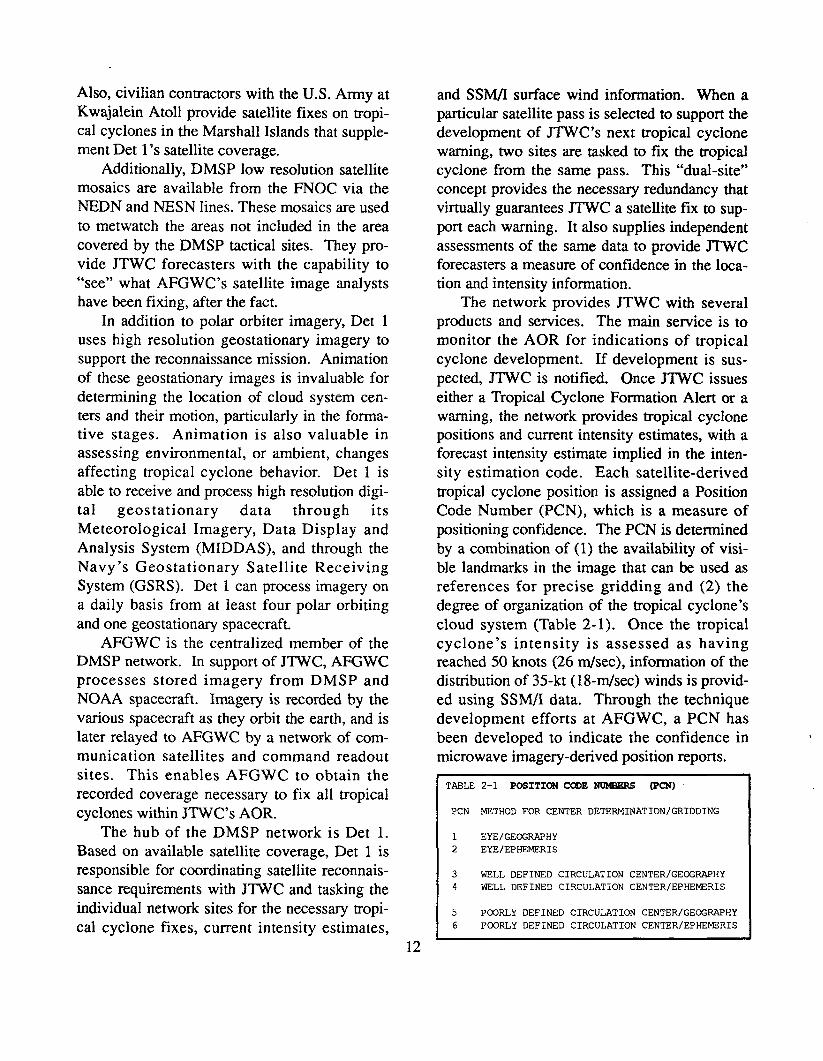
tropical cyclone position is assigned a PositionCode Number (PCN), which is a measure ofpositioning confidence. The PCN is determinedby a combination of (1) the availability of visi-ble landmarks in the image that can be used asreferences for precise gridding and (2) thedegree of organization of the tropical cyclone’scloud system (Table 2-1 ). Once the tropicalcyclone’s intensity is assessed as havingreached 50 knots (26 m/see), information of thedistribution of 35-kt (18-m/see) winds is provid-ed using SSM/I data. Through the techniquedevelopment efforts at AFGWC, a PCN hasbeen developed to indicate the confidence in ‘microwave imagery-derived position reports.
TABLE 2-1 POSITICRJCODENm4PERS (PCN)
PCN METHOD FOR CENTER DETERMINATION/GRIDDING
1 EYE/GEC@QPHY2 EYE/EPHEMi2RIS
3 WELL DEFINED CIRCULATIONCENTER/GECGRAPHY4 WELL DEFINED CIRCULATIONCENTER/EPHEMERIS
5 POORLY DEFINED CIRCULATIONCENTER/GECGRAPHY6 POORLY DEFINED CIRCULATIONCENTER/EPHEMERIS
1A
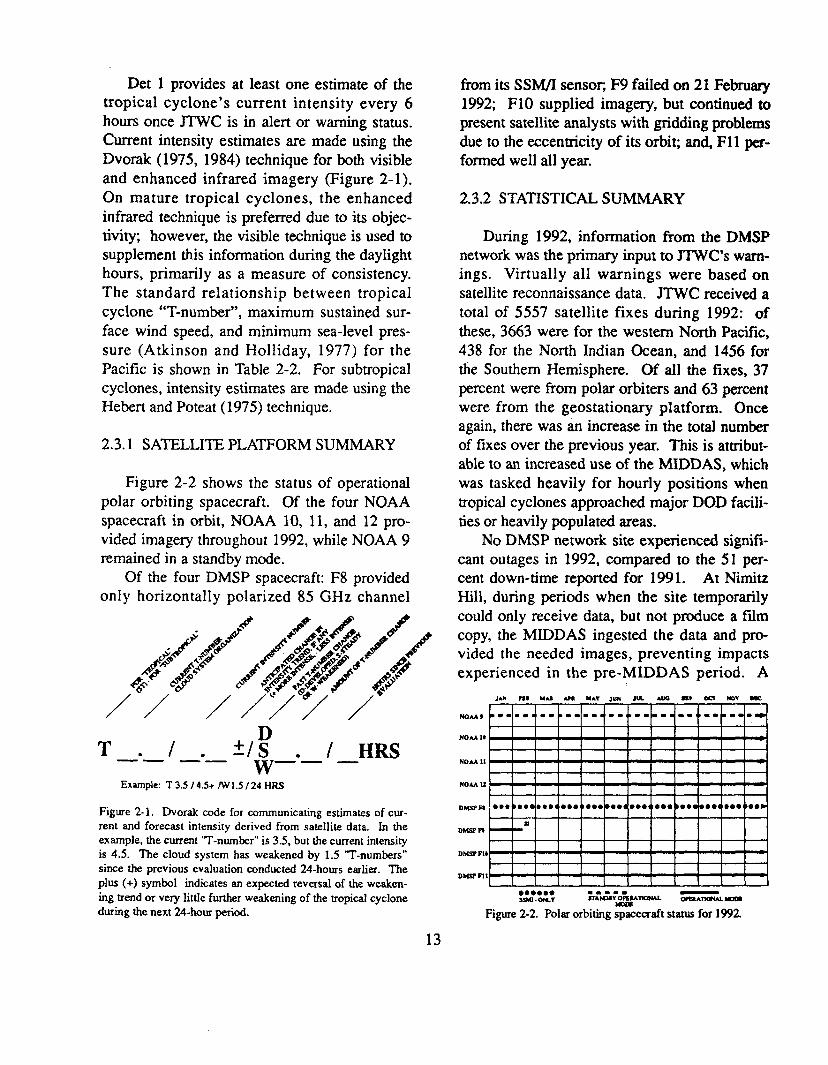
Det 1 provides at least one estimate of thetropical cyclone’s current intensity every 6hours once JTWC is in alert or warning status.Current intensity estimates are made using theDvorak (1975, 1984) technique for both visibleand enhanced infrared imagery (Figure 2-1 ).On mature tropical cyclones, the enhancedinbred technique is preferred due to its objec-tivity; however, the visible technique is used tosupplement this information during the daylighthours, primarily as a measure of consistency.The standard relationship between tropical
cyclone “T-number”, maximum sustained sur-face wind speed, and minimum sea-level pres-sure (Atkinson and Holliday, 1977) for thePacific is shown in Table 2-2. For subtropicalcyclones, intensity estimates are made using theHebert and Poteat (1975) technique.
2.3.1 SATELLITE PLATFORM SUMMARY
Figure 2-2 shows the status of operationalpolar orbiting spacecraft. Of the four NOAAspacecraft in orbit, NOAA 10, 11, and 12 pro-vided imagery throughout 1992, while NOAA 9remained in a standby mode.
Of the four DMSP spacecraft: F8 providedonly horizontally polarized 85 GHz channel
DT_. / . m_. / HRS
w——Example: T 3.5 I Ii.5+/W1.5 / 24 HRS
Figure 2-1. Dvorak code for communicating estimates of cur-rent and forecast intensity derived from satellite data. In theexample, the current ‘T-number’O is 3.5, but tie current in[ensityis 4.5. The cloud system has weakened by 1.5 “T-numbers’”since the previous evaluation conducted 24-hours earlier. Theplus (+) symbol indicates an expected reversal of the weaken-ing trend or very little further weakening of the tropical cycloneduring the next 24-hour period.
from its SSM/I sensor F9 failed on 21 Februaxy1992; F1O supplied imagery, but continued topresent satellite analysts with grickling problemsdue to the eccentricity of its orbi~ and, Fll per-formed well all year.
2.3.2 STATISTICAL SUMMARY
During 1992, information from the DMSPnetwork was the primary input to 3TWC’S warn-ings. Virtually all warnings were based onsatellite reconnaissance data. JTwC received atotal of 5557 satellite fixes during 1992: ofthese, 3663 were for the western North Pacific,438 for the North Indian Ocean, and 1456 forthe Southern Hemisphere. Of all the fixes, 37percent were from polar orbiters and 63 percentwere from the geostationary platform. Onceagain, there was an increase in the total numberof fixes over the previous year. This is atrnbut-able to an increased use of the MIDDAS, whichwas tasked heavily for hourly positions whentropical cyclones approached major DOD facili-ties or heavily populated areas.
No DMSP network site experienced signifi-cant outages in 1992, compared to the 51 per-cent down-time reported for 1991. At NimitzHill, during periods when the site temporarilycould only receive data, but not produce a fdmcopy, the MIDDAS ingested the data and pro-vided the needed images, preventing impactsexperienced in the pre-MIDDAS period. A
JMMSMUUUMA1]UN lu*=?*mvMWM9 =-- -- -- ● -- --= --, ● -- -- --* b-- -- --
NOM lb I 1●
NOAA 11 kI 1 I
m
NOM u\
●
DMSP m ● ** b@** ● **4 ,Ooe, I*O* ●**4 ● **t tee. DO*W *@e4 ●O* ● **
aDMSP m
DM5PF18 L -
IDM.WFI1
II I I I I 7
● . . . . . .-.--$SM.ON.Y 8TN’QmOK#nOML -mmu. m
Figure 2-2. Polar orbiting spacecraft status for 1992
13

comparison of satellite fixes from all datasources with their corresponding best trackpositions is shown in Table 2-3.
2.3.3 APPLICATION OF NEWTECHNOLOGY
By early 1992, all tactical sites in the DMSPnetwork had received the Mission SensorTactical Imaging Computer (MISTIC) for pro-cessing the SSM/1, however, the AFGWCTropical Section continued to provide themajority of the SSM/I support to JTWC. Highresolution, 256 gray shade, SSM/I data becameavailable at AFGWC for interpretation viaAFGWC’S Satellite Data Handling System on 1March 1992. AFGWC, Det 1, and 18 OSS/WE(Kadena AB) provided bulletins to JTWCdescribing the distribution of 35-kt (18-m/see)winds near tropical cyclones. The MISTIC II,which is an expanded and upgraded version of
2.3.4 FUTURE OF SA~LLITERECONNAISSANCE
The MIDDAS, which was formally accept-ed for operational use by Det 1 on 1 April 1992,has proven invaluable for providing JTWC withtailored satellite support. Work on the develop-ment and application of more user-friendly,interactive software designed for the MIDDAScontinues. The Det 1 goal is to establish a fullyintegrated satellite system with interfaces to theAutomated Weather Distribution System(AWDS), NEXRAD, MIDDAS, MISTIC H,TESS 3, and the MARK IVB.
Plans and work have progressed on installa-tion of the MARK IVB at DMSP network sites.Projected completion dates for the Nimitz Hill,Hickam AFB, and Kadena AB sites will be in1994. Until the projected October 1993 instal-lation of AWDS, conventional weather data willcontinue to come through the Automated
the MISTIC system, was to be installed at the Weather Network (AWN).tactical network sites in early 1993. MISTIC IIis designed to supply co-registered OLS and fullresolution, 256 gray shade, SSM/I data.
TABLE 2-2 MiXIKIM SUSTAINID WIND SPEED (ICI!) AS A ~ION OFUVCRAK~ANDPOREXST~ITY ~AND I
KKNIMUMSEA-IJWEL PREssum (MsLP)
TROPICAL CYCLONE WIND M.SLP(MB)
NSITY N- [NW PACIFICL
0.0 25 --- -
0.5 25 --- -
1.0 25 —--
1.5 25 --- -
2.0 30 10002.5 35 9973.0 45 9913.5 55 9844.0 65 9764.5 77 9665.0 90 9545.5 102 9416.0 115 9276.5 127 9147.0 140 8987.5 155 8798.0 170 858
1A
2.4 RADAR RECONNAISSANCESUMMARY
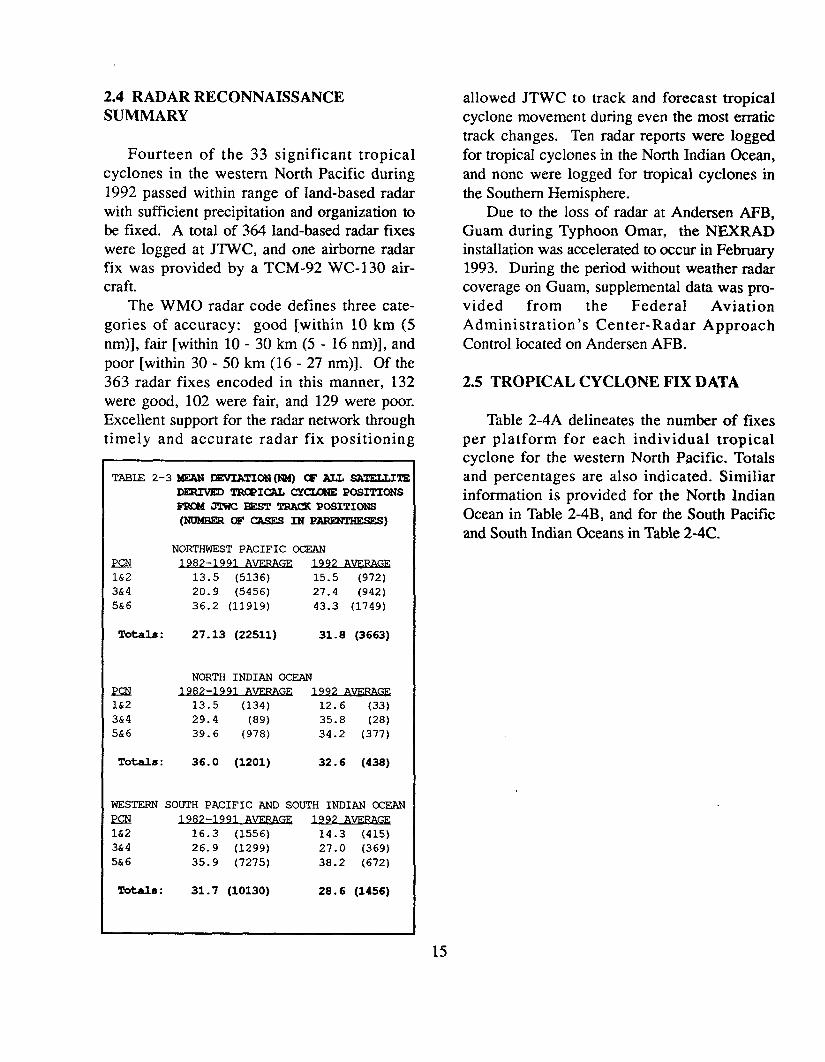
Fourteen of the 33 significant tropicalcyclones in the western North Pacific during1992 passed within range of Iand-based radarwith sufficient precipitation and organization tobe fixed. A total of 364 land-based radar fixeswere logged at JTWC, and one airborne radarfix was provided by a TCM-92 WC-130 air-craft.
The WMO radar code defines three cate-gories of accuracy: good [within 10 km (5rim)], fair [within 10-30 km (5 - 16 rim)], and
poor [within 30-50 km (16 -27 rim)]. Of the363 radar fixes encoded in this manner, 132were good, 102 were fair, and 129 were poor.Excellent support for the radar network throughtimely and accurate radar fix positioning
TABLE 2-3 WAN DEVIATION C&?ALL SATELLITE~ TRC#?ICAL CYCIK)N? POSITIONSET&X4J3WC = TRXX POSITIONS
(NuMEER oFcAsEs IN PARmmEsE s)
NORTHWEST PACIFIC OCEAN
w 1982-1991 AVERAGE 1992 AVF.RAGRl&2 13.5 (5136) 15.5 (972)3&4 20.9 (5456) 27.4 (942)5&6 36.2 (11919) 43.3 (1749)
Totals : 27.13 (22511) 31.8 (3663)
NORTH INDIAN OCEAN
m 1982-1991 A~.W@3l&2 13.5 (134) 12.6 (33)3&4 29.4 (89) 35.8 (28)5&6 39.6 (978) 34.2 (377)
Totals : 36.0 (1201) 32.6 (438)
h’ESTERN SOUTH PACIFIC AND SOUTH INDIAN CY2EAN
m 1982-1991 AWWKiE 1992 AVERAGEl&2 16.3 (1556) 14.3 (415)3&4 26.9 (1299) 27.0 (369)5&6 35.9 (7275) 38.2 (672)
Totals: 31.7 (10130) 28.6 (1456)
allowed JTWC to track and forecast tropicalcyclone movement during even the most erratictrack changes. Ten radar reports were logged
for tropical cyclones in the North Indian Ocean,and none were logged for tropical cyclones inthe Southern Hemisphere.
Due to the loss of radar at Andersen AFB,Guam during Typhoon Omar, the NEXRADinstallation was accelerated to occur in February1993. During the period without weather radarcoverage on Guam, supplemental data was pro-vided from the Federal AviationAdministration’s Center-Radar Approach
Control located on Andersen AFB.
2.5 TROPICAL CYCLONE FIX DATA
Table 2-4A delineates the number of fixesper platform for each individual tropicalcyclone for the western North Pacific. Totalsand percentages are also indicated. Similiarinformation is provided for the North IndianOcean in Table 2-4B, and for the South Pacificand South Indian Oceans in Table 2-4C.
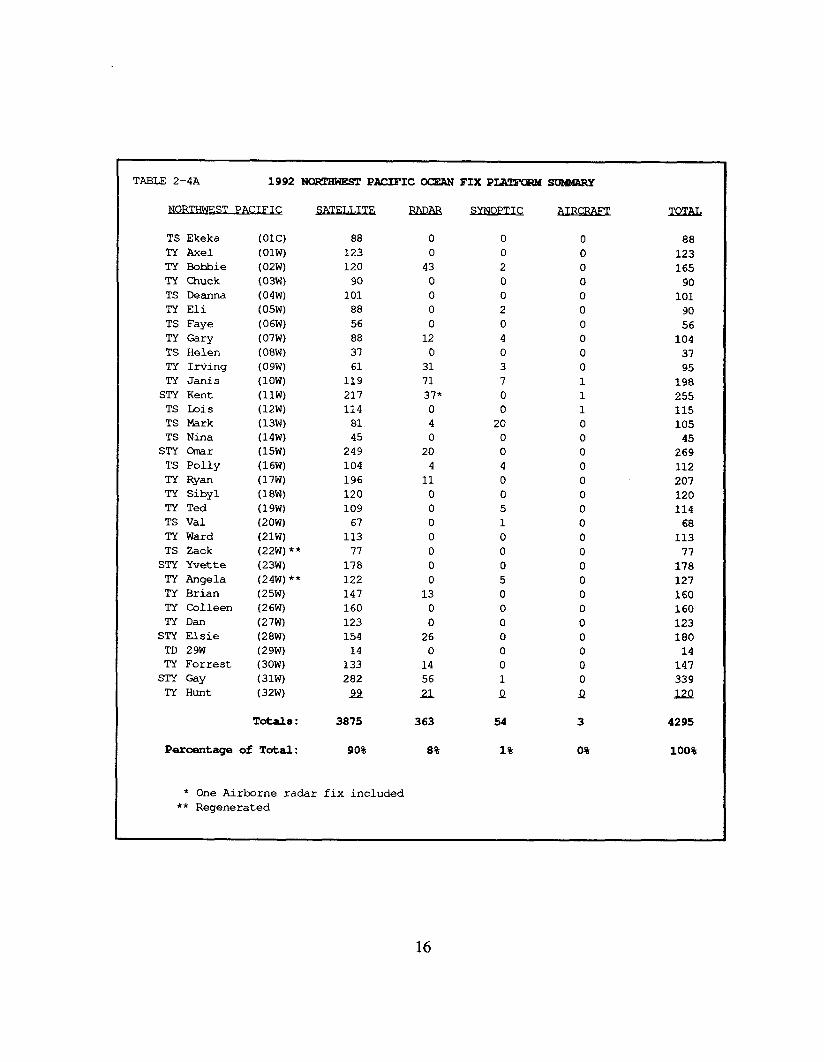
TABLE 2-4A 1992 NCMWWIMT PACIFIC 0L3iXN FIX PLATFCRM SUWARY
lJQi?TllVFSTPACIFIC
TS EkekaTY AxelTY BobbieTY ChuckTS DeannaTY EliTS Faye
TY Gary
TS HelenTY IrvingTY Janis
STY KentTS hisTS MarkTS Nina
STY Cm3r
TS Pony
TY Ryan
TY Sibyl
TY Ted
TS ValTY WardTS Zack
STY YvetteTY AngelaTY BrianTY ColleenTY Dan
STY ElsieTD 29WTY Forrest
STY GayTY Hunt
(Olc)
(Olw)
(02W)
(03W)
(04W)
(05W)
(06W)
(07W)
(08W)
(09W)
(low)
(llW)
(12W)
(13W)
(14W)
{15W)
(16W)
(17W)
(18W)
(19W)
(20W)
(21W)
(22W)‘*
(23W)
(24W)**
(25W)
(26W)
(27W)
(28W)
(29W)(30W)
(31W)
(32w)
Totals :
Percentage of Total:
88
123
120
90
101
88
56
88
37
61
119217
114
8145
249
104
196
120
109
67
113
77
178
122
147
160
123
154
14
133
282
S2$!
3875
90%
o
0
43
0
0
0
0
12
0
31
7137*
o
4
0
20
4
11
0
0
0
0
0
0
0
13
0
0
260
14
56
a
363
8%
o
0
2
0
0
2
0
4
0
3
7
0
0
200
0
4
0
0
5
1
0
0
0
5
0
0
0
0
0
0
1
Q
54
1%
o
0
0
0
0
0
0
0
0
0
1
1
100
0
0
0
0
0
0
0
0
0
0
0
0
0
0
0
0
0
Q
3
o%
88
123
165
90
101
90
56
104
3-I
95
198
255115
10545
269
112
207
120
11468
113
77
178
127
160
160
123
18014
147
339
lx!
4295
100%
* One Airborne radar fix included** Regenerated
16
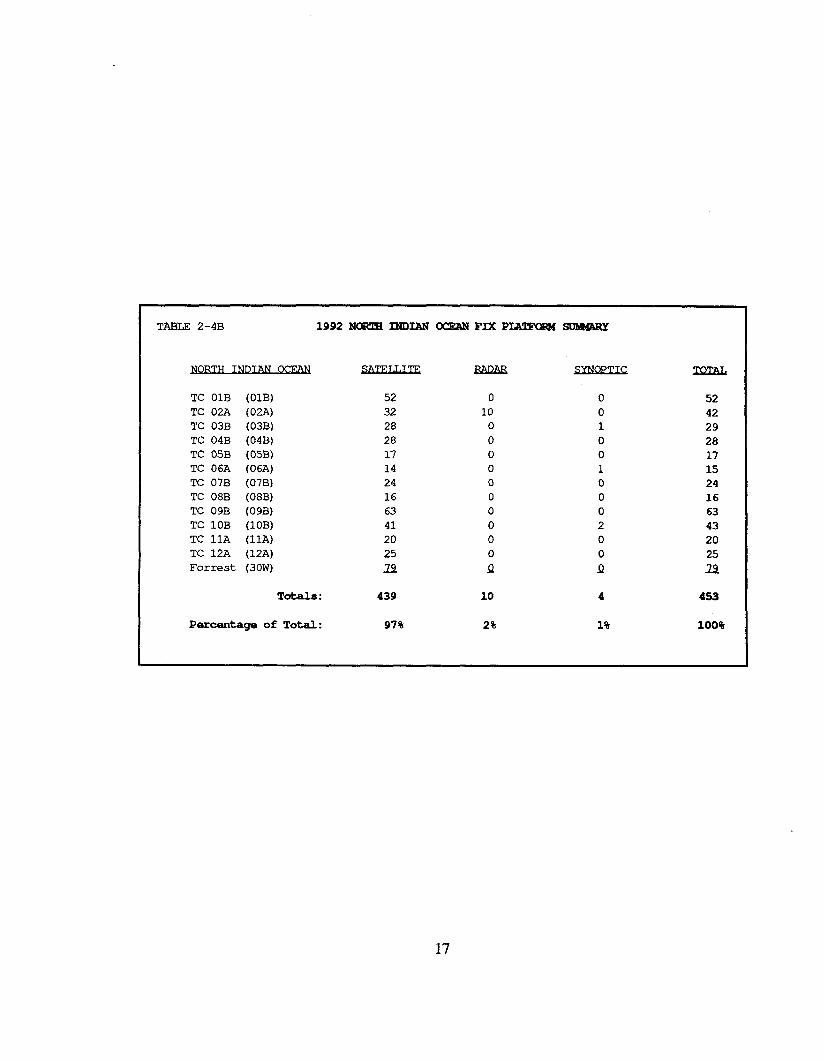
TABLE 2-4B 1992 ~ INDIAN ~ FIX PIXl?WiW ~
TC OIB (OIB)
TC 02A (02A)
TC 03B (03B)
TC 04B (04B)
TC 05B {05B)
TC 06A (06A)
TC 07B (07B)
TC 08B (08B)
TC 09B (09B)
TC 10B (1OB)
TC 11A (11A)
TC 12A (12A)
Forrest (30W)
Totals :
Percentage of Total:
523228281714241663412025
D
439
97%
o
10
0
0
0
0
0
0
0
0
0
0
Q
10
2%
o
0
10
0
10
0
0
2
0
0
Q
4
1%
524229281715241663432025
z!
4s3
100%
17
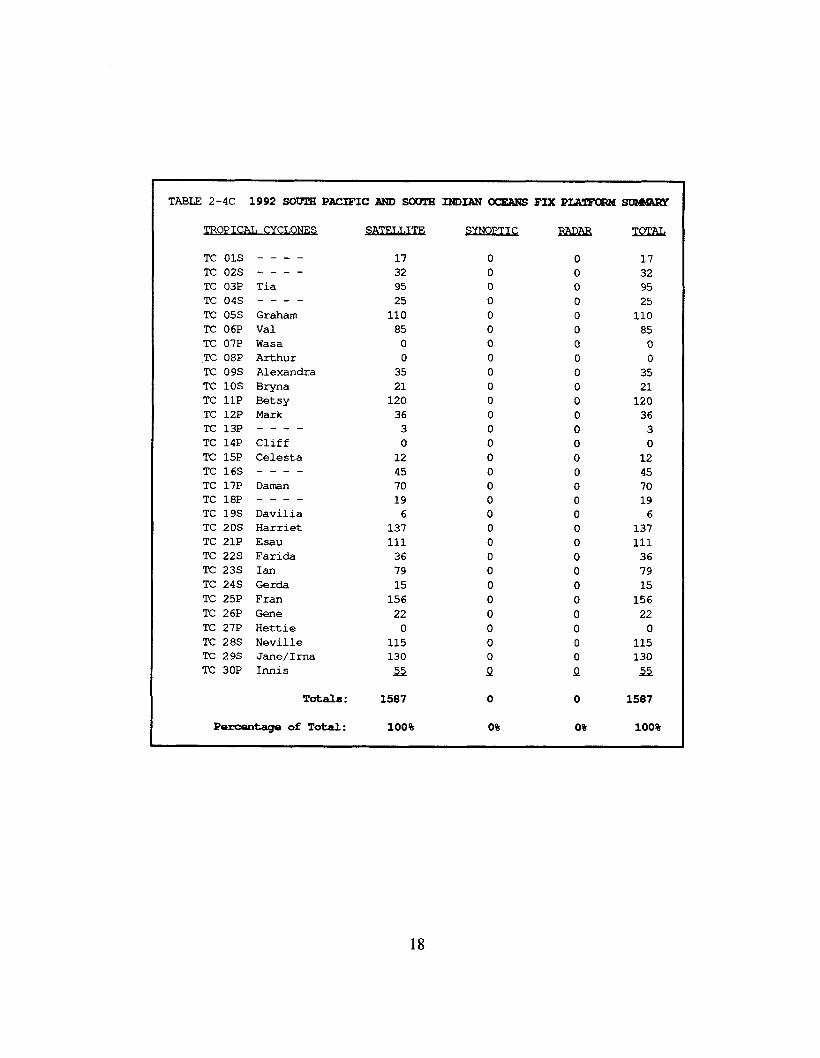
TABLE 2-4C 1992 SOUTH PACIFIC AND 80UTH ~IAN ~ FIX PLATFORM 8UlWhRY
TC 01S
TC 02S
TC 03P
TC 04S
TC 05S
TC 06P
TC 07P
.K 08P
TC O9S
TC 10S
TC 11P
TC 12P
TC 13P
TC 14P
Tc 15P
TC 16S
TC 17P
TC 18P
TC 19S
TC 20S
TC 21P
TC 22S
TC 23S
TC 24S
TC 25P
TC 26P
TC 27P
TC 28STC 29S
TC 30P
— —-——-.
Tia—-- -
Graham
Val
Wasa
Arthur
Alexandra
Bryna
Betsy
Mark--- -
Cliff
Celesta--— —
Damn—-- -
Davilia
Harriet
Esau
Farida
Ian
Gerda
Fran
Gene
Hett ie
NevilleJane/Irna
Innis
Totsls:
Percentage of Total:
17
32
95
25
110
85
0
0
35
21
120
36
3
0
12
4570
19
6
137
111
36
79
15
156
22
0
115130
xi
1587
100%
o00
00
0
0
0
0
00000
0
0
0
0
000
000
0
0
0
00Q
o
o%
o
00
0
0
00
0000
0
0
0
0
000000
0
0
0
0
0
0
0
0
Q
o
0%
17
3295
25
110
85
0
0
35
21
120
36
3
0
12
4570
196
137
11136
79
15
156
22
0
115130
x?
1587
100%
3. SUMMARY OF WESTERN NORTH PACIFIC ANDNORTH INDIAN OCEAN TROPICAL CYCLONES
3.1 GENERALFor the western North Pacific, 1992 was
another record-breaking year for the number ofwarnings issued — 941 (106 more than lastyear) on 33 tropical cyclones (Table 3-l). Thiswas two more tropical cyclones than the long-term annual mean of 31 (Table 3-2). As in theprevious two years, one additional significanttropical cyclone, Ekeka (01 C), moved westwardacross the central North Pacific into JTWC’Sarea of responsibility and was included in thetotals. A chronology of the tropical cycloneactivity is provided in Figure 3-1. Table 3-3includes: a climatology of typhoons, tropicalstorms and typhoons for the period from 1945to 1959 and 1960 to 1992; and a summary ofwarning days. JTWC was in warning status 159days during 1992 compared to 169 in 1991.Although there were less total warning days, anincrease in the number of multiple storm daysresulted in a greater total number of warnings— 941 compared to 835 the previous year. Ofthese warnings, 73 were issued by AJTWCwhen JTWC was incapacitated for 11 days afterthe destructive passage of Typhoon Omar overGuam. There were 75 warning days for two ormore tropical cyclones, 28 days with at leastthree, and 5 days with four tropical cyclonesoccurring simultaneously. Thirty-six initial
Tropical Cyclone Formation Alerts were issuedon western North Pacific tropical disturbances(Table 3-4). Except for one initial alert that didnot develop, alerts preceded warnings on all sig-nificant tropical cyclones in the western NorthPacific with the exception of Typhoon Gary(07W) and Tropical Storm Val (20W).
For the North Indian Ocean, it was anextremely active year with 13 tropical cycloneswhich is 7 more than the annual mean of five.Four of these occurred in the Arabian Sea andnine, including Forrest (30W), in the Bay ofBengal. These tropical cyclones required a totalof 190 warnings. and JTWC was in warning sta-tus 48 days during 1992 compared to nine in1991. Alerts preceded all warnings in the NorthIndian Ocean.
During the year, a total of 1131 warningswere issued for 45 tropical cyclones in theNorthern Hemisphere. When the North lndianOcean was included with the western NorthPacific in the total, there were 182 days withwarnings on one cyclone and 90 days with twoor more, 41 days with three or more and 9 dayswith four cyclones occurring at once. Therewere no days in the Northern Hemisphere whenwarnings were issued for five or more tropicalcyclones at once.
19
(OIW) TY AXEL(OIC) TS EKEKA(02W) TY BOBBIE(03W) TY CHUCK(04W) TS DEANNA(05W) TY ELI(06w) TS FAYE(07W) TY GARY(08W) TS HELEN(09W) TY IRVING(1OW) TY JANIS(llW) STY KENT(12W) TS LOIS(13W) TS MARK(14W) TS NINA(15W) sTY OMAR(16w) “TS POLLY(17W) TY RYAN(18w) TY SIBYL(19W) TY TED(20W) TS VAL(21W) TY WARD(22W) TS ZACK(23w) STY YVETTE(24W) TY ANGELA(25w) TY BRIAN(26w) TY COLLEEN(27w) TY DAN(28w) STY ELSIE(29w) TD 29w(30W) TS FORREST(31W) STY GAY(32w) TY HUNT
NUI$MEROFWARNINGS
OF05 JAN – 15 JAN 3805 FEB - 08 FSB 1923 JUN - 30 JUN 2725 JUN - 30 JUN 2226 JUN - 03 JUI 2409 JUN - 14 JUN 1816 JUL - 18 JUL 1119 JUL – 23 JUL 1926 JUL - 28 JUL 901 AUG - 05 AUG 1703 AUG - 09 AUG 2705 AUG – 20 AUG 5815 AUG - 22 AUG 2815 AUG - 21 AUG 2118 AUG - 21 AUG 1324 AUG - 05 SEP 5025 AUG - 30 AUG 2101 SEP - 11 SEP 4307 SEP - 15 SEP 3218 SEP - 24 SEP 2723 SEP - 27 SEP 1526 SEP - 06 OCT 4007 CCT - 15 OCT 2708 CCT - 17 OCT 4a16 CCT - 29 OCT 4117 OCT - 25 OCT 3318 (XT - 28 OCT 4424 CCT - 03 NOV 4029 (XT - 07 NOV 3601 NOV - 02 NOV 312 NOV - 15 NOV 1214 NOV - 30 NOV 6316 NOV - 21 NOV 23
X?lALl:941
MAXIMUMSURFACE WINDS
KT {Ml-
70 (36)45 (23)120 (62)80 (41)40 (21]75 (39)55 (28)65 (33)45 (23)80 (41)115 (59)130 (67)40 (21)50 (26)45 (23)130 (67)50 (26)115 (59)110 (57)65 (33)55 (28)95 (49)40 (21)155 (80)90 (46)95 (49)80 (41)110 (5-/)145 (75)25 (13)55 (28)160 (82)125 (64)
ESTIMATED
9729919229649949689849769919759279109949879919109879279339769849499938789549499639278921002984872916
TABLE 3-2 WEISTERN NORTH PACIFIC TROPICAL CYCLONE DISTRIBUTION
XEARJAN EEEMARAF3MAX JYNJYLAYGS.12UW RK.TsmL.s1959 0 1 1 1 0 1 3 8 9 3 2 2 31
000 010 010 100 000 001 111 512 423 210 200 200 17771960 1 0 1 1 1 3 3 9 5 4 1 1 30
001 000 001 100 010 210 210 810 041 400 100 1001961 1 1
19831 1 4 6 5 7 6 7 2 1 42
010 010 100 010 211 114 320 313 510 322 101 1001962 0
20 11 111 0 1 3 0 8 8 7 5 4 2 39
000 010 000 100 201 000 512 701 313 311 301 0201963 0 0
24691 1 0 4 5 4 4 6 0 3 28
000 000 001 100 000 310 311 301 220 510 000 210 19631964 0 0 0 0 3 2 8 8 8 7 6 2 44
000 000 000 000 201 200 611 350 521 331 420 1011965 2 2
26 13 51 1 2 4 6 7 9 3 2 1 40
110 020 010 100 101 310 411 322 531 201 110 0101966 0
21 13 60 0 1 2 1 4 9 10 4 5 2 38
000 000 000 100 200 100 310 531 532 1121967 1 0
122 101 20 10 82 1 1 1 8 10 8 4 4 1 41
010 000 110 100 010 100 332 343 530 211 400 0101968 0
20 15 61 0 1 0 4 3 8 4 6 4 0 31
000 001 000 100 000 202 120 341 400 510 400 0001969 1
20740 1 1 0 0 3 3 6 5 2 1 23
100 000 010 100 000 000 210 210 204 410 110 010 1364TABLECONTINUED ONTOPOFNEXT PAGE
20
1970
1971
1972
1973
1974
1975
1976
1977
1978
1979
1980
1981
1982
1983
1984
1985
1986
1987
1988
1989
1990
1991
1992
tXWITNUED FROM PREVIOUS PAGEJz!NEEB MiEAilRkfAXm A,!L AKG.SERSCLW
o 1 0 0 0 2 3 7 4 6 4000 100 000 000 000 110 021 421 220 321 130
1 0 1 2 5 2 8 51 4 2010 000 010 200 230 200 620 311 511 310 110
1 0 1 0 0 4 5 5 6 52100 000 001 000 000 220 410 320 411 410 200
0 0 0 0 0 0 7 6 3 4 3000 000 000 000 000 000 430 231 201 400 030
1 0 1 1 1 4 5 7 5 4 4010 000 010 010 100 121 230 232 320 400 220
1 0 0 1 0 0 1 6 5 6 3100 000 000 001 000 000 010 411 410 321 210
1 1 0 2 2 2 4 4 5 0 2100 010 000 110 200 200 220 130 410 000 110
0 0 1 0 1 1 4 2 5 4 2000 000 010 000 001 010 301 020 230 310 2001 0 0 1 0 3 4 8 4 7 4
010 000 000 100 000 030 310 341 310 412 1211 0 1 1 2 0 5 4 6 3 2100 000 100 100 011 000 221 202 330 210 1100 0 1 1 4 1 5 3 7 4 1000 000 001 010 220 010 311 201 511 220 1000 0 1 1 1 2 5 8 4 2 3000 000 100 010 010 200 230 251 400 110 2100 0 3 0 1 3 4 5 6 4 1000 000 210 000 100 120 220 500 321 301 1000 0 0 0 0 1 3 63 5 5000 000 000 000 000 010 300 231 111 320 3200 0 0 0 0 2’5 7 4 8 3000 000 000 000 000 020 410 232 130 521 3002 0 0 0 1 3 1 7 5 5 1020 000 000 000 100 201 100 520 320 410 0100 1 0 1 2 2 2 5 2 5 4000 100 000 100 110 110 200 410 200 320 2201 0 0 1 0 2 4 4 7 2 3
100 000 000 010 000 110 400 310 511 200 1201 0 0 0 1 3 2 5 8 4 2100 000 000 000 100 111 110 230 260 400 2001 0 0 1 2 2 6 8 4 6 3010 000 000 100 200 110 .231 332 220 600 3001 0 0 1 2 4 4 5 5 5 4100 000 000 010 110 211 220 500 410 230 3100 0 2 1 1 1 4 8 6 3 6000 000 110 010 100 100 400 332 420 300 3301 1 0 0 0 3 4 8 5 6 5100 010 000 000 000 210 220 440 410 510 311
[1959-1992)MEAN: 0.6 0.3 0.6 0.8 1.2 2.2 4.5 6.3 5.7 4.6 3.0CASES: 20 10 20 25 42 73 151 214 192 156 101
E?&o
0000000321000002020200220201
100000031111010220011002020110021103210110010102101110000000000
1.446
2’712 12 3
3724 11 2
322282
231292
3515 17 3
251465
2514 11 0
211182
3215 13 4
281495
281594
2916 12 1
281972
2512 11 2
3016 11 3
271791
271980
251861
2714 12 1
3521 10 4
312191
3220 10 2
3321 11 1
30.91049
I !
The criteria used in Table 3-2 areas follows:
1. If a rropical cyclcne was first warned m during she last two &ys of a par-TABLE 3-2 LEGEND
titular month and cuntinued imo dre next moruh for longer shan two days,SJsensfratsystem was attributed to he second month.2.ffamopical cyclone was warned on prior to h last two &ys of a monsh,
=
Legend: Total for the month 6
it was attributed 10the first montfr, regardless of how lcmgthe system lamed. Typhoons3. If a mcpical cyclone began on the last&y of the month and ended m tie
~312
first day of the nex[ momth, that syuem was attributed to the first month. Tropical StormsHowever, if a trcpical cyclone began m the last day of the month and contirr-ued inso the next monsfr for only two days, tfrtarit was amibuted to She sec- Tropicai Depressionsond moss$h.
21
,,* --.tiy.: *:.:.:.*.:.,.,
3■ “:*:::,::*
* OICTSEkeka02W TY Bobbie TROPICAL DEPRESSION –03WTY Chuck MW TROPICAL STORM04WTSDeanna :::,*:+05W TY Eli
m TYPHOON06WTSFaye ;:*
07W TY Garyn H SUPER TYPHOON
$*08WTS Helen
*+** DISSIPATING:+
09W TY Irvingw++ EXTRATROPICAL
+. 10W TY Janis I I I
11W STY Kent I. 12W TS Lois I I I
. 13W TS Mark14W TS Nina
. 15W STY Omar16W TS pol& , .:,,,,
17W TY Ryan I18WTY Sibyl ‘19W TY Ted20W TS Val
:.,.
21WTY Ward :..,22W TS Zack23W STY Yvette24W TY Angela25W TY Brian .>
26W TY Colleen27W TY Dan28W STY Elsie29W TD 29W *30W TY Forrest31W STY Gay32W TY Hunt
TCO1B ~*TC02A W*
TC03B :*TC04B :*TC05B *TC06A ~~;*
TC07B :*TC08B *TC09B :j~:::;........TC1OB ::,::;::*.:.:.:.,TC11A ?,::*TC12A I :::;:;●.,.,.,.,
January February March April May June July August September October November December
Figure 3-1. Chronology of westent North Pacific and North Indian Ocean tropical cyclones for 1992.
TABLE 3-3 WESTSRN NORTH PACIFIC TROPICALCYCIL3NES
TYPH~NS11945 - 1959L
JAN EEEMEAE?RMAXJUNALL AL!GsEEfx2Nfuz REFTFAN: 0.3 0.1 0.3 0.4 0.7 1.0 2.9 3.1 3.3 2.4 2.0 0.9
CASES: 5 1 4 6 10 15 29 46 49 36 30 14(1960 1997~
JANrEFi 2mEAm M?um JuL AuGsEJ2fla Nw12ELMEAN: 0.3 0.1 0.2 0.5 0.7 1-1 2.7 3.2 3.3 3.2 1.8 0.6
CASES: 10 2 7 15 24 37 90 106 108 105 60 20
TROPICALSTORMS AND TYPHOONS
J1945- 195%
JAN Em MAR m Mu J.uK J!JLAL!G4SEE ax. NQY I&cMEAN: 0.4 0.1 0.5 0.5 0.8 1.6 2.9 4.0 4.2 3.3 2.7 1.2
CASES: 6 2 7 8 11 22 44 60 64 49 41 18
am - 199?)
JAti EBE3.RAm Max J!lIi JuL AuGsEEQ2LI@mLmAN : 0.6 0.3 0.5 0.7 1.1 1.9 4.2 5.4 5.0 4.2 2.8 1.2
CASES: 19 9 15 22 36 62 137 179 164 139 92 38
NUM8ER OF CALENDARWARNING DAYS: 159NUMBER OF CALENDAR WARNING DAYS WITH TWO TROPICAL CYCIK)NES:NUMBER OF CALENDAR WARNING DAYS WITH THREE TROPICAL CYCLONES:NUM8ER OF CALENDARWARNING DAYS WITH FOUR TROPICAL CYCLONES:
16.4245
17.7584
22.2332
27.6912
47235
I 1
TABLE 3-4 TROPICAL CYCWNE FORMATION ALERTS FOR THE WES= NCRTE PACIFIC OCZIAN
TROPICAL TOTAL FALSE PROBA!31LITYINITIAL CYCLONES TROPICAL ALARM OF
WITH RAlx1976 34 25 25 26% 100%1977 26 20 21 23% 95%1978 32 27 32 16% 84%1979 27 23 28 15% 82%1980 37 28 28 24% 100%1981 29 28 29 3% 96%1982 36 26 28 28% 93%1983 31 25 25 19% 100%1984 37 30 30 19% 100%1985 39 26 27 33% 96%1986 38 27 27 29% 100%1987 31 24 25 23% 96%1988 33 26 27 21% 96%1989 51 32 35 37% 91%1990 33 30 31 9% 97%1991 37 29 31 22% 94%1992 36 32 32 20%
(1976-1992)100%
MEAN: 34.5 26.9 28.2 22% 95%TOTALS: 587 458 481
1992 FORMATION ALERTS: 32 OF 34 INITIALFORMATION ALERTS DEVELOPED INTO SIGNIFICANTTROPICAL CYCLONES.
23

.3.2 WESTERN NORTH PACIFICTROPICAL CYCLONES
The year of 1992 included five supertyphoons, 16 lesser typhoons, 11 tropical stormsand one tropical depression. All tropicalcyclones with the exception of Helen (08 W),which was Tropical Upper Tropospheric Trough(TUTT)-induced, originated in the low-levelmonsoon trough or near-equatorial trough.
Due to warm sea-surface temperature anom-alies in the central equatorial Pacific Ocean,January was a month with westerly low-levelwind anomalies that extended from New Guineaeastward into the Central Pacific Ocean (Bureauof Met., 1992). These anomalies aided thedevelopment of Axel (OIW) in the westernNorth Pacific and a twin tropical cyclone in the
Southern Hemisphere, and in late January, theformation of Ekeka (OIC), a rare JanuaryHurricane, south of the Hawaiian Islands. AfterEkeka, there was a four month break in signifi-cant tropical cyclone activity. By mid-June themonsoon trough became established in its nor-mal location across the South China Sea, centralPhilippine Islands and eastward into theCaroline Islands, and supported the formation ofBobbie (02 W), Chuck (03W) and Deanna(04W) in late June (Figure 3-2).
After Deanna recurved on 2 July, the ridgingand associated high pressure temporarily builtinto low latitudes in the Philippine Sea andreplaced the monsoon trough. However, low-level southwesterly flow and weak troughingpersisted to the east and supported the formationof Eli (05W) the second week of July, followedby Faye (06W), and Gary (07W) (Figure 3-3).After Gary, no significant tropical cyclonesoriginated in the low-level monsoon troughuntil the end of July. In the interim, Helen(08 W), which was a TUTT-induced low-level
I!Yl,--~.,.,
8,’,:..0 .“
.*●.”
●“t
,: ,+ -----------.-* s
--. *. 16
D
s% ,’-.‘“ - .-,,.●.
0---”-””--.”*--- -- ’., 17
m
.
D~.-..t
it “ 0.‘...*’ -0,.
)------ -------
.,“ ‘---’”; ‘~.~ 18
El,“-., :@,
. .,.’\ .
. -~ ,- .,--------‘- J ~.. . .. 19
Iiii!!*,’ ●-*.
,) s *,***.8
,@
● “*----..--,-----.%9 --- 24
D,-A
,1
-~ ‘.
“. &*.....
/’------- -
~ “\ --------~‘. .----, o
‘---- . . 25
m
,“ -“ .. ,- . ., “ +-: .S---....:,----
,. “,1: :“;DZ . . . ..-
-------- .. 26
lzl
# t: . . .-..’ ,------- ,,’
:’ .’, --- D;-. ‘~ ;~.- ---a-----,*-.. “ 27-- a..-.-.: .,
El{-@“>. ..
‘-”s.:.. %-.. ..-; *-------L---...
. 21
!!!!d‘Q@..’
:*:. . ---------
-.. .-. 2:. .
m-...-.,,‘\-.’,.’-------B*’-.....-..~--------23
ICI-----*-
e’,4....---$.
.*”B.’‘ (fy
.“’ :.*. 28
E!?z!,-:,●<● ) -“””,,z’B
-.-~ “ I@D29
I!!!zl
,.,
c ● ;B.’’.’-’;.’
. :%)D,
●s. 30
m
TOKYON40°
* GUAM
EQ
120”E 180°
Figure 3-2. Western North Pacific sea-level pressure analyses for 16 to 30 June 1992. Map panels are for 00002 for the date indicated inthe lower right of each panel. A geographicalreference appears as tie lower right pane]. Contours outer dashed line = 1010 m~ solidline = 1008 mb; arr~ black area < 1004 mb. Tropical cyclones: B . Bobbie (02W); C = Chuck (03W); and, D = Deanna (04W).
(Analyses courtesy of M.A. Lander.)
24
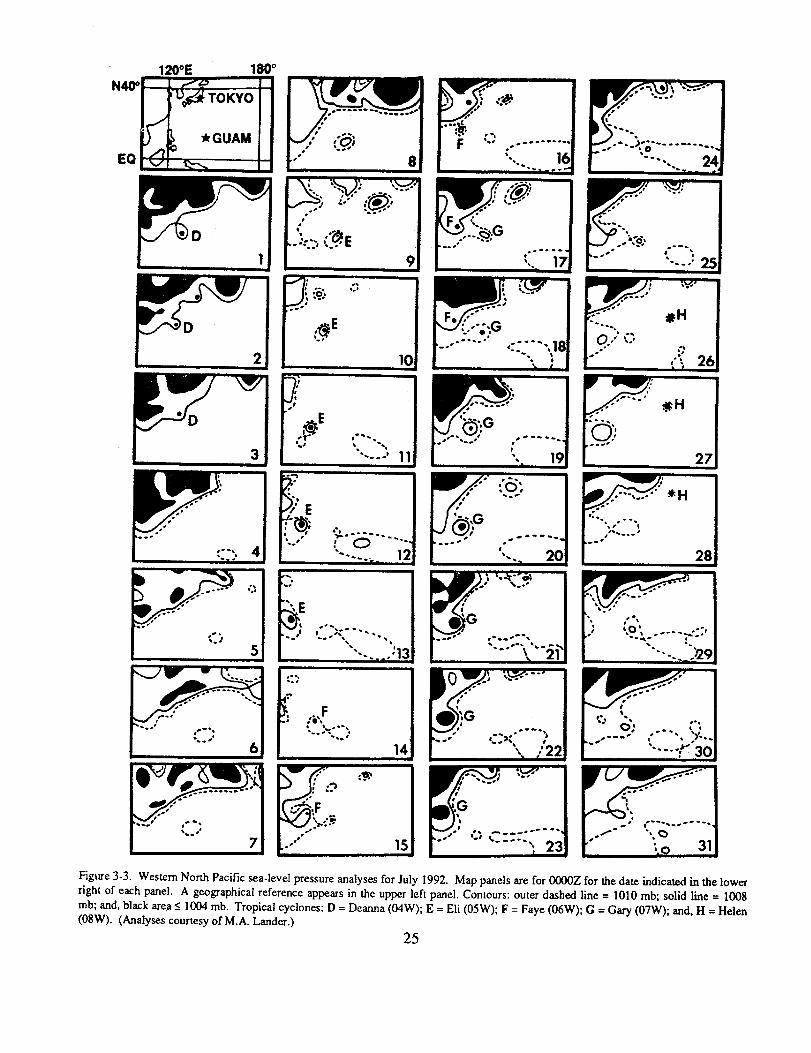
120”E 18@’
m
W@’TOKYO
.* GUAM
EQ
m“D
m‘D
1 3
m‘!.
.“”.“
.“..”
---
Lx-J
r ‘...
#-
-----------
/-.‘.=
. . -,
+.’,-..’ --.,
.,‘.-.
6
F
0J .
1!‘.‘#..- ----------
@ #---..-,.-. * ,- -.
I *...7
mt‘..‘:,.--;..‘“.”‘<@:---t.*’-:::3<?$E9
m
.., .-. ,-,; :?.,,---
:gE
10
m
,’8.~
‘*E ,...~:? \ “.
‘ 11‘.-- --,
m
--l.,*.,
:~i$ .&.*b...” { ‘o--.-”------ 12
1..b..*
P.,
●E.0 :, ---------b.-, -..”’. ..
‘.‘.. 9:13. .
::> I
F-.. . . . ..- 4I :... 17[
m::_●----
F. [;‘g’,G-#-._.’
,]8,. ----,-. -.-‘. *
I . t [
F-1‘.
. .“
-j’ir~--”,------●
11●
. 19
D/’ “-’J?
,’
●:G,.’
. .- ,------. --.””’‘---
J 21
m
o ..-’ ‘--”---.“
●fG ----.’
m:: )*.*‘. :22
m
,--- * %.”t --j
(Gu
/“’ ,:, ‘. -.----’--‘-”-”S 23
E.-.;....-.
d’ ‘.-. .,’
,“t’-’-..
...-.J-;-----------‘-. *
‘...- 24
n,‘.- ,;. ..~
.’-.”
.
.... .
-..●-~-,.- ,-, ----
.-.@ 8 ●*
‘.--/ 25
n
: ‘-’,,_.’.’.- “- *H------
q’ ‘:)a-
,.! 26
m
!’.’.- ..-,
*H:.-.
0::----27
r—,,,..-\e. - “. *H
.“---1 .. ..-.
‘, ,,#.. _!---
D,..-“-
---. ,-----‘bL,.’
,.‘. ,, :.?;.~ .----%”::’-4-
*.---- . .:Q9
El
.“”---#>-”
t’?. ‘*•.> 0: ,..,--. , 1.~#---- ‘ .$.”-
: 30‘.. --. J’-
m
-.... /”--
.-. -.-*‘1,
,*.-.. --e--- .--’●“’- .~,o
* 31
Figure 3-3. Western North Pacific sea-level pressure analyses for July 1992. Map panels are for 0000Z for the date indicated in the lowerright Of each panel. A geqraphicat reference appears in the upper left panel. Contours: outer dashed line = 1010 mb; solid line = 1008mb; and, black areas 1004 mb. Tropical cyclones: D . Deanna(04 W); E = Eli (05 W); F = Faye (06 W); G = Gary (07 W); and, H = Helen
(08W). (Analyses courtesy of M.A. Lander.)
25

L -----------.. .... -4
L
$ :@;# *..’
“+ ,.
e.... ‘-----*.-. .
. ‘-----.’ -.>. 5
E....,,..+.
‘iJ <o:● ..-..””?
.-. . K&’-------- ●.-..* 6
E
,.’,. . ‘&‘~,J‘“ ‘-”.. -----
L..K
8---..-
,--------. ‘...< . 7
EcIl;Jf”-----
,9, “ ~f..-.f
%*.” ,------
--------- ‘.=‘. 8
!!77;.;<;?J,.-.‘1,‘.- -yqK
-. i, *-----------+‘. ‘- . .. 9
m,*-”8. ~.
4’.-. . . . .“@-K----. ..--*4------f’ ,-.. 10
m
..,,~:, .,: K ;ij,’ ~--------0●“...>, ‘.------,’‘...--a,’ ‘..11
I!!Kl
--.>.-i_.K
0●’*’t..-.-.----, - ..,0 --- 12
m#K
c113
m
‘.K●
- i.._>-.,-- -.. .------ . , 141
~
.. %----,.. ● O; $
1;’;--------~.-. ----- ,
●✍✍✍✍✍✍ 1!
m@NL
21
IIzl
●
@-.!..~ , :~;.>LN
● (--. ------------ “, o.“ - ,-- . . 22
m
i
23
Ecl●PCCe
24
Ezl
“ 9P ,0
r) 25
E!i!izl
P
0°26
I!!i!Gl
P
0°7
I!El
P
0°28
I P I
I!!!!!vo
29
I&l
P*
I 301
I!!!!El
p 0°31
E!!za,,0:-
“.K;,t -.>.’
● .,
‘t-------
>.---,L-.-, *---- . 16
liiizzl
,,’ K.->,-..--,
..‘.- @N
:--------. .-, L
--- ‘.. 17
Ii!!!El●N
ML ‘8
m
K●N
ML 19
m
K ●N
L
20
Figure 3-4. Western North Pacific sea-level pressure analyses for August 1992. Map panels are for 0000Z for the date indicated in thelower right of each panel. A geographical reference appears in fie upper left panel. Conmurs: outer dashedline=1010mtysolidline=1008 mb; black areas 1004 mh and, inner white areas 1000 mb. Tropical cyclones: I = Irving (09W); J = Janis (1OW); K = Kent (1lW}L= Lois (12W} M = Mark (13W~ N = Nina (14W); O = Omar (] SW); ad, P = Pony (16W). (Analyses courtesy of M.A. Lander.)
26
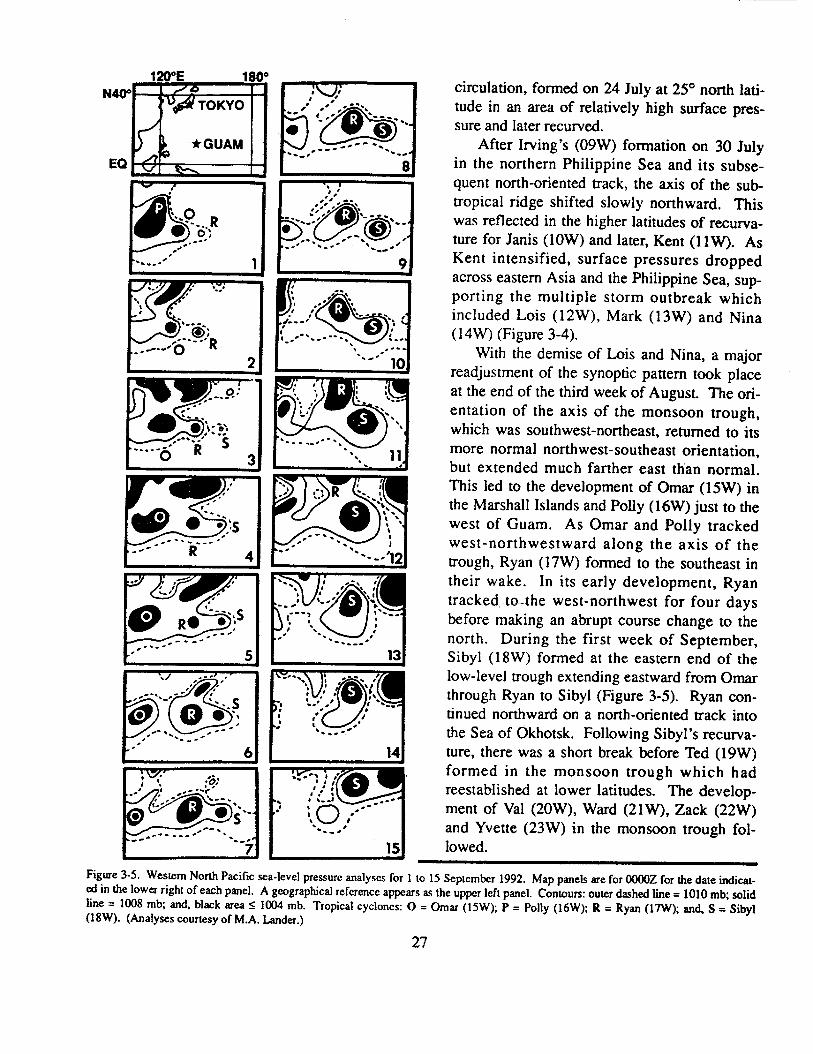
‘:mE1 . 1 d
.‘*.-..- q
m... ‘..“.’‘*s: ●
●“--&$,----..).. /.-” OR
2—
F!!!zl.-:-g:
●“-”
o ----● ;b:y
.-. ..*------ S0- R 3
m
.,’.
e● .’--- :;~
---- .-----e-z- R 4P t
B./..,f; .’
~,.’
0 $----● R, ● :s#---..---”
##-’-
5
PI
‘~.-=’>:(’
6-”-’0 .-s,# **- ~---
. ----.’6
Ezl
.: ‘, :’@:,,
& ‘:”’-w+’-,#-.,.. -------- ‘.. -.7
I Im-.
circulation, formed on 24 July at 25° north lati-tude in an area of relatively high surface pres-sure and later recurved.
After Irving’s (09W) formation on 30 Julyin the northern Philippine Sea and its subse-quent north-oriented track, the axis of the subtropical ridge shifted slowly northward, Thiswas reflected in the higher latitudes of recurva-ture for Janis (1OW) and later, Kent (1 lW). AsKent intensified, surface pressures droppedacross eastern Asia and the Philippine Sea, Sup-
porting the multiple storm outbreak whichincluded Lois (12W), Mark (13W) and Nina(14W) (Figure 3-4).
With the demise of Lois and Nina, a majorreadjustment of the synoptic pattern took placeat the end of the third week of August. The ori-entation of the axis of the monsoon trough,which was southwest-northeast, returned to itsmore normal northwest-southeast orientation,but extended much farther east than normal.This led to the development of Omar (15W) inthe Marshall Islands and Pony (16W) just to thewest of Guam. As Omar and Pony trackedwest-northwestward along the axis of thetrough, Ryan (17W) formed to the southeast intheir wake. In its early development, Ryantracked -to-the west-northwest for four daysbefore making an abrupt course change to thenorth. During the first week of September,Sibyl (18W) formed at the eastern end of thelow-level trough extending eastward from Omarthrough Ryan to Sibyl (Figure 3-5). Ryan con-tinued northward on a north-oriented track intothe Sea of Okhotsk, Following Sibyl’s recurva-ture, there was a short break before Ted ( 19W)formed in the monsoon trough which hadreestablished at lower latitudes. The develop-ment of Val (20W), Ward (21 W), Zack (22W)and Yvette (23W) in the monsoon trough fol-. .
I 15 lowed.
Figure 3-5. Western North Pacific sea-level pressure analyses for I to 15 September 1992. Map panels are for 00002 for the date indicat-d in the lower right of each panel. A geographical reference appears as the upper left panel. Contours: outer dashed lime= 1010 mb solidline = 1008 mb; and, black area <1004 mb. Tropical cyclones: O = Ornar (15W); P . Pony (16W); R = Ryan (17W~ and S = Sibyl(18W). (Analyses courtesy of M.A. Lander.)
27

Next came Angela (24W) which formed inthe monsoon trough in the South China Sea andbecame the anchor-low for the multiple stormoutbreak which contained Brian (25 W), Colleen(26W) and Dan (27 W). As a subset of thisevent, Brian’s binary interaction with Colleen atthe end of the third week of October resulted inColleen slowly executing a broad loop beforetracking westward. The last week of October,Elsie (28W) and Tropical Depression 29W keptthe activity going until the short pause beforeForrest (30W) consolidated the second week ofNovember. Forrest became part of anothermultiple storm outbreak that included Gay(31W) and Hunt (32W). As the subtropicalridge strengthened and pushed equatorward,Forrest tracked from the Philippine Sea west-ward across the South China Sea and the Gulfof Thailand, and ultimately recurved in the Bayof Bengal. Hunt recurved on 20 November andGay, which was long-lived and required 63, six-hour warnings, recurved on 30 November toclose out the year. ‘”
JANUARY THROUGH MAY
Typhoon Axel (OIW), the first significanttropical cyclone to occur in 1992 in the westernNorth Pacific, developed in the first week ofJanuary in conjunction with two other tropicalcyclones — Betsy (1 1P) and later Mark (12P)— in the Southern Hemisphere in response toan equatorial west wind burst to the east of NewGuinea. Axel’s early intensification at a lowlatitude proved particularly damaging to theMarshall and eastern Caroline Islands. Duringthe last week of January, Ekeka (OIC), whichformed south of the Hawaiian Islands, became arare January central North Pacific hurricane.Due to increasing upper-level wind shear, Ekekahad weakened to 40 kt (20 m/see) when theJTWC assumed warning responsibility on 4February. The weakening tropical cyclone con-
tinued to move westward and passed throughthe Marshall Islands.
JUNE
After a four month hiatus in tropical cycloneactivity in the western North Pacific Ocean,Bobbie (02W) developed in the monsoontrough in the central Caroline Islands in lateJune. Bobbie’s formation coincided with that ofChuck’s (03W) over the central PhilippineIslands, and the two underwent binary interac-tion for three days. As Typhoon Bobbie passedeast of northern Luzon, torrential rains, associ-ated with the deep monsoonal flow into Bobbieand enhanced by Chuck, caused heavy rains,mudslides, and widespread flooding over thenorthern half of the Philippines. After, recum-ing and tracking just to the southeast ofOkinawa, Bobbie accelerated in forwardmotion, and underwent extra-tropical transitionbefore passing just south of Tokyo. Chuck wasthe first significant tropical cyclone of the yearin the South China Sea. Deanna (04W) was thethird, and final, significant tropical cyclone toform in June. Deanna executed a counter-clockwise loop on 27 and 28 June in the westernCaroline Islands before moving out to the north-west on a track parallel to the one taken byBobbie five days earlier.
JULY
After Deanna recurved on 2 July, ridgingtemporarily replaced the monsoon trough acrossthe northern Philippine Islands and PhilippineSea. Weak southwesterlies, however, persistedat low latitudes and Eli (05W) formed in theeastern Caroline Islands. Slow to intensify,Typhoon Eli tracked rapidly west-northwest-ward across Luzon, the South China Sea, andinto northern Vietnam. Next came Faye (06W),the second of three successive tropical cyclonesto pass over northern Luzon and intensify in theSouth China Sea. Recurving south of HongKong on 17 July, Faye proceeded north-north-
eastward into China and dissipated. Gary
(07W) followed Faye, and after presenting28

JTWC with early difficulties locating the low-level vortex, the Center correctly predicted thatGary would strike the southern coast of Chinanear Hainan Dao, Gary caused widespreaddamage across southern China. Typhoon Gary’strack paralleled those of Typhoon Eli andTropical Storm Faye. The fourth of five signif-icant tropical cyclones to develop in July, Helen(08W) intensified from a Tropical UpperTropospheric Trough (TUTT)-induced low-level circulation. The tropical storm began toweaken as it gained latitude and moved into aregion of cooler sea-surface temperatures. Afew days later, Irving (09W) became the first oftwo successive typhoons to affect southwesternJapan. It formed at the eastern end of the mon-soon trough where several low-level vorticit ycenters were embedded in a broad area of poor-ly organized convection. Irving slowly intensi-fied and took a north-oriented track into south-western Japan followed by westward motiontoward Korea due to the reestablishment of themid-level subtropical ridge.
AUGUST
Four days after Irving hammered Shukoku,
Janis (1OW) slammed into Kyushu. Janisbegan near Pohnpei in the Caroline Islands,took a northwestward track threateningOkinawa, then recurved, passed over Kyushu,and skirted the western coast of Honshu beforetransitioning to an extratropical low overHokkaido. The second of eight significant tropi-cal cyclones to develop in August, Kent (llW)became the first super typhoon of 1992. Duringits trek toward Japan, Kent underwent binaryinteraction with Tropical Storm Lois. Requiringa total of 58 warnings, Kent was second only toSuper Typhoon Gay for the highest total numberof warnings and longevity for the western NorthPacific in 1992. Next came Lois (12W), one ofonly two tropical cyclones in 1992 which had apersistent eastward component of motion duringits period of warning. The storm bedeviled
JTWC forecasters by consistently movingcounter to the climatologically expectedmotion. After escaping the binary interactionwith Kent, Lois accelerated northeastward anddissipated over colder water. Mark (13W) waspart of a multiple storm outbreak with Kent,Lois, and later, Nina. On 15 August, Mark’sgenesis in the South China Sea in the monsoontrough coincided with Lois’ in the PhilippineSea, as deep low-level southwesterly flowsurged eastward across the Philippine Islands.Due to strong vertical wind shear, Mark was
slow to intensify and spent its short lifetimeembedded in the monsoon trough. It dissipatedover southern China. Nina (14W), part of themultiple storm outbreak in August with Kent,Lois and Mark, formed as a TUTT-inducedtropical cyclone under divergent upper-levelflow east of Kent. Nina intensified to a peakintensity of 45 kt (23 rn/see) despite the stronglysheared environment. On 20 August, the sec-ond super typhoon of 1992, Omar (lSW)developed in the southern Marshall Islands,moved steadily west-northwestward and intensi-fied. On 28 August, Omar wreaked havoc onGuam as it rapidly intensified immediately priorto passing directly over the island. TyphoonOmar was the most damaging typhoon to srnkeGuam since Typhoon Pamela in 1976, causingan estimated $457 million of damage. After tra-versing Guam, Omar continued onward into thePhilippine Sea where it briefly attained supertyphoon intensity. Omar then steadily weak-ened, passing over Taiwan as a tropical storm,and dissipated over southeastern China. Pony
(16W), the eighth and final significant tropicalcyclone of August, developed along with Omaras part of a major relocation of the monsoonaltrough. Pony was unusual in that throughoutmost of its life, it maintained the structure of amonsoon depression with a ring of peripheralgales and a broad band of deep convectionaround a large, relatively cloud free, central areaof light-and-variable winds. The outflow aloftfrom Pony appeared to play an important role in
29
delaying the intensification of Omar, whenOmar was approaching Guam. Although Ponynever reached typhoon intensity, it did havequite an impact on eastern Asia.
ty to JTWC forecasters, as it underwent twomajor track changes and two significant acceler-ation episodes.
OCTOBERSEPTEMBER
The firstof five significant tropical cyclonesto form in September, Ryan (17W) became partof a multiple storm outbreak, including Omarand Sibyl, east of 150° east longitude.Although Ryan initially took a west-northwest-ward course similar to the two preceding tropi-cal cyclones (Pony and Omar), it later stalled,and then acquired a north-orientated track. Twodays after transitioning to an extratropical loweast of Hokkaido, the remnants of Ryan couldstill be identified, as an occluded low continu-ing northward over Siberia, north of the Sea ofOkhotsk. Sibyl (18W), like Ryan, formed at theextreme eastern end of the monsoon trough.But unlike Ryan, Sibyl underwent a complexinteraction with a cyclonic cell in the TU’IT,and later recurved. For five days, Sibyl exhibit-ed erratic motion and slowly intensified nearWake Island, before moving to the northwestand recurving. A short respite ensued forJTWC while the disturbance that was to becomeTyphoon Ted (19W) slowly developed. Tedwas marked by moderate to strong upper-levelwind shear throughout most of its life. A com-bination of shearing effects and land interactionprevented Td from intensifying above minimaltyphoon. Ted’s tour of Asia included northernLuzon, northeastern Taiwan, eastern China, andfinally Korea before the circulation transihonedto a weak extratropical cyclone over the Sea ofJapan. The next tropical cyclone, Val (20W),was the only one of five typhoons in Septemberthat did not intensify beyond a tropical storm.Like Ted, which formed a day earlier on 18September, Val was slow to intensify. Nextcame Ward (21W) which formed in the tradewind trough just to the east of the international
date line. Ward presented considerable difficul-
The first of eight significant tropicalcyclones to form in October, Zack (22W) wasalso the frost to threaten the southern MarianaIslands since Omar’s devastating passage acrossGuam in August. Initially its movement was tothe west-northwest along the axis of the mon-soon trough, but a monsoon surge of deepsouthwesterly winds resulted in an abrupt trackchange to the north-northeast for Zack. As thetropical storm weakened, the low-level circula-tion center became difficult to locate, andJTWC issued a final warning on Zack on 12October. However, by the following day, theconvection and organization of the system hadincreased, prompting JTWC to issue a “regener-ated” warning. Zack briefly reintensified to atropical storm before transitioning into a sub-tropical system and dissipating over the ocean.The third Northwest Pacific tropical cyclone of1992 to achieve super typhoon intensity wasYvette (23W). It formed at the same time asZack and proved to be an action-packed systemwhich posed many forecast challenges. In thespan of two weeks, Yvette developed in a mod-erately sheared environment, made a run towardLuzon as it intensified to a typhoon, stalled,executed a major, 150-degree track change,weakened, reintensified to a super typhoon, andtransitioned to an extratropical cyclone. Duringthe second week of October, Angela (24W)developed in the South China Sea, moved east,reversed course and struck southern Vietnam.Angela later crossed southern Indochina andreintensified to a severe tropical storm in theGulf of Thailand, where it tracked through aclockwise loop, and finally dissipated over theGulf. While anchoring the western end of amonsoon trough, Angela became part of a mul-tiple storm outbreak along with Brian, Colleen
30
and Dan. Angela posed a significant threat inthe Gulf of Thailand, where manned gas plat-forms were forced to evacuate as the stormintensified and moved into the area. Forming inthe southern Marshall Islands, Brian (25W)moved west-northwestward and intensified intoa midget typhoon as it passed across Guam. ForGuam, it was the second eye passage in lessthan two months - Omar being the fwst. Later,
IBrian underwent binary interaction withTyphoon Colleen, subsequently recurved, andfinally transitioned to an extratropical system.Colleen (26W) developed from a broadcyclonic circulation in the monsoon troughbetween Typhoon Angela to the west andTyphoon Brian to the east. Binary interactionoccurred between Colleen and Brian, causingColleen to make a slow anticyclonic loop in thePhilippine Sea before turning west. After cross-ing Luzon, Colleen reintensified into a typhoonbefore slamming into central Vietnam and dissi-pating inland. The last significant tropicalcyclone to develop in October as part of the fourstorm outbreak, Dan (27W) became the mostdestructive typhoon to strike Wake Island in thepast quarter-century, causing an estimated $9.0million in damage. Just as Ekeka and Ward didearlier in 1992, Dan formed east of the interna-tional date line, marking the first time that threesignificant tropical cyclones were observed tocross into the JTWC’S area of responsibilityfrom the central North Pacific during a singleyear. Later, Dan faked a move toward recurva-ture, took a west-southwesterly course, under-went an episode of reintensification, and finally,underwent a binary interaction with TyphoonElsie before recurving sharply. Next came thefourth super typhoon of 1992, Elsie (28W),which was the third typhoon to pass within 60nm (100 km) of Guam in less than threemonths. After initial movement to the northeastin response to a southwest monsoonal surge, asubsequent turn to the west, and then interactionwith Typhoon Dan, which brought Elsie to thenorth toward the southern Mariana Islands, the
tropical cyclone setsled down on a track to thenorthwest, recurved, and transitioned into a hur-ricane-force extratropical low.
NOVEMBER AND DECEMBER
Forming in the wake of Typhoon Dan,Tropical Depression 29W immediately becomea threat to Wake Island which had already beenheavily damaged by Dan on 28 October.Fortunately for Wake Island, the TropicalDepression’s intensification was severely cur-tiiled by the persistent outflow Ilom Dan. Thesecond of four signitlcant tropical cyclones toget started in November, Forrest (30W)became part of a three storm outbreak with Gayand Hunt. Forrest was the only tropical cycloneof 1992 to track from the western North Pacific,across the South China Sea, and into the Bay ofBengal. It reached a maximum intensity of 125kt (64 rn/see) in the Bay of Bengal over a dayafter it had recurved. A day after Forrestbecame a tropical storm, Hunt (32W) devel-oped and became the ‘fourth typhoon to passwithin 60 nm (110 km) of Guam in less thanthree months. Hunt was part of a three stormoutbreak with Tropical Storm Forrest and SuperTyphoon Gay. As Hunt intensified, it brushedby Guam, moved into the Philippine Sea, andlater recurved. After recurvature, the typhoonplayed an important role in the extremely rapidweakening of Super Typhoon Gay which wasapproaching the southern Mariana Islands. Gay(31W) developed at the same time as Hunt.Gay was noteworthy for five reasons: its eyebecame the record third to pass across Guam inless than three months; it was estimated to bethe most intense tropical cyclone to occur in thewestern North Pacific since Super Typhoon Tlpin October of 1979; it went through two intensi-fication periods, which is not rare but is rela-tively uncommoty it filled an estimated 99 mbin less than 48 hours without moving over land;and, it required the highest number of warnings,63, for any western North Pacific tropical
31
cyclone in 1992. Four days after being detectedas a tropical disturbance, Gay slammed intoseveral of the Marshall Islands with typhoonforce winds. After peaking with sustainedwinds of 160 kt (82 m/see) with gusts to 195 kt(100 m/see), the super typhoon weakened fortwo days before reaching Guam. Typhoon Gaypassed across the center of Guam on 23November, then reintensified to a second peak
before recurving on 30 November, and dissipat-ing over water south of Japan. No significanttropical cyclones occurred in the western NorthPacific in December.
Composite best tracks for the western NorthPacific tropical cyclones this year are providedin Figures 3-6, 3-7 and 3-8.
32
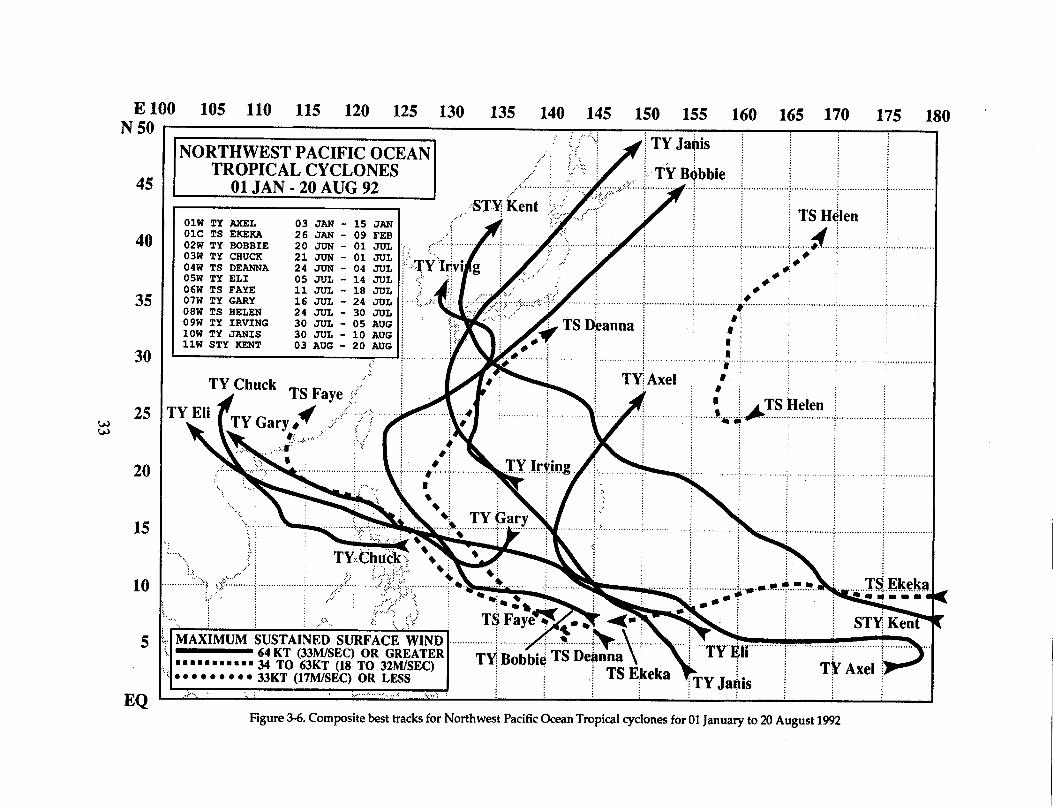
E 100 105 110 115 120 125 130 135 140 145 150 155 160 165 170 175 180N 50
45
40
35
30
25ww
20
15
10
5
EQ
:, ,...:,;‘.::
INORTHWEST PACIFIC OCEANI:.,.,:
xi~TYJa~is ~ ~ / ~;.’: :....
TROPICAL CYCLONES
t (.“’f/ ~
::,.,.,’:...;... :..... : .,. .. ~ TYB~bbie .01 JAN -20 AUG 92
....’ : .. : ..,,. :.......... ,,.,:.,,..:.,:..,...................’..,............,,., ......................1..,,;,,#,,,::.:.,..... :.:ST.~Kent ;.;{, “,....$ : \ ~,,...,
ti........ .,,: ~,,,.,.
,.: ..,’“ :I Olw TY AXEL 03 JAN - 15 JANOIC TS EKEKA 26 JAN - 09 FEB I02W TY BOBBIE
/:20 JUN-OIJUL ‘:: :“”””’f”””’””””””’””;.,.,..:,.,,,
03W TY CHUCK ,,
04W TS DEANNA::~:;;g f::.~y”’~ “ -
05W TY ELI 05 JUL-14JUL : ::06w TS FAYE 11 JUL - 18 JUL : “:
p ,,
07W TY GARY 16 JUL - 24 JUL : :,..+,08W TS HELEN 24 JVL -30 J-UL:09W TY IRVING 30 JUL - 05 AUG ! :710W TY JAWIS 30 JUL - 10 AUG ;
d
:...llW STY KENT 03 AUG - 20 AUG :
f:....
7.:.,....,
..;...,..,,,,.,,,,..,;...,....
j TSH~len
r ....................................!!..................................#r..,..;,..,,,.,,...:*,/’y.......... ...........,,...
lrvim! : .,,,..””;Y : :......, .,
3“
,.: >.,,.” .. ...: ......,.. .,;....,....... .....:.,....,,. ..... ...
,., :,, “*.. ;------ ...‘.’‘l”YChuck
f
TSFaye,,j; ~ ..rY Eli ‘“>~ ~Axe’ ! /~ ~TSHelen ~
A 4 .....’’’’’.’’””.’&\.;l ‘TY Gary.. .. ..... ,,...,,:,.,,..,,..,,;,, ,, ~..~.,
.. ...........=. ,,...; . .. ..
..::....... .:::, TY&hucki ‘s~.,. ,,:.<:,:: : ... ;.,,..:,.,,..,..’ ~ ,;,,,,,>,,:...:?.,,....... ,::,.... ;,...,,,,,
‘“v ~ ‘
,:.,..i ?:P............................................xJ.............<...x.!....................?.*... ... :,,,,,,,,,,,,,,; ,.’.’ .............j,i.# : .,,
‘w................................#.m.a.*n.?.<....?.. ‘.
::............
.+”
‘*” ?~~: ; T,:
MAXIMuMSUSTAINEDsuRFACE""WIND"..................~............ .......$... ..I/>. .. ..j. ....... ...../ ,.. ..~.,............~............o...~.........”¤n~~~-.ms-~~To 63KT (18 TO 32M/SEC)● ● ● ● ● ● ● ● c 33KT (17~sEc) OR LESS
.,:.... .................. .....:. : .:.-..: :
Figure % Composite best tracks for Northwest Pacific Ocean Tropical cyclones for 01 January to 20 August 1992
.........
........ ...,,,.
,,.
.
Ekeka■ -,(
&
2,.,4 ,,.,. .,
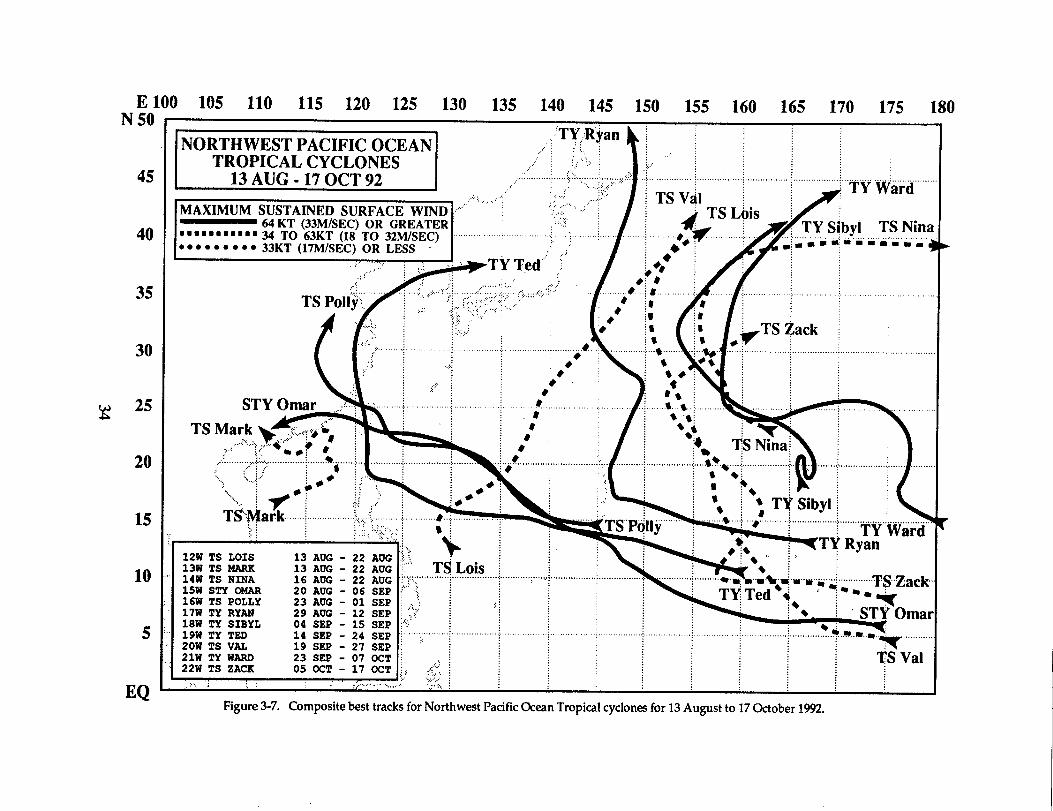
E 100 105 110 115 120 125 130 135 140 145 150 155 160 165 170 175 180N 50
45
40
35
30
~ 25
20
15
10
5
EQ
IEwEH ,’IXI)lI .......... ..........2 l’%’ Wnrll: .,! :..:...,:, ... “1 ;TSVdl : ; --
IMAXIMUMSUSTAINED SURFACE WWD ~,.....’”““”“’” ;:,.;.,., -~” ~ r
.. ”.”
~ TS1.hic : ‘‘64KT (33M/SEC) OR GREATER “:.‘;: 1: 4:
. u -.,. ”-Ynw? c?
¤mm-s---=~~~ TO 63KT (18 TO 32M/SEC)● ● ● ● ● ● ● ● ● 33KT (17M/sBC) OR LESS .
.::““”’ i~TyTe’m’”” ‘ ‘ ‘ * ‘ “
-+
STY Omar ..+; -~ ~ \
TS Mark > ,..,.,;Y‘-- ;.
T$!~aik .......~.......... \.:j::;,..........j.............&~. ................j ~
I 13W TS MhRK 13 AUG - Ts I-& ~ ~14W TS NINA 16 AUG - ‘\=%”’~ ~::"''''"`'""""i"""""""""""""""""""!""'"""""""":'"''''"!"''''"'''```""""""?""''"'""""''""''''?......,,,,:.,,..*W:..w%wrnw_:.....TSZ,nck
I
-—-16W TS POLLY 23 AUG I-oisEP : .“: : !;17W TY RYAW 29 AUG - 12 SEP ~“:;! ! ! ~ 1’.. !_ -iT’’Oma,
A:18W TY SIBYL 04 SEP - 15 SEP19W TY TZD 14 55P - 24 SEP20W TS VAL 19 SEP - 27 SEP21W TY WARD 23 SEP - 07 OCT22W TS ZACK 05 OCT - 17 OCT
.. I.,,,::..,...:,j~,.,:,,..:’:.....
.:.:.......
.:.. ........... ,:... ....-
........... ..+...w..n...n~-..,,T/l Val
Figure 3-7. Composite best tracks for Northwest Pacific Ocean Tropical cyclones for 13 August to 17 October 1992.
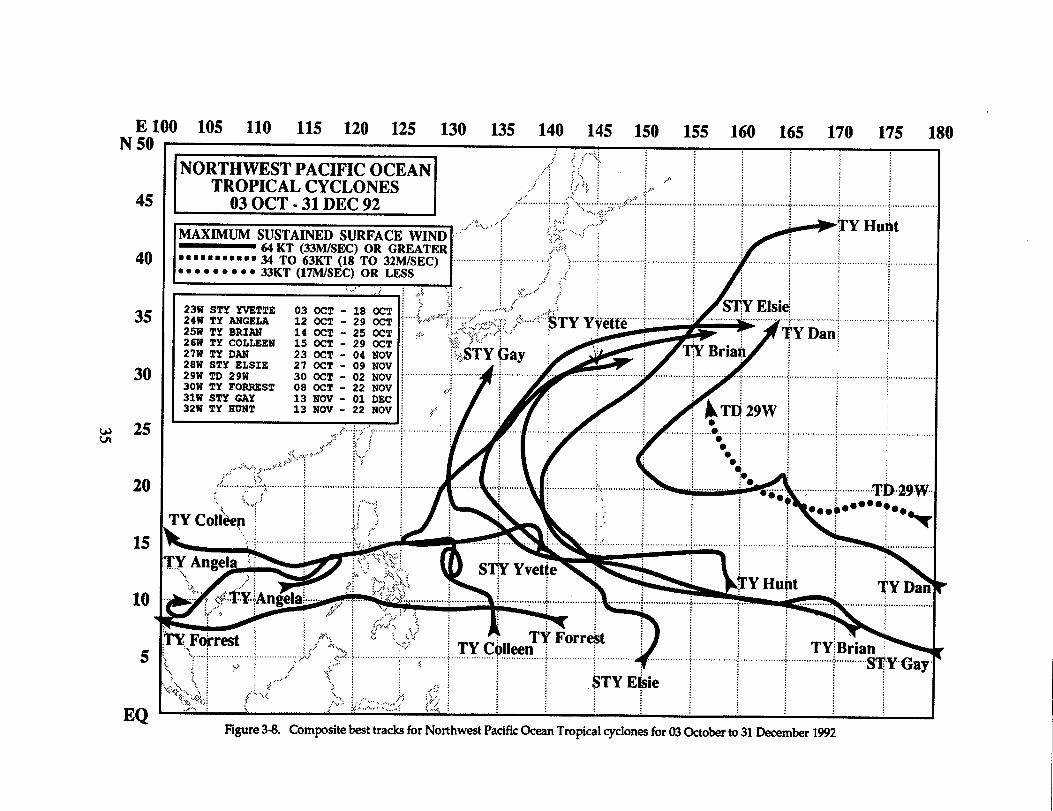
E 100 105 110 115 120 125 130 135 140 145 150 155 160 165 170 175 180N 50
45
40
35
30
25z
20
15
10
5
EQ
•ms-aona-as~ TO 63KT (18 TO 32M/SEC)
● ● s c ● ● ● ● ● 33KT (17M/SEC) OR LESS
23w STY YVETTE24W TY ANGELA 12 OCT25w TY BRIAN 14 OCT- 25 OCT ~ ;’:.26W TY COLLEEN 15 OCT - 29 (XT :27W TY DAN 23 OCT - 04 NOV :28W STY ELSIE 27 OCT - 09 NOV !29W TD 29W 30 OCT - ............. .,,;..,...,.. ............,,..,.,,.;,,..,....,.,,,,,,,30W TY FORREST 08 OCT31W STY GAY 13 NOV - 01 DEC :32W TY HUNT 13 NOV - 22 NOV :?’/
.{,:t.......””’.”.,.................................
...
,,.,,.,.; ,.,...
,.:+.... ,.,.>...,,. ,..:.,,
...................R.............i..................c
;*.. .,.Yit ~ ~,,,:’’’”j.:,,: ““ ‘“...:;y ,4;Tl? Forr~t ~
!TYC%lleen ! , , ! !...............,,,,,,,,,...,.................+...! .’?.~ ; TY:B~,.y:$’’’’:’’’’.’’,,.’.,,.,,,:,.,..,;,...,,.......................;,,,,.,,,..,........;.................................;; .,:. : ,; ,.:. ; ., ; “’”’”””’”””’’”””;””””””””””’”’””’’f””””’””‘“”””””~”””””””’””””’””””’\”””””’””’””S~Yi~.:i ;, ... >, :... : ; ..... ..,. : .flTYE$e / ~ ~ j /.<}:.,, 1’;.~ ..:,i ...../ f: ..;.::......,{’:.+:x..: ,. . .. : .,.:. .:’:: :.+’:
Figure 3-& Composite best tracks for Northwest Pacific (Man Tropical cyclones for 03 october to 31 December W92

TYPHOON AXEL (OIW)
I. HIGHLIGHTSTyphoon Axel was the fmt significant tropical cyclone to occur in 1992 in the western North
Pacific. It developed in January in conjunction with an equatorial west wind burst to the east of NewGuinea along with two other tropical cyclones — Betsy (11P) and later Mark (12P) — in the SouthernHemisphere. Axel’s early intensification at a low latitude proved particularly damaging to the MarshallIslands.
II. TRACK AND INTENSITYStronger than normal low-level westerly winds along the equator were noted east of New Guinea
when Tarawa (WMO 91610) in the Gilbert Islands reported 28 kt (14 m/see) gradient-level winds at01 1200Z, 37 kt (19 m/see) gradient-level winds at 0200002, and later, at 030000Z, Banaba Island(WMO 91533) 300 nm (555 km) to the southwest of Tarawa reported surface winds of 30 kt (15 m.kc).These increased winds and an area of maximum cloudiness persisted in the area, as twin cyclones beganto form. Axel was to the north and Betsy (11P) to the south of the equator. The evolution of these twincyclones, and later a third, Mark (12P) located to the west of Betsy (11P), is graphically illustrated ascloud silhouettes in Figure 3-01-1. The persistent convection, which was to become Axel, was f~stmentioned on the Significant Tropical Weather Advisory at 030600Z. As the equatorial westerly windsdied down, the convection began to consolidate around the twin disturbances. This prompted theissuance of a Tropical Cyclone Formation Alert on Axel at 0500302, and the first warning at 050600Z.
Strong upper-level divergence over the area enhanced development of the cloud system and Axel(Figure 3-01-2) attained tropical storm intensity based on Dvorak intensity estimates at 060000Z justbefore slamming into the Marshall Islands. Later, at 070000Z, an 85 kt (44 m/see) ship report fkom theSV Cherokee became the basis for an upgrade to typhoon intensity. (In post analysis, comparison of the85 kt (44 m/see) report with observations from the nearby islands of Majuro (WMO 91376), Mili(WMO 91378), Jaluit (WMO 91369) and Ailinglapalap (WMO 91367) caused the SV Cherokee’s to bequestioned.)
By 8 January, Axel and Betsy (11P) were both at typhoon intensity and the distance between thetwo was steadily increasing with Axel headed west and Betsy (11P) south. After Axel reached a peakintensity of 70 kt (36 m,kec) at 080000Z, the typhoon passed just north of Kosrae and Pingelap (Figure3-01-3) in the eastern Caroline Islands. Continuing to track south of the subtropical ridge axis and west-ward towards Guam, the typhoon weakened due to increasing vertical wind shear. As a consequence,JTWC downgraded Axel to a tropical storm at 091800Z, shortly after the cyclone passed 15 nm (30 km)north of Pohnpei (WMO 91348), where a maximum sustained winds of 30 kt (15 m/see) and a peak gustto 48 kt (25 m/see) were reported. Six hours after being downgraded to a tropical depression at130000Z, Axel passed 90 nm (165 km) to the southwest of Guam. The tropical cyclone recurved a daylater. As Axel was transitioning to an extratropical low and accelerating into the mid-latitude westerlyflow, JTWC issued the final warning on the system at 150000Z.
37
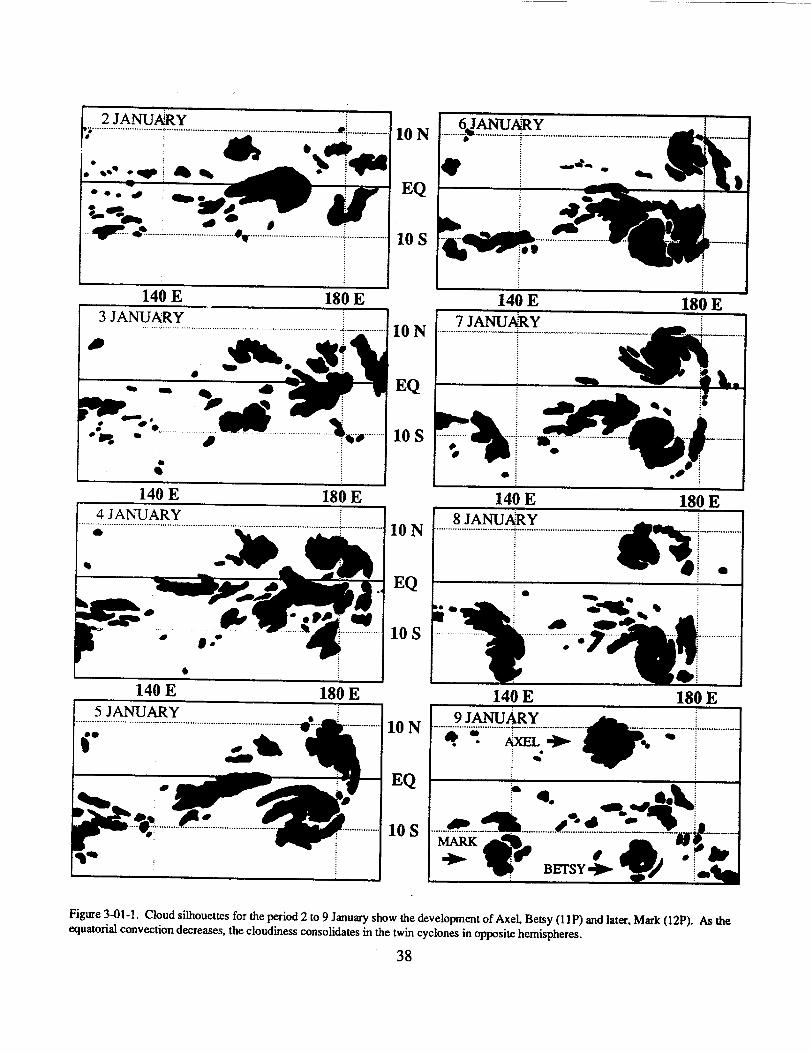
2 JANU&Y**.............................<........................................ ....................K........- ;__...........●
*!
a
10 N
●
‘.~j~~● ●*-o.~ EQ
.:-$!- .....................................@w........................................~.................10 s
I
140 EI
I180 E
3 JANUARY 1.. .. . . . . . . .......= ...-- .....
#
●“o-
P
.:
I140 E
1180 E
4 JANUARY 1
10N
EQ
10s
)
140E 180E7JAIWL4RY
- *,.
............. ....— -&._.....--- . . ......... ..... —-—
7+~..:4*~._..
m;
10N
EQ
10s
10N
EQ
10s
141
k
8JANUA.................................
● -
E 180ECY
$s
............................................... ..-..+.._............
,/ *
● -a*o%* :
m -*
r“”””””””’’’’”””””’”’”””““7 *fi●
..... ..●
*~140E 180Eh
I-$FF-K~;-r~---...-?@. * •,~
.......e.....* -%.--..........2.+ ‘- ~...............-..—.._--_... -------MARK
qhill
*
~$
+ ●?&BETSY~ ~ ;9
Figure 3-01-1. Cloud silhouettes for the period 2 to 9 January show the development of Axel, Betsy (1 1P) and later, Mark (12P). As theequatorial convection decreases, the cloudiness consolidates in tie twin cyclones in opposite hemispheres.
38
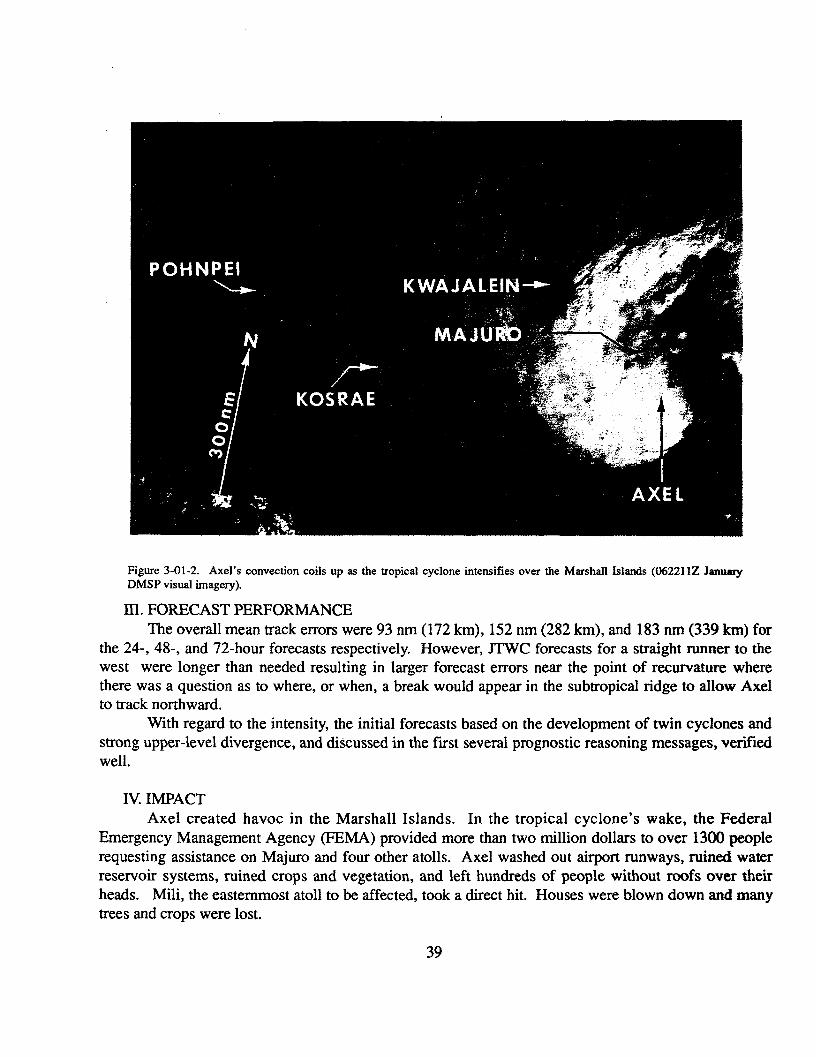
Figure 3-01-2. AxeI’s convection coiis up as the tropical cyclone intensifies over the Marshall Islands (06221 IZ JanuqDMSP visual imagery).
III. FORECAST PERFORMANCEThe overall mean track errors were 93 nm (172 km), 152 nm (282 km), and 183 nm (339 km) for
the 24-, 48-, and 72-hour forecasts respectively. However, JTWC forecasts for a straight runner to thewest were longer than needed resulting in larger forecast errors near the point of recurvature wherethere was a question as to where, or when, a break would appear in the subtropical ridge to allow Axelto track northward.
With regard to the intensity, the initial forecasts based on the development of twin cyclones andstrong upper-level divergence, and discussed in the fiist several prognostic reasoning messages, verifiedwell.
IV. IMPACTAxel created havoc in the Marshall Islands. In the tropical cyclone’s wake, the Federal
Emergency Management Agency (FEMA) provided more than two million dollars to over 1300 peoplerequesting assistance on Majuro and four other atolls. Axel washed out airport runways, ruined waterreservoir systems, ruined crops and vegetation, and left hundreds of people without roofs over theirheads. Mili, the easternmost atoll to be affected, took a direct hit. Houses were blown down and manytrees and crops were lost.
39

Majuro (WMO 91 367) experienced peak gusts of 46 kt (24 rn/see) and a low pressure of 997.0mb as Axel passed 75 nm (139 km) to the south. Unfortunately for Majuro, Axel’s closest point ofapproach coincided with high tide. The high surf, estimated to be in the 13 to 16 foot range on top ofthe high tide, broke pipes and washed sand, coral rock, and debris onto the island’s runway which dou-bles as a water catchment system and provides almost 90% of the fresh drinking water. Despite the factthat almost 10 inches (254 mm) of rain from Axel fell in a 24-hour period, salt water contaminated mostof the water supplies on the island. Sanitation became an immediate problem due to water wells, tanksand toilets being damaged by AxeI’s passage. The airport was closed for five days while bulldozerswere used to clear off the larger debris. The south shore reefs were damaged when huge chunks of coralwere ripped out and rolled across the reef. Trees, brush and other debris from the land washed onto thereefs adding to the loss. On land, food crops were ruined by the wind and flooding.
Then, Axel passed across Jaluit Atoll and over four feet of water covered most of the mainislands. The strong winds deposited rocks and coral debris on runway and washed away portions ofairsrnp. Additionally, over one half of the outhouses were destroyed, resulting in serious health con-cerns for the islanders. Farther north, Kwajalein Atoll, 170 nm (315 km) north of track, experiencedmaximum sustained winds of only 25 with gusts to 35 kt (10 G 18 m/see) and reported no damage orinjuries.
In the eastern Caroline Islands, Kosrae (WMO 91356) which was 40 nm (75 km) south of trackexperienced maximum sustained winds of 65 G 80 kt (33 G 41 rrdsec) resulting in severe crop losses,trees and vegetation damaged, and some wooden and tin-roofed structures destroyed. Just south oftrack, Pingelap (Figure 2) and Mokil atolls located east of Pohnpei had their airstrips 60% damaged bythe storm surge and the runways were closed for months afterward for repairs. Some wood and tinroofed structures were destroyed. An estimated 50-60% of the small vegetation, such as bananas, waslost, plus some large coconut and breadfruit trees uprooted. As Axel passed 15 nm (30 km) north of thePohnpei, the island’s elecrncal power was knocked out for 8 hours and houses and building in low-lyingareas flooded. Banana and breadfruit trees suffered extensive damage. The storm surge was estimatedat 15 feet on the offshore islands and 9.73 inches (247 mm) of rain was recorded in a 24-hour period asthe cyclone passed. And finally, Axel was weakening as it passed 90 nm (170 km) southwest of Guam,where no damages or injuries were reported.
40
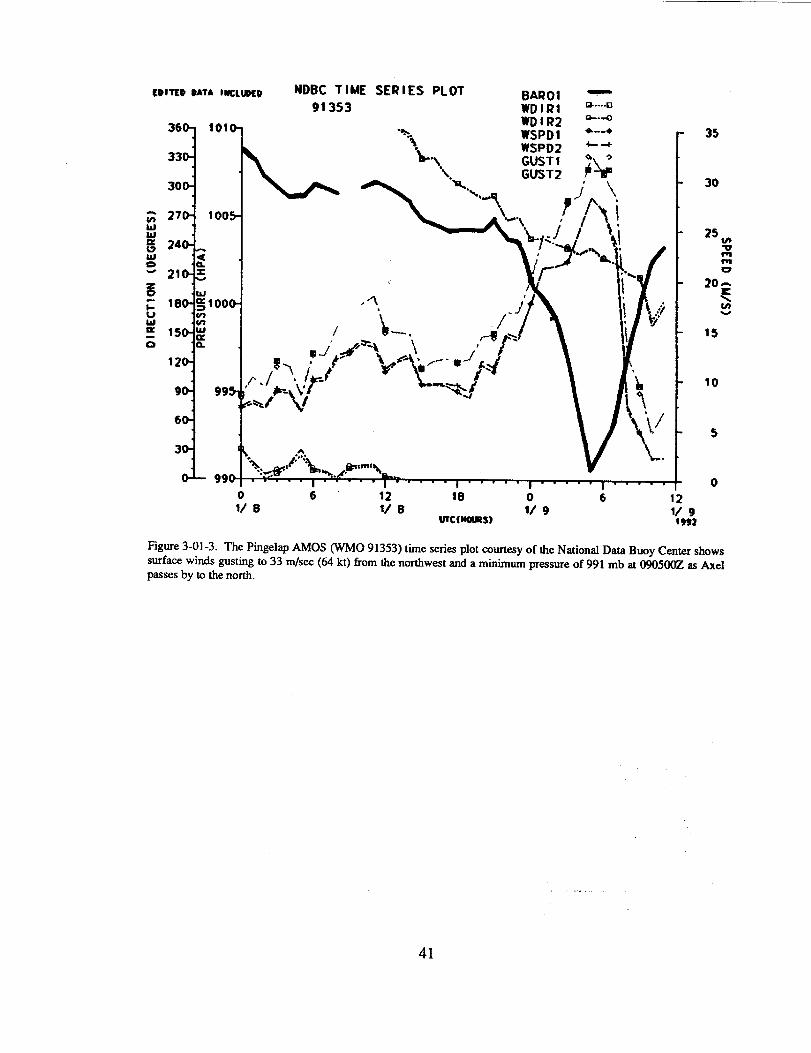
CDITEO PATA IUCLWEP NDBC TIME SERIES P1.oT Bfmol -91353 WlllRl ‘“”””n-...
3’9 ‘“’”l
F’- ‘k.\ WSPD2 :+GUST 1
$$
Y *“X”’*+ ‘uST’.J’. “.
00“i u“”’.. /’7-?!
Mm-l .’l ;i\--- I
II,-.
/ ‘b-,
o 6“ 12 i8 o ;1/ 8 1/ B 1/ 9
uTc(maRs)
35
30
25 ~
zm
20::u
15
10
5
0
9)92
Figure 3-01-3. The Pmgelap AMOS (WMO 91353) time series plot courtesy of the National Data Buoy Center showssurface winds gusting to 33 m/see (64 kt) from the northwest and a miniiurn pressureof 991 mb at 090500Z as Axelpasses by to the north.
.
41
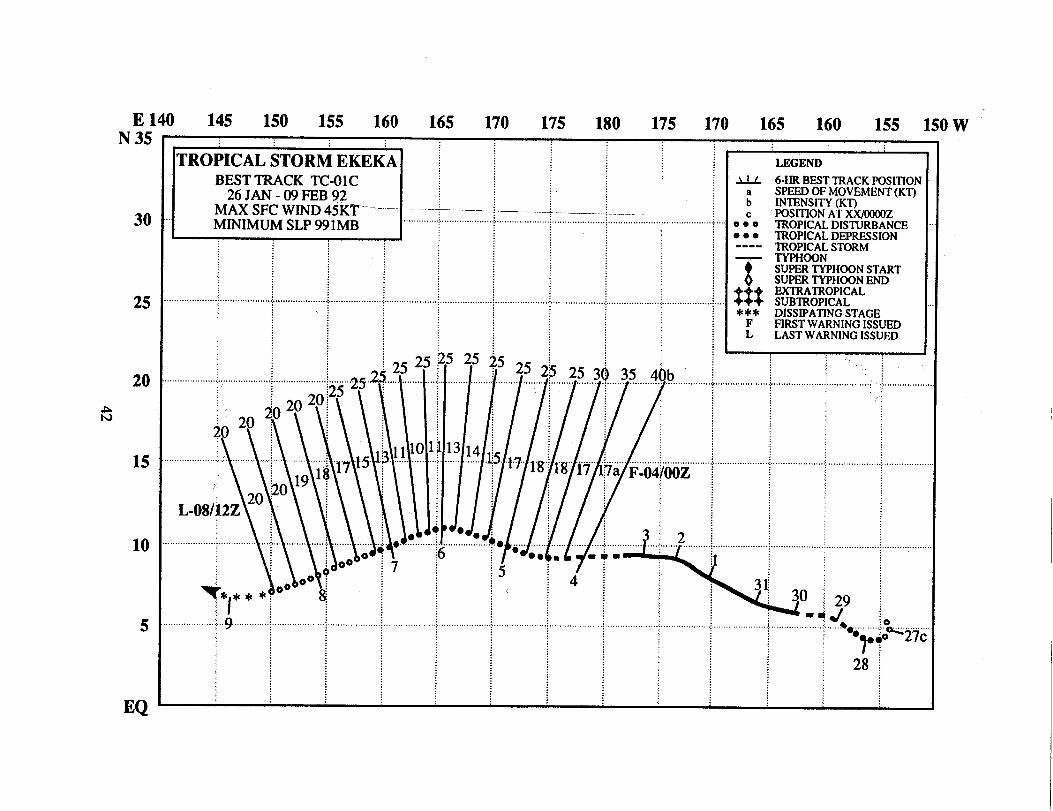
u)v):*:~
~
m$*
N>
:......
*..:..
....
....,:
7:%
;ow
‘P.............................................
;N~:+~~~~--j.~.....
~~.-.................................................................,;,;~:~ S
K;.:
'"`'"``""""""""
""""'"}'"!
"`"`""""""
'""'""""""""''"'"''"{'""'
'..............ei--.......
-xj:,:
y-J. ..2
‘--”4::
*.....................................................,.
m..L.............................-
.................].................................{................................%...
.....................~..........................i:;:,,
r~h:
i;~
--“
.-....-...... ...2....;...*.
....
*;.:
3:d
:
m:
●:
................. ..2..............................z...................................9...............m
:*!
4m
:Q
:~:
A
e-1~..........................~’
....
N--+=
pm’:
m.........................
:
ii1;
ml
.................,;●
!●
;a“r-
k~~>o”’””””””””~”’”
:o=
;N~&
”””’””-”r””””J--
‘..........+
.......~..............................*:
5221!~_~----A
.(
\..............................................................................
I .........i;
!‘“3%................................................................8.
.....
.~:~~.:am
QH
.:/
..:...&.!~~~~~~
~~~~~~~,
P.......j.
............00:
q:
d:
omo=?
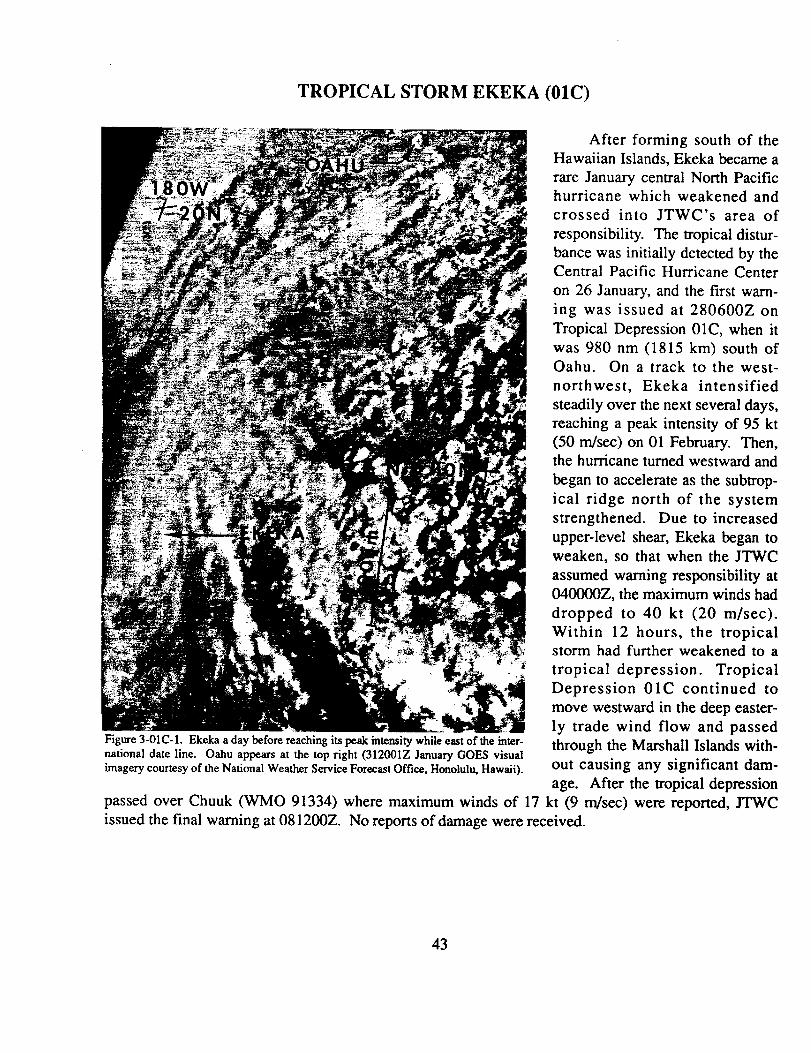

E 105 110 115 120 125 130 135 140 145 150 155 160 165EN 45
40
35
30
25t
20
15
10
5
EQ
REEi!v .....’’’’’’”’.’”’”’”””’”’~:i’”’’~””I MAX SFC WIND 120 KT
,,,,..... ... ,;:.. .. ;
MINIMUM SLP 922 MB ..... .....
‘... “’.,“’..... .
‘.....i.,:.
,..’.’,,,...
,.,,~....................
,,
=... ~ :29; ““””””’’’””””~’”””’””““”””
>
~ ~-’-- \
//-/
4:30b ;j ,,.. ,,. . S@ . . . . . . ... . . . . . . . . . . . . . . . . . . . . . . ,
: F-23/l~Z
II/‘:*j&’231 22 ~,,,,,,.,,~?4..*04.,+oodioo;
r“““““”””’’””””’”21””””””’”
‘“400 2(-75 {~; j ; ,l,~v 10 ; TCFA. ‘ ~; .....,,,,.,., //
: 70 “’”” ‘ ““ ‘94.“%.,.,,,,,,.... ....;...,..,,.;.... ;.... . ,:........ :,..’,,. v::~.:., : : 33 45:,,.,...... ... :
....J.”H .,:,.,.....“63 -i :
.:........................ABP.W. .. .
,y
,..&..
Alk,
. .......
,.
...
,.“’
..
..........
........ . . ... ...
.............
.......... .........
LEGEND
—
............... ....
000 TROPICALDISliRl● ● ● TROPICAL DEPREs!
~OVCYICP STORM
$ SUPERTiPHOON SSUPERTYPHOONE
%%%EXIRATROPICALSUBTROPICAL
xxx DISSIPATINGSTAGFIRST WARNING IS
: LAST WARNING 1SS
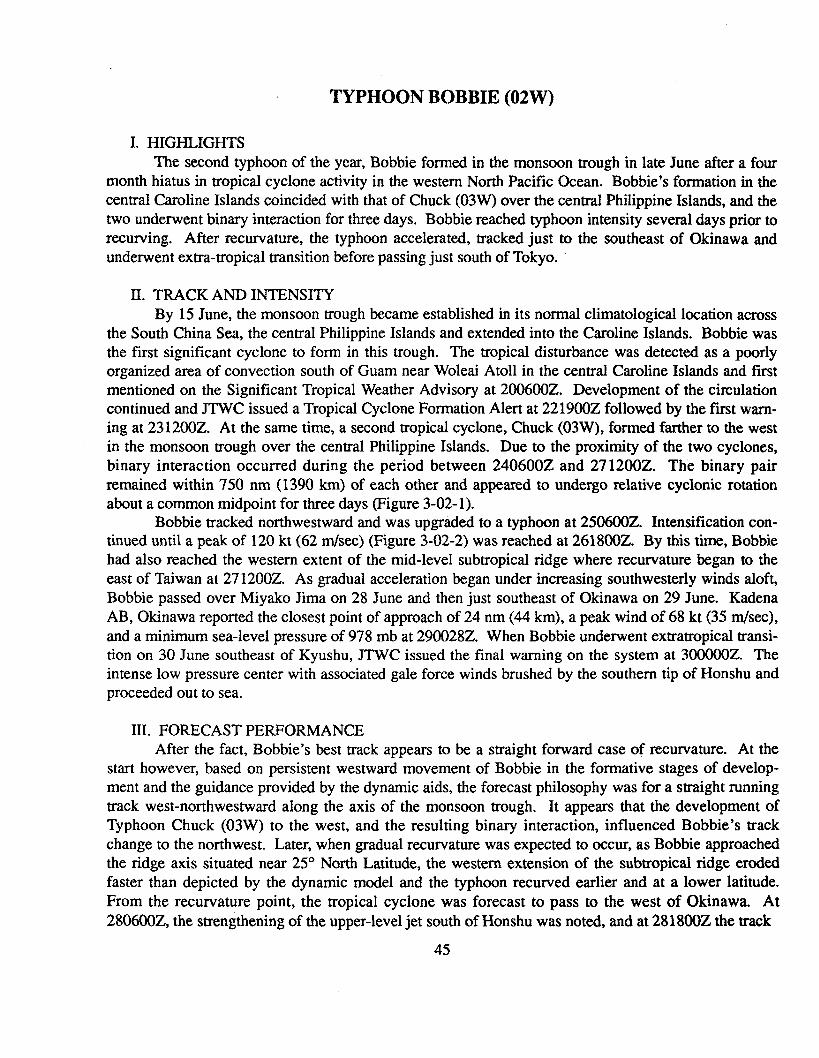
TYPHOON BOBBIE (02W)
I. HIGHLIGHTSThe second typhoon of the year, Bobbie formed in the monsoon trough in late June after a four
month hiatus in tropical cyclone activity in the western North Pacific Ocean. Bobbie’s formation in thecentral Caroline Islands coincided with that of Chuck (03W) over the central Philippine Islands, and thetwo underwent binary interaction for three days. Bobble reached typhoon intensity several days prior torecurving. After recurvature, the typhoon accelerated, tracked just to the southeast of Okinawa andunderwent extra-tropical transition before passing just south of Tokyo.
II. TRACK AND INTENSITYBy 15 June, the monsoon trough became established in its normal climatological location across
the South China Sea, the central Philippine Islands and extended into the Caroline Islands. Bobbie wasthe first significant cyclone to form in this trough. The tropical disturbance was detected as a poorlyorganized area of convection south of Guam near Woleai Atoll in the central Caroline Islands and firstmentioned on the Significant Tropical Weather Advisory at 200600Z. Development of the circulationcontinued and JTWC issued a Tropical Cyclone Formation Alert at 221900Z followed by the fiit warn-ing at 231200Z. At the same time, a second tropical cyclone, Chuck (03W), formed farther to the westin the monsoon trough over the central Philippine Islands. Due to the proximity of the two cyclones,binary interaction occurred during the period between 240600Z and 271200Z. The binary pairremained within 750 nm (1390 km) of each other and appeared to undergo relative cyclonic rotationabout a common midpoint for three days (Figure 3-02-1).
Bobbie tracked northwestward and was upgraded to a typhoon at 250600Z. Intensification con-tinued until a peak of 120 kt (62 rrdsec) (Figure 3-02-2) was reached at 261800Z. By this time, Bobbiehad also reached the western extent of the mid-level subtropical ridge where recurvature began to theeast of Taiwan at 271200Z. As gradual acceleration began under increasing southwesterly winds aloft,Bobbie passed over Miyako Jima on 28 June and then just southeast of Okinawa on 29 June. KadenaAB, Okinawa reported the closest point of approach of 24 nm (44 km), a peak wind of 68 kt (35 m/see),and a minimum sea-level pressure of 978 mb at 290028Z. When Bobbie underwent extratropical transi-tion on 30 June southeast of Kyushu, JTWC issued the final warning on the system at 300000Z. Theintense low pressure center with associated gale force winds brushed by the southern tip of Honshu andproceeded out to sea.
III. FORECAST PERFORMANCEAfter the fact, Bobbie’s best track appears to be a straight forward case of recurvature. At the
start however, based on persistent westward movement of Bobbie in the formative stages of develop-ment and the guidance provided by the dynamic aids, the forecast philosophy was for a straight runningtrack west-northwestward along the axis of the monsoon trough. It appears that the development ofTyphoon Chuck (03W) to the west, and the resulting binary interaction, influenced Bobbie’s trackchange to the northwest. Later, when gradual recurvature was expected to occur, as Bobbie approachedthe ridge axis situated near 25° North Latitude, the western extension of the subtropical ridge erodedfaster than depicted by the dynamic model and the typhoon recurved earlier and at a lower latitude.From the recurvature point, the tropical cyclone was forecast to pass to the west of Okinawa. At280600Z, the strengthening of the upper-level jet south of Honshu was noted, and at 2818002 the track
45
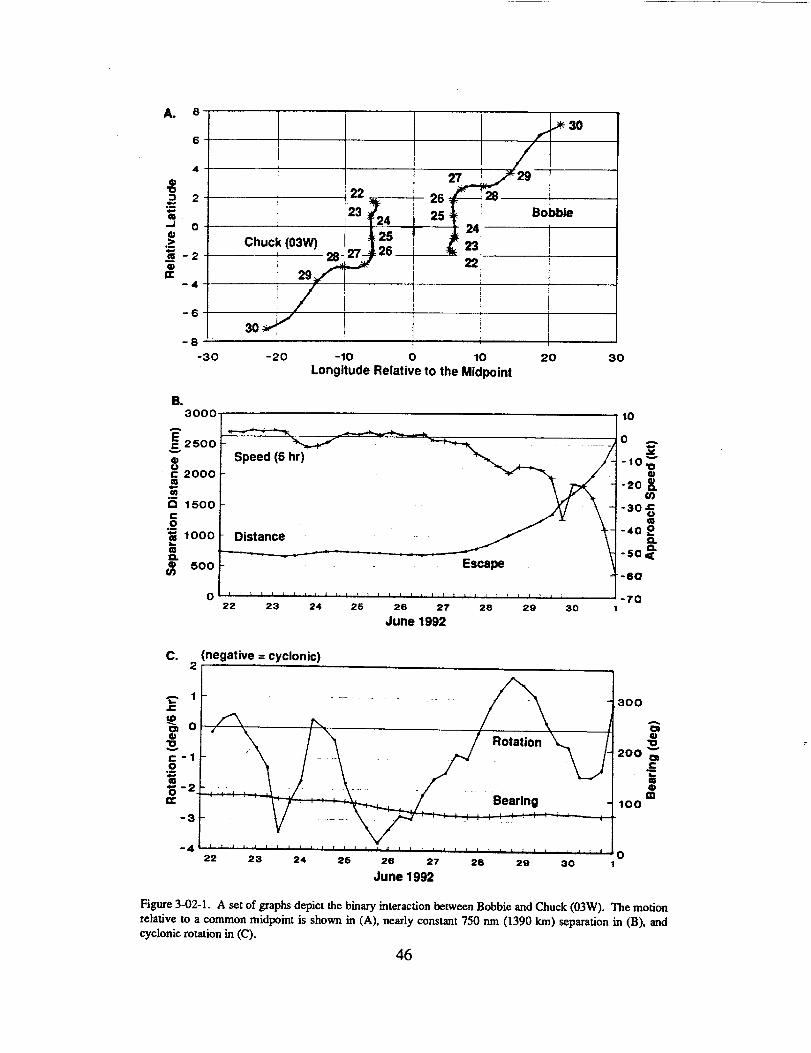
A 0
6
4- 1
2
0
IChuck (03W)2
4I
6
8’, I I
-30 -20 -lo 0 10 20 30Longitude Relative to the Midpaint
B.3000, 110
~ 2500 :—-—w——————.al Speed (6 hr)
: 2000 -m%ii 1500 -
5“g 1000 - Distancea
; 500 -
o“ I22 23 24 25 28 29 30 1
J;;e 199;
-Sff
-7Q
Figure 3-02-1. A set of graphs depict the binary interaction between Bobbie and Chuck (03W). The motionrelative to a common midpoint is shown in (A), nearly constant 750 nm (1390 km) separation in (B), andcyclonic rotation in (C).
46
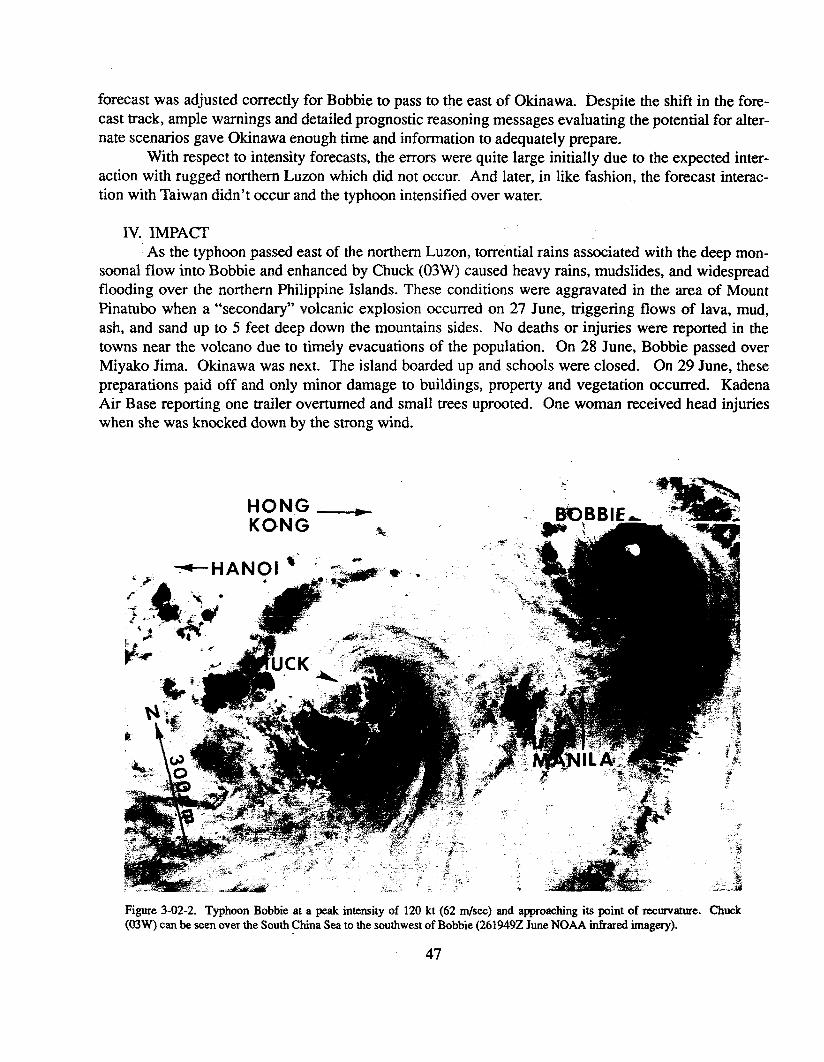
forecast was adjusted correctly for Bobbie to pass to the east of Okinawa. Despite the shift in the fore-cast track, ample warnings and detailed prognostic reasoning messages evaluating the potential for alter-nate scenarios gave Okinawa enough time and information to adequately prepare.
With respect to intensity forecasts, the errors were quite large initially due to the expected inter-action with rugged northern Luzon which did not occur. And later, in like fashion, the forecast interac-tion with Taiwan didn’t occur and the typhoon intensified over water.
IV. lMPA~As the typhoon passed east of the northern Luzon, torrential rains associated with the deep mon-
soonal flow into Bobble and enhanced by Chuck (03W) caused heavy rains, mudslides, and widespreadflooding over the northern Philippine Islands. These conditions were aggravated in the area of MountPinatubo when a “secondary” volcanic explosion occurred on 27 June, rnggering flows of lava, mud,ash, and sand up to 5 feet deep down the mountains sides. No deaths or injuries were reported in the
towns near the volcano due to timely evacuations of the population. On 28 June, Bobble passed over
Miyako Jima. Okinawa was next. The island boarded up and schools were closed. On 29 June, thesepreparations paid off and only minor damage to buildings, property and vegetation occurred. KadenaAir Base reporting one trailer overturned and small trees uprooted. One woman received head injurieswhen she was knocked down by the strong wind.
Figure 3-02-2. Typhoon Bobbie at a peak intensity of 120 kt (62 m/see) and approaching its point of recurvature. Chuck(03W) can be seen over the South China Seato the southwest of Bobbie (261949Z June NOAA rnfraTed imagery).
47
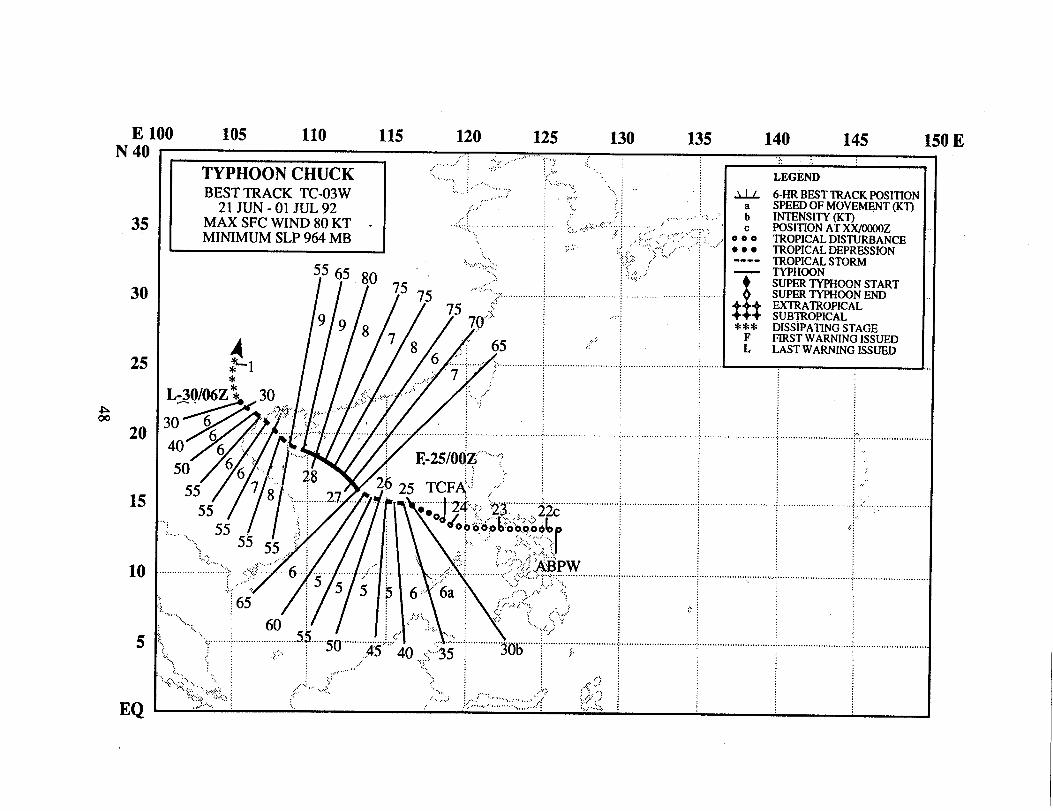
ol-i
o
:!,
,.,.....
............
............................
.,
Id“
:=
“,..j
::
..”””’”””.::;”f
.......,+
.,...................“
TYPHOON CHUCK (03W)
I. HIGHLIGHTSChuck was the first tropical cyclone of the year in the South China Sea. Genesis occurred in the
monsoon trough at the same time in late June as Bobbie (02W) and binary interaction took place overthe first few days of development.
II. TRACK AND INTENSITYChuck developed over the central Philippines as part of a multiple tropical cyclone outbreak, and
the Significant Tropical Weather Advisory was reissued at211900Z to include the event. In conjunctionwith this development, gradient-level wind reports as far to the west as the Malay Peninsula showed anoverall increase of 10 kt (5 rn/see) to the 25-35 kt (13-18 mhc) range. As the amount and organizationof the convection continued to increase, JTWC issued a Tropical Cyclone Formation Alert at 2404302.The fnst warning followed at 2500002, and 12 hours later, Chuck was upgraded to a tropical stormbased on satellite and ship synoptic reports. Tracking slowly along the monsoon trough axis, Chuckmoved to the west-northwest as it underwent binary interaction with Bobbie (02W) (Figure 3-03-1).Even after 271200Z, when Typhoon Bobbie (02W) began to recurve and the separation distancebetween the two cyclones started to increase, Chuck showed very little change in track.
A wind report of 60 kt (31 m/see) and a 981.4 millibar pressure from Xisha Qundao (WMO59981), was the basis for upgrading Chuck to typhoon intensity at 271200Z. Xisha recorded a mini-mum sea-level pressure of 966.2 mb (Royal Observatory, June 1992) during the typhoon’s passage.Chuck remained a typhoon until it hit the southern tip of Hainan Dao on 28 June. The station at Yaxian(WMO 59948) reported a pressure of 964.1 mb (Royal Observatory, June 1992) when the typhoon madelandfall 20 nm (37 km) to the northeast. Chuck weakened slightly as it passed over the southern tip ofHainan Dao, crossed the Gulf of Tonkin and slammed in northern Viemam on 29 June. The final warn-ing was issued at 300600Z, as Chuck dissipated over land.
III. FORECAST PERFORMANCEThe overall mean errors were 106 nm (196 km), 207 nm (380 km) and 331 nm (610 km) for the
24-, 48-, and 72-hour track forecasts respectively. At the start, larger track errors were associated withforecasts based on a more westerly straight-running track in agreement with the dynamic guidance thatturned out to be to the left of track. And later, forecasts based on premature recurvature to the northwere to the right of track.
IV. IMPACTNavy patrol aircraft from Kadena Air Base and Cubi Point NAS, Philippines, searched for two
ships in distress and 22 crew members missing after Typhoon Chuck crossed the South China Sea.Only flotsam, oil slicks, and other debris were found. On Hainan Dao, one death and 19 injuries werereported, plus extensive damage to houses and crops. In northern Vietnam, at least 21 people died and80 were reported missing. In addition, many watercraft were sunk, houses destroyed, and power linesdowned.
49
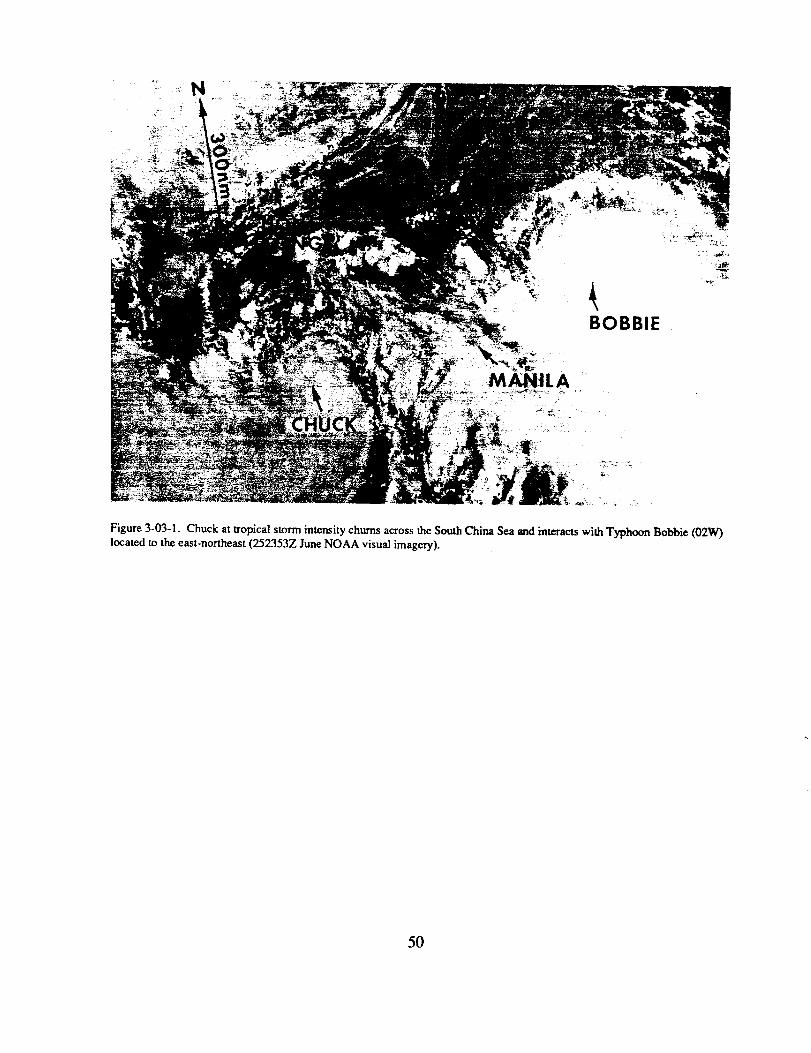
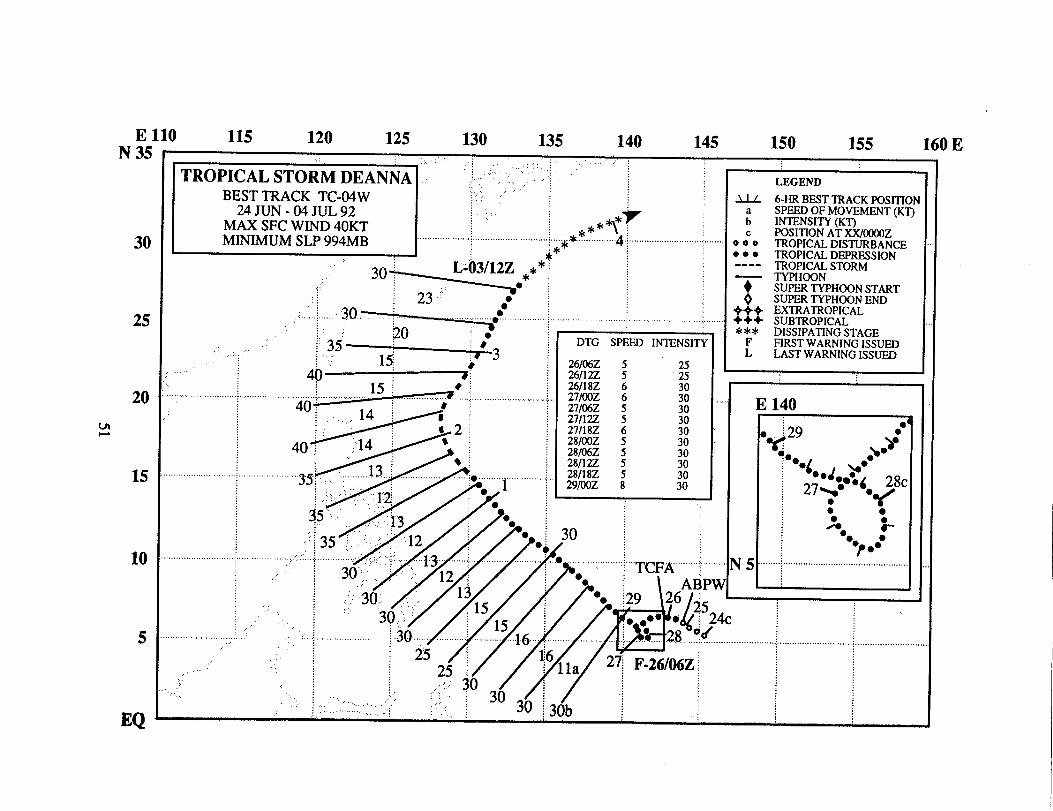
E 110N 35
30
25
20
WI
15
10
5
EQ
115 120 125 130 135 140 145 150 155 160E,,, ,.,,.,
TROPICAL STOlilVl DEANNA ,: “’,f;: ““ :.,:,,BEST TRACK TC-04W 1:’,’
24 JUN -04 JUL 92:,:.. .’
MAX SFC WIND 40KTMINIMUM SLP 994MB . .. . ,:.,,,...... .. .,,,,,,,,,
.,.,.,
.,..
30 ; L=03/12Z ***●~3~
●
.:.::;..... 30. :.. ●’ ,...,,,,,:.,:.,: ~o : :0”””’””’:’3~ ;
1: 6°3
4./” :0
~-
....................... .,,.
. ...,,>,,,,...,..,,,.,,,,,,,
.,: ....:.,/.’,,’.......... ..
DTG SPEED INTENSITY
26/06Z26/122 :26/18Z271002 :27/06Z 527/122 527/18Z 628/002 528/06228/122 i28/18Z291002 :
2525
30303030
/30 ;
LEGEND I
abc
000● **----
+0
++++++***
[FIRST WARNING ISSUEDLAST WARNING ISSUED
I
E 140
!0 ....................~ TCFA”’””’’””””;”””””
AEiPWp, ~‘e !29 26 ~~ ,
p+ ~
. .0. ● !24C :● 2.8....”~ !......... . . . . .,..,,,:.,,.... ..................... . ......... ,,
27~ F.26/f’J6z;lla ,
lob ~
.
.
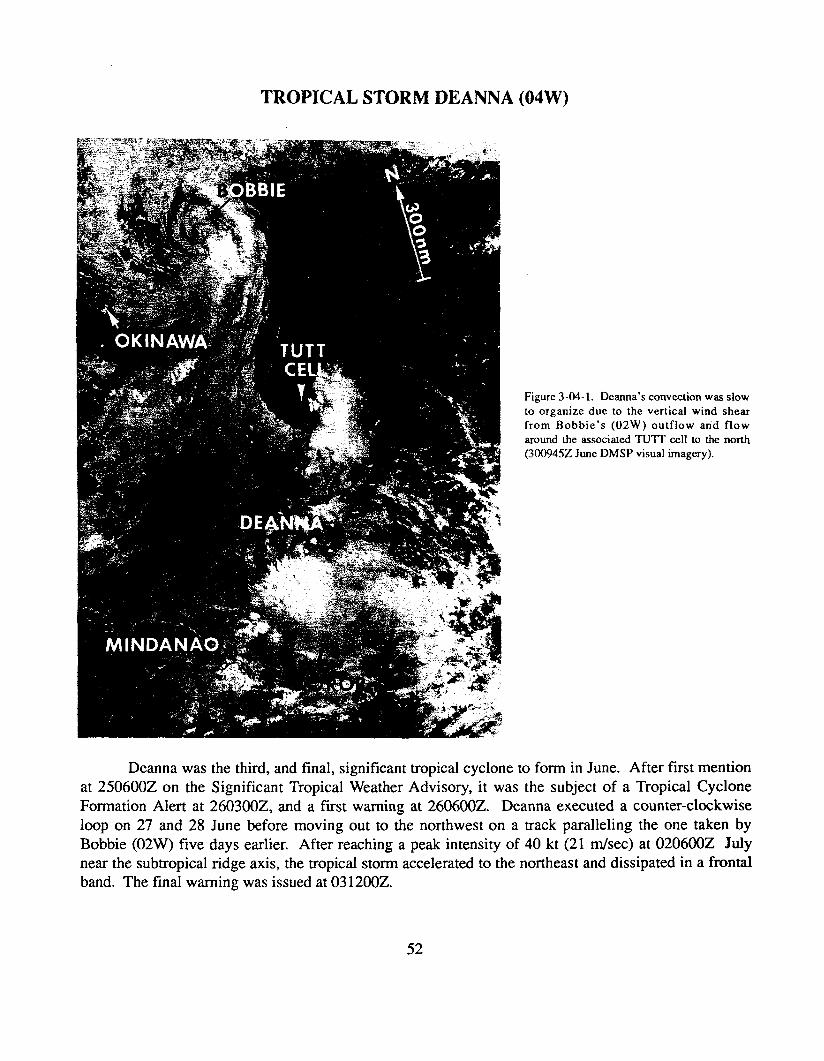
TROPICAL STORM DEANNA (04W)
Figure 3-04-1. Deanna’s convection was slowto organize due to the vertical wind shearfrom Bobbie’s (02W) outflow and flowaround the associated TUTT cell to the north(300945Z June DMSP visual imagery).
Deanna was the third, and final, significant tropical cyclone to form in June. After first mentionat 250600Z on the Significant Tropical Weather Advisory, it was the subject of a Tropical CycloneFormation Alert at 260300Z, and a first warning at 260600Z. Deanna executed a counter-clockwiseloop on 27 and 28 June before moving out to the northwest on a track paralleling the one taken byBobbie (02W) five days earlier. After reaching a peak intensity of 40 kt (21 m/see) at 020600Z Julynear the subtropical ridge axis, the tropical storm accelerated to the northeast and dissipated in a frontalband. The final warning was issued at031200Z.
52
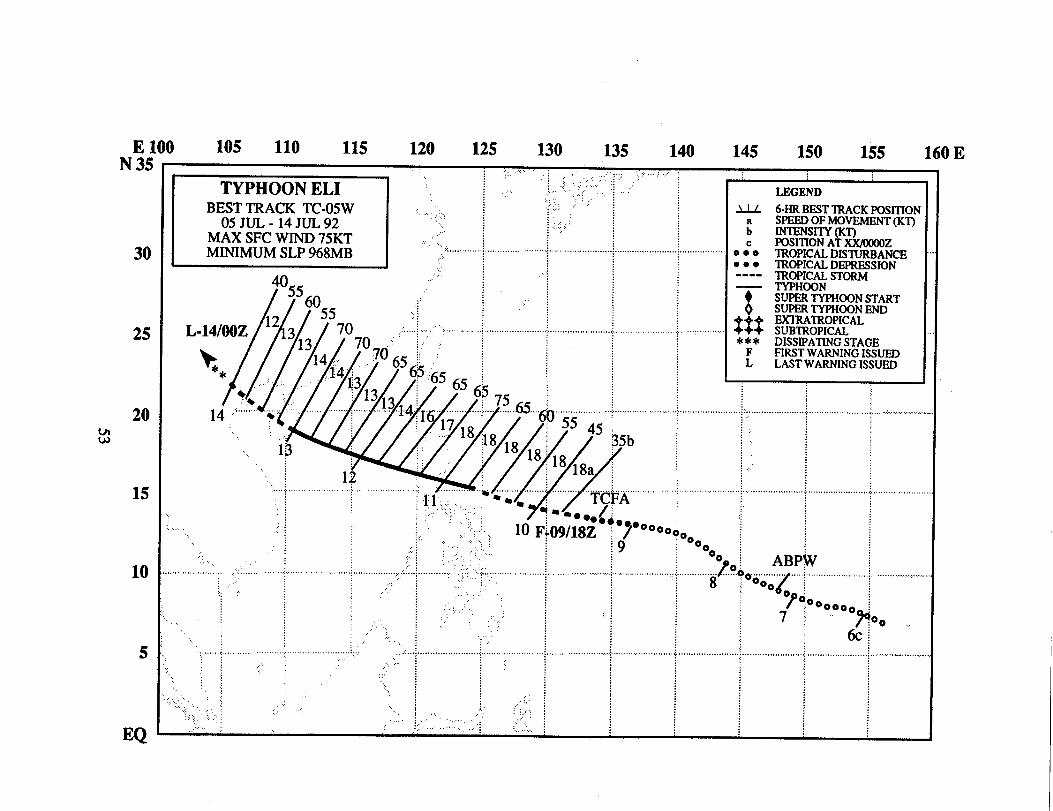
..
.....................................
....................................................
:,
.:.:..-..
..........,,..
..........
.............
,.;
............
.0°
/....... . ..e?.....
.:,...................o:a
-..
.......s
;4*K-
~
““”””””’”’”’\xl...............ii.....*.......................................
;U3
Q,*
;.-
:-t
$-:~
;c%
”1-:
9~:>
~i~~,.\\
+!80
-’,...-‘...
........=
.......&.........................................
..........................
...........................
. .:.....’,
........
....‘....
.........................
..........................
... ..”’.
“,.,......
~..>
~..;.........
;...,..
.........
F.:.2
:!4;
:,
;...
~~~
&!,
::
:,
S$ji::
~~m.;:‘
::.,,,.~
..........................................................................:.....:.
WC
-J~
:.,.,,.
:0:.
●:
.,..
”‘,...+
.
&:
8“;””“’
sA
“”“
:..................-....Y
....-+.’-.
..-....>.
.......
..:
,:.....
..
....’..
IA,.,::
..,,.:...::
,.’
...
53
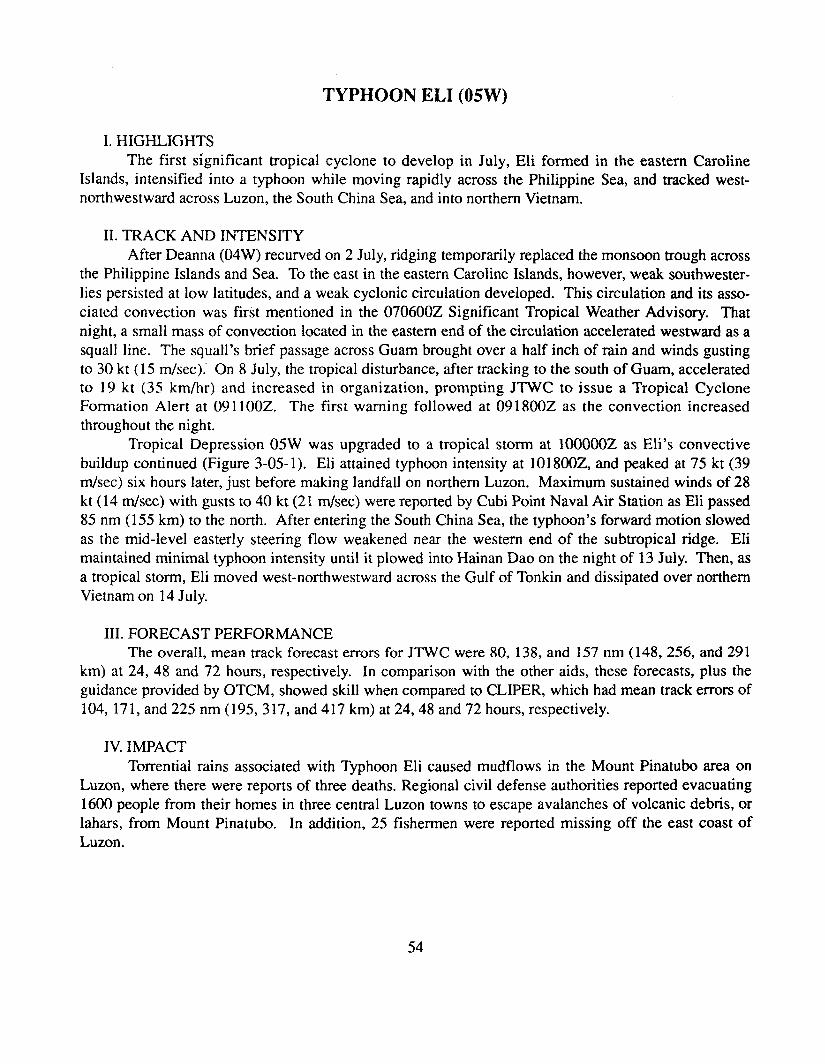
TYPHOON ELI (05W)
L HIGHLIGHTSThe first significant tropical cyclone to develop in July, Eli formed in the eastern Caroline
Islands, intensified into a typhoon while moving rapidly across the Philippine Sea, and tracked west-northwestward across Luzon, the South China Sea, and into northern Vietnam.
II. TRACK AND INTENSITYAfter Deanna (04W) recurved on 2 July, ridging temporarily replaced the monsoon trough across
the Philippine Islands and Sea. To the east in the eastern Caroline Islands, however, weak southwester-lies persisted at low latitudes, and a weak cyclonic circulation developed. This circulation and its asso-ciated convection was first mentioned in the 070600Z Significant Tropical Weather Advisory. Thatnight, a small mass of convection located in the eastern end of the circulation accelerated westward as asquall line. The squall’s brief passage across Guam brought over a half inch of rain and winds gustingto 30 kt (15 rn/see).’ On 8 July, the tropical disturbance, after tracking to the south of Guam, acceleratedto 19 kt (35 km/hr) and increased in organization, prompting JTWC to issue a Tropical CycloneFormation Alert at 0911002. The first warning followed at 0918002 as the convection increasedthroughout the night.
Tropical Depression 05 W was upgraded to a tropical storm at 1000OOZ as Eli’s convectivebuildup continued (Figure 3-05- 1). Eli attained typhoon intensity at 1018002, and peaked at 75 kt (39
m/see) six hours later, just before making landfall on northern Luzon. Maximum sustained winds of 28kt (14 m/see) with gusts to 40 kt (21 m/see) were reported by Cubi Point Naval Air Station as Eli passed85 nm (155 km) to the north. After entering the South China Sea, the typhoon’s forward motion slowedas the mid-level easterly steering flow weakened near the western end of the subtropical ridge. Elimaintained minimal typhoon intensity until it plowed into Hainan Dao on the night of 13 July. Then, asa tropical storm, Eli moved west-northwestward across the Gulf of Tonkin and dissipated over northernVietnam on 14 July.
III. FORECAST PERFORMANCEThe overall, mean track forecast errors for JTWC were 80, 138, and 157 nm (148, 256, and 291
km) at 24, 48 and 72 hours, respectively. In comparison with the other aids, these forecasts, plus theguidance provided by OTCM, showed skill when compared to CLIPER, which had mean track errors of104, 171, and 225 nm (195, 317, and 417 km) at 24,48 and 72 hours, respectively.
IV. IMPACTTorrential rains associated with Typhoon Eli caused mudflows in the Mount Pinatubo area on
Luzon, where there were reports of three deaths. Regional civil defense authorities reported evacuating1600 people from their homes in three central Luzon towns to escape avalanches of volcanic debris, orlahars, from Mount Pinatubo, In addition, 25 fishermen were reported missing off the east coast ofLuzon.
54

Figure 3-05-1. As Eli intensities, a circular exhaust cloud (CEC’) appears superimposed on the central dense overcasLThe low angle of the sun to the east accentuates the cloud-top topography, revealing a concentric, or tree ring-like pat-tern of gravity waves in the top of the CEC (092354Z July DMSP visual imagery).
55
Fi
.:
. ...0..00°
.............
..............
....................
ski....,..,.....
0°‘“
;*
..............,..:...,..,.............
............
...
.....
,..........
..
..
...
..
. ...!.
n.
5u3
z–-
0mozomz
oNu’)
VJ
TROPICAL STORM FAYE (06W)
Faye, the second of three suc-cessive tropical cyclones to passover northern Luzon and intensifyin the South China Sea, was firstmentioned in the 130600Z JulySignificant Tropical WeatherAdvisory after synoptic data in thewestern Caroline Islands revealed acyclonic circulation in the low-level wind field. As the circulationcrossed the Philippine Sea, its con-vective organization increased,prompting forecasters to issue aTropical Cyclone Formation Alertat 150000Z. After the cloud sys-tem crossed northern Luzon and
the central convection reformed,the first warning was issued at160000Z. Tropical Depression06W proceeded west-northwest-ward until recurving south of HongKong on 17 July. At 170600Z,Faye was upgraded to a tropicalstorm, and shortly thereafter madelandfall with an estimated maxi-
mum intensity of 55 kt (28 m/see).Faye proceeded north-northeast-ward into China and dissipated.The final warning was issued at
18 1200Z.
57
.........g.~~
~....................................
.
a~.
.“
o
4~a~:
GA
!-(Q-%
o*$;
..............oo
?..............................................
O<
m~
\o-
0
....................
..,
L.
L
:0°
...
...
...
..
..
...
.. ...’.”
...
“FL
-...’
“’““”9“-q”’’””-”””
“’”’”””””’””:”””’”””Gw
i>:~v’z.%
’’”””==7-4.
N“
,:m
l
:%:
,
m:,..
,t-1
,,.,..:.
............................
:&‘i””....,,,.:’
,,,,,
%ii\h
~,:~;
●:...;,..,,.”
N●
.—
N●
.,.
-oklmzz
58
TYPHOON GARY (07W)
I. HIGHLIGHTSGary was the last of three consecutive tropical cyclones to cross northern Luzon and intensify in
the South China Sea during July. After early diftlculties locating the low-level vortex, JTWC correctlypredicted that the tropical cyclone would strike the southern coast of China near Hainan Dao. Garycaused widespread damage across southern China.
II. TRACK AND INTENSITYTyphoon Gary’s track paralleled those of Typhoon Eli (05W) and Tropical Storm Faye (06W).
The genesis mechanism for all three was an active monsoon trough, which extended across thePhilippine Sea. On 16 July, mention of an area of vigorous convection was included on the dailySignificant Tropical Weather Advisory. Within 24 hours, its organization had improved sufficiently towarrant a Tropical Cyclone Formation Alert, which was issued at 170630Z. The Alert was reissued at180630Z after the broad low-level circulation, containing multiple vortices, failed to consolidate in thepresence of increased upper-level shear. At 190000Z, convective organization had improved to thepoint that the first warning on Tropical Depression 07W was issued. Because the circulation was largeand poorly organized, there were large differences in the satellite fix positions as satellite analysts atnetwork sites attempted to pinpoint the location of the low-level circulation center. The cloud systemconsolidated and became easier to locate by satellite once it crossed the northern Philippines. Afterbeing upgraded to tropical storm intensity at 201800Z, Gary tracked west-northwestward across theSouth China Sea, and later over the Leizhou Peninsula to the north of Hainan Dao. Shortly before land-fall, Gary developed a large, ragged eye (Figure 3-07-1), which prompted its upgrade to typhoon inten-sity at 221200Z. After reaching an estimated peak intensity of 65 kt (33 m/see), the typhoon made land-fall and dissipated. Ship reports near Hainan Dao indicated that winds in excess of30kt(15 m/see) per-sisted overwater until after the cyclone center was well inland, which necessitated additional tropicalcyclone warnings until 23 1200Z.
111. FORECAST PERFORMANCEJTWC’S track forecasts improved significantly after the low-level circulation center consolidated
on 20 July. Initial position errors fell in the 25 nm (45 km) range in contrast to those a day earlier on 19July, which were in the 125 nm (230 km) range. Early on, JTWC correctly predicted Gin-y’s west-north-westward track across the South China Sea, just as Eli (05W) and Faye (06W) had done less than twoweeks earlier.
IV. IMPACTNews reports indicated that Typhoon Gary’s passage over southern China resulted in the deaths
of 26 people, and injuries to another 63. The southern provinces of Guangdong and Guangxi sufferedextensive flood and wind damage with losses estimated at $148 million (US).
59

Figure 3-07-1. Gary with a large, ragged eye is intensifying aa it approaches We southern coast of China (2202002 JulyDMSP visual imagery).
60

——
.....................................
.......................................
il...*..........
......****““***C
Q*CJ
,,...,...
*// **
%*
.,,...>>,,-.-....,
gqdzo--m
..................
......,
......,..........,.
........
...................
‘m1
,/:/
%.-m
mm‘1 .............
U7
!0
%o*
........
.....................
.,,,,,,,,,8#
_......>.......-
.
......................................
z61

TROPICAL STORM HELEN (08W)
Figure 3-08-1. As Helen weakens, the low-level cloudiness defining its circulation center appears to the south-southwest ofthe central cloud mass (2714012 July NOAA visual imagery).
The fourth of five significant tropical cyclones to develop in July, Helen intensified from aTropical Upper Tropospheric Trough (lW’IT)-induced low-level circulation. The initial SignificantTropical Weather Advisory issued at 250600Z was reissued at251900Z to include mention of a persis-tent area of deep convection. At 252300Z, JTWC issued a Tropical Cyclone Formation Alert when thesystem showed a steady increase in low-level cloud organization. The first warning followed quickly at260000Z, based on visual satellite observations of cunwd low-level cloud lines associated with thismidget tropical cyclone and satellite Dvorak intensity estimates of 25 kt (13 m/see). Helen continued tointensify as it slowly tracked to the north and reached its peak intensity of 45 kt (23 m/see) at 260600Z.The tropical storm began to weaken as it gained latitude and moved into a region of cooler sea-surfacetemperatures. The final warning on this system was issued at 280000Z when satellite image~ indicated
that Helen no longer maintained any persistent central convection.
62
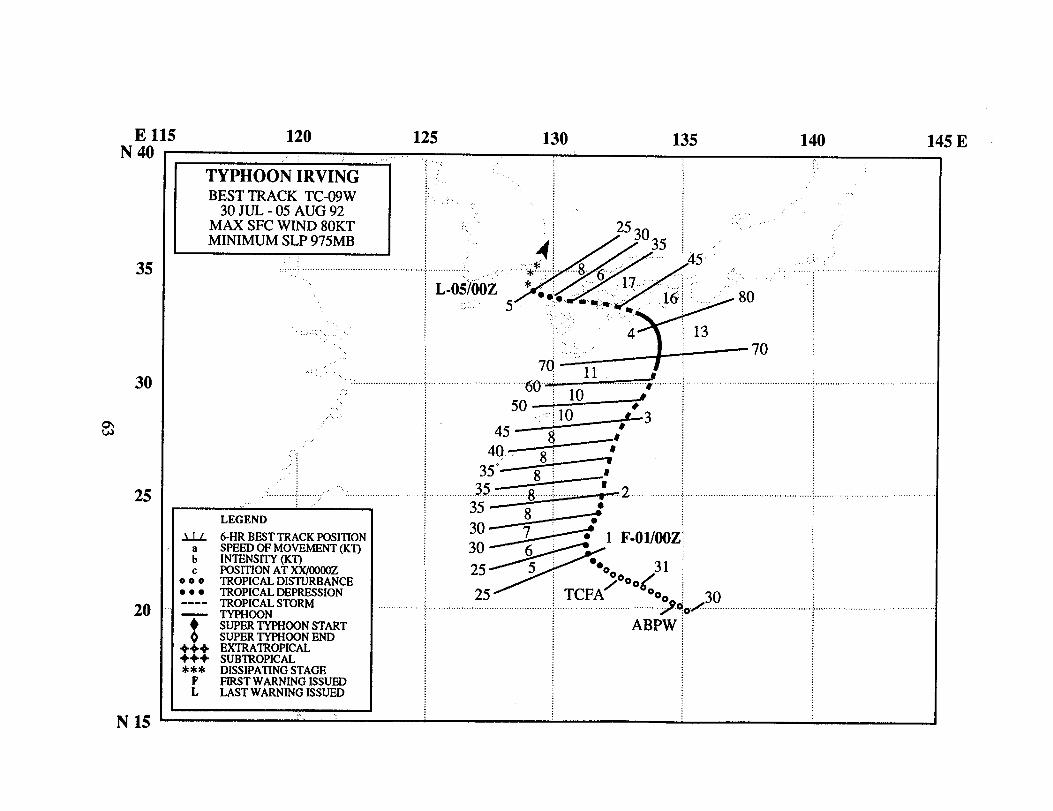
E 115 120 125 130 135 140 145EN 40
35
30
25
20
N 15
TYPHOON IRVINGBEST TRACK TC-09W
30 JUL -05 AUG 92MAX SFC WIND 80KTMINIMUM SLP 975MB
.......... .,.,,,,.. .. ,,,
.......’ ...
.:.:.:.. :
.......................,,. ,,.
----
$++++++***[
LEGEND
6-HR BEST TRACK POSITIONSPEED OF MOVEMENT (KT)INTENSITY (KT)POSITION AT XX/OOOOZTROPICAL DISTURBANCETROPICAL DEPRESSIONTROPICAL STORMTYPHOONSUPER TYPHOON STARTSUPER TYPHOON ENDEXTTWTROPICALSUBTROPICALDISSIPATING STAGEFIRST WARNING ISSUEDLAST WARNING ISSUED
...,.,
L-O#OOZ,..,.
,; 253035 ~
sp~, :-8 (y” “ “ “’““”
:..45 “.
1~:.’ ~~..”.::: .,.-..m.. .“.:’ ,:.,. ...” ..,16’., ,
4,, .,:.~~“ ““”Y
7g” “~~ 1.!...,,,,,
““”’”””60”””’:10,!,,,
●<n b
. . . .
d“
.. ’:10 4-345 j!j _#”40:, fj: 835.:. 8
8:.................35...........8................. jk .
35p-+0 1 F.ol/()(Jz
;~ /25& &o ‘
25/ TCFA~oO~~l ;><.<?O,, . . ..... ,,.,,,,..
,:.
..... . ,.

TYPHOON IRVING (09W)
I. HIGHLIGHTSThe last of five significant tropical cyclones to develop in July, Irving was the first of two suc-
cessive typhoons to affect Southwest Japan. It formed at the eastern end of the monsoon trough whereseveral low-level vorticity centers were embedded in a broad area of poorly organized convection, and
slowly intensified. Initially, track forecasts suffered due to a difficulty in distinguishing a clear-cut,low-level circulation center. Once an accurate track history was established and the Joint TyphoonWarning Center committed to a north-oriented track followed by westward motion due to the expectedreestablishment of the mid-level subtropical ridge north of Irving, forecast errors were significantlyreduced. Intensity estimates based solely on satellite imagery proved to be too low as all forecast agen-cies peaked Irving as a tropical storm. Post-storm analysis has revealed enough synoptic data to justifyupgrading Irving to a typhoon.
11.TRACK AND INTENSITYInitially, synoptic and satellite data indicating a definite, albeit weak, low-level cyclonic circula-
tion within the monsoon trough that extended from the South China Sea to the central Philippine Sea.This circulation was mentioned on the 3006002 July Significant Tropical Weather Advisory. Whilemultiple low-level vorticity centers were present at this early stage of development, JTWC focused onthe circulation near a major flare-up of convection occurring in the southwestern portion of the tropicaldisturbance. The detection of curved low-level cloud lines on the visual satellite imagery resulted inJTWC issuing a Tropical Cyclone Formation Alert at 3108002. By 01 August at 00002, the cloud orga-nization had improved sufficiently to classify this system as a tropical depression, and the first warningwas issued. A short time after this warning, a weather reconnaissance aircraft from the Tropical MotionCyclone Experiment (TCM-92) explored the structure of the tropical depression, and determined thatthe primary low-level circulation was most probably situated 120 nm (220 km) further to the north thaninferred from the satellite data. The circulation proceeded slowly northward over the next two days andgradually intensified. This slow northward motion was atrnbuted to the tropical cyclone being situatednear the western periphery of the subtropical ridge. At 0200002, the amount of centralized deep convec-tion had increased, prompting forecasters to upgrade the tropical depression to a tropical storm.
From the standpoint of satellite intensity estimates, Irving appeared to reach its peak intensity of55 kt (28 m/see) at 0312002 based on the curvature of the convection. However, synoptic data indicat-ed that Irving continued to intensify, and attained a pedk intensity of 80 kt (41 m.kec) at 0400002. Thesurface pressure pattern and key wind reports are depicted in Figure 3-09-1. The figure shows the tightpressure gradient that existed to the north of the typhoon. The visual imagery (Figure 3-09-2) nearestthe time of the synoptic data shows Irving with an elliptic eye that was approximately 100 nm (185 km)in diameter. With the ridge established to the north, the tropical cyclone began to track west-northwest-ward. Upon landfall over southwestern Shikoku, Irving turned sharply to the west, rapidly weakened,and later, dissipated over the Korea Strait near Pusan, Korea.
64
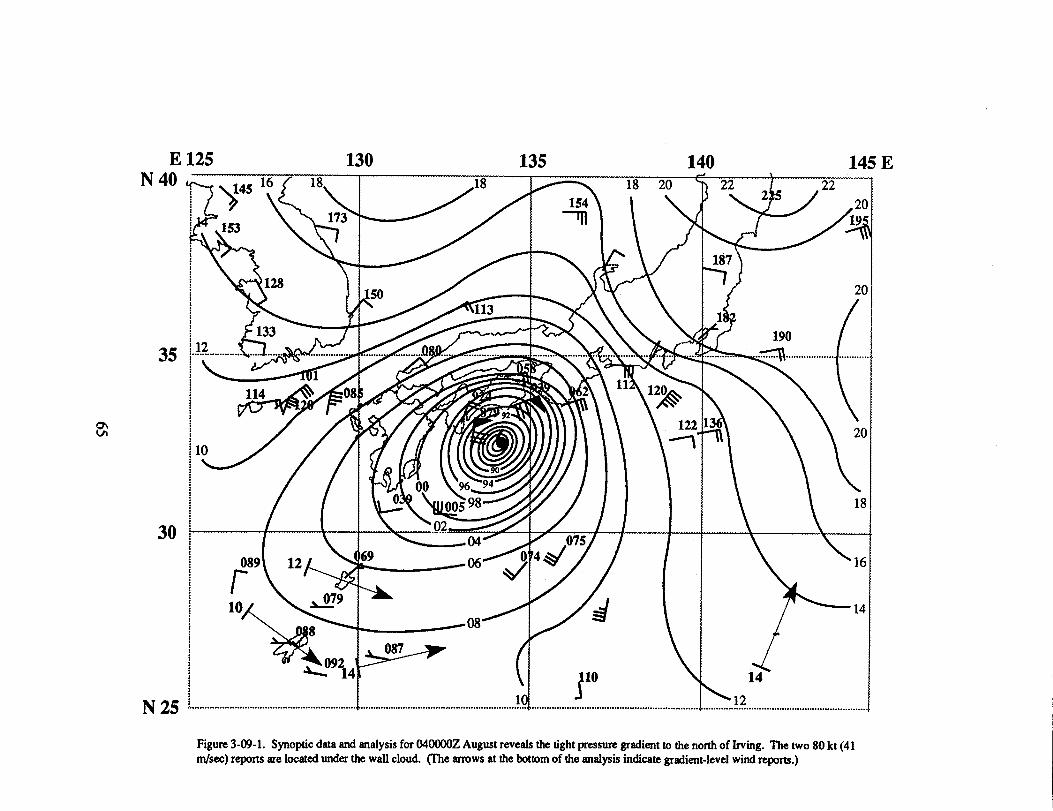
E 125 130 135 140 145 EN 40
35
g
30
N 25 1 14 J............................................................... .................................................................. ..................................................................
_
2225
22
2019
4
187
7)2C
./14
~ 12.............................................................
Figure 3-09-1. Synoptic data and analysis for 040000Z August reveals the tight pressure gradient to the north of Irving. The two 80 kt (41ndsec) repmts are located under the wall cloud. (The arrowsatthebottom of the analysis indicate gradient-level wind reports.)

Figure 3-09-2. The satellite &W cormapondmg lo the synoptic analysis m Figure 3-09-1, shows Irving with a lsrge eye justbefore makiig landfall on Shikoku (0400152 August DMSP visual image@.
III. FORECAST PERFORMANCEForecasting for Irving proved to be quite challenging as climatological and numerical model
guidance were in almost total disagreement. To complicate the forecast difficulties, problems withlocating the low-level center during the first five warnings led to four relocated warnings. Once the per-sistent northward motion was established, JTWC placed a heavier reliance on climatological and statis-tical based models. Then, when Irving was approaching Japan, predictions based on the NOGAPSmodel provided correct guidance. In retrospect, the Japanese Typhoon Model (JTYM), although biasedright-of-track, provided accurate guidance for timing and direction of major track directional changes.
With regard to intensity forecasts, JTWC did not anticipate the further drop in central pressureof the tropical cyclone and building of the pressure gradient to the nonh as Irving approached Japan,which resulted in underforecasting the winds.
IV. IMPACTAlthough some observations from Japan were in excess of 60 kt (31 m/see) and orographically
induced rainfall was heavy, there were no reports of significant damage received.
66
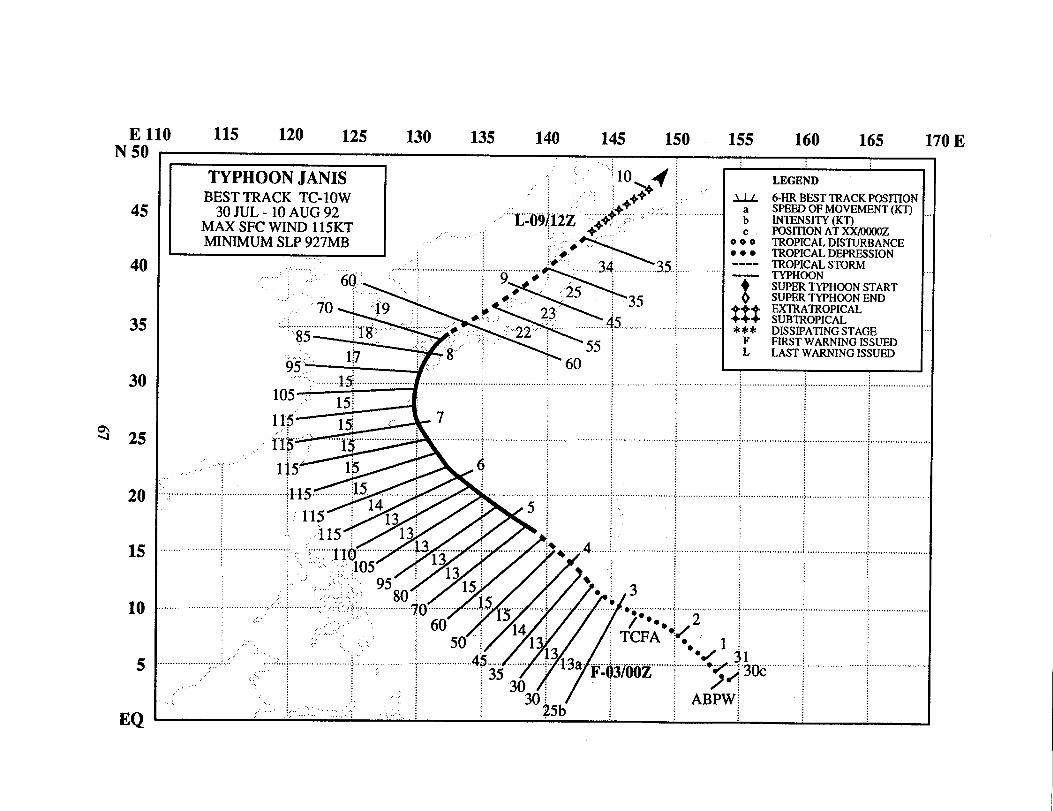
E 110 115 120 125 130 135 140 145 150 155 160 165 170EN 50
45
40
35
30
~ 25
20
15
10
5
EQ
.;
TYPHOON JANIS ..; ““:10,++ / ‘ ‘ :LEGEND,,. ;
BEST TRACK TC-1OW :.’ : ; ++ ;,,, U 6-HRBEST TRACK POSITIO
30 JUL -10 AUG 92 ,++ .. .. ‘,
MAX SFC WIND 115KT .“”””’’’09&z&z’‘“’’$+?,3’“““”’”’””‘“:”””““”’’’”’”’”~ :~kY:LY:kEMENT(Km:.. ,
MINIMUM SLP 927MB..:
.: ;~!% ~ ‘;:,..:......,., ,,, ................ . ...........................,,,,, ......3.4. .. .... ......35.. .. .. ‘---,..
““g;;&~~~3’ : f!!!%:%!E!!.
““’~”””””’::::’”’+..: ............45.......... ......1..................
.,’:, 12
KxNTION AT XWOOOZTROPICAL DISTURBANCETROPICAL DEPRESSIONTROPICAL STORMTYPHOONSUPER TYPHOON STARTSUPER TYPHOON ENDEXTRATROPICALSUBTROPICAL
115”4 .:::‘—
,,,15#-i+2--i+2...............................................j.~.~5~5. .......... . ~
!, ,.115 ;
/&
13:.,,,,. . .......... ......... . . ...... ....+. ......... .......:.:,,::::.:...l&l&,.
“ :;;;,:105 ; 13:.,::..”, ,,,.::.,,, ~5-- ~....,.. .:, 13152
/,
;-@#’,:-*,..,,,.4$. ,...;..,,, ...,,.,, ... .;. . . .. . . . . . . ,, .,, ,. .:,.,. . . .. . .. .. .. . .. . .. . . . . .. . .. . .,, ,,, /,,.., . .. . . . . . . . . . .., . . . ...}...,, , .,,,,,,,,,,
●:3::;;.:..:,’..:,:: ..:’’’.....
8“&’#!~ py””‘“’’”’~““”””’““”””‘“””*y:':'o'":'"""""2""'"""""""""'",""""'""""""""."'""'":""".""""""""""""................................,..:.,’....’:;..........................”.,,..,,.,,..,....’’...’“. /60;,,,.,,... 1413;,:’. . ,50 “: iTCFA ~<, 1[ ~ ~:. ‘..::
,’,:,:..:,,.,,,,,,,,,,,,,,,,,,,,,,i,,’,,,,,,,,,,.......................,’ :, ~~~~~..:.....................4$. .... ........ ....p~.~a. ........i.............. ‘ ‘~ 31.........?............0......’; ;. :35 F-Q3/OOZ : / ~3~”””’”””’’’’’””””’’””’”’“’““ ““””’”;”””””’”””’”’”’”””,:,’:.. ;,. ... 30:”/:
>< :
.:.:.. . 30:., .’.: ...... ... . . . .... ABI@ / :
... ...... .,....: ~5b ; ~ ~ j ~:...’....:
TYPHOON JANIS (1OW)
I. HIGHLIGHTSFour days after Irving (09W) hammered Shukoku, Janis slammed into Kyushu. Janis began near
Pohnpei in the Caroline Islands, took a northwestward track threatening Okinawa, then recurved, passedover Kyushu, and skirted the western coast of Honshu before transitioning to an extratropical low overHokkaido.
II. TRACK AND INTENSITYThe tropical disturbance, that matured into Janis, formed near Pohnpei in the eastern Cadine
Islands, and was first mentioned in the 3006002 July Significant Tropical Weather Advisory. Increasedconvective development led to the issuance of a Tropical Cyclone Formation Alert at 0221 30Z August.Intensification continued through the early morning hours, and at 0300002, JTWC issued the fiit warn-ing on Tropical Depression 10W. As the depression moved past Guam, it brought winds gusting to 30
kt (15 trdsec) and 2.5 inches (64 mm) of rain in 24 hours to the island, but caused no major damage.Later that day, at 0314392, aircraft reconnaissance assigned to the TCM-92 experiment explored
the tropical depression and provided a center fix with a minimum 700 mb pressure height of 3081 m,which supportd, 30 kt (15 m/see) at the surface. Moving into the Philippine Sea, the depression orga-nized further and was upgraded to a tropical storm at 0318002 and to a typhoon 24 hours later. Janisreached a peak intensity of 115 kt (59 m/see) at 0600002, where it posed a major threat to Okinawa(Figure 3-10-1). Fortunately, the typhoon did not directly hit the island, but passed 90 nm (165 km) tothe east. On Okinawa, Kadena AB (WMO 47931) reported maximum winds of 30 gusting to 50 kt (15G 26 rn/see), the Marine Cor@ Air Station (WMO 47933) at Futenma observed peak winds of 36 gust-ing to 53 kt (19 G 27 m/see), and the peak at Naha (WMO 47936) was 34 gusting to 55 kt (18 G 28m/see).
Passing near the airport on Amami-O-Shims (WMO 47872) which reported maximum winds of69 gusting to 94 kt (36 G 48 m/see), the typhoon began to weaken, recurved, and accelerated tows.dKyushu. Over Kyushu, land interaction further weakened Janis to tropical storm intensity at 081500Z.As Janis passed 60 nm (110 km) east-southeast of Sasebo with an estimated intensity of 85 kt (44
m/see), the base observed maximum winds of 28 gusting to 50 kt (14 G 26 m/see). The tropical stormmoved to the northeast, paralleling the western coast of Honshu. At 0912002, Janis transitioned into anextratropical low over Hokkaido.
111.FORECAST PERFORMANCEJTWC correctly forecast the recurvature path of Typhoon Janis. Overall, mean track forecast
errors were 92, 182, and 336 nm (170, 337 and 620 km) for 24$48, and 72 hours, respectively. Thelargest 72-hour mean position forecast errors occurred after recurvature and were primarily due to therapid accelemtion of Janis to speeds over 30 kt (55 km/hr).
JTWC forecast the intensity trend and period of rapid intensification well. However, with regardto the peak intensity, a procedural difference concerning the application of the Dvorak enhancedinfrared technique eye adjustment factor to digital high resolution TIROS-N polar orbiting satellite dataled to an overestimation of the raw intensity input to the warning. The analysis procedure was reviewedand adjusted to use the average of the warmest pixels within the eye, instead of the single warmest indLvidual pixel, before determining the eye adjustment factor. This change more closely paralleled the val-
68
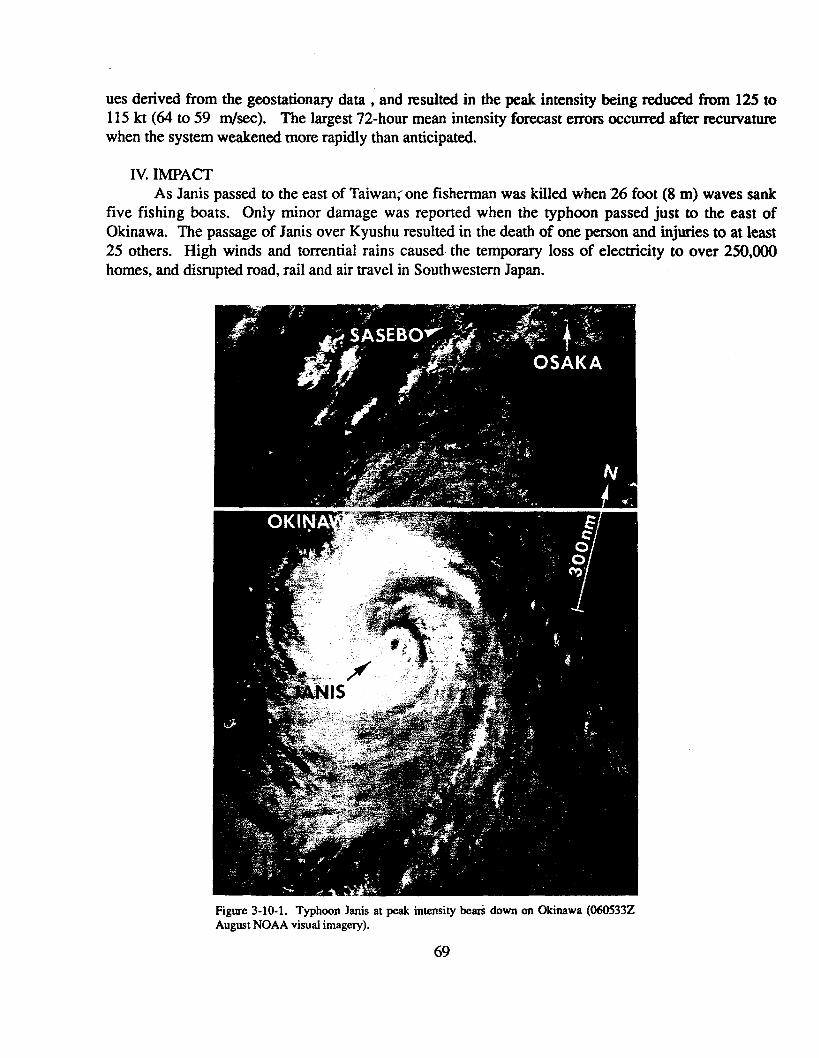
ues derived from the geostationary data , and resulted in the peak intensity being reduced fkom 125 to115 kt (64 to 59 m/see). The largest 72-hour mean intensity forecast errors occurred after recuwaturewhen the system weakened more rapidly than anticipated.
IV. IMF!ACTAs Janis passed to the east of Taiwan; one fisherman was killed when 26 foot (8 m) waves sank
five fishing boats. Only minor damage was reported when the typhoon passed just to the east ofOkinawa. The passage of Janis over Kyushu resulted in the death of one person and injuries to at least25 others. High winds and torrential rains caused the temporary loss of electricity to over 250,000homes, and disrupted road, rail and air travel in Southwestern Japan.
Flgu.re 3-10-1. Typhoon Janis at peak intensity beti down on Okinawa (060533ZAugust NOAA visual imagery).
69
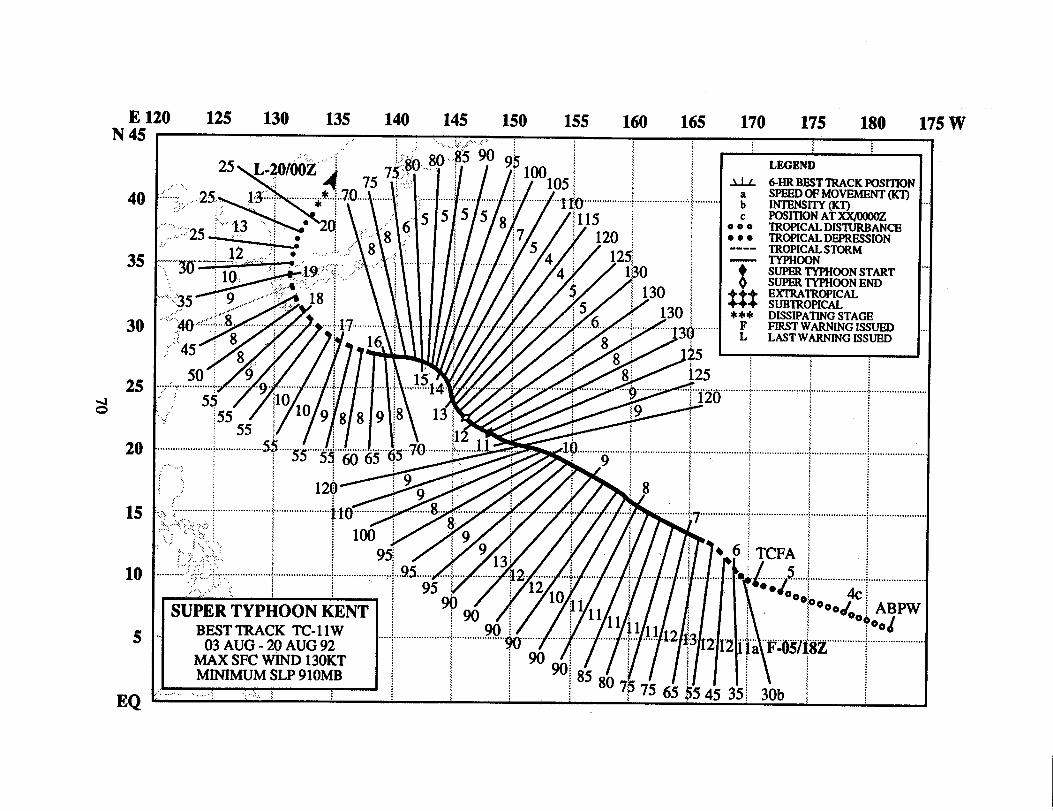
N 45
40
35
30
258
20
15
10
5
EQ
E 120 125 130 135 140 145 150 155 160 165 170 175 180 175 w
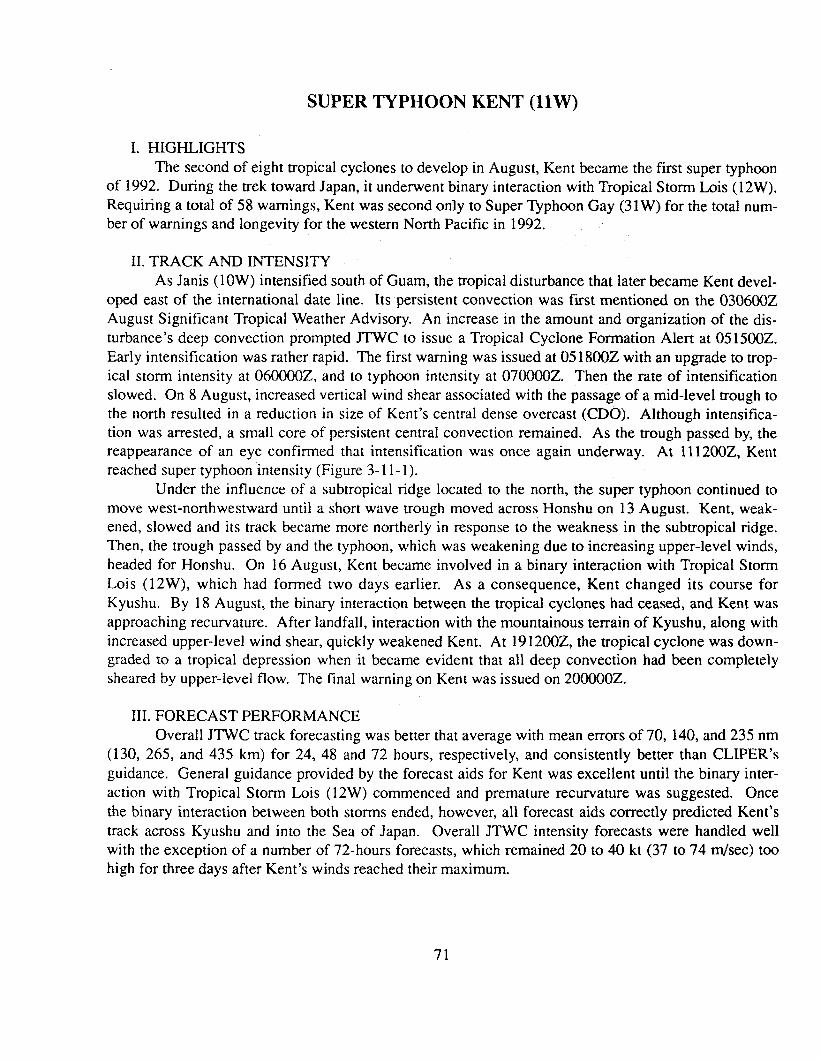
SUPER TYPHOON KENT (llW)
I. HIGHLIGHTSThe second of eight tropical cyclones to develop in August, Kent became the first super typhoon
of 1992. During the trek toward Japan, it underwent binary interaction with Tropical Storm Lois ( 12W).Requiring a total of 58 warnings, Kent was second on] y to Super Typhoon Gay (31 W) for the total num-ber of warnings and longevity for the western North Pacific in 1992.
II. TRACK AND INTENSITYAs Janis (1OW) intensified south of Guam, the tropical disturbance that later became Kent devel-
oped east of the international date line. Its persistent convection was first mentioned on the 030600ZAugust Significant Tropical Weather Advisory. An increase in the amount and organization of the dis-turbance’s deep convection prompted JTWC to issue a Tropical Cyclone Formation Alert at 05 1500Z.Early intensification was rather rapid. The first warning was issued at 05 1800Z with an upgrade to trop-ical storm intensity at 060000Z, and to typhoon intensity at 070000Z. Then the rate of intensificationslowed. On 8 August, increased vertical wind shear associated with the passage of a mid-level trough to
the north resulted in a reduction in size of Kent’s central dense overcast (CDO). Although intensifica-tion was arrested, a small core of persistent central convection remained. As the trough passed by, thereappearance of an eye confirmed that intensification was once again underway. At 111200Z, Kentreached super typhoon intensity (Figure 3-11- 1).
Under the influence of a subtropical ridge located to the north, the super typhoon continued tomove west-northwestward until a short wave trough moved across Honshu on 13 August. Kent, weak-ened, slowed and its track became more northerly in response to the weakness in the subtropical ridge.Then, the trough passed by and the typhoon, which was weakening due to increasing upper-level winds,headed for Honshu. on 16 August, Kent became involved in a binary interaction with Tropical StormLois ( 12W), which had formed two days earlier. As a consequence, Kent changed its course forKyushu. By 18 August, the binary interaction between the tropical cyclones had ceased, and Kent wasapproaching recurvature. After landfall, interaction with the mountainous terrain of Kyushu, along withincreased upper-level wind shear, quick] y weakened Kent. At 1912002, the tropical cyclone was down-graded to a tropical depression when it became evident that all deep convection had been completelysheared by upper-level flow. The final warning on Kent was issued on 200000Z.
111.FORECAST PERFORMANCEOverall JTWC track forecasting was better that average with mean errors of 70, 140, and 235 nm
(130, 265, and 435 km) for 24, 48 and 72 hours, respectively, and consistently better than CLIPER’Sguidance. General guidance provided by the forecast aids for Kent was excellent until the binary inter-action with Tropical Storm Lois (12W) commenced and premature recurvature was suggested. Oncethe binary interaction between both storms ended, however, all forecast aids correctly predicted Kent’strdck across Kyushu and into the Sea of Japan. Overall JTWC intensity forecasts were handled wellwith the exception of a number of 72-hours forecasts, which remained 20 to 40 kt (37 to 74 m/see) toohigh for three days after Kent’s winds reached their maximum.
71
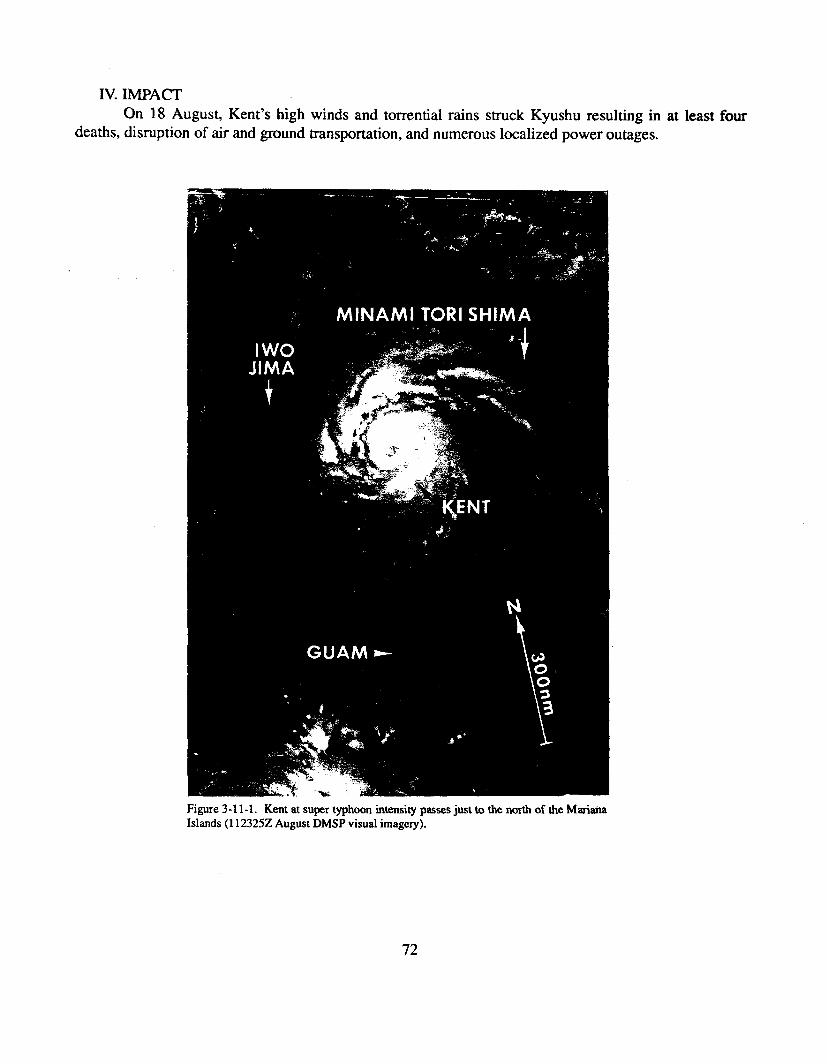
IV. IMPACTOn 18 August, Kent’s high winds and torrential rains struck Kyushu resulting in at least four
deaths, disruption of air and ground transportation, and numerous localized power outages.
Figure 3-11-1. Kent at su~r typhoon intensity passes just to the north of the MarianaIslands (112325Z August DMSP visual imagery).
72

E 110 115 120 125 130 135 140 145 150 155 160 165 170 175 180N 55
50
40
35
304w
25
20
15
10
EQ
... ......:..,,.:
.,,.,., ...........
.... ..... . .,...:...,
,..,,..,,,. ~ .:,:....... ...&T......................I...\ :
,..:j ..,.,’,..
TROPICAL STORM LOISBEST TRACK TC-12W
13 AUG -22 AUG 92MAX SFC WIND 40KTMINIMUM SLP 994MB
& lU:-35 ~ I ‘ :~~~~~~ ‘ :
*:4~ ........ .......... .........~...: & 6-HR BEST TRACK POSITION
: .,: ... ... ! .::,. I
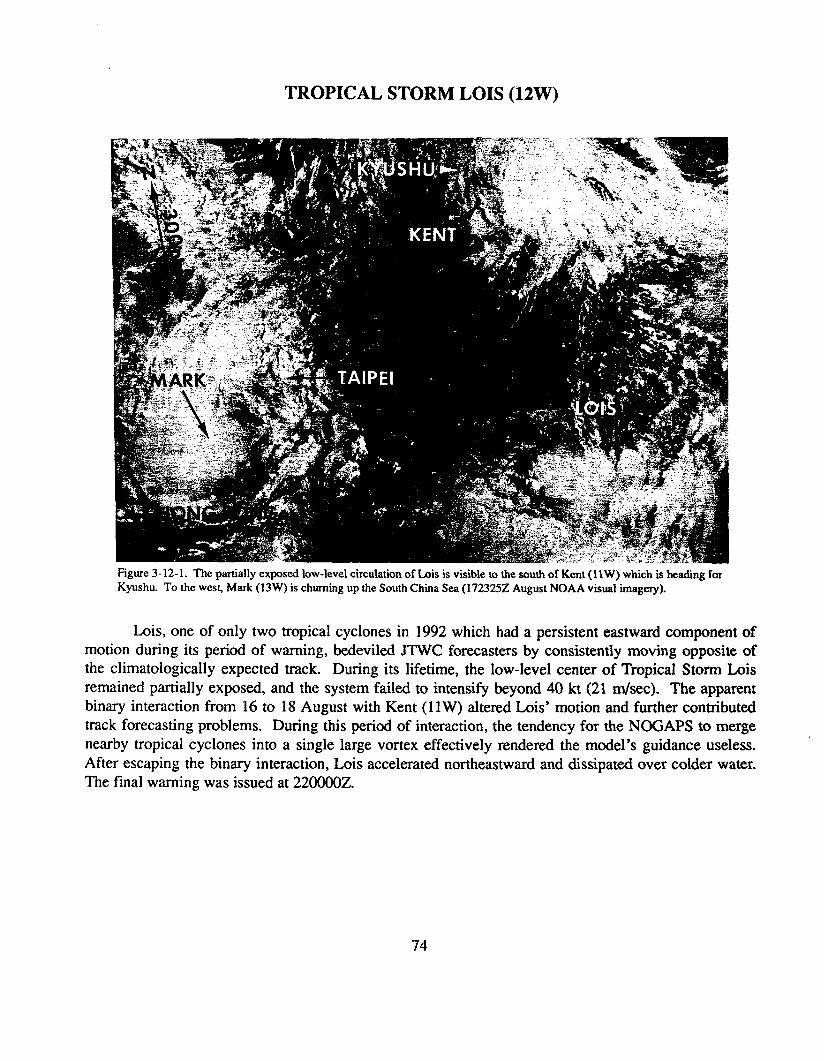
TROPICAL STORM LOIS (12W)
Figure 3-12-1. The partially exposed low-level circulation of L@ is visible to the south of Kent (11 W) which is heading forKyushu. To the wes~ Mark (13W) is churning up the South China Sea (172325Z August NOAA visual imagery).
Lois, one of only two tropical cyclones in 1992 which had a persistent eastward component ofmotion during its period of warning, bedeviled JTWC forecasters by consistently moving opposite ofthe climatologically expected track. During its lifetime, the low-level center of Tropical Storm Loisremained partially exposed, and the system failed to intensify beyond 40 kt (21 m/see). The apparentbinary interaction from 16 to 18 August with Kent (11W) altered Lois’ motion and further conhibutedtrack forecasting problems. During this period of interaction, the tendency for the NOGAPS to mergenearby tropical cyclones into a single large vortex effectively rendered the model’s guidance useless.After escaping the binary interaction, Lois accelerated northeastward and dksipated over colder water.The final warning was issued at 220000Z.
74
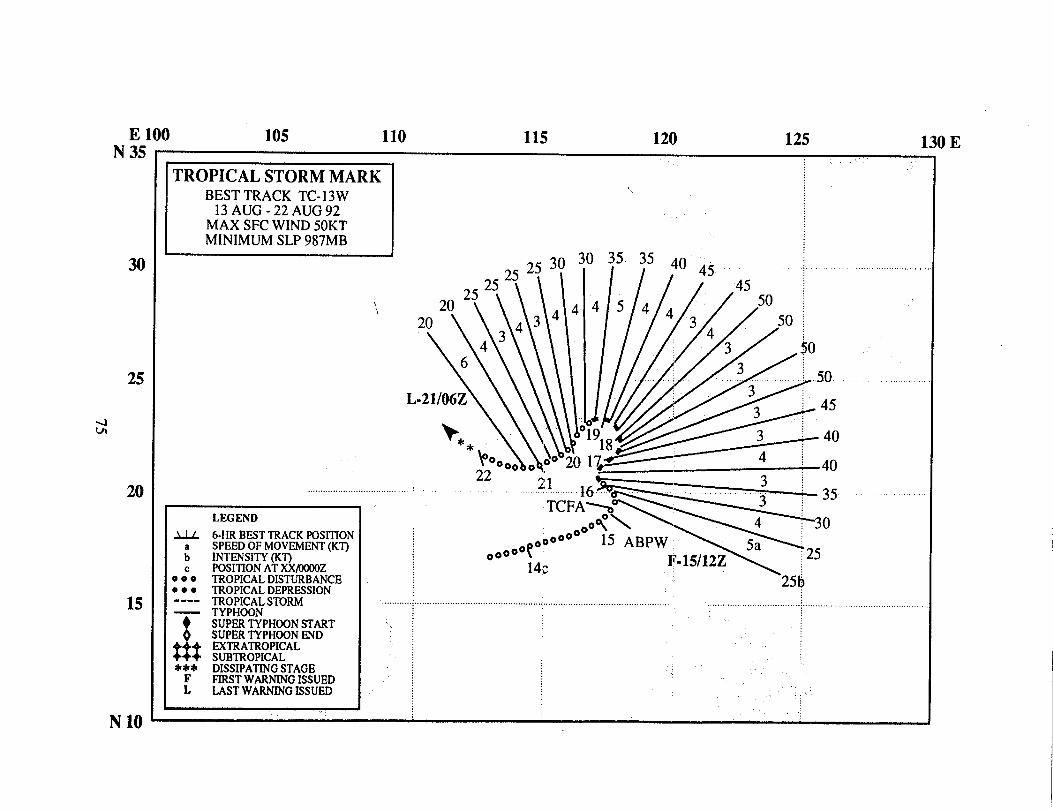
E 100N 35
30
25
4u
20
15
N 10
105 110 115 120 125
TROPICAL STORM MARKBEST TRACK TC-13W
13 AUG -22 AUG 92MAX SFC WIND 50KTMINIMUM SLP 987MB
{252530 30 35 35 40 45
2525 4520 50
‘\ 44454420 43 34 50
43
~~
6
/
.....,.:. ... ...
L-21106Z
F**
,.O ‘oo2;id&*- 000,
:c
000● **----
LEGEND
6-HR BEST TRACK POSITIONSPEED OF MOVEMENT (KT)INTENSITY (la-)POSITIONAT XX/OOCOZTROPICAL DISTURBANCETROPICAL DEPRESSIONTROPICAL STORM
8
TYPHOONSUPER TYPHOON STARTSUPER TYPHOON END
$#EXTRATROPICALSUBTROPICAL
XT DISSIPATING STAGEFIRST WARNING ISSUED
L LAST WARNING ISSUED
.&L
, ..,,,..:. .....?!.... ~(jOooz ;TcFAay ““”‘-3~oooo 15 ABPW
Ooooof~ 5a
14!2 F-15/12z‘-)<1
130E
)“
.50. . .. .
.45
-40
-40
-35 “ ““ ‘“ “’
“30
!5
:,,,,, ‘.:
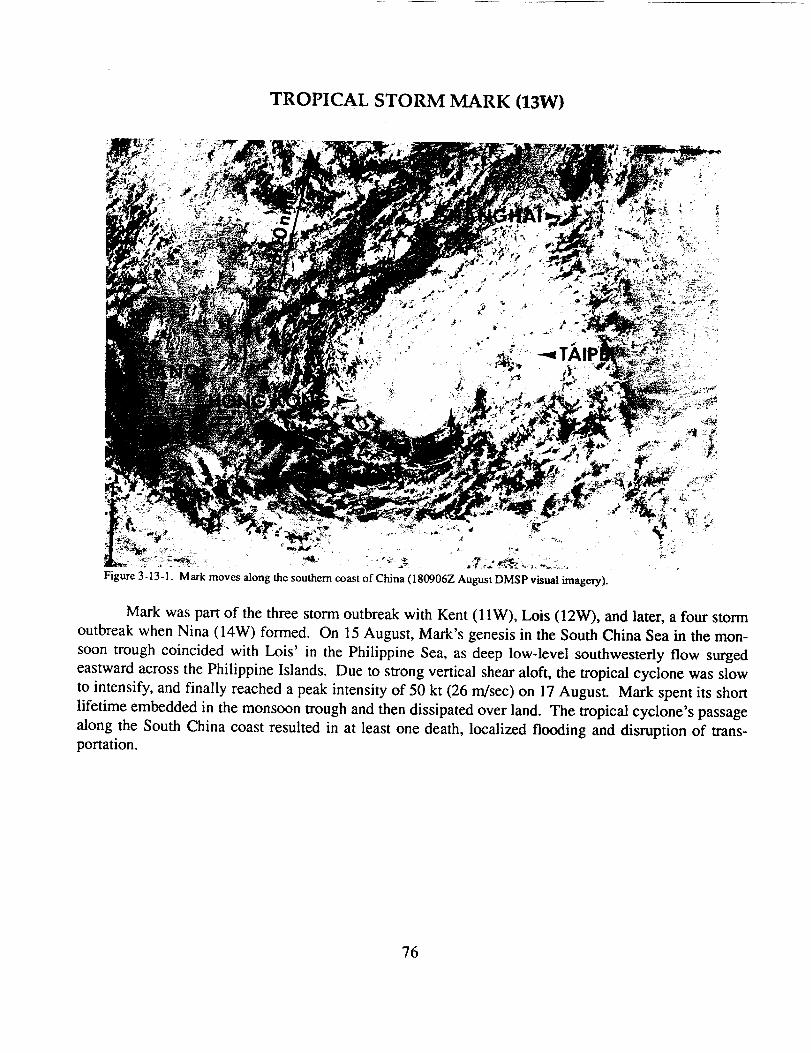
—. -—
TROPICAL STORM MARK (13W)
Mark was part of the three storm outbreak with Kent (11W), Lois (12W), and later, a four stormoutbreak when Nina (14W) formed. On 15 August, Mark’s genesis in the South China Sea in the mon-soon trough coincided with Lois’ in the Philippine Sea, as deep low-level southwesterly flow surgedeastward across the Philippine Islands. Due to strong vertical shear aloft, the tropical cyclone was slowto intensify, and finally reached a peak intensity of 50 kt (26 m/see) on 17 August. Mmk spent its shortlifetime embedded in the monsoon trough and then dissipated over land. The tropical cyclone’s passagealong the South China coast resulted in at least one death, localized flooding and disruption of trans-portation.
76
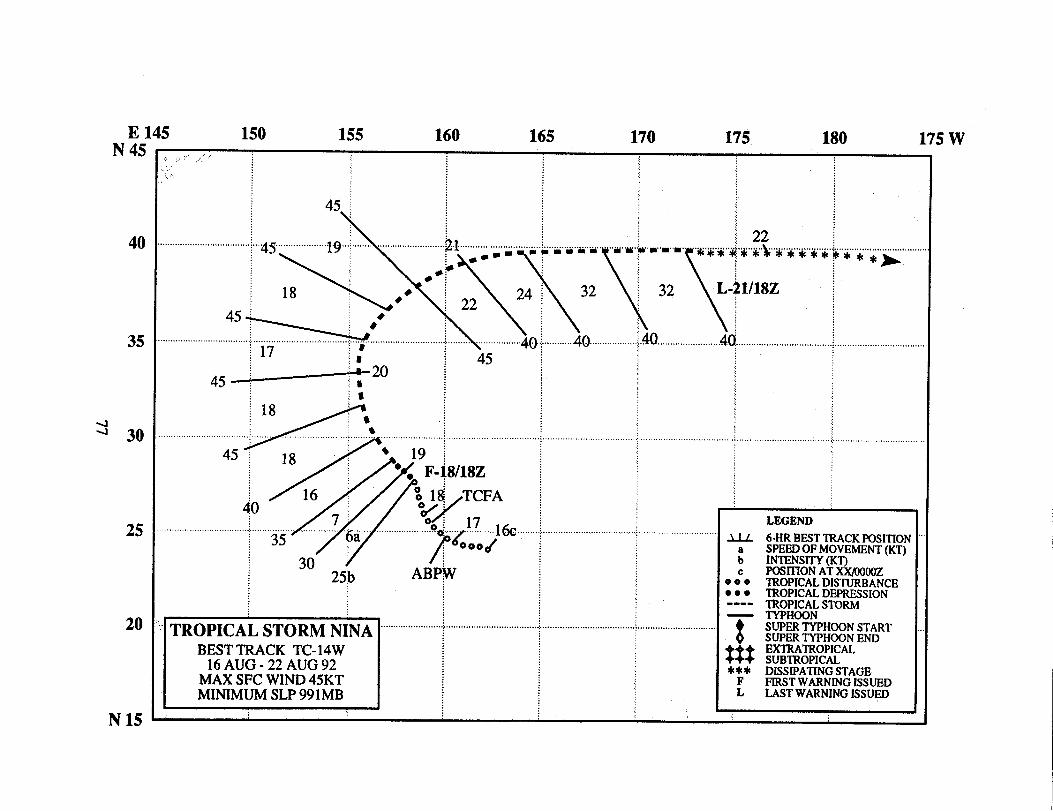
E 145, , ....’ ...
40
35
30
25
20
N 15
150 155 160 165 170 175 180 175 w
45................... .,
45 —
45 “
4
45 :
..45.................!.pj. ............ .........................“lb●’18 j .+
..... .. . .............. .. ............... ..17 :8
:8~ 20
#- ‘“”““”’’”’”””””’’’:”’””’’’”’”~-’”””’’’’”’’”””
Py18 : .19. F-
16 ; % 1[‘d
7: .,.,.........$.. ...Ga...,35 ,
30 /25b ABF
TROPICAL STORM NINA ““”””’’”’””’’’””’’”’””BEST TRACK TC-14W
16 AUG -22 AUG 92MAX SFC WIND 45KTMINIMUM SLP 991MB
1. ...............................
\,- =
\
amb
22 24
\ . ..................4(.J
45
l/18Z
,TCFA
.&.?M&. . .
““”’”’””’”””’”’’”’’”“U”*m-mm
\
32\
..........4~.................
,.rn.m.-. .*.%.%,.:
\
32 L“
\40,..................!....4(
22~...%..%.%.* * #...........
l/18Z
. . ... . . . ,,,
............................***>
:c
000● *e----
$m***
FL
LEGEND
SUPER TYPHOON STARTSUPER TYPH~N ENDEXTRATROPICmSUBTROPICAL -DISSIPATING STAGEFIRST WARNING ISSUEDLAST WARNING ISSUEQ
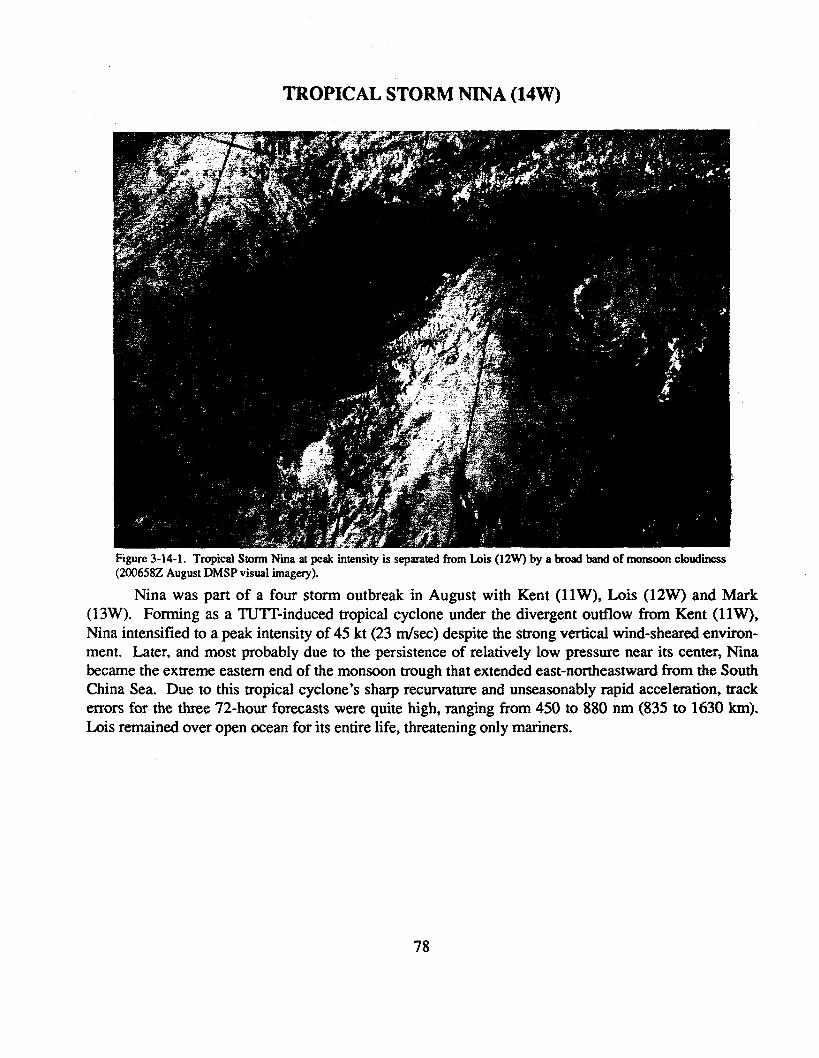
TROPICAL STORM NINA (14W)
Figure 3-14-1. Tropical Storm Nina at peak intensity is separated horn I.& (12W) by a broad band of monsoon cloudiness(20065S2 August DMSP visual imagery).
Nina was part of a four storm outbreak in August with Kent (11 W), Lois (12W) and Mark(13W). Forming as a TUTI’-induced tropical cyclone under the divergent outflow fkom Kent (llW),Nina intensified to a peak intensity of 45 kt (23 rn/see) despite the strong vertical wind-sheared environ-ment. Later, and most probably due to the persistence of relatively low pressure near its center, Ninabecame the extreme eastern end of the monsoon trough that extended east-northeastward from the SouthChina Sea. Due to this tropical cyclone’s sharp recurvature and unseasonably rapid acceleration, trackerrors for the three 72-hour forecasts were quite high, ranging from 450 to 880 nm (835 to 1630 km).Lois remained over open ocean for its entire life, threatening only mariners.
78
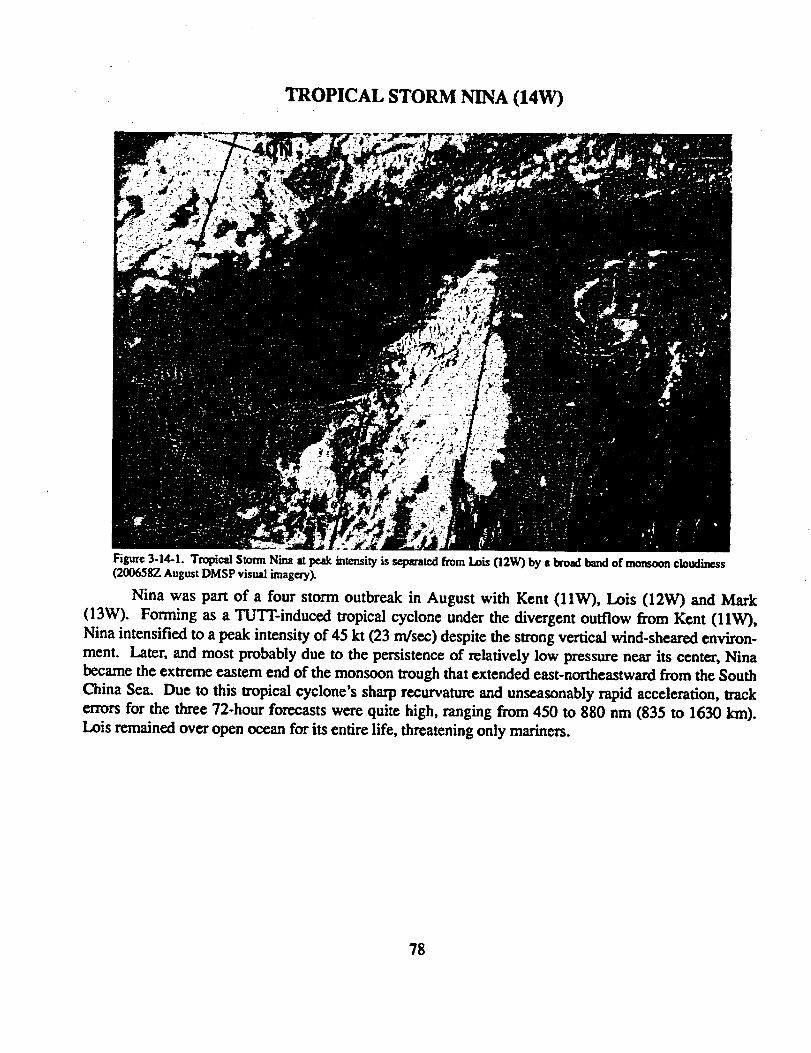
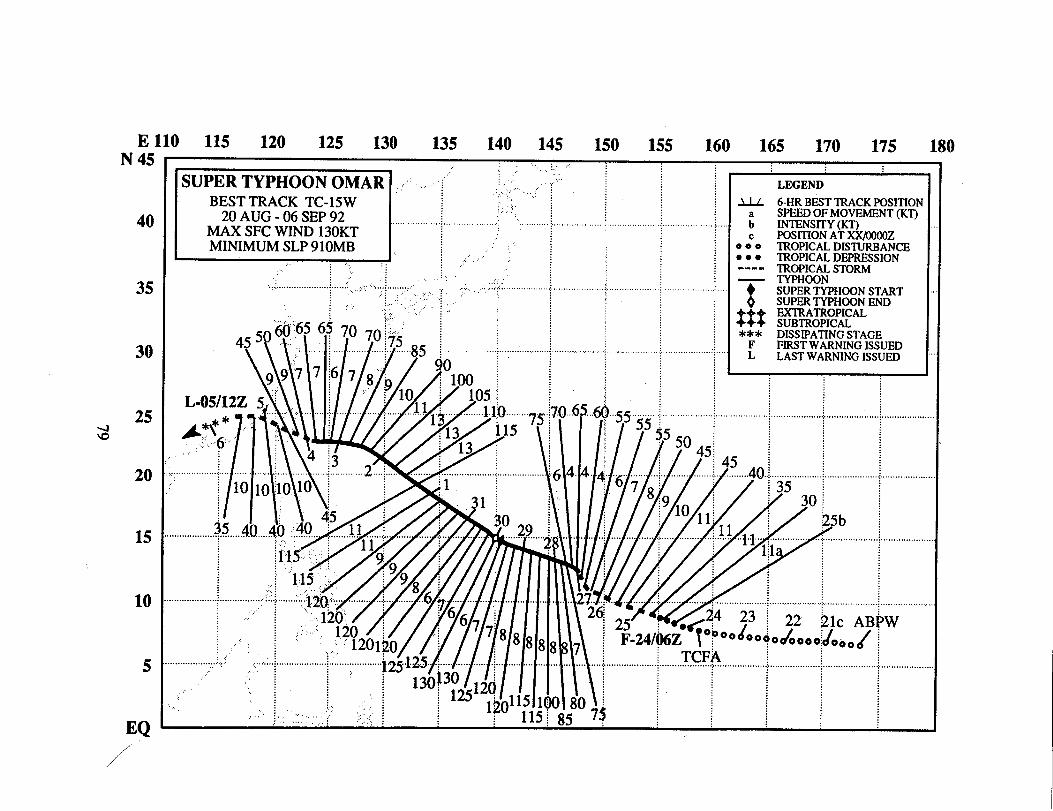
E 110 115 120 125 130 135 140 145 150 155 160 165 170 175 180N 45
40
35
30
2s4m
20
15
10
5
EQ
,//

SUPER TYPHOON OMAR (15W)
1, HIGHLIGHTSThe second super typhoon of 1992, Omar became the seventh of the eight tropical cyclones to
develop in August. The tropical disturbance that became Omar was first noted over the southernMarshall Islands, at a time when Mark (13W) was weakening along the south coast of China, Kent(11W) had dissipated in the Sea of Japan, and Lois (12W) and Nina (14W) were east of Japan. Later,after moving steadily west-northwestward and intensifying, Omar wreaked havoc on Guam as it rapidlyintensified immediately prior to passing directly over the island with 105 kt (54 rdsec) sustained winds.After traversing Guam, Omar continued onward into the Philippine Sea where it briefly attained supertyphoon intensity. Omar then steadily weakened, passing over Taiwan as a tropical storm, and dissipat-ed over southeastern China.
II. TRACK AND INTENSITYBased on persistent convection, the tropical disturbance that was to become Omar was first men-
tioned in the 2006002 August Significant Tropical Weather Advisory. During the next three days,which included the dissipation of Kent (1 lW) and Mark (13W), and the approaching of the extratropicaltransitions of Lois (12W) and Nina (14W), the monsoon trough began to reestablish itself in a more nor-mal location, extending across the northern Philippine Islands, east-southeastward into the CarolineIslands. While this major synoptic pattern readjustment was taking place, the tropical disturbance haddeveloped sufficiently to warrant the issuing of a Tropical Cyclone Formation Alert at 2321OOZ.Intensification continued, and JTWC issued the first warning at 2406002. Coincident with Omarbecoming a tropical depression 750 nm (1390 km) east-southeast of Guam and the southwesterly low-level flow deepening across the western Caroline Islands, Pony (16W) began to develop 200 nm (370km) to the west of Guam. After Omar was upgraded to a tropical storm on the warning at 2500002, therate of intensification decreased due to upper tropospheric wind shear from the extensive outflow ofPony (16W), which was also intensifying. At about the same time, Omar (Figure 3-15-1) began to slowin forward speed. This slowing of development and forward motion continued until early on 27 Augustwhen Tropical Storm Omar stalled.
If the strong vertical wind shear created by Pony’s proximity continued, or increased, there wasa possibility that Omar’s upper and lower circulation centers could decouple and further weaken thetropical cyclone. However, the circulation held together, drifted northwestward, and began to intensify.Omar (Figure 3-15-2) was upgraded to typhoon intensity at 2706002, and 12 hours later at about27 1800Z began a period of rapid intensification which lasted for the next 12 to 18 hours. By theevening of 27 August, Omar began to accelerate towards Guam. Gale force sustained winds, began tobuffet Guam at 2723002 about the time that a visible eye appeared on satellite imagery. This was fol-lowed by the onset of destructive winds, in excess of 50 kt (26 m/see), which commenc~ at 2803002and lasted for 16 hours. These sustained winds rose steadily until they peaked at 105 kt (54 rn/see) withgusts to 130 kt (67 rn/see) in the western half of the eye wall (Figure 3- 15-3). As the eye passed acrossthe island, the eastern half of the eye wall followed, battering Guam with torrential rain again and strungwinds from the opposite direction (Figure 3-15-4). While Omar’s eye passage coincided with one of thehighest astronomical tides of August (Figure 3-15-5), the storm surge was not as high as expected.Apparently the rapidly changing wind direction that occurred with eye passage limited the fetch andkept the inundation to a lower level than anticipated. Some low-lying areas on Guam suffered total
80
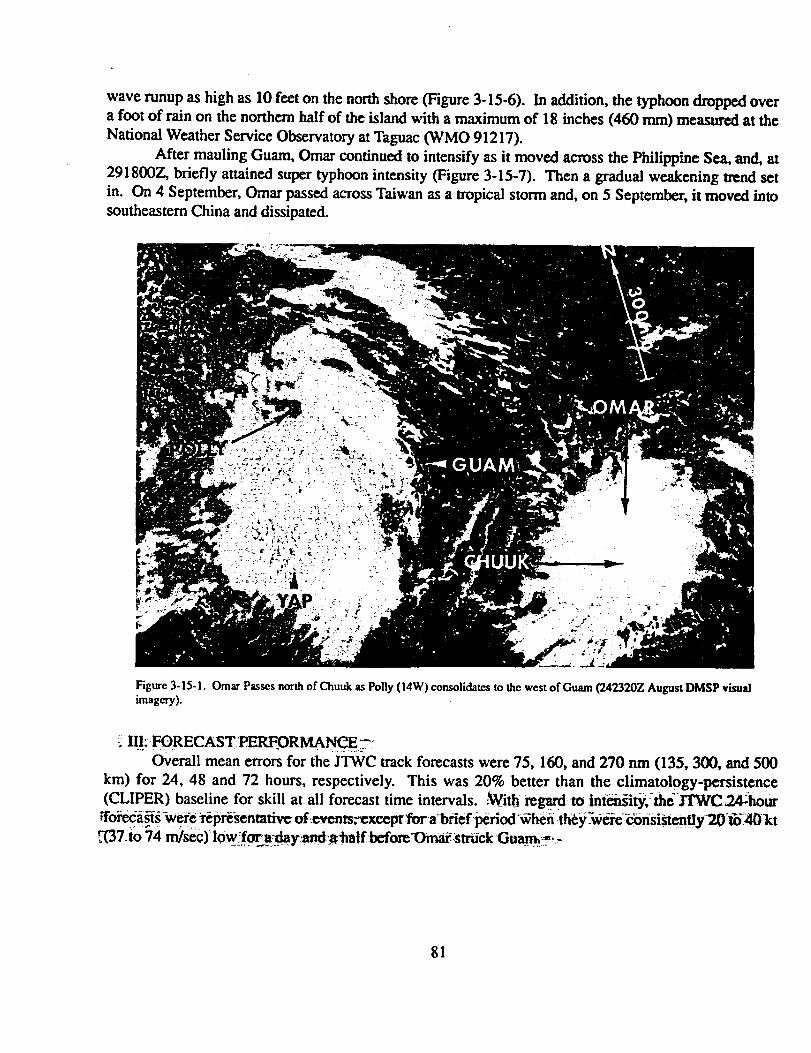
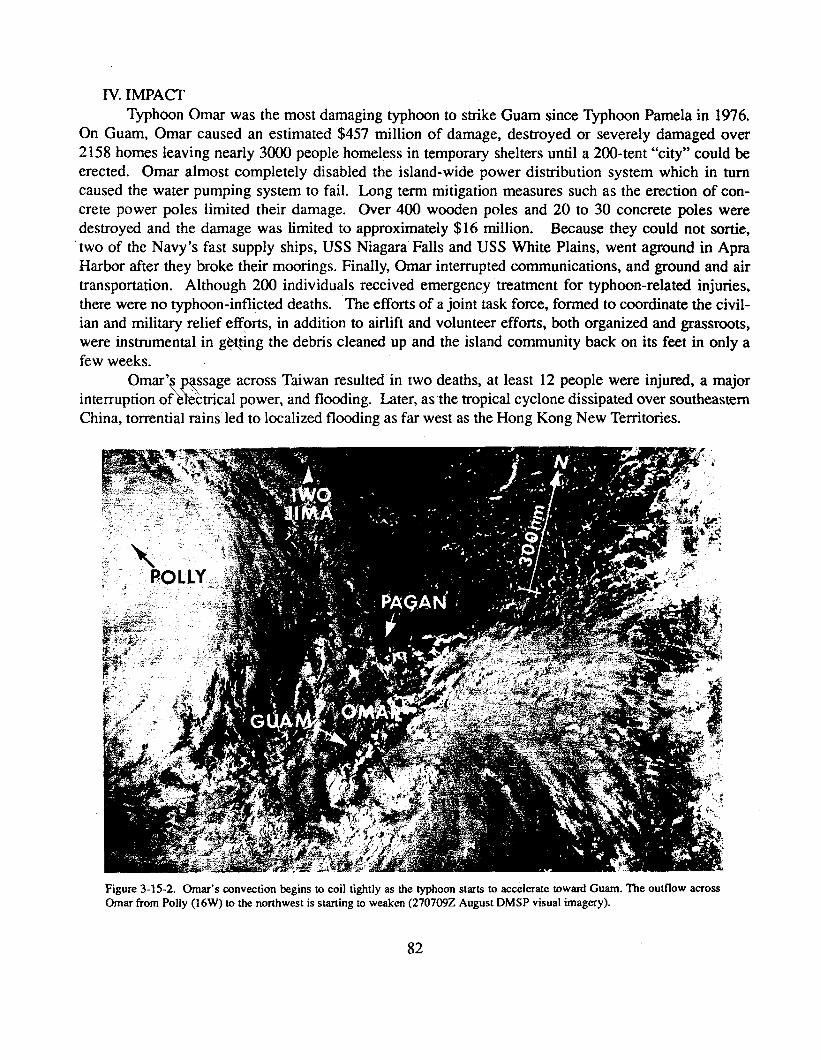
IV. IMPACTTyphoon Omar was the most damaging typhoon to strike Guam since Typhoon Pamela in 1976.
On Guam, Omar caused an estimated $457 million of damage, destroyed or severely damaged over2158 homes leaving nearly 3000 people homeless in temporary shelters until a 200-tent “city” could beerected. Omar almost completely disabled the island-wide power distribution system which in turncaused the water pumping system to fail. Long term mitigation measures such as the erection of con-crete power poles limited their damage. Over 400 wooden poles and 20 to 30 concrete poles weredestroyed and the damage was limited to approximately $16 million. Because they could not sortie,two of the Navy’s fast supply ships, USS Niagara Falls and USS White Plains, went aground in ApraHarbor after they broke their moorings. Finally, Omar interrupted communications, and ground and airtransportation. Although 200 individuals received emergency treatment for typhoon-related injuries,there were no typhoon-inflicted deaths. The efforts of a joint task force, formed to coordinate the civil-ian and military relief efforts, in addition to airlift and volunteer efforts, both organized and grassroots,were instrumental in g~ting the debris cleaned up and the island community back on its feet in only afew weeks.
Omar’+B
ssage across Taiwan resulted in two deaths, at least 12 people were injured, a majorinterruptionof> ctricalpower, and flooding. Later,as the tropicalcyclone dissipatedover southeastern
China, torrentialrainsledto localizedfloodingas farwest as the Hong Kong New Territories.
F]gure 3-15-2. Omar’s convection begins to coil tightly as tic typhoon starts to accelerate toward Guam. The outflow acrossOmar from Pony (16W) to the northwest is starting to weaken (270709Z August DMSP visual imagery).
82
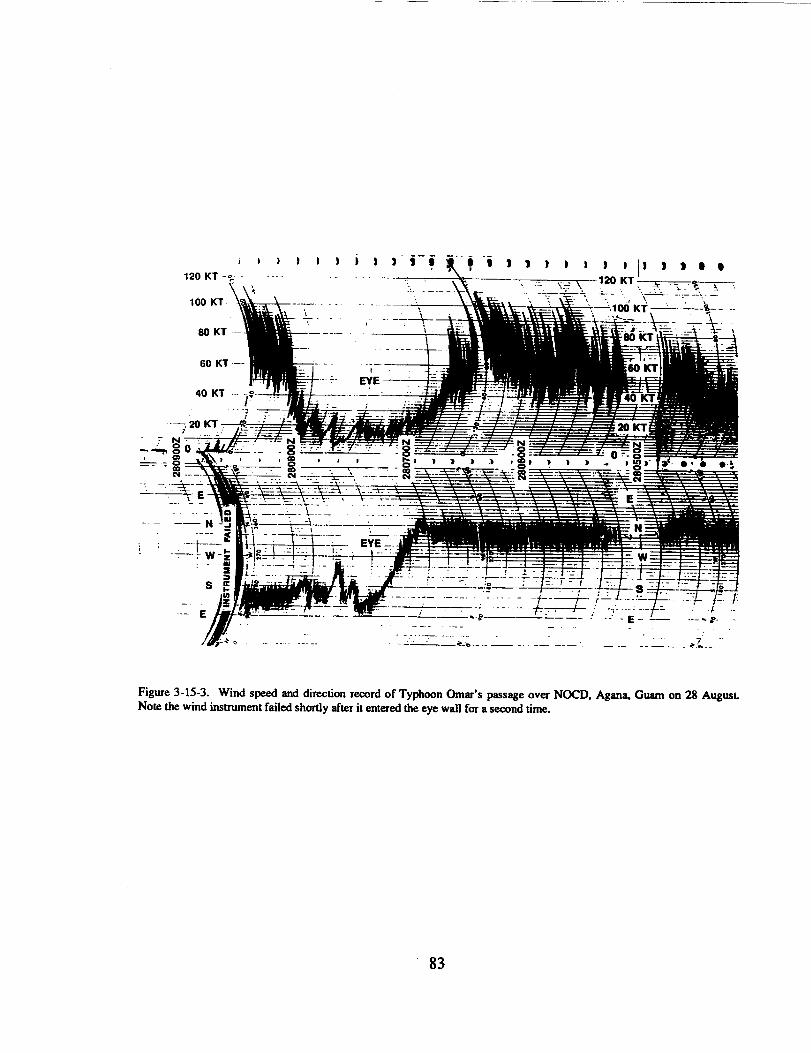
——
i)))))
120KT -> ---—– ---–\\i
; ; ,.5_ i_..;.-
-4,-’ y-:l;,:-io~’i;:,:{
.. —_—
-. —
;;
P“’-----... —-........._. . .. .
3:+*. .
. ..-. .- -- —.?_.e .- .- —-. .— ___ :._ ._. -*.7m._.
Figure 3-15-3. Wind speed and direction record of Typhoon omar’s passage over NOCD, Agsnz Guam on 28 AugusLNote the wind instrument fsiled shortly after it en[ered the eye wall for a second time.
83
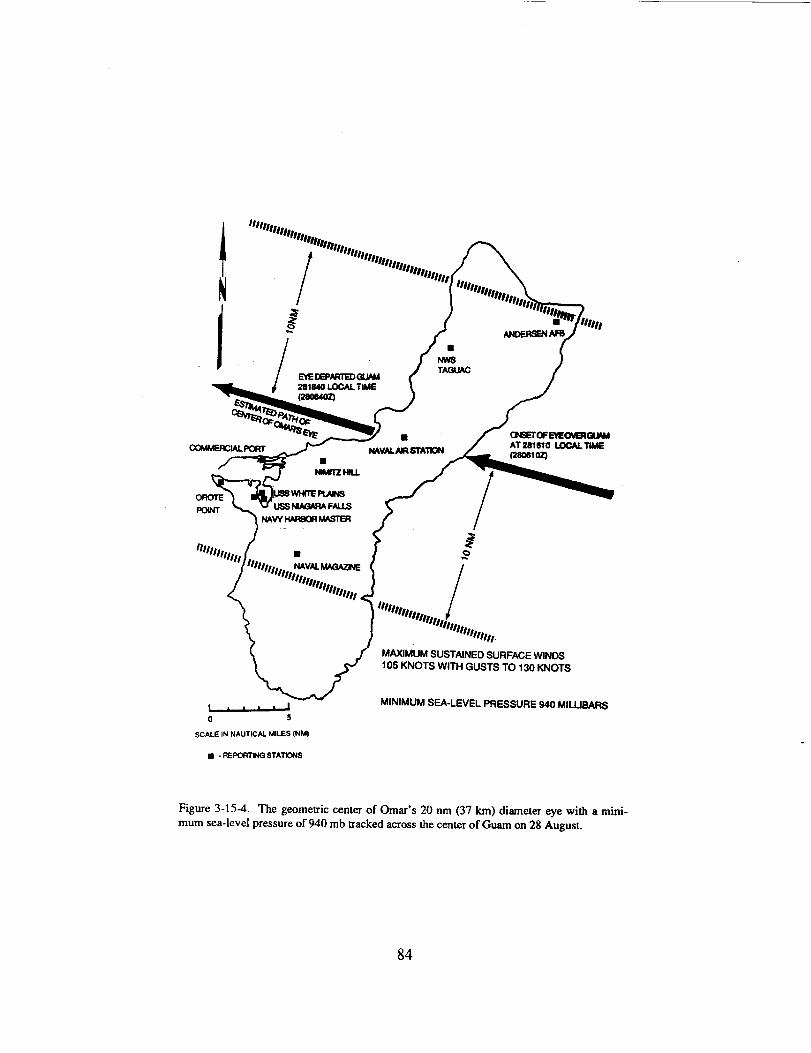
CNSTOFEYE-WcoMMER31ALPml
ORoTE
KnN-rNwYFwamwmER
SCALE IN NAUTICAL MILES (NW
m - FWORTNQ STATICUS
MAXIMUM SUSTAINED SURFACE WINDS105 KNOTS WITH GUSTS TO 130 KNOTS
MINIMUM SEA-LEVEL PRESSURE 940 MILLIBARs
Figure 3-154. The geomewic center of Omar’s 20run(37 km) diameter eye with a mini-mum sea-level pressure of 940 mb tracked across the center of Guam on 28 August.
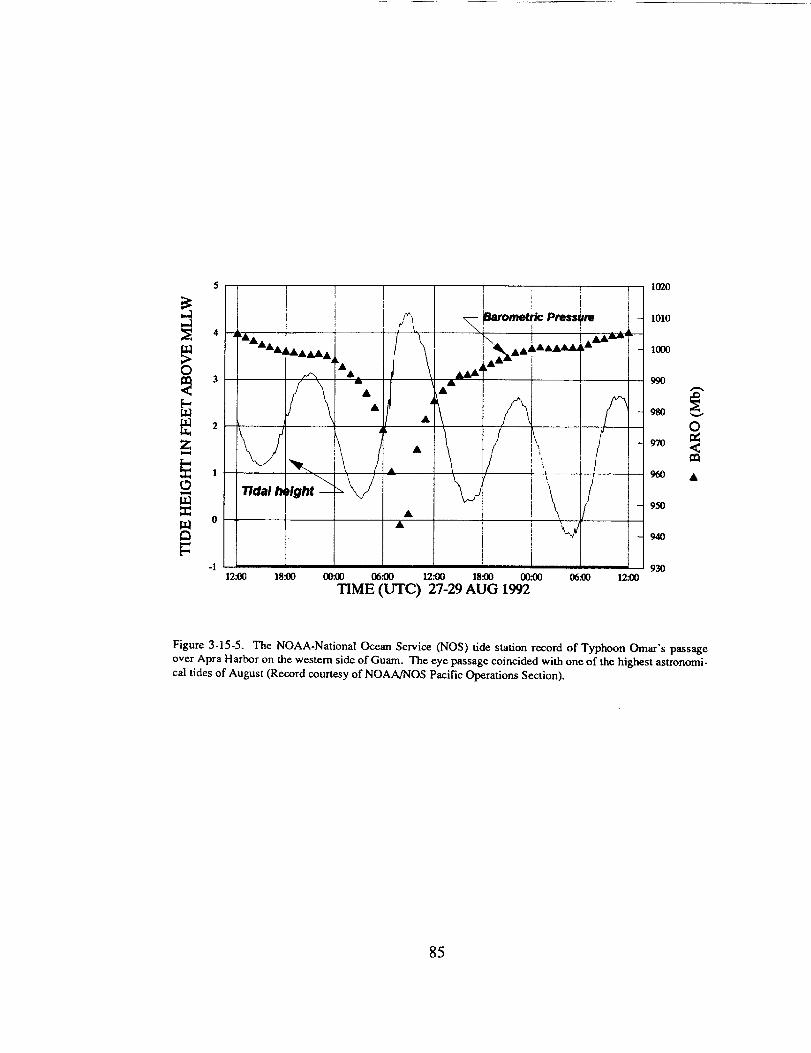
— —
3 1020
10104
Km
3 990
w2
970
1 %0
9500
940
-112@
93018s141 O&OO mOO mm
TIME~m&’C) 1%-29 fUmG 199212a0
Figure 3-15-5. The NOAA-National Ocean Service (NOS) tide station record of Typhoon Omar’s passageover Apra Harbor on the western side of Guam. The eye passage coincided with one of the highest astronomi -cd tides of August (Record courtesy of NOAA/NOS Pacific Operations Section).
85

ES71MATEDHEIGHT(1NFEET)OF WATERABOVEMEANHIGHTIDE
2-4
77-Q 3+
{
2-4
2-4
Figure 3-15-6. Maximum “’storm surge” heights (which include astronomical tide, hydrosta-tic effects, and winds driven wave effects) at selccmd locations on Guam as estimated fol-10wing Omar’s passage.
86
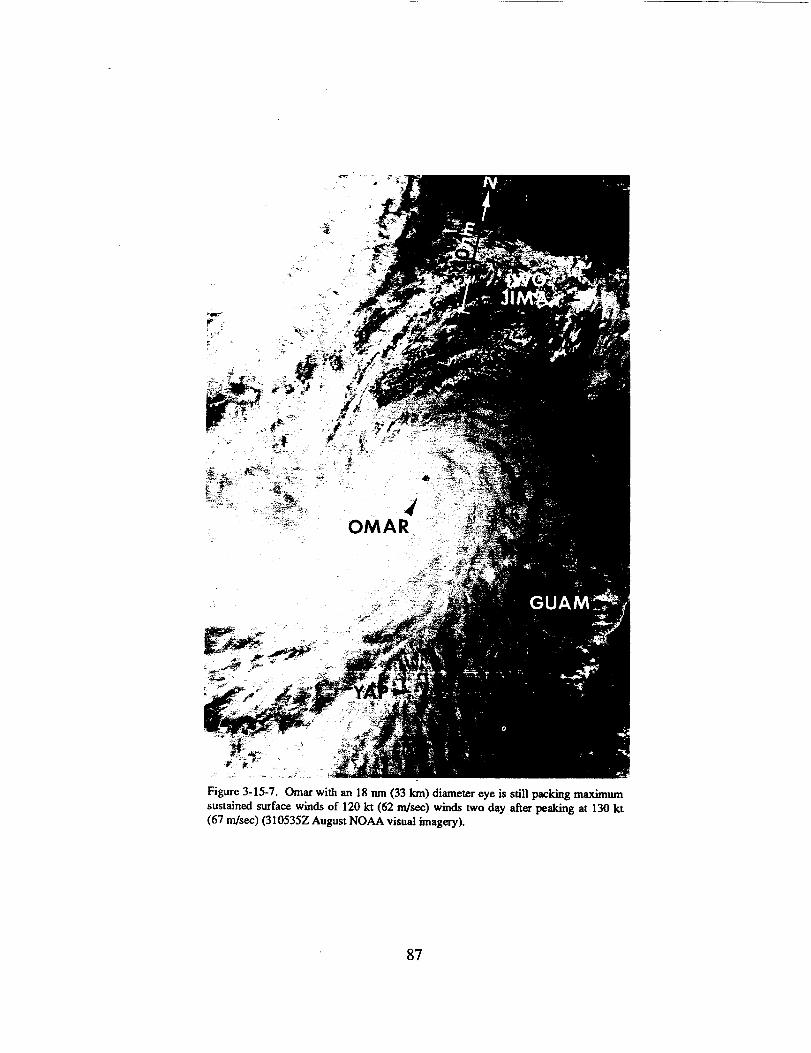
Figure 3-15-7. Omar with an 18 nm (33 km) diameter eye is still packing maximumsustained surface winds of 120 kt (62 rn/see) winds two day after peaking at 130 kt(67 III&C) (310535Z August NOAA visual imagery).
87
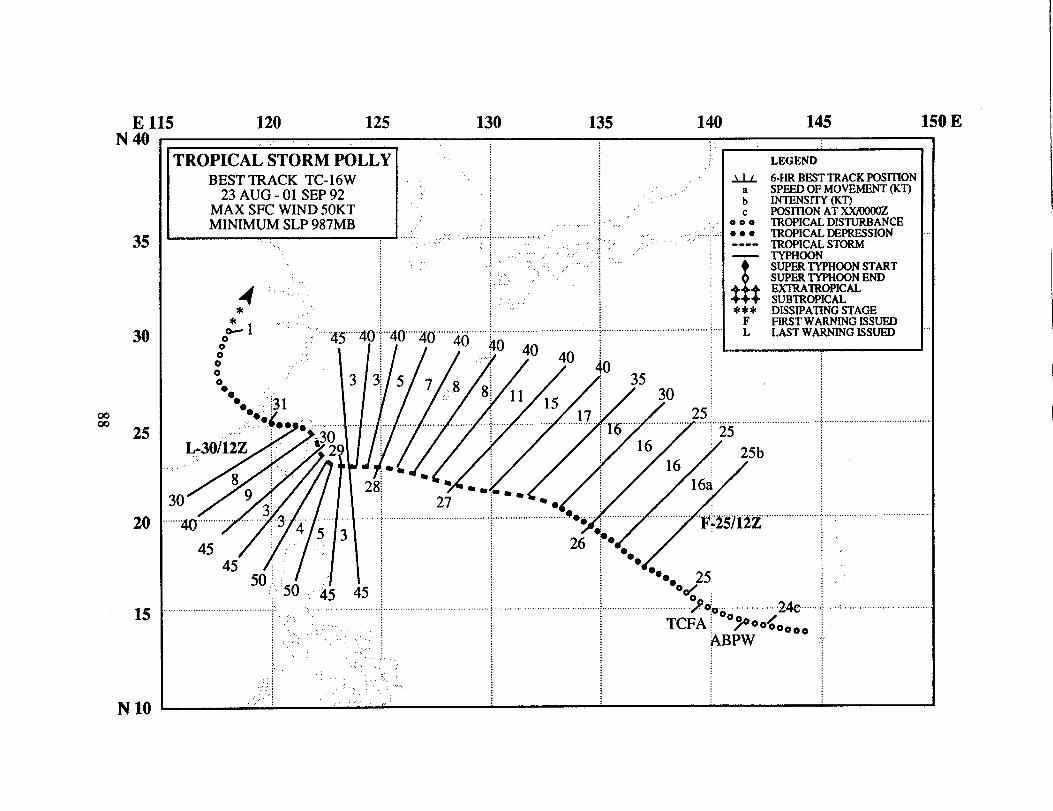
E 115 120 125 130 135 140 145 150 EN40
35
30
00w 25
20
15
N 10
TROPICAL STORM POLLY “ :BESTTRACK TC-16W
23 AUG -01 SEP92MAX SFC WIND50KT : ,.MINIMUMSLP 987MB ,:” ,“~ ~~~~~~~: ‘“ ,,,,,:,:,:
..... . ... ,.............. ......... . .;.,,. ..’..! .: ...’ .,.:~.. ,, ’,,,.‘..::.. “ ,{ ,’..~:’ ,. ..,. ..;
!..;:... ..:.: .’,:’4“’””*
a “’””””’“ “45”””’”49”~””’?0’’”’”4o’’”’’”’4o’‘“”’”:’”’’””””””””””””””""""""""'"""""`""""""""~`"`"'''""""'""'"''"'"'''""""'"''''""'''"'''!""0° ‘~ 40 40 ~
~~~y,o ‘
-%zx?lwi.:.
LEGEND
JJ_L 6-HR BESTTRACKPOSITIONSPEEDOF MOVEMENTW’r)
: INTENSITY(W)POSITIONAT XX/OOOOZ
0:0 TROPICALDIST7JRBANCE● 00----
L
SUBTROPICALDISSIPATINGSTAGEFIRSTWARNINGISSUEDLASTWARNINGISSUED
45 /$/””/\,,........3.. ~... ~ ~
:,, .
45 :so;; ..‘: ’50.,45 45
........
............ .... .. ///’, /’
-ao.. ;“’’-’’’’”. - .“’’’’’’..’’..” “’””””:’””””’”‘“””’’’”’’’’”’””’’””’’””’”””F-25/i2Z26 “~ .*
●
●*●mOd25
..,.,..>..“‘ .......~..............>de.......2kTCFA ; ‘“>oo<oooo
~BPW
........... ... .. . .
........
,..::..,!,
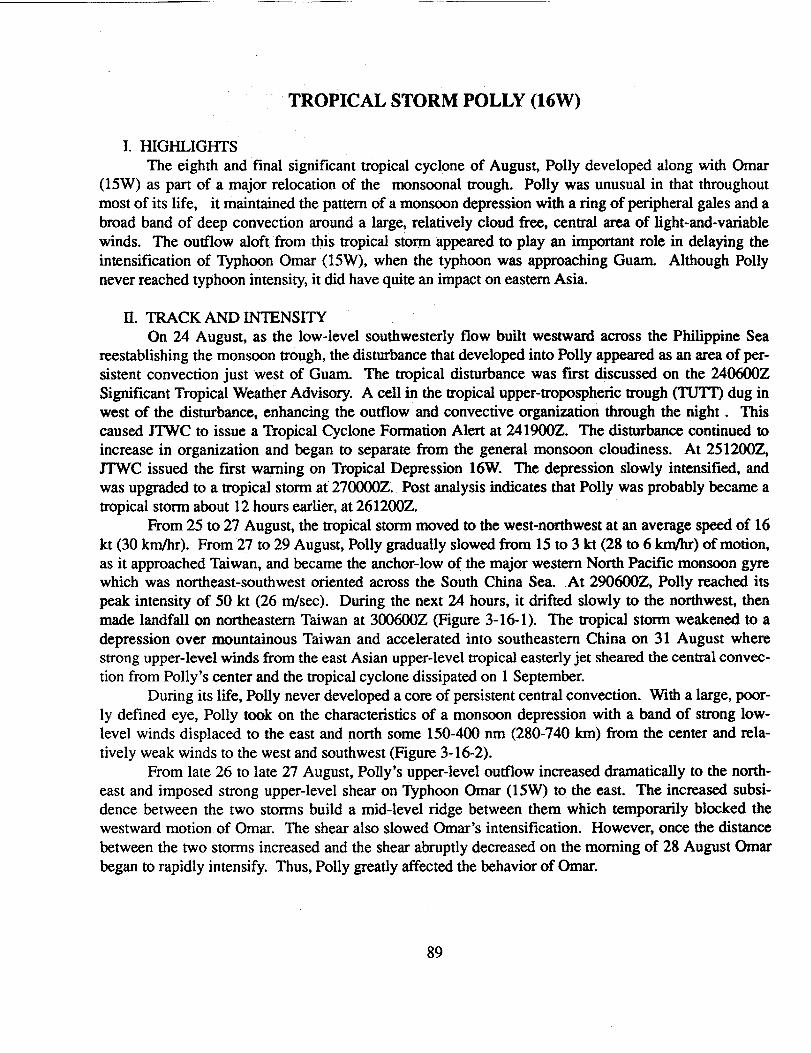
TROPICAL STORM POLLY (16W)
I. HIGHLIGHTSThe eighth and final significant tropical cyclone of August, Pony developed along with Omar
(15W) as part of a major relocation of the monsoonal trough. Pony was unusual in that throughoutmost of its life, it maintained the pattern of a monsoon depression with a ring of peripheral gales and abroad band of deep convection around a large, relatively cloud free, central area of light-and-variablewinds. The outflow aloft from this tropical storm appeared to play an important roie in delaying theintensification of Typhoon Omar (lSW), when the typhoon was approaching Guam. Although Ponynever reached typhoon intensity, it did have quite an impact on eastern Asia.
IL TRACK AND INTENSITYOn 24 August, as the low-level southwesterly flow built westward amoss the Philippine Sea
reestablishing the monsoon trbugh, the disturbance that developed into Pony appeared as an area of per-sistent convection just west of Guam. The tropical disturbance was fiit discussed on the 240600ZSignificant Tropical Weather Adviso~. A cell in the tropical upper-tropospheric trough (lT.JIT) dug inwest of the disturbance, enhancing the outflow and convective organization through the night . Thiscaused JTWC to issue a Tropical Cyclone Formation Alert at 241900Z. The disturbance continued toincrease in organization and began to separate from the general monsoon cloudiness. At 25 1200Z,JTWC issued the frost warning on Tropical Depression 16W. The depression slowly intensified, andwas upgraded to a tropical storm at 270000Z. Post analysis indicates that Pony was probably became atropical storm about 12 hours earlier, at 261200Z.
From 25 to 27 August, the tropical storm moved to the west-northwest at an average speed of 16kt (30 krn/hr). From 27 to 29 August, Pony gradually slowed horn 15 to 3 ~ (28 to 6 m) of motion,as it approached Taiwan, and became the anchor-low of the major western North Pacific monsoon gyrewhich was northeast-southwest oriented across the South China Sea. At 290600Z, Pony reached itspeak intensity of 50 kt (26 rn/see). During the next 24 hours, it drifted slowly to the northwest, thenmade landfall on northeastern Taiwan at 300600Z (Figure 3-16-1). The tropical storm weakened to adepression over mountainous Taiwan and accelerated into southeastern China on 31 August wherestrong upper-level winds from the east Asian upper-level tropical easterly jet sheared the central convec-tion from Pony’s center and the tropical cyclone dissipated on 1 September.
During its life, Pony never developed a core of persistent central convection. With a large, poor-ly defined eye, Pony took on the characteristics of a monsoon depression with a band of strong low-level winds displaced to the east and north some 150-400 nm (280-740 km) from the center and rela-tively weak winds to the west and southwest (Figure 3-16-2).
From late 26 to late 27 August, Pony’s upper-level outflow increased dramatically to the north-east and imposed strong upper-level shear on T~hoon Omar (15W) to the east. The increased subsi-dence between the two storms build a mid-level ridge between them which temporarily blocked thewestward motion of Omar. The shear also slowed Omar’s intensification. However, once the distancebetween the two storms increased and the shear abruptly decreased on the morning of 28 August Omarbegan to rapidly intensify. Thus, Pony greatly affected the behavior of Omar.
89
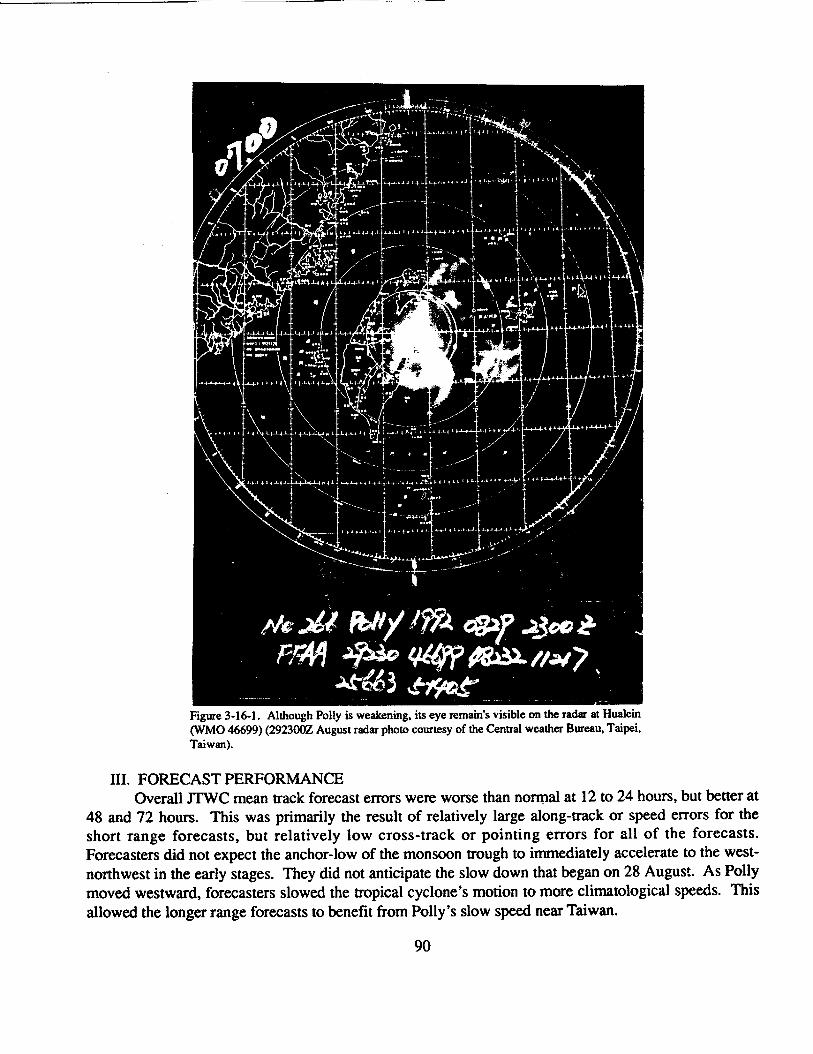
Figure 3-16-1. Although Pony is weakening, i~ eye remain’s visible on the radar at Hualein(WMO 46699) (292300Z August radar photo courtesy of the Central weather Bureau, Taipei,Taiwan).
III. FORECAST PERFORMANCEOverall JTWC mean track forecast errors were worse than no~al at 12 to 24 hours, but better at
48 and 72 hours. This was primarily the result of relatively large along-track or speed errors for theshort range forecasts, but relatively low cross-track or pointing errors for all of the forecasts.Forecasters did not expect the anchor-low of the monsoon trough to immediately accelerate to the west-northwest in the early stages. They did not anticipate the slow down that began on 28 August. As Ponymoved westward, forecasters slowed the tropical cyclone’s motion to more climatological speeds. Thisallowed the longer range forecasts to benefit from Pony’s slow speed near Taiwan.
90
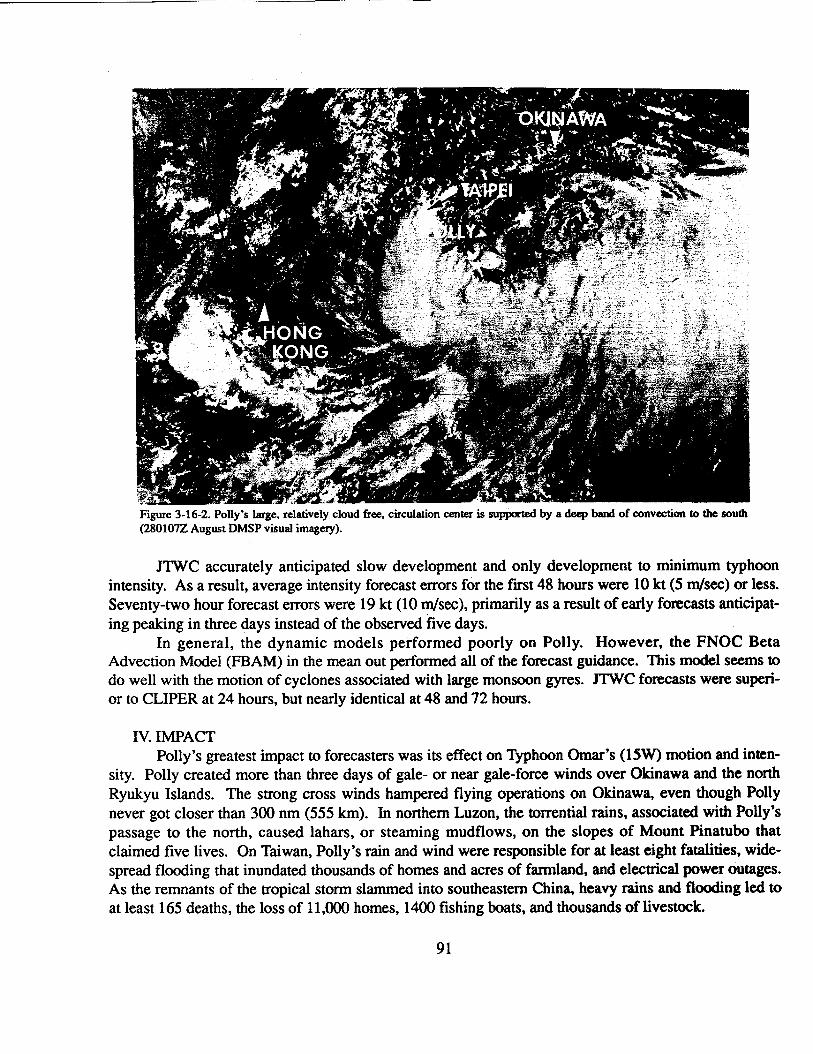
Figure 3-16-2. Pony’s large, relatively cloud free, circulation center is supported by a deep band of convection to the south(2801O7Z August DMSP visual imagery).
JTWC accurately anticipated slow development and only development to minimum typhoonintensity. As a result, average intensity forecast errors for the fmt 48 hours were 10 kt (5 mkc) or less.Seventy-two hour forecast errors were 19 kt (10 mkc), primarily as a result of early forecasts anticipat-ing peaking in three days instead of the observed five days.
In general, the dynamic models performed poorly on Pony. However, the FNOC BetaAdvection Model (FBAM) in the mean out performed all of the forecast guidance. This model seems todo well with the motion of cyclones associated with large monsoon gyres. JTWC forecasts were superi-or to CLIPER at 24 hours, but nearly identical at 48 and 72 hours.
IV. IMPACTPony’s greatest impact to forecasters was its effect on Typhoon Omar’s (15W) motion and inten-
sity. Pony created more than three days of gale- or near gale-force winds over Okinawa and the northRyukyu Islands. The strong cross winds hampered flying operations on Okinawa, even though Ponynever got closer than 300 nm (555 km). In northern Luzon, the torrential rains, associated with Pony’spassage to the north, caused lahars, or steaming mudflows, on the slopes of Mount Pinatubo thatclaimed five lives. On Taiwan, Pony’s rain and wind were responsible for at least eight fatalities, wide-spread flooding that inundated thousands of homes and acres of fanrdand, and electrical power outages.As the remnants of the tropical storm slammed into southeastern China, heavy rains and flooding led toat least 165 deaths, the loss of 11,000 homes, 1400 fishing boats, and thousands of livestock.
91

E 125 130 135 140 145 150 155 160 165 170 EN 50
45
40
35
30aw
25
20
15
10
N5
,;
TYPHOON RYANW12 ~ ‘ ~~~~~~
BESTTRACK TC-17W29 AUG-12 SEP 92
u 6-HR BEST TRACKPGSITIC
MAXSFC WIND 115KTMINIMUMSLP927MB
.......... .,,..:,.,,
*** DISSJPATINGSTAGEFIRST WARNINGISSUED
--80 ~5~ [ LASTWARNINGISSUED
....................................................... ...... .. ...
,..j
147 E
75
TYPHOON RYAN (17W)
1. HIGHLIGHTSThe first of five significant tropical cyclones to form in September, Ryan became part of a three
storm outbreak east of 150° E longitude along with Typhoons Omar (15W) and Sibyl (18W). AlthoughRyan initially took a west-northwestward course similar to the two preceding tropical cyclones, it laterstalled, and then changed to a north-orientated track. Two days after transitioning to an extratmpica.1low east of Hokkaido, the remnants of Ryan could still be identified, as an occluded low continuingnorthward over Siberia, north of the Sea of Okhotsk.
II. TRACK and INTENSITYOn 29 August, one day after Typhoon Omar (15W) roared across Guam knocking the Joint
Typhoon Warning Center out of commission, the Alternate JTWC (AJTWC) noticed a persistent area ofconvection east of the Mariana Islands and included it on the 2906002 Significant Tropical WeatherAdvisory. As this persistent area of convection at the extreme eastern end of the monsoon troughmoved west-northwestward, the tropical disturbance steadily increased in convective organization,prompting AJTWC to issue a Tropical Cyclone Formation Alert at 3121OOZ, and the first warningshortly afterward at O1OOOOZSeptember. ”
Instead of continuing along the axis of the monsoon trough to the west-northwest, as Omar(15W) and Pony (16W) had done, Ryan stalled on 2 September, and abruptly changed course in~sponse to a weakening of the subtropical ridge to the north caused by the passage of a deep mid-leveltrough. As the tropical cyclone drifted northward in a weak steering environment, it gradually intensi-fied and became a typhoon at 0212002.
On 5 September, a second mid-level trough began to deepen near Honshu and effect the subtrop-ical ridge. As a consequence, the typhoon (Figure 3-17-1) changed to a north-northeast track, andreached a peak intensity of 115 kt (59 m/see) at 0700002. When the ridge reestablished itself tier thetrough’s passage on 8 September, the typhoon began to move northwestward. Then, on 10 September,the cyclone turned east of north again, and began to accelerate ahead of a third mid-latitude trough. At1112002, Ryan transitioned into an extratropical low east of Hokkaido and JTWC, which had resumedprimary warning responsibility on 8 September, released a final warning. The extratropical remnants ofRyan continued northward across the Sea of Okhotsk and was still evident as a large occluded low overSiberia two days later.
III. FORECAST PERFORMANCERyan’s first 28 warnings were issued by AJTWC and the last 15 by JTWC. Early track forecasts
predicted that Ryan would be a straight-runner to the west, however, after it became app~ent that thetrack would become north-oriented, the errors were noticeably reduced. Overall mean JTWC trackforecast errors were 97, 238 and 360 nm (180, 445, and 665 km) for 24,48 and 72 hours, respectively.Although the mean errors at 48 and 72 hours were larger than average, JTWC and AJTWC did showskill by bettering CLIPER by 70% on this harder-than-average typhoon. However, for 72-hour fore-casts, the best overall guidance was provided by OTCM, which in the mean, was considerably betterthan JTWC/AJTWC by 139 nm (255 km). With regard to intensity, the short range forecasts verifkdwell. Nevertheless, for the 36-hour period beginning at 0218002, the 72-hour intensity forecasts werelow by 20 to 50 kt (10 to 26 m/see) due to anticipated weakening that did not occur.
93

94

IV. IMPACTTyphoon Ryan remained over open ocean and no reports of property damage or loss of life were
received. While Ryan was developing northeast of Saipan, and moving erratically, it threatened thesparsely populated islands of Pagan and Agrihan which were in Condition of Readiness One for nearlytwo days. The system also enhanced the southwest monsoon between Guam and Saipan, delaying thearrival of barges carrying bucket trucks and line crews from Saipan to help restore power on Guam.
This was the first time in recent history that the AJTWC had to activate in the middle of thewestern North Pacific tropical cyclone season for JTWC and keep the Pacific Command’s warning sys-tem running for a long period, 11 days. AJTWC rose to the challenge and the excellent statistics bearthis out.
95
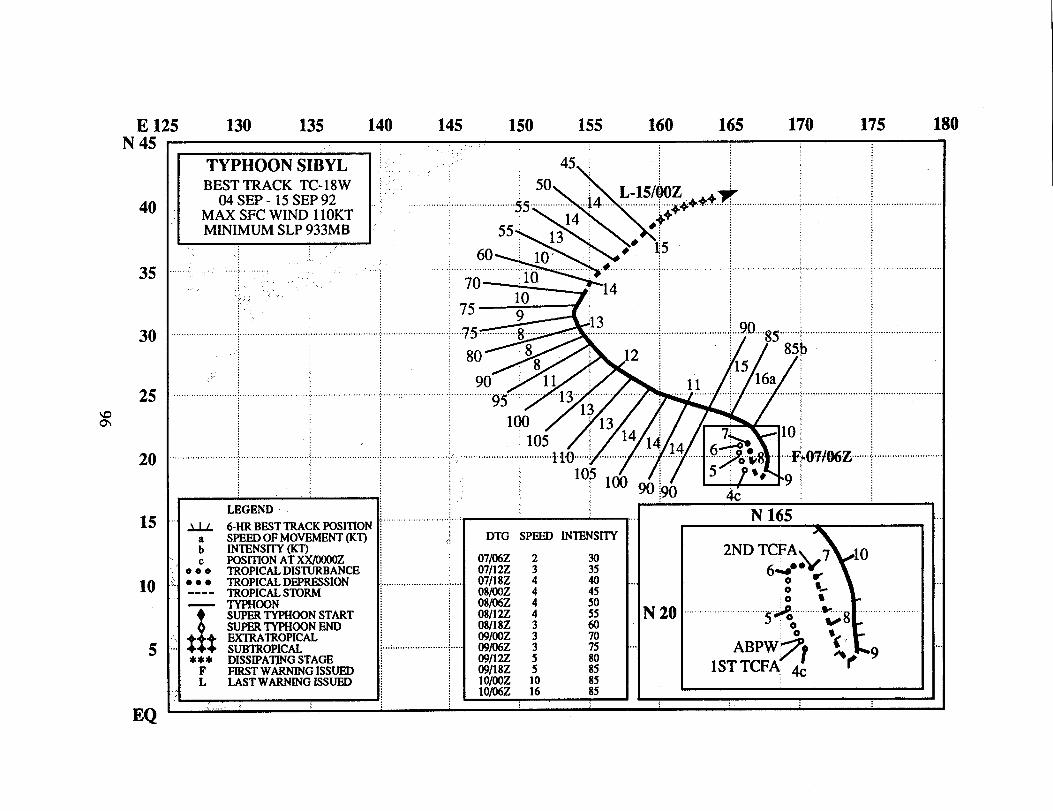
E 125N 45
40
35
30
25am
20
15
10
5
EQ
130 135 140 145 150 155 160 165 170 175
J:BESTTRACK TC-18W ; ,
04sEP-15SEP92 \MAX SFC WIND 110KT ““”MINIMUMSLP 933MB
:;,.
I LEGEND
...
U 6-HR BESTTRACKPOSITIONa SPEEDOF MOVEMENT(KT)b INTEN!HTY(KT)c POSITION AT XX/UOOOZ
000 tiOPICAL DIS1l.htBANCE● ● ● TROPICALDEPRESSION---- TROPICALSTORM— TYPEKX)N
!
sUPER TYPHOONSTARTSUPERTYPHOONEND
$%ExrRATRoPIcALSUBTROPICAL
*** DISSIPATINGSTAGEFIRSTWARNINGISSUED
: LASTWARNINGISSUED
,. .,..
,,..,,..
,,.,..,..,,.
J,+
. . . . . . . . ...+...90...85. ............;/ / 85b
100 / “713/
.... ... .......... ......................55..50. . ....... ...j4..... L-15’~z i ;....................+++..+.7
Si$i$
+ y.......................:.....,4+ ~ :55 /4: : \ ,
60:lo+*!5”[
“’”+?.. ..... ......&......... .;...... ......... ... ......... .... ...
70 ““ :10 ‘
75
80
90
................................ ... ... ...
IO(JV15 :?*N9;i:""""`'''"'"""`"""''"."''"""'"`"""*lo""""""y""""""""““””””””””’”’’:’’””””“’go%?“’““’F?07/Mfi’’””’”;’””’”’”’”””””””’”’””10:
;90 &i
H DTG SPEED 1NTENSIT%
N 20
180

—.— —
TYPHOON SIBYL (18W)
I. HIGHLIGHTSThe second of five significant tropical cyclones to form in September, Sibyl, like Ryan (17W),
formed at the extreme eastern end of the monsoon trough. But unlike Ryan, Sibyl underwent a complexinteraction with a cyclonic cell in the Tropical Upper-Tropospheric Trough (TUTT), and later recurvedFor five days Sibyl exhibited erratic motion and slowly intensified near Wake Island before moving to
the northwest and mcurving.
II. TRACK AND INTENSITYThe tropical disturbance that became Sibyl formed at the eastern end of the monsoon trough that
included both Typhoon Omar (15W) and Typhoon Ryan (17W). As Ryan (17W) intensified, the fallingsurface pressures along the monsoon trough extended eastward into the Wake Island area. In respon%the surface pressure at Wake Island (WMO 91245) had been slowly, but steadily falling since 1September (Figure 3-18-1). The combination of the falling surface pressures, soundings from WakeIsland (WMO 91245) showing strengthening southwesterlies, and the appearance of an exposed low-level circulation center on the satellite imagery, prompted the Alternate JTWC (AJTWC) to issue aTropical Cyclone Formation Alert (TCFA) at 0404002.
Figure 3-18-1. Barograph trace for the period 01-11 September for Wake Island (WMO 91245) showing the steadily falling pres-sures from 0100002 to 0914452 associated with the extension of the mommm trough into the ar~ snd the formation and inten-sflcation of Sibyl near the island. (Mkrobsxogrsph trace courtesy of the National Weather Service Offk Wake Island).
In the TU’IT over the alert area, in conjunction with the increasing outflow from Ryan (15W), acyclonic cell developed. As the complex interaction between the tropical disturbance and the TU’lT-cell progressed, the deep convection was sheared from the low-level circulation center by strong 35- to45-kt (18- to 23-m/see) winds around the TU’IT-cell at 200 mb. As a result, the TCFA was canceled at0504002. Though the strong vertical wind shear remained over the are% the stronger than normal low-level winds remained. The ambient surface pressure near Wake Island continued to fall, and the tropicaldisturbance persisted in the form of a monsoon depression. A second TCFA, issued at 070000Z, dis-cussed the gales, and the presence of a low-level circulation center evident in the synoptic and satellitedata. The reappearance of central convection resulted in AJTWC issuing the first waming at 0706002.Subsequently, Sibyl was upgraded to tropical storm intensity at 0718002 as the central convectionexpanded displacing the TUTT-cell aloft farther to the north. The tropical storm continued to intensify,
97

and a visible eye developed in the central dense ovemast. The resulting satellite intensity estimate of 65kt (33 m/see) was the basis for Sibyl’s upgrade to typhoon on the 090000Z warning issued by JTWC.At091445Z, Wake Island recorded its lowest pressure, 984.5 mb, and northwest winds of 35 gusting to48kt(18 G 25 m/see) at 091500Z, as Typhoon Sibyl finally began moving away.
Until 9 September, Sibyl’s erratic track appeared to be the consequence the southwest flow asso-ciated with the interaction of the monsoon flow and with the easterlies of the subtropical ridge to the
north and east of Wake Island. The TU’IT may have played a role in the erratic movement as well.This complex synoptic pattern changed on 9 September, and Sibyl made an abrupt track change to thenorth. By 10 September the typhoon had accelerated and had settled into a more nomtl northwestwdcourse under the influence of the subtropical ridge (Figure 3-18-2). Sibyl continued tracking towad thenorthwest until 13 September, when it passed through a break in the mid-tropospheric subtropical ridgeand recurved. The final warning was issued by JTWC at 1500002 as Sibyl became extrampical andaccelerated to the northeast.
Figure 3-18-2. Typhoort Sibyl finally moves away from Wake Island. Typhoon Ryan (17W) is v~lble at the topleft of the picture (102133Z September NOAA visual imagery).
98
III. FORECAST PERFORMANCESibyl proved to a difilcult system for AJTWC/JTWC to forecast. The overall mean track errors
were 100, 194 and 305 nm (185, 360 and 565 km) for the 24-, 48 and 72-hour forecasts, respectively.While these are below average, they would have been much larger had Sibyl not moved so slowly.Although AJTWC/JTWC showed skill overall on the 24-hour forecasts, CLIPER, which provides theperformance baseline, was superior at the 48- and 72-hour points with 10% and 30% better perfor-mance, respectively.
With regard to intensity, the short term forecasts were good, however, the extended outlooks for72-hours were low by 20 to 45 kt (10 to 23 rn/see) for the first day and a half, and high by 40 to 55 kt(21 to 28 m/see) for a day after 1106002.
IV. IMPACTAlthough Wake Island was buffeted by gales for days, no major damage or injuries were
reported. Some minor water damage occurred, and Wake Island was in Condition of Readiness 1 for aday.
As with Typhoon Ryan (17W), AJTWC warned on Sibyl while JTWC was incapacitated.However, many of the direct telephone discussions with customers in Micronesia, including WakeIsland, were handled by the JTWC, Guam forecasters. JTWC was able to resume its full service on 8September.
99
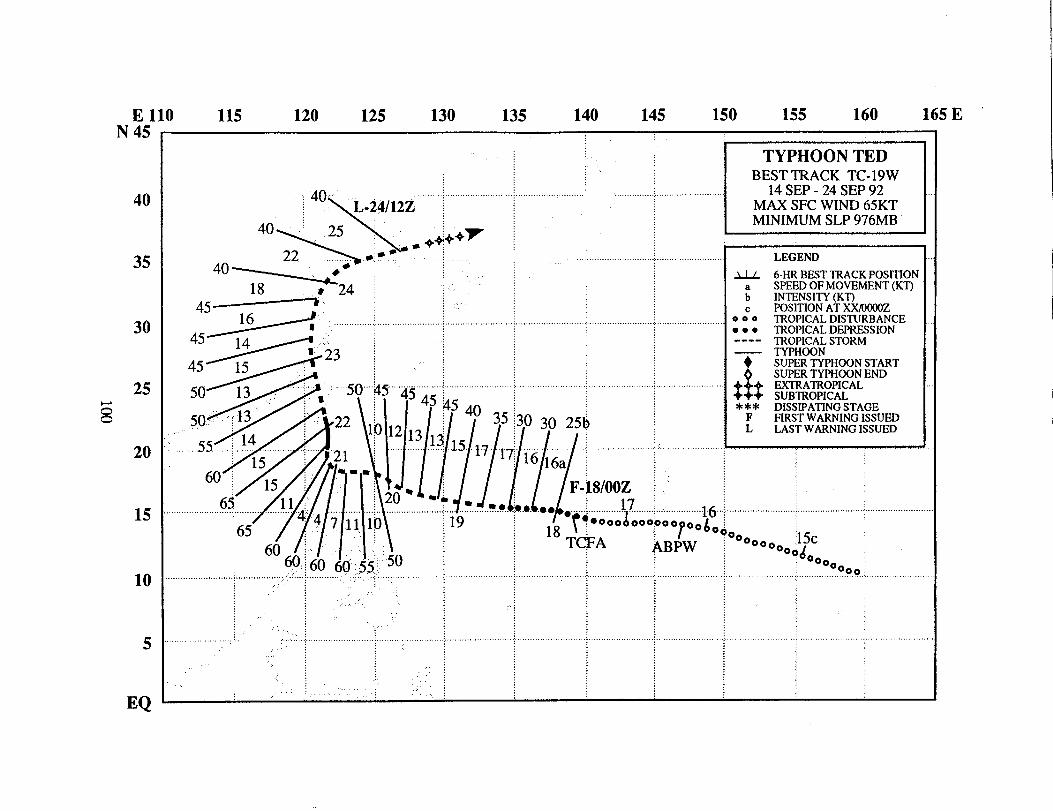
E 110 115 120 125 130 135 140 145 150 155 160 165 EN 45
40
35
30
25
~
20
15
10
5
EQ
TYPHOON TEDBESTTRACK TC-19W
“:40 ........... 14SEP -24 SEP 92L-24/12~ ~ / MAXSFCWIND65KT
40 : 25 : :+7 ‘;\ - +$+22 ...* ..*? :. :
40 ~ 4...0 ,24 :’
45~ - 1 ““””””””””””r”’”” *.lb ~< ,,,..,............... .........
:’H23~‘ ~/
~o,..,fl~.. .T...ji...i
;’ 8
@/n?//5.0’““~~’” ;’‘ 22 : ;lb 1213 ~~
...55...... !.! . . .; ~~~~~1 : ~~~~~~:.
/
60 ; 15 ~:” ,*-=: ~15 !
65 11 ,’” :20* :-y-l–– I. ............4 d .7 i ~ lo....:.... ... ...........
.Lc :19
K/mooz‘---- “- ‘-YIT.JRBANCE..,,,,:,,,,.. ..........{...
“1000 “l”K(WICALLJIS● ● ● TROPICALDEPKE.SSK)N---- ~RO;Il; STORM
~ SUPERTYPHOONSTART
‘ ......L.E.................... ......
\:l @4540 :
///y//:
35 ~30 30 25~
i ..1.5..y7....l~. .16..16a......
.’.F-i8/ooz i ‘“ ;
\; / \j.,,,7.,-,.?,.-.*, M9.b.b F.00 ....................!!...........................~6...f........................................................................
‘v’(j;6&~jb,~5:.\o~ ~ 18:2:;oAooo~!;koooo:0“0 ~
.,:.. ..... ... ......................................................’ .,’.”..‘..;. .{....,,’.,,,..,,,.,,. . . . . . . . . . . . . . . . . . . .
“00;.
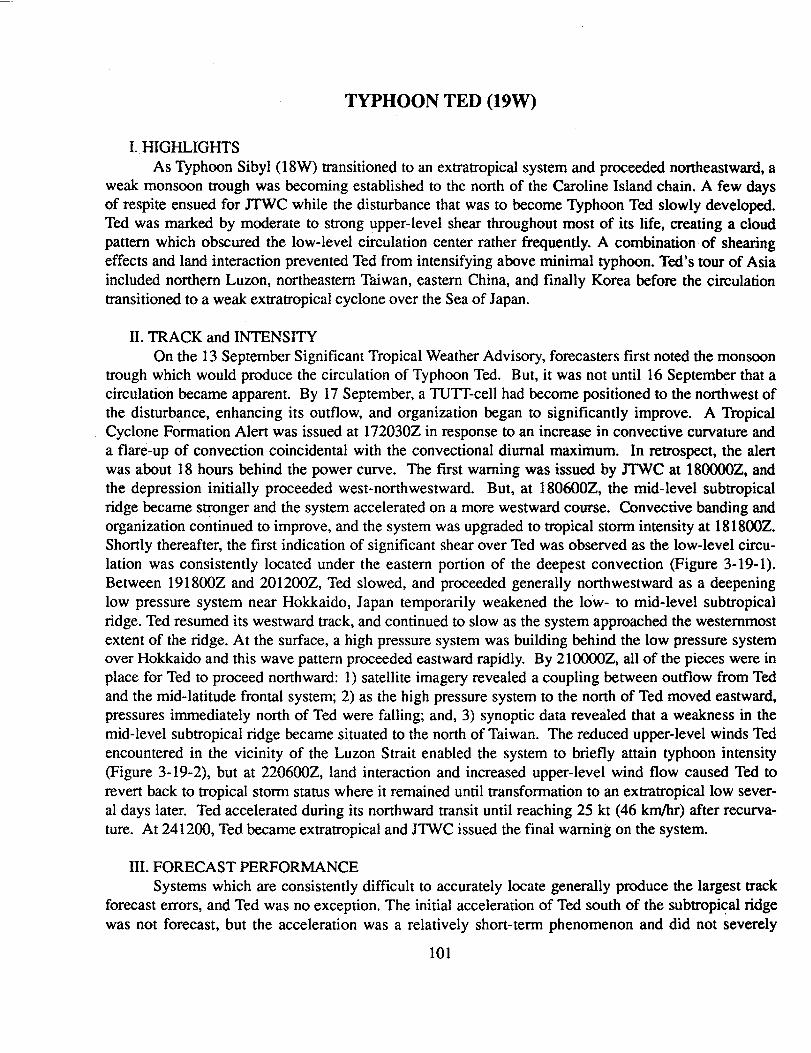
TYPHOON TED (19W)
I. HIGHLIGHTSAs Typhoon Sibyl (18W) transitioned to an extratropical system and proceeded northeastward, a
weak monsoon trough was becoming established to the north of the Caroline Island chain. A few daysof respite ensued for JTWC while the disturbance that was to become Typhoon Ted slowly developed.Ted was marked by moderate to strong upper-level shear throughout most of its life, creating a cloudpattern which obscured the low-level circulation center rather frequently. A combination of shearingeffects and land interaction prevented Ted from intensifying above minimal typhoon. Tti’s tour of Asiaincluded northern Luzon, northeastern Taiwan, eastern China, and finally Korea before the circulationtransitioned to a weak extratropical cyclone over the Sea of Japan.
II. TRACK and INTENSITYOn the 13 September Significant Tropical Weather Advisory, forecasters first noted the monsoon
trough which would produce the circulation of Typhoon Ted. But, it was not until 16 September that acirculation became apparent. By 17 September, a TU1’T-cell had become positioned to the northwest ofthe disturbance, enhancing its outflow, and organization began to significantly improve. A TropicalCyclone Formation Alert was issued at 172030Z in response to an increase in convective curvature anda flare-up of convection coincidental with the convectional diurnal maximum. In retrospect, the alertwas about 18 hours behind the power curve. The first warning was issued by JTWC at 180000Z, andthe depression initially proceeded west-northwestward. But, at 180600Z, the mid-level subtropicalridge became stronger and the system accelerated on a more westward course. Convective banding andorganization continued to improve, and the system was upgraded to tropical storm intensity at 181800Z.Shortly thereafter, the first indication of significant shear over Ted was observed as the low-level circu-lation was consistently located under the eastern portion of the deepest convection (Figure 3-19-1).Between 191800Z and 201200Z, Ted slowed, and proceeded generally northwestward as a deepeninglow pressure system near Hokkaido, Japan temporarily weakened the low- to mid-level subtropicalridge. Ted resumed its westward track, and continued to slow as the system approached the westernmostextent of the ridge. At the surface, a high pressure system was building behind the low pressure systemover Hokkaido and this wave pattern proceeded eastward rapidly, By 2 10000Z, all of the pieces were inplace for Ted to proceed northward: 1) satellite imagery revealed a coupling between outflow from Tedand the mid-latitude frontal system; 2) as the high pressure system to the north of Ted moved eastward,pressures immediately north of Ted were Ming; and, 3) synoptic data revealed that a weakness in themid-level subtropical ridge became situated to the north of Taiwan. The reduced upper-level winds Tedencountered in the vicinity of the Luzon Strait enabled the system to briefly attain typhoon intensity(Figure 3-19-2), but at 220600Z, land interaction and increased upper-level wind flow caused Ted torevert back to tropical storm status where it remained until transformation to an extratropical low sever-al days later. Ted accelerated during its northward transit until reaching 25 kt (46 km/hr) after recurva-ture. At 241200, Ted.became extratropical and JTWC issued the final warning on the system.
III. FORECAST PERFORMANCESystems which are consistently difficult to accurately locate generally produce the largest track
forecast errors, and Ted was no exception. The initial acceleration of Ted south of the subtropical ridgewas not forecast, but the acceleration was a relatively short-term phenomenon and did not severely
101

IV. IMPACTOn northern Luzon, torrential rains from Td caused landslides and flooding which resulted in at
least 8 fatalities. The impact on Tkiwan and eastern China was similar with heavy rains, flooding andlandslides. However, the losses were much greater in eastern China where at least 53 lives were lostand as many people were reported as missin~ over 30,000 houses collapsed; and extensive darnage toagricultural land occurred. No loss of life or significant damage reports were received fmm Korea.
Figure 3-19-2. The 220200Z September radar image from Haulien (WMO 46699) ofTed at peak intensity (radar photo courtesy of the Central Weather Bure& Taipei,Taiwan).
103

Ello 115 120 125 130 135 140 EN40
35
30
25
20
15
N 10
+---,.e-......... .. .......= .::--
.7 118
..:.,.....”’.... “’.:: ..,: ,
: +...,,,:,,. . .. .. . ..:..
Figure 3-19-3. NOGAPS guidance for Ted is consistcruly north of track until the tropical storm enters the Luzon .strai~ then themodel locks on.

E 130N 40
40
35
30
25
20
15
10
5
EQ
135 140 145 150 155 160 165 170 175 180; .. ,,.,:,’,., ‘.’;,. .,.. ;... ~ TROPICAL STORM VAL: :,”:, .,.;.. .
++ : : BESTTRACK TC-20W::..19SEP -27 SEP 92..... .. ...,:,,.,,,...,. ........ .!.,.,.. .:,.,.,. .......++. .........................’ ~~~‘ .’...~..
MAXSFC WIND55KTMINIMUMSLP 984MB; ,...’
{ ,’.:::,,,.,.,..,..,........... ,.,,,,,..; ... .... ... . ..................................................................................................................................,.:.............................j............,....,,,...,,,
. ..’.’.’‘.’,,. ;:.,,,.
...............!.........................................
... .. .... ........... . .
LEGEND“ U 6-HRBEST TRACKPOSITION
a SPEEDOF MOVEMENT(KT) ,; 35b INTENSITY(KT)
POSITIONAT XX/OOOOZo ofo TROPICALDISTURBANCE :● ● ● TROPICALDEPRESSION---- nOPICAL STORM— mooN
!
SUPERTYPHOONSTARTSUPERTYPHOONEND
$$EXTM’IROPICALSUBTROPICAL
*** DISSIPATINGSTAGEF FIRSTWARNINGISSUED jL LASTWARNINGISSUED :

TROPICAL STORM VAL (20W)
Figureconve(es tqNOAA
3-20-1. Poor]y:tion defines Vallical storm inten:~visual imagery:
orj12
sity).
hours(2404
~ but pabefore it062 Sep
rsistentreach-
The fourth of five significant tropical cyclones to form in September, Val was the only one not tointensify beyond a tropical storm. Like Ted (19W), which formed a day earlier on 18 September, WIwas slow to intensify. After first being mentioned as a broad area of convection on the 1906002September Significant Tropical Weather Advisory, Val became the subject of two Tropical CycloneFormation Alerts before the first warning. The tropical storm passed to the west of Minami Tori Shim&weakened, and on 27 September recurved. Val’s transition to an extratropical low prompted JTWC to
issue the final warning at 2706002.
106

E 135 140 145 150 155 160 165 170 175 180 175 170 165 160N 50
45
40
35
30
5 yJ
20
15
10
5
EQ
w

TYPHOON WARD (21W)
I. HIGHLIGHTSThe last of five significant tropical cyclones to form in September, Ward was unusual in that it
underwent two major track changes and two significant acceleration episodes. As a result, it presentedconsiderable difficulty to JTWC forecasters. Ward remained over open ocean its entire life and onlyposed a threat to maritime interests.
Il. TRACK and INTENSITYWard developed from a tropical disturbance that formed in the trade wind trough just to the east
of the international date line. This disturbance was initially detected on 24 September when its persis-tent convection attracted the atteniion of satellite analysts collocated with JTWC. Even though the cir-culation was located east of the international date line, it was mentioned on the 260600Z SeptemberSignificant Tropical Weather Advisory because it was anticipated to become a significant tropicalcyclone as it crosstid into JTWC’S area of responsibility. At 261 100Z, JTWC issued a Tropical CycloneFormation Alert. Seven hours later, the first warning was issued at 2618002, based on a satellite-denved intensity estimate of 30 kt (15 m/see) and the presence of a well-defined low-level circulationcenter on the animated satellite imagery, near the area of deep convection. After being upgraded to atropical storm, at 270000Z, Ward continued to track west-northwestward, gradually slowing down as itapproached a weakness in the subtropical ridge which had developed in response to an approachingmid-tropospheric short-wave trough. On 28 September, the tropical storm turned sharply to the northand accelerated as the trough to the north swept past. Then, as the subtropical ridge strengthened to thenorth, Ward again made a sharp turn, this time to a more westward track. The appearance of a visibleeye on 01 October indicated that the typhoon had begun to intensify a second time, reaching a maxi-mum intensity of 95 kt (49 m/see) at 021200Z. During the following 24 hours, the diameter of the eyeexpanded from 20 to 70 nm (37 to 130 km) (Figure 3-21-1).
On 5 October, a break in the subtropical ridge developed near 155”E longitude, allowing Wardto recurve and accelerate northward. Extratropical transition ensued on 6 October as the system movedover colder waters north of the Kuroshio current. JTWC issued its final warning at 0612002.
III. FORECAST PERFORMANCE‘ Ward’s track proved to be difficult for JTWC forecasters to predict. Changes in the strength and
orientation of the subtropical ridge led to two abrupt track changes, a series of deceleration and acceler-ation episodes, and a wide, arcing path as Ward’s heading backed 130° from north-northeastward towest-southwestward between 29 September and 01 October. Typically, such a complex track wouldlead to larger than normal forecast errors, and this case was no exception. JTWC’S overall mean trackerrors were 120, 255 and 360 nm (220, 470 and 665 km) for 24-, 48- and 72-hour forecasts, respective-ly. These results on average were 15% better than those of CLIPER, which provides the performancebaseline for demonstrating skill. The primary reason for JTWC’S acceptable performance was the guid-ance provided by the NOGAPS model which for Ward was impressive. However, this was not reallyappreciated until after the fact, when the overall mean track error for NOGAPS guidance was tabulated.It showed that NOGAPS bettered JTWC track forecasts at all time intervals except 12-hour forecasts.At 72-hours, the overall mean track errors for NOGAPS were 40% lower than JTWCS.
108
—.
Overall intensity forecast errors were average; however, for a 2day period starting at 300600Z,the 72-hour intensity forecasts were low by 15 to 30 kt (8 to 15 rrdsec), as anticipated vertical shear didnot occur to arrest intensification.
IV. IMPACTBecause Ward remained over open ocean during its lifetime, it only threatened maritime inter-
ests. No reports of any damage or loss of life were received.
Figure 3-21-1. Ward’s 55 nrn (100 km) diameter eye is visible to tie east of Minarni Tori Shma (0322322 October DMSPvisual imagery).
109
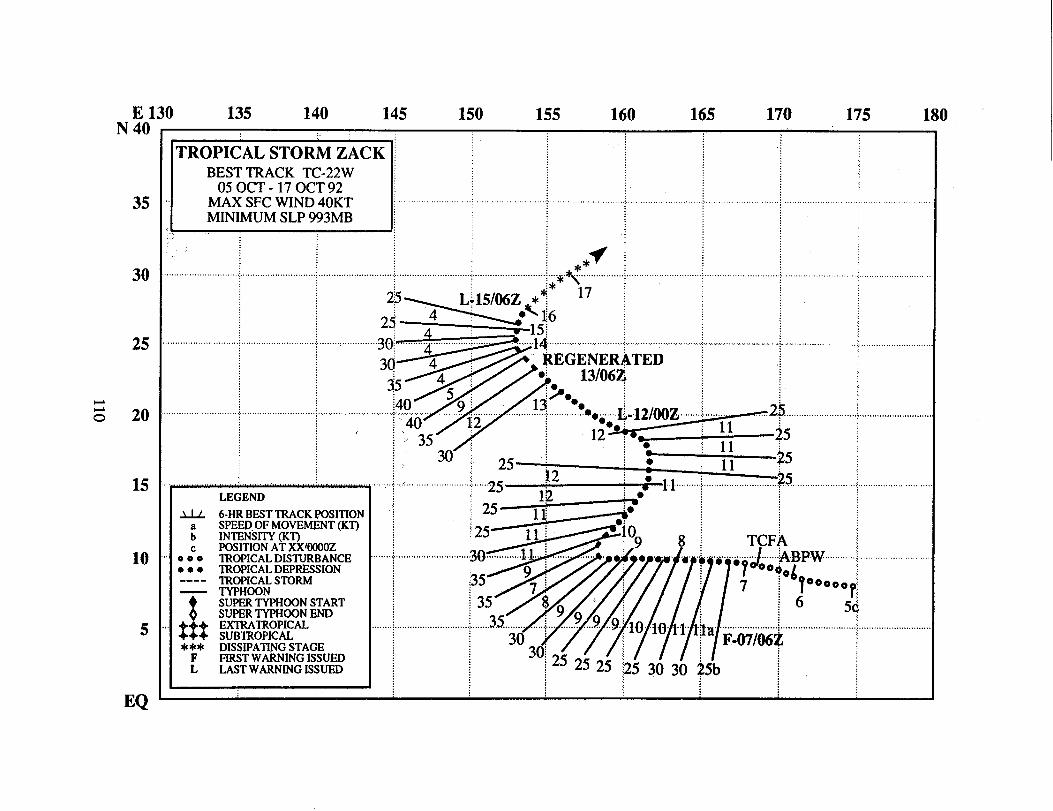
ow
..
....................
...........
...,:..,..,.........
...
...
................ ..Y
~: ‘“””””~””~
733
~~;:
:-N
eac-+M
z~
g;:g.....................................................................~...........................
og~;
gb
4~3
w::
m~,u~
:$m
kg:;
Q*
O)4.
,.
.............
......................
-cmln<
~&
Wozz
:O
m

—
TROPICAL STORM ZACK (22W)
Figure 3-22-1. Cimus cloud partially obscures Zack’s exposed low-level circulation center, which appears at the westernedge of a band of deep convective cloudiness associated with enhartced low-level southwesterly flow.
The first of eight significant tropical cyclones to form in October, Zack was also the first tothreaten the southern Mariana Islands since Omar’s (l SW) devastating passage across Guam in August.Initial JTWC track forecasts towards the southern Mariana Islands and Guam were based on continuedwest-northwestward movement along the axis of the monsoon trough. On 9 October, however, a mon-soon surge of deep southwesterly winds resulted in an abrupt track change to the north-northeast forZack. As the tropical storm weakened, the low-level circulation center became dfilcult to locate, andJTWC issued a final warning on Zack at 120000Z. However, by the following day, the convection andorganization of the system had increased, prompting JTWC to issue a “regenerated” warning at130600Z. Zack briefly reintensified to a tropical storm before transitioning into a subtropical systemand dissipating over the ocean. No reports of damage or injury were received.
111

E 105N 45
40
35
20
15
10
N5
110 115 120 125 130 135 140 145 150 155 E
LEGEND
.LLL 6-HR BEST TRACKPOSITIONSPEED OF MOVEMENT(KT)
: INTENSITY(KT)POSITIONAT XX/OOCOZ
o JO TROPICALDISTURBANCE● c Q TROPICALDEPRESSION---- TROPICALSTORM— TYPHOON
$
w***
F
.. .
SUPER TYPHOON YVEITEBESTTRACK TC-23W
03 OCT-18 OCT92./,.,.....,. ............,,,,,,,,,. . ............... .,,,,,,,,,,,.,,,., MAX SFC WIND 155KTMINIMUMSLP 878MB:,
,1<~05 , : ;; ,. .
I L LAST WARNINGISSUEDJ
150\\; ,.,-J5p \ ~ 101
‘“:115, m>
llJj............ . . ..,...,:... .~20*~
.,..j..-.
...
v":":\l`3v-""'\"+"''J`"""'"""'"""""'"":""""""""""""""'""'""""
..............
SUPER TYPHOON YVETTE (23W)
1. HIGHLIGHTSThe third Northwest Pacific tropical cyclone of 1992 to achieve super typhoon intensity, Yvette
was an action-packed system which posed many forecast challenges. In the span of two weeks, Yvettedeveloped in a moderately sheared environment, made a run toward Luzon as it intensifkd to a typhoon,stalled, executed a major, 150-degree track change, weakened, reintensified to a super typhoon, andtransitioned to an extratropical cyclone. This tropical cyclone marked the beginning of the 1992 supertyphoon season - October being the month of most frequent super typhoon occurrence.
II. TIWCK AND INTENSITYOn 3 October, the monsoon trough extended from the South China Sea eastward across the
southern Philippine Islands and Philippine Sea, through the southern Mariana Islands, and northeast-ward to Typhoon Ward (21W), located 1080 nm (2000 km) northeast of Guam. The persistence of con-vective activity along the trough in the Philippine Sea prompted JTWC forecasters to mention a broadtropical disturbance on the 0306002 Significant Tropical Weather Advisory. Due to moderate verticalwind shear, the low-level circulation center of this tropical disturbance, which was to become Yvette,remained poorly defined. On 5 October, the amount of convection started to increase around the center.At 0706002, a Tropical Cyclone Formation Alert was released as the convective organization wasrapidly improving. When a comma-shaped cloud mass developed in association with the center, JTWCissued the frost warning for Tropical Depression 23W at 0800002. With the rapid appearance of a cen-tral dense overcast, the system was upgraded to a tropical storm at 0806002.
As Yvette tracked westward under the steering influence of the mid-level subtropical ridge to thenorth, it steadily intensified. At 0912002, rapid intensification commenced with Yvette reachingtyphoon intensity at 0918002. The intensification process continued until the typhoon peaked at 125 kt(64 m/see) at 11000OZ (Figure 3-23-l). Coincident with the onset of rapid intensification, the typhoonvirtually stalled and slowly executed a major track change to the northeast in conjunction with the sub-tropical ridge being weakened by the deepening and retrogression of the mid-level East Asian trough.After peaking, Yvette weakened slightly until 1212002, when rapid intensification again started. Thisprocess of premature, low latitude recurvature and subsequent intensification has been described byGuard (1983). At the same time, a large plume of cirrus appeared, extending from the typhoon’s centraldense overcast to the frontal cloudiness to the north and northeast over Japan. By the time that Yvettehad reached its maximum intensity of 155 kt (80 m/see), at 1318002, the extensive plume of cirrus tothe northeast had almost disappeared, suggesting some relationship between the rapid intensificationand the cirrus plume.
At 1406002, the super typhoon (Figure 3-23-2) reached a position where it could proceedaround the western end of the mid-level subtropical ridge. As vertical wind shear from southwesterliesaloft increased, Yvette’s intensity decreased slowly until 16 October, then decreased more rapidly. At1718002, just before Yvette completed its transition to an extratropical low pressure system, JTWCissued the final warning.
113
III. FORECAST PERFORMANCEThe overall mean emors for the track forecasts were 85, 190 and 340 nm (155, 355 and 630 km)
for 24, 48 and 72 hours, respectively. These errors were essentially the same as those for CLIPER,which is used as a performance baseline. Problems that prevented JTWC from outperforming CLIPERwere: 1) the stall and major track change from west to northeast when Yvette was approaching Luzon.
The northeastward drift of Yvettewas mentioned as an alternate sce-nario and then abandoned as thesystem appeared to be accelemtingwestward shortly before it stalled.This acceleration was not real, butresulted from differences betweenthe raw satellite data based onpoorly defined upper-level cloudtop fixes and the location of thelow-level circulation center, whichwas totally obscured by the highcloud shield; 2) the reintensiflca-tion-to-super-typhoon episode wasnot considered as a possibility untilsix hours before it occurred. Thiswas due primarily to an over-reliance on extrapolating the ongo-ing intensity trend into the futurewithout any reliable intensity guid-ance from the numerical models tocontradict that assumption; 3) therapid rate of weakening, startingon 16 October, was under forecastagain based on extrapolation of theearlier trend. In this case, numeri-cal models did predict strong shearover Yvette but, it appeared to be asystem that could remain intactmuch longer than it did in the pres-ence of moderate-to-strong upper-level winds; and, 4) accelerationwas over forecast during the periodYvette was becoming extratropical.This was caused by the slowing ofthe low-level circulation centerafter its decoupling from the fromthe mid- to upper-level center hasoccurred.
114
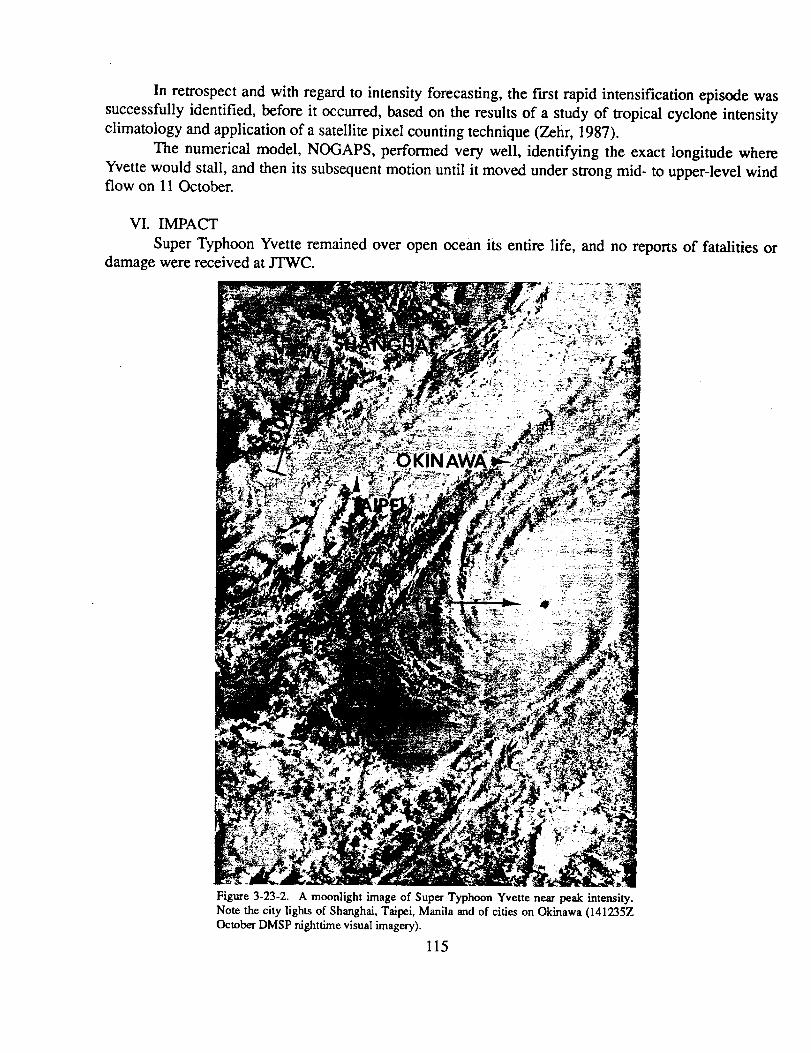
E 85 90 95 100 105 110 115 120 125 130 EN 35
30
25
20
15
10
5
EQ
LEGEND
Q 6-HR BEST TRACKPOSITIONa SPEED OF MOVEMENT(KT)b INTENSITY(KT)
POSITIONAT XX/OOOOZ0:0 TROPICALDISTURBANCEc ● ● TROPICALDEPRESSION---- TROPICALSTORM
~ ;$iR??pHOON START+$+ &JPJIWrWr;~A:END
+++ SUBTROPICAL*** DISSIPATINGSTAGE
FIRSTWARNINGISSUED: LAST WARNINGISSUED
TYPHOON ANGELABESTTRACK TC-24W
12OCT -29 OCT 92MAX SFC WIND90KTMINIMUMSLP 954MB
E 115
t&&)
18 ~$”,...,.,..,:...........%......17..70...
&20 :1! 1st TCFA :f, OV
0000° 1!
yo ooQo[@0J4
N 13
.
...,:. .
DTG SPEED lNTENSfTl
E 101B:................................~9.......................
16/OOZ 116/’o6z 1 %16j12Z 216/18Z 317100Z17/U6Z !17/12z 417/18Z 518/OOZ 518/06z :18/12Z
3030
::5055al6570
1//YAF16’!:\ \ y\..\
‘!%iLkiY27 18/18Z 7519/Ooz 2WW& 4 :
4 9J19/18Z 42omoz 3 80
,..,..3DTG SPEED INTENSITY
.........x...x2.1...J....l.........................................
A27106Z27/12Z27/18Z28POZ28P6Z28/12Z28/18Z29POZ29fiZ
:,, .;.,,;.,
33233
3530
29112Z 4 25

TYPHOON ANGELA (24W)
I. HIGHLIGHTSThe third of eight significant tropical cyclones to form in October, Angela developed in the
South China Sea, moved east, reversed course and struck southern Vietnam, crossed southernIndochina, reintensified to a severe tropical storm in the Gulf of Thailand, tracked through a clockwiseloop, and finally dissipated over water. While anchoring the western end of a monsoon trough, Angelabecame part of a four storm outbreak along with Brian (25W), Colleen (26W) and Dan (27W).
II. TRACK AND INTENSITYDeveloping in the South China Sea in the monsoon trough that trailed southwestward from
Super Typhoon Yvette (23W), the tropical disturbance, which became Angela, was first mentioned onthe 1206002 October Significant Tropical Weather Advisory as an area of persistent convection. Thetropical disturbance drifted slowly eastward along the edge of the deep southwesterly flow on the southside of the trough. On 15 October, as Yvette (23W) reached the axis of the subtropical ridge and beganrecurving to the northeast, the vertical wind shear over the disturbance weakened. As a consequence,the disturbance began to intensify, prompting JTWC to issue a Tropical Cyclone Formation Alert(TCFA) at 1518302, and the first warning at 1600002.
With Yvette’s (23W) departure from the tropics, the monsoon trough moved south to reestablishitself east-southeastward across the central Philippines and into the Caroline Islands. As this shiftoccurred, the orientation of the trough axis changed from southwest/northeast to east-southeast/west-northwest, and Tropical Depression 24W reversed course and slowly headed westward. Angela’s fur-ther consolidation required JTWC to upgrade the 1700002 warning to tropical stoxm intensity, and latertyphoon intensity at 1800002.
By 18 October, Angela also became the anchor-low for the western end of the monsoon troughthat extended eastward through Colleen (26W), Brian (25W), and into the southern Marshall Islands.As the northeasterly winds aloft increased, Angela’s low-level circulation became partially exposed tothe east of the deep central convection, and forecasters downgraded the typhoon to a tropical storm at201800Z. Further weakening ensued as the tropical cyclone moved westward into southern Vietnam(3-24-1 ). This necessitated another downgrade to a tropical depression and, six hours later, a finalwarning at 2318002, as the low-level center dissipated over land.
For the next four days the mid-level remnants of Angela persisted without central convectionand moved southwestward across southern Indochina. Upon entering the Gulf of Thailand on 27October, the cyclonic circulation slowly regained its convection and deepened through the lower tropos-phere. Another TCFA was issued by JTWC at 2703302, and immediately followed by a regeneratedwarning on 2706002. As the compact circulation of Angela intensified and began to execute a clock-wise loop in the central Gulf of Thailand, it moved through a group of manned gas platforms which pro-vided invaluable surface and radar reports. The reports from the Satun Station gas platform (9.3°N101.4”E) proved to be important for describing the passage of this midget tropical cyclone. The2802402 depiction of the Satun Station radar display in Figure 3-24-2 and the wind reports (Figure 3-24-3), which included the 70 kt (36 m/see) peak at 2804402, prompted JTWC forecasters to upgrade the2806002 warning to typhoon intensity. Later, during post analysis, this 6-hour maximum at typhoonintensity was reduced to a severe tropical storm intensity of 60 kt (31 m/see) based on the relative] yhigh surface pressures near 1000 mb, other wind reports in the area, and the determination that the 70-kt
117
Figure 3-24-1. Twelve hours after behg downgraded to a tropical storm, Angela chums westward across the South China Seatowards southern Viemam. Part of Colleen’s (26W) dense overcast is visible at the lower right of the picture (210122ZOctober DMSP visual imagery).
wind report was averaged over a period of less than one minute. After this peak, Angela’s organizationand intensity rapidly weakened due to upper-level wind shear until the “second” final warning wasissued by JTWC at291200Z as the tropical cyclone dissipated over the Gulf.
III. FORECAST PERFORMANCEThe overall mean track forecasting errors showed that JTWC ‘s performance was better than
average and showed skill in comparison with CLIPER, which is used as the baseline for perfomnance.With overall errors of 80, 145 and 180 nm (145, 265 and 330 km) at 24, 48 and 72 hours, respectively,JTWC bettered CLIPER’S performance by 30%. Initially, due to the relatively weak steering flowaffecting Angela, track forecast guidance was poor. However, once Angela began to move westwardtoward the Vietnamese coast, most forecast aids dicl well. Later, in the Gulf of Thailand, the track guid-ance tended to track Angela across the Malay Peninsula and into the Bay of Bengal.
IV. IMPACTIn southern Vietnam, at least seven people were reported missing and 17 others injured.
Angela’s torrential rains caused extensive flooding, loss of crops, livestock and fishing boats, and dam-age to rail lines and roads. In Thailand, there were two fatalities and seven people were reported miss-ing. Heavy rains and flooding resulted in at least 600 houses being destroyed. Angela posed a sig-nificant threat in the Gulf of Thailand, where manned gas platforms were forced to evacuate as Angelaintensified and moved into the area. All platform evacuations proceeded smoothly and no reports ofdamage or injuries were received.
118

The weather and radar reports from the manned gas platforms in the Gulf of Thailand presentedforecasters at .JTWC a unique opportunity to gather data on the rainbands and compact wind field asso-ciated with a very small tropical cyclone.
IP +- Yt-7F?ab
Figure 3-24-2. Angela’s tightly curved rain-bands as seen on radar from the Satun Stationgas platform located at 9.3”N amd 101.4°E(radar depiclion courtesy of UNOCALThailand, Ltd.).
28 OCTOBER 1993
Time (Z) 00 01 0203 CM 050607
Pressure (rob) 1002.31~1.5 m m 998-11~.1 10I31.91000.9
Wind (W) Pb A+J
F PI.LWaveHeight (m)
5.2 5.3 m m 6.2 5.0 5.0 3.9
Figure 3-24-3. Wind reports which are plotted to the nearest hour for theSatun Station gas platform (9.3”N, 101.4”E) for the 24-hour period com-mencing 270900Z. Angela’s passage close by the platform is reflected bythe storm force winds, wind shif~ and lower pressures from 280300Z to280600Z. The lowest pressure reported was 998.1 mb at 280400Z, howev-er, the pressure an hour earlier, which was missing from the data set, couldhave been considerably lower (data courtesy of Uncope Thailand, Ltd.).
119
E 120 125 130 135 140 145 150 1s5 160 165 170 175 180N 40
LEGEND
abc
000● *O----
6-HR BEST TRACKPOSITIONSPEED OF MOVEMENT(KT)INTENSITY(KT)POSITIONAT XXJ1000ZTROPICALDISTURBANCE
.,,,,,,,,,.,F
35
30
25
25/ooz● +++’
’25
*++++ 1 TROPICALDEPRESSIONTROPICALSTORMTYPHOON●☛☛
W..-.....~.... SUPERTYPHOONSTARTSUPERTYPHooN ENDEXTRATROPICAL
55 ‘“ ‘ :4SUBTROPICALDISSIiAiING STAGEFIRSTWARNINGISSUEDLAST WARNINGISSUED22 ;
95
.............. ............., ~o....y
.,,,..,.., .,,,..,,,.,.,.....:, ....j,.,.... 2360 20
15
50”50”45:45 ~.
/
lp~ ~
3530 30 J5b :
011121121212 : :
.:!2 .J.3a .............................~......................... . . . ........ ...... .
F-l@Z ~
t AB~W ~9● ‘ ?. ..W..!?.!?.!?4Q.:Ooooa.o................................ ........ ~j ....
17?~~:
~.
TCl+A I15~ yo
. .. . ,.,.,,..
.,,,..,,.,,
,. .,,
~\
22 8
.“~
“20
)/
I!
,10 ... ... .... .......8..8.7,
?/
’6765
60 ‘..~55 55.55.
........ ....
10
5
EQ
65
I I(
TYPHOON BRIANBESTTRACK TC-25W
14OCT -25 OCT92MAXSFC WIND95KTMINIMUMSLP949MB

—— — —
I. HIGHLIGHTSBrian was part
(26W) and Dan (27W).
TYPHOON BRIAN (25W)
of the four storm outbreak in October that included Angela (24W), ColleenForming in the southern Marshall Islands, Brian moved west-northwestward
and intensified to a typhoon as it passed across Guam. For Guam, it was the second eye passage in lessthan two months - Omar ( 15W) was the first. Later, Brian underwent binary interaction with T~hoonColleen (26W), subsequently recurved, and finally transitioned to an extratropical system.
II. TRACK AND INTENSITYJTWC began monitoring the tropical disturbance, that would become Typhoon Brian, in the
southern Marshall Islands on 14 October. After an increase in the amount and organization of thecloudiness, the tropical disturbance was mentioned on the 1616002 Significant Tropical WeatherAdvisory. Initially the potential for development was considered to be poor. However, a rapid increasein convection prompted JTWC to reissue the Advisory at 161800Z, and the area’s potential for develop-ment was upgraded to fair. A Tropical Cyclone Formation Alert followed at 1622232 as organizationcontinued to improve. Anticipating continued consolidation within the small compact cloud system,and assessing the potential for subsequent rapid intensification as good, JTWC issued the first warningat 170300Z.
The tropical cyclone was upgraded to Tropical Storm Brian at 1718002. As it approachedGuam, Brian’s convection increased markedly during the nighttime hours. With no synoptic datareports near the center of the small circulation and impressive convective flare-ups for two nights run-ning on the satellite imagery, there was a question on the second night: “Was rapid intensification takingplace or not?’ When satellite data gave conflicting information concerning the intensity of the stomn,JTWC elected to go with the higher intensity that indicated that rapid intensification was occurring.Subsequently, Brian was upgraded to typhoon intensity at 1906002 based on the higher satellite intensi-ty estimates. As the tropical cyclone approached Guam on the morningof21 October, it became appar-ent that Brian was a smaller than expected system, and that its intensity and area affected by the highsurface winds were significantly less than forecast. Brian was, in fact, a midget typhoon with 65-kt (33-mhec) sustained winds.
The extended outlook for the track was more straight forward. For two days prior to Brian hit-ting Guam, JTWC predicted a direct hit. As Brian approached Guam, fixes from satellite imagery andthe Federal Aviation Administration flight control radar at Mount Santa Rosa showed that as the tropicalcyclone S1OWWI,it began to exhibit erratic motion. Despite the erratic motion, JTWC continued to pre-dict a direct hit, and actually pin-pointed the southern half of the island as the target. The leading edgeof the small, 10 nm (19 km) diameter eye came ashore just northeast of DanDan at 202350z and laterexited near Orote Point at 2103OOZ(Figure 3-25-1).
As Brian’s eye came across Guam, an interesting phenomena was observed by residents on thewest side of the island from Orote Point northward to Taguac. Preceding the onset of the primary areaof light-and-variable winds within the eye, there was another low pressure area — a precursor — wherethe winds lessened prematurely and the sky lightened. This precursor event was followed by a band ofheavy rain and wind. Figure 3-25-2 illustrates the merge of the leeside low with the eye of Brian. Theevent appears on the Nimitz Hill microbarograph trace (Figure 3-25-3) as a drop in pressure (at Point A)followed by a rise in pressure associated with the squall, and then another drop in pressure (at Point B).
121

(’l
MAXIMUMSUSTAINEOSURFACEWINCG6SKl GUSTINGTOSOI(T(S3GUSTINGTO41ML%(2)
wwwmmwwER
o 5 -“%%,,,
SWdE INNAUTICALMILESINM) -r%l,,,,,
-,■ - RWCRTINGSTATtWS
Figure 3-2S-1. Graphic of Brian’s 10 mn (19 km) diameter eye passage across Guam on 21 October.
What is suggested was that Brian, which was small and at minimal typhoon intensity, encountered a bar-rier, the island of Guam, in its path. The wind field within the core region adjusted to the barrier and alee side low, or secondary circulation, formed ahead , and to the west of, the primary circulation center.As the eye approached, the lee side low shrunk in size, consolidating over the northwest portion of ‘Guam. Once the eye moved to the west side of the island, strong low-level winds trying to flow towardthe low pressure of the eye quickly returned to normal, and Brian tegained its more normal form andintensified. During this time, Guam’s maximum sustained l-minute winds of 65 kt (33 m/see) gustingto 80 kt (41 m/see) were recorded at Nimitz Hill, which is 650 feet (200 m) above sea level. Typhoonforce winds may also have occurred in the east coastal areas, but the no wind recording were availableat these locations. The minimum sea-level pressure reading of 989 mb was recorded in the eye by the
122
fast supply ship U.$.$ White Plains, which was moored in Apra Harbr. While this pressure is toohigh to support typhoon-force winds for a normal sized tropical cyclone, computations indicate that itwas sufficient to support typhoon-force winds for a cyclone the size of Brian
7+00 T+lHR
““” 7
T+2HR
LEr3iiioElaw I
Figure 3-25-2. Sequence of events illustrating the merger of a low on the leeside of Guam with the eye of Brian.
Figure 3-25-3. Microbarograph trace fromthe Nimitz Hill, Guam during the passageof Typhoon Brian. Point A is the passageof the Ieeside low hat proceeded the pas-sage of the eye at point B.
On 21 October, as Brian moved into the Philippine Sea, it became involved in a binary interac-tion for the next three days with TWhoon Colleen (26W) which was located to the west (Figure 3-25-4).Brian peaked at 95 kt (49 m/see) at 221800Z, and on 24 October, the typhoon recurved south of Japan,accelerated, and transitioned to an extratropical low. The final warning was issued by JTWC at250000Z.
123
III. FORECAST PERFORMANCEThe overall mean track errors for JTWC were 90, 140 and 225 nm (170, 255 and 415 km) for
the 24-, 48- and 72-hour forecasts, respectively. These were 25-42% lower than JTWC’S long texmaverage and approximately 2570 better than those of CLIPER, which is used as a baseline for determini-ng skill. Typhoon Colleen (26W), which was about 1000 nm (1850 km) to the west of Brian, added ameasure of difficulty and uncertainty to both the intensity and track forecasts for Brian. Colleen’s out-flow aloft blew eastward across Brian and impeded the formation of Brian’s upper level anticyclone,which may have slowed the intensification of Brian’s midget circulation. Also, the induced ridgingbetween the two cyclones probably contributed to the slowing and erratic motion of Brian’s track as itneared Guam. Finally, the binmy interaction between the typhoons was of significant concern untilBrian recurved.
In contrast to the track forecasts, the intensity forecasts were poor. For a four day period startingat 1718002, the 72-hour outlooks were consistently 25 to 55 kt (13 to 28 rn/see) too high. And for twodays before Brian crossed Guam, the initial warning intensities were determined to be 25 to 35 kt (13 to18 rn/see) high. The high intensity forecasts for four days resulted from anticipation of rapid intensifi-cation that did not occur, and were compounded, for two of the four days, by high values for intensityon the initial warnings.
IV. IMPACTDarnage on Guam was much less than would have occurred had Typhoon Omar not hit less than
2 months earlier. Omar destroyed most structures that a weaker storm might have damaged ordestroyed. Schools and businesses were closed for two days as the typhoon passed. Some power lineswere blown down, and there were isolated reports of damage in the central portion of the island. Theagriculture industry suffered the most, as the coastal regions received considerable saltwater spray dama-ge.
124
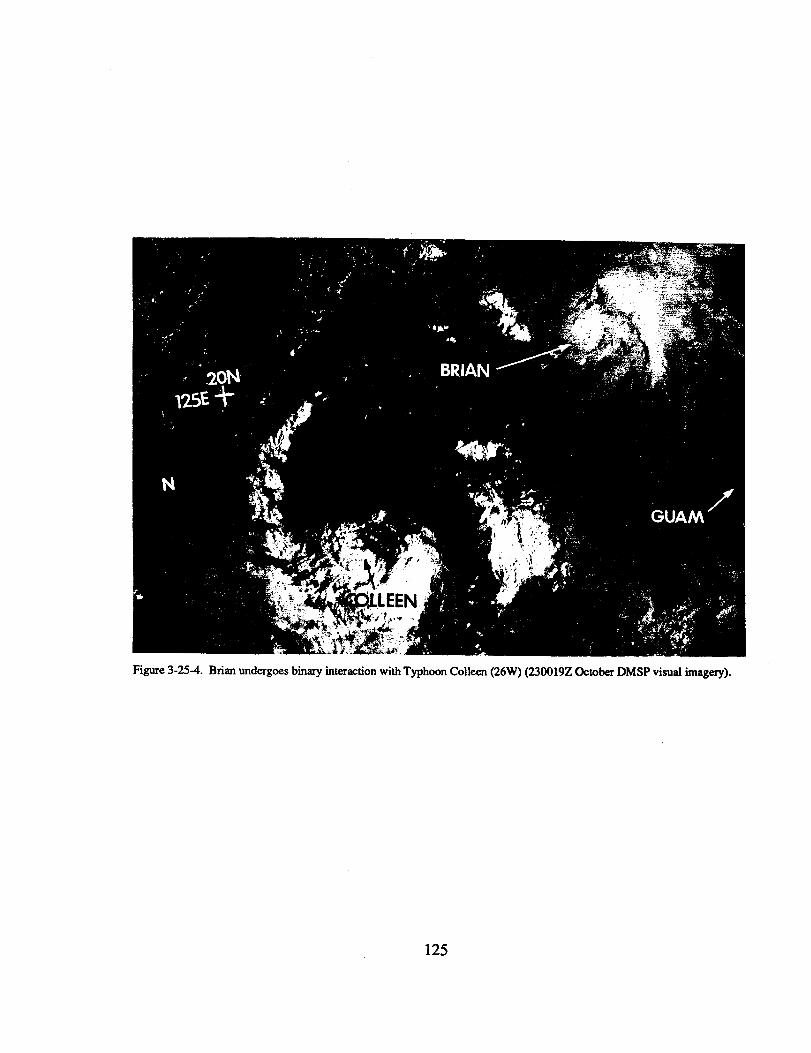
F@re 3-2S-4. Brian undergoes binary interaction with Typhoon ColleeII (26W) (230019Z October DMSPvisual imagery).
125
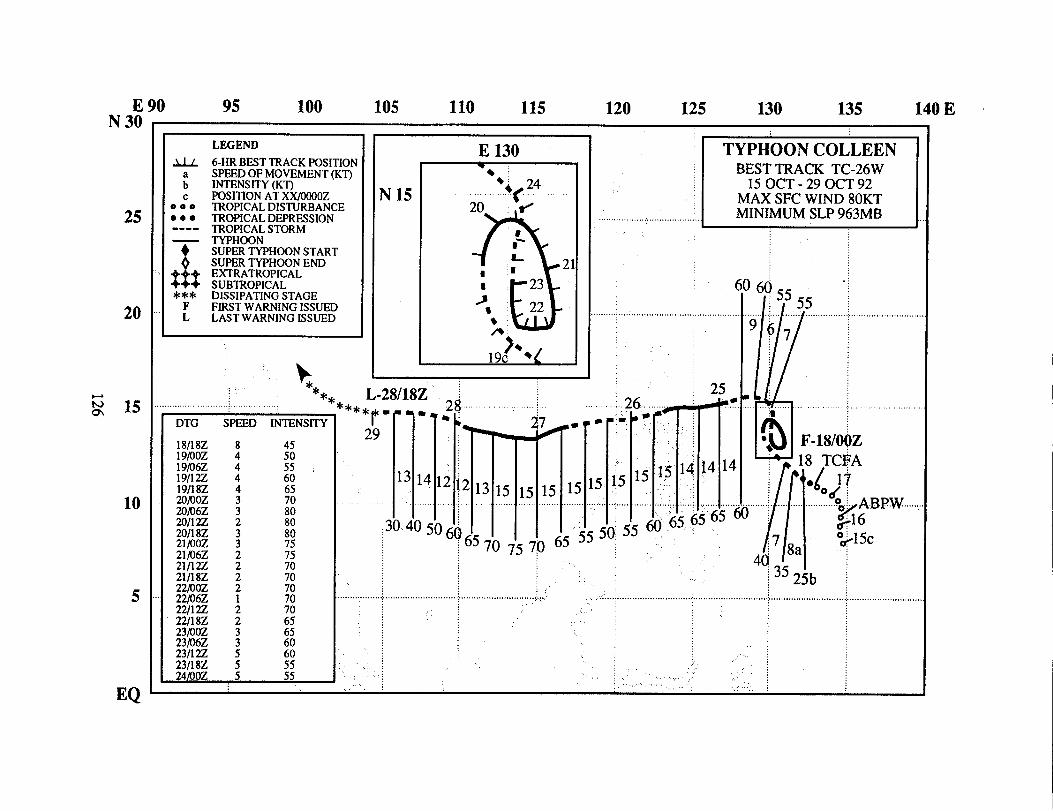
E 90 95 100 105 110 115 120 125 130 135 140 E
iGm
25
20
15
10
5
LEGEND
~ 6-HR BESTTRACKPOSITIONa SPEEDOF MOVEMENT(KT)b INTENSITY(KT)c POSITIONAT XX/OOOOZ
000 TROPICALDISTURBANCE● ● ● TROPICALDEPRESSION---- TROPICALSTORM
~ #J:~~: :T&RT
$!$EXTRATROPICALSUBTROPICAL
*** DISSIPATINGSTAGEF FLRSTWARNINGISSUEDL LAST WARNINGISSUED
:...........
L
DTG SPEED
T*****
1INTENSITY
4550 “.55 ,60657080
u7575707070
‘**
E 130
I‘15Fzl
I
.’.,..,,... ...,,,,.. ,.,..,,,.
TYPHOON COLLEENBESTTRACK TC-26W
15 OCT -29 OCT 92MAXSFC WIND 80KTMINIMUMSLP963MB
J.!W HI- 1 -’IIII
--. . . 9 I 1-
-
5
....,,,:,,
. :.:.2(jL ....+
1“1”1”’.9 .,.,
,:.
15 15 y I’”TTI irrt”o“j;j;jo’j5::i5”$5”J5 ~ ‘Ill
‘“”’’””‘“’””’“-”’”””l’“’””‘“””““”’””””””gym’”””””
o ~1 +7: ‘J 70 75 7? OJ “-
: ..

TYPHOON COLLEEN (26W)
I. HIGHLIGHTSThe third significant tropical cyclone to form as part of the four storm outbreak in mid-October,
Colleen developed from a broad cyclonic circulation in the monsoon trough between Typhoon Angela(24W) to the west and T~hoon Brian (25W) to the east. Bina~ interaction occurred between Colleenand Brian (25W), causing Colleen to make a slow anticyclonic loop in the Philippine Sea before turningwest. After crossing Luzon, Colleen reintensified to a typhoon before slamming into central Vietnamand dissipating inland.
II. TRACK AND INTENSITYAnchored by what was to become Typhoon Angela (24W) in the South Chim Sea, the monsoon
trough extended eastward into the southern Marshall Islands where Typhoon Brian (25W) was develop-ing. The weak low-level circulation, that was to become Colleen, formed in the monsoon trough in thePhilippine Sea and was first mentioned on the Significant Tropical Weather Adviso~ at 160600Z. ATropical Cyclone Formation Alert was issued by JTWC at 171600Z based on the increased cloud orga-nization in satellite imagery of the disturbance and increasing gradient-level winds at Koror (WMO91408). Continued intensification during the morning prompted JTWC to issue the first wanting at180000Z. Only six hours later, JTWC upgraded Tropical Depression 26W to Tropical Storm Colleen.But, Tropical Storm Colleen went through seveml reorganization periods over the first few days as itsbroad circulation became more vertically aligned. The upper-level flow was shearing the convection tothe west while the southwesterly surface flow associated with the monsoon trough forced the low-levelto track and reorganize to the east. Despite the strong shear, the cyclone continued to consolidate, andJTWC upgraded Colleen to typhoon intensity on the 191800Z warning.
With regard to the episode of binary interaction, Colleen and Brian (25W) had been, in a ~lativesense, approaching each other since 15 October (Figure 3-26-1). It became apparent that capture of thetwo circulations had occurred at 201200Z when they began to orbit around a common point, or centroid(Figures 3-26-2 and 3-26-3). On 22 October, the binary pair reached a minimum separation distance of680 nm (1260 km). During the binary interaction, Colleen, the larger of the two cyclones, slowed andmade an anticyclonic loop as Typhoon Brian accelerated northwestward. On 24 October, Brian escapedto the northeast and recurved. Colleen, which had initially intensified then weakened during the periodof interaction, moved westward toward Luzon. Ship reports confirmed that Colleen, with a large raggedeye, had its strongest winds in a ring displaced approximately 40 to 80 nm (75 to 150 km) from the cen-ter of the circulation.
While weakening, Colleen passed over central Luzon and then reintensified as it moved into theSouth China Sea. After peaking at 75 kt (39 m/see) in the central South China Sea, at 270600Z, Colleenslowly weakened until it made landfall in central Vietnam on the morning of 28 October (Figure 3-26-4). When it was evident that the circulation was dissipating overland, the final warning was issued byJTWCat281800Z.
111.FORECAST PERFORMANCEForecasters at JTWC recognized early on that Colleen was going to be a challenge, and that’s
exactly how it turned out. Overall the mean track errors were significantly larger than the long termaverage errors with values of 130, 290 and 500 nm (240, 535 and 925 km) for the 24-, 48- and 72-hour
127
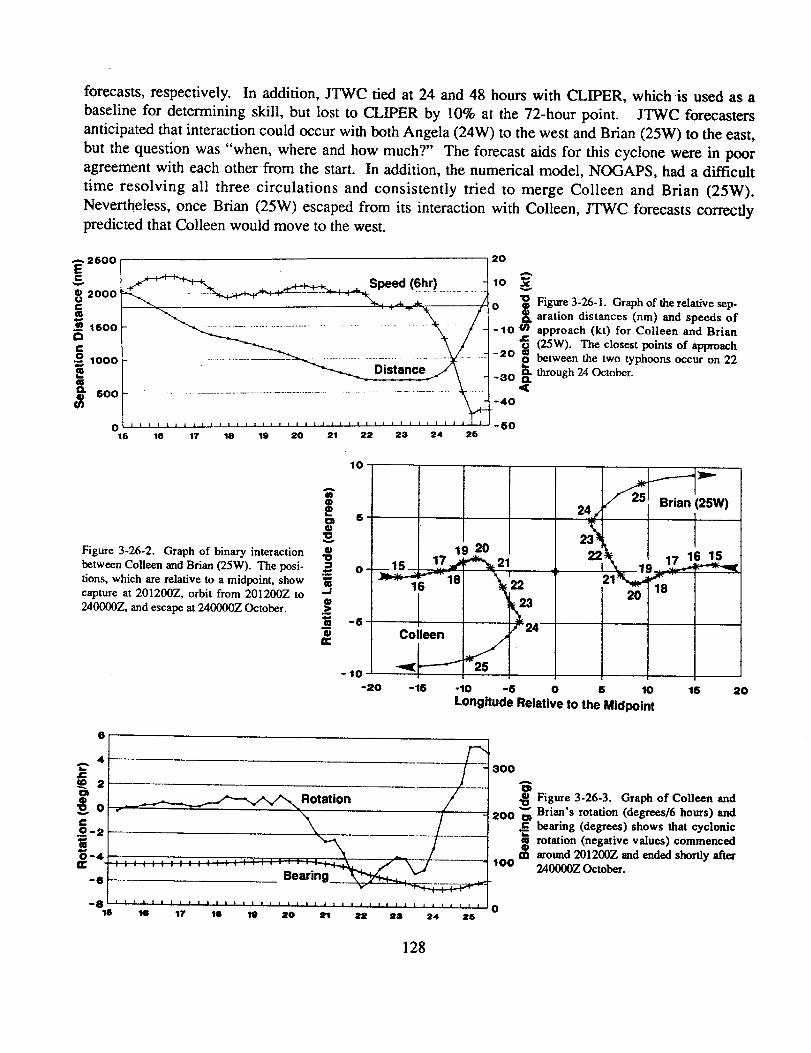
forecasts, respectively. In addition, JTWC tied at 24 and 48 hours with CLIPER, which is used as abaseline for determining skill, but lost to CLIPER by 10% at the 72-hour point. JTWC forecastersanticipated that interaction could occur with both Angela (24W) to the west and Brian (25W) to the east,but the question was “when, where and how much?” The forecast aids for this cyclone were in pooragreement with each other from the start. In addition, the numerical model, NOGAPS, had a difficulttime resolving all three circulations and consistently tried to merge Colleen and Brian (25W).Nevertheless, once Brian (25W) escaped from its interaction with Colleen, JTWC forecasts correctlypredicted that Colleen would move to the west.
A 2600Ec
‘1. . . ... ....
n 600 -t%
-... . . .-.-. ..... .
n , , t , , t L , t # , , , , , , t , , , 1 - -s0’16 16 17 10 19 20 21 22 23 24 26 ‘-
Figure 3-26-2. Graph of bhry interactionbetween Colleen and Brian (25W). The posi-tions, which are relative to a midpoint, showcapture at 2012002, orbit from 2012002 to2400002, and escape at 2400002 October.
Figure 3-2J5-1. Graph of the relative sep-aration distances (rim) and speeds ofapproach (kt) for Colleen and Brian(25W). The closest points of approachbetween the two typhoons occur on 22through 24 c)CiOfET.
-20 -16 -lo 0 6 10 16 20Longitu;~ Relative to the Midpoint
Figure 3-26-3. Graph of Colleen andBrian’s rotation (degrees/6 hours) andbearing (degrees) shows that cyclonicrotation (negative values) commencedaround 2012002 and ended ShOdy after?mOOOzOctober.
’81’ , , , , , , , ,16 m 17 10 la 20 21 2* ** 24 26 ‘o
128
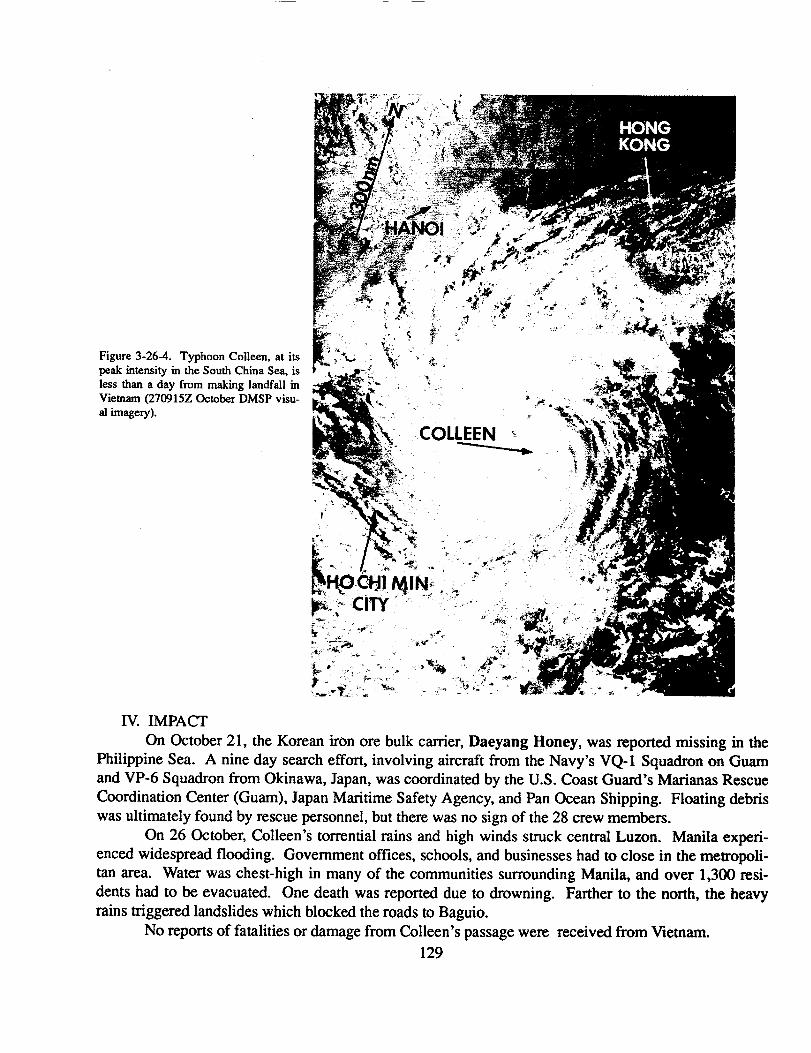
Figure 3-26-4. Typhoon Colleen, at i~peak intensity in the South China Sea, isless than a day from makiig landfall mViemam (270915Z October DMSP visu-al imagery).
IV. IMPACTOn October 21, the Korean iron ore bulk carrier, Daeyang Honey, was reported missing in the
Philippine Sea. A nine day search effort, involving aircraft from the Navy’s VQ-1 Squadron on Guamand VP-6 Squadron from Okinawa, Japan, was coordinated by the U.S. Coast Guard’s Marianas RescueCoordination Center (Guam), Japan Maritime Safety Agency, and Pan Ocean Shipping. Floating debriswas ultimately found by rescue personnel, but there was no sign of the 28 crew members.
On 26 October, Colleen’s torrential rains and high winds struck central Luzon. Manila experi-enced widespread flooding. Government offices, schools, and businesses had to close in the metropoli-tan area. Water was chest-high in many of the communities surrounding Manila, and over 1,300 resi-dents had to be evacuated. One death was reported due to drowning. Farther to the north, the heavyrains triggered landslides which blocked the roads to Baguio.
No reports of fatalities or damage from Colleen’s passage were received from Vletnarn.
129

VJ
m
z--
..
...
......
omm
..........0...../oa
w“
—w
.mo
>~*,.,:...............
o>%.
...........4J
~::%
.=
~O
e\
~“...................#
cd
130
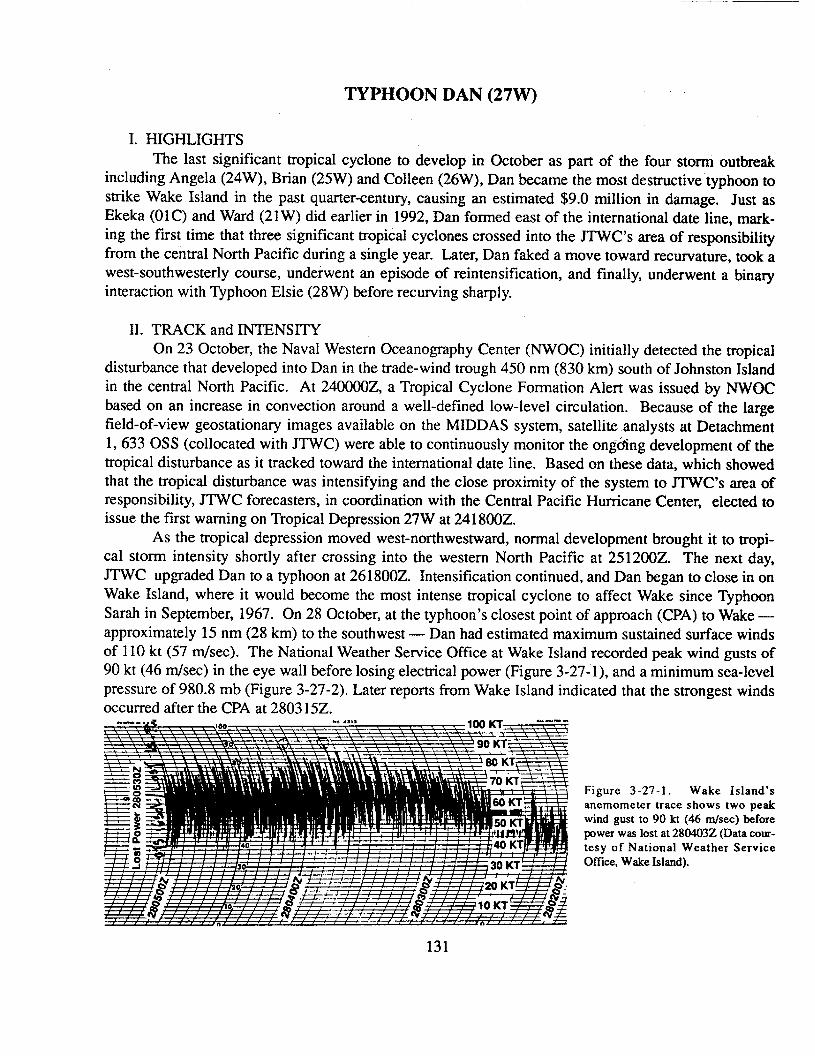
TYPHOON DAN (27W)
I. HIGHLIGHTSThe last significant tropical cyclone to develop in October as part of the four storm outbreak
including Angela (24W), Brian (25W) and Colleen (26W), Dan became the most destructive typhoon tostrike Wake Island in the past quarter-century, causing an estimated $9.0 million in damage. Just asEkeka (OIC) and Ward (21W) did earlier in 1992, Dan formed east of the international date line, mark-ing the fiist time that three significant tropical cyclones crossed into the JTWC’S area of responsibilityfrom the central North Pacific during a single year. Later, Dan faked a move toward recurvature, took awest-southwesterly course, underwent an episode of reintensification, and finally, underwent a binaryinteraction with Typhoon Elsie (28W) before recurving sharply.
II. TRACK and INTENSITYOn 23 October, the Naval Western Oceanography Center (NWOC) initially detected the tropical
disturbance that developed into Dan in the trade-wind trough 450 nm (830 km) south of Johnston Islandin the central North Pacific. At 240000Z, a Tropical Cyclone Formation Alert was issued by NW(3Cbased on an increase in convection around a well-defined low-level circulation. Because of the largefield-of-view geostationary images available on the MIDDAS system, satellite analysts at Detachment1,633 0SS (collocated with JTWC) were able to continuously monitor the ongding development of thetropical disturbance as it tracked toward the international date line. Based on these data, which showedthat the tropical disturbance was intensifying and the close proximity of the system to JTWC’S area ofresponsibility, JTWC forecasters, in coordination with the Central Pacific Hurricane Center, elected toissue the first warning on Tropical Depression 27Wat241800Z.
As the tropical depression moved west-northwestward, normal development brought it to tropi-cal storm intensity shortly after crossing into the western North Pacific at 25 1200Z. The next day,JTWC upgraded Dan to a typhoon at 261800Z. Intensification continued, and Dan began to close in onWake Island, where it would become the most intense tropical cyclone to affect Wake since TyphoonSarah in September, 1967. On 28 October, at the typhoon’s closest point of approach (CPA) to Wake —approximately 15 nm (28 km) to the southwest — Dan had estimated maximum sustained surface windsof 110 kt (57 m/see). The National Weather Service Office at Wake Island recorded peak wind gusts of90 kt (46 m/see) in the eye wall before losing electrical power (Figure 3-27-1), and a minimum sea-levelpressure of 980.8 mb (Figure 3-27-2). Later reports from Wake Island indicated that the strongest windsoccurred after the CPA at 2803 15Z.
Figure 3-27-1. Wake Island’sanemometer trace shows two peakwind gust to 90 kt (46 m/see) beforepower was lost at 280403Z (Data cour-tesy of National Weather ServiceOflh, Wake Island).
131
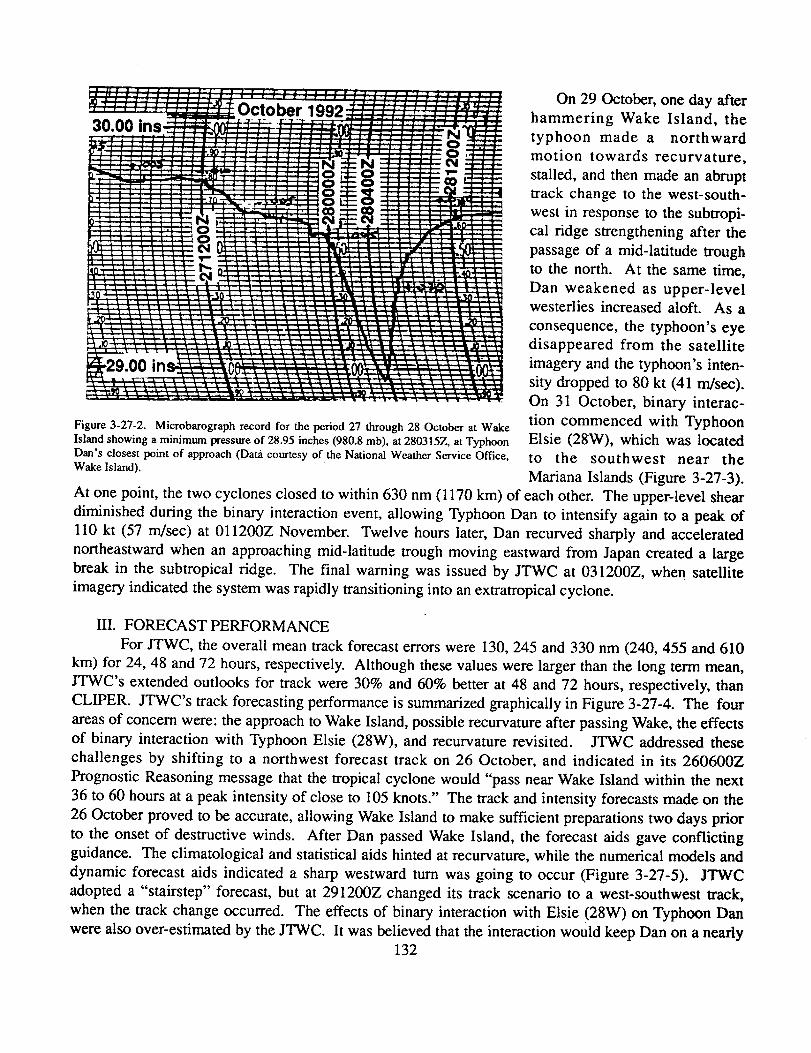
Figure 3-27-2. Microbarograph record for the period 27 through 28 October at WakeIsland showing a minimum pressure of 28.95 inches (980.8 rob), at 2803152, at TyphoonDan’s closest point of approach (Data courtesy of the National Weather Service Office,Wake Island).
On 29 October, one day afterhammering Wake Island, thetyphoon made a northwardmotion towards recurvature,stalled, and then made an abrupttrack change to the west-south-west in response to the subtropi-cal ridge strengthening after thepassage of a mid-latitude troughto the north. At the same time,Dan weakened as upper-levelwesterlies increased aloft. As aconsequence, the typhoon’s eyedisappeared from the satelliteimagery and the typhoon’s inten-sity dropped to 80 kt (41 m/see).C)n 31 October, binary interac-tion commenced with TyphoonElsie (2SW), which was locatedto the southwest near theMariana Islands (Figure 3-27-3).
At one point, the two cyclones closed to within 630 nm (1170 km) of each other. The upp&-level sheardiminished during the binary interaction event, allowing Typhoon Dan to intensify again to a peak of110 kt (57 m/see) at 01 1200Z November. Twelve hours later, Dan recurved sharply and acceleratednortheastward when an approaching mid-latitude trough moving eastward from Japan created a largebreak in the subtropical ridge. The final warning was issued by JTWC at 03 1200Z, when satelliteimage~ indicated the system was rapidly transitioning into an extratropical cyclone.
III. FORECAST PERFORMANCEFor JTWC, the overall mean track forecast errors were 130, 245 and 330 nm (240, 455 and 610
km) for 24, 48 and 72 hours, respectively. Although these values were larger than the long term mean,JTWC’S extended outlooks for track were 30% and 60% better at 48 and 72 hours, respectively, thanCLIPER. JTWC’S track forecasting performance is summarized graphically in Figure 3-27-4. The fourareas of concern were: the approach to Wake Island, possible recurvature after passing Wake, the effectsof binary interaction with Typhoon Elsie (28W), and recurvature revisited. JTWC addressed thesechallenges by shifting to a northwest forecast track on 26 October, and indicated in its 260600ZPrognostic Reasoning message that the tropical cyclone would “pass near Wake Island within the next36 to 60 hours at a peak intensity of close to 105 knots.” The track and intensity forecasts made on the26 October proved to be accurate, allowing Wake Island to make sufficient preparations two days priorto the onset of destructive winds. After Dan passed Wake Island, the forecast aids gave conflictingguidance. The climatological and statistical aids hinted at recurvature, while the numerical models anddynamic forecast aids indicated a sharp westward turn was going to occur (Figure 3-27-5). JTWCadopted a “stairstep” forecast, but at 291200Z changed its track scenario to a west-southwest track,when the track change occurred. The effects of binary interaction with Elsie (28W) on Typhoon Danwere also over-estimated by the JTWC. It was believed that the interaction would keep Dan on a nearly
132
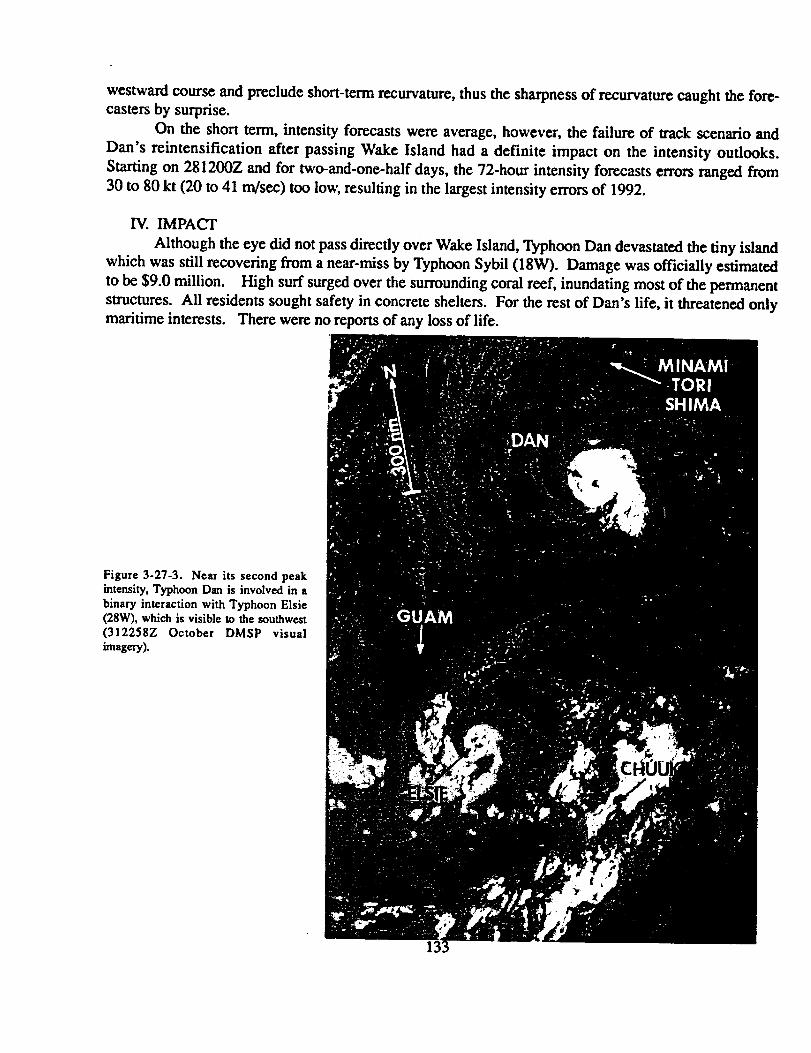
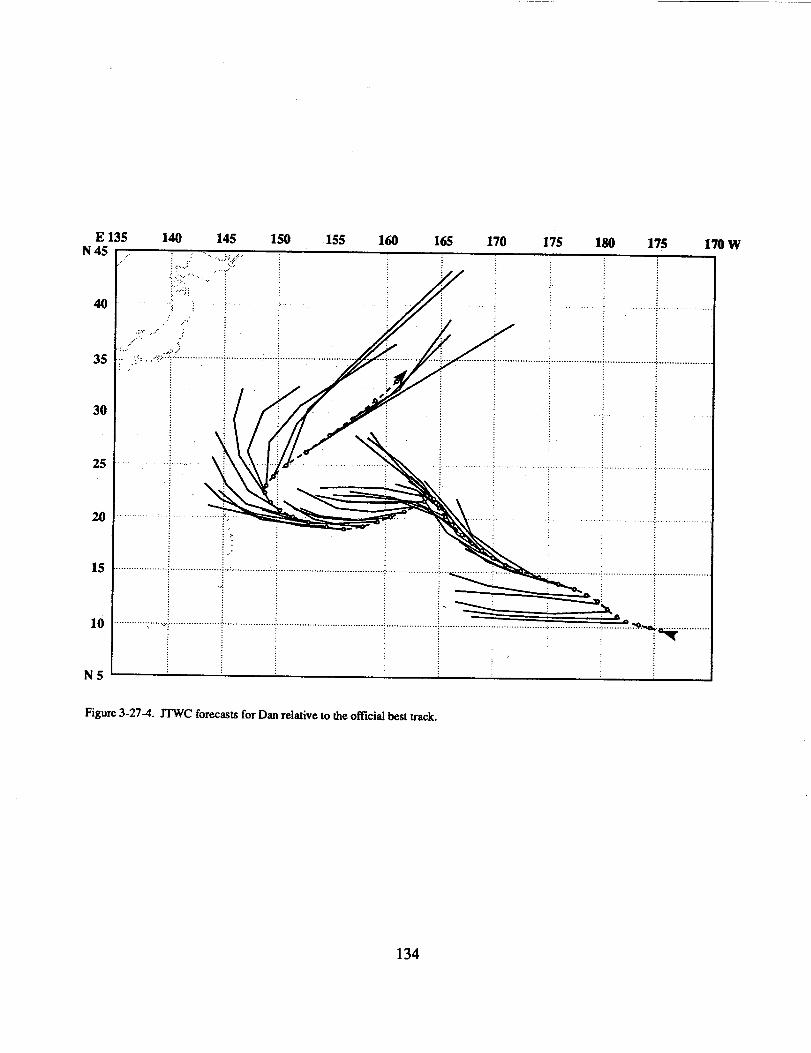
N 45
40
35
30
25
20
15
10
N5
E 135 140 145 150 155 160 165 17n 176 lsfl 17C lVOW--- -.w .- X,=
:., ..
Ar
.... . ,j., .,::::: ;. ,,...., ..... ... .,,...
. . . ... ..... . ...
,., ., . . . . . . . . . .
:.. .. ... :,:,. ..
....’.,,......,.. ,
., ,,.: ........................................
:.
,.. . ... .. .. . .,., ..,,
,,........ . .. . . . ..
.............. . ............ . ,........... . ..... . . . . . . .. ..;..,..,.. . .. .......... . ..... .......... .......... ........... .......... .,..,.:.... ..........,, ;
Figure 3-27-4. JTWC forecasts for Dan relative to the ofllcial best track.
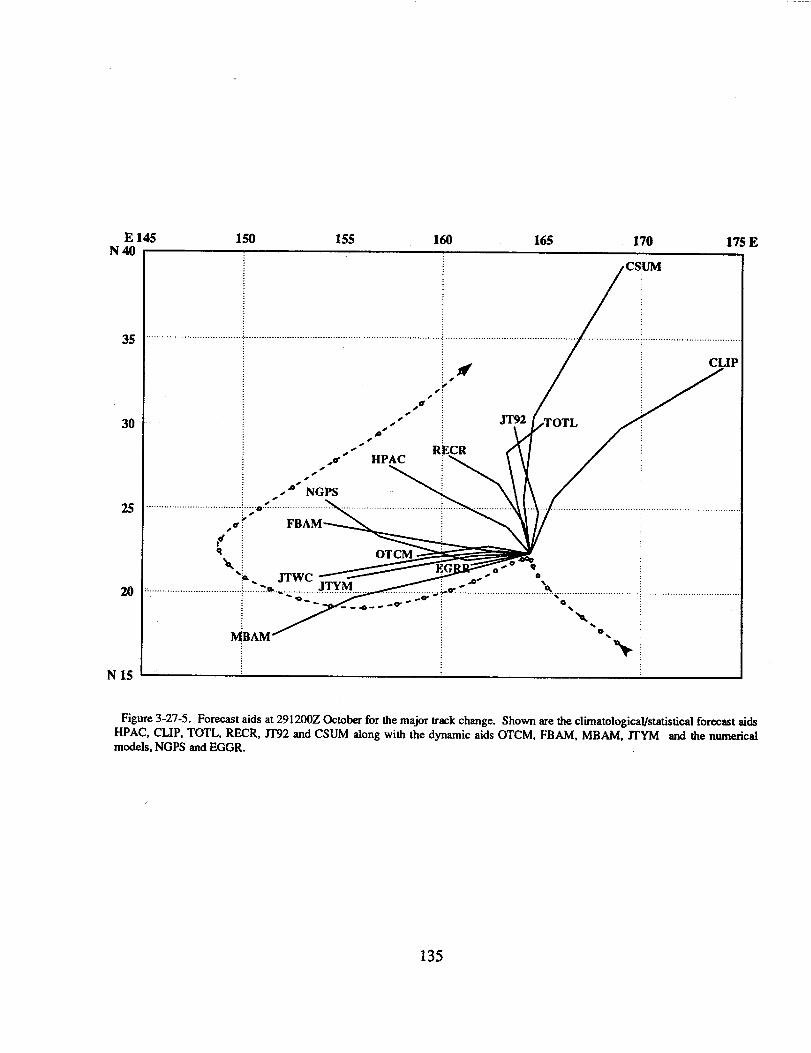
E 145 150 155 160 165 170 175 EN40
35
30
25
20
N 15
. . . . . . . .-.-+ -.. .
. . . ..........
,U ? FBAM,d ;
‘lk :
i *. . .. .. . . ............,,,,
M;BAM
Figure 3-27-5. Forecast aids at 2912002 October for the major track change. Shown are the climatological/statisticxd forecast aidsHPAC, CLIP, TOTL, RECR, IT92 and CSUM along with the dynamic aids OTCM, FBAM, MBAM, JTYM and the numericalmodels, NGPS and EGGR.
135
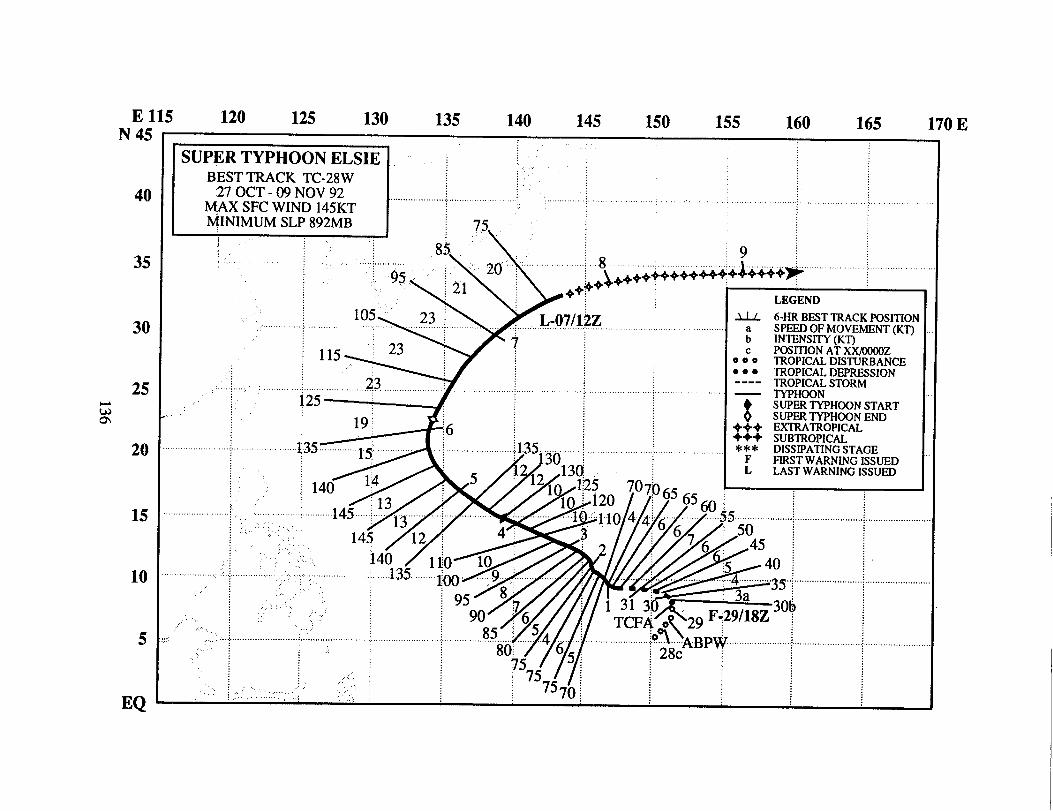
men
u’)
...................!2A
...........wu
+3
+;+:
+
........,..,:.
~:
N.:....
I:..
.!:
...................
~n
I
.,m
..”
I..........+..
w.....................
....................
............
SUPER TYPHOON ELSIE (28W)
I. HIGHLIGHTSThe fourth super typhoon of 1992, Elsie was the third typhoon to pass within 60 nm (100 km) of
Guam in less than three months. After initial movement to the northeast in response to a southwestmonsoonal surge, a subsequent turn to the wes~ and then interaction with Typhoon Dan (27W), Elsiesettled down on a track to the northwest, recurved, and transitioned into a hurricane-force extratropicallow.
II. TR4CK AND INTENSITYThe tropical disturbance that became Elsie formed in the monsoon trough near Chuuk in the cen-
tral Caroline Islands, and was first described on the 2806002 October Significant Tropical WeatherAdvisory as an area of poorly organized, persistent convection. The combination of increasing deepconvection near the cloud system center and falling pressure in excess of 3 mb in 24 hours at Chuuk(WMO 91344) led forecasters at JTWC to issue a Tropical Cyclone Formation Alert at 291200Z. Ashort time later, the appearance of deep cyclonically curved spiral convective bands around the systemcenter prompted JTWC to issue the first warning for Tropical Depression 28W at 29 1800Z.
The tropical cyclone initially moved to the northeast in response to a deep southwest monsoonalsurge. The northward component of this movement, plus the depression’s early intensification, broughtthe tropical cyclone under the influence of the mid-level steering flow of the subtropical ridge to thenorth, causing the track to become more westward. As intensification continued at a rate of 1.25rob/hour, JTWC upgraded Elsie to a tropical storm six hours later on the 300000Z warning, and to atyphoon at 3012002. Meanwhile, the separation distance between Elsie and Typhoon Dan (27W) wassteadily decreasing. During the period 3118002 October through 020600Z November, binary interac-tion between the two typhoons caused Elsie to slow, undergo erratic motion, and again take a morenorthward track toward the southern Mariana Islands. At the same time, the outflow from Dan (27W)was causing moderate upper-level shear from the east across Elsie’s cloud shield, and retarding intensi-fication. At its closest point of approach to Guam on 2 November, Elsie was located 55 nm (100 km) tothe south-southwest of the island. Peak wind gusts to 62 kt (32 m/see) were recorded at the Naval AirStation, Guam (WMO912 12), but recordings were not available for the southern portion of the island.
After Dan (27W) recurved, ending the binary interaction on 2 November, Elsie resumed devel-opment at a rate of 5 kt (3 rn/see) per six hours, reaching super typhoon intensity at 0406002 and a peakof 145 kt (75 m/see) at 0506002 (Figure 3-28-1). Elsie’s intensification kept Guam in gale-force windsfor two days after its passage and movement away from the southern Mariana Islands. After Elsie’srecurvature at 0600002, increasing southwesterly winds aloft weakened the super typhoon to typhoonintensity at 0606002. As Elsie was transitioning into an intense extratropical low with hurricane-forcewinds, the final warning was issued byJTWCat0712002.
III. FORECAST PERFORMANCEAlthough Elsie’s track is basically one of recurvature, the initial monsoon surge from the south-
west, binary interaction, recurvature and the subsequent acceleration into midlatitudes proved difficultto handle. With mean track errors of 110, 250 and 340 nm (205, 465 and 630 km) for the 24-, 48- and72-hour forecasts, respectively, JTWC’S performance overall was below average and tied withCLIPER. The specific forecasting successes were accurately predicting Typhoon Dan’s (27W) infhi-
137

ence on Elsie’s track change to the north and anticipating Zlsie’s intensification to a super typhoon.With respect to Guam, JTWC predicted that intensification would take place a little early and that thetyphoon would pass 30 nm (55 km) closer than actually occurred. For Okinawa, JTWC forecasts wereused to prevent the unnecessary preparations for destructive winds at DOD installations there.
IV. IMPACTC)n Guam, no deaths, injuries,
or significant property damageoccurred. As a precaution, militaryaircraft from the Navy’s VQ- 1, VQ-5 and VRC-50 squadrons were tem-porarily relocated from Guam toJapan, and all ships in port at Guamwere sent to sea. Residents ofGuam and Rota spent a day intyphoon Condition of Readiness 1,and the Guam general election hadto be postponed for the fiist time inits history.
Later on, as Elsie moved north-ward in the Philippine Sea, theprepositioning of some supportunits for the military exercise,ANNUAL-EX 92, had to bedelayed.
Figure 3-28-1. Elsie at super typhoon intcnsily in the ccmral Philippine Sea (0423422November DMSP visual imagery).
138
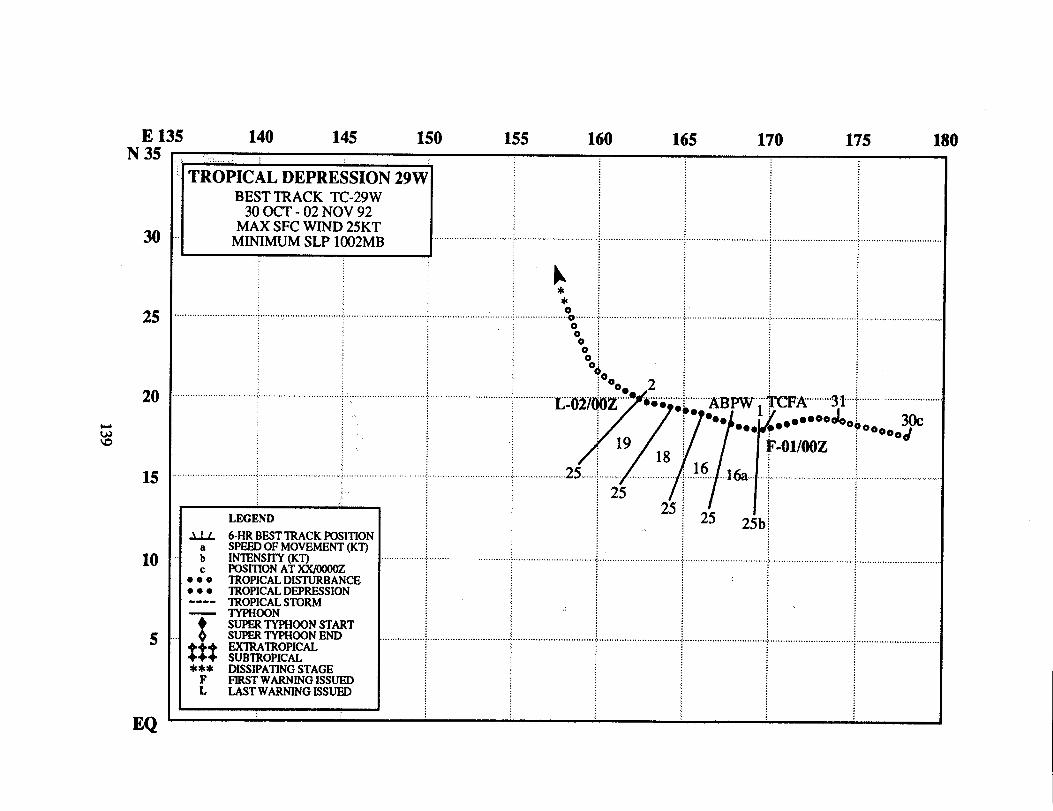
E 135 140 145 150 155 160 165 170 175 180N 35
30
25
20
15
10
5
EQ
,.......... .
TROPICAL DEPRESSION 29WBESTTRACK TC-29W
30 OCT-02 NOV 92MAXSFC WIND25KT
MINIMUMSLP 1002MB
........ .. ........ .......,,.;.....,,..... ....... . .
,,:........... ,,,,,,
:c
● 00● **----
t
m***:
....... . .,.,,,,,.,~.,,,,...,,,,,,,,,,...........
.~,,,,., . .... .
,..........
LEGEND
6-HRBEST TRACK POSITIONSPEEDOF MOVEMENT(KT’)lNTENSITY(w)POSITIONAT XX/OOOOZTROPICALDISTURBANCETROPICALDEPRESSIONTROPICALSTORMTYPHOON
h**...................o~.....
o000c
...............~:02/,
/
,.,.,.,..,,........25....
.......... .. .........
B00.
/
212.....0*G.;..,
/
1918
....... . .25 /
25
. ...... ,..,,,,..,.,. .
M3PW1. ..
/ /0● ●@e
●. .
16 I& .. ... ..
25 25h
. .
............... ....
................. ....
..........
yFA’’’’’’’’’3}’’”\’”””””’‘“”’’””””
. ..-ILOOOOOOO!‘-omoz : ‘
. . ........... .
.... .. ..,,..;,,..................
...............................:....................
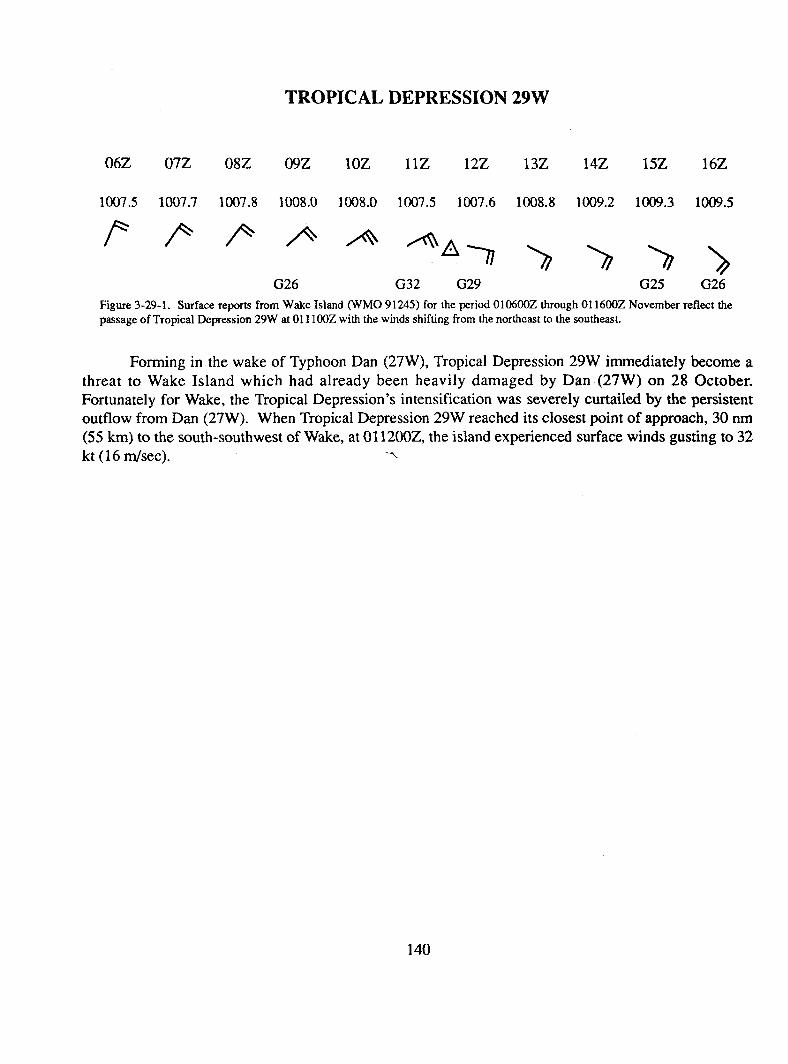
06Z
1007.5
P
07Z
1007.7
P
08Z
1007.8
P
TROPICAL DEPRESSION 29W
09z 10Z llZ 12Z 13Z
1008.0 1008.0 1007.5 1007.6 1008.8
fiA4~3>
G26 (332 G29
14Z
1009.2
>
15Z
1009.3
>G25
16Z
1009.5
>G26
Figure 3-29-1. Surface reports from Wake Island (WMO 91245) for Lheperiod010600Z through 01 1600Z November reflect thepassage of Tropical Depression29Wat0111 00Z wi~ the winds shifting horn the northeast to the southeast.
Forming in the wake of Typhoon Dan (27W), Tropical Depression 29W immediately become a
threat to Wake Island which had already been heavily damaged by Dan (27W) on 28 October.
Fortunately for Wake, the Tropical Depression’s intensification was severely curtailed by the persistent
outflow from Dan (27 W). When Tropical Depression 29W reached its closest point of approach, 30 nm
(55 km) to the south-southwest of Wake, at011200Z, the island experienced surface winds gusting to 32
kt(16 m/see). Y
140
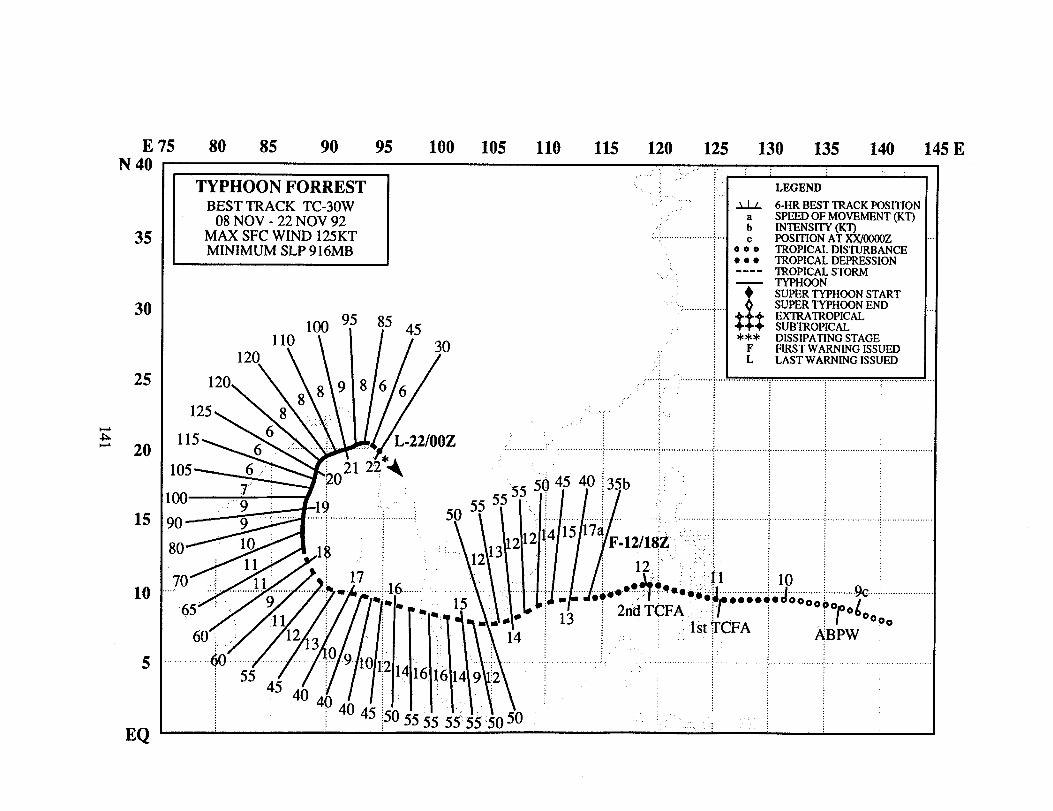
E 75 80 85 90 95 100 105 110 115 120 125 130 135 140 145 EN 40
35
30
25
zF 20
15
10
5
EQ
I TYPHOON FORREST I
110 ‘-( I / 7 an
“o\\ \l //7
:.,. LEGEND:.’”.. ,.:
U 6-FIRBESTTRACKPOSITIONa SPEED OF MOVEMENT(K’r)
.: b INTENSITY(K’r).,.:...,,,. ... .,,...:,,., POSITIONAT XX/OOOOZ
0:0 TROPICALDISTURBANCE● O* TROPICALDEPRESSION‘--- TROPICALSTORM— TYPIWK)N------- .
SUPER TYPHOONSTART I+SUPER TYPHOONEND. ....,...
; $!$EXTRATROPICALSUBTROPICAL
*** DISSIPATINGSTAGEFIRSTWARNINGISSUED
: LAST WARNINGISSUED
1’0. \ \o\Ad6/z / ,..,,.:..,, 1 I:,..,,....,..:.,...,.,.,,..,,,.,,,.:,,. . ............. ,.,.,,,.,.,.,.,,..,,,,
f“@;i[g,o:iip....o.io@/..!..4:....... : *O.?... ..?9.+. . . .. .,........................ ...........................~........................
60:. 1213, ~
““~ ““5545441Jj~jjjjlj ‘** ““”---’ ‘
.@ .......... ,,,,.,.,,. ;0 .9 1* ;2
.
,Y//lil I 1“”’1\ ‘-i4 ~ ~ , ls[f~rA j ~
\~’~l ““”
4BPW -
.,, :., ,:, ;, ,: .. .......92 “j
55050 ,.
TYPHOON FORREST (30W)
I. HIGHLIGHTSThe second of four significant tropical cyclones to start in November, Forrest became part of a
three storm outbreak with Gay (31W) and Hunt (32W). Forrest was the only tropical cyclone of 1992 totrack from the western North Pacific, across the South China Sea, and into the Bay of Bengal. Itreached a maximum intensity of 125 kt (64 m/see) in the Bay of Bengal over a day after it had startedrecurvature.
II. TRACK AND INTENSITYOn 9 November, the tropical disturbance that became Forrest was detected as a persistent area of
convection in the western Caroline Islands, and was first mentioned on the 090600Z SignificantTropical Weather Advisory. As the tropical disturbance was approaching the southern PhilippineIslands, an increase in its convective organization prompted JTWC to issue a Tropical CycloneFormation Alert on 102300Z, forecasting for futiher development once the disturbance exited theIslands. The cloud system was slow to intensify and required the alert to be reissued at 112300Z. Oncepast Palawan Island and over open water in the South China Sea, the disturbance’s organization andconvection increased rapidly. JTWC issued the first warning on Tropical Depression 30W at 121800Z.The upgrade to Tropical Storm Forrest followed at 1300002, which in post analysis appeared to be sixhours slow.
As Forrest continued westward, disruptive land interactions with southern Vietnam and theMalay Peninsula temporarily prevented it from developing into a typhoon. On 15 November, the tropi-cal storm crossed the Malay Peninsula and lost most of its central convection (Figure 3-30-1). Althougha low-level circulation center remained, Forrest continued to slowly weaken for the next two days. Itscentral convection rebuilt and again became persistent on 17 November. Coincident with the tropicalstorm’s intensification came a gradual track change to the north in response to the steering provided bythe subtropical ridge over Southeastern Asia. At 180600Z, Forrest reached typhoon intensity andpassed through the axis of the mid-tropospheric subtropical ridge to begin its recurvature. Despite therecurvature, upper-level winds were from the south-southwest, and provided enhanced oufflow. As aresult, Forrest reached its peak intensity of 125 kt (64 rn/see) 36 hours after it commenced recurvature.As Forrest proceeded to the north, sharper recurvature commenced, and increasing upper-level windshear from the southwest started to weaken the typhoon. On 21 November, Forrest underwent rapidweakening as it made landfall on the coast of Burma. At landfall, the maximum surface winds gustingto 56 kt (29 m/see) were recorded at Cox’s Bazar (WMO 41992), Bangladesh, 75 nm (140 km) north ofthe cyclone’s center. Based on Forrest’s rapid dissipation over Burma’s rugged terrain the final warningwas issued by JTWC at 2200002 (Figure 3-30-2).
III. FORECAST PERFORMANCEThe sample of mean track forecast errors for the South China Sea area was small and the errors
of 75 and 105 nm (135 and 195 km) for 24 and 48 hours, respectively, were roughly equal to CUPER.The mean forecasting errors for track in the Bay of Bengal were considerably larger at 100,220 and 415nm (185, 405 and 770 km) for 24, 48 and 72 hours, respectively. This performance, which againmatched CLIPERS performance, was average for the short range, and less than average for the extendedoutlooks. JTWC did correctly forecast Forrest’s track change to the north in the Bay of Bengal, but did
142
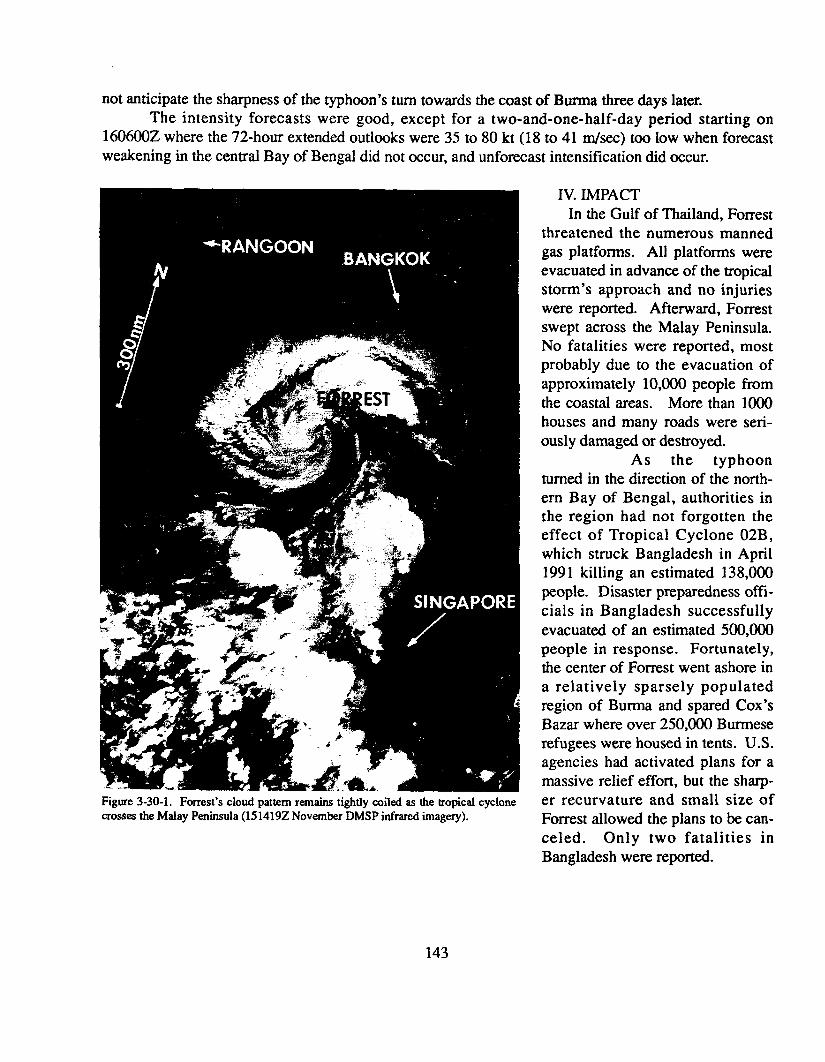
not anticipate the sharpness of the typhoon ‘Sturn towards the coast of Burma three days later.The intensity forecasts were good, except for a two-and-one-half-day period starting on
1606002 where the 72-hour extended outlooks were 35 to 80 kt (18 to 41 m/see) too low when forecastweakening in the central Bay of Bengal did not occur, and unforecast intensification did occur.
Figure 3-30-1. Forrest’s cloud pattern remains tightly coiled as the Mopical cyclonecrosses the Malay Peninsula (15 1419Z November DMSP infrared imagery).
IV. IMPACTIn the Gulf of Thailand, Forrest
threatened the numerous mannedgas platforms. All platforms wereevacuated in advance of the tropicalstorm’s approach and no injurieswere reported. Afterward, Forrestswept across the Malay Peninsula.No fatalities were reported, mostprobably due to the evacuation ofapproximately 10,000 people fromthe coastal areas. More than 1000houses and many roads were seri-ously damaged or destroyed.
As the typhoonturned in the direction of the north-ern Bay of Bengal, authorities inthe region had not forgotten theeffect of Tropical Cyclone 02B,which struck Bangladesh in April1991 killing an estimated 138,000people. Disaster preparedness offi-cials in Bangladesh successfullyevacuated of an estimated 500,000people in response. Fortunately,the center of Forrest went ashore ina relatively sparsely populatedregion of Burma and spared Cox’sBazar where over 250,000 Burmeserefugees were housed in tents. U.S.agencies had activated plans for amassive relief effort, but the sharp-er recurvature and small size ofForrest allowed the plans to be can-celed. Only two fatalities inBangladesh were reported.
143
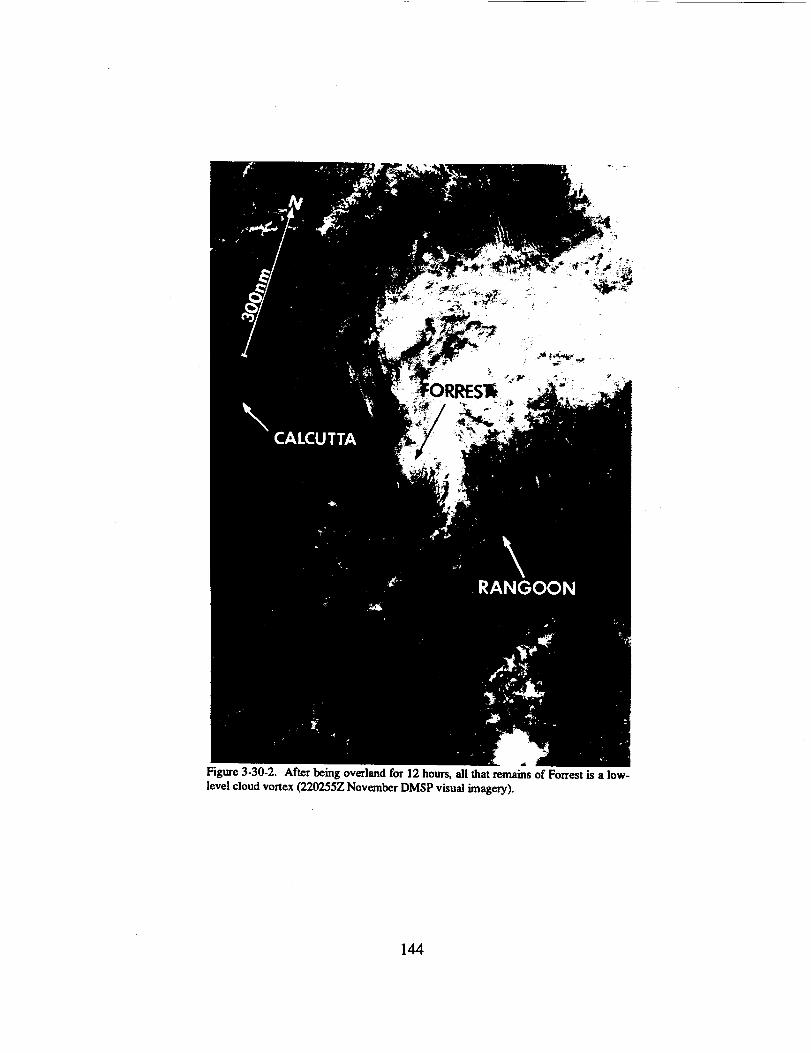
144
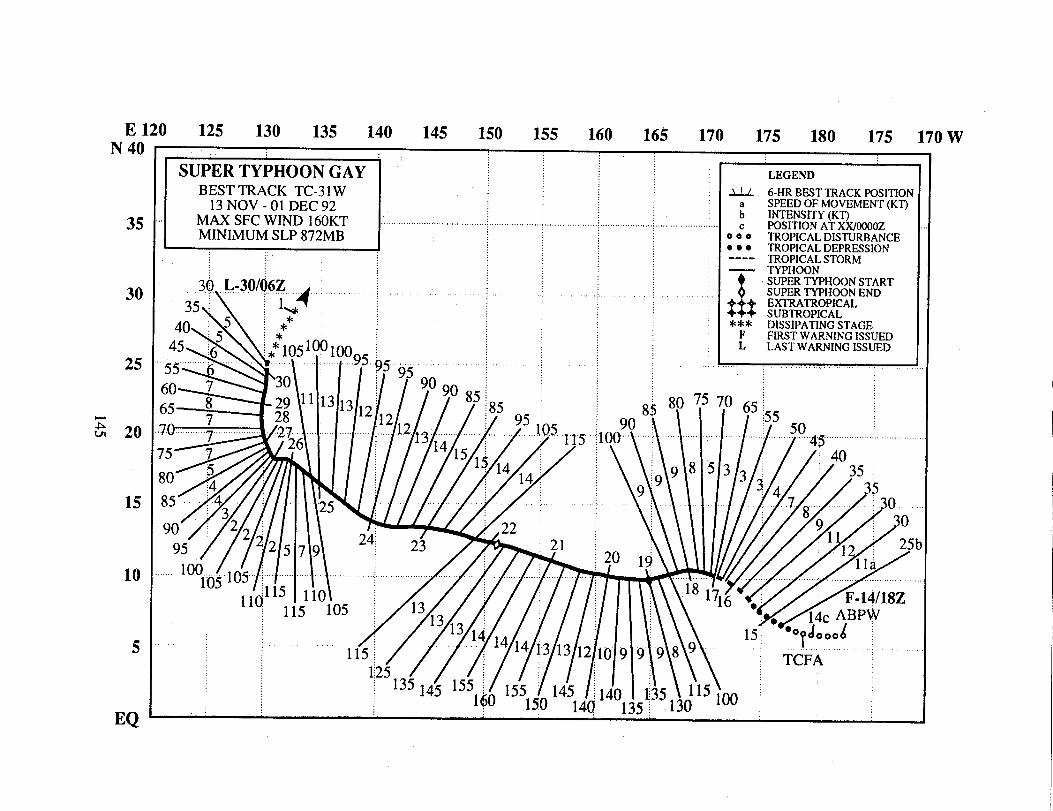
E 120 125 130 135 140 145 150 155 160 165 170 175 180 175 170 w
35
30
25
20
15
10
5
EQ
[ SUPER TYPHOON GAY 1“ I LEGEND
BEST TRACK TC-31W13 NOV -01 DEC92
MAX SFC WIND 160KTMINIMUM SLP 872MB
..3.(),L-3W!kZ. ...A
,..{
&Lf. 6-HR BEST TRACK POSITIONa SPEED OF MOVEMENT(KT)b INTENSITY(Kl;
.:......,.,,,.,,,..,,,,;.. .,,,,,,,, POSITIONAT XO:0 TROPICALDIST● ● ● TROPICALDEPf‘--- TROPICALSTOI— TYPHOON
tSUPER TYPHOOSUPER TYPHOO
)X/oooozWRBANCERESSIONRM
7.0.. ..... .L............ux\ I I I 117
l-r. ,,. ,. ..-”
SUPER TYPHOON GAY (31W)
I. HIGHLIGHTSGay was noteworthy for five reasons: its eye became the record third to pass across Guam in less
than three months; it was estimated to be the most intense tropical cyclone to occur in the western NorthPacific since Super Typhoon Tip in October of 1979; it went through two intensification periods, whichis not rare but is relatively uncommon; it filled an estimated 99 mb in less than 48 hours without movingover land, and, it required the highest number of warnings, 63, for any western North Pacific tropicalcyclone in 1992. Four days after being detected as a tropical disturbance, Gay slammed into several ofthe Marshall Islands with typhoon force winds. After peaking with sustained winds of 160 kt (82m/see) with gusts to 195 kt (1OOm/see), the super typhoon weakened for two days before reachingGuam. Typhoon Gay passed across the center of Guam on 23 November, then reintensified to a secondpeak before recurving, and dissipating over water south of Japan.
II. TRACK AND INTENSITYOn 13 November, the tropical disturbance that became Super Typhoon Gay was detected just
east of the international date line in the monsoon trough which extended westward through the southernMarshall Islands, where Hunt (32W) was forming, to Tropical Storm Forrest (30W) in the South ChinaSea. JTWC first mentioned the disturbance as a convective area with fair potential for development onthe 1306002 November Significant Tropical Weather Advisory. As the disturbance moved westward,the overall area of cloudiness decreased, but there was a marked increase in central convection andorganization. To address this development, the Center issued a Tropical Cyclone Formation Alert at1405002. Intensification continued and the first warning followed at 1418002 with an upgrade toTropical Storm Gay at 1500002.
As Gay approached the Marshall Islands and slowed, it intensified reaching typhoon intensity at1700002. Mejit Island and the atolls of Ailuk and Wotje, just east-northeast of Kwajalein Atoll, werethe first to be buffeted by the typhoon which inflicted considerable damage. Then Typhoon Gay sweptwestward, passing 60 nm (11Okm) north of Kwajalein, and later over Wotho Atoll, where all the homesand crops were destroyed, fortunately without any loss of life. At 1906002, JTWC upgraded Gay to asuper typhoon, the peak intensity of 160 kt (82 m/see) based on estimates from satellite imagery was notreached until 21OOOOZ.This peak intensity, although estimated, established Gay as the most intensetyphoon to occur in the western North Pacific since Typhoon Tip peaked in October 1979 with sustainedwinds of 165 kt (85 m/see).
In the meantime, Typhoon Hunt (32W) had brushed by Guam, intensified, recurved, and waslocated, on 21 November, on the north side of the subtropical ridge, north of Guam, and north-northwestof Super Typhoon Gay. From this position, Hunt’s strong upper-level outflow combined with a massiveupper-level anticyclone to the north-northeast of Gay brought strong northeasterly flow to bear on Gay,
decapitating the north side of its well organized thunderstorm structure. As a consequence, sea-levelpressures began to rapidly rise within the typhoon’s eye, the torrential rains abated, and the winds withinthe core region spun down faster than forecast by JTWC.
Fortunately, for the southern Mariana Islands, the weakening trend continued at a phenomenalrate of 10 kt (5 m/see) per 6 hours, and JTWC downgraded the super typhoon to typhoon status at2212002. Twelve hours later, Gay crossed Guam (Figure 3-31-1) packing sustained winds of 85 kt (44m/see) gusting to 105 kt (54 rn/see). Post analysis indicates that during the rapid weakening event,
146
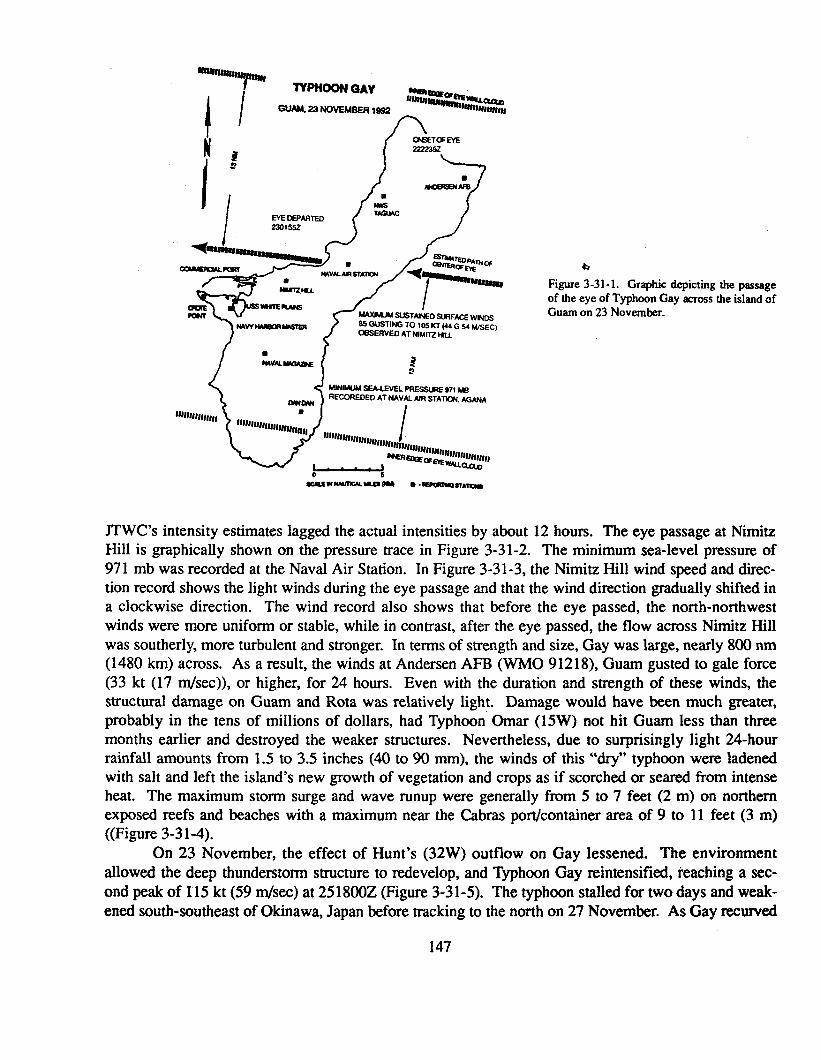
m~~OON GAY -Caotmmwm(“”7--.23 NOVEMBER19s2 “w~WUttim,tn
N-TGEYE
I
3~
b
-
Figure 3-31-1. Graphic depicting the passageof tie eye of Typhoon Gay across the island of
~ WST#dUEDSIJRFAcEWINDS Guam on 23 November.mw~wslm SSOUSTING TO 105KT(44 G 54 WSEC)
CSSERVEDAT MMIR MU
MINIMuM$EA.LEVELwx 97, ~RECOREOEO AT NAVALNR STATION.AGANA
Wllltllu,,
o
JTWC’S intensity estimates lagged the actual intensities by about 12 hours. The eye passage at NimitzHill is graphically shown on the pressure trace in Figure 3-31-2. The minimum sea-level pressure of971 mb was recorded at the Naval Air Station. In Figure 3-31-3, the Nimitz Hill wind speed and direc-tion record shows the light winds during the eye passage and that the wind direction gradually shifted ina clockwise direction. The wind record also shows that before the eye passed, the north-northwestwinds were more uniform or stable, while in contrast, after the eye passed, the flow across Nimitz Hillwas southerly, more turbulent and stronger. In terms of strength and size, Gay was large, nearly 800 nm(1480 km) across. As a result, the winds at Andersen AFB (WMO 91218), Guam gusted to gale force(33 kt (17 m/see)), or higher, for 24 hours. Even with the duration and strength of these winds, thestructural damage on Guam and Rota was relatively light. Damage would have been much greater,probably in the tens of millions of dollars, had Typhoon Omar (15W) not hit Guam less than threemonths earlier and destroyed the weaker structures. Nevertheless, due to surprisingly light 24-hourrainfall amounts from 1.5 to 3.5 inches (40 to 90 mm), the winds of this “dry” typhoon were ladenedwith salt and left the island’s new growth of vegetation and crops as if scorched or seared from intenseheat. The maximum storm surge and wave runup were generally from 5 to 7 feet (2 m) on northernexposed reefs and beaches with a maximum near the Cabras port/container area of 9 to 11 feet (3 m)((Figure 3-31-4).
On 23 November, the effect of Hunt’s (32W) outflow on Gay lessened. The environmenttallowed the deep thunderstorm structure to redevelop, and Typhoon Gay reintensified, reaching a sec-ond peak of 115 kt (59 rn/see) at 25 1800Z (Figure 3-31-5). The typhoon stalled for two days and weak-ened south-southeast of Okinawa, Japan before tracking to the north on 27 November. As Gay mcumxl
147
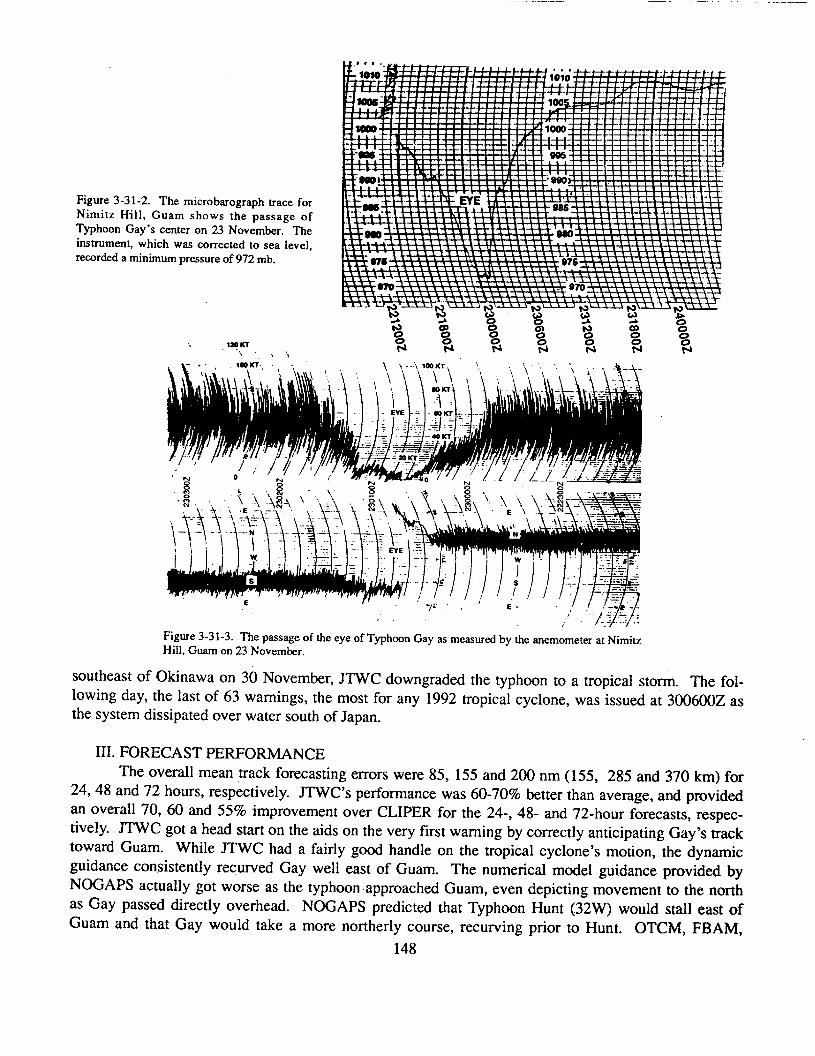
—
Figure 3-31-2. The microbarograph trace forNimitz Hill, Guam shows the passage ofTyphoon Gay’s center on 23 November. Theinstrument, which was corrected to sea level,recorded a minimum pressure of 972 mb.
., la UT“\’\\
Figure 3-31-3. The passage of the eye of Typhoon Gay as measured by the anemometer at NimitzHill, Guam on 23 November.
southeast of Okinawa on 30 November, JTWC downgraded the typhoon to a tro~ical storm. The fol-lowing day, the last of 63 warnings, the most for any _1992tropic~i cyclone, was-issued at 300600Z asthe system dissipated over water south of Japan.
III. FORECAST PERFORMANCEThe overall mean track forecasting errors were 85, 155 and 200 nm (155, 285 and 370 km) for
24,48 and 72 hours, respectively. JTWC’S performance was 60-70% better than average, and providedan overall 70, 60 and 55% improvement over CLIPER for the 24-, 48- and 72-hour forecasts, respec-tive]y. JTWC got a head start on the aids on the very first warning by correct] y anticipating Gay’s tracktoward Guam. While JTWC had a fairly good handle on the tropical cyclone’s motion, the dynamicguidance consistently recuxved Gay well east of Guam. The numerical model guidance provided byNOGAPS actually got worse as the typhoon approached Guam, even depicting movement to the northas Gay passed directly overhead. NOGAPS predicted that Typhoon Hunt (32W) would stall east ofGuam and that Gay would take a more northerly course, recurving prior to Hunt. OTCM, FBAM,
148
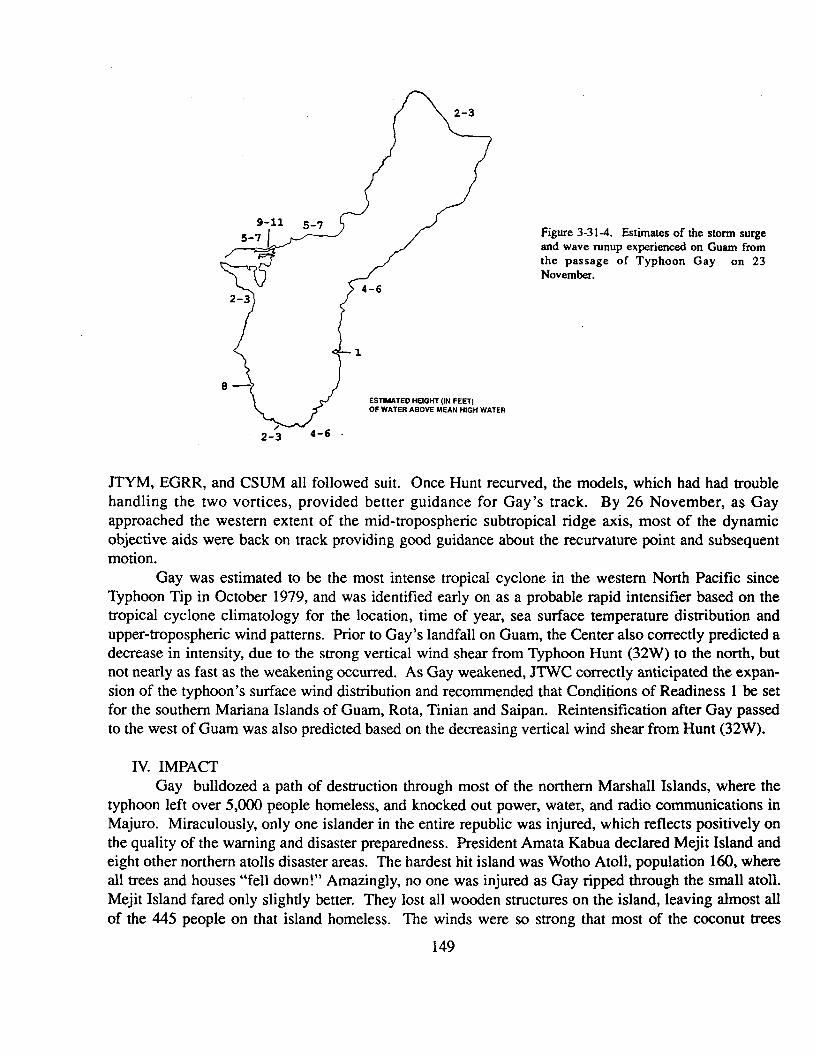
9-11 5.75-7 [
2-3
ESTIMATEDHEIGNT([N FEETIOF WATER ABOVE MEAN HIGH WATER
Figure 3-31-4. Estimaies of the storm surgeand wave nmup experienced on Guam fromthe passage of Typhoon Gay on 23November.
JTYM, EGRR, and CSUM all followed suit. Once Hunt recurved, the models, which had had troublehandling the two vortices, provided better guidance for Gay’s track. By 26 November, as Gayapproached the western extent of the mid-tropospheric subtropical ridge axis, most of the dynamicobjective aids were back on track providing good guidance about the recurvature point and subsequentmotion.
Gay was estimated to be the most intense tropical cyclone in the western North Pacific sinceTyphoon Tip in October 1979, and was identified early on as a probable rapid intensifier based on thetropical cyclone climatology for the location, time of year, sea surface temperature distribution andupper-tropospheric wind patterns. Prior to Gay’s landfall on Guam, the Center also correctly predicted adecrease in intensity, due to the strong vertical wind shear from Typhoon Hunt (32W) to the north, butnot nearly as fast as the weakening occurred. As Gay weakened, JTWC correctly anticipated the expan-sion of the typhoon’s surface wind distribution and recommended that Conditions of Readiness 1 be setfor the southern Mariana Islands of Guam, Rota, Tinian and Saipan. Reintensification after Gay passedto the west of Guam was also predicted based on the decreasing vertical wind shear from Hunt (32W).
IV. IMPACTGay bulldozed a path of destruction through most of the northern Marshall Islands, where the
typhoon left over 5,000 people homeless, and knocked out power, water, and radio communications inMajuro. Miraculously, only one islander in the entire republic was injured, which reflects positively onthe quality of the warning and disaster preparedness. President Amata Kabua declared Mejit Island andeight other northern atolls disaster areas, The hardest hit island was Wotho Atoll, population 160, whenall trees and houses “fell down!” Amazing] y, no one was injured as Gay ripped through the small atoll.Mejit Island fared only slightly better. They lost all wooden structures on the island, leaving almost allof the 445 people on that island homeless. The winds were so strong that most of the coconut trees
149
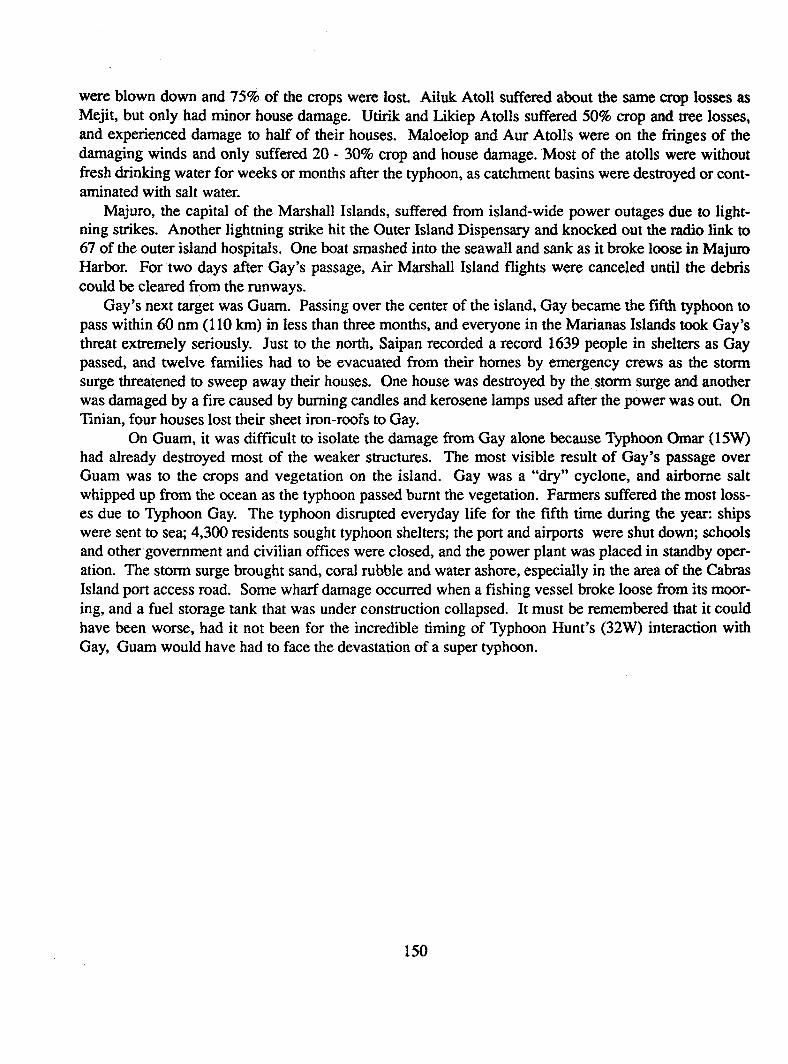
were blown down and 7590 of the crops were lost. Ailuk Atoll suffered about the same crop losses asMejit, but only had minor house damage. Utirik and Likiep Atolls suffered 50% crop and tree losses,and experienced damage to half of their houses. Maloelop and Aur Atolls were on the fringes of thedamaging winds and only suffered 20- 30% crop and house damage. Most of the atolls were withoutfresh drinking water for weeks or months after the typhoon, as catchment basins were destroyed or cont-aminated with salt water.
Majuro, the capital of the Marshall Islands, suffered from island-wide power outages due to light-ning strikes. Another lightning strike hit the Outer Island Dispensary and knocked out the radio link to67 of the outer island hospitals. One boat smashed into the seawall and sank as it broke loose in MajuroHarbor. For two days after Gay’s passage, Air Marshall Island flights were canceled until the debriscould be cleared horn the runways.
Gay’s next target was Guam. Passing over the center of the island, Gay became the fifth typhoon topass within 60nm(110 km) in less than three months, and everyone in the Marianas Islands took Gay’sthreat extremely seriously. Just to the north, Saipan recorded a record 1639 people in shelters as Gaypassed, and twelve families had to be evacuated from their homes by emergency crews as the stormsurge threatened to sweep away their houses. One house was destroyed by the storm surge and anotherwas damaged by a fire caused by burning candles and kerosene lamps used after the power was out. OnTlnian, four houses lost their sheet iron-roofs to Gay.
On Guam, it was difficult to isolate the damage from Gay alone because Typhoon Omar (15W)had already destroyed most of the weaker structures. The most visible result of Gay’s passage overGuam was to the crops and vegetation on the island. Gay was a “dry” cyclone, and airborne saltwhipped up from the ocean as the typhoon passed burnt the vegetation. Farmers suffered the most loss-es due to Typhoon Gay. The typhoon disrupted everyday life for the fifth time during the year: shipswere sent to sew 4,300 residents sought typhoon shelters; the port and airports were shut down; schoolsand other government and civilian offices were closed, and the power plant was placed in standby oper-ation. The storm surge brought sand, coral rubble and water ashore, especially in the area of the CabrasIsland port access road. Some wharf damage occurred when a fishing vessel broke loose from its moor-ing, and a fuel storage tank that was under construction collapsed. It must be remembered that it couldhave been worse, had it not been for the incredible timing of Typhoon Hunt’s (32W) interaction withGay, Guam would have had to face the devastation of a super typhoon.
150
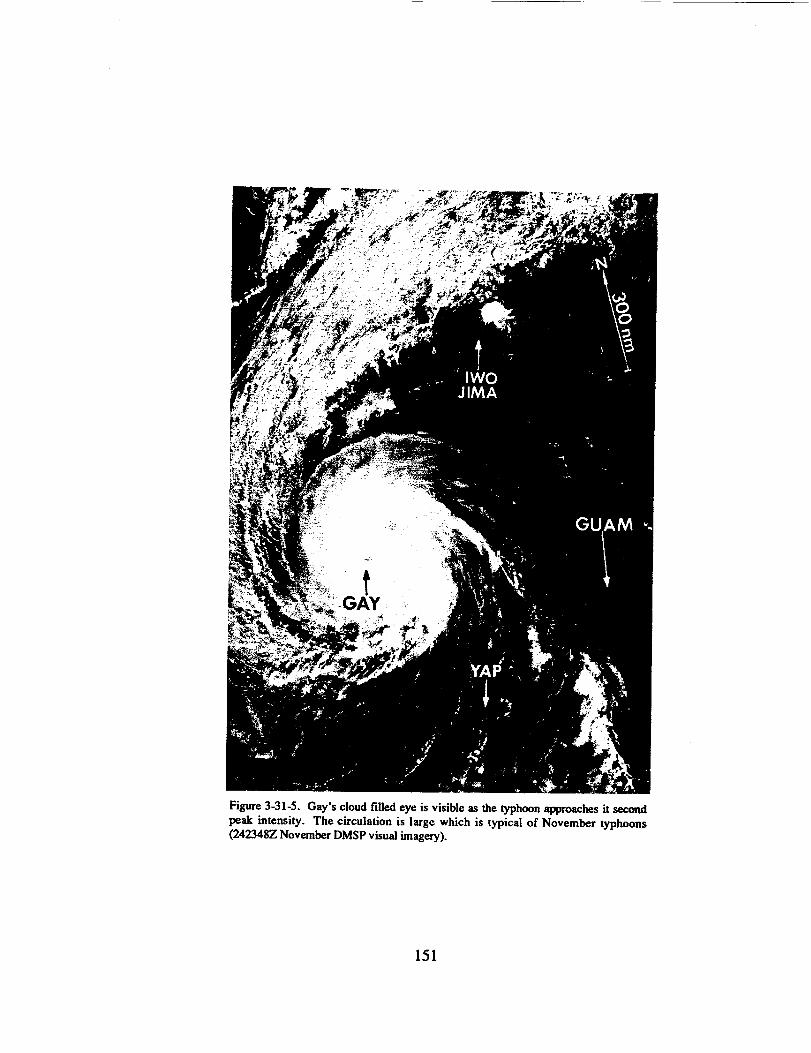
Figure 3-31-5. Gay’s cloud filled eye is visible as the typhoon approaches it secondpeak intensity. The circulation is Iargc which is typical of November typhoons(242348Z November DMSPVi5Ud imagery).
151
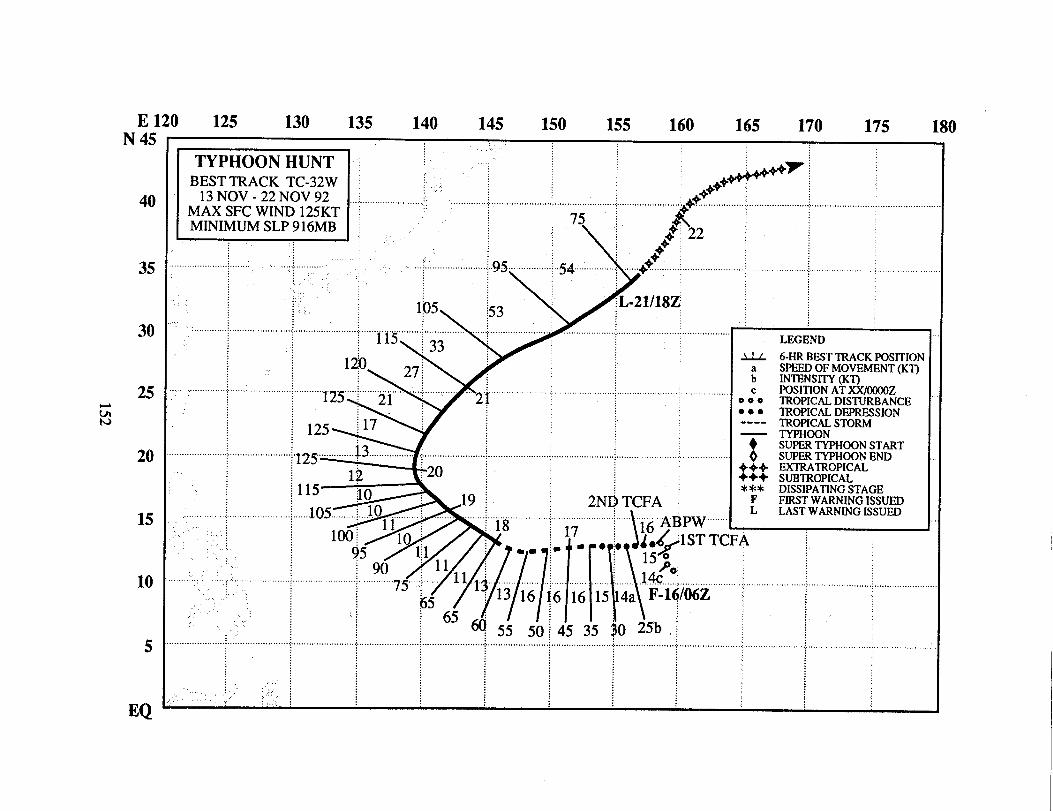
n
,
I~
~~
::..
L?
l............................................j..........
d-::!1.
‘+=
‘
%“’””,..,.,,,,,
4:
.....
4N
g$ji~
:9:
~Eziliil~
~.i........................i..............a
....!.........e......
:
“m7
~;~
..................j...........
A:
:.
...,.:.,................................ ..............~
.......
i’-1......A...f....~
.y....y..
..=................j...........................
(TW
X‘m
...........$O................
!..l.ml.\...i.
\........a
........i
.......................~
..... .......

TYPHOON HUNT (32W)
1.HIGHLIGHTSThe fourth typhoon to pass within 60 nm (110 km) of Guam in less than three months, Hunt was
part of a three storm outbreak with Tropical Storm Forrest (30W) and Gay (31W). As Hunt intensified,it brushed by Guam, moved into the Philippine Sea, and later recurved. After recurvature, the typhoonplayed an important role in the extremely rapid weakening of Super Typhoon Gay (31W) which wasapproaching the southern Mariana Islands.
II. TRACK AND INTENSITYOn 13 November, the monsoon trough extended eastward from Tropical Storm Forrest (30W) in
the South China Sea, across the southern Philippines, through the Caroline Islands to a tropical distur-bance in the southern Marshall Islands, and on further to the another tropical disturbance forming just to
the east of the international dateline that would become Gay (31W). The tropical disturbance in thesouthern Marshall Islands that became Hunt was first mentioned by JTWC on the 1406002 NovemberSignificant Tropical Weather Advisory. As the cloud system associated with this disturbance slowlydrifted northward, increasing convection prompted JTWC to issue the first Tropical Cyclone FormationAlert at 150400Z. Because the disturbance was slow to consolidate, the alert was reissued at 160400Z.The first warning followed at 1606002 based on the appearance of a poorly defined low-level circula-tion center with improved convective organization on the animated visual and infrared satellite imagery.
Tropical Depression 32W tracked westward under the steering influence of the mid-troposphericsubtropical ridge. Intensifying at an average rate of one Dvorak T-number per day, the depression wasupgraded by JTWC to Tropical Storm Hunt at 170000Z. Twenty-four hours later, Hunt was furtherupgraded to a typhoon based on an Dvorak intensity estimate of 65 kt (33 m/see), and convective orga-nization that had continued to improve.
As Hunt approached Guam, it was expected to pass close to, or over, the southern portion of theisland. However, to the east of the island, the typhoon changed course and began to track northwest-ward toward a break in the subtropical ridge. The typhoon passed 10 nm (20 km) east-northeast ofAndersen AFB (WMO 91218) where a minimum sea-level pressure of 987.2 mb was recorded at1804552. After Hunt churned through the channel between the islands of Guam and Rota, a strong con-vective band crossed Guam producing two to three hours of 60 kt (31 m/see) winds with gusts to 75 kt(39 m/see), and heavy rain.
Continuing to intensify on its northwestward track, Hunt reached a peak of 125 kt (64 rn/see)near its point of recurvature at 200000Z (Figure 3-32-1). The typhoon’s acceleration into the mid-lati-tude westerlies was one of the fastest noted in 1992 or any year, reaching an average 6-hour track speedof 54 kt (100 km/hr) as it transitioned into an extratropical low. (See the Super Typhoon Gay (31W)synopsis for a more complete description of Hunt’s affect on Gay (31W).) The final warning for Huntwas issued by JTWC at 211800Z when Hunt became extratropical.
III. FORECAST PERFORMANCEThe overall mean track errors for JTWC were 145, 300 and 545 nm (265, 556 and 1010 km) for
the 24-, 48- and 72-hour forecasts. This performance was much worse than average and was beaten byCLLPER at 48 and 72 hours. The poor overall performance resulted from several factors. First, overestimation of the strength of the subtropical ridge led to steady westward track forecasts, even after
153

Hunt began to move northwestward. Second, forecasters were heavily influenced by the NOGAPSguidance which had a difllcult time resolving both the circulations of Typhoon Hunt and Super TyphoonGay (31W), and erroneously indicated that Hunt would stall as Gay (31W) recurved first and accelerat-ed into the westerlies. Finally, the greatest errors at 48 and 72 hours were due to under forecastingHunt’s unusually rapid acceleration after recurvature.
Overall intensity forecasts were good with the exception of the 72-hour extended outlooks forthe fmt four warnings. These proved to be 45 to 50 kt (23 to 26 rn/see) too low when an anticipatedincrease in vertical shear did not occur, and Hunt intensified more rapidly than expected.
IV. IMPACTIn preparation for Hunt’s passage on 18 November, Guam boarded up, closed schools and other
government offices, evacuated aircraft, and sent ships to sea. The disaster preparations paid off. Nofatalities or injuries were reported and damage appeared to minimal, however, the quantitative assess-ments of the minor damage caused by Hunt were not completed before Super Typhoon Gay (31W)slammed into the island five days later. As with Brian (25W) and Elsie (28W), more damage wouldhave occurred had not Omar (15W) destroyed most of the island’s weaker structures earlier on 28August.
Figure 3-32-1. As Hunt intenaifiis the diameter of its cloud-filled eye, which had been 14 nm (26 km) nine hours earlier,decreases to 7 nm (13 km) (1823362 November DMSP visual imagery).
154
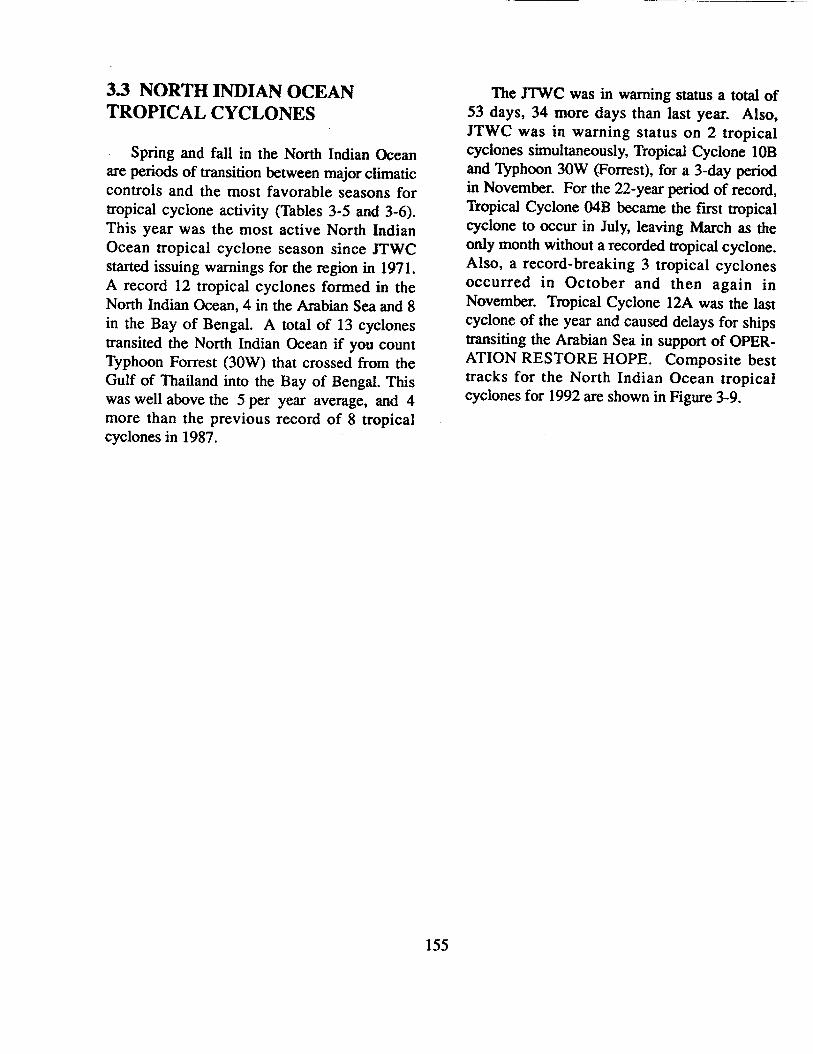
3,3 NORTH INDIAN OCEANTROPICAL CYCLONES
Spring and fall in the North Indian Oceanare periods of transition between major climaticcontrols and the most favorable seasons fortropical cyclone activity (Tables 3-5 and 3-6).This year was the most active North IndianOcean tropical cyclone season since JTWCstarted issuing warnings for the region in 1971.A record 12 tropical cyclones formed in theNorth Indian Ocean, 4 in the Arabian Sea and 8in the Bay of Bengal. A total of 13 cyclonestransited the North Indian Ocean if you countTyphoon Forrest (30W) that crossed from theGulf of Thailand into the Bay of Bengal. Thiswas well above the 5 per year average, and 4more than the previous record of 8 tropicalcyclones in 1987.
The JTWC was in warning status a total of53 days, 34 more days than last year. Also,JTWC was in warning status on 2 tropicalcyclones simultaneously, Tropical Cyclone 10Band Typhoon 30W (Forrest), for a 3-day periodin November. For the 22-year period of record,Tropical Cyclone 04B lxxame the fmt tropicalcyclone to occur in July, leaving March as theonly month without a recorded tropical cyclone.Also, a record-breaking 3 tropical cyclonesoccurred in October and then again inNovember. Tropical Cyclone 12A was the lastcyclone of the year and caused delays for shipstransiting the Arabian Sea in support of OPER-ATION RESTORE HOPE. Composite besttracks for the North Indian Ocean tropicalcyclones for 1992 are shown in Figure 3-9.
155

TABLE 3-5.
TROPICAL
TC OlBTC 02ATC 03BTC 04BTC O5BTC o6ATC 07BTC O8BTC C@~C 10BTC 30WTC Ill+TC 12A
1992 S~IFICANT TR@ICAL CYCWWES.N- INDIAN fXSAN
OF ~16 MAY - 20 MAY05 JUN - 12 JUN17 JUN-18JUN26 JUL - 27 JUL22 SEP - 24 SSP01 OCT - 03 OCT07 WT - 09 OCT21 OCT”- 21 OCT03 NOV - 07 NOV11 NOV - 17 NOV15 NOV - 22 NOV30 NOV - 03 DEC20 DEC - 24 DEC
NUMBER OF
WARNINGS
LSS~D1529647101032028261418
TOTAL: 190
MAxImSURFACEs-l-n(M/~65 (33)35 (18)45 (23)40 (21)30 (15)55 (28)45 (23)30 (15)55 (28)70 (36)125 (64)50 (26)50 (26)
ESTIMATED
Msl.F(MB)97699799199410009849911000984972916987987
TABLE 3-6. NORTE mIAN (12ElU4TR@ICAL ~S DISTIUSU1’1~
JAN m WiRlklii w LL?N m A!& SEEQfXNQYI.?EC l?2zAL1971* - - - - - (1 o 0 0 1 1 0 21972* 0 0 0 1 0 0 0 0 2 0 1 0 41973* o 0 0 0 0 0 0 0 0 1 2 1 4
1974* o 0 0 0 0 0 0 0 0 0 1 0 11975 1000200 00120 61976 000101 001101 51977 000011 000120 51978 0000100 00120 41979 000011 0021.20 71980 000000 000011 21981 000000 000111 31982 000011 000210 51983 000000 010110 31984 000010 000120 41985 0000200 00211 61986 100000 000020 31987 0100020 00122 81988 0000010 00121 51989 000011 000010 31990 000110 000011 41991 1001010 00010 41992 0000121 01332 13
(1975-1992)AVERJKE: 0.2 0.1 0.0 0.2 0.7 0.6 0.0 0.0 0.3 0.9 1.5 0.6 5.0TOTAL: 3 1 0 3 12 11 1 1 4 17 27 10 90
* JTWC WARNING RESPONSIBILITYBEGAN ON 4 JUNE 1971 FOR THE BAY OF BENGAL, EAST OF 90” EASTLONGITUDE.AS DIRECTED BY CINCPAC, JTWC ISSUED WARNINGS ONLY FOR THOSE TROPICAL CYCLONES THATDEVELOPED OR TRACKED THROUGH THAT FART OF THE BAY OF BENGAL. IN 1975, JTWC’S AREAOF RESPONSIBILITYWAS EXTF,NDEDWESTWARD TO INCLUDE THE WESTERN PART OF TFD3BAY OF BENGALAND THE ENTIRE ARABIAN SEA.
156

E35 40 45 50 55 60 65 70 75 80 85 go 95 100 EN 40
35
30
25
+u!4 20
15
10
5
EQ
TC OIB 15 t4AY - 20 MAY‘1’C02A 03 JUN-12JIJN!l!C03B 14 JON-18JUN‘rC04B 24 JUL - 28 JULTC OSB 21 SEP - 25 SEPTC 06A 29 SEP - 04 OCTTC 07B 04 OCT - 09 OCTTC 08B 13 OCT - 22 OCTTC O9B 31 OCT - 08 NOVTC 10B,,,. 06 NOV - 17 NW
.... ..... .....’..,,,, TC 30w 08 NOV - 22 NOV, ‘:. TC 11A 29 NOV - 04 DEC.; ... TC 12A 18 DEC - 24 DEC,.,.,
:, .... . ... .. ..... ....” ;,“.. .,..;, ,:.; :.,. :., .,... . , ,...... ..... ,.,‘., ,...’,,.: ,;, ;,,, . ... . ... ... .. ... .:......,’,..j. .: ...:,,, 011:... 04B,.,,.,...,,..,’,..,,, ...’.., ;.,........ .:.,,,....,,..,, :..,.. ,,,.... ,. .:/ ..
06A*.** ;.’; : ““‘..‘, ...‘:,,.,...,,,,,.... :.. **”’”~’;.,. “:. ,,.,,;++ ~
,.,, 4., ,...‘.. : , ●
‘: .... ,.,..,,., ---+0,,... :i. : ●* ::.,... ● +“...,,,......, ,, '""`'::""""`""'"'''\''"''''"""..'''''''''..:.........................................4i..... . ...,,....,...,, ,,....... ,:.,;,... -’,.:..’ ‘A--;~-**+ i ; +‘i“.,,. ;
:...QA”’02’A”’““ I●,.,:: :‘:..
“’”””””‘“’””’k. ::’ I~~ ..; 0- -?.; m.--..?~+*4,.,,
,,:
.:
~[--’”’”’
MAXIMUM SUSTAINED SURFACE WIND ‘;
•~m~am,-s-m~ TO 631fT (18 TO 32M/SECJ● ● ● ● ● ● ● ● ● 33KT (17M/,$EC) OR LESS
-..Figure 3-9. Composite best trsck for the North Indian Ocean tropical cyclones for 1992.
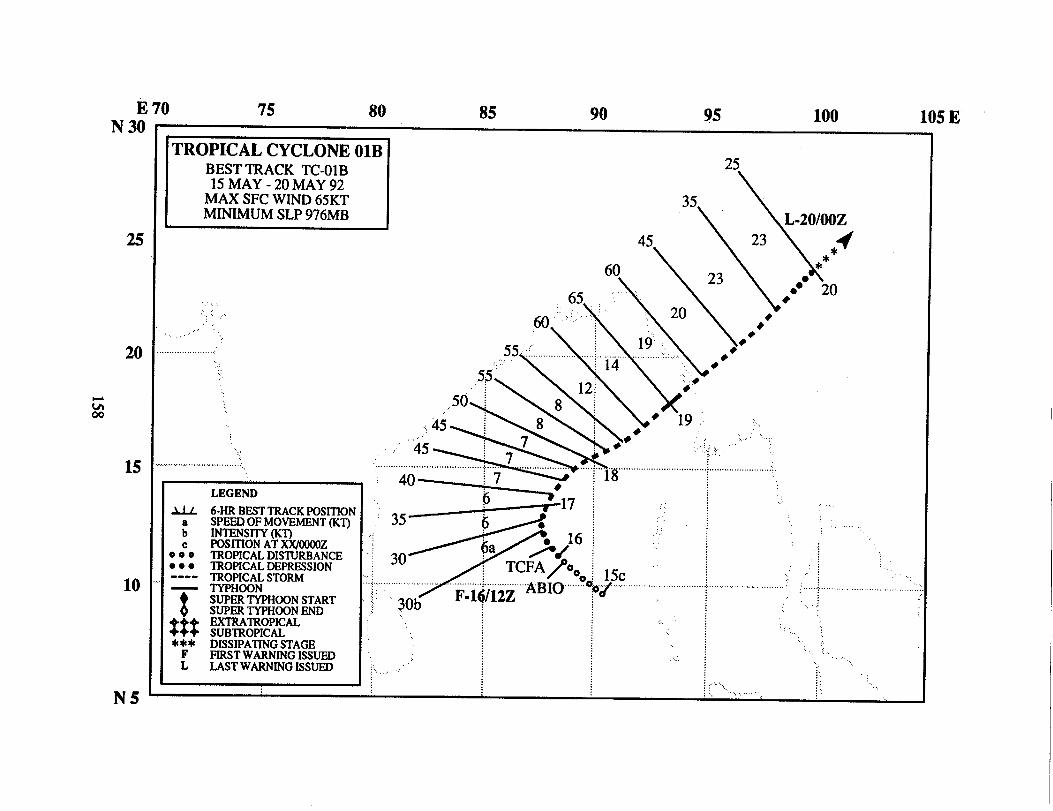
la
........,:
..:
m“
w
‘“z“:A
:‘“”;.
i~~“::““’””“’”“
mI
:,....,...
‘....................................,
!+.,:
.,.,
i.
I
,........
. ...””
.:
omz
mz
TROPICAL CYCLONE OIB
Figure 3-OIB-1. Although TCOIB’S central dense overcast is located near the center of the Bay of Bengal, a broad band ofenhanced cloudiness associated with the tropical cyclone is already affecting Burma (180200Z - 180400Z May DMSP visualdigitized mosaic).
After an absence of tropical cyclone activity in the North Indian Ocean for six months, TCOIBdeveloped in the Bay of Bengal with the onset of the summer monsoon. It was first mentioned on the1518002 May Significant Tropical Weather Advisory and was the subject of a Tropical CycloneFormation Alert at 1604512, which was followed by the first warning at 1612002. Because of the slowintensification and poorly defined cloud system center of TCOIB, JTWC had to relocate the initial posi-tion on the second warning. The system recurved on 16 May, and continued to intensify afterward,reaching minimal typhoon intensity for a short period prior to landfall in Burma on 19 May. The finalwarning was issued by JTWC at 200000Z.
159

E40 45 50 55 60 65 70 75 E
TROPICAL CYCLONE 02A I
m ...........!""'.................................
. ......
63 E
.!.:
LEGEND
* 6-HR BEST TRACKPOSIllO}SPEED OF MOVEMENT(IW)
: INTENSITY(K’r)c POSI’ITONAT XX/OOOOZ
000 TROPICALDISTURBANCE● ● ● TROPICALDEPRESSION‘--- ~O&I&~ STORM
$— SUPER TYPHOONSTART
SUPERTYPHOONEND
mEXTRt%mtOPICWSUBTROPICAL
.Pq!!Eg25 25 303030 35:i.........j...........................................~...
,, ‘\\)~\\ll/p
3535...,.: 3535
9 9 9“”’9 9353531
9865
~f’”
~.i27ti.z... . ~........... ...... ..... ..... . .... .....4. ..4..~........~...........................!!...............................................
● e, *@@eA** : ●
:12 ●b11 ~
! 10 > Iio5/06z ‘BIO :k,*,&og..;i:.,..,,,,, .................... ........ . . ..........,,........,,, - is .*,
ll\
.. ...... ..........$ .............................
5 TcFA~899a
............ . ........................................................................~5 .....35..~...30.....30B..................................................
.
.,.
TROPICAL CYCLONE 02A
Figure 3-02A-1. A partially exposed low-level circulation is visible to the east of TC(12A’s central cloud mass (1103OOZ-1104OOZJune DMSP visual digitized mosaic).
Two weeks after TCOIB formed in the Bay of Bengal, a small low-level circulation center devel-oped in the monsoon trough in the Arabian Sea. Increasing convection prompted JTWC to mention iton the 04 1800Z June Significant Tropical Weather Advisory. As convective organization rapidlyimproved, this was followed by a Tropical Cyclone Formation Alert at 042300Z, and the first warningat 050600Z. However, strong upper-level easterly winds restricted the outflow aloft, keeping thecyclone at minimum tropical storm intensity over the next five days as it tracked slowly westwardacross the Arabian Sea. Interpretation of DMSP microwave imagery on 7 June indicated that the low-level circulation was further east than analyzed from infrared data, resulting in a relocated position andan amended forecast at O721OOZ. As the presence of upper-level shear persisted, TC02A graduallyweakened. The final warning was issued by JTWC at 1206(3OZas the cyclone dissipated over the openocean just north of the island of Socotra. TC02A was the first of four tropical cyclones to develop dur-ing 1992 in the Arabian Sea a basin that averages only one per year
161
E 75N 25
10
N5
80 85 90 lilQE. . .- mvl
45/ 35
\**
/
~.:.30..:(j ~ ‘“”:.
., .,,
** 18 :., ..’: .::,.7:.(; 3ob* * *, ●*,Q f.L-18/06z
,,,,:. . . .../{/ “:..,:
*W
/
6a “..,,.,.:..’.,....... .. . ........ ............
●................,..,,!.,,,.......................... . ......
~70 . F-17jOOZ.. ,“,,:
..’i~ 8TCFAAO ~ABIO+ \
● ;25
3$ 45●y~6 ‘,,. .,::.,.
.’:’..,, .,’‘, ..., :..,.;,...:.,,,.,,.::....................................................................................!....!.................o. ........!,..,.,,,,,......................................,.,,,,,,,....,,:....................................”.
●° :
LEGEND
U 6-HR .BEST TRACKPOSITIONa SPEEDOF MOVEMENT(KT)b INTENSITY(KT)
POSITIONAT XXIOOOOZo ~0 TROPICALDISTURBANCEc ● ● TROPICALDEPRESSION---- ~O;l&A~ STORM
!
— SUPER TYPHOONSTARTSUPER TYPHOONEND
$$EKTRATROPICALSUBTROPICAL
*** DISSIPATINGSTAGEFIRSTWARNINGISSUED
[ LASTWARNINGISSUED
..............,.,,
●●● ✎✎
:’. ,
..,.,,,,.,.,,,,..., .......... .,,,,,.,,, .,,,,,,,.
..’,.
., :,.,
TROPICAL CYCLONE 03BBESTTRACK TC-03B
14JUN-18JUN92MAXSFC WIND45KTMINIMUMSLP 981MB
. .
TROPICAL CYCLONE 03B
F@re 3-03B-1. TC03B a day before makiig landfall in India (161OOOZ- 161200Z June DMSP in!h=d digitized mosaic).
In response to a surge in the monsoon the second week of June, a tropical disturbance developedin the Bay of Bengal which prompted JTWC to reissue the Significant Tropical Weather Advisory forthe Indian Ocean at 1613(K)ZJune to include mention of the disturbance’s consolidation. A TropicalCyclone Formation Alert followed at 161800Z, and the first warning was issued by JTWC at 170000Zas the cyclone turned northwestward towards India. Due to its nearness to the coast of India, TC03Bhad little time to intensify. The tropical cyclone struck the coast with a peak intensity of 45 kt (23mhec) at 172000Z, and slowly dissipated overland. JTWC issued the final warning at 180600Z.
163
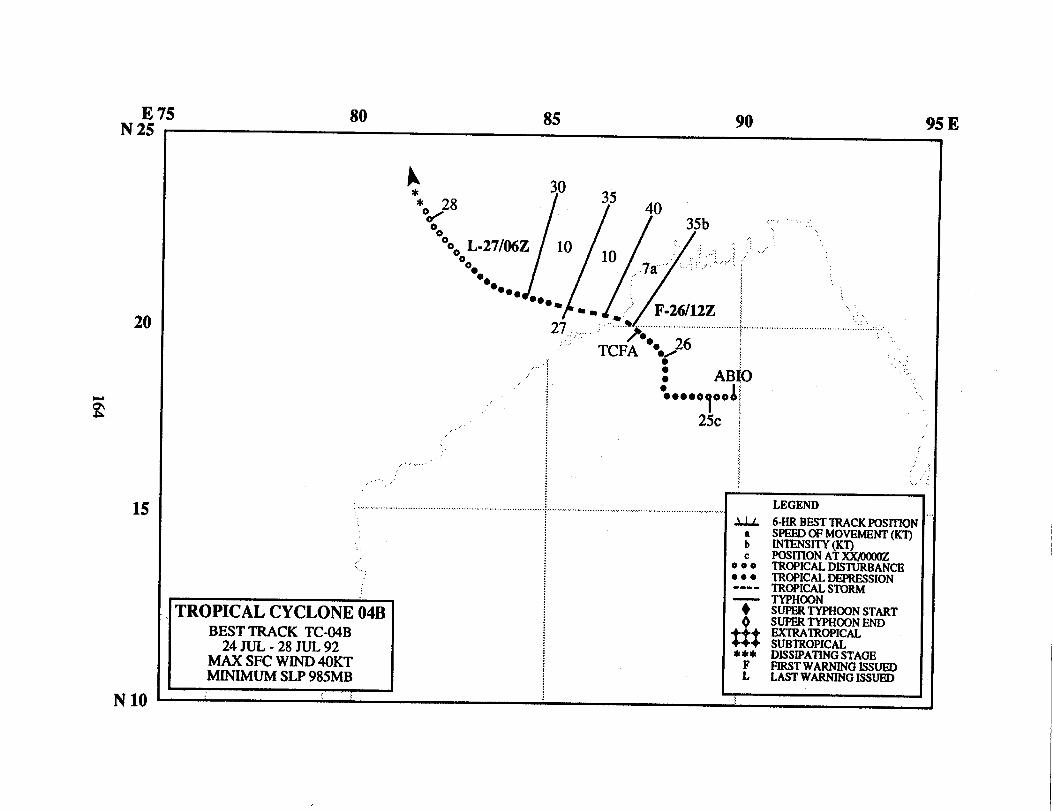
yJ
.....-.....
,..... ...’
,,
..
....’
,..
0..................J...
...,....
,...x
..................
.,..
.:.,........
:.,..,.
~:
?:F
#.:,...
IJ-j
‘::.::;;~;
ON
\
m:
g~~
:
\“id
&:
..000..
.’< ~‘..,:<04
~%
,~.“>
‘
8.s
j.:.
o..
8$
‘“’............................................................:
g;“
““q
●“d#e*
‘b””o
oo
&**
.,..,,
....,.”..
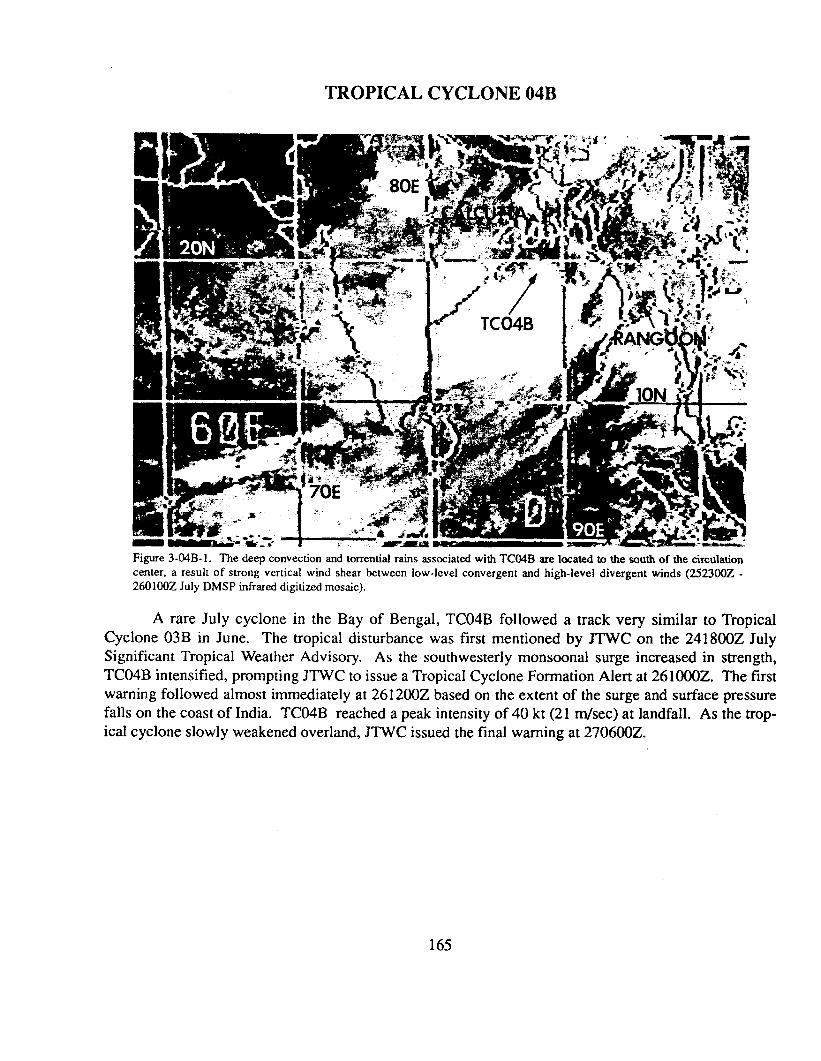
TROPICAL CYCLONE 04B
Figure 3-04B- 1. The deep convection and torrernial rains associated with TC04B are located to the south of the circulationcenter, a result of strong vertical wind shear between Iow-level convergent and high-level divergent winds (252300Z -2601OOZ July DMSP infrared digitized mosaic).
A rare July cyclone in the Bay of Bengal, TC04B followed a track very similar to TropicalCyclone 03B in June. The tropical disturbance was first mentioned by JTWC on the 241800Z JulySignificant Tropical Weather Advisory. As the southwesterly monsoonal surge increased in strength,TC04B intensified, prompting JTWC to issue a Tropical Cyclone Formation Alert at 26 1000Z. The firstwarning followed almost immediately at 261200Z based on the extent of the surge and surface pressurefalls on the coast of India. TC04B reached a peak intensity of 40 kt (21 ~sec) at landfall. As the trop-ical cyclone slowly weakened overland, JTWC issued the final warning at 270600Z.
165

us?o:
,.00
‘“”
o“””..
:z.....
:.’.
:.......,
“’~’:’”””..0
,...,.....
●
..“’”:
2+0●“
●<
g,s
z...
.,,...
..,.
.,
......................
...........
...
zz
166
TROPICAL CYCLONE 05B
After a two month hiatus of tropical cyclone activity in the North Indian Ocean, the tropical dis-turbance that became TC05B moved into the Bay of Bengal and developed on 21 September. As thebroad monsoon depression moved over open water in the Bay of Bengal and its convection increased,JTWC went directly to a Tropical Cyclone Formation Alert at 220525Z. Within the next six hours, theincreased convection had organized and the Center issued the first warning at 22 1200Z. TC05Bremained close to the shoreline of Bangladesh and India and did not intensify above 30 kt (15 rn/see).The final warning was issued by JTWC at 2400002 as the tropical cyclone dksipated over land.
167
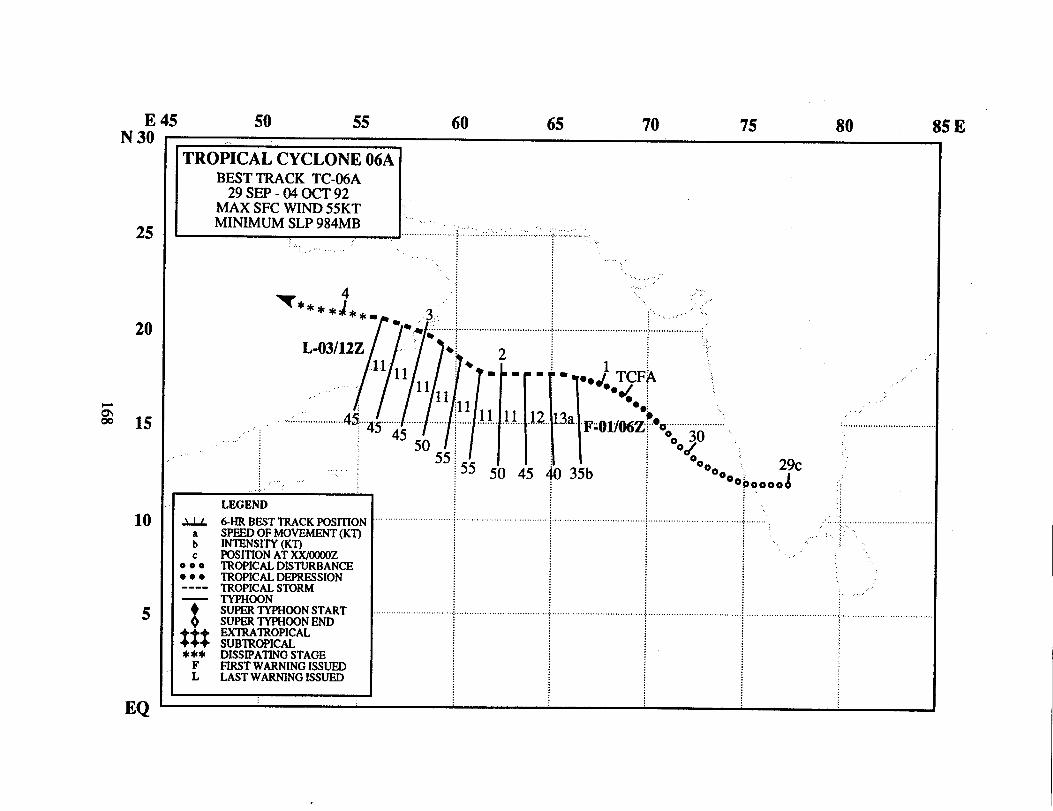
E 45N 30
55 60 65 70 75 80 85 E
TROPICAL CYCLONE 06ABESTTRACK TC-06A
29 SEP-040CT92MAXSFC WIND55KTMINIMUMSLP984MB ““ ....,,,,,,,.,,,,,,.............::,’.::.,..............................’.....,..:.
:.:.:::...............4s.. ..#.!. .. ...../... ....l... ....l......1.l.l.ll.l...l.l.z
~ TyFA
~~~~ Lwtrh-!-““~ii”““:., 11505i~ I I I ‘!1”3’a’”F’ol’wzP*o~o ‘“., 29
;4345 /
;55 50 45 +135b ~ 00 ~.;..,,’. ‘%000* &
LEGEND
A-K 6-HR BEST TRACKPOSITIONa SPEED OF MOVEMENT(KT)b INTENSITY(KT)
POSITIONAT KX/OOOOZ~ :0 TROPICALDISTURBANCE● ● ● TROPICALDEPRESSION---- TROPICALSluwl— TYPHOON
$SUPER TYPHOONSTARTSUPER TYPHOONEND
mExmATRoPIcALSUBTROPICAL
* *aI DISSIPATINGSTAGEFIRST WARNINGISSUED
: LAST WARNINGISSUED
,..’
,, ,......................... :.,,,...,......................
25
20
~15
10
s
EQ
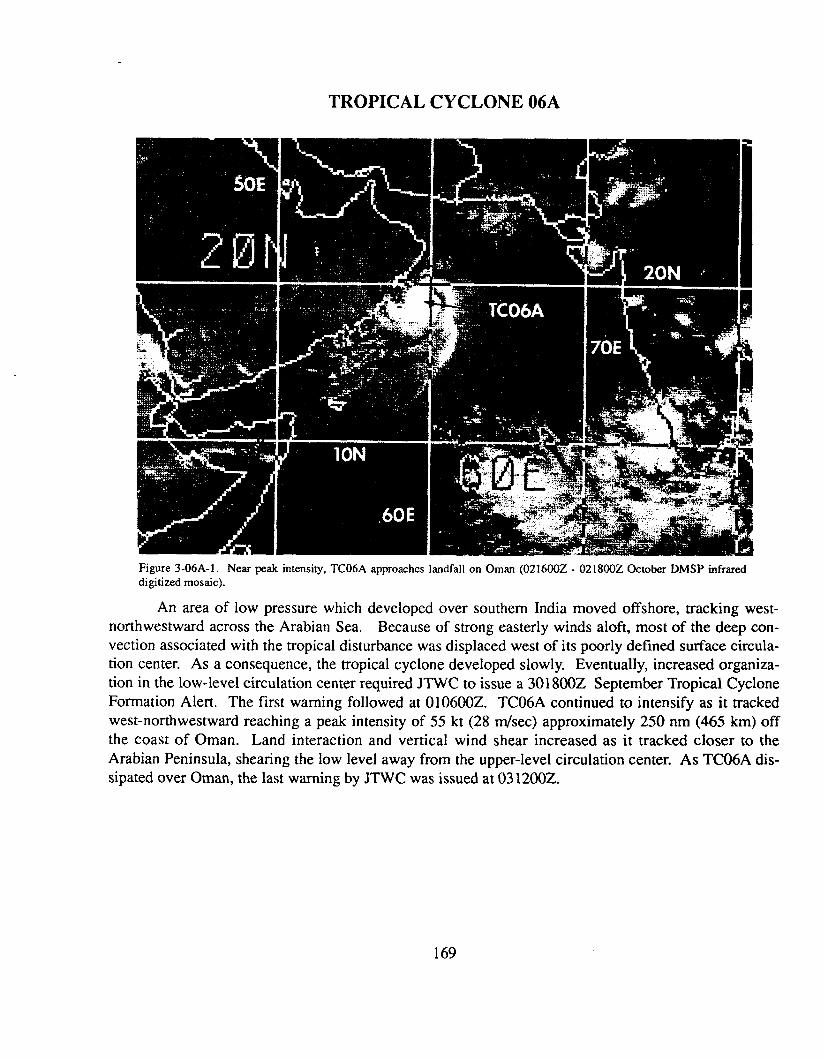
TROPICAL CYCLONE 06A
Figure 3-06A-1. Near peak intensity, TC06A approaches landfall on Oman (0216002 -0218002 October DMSP infrareddigitized mosaic).
An area of low pressure which developed over southern India moved offshore, tracking west-northwestward across the ArabIan Sea. Because of strong easterly winds aloft, most of the deep con-vection associated with the tropical disturbance was displaced west of its poorly defined surface circula-tion center. As a consequence, the tropical cyclone developed slowly. Eventually, increased organiza-tion in the low-level circulation center required JTWC to issue a 3018002 September Tropical CycloneFormation Alert. The first warning followed at 0106002. TC06A continued to intensify as it trackedwest-northwestward reaching a peak intensity of 55 kt (28 rn/see) approximately 250 nm (465 km) offthe coast of Oman. Land interaction and vertical wind shear increased as it tracked closer to theArabian Peninsula, shearing the low level away from the upper-level circulation center. As TC06A dis-sipated over Oman, the last warning by JTWC was issued at 0312002.
169
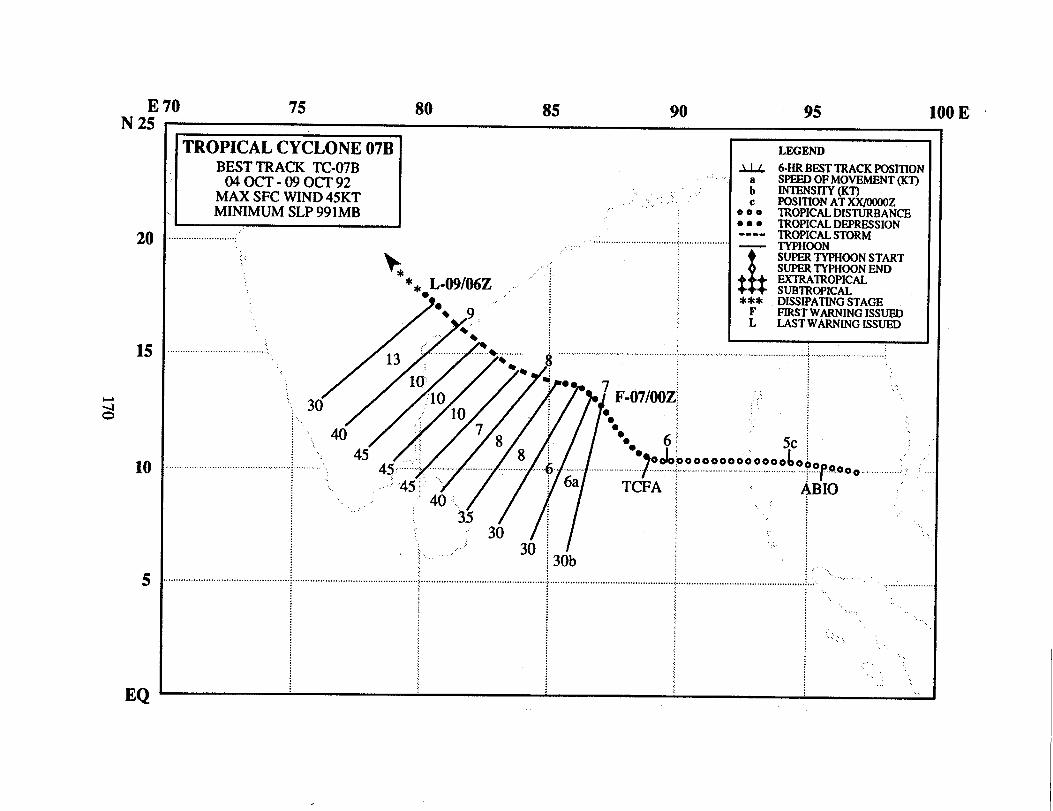
000
:@
.j.............................................. ..$................................
V4*
;m
~::
....“.:o0:
.....?....o...;
..........................................g
~+:
*:4%
P-1
1;+
~;&<=
\“..”-”.
-’.-’’-’’.’’..’.’...
-.......m<
#..
..............
,..,
‘\i
\,~.......
\i
.“””~
~
\““””x:”””’:”:~
ix”
.....~
~~“““”’’”’””’””’
\‘q
.,..’X
‘“’””’.....................
.....................................
,...,
zla
170
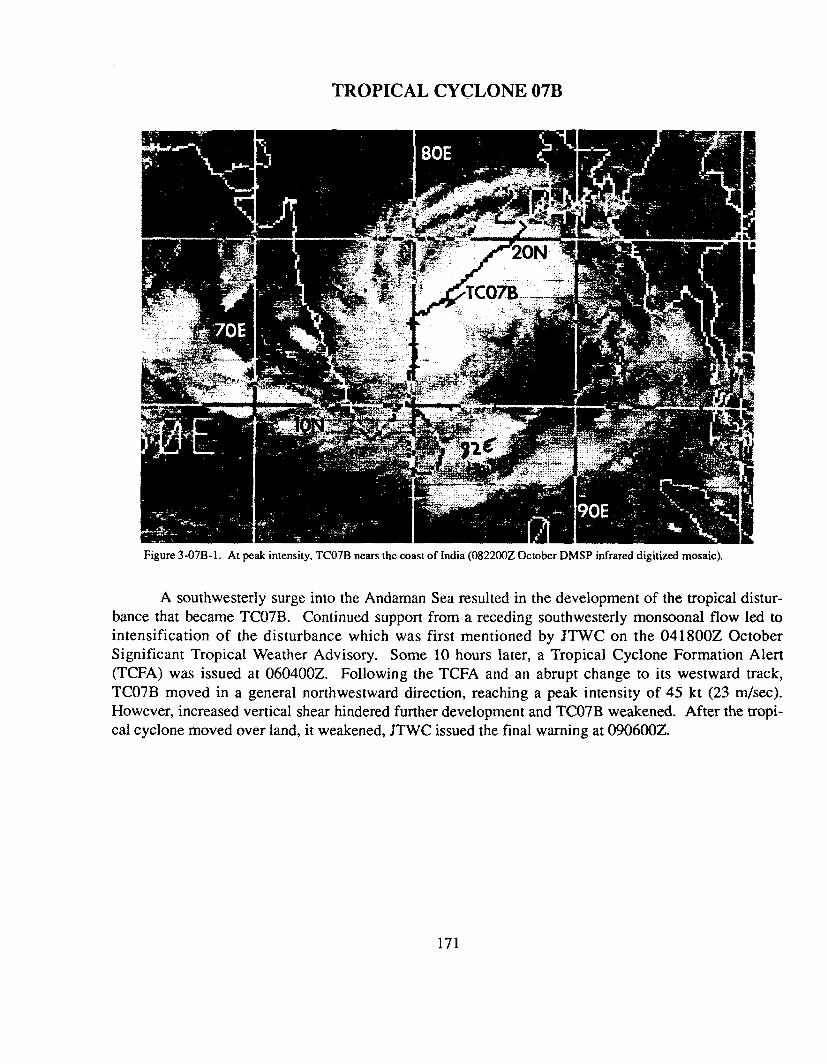
TROPICAL CYCLONE 07B
Figure 3-07B-1. At peak intensity, TC07B nears the coast of India (082200Z October DMSP infrared digitized mosaic).
A southwesterly surge into the Andaman Sea resulted in the development of the tropical distur-bance that became TC07B. Continued support from a receding southwesterly monsoonal flow led tointensification of the disturbance which was first mentioned by JTWC on the 041800Z OctoberSignificant Tropical Weather Advisory. Some 10 hours later, a Tropical Cyclone Formation Alert(TCFA) was issued at 060400Z. Following the TCFA and an abrupt change to its westward track,TC07B moved in a general northwestward direction, reaching a peak intensity of 45 kt (23 m/see).However, increased vertical shear hindered further development and TC07B weakened. After the tropi-cal cyclone moved over land, it weakened, JTWC issued the final warning at 090600Z.
171
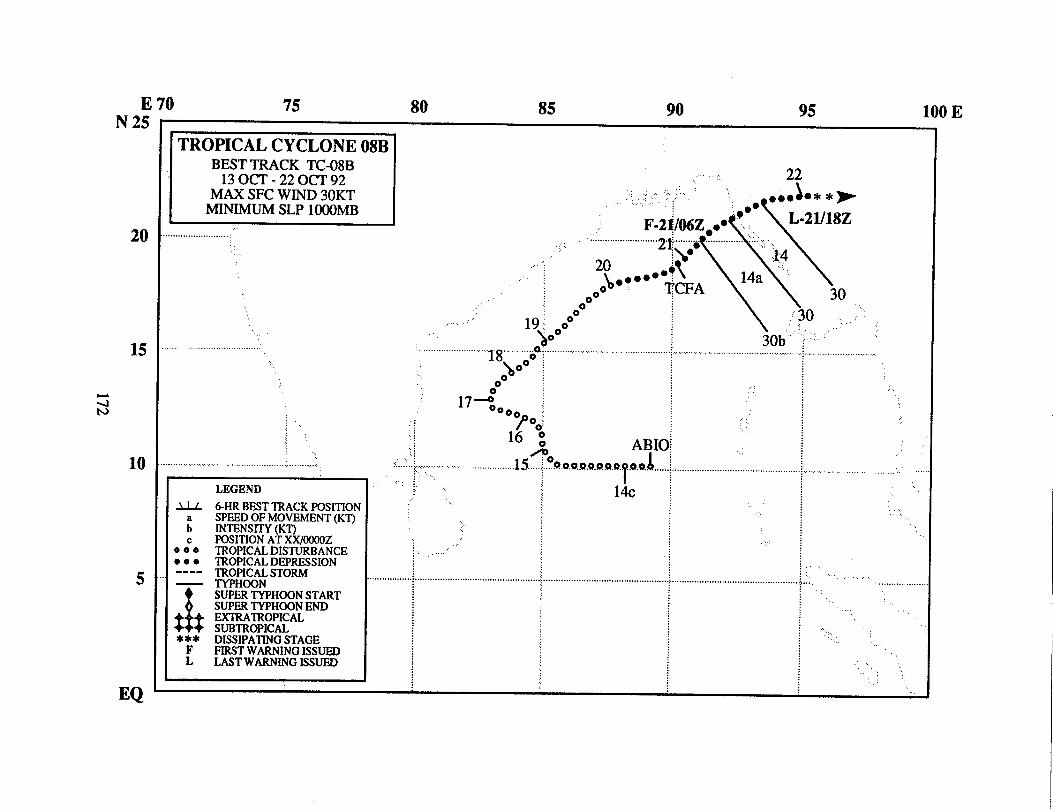
E 70 75 80 85 90 95 100 EN 25
20
15
10
5
EQ
TROPICAL CYCLONE 08BBESTTRACK TC-08B
130CT-220CT92MAXSFC WIND 30KT
MINIMUMSLP 1000MB
.,:
. .. ....................
LEGEND
U 6-HR BEST TRACKPOSITIONSPEED OF MOVEMENT(KT)
: INTENSITY(XT’)POSITIONAT XX/OOOOZ
O;O TROPICALDISTURBANCE● ● ● TROPICALDEPRESSION---- &O;I&A; STORM
!
— SUPERTYPHOONSTARTSUPERTYPHOONEND
$%EXTRATROPICALSUBTROPICAL
*** DISSIPATINGSTAGEFIRSTWARNINGISSUED
[ LAST WARNINGISSUED
...” ... 22‘.;.. .. ... .
i:,.:..:,:. .:, ● OO ●**>1,900
F-2 062 ●. .... L-21/18Z.::..:.......................2. ,.....*‘ ............ “i’.:,..,,
20,0(““’.+\
~4..,:.~o. ”’”; .F~ 14a ~~
~oo 30Oo
19j 00..
::.._...............,...18,.._,,..J=o....... . .\oo” ~o
17-::oe ~.. /00..; 16 $
ABIO.:..,,:4:‘o O,v Q.o.o.a.o. .0.0.. ......................15.. ...... ~......... .. ....... ..;......:’
) ... 14C
job ,
. . .,, ,,,
) .,:””.,,
. ..
,.
.... .... ....
.,.
TROPICAL CYCLONE 08B
Figure 3-08B-1. Deeheavy rains accompanylandfall in BangladeshDMSP infrared digitize
!p convect‘TC08B as(2102OOZ
d mosaic).
ion andit nears
October
Although the tropical disturbance that became TC08B was first mentioned on the 131800Zoctober Significant Tropical Weather Advisory, noticeable development did not occur until a weeklater, at which time a Tropical Cyclone Formation Alert was issued by JTWC at 2022 15Z. The firstwarning followed at 2106002 when satellite imagery indicated an increase in the amount of cold cloudtops near the cloud system center and improved overall convective organization. TC08B made landfallshortly thereafter on the southern coast of Bangladesh on 21 October. The final warning was issued byJTWCat211 8002 as the weak tropical cyclone dissipated over land.
173
E 70 75 80 85 90 95 100 EN 25
20
15
zA
10
5
EQ
TROPICAL CYCLONE 09BBESTTRACK TC-09B
31 OCT -08 NOV92MAX SFC WIND55KTMINIMUMSLP 984MB
........................,..,:::.
‘,...
; ...; .,; .,~ ,.,
.. .. .,...........,..,,.,
abc
*OO● **----
8
$%$***
:
SUBTROPICALDISSIPATINGSTAGEFIRSTWARNINGISSUEDLASTWARNINGISSUBD
j’”#“”\8.:::,:
,..
...;..,, ,,...,
..,,:,,...,.... ... ......,,
....,
.,
.!....,..,,,, . . . . . . . . . ,,, ,, .<,,,,,, .,, ,, ..,...,, . . . . . . . . . . . . ,, ..,,,,.,,,, ,,, ,,, ,
,:.: :, .,....,.............. ... ..........
:,:
.. . ,..,,,.,,,,,,,,.,,,,,..,.’.,
... .............. ....:...
,,
,...
TROPICAL CYCLONE 09B
Figure 3-09B-1. TC09B at peak intensity(05 I048Z November DMSP visualimagery).
The tropical disturbance ,that became TC09B was fwst identified on the 01 1800Z NovemberSignificant Tropical Weather Ad~isory by JTWC as a broad area of convection in the Bay of Bengal.As the tropical disturbance tracked north-northwestward, its convection increased in amount and organi-zation. JTWC issued a Tropical Cyclone Formation Alert at 0221002, and the first warning at0300002. Intensification continued until the tropical cyclone stalled on 5 November. With increasingwind sheer aloft over the cyclone, a weakening trend set in on 6 November which continued untilTC09B dissipated over water two days later. The final warning was issued by JTWC at 0718002.
175
.
..
G‘“’
,.,,,,.’,.
0..’”
0.
.,
eo0..
6:G
00
-a
.s.................:1
,.......................................
................................................................. .;!is$:fii;*
sg;&
g:e<
:..:
>;
m-;
*Z:
md
...........................................................0:
m;
...
-.*
ow~:
ii~:!-!:
m—
m%
o,.
““;,;
om
o~
..........................b..:-...
?........a........................?
v)o
176
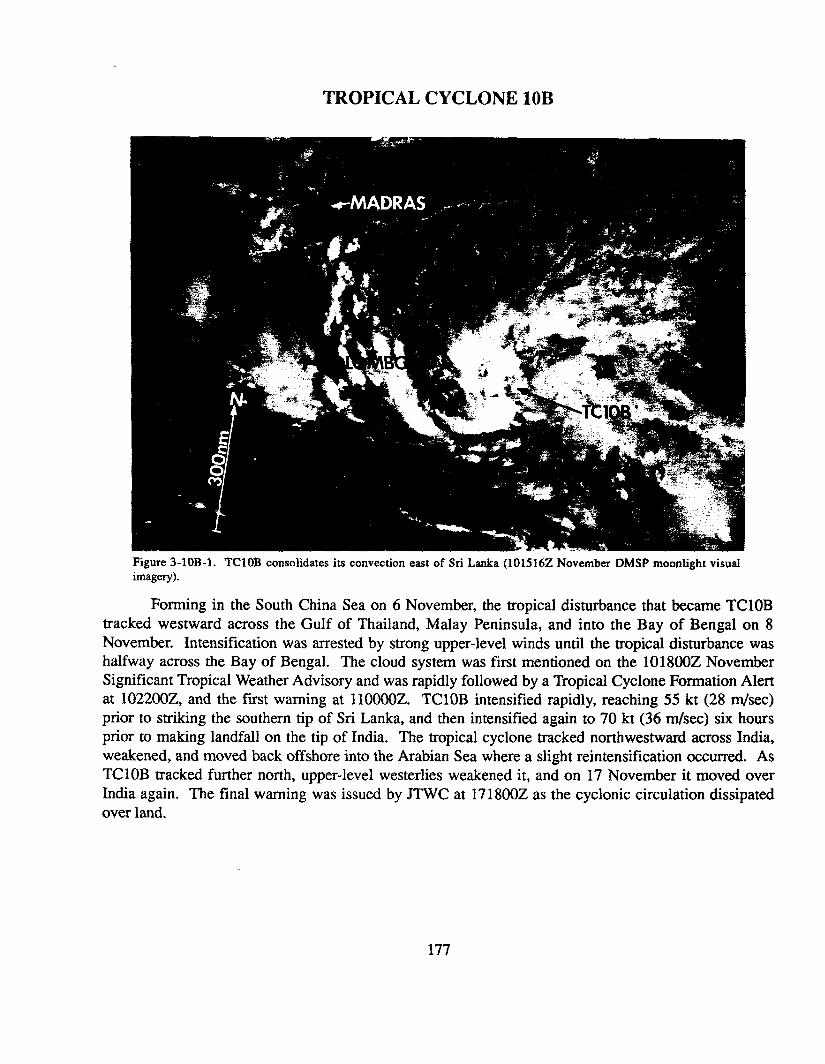
TROPICAL CYCLONE 10B
Figure 3-1 OB-1. TC1OB consolidates its convection east of Sri Lanka (1015 16Z November DMSP moonlight visualimagery).
Forming in the South China Sea on 6 November, the tropical disturbance that became TC1OBtracked westward across the Gulf of Thailand, Malay Peninsula, and into the Bay of Bengal on 8November. Intensification was arrested by strong upper-level winds until the tropical disturbance washalfway across the Bay of Bengal. The cloud system was first mentioned on the 1018OOZNovemberSignificant Tropical Weather Advisory and was rapidly followed by a Tropical Cyclone Formation Alertat 1022OOZ,and the fiist warning at 11000OZ. TC1OB intensified rapidly, reaching 55 kt (28 m/see)prior to striking the southern tip of Sri Lanka, and then intensified again to 70 kt (36 m/see) six hoursprior to making landfall on the tip of India. The tropical cyclone tracked northwestward across India,weakened, and moved back offshore into the Arabian Sea where a slight reintensification occurred. AsTC1OB tracked further north, upper-level westerlies weakened it, and on 17 November it moved overIndia again. The final warning was issued by JTWC at 171800Z as the cyclonic circulation dksipatedover land.
177

E 70N 10
zm 5
EQ
75 80 85 E;..’:’.
LEGEND
& 6-HR BEST TRACK POSITION;.:, SPEED OF MOVEMENT (K’I’)
25 /}: : INTENSITY (KT)
FOSITION AT XX/OOOOZ0:0 TROPICAL DISTURBANCEc ● ● TROPICAL DEPRESSION---- TROPICAL STORM— TYPHOON
L-03/18ZSUPER TYPHOON STARTSUPER TYPHOON ENDEXTRATROPICAL
\**SUBTROPICAL
*Y DISSIPATING STAGEFJRST WARNING ISSUEDLAST WARNING ISSUED
4
~....................
8m 35
~op...$~*000
F-30/i2Z 30bABIO
TROPICAL CYCLONE 11A :BESTTRACK TC-11A
29 NOV -04 DEC92MAX SFC WIND50KT ~MINIMUMSLP987MB :
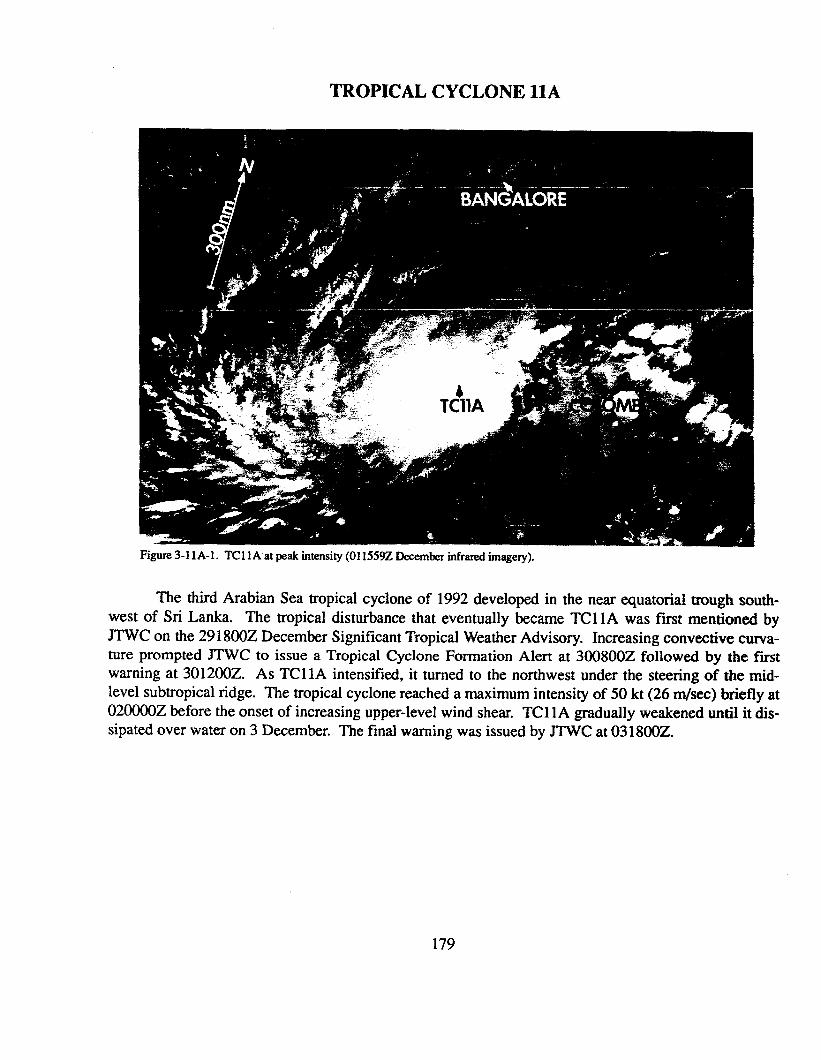
TROPICAL CYCLONE 11A
Figure 3-1 1A-1. TC1 lAat peak intensity (011559Z December infrared imagery).
The third Arabian Sea tropical cyclone of 1992 developed in the near equatorial trough south-west of Sri Lanka. The tropical disturbance that eventually became TC 11A was first mentioned byJTWC on the 2918002 December Significant Tropical Weather Advisory. Increasing convective curva-ture prompted JTWC to issue a Tropical Cyclone Formation Alert at 300800Z followed by the fwstwarning at 3012002. As TC 11A intensified, it turned to the northwest under the steering of the mid-level subtropical ridge. The tropical cyclone reached a maximum intensity of 50 kt (26 r@ec) briefly at020000Z before the onset of increasing upper-level wind shear. TC11A gradually weakened until it dis-sipated over water on 3 December. The final warning was issuedbyJTWCat0318002.
179
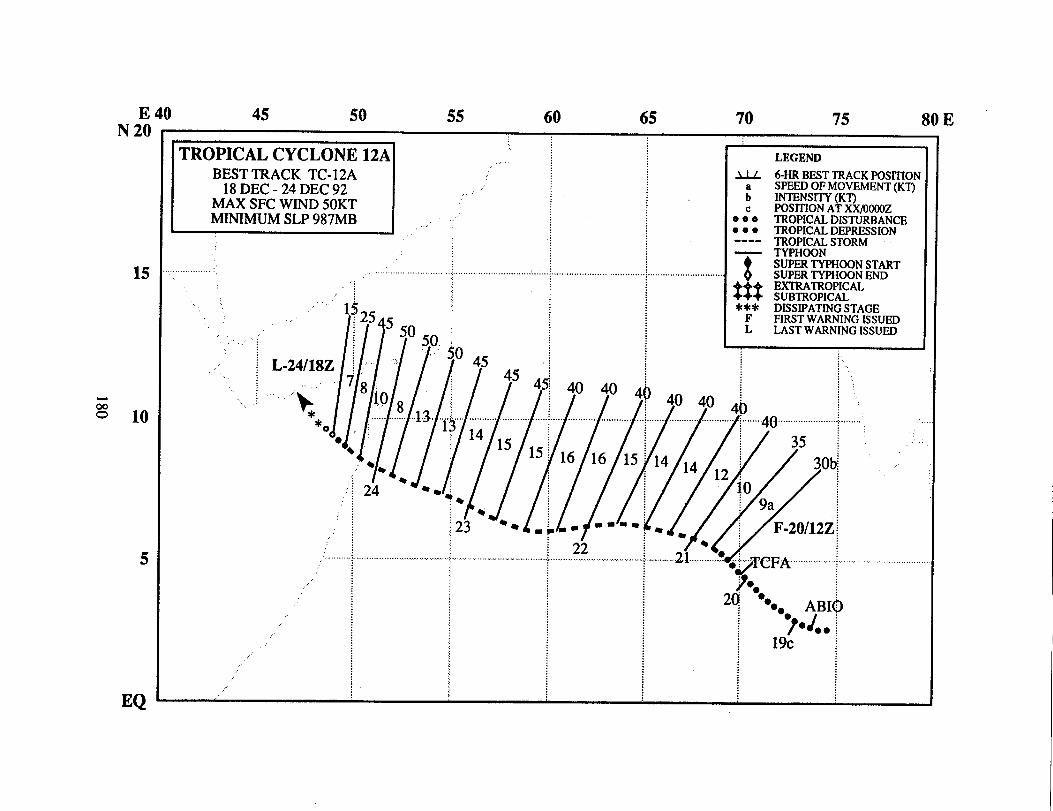
E 40 45 50 55 60 65 70 75 80 EN 20
15
@$ 10
5
EQ
TROPICAL CYCLONE 12ABESTTRACK TC-12A
18DEC -24 DEC 92MAXSFC WIND50KTMINIMUMSLP 987MB 1.
i, I’r
LEGEND
abc
000● om----
!
SUPERTYPHOONSTART. .:.. ....................... ... ............. SUPER TYPHOON END.:
ttEXTRATROPICALSUBTROPICAL
*** DISSIPATING STAGEF
‘“’” #;545qn :FIRST WARNING ISSUED
Ii/f
.: ,.. ...,.”
.............’................ ... . ....... ..
1:L
/j//LAST WARNING ISSUED
‘“ 50. :
//// ‘
““” 50 45 : 1! L-24/18Z ] t/:/ “’ ,
‘8,9 ~ ~ fl .~ ....~ .....][ ....p .....~ ......~<..40.. . ...............~.'..
.,
...... .............
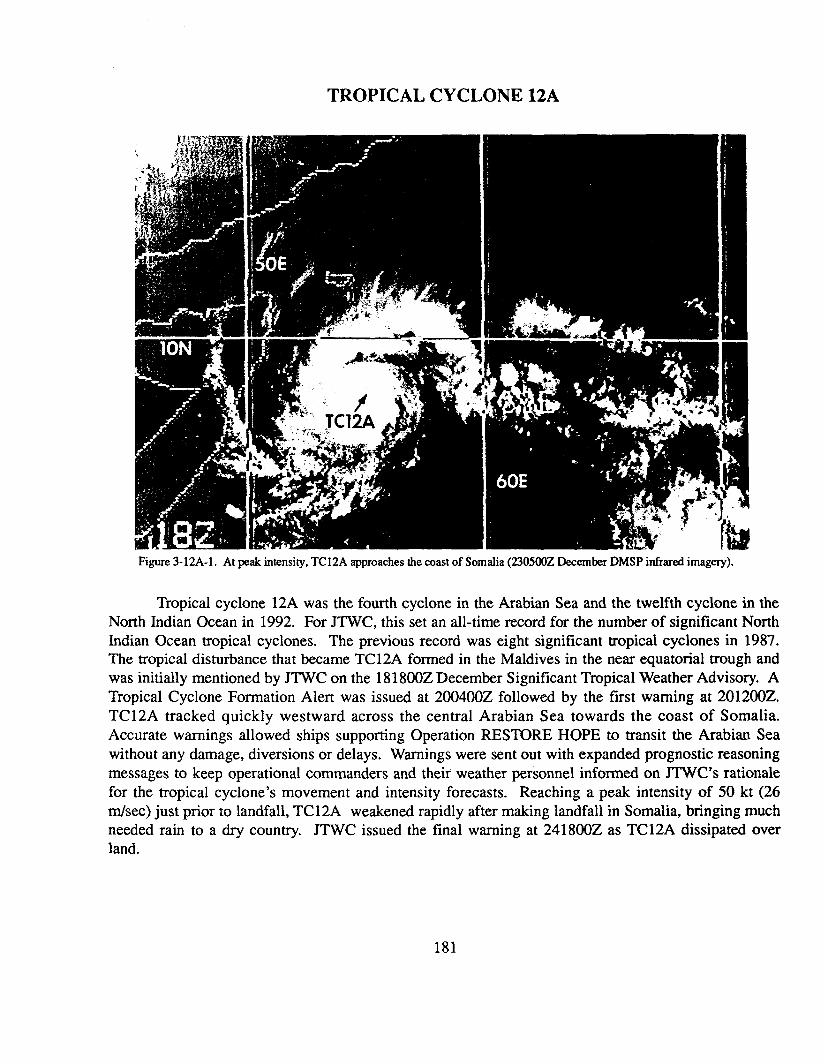
TROPICAL CYCLONE 12A
Figure 3-12A-1. At peak intensity, TC12A approaches the coast of Somalia (230500Z December DMSP infrared imagery).
Tropical cyclone 12A was the fourth cyclone in the Arabian Sea and the twelfth cyclone in theNorth Indian Ocean in 1992. For JTWC, this set an all-time record for the number of significant NorthIndian Ocean tropical cyclones. The previous record was eight significant tropical cyclones in 1987.The tropical disturbance that became TC12A formed in the Maldives in the near equatorial trough andwas initially mentioned by JTWC on the 181800Z December Significant Tropical Weather Advisory. ATropical Cyclone Formation Alert was issued at 200400Z followed by the first warning at 201200Z.TC12A tracked quickly westward across the central Arabian Sea towards the coast of Somalia.Accurate warnings allowed ships supporting Operation RESTORE HOPE to transit the Arabian Seawithout any damage, diversions or delays. Warnings were sent out with expanded prognostic reasoningmessages to keep operational commanders and their weather personnel informed on JTWC’S rationalefor the tropical cyclone’s movement and intensity forecasts. Reaching a peak intensity of 50 kt (26
@see) just prior to landfall, TC12A weakened rapidly after making landfall in Somalia, bringing muchneeded rain to a dry country. JTWC issued the final warning at 241800Z as TC12A dissipated overland.
181
Intentionally left blank
182
4. SUMMARY OF SOUTH PACIFIC ANDSOUTH INDIAN TROPICAL CYCLONES
4.1 GENERAL
On 1 October 1980, JTWC’S area of respon-
sibility (AOR) was expanded to include the
Southern Hemisphere from 180° east longitude
westward to the coast of Africa. Details on
Southern Hemisphere tropical cyclones and
JTWC warnings from July 1980 through June
1982 are contained in Diercks et al. (1982) andfrom July 1982 through June 1984, in Wirfeland Sandgathe (1986). Information on SouthernHemisphere tropical cyclones after June 1984can be found in the applicable Annual TropicalCyclone Report. The Naval WesternOceanography Center (NWOC) Pearl Harbor,HIissues warnings on tropical cyclones in theSouth Pacific east of 180° east longitude.
In accordance with CINCPACINST3140. lV, Southern Hemisphere tropicalcyclones are numbered sequential] y from 1 Julythrough 30 June. This convention is establishedto encompass the Southern Hemisphere tropicalcyclone season, which primarily occurs fromJanuary through April. There are two oceanbasins for warning purposes - the South Indian(west of 135° east longitude) and the SouthPacific (east of 135° east longitude) - which areidentified by appending the suffixes “S” and“P” respectively to the tropical cyclone number.
Intensity estimates for Southern Hemispheretropical cyclones are derived from the interpre-tation of satellite imagery using the Dvoraktechnique (Dvorak, 1984) and in rare instancesfrom surface observations. The Dvorak tech-nique relates specific cloud signatures to maxi-mum sustained one-minute average windspeeds. The conversion from maximum sus-tained winds to minimum sea-level pressure isobtained from the Atkinson and Holliday (1977)relationship (Table 4-1).
4.2 SOUTH PACIFIC AND SOUTHINDIAN OCEAN TROPICAL CYCLONES
Tropical cyclone activity in 1992 (Table 4-2) which includes the period of 1 July 1991 to30 June 1992 was three above the climatologi-cal mean of 27 storms, and the third highest sea-sonal total since 1981 (Table 4-3). The above-average number of cyclones was a reflection ofvery high activity in the Southeast Pacific. Arecord thirteen cyclones developed east of 165°east longitude, 12 more than last year and 7
TABLE 4-1 ~s’u~~~
=~MINnuJu SEA-LEVELPIU2SSURE (A!L’KINSCW~ HOLLI~,1977)
MAXIMUMSUSTAINIIO MINIMUM SEA-LEVEL
w.=~~ {W
30 1000
35 99740 99445 991
50 987
55 984
60 98065 97670 972
75 967
80 963
85 958
90 954
95 948
100 943
105 938
110 933
115 927
120 922
125 916
130 910
135 906
140 898
145 892
150 885
155 879160 872165 865170 858175 851180 844
I
183
above the 1981-1992 average (Table 4-4).Tropical cyclones started in mid-September andended in early May. An unusually activeFebruary resulted in a record 11 cyclones form-ing that month, with the JTWC warning on 5cyclones for a 2-day period late in the month(Figure 4-l). Composites of the best tracks areprovided in Figures 4-2 and 4-3.
The JTWC was in warning status a total of98 days, which includes 25 days when theJTWC issued warnings on two or moreSouthern Hemisphere cyclones, 13 days withthree or more, 6 days with four or more, and 2days with five cyclones occurring simultaneous-ly. For the record, if the number of SoutheastPacific warning days were added to those of theSouthwest Pacific and South Indian Oceans, thetotal would increase from 98 to 120 days. Alltropical cyclones warnings with the exceptionof those for Tropical Cyclone 18P were preced-ed by Tropical Cyclone Formation Alerts.Tropical cyclones 06P (Val), 21P (Esau), and25P (Fran) all made it to super typhoon intensi-ty in contrast to only one during the 1991 year.
184
TABLE 4-2 SOUTH PACIFIC AND SOUTH INDIAN OCEAN 1992 SIGNIFICANT TROPICzu CYCLONES
cYcIQl&01s ----02s ----
03P Tia
04s ----
05S Graham
06P Val
07P Wasa
08P Arthur
09S Alexandra
10S Bryna
11P Betsy
12P Mark
13P ----
14P Cliff
15S Celesta16s ____
17P Daman
18P ----
19S Davilia
20S Harriet
21P Esau
22S Farida
23s Ian
24S Gerda
25P Fran*
26P Gene
27P Hettie
28s Neville
29s Jane/Irna
30P Innis
(1 July 1991
OD OF
11 Sep - 13 Sep
17 Ott - 21 Ott
15 Nov - 21 Nov
22 NOV - 26 NOV
02 Dec - 10 Dec
05 Dec - 13 Dec
05 Dec - 13 Dec
15 Dec - 17 Dec
20 Dec - 25 Dec
3(IDec - 02 Jan
06 Jan - 15 Jan
08 Jan - 10 Jan
17 Jan - 18 Jan
06 Feb - 09 Feb
11 Feb - 13 Feb
12 Feb - 14 Feb
14 Feb - 19 Feb
19 Feb - 20 Feb
23 Feb - 24 Feb26 Feb - 08 Mar
26 Feb - 06 Mar
26 Feb - 03 Mar
26 Feb - 03 Mar
27 Feb - 28 Feb
06 Mar - 17 Mar
15 Mar - 19 Mar
25 Mar - 29 Mar
06 Apr - 14 Apr
08 Apr - 18 Apr
28 Apr - 02 May
Total:
* First 2 Warnings Issued by NWOC
- 30 June 1992)
NUMBER MAXIMUM
WARNINGS SURFACES-KT (M/SRC)
5 40(21)
8 35(18)
17 95(49)
10 45(23)
19 120(62)
17 140 (72)
16 105(54)
4 45(23)
12 105 (54)
7 45(23)
19 95(49)
6 55(28)
4 35(18)
7 60(31)
5 45(23)
4 25(13)
11 85(44)
4 35(18)
3 35(18)
23 120 (62)
20 130 (67
15 120(62
13 115(60
3 35 (18
23 140(72
9 65 (33
9 50(26)
18 120(62)
23 120(62)
8 65(33)
340
ESTIMATED
(MBL
994
997
949
991
922
898
938
991
938
991
949
984
997
980
991
1003
958
997
997
922
910
922
927
997
898
976
987
922
922
976
NCYl?E:Names of Southern Hemisphere Tropical Qclones are given by the Regional WarningCenters (Nadi,Brisbane, Darwin, Perth, Reunion and Mauritius) and are appended toJTWC Warnings, when available.
185
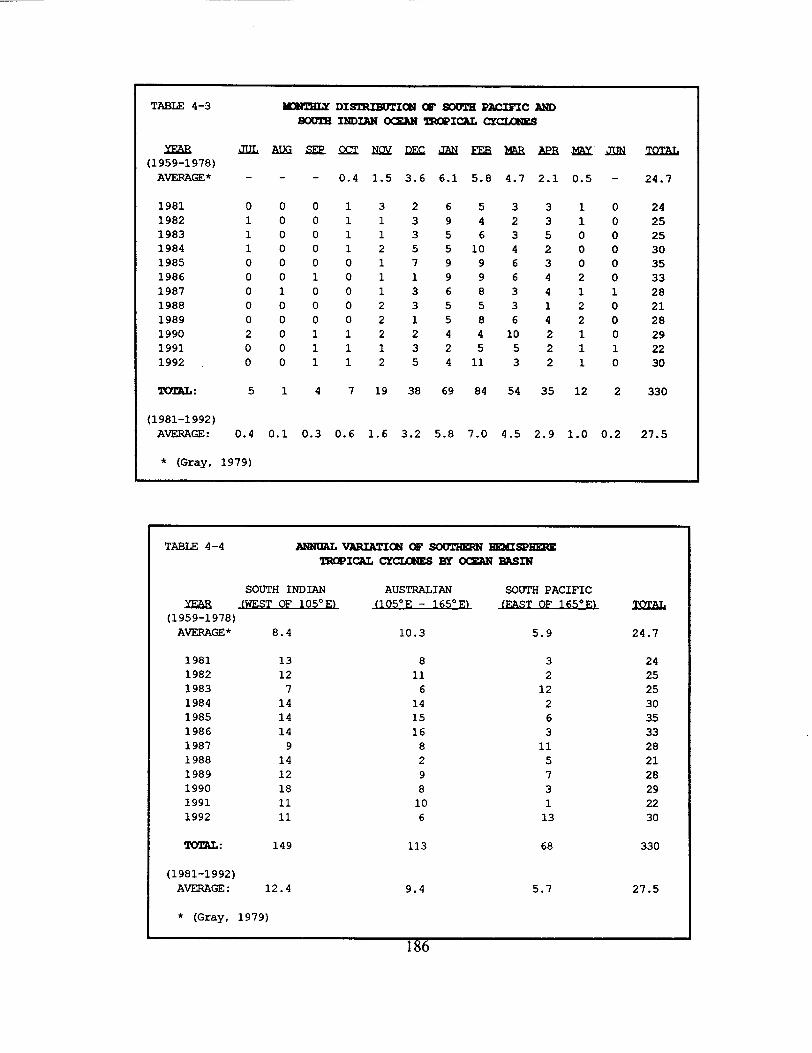
.
mBLE 4-3 ~ DISTMBUTKM ~ SOUTH PACIFIC MO~ INDIAN OmAN mcPIcAL CYuams
JIJLAL?GSEEQQ1959-1978)AVERAGE* - - - 0.4
1981 00011982 10011983 10011984 10011985 00001986 00101987 01001988 00001989 00001990 20111991 00111992 0011
Tcn!AL: 5147
1981-1992)AVERAGE: 0.4 0.1 0.3 0.6
* (Gray, 1979)
NsLi DEc JliNEEBmRE13
1.5 3.6 6.1 5.8 4.7 2.1
326533139423135635255104217996311996413683423553121586422441021325522541132
19 38 69 84 54 35
1.6 3.2 5.8 7.0 4.5 2.9
MAX ATL?N
0.5 -
101000000020112020101110
12 2
1.0 0.2
24.7
242525303533282128292230
330
27.5
SOUTH INDIAN
-M=T OF lo5 E)0
(1959-1978)AVERAGE* 8.4
1981 131982 121983 71984 141985 141986 141987 91988 141989 121990 181991 111992 11
Tonu: 149
(1981-1992)AVERAGE: 12.4
AUSTRALIAN
-(105OF _ ~650~)
10.3
8116
1415168298106
113
9.4
SOUTH PACIFICT OF 1650 ~,
5.9
321226311573113
68
5.7
24.7
242525303533282128292230
330
27.5
* (Gray, 1979)
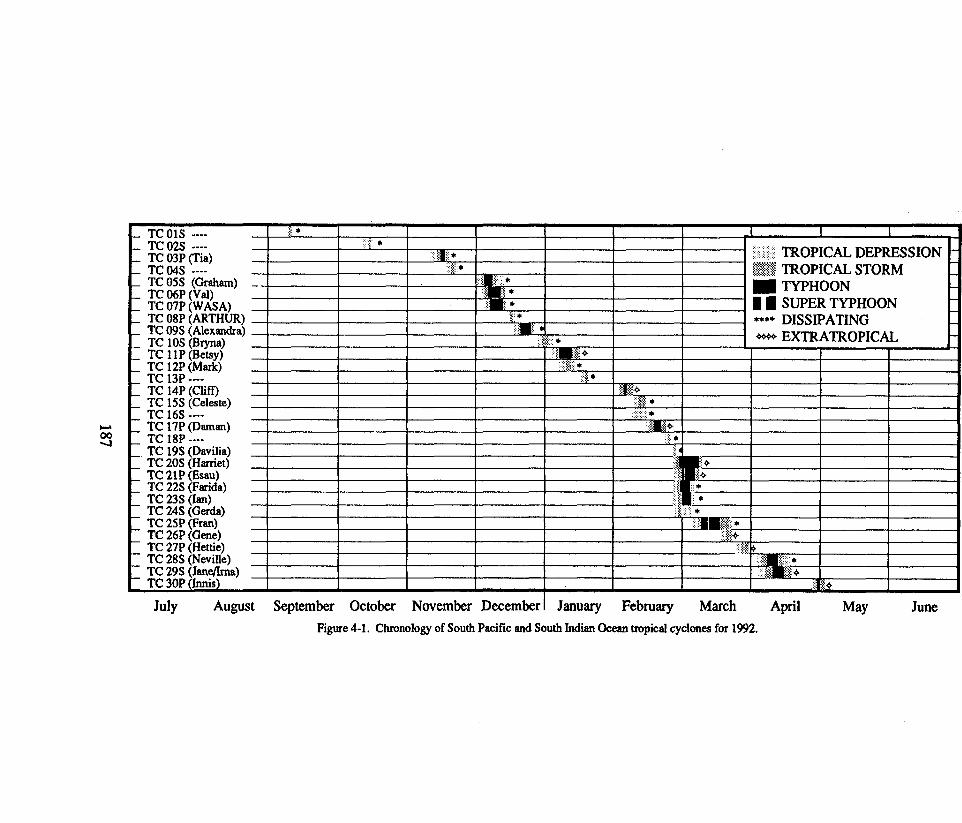
L TC 01S ---- ! “:*,::: ! ! I ! ! I i I I1 m
TC 02S ----..>,*
TC 03P (Tia)
,.,.,,,,,,.,,:.:.,,.,:
TC 04S ----; ,.,: ;.:.;:I:.Y;
*:::: &.::::fj~,*j.{:,::\:
TC 05S (Graham) _TC 06P (Val)TC 07P (WASA) .: m,
TC 08P (ARTHUR)y *
TC 09S (Alexandra)
*****
TC 10S (Brvna)& *
1+$++
TROPICAL DEPRESSIONTROPICAL STORMTYPHOONSUPER TYPHOONDISSIPATINGEXTRATROPICAL 1
TC 11P /B&yjTC 12P (Mark)TC 13P ----TC 14P (Cliff)TC 15S (Cele@e)TC 16S ----;: ~~; (Damn)
. . . .
TC 19S (Davilia)TC 20S (Harriet)TC 21P (Esau)TC 22S (Farida)TC 23S (Ian)TC 24S (GeraldTC 25P {Fran)”TC 26P(Gme)TC 27P(Hettie)TC 28S(Neville);: ;:!(J#?Jrna)
I I I I 1 I I I .; ;?4 I
July August September October November December I January Febmary March April May June
Figure 4-1. Chronology of South Pacific andSouth Indian Ocean tmpicaI cyclones for 1992.
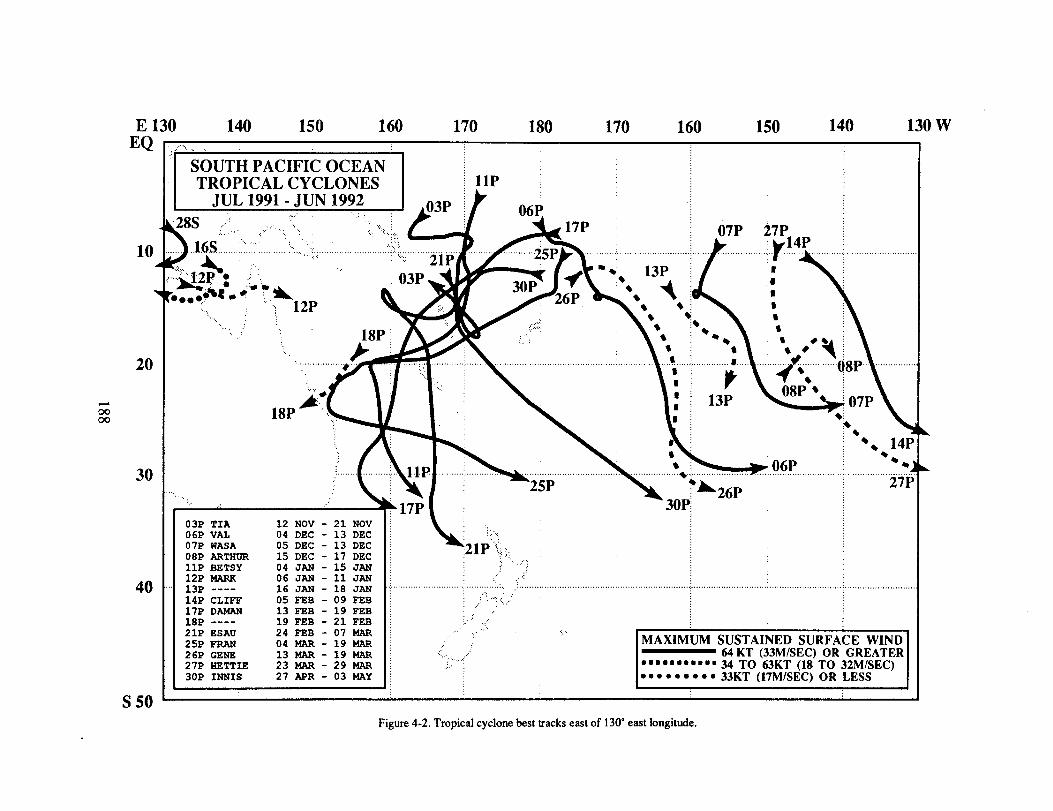
4
cm00
E 130EQ
10
20
30
40
s 50
140 150 160 170 180 170 160 150 140 130 w.,..
SOUTH PACIFIC OCEANTROPICAL CYCLONES I :11P
03P TIA 12 NOV - 21 NOV :06P VAL 04 DEC - 13 DEC ;
L “
,.,,...,,
07P WASA 05 DEC - 13 DEC j.,
08P ARTHUR 15 DEC - 17 DEC ~m ““’;fl,
11P BBTSY:,“ .,...:
04 JAN - 15 JAN ~ :’12P MARK 06 JAN - 11 JAN : ,,. ,:
13P ----., .,’
16 JAN - 18 JAN “:........... ............ ...:,, ,,,,.,.,. :.
14P CLIFF 05 FEB - 09 FEB ; :,,.,.,:,...”
17P DAMAN 13 FEB - 19 FEB ~,,., ..
18P ---- 19 FEB - 21 FEB :.,:’,.,,
21P ESAU 24 FEB - 07 MAR : ,..’. .,,25P FRAN 04 MAR- 19MAR ;26P GENE 13 MAR- 19MAR :
.:’,, .,,...,......’27P HETTIE 23 MAR- 29&4AR ~ .:.:30P INNIS 27 APR - 03 MAY : -
MAXIMUM SUSTAINED SURFACE WIND
,-nsmosm@m~34 TO 63KT (18T0 32MRIW)● 0C0OOOOO 33KT (17M/sEc) OR Lfjss
Figure4-2.Tropicalcyclone best tracks east of 13W east longitude.

●,2
.,.
:.:::...
.......:,‘...
...............‘
“”””.””’,,..
:’”.....
..... .’:
..............,..,:.:., “
“””
xk.k-~:!
,.[,
..
l..........*..i..............s....J........... .....i...............
:’,
‘x:,
....&
............................................................................
N
I !xmm
lMw
iii~
:9•~;
I*
●-’
?.
::s
g.
...........+......<
.-. ““:...............................................................................
K...........
%;
..:..,,,,.8
.......““’8,.
....,
~g~
‘i”.=..+..:%..,..,
........>”;
w
..,
2
!!!Mmhor-l
m
189

Intentionally left blank
190
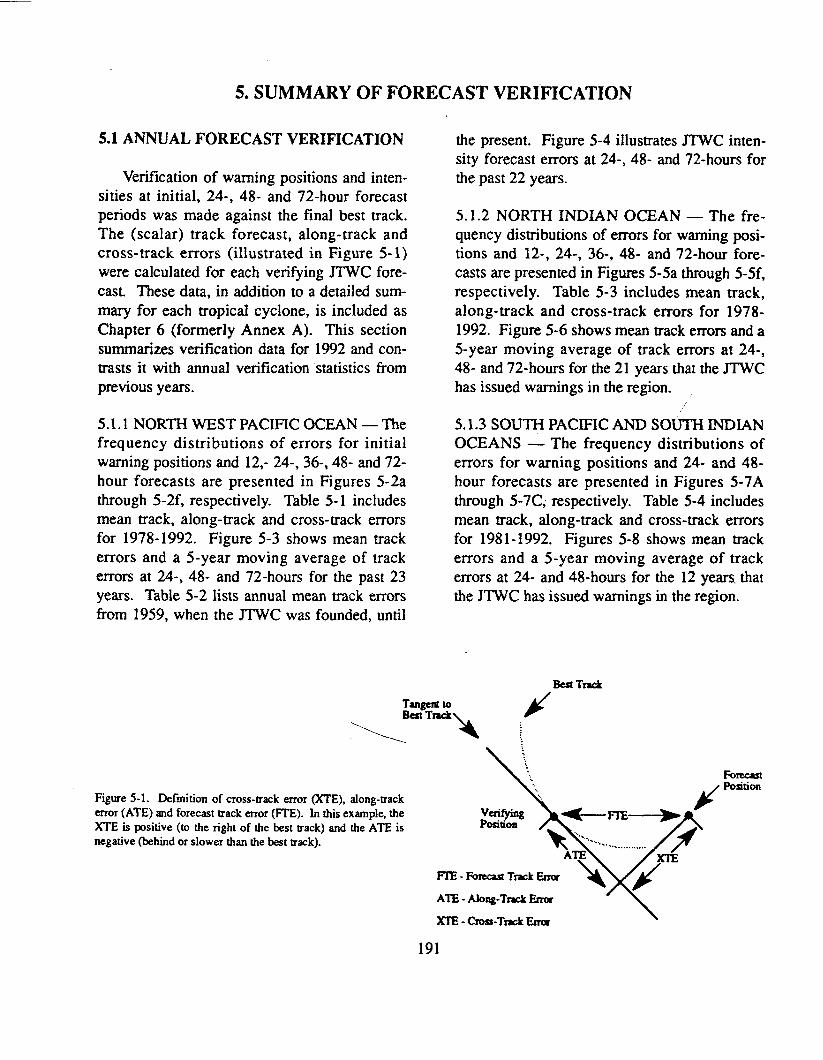
5. SUMMARY OF FORECAST VERIFICATION
5.1 ANNUAL FORECAST VERIFICATION
Verification of warning positions and inten-sities at initial, 24-, 48- and 72-hour forecastperiods was made against the final best track.The (scalar) track forecast, along-track andcross-track errors (illustrated in Figure 5-1)were calculated for each verifying JTWC fore-cast. These data, in addition to a detailed sum-mary for each tropical cyclone, is included asChapter 6 (formerly Annex A). This sectionsummarizes verification data for 1992 and con-trasts it with annual verification statistics fromprevious years.
5.1.1 NORTH WEST PACIFIC OCEAN — Thefrequency distributions of errors for initialwarning positions and 12,- 24-, 36-, 48- and 72-hour forecasts are presented in Figures 5-2athrough 5-2f, respectively. Table 5-1 includesmean track, along-track and cross-track errorsfor 1978-1992. Figure 5-3 shows mean trackerrors and a 5-year moving average of track
errors at 24-, 48- and 72-hours for the past 23years. Table 5-2 lists annual mean track errorshorn 1959, when the JTWC was founded, until
the present. Figure 5-4 illustrates JTWC inten-sity forecast emors at 24-, 48- and 72-hours forthe past 22 years.
5.1.2 NORTH INDIAN OCEAN — The fre-quency disrnbutions of errors for warning posi-tions and 12-, 24-, 36-, 48- and 72-hour fore-casts are presented in Figures 5-5a through 5-5f,respectively. Table 5-3 includes mean track,along-track and cross-track errors for 1978-1992. Figure 5-6 shows mean track errors and a5-year moving average of track errors at 24-,48- and 72-hours for the 21 years that the JTWChas issued warnings in the region.
5.1.3 SOUTH PACIFIC AND SOUTH INDIANOCEANS — The frequency distributions oferrors for warning positions and 24- and 48-hour forecasts are presented in Figures 5-7Athrough 5-7C; respectively. Table 5-4 includesmean track, along-track and cross-track errorsfor 1981-1992. Figures 5-8 shows mean trackerrors and a 5-year moving average of trackerrors at 24- and 48-hours for the 12 years. thatthe JTWC has issued warnings in the region.
BestTrack
Figure5-1.Definition of cross-uack error (X7%), along-track
error (ATE) andforecastrrack error(F’lZ).In&iiexarnpl~theXTE is psitive (to tie right of the best track) and tie ATE isnegative (behind or slower than tie best track).
Fmx4ztPosition
VaitjringPosition
-m->
Ft13-Foreust Track Emor
ATE - Along-Track Ems
XtZ - Cross-Track Ems \
191
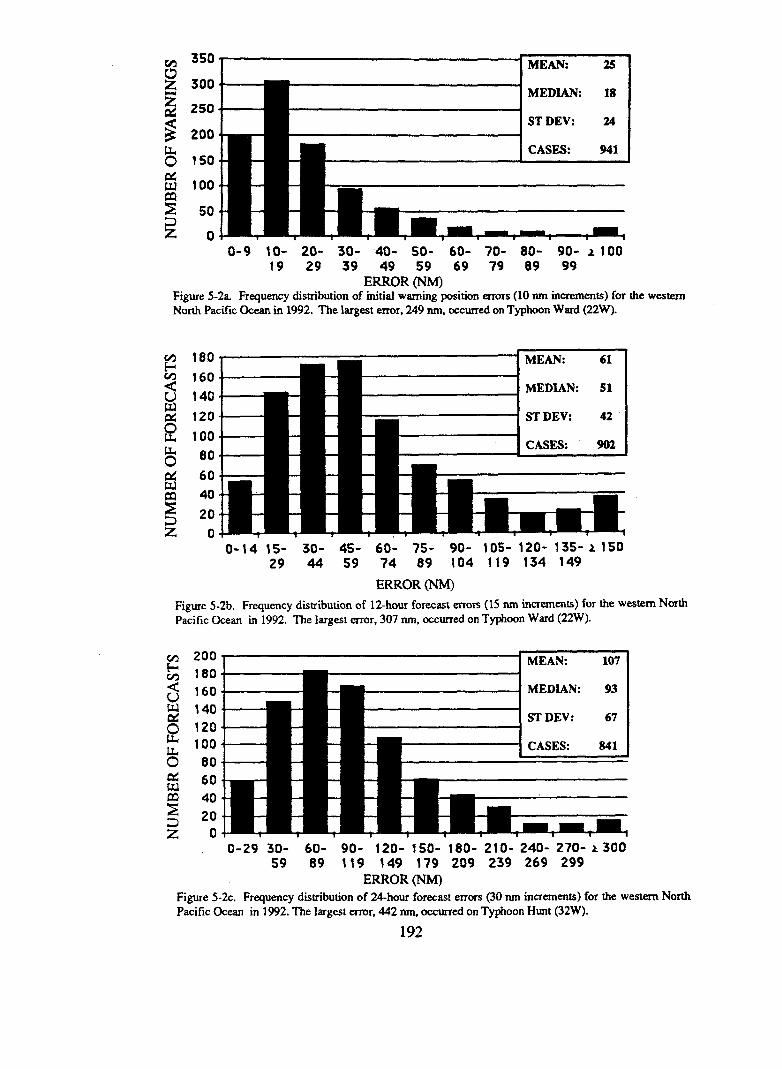
8
300
250
200
150
100
50
0
MEDIAN: 18
ST DEV: 24
CASES: 941
0-9 10- 20- 30- 40- 50- 60- 70- 80- 90- ~100t9 29 39 49 59 69 79 89 99
ERROR (NM)
Figure 5-2a Frequency distribution ofinitial warning position errors (lOrrmincrements) for theNorth Pacitlc Ocean in 1992. The largest error, 249 nm, occurred on Typhoon Ward (22W).
180
160
140
120
100
00
60
40
20
0
1 — — MEAN: 61
MEDIAN: S1
— ‘ ST DEV: 42
CASES 902I
1
1
-—t
western
0-14 15- 30- 4S- 60- 75- 90- 105- 120- 135-2150
29 44 59 74 89 104 119 134 149
ERROR QN’M)
Figure5-2b. Frequency d~tribution of 12-hour forecast errors (15 run increments) for the western North
PacificOceanin1992.Thelargesterror,307run,occurredon Typhoon Ward (22W).
200
180
160
140
120
100
80
60
40
20
0
— MEAN: 107
MEDIAN: 93
ST DEV: 67
‘ CASES: 841
0-29 30- 60- 90- 120- 150- 180- 210-240-270- L 300
59 89 119 149 179 209 239 269 299
ERROR (NM)
Figure 5-2c. Frequency distribution of 24-hourforecast errors (30 nrn increments) for the we
Pacific Ocean in 1992.Thelargesterror,442~ occurredonTyphoonHunt (32W).
Stern North
192

160
140
120
100
80
60
40
20
0
1 — - * MEAN: 160
MEDIAN: 143
ST DEV: 97
[ CASES: 733
0-44 45- 90- 135- 180- 225- 270- 315- 360- 405- ~450
89 134 179 224 269 314 359 404 449
ERROR (NM)
Figure5-2d.Frquenq disuibutimof36-hourfor==tenom (45mkmmmw) fortiewwkm NofiPacificOceanin1992.Thekugesterror,707nm,occurredonTyphoonHunt(32W).
160=C
— MEAN: 205
~ 140.
$ 120. .MEDIAN: 182
g 100”ST DEV: 12s
LL 80 s CASES: 687
0 60. LE
2 40
~ 20-
Zo0-59 60- 120- 180- 240-300- 360- 420- 480- 540- A 600
119 179 239 299 359 419 479 539 600
ERROR (NM)
Figure5-2e.Frequencydistributionof48hourforecasterrors(60nm increments)forthewesternNorthPacificOcean in1992.Thelargesterror,714run,occurredonTyphoonColleen(26W).
Ckw
g
z
140
120
100
80
60
40
20
0
1MEAN: 305
1 CASES: 568
0-89 90- 180-270- 360-450-540- 630-720-810- k 900
179 269 359 449 S39 629 719 809 899ERROR (NM)
Figure5-2f.Frequencydistributionof72-hourforecasterrors(90runincremems)forthewesternNorthPacific&ean in1992.Thelargesterror,1014nm,oc~ed onTyphoonColkn (26W).
193

rAELE5-1. INITIALWARNINGPOSITIONAND FORECAST ERRORS (NX)FOR THE WNSTERN NORTH PACIFIC 1978-1992.
NUMHER OF INITIAL NUNBER OF 24-HOUR NUMEER OF 48-HoOR NUMHER OF 72-HOURALONG CROSS
1978 696 21 556 126 71 420 2741979 695
19425
151589
295 411125
296:; 76 469 227
218
1980 590 28146 138
491366
127 86316
76 369214
244182
1981 584 25165 147 267 391
466266 230
124 80 77 3481982 786
22119
146 131 246666
334 206 219113 74 70 532 238 162
1983 445142 425
342 117342
73 253223 211
1984 611260 169 164
:: 492184
117407 259
:: 64 378263
2321985 592 18
163 131 286 363 238477 117 80
21668 336 231 153
1986 743138 241
21 645367 230 227
126 85 70 535 261 1831987 657
151 412563
394107 71
276 227465 204
1988 465134 127 389
;: 373303 198 186
114 85 :: 262 216 1701989
103 183 315 244710 20 625
159120 83 69 481 231 162
1990 794127 363 350 265
21 658177
120 81 404 2371991 835
162 138 30522 733
355 242 21196 69 U 599 185 137 97 484 287 229 146
1992 941 25 841 107 77 59 687 205 143 116 568 305 210AVERAGE
172
78-92: 676 22 568 116 79 67 436 229 158 131 334 343 237 198
Cross-track and along-track errors were adopted by the JTWC in 1986. Right-angle errors (used prior to 1986)NOTE: were recomputed as cross-track and along-track errors after the fact to extend the data base.
See Figure 5-1 for the definitions of cross-track and along-track errors.
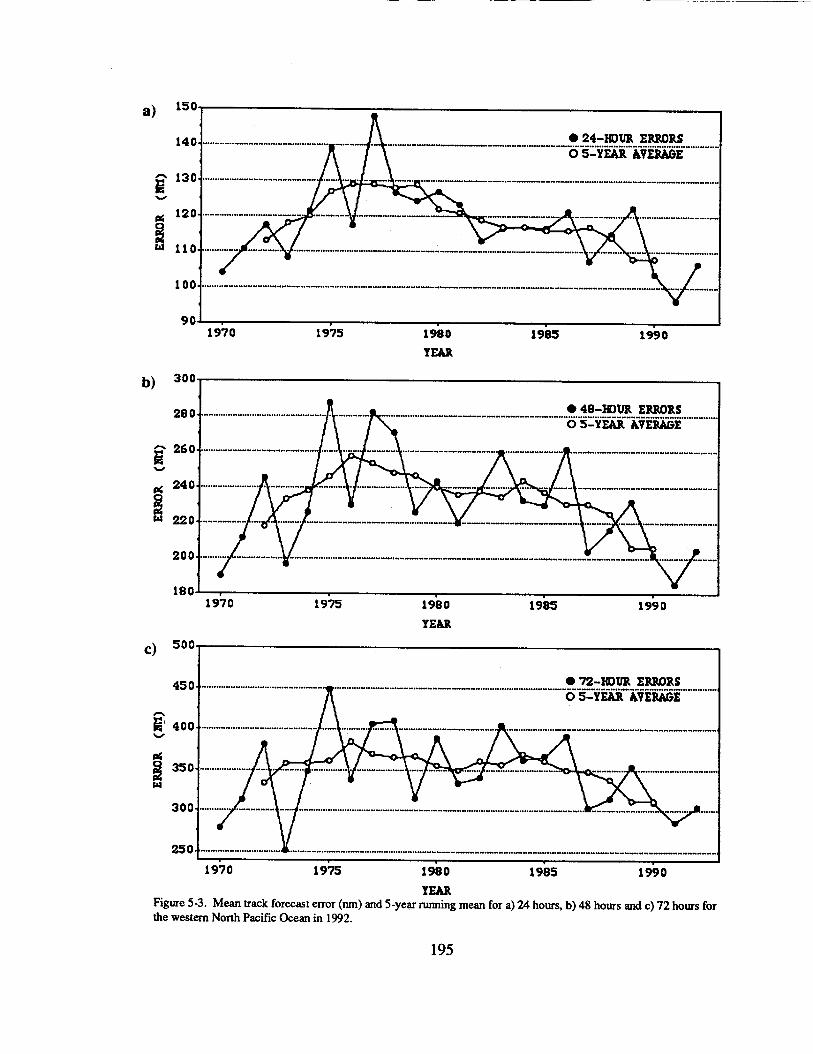
150
1404
130
120.
110.
100.
90.
300
280
260
240
220
200
180.
● 24-HOUR ERRDRS-..”..”—””” ”-”-”............”..””-“..””””..””””““””””””...O 5-YEAR AVERAGE
.- M””....””- e..””” --e”” . ------------
19?0 1975 1980 1985 1990
YEAR
● 48-HOUR ERRDRS““””--..--..---------”- ““”-”””---Bq—” ........”....-..Ms““”””””””””””..”..”,....O 5-YEAR AVERAGE
1970 1975 1980 1985 1990
YEAR
500
450- ....--”----. ... ................... . . . .. ● 72-IU)UR ER3DRS."""-"""""""-.."u".."""""-"_""""......"-...."""""""----"-w”””..........”-””““””””””_”””..-.O 5-YEAR AVERAGE
...”..- . ...”””- ”-......““””.. ”....”””..”.. ““””””””””..”.
3oo-
250 4.......... .............. .................""" ..""ee.. ".. ""- . . ..e""""---- "_"""""-"""" “-”””””””.-””-”””””””----”””e”-”””””””“---
1970 1975 1980 1985 1990
YEARFigure5-3.Mean trackforecasterror(rim)and5-yearrunningmeanfora)24hours,b)48hoursandc)72hoursforthewesternNorthPacificoceanin1992.
195
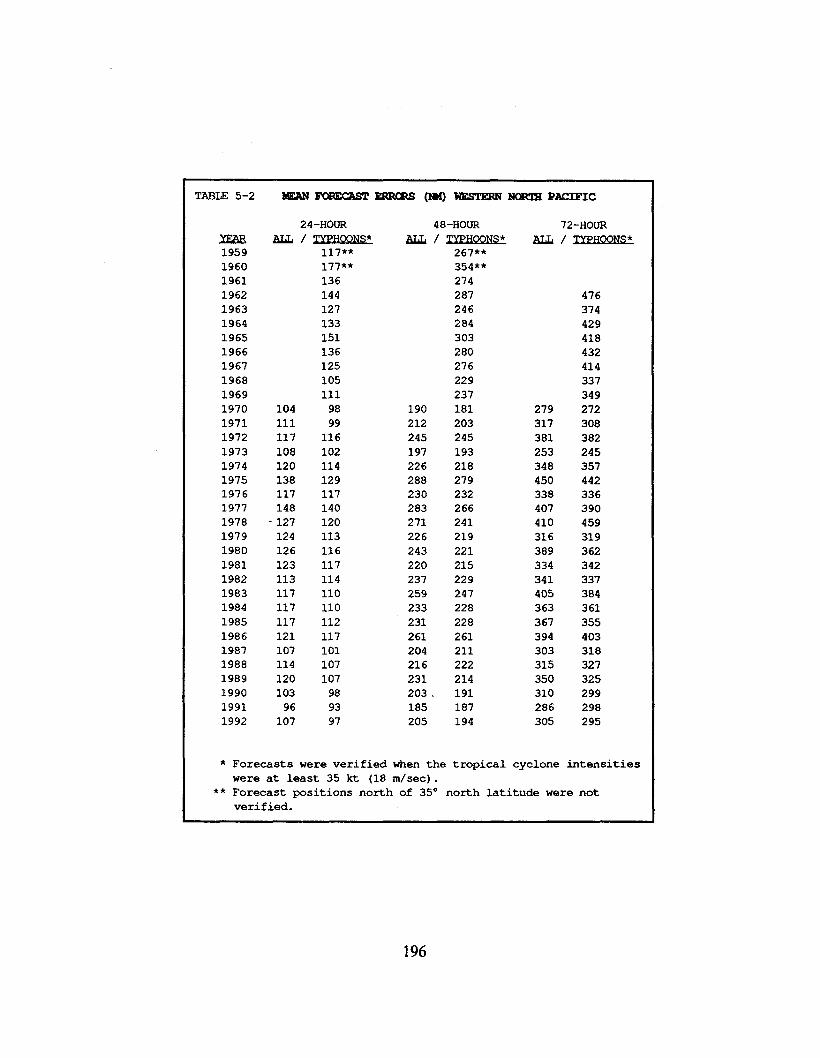
TABLE 5-2
1959196019611962196319641965196619671968196919701971197219731974197519761977197819791980198119821983198419851986198719881989199019911992
14EaNF@EcAsT EEmms(N4) WESTERN ~ PACIFIC
24-HOUR 48-HOUR 72-HOOR
ALL / ZXEMOONS* ALL / XXEH90NS * ALL/ XXFKQNL *
104111117108120138117148
127
124
126
123
113
117
117
117
121
107
114
120
103
96
107
117**177**13614412713315113612510511198 19099 212
116 245102 197114 226129 288117 230140 283120 271113 226116 243117 220114 237110 259110 233112 231117 261101 204107 216107 23198 20393 18597 205
267**
354**
274
287
246
284
303
280
276
229
237
181 279
203 317
245 381
193 253
218 348
279 450232 338
266 407
241 410
219 316
221 389
215 334
229 341
247 405
228 363
228 367
261 394
211 303
222 315
214 350
191 310
187 286
194 305
476374429418432414337349272308382245357442336390459319362342337384361355403318327325299298295
* Forecasts were verified when the tropical cyclone intensitieswere at least 35 kt (18 m/see).
** Forecast positions north of 35° north latitude were not
verified.
196
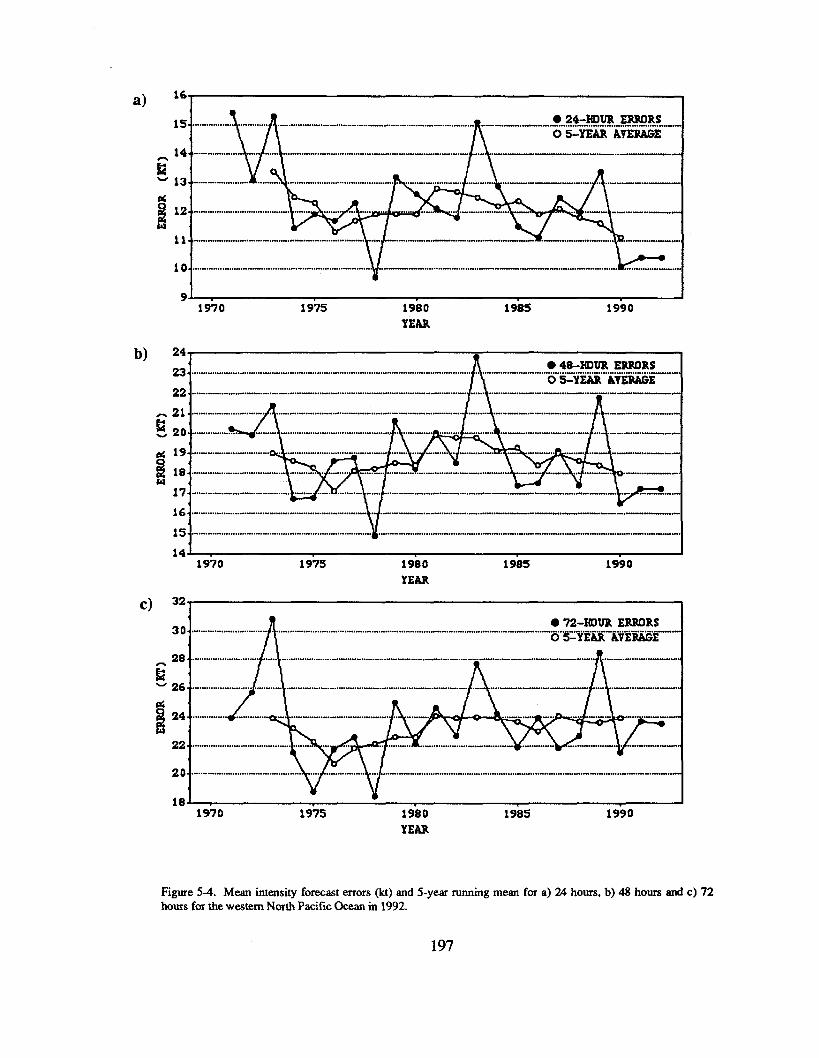
a) 16
15
10
9
● 24-IfDUR ERMRSO 5-YEAR AYERAGE
1970 1975 1980 1985 1990
YEAR
b) zd-
A23. ...................................... ................. .. . ........". ....". .. .... .. ..... ...... . . .....". .-..-.-.....-.-..-- .. ..g~g~x..y$----
22- ......... . ...".... .. . ... ..... ..".. . .. .................... ..... .. .... .... .....". . .. .... .. ...... -----------”--------------
A l\ A I........................... .............................. ................... ..............”. . ...” “.”- . . . . . . . . . . . . . . . . . ........ . “...”....-”...-.-....
--f.... ...”...”. . . . . . ““ . . . . . . . . . . . . . . . . . . . . . . . . . . . . . .-.”... . . . . . . . . . . . . . . . . . . . . . . . ...”.” . . . . . . . . . . . . . . . . . . . . . . . . . . . . . . . . . . . . . . . . . . . . . .
~1,-...............................................................” . . . . . . . . ...”. . “........”. .- . ..”-.. “...”.. . . . . “ . . . . . . . . . . ...”.--”..
,“ . . . . . . . . . . . . . . . . . . . . . . ““...... ,“ . . ...”.. . .“. ”,.. . . . . . . . . . . . . . . . . . . . . . . . . . . . ...”.....-”.....-......”...”.. —..- . . . . . ...”... . . . . . . . . . . . . . . .
. . . . . . . . . . . . . . . . . . . . . . . . . . . . . . . . . . . . . . . . . . ..”. . . . . . . . . . . ..”. . . . . .. M-u . . . . . ..u... --- . . . . ..-----. --"--- ."." ----."" . . . . . . . .
116 .".. ................... ......... .......... ................."...- .. ..,...----- ....-”.-...--.-...-.-..-.— --------
v 1
——...- .. .. .. . . . .
15 ..... ............."....................... .. ........"........."....."...---.----.---”.- ..........-...-.”---. . . . . . . . . . . ... . . . . . . .
c)
.-1970 1975 1900 1985 1990
YEAR
32-
30. .................................● 72-IUWR ERRORS
.............'..'.'.........'..."..'.'......................... ...".. ..'. ......".."...'...'..."... . ... ..os.fEn..KvEMf.-
28.
24. , . . . .. . . . . .
20. .. ...... ..... ........... ...... ..... .... .
18-19?0 1975 1980 1985 1990
YEAR
Figure 5-4. Mean intensity forecast errors (kt) and 5-year mming mean for a) M hours. b) 48 hours and c) 72
hours for the western North Pacific Ocean in 1992.
197

4s
40
35
30
25
20
15
10
5
0
●
✞ MEAN 35
MEDIAN: 26
‘ ST DEV: 34
CASES: 191
0-9 10- 20- 30- 40- 50- 60- 70- 80- 90- ~loo19 29 39 49 59 69 79 89 99
ERROR (NM)Figure 5-5a. Frequency distribution of initisl wsrning position errors (10 nm increments) for the North
IndianOcesnin1992.Thelmgesterror,306nnLwason‘K02A.
3s . MEAN: 77~ so
u MEDIAN: 70
25
20
15
10
5
0z 0-14 15- 30- 45- 60- 75- 90- 105- 120- 135-2150
29 44 59 74 89 104 119 134 149
ERROR (NM)Figure 5-5b. Frequency distribution of 12-hour forecast tm-ors (15 run increments) for the North Indian
Ocean in 1992. he l~gest error, 460 run, was on TC02A.
30~
MEAN: 12$
1- MEDIAN: 108
ST DEV: 87
CASES: 149
0-29 30- 60- 90- 120- 150- 180- 210- 240- 270- L 30059 89 119 149 179 209 239 269 299
ERROR (NM)
Figure 5-5c. Frequency distribution of 24-hour forecast errors (30 nm increments) for the North Indian
Ocean in 1992. The largest error, 592 nm, was on TC02A.
198
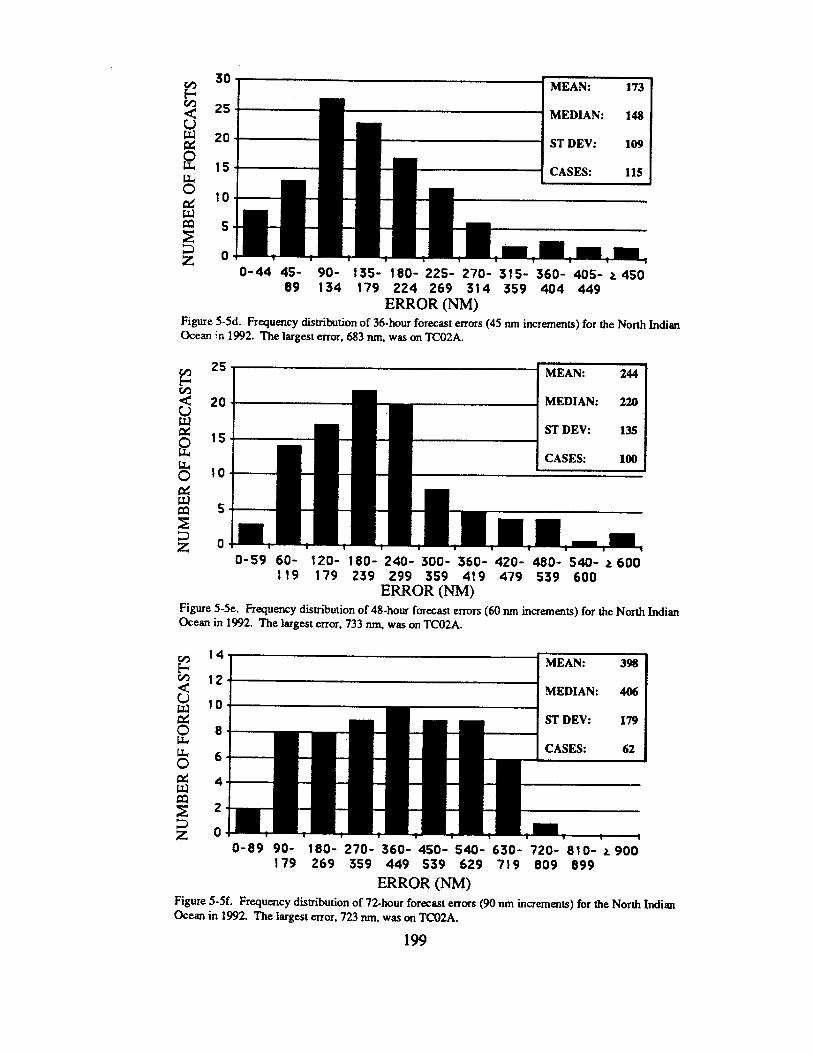
_ 30L MEAN: 173
25
20
15
10
5
c1
~ CASES: 115 I
la1 i—o-44 45- 90- 135- 180-225- 270- 315- 360- 40 S- L450
89 134 179 224 269 314 359 404 449
ERROR (NM)Figure5-5d. Frequency distribution of 36-hour forecast errors (45 run increments)for the North In—.—_.Ocesn~.n1992.The largest error, 683 run, wss on ‘fC02A.
25 MEAN: 244
20
15
!0
5
0
{. MEDIAN: 220
ST DEV: 13S Ii CASES: 100 i
0-59 60- 120- 180- 240-300- 360- 420- 480- 540- L 600t 19 179 239 299 359 419 479 539 600
ERROR (NM)Figure 5-5e. Frequency distribution of 48-hour forecast errors (60 run increments) for the North IndianOcean in 1992. The largest error. 733 ~ was on TC02A.
14-
~MEAN:~ 398
12-
; 10. ~MEDIAN: 406
~ 8.ST DEV: 179
8 6“
$4
2 2“
200-89 90- 180- 270- 360-450- 540- 630- 720- 810- L 900
179 269 359 449 539 629 719 809 899
ERROR (NM)Figure 5-5f. Frequency distribution of 72-hour forecast errors (90 nrn increments) for the North Irtdkn
Ocesn in 1992. The lsrgest error, 723 nm, was on TC02A.
199

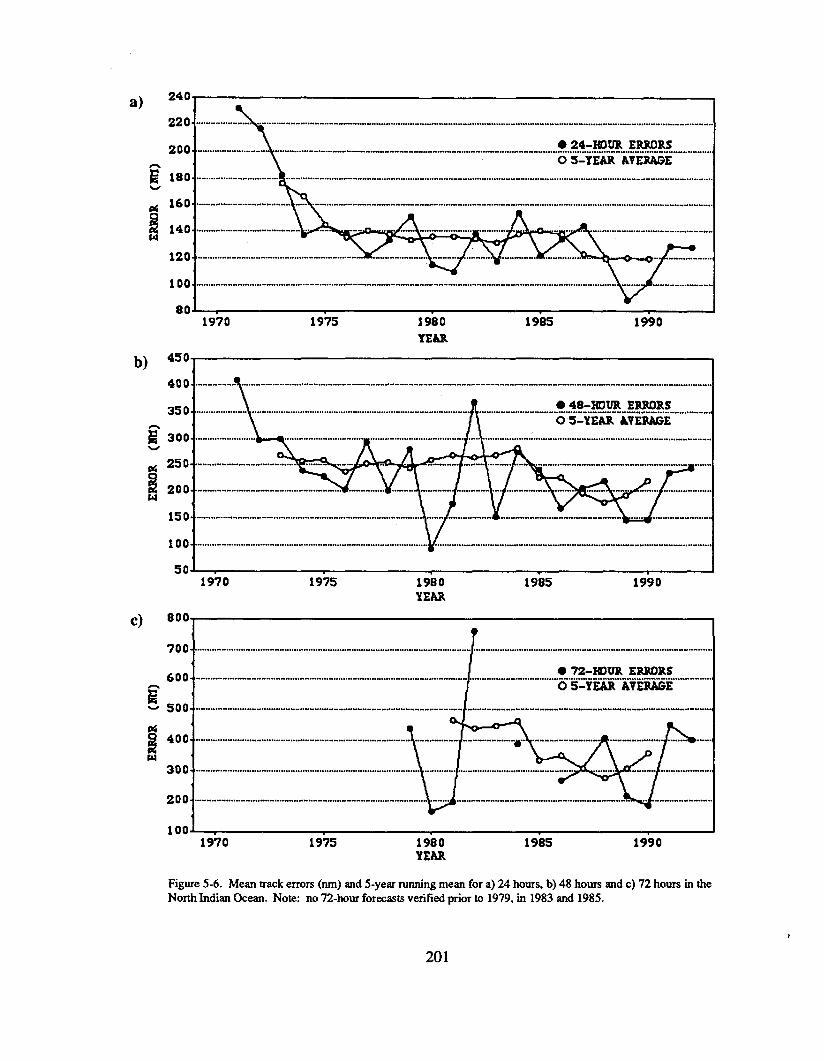
a)
b)
c)
240-
\220. . ... ................ ..-.--”---..-..----”..- —M””” ......-”” ..”” ””-.” w”..--””””----.. -..--w - ““ . . ... ........... ... ... ......... ......... . ..”“ -..
2001 \
● 24-HOUR ERRORS........””””-”“--..”"......................".."-----Q""""""-------"""--"e"H..""""""e"““””-B........--”-”....““..””””..””..””-”-”..”.,....0 5-YEAR ILYERAGE I
180.
160.
i20f .......""..."" . . . ... . .........................."..-
100.
450
400
350
300
250
200
150
100
50
1970 1975 1980 1905 1990
WAR
● 48-IKNJR ERRORS
O 5-YEAR AVERAGE
19’70 1975 1980 1985 1990YEAR
800-9
7oo- ...- ....-..............---"-"-- ............- ....-..-"-------"-----"----"------ .---"---.,-------"" ......"...---"------- ........."-------------
600.0 72-IKXIR ERRDRS
......”” .......””---- ““””” ”””,. . ................””””””-..””””O 5-YEAR kVERAGE
500. $..-.-....-.-..-.-..""---......"----""--------------"--
400. ..”” .....”” ””....” ..................”..””.. . . ....... . . ......... . ... .
300. ....”.........”.. . ..-”..””..................”....”........................... .. “....”,.”””””.,
200. ----"--"..- ...........--.-------------"-------"""-"-
1oo-1970 1975 1980 1985 1990
YEAR
Figure 5-6. Mean track errors (rim) and 5-yez running mean for a) 24 hour% b) 48 hours and c) 72 hours in theNorth Indian Ocean. Note: no 72-hour forecasts verified prior to 1979, in 1983 and 1985.
1
201
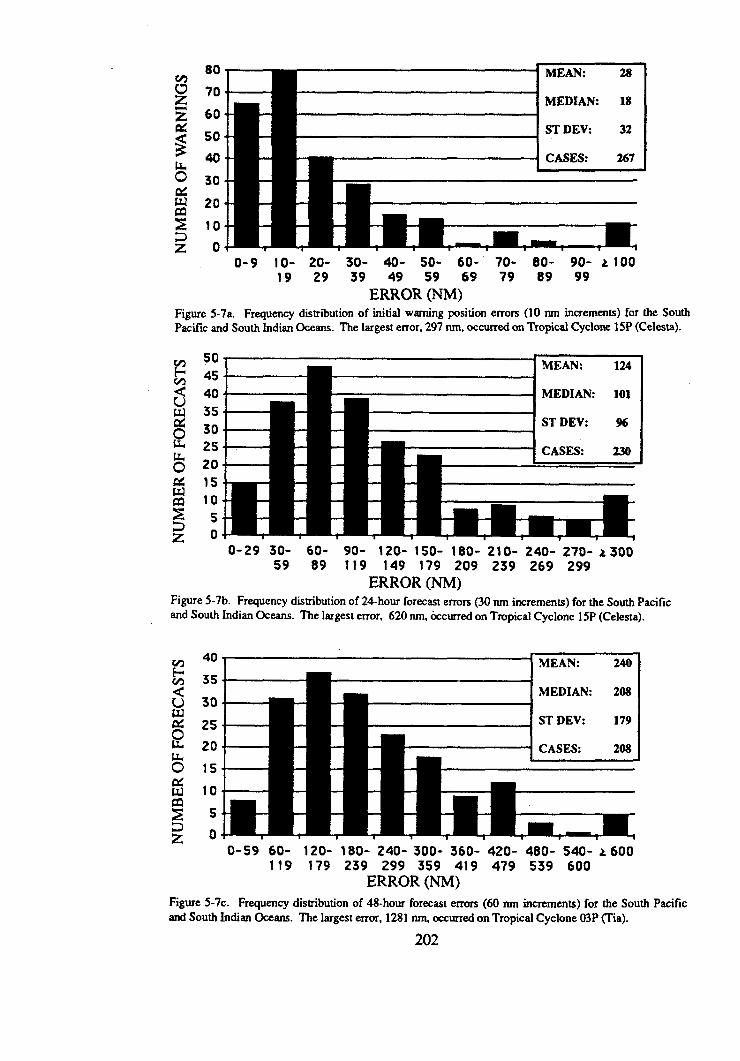
8070
60
50
40
30
20
10
0
~ ‘E”: “MEDIAN: 18
ST DEV: 32
CASES: 267
I
O-9 IO- 20- 30- 40- 50- 60- 70- 80- 90- a10019 29 39 49 59 69 79 89 99
ERROR (NM)Figure 5-7a Frquenq dk&ibution oftitid wtigpsitim emom(10 mkaema~)for WSouti
Pacific and South Indian Oceans. The largest error, 297 nm, occurred on Tropical Cyclone 15P (Celesta).
50
45
40
35
30
25
20
15
10
so
MEAN: 124
MEDIAN: 101
ST DEV: %
CASES: 230
0-29 30- 60- 90- 120- 150- 180- 210- 240- 270- k 30059 89 119 149 179 209 239 269 299
ERROR (NM)Figure5-7b.Frequencydistributionof24-hourforecasterrors(30nm increments)fortheSouthPacificand South Indian Oceans. The largest error, 620 nm, &curred on Tropical Cyclone 15P (Celesta).
35
30
25
20
15
10
s
o
I I1
I CASES: 208m
.0-59 60- 120- 180- 240-300- 360- 420- 480- 540- L 600
119 179 239 299 359 419 479 539 600ERROR (NM)
Figure5-7c. Frequency distribution of 48-hour forecast errors (60 nm increments) for the South PacificandSouthIndian@ans. The largest error, 1281 ~ wcurred on Tropical Cyclone 03P (’Ra).
202
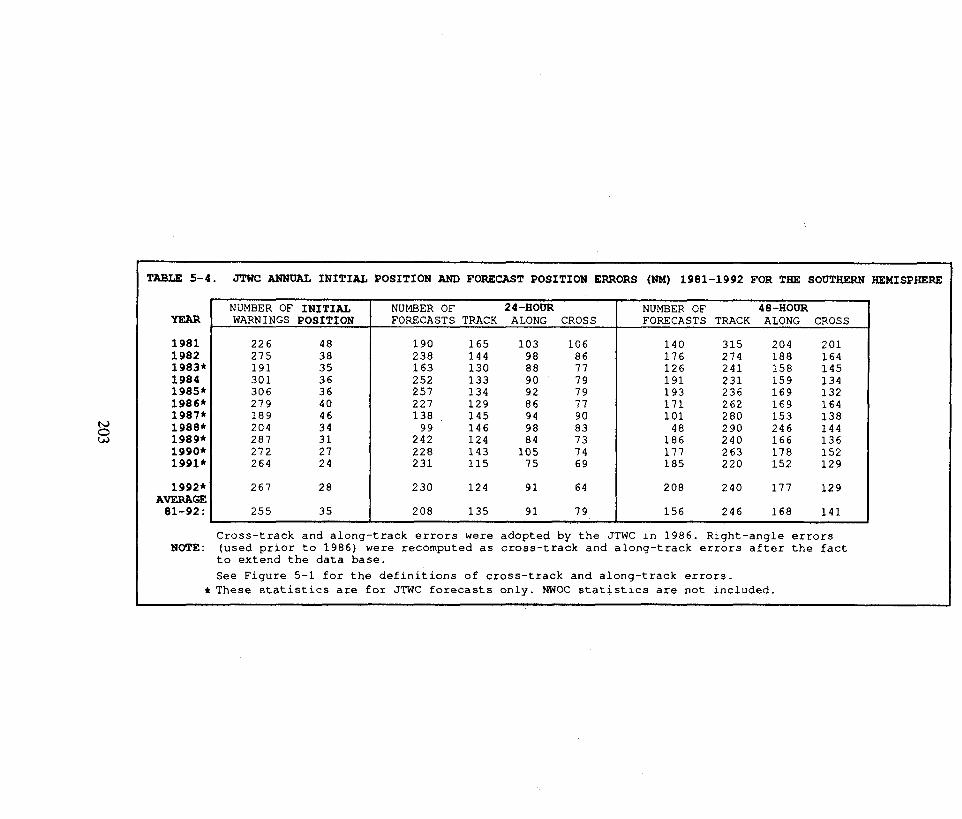
TABLE 5-4. JTWC ANNUAL INITIAL POSITION AND FORECAST POSITION ERRORS (NM) 1981-1992 FOR TNE SOUTHERN HEMISPHERE
198119821983*19841985*1986*1987*1988*1989*1990*1991*
1992*AVERAGE81-92:
NUMBER OF INITIAL NUMBER OF 24-HOUR NUMBER OF 48-HOORWARNINGS POSITION FORECASTS TRACK ALONG CROSS FORECASTS TRACK ALONG CROSS
226 48 190 165 103 106 140 315 204 20127.5 38 238 144 98 86 176 274 188191 35 163
164130 88 77 126 241 158 145
301 36 252 133 90 79 191 231 159306 36 257
134134 92 79 193 236 169 132
279 40 227 129 86 77 171 262 169 164189 46 138 145 94 90 101 280 153 138204 34 146 98 83 48 290 246287 31 2:;
144124 84 73 186 240 166
272136
27 228 143 105 74 177 263 178 152264 24 231 115 75 69 185 220 152 129
267 28 230 124 91 64 208 240 177 129
255 35 208 135 91 79 156 246 168 141
Cross-track and along-track errors were adopted by the JTWC in 1986. Right-angle errorsNOTE : (used prior to 1986) were recomputed as cross-track and along-track errors after the fact
to extend the data base.
See Figure 5-1 for the definitions of cross-track and along-track errors.● These statistics are for JTWC forecasts only. NWOC statistics are not included.
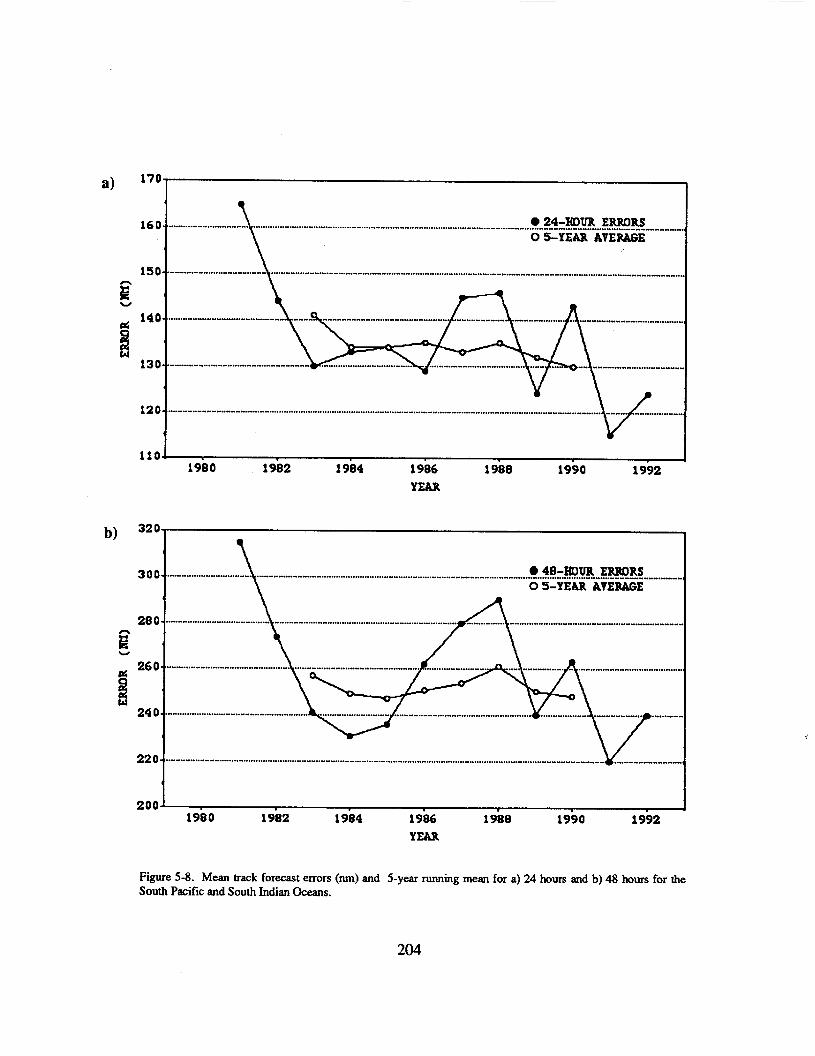
a)
b)
,
160- ● 24-XOUR ERRDRSO 5-YEAR AVERAGE
150. .
.“”””.. ””””” ........““”””””,
130. .
3
1101 J1980 1982 1984 1986 1988 1990 1992
YEAR
320.
1
300. ● 48-IKWR ERRORSO 5-YEAR AYERAGE
<
240. .---.--------..--”----”..-.”.........-..
4
2oo- .1980 1982 1984 1986 1988 1990 1992
YEAR
Figure 5-8. Mean track forecast errors (run) and 5-year running mean for a) 24 hours and b) 48 hours for the
South Pacific and South Indian Oceans.
204
5.2 COMPARISON OF OBJECTIVETECHNIQUES
JTWC uses a variety of objective tech-niques for guidance in the warning developmentprocess. Multiple techniques are required,because each technique has particular strengthsand weaknesses which vary by basin, numericalmodel initialization, time of year, synoptic situ-ation and forecast period. The accuracy ofobjective aid forecasts depends on both thespecified position and the past motion of thetropical cyclone as determined by the workingbest track. JTWC initializes its objective tech-niques using the extrapolated warning position.
An initiative is presently underway to con-vert most of the objective techniques that cur-rently run on mainframe computers at FNOC todesktop computer versions that run on ATCFworkstations. These will eventually replace theFNOC-generated techniques. Three of thesenew aids have been received and are under eval-uation.
Unless stated otherwise, all the objectivetechniques discussed below run in all basinscovered by JTWC’S AOR and provide forecastpositions at 24-, 48-, and 72-hours unless thetechnique aborts premature y during computa-tions. The techniques can be divided into sixgeneral categories: extrapolation, climatologyand analogs, statistical, dynamic, hybrids, andempirical or analytical.
5.2.1 EXTRAPOLATION (XTRP) — Pastspeed and direction are computed using therhumb line distance between the current and 12-hour old positions of the tropical cyclone.Extrapolation from the current warning positionis used to compute forecast positions.
5.2.2 CLIMATOLOGY and ANALOGS5.2.2.1 CLIMATOLOGY (CLIM) — Employstime and iocation windows relative to the cur-rent position of the storm to determine whichhistorical storms will be used to compute theforecast. The historical data base is 1945-1981for the Northwest Pacific, and 1900 to 1990 forthe rest of JTWC’S AOR. A second climatol-ogy-based technique exists on JTWC’SMacintosh@m II computers. It employs databases from 1945 to 1992 and from 1970 to1992. The latter is referred to as the satellite-era
data base. Objective intensity forecasts areavailable from these data bases. Scatter dia-grams of expected tropical cyclone motion atbifurcation points are also available from thesedata bases.
5.2.2.2 ANALOGS — JTWC’S analog and cli-matology techniques use the same historicaldata base, except that the analog approachimposes more restrictions on which storms willbe used to compute the forecast positions.Analogs in all basins must satisfy time, location,speed, and direction windows, although thewindow definitions are distinctly different in theNorthwest Pacific. In this basin, acceptableanalogs are also ranked in terms of a similarityindex that includes the above parameters and:storm size and size change, intensity and inten-sity change, and heights and locations of the700-mb subtropical ridge and upstream midlati-tude trough. In other basins, all acceptableanalogs receive equal weighting and a persis-tence bias is explicitly added to the forecast.Inside the Northwest Pacific, analog weightingis varied using the similarity index, and a persis-tence bias is implicitly incorporated by rotatingthe analog tracks so that they initially match the12-hr old motion of the current storm. In theNorthwest Pacific, a forecast based on allacceptable analogs called TOTL, as well as aforecast based only on historical recurverscalled RECR are available. Outside this basin,only the TOTL technique is available.
205

5.2.3 STATISTICAL
5.2.3.1 CLIMATOLOGY AND PERSISTENCE(CLIP) — A statistical regression technique thatis based on climatology, current position and12-hour and 24-hour past movement. This tech-nique is used as a crude baseline against whichto measure the forecast skill of other moresophisticated techniques. CLIP in theNorthwest Pacific uses third-order regressionequations and is based on the work of Xu andNeumann (1985). CLIP has been available out-side this basin since mid- 1990, with regressioncoefficients recently recomputed by FNOCbased on the updated 1900-1989 data base.
5.2.3.2 COLORADO STATE UNIVERSITYMODEL (CSUM) — A statistical-dynamicaltechnique based on the work of Matsumoto(1984). Predictor parameters include the currentand 24-hr old position of the storm, heightsfrom the current and 24-hr old NOGAPS 500-mb analyses, and heights from the 24-hr and 48-hr NOGAPS 500 mb prognoses. Height valuesfrom 200-mb fields are substituted for stormsthat have an intensity exceeding 90 knots andare located north of the subtropical ridge. Threedistinct sets of regression equations are useddepending on whether the storm’s direction ofmotion falls into “below,” “on,” or “above” thesubtropical ridge categories. During the devel-opment of the regression equation coefficientsfor CSUM, the so-called “perfect prog”approach was used, in which verifying analyseswere substituted for the numerical prognosesthat are used when CSUM is run operationally.Thus, CSUM was not “tuned” to any particularversion of NOGAPS, and in fact, the perfor-mance of CSUM should presumably improve asnew versions of NOGAPS improve. CSUMruns only in the Northwest Pacific, South ChinaSea, and North Indian Ocean basins.
5.2.3.3 JTWC92 (JT92) - JTWC92 is a statisti-cal-dynamical model for the Northwest PacificOcean basin which forecasts tropical cyclonepositions at 12-hour intervals to 72 hours. Themodel uses the deep-layer mean height fieldderived from the NOGAPS forecast fields.These deep-layer mean height fields are spec-trally truncated to wave numbers O through 18prior to use in JT92. Separate forecasts aremade for each position. That is, the forecast 24hour position is not a 12-hour forecast from theforecasted 12-hour position.
JT92 uses five internal sub-models whichare blended and iterated to produce the finalforecasts. The first sub-model is a statisticalblend of climatology and persistence, known asCLIPER. The second sub-model is an analysismode predictor, which only uses the “analysis”field. The third sub-model is the forecast modepredictor, which uses only the forecast fields.The fourth sub-model is a combination of 1 and2 to produce a “first guess” of the 12-hourlyforecast positions. The fifth sub-model uses theoutput of the “first guess” combined with 1,2,and 3 to produce the forecasts. The iteration isaccomplished by using the output of sub-model5 as though it were the output from sub-model4. The optimum number of iterations has been
determined to be three.When JT92 is used in the operational mode,
all the NOGAPS fields are forecast fields. The002 and 122 tropical forecasts are based uponthe previous 12-hour old synoptic timeNOGAPS forecasts. The 062 and 18Z mpkrd .forecasts are based on the previous 00Z and 12ZNOGAPS forecasts, respectively. Therefore, thesecond sub-model uses forecast fields and notanalysis fields operationally.
5.2.4 DYNAMIC
5.2.4.1 NOGAPS VORTEX TRACKING ROU-TINE (NGPS) — This objective technique fol-lows the movement of the point of minimumheight on the 1000 mb pressure surface ana-
206
lyzed and predicted by NOGAPS. A search inthe expected vicinity of the storm is conductedevery six hours through 72 hours, even if thetracking routine temporarily fails to discern aminimum height point. Explicit insertion of atropical cyclone bogus via data provided overTYMNET by JTWC began in mid-1990, andshould improve the ability of the NOGAPStechnique to track the vortex.
5.2.4.2 ONE-WAY INFLUENCE TROPICALCYCLONE MODEL (OTCM) — This tech-nique is a coarse resolution (205 km grid), threelayer, primitive equation model with a horizon-tal domain of 6400 x 4700 km. OTCM is ini-tialized using 6-hour or 12-hour prognosticfields from the latest NOGAPS run, and the ini-tial fields are smoothed and adjusted in thevicinity of the storm to induce a persistence biasinto OTCM’S forecast. A symmetric bogus vor-tex is then inserted, and the boundaries updatedevery 12 hours by NOGAPS fields as the inte-gration proceeds. The bogus vortex is main-tained against frictional dissipation by an ana-lytical heating function. The forecast positionsare based on the movement of the vortex in thelowest layer of the model (effectively 850-mb).
5.2.4.3 FNOC BETA AND AEIVECTIONMODEL (FBAM) — This model is an adapta-tion of the Beta and Advection model used byNMC. The forecast motion results from a calcu-lation of environmental steering and an empiri-cal correction for the observed vector differencebetween that steering and the 12-hour old stormmotion. The steering is computed from theNOGAPS Deep Layer Mean (DLM) wind fieldswhich are a weighted average of the wind fieldscomputed for the 1000-mb to 100-mb levels.The difference between past storm motion andthe DLM steering is treated as if the storm werea Rossby wave with an “effective radius” propa-gating in response to the horizontal gradient ofthe coriolis parameter, Beta. The forecast pro-ceeds in one-hour steps, recomputing the effec-
tive radius as Beta changes with storm latitude,and blending in a persistence bias for the first12 hours.
5.2.5 HYBRIDS
5.2.5.1 HALF PERSISTENCE AND CLIM-ATOLOGY (HPAC) — Forecast positions aregenerated by equally weighting the forecastsgiven by XTRP and CLIM.
5.2.5.2 COMBINED CONFIDENCEWEIGHTED FORECASTS (CCWF) — Anoptimal blend of objective techniques producedby the ATCF. The ATCF blends the selectedtechniques (currently OTCM, CSUM andHPAC) by using the inverse of the covariancematrices computed from historical and real-time cross-track and along-track errors as theweighting function.
5.2.6 EMPIRICAL OR ANALYTICAL
5.2.6.1 DVORAK — An estimation of a tropi-cal cyclone’s current and 24-hour forecast inten-sity is made from the interpretation of satelliteimagery (Dvorak, 1984) . These intensity esti-mates are used with other intensity related dataand trends to forecast short-term tropicalcyclone intensity.
5.2.6.2 MARTIN/HOLLAND — The techniqueadapts an earlier work (Holland, 1980) andspecificallyy addresses the need for realistic 30-,50- and 100-kt (15-,26- and 51-m/see) windradii around tropical cyclones. It solves equa-tions for basic gradient wind relations within thetropical cyclone area, using input parametersobtained from enhanced infrared sateIliteimage~. The diagnosis also includes an asym-metric area of winds caused by tropical cyclonemovement. Satellite-derived size and intensityparameters are also used to diagnose internalsteering components of tropical cyclone motionknown collectively as “beta-drift”.
207

5.2.6.3 TYPHOON ACCELERATION PRE-DICTION TECHNIQUE (TAPT) — This tech-nique (Weir, 1982) utilizes upper-troposphericand surface wind fields to estimate accelerationassociated with the tropical cyclone’s interac-tion with the rnid-~atitude westerlies. It includesguidelines for the duration of acceleration,upper limits and probable path of the cyclone.
5.3 TESTING AND RESULTS
A comparison of selected techniques isincluded in Table 5-5 for all Northwest Pacifictropical cyclones; Table 5-6 for all North IndianOcean tropical cyclones and Table 5-7 for theSouthern Hemisphere. In these tables, “x-axis”refers to techniques listed vertically. For exam-ple (Table 5-5) in the 861 cases available for a(homogeneous) comparison, the average fore-cast error at 24 hours was 137 nm (254 km) forCSUM and 139 nm (257 km) for FBAM. Thedifference of 2 nm (4 km) is shown in the lowerright. (Differences are not always exact, due tocomputational round-off which occurs for eachof the cases available for comparison).

JTWC 841 107107 0
NGPS 427 99146 47
oTct4 795 105126 21
CSUM 793 107129 22
FBAM 804 107138 31
CLIP 814 107134 27
HPAC 809 107136 29
JTK
NGPS
OTCM
CSUM
FBAM
CLIP
HPAC
685 205205 0360 201237 36641 202226 24651 204235 31658 204253 49665 204261 57661 204247 43
NGi?2
428 146146 0421 145117 -28419 144121 -23416 145138 -7422 146121 -25422 145126 -19
364 238238 0356 233219 -14355 234236 2353 235258 23358 237246 9358 236247 11
881 129129 0846 127145 18866 128140 12876 128139 11862 128136 8
“tiDiffemme
872 146 Error m-m146 0
868 137 888 140133 -4 140 0866 137 874 139139 2 139 0
756 229229 0723 228 755 252251 23 252 0743 228 745 241 775 257256 28 255 14 257 0751 229 751 242 772 257276 47 262 20 277 20739 229 750 242 759 256253 24 256 14 255 -1
905 140140 0887 135 888 139139 4 139 0
788 277277 0771 264 772 255256 -8 255 0
JTKC
NGPS
OTCM
CSUM
FBAM
CLIP
HPAC
565 305305 0271 297313 16521 300326 26544 30233o 28549 303363 60553 303386 83548 302348 46
280 319319 0265 315314 -1273 313338 25274 316364 48276 319374 55276 318343 25
629 326326 0601 327 645 340332 5 340 0619 325 638 339 664 373367 42 369 30 373 0626 326 642 340 661 374392 66 385 45 400 26612 326 638 340 645 370349 23 356 16 354 -16
675 402402 0655 387 656 355355 -32 355 0
JTtc - Jlwc T-a8t UcPs - Ih’y-cpmt%od C10b81-aspbuic Prd.ktiOn syat-
OTol - (h9+layZrepicd Cyclona Mo&l m- COlormdo stat. Ulamsity Ik.d91rBml - moc aata d Advoction MO&l CLIP - c15mBt010gy/PusistuJaSmx - Umlf Pushtoac, and Climatology
209
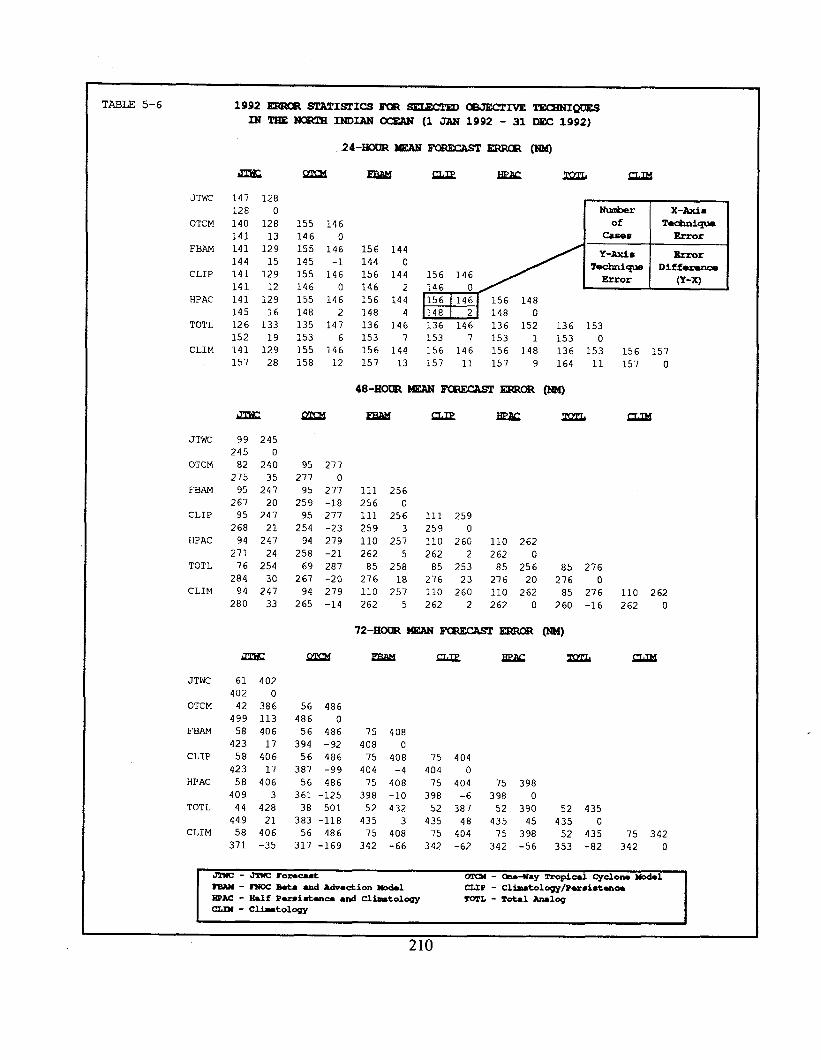
TABLE 5-6 1992 ~ 8TA!I!ISTIC8E’c&?~ CWECITW TEC21NI_INTHE~INDIhN~(lJAH 1992 -31 DEC1992)
JThC
OTCM
FBAM
CLIP
HPAC
TOTL
CLIM
JTWC
OTCM
FBAM
CLIP
HPAC
TOTL
CLIM
JTWC
OTCM
FBAM
CLIP
HPAC
TOTL
CLIM
m?2
147 128128 0140 128141 13141 129144 15141 129141 12141 129145 16126 133152 19141 129157 28
99 245245 082 240215 3595 247
267 2095 247268 2194 247
271 2476 254284 3094 247
280 33
61 402402 042 386499 11358 406423 1758 406423 1758 406409 344 428449 2158 406371 -35
Su24
155 146146 0155 146145 -1155 146146 0155 146148 2135 147153 6155 146158 12
ram
95 277277 095 277
259 -1895 277254 -2394 279
258 -2169 287
267 -2094 279
265 -14
56 486486 056 486394 -9256 486387 -9956 486361 -12538 501383 -11856 486317 -169
156 144144 0156 144146 2156 144148 4136 146153 7156 144157 13
9J3i riuK
Nuder X-xixiaof Technique
cases ErrQr
Y-Axis Brror
156 146TdYnique Differwicn
Error146 0
(Y-x)
136 146 136 152 136 153153 7 153 1 153 0156 146 156 148 136 153 156 157157 11 157 9 164 11 157 0
111 256256 0111 256 111 259259 3 259 0110 257 110 260 110 262262 5 262 2 262 085 258 85 253 85 256276 18 276 23 276 20110 257 110 260 110 262262 5 262 2 262 0
72-HOUR !4EAHl?mm3sr ~
m GLLE Jie.X
75 408408 075 408 75 404404 -4 404 075 408 75 404 75 398398 -lo 398 -6 398 052 432 52 387 52 390
85 276276 085 276 110 262
260 -16 262 0
m)
ZaL %rJM
52 435435 3 435 48 435 45 435 075 408 75 404 75 398 52 435 75 342342 -66 342 -62 342 -56 353 -82 342 0
I J1’iK- JmK! Tome 0TQ4 - &.-Way Tropid *don. nodd IrPAM- P’mcB9ta andAdv*rtionMD&l CLIP - clin9t010gy/Pus ixmaPmAc - Half P,rsist,nc. ●nd Clhtology To17.- Total MDlog
CLm - Clktolcqy
210
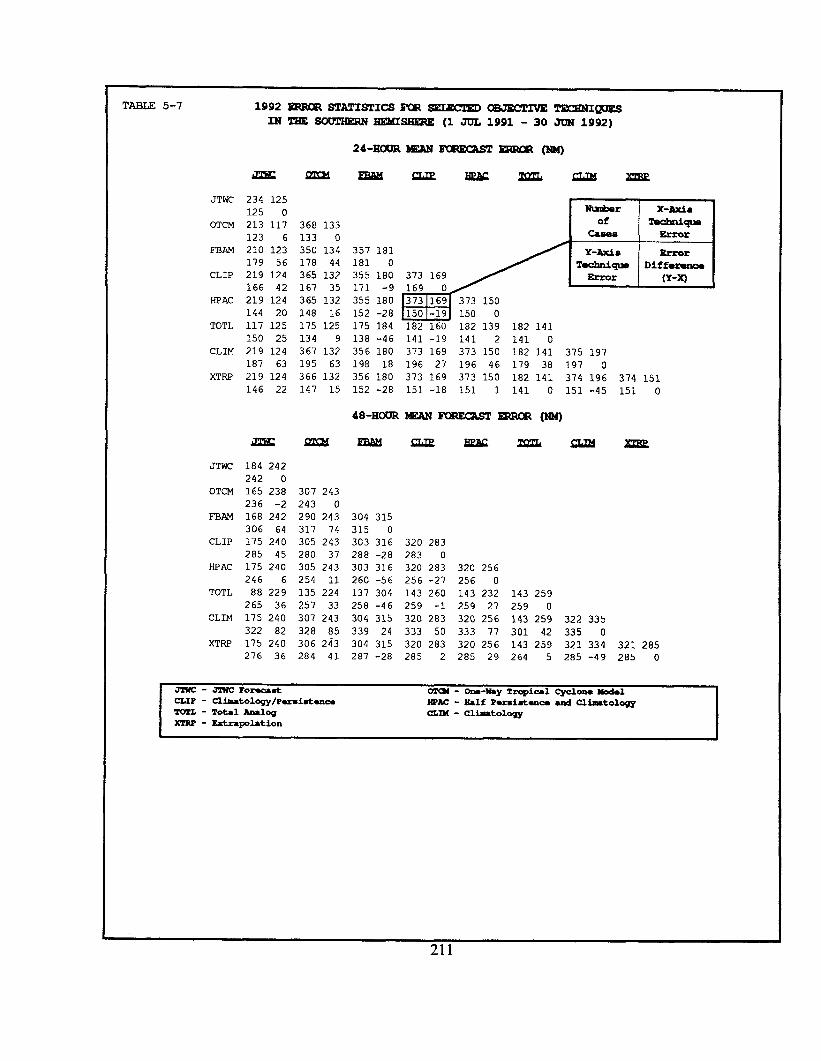
TABLE 5-7 1992 SiZiRCRSTATISTICSE’(X~ cmJEc’rIvEmixxNIguEsm = SWXWE3W HEMISEIERE(1 JUL 1991 - 30 JUN 1992)
24-- WAN ~ ~m
JThC
OTCM
FBAM
CLIP
HPAC
TOTL
CLIM
XTRP
JTwc
OTCM
PBAM
CLIP
HPAC
TOTL
CLIM
XTRl
234 125125 0213 117 368 133123 6 133 0210 123 350 134 357 181179 56 178 44 181 0219 124 365 132 355 180166 42 167 35 171 -9219 124 365 132 355 180144 20 148 16 152 -28117 125 175 125 175 184150 25 134 9 138 -46219 124 367 132 356 180187 63 195 63 198 18219 124 366 132 356 180146 22 147 15 152 -28
184 242242 0165 238236 -2168 242306 64175 240285 45175 240246 688 229
265 36175 240322 82175 240276 36
307 243243 0290 243317 74305 243280 37305 243254 11135 224257 33307 243328 85306 243284 41
d182 160 182 139 182 141141 -19 141 2 141 0373 169 373 150 182 141 375 197196 27 196 46 179 38 197 0
373 169 373 150 182 141 374 196 374 151151 -18 151 1 141 0 151 -45 151 0
4a-EiouRMEaN mRECAST EnRCR (NM)
304 315315 0303 316288 -28303 316260 -56137 304258 -46304 315339 24304 315287 -28
+
Nur&r X-tiaof l’achmtqx
Caaee
Y-AxiBlkch?iiqn Diff~Error (Y-x)
320 283283 0320 283256 -27143 260259 -1320 283333 50320 283285 2
320 256256 0143 232 143 259259 27 259 0320 256 143 259333 77 301 42320 256 143 259285 29 264 5
QTMXcKE
322 335335 0321 334 321 285285 -49 285 0
? J’mc- JTWC rO-8t mad - Orio-iTJWTropial CyclOM )lddCLIP - clim8t01cgy/P0r8i8tulc, WAC - I181f P-i8tulca aid CM5atolcgy= - TotalAMlcg am- clillmtol~xTRY- rxtrqmlation
211
Intentionally left blank
212
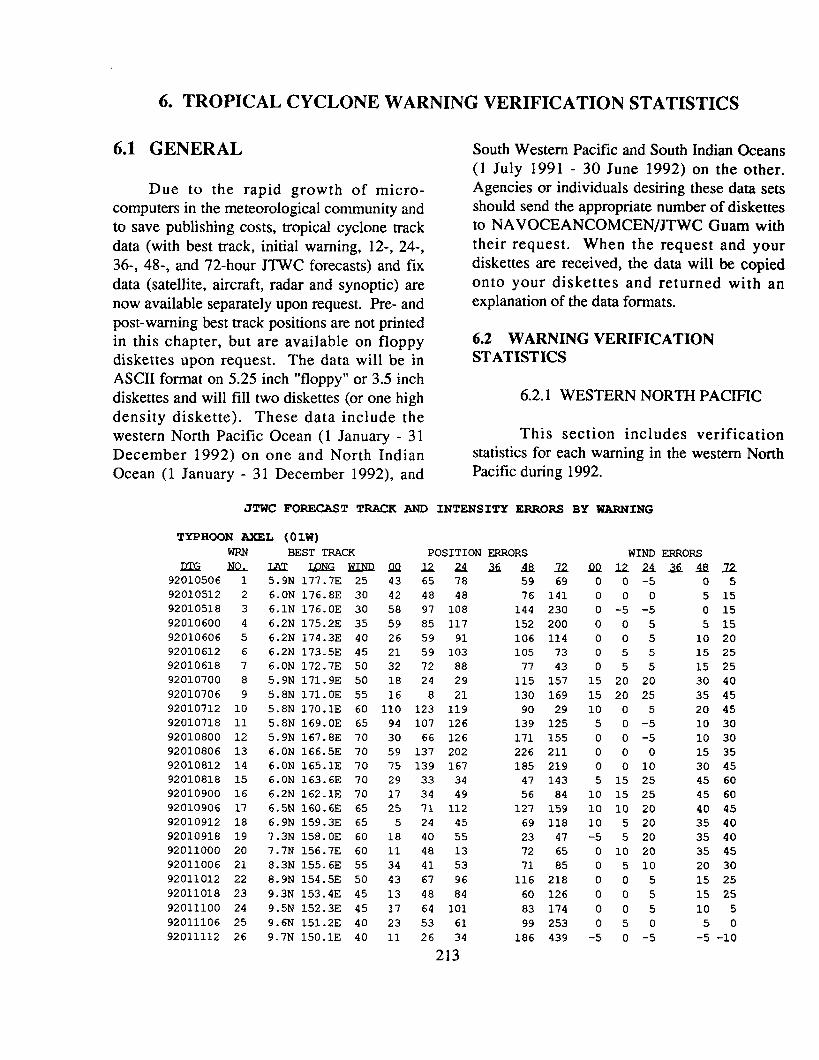
6. TROPICAL CYCLONE WARNING VERIFICATION STATISTICS
6.1 GENERAL
Due to the rapid growth of micro-computers in the meteorological community andto save publishing costs, tropical cyclone trackdata (with best track, initial warning, 12-, 24-,36-, 48-, and 72-hour JTWC forecasts) and fixdata (satellite, aircraft, radar and synoptic) arenow available separately upon request. Pre- andpost-warning best track positions are not printedin this chapter, but are available on flo~py
South Western Pacific and South Indian Oceans(1 July 1991-30 June 1992) on the other.Agencies or individuals desiring these data setsshould send the appropriate number of diskettesto NAVOCEANCOMCEN/JTWC Guam withtheir request. When the request and yourdiskettes are received, the data will be copiedonto your diskettes and returned with anexplanation of the data formats.
6.2 WARNING VERIFICATION
diskettes upon “request. The data will b; “ii STATISTICS
ASCII format on 5.25 inch “floppy” or 3.5 inchdiskettes and will fill two diskettes (or one high 6.2.1 WESTERN NORTF
density diskette). These data include thewestern North Pacific Ocean ( 1 January - 31 This section includes.December 1992) on one and North Indian statistics for each warning in
Ocean (1 January -31 December 1992), and Pacific during 1992.
JTWC FORECAST TRACK AND INTENSITY ERRORS BY WARNING
TYPHOON AKEL (OlW)WRN
12KNSL92010506 192010512 292010518 392010600 492010606 592010612 692010618 792010700 892010706 992010712 1092010718 1192010800 1292010806 1392010812 1492010818 1592010900 1692010906 1792010912 1892010918 1992011000 2092011006 2192011012 2292011018 2392011100 2492011106 2592011112 26
BEST TRACK
I&C I.Ql?GhzIiRQQ3.YN l-l”/.IE 23
6.ON 176.8E 306.lN 176.OE 306.2N 175.2E 356.2N 174.3E 406.2N 173.5E 456.ON 172.7E 505.9N 171.9E 505.8N 171.OE 555.8N 170.lE 605.8N 169.OE 655.9N 167.8E 706.ON 166.5E 706.ON 165.lE 706.ON 163.6E 706.2N 162.lE 706.5N 160.6E 656.9N 159.3E 657.3N 158.OE 607.7N 156.7E 608.3N 155.6E 558.9N 154.5E 509.3N 153.4E 459.5N 152.3E 459.6N 151.2E 409.7N 150.lE 40
43
42
58
59
26
21
32
18
16
110
94
30
59
75
29
17
25
5
18
11
34
43
13
17
23
11
PACIFIC
verificationthe western North
POSITION ERRORS WIND ERRORSu 2.4 36 M 22 QQJ,22465 78 596900-548 48 7614100097 108 144 230 0 -5 -585 117 152 200 0 0 559 91 106 114 0 0 559 103 105 73 0 5 5
72 88 77 43 0 5 524 29 115 157 15 20 208 21 130 169 15 20 25
123 119 90 29 10 0 5107 126 139 125 5 0 -566 126 171 155 0 0 -5137 202 226 211 0 0 0139 167 185 219 0 0 1033 34 47 143 5 15 2534 49 56 84 10 15 2571 112 127 159 10 10 2024 45 69 118 10 5 2040 55 23 47 -5 5 2048 13 72 65 0 10 2041 53 71 85 0 5 1067 96 116 218 0 0 548 84 6012600564 101 8317400553 61 9925305026 34 186 439 -5 0 -5
213
Xmu055 150 155 1510 2015 2515 2530 4035 4520 4510 3010 3015 3530 4545 6045 6040 4535 4035 4035 4520 3015 2515 2510 550-5 -lo
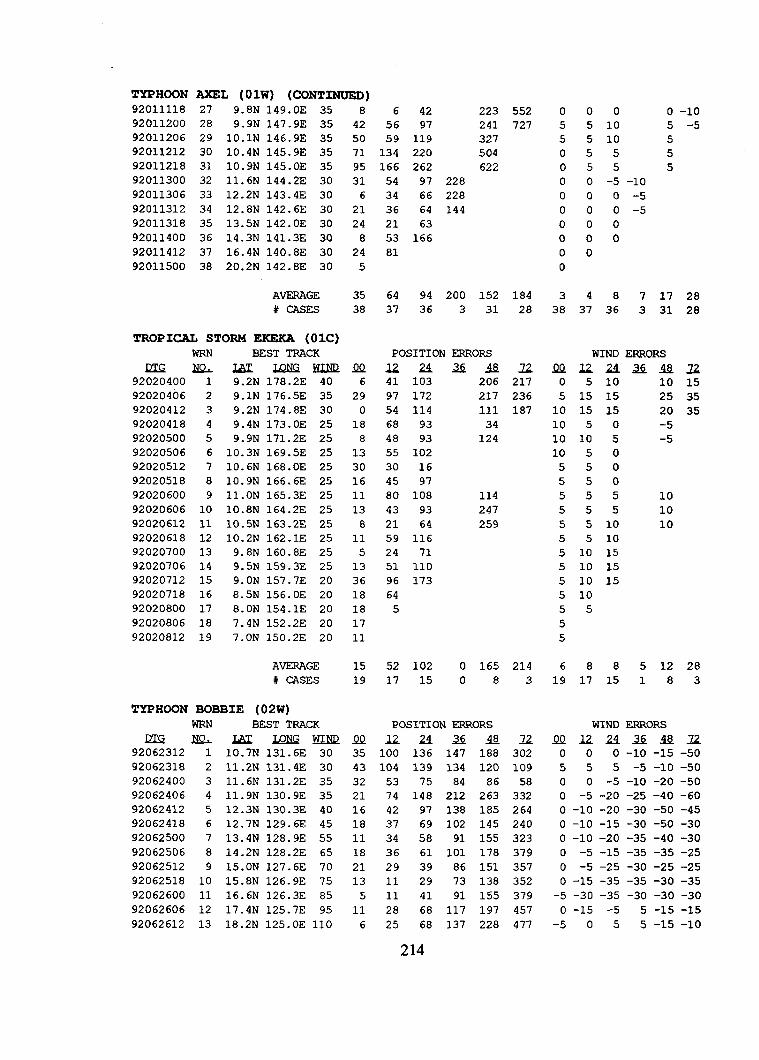
TYPHOON AXEL (OIW) (CONTZIWJED)92011118 27 9.8N 149.OE 35 892011200 28 9.9N 147.9E 35 4292011206 29 10.1N 146.9E 35 5092011212 30 10.4N 145.9E 35 7192011218 31 10.9N 145.OE 35 9592011300 32 11.6N 144.2E 30 3192011306 33 12.2N 143.4E 30 692011312 34 12.8N 142.6E 30 2192011318 35 13.5N 142.OE 30 2492011400 36 14.3N 141.3E 30 892011412 37 16.4N 140.8E 30 2492011500 38 20.2N 142.8E 30 5
AVERAGE 35# CASES 38
TROPICAL STORM EICEKA (OIC)WRN BEST TRACK
QzG ML LUX?NGJ!UM2QQ92020400 1 9.2N 178.2E 40 692020406 2 9.lN 176.5E 35 2992020412 3 9.2N 174.8E 30 092020418 4 9.4N 173.OE 25 1892020500 5 9.9N 171.2E 25 892020506 6 10.3N 169.5E 25 1392020512 7 10.6N 168.OE 25 3092020518 8 10.9N 166.6E 25 1692020600 9 11.ON 165.3E 25 1192020606 10 10.8N 164.2E 25 1392020612 11 10.5N 163.2E 25 892020618 12 10.2N 162.lE 25 1192020700 13 9.8N 160.8E 25 592020706 14 9.5N 159.3E 25 1392020712 15 9.ON 157.7E 20 3692020718 16 8.5N 156.OE 20 1892020800 17 8.ON 154.lE 20 1892020806 18 7.4N 152.2E 20 1792020812 19 7.ON 150.2E 20 11
AVERAGE 15# CASES 19
TYPHOON BOBBIE (02W)WRN BEST TRACK
m m LZ!XLQ?GJQM2QQ92062312 1 10.7N 131.6E 30 3592062318 2 11.2N 131.4E 30 4392062400 3 11.6N 131.2E 35 3292062406 4 11.9N 130.9E 35 2192062412 5 12.3N 1.30.3E 40 1692062418 6 12.7N 129.6E 45 1892062500 7 13.4N 128.9E 55 1192062506 8 14.2N 128.2E 65 1892062512 9 15.ON 127.6E 70 2192062518 10 15.8N 126.9E 75 1392062600 11 16.6N 126.3E 85 592062606 12 17.4N 125.7E 95 1192062612 13 18.2N 125.OE 110 6
6 42 22356 97 24159 119 327134 220 504166 262 62254 97 22834 66 22836 64 14421 6353 16681
64 94 200 15237 36 3 31
POSITION ERRORS
552 0727 5
5000000000
184 328 38
00 0 -lo5 10 5 -55 10 555 555 50 -5 -lo00-500-500000
48 7 17 2837 36 3 31 28
WIND ERRORS
X22441 10397 17254 11468 9348 9355 10230 1645 9780 10843 9321 6459 11624 7151 11096 173645
52 10217 15
2Q@lz QQ 1224** Z206 217 0 5 10 10 15217 236 5 15 15 25 35111 187 10 15 15 20 3534 10 5 0 -5124 10 10 5 -5
10 5 0550550
114 555 10247 555 10259 5 5 10 10
5 5 105 10 155 10 155 10 155 105555
0 165 214 6 8 8 5 12 28083 19 17 15 1 8 3
POSITION ERRORS
12.a3*100 136 147 188104 139 134 12053 75 84 8674 148 212 26342 97 138 18537 69 102 14534 58 91 15536 61 101 17829 39 86 15111 29 73 13811 41 91 15528 68 117 19725 68 137 228
WIND ERRORS
z2f!Q12aiX9Qlz302 0 0 0 -lo -15 -50109 5 5 5 -5 -lo -5058 0 0 -5 -lo -20 -50332 0 -5 -20 -25 -40 -60264 0 -lo -20 -30 -50 -45240 0 -lo -15 -30 -50 -30323 0 -lo -20 -35 -40 -30379 0 -5 -15 -35 -35 -25357 0 -5 –25 -30 -25 -25352 0 -15 -35 -35 -30 -35379 -5 -30 -35 -30 -30 -30457 0 -15 -5 5 -15 -15477 -5 0 5 5 -15 -lo
214
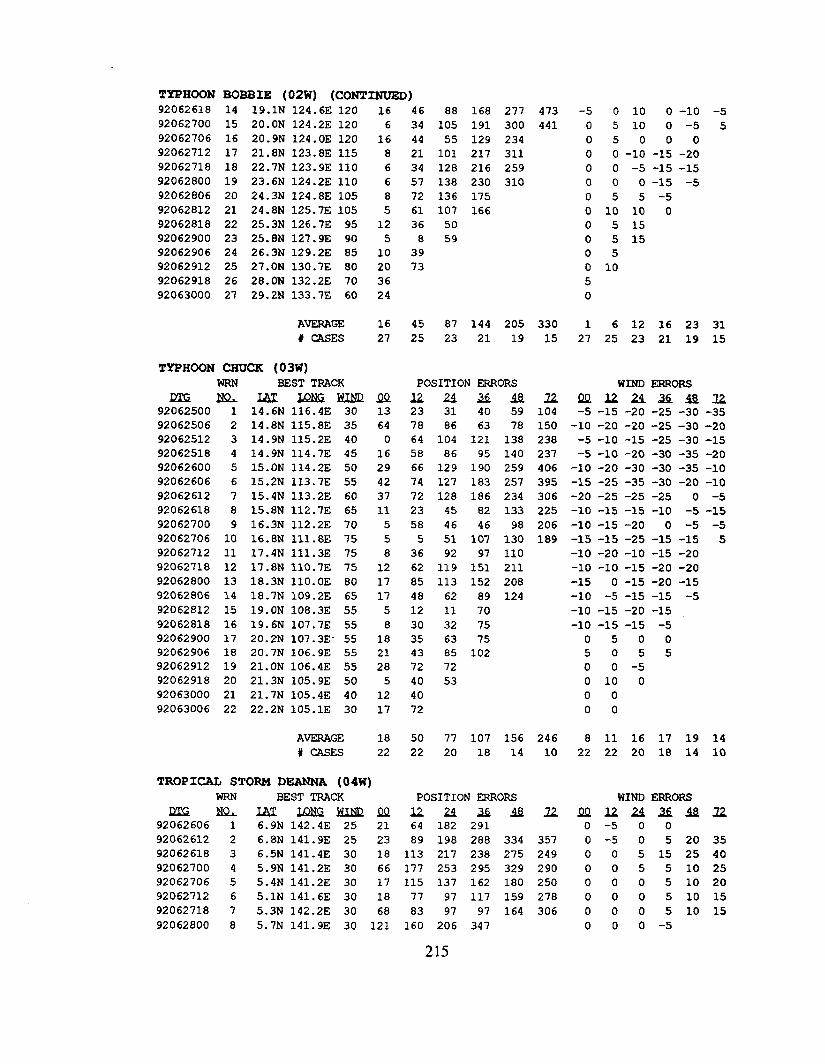
TYPHOON BOBBIE (02W) (CONTINUED)
92062618 14 19.lN 124.6E 12092062700 15 20.ON 124.2E 12092062706 16 20.9N 124.OE 12092062712 17 21.8N 123.8E 11592062718 18 22.7N 123.9E 11092062800 19 23.6N 124.2E 11092062806 20 24.3N 124.8E 10592062812 21 24.8N 125.7E 10592062818 22 25.3N 126.7E 9592062900 23 25.8N 127.9E 9092062906 24 26.3N 129.2E 8592062912 25 27.ON 130.7E 8092062918 26 28.ON 132.2E 7092063000 27 29.2N 133.7E 60
AVERAGE# CASES
TYPHOON CHUCK (03W)WRN BEST TRACK
lzD2 m L?iz JQNGHIM292062500 1 14.6N 116.4E 3092062506 2 14.8N 115.8E 3592062512 3 14.9N 115.2E 4092062518 4 14.9N 114.7E 4592062600 5 15.ON 114.2E 5092062606 6 15.2N 113.7E 5592062612 7 15.4N 113.2E 6092062618 8 15.8N 112.7E 6592062700 9 16.3N 112.2E 7092062706 10 16.8N 111.8E 7592062712 11 17.4N 111.3E 7592062718 12 17.8N 11O.7E 7592062800 13 18.3N 11O.OE 8092062806 14 18.7N 109.2E 6592062812 15 19.ON 108.3E 5592062818 16 19.6N 107.7E 5592062900 17 20.2N 107.3E” 5592062906 18 20.7N 106.9E 5592062912 19 21.ON 106.4E 5592062918 20 21.3N 105.9E 5092063000 21 21.7N 105.4E 4092063006 22 22.2N 105.1E 30
AVERAGE# CASES
166
168668512510203624
1627
QQ13640162942371155812171758
18212851217
1822
TROPICAL STORM DEANNA (04W)WRN BEST TRACK
12rG NGLL?xxQt?G5ulQQQ92062606 1 6.9N 142.4E 25 2192062612 2 6.8N 141.9E 25 2392062618 3 6.5N 141.4E 30 1892062700 4 5.9N 141.2E 30 6692062706 5 5.4N 141.2E 30 1792062712 6 5.lN 141.6E 30 1892062718 7 5.3N 142.2E 30 6892062800 8 5.7N 141.9E 30 121
46 88 168 277 47334 105 191 300 44144 55 129 23421 101 217 31134 128 216 25957 138 230 31072 136 17561 107 16636 508 59
3973
45 87 144 205 33025 23 21 19 15
POSITION EF@ORS
lz2378645866747223585366285481230354372404072
5022
=25431 40 59
86 63 78
104 121 138
86 95 140
129 190 259
127 183 257
128 186 234
45 82 133
46 46 98
51 107 130
92 97 110
119 151 211
113 152 208
62 89 124
11 70
32 75
63 7585 102
72
53
77 107 15620 18 14
22104150238237406395306225206189
24610
POSITION ERRORS
Uaxazz64 182 291
89 198 288 334 357
113 217 238 275 249
177 253 295 329 290115 137 162 180 250
77 97 117 159 278
83 97 97 164 306
160 206 347
-5 0 10 0 -lo -50 5 10 0 -5 5050000 0 -lo -15 -2000 -5 -15 -1500 0 -15 -5055-50 10 10 00 5 150 5 15050 1050
1 6 12 16 23 3127 25 23 21 19 15
WIND ERRORS
QQUz!lxsn-5 -15 -20 -25 -30 -35-10 -20 -20 -25 -30 -20-5 -10 -15 -25 -30 -15-5 -10 -20 -30 -35 -20-lo -20 -30 -30 -35 -lo-15 -25 -35 -30 -20 -10-20 -25 -25 -25 0 -5-lo -15 -15 -lo -5 -15-lo -15 -20 0 -5 -5-15 -15 -25 -15 -15 5-lo -20 -lo -15 -20-lo -lo -15 -20 -20-15 0 -15 -20 -15-lo -5 -15 -15 -5-lo -15 -20 -15-lo -15 -15 -50500505500-501000000
8 11 16 17 19 1422 22 20 18 14 10
WIND ERRORS
QQ u as *Uo -5 0 00 -5 0 5 20 3500 5 15 25 40005 5 10 25000 5 10 20000 5 10 15000 5 10 15000-5
215
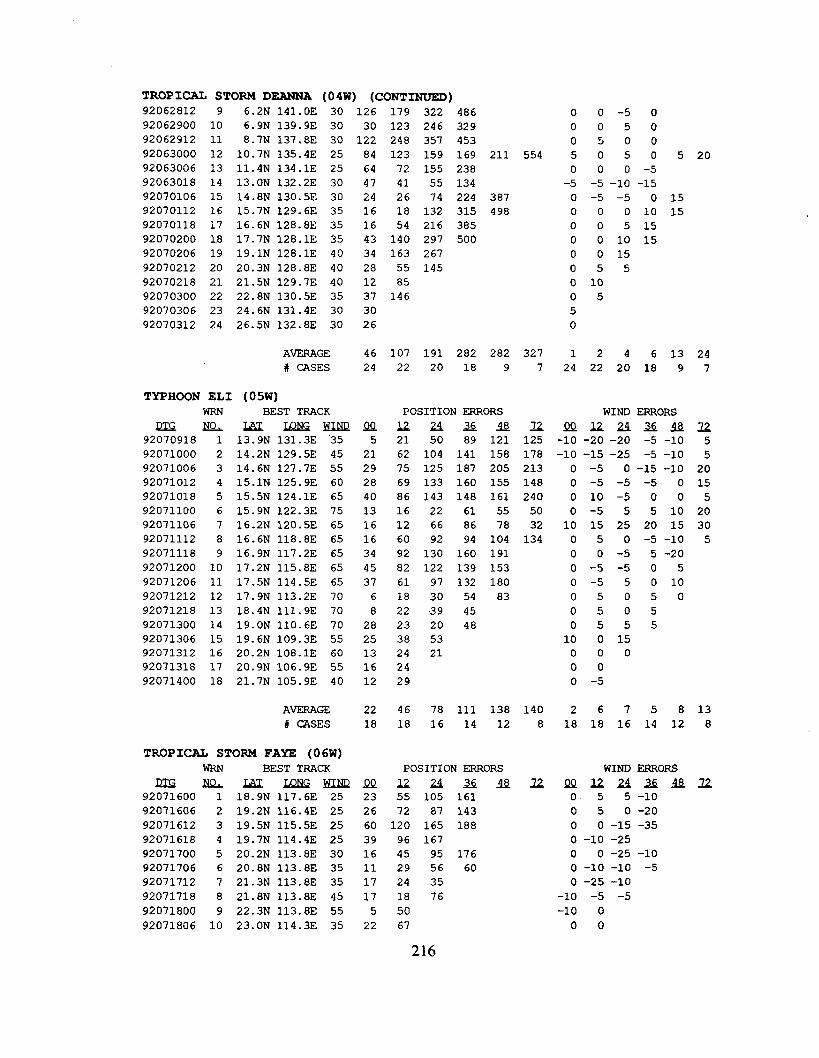
TROPICAL STORM DEANNA (O4W) (CONTINUED)92062812 9 6.2N 141.OE 30 126 179 322 486 0 0-5092062900 10 6.9N 139.9E 30 30 123 246 329 005092062912 11 8.7N 137.8E 30 122 248 357 453 050092063000 12 10.7N 135.4E 25 84 123 159 169 211 554 5 0 5 0 5 2092063006 13 11.4N 134.lE 25 64 72 155 238 000-592063018 14 13.ON 132.2E 30 47 41 55 134 -5 -5 –lo -1592070106 15 14.8N 130.5E 30 24 26 74 224 387 0 -5 -5 0 1592070112 16 15.7N 129.6E 35 16 18 132 315 498 00 0 10 1592070118 17 16.6N 128.8E 35 16 54 216 385 00 5 1592070200 18 17.7N 128.lE 35 43 140 297 500 0 0 10 1592070206 19 19.lN 128.lE 40 34 163 267 0 0 1592070212 20 20.3N 128.8E 40 28 55 145 05592070218 21 21.5N 129.7!3 40 12 85 0 1092070300 22 22.8N 130.5E 35 37 146 0592070306 23 24.6N 131.4E 30 30 592070312 24 26.5N 132.8E 30 26 0
AVERAGE 46 107 191 282 282 327 1 2 4 6 13 24
# CASES 24 22 20 18 9 7 24 22 20 18 9 7
TYPHOON ELI (05W)WRN BEST TRACK
12zG m LAz IQNGWLM292070918 1 13.9N 131.3E “3592071000 2 14.2N 129.5E 4592071006 3 14.6N 127.7E 5592071012 4 15.lN 125.9E 6092071018 5 15.5N 124.lE 6592071100 6 15.9N 122.3E 7592071106 7 16.2N 120.5E 6592071112 8 16.6N 118.8E 6592071118 9 16.9N 117.2E 6592071200 10 17.2N 115.8E 6592071206 11 17.5N 114.5E 6592071212 12 17.9N 113.2E 7092071218 13 18.4N 111.9E 7092071300 14 19.ON 11O.6E 7092071306 15 19.6N 109.3E 5592071312 16 20.2N 108-1E 6092071318 17 20.9N 106.9E 5592071400 18 21.7N 105.9E 40
u!52129284013161634453768
2825131612
POSITION ERRORS
lziusiflfi21 50 89 12162 104 141 15875 125 187 20569 133 160 15586 143 148 16116 22 61 5512 66 86 7860 92 94 10492 130 160 19182 122 139 15361 97 132 18018 30 54 8322 39 4523 20 4838 5324 212429
WIND ERRORS
Zi?Qlzii!liXim125 -lo -20 -20 -5 -lo178 -10 -15 -25 -5 -10213 0 -5 0 -15 -lo148 0 -5 -5 -5 0240 0 10 -5 0 050 0 -5 5 5 1032 10 15 25 20 15134 0 5 0 -5 -lo
00-5 5 -200 -5 -5 0 50 -5 5 0 10050500505055510 0 15000000 -5
z5520155
20305
AVERAGE 22 46 78 111 138 140 2 6 7 5 8 13
# CASES 18 18 16 14 12 8 18 18 16 14 12 8
TROPICAL STORM FAYE (06w)WRN BEST TRACK
m m XIAz mm92071600 1 18.9N 117.6E 25
92071606 2 19.2N 116.4E 25
92071612 3 19.5N 115.5E 25
92071618 4 19.7N 114.4E 25
92071700 5 20.2N 113.8E 30
92071706 6 20.8N 113.8E 35
92071712 7 21.3N 113.8E 35
92071718 8 21.8N 113.8E 45
92071800 9 22.3N 113.8E 55
92071806 10 23.ON 114.3E 35
L?Q23266039161117175
22
POSITION ERRORS
lza3*55 105 16172 87 143120 165 18896 16745 95 17629 56 6024 3518 765067
WIND ERRORS
2Z!2QUZ!IMQZ05 5 -lo05 0 -200 0 -15 -350 -10 -250 0 -25 -100 -lo -10 -50 -25 -10
-lo -5 -5-lo 000
216

. .
TROPICAL STORM FAYE (O 6w)
92071812 11 23.7N 114.9E 30
AVEP.AGE
# CASES
TYPHOON GARY (07W)WRN BEST TRACK
QXGML92071900 192071906 292071912 392071918 492072000 592072006 692072012 792072018 892072100 992072106 1092072112 1192072118 1292072200 1392072206 1492072212 1592072218 1692072300 1792072306 1892072312 19
(CONTINUED)6
23 58 99 14611 10 8 5
POSITION ERRORS WIND ERRORS
o
2 6 12 16
11 10 8 5
xA21QNGh!Lm QQ14.9N 124.8E 25 8115.3N 123.9E 25 5815.9N 123.2E 25 16116.6N 122.7E 30 11217.lN 121.9E 25 12517.3N 120.9E 25 5817.5N 119.9E 30 2317.7N 118.9E 35 2618.lN 117.8E 35 2418.5N 116.7E 40 618.9N 115.6E 40 019.4N 114.6E 45 819.9N 113.6E 50 520.2N 112.5E 60 620.5N 111.3E 65 1321.lN 11O.1E 65 2421.6N 108.9E 50 022.lN 107.7E 35 1222.5N 106.5E 30 13
AVERAGE 40# CASES 19
TROPICAL STORM HELEN (08w)WRN BEST TRACK
Q?& mu-mm920726009207260692072612920726189207270092072706920727129207271892072800
U115971921371535839453085
28493937483017
24181
113
233
184
190
66
41
49
48
30
46
67
9474
57
74
26s180125297 379258 326218 25457 8226 4639 3970 12268 10278 155138 215168119
63 97 132 17318 16 14 10
POSITION ERRORS
lza3!=L9.Q1 26.5N 157.2E 35 81 180. 283 428 5562 27.2N 157.4E 45 12 33 173 325 3843 27.8N 157.7E 45 12 36 165 209 1894 28.6N 157.9E 40 10 97 206 224 1555 30.ON 158.4E 40 16 72 104 606 31.9N 158.8E 40 20 63 927 33.7N 159.4E 35 11 71 1708 35.3N 160.lE 30 18 519 36.5N 160.8E 30 11 60
AVERAGE 22# CASES 9
TYPHOON IRVING (09W)
WFu4 BEST TRACK
QzG NQXA2LQNGEUM2QQ92080100 & 22.8N 131.2E 25 8692080106 2 23.3N 131.OE 25 5092080112 3 23.9N 131.2E 30 5692080118 4 24.5N 131.5E 30 10692080200 5 25.3N 131.6E 35 5892080206 6 26.lN 131.7E 35 6
92080212 7 26.9N 131.9E 35 8
74 171 250 3219754
POSITION ERRORS
UMX*127 200 288 38980 137 230 359
105 185 285 429
173 259 352 47799 156 248 361
5 58 154 160
31 89 145 114
L!2muzxalz00000 -5 5 -lo
547 0 5 5 0 -lo -40483 -5 10 -15 -15 -20 -35341 5 5 -lo -15 -20 -15231 5 -lo –15 -15 -20 -5194 -5 -10 -10 -15 -25 -10217 0 0 0 -lo -20 -5
00 -5 -lo 50 0 -lo -15 -50 –5 -15 -lo -lo
–5 -15 -15 0 -50 -lo -5 –5o -5 5 -50 10 10015505000
336 1 6 8 9 14 186 19 18 16 14 10 6
-lo -5 5 10 150 10 15 25 250 10 15 15 100050005500500000 -505
19
22QQ656 0563 0532 0523 0303 086 0
0
5 6 10 139754
WIND ERRORS
lzaxflf!z-5 -5 0 0 -20-5 -5 -5 -5 20-5 0 -lo -15 30-5 -5 -15 -25 3550 -5 -20 350 -5 -20 5 20
-5 -15 -30 5
217
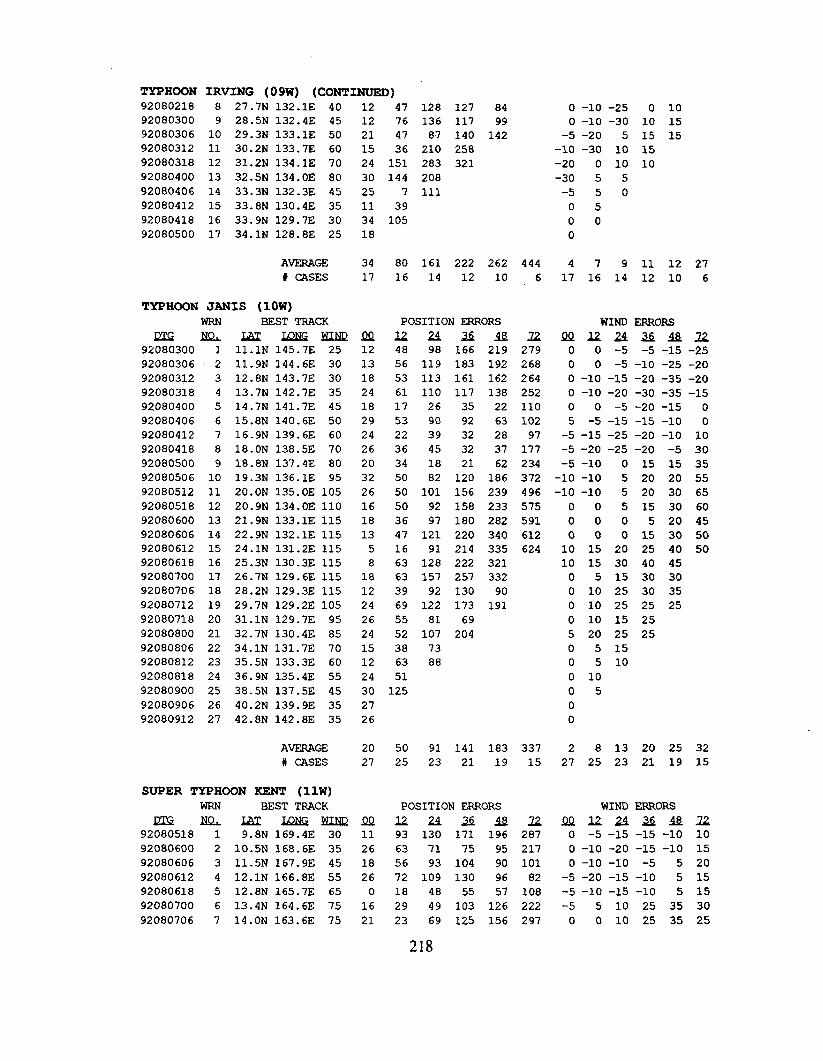
TYPHOON IRVING (09W) (CONTXNUED)
92080218
92080300
92080306
92080312
92080318
92080400
92080406
92080412
92080418
92080500
8 27.7N 132.lE 409 28.5N 132.4E 4510 29.3N 133.lE 5011 30.2N 133.7E 6012 31.2N 134.lE 7013 32.5N 134.OE 8014 33.3N 132.3E 4515 33.8N 130.4E 3516 33.9N 129.7E 3017 34.lN 128.8E 25
AVERAGE# CASES
TYPHOON JANIS (1OW)
WRN BEST TRACK
DE ML LAX LQNGhz$!92080300 1 11.lN 145.7E 25
92080306 2 11.9N 144.6E 30
92080312 3 12.8N 143.7E 30
92080318 4 13.7N 142.7E 35
92080400 5 14.7N 141.7E 45
92080406 6 15.8N 140.6E 50
92080412 7 16.9N 139.6E 60
92080418 8 18.ON 138.5E 70
92080500 9 18.8N 137.4E 80
92080506 10 19.3N 136.lE 95
92080512 11 20.ON 135.OE 105
92080518 12 20.9N 134.OE 110
92080600 13 21.9N 133.lE 115
92080606 14 22.9N 132.lE 11592080612 15 24.lN 131.2E 115
92080618 16 25.3N 130.3E 115
92080700 17 26.7N 129.6E 115
92080706 18 28.2N 129.3E 115
92080712 19 29.7N 129.2E 105
92080718 20 31.lN 129.7E 95
92080800 21 32.7N 130.4E 85
92080806 22 34.lN 131.7E 7092080812 23 35.5N 133.3E 60
92080818 24 36.9N 135.4E 55
92080900 25 38.5N 137.5E 45
92080906 26 40.2N 139.9E 35
92080912 27 42.8N 142.8E 35
AVERAGE# CASES
SUPER TYPHOON KENT (llw)WRN BEST TRACK
m ML m LQNG!N.LNQ92080518 1 9.8N 169.4E 30
92080600 2 10.5N 168.6E 35
92080606 3 11.5N 167.9E 45
92080612 4 12.lN 166.8E 55
92080618 5 12.8N 165.7E 65
92080700 6 13.4N 164.6E 75
92080706 7 14.ON 163.6E 75
12122115243025113418
3417
Q(212
13
18
24
18
29
24
26
20
32
26
16
18
13
5
818
12
24
26
24
1512
24
30
27
26
2027
J2Q1126182601621
47 128 127 8476 136 117 9947 87 140 14236 210 258151 283 321144 2087 11139105
80 161 222 26216 14 12 10
POSITION ERRORS
U a 3Q48 98 166 219
56 119 183 192
53 113 161 162
61 110 117 138
17 26 35 22
53 90 92 63
22 39 32 28
36 45 32 37
34 18 21 62
50 82 120 186
50 101 156 239
50 92 158 233
36 97 180 282
47 121 220 340
16 91 214 335
63 128 222 321
63 157 257 332
39 92 130 90
69 122 173 191
55 81 69
52 107 204
38 7363 88
51
125
50 91 141 18325 23 21 19
POSITION ERRORS
lzzflii! ia93 130 171 196
63 71 75 95
56 93 104 90
72 109 130 96
18 48 55 57
29 49 103 126
23 69 125 156
4446
lz27926826425211010297177234372496575591612624
33715
Z28721710182108222297
0 -10 -25 0 100 -lo -30 10 15
-5 -20 5 15 15-10 -30 10 15-20 0 10 10-30 5 5-5 5 005000
47 9 11 12 2717 16 14 12 10 6
WIND ERRORS
QQ12axilQz00 -5 -5 -15 -2500 -5 -10 -25 -200 -lo -15 –20 -35 -200 -lo -20 -30 -35 -150 0 -5 -20 -15 05 -5 -15 -15 -10 0–5 -15 -25 -20 -10 10-5 -20 -25 -20 -5 30-5 -lo 0 15 15 35-lo -lo 5 20 20 55-lo -lo 5 20 30 65
00 5 15 30 60000 5 20 4500 0 15 30 5010 15 20 25 40 5010 15 30 40 450 5 15 30 300 10 25 30 350 10 25 25 250 10 15 255 20 25 250 5 150 5 100 100500
2 8 13 20 25 3227 25 23 21 19 15
WIND ERRORS
SX!lziklxao -5 -15 -15 -lo0 -lo -20 -15 -lo0 -lo -lo -5 5
-5 -20 -15 -lo 5-5 -lo -15 -lo 5-5 5 10 25 350 0 10 25 35
X1015
2015
15
30
25
218

SUPER TYPHO92080712 8
92080718 9
92080800 10
92080806 11
92080812 12
92080818 1392080900 14
92080906 15
92080912 16
92080918 17
92081000 18
92081006 19
92081012 20
92081018 21
92081100 22
92081106 23
92081112 24
92081118 25
92081200 26
92081206 27
92081212 28
92081218 29
92081300 30
92081306 31
92081312 32
92081318 33
92081400 34
92081406 35
92081412 36
92081418 37
92081500 38
92081506 39
92081512 40
92081518 41
92081600 42
92081606 43
92081612 44
92081618 45
92081700 4692081706 47
92081712 48
92081718 49
92081800 50
92081806 51
92081812 52
92081818 53
92081900 54
92081906 55
92081912 56
92081918 57
92082000 58
ON RENT (llW) (CONT~)
14.6N 162.6E 80 12 5 ’5015.ON 161.5E 85 6 24 5315.5N 160.5E 90 8 46 51
16.2N 159.6E 90 13 17 29
17.ON 158.9E 90 36 66 9117.5N 157.8E 90 38 73 7218.ON 156.7E 90 16 25 42
18.5N 155.4E 90 16 25 7418.9N 154.5E 95 11 46 8’7
19.2N 153.6E 95 12 17 26
19.4N 152.8E 95 0 21 2919.6N 152.OE 100 6 18 30
19.9N 151.lE 110 16 22 3420.2N 150.2E 120 8 28 20
20.5N 149.3E 125 6 12 28
20.9N 148.4E 125 11 22 5021.3N 147.7E 130 13 16 50
21.7N 147.OE 130 8 33 8222.lN 146.3E 130 11 34 93
22.5N 145.8E 130 13 61 127
22.8N 145.4E 125 12 44 7623.2N 145.lE 120 0 20 56
23.6N 145.OE 115 17 38 4924.ON 144.8E 110 12 42 4224.5N 144.7E 105 5 20 1725.2N 144.5E 100 17 50 10825.8N 144.OE 95 17 135 7226.lN 143.6E 90 16 41 84
26.4N 143.2E 85 6 24 6826.7N 142.7E 80 11 48 10227.ON 142.3E 80 18 58 117
27.2N 141.7E 75 5 63 120
27.4N 140.8E 75 28 71 12727.5N 139.9E 70 16 42 8027.7N 139.OE 65 27 72 11927.9N 138.OE 65 16 57 91
28.lN 137.lE 60 16 37 41
28.3N 136.2E 55 28 49 6428.7N 135.3E 55 28 57 8329.lN 134.3E 55 21 54 106
29.7N 133.4E 55 13 44 7030.3N 132.7E 55 23 66 105
31.ON 132.lE 55 13 39 8031.7N 131.6E 50 23 65 10332.4N 131.2E 45 23 24 5333.2N 131.OE 40 30 38 54
34.lN 130.9E 35 26 50 9035.lN 130.9E 30 41 90
36.3N 131.2E 25 43 35
37.5N 131.9E 25 48
38.6N 132.8E 25 35
AVERAGE 18 44 72# CASES 58 56 54
54 72 23162 97 19259 85 1535 53 13970 32 6371 78 11172 92 11890 111 222
129 171 31557 108 26750 90 27553 86 23827 30 16131 85 21982 162 267100 181 272123 193 264141 203 270156 179 257172 191 25184 97 13051 66 12043 53 10126 27 14560 138 278
168 250 424143 249 441187 296 502135 220 426175 267 445187 267 402197 262 345173 230 303120 161 210171 186 18499 79 7920 0 15958 46 189107 145 379139 199121 211175 303144 225175111
105 142 23752 50 46
-5 -lo -5 5 10 15-5 0 10 20 20 5-5 0 10 15 20 00 5 15 20 20 000 0 10 5 -5
-5 0 0 5 -5 -lo-5 -5 0 -5 -lo -lo0 -5 -5 -15 -lo -lo05 -5 -15,-15 -50 0 -15 -15 -15 05 -5 -15 -15 -lo 100 -15 -15 -15 -lo 15
-lo -20 -20 -15 -lo 0-5 5 0 0 5 15-5 0 0 5 10 20-5 0 0 10 15 30-5 0 5 15 20 350 0 10 20 25 400 5 10 20 25 350 10 15 20 25 350 5 10 20 25 35
-5 -5 0 5 10 2000 5 10 10 2000 5 15 15 20-5 -5 5 10 20 35-5 0 10 15 25 400 5 10 15 30 400 10 15 15 20 50 5 10 25 35 400 10 15 25 40 150 5 20 30 35 1005 5 15 15 150 5 10 15 15 25005 5 10 300 5 10 15 20 2501050 0 1500-5 0 10 200055 5 150 -5 -5 0 5 1005 5 10 100 5 10 15 150 10 15 20 150 10 15 20 155 15 20 205 10 15 155 10 105 15 10050000
26 9 14 16 1958 56 54 52 50 46
219

TROPICAL STORM LOIS (12W)
WRN BEST TRACK
m NSL LAX IQN.Gm92081506 1 15.8N 129.3E 2592081512 2 16.3N 130.OE 2592081518 3 16.7N 130.7E 30
92081600 4 17.lN 131.4E 30
92081606 5 17.3N 132.2E 3092081612 6 17.6N 133.OE 30
92081618 7 18.ON 133.8E 30
92081700 8 18.4N 134.5E 3592081706 9 18.8N 135.2E 3592081712 10 19.4N 135,7E 35
92081718 11 20.ON 136.2E 4092081800 12 20.7N 136.6E 40
92081806 13 21.4N 137.OE 40
92081812 14 22.2N 137.4E 35
92081818 15 23.lN 137,8E 3592081900 16 24.lN 138.3E 35
92081906 17 25.lN 139.OE 35
92081912 18 26.lN 139.7E 3592081918 19 27.2N 140.5E 3592082000 20 28.lN 141.5E 35
92082006 21 29.ON 142.7E 30
92082012 22 30.ON 144.lE 3092082018 23 31.2N 145,7E 3092082100 24 32.7N 147.lE 3092082106 25 34.3N 148.4E 25
92082112 26 35.9N 149.8E 2592082118 27 37.3N 151.6E 2592082200 28 38.5N 153.7E 25
AVERAGE
# CASES
TROPICAL STORM MARK (13W)
WRN BEST TRACK
QQ3445833781624121336625849556916517163224265431144910030
3728
IuG ML L2LCLQNGIUNDL!Q92081512 1 19.7N 117.5E 25 101
9208160092081606920816129208161892081700920817069208171292081718920818009208180692081812920818189208190092081906920819129208191892082000920820069208201892082106
23456789101112131415161718192021
20.6N 117.2E20.8N 116.9E21.lN 116.9E21.4N 117.2E21.6N 117.5E21.9N 117.6E22.lN 117.8E22.4N 117.9E22.7N 117.9E23.lN 117.9E23.4N 117.8E23.7N 117.6E23.8N 117.2E23.8N 116.7E23.6N 116.3E23.2N 116.lE22.9N 115.9E22.6N 115.8E22.lN 115.3E21.6N 114.3E
3035404045505050504545403535303025252520
452681326302637818121122131124454086
POSITION ERRORS
lz. &la!i*97 195 315 423
142 257 349 407
183 280 370 420
139 220 297 364
67 128 176 225
43 80 106 154
75 122 157 200
12 17 24 52
42 94 134 187
96 142 172 213
119 186 231 289
90 153 225 294
95 124 163 231
100 116 182 279
82 114 167 311
43 123 247 410
51 150 297 456
80 210 359 503
52 135 205 285
90 177 271 369
74 134 219 283
54 114 132
130 180 19772 96
39 18147
212
90 143 218 303
27 25 23 21
POSITION ERRORS
12629
457
480
468
362
329
371
258
367
432
522
555
561
622
697
789
817
513
17
12z43ti&i12197 289 33981 126 15560 110 15555 83 90 7244 65 65 6853 54 42 4245 68 72 73 10536 53 69 82 15861 84 105 121 22420 71 140 212 34542 104 172 229 39449 122 174 23573 147 221 29485 154 21637 89 12958 906645 3658 11537
mo005555000
-500550555510101055000
3
28
Qo
–5
5
0
0
0
-5
-5
-5
0
5
0
5
00-5-50000
WIND ERRORS
lzxaia-5 -5 0 -5
-5 -5 -5 -5
5 10 10 1010 15 20 25
55 5 1005 5 15
00 5 150 0 10 20
-5 0 10 20
-5 5 10 20
-5 5 10 20
10 20 30 40
10 20 30 45
5 10 15 30
5 10 20 30
0 5 15 20
10 20 25 30
10 20 25 3010 10 15 15
10 10 15 15
10 15 15 10
10 15 15
15 15 15
10 5
5 -5
0
-5
6 9 14 2027 25 23 21
WIND ERRORS
lzaxal-5 -lo -15
-10 -10 –25
O -15 -25
-5 -15 -25 -20
-lo -15 -15 -15
055-5
0 5 15 20
-5 5 20 25
0 10 20 25
10 20 25 25
15 20 25 25
10 20 20 15555-500-50 0 -50 -5005055
22-50
204030303035404040556040403520
3317
12
2020303030
220

TROPICA.L STORM MARK (13W) (CONTINUED)
AVERAGE 26 61 104 143 143 246 2 4 9 17 18 26# CASES 21 20 18 15 10 5 21 20 18 15 10 5
TROPICAL STORM NINA (14W)
WRN BEST TRACK
lzl& m LAz LQN.GNLNQ92081818 1 27.6N 158.3E 2592081900 2 28.ON 157.8E 3092081906 3 28.5N 157.2E 3592081912 4 29.9N 156.3E 4092081918 5 31.6N 155.6E 4592082000 6 33.4N 155.4E 4592082006 7 35.lN 155.8E 4592082012 8 36.7N 156.9E 4592082018 9 38.lN 158.5E 4592082100 10 39.2N 161.OE 4092082106 11 39.8N 164.OE 4092082112 12 39.8N 168.2E 4092082118 13 39.8N 172.4E 40
QQ2331137153111015305175
POSITION ERRORS
lzxx=27 153 288 406
86 132 165 211
98 200 310 424
86 179 309 467
50 113 186 333
98 180 312
25 46 239
23 45
18 83
119 268
95
79
WIND ERRORS
u QQ12 Z!Lx M U881 0 -lo -20 -15 -15 -5493 -5 -5 -5 -5 -5 -lo799 0 -5 0 -5 -5 -5
0 0 0 0-50 -5 -15 -15 -200 -5 -lo -150 -5 -lo -15-5 0 -lo-5 -lo -200 -lo -15
-5 -15-lo -15-15
AVERAGE 16 67 140 259 369 725 3 7 11 10 10 7# CASES 13 12 10 7 5 3 13 12 10 7 5 3
SUPER TYPHOON OMAR (lSW)
t4Fu4 BEST TRACK
RzG ML LAX LQNGMLNQ92082406 1 8.3N 156.5E 2592082412 2 8.6N 155.4E 30
92082418 3 8.9N 154.3E 3592082500 4 9.2N 153.2E 40
92082506 5 9.6N 152.2E 4592082512 6 9.9N 151.2E 45
92082518 7 10.2N 150.3E 50
92082600 8 10.6N 149.6E 5592082606 9 10.8N 148.9E 5592082612 10 11.lN 148.4E 5592082618 11 11.4N 148.lE 60
92082700 12 11.8N 148.OE 6592082706 13 12.2N 147.8E 7092082712 14 12.5N 147.3E 7592082718 15 12.8N 146.6E 80
92082800 16 13.lN 145.8E 8592082806 17 13.4N 145.OE 100
92082812 18 13.6N 144.2E 11592082818 19 13.8N 143.4E 115
92082900 20 14.ON 142.6E 120
92082906 21 14.2N 141.8E 12092082912 22 14.4N 141.lE 125
92082918 23 14.7N 140.5E 130
92083000 24 15.ON 140.OE 13092083006 25 15.4N 139.5E 125
92083012 26 15.8N 138.9E 12592083018 27 16.ON 138.3E 12092083100 28 16.5N 137.6E 120
92083106 29 16.9N 136.8E 120
92083112 30 17.3N 136.OE 120
92083118 31 17.8N 135.2E 120
92090100 32 18.4N 134.2E 115
Lx-23024185
546355291658341817131213088132430013172918226012
POSITION ERRORS WIND ERRORS
u M 35 * 22 9!2 12 Zflxa E17 24 34 77 231 0 -5 -10 -5 0 5
17 24 29 63 186 -5 -lo -5 -5 5 5
25 18 8 59 153 -5-1o-5 0 5 5
6 33 88 176 289 -5 0 0 10 10 10
89 130 205 290 358 -5 –5 O 5 5 -5
101 144 216 294 402 -5 -lo -5 -5 -5 -20
95 150 246 304 379 -5 -5 -5 -10 -10 -25
85 179 263 282 331 -5 0 -5 0 5 -15
68 133 174 193 262 0 5 0 0 -lo -lo
47 94 114 155 229 0 0 -5 -5 -25 -15
59 76 95 147 255 -5 -lo -20 -35 -45 -40
36 34 31 34 60 -5 -15 -20 -45 -40 -40
39 68 65 66 43 -5 -15 -30 -40 -40 -35
11 26 46 69 95 -lo -15 -40 -40 -35 -35
35 48 45 66 109 -5 -25 -35 -35 -40 -30
8 13 34 48 74 -5 -30 –30 -30 -30 -20
34 62 70 79 108 10 0 0 -5 5 10
30 62 91 122 207 0 0 0 0 10 20
29 62 99 160 203 0 5 -5 5 10 15
37 81 127 178 222 5 5 5 10 20 30
42 26 124 160 227 10 0 10 15 20 30
61 98 120 138 184 5 0 10 15 20 35
66 90 122 141 234 0 5 15 15 20 35
5 0 13 58 170 0 5 5 5 5 20
16 36 65 118 227 5 0 -lo -15 -15 0
25 33 24 13 63 -10 -10 -20 -20 -20 020 13 0 46 82 -5 -15 -lo 0 10 40
40 62 88 117 126 -5 -lo 0 5 15 45
8 41 94 141 194 -5 -5 -5 0 10 30
17 35 87 127 210 0 0 0 5 15 25
25 73 113 147 255 0 5 10 15 25 25
45 107 139 185 305 5 5 10 20 30 30
221
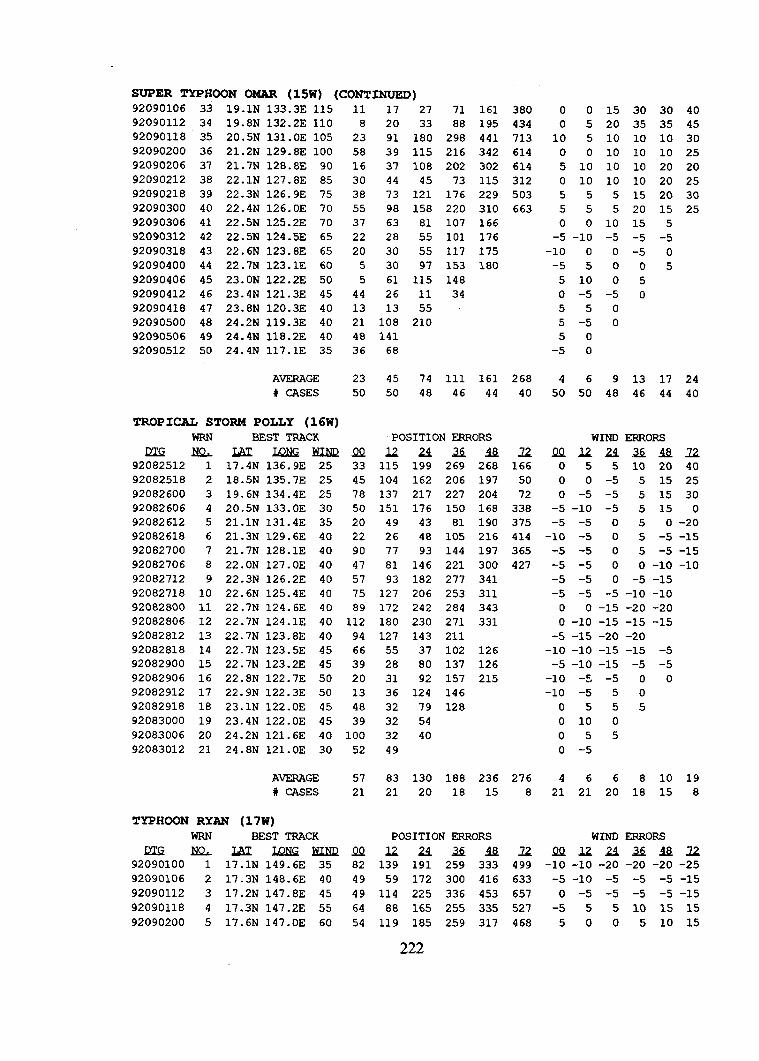
SUPER TYPHOON OMAR (lSW) (CONTINUED)92090106 33 19.lN 133.3E 11592090112 34 19.8N 132.2E 11092090118 35 20.5N 131.OE 10592090200 36 21.2N 129.8E 10092090206 37 21.7N 128.8E 9092090212 38 22.lN 127.8E 8592090218 39 22.3N 126.9E 7592090300 40 22.4N 126.OE 7092090306 41 22.5N 125.2E 7092090312 42 22.5N 124.5E 6592090318 43 22.6N 123.8E 6592090400 44 22.7N 123.lE 6092090406 45 23.ON 122.2E 5092090412 46 23.4N 121.3E 4592090418 47 23.8N 120.3E 4092090500 48 24.2N 119.3E 4092090506 49 24.4N 118.2E 4092090512 50 24.4N 117.lE 35
AVERAGE# CASES
TROPICAL STORM POLLY (16w)
WRN BEST TRACK
RIG m Lhl LQNGl!UNQ92082512 1 17.4N 136.9E 2592082518 2 18.5N 135.7E 25
92082600 3 19.6N 134.4E 25
92082606 4 20.5N 133.OE 30
92082612 5 21.lN 131.4E 35
92082618 6 21.3N 129.6E 40
92082700 7 21.7N 128.lE 40
92082706 8 22.ON 127.OE 40
92082712 9 22.3N 126.2E 40
92082718 10 22.6N 125.4E 4092082800 11 22.7N 124.6E 4092082806 12 22.7N 124.lE 40
92082812 13 22.7N 123.8E 4092082818 14 22.7N 123.5E 4592082900 15 22.7N 123.2E 45
92082906 16 22.8N 122.7E 5092082912 17 22.9N 122.3E 50
92082918 18 23.lN 122.OE 4592083000 19 23.4N 122.OE 45
11 17 27 71 1618 20 33 88 195
23 91 180 298 44158 39 115 216 34216 37 108 202 30230 44 45 73 11538 73 121 176 22955 98 158 220 31037 63 81 107 16622 28 55 101 17620 30 55 117 1755 30 97 153 1805 61 115 14844 26 11 3413 13 5521 108 21048 14136 68
23 45 74 111 161
50 50 48 46 44
!2!2334578502022904757758911294663920134839
POSITION ERRORS
u M X*115 199 269 268
104 162 206 197
137 217 227 204
151 176 150 168
49 43 81 190
26 48 105 21677 93 144 197
81 146 221 300
93 182 277 341
127 206 253 311
172 242 284 343
180 230 271 331
127 143 211
55 37 102 126
28 80 137 126
31 92 157 215
36 124 146
32 79 128
32 54
380 0 0 15 30 30 40434 0 5 20 35 35 45713 10 5 10 10 10 30614 0 0 10 10 10 25614 5 10 10 10 20 20312 0 10 10 10 20 25503 5 5 5 15 20 30663 5 5 5 20 15 25
0 0 10 15 5-5 -lo -5 -5 -5
-lo 0 0 -5 0-55005
510050 -5 -5 05505 -5 050
-5 0
268 4 6 9 13 17 2440 50 50 48 46 44 40
WIND ERRORS
lzQQ12z.43Mim166 0 5 5 10 20 4050 0 0 -5 5 15 2572 0 -5 -5 5 15 30
338 -5 -lo -5 5150375 -5 -5 0 5 0 -20414 -lo -5 0 5 -5 -15365 -5 -5 0 5 -5 -15427 -5 -5 0 0 -lo -lo
-5 -5 0 -5 -15-5 -5 -5 -lo -lo0 0 –15 -20 -200 -lo -15 -15 -15
-5 -15 -20 -20-lo -lo -15 -15 -5-5 -lo -15 -5 -5-lo -5 -5 0 0-lo -5 5 005550100
92083006 20 24.2N 121.6E 40 100 32 40 05592083012 21 24.8N 121.OE 30
AVERAGE# CASES
TYPHOON RYAN (17W)WRN BEST TRACK
m m J.&l LQNGh?XNQ92090100 1 17.lN 149.6E 3592090106 2 17.3N 148.6E 4092090112 3 17.2N 147.8E 4592090118 4 17.3N 147.2E 5592090200 5 17.6N 147.OE 60
52 49
57 83 130 188 236 27621 21 20 18 15 8
POSITION ERRORS
L!Qlzaxmz82 139 191 259 333 49949 59 172 300 416 63349 114 225 336 453 65764 88 165 255 335 52754 119 185 259 317 468
0 -5
466 8 10 1921 21 20 18 15 8
WIND ERRORS
L!QJ.za3*2z–10 -10 -20 -20 -20 -25-5 -lo -5 -5 -5 -150 -5 -5 -5 -5 -15-5 5 5 10 15 15500 5 10 15
222
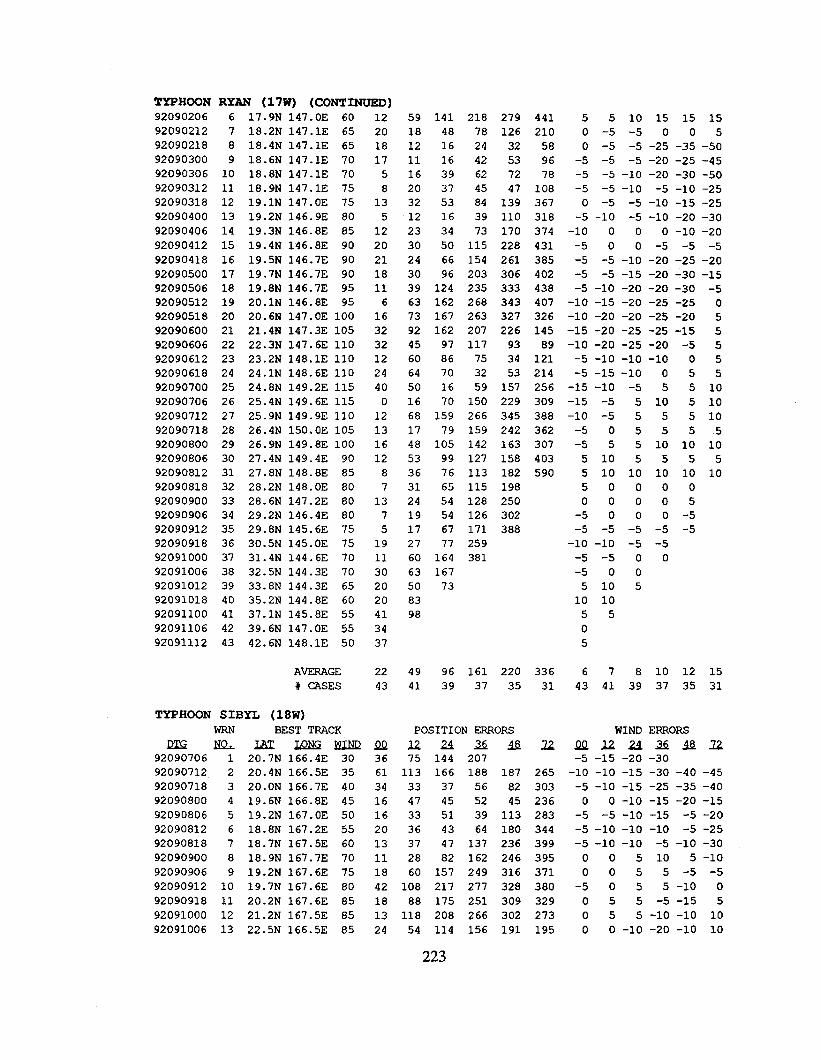
TYPHOON
92090206
92090212
9209021892090300
9209030692090312
92090318
92090400
92090406
92090412
92090418
92090500920905069209051292090518
92090600
920906069209061292090618
9209070092090706
92090712
92090718920908009209080692090812
92090818920909009209090692090912
920909189209100092091006
920910129209101892091100
92091106
92091112
RYAN (17W) (CONTI141
6 17.9N 147.OE 60
7 18.2N 147.lE 658 18.4N 147.lE 65
9 18.6N 147.lE 7010 18.8N 147.lE 70
11 18.9N 147.lE 7512 19.lN 147.OE 75
13 19.2N 146.9E 80
14 19.3N 146.8E 85
15 19.4N 146.8E 90
16 19.5N 146.7E 90
17 19.7N 146.7E 9018 19.8N 146.7E 9519 20.lN 146.8E 9520 20.6N 147.OE 100
21 21.4N 147.3E 10522 22.3N 147.6E 11023 23.2N 148.lE 11024 24.lN 148.6E 110
25 24.8N 149.2E 115
26 25.4N 149.6E 115
27 25.9N 149.9E 11028 26.4N 150.OE 10529 26.9N 149.8E 100
30 27.4N 149.4E 9031 27.8N 148.8E 8532 28.2N 148.OE 80
33 28.6N 147.2E 8034 29.2N 146.4E 80
35 29.8N 145.6E 7536 30.5N 145.OE 7537 31.4N 144.6E 70
38 32.5N 144.3E 7039 33.8N 144.3E 6540 35.2N 144.8E 6041 37.lN 145.8E 55
42 39.6N 147.OE 55
43 42.6N 148.lE 50
AVERAGE# CASES
TYPHOON SIBYL (18w)
WRN BEST TRACK
QXG m LAX LQNGm92090706 1 20.7N 166.4E 3092090712 2 20.4N 166.5E 3592090718 3 20.ON 166.7E 4092090800 4 19.6N 166.8E 4592090806 5 19.2N 167.OE 5092090812 6 18.8N 167.2E 5592090818 7 18.7N 167.5E 6092090900 8 18.9N 167.7E 70
92090906 9 19.2N 167.6E 7592090912 10 19.7N 167.6E 80
92090918 11 20.2N 167.6E 85
92091000 12 21.2N 167.5E 85
92091006 13 22.5N 166.5E 85
mm)122018175813512202118116
16323212244001213161287
13751911302020413437
22
43
S!Q36613416162013111842181324
59 141 218 279 441 5 5 10 15 15 1518 48 78 126 21O 0 -5 -5 0 0 512 16 24 32 58 0 -5 -5 –25 -35 -5011 16 42 53 96 -5 -5 -5 -20 -25 -4516 39 62 72 78 -5 -5 -10 -20 -30 -5020 37 45 47 108 -5 -5 -10 -5 -10 -2532 53 84 139 367 0 -5 -5 -10 -15 -2512 16 39 110 318 -5 -lo -5 -lo -20 -3023 34 73 170 374 -lo 0 0 0 -lo -2030 50 115 228 431 -5 0 0 -5 -5 -524 66 154 261 385 -5 -5 -10 -20 -25 -2o30 96 203 306 402 -5 -5 -15 -20 -30 -1539 124 235 333 438 -5 -10 -20 -20 -30 -563 162 268 343 407 -10 -15 -20 -25 -25 073 167 263 327 326 -10 -20 -20 -25 -20 592 162 207 226 145 -15 -20 -25 -25 -15 545 97 117 93 89 -10 -20 -25 -20 -5 560 86 75 34 121 -5 -lo -lo -lo 0 564 70 32 53 214 -5 -15 -lo 0 5 550 16 59 157 256 -15 -10 -5 5 5 1016 70 150 229 309 –15 -5 5 10 5 1068 159 266 345 388 -lo -5 5 5 5 1017 79 159 242 362 -5 0 5 5 5 548 105 142 163 307 -5 5 5 10 10 1053 99 127 158 403 510 5 5 5 536 76 113 182 590 5 10 10 10 10 1031 65 115 198 5000024 54 128 250 0000519 54 126 302 -5 0 0 0 -517 67 171 388 -5 -5 -5 -5 -527 77 259 -lo -lo -5 -560 164 381 -5 -5 0 063 167 -5 0 050 73 510583 10 1098 55
05
49 96 161 220 336 6 7 8 10 12 1541 39 37 35 31 43 41 39 37 35 31
POSITION ERRORS
Kzflxa75 144 207
113 166 188 187
33 37 56 82
47 45 52 45
33 51 39 113
36 43 64 180
37 47 137 236
28 82 162 246
60 157 249 316
108 217 277 328
88 175 251 309
118 208 266 302
54 114 156 191
2
265303236283344399395371380329273195
WIND ERRORS
QQlz&lx*z-5 -15 -20 -30-lo -lo -15 -30 -40 -45-5 -10 -15 -25 -35 -400 0 -lo -15 -20 -15
-5 -5 -lo -15 -5 -20-5 -10 -10 -10 -5 -25-5 -10 -10 -5 -lo -3000 5 10 5 -lo0 0 5 5 -5-5-5 0 5 5 -lo 0055-5-15505 5 -lo -lo 100 0 -lo -20 -lo 10
223

TYPHOON92091012920910189209110092091106920911129209111892091200920912069209121292091218920913009209130692091312920913189209140092091406920914129209141892091500
SIBYL (18w) {CONT31n.lED)14 23.3N 165.OE 85 8 5215 23.9N 163.5E 90 11 3016 24.3N 162.OE 90 16 4517 24.8N 160.6E 100 8 3418 25.5N 159.3E 105 8 3619 26.3N 158.lE 110 13 1820 27.lN 157.OE 105 5 2621 28.lN 156.OE 100 13 7022 29.ON 155.2E 95 13 7223 29.7N 154.7E 90 7 1624 30.4N 154.3E 80 11 3925 31.2N 154.lE 75 6 4026 32.lN 154.2E 75 5 3927 33.ON 154.6E 70 16 5328 33.9N 155.lE 60 18 3729 34.7N 155.8E 55 15 3530 35.6N 156.9E 55 22 8131 36.7N 158.OE 50 60 12932 37.8N 159.lE 45 26 37
62 66 120 265 0 0 -15 -15 -5 1042 72 144 276 -5 -lo -20 -lo -5 1060 99 188 316 -5 -15 -15 -5 5 1531 98 172 285 -10 -20 -10 0 10 2073 106 160 380 -5 5 20 35 30 4048 102 145 295 5 25 35 45 40 45111 158 201 277 20 30 45 45 50 50133 188 231 247 20 30 40 45 55 55112 154 222 285 15 20 15 15 10 2076 128 202 290 10 15 10 15 10 588 156 204 10 5105584 149 200 10 5105590 108 128 5 10 510596 109 140 05 510561 77 0 -lo -5 0103 128 0 5105132 0 10 10146 5105
0 -5
AVERAGE 19 54 98 138 192 304 5 10 13 16 16 22# CASES 32 32 31 29 26 22 32 32 31 29 26 22
TYPHOON TED (19W)
WRN BEST TRACK POSITION EFWtORSDTG NO. LAT I.lJNGWIND 00 12 24 36 48
92091800 1 15.lN 137.9E 25 16 58 124 160 15492091806 2 15.5N 136.3E 30 44 110 175 196 19392091812 3 15.7N 134.7E 30 29 75 111 90 9792091818 4 15.8N 132.9E 35 11 8 34 80 8692091900 5 16.ON 131,1E 40 21 31 85 126 17792091906 6 16.2N 129.6E 45 24 75 123 147 23292091912 7 16.5N 128.3E 45 64 161 214 250 36792091918 8 17.lN 127.lE 45 12 25 102 160 16892092000 9 17.9N 126.lE 45 41 79 159 191 13992092006 10 18.2N 125.lE 50 21 108 189 183 8692092012 11 18.4N 124.lE 55 21 66 136 90 3292092018 12 18.5N 122.9E 60 18 66 120 150 17392092100 13 18.7N 122.2E 60 41 95 150 168 22592092106 14 19.ON 121.9E 60 34 143 293 416 54192092112 15 19.4N 121.8E 60 26 147 282 378 48292092118 16 20.5N 121.9E 65 54 174 276 378 49892092200 17 22.ON 121.9E 65 60 152 230 322 45292092206 18 23.5N 121.6E 60 18 52 97 142 20592092212 19 24.9N 121.2E 55 12 58 88 135 10392092218 20 26.2N 120.9E 50 28 52 87 13992092300 21 27.5N 120.8E 50 22 38 65 2392092306 22 29.ON 120.7E 45 12 58 7992092312 23 30.4N 120.8E 45 50 141 18192092318 24 32.ON 121.2E 45 23 5092092400 25 33.7N 122.OE 40 12 8692092406 26 35.2N 124.OE 40 3592092412 27 35.7N 127.OE 40 6
WIND ERRORS72 00 12 24 36 48189 0 0 -5 0 10166 0 0 0 10 1558 0 0 0 10 10298 0 -5 5105271 0 0 5 5 10552 -5 0 0 -10 0655 10 20 5 5 15175 0 5 10 25 30196 0 0 10 25 30117 0 0 10 20 30196 0 0 10 20 30330 0 5 5 25 35439 0 5 5 30 35869 0 0 10 30 40731 5 0 15 30 40
5 10 25 25 25050550055500 5105
-5 0 0 0005000555505000
-lo
72101515101015256565454040454545
AVERAGE 28 85 148 187 233 350 2 3 6 14 20 33# CASES 27 25 23 21 19 15 27 25 23 21 19 15
224
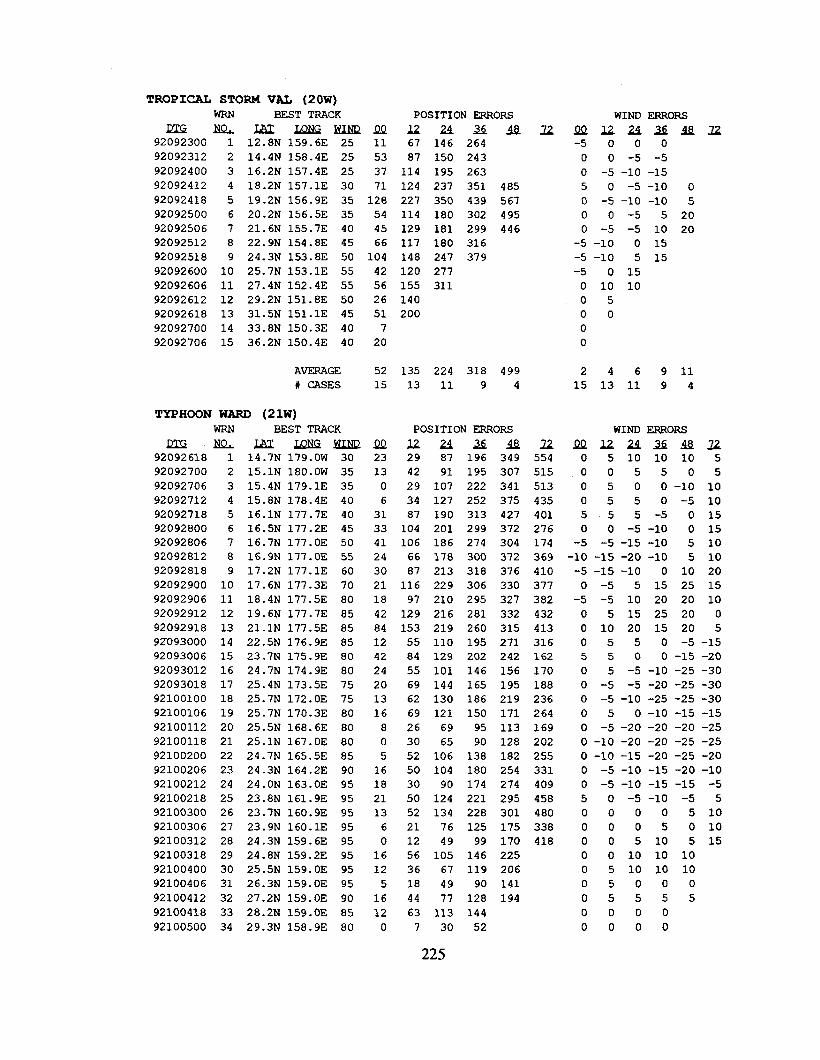
TROPICAL STORM VAL (20W)WRN BEST TRACK
QzG IU&Li3z LQN.ENLNRQ292092300 1 12.8N 159.6E 25 1192092312 2 14.4N 158.4E 25 5392092400 3 16.2N 157.4E 25 3792092412 4 18.2N 157.lE 30 7192092418 5 19.2N 156.9E 35 12892092500 6 20.2N 156.5E 35 5492092506 7 21.6N 155.7E 40 4592092512 8 22.9N 154.8E 45 6692092518 9 24.3N 153.8E 50 10492092600 10 25.7N 153.lE 55 4292092606 11 27.4N 152.4E 55 5692092612 12 29.2N 151.8E 50 2692092618 13 31.5N 151.lE 45 5192092700 14 33.8N 150.3E 40 792092706 15 36.2N 150.4E 40 20
AVERAGE 52
# CASES 15
TYPHOON WARD (21W)
m BEST TRACK
LUG NLXL!QNGHI.NQQ!292092618 1 14.7N 179.OW 30 23
92092700 2 15.lN 180.OW 35 13
92092706 3 15.4N 179.lE 35 0
92092712 4 15.8N 178.4E 40 6
92092718 5 16.lN 177.7E 40 31
92092800 6 16.5N 177.2E 45 33
92092806 7 16.7N 177.OE 50 41
92092812 8 16.9N 177.OE 55 24
92092818 9 17.2N 177.lE 60 30
92092900 10 17.6N 177.3E 70 21
92092906 11 18.4N 177.5E 80 18
92092912 12 19.6N 177.7E 85 4292092918 13 21.lN 177.5E 85 84
92?093000 14 22.5N 176.9E 85 1292093006 15 23.7N 175.9E 80 42
92093012 16 24.7N 174.9E 80 2492093018 17 25.4N 173.5E 75 20
92100100 18 25.7N 172.OE 75 1392100106 19 25.7N 170.3E 80 16
92100112 20 25.5N 168.6E 80 8
92100118 21 25.lN 167.OE 80 0
92100200 22 24.7N 165.5E 85 592100206 23 24.3N 164.2E 90 1692100212 24 24.ON 163.OE 95 18
92100218 25 23.8N 161.9E 95 2192100300 26 23.7N 160.9E 95 13
92100306 27 23.9N 160.lE 95 692100312 28 24.3N 159.6E 95 0
92100318 29 24.8N 159.2E 95 1692100400 30 25.5N 159.OE 95 12
92100406 31 26.3N 159.OE 95 5
92100412 32 27.2N 159.OE 90 16
92100418 33 28.2N 159.OE 85 12
92100500 34 29.3N 158.9E 80 0
POSITION ERRORS
Ui?flx*67 146 264
87 150 243
114 195 263
124 237 351 485
227 350 439 567
114 180 302 495
129 181 299 446
117 180 316
148 247 379
120 277
155 311
140
200
135 224 318 49913 11 9 4
POSITION ERRORS
12221xa29 87 196 34942 91 195 30729 107 222 34134 127 252 37587 190 313 427104 201 299 372106 186 274 30466 178 300 37287 213 318 376116 229 306 33097 210 295 327129 216 281 332153 219 260 31555 110 195 27184 129 202 24255 101 146 15669 144 165 19562 130 186 21969 121 150 17126 69 95 11330 65 90 12852 106 138 18250 104 180 25430 90 174 27450 124 221 29552 134 228 30121 76 125 17512 49 99 17056 105 146 22536 67 119 20618 49 90 14144 77 128 19463 113 1447 30 52
22
22554515513435401276174369410377382432413316162170188236264169202255331409458480338418
WIND ERRORS
QQnaxau-5 0 0 000 -5 -50 -5 -lo -1550 -5 -lo 00 -5 -lo -lo 50 0 -5 5 200 -5 -5 10 20
-5 -lo 0 15-5 -lo 5 15-5 0 150 10 10050000
246 9 1115 13 11 9 4
WIND ERRORS
S!!2 U a,= AQlzo 5 10 10 10 5005505050 0 -lo 100 5 5 0-.5 10555-5 0 1500 -5 -lo 0 15
-5 -5 -15 -lo 5 10-lo -15 -20 -lo 5 10-5 -15 -lo 0 10 200 -5 5 15 25 15
-5 -5 10 20 20 100 5 15 25 20 00 10 20 15 20 50 5 5 0-5-15550 0 -15 -2005 -5 -10 -25 -300 -5 -5 -20 -25 -300 -5 -10 -25 -25 -3005 0 -lo -15 -150 -5 -20 -20 -20 -250 -10 -20 -20 -25 -250 -10 -15 -20 -25 -200 -5 -lo -15 -20 -100 -5 -lo -15 -15 -550 -5 -lo -5 50000 5 100005 0 1000 5 10 5 150 0 10 10 100 5 10 10 10050000555500000000
225

TYPHOON WARD (21W) (CONTINUED)
92100506 35 30.5N 158.8E 80 692100512. 36 31.8N 158.9E 75 1192100518 37 33.2N 159.lE 70 2492100600 38 34.8N 159.5E 65 1592100606 39 36.5N 160.2E 60 592100612 40 38.4N 161.5E 55 15
AVERAGE 18
# CASES 40
TROPICAL STORM ZACX (22W)
WRN BEST TRACK
m N!&uzu?wkmQQi!92100706 1 9.5N 166.9E 25 24992100712 2 9.5N 165.8E 30 3892100718 3 9.6N 164.7E 30 4292100800 4 9.7N 163.7E 25 4192100806 5 9.8N 162.7E 25 5092100812 6 9.9N 161.8E 25 2192100818 7 9.9N 160.9E 25 1392100900 8 9.9N 160.OE 30 3492100906 9 9.7N 159.lE 30 6792100912 10 9.9N 158.3E 35 2992100918 11 10.6N 158.3E 35 7192101000 12 11.4N 158.8E 35 7692101006 13 12.2N 159.5E 30 3792101012 14 13.lN 160.2E 25 3792101018 15 14.ON 160.8E 25 5992101100 16 15.ON 161.4E 25 12692101112 17 17.3N 161.6E 25 18992101200 18 18.9N 160.lE 25 202921013O6* 19 22.5N 155.2E 30 8892101312 20 23.3N 154.2E 35 892101318 21 24.ON 153.5E 40 2992101400 22 24.4N 153.2E 40 2392101406 23 24.8N 153.OE 35 2192101412 24 25.2N 152.9E 30 1892101418 25 25.6N 152.9E 30 3492101500 26 26.ON 152.9E 25 3292101506 27 26.4N 152.9E 25 40
AVERAGE 62
# CASES 27
* Regenerated Warning
SUPER TYPHOON YVETTE (23w)WRN BEST TRACK
m m I&c LQNGMI.NQ92100800 1 15.4N 131.lE 3092100806 2 15.3N 130.3E 3592100812 3 15.2N 129.5E 4092100818 4 15.lN 128.7E 4592100900 5 15.ON 127.9E 5092100906 6 15.ON 127.lE 5592100912 7 15.ON 126.3E 6092100918 8 15.ON 126.OE 7092101000 9 15.lN 125.8E 8092101006 10 15.3N 125.8E 90
u!6235362516131841816
5 5847 904324
57 123 194 26438 36 34 32
POSITION ERRORS
lzaxu307 325 325 32055 58 72 9750 58 91 8160 93 124 27090 138 216 41143 60 153 36743 83 274 48258 101 297 49441 137 331 512156 337 520 649221 407 571 6668 115 237 292
59 175 278 28591 183 185 14396 147 135 139
216 277 340181 156 186227121 133 160 21159 136 196 23184 131 191 25080 165 227 29876 120 186 24645 81 12486 142 2313552
98 157 236 32327 24 24 20
POSITION ERRORS
12z!ls*116 166 224 309
70 99 138 225
58 79 156 266
34 63 136 226
16 66 139 226
41 117 205 314
92 186 279 371
116 193 296 406
21 49 93 150
36 81 132 189
34528
12106323421692789745786672614650656345332195217
303
49116
z533408472461437519580615274313
000055000000
14 7 10 12 1440 38 36 34 32 28
WINO ERRORS
QQ12aM*o 0 15 25 30
-5 5 15 20 250 10 15 20 255 10 10 15 25055 5 20000 5 2500 0 10 2500 5 20 305 0 10 20 300 5 20 25 350 5 15 25 350 10 15 25 355 10 10 15 2010 10 10 10 1510 10 10 10 100000000-5-5 -50 -lo 0 5 10-5 -lo 5 10 10-lo -5 0 10 10-lo 0 5 5 5-5055505000000000 -5
Zii5055555545454550so5050452515-5
5
34 7 12 21 4027 27 24 24 20 16
WIND ERRORS
!2!2lz MM &z-5 -5 -5 -5 -20 -55-5 0 0 -5 -15 -5500 0 -15 -35 -50
10 10 5 0 -20 -2510 15 10 0 -15 -2050 -5 -15 -25 -200 -10 -15 -25 -45 -25
-5 -15 -25 -35 -40 -30-5 -lo -20 0 15 -5-5 -15 -lo 10 15 -15
226
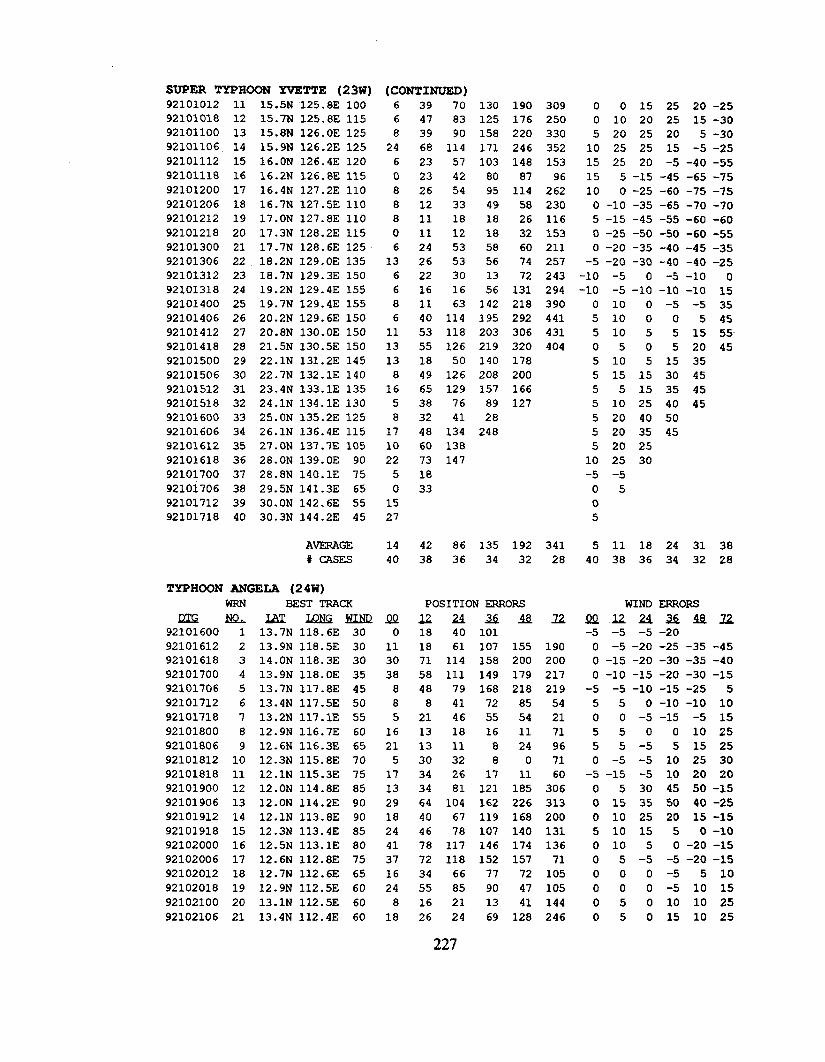
SUPER TYPHOON YVETTE (23W)92101012 11 15.5N 125.8E 10092101018 12 15.7N 125.8E 115
92101100 13 15.8N 126.OE 12592101106 14 15.9N 126.2E 125
92101112 15 16.ON 126.4E 120
92101118 16 16.2N 126.8E 115
92101200 17 16.4N 127.2E 110
92101206 18 16.7N 127,5E 11092101212 19 17.ON 127.8E 110
92101218 20 17.3N 128.2E 11592101300 21 17.7N 128.6S 125
92101306 22 18.2N 129.OE 135
92101312 23 18.7N 129.3E 15092101318 24 19.2N 129.4E 155
92101400 25 19.7N 129.4E 15592101406 26 20.2N 129.6E 150
92101412 27 20.8N 130.OE 15092101418 28 21.5N 130.5E 150
92101500 29 22.lN 131.2E 14592101506 30 22.7N 132.lE 14092101512 31 23.4N 133.lE 135
92101518 32 24.lN 134.lE 130
92101600 33 25.ON 135.2E 12592101606 34 26.lN 136.4E 11592101612 35 27.ON 137.7E 105
92101618 36 28.ON 139.OE 9092101700 37 28.8N 140.lE 75
92101706 38 29.5N 141.3E 65
92101712 39 30.ON 142.6E 5592101718 40 30.3N 144.2E 45
AVERAGE
# CASES
TYPHOON ANGELA (24W)
WRN BEST TRACK
lXG N&- IAl IQNGNIl!U292101600 1 13.7N 118.6E 30
92101612 2 13.9N 118.5E 3092101618 3 14.ON 118.3E 3092101700 4 13.9N 118.OE 3592101706 5 13.7N 117.8E 45
92101712 6 13.4N 117.5E 50
92101718 7 13.2N 117.lE 5592101800 8 12.9N 116.7E 60
92101806 9 12.6N 116.3E 6592101812 10 12.3N 115.8E 7092101818 11 12.lN 115.3E 75
92101900 12 12.ON 114.8E 8592101906 13 12.ON 114.2E 90
92101912 14 12.lN 113.8E 9092101918 15 12.3N 113.4E 85
92102000 16 12.5N 113.lE 8092102006 17 12.6N 112.8E 75
92102012 18 12.7N 112.6E 65
92102018 19 12.9N 112.5E 60
92102100 20 13.lN 112.5E 60
92102106 21 13.4N 112.4E 60
(CONTINUED)
668
246088806
13668611131381658171022501527
1440
$!!2o11303888516215171329182441371624818
39 70 130 190 309
47 83 125 176 250
39 90 158 220 330
68 114 171 246 352
23 57 103 148 153
23 42 80 87 96
26 54 95 114 262
12 33 49 58 230
11 18 18 26 116
11 12 18 32 153
24 53 58 60 211
26 53 56 74 257
22 30 13 72 243
16 16 56 131 294
11 63 142 218 390
40 114 195 292 441
53 118 203 306 431
55 126 219 320 404
18 50 140 178
49 126 208 200
65 129 157 166
38 76 89 127
32 41 28
48 134 248
60 138
73 147
18
33
42 86 135 192 34138 36 34 32 28
POSITION ERRORS
l.za%a18 40 101
18 61 107 155
71 114 158 200
58 111 149 179
48 79 168 218
8 41 72 85
21 46 55 54
13 18 16 11
13 11 8 24
30 32 8 0
34 26 17 11
34 81 121 185
64 104 162 226
40 67 119 168
46 78 107 140
78 117 146 174
72 118 152 157
34 66 77 72
55 85 90 47
16 21 13 41
26 24 69 128
22
190
200
217
219
54
21
71
96
71
60
306
313
200
131
136
71
105
105
144246
0 0 15 25 20 -250 10 20 25 15 -305 20 25 20 5 -3010 25 25 15 -5 -2515 25 20 -5 -40 -5515 5 -15 -45 -65 -7510 0 -25 -60 -75 -750 -10 -35 -65 -70 -705 -15 -45 -55 -60 -600 -25 -50 -50 -60 -550 -20 -35 -40 -45 -35
-5 -20 -30 -40 -40 -25-lo -5 0 -5 -lo 0-lo -5 -lo -lo -lo 150 10 0 -5 -5 3551000 5 455105 5 15 55050 5 20 455 10 5 15 355 15 15 30 455 5 15 35 455 10 25 40 455 20 40 505 20 35 455 20 2510 25 30-5 -50505
5 11 18 24 31 3840 38 36 34 32 28
WIND ERRORS
QQlzz!l. xalz-5 -5 -5 -200 -5 -20 -25 -35 -450 -15 -20 -30 -35 -400 -lo -15 -20 -30 -15
-5 -5 -10 -15 -25 5
55 0 -lo -lo 10
00 -5 -15 -5 15
550 0 10 25
55-5 5 15 25
0 -5 -5 10 25 30-5 -15 -5 1.0 20 20
0 5 30 45 50 -150 15 35 50 40 -25
0 10 25 20 15 -155 10 15 5 0 -lo
0105 0 -20 -15
05-5 -5 -20 -15
000-5 5 10
000 -5 10 15
05 0 10 10 25
05 0 15 10 25
227
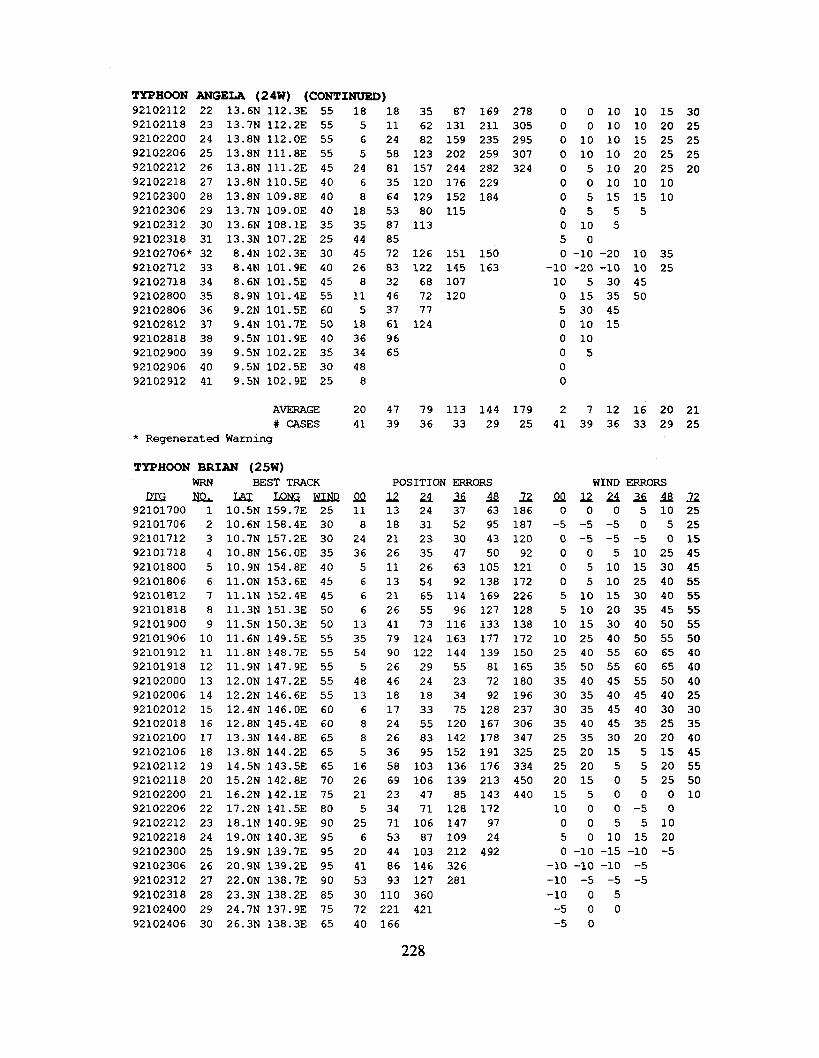
TYPHOON i#NGELA (24W) (CONTINUED)92102112 22 13.6N 112.3E 55 18 1892102118 23 13.7N 112.2E 55 5 1192102200 24 13.8N 112.OE 55 6 2492102206 25 13.8N 111.8E 55 5 5892102212 26 13.8N 111.2E 45 24 8192102218 27 13.8N 11O.5E 40 6 3592102300 28 13.8N 109.8E 40 8 6492102306 29 13.7N 109.OE 40 18 5392102312 30 13.6N 108.1E 35 35 8792102318 31 13.3N 107.2E 25 44 85921027O6* 32 8.4N 102.3E 30 45 7292102712 33 8.4N 101.9E 40 26 8392102718 34 8.6N 101.5E 45 8 3292102800 35 8.9N 101.4E 55 11 4692102806 36 9.2N 101.5E 60 5 3792102812 37 9.4N 101.7E 50 18 6192102818 38 9.5N 101.9E 40 36 9692102900 39 9.5N 102.2E 35 34 6592102906 40 9.5N 102.5E 30 4892102912 41 9.5N 102.9E 25 8
35 87 169 278 0 0 1062 131 211 305 0 0 1082 159 235 295 0 10 10123 202 259 307 0 10 10157 244 282 324 0 5 10120 176 229 0 0 10129 152 184 0 5 1580 115 055113 0 10 5
50126 151 150 0 -lo -20122 145 163 -lo -20 -1068 107 10 5 3072 120 0 15 3577 5 30 45124 0 10 15
0 100500
10 1510 2015 2520 2520 2510 1015 105
10 35
10 254550
AVERAGE 20 47 79 113 144 179 2 7 12 16 20# CASES 41 39 36 33 29 25 41 39 36 33 29
* Regenerated Warning
TYPHOON BRIAN (25w)
BEST TRACKWRN
m ML LAz IQNGkUliRQQ92101700 1 10.5N 159.7E 25 1192101706 2 10.6N 158.4E 30 892101712 3 10.7N 157.2E 30 2492101718 4 10.8N 156.OE 35 3692101800 5 10.9N 154.8E 40 592101806 6 11.ON 153.6E 45 692101812 7 11.lN 152.4E 45 6
92101818 8 11.3N 151.3E 50 6
92101900 9 11.5N 150.3E 50 1392101906 10 11.6N 149.5E 55 3592101912 11 11.8N 148.7E 55 54
92101918 12 11.9N 147.9E 55 5
92102000 13 12.ON 147.2E 55 4892102006 14 12.2N 146.6E 55 13
92102012 15 12-4N 146.OE 60 692102018 16 12.8N 145.4E 60 892102100 17 13.3N 144.8E 65 8
92102106 18 13.8N 144.2E 65 5
92102112 19 14.5N 143.5E 65 1692102118 20 15.2N 142.8E 70 2692102200 21 16.2N 142.lE 75 2192102206 22 17.2N 141.5E 80 5
92102212 23 18.lN 140.9E 90 25
92102218 24 19.ON 140.3E 95 692102300 25 19.9N 139.7E 95 20
92102306 26 20.9N 139.2E 95 41
92102312 27 22.ON 138.7E 90 53
92102318 28 23.3N 138.2E 85 30
92102400 29 24.7N 137.9E 75 72
92102406 30 26.3N 138.3E 65 40
POSITION ERRORS
Uaxa13 24 37 63
18 31 52 95
21 23 30 43
26 35 47 50
11 26 63 105
13 54 92 138
21 65 114 169
26 55 96 127
41 73 116 133
79 124 163 177
90 122 144 139
26 29 55 81
46 24 23 72
18 18 34 92
17 33 75 128
24 55 120 16726 83 142 178
36 95 152 191
58 103 136 176
69 106 139 213
23 47 85 143
34 71 128 172
71 106 147 97
53 87 109 24
44 103 212 492
86 146 326
93 127 281
110 360
221 421
166
22!2!2186 0
187 -5
120 092 0
121 0172 0226 5128 5138 10172 10150 25165 35180 35196 30237 30306 35347 25325 25334 25450 20440 15
10050
-lo-lo-lo-5-5
WIND ERRORS
J.zuxu00 5 10
-5 -5 0 5–5 -5 -5 00 5 10 255 10 15 305 10 25 4010 15 30 4010 20 35 4515 30 40 5025 40 50 5540 55 60 6550 55 60 6540 45 55 5035 40 45 4035 45 40 3040 45 35 2535 30 20 2020 15 5 1520 5 5 2015 0 5 25500000-5005 5 100 10 15 20
-lo -15 -lo -5-lo -lo -5-5 -5 -505000
3025252520
21
25
22252515454555555555504040402530354045555010
228
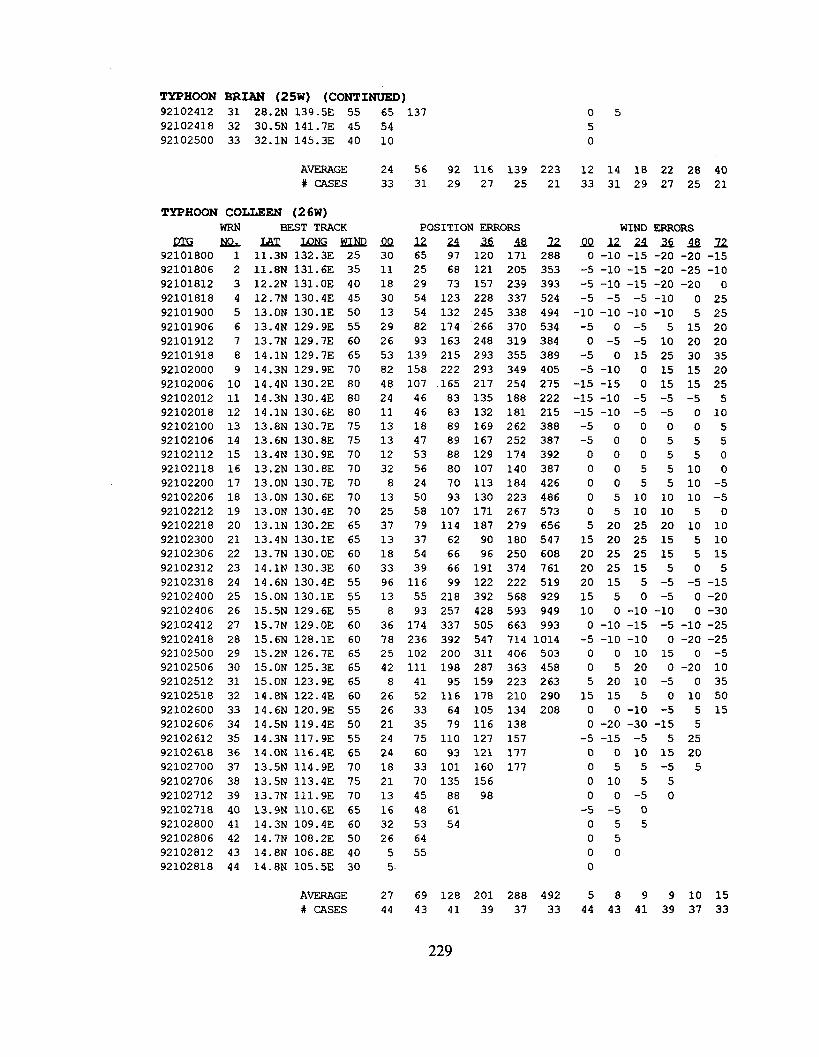
TYPHOON BRIAN (25w) (CONTINUED)92102412 31 28.2N 139.5E 55
92102418 32 30.5N 141.7E 45
92102500 33 32.lN 145.3E 40
AVERAGE# CASES
TYPHOON COLLEEN (26w)
WRN BEST TRACK
IllSL LAX IL2N.GM.LNQD92101800 1 11.3N 132.3E 2592101806 2 11.8N 131.6E 3592101812 3 12.2N 131.OE 4092101818 4 12.7N 130.4E 4592101900 5 13.ON 130.lE 5092101906 6 13.4N 129.9E 5592101912 7 13.7N 129.7E 6092101918 8 14.lN 129.7E 6592102000 9 14.3N 129.9E 7092102006 10 14.4N 130.2E 8092102012 11 14.3N 130.4E 8092102018 12 14.lN 130.6E 8092102100 13 13.8N 130.7E 7592102106 14 13.6N 130.8E 7592102112 15 13.4N 130.9E 7092102118 16 13.2N 130.8E 7092102200 17 13.ON 130.7E 7092102206 18 13.ON 130.6E 7092102212 19 13.ON 130.4E 7092102218 20 13.lN 130.2E 6592102300 21 13.4N 130.lE 6592102306 22 13.7N 130.OE 6092102312 23 14.lN 130.3E 6092102318 24 14.6N 130.4E 5592102400 25 15.ON 130.lE 5592102406 26 15.5N 129.6E 5592102412 27 15.7N 129.OE 6092102418 28 15.6N 128.lE 6092102500 29 15.2N 126.7E 6592102506 30 15.ON 125.3E 6592102512 31 15.ON 123.9E 6592102518 32 14.8N 122.4E 6092102600 33 14.6N 120.9E 5592102606 34 14.5N 119.4E 5092102612 35 14.3N 117.9E 5592102618 36 14.ON 116.4E 6592102700 37 13.5N 114.9E 7092102706 38 13.5N 113.4E 7592102712 39 13.7N 111.9E 7092102718 40 13.9N 11O.6E 6592102800 41 14.3N 109.4E 6092102806 42 14.7N 108.2E 5092102812 43 14.8N 106.8E 4092102818 44 14.8N 105.5E 30
AVERAGE# CASES
65
54
10
24
33
m30
11
18
30
13
29
26
53
82
48
24
1113
13
12
32
8
13
2537
13
18
33
96
13
8
36
78
25
42
8
26
26
21
24
24
18
21
13
16
32
26
5
5
27
44
137
56 92 11631 29 27
POSITION ERR
l.zax65 97 120
25 68 121
29 73 157
54 123 228
54 132 245
82 174 266
93 163 248
139 215 293
158 222 293
107 165 217
46 83 135
46 83 132
18 89 169
47 89 16753 88 129
56 80 107
24 70 113
50 93 130
58 107 17179 114 187
37 62 90
54 66 96
39 66 191
116 99 122
55 218 392
93 257 428
174 337 505
236 392 547102 200 311
111 198 28741 95 159
52 116 178
33 64 105
35 79 116
75 110 127
60 93 121
33 101 160
70 135 156
45 88 98
48 61
53 54
64
55
69 128 20143 41 39
139 22325 21
ORS
Blz171 288205 353
239 393
337 524338 494
370 534319 384
355 389
349 405254 275
188 222181 215262 388252 387174 392
140 387
184 426
223 486267 573
279 656180 547
250 608374 761
222 519
568 929593 949
663 993714 1014406 503
363 458223 263
210 290134 208
138157
177177
288 49237 33
05
5
0
12 14 18 22 28 40
33 31 29 27 25 21
WIND ERRORS
QQUM3*Uo -lo -15 -20 -20 -15
-5 -10 -15 -20 -25 -10-5 -lo -15 -20 -20 0-5 -5 -5 -lo 0 25
-lo -lo -lo -lo 5 25-5 0 -5 5 15 200 -5 -5 10 20 20-5 0 15 25 30 35-5 -lo 0 15 15 20-15 -15 0 15 15 25-15 -lo -5 -5 -5 5-15 -lo -5 -5 0 10-500005-500555000550005 5100005 5 10 -50 5 10 10 10 -50 5 10 10 5 05 20 25 20 10 1015 20 25 15 5 1020 25 25 15 5 1520 25 15 5 0 520 15 5 -5 -5 -1515 5 0 -5 0 -2010 0 -lo -lo 0 -300 -lo –15 -5 -10 -25-5 -lo -lo 0 -20 -250 0 10 15 0 -50 5 20 0 -20 105 20 10 -5 0 3515 15 5 0 10 500 0 -10 -5 5 150 -20 -30 -15 5
-5 -15 -5 5 250 0 10 15 200 5 5-5 50105500-50-5 -5 005505000
589 9 10 15
44 43 41 39 37 33
229

TYPHOON DAN (27u)
WRN BEST TRACK
R1’!2 m LA2 L&MGIW,D92102418 1 10.7N 177.6t4 25
92102500 2 11. ON 178.7W 30
92102506 3 11.7N 179.5W 30
92102512 4 12.6N 179.7E 35
92102518 5 13.3N 178.7E 40
92102600 6 13.7N 177.5E 45
92102606 7 14.2N 176.OE 55
92102612 8 14.7N 174.3E 60
92102618 9 15.2N 172.6E 65
92102700 10 15.7N 171.lE 70
92102706 11 16.4N 169.9E 80
92102712 12 17.lN 168.9E 90
92102718 13 17.8N 168.OE 100
92102800 14 18.6N 167.lE 11092102806 15 19.5N 166.2E 110
92102812 16 20.3N 165.4E 10092102818 17 21.ON 164.9E 100
92102900 18 21.6N 164.6E 100
92102906 19 22.ON 164.5E 95
92102912 20 22.lN 164.3E 9592102918 21 22.ON 164.lE 9092103000 22 21.7N 163.6E 9092103006 23 21.3N 162.8E 8592103012 24 20.7N 161.7E 8592103018 25 20.2N 160.5E 80
92103100 26 19.7N 159.2E 8092103106 27 19.3N 157.8E 80
92103112 28 19.lN 156.2E 8092103118 29 19.2N 154.5E 85
92110100 30 19.6N 152.9E 95
92110106 31 20.lN 151.4E 10592110112 32 20.8N 150.2E 110
92110118 33 21.6N 149.3E 110
92110200 34 22.4N 148.8E 105
92110206 35 23.lN 148.9E 10592110212 36 23.9N 149.6E 10092110218 37 24.9N 150.8E 9092110300 38 26.2N 152.6E 8092110306 39 27.8N 154.7E 7092110312 40 29.4N 156.9E 60
AVERAGE# CASES
SUPER TYPHOON ELSIE (28w)
WRN BEST TRACK
m m m IQNGEUNR92102918 1 8.6N 151.lE 30
92103000 2 8.9N 151.OE 35
92103006 3 9-ON 150.6E 40
92103012 4 9.2N 150.lE 45
92103018 5 9.3N 149.5E 50
92103100 6 9.4N 148.9E 55
92103106 7 9.5N 148.2E 60
92103112 8 9.5N 147.6E 65
92103118 9 9.4N 147.OE 65
POSITION ERRORS
QQlzz.$lxa25 89 173 200 234
21 117 174 210 259
56 143 180 231 273
17 51 107 170 225
24 75 154 205 231
29 70 112 108 100
26 76 81 47 22
13 35 12 8 48
13 5 24 55 87
0 31 74 117 169
17 75 129 197 285
20 54 99 155 220
13 42 82 143 182
8 34 18 50 108
20 35 8 62 174
5 39 83 130 205
12 21 72 151 263
5 77 161 250 357
24 113 199 302 409
21 69 152 226 256
26 95 187 243 260
29 99 172 246 265
33 98 178 257 311
23 28 84 147 187
8 32 37 63 116
20 36 28 71 138
8 52 107 153 186
18 76 139 169 212
16 50 96 148 315
29 53 103 207 455
42 103 200 390 713
5 24 127 361 640
8 77 235 506
11 115 319 544
22 142 343
12 64 19324 136
28 6830
75
123773913933733301088368
149192329248180210461508535533553193156163224168342519648730
21 69 129 192 248 32840 38 36 34 32 28
POSITION ERRORS
QQuziiQ*66 67 41 105 182
24 71 149 236 282
36 116 198 267 245
24 50 112 174 163
16 78 143 153 168
0 51 85 87 97
13 62 86 98 130
8 30 40 66 100
8 47 50 84 81
WIND ERRORS
QQ u ax au00 -5 -10 -10 -250 0 0-5-5-2500-5 -5 -lo -2055 -5 -lo -20 -lo0 –5 -5 -15 -25 -50 -5 -5 -15 -20 0
-5 -5 -5 -lo –5 o-5 -5 -15 –20 5 00 -5 -lo -5 5 50-15-20555-5 -15 -lo 5 10 10-5 -15 5 15 20 15-5 -5 15 20 25 205 25 25 25 25 2051050-5-1010 5 5 -5 -15 -30555 -5 -15 -4000 0 -lo -20 -45000 -5 -20 -55
-10 -20 -25 -30 -35 -80-10 -15 -20 –30 –40 -80-10 -20 -25 -30 -50 -75-10 -15 -25 -35 -60 -75-15 -15 -25 -40 –65 –70-5 -5 -15 -40 -50 -40-5 -5 -25 -45 –45 –30-5 -lo -35 -45 -45 -20-5 -20 -35 -35 -35 -5
-10 -30 -35 -35 -25-20 -35 -30 -30 -15-30 -15 -15 -5 15-5 10 15 25 300 0 10 25-5 0 20 35
-lo -5 0-5 0 505050
-lo
6 9 14 20 24 2940 38 36 34 32 28
lztlsl230 -5242 0177 0126 0150 0201 10113 15107 1566 20
WIND ERRORS
U221.3U-lo -15 -15 -lo0 -5 -5 0
-5 -5 0 5-5 -5 0 50 5 10 2010 15 25 4020 25 30 3520 25 3.5 3520 25 30 30
22-51010152035302010
230
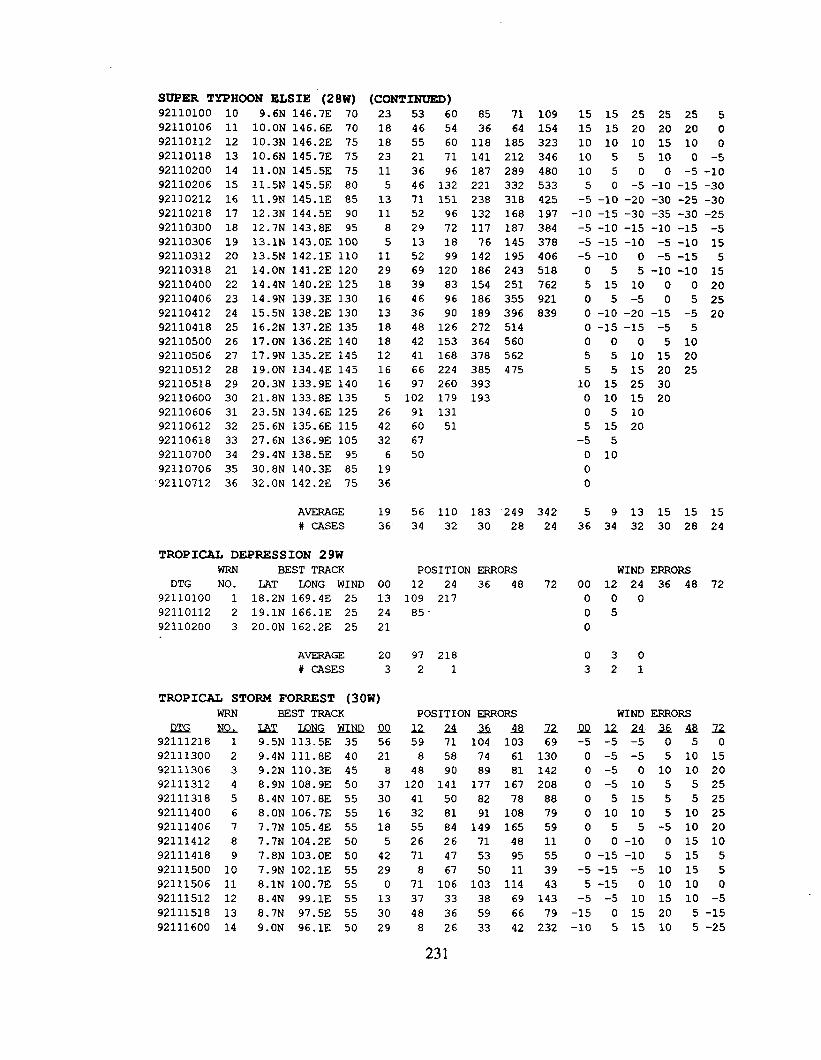
SUPER TYPHOON ELSIE (28w) (CO~~)
92110100 10 9.6N 146.7E 70
92110106 11 10.ON 146.6E 70
92110112 12 10.3N 146.2E 75
92110118 13 10.6N 145.7E 75
92110200 14 11.ON 145.5E 7592110206 15 11.5N 145.5E 8092110212 16 11.9N 145.lE 8592110218 17 12.3N 144.5E 9092110300 18 12.7N 143.8E 9592110306 19 13.lN 143.OE 10092110312 20 13.5N 142.lE 11092110318 21 14.ON 141.2E 12092110400 22 14.4N 140.2E 12592110406 23 14.9N 139.3E 13092110412 24 15.5N 138.2E 13092110418 25 16.2N 137.2E 13592110500 26 17.ON 136.2E 14092110506 27 17.9N 135.2E 14592110512 28 19.ON 134.4E 14592110518 29 20.3N 133.9E 14092110600 30 21.8N 133.8E 13592110606 31 23.5N 134.6E 12592110612 32 25.6N 135.6E 11592110618 33 27.6N 136.9E 10592110700 34 29.4N 138.5E 9592110706 35 30.8N 140.3E 8592110712 36 32.ON 142.2E 75
AVERAGE# CASES
TROPICAL DEPRESSION 29w
WRN BEST TRACKDTG NO. LAT LONG WIND
92110100 1 18.2N 169.4E 2592110112 2 19.lN 166.lE 2592110200 3 20.ON 162.2E 25
AVERAGE
# CASES
TROPICAL STORM FORREST (30W)
23 53 60 85 7118 46 54 36 6418 55 60 118 18523 21 71 141 21211 36 96 187 2895 46 132 221 33213 71 151 238 31811 52 96 132 1688 29 72 117 1875 13 18 76 14511 52 99 142 19529 69 120 186 24318 39 83 154 25116 46 96 186 35513 36 90 189 39618 48 126 272 51418 42 153 364 56012 41 168 378 56216 66 224 385 47516 97 260 3935 102 179 193
26 91 13142 60 5132 676 50
1936
19 56 110 183 249
36 34 32 30 28
POSITION ERRORS
00 12 24 36 48
13 109 217
24 85
21
20 97 218
321
WRN
RzGm92111218 192111300 292111306 392111312 492111318 592111400 692111406 792111412 892111418 992111500 1092111506 1192111512 1292111518 1392111600 14
BEST TRACK
u#lu2NGY.mr29.5N 113.5E 35
9.4N 111.8E 40
9.2N 11O.3E 458.9N 108.9E 50
8.4N 107.8E 55
8.ON 106.7E 55
7.7N 105.4E 55
7.7N 104.2E 50
7.8N 103.OE 50
7.9N 102.1E 55
8.lN 100.7E 55
8.4N 99.lE 55
8.7N 97.5E 55
9.ON 96.lE 50
QQ56218
37301618542290133029
POSITION ERRORS
12a2!29B59 71 104 1038 58 74 6148 90 89 81120 141 177 16741 50 82 7832 81 91 10855 84 149 16526 26 71 4871 47 53 958 67 50 1171 106 103 11437 33 38 6948 36 59 668 26 33 42
109154323346480533425197384378406518762921839
34224
72
12691301422088879591155394314379
232
15 15 25 25 25 5
15 15 20 20 20 0
10 10 10 15 10 010 5 5 10 0 -510 5 0 o–5-lo
50 -5 -lo -15 -30-5 -10 -20 -30 -25 -30
-10 -15 -30 -35 -30 -25
-5 -lo -15 -lo -15 -5-5 -15 -lo -5 -lo 15-5 -lo 0 -5 -15 5
05 5 -lo -lo 155 15 10 0 0 200 5-50 5 250 -lo -20 -15 -5 200 -15 -15 -5 5
000 5 105 5 10 15 205 5 15 20 25
10 15 25 30
0 10 15 200 5 105 15 20
-5 5
0 10
0
0
5 9 13 15 15 1536 34 32 30 28 24
WIND ERRORS00 12 24 36 48 72000050
030
321
WIND ERRORS
IQ u as a z-5 -5 -5 0 5 00 -5 -5 5 10 150 -5 0 10 10 200 -5 10 5 5 250 5155 5 250 10 10 5 10 25055 -5 10 200 0 -lo 0 15 100 -15 -lo 5155
-5 -15 -5 10 15 55 -15 0 10 10 0-5 -5 10 15 10 -5-15 0 15 20 5 -15-lo 5 15 10 5 -25
231
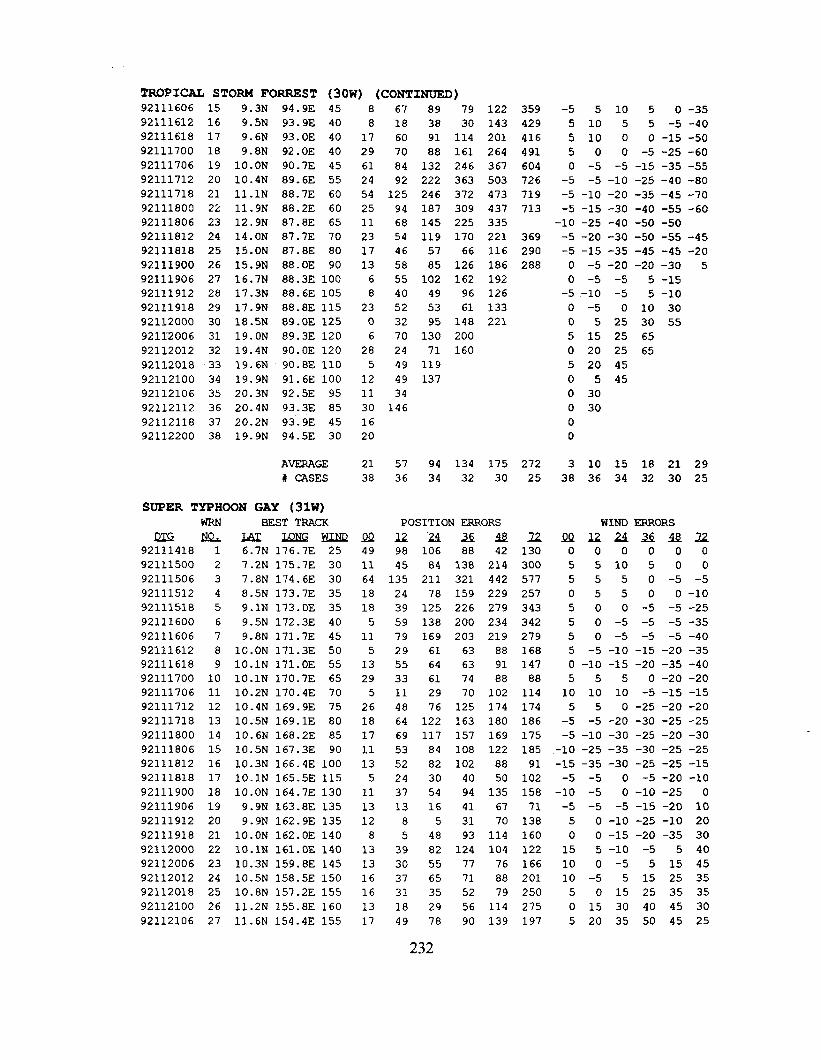
TROPICAL STORM FORREST (30W) (CONTINUED)92111606 15 9.3N 94.9E 4592111612 16 9.5N 93.9E 4092111618 17 9.6N 93.OE 4092111700 18 9.8N 92.OE 4092111706 19 10.ON 90.7E 4592111712 20 10.4N 89.6E 5592111718 21 11.lN 88.7E 6092111800 22 11.9N 88.2E 6092111806 23 12.9N 87.8E 6592111812 24 14.ON 87.7E 7092111818 25 15.ON 87.8E 8092111900 26 15.9N 88.OE 9092111906 27 16.7N 88.3E 10092111912 28 17.3N 88.6E 10592111918 29 17.9N 88.8E 11592112000 30 18.5N 89.OE 125921i2006 31 19.ON 89.3E 12092112012 32 19.4N 90.OE 12092112018 33 19.6N 90.8E 11092112100 34 19.9N 91.6E 10092112106 35 20.3N 92.5E 9592112112 36 20.4N 93.3E 8592112118 37 20.2N 93.9E 4592112200 38 19.9N 94.5E 30
AVERAGE# CASES
SUPER TYPHOON GAY (31W)WRN BEST TRAcK
m m LAX LQN.GMLNQ92111418 1 6.7N 176.7E 2592111500 2 7.2N 175.7E 3092111506 3 7.8N 174.6E 3092111512 4 8.5N 173.7E 3592111518 5 9.lN 173.OE 3592111600 6 9.5N 172.3E 4092111606 7 9.8N 171.7E 4592111612 8 10.ON 171.3E 5092111618 9 10.1N 171.OE 5592111700 10 10.1N 170.7E 6592111706 11 10.2N 170.4E 7092111712 12 10.4N 169.9E 7592111718 13 10.5N 169.lE 8092111800 14 10.6N 168.2E 8592111806 15 10.5N 167.3E 9092111812 16 10.3N 166.4E 10092111818 17 10.1N 165.5E 11592111900 18 10.ON 164.7E 13092111906 19 9.9N 163.8E 13592111912 20 9.9N 162.9E 13592111918 21 10.ON 162.OE 14092112000 22 10.1N 161.OE 14092112006 23 10.3N 159.8E 14592112012 24 10.5N 158.5E 15092112018 25 10.8N 157.2E 15592112100 26 11.2N 155.8E 16092112106 27 11.6N 154.4E 155
8 67 89 79 122 35981729612454251123171368
2306
2851211301620
21
38
QQ4911641818511513295261817111351113128
131316161317
1860708492
1259468544658554052327024494934146
38 30 143 42991 114 201 41688 161 264 491132 246 367 604222 363 503 726246 372 473 719187 309 437 713145 225 335119 170 221 36957 66 116 29085 126 186 288102 162 19249 96 12653 61 13395 148 221130 20071 160119137
57 94 134 175 27236 34 32 30 25
POSITION ERRORS
u ‘a X *98 106 88 4245 84 138 214135 211 321 44224 78 159 22939 125 226 27959 138 200 23479 169 203 21929 61 63 8855 64 63 9133 61 74 8811 29 70 10248 76 125 17464 122 163 18069 117 157 16953 84 108 12252 82 102 8824 30 40 5037 54 94 13513 16 41 678 5 31 705 48 93 11439 82 124 10430 55 77 7637 65 71 8831 35 52 7918 29 56 11449 78 90 139
z130300577257343342279168147881141741861751859110215871138160122166201250275197
-5 5105 0 -35510 5 5-5-405100 0 -15 -5050 0 -5 -25 -600 -5 -5 -15 -35 -55
-5 -5 -10 -25 -40 -80-5 -lo -20 -35 -45 -70-5 -15 -30 -40 -55 -60
-10 -25 -40 -50 -50-5 -20 -30 -50 -55 -45-5 -15 -35 -45 -45 -200 -5 -20 -20 -30 50 -5 -5 5 -15-5 -lo -5 5 –loo –5 o 10 300 5 25 30 555 15 25 650 20 25 655 20 450 5 450 300 3000
3 10 15 18 21 29
38 36 34 32 30 25
WIND ERRORS
Q(!M xx m lz000000
5 510 5 0 05 5 5 0 -5-50550 0 -lo500 -5 -5 -2550-5 -5 -5 -355 0 -5 -5 -5 -405 -5 -lo –15 -20 -350 -lo -15 -20 -35 -40555 0 -20 -2010 10 10 -5 -15 -1555 0 -25 -20 -20-5 -5 -20 -30 -25 -25-5 -10 -30 -25 -20 -30-10 -25 -35 -30 -25 -25-15 -35 -30 -25 -25 -15-5 -5 0 -5 -20 -lo
-lo -5 0 -10 -25 0-5 –5 -5 -15 -20 105 0 -10 -25 -10 200 0 -15 -20 -35 3015 5 -lo -5 5 4010 0 -5 5 15 4510 -5 5 15 25 355 0 15 25 35 350 15 30 40 45 305 20 35 50 45 25
L3L
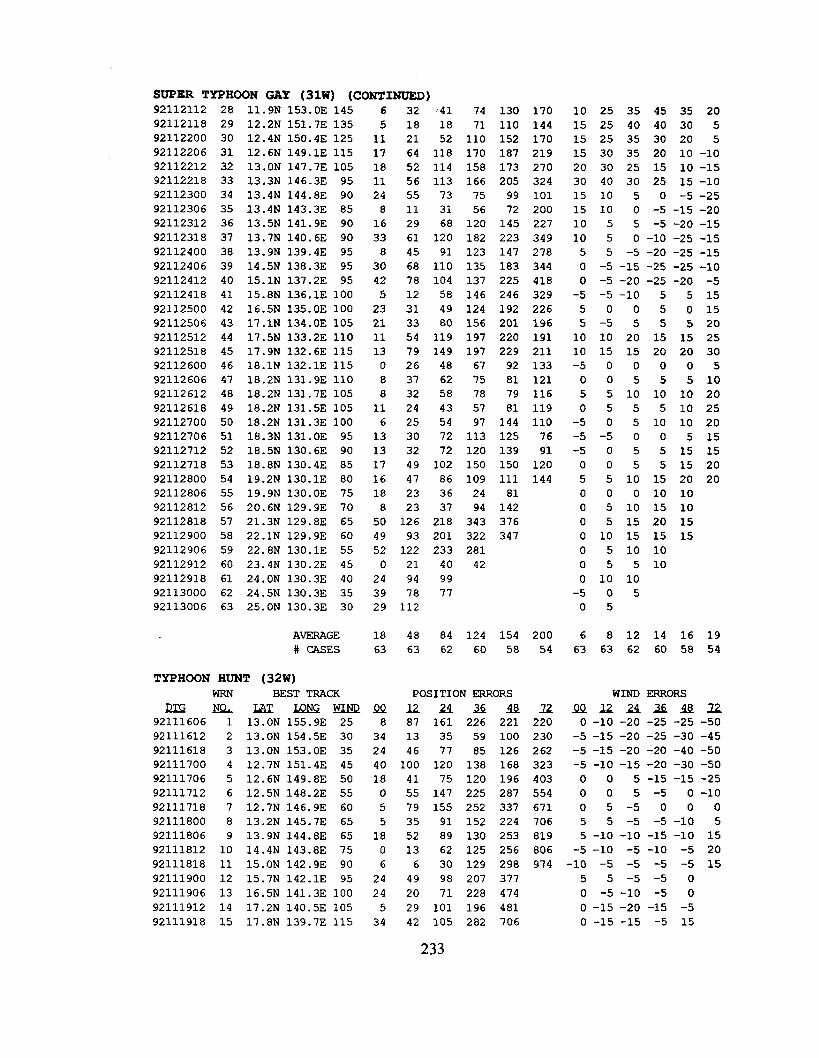
SUPER TYPHOON GAY (31W) (CONTINmD)92112112
92112118
92112200
92112206
92112212
92112218
92112300
92112306
92112312
92112318
92112400
92112406
92112412
92112418
92112500
92112506
92112512
92112518
92112600
92112606
92112612
92112618
92112700
92112706
92112712
92112718
92112800
92112806
92112812
92112818
92112900
92112906
92112912
92112918
92113000
92113006
TYPHOON
28 11.9N 153.OE 14529 12.2N 151.7E 13530 12.4N 150.4E 12531 12.6N 149.lE 11532 13.ON 147.7E 10533 13.3N 146.3E 9534 13.4N 144.8E 9035 13.4N 143.3E 8536 13.5N 141.9E 9037 13.7N 140.6E 9038 13.9N 139.4E 9539 14.5N 138.3E 9540 15.lN 137.2E 9541 15.8N 136.lE 10042 16.5N 135.OE 10043 17.lN 134.OE 10544 17.5N 133.2E 11045 17.9N 132.6E 11546 18.lN 132.lE 11547 18.2N 131.9E 11048 18.2N 131.7E 10549 18.2N 131.5E 10550 18.2N 131.3E 10051 18.3N 131.OE 9552 18.5N 130.6E 9053 18.8N 130.4E 8554 19.2N 130.lE 8055 19.9N 130.OE 7556 20.6N 129.9E 7057 21.3N 129.8E 6558 22.lN 129.9E 6059 22.8N 130.lE 5560 23.4N 130.2E 4561 24.ON 130.3E 4062 24.5N 130.3E 3563 25.ON 130.3E 30
AVERAGE# CASES
HUNT (32w)WRN
QKiML92111606 192111612 292111618 392111700 492111706 592111712 692111718 792111800 892111806 992111812 1092111818 1192111900 1292111906 1392111912 1492111918 15
BEST TRACK
lAXIQISGm13.ON 155.9E 2513.ON 154.5E 3013.ON 153.OE 3512.7N 151.4E 4512.6N 149.8E 5012.5N 148.2E 5512.7N 146.9E 6013.2N 145.7E 6513.9N 144.8E 6514.4N 143.8E 7515.ON 142.9E 9015.7N 142.lE 9516.5N 141.3E 10017.2N 140.5E 10517.8N 139.7E 115
651117181124816338
3042523211113088116
13131716188
5049520
243929
1863
C!Q8
342440180551806
2424534
32 ’41 7418 18 7121 52 11064 118 17052 114 15856 113 16655 73 7511 31 5629 68 12061 120 18245 91 12368 110 13578 104 13712 58 14631 49 12433 80 15654 119 19779 149 19726 48 6737 62 7532 58 7824 43 5725 54 9730 72 11332 72 12049 102 15047 86 10923 36 2423 37 94126 218 34393 201 322122 233 28121 40 4294 9978 77112
48 84 12463 62 60
POSITION ERR(
MUX87 161 22613 35 5946 77 85100 120 13841 75 12055 147 22579 155 25235 91 15252 89 13013 62 1256 30 129
49 98 20720 71 22829 101 19642 105 282
13011015218717320599721452231471832252461922012202299281798114412513915011181142376347
15458
)RS
m221100
126168
196287337
224253
256
298377
474481706
170 10 25 35 45 35 20144 15 25 40 40 30 5170 15 25 35 30 20 5219 15 30 35 20 10 -lo270 20 30 25 15 10 -15324 30 40 30 25 15 -10101 15 10 5 0 -5 -25200 15 10 0 -5 -15 -20227 10 5 5 -5 -20 -15349 10 5 0 -10 -25 -15278 5 5 -5 -20 -25 -15344 0 -5 -15 -25 -25 -10418 0 -5 -20 -25 -20 -5329 -5 -5 -10 5 5 15226 5 0 0 5 0 15196 5 -5 5 5 5 20191 10 10 20 15 15 25211 10 15 15 20 20 30133 -5 0 0 0 0 5121 0 0 5 5 5 10116 5 5 10 10 10 20119 0 5 5 5 10 25110 -5 0 5 10 10 2076 -5 -5 0 0 5 1591 -5 0 5 5 15 15120 0 0 5 5 15 20144 5 5 10 15 20 20
00 0 10 100 5 10 15 100 5 15 20 150 10 15 15 150 5 10 1005 5 100 10 10-5 0 505
200 6 8 12 14 16 19
54 63 63 62 60 58 54
WIND ERRORS
lzQQlzax*zL220 0 -10 -20 -25 -25 -50230 -5 -15 -20 -25 -30 -45
262 -5 -15 -20 -20 -40 -50
323 -5 -lo -15 -20 -30 -50
403 0 0 5 -15 -15 -25
554 0 0 5 -5 0 -10
671 0 5-5 0 0 0
706 5 5 -5 -5 -10 5
819 5 -lo -lo -15 -lo 15
806 -5 -lo -5 -lo -5 20
974 -lo -5 -5 -5 -5 15
5 5 -5 -5 0
0 -5 -lo -5 0
0 -15 -20 -15 -50 -15 -15 -5 15
233
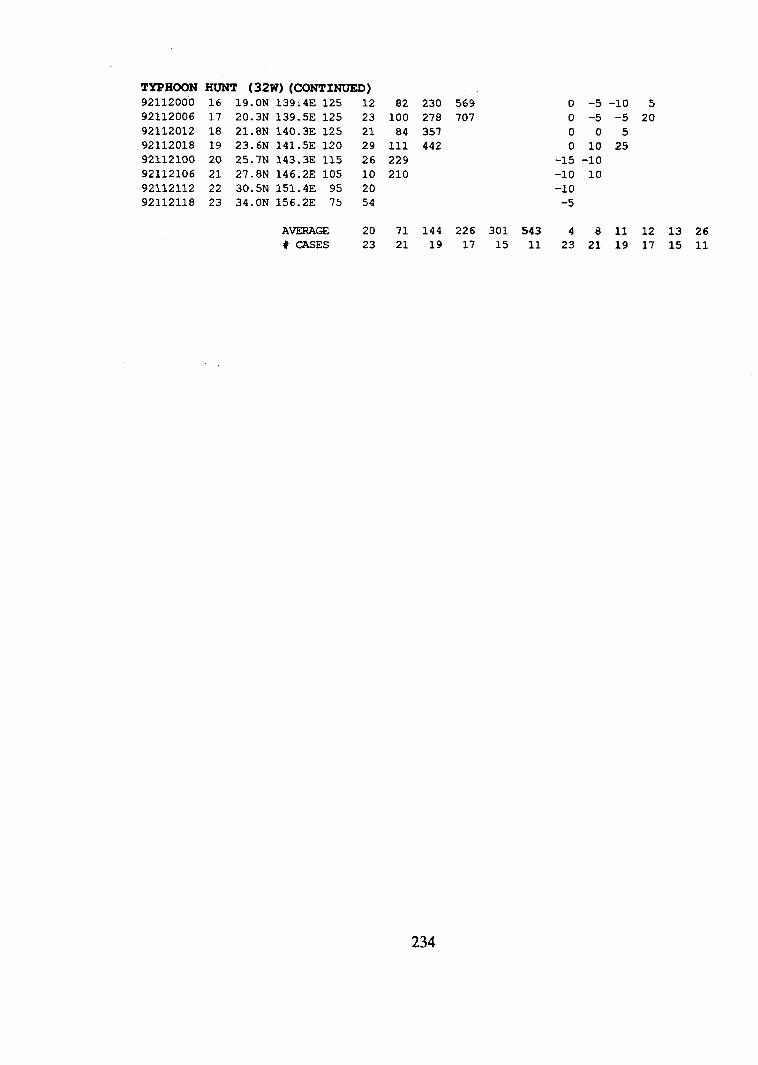
TYPHOON HUNT (32w) (CONTINUED)92112000 16 19.ON 139.4E 125 1292112006 17 20.3N 139.5E 125 2392112012 18 21.8N 140.3E 125 2192112018 19 23.6N 141.5E 120 2992112100 20 25.7N 143.3E 115 2692112106 21 27.8N 146.2E 105 1092112112 22 30.5N 151.4E 95 2092112118 23 34.ON 156.2E 75 54
82 230 569 0 -5 -lo 5
100 278 707 0 -5 -5 2084 357 005
111 442 0 10 25229 -15 -lo210 -lo 10
-10-5
AVERAGE 20 71 144 226 301 543 4 8 11 12 13 26
# CASES 23 21 19 17 15 11 23 21 19 17 15 11
234
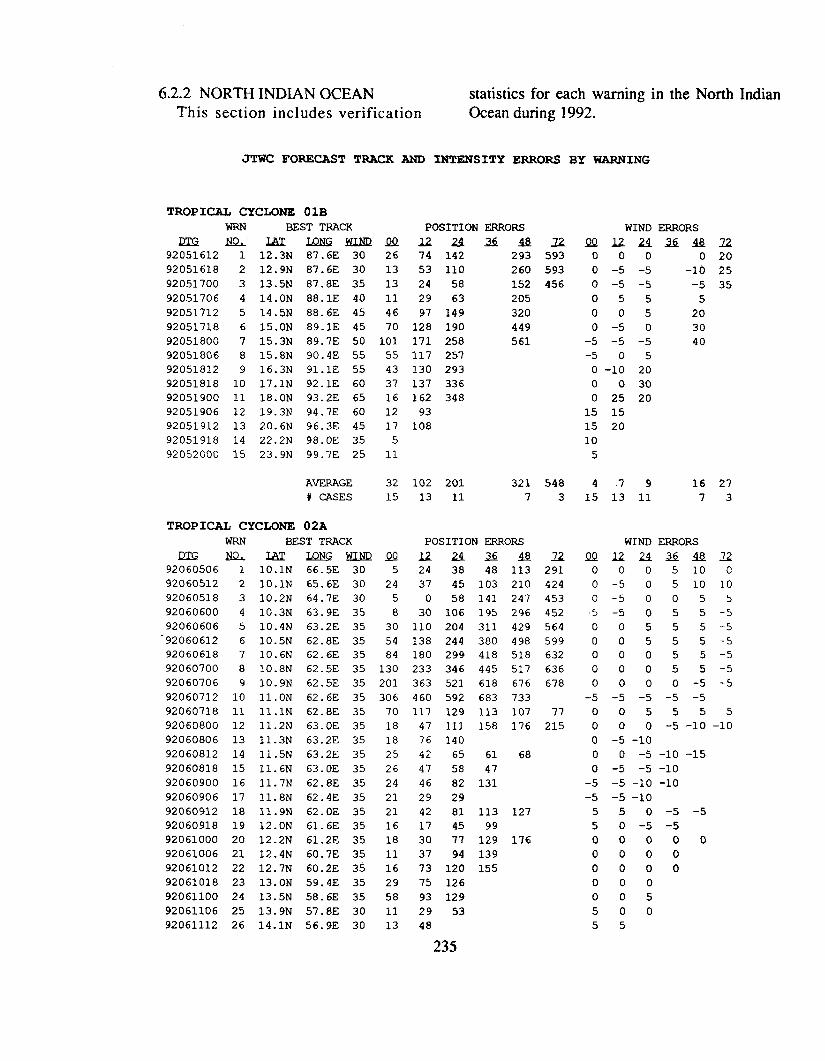
6.2.2 NORTH INDIAN OCEAN statistics for each warning inThis section includes verification Ocean during 1992.
JTWC FORECAST TRACK AND INTENSITY ERRORS BY WARNING
TROPICAL CYCLONE OlBWRN BEST TRACK
Qz.G ll.Q_I.u IQNGkuNRQQ92051612 1 12.3N 87.6E 30 2692051618 2 12.9N 87.6E 30 1392051700 3 13.5N 87.8E 35 1392051706 4 14.ON 88.lE 40 1192051712 5 14.5N 88.6E 45 4692051718 6 15.ON 89.lE 45 7092051800 7 15.3N 89.7E 50 10192051806 8 15.8N 90.4E 55 5592051812 9 16.3N 91.lE 55 4392051818 10 17.lN 92-lE 60 3792051900 11 18.ON 93.2E 65 1692051906 12 19.3N 94.7E 60 1292051912 13 20.6N 96.3E 45 1792051918 14 22.2N 98.OE 35 592052000 15 23.9N 99.7E 25 11
AVERAGE 32# CASES 15
TROPICAL CYCLONE 02A
WRN BEST TFY4CK
m UL2WLQNGEXM2QQ92060506
92060512
92060518
92060600
92060606
“9206061292060618
92060700
92060706
92060712
92060718
92060800
92060806
92060812
92060818
92060900
92060906
92060912
92060918
92061000
92061006
92061012
92061018
92061100
92061106
92061112
123456789
1011121314151617181920212223242526
10.1N10.1N10.2N10.3N10.4N10.5N10.6N10.8N10.9N11.ON11.lN11.2N11.3N11.5N11.6N11.7N11.8N11.9N12.ON12.2N12.4N12.7N13.ON13.5N13.9N14.lN
66.SE65.6E64.7E63.9E63.2E62.8E62.6E62.SE62.SE62.6E62.8E63.OE63.2E63.2E63.OE62.8E62.4E62.OE61.6E61.2E60.7E60.2E59.4E58.6E57.8E56.9E
3030303535353535353535353535353535353535353535353030
5
24
5
8
30
5484
130
201
30670
18
18
25
26
24
21
21
16
18
11
16
29
58
11
13
POSITION ERRORS
J.zz!lilfiti74 142 29353 110 26024 58 15229 63 20597 149 320128 190 449171 258 561117 257130 293137 336162 34893108
102 201 32113 11 7
POSITION ERRORS
lzaaifla24 38 48 113
37 45 103 2100 58 141 247
30 106 195 296110 204 311 429
138 244 380 498180 299 418 518
233 346 445 517
363 521 618 676
460 592 683 733
117 129 113 107
47 111 158 17676 140
42 65 61 68
47 58 47
46 82 131
29 29
42 81 113 127
17 45 99
30 77 129 176
37 94 13973 120 155
75 126
93 129
29 53
48
12593593456
5483
z291424453452564599632636678
77215
WIND ERRORS
QQli2241i!fi 9.412000 0 200 -5 -5 -10 250 -5 -5 -5 35055 5005 200 -5 0 30
-5 -5 -5 40-5 0 5
0 -lo 20
0 0 30
0 25 20
15 15
15 20
10
5
4 .7 9 16 2715 13 11 73
WIND ERRORS
QQ1.22..4364I3l2000 5 10 00 -5 0 5 10 100 -500555 -5 0 5 5 -50 0 5 5 5-50 0 5 5 5-500055-500055-50 0 0 0 -5 -5
-5 -5 -5 -5 -5005555000 -5 -lo -lo0 -5 -lo00 -5 -lo -150 -5 -5 -lo-5 -5 -lo -lo-5 -5 -lo5 5 0 -5 –55 0 -5 -5000000000000000000550055
235

TROPICAL CYCLONE 02A (CONTIIWJEZ))92061118 27 14.2N 56.OE 30 76 12892061200 28 14.2N 55.lE 25 4292061206 29 14.ON 54.2E 25 6
AVERAGE 48 95 152 225 327# CASES 29 27 25 20 15
TROPICAL CYCLONE 03BWRN BEST TRACK POSITION ERRORS
m N!& ILiX x&?llGMLhUzs!Q J.z 24 x *92061700 1 19.ON 88.3E 30 53 78 76 4192061706 2 19.5N 88.OE 30 24 6 5892061712 3 20.ON 87.5E 35 28 88 25292061718 4 20.4N 87.OE 45 8 8092061800 5 20.6N 86.2E 35 6 8592061806 6 20.9N 84.7E 25 29
AVERAGE 25 68 129 41# CASES 6531
TROPICAL CYCLONE 04BWRN BEST TRACK POSITION ERRORS
m u m IQliG3iIN2QQ u a x *92072612 1 20.ON 87.lE 35 13 25
92072618 2 20.3N 86.4E 40 11 46
92072700 3 20.5N 85.4E 35 20 92
92072706 4 20.8N 84.4E 30 18
AVERAGE 16 55
# CASES 43
TROPICAL CYCLONE 05BWRN BEST TRACK POSITION ERRORS
QTG N!& I&l JQN!3MI.NRQQ 12 a x *92092212 1 20.ON 91.5E 30 54 105 156 190 21592092218 2 20.7N 91.lE 30 51 58 101 13592092300 3 21.lN 90.5E 30 35 106 17792092306 4 21.2N 90.2E 30 41 68 100 12992092312 5 21.3N 90.OE 30 33 39 55 8192092318 6 21.5N 89.7E 30 30 45 8492092400 7 21.6N 89.4E 25 84 106
AVERAGE 47 76 113 134 215# CASES 77641
TROPICAL CYCLONE 06AWRN BEST TRACK POSITION ERRORS
Q7& M!& LAX XL2NGkiIN12M lZ 24 Z Q92100106 1 17.5N 66.3E 35 41 72 111 106 10692100112 2 17.7N 64.9E 40 51 99 100 101 13092100118 3 17.7N 63.6E 45 5 13 43 92 12792100200 4 17.7N 62.4E 50 13 24 102 144 15992100206 5 17.9N 61.3E 55 12 71 113 134 14392100212 6 18.5N 60.3E 55 29 85 132 153 18592100218 7 19.2N 59.4E 50 64 108 139 16592100300 8 19.8N 58.4E 45 41 91 11792100306 9 20.2N 57.3E 45 43 5692100312 10 20.6N 56.2E 45 66 110
45711
u
U
2
z163165
0550
22356529 27 25 20 15 11
WIND ERRORS
M122ii!.6ilQ2Z-5 -5 0 0-5 -15 0
005
-5 5
00
0
35206531
WIND ERRORS
S?Q u ax alzo -5
-5 -5050
1543
WIND EFRORS
QQ12ax*uo 5 5 5-5050-5005000-5050-500-50 -5
0335577641
WINO ERRORS
QQUaxwzz-10 -15 -25 -15 -10 0
0 -5 -lo -5 -lo 00 -lo -5 -5 -5
0 01055
-50000
05 5150
0550000
0 -5
-10 0
236

TROPICAL CYCLONE O6A (CONTINUED)AVEP.AGE 37 73 108 129 142
#CASES 10 10 8 7 6
TROPICAL (2YCLONE 07B
BEST TRACKWRN POSITION ERRORS
m m m LQN.!2m QQ 12 u 3 *92100700 1 12.8N 86.9E 30 37 87 175 220 23292100706 2 13.2N 86.5E 30 64 130 203 237 236921G0712 3 13.6N 86.OE 30 93 193 245 277 295
92100718 4 13.8N 85.2E 35 73 136 188 246
92100800 5 14.ON 84.4E 40 108 159 195 286
92100806 6 14.3N 83.7E 45
92100812 7 14.9N 82.9E 45
92100818 8 15.5N 82.lE 4592100900 9 16.2N 81.3E 40
92100906 10 17.2N 80.4E 30
AVERAGE
# CASES
TROPICAL CYCLONE 08B
WRN BEST TRACK
lYT.G m LAX XQM3hUN1292102106 1 20.ON 91.OE 30
92102112 2 20.9N 92.lE 30
92102118 3 21.7N 93.3E 30
AWGE
# CASES
TROPICAL CYCLONE 09B
WRN BEST TRACK
M& NSL IAz IAMGULNQ92110300 1 14.9N 90.2E 30
92110306 2 15.ON 89.9E 3092110312 3 15.lN 89.5E 3592110318 4 15.2N 88.9E 35
‘921104OO 5 15.4N 88.3E 3592110406 6 15.7N 87.7E 3592110412 7 16.ON 87.OE 35
92110418 8 16.2N 86.6E 40
92110500 9 16.3N 86.4E 4592110506 10 16.4N 86.2E 50
92110512 11 16.5N 86.OE 55
92110518 12 16.5N 85.8E 55
92110600 13 16.4N 85.6E 5592110606 14 16.3N 85.3E 5592110612 15 16.2N 84.9E 5092110618 16 16.lN 84.5E 45
92110700 17 15.6N 84.OE 40
92110706 18 14.8N 83.3E 35
55 116 19970166633
6210
S!Q503723
373
QQ1117345752152262142218
21181852159
96 16539154
124 196 254 2559753
POSITION ERRORS
UZ4A2!3*145113
1292
POSITION ERRORS
12. zf13s47 120 194 24369 133 178 20182 126 121 10292 121 115 1060 33 87 14618 34 77 14136 17 53 10923 49 113 18051 93 131 20389 124 164 29033 69 144 31333 91 205 3356 18 106 1398 77 147
21 109 14790 186113 159130
92110712 19 13.9N 82.7E 30 104 158
92110718 20 13.2N 82.lE 25 145
AVERAGE 36 58 92 133 193
# CASES 20 19 17 15 13
1642
2
u
z324275156197300336374442
3018
3586501010 8 7 6 2
WIND ERRORS
QQ U ax *2Z05 5 10 2000 0 10 200 -5 0 15 250 -lo 0 25-5 -5 5 30005005055 150
15 3 18 22109753
WIND ERRORS
QQ12uxa2z05050
0532
WIND ERRORS
M lZ M= 9Qi!Zo 0 10 20 20 205 5 10 10 10 150 5105 5 200550 5 25050-5 5 -15050 5 10 -lo00-5 5 15 -5
-5 -5 -5 520000 5 10 -lo05 5 -15 -lo0 5 10 5 -50 5 20 30 30
-5 -5 0 10 100 10 15 205 15 20 2010 20 255 10 1505000
26 9 10 11 1420 19 17 15 13 8
237
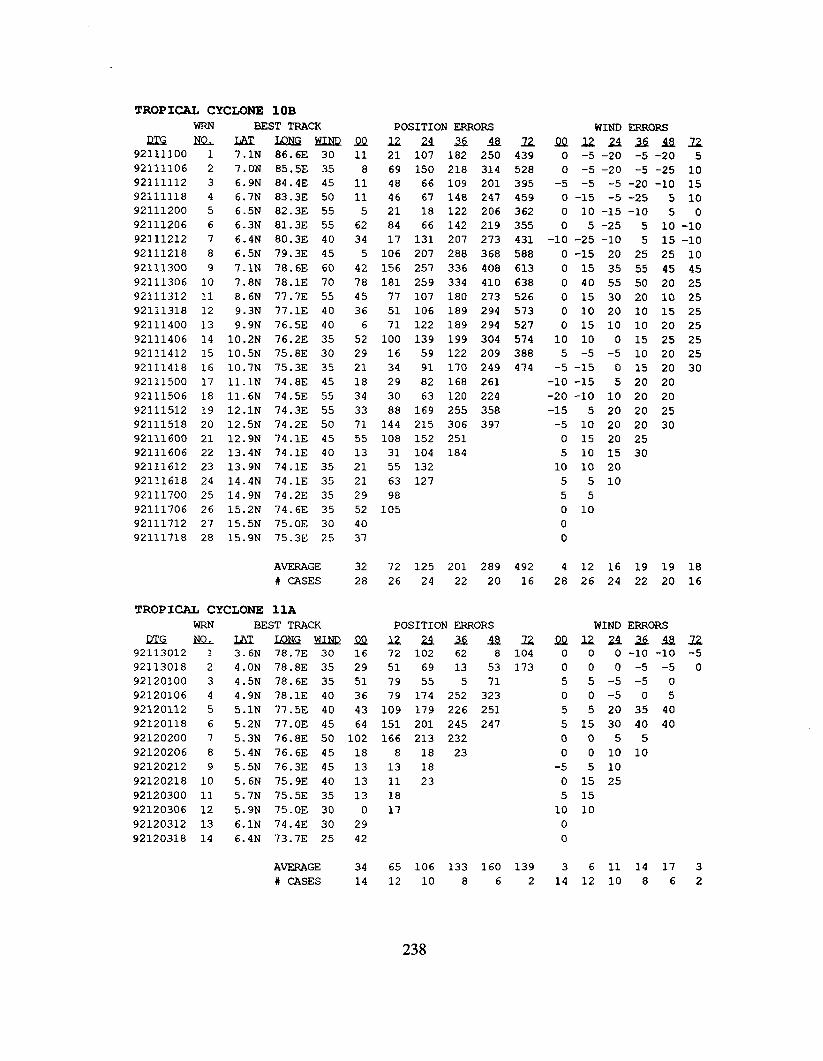
TROPICAL CYCLONE 10BWRN BEST TRACK
QzG u LAz LQN!3MIliQ92111100 1 7.lN 86.6E 3092111106 2 7.ON 85.5E 3592111112 3 6.9N 84.4E 4592111118 4 6.7N 83.3E 5092111200 5 6.5N 82.3E 5592111206 6 6-3N 81.3E 5592111212 7 6.4N 80.3E 4092111218 8 6.5N 79.3E 4592111300 9 7.lN 78.6E 6092111306 10 7.8N 78.lE 7092111312 11 8.6N 77.7E 5592111318 12 9.3N 77.lE 4092111400 13 9.9N 76.5E 4092111406 14 10.2N 76.2E 3592111412 15 10.5N 75.8E 3092111418 16 10.7N 75.3E 3592111500 17 11.lN 74.8E 4592111506 18 11.6N 74.5E 5592111512 19 12.lN 74.3E 5592111518 20 12.5N 74.2E 5092111600 21 12.9N 74.lE 4592111606 22 13.4N 74.lE 4092111612 23 13.9N 74.lE 3592111618 24 14.4N 74.lE 3592111700 25 14.9N 74.2E 3592111706 26 15.2N 74.6E 3592111712 27 15.5N 75.OE 3092111718 28 15.9N 75.3E 25
AVERAGE# CASES
TROPICAL CYCLONE 11AWRN BEST TRACK
Q332NQ 1.JSEllQNGkiIN!292113012 1 3.6N 78.7E 30
92113018 2 4.ON 78.8E 35
92120100 3 4.5N 78.6E 35
92120106 4 4.9N 78.lE 40
92120112 5 5.lN 77.5E 40
92120118 6 5.2N 77.OE 45
9212020092120206921202129212021892120300921203069212031292120318
7 5.3N8 5.4N9 5.5N10 5.6N11 5,7N12 5.9N13 6.lN14 6.4N
76.8E 50
76.6E 45
76.3E 45
75.9E 40
75.5E 35
75.OE 30
74.4E 30
73.7E 25
AVERAGE# CASES
QQ1181111562345427845366
522921183433715513212129524037
3228
QQ16
29
51
36
43
64
POSITION ERRORS
1.z2flxfi21 107 182 250
69 150 218 31448 66 109 20146 67 148 24721 18 122 206
84 66 142 219
17 131 207 273
106 207 288 368
156 257 336 408
181 259 334 410
77 107 180 273
51 106 189 294
71 122 189 294
100 139 199 304
16 59 122 209
34 91 170 249
29 82 168 261
30 63 120 224
88 169 255 358
144 215 306 397
108 152 25131 104 184
55 132
63 127
98
105
72 125 201 289
26 24 22 20
POSITION ERRORS
Uuil,tim72 102 62 8
51 69 13 53
79 55 5 71
79 174 252 323
109 179 226 251
151 201 245 247
102 166 213 23218 8 18 2313 13 1813 11 2313 180 17
2942
22439528395459362355431588613638526573527574388474
49216
22104
173
34 65 106 133 160 13914 12 10 8 6 2
WIND ERRORS
QQlziM26Qo -5 -20 -5 -200 –5 –20 -5 -25
–5 -5 -5 -20 -lo0 -15 -5 -25 50 10 -15 -lo 50 5 -25 5 10
-10 -25 -10 5 150 -15 20 25 250 15 35 55 450 40 55 50 200 15 30 20 100 10 20 10 150 15 10 10 2010 10 0 15 255 -5 -5 10 20-5 -15 0 15 20
-lo -15 5 20 20-20 -lo 10 20 20-15 5 20 20 25-5 10 20 20 300 15 20 255 10 15 3010 10 205 5 10550 1000
4 12 16 19 1928 26 24 22 20
WIND ERRORS
QQ12z$lxa00 0 -lo -lo0 0 0 -5 -55 5 -5 -5 00 0-5 0 55 5 20 35 405 15 30 40 4000550 0 10 10-5 5 100 15 255 1510 1000
3 6 11 14 17
14 12 10 8 6
2251015100
-lo-lo104525252525252530
18
16
22-5
0
32

TROPICAL CYCLONE 12A
WRN
UCGNLL92122012 1
92122018 2
92122100 3
92122106 4
92122112 5
92122118 6
92122200 7
92122206 8
92122212 9
92122218 10
92122300 11
92122306 12
92122312 13
92122318 14
92122400 15
92122406 16
92122412 17
92122418 18
BEST TRACK
I&Cmm5.ON 69.4E 30
5.5N 68.6E 35
5.8N 67.6E 40
6.ON 66.4E 40
6.2N 65.OE 40
6.3N 63.6E 40
6.2N 62.lE 40
6.ON 60.5E 40
6.lN 58.9E 40
6.4N 57.4E 45
6.9N 56.OE 45
7.3N 54.6E 45
7.6N 53.3E 50
8.ON 52.OE 50
8.2N 51.2E 508.6N 50.3E 45
9.ON 49.6E 259.4N 49.OE 15
AVERAGE
# CASES
QQ4543243262405652159268131329322434
3218
POSITION ERRORS
Uzflxu73 45 32 86
63 89 131 173
73 134 208 232
95 175 239 274
125 199 256 29197 161 203 223
125 166 191 178
40 64 77 85
62 103 129 179
111 155 175 21624 26 132
25 79 160
56 107
39 101
4277
71 115 162 194
16 14 12 10
22150219244262237167
214
6
TROPICAII STORM FORREST (30W)
NU1’E: THE NORTH INDIAN CCEAN PORTION OF THIS BEST T~CK IS
PACIFIC WARNING VERIFICATION STATISTICS FOR TROPICALPAGES 231 AND 232.
WIND EPRORS
QQuz!l&i!ifiuo -lo -5 -5 -5 -20
0 0 5 5 -5 -150 0 5 5 –5 -15
0 0 5 0–5-10
005 -5 -lo 100 0 -lo -lo -20 15
0 0 -lo -15 -20
0 -5 -lo -15 -15
0 -5 -15 -15 5
-5 -5 -15 -lo 15
0000
0 0 –lo 10
0 0 10
0 -5 10
0 150 15
10
15
248 8 11 1418 16 14 12 10 6
INCLUDED IN WESTERN NORTHSTORM FORREST(30W) ON
239
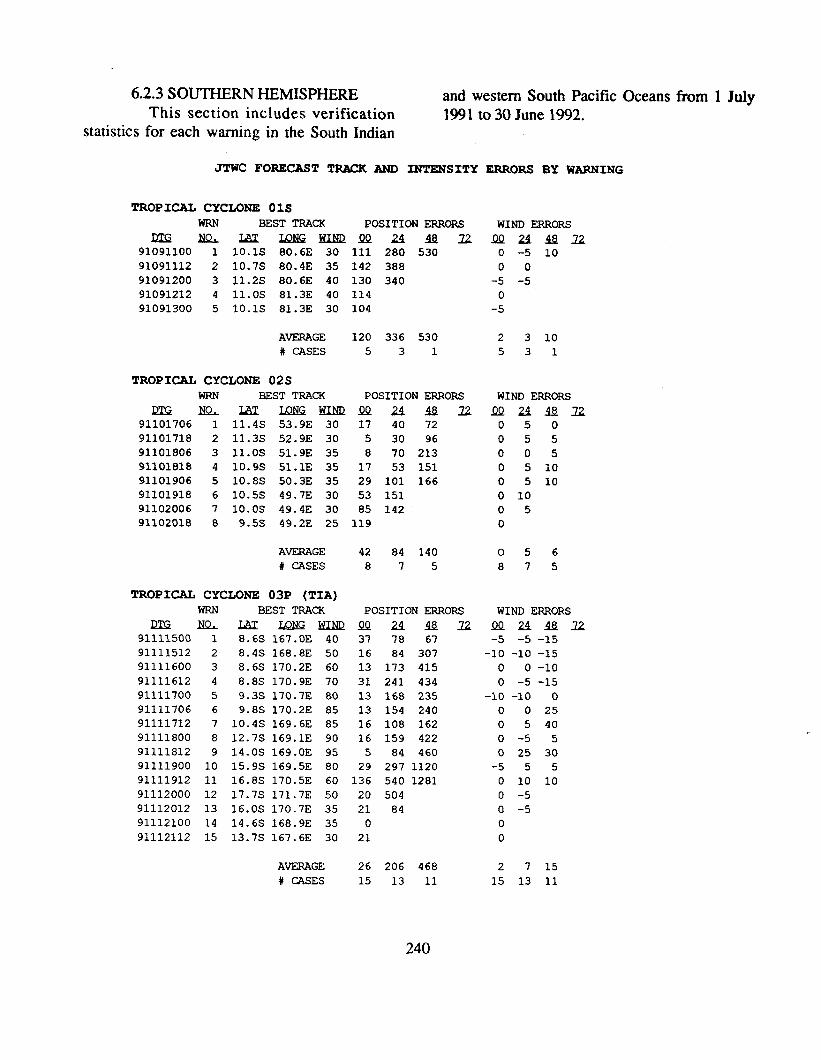
6.2.3 SOUTHERN HEMISPHEREThis section includes verification
statistics for each warning in the South Indian
JTWC FORECAST TRACK AND
TROPICAL CYCLONE O1S
and western South Pacific Oceans from 1 July1991 to 30 June 1992.
INTENSITY
WRN BEST TRACK POSITION ERRORS
QzG NQ. Iifl IQNGkiI.NDQQ 2 B i!z91091100 1 10.1S 80. 6E 30 111 280 530
91091112 2 10.7S 80.4E 35 142 388
91091200 3 11.2s 80.6E 40 130 34091091212 4 11.0S 81.3E 40 114
91091300 5 10.1S 81.3E 30 104
AVERAGE 120 336 530
# CASES 531
TROPICAL CYCLONE 02SWRN BEST TRACK POSITION ERRORS
IzG n m I&E&mm M B 1291101706 1 11.4S 53.9E 30 17 40 7291101718 2 11.3S 52.9E 30 5 30 9691101806 3 11.0S 51.9E 35 8 70 21391101818 4 10.9S 51.lE 35 17 53 15191101906 5 10.8s 50.3E 35 29 101 16691101918 6 10.5S 49.7E 30 53 15191102006 7 10.0S 49.4E 30 85 14291102018 8 9.5S 49.2E 25 119
AVERAGE 42 84 140# CASES 875
TROPICAL CYCLONE 03P (TIA)
WRN BEST TFACK POSITION ERRORS
mm L&z LQNGWI.NQQQ a B x91111500 1 8.6S 167.OE 40 37 78 6791111512 2 8.4S 168.8E 50 16 84 30791111600 3 8.6S 170.2E 60 13 173 41591111612 4 8.8S 170.9E 70 31 241 43491111700 5 9.3S 170.7E 80 13 168 23591111706 6 9.8S 170.2E 85 13 154 24091111712 7 10.4S 169.6E 85 16 108 16291111800 8 12.7s 169.lE 90 16 159 42291111812 9 14.0S 169.OE 95 5 84 46091111900 10 15.9S 169.5E 80 29 297 112091111912 11 16.8S 170.5E 60 136 540 128191112000 12 17.7S 171.7E 50 20 50491112012 13 16.0s 170.7E 35 21 8491112100 14 14.6S 168.9E 35 0
91112112 15 13.7S 167.6E 30 21
AVERAGE 26 206 468
# CASES 15 13 11
ERROIW BY WARNING
WIND ERRORS
QQaalzo -5 1000
-5 -50
-5
2 3 10531
WIND ERRORS
QQamzz0500550050 5 100 5 100 10050
056875
WIND ERRORS
QQ221B12-5 -5 -15
-lo -lo -15
0 0 -lo
0 -5 -15
-10 -lo 00 0 25
0 5 40
0 -5 5
0 25 30
-5 5 5
0 10 10
0 -5
0 -5
0
0
2 7 15
15 13 11
240

TROPICAL CYCLONE 04SWP.N
L!XGNSL91112200 191112212 291112218 391112300 491112312 591112400 691112412 791112500 891112512 991112600 10
BEST TRACK
LAZIQNGHI.KR10.5S 70.6E 2511.3S 70.7E 3011.8s 70.7E 3512.4s 70.8E 3513.6S 71.4E 4014.9S 72.3E. 4516.2S 71.7E 4516.4s 70.3E 4016.2S 68.9E 3515.8s 67.6E 30
POSITIOh ERRORS
QQalfilz78 288 57031 139 28731 134 1878 166 196
18 70 7218 167 27954 223 38824 13313 1005
AVEPAGE 28 158 283
# CASES 10 9 7
TROPICAL CYCLONE 05S (GRAHAM)
WRN BEST TRACK POSITION ERRORS
RU3 m LAX LQIGm L!Q u * Z91120212 1 5.7S 93.5E 30 17 45 131
91120300 2 6.5S 93.lE 40 33 102 27191120306 3 6.9S 92.9E 45 55 151 35191120312 4 7.2S 92.8E 50 51 138 34891120400 5 7.9s 92.9E 65 0 90 30391120412 6 8.5s 93.5E 75 5 127 31791120500 7 9.2S 94.7E 95 11 148 31191120512 8 10.0S 96.lE 110 21 136 28191120518 9 10.6s 96.9E 115 8 48 14391120600 10 11.1S 97.7E 120 12 94 25091120612 11 12.0S 98.9E 105 26 228 39691120700 12 12.6S 100.OE 85 35 114 22191120712 13 12.5s 101.4E 65 52 43
91120800 14 12.6S 102.8E 45 11 116 17691120812 15 13.3S 103.5E 35 24 13591120900 16 13.9S 103.8E 35 17 5691120912 17 14.4S 104.3E 30 0 13091121000 18 14.7S 104.8E 30 1891121012 19 15.2S 104.6E 25 8
AVERAGE 21 112 269# CASES 19 17 13
TROPICAL CYCLONE 09S (ALEXANDRA)
WRN BEST TRACK POSITION ERRORS
DIG u LAX LQM2HXNRQQ M * 1291122006 1 11.5S 75.6E 40 16 48 5791122018 2 13.4S 76.4E 60 23 29 10891122106 3 15.1S 77.OE 85 13 135 25291122118 4 16.3S 77.7E 95 30 192 37091122206 5 16,7S 78.8E 100 61 204 47591122218 6 16.8S 79.4E 100 41 200 52891122306 7 17.1s 79.6E 85 17 92 25991122318 8 17.4S 78.8E 75 31 203 29691122406 9 17.6s 77.3E 60 20 62 10591122418 10 17.6S 75.5E 45 22 45
91122506 11 17.9S 74.OE 35 30 64
91122518 12 18.5S 72.6E 30 11
WIND ERRORS
42! 22448200500510 15 300 15 300550 10 100 10 1555000
2 7 1410 9 7
WIND ERRORS
QQA*Z2o -lo -20-5 -15 -300 -lo -300 -lo -350 -5 -200 -lo 100 -5 300 10 400 20 450 30 550 0 155 15 105 105 0 -105 -5500000
2 9 2719 17 13
WIND ERRORS
QQii!ia12-5 -lo -lo
5 -5 5
-5 0 15
0 -5 5
0 5 15
5 15 30
15 20 30
15 20 15
15 15 5
10 5
0 -5
0
241
TROPICAL CYCLONE f)9S (ALEXANDRA) (CONTINUED)AVERAGE 26 116 272 6 10 14# CASES 12 11 9 12 11 9
TROPICAL CYCLONE 10S (BRYNA)WRN BEST TRACK POSITION ERRORS
m & N IQNGm QQ 29, U z91123018 1 13.6S 59.4E 30 50 115 13991123106 2 14.0S 57.4E 35 23 87 83
91123118 3 14.5S 55.4E 40 5 42 34
92010106 4 14.9S 53.6E 45 0 23 7292010118 5 15.2S 52.3E 40 13 70
92010206 6 15.4S 50.8E 35 8 89
92010218 7 15.4S 49.2E 30 0
WIND ERRORS
QQZ49.QZ210 20 250 5 155 10 200 10 155 105 -50
AVERAGE 14 71 82 4 10 19# CASES 764 764
TROPICAL CYCLONE 11S (BETSY)WRN BEST TRACK POSITION ERRORS
L?l.S? N!LLULIQI?G!Q.M2QQ Zaz92010600 1 8.7S 170.3E 25 30 204 43192010612 2 9.5S 169.9E 35 80 302 43992010700 3 10.8S 170.lE 45 55 151 21692010712 4 12.4S 170.5E 55 13 11 14792010800 5 13.9S 170.5E 65 42 233 44892010812 6 15.2S 169-7E 80 8 155 45392010900 7 16.4S 167.9E 90 33 176 37592010912 8 17.3S 165.5E 95 20 122 23892011000 9 18.2S 162.6E 90 12 162 28492011012 10 19.0S 160.3E 85 23 211 41492011100 11 19.6S 158.3E 85 23 13292011112 12 20.1S 157.4E 70 16 6092011200 13 20.9S 157.5E 60 28 16992011212 14 21.8S 157.8E 60 26 147 28192011300 15 22.8S 157.9E 60 47 26 8392011312 16 24.3S 158.lE 55 16 2492011400 17 26.2S 158.6E 55 36 18792011412 18 28.3S 160.OE 55 1692011500 19 30.1S 161.9E 50 0
WIND ERRORS
QQZA42Zo -5 -5
-5 -5 -150 0 -150 -5 -55 -5 00 -5 100 10 150 5 15
-5 –15 o-lo -lo -15-15 00 -105 -15
-lo -15 -20-15 -15 -15-15 -20-lo -lo-15-lo
AVERAGE 28 145 318 6 9 11# CASES 19 17 12 19 17 12
TROPICAL CYCLONE 12P (MARK)WRN BEST TRACK POSITION ERRORS
m lQI&31LQN.GMD!QQQ 2A3.QZZ92010806 1 14.0S 138.OE 30 31 44 9092010818 2 14.1S 138.9E 35 11 120 20292010906 3 13.9S 139.9E 45 17 89 15392010918 4 13.4S 141.OE 55 16 4692011006 5 13.1S 142.3E 45 13 5492011018 6 13.2S 143.5E 25 24
WIND ERRORS
QQa@z5 -5 105 -5 25
-5 0 10-15 10-5 -55
AVERAGE 19 70 148 7 5 15
# CASES 653 653
TROPICAL CYCLONE 15P (CELESTA)m BEST TRAcK POSITION ERRORS
UcG m LJM. xL?twh?LM2QQ 2 m 2292021100 1 22.0S 67.5E 35 72 389 114492021112 2 23.6S 69.lE 45 131 481
92021200 3 24.3S 67.8E 45 163 620
92021212 4 22.2S 66.4E 40 154
92021300 5 19.9S 65.lE 30 297
/AVERAGE 164 497 1144
# CASES 531
TROPICAL CYCLONE 16SBEST TRACKWRN POSITION ERRORS
Rzi IiQ LAX IL?NGMUU2QQ 24 * U92021218 1 13.7S 128.lE 20 35 24192021306 2 14.1S 124.8E 25 21 24292021318 3 14.9S 120.8E 20 7992021406 4 16.4S 116.6E 15 11
AVERAGE 37 242# CASES 42
TROPICAL CYCLONE 17P (DAMAN)Wl?N BEST TRACK POSITION ERRORS
m m m IQNGkEli12QQ a B x92021412 1 11.5S 172.6E 35 90 112 13092021500 2 12.7S 169.9E 40 24 60 12392021512 3 13.7S 167.2E 55 13 88 21892021600 4 15.2S 164.7E 65 13 108 33692021612 5 17.2S 162.6E 75 18 102 22392021700 6 19.6S 161.4E 85 30 240 31892021712 7 22.8S 160.4E 80 17 238 29392021800 8 26.3S 158.9E 70 28 70
92021812 9 28.4S 156.6E 55 26 34292021900 10 30.2S 155.7E 45 23
92021912 11 32.0S 157.6E 40 20
2iVERAGE 27 151 234
+ CASES 11 9 7
TROPICAL CYCLONE 18Pmu? BEST TRACK POSITION ERRORS
m ML m LQNGHI.tu2Qs! a * 2292021918 1 21.2S 153.lE 25 11 10292022000 2 21.8S 152.6E 30 4592022006 3 22.3S 151.9E 35 3392022018 4 22.9S 150.5E 25 0
AVERAGE 22 102# CASES 41
TROPICAL CYCLONE 19S (DAVILIA)
WRN BEST TRIKX POSITION ERRORS
m m m LQM2klINRIXl a m l.z92022318 1 21.4S 72.2E 35 74 10392022406 2 22.2S 72.6E 30 2192022418 3 23.0S 73.OE 25 12
243
WIND ERRORS
QQa4&z2o 5 20-5 -lo00
-50
2 5 20531
WIND ERRORS
QQ24AQ215 3520 402020
19 3842
WIND ERRORS
QQauz-5 -5 -5-5 -lo -lo-5 5 100 5 205 10 155 30 4010 10 0005 -lo50
4 9 1411 9 7
WIND ERRORS
L!Qzdl&!z10 01055
8041
WIND ERRORS
QQaxlzo 1555

TROPICAL CYCLONE 19S (DAVILIA) (CONTINUED)
AVERAGE 36 103# CASES 31
TROPICAL CYCLONE 20S (HARRIET)
WRN BEST TRACK POSITION ERRORS
m m LAz U2M2MIIQQQ a a Z292022600 1 11.4S 98.2E 35 6 46 11392022612 2 11.5S 97.lE 45 11 63 9092022700 3 11.7S 96.lE 55 39 55 6992022712 4 11.9S 95.2E 55 29 92 14092022800 5 12.2S 94.4E 65 13 96 12592022812 6 12.9S 93.5E 80 0 18 7492022900 7 13.5S 92.6E 90 8 36 13992022912 8 14.2s 91.7E 100 5 53 17492030100 9 14.9S 90.6E 110 16 138 26492030112 10 15.1S 89.4E 120 5 102 21792030200 11 15.1S 88.4E 120 0 51 8892030212 12 14.9S 87.5E 115 5 58 10892030300 13 14.8s 86.8E 110 13 55 15492030312 14 15.0S 86.2E 95 8 95 21592030400 15 15.5S 85.6E 85 8 53 8292030412 16 16.5s 85.lE 80 12 33 14092030500 17 17.6S 85.OE 90 6 64 29092030512 18 18.7S 85.2E 90 16 73 36892030600 19 20.0S 85.8E 90 11 140 46592030612 20 21.7S 87.2E 90 16 16692030700 21 24.4S 89.5E 85 48 38092030712 22 28.2s 93.lE 75 4192030800 23 32.4S 98.4E 60 11
AVERAGE 14 89 175# CASES 23 21 19
TROPICAL CYCLONE 21P (ESAU)WRN BEST TRACK POSITION ERRORS
R3X ~ ~ LQNGELNQQQ a a u92022600 1 15.7S 167.5E 30 29 76 18292022612 2 15.9s 166.8E 40 26 124 24092022700 3 15-8S 165.4E 45 8 42 14192022712 4 15.4S 163.8E 55 59 73 15892022800 5 15.2s 162.2E 70 13 42 20892022812 6 14.7s 160.6E 95 8 92 34292022900 7 13.9s 159.6E 125 5 114 27592022912 8 13.4S 159.4E 130 13 135 26592030100 9 13.6S 160.lE 115 5 89 21092030112 10 14.4S 160.8E 95 6 63 13192030200 11 15.3s 161.6E 95 25 75 16792030?12 12 16.1s 162.7E 100 0 52 9092030300 13 16.9S 163.7E 100 6 55 10892030312 14 18.0S 164.8E 95 0 62 15392030400 15 19.6S 165.3E 90 12 60 25792030412 16 21.2S 165.5E 80 12 85 36692030500 17 22.8S 165.5E 65 35 169 33692030512 18 24.8S 165.9E 60 36 283 37292030600 19 28.4S 166.lE 50 20 14792030612 20 31.8S 165.7E 45 39
AVERAGE 18 97 222# CASES 20 19 18
3 1531
WIND ERRORS
QQzll A!21zo -lo -5
-lo 0 -lo0 10 05 -5 -lo0 -5 -200 -5 -400 -15 -405 -20 -25
–lo -30 –30o -lo -50 -5 55 -5 00 0 -20
-5 -5 -30-lo -30 -40-15 -30 -50-30 -20 -300 -5 -lo0 -5 00 -lo
-5 -lo-lo-5
5 11 1923 21 19
WIND ERRORS
QQZ$14QU00-50 0 –20o 0 –35o -20 -450 -40 -25
-5 -20 -5-5 -5 -5-5 15 -lo0 5 -lo0 -20 -300 -20 -250 -5 0
-5 -lo 100 -5 5
-5 0 0-5 0 -5-lo -lo -lo-15 -lo -15-5 -lo-5
3 10 1420 19 18
244
TROPICAL CYCLONE 22S (FARIDA)
WRN BEST TRACK POSITION ERRORS
LUG IQ. N IQMikUliQQQ u 4!3 u92022600 1 15.5S 81.lE 45 29 80 12692022606 2 15.9s 80.8E 55 13 18 14392022618 3 16.7s 80.2E 65 30 136 26592022706 4 17.5S 79.3E 80 18 18 3792022718 5 18.0S 78.oE 85 33 79 14592022806 6 18.3S 76.8E 105 18 23 49
92022818 7 18.9S 75.7E 120 5 41 12792022906 8 19.5S 74.7E 120 8 66 19692022918 9 20.4S 73.7E 115 38 157 386
92030106 10 21.5S 72.3E 110 34 143 334
92030118 11 22.4S 70.4E 100 86 285 480
92030206 12 23.2S 68.OE 80 11 101
92030218 13 24.3S 65.5E 65 5 154
92030306 14 26.1S 63.2E 50 0
92030318 15 28.3S 61.OE 30 27
AVERAGE 24 100 208# CASES 15 13 11
TROPICAL CYCLONE 23s (IAN)
WRN BEST TRACK POSITION ERRORS
QzG n LWL IQN.GEIM2QQ z a 2292022618 1 12.4S 114.5E 30 47 241 45892022706 2 12.0S 114.8E 35 41 229 40592022718 3 11.7S 115.4E 40 29 17992022806 4 11.7S 116.4E 50 26 120 23392022818 5 12.3s 117.OE 70 11 66 19692022906 6 13.4S 117.3E 90 5 66 17492022918 7 14.6S 117.3E 100 16 87 15592030106 8 16.1s 117.2E 105 12 113 17192030118 9 17.8S 116.7E 115 17 24 22792030206 10 19.3S 116.OE 105 11 15192030218 11 20.8S 115.8E 100 12 17592030306 12 22.5S 116.3E 55 1692030318 13 24.3S 117.8E 25 30
AVERAGE 21 132 252# CASES 13 11 8
TROPICAL CYCLONE 24s (GERDA)WRN BEST TRACK
RIG n m UN!!2im92022718 1 15.9S 61.7E 35
92022806 2 16.9S 61.8E 30
92022818 3 17.8s 62.3E 30
AVERAGE
# CASES
TROPICAL CYCLONE 25P (FRAN)
WRN BEST TRACK
QzG mIIAz K217GkiIlQ.
POSITION ERRORS
QQz!lll.filz8 67 160
77 225
36
40 146 160
321
POSITION ERRORS
QQaBlz92030706* 3 14.6S 178.4E 90 17 194 34592030718 4 15.4S 176.lE 100 16 153 30892030806 5 16.4S 173.4E 115 6 98 17092030818 6 17.3S 170.7E 140 5 91 211
WIND ERRORS
s!Qzfl Qlz-5 -lo -15
0 10 -150 5 -30
10 –15 -400 -50 -655 -lo -15
-5 -20 -255 -lo 5
5 0 105 15 25
-5 15 300 10
-lo 10-5
0
4 14 2515 13 11
WIND ERRORS
QQ29Q2o 0 -200 0 -25
-5 -35-5 -5 -250 -15 -355 -5 -150 -20 -lo0 -lo 300 -lo 4010 355 50
2020
5 17 2513 11 8
WIND ERRORS
QQzflmuo 20 35
5 -5
-5
3 13 35321
WIND ERRORS
L?Qztilzo -5 -30
-lo -40 -lo-lo -15 00 20 30
245
92030818 6 17.3S 170.7E 140 5 91 211
TROPICAL CYCLONE 25P (FRAN) (CONTINUED)92030906 7 18.4S 168.4E 130 6 115 31992030918 8 19.2S 166.OE 120 11 69 8992031006 9 19.6S 163.7E 110 8 25 6192031018 10 19.6S 161.4E 100 13 45 15892031106 11 19.8s 159.3E 90 8 33 15192031118 12 19.9s 157.6E 85 5 84 21492031206 13 19.9s 156.3E 90 0 120 20292031218 14 20.0s 155.5E 90 12 127 18092031306 15 20.6S 155.3E 85 12 16 5392031318 16 20.8S 154.7E 80 33 110 12592031406 17 21.0S 153.8E 70 46 49 19092031418 18 21.4S 152.8E 60 65 97 31392031506 19 22.5s 151.9E 50 6 15092031518 20 23.8S 151.4E 45 36 23992031606 21 24.7S 152.9E 45 0 4592031618 22 24.9S 154.6E 45 692031706 23 25.3S 156.2E 45 0
AVERAGE 15 98 193# CASES 21 19 16
*Two warnings issued by NWOC
TROPICAL CYCLONE 28s (NEVILLE)WRN BEST TRACK POSITION ERRORS
!2XQi n UT. LQNGKLNQQ!2 u 4 Z292040606 1 9.8s 133.6E 35 18 107 20892040618 2 10.3S 133.2E 40 35 106 13992040706 3 10.6S 132.3E 50 29 94 7792040718 4 11.0S 131.OE 65 18 79 20292040806 5 11.1S 129.7E 95 8 89 22492040818 6 11.3S 128.8E 115 11 118 22892040906 7 11.5S 128.3E 120 8 46 8492040918 8 11.6S 128.lE 115 8 5 1192041006 9 11.6S 127.8E 110 0 17 1892041018 10 11.8S 127.2E 100 50 89 10492041100 11 11.9S 127.OE 95 41 146 25292041106 12 12.0s 126.7E 90 59 169 27292041118 13 12.2S 126.2E 80 50 83 13592041206 14 12.3S 125.7E 70 8 37 8992041218 15 12.5S 125.3E 60 18 58 10592041306 16 12.9S 124.9E 50 18 6592041318 17 13.1s 124.5E 40 29 5892041406 18 13.5S 124.3E 30 13 66
AVERAGE 23 80 143# CASES 18 18 15
TROPICAL CYCLONE 29s (J~/IWA)
WRN BEST TRACK POSITION ERRORS
Q132 m LAT. [email protected] x 4 z92040806 1 8.1s 98.6E 35 43 111 18492040818 2 8.9S 98.8E 45 32 60 122
92040906 3 9.8s 99.lE 55 13 74 113
92040918 4 11.0S 99.6E 55 24 50 79
92041006 5 12.3s 99.9E 60 18 75 83
92041018 6 13.2S 100.3E 70 71 283 670
92041100 7 13.5S 100.4E 75 21 97 278
0 20 30
5 -20 –loo -lo 50005 5 -150 -20 -255 -15 -200050 5 150 5 150 10 15-5 5 5050-5 -lo-5 -20-5 -20
-lo-15
4 12 1321 19 16
WIND ERRORS
QQz9. &i.zzo -5 -50
0 -15 -65
-5 -50 -70
0 –30 -20
-15 -35 -25-5 5 20
-5 0 10
10 10 20
5 20 20
10 15 25
10 20 25
10 15 15555
5 15 15
-5 -5 -5
-lo -505
00
6 14 2618 18 15
WIND ERRORS
QQzf19.Qzo 0 15
5 25 15
5 20 15
5 20 20
0 -20 -35
5 -15 -25
-10 -15 -25

TROPICAL CYCLONE 29S (JANE /IRNA) (CONTINUED)
92041118 9 14.0S 99.8E 80 42 231 46492041206 10 14.2S 98.2E 80 41 202 42292041218 11 14.6S 95.9E 80 26 111 25092041306 12 15.0S 93.3E 85 47 68 12392041318 13 15.0S 90.7E 95 18 79 69
92041400 14 14.8S 89.5E 105 8 42 52
92041406 15 14.7S 88.4E 115 0 26 85
92041418 16 14.5S 86.3E 120 8 107 31492041506 17 14.7S 84.6E 120 11 50 191
92041518 18 15.2S 83.4E 115 25 149 320
92041606 19 15.7S 82.8E 100 50 175 350
92041618 20 16.4S 83.lE 75 5 115
92041706 21 17.2S 84.lE 55 16 246
92041718 22 17.2s 85.8E 50 23
92041806 23 17.0S 87.7E 45 8
AVERAGE 24 117 236
# CASES 23 21 19
TROPICAL CYCLONE 30P (INBIIS)
BEST TFQCKWRN POSITION ERRORS
IzlG m w x&2t12m QQ a @ u92042818 1 11.3S 172.2E 35 16 115 29492042906 2 12.3S 170.6E 50 8 34 26392042918 3 13.5S 169.5E 65 32 66 23192043006 4 14.6S 168.8E 65 18 159 64692043018 5 16.2S 169.OE 65 44 34592050106 6 18.0S 170.7E 55 77 416
92050118 7 20.4S 173.9E 50 28
92050206 8 23.6S 178.7E 40 56
AVERAGE 35 189 359
# CASES 864
0 -lo -405 -15 -600 -20 -55
-10 –45 -60-5 -40 -455000 0 105 5 350 10 30-5 20 155 25 150 -lo0 -lo-5-15
4 16 2823 21 19
WIND ERRORS
QQzililflzo -15 55 10 300 20 35
-lo -lo -lo-15 -lo-15 -lo-15-5
8 13 20864
247
Intentionally left blank
248

7. TROPICAL CYCLONE
7.1 AN UPDATED VALUE ANALYSIS OFJTWC WARNING SUPPORT
Lt Col Chip GuardJoint Typhoon Warning Center, Guam
A comprehensive analysis of the costs ofwestern North Pacific DOD typhoon prepara-tions, the value of J’IWC support, and the costeffectiveness of the US PACOM TropicalCyclone Warning System was accomplished.The study analyzes the warning process atJTWC, describes various typhoon strike scenar-ios, explains the value of credibility, considersboth tangible and intangible costs and benefits,ascertains port./facility costs for typhoon prepa-ration, illustrates the value of resources at risk,and finally computes the cost-benefit ratio ofthe Warning System. The analysis provides abaseline for future assessments whenever sup-port requirements change. (It will be publishedas a NOCC/JTWC Technical Note.)
7.2 A TROPICAL CYCLONE WINDSPEED VERSUS DAMAGE SCALE FORTHE TROPICAL WESTERN PACIFIC
Lt CO] Chip GuardJoint Typhoon Warning Center, Guam
andDr. Mark A. LanderUniversity of Guam
A scale that relates tropical cyclone windspeed to potential structural, agricultural, andcoastal damage has been developed for use inthe tropical western Pacific Ocean. The scaleemploys the basic model of the Saffir-SimpsonHurricane Scale which has been used for manyyears along the Atlantic and Gulf of Mexicocoastal areas of the United States. It incorpo-rates construction materials and plant life that
!WPPORT SUMMARY
are common to the tropical Pacific region, andconsiders the structural weakening of woodfrom termites and wet and dry wood rot. Thescale also modifies expected storm surge valuesof the Saffir-Simpson Hurricane Scale toaccount for the effects of island near-shore bot-tom topography (such as fringing coral reefs) onstorm surge, wind-driven waves, and near-coastal surf action. Because many of the islandsof the tropical Pacific contain crops and sheltersthat are highly susceptible to damage by sub-hurricane-force winds, the scale addresses thepotential damage from the winds and seas asso-ciated with tropical depressions and tropicalstorms as well as with typhoons. The scale hasgood potential for application in other tropicalcyclone-prone areas in the global tropical belt.The paper will be submitted to a meteorologicaljournal, and a User’s Manual has been complet-ed and will be published as an NOCC/JTWCTechnical Note.
7.3 MIDGET TROPICAL CYCLONES: ASURVEY AND DESCRIPTION
Dr. Mark A. LanderUniversity of Guam
andLt Col Chip Guard
Joint Typhoon Warning Center, Guam
This paper attempts to distill from historicalaccounts, technical studies, and recent observa-tions, a descriptive climatology of midget tropi-cal cyclones (MTCS). A definition of the MTCis presented. Several examples of MTCS areprovided to illustrate the special diagnostic andforecast problems associated with these storms.An argument is presented that the MTC is aunique subset of tropical cyclones possessing aunique set of characteristics, and not merely acontinuum of smaller than normal tropical
249
cyclones based solely on size. These uniquecharacteristics are identified and a physicalmodel is presented. Foremost among these arethe presence of inner core winds only (no sig-nificant outer core winds), rapid intensitychanges, and preferred areas for genesis underspecific synoptic conditions. Techniques foranalysis, satellite interpretation, and forecastingare presented. The paper will be submitted to ameteorological journal for publication.
7.4 AN EXPLORATORY ANALYSISOF THE RELATIONSHIP BETWEENTROPICAL STORM FORMATION IN THEWESTERN NORTH PACIFIC ANDEL NINO-SOUTHERN OSCILLATION(ENSO)
Dr. Mark A. LanderUniversity of Guam
Observed annual tropical cyclone (TC)totals in the western North Pacific are virtuallyuncorrelated with any ENSO index, a findingwhich supports earlier work by Ramage andHori (1981). The only statistically significantrelationship found in this study between anENSO index and a statistic of TC totals was thereduction in the number of Early Season stormsduring years when the Southern Oscillationindex starts out relatively low and rises sharplyby the middle of the year.
It is very clear that the ENSO cycle plays amajor role in the interannual fluctuation of theannual mean genesis location of TCS in thewestern North Pacific. In order to show thisrelationship, the NOAA Climate AnalysisCenter’s monthly values of the SouthernOscillation index were averaged in 1l-month(March through January) intervals (< S01>).When the <S01> is low and the SST in the cen-tral and eastern equatorial Pacific is warmerthan normal, the genesis region for TCS in thewestern North Pacific shifts eastward; when the<S01> is very high and the SST of the central
250
and eastern equatorial Pacific is cooler than nor-mal (so-called, “la nina” or cold event cond~-tions) the annual average genesis location shiftswestward.
During a given year, the TC distribution andthe preferred areas for genesis are governed pri-marily by the location and the behavior of themonsoon trough. ENSO plays a significant partin the complex behavior of the regional circula-tion of the western North Pacific, particularlywith respect to the eastward extent of penetra-tion of monsoonal westerly winds in the westernNorth Pacific. During low cSOI> years, themonsoonal westerly winds penetrate further tothe east than during most other years, and theaverage annual genesis location of the TCS isfound east of normal. This eastward displace-ment of cyclogenesis is greatest during the LateSeason of low <S01> years (Figure 1). Duringhigh <S01> years, the monsoon trough, onaverage, does not penetrate as far to the east asit does during low <S01> years, and the annualmean genesis location is found west of normal,particularly during the Early and Late Season,Many of the TCS that form to the east of notmalduring the Mid Season of high <S01> years aminduced north of 20”N in low-level easterly flowby overlying or peripheral TWIT’ cells. Most ofthe TCS that form to the east of normal duringlow <S01> years form south of 20”N at theeastern terminus of an eastward-displaced mon-soon trough (Figure 1).
A BEARLY SEASON EARLY SEASON
30”N 2VN.:* t
●
● * ● L---------- ----- m.“ * A----------- -----s“ -20
.“ , ,.● * .%.*.”: >.”** I
%3 .-.,-1 0 .
. . ●
.“.”** :. “- 10
● , .t.
, ●**,,
100 120, ~Eo
MO I&” E mo 120 la40
MO-E 1s0
MID SEASON MID SEASON● X)*N . 30%
.,*. 1.a“ ‘.
. . .. .
.t*.@:*“ .*
;.●*●
●. .*● ●..**: ---------------20 ● .*,. . ●.*” *o----------------~
“s-e g:” .* ●.” : ! “***:. ● * ,*..”..*. ● .“.~ “* :.
●*. .. ● ●
.* ##/*..;.;.*. . .10
. “. *****, .* .101., .
t100 120
Jm140 MO-E 1s0 100 120 w
JEOlS&E ISO
LATE SEASON 8m
LATE SEASON. 20%
,,
1
. ; ---------- ------ ~ ●,----- ----- ----- . 20.
●
.=s” *.●
..“; .
.: .*
..’8 ●*.
.
. ~10.*O
“** ● . 10.
:* .**..,* ●.. #*”●
. .“, ,.,1
100EQ
120 )40 100-m
WE ?s0 am MO M&c 1s0
Figure 1. Origins of tropical cyclones by season (EarlySeason— March through mid-July; Mid-Season — mid-July throughmid-octobe~ Late Season — mid-oclober through January) for he five years during tie period 1970-1991 with tie five high-est values of <SOb (column A), and for the live years with the lowesl values of 40b. (cdn-nn B). NOR origin is definedas the location where tropical depression intensity firs~ appears on the JTWC final best track .
7.5 AUTOMATED TROPICAL CYCLONEBINARY INTERACTION ANALYSIS ANDFORECASTING
Captain Steven C. Hallin, USAFJoint Typhoon Warning Center, Guam
7.5.1 ANALYSISIn order to update existing hand plotted
techniques, an automated technique for theanalysis of binary systems has been developed.This technique uses analytical techniques devel-oped in previous studies (Brand, 1970; Dongand Neumann, 1983; Lander and Holland,1993) which have emphasized the importanceof plotting the tracks of the two tropicalcyclones relative to the centroid, calculating the
251
separation distance between them, and calculat-ing orbit rates around the centroid. Typical fea-tures of a binary interaction, as seen in the cen-troid-relative tracks, are summarized in Figure2.
The primary, and most reliable, parameterused in diagnosing the onset of binary interac-tion is the separation distance. The average dis-tance at which binary interaction is initiated isapproximately 750 nm (1400 km or approxi-mately 12° of longitude) (Brand, 1970),although in practice, capture or escape canoccur at substantially different distances. Areal-time calculation of the orbit rates aroundthe centroid provides another objective measure
of the onset of interaction. To use the orbit ratein determining the onset of binary interaction,

ridge as it escapes and recurves. In Figure 4,
Figure 2. Model of binary interaction of two cyclonic,mesoscale vortices, conr.aining the major elements of approachand capture, followed by mutual Orb]L then release and escape,or merger (from Lander end Holland. 1993).
the following rule of thumb is applied: if theseparation distance is greater than 750 nm, adelay of the diagnosis of binary interaction issuggested until a cyclonic orbit rate of at leasttwo degrees per six hours has been establishedfor 12 hours. If the separation distance is lessthan average, then six hours of any amount ofcyclonic orbit rate should suffice to establishthat interaction has commenced. Deviationsfrom the idealized case shown in Figure 2 canbe manifested as periods of transient binaryinteraction, periods of weak binary interaction,fluctuating orbit rates, and nonstandard captureand escape distances. These deviations mayoccur due to external influences or size variabil-ity in the tropical cyclones.
Figures- 3 and 4 show the interactionbetween Typhoons Brian (25W) and Colleen
(26W) in October 1992. Figure 3 is a commoncentroid-relative pattern for a binary interaction(Lander and Holl:ind, 1993). In earth-relativecoordinates, the system to the west will typical-ly exhibit a slow, erratic, looping motion as
occurred with Colleen. The other tropicalcyclone, in this case Brian, will acclerate towardthe northwest after a noticeable bifurcation in itstrack, and then track around the subtropical
the significant cyclonic rotation started on2012002 October at a greater than average dis-tance, e.g. 12-18 hours before the separationdistance reached the 750 nm threshold, andincreased as the systems approached. Brianescaped the interaction on 2318002 October asindicated by the increase in separation. Theactual tracks of Typhoons Brian (25W) andColleen (26W) are shown in Chapter 3, Section3.2 Western North Pacific Tropical Cyclones.
15” ~—. —-.
w Eecai= Typhoon
\A / Brian: sO--
Centroid
\A . 1~z
\zK ‘-5”- -
- .Capture
Typhoon.1OO Colleen
-Iw
-Iv -Iv -s” 0 5“ 10“ 1s’
Longitude Relative to the Centrold
Figure 3 Cerrtroid relative positions for Typhoom Brian (25W)and Colleen (26W).
2* I1300
——— — ——— .——. —.— ._._——0 -
: . .Orbll Rate
!2
/0-2 --___. . . . . ~__ -— -- .- .-.g
/
- 1000E
‘~
~g -—...— —.—-.- -..—. .— —---.—-.. .-.=4 - 900 g
Separation; ,.. . . . . . ..
0-- —. aoo
-6 ---.----’–-— — ---- --—----~ .-– - --- 700
+~~Qo19 20 21 22 23 24
October
Figure 4. Time series of separation and orbit rale for the inter-action between Typhoons Brian (25W) and Colleen (26 W).Negative orbi[ rates indicate cyclone rotation.
252
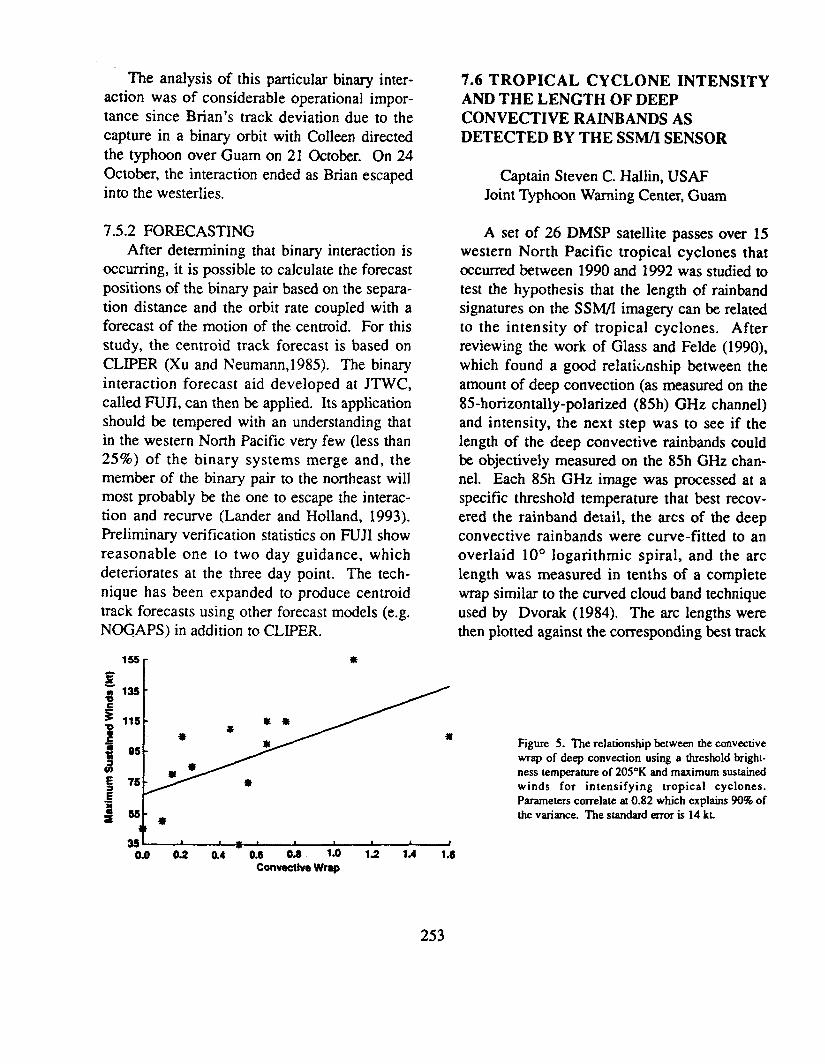
The analysis of this particular binary inter-action was of considerable operational impor-tance since Brian’s track deviation due to thecapture in a binary orbit with Colleen directedthe typhoon over Guam on 21 October. On 24October, the interaction ended as Brian escapedinto the westerlies.
7.5.2 FORECASTINGAfter determining that binary interaction is
occurring, it is possible to calculate the forecastpositions of the binary pair based on the separa-tion distance and the orbit rate coupled with aforecast of the motion of the centroid. For thisstudy, the centroid track forecast is based onCLIPER (Xu and Neumann,1985). The binaryinteraction forecast aid developed at JTWC,called FUJI, can then be applied. Its applicationshould be tempered with an understanding thatin the western North Pacific very few (less than25%) of the binary systems merge and, themember of the binary pair to the northeast willmost probably be the one to escape the interac-tion and recurve (Lander and Holland, 1993).Preliminary verification statistics on FUJI showreasonable one to two day guidance, whichdeteriorates at the three day point. The tech-nique has been expanded to produce centroidtrack forecasts using other forecast models (e.g.N@APS) in addition to CLIPER.
lS5r *
7.6 TROPICAL CYCLONE INTENSITYAND THE LENGTH OF DEEPCONVECTIVE RAINBANDS ASDETECTED BY THE SSM/I SENSOR
Captain Steven C. Hallin, USAFJoint Typhoon Warning Center, Guam
A set of 26 DMSP satellite passes over 15western North Pacific tropical cyclones thatoccurred between 1990 and 1992 was studied totest the hypothesis that the length of rainbandsignatures on the SSM/1 imagery can be relatedto the intensity of tropical cyclones. Afterreviewing the work of Glass and Felde (1990),which found a good relaticmship between theamount of deep convection (as measured on the85-horizontally-polarized (85h) GHz channel)and intensity, the next step was to see if thelength of the deep convective rainbands couldbe objectively measured on the 85h GHz chan-nel. Each 85h GHz image was processed at aspecific threshold temperature that best recov-ered the rainband detail, the arcs of the deepconvective rainbands were curve-fitted to anoverlaid 10° logarithmic spiral, and the arclength was measured in tenths of a completewrap similar to the curved cloud band techniqueused by Dvorak (1984). The arc lengths werethen plotted against the corresponding best track
~g 136 “
# ,,~ .
2**
* *la
*
+ 05-Figure 5. Ike relationship between the convective
5wrap of deep convection using a threshold bright-
g 75-nesstemperatureof205°Kandmaximum sustainedwinds for intensifying tropical cyclones.Parameters correlate at 0.82 which explains 90% ofthe variance. The standard error is 14 kt.
i #
36~ a t * t0.0 0.2 0.4 0.6 0.6 1.0 1.2 1.4 1.6
Convective Wrap
253
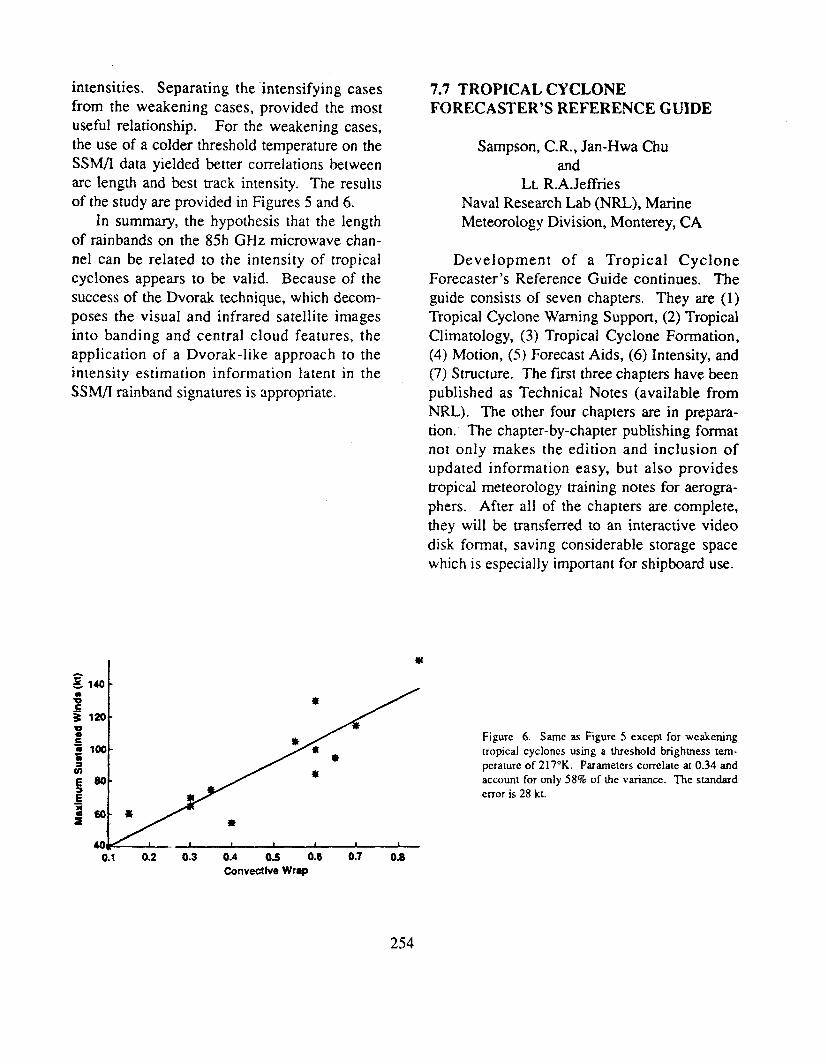
intensities. Separating the ‘intensifying casesfrom the weakening cases, provided the mostuseful relationship, For the weakening cases,the use of a colder threshold temperature on theSSM/1 data yielded better correlations betweenarc length and best track intensity. The resultsof the study are provided in Figures 5 and 6.
In summary, the hypothesis that the lengthof rainbands on “the 85h GHz microwave chan-nel can be related to the intensity of tropicalcyclones appears to be valid. Because of thesuccess of the Dvorak technique, which decom-poses the visual and infrared satellite imagesinto banding and central cloud features, theapplication of a Dvorak-1ike approach to theintensity estimation information latent in theSS,M/I rainband signatures is appropriate.
*m .
100-*
80-
*
60 -=
40
7.7 TROPICAL CYCLONEFORECASTER’S REFERENCE GUIDE
Sampson, C. R., Jan-Hwa Chuand
Lt. R.A.JeffriesNaval Research Lab (NRL), MarineMeteorology Division, Monterey, CA
Development of a Tropical CycloneForecaster’s Reference Guide continues. Theguide consists of seven chapters. They are (1)Tropical Cyclone Warning Support, (2) TropicalClimatology, (3) Tropical Cyclone Formation,(4) Motion, (5) Forecast Aids, (6) Intensity, and(7) Structure. The f~st three chapters have beenpublished -as Technical Notes (available fromNRL). The other four chapters are in prepara-tion. The chapter-by-chapter publishing formatnot only makes the edition and inclusion ofupdated information easy, but also providestropical meteorology training notes for aerogra-phers. After all of the chapters are complete,they will be transferred to an interactive videodisk format, saving considerable storage spacewhich is especially important for shipboard use.
Figure 6. Same as Figure 5 except for weakeningmrpical cyclones using a threshold brightness tem-perature of217°K. Parameters correla~e at 0.34 andaccount for only 5870 of the variance. The standardemor is 28 kt.
0:1 0.2 0.3 0.4 0.s 0.6 ~.7 OBConvective Wrap
254
7.8 A REGRESSION MODEL FOR THE under the program direction of the SpaceWESTERN NORTH PACIFIC Warfare and Systems Command. The newTROPICAL CYCLONE INTENSITY ATCF will use industry standard X-FORECAST Window/Motif for window management and
will communicate with the TacticalJan-Hwa Chu and C.R. Sampson Environmental Support System (TESS 3.0).
Naval Research Lab (NRL), Marine The first phase of the project is expected to beMeteorology Division, Monterey, CA completed in the summer of 1995.
A regression model forecasting the tropicalcyclone intensity in the western North Pacificwas derived by using the nineteen-year (1971-1989) post-analysis best track data from JTWCwhich includes the date, time and location of thecyclone’s circulation center, and the observedmaximum sustained wind speed (1-minute aver-age at 10-meter elevation). The term intensityrefers to the estimated maximum sustained 1-minute surface wind speed associated with acyclone. This model provides intensity fore-casts for 12-hour intervals up to 72 hours. Theverification of the model’s forecasts for datafrom 1990 is discussed. An operational versionof this regression model, Statistic TyphoonIntensity Forecast (SHIFOR), was delivered tothe Fleet Numerical Oceanography Center foroperational testing. This model is based on theSHIFOR model (Jarvinen and Newmann, 1979)used at the National Hurricane Center. A tech-nical report on this model will be published.
7.9 AUTOMATED TROPICAL CYCLONEFORECASTING SYSTEM (ATCF)UPGRADE
T.L. Tsui, A.J. Scrader, Lt R.A. Jeffriesand
C.R. SampsonNaval Research Lab (NRL), MarineMeteorology Division, Monterey, CA
The ATCF has been operational at JTWCsince 1988. The current system runs on anIBM-DOS operating system. NRL, Monterey is
adapting ATCR to the UNIX operating system
7.10 PROTOTYPE AUTOMATEDTROPICAL CYCLONEHANDBOOK (PATCH)
C.R. Sampson and Lt. R.A. Jeffi-iesNaval Research Lab (NRL)
Marine Meteorology Division, Monterey, CA
PATCH is an expert system designed to pro-vide tropical cyclone forecast and training guid-ance to JTWC for the western North PacificOcean. The scope of the project has expandedto include expertise pertaining to tropicalcyclone formation, motion, intensification anddissipation, and structure and structure change.The motion section is under evaluation and inthe future will include forecasting expertise cur-rently under development at the NavalPostgraduate School. The expert system is anintegral part of the ATCF upgrade.
7.11 TROPICAL CYCLONE MOTION-92(TCM-92) MINI-FIELD EXPERIMENT
Professor Russell L. ElsberryNaval Postgraduate School, Monterey, CA
The Naval Postgraduate School (NPS) andthe Office of Naval Research (ONR) MarineMeteorology Program co-sponsored a mini-fieldexperiment near Guam during July-August1992. The Experiment Operations Center waslocated at JTWC, which provided space, sharedits meteorological data bases and facilitated theTCM-92 operations. JTWC TDOS participatedin routine meteorological discussions.
255

The objectives and organization of theexperiment were described in the TCM-92Operations Plan (Elsberry et al., 1992), whichalso summarized recent research that has inves-tigated short-duration tropical cyclone trackdeviations. TCM-92 tested the followinghypotheses:
1) Long-lived tropical MesoscaleConvective Systems (MCS) have a three-dimen-sional wind and thermal structure similar to amidtropospheric vortex in the stratiform rainregion of a midlatitude MCS, and have suffi-cient horizontal extent to cause a mutual inter-action with a tropical storm or weak typhoonvia a Fujiwhara-type effect that results in trackdeviations of the order of 100 km a day.
2) Long-lived tropical MCSS that maintaina quasi-stationary position relative to an associ-ated tropical cyclone cause approximately 100km deflections in the cyclone track via a diver-gent circulation and its interaction with the sym-metric vorticity field to create a wavenumberone asymmernc circulation.
3) Relative cyclone track displacement of aMCS and a tropical cyclone can be related totheir radial positions within the horizontal windshear field of an active monsoon trough.
4) Tropical cyclone genesis is caused by themerger of two or more interacting MCSS to cre-ate a single system with greater vorticity.
During the period of 21 July 1992 to 21August 1992, USAF Reserve WC- 130 aircraftand crews of the 815th Tactical AirliftSquadron, Keesler Air Force Base, Mississippideployed to the western North Pacific.Operating from Guam, crews flew nine mis-sions of 9-13 hours duration into tropicalcyclones and nearby MCS to collect flight-leveland dropwindsonde obsexwations in support ofthe TCM-92 mini-field experiment as describedin the NPS Technical Report (Dunnavan et al.,1992). A M.S. thesis at NPS by Captain EricMcKinley (USAF) compares the observationsfrom the most pronounced MCS during
256
Intensive Observing Period (IOP) 7 verses aweak MCS during IOP 1. Four papers describ-ing the preliminary results from TCM-92 willappear in the Preprints of the AmericanMeteorological Society 20th Conference onHurricanes and Tropical Meteorology (Bootheet al., 1993; Dunnavan et al., 1993; McKinleyand Elsberry, 1993; and Ritchie, 1993).

BIBLIOGRAPHY
Atkinson, G. D. and C. R. Holliday, 1977: Tropical
cyclone minimum sea-level pressure and maximum sus-
tained wind relationship for the western North PacKlc.Monthly Weather Review, Vol. 105, No. 4, pp 421-427.(also Fleet Weather Central/JTWC Technicat Note 75-l).
Boothe, M.A., P.A. llarr and R.L. Elsberry, 1993:Interaction between a mesoscale convective system andthe large-scalemonsoon flow during TCM-92. Preprints,20th Conf. on Hurr. and Trop. Meteor., (Paper 15A.3).
Brand, S., 1970: Interaction of binary tropical cyclonesof the western North Pacific Ocean. Journal of AppliedMeteorology, Vol. 9, pp 433-441.
Bureau of Meteorology (Northern Territory Region),1992: Darwin Tropical Diagnostic Statement(s), Janthrough Dec. The Regional Director, Bureau ofMeteorology, GPO Box 735, Darwin, Northern Territory0801, Australia.
Diercks, J. M., R. C. Weir and M. K. Kopper, 198XForecast Verification and Reconnaissance Data forSouthern%emisphere Tropical Cyclones (July 1980through June 1982), NOCC/JTWC Technical Note 82-1,77 pp.
Dong, K. and C. J. Neumann, 1983: On the relativemotion of binary tropical cyclones. Monthly WeatherReview, Vol. 111, pp 945-953.
Dunnavan, G. M., 1981: Forecasting Intense TropicalCyclones Using 700 mb Equivalent PotentialTemperature and Central Sea-Level Pressure.NOCC/JTWC Technical Note 81-1, 12 pp.
Dunnavan, G. M., E. J. McKinley, P. A. Harr, E. A.Ritchie, M. A. Boothe, M. A. Lander and R. L.Elsberry, 1992: Tropical Cyclone Motion (TCM-92)mini-field experiment summary. Tech. Report NPS-MR-93-001, Naval Postgraduate School, Monterey, CA93943.
Dunnavan, G. M., R.L. Elsberry, P.A. Harr, E.J.McKinley and M.A. Boothe, 1993: Overview of the1992 Tropical Cyclone Motion (TCM-92) mini-fieldexperiment. Preprints,Meteor., (Paper 15A. 1).
20th Conf. on Hum. and Trop.
257
Dvorak, V. F., 1975: TC Intensity Analysis andForecasting from Satellite Imagery. Monthly WeatherReview,Vol 103,No. 5, pp 420-430.
Dvorak, V. F., 1984: Tropical Cyclone IntensityAnalysisUsing Satellite Data. NOAA TechnicalReportNESDIS 11,46 Pp.
Elsberry, R.L., G.M. Dunnavan and EJ. McKinley,1992: Operations plan for the tropical cyclone motion(TCM-92) mini-field experiment. Tech. Report NPS-MR-92-002, Naval Postgraduate School, Monterey, CA93943,46 pp.
Glass, M., and G.W. Felde, 1990: Tropical storm struc-ture analysis using SSMJI and OLS data. 5th Ml. Conf.on Interactive and Info. Processing Systems for Meteor.,Oceanogr.. and HydroL, Aneheim, CA, Amer. Meteor.Sot., 432-437.
Guard, C.P., 1983: A Study of Western North PacificTropical Storms and Typhoons that Intensify afterRecurvature. First Weather Wing Technical Note-831t302,28 pp.
Herbert, P. H. and K. O. Poteat, 1975: A SatelliteClassification Technique for Subtropical Cyclones.NOAA Technical Memorandum NWS SR-83, 25 pp.
Holland, G. J., 1980: An analytical model of wind andpressure profiles in hurricanes. Monthly WeatherReview, Vol. 108, No. 8, pp 1212-1218.
Holland, GJ. and M.A. Lander, 199% On the mean-dering nature of tropical cyclone tracks. Journal of theAtmospheric Sciences (in press).
Holliday, C. R. and A. H. Thompson, 1979:Climatological characteristics of rapidly intensifyingtyphoons. Monthly Weather Review, Vol. 107, pp 1022-1034.
Jarvinen, B.R. and CJ. Neumann, 1979: Statisticalforecast of tropical cyclone intensity. NOAA TechnicalMemorandum NWS NHC-10, 22pp.
Jarrell, J. D., S. Brand and D.S. Nicklin, 1978: Ananalysis of western Pacific tropical cyclone forecastercors. Monthly Weather Review, 106,925-937.

APPENDIX ADEFINITIONS
BEST TRACK - A subjectively smoothed path,versus a precise and very erratic fix-to-fix path,used to represent tropical cyclone movement,and based on an assessment of all availabledata.
CENTER - The vertical axis or core of a tropi-cal cyclone. Usually determined by cloud vor-ticity patterns, wind and/or pressure distribu-tion.
EPHEMERIS - Position of a body (satellite) inspace as a function of time; used for griddingsatellite imagery. Since ephemeris gridding isbased solely on the predicted position of thesatellite, it is susceptible to errors from vehiclewobble, orbital eccentricity, the oblateness ofthe Earth, and variation in vehicle speed.
EXPLOSIVE DEEPENING - A decrease inthe minimum sea-level pressure of a tropicalcyclone of 2.5 mb/hr for at least 12 hours or 5.0mb/hr for at least six hours (Dunnavan, 1981).
EXTRATROPICAL - A term used in warningsand tropical summaries to indicate that acyclone has lost its “tropical” characteristics.The term implies both poleward displacementfrom the tropics and the conversion of thecyclone’s primary energy source from therelease of latent heat of condensation to baro-clinic processes. It is important to note thatcyclones can become extratropical and stillmaintain winds of typhoon or storm force.
EYE - The central area of a tropical cyclonewhen it is more than half surrounded by wallcloud.
FUJIWHARA EFFECT - A binary interactionwhere tropical cyclones within about 750 nm(1390 km) of each other begin to rotate about acommon midpoint (Brand, 1970; Dong and
Neumann, 1983).
INTENSITY - The maximum sustained 1-minute mean surface wind speed, typicallywithin one degree of the center of a tropicalcyclone.
MAXIMUM SUSTAINED WIND - The high-est surface wind speed averaged over a 1-minute period of time. (Pe* gusts over wateraverage 20 to 25 percent higher than sustainedwinds.)
MONSOON DEPRESSION - a tropicalcyclonic vortex characterized by: 1) its largesize, the outermost closed isobar may have adiameter on the order of 600 nm (1000 km); 2)a loosely organized cluster of deep convectiveelements; 3) a low-level wind distributionwhich features a 100-nm (200-km) diameterlight-wind core which may be partially sur-rounded by a band of gales; and, 4) a lack of adistinct cloud system center. Note: most mon-soon depressions which form in the westernNorth Pacific eventually acquire persistent cen-tral convection and accelerated core windsmarking its transition into a conventional tropi-cal cyclone.
MONSOON GYRE - a mode of the summermonsoon circulation of the western NorthPacific characterized by: 1) a large nearly circu-lar low-level, cyclonic vortex that has an outermost closed isobar with diameter on the order of1200 nm (2500 km); 2) a cloud band rimmingthe southern through eastern periphery of thevortex/surface low; 3) a relatively long (twoweek) life span - initially, a subsident regime
exists in its core and western and northwesternquadrants with light winds and scattered lowcumulus clouds; later, the area within the outerclosed isobar may fill with deep convectivecloud and become a monsoon depression or
259
tropical cyclone; and, 4) the large vortex cannotbe the result of the expanding wind field of apreexisting monsoon depression or tropicalcyclone. Note: a series of small or midget tropi-cal cyclones may emerge from the “head” orleading edge of the peripheral cloud band of amonsoon gyre (Lander, 1993).
RAPID DEEPENING - A decrease in the min-imum sea-level pressure of a tropical cyclone of
1.75 mb/hr or 42 mb for 24-hours (Hollidayand Thompson, 1979).
RECURVATURE - The turning of a tropicalcyclone from an initial path toward the west andpoleward to east and poleward, after movingpoleward of the mid-tropospheric subtropicalridge axis.
SIGNIFICANT TROPICAL CYCLONE -A tropical cyclone becomes “significant” withthe issuance of the first numbered warning bythe responsible warning agency.
SIZE - The areal extent of a tropical cyclone,usually measured radially outward from thecenter to the outer-most closed isobar.
STRENGTH - The average wind speed of thesurrounding low-level wind flow, usually mea-sured within one to three degrees of the centerof a tropical cyclone (Weatherford and Gray,1985).
SUBTROPICAL CYCLONE - A low pres-sure system that forms over the ocean in thesubtropics and has some characteristics of atropical circulation, but not a central denseovercast. Although of upper cold low or low-level baroclinic ongins, the system can transi-tion to a tropical cyclone.
SUPER TYPHOON - A typhoon with maxi-mum sustained 1-minute mean surface winds of130 kt (67 m/see) or greater.
TROPICAL CYCLONE - A non-frontal,migratory low-pressure system, usually of syn-optic scale, originating over tropical or subtropi-cal waters and having a definite organized cir-culation.
TROPICAL DEPRESSION - A tropicalcyclone with maximum sustained l-minutemean surface winds of 33 kt (17 m/see) or less.
TROPICAL DISTURBANCE - A discretesystem of apparently organized convection,generally 100 to 300 nm (185 to 555 km) indiameter, originating in the tropics or subtrop-ics, having a non-frontal, migratory characterand having maintained its identity for 12- to 24-hours. It may or may not be associated with adetectable perturbation of the low-level wind orpressure field. It is the basic generic designa-tion which, in successive stages of develop-ment, may be classified as a tropical depression,tropical storm, typhoon or super typhoon.
TROPICAL STORM - A tropical cyclonewith maximum l-minute mean sustained sur-face winds in the range of 34 to 63 kt (17 to 32m/see), inclusive.
TROPICAL UPPER-TROPOSPHERICTROUGH (TUTT) - A dominant climatologi-cal system and a daily upper-level synoptic fea-ture of the summer season, over the tropicalNorth Atlantic, North Pacific and South PacificOceans (Sadler, 1979).
TYPHOON (HURRICANE) - A tropicalcyclone with maximum sustained l-minutemean surface winds of 64 to 129 kt (33 to 66
m/see). West of 180 degrees east longitude theyare called typhoons and east of 180 degrees eastlongitude hurricanes.
260
WALL CLOUD -Unorganized band of deepcumuliform clouds that immediately surroundsthe central area of a tropical cyclone. The wallcloud may entire] y enclose or partially surroundthe center.
261
APPENDIX B
NAMES FOR TROPICAL CYCLONES IN THEWESTERN NORTH PACIFIC AND SOUTH CHINA SEA
Column 1 Column 2 Column 3 Column 4
ANGELA AN-gel-ah ABE ABE AMY A-mee AXEL AX-enBRIAN 13RY-an BECKY BECK-ee IIRENDAN BREN-dan BOBBIE BOB-eeCOLLEEN COL-leen CECIL CEE-cil CAITLIN KATE-lin CHUCK CHUCKDAN DAN DOT DOT DOUG DUG DEANNA dee-AN-naELSIE ELL-see ED ED ELLIE ELL-ee ELI EE-lyeFORREST FOR-rest FLO FLO FRED FRED FAYE FAYGAY GAY GENE GEEN GLADYS GLAD-iss GARY GAR-eeHUNT HUNT HATTIE HAT-ee HARRY H.AR-ee HELEN HELL-enIRMA IR-ma IRA EYE-ra IVY EYE-vee IRVING ER-vingJACK JACK JEANA JEAN-ah JOEL JOLE JANIS JAN-issKORYN ko-RIN KYLE KYE-ell KINNA KIN-na KENT KENTLEWIS LOU-iss LOLA LOW-lab LUKE LUKE LOIS LOW-issMARIAN MAH-nan MANNY* MAN-ee MELISSA* meh-LISS-ah MARK MARKNATHAN NAY-than NELL NELL NAT NAT NINA NEE-nahOFELIA oh-FEEL-ya OWEN OH-en ORCHID OR-kid OSCAR* OS-carPERCY PURR-see PAGE PAGE PAT PAT POLLY PA-leeROBYN ROB-in RUSS RUSS RUTH RUTH RYAN RYE-anSTEVE STEEV SHARON SHAR-on SETH SETH SIBYL SIB-illTASHA TA-sha TIM TIM TERESA* teh-REE-sah TED TEDVERNON VER-non VANESSA vah-NES-ah VERNE VERN VAL VALWINONA wi-NO-nah WALT WALT WILDA WILL-dab WARD WARDYANCY YAN-see YUNYA YUNE-yah YURI YOUR-ee YVETTE ee-VETZOLA ZO-lah ZEKE ZEEK ZELDA ZELL-dah ZACK ZACK
* Name changes: MANNY replaced MIKE in 199 1; MELISSA replaced MIREILLE, TERESAreplaced THELMA in 1992, and OSCAR replaced OMAR in 1993.
NOTE 1: Names are assigned in rotation and alphabetically. When the last name in Column 4 (ZACK)has been used, the sequence will begin again with the first name in Column 1 (ANGELA).
NOTE 2: Pronunciation guide for names are italicized.
SOURCE: CINCPACINST 3140. IV
262

APPENDIX CCONTRACTIONS
A-track
AB
ABW
ABIO
ABPW
ACCS
ACFI’
ADP
AFB
AFGWC
AIREP
AJTWC
AMos
AOR
ARc
Along-tmck
Air Base
Air Base Wing
Significant TropicalWeather Advisory forthe Indian Ocean
Significant TropicalWeather Advismy forthe Western PacificOcean
Air Control CenterSquadron
Aircraft
Automated DataProcessing
Air Force Base
Air Force GlobalWeather Central
Airfield FixedTelecommunicationNetwork
Aircraft (Weather)Report
Alternate Joint TyphoonWarning Center
AutomaticMeteorologicalObserving Station
Area of Responsibility
Automatic PictureTransmission
Automated RemoteCollection
ARGOS
ATCF
AUTODIN
AWDS
AWN
CCWF
CDO
CEC
CI
CINCPAC
CIV
CLD
CLIM
CLIP orCLIPER
CM
C-MAN
CNOC
CPA
International Servicefor Drifting Buoys
Automated TropicalCyclone Forecast(Syslem)
Automated DigitalNetwork
Automated WeatherDistribution System
Automated WeatherNetwork
Combined ConfidenceWeighted Forecast
Central Dense Overcast
Circular Exhaust Cloud
Currcnl Intensily
Commander-in-ChiefPacific (AF - Air Force,FLT - Fleet)
Civilian
Cloud
Climatology
Climatology andPersistence Technique
Centimeter(s)
Coastal-MarineAutomated Network
Commander NavalOceanographyCommand
Closest Point ofApproach
263
CPHC
Csc
CSUM
DDN
DEG
DET
DFS
DMSP
DOD
DSN
DTG
EGGR
FBAM
FI
FNOC
FT
GMT
GOES
GTS
Central PacificHurricane Center
Cloud System Center
Colorado StateUniversity Model
Defense Data Network
Degres(s)
Detachment
Digital FacsimileSystem
Defense MeteorologicalSatellite program
Department of Defense
Defense SwitchedNetwork
Date Time Group
Bracknell Model
FNOC Beta AdvectionModel
Forecast Intensity(Dvorak)
Fka NumericalOceanography Center
Feet
Greenwich Mean Time
GeostationaryOperationalEnvironmental Satellite
Global Telecommun-ications System
HPAC
HF
HR
HRPT
ICAO
INIT
lNST
IR
nwc
JTWC92or JT92
JTYM
KM
KT
LAN
LAT
LLCC
LONG
LUT
LVL
M
MAX
MB
Mean of XTRP andCLIM Tcchniqucs (Halt’Persistcncc andClimatology)
High Frequency
Hour(s)
High ResolutionPicture Transmission
International CivilAviation Organization
Initial
Instruction
lnfrarcd
Joint Typhoon WarningCenter
Statistical-dynamicalObjcctivc Tcchniquc
Japanese TyphoonModel
Kilometer(s)
Knot(s)
Local Area Network
Latitude
Low-Level CirculationCenter
Longitude
Local User Terminal
Level
Meter(s)
Maximum
Millibar(s)
M13AM
MCAS
MET
MIDDAS
MIN
MINI-MET
MISTIC
MM
MOVG
MSLP
NARDAC
NAS
NASA
Medium Beta andAdvcction Model
Marine CorpsAir Station
Meteorological
MeteorologicalImagery, Data Display,and Analysis Systcm
Minimum
Mini-Meteorological
Mission Sensor TacticalImaging Computer
Millimeter(s)
Moving
Minimum Sea-levelPressure
Naval Regional DataAutomation Center
Naval Air Station
National Aeronauticsand SpaceAdministration
NAVOCEANCOM
NEDN
NEDS
NESDIS
NESN
Naval OceanographyCommand
Naval EnvironmentalData Network
Naval EnvironmentalDisplay Station
National EnvironmentalSatellite, Data, andInformation Service
Naval EnvironmentalSatellite Network
264
NEXRAD
NHC
NM
NMC
NOAA
NOCC
NODDES
NODDS
NOGAPSor NGPS
NR
NRL
NRPS orNORAPS
NSDS
NSDS-G
NSS
NTCC
Next GenerationWeather (Doppler)Radar
National HurricaneCenter
Nautical Mile(s)
National MeteorologicalCenter
National Oceanic andAtmosphericAdministration
Naval OceanographyCommand CenterNaval EnvironmentalData NetworkOceanographic DataDistribution andExpansion System
Navy/NOAAOceanographic DataDistribution Systcm
Navy OperatiomlGlobal AtmosphericPrediction System
Number
Naval ResearchLaboratory
Navy OpcratiomlRegional AtmosphericPrediction System
Naval Satellite DisplaySystem
Naval Satellite DisplaySystem - Geostationary
Northward-displaced,Self-sustaining, Solitary(monsoon gyre)
NavalTelecommunicationsCenter
Nwoc
Nws
OBS
OLS
ONR
0ss
OTCM
PACAF
PACMEDS
PACOM
PCN
PDN
PIREP
RADOB
RECON
RRDB
RRT
RSDB
SAT
SEC
SDHS
Naval WesternOceanography Center
NorthWes[ Pacific
National WeatherService
Observations
Operational LinescanSystem
Office of NavalResearch
Operations SupportSquadron
One-Way (Interactive)Tropical Cyclone Model
Pacific Air Force
Pacific MeteorologicalData System
Pacific Command
Position Code Number
Public Data Network
Pilot Weather Report(s)
Radar Observation
Reconnaissance
Reference Roster DataBase
Rapid Response Team
Raw Satellite Data Base
Satellite
Scxond
Satellite Data HandlingSystem
SFC Surface
SGDB Satellite Global DataBase
SLP Sea-Level Pressure
SPAWRSYSCOM Space and
ssM/I
SST
STNRY
ST
STR
STY
TAPT
TC
TCFA
TCM-90
TD
TDA
TDO
TEss
TIROS
TOGA
COARE
Naval WarfareSystems Command
Special SensorMicrowaveflmager
Sea SurfaceTemperature
stationary
Subtropical
Subtropical Ridge
Super Typhoon
Typhoon AccelerationPrediction Technique
Tropical Cyclone
Tropical CycioneFormation Alert
Tropical CycloneMotion Mini-FieldExperiment -1992
Tropical Depression
Typhoon Duty Assistant
Typhoon Duty Officer
Tactical EnvironmentalDisplay System
Television InfraredObservational Satellite
Tropical Ocean Global
Atmosphere CoupledOcean-AtmosphereResponse Experiment
265
TOTL
TOVS
TS
TY
TYAN
TYMNET
ULCC
us
USAF
USN
VIS
WESTPAC
WMO
WRN or
WRNG
Ws
X-track
XTRP
z
Analog Technique basedon all acceptable NWPbasin analogs (straightand rtxwrvers)
TIROS OperationalVertical Sounder
Tropical Storm
Tropical Upper-Tropospheric Trough
Typhoon
Typhoon Analog(Program)
Time-Sharing NetworkCommercial wide areanetwork comectingmicro- and main-framecomputers
Upper-Level CirculationCenter
United States
United States Air Force
United States Navy
Visual
Western (North) Pacific
World MeteorologicalOrganization
warning(s)
Weather Squadron
Cross-track
Extrapolation
Zulu time(Greenwich MeanTime/UniversalCoordinated Time)
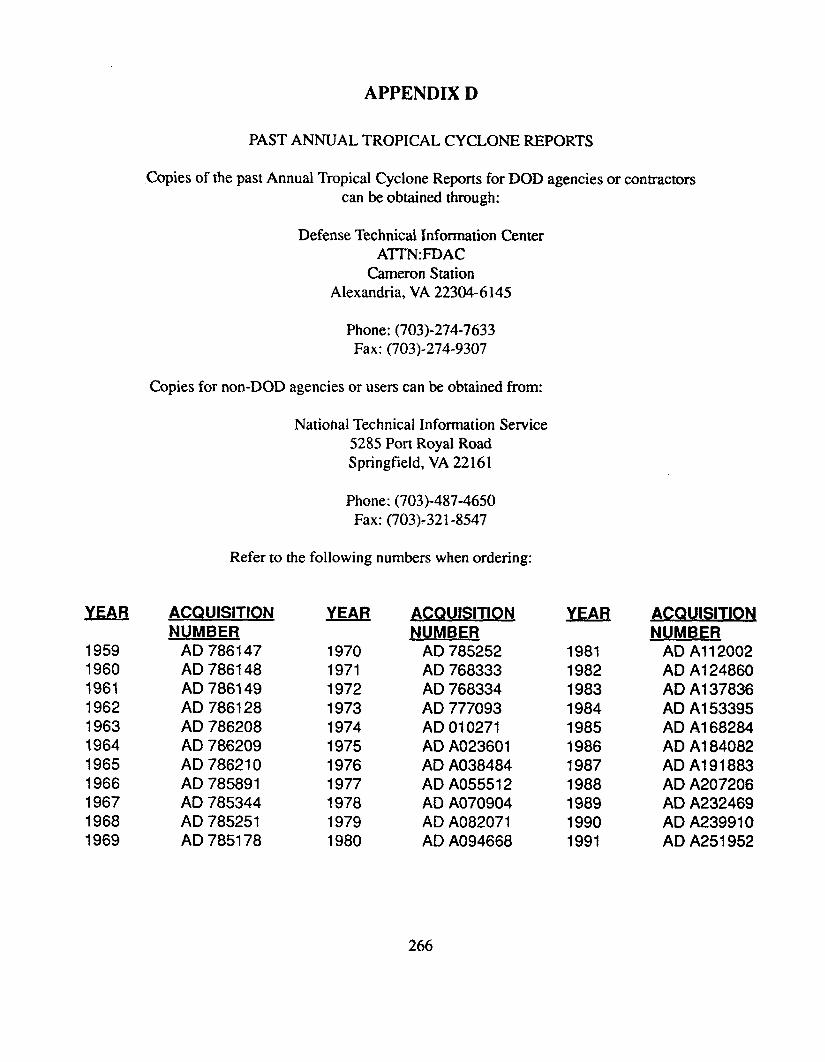
YEAR
19591960196119621963196419651966196719681969
A1’1’liNIJIX l.)
PAST ANNUAL TROPICAL CYCLONE REPORTS
Copies of the past Annual Tropical Cyclone Reports for DOD agencies or contractorscan be obtained through:
Defense Technical Information CenterATTN:FDAC
Cameron StationAlexandria, VA 22304-6145
Phone: (703)-274-7633Fax: (703)-274-9307
Copies for non-DOD agencies or users can be obtained from:
National Technical Information Service5285 Port Royal RoadSpringfield, VA 22161
Phone: (703)-487-4650Fax: (703)-321-8547
Refer to the following numbers when ordering:
ACQUISITION YEAR ACQUISITION
lw!!M!3AD 786147AD 786148AD 786149AD 786128AD 786208AD 786209AD 786210AD 785891AD 785344AD 785251AD 785178
970971972973974975976977978979980
!wA!!BmAD 785252AD 768333AD 768334AD 777093AD 010271AD A023601AD A038484ADA055512AD A070904AD A082071AD A094668
19811982198319841985986987988989990991
CQU S T ON
hMMAD Al 12002AD Al 24860AD Al 37836AD Al 53395AD Al 68284AD Al 84082AD A191883AD A207206AD A232469AD A23991OAD A251 952
266
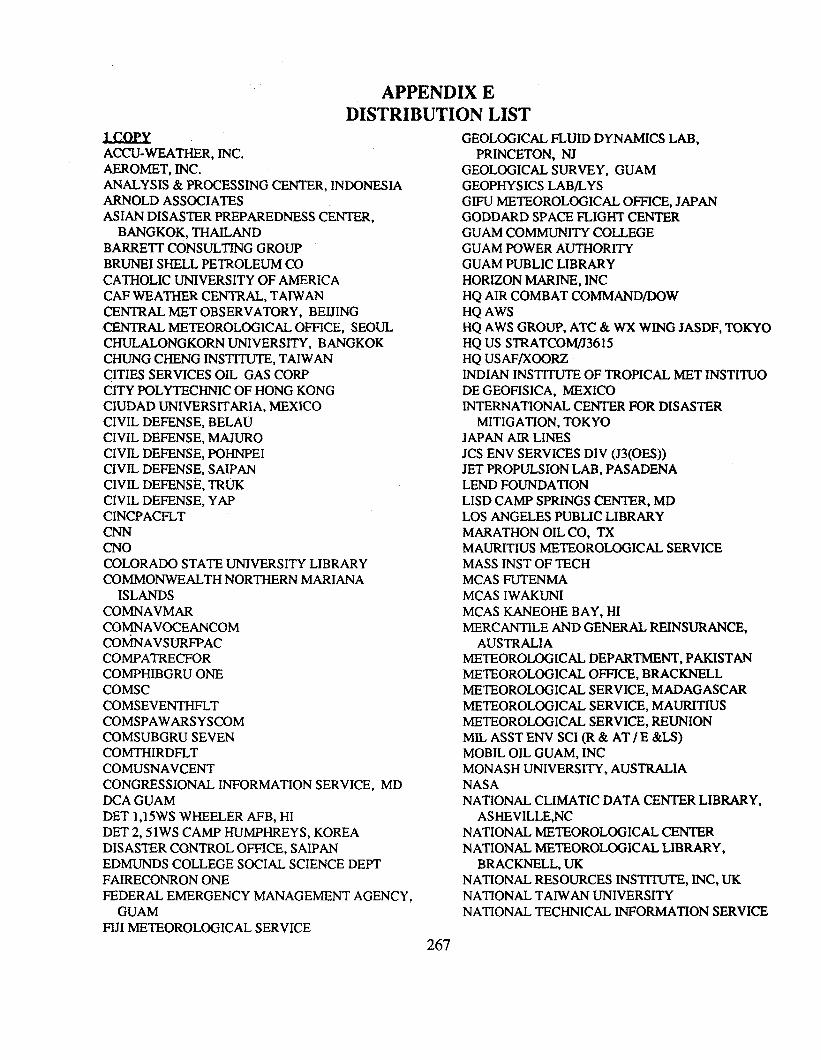
APPENDIX EDISTRIBUTION LIST
1 CopxACCU-WEATHER, INC.AEROMET, INC.ANALYSIS & PROCESSING CENTER, INDONESIAARNOLD ASSOCIATESASIAN DISASTER PREPAREDNESS CENTER,
BANGKOK, THAILANDBARRE7T CONSULTING GROUPBRUNEI SHELL PETROLEUM COCATHOLIC UNIVERSITY OF AMERICACAF WEATHER CENTRAL, TAIWANCENTRAL MET OBSERVATORY, BEIJINGCENTRAL METEOROLOGICAL OFFICE, SEOULCHULALONGKORN UNIVERSITY, BANGKOKCHUNG CHENG INSTITUTE, TAIWANCITIES SERVICES OIL GAS CORPCITY POLYTECHNIC OF HONG KONGCKJDAD UNIVERSITARIA, MEXICOCIVIL DEFENSE, BELAUCIVIL DEFENSE, MAJUROCIVIL DEFENSE, POHNPEICIVIL DEFENSE, SAIPANCIVIL DEFENSE, TRUKCIVIL DEFENSE, YAPCINCPACFLTCNNCNoCOLORADO STATE UNIVERSITY LIBRARYCOMMONWEALTH NORTHERN MARIANA
ISLANDSCOMNAVMARCOMNAVOCEANCOMCOI@JAVSURFPACCOMPATRECFORCOMPHIBGRU ONECOMSCCOMSEVENTHFLTCOMSPAWARSYSCOMCOMSUBGRU SEVENCOMTHIRDFLTCOMUSNAVCENTCONGRESSIONAL INFORMATION SERVICE, MDDCA GUAMDET 1,15WS WHEELER AFB, HIDET 2, 51WS CAMP HUMPHREYS, KOREADISASTER CONTROL OFFICE, SAIPANEDMUNDS COLLEGE SOCIAL SCIENCE DEPTFAIRECONRON ONEFEDERAL EMERGENCY MANAGEMENT AGENCY,
GUAMFIJI METEOROLOGICAL SERVICE
267
GEOLOGICAL FLUID DYNAMICS LAB,PRINCETON, NJ
GEOLOGICAL SURVEY, GUAMGEOPHYSICS LAB/LYSGIF’UMETEOROLOGICAL OFFJCE, JAPANGODDARD SPACE FLIGHT CENTERGUAM COMMUNITY COLLEGEGUAM POWER AUTHORITYGUAM PUBLIC LIBRARYHORIZON MARINE, INCHQ AIR COMBAT COMMAND/DOWHQ AWSHQ AWS GROUP, ATC & WX WING JASDF, TOKYOHQ US STRATCOMLT3615HQ USAF/XOORZINDIAN INSTITUTE OF TROPICAL MET INSTITUODE GEOFISICA, MEXICOlNTERNATIONAL CENTER FOR DISASTER
MITIGATION, TOKYOJAPAN AIR LINESJCS ENV SERVICES DIV (J3(OES))JET PROPULSION LAB, PASADENALEND FOUNDATIONLISD CAMP SPRINGS CENTER, MDLOS ANGELES PUBLIC LIBRARYMARATHON OIL CO, TXMAURITIUS METEOROLOGICAL SERVICEMASS INST OF TECHMCAS FUTENMAMCAS IWAKUNIMCAS KANEOHE BAY, HIMERCANTILE AND GENERAL REINSURANCE,
AUSTRALIAMETEOROLOGICAL DEPARTMENT, PAKISTANMETEOROLOGICAL OFFICE, BRACKNELLMETEOROLOGICAL SERVICE, MADAGASCARMETEOROLOGICAL SERVICE, MAURITIUSMETEOROLOGICAL SERVICE, REUNIONMIL ASST ENV SCI (R & AT / E &LS)MOBIL OIL GUAM, INCMONASH UNIVERSITY, AUSTRALIANASANATIONAL CLIMATIC DATA CENTER LIBRARY,
ASHEVILLE,NCNATIONAL METEOROLOGICAL CENTERNATIONAL METEOROLOGICAL LIBRARY,
BRACKNELL, UKNATIONAL RESOURCES INSTITUTE, LNC,UKNATIONAL TAIWAN UNIVERSITYNATIONAL TECHNICAL INFORMATION SERVICE
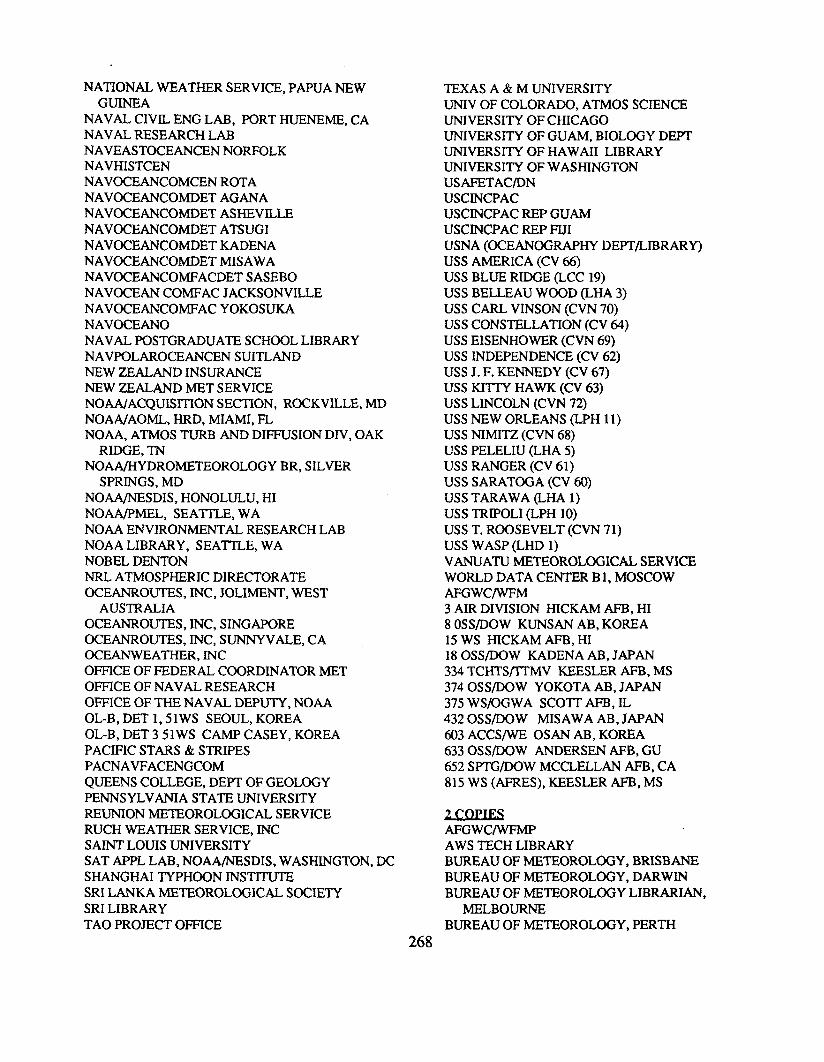
NATIONAL WEATHER SERVICE, PAPUA NEWGUINEA
NAVAL CIVIL ENG LAB, PORT HUENEME, CANAVAL RESEARCH LABNAVEASTOCEANCEN NORFOLKNAVHISTCENNAVOCEANCOMCEN ROTANAVOCEANCOMDET AGANANAVOCEANCOMDET ASHEVJLLENAVOCEANCOMDET ATSUGINAVOCEANCOMDET KADENANAVOCEANCOMDET MISAWANAVOCEANCOMFACDET SASEBONAVOCEAN COMFAC JACKSONVILLENAVOCEANCOMFAC YOKOSUKANAVOCEANONAVAL POSTGRADUATE SCHOOL LIBRARYNAVPOLAROCEANCEN SUITLANDNEW ZEALAND INSURANCENEW ZEALAND MET SERVICENOAA/ACQUISITION SECTION, ROCKVILLE, MDNOAA/AOML, HRD, MIAMI, FLNOAA, ATMOS TURB AND DIFFUSION DIV, OAK
RIDGE, TNNOAA/HYDROMETEOROLOGY BR, SILVER
SPRINGS, MDNOAA/NESDIS, HONOLULU, HINOAA/PMEL, SEA1’TLE, WANOAA ENVIRONMENTAL RESEARCH LABNOAA LIBRARY, SEATTLE, WANOBEL DENTONNRL ATMOSPHERIC DIRECTORATEOCEANROUTES, INC, JOLIMENT, WEST
AUSTRALIAOCEANROUTES, INC, SINGAPOREOCEANROUTES, INC, SUNNYVALE, CAOCEANWEATHER, INCOFFICE OF FEDERAL COORDINATOR METOFFICE OF NAVAL RESEARCHOFFICE OF THE NAVAL DEPUTY, NOAAOL-B, DET 1, 51WS SEOUL, KOREAOL-B,DET351 WS CAMP CASEY, KOREAPACIFIC STARS & STRIPESPACNAVFACENGCOMQUEENS COLLEGE, DEPT OF GEOLOGYPENNSYLVANIA STATE UNIVERSITYREUNION METEOROLOGICAL SERVICERUCH WEATHER SERVICE, INCSAINT LOUIS UNIVERSITYSAT APPL LAB, NOAA/NESDIS, WASHINGTON, DCSHANGHAI TYPHOON INSTITUTESRI LANKA METEOROLOGICAL SOCIETYSRI LIBRARYTAO PROJECT OFFICE
TEXAS A & M UNIVERSITYUNIV OF COLORADO, ATMOS SCIENCEUNIVERSITY OF CHICAGOUNIVERSITY OF GUAM, BIOLOGY DEIWUNIVERSITY OF HAWAII LIBRARYUNIVERSITY OF WASHINGTONUSAFETAC/DNUSCINCPACUSCINCPAC REP GUAMUSCINCPAC REP FIJIUSNA (OCEANOGRAPHY DEPT/LIBRARY)USS AMERICA (CV 66)USS BLUE RIDGE (LCC 19)USS BELLEAU WOOD (LHA 3)USS CARL VINSON (CVN 70)USS CONSTELLATION (CV 64)USS EISENHOWER (CVN 69)USS INDEPENDENCE (CV 62)USS J. F. KENNEDY (CV 67)USS KITTY HAWK (CV 63)USS LINCOLN (CVN 72)USS NEW ORLEANS (LPHUSS NIMITZ (CVN 68)USS PELELIU (LHA 5)USS RANGER (CV 61)USS SARATOGA (CV 60)USS TARAWA (LHA 1)USS TRIPOLI (LPH 10)
11)
USS T. ROOSEVELT (CVN 71)USS WASP (LHD 1)VANUATU METEOROLOGICAL SERVICEWORLD DATA CENTER Bl, MOSCOWAFGWC/WFM3 AIR DIVISION HICKAM AFB, HI8 OSS/DOW KUNSAN AB, KOREA15 WS HICKAM AFB, HI18 OSS/DOW KADENA AB, JAPAN334 TCH’IWTTMV KEESLER AFB, MS374 OSS/DOW YOKOTA AB, JAPAN375 WS/OGWA SCOTT AFB, IL432 OSSPOW MISAWA AB, JAPAN603 ACCS/WE OSAN AB, KOREA633 OSS/DOW ANDERSEN AFB, Gu652 SPTG/DOW MCCLELLAN AFB, CA815 WS (AFRES), KEESLER AFB, MS
AFGWC/WFMPAWS TECH LIBRARYBUREAU OF METEOROLOGY, BRISBANEBUREAU OF METEOROLOGY, DARWINBUREAU OF METEOROLOGY LIBRARIAN,
MELBOURNEBUREAU OF METEOROLOGY, PERTH
268
BUREAU OF PLANNING, GUAMCIVIL DEFENSE, GUAMDEFENSE TECHNICAL INFORMATION CENTERDEPARTMENT OF COMMERCEECMWF, BERKSHIRE, UKESCAP LIBRARY, BANGKOKFLENUMOCEANCEN MONTEREYFLORIDA STATE UNIVERSITYINSTITUTE OF PHYSICS, TAIWANMARINERS WEATHER LOGMET RESEARCH INST LIBRARY, TOKYOMICRONESIA RESEARCH CENTER UOG, GUAMNATIONAL CLIMATIC DATA CENTERNATIONAL DATA BUOY CENTERNATIONAL HURRICANE CENTER, MIAMINATIONAL WEATHER SERVICE, HONOLULUNAVOCEANCOMDET DIEGO GARCIANAVOCEANCOMDET MISAWANAVWESTOCEANCEN PEARL HARBORNOAA GUAMNORA 1570 DALLAS, TXOKINAWA METEOROLOGY OBSERVATORYSAT APPL LAB, NOAA/NESDIS, CAMP SPRINGS,
MDTYPHOON COMMITTEE SECRETARIAT, MANILAUNIVERSITY OF PHILIPPINESUS ARMY, FORT SHAFTERWORLD DATA CENTER A, NOAA73 WEATHER GROUP, ROK AF
3 ~~HESBUREAUOF METEOROLOGY, DIRECTOR,
MELBOURNE, AUSTRALIACENTRAL WEATHER BUREAU, TAIWANINDIA METEOROLOGICAL DEPTINOSHAC, DDGM (W%’)JAPAN METEOROLOGICAL AGENCYKOREAN METEOROLOGY ADMINISTRATIONNAVPGSCOL DEPT OF METEOROLOGYNOAA CORAL GABLES LIBRARYPACAF/DOWUNIVERSITY OF HAWAII, METEOROLOGY DEFTWEATHER CENTRAL, CAF
9 ~~nlzsCOLORADO STATE UNIVERSITYMETEOROLOGY DEPT. BANGKOK
5 c~pmPAGASAWEATHERBUREAU,RPR & D UNIT,NHC, MIAMIROYAL OBSERVATORY HONG KONG
6 c~msNRL WESTNATIONAL WEATHER ASSOCIATION
269
--
mCIXSIFIED
,ECURITV CLASSIFICATION OF THIS PAGE
REPORT DOCUMENTATION PAGE
10, REPORT SECURITY CLASSIFICATION
UNCLASSIFIED2s. SE CURITy CLASSIFICATION AUTHORITY
!m, OECLA-S.SI FICATION/DOWNG RADING SCHEDULE
4. PERFORMING ORGANIZATION REPORT NUMEER(S)
6* NAME OF PERFORMING ORGANIZATION 6b. OFFICE SYMBOL
NAVOGEANCOMCEN/JTIJCII fupplicable)
Se. AOORESS (City. State and ZIP Code}
C@lNAVMAR,PSC 489, BOX 12FPOAP 96536-0051
M.NAME OF FUN OING/SPONSORING Eb. OFFICE SYMBOLORGANIZATION (If appiicablet
NAvocEANcoMcEN/JTwc
k. AOOPiESS (City. Stale and ZIP Code)
COMNAVMAR,PSC 489, 130X12FPO AP 96536-0051
11. 71 TLE (fnchde Secwity Clauificdion)
1992 ANNUALTROPICALCYCLONEREPORT
2. PERSONAL AUTHOR(S)
lb. RESTRICTIVE MARKINGS
3. DISTRIBUTION/AVAILABILITY OF REPORT
AS IT APPEARS IN lTllZ REPORT/
DISTRIBUTION UNLIMITED
5. MONITORING ORGANIZATION REPORT NUMBER [St
7a NAME OF MONITORING ORGANIZATION
NAVOCFANCOM~/~C
Tb.ADORESS (City, State and ZIP Code)
COMNAVMAR,PSC 489, EOX 12l?FO AP 96536-0051
9. PROCUREMENT INSTRUMENT IDENTIFICATION NUMSER
10. SOURCE OF FUNOING NOS.
~! 1 1
13a TYPE OF REPORT I 13b. TIME COVEREO I 14. OATE OF REPORT (Yr.. Mo.. DoY) I 15. PAGE COUNT
ANNUAL I •oM~To~l‘6. SUPPLEMENTARY NOTATION
7. COSATI COOES 18. SU6JECT TERMS (Continue on reueme if necewary and i&ntify by block number)
FIELO GROUP SUEt. GR. TROPICALCYCLO-- —-——— .——
TROPICALDEPRE_____ -.-..---.-,---—..TROPICALCYCLONERESEARCH vnDnl I_WTf’AT C
J1’4ES ‘lROPICAL STORMS1SS1ONS TYPH(YINS/SilP~ ~HooNS
. u LLlwL\wLw L— SATELLITES9.ASSTRACT /Continue on muerae if neceuaw and i&nttfy by block numberJ
ANNUALPUBLICATION SUMMARIZINGTROPICALCYCLONEACTIVITYIN THE WESTERNNORTH PACIFIC,BAY OF BENGAL, ARABIAN SFA, WESTERN SOUTH PACIFIC AND SOUTH INDIAN OCEANS. A BESTTRACK IS PROVIDED FOR EAGH SIGNIFICANT TROPICAL CYCLONE. A BRIEF NARRATIVEIS GIVENFOR ALL TROPICILCYCKINESIN THE WESTERNNORTHPACIFICAND NORTH INDIAN OCEANS. ALLFIX DATA USEDTO CONSTRUCTTHEFORECASTVERIFICATIONDATAANDARE SUBMITTED.
BESTTRACKSARE PROVIDED,UPONREQUEST,ON DISKEITES.STATISTICSFOR THE JOINTTYPHOONWARNINGCENTER(JTWC)
). OISTRI BUTION/AVAl LA61L!TY OF ABSTRACT 21. A&STRACT SECURITY CLASSIFICATION
NCLASSIFIEO/UNLIMITED ?! %SAME AS RPT. DTIC USERS aUNCLASSIFIED
2a. NAME OF RESPONSIBLE IN OIVIOUAL
FRANK H.WELLS22b. TELEPHONE NUMBER 22c. OFFICE SYM80L
(my%m-wlio NOCC/JTWCI I
D FORM 1473,83 APR EDITION OF 1 JAN 73 IS OBSOLETE. UNCLASSIFIEDSECURITY CLASSIFICATION OF THIS PAGE
-.