Luminescence properties of green emission of SiO2/Zn2SiO4:Mn nanocomposite prepared by sol–gel...
7
Luminescence properties of green emission of SiO 2 /Zn 2 SiO 4 :Mn nanocomposite prepared by sol–gel method K. Omri a , J. El Ghoul a,n , A. Alyamani b , C. Barthou c , L. El Mir a,d a Laboratoire de Physique des Matériaux et des Nanomatériaux Appliquée à l'Environnement, Faculté des Sciences de Gabès, Cité Erriadh Manara Zrig 6072, Gabès, Tunisia b National Nanotechnology Centre, KACST, Riyadh, Saudi Arabia c Institut des NanoSciences de Paris (INSP), UPMC Université Paris 6, CNRS UMR 7588, 140 rue de Lourmel, F-75015 Paris, France d Al Imam Mohammad Ibn Saud Islamic University (IMSIU), College of Sciences, Departement of Physics, Riyadh 11623, Saudi Arabia HIGHLIGHTS Elaboration of Mn doped Zn 2 SiO 4 nanoparticles. Structural and optical characterizations of Zn 2 SiO 4 :Mn nanoparticles. The powder shows an average particle size of 25 nm. A strong luminescence band in the visible region. article info Article history: Received 16 December 2012 Received in revised form 19 April 2013 Accepted 26 April 2013 Available online 4 May 2013 Keywords: Zn 2 SiO 4 Zinc oxide Nanoparticle Sol–gel Optical material abstract Green light emitting Mn 2+ doped Zn 2 SiO 4 particles embedded in SiO 2 host matrix were synthesized by a sol–gel method. After the incorporation of ZnO:Mn nanoparticles in a silica monolith using sol–gel method with supercritical drying of ethyl alcohol in two steps, it was heat treated in air at 1200 1C for 2 h in order to obtain the SiO 2 /α-Zn 2 SiO 4 :Mn nanocomposites. The microstructure of phosphor crystals was characterized by transmission electron microscopy (TEM) and X-ray diffraction (XRD). XRD results indicate that the pure phase α-Zn 2 SiO 4 with rhombohedral structure was obtained after thermal treatment at 1200 1C. The SiO 2 /α-Zn 2 SiO 4 :Mn nanocomposites with a Mn doping concentration of 1.5 at% exhibit two broadband emissions in the visible range: a strong green emission at around 525 nm and a second one in the range between 560 and 608 nm. This nanocomposite with a Mn doping concentration of 0.05 shows the highest relative emission intensity. Upon 255 nm excitation, the luminescence decay time of the green emission of Zn 2 SiO 4 :Mn around 525 nm is 11 ms. The luminescence spectra at 525 nm ( 4 T 1 – 6 A 1 ) and lifetime of the excited state of Mn 2+ ions-doped Zn 2 SiO 4 nanocrystals are investigated. & 2013 Elsevier B.V. All rights reserved. 1. Introduction Luminescence properties of inorganic phosphors have been extensively investigated. Zn 2 SiO 4 :Mn 2+ is an efficient green phos- phor widely used in plasma display panels (PDPs), cathode ray tubes (CRTs), tri-color lamps, color televisions and thin film electroluminescent devices because of its high luminescence efficiency, purity of color, chemical stability [1] and large color gamut [2]. It is well known that the luminescence properties of phosphor depend on its synthesis process. It has also been tested recently in thin film electroluminescent (EL) devices [3] and medical imaging radiation detectors [4]. It was shown that depending on the synthesis conditions, Zn 2 SiO 4 :Mn 2+ could exhi- bit green or yellow luminescence. This was found to be due to the formation of α or β phase of Zn 2 SiO 4 [5]. It was also observed that Mn ions introduced into the porous material are effectively located inside Zn 2 SiO 4 crystalline particles rather than in porous SiO 2 skeleton or on the walls. In addition, the conventional solid-state reaction method requires a milling process, high reaction tem- perature, long heating time, and calcining in a reducing atmo- sphere. In order to overcome these disadvantages, many methods have been developed to synthesize high efficiency Zn 2 SiO 4 :Mn 2+ particles and produce a material having desirable luminescence effects. Some processes have been developed to synthesize Zn 2 SiO 4 :Mn 2+ particles in a non-reducing atmosphere [6,7]. Liquid solution processes are also developed; these required preparation Contents lists available at SciVerse ScienceDirect journal homepage: www.elsevier.com/locate/physe Physica E 1386-9477/$ - see front matter & 2013 Elsevier B.V. All rights reserved. http://dx.doi.org/10.1016/j.physe.2013.04.020 n Corresponding author. Tel.: +216 97863599. E-mail addresses: [email protected], [email protected] (J. El Ghoul). Physica E 53 (2013) 48–54
Transcript of Luminescence properties of green emission of SiO2/Zn2SiO4:Mn nanocomposite prepared by sol–gel...
Physica E 53 (2013) 48–54
Contents lists available at SciVerse ScienceDirect
Physica E
1386-94http://d
n CorrE-m
journal homepage: www.elsevier.com/locate/physe
Luminescence properties of green emission of SiO2/Zn2SiO4:Mnnanocomposite prepared by sol–gel method
K. Omri a, J. El Ghoul a,n, A. Alyamani b, C. Barthou c, L. El Mir a,d
a Laboratoire de Physique des Matériaux et des Nanomatériaux Appliquée à l'Environnement, Faculté des Sciences de Gabès, Cité Erriadh Manara Zrig 6072,Gabès, Tunisiab National Nanotechnology Centre, KACST, Riyadh, Saudi Arabiac Institut des NanoSciences de Paris (INSP), UPMC Université Paris 6, CNRS UMR 7588, 140 rue de Lourmel, F-75015 Paris, Franced Al Imam Mohammad Ibn Saud Islamic University (IMSIU), College of Sciences, Departement of Physics, Riyadh 11623, Saudi Arabia
H I G H L I G H T S
� Elaboration of Mn doped Zn2SiO4 nanoparticles.
� Structural and optical characterizations of Zn2SiO4:Mn nanoparticles.� The powder shows an average particle size of 25 nm.� A strong luminescence band in the visible region.a r t i c l e i n f o
Article history:Received 16 December 2012Received in revised form19 April 2013Accepted 26 April 2013Available online 4 May 2013
Keywords:Zn2SiO4
Zinc oxideNanoparticleSol–gelOptical material
77/$ - see front matter & 2013 Elsevier B.V. Ax.doi.org/10.1016/j.physe.2013.04.020
esponding author. Tel.: +216 97863599.ail addresses: [email protected], ghoult
a b s t r a c t
Green light emitting Mn2+ doped Zn2SiO4 particles embedded in SiO2 host matrix were synthesized by asol–gel method. After the incorporation of ZnO:Mn nanoparticles in a silica monolith using sol–gelmethod with supercritical drying of ethyl alcohol in two steps, it was heat treated in air at 1200 1C for 2 hin order to obtain the SiO2/α-Zn2SiO4:Mn nanocomposites. The microstructure of phosphor crystals wascharacterized by transmission electron microscopy (TEM) and X-ray diffraction (XRD). XRD resultsindicate that the pure phase α-Zn2SiO4 with rhombohedral structure was obtained after thermaltreatment at 1200 1C. The SiO2/α-Zn2SiO4:Mn nanocomposites with a Mn doping concentration of1.5 at% exhibit two broadband emissions in the visible range: a strong green emission at around 525 nmand a second one in the range between 560 and 608 nm. This nanocomposite with a Mn dopingconcentration of 0.05 shows the highest relative emission intensity. Upon 255 nm excitation, theluminescence decay time of the green emission of Zn2SiO4:Mn around 525 nm is 11 ms. Theluminescence spectra at 525 nm (4T1–
6A1) and lifetime of the excited state of Mn2+ ions-doped Zn2SiO4
nanocrystals are investigated.& 2013 Elsevier B.V. All rights reserved.
1. Introduction
Luminescence properties of inorganic phosphors have beenextensively investigated. Zn2SiO4:Mn2+ is an efficient green phos-phor widely used in plasma display panels (PDPs), cathode raytubes (CRTs), tri-color lamps, color televisions and thin filmelectroluminescent devices because of its high luminescenceefficiency, purity of color, chemical stability [1] and large colorgamut [2]. It is well known that the luminescence properties ofphosphor depend on its synthesis process. It has also been testedrecently in thin film electroluminescent (EL) devices [3] and
ll rights reserved.
[email protected] (J. El Ghoul).
medical imaging radiation detectors [4]. It was shown thatdepending on the synthesis conditions, Zn2SiO4:Mn2+ could exhi-bit green or yellow luminescence. This was found to be due to theformation of α or β phase of Zn2SiO4 [5]. It was also observed thatMn ions introduced into the porous material are effectively locatedinside Zn2SiO4 crystalline particles rather than in porous SiO2
skeleton or on the walls. In addition, the conventional solid-statereaction method requires a milling process, high reaction tem-perature, long heating time, and calcining in a reducing atmo-sphere. In order to overcome these disadvantages, many methodshave been developed to synthesize high efficiency Zn2SiO4:Mn2+
particles and produce a material having desirable luminescenceeffects. Some processes have been developed to synthesizeZn2SiO4:Mn2+ particles in a non-reducing atmosphere [6,7]. Liquidsolution processes are also developed; these required preparation

K. Omri et al. / Physica E 53 (2013) 48–54 49
temperatures are lower than those required by solid-state reactionmethods [8]. Although these chemical methods can be applied toproduce fine particles with good phosphor luminescence, theyhave certain shortcomings, like being a complex process, poorcontrollability, difficulty in using for mass production, and highcost. Therefore, it is imperative to develop a simple synthesis routein order to potentially overcome most of these difficulties incommercialization [8]. The work of our team is mainly focusedon this context. It comes to finding new protocols for nanoparticlesynthesis by the sol–gel technique for various chemical andphysical applications [9,10]. Our objective in this work is the in-situ synthesis of luminescent nanoparticles of Zn2SiO4:Mn in asilica matrix in order to increase the lifetime of compound andprevent contamination caused by the external environment. Thesol–gel method has been confirmed to have advantages in low-ering the firing temperature, distributing the activator ions homo-geneously and improving the emission efficiency for the powderphosphors [11,12]. Additionally, the sol–gel technology is suitablefor deposition of thin amorphous and crystalline films, which havefound extensive applications in many fields [13].
Morimo and Matea [11] synthesized Zn2SiO4:Mn by a sol–gelmethod and compared the emission of their samples with thosemade by solid-state reactions. They found higher emission fortheir samples containing 2% Mn dopant. Li et al. [7] have preparedpure and Mn-doped willemite using various salts of zinc andfound that the nature of anion affects the morphology of theparticles. More recently, Raynaud et al. [14] developed an aqueoussol–gel process for silicate synthesis, which gave α-Zn2SiO4 parti-cles of 1–3 μm dimensions with well-defined morphology. There isa need for more control over the shape, size, surface propertiesand purity of phosphors, which are compromised in high tem-perature synthesis. The luminescence properties of phosphorsstrongly depend on the crystal structure and particle size [15].High temperature synthesis results in agglomeration of phosphorparticles [15].
Accordingly, based on our previous work on the sol–gel synth-esis of nanocomposites phosphors [9,10], we synthesized Mn-doped Zn2SiO4 particles in SiO2 host matrix via a sol–gel routewith calcining treatment at 1200 1C for 2 h. The emission spectra,crystalline properties and decay time were also investigated.
2. Experimental procedure
For this investigation we prepared samples of nanocrystallineZnO:Mn aerogels and SiO2/Zn2SiO4:Mn nanocomposites by a sol–gel technique. The source materials used were zinc acetate dehydrate(Zn(CH3COO)2 �2H2O), manganese(II) chloride-4-hydrate (MnCl2 �4H2O), tetraethyl orthosilicate (TEOS), distilled water, fluoride acid,methanol and ethanol (EtOH).
2.1. Preparation of SiO2/Zn2SiO4:Mn nanocomposites
The samples were prepared by a sol–gel method under super-critical conditions of ethyl alcohol (EtOH) based on El Mir et al.[16,17] protocol. Nanoparticles aerogel was obtained by super-critical drying in ethyl alcohol (EtOH). In the second step, weprepared ZnO:Mn confined in aerogel according to the followingprocess: 0.5 ml of TEOS was first dissolved in EtOH. Then, withconstant stirring of the mixture of TEOS and EtOH, 0.44 ml ofwater and 30 mg of ZnO:Mn powder prepared in the first stepwere added. The whole solution was stirred for about 30 min,resulting in the formation of a uniform sol.
The sols were transferred to tubes in an ultrasonic bath where100 μl of fluoride acid was added. The wet gel was formed in a fewseconds. Monolithic and transparent aerogel was obtained by
supercritical drying in EtOH as described in the first step. Finally,silica glasses containing ZnO:Mn and Zn2SiO4 particles wereobtained after firing the aerogel at high temperature. In thepresent case, the thermal treatment was carried out in an ovenunder natural atmosphere. The aerogel was put into a furnace andheated up to the densification temperature at a heating rate of50 1C/h. After this step, we performed a heat treatment in air at1200 1C for 2 h in order to obtain the SiO2/α-Zn2SiO4:Mn nano-composites. The densification temperature selected (1200 1C) wasstill lower than the fusion temperature of glasses and the forma-tion of macro-fissures did not occur. The density achieved atincreasing temperature shows two transitions: the first onesituated near 700 1C was attributed to the disappearance of themicropores and small mesopores in the aerogel whereas thesecond one located at 1200 1C was attributed to the final densifi-cation to glass with a density of about 2 [9,10,18].
2.2. Characterization
The crystalline phases of annealed powders were identified byX-ray diffraction (XRD) using a Bruker D5005 powder X-raydiffractometer using a CoKα source (1.78901 Å radiation). Crystal-lite sizes were estimated from Scherrer's equation [19].
Chemical bonding states and chemical compositions of the nano-particle were analyzed by X-ray photoelectron spectroscopy (XPS). Theposition of the C1s peak from contamination was taken as a standardreference with a binding energy of 284.6 eV. Transmission electronmicroscopy (TEM, JEM-200CX) was used to study the morphology andparticle size of the phosphor powders. The specimens for TEM wereprepared by putting the as-grown products in EtOH, immersing themin an ultrasonic bath for 15 min, and then dropping a few drops of theresulting suspension containing the synthesized materials onto TEMgrid. The optical absorbance of the powders was determined using aSchimadzu UV-3101 PC spectrophotometer with integrating sphere inthe wavelength range 200–2000 nm. For photoluminescence (PL)measurements, a 450WXenon lampwas used as an excitation source.The emitted light from the sample collected by an optical fiber on thesame side as that of excitation was analyzed with a Jobin-YvonSpectrometer HR460 and a multichannel CCD detector (2000 pixels).The photoluminescence excitation (PLE) measurements were per-formed on a Jobin-Yvon Fluorolog 3-2 spectrometer. The decays wereanalyzed by a PM Hamamatsu R928 and a scope Nicolet 400 with atime constant on the order of 1 ns. The low temperature experimentswere carried out in a Janis VPF-600 Dewar with variable temperaturecontrolled between 78 and 300 K.
3. Results and discussion
3.1. Structural studies
Fig. 1 shows the XRD patterns of undoped ZnO and 5 at% Mndoped ZnO nanoparticles; the two samples show similar diffractionpeak positions. All peaks in ZnO and ZnO:Mn samples could be fittedwith hexagonal wurtzite structure (space group P63mc (No. 186)(JCPDS No. 36-1451)). XRD pattern indicates the formation of ZnOphase [18]. The high intensity of (1 0 1) peak suggests that the growthof nanoparticles has taken place along the easy direction of crystal-lization of ZnO and the same has been reported by Lin et al. [20].The lattice constants calculated from the XRD pattern are a¼3.252 Åand c¼5.208 Å, which are very close to wurtzite ZnO ones. Theseresults are in good accordance with the findings of El Mir et al. [21].The agreement of those parameters with the accepted values is anindication of the quality of the present samples. The diffraction peaksof ZnO were found to shift to a smaller angle by Mn doping, indicatingan increase in the lattice constants [22]. It is known that the ionic

Fig. 1. X-ray diffraction patterns of the (a) undoped ZnO and (b) ZnO:Mn5%
nanopowder.
Fig. 2. X-ray diffraction pattern of the SiO2/α-Zn2SiO4:Mn nanocomposite.
K. Omri et al. / Physica E 53 (2013) 48–5450
radius of Zn2+ is smaller than that of Mn2+ and larger than that ofMn4+, so the XRD patterns indicate that the divalent Mn2+ ionssubstitute Zn2+ ions in ZnO crystal lattice and do not change thewurtzite structure [23,24]. Therefore, Mn is in 2+ valence state andhere Mn2+ substitutes Zn2+. Lattice constants of Mn doped ZnO wereslightly larger than those of undoped ZnO because the ionic radius ofMn (II) (0.66 Å) is larger than that of Zn (II) (0.60 Å) [25]. Similardependences have also been observed in ZnO:Mn systems [26]. Mn isan element with large ionic radius, which may involve poor crystal-linity [27].
After incorporation of these nanoparticles of ZnO:Mn in SiO2
and heat treatment at 1200 1C for 2 h in air, new phase α-Zn2SiO4:Mn was formed. Fig. 2 shows the XRD patterns of the sol–gelderived SiO2/α-Zn2SiO4:Mn nanocomposites. The difference in thepeak intensity shows that this sample has a higher degree ofcrystallinity. These results agree well with the standard patternJCPDS No. 79-2005 [28] of zinc orthosilicate (α-Zn2SiO4). Thelattice constants calculated from the XRD pattern area¼13.943 Å and c¼9.312 Å, which are very close to willemite α-Zn2SiO4 ones, i.e., a¼13.945 Å and c¼9.315 Å [29]. Here we wouldalso expect to see the signature peaks for any residual Mn notabsorbed in our particles, but such peaks are noticeably absent[2,7]. All the diffraction peaks of the as-synthesized samples can
be indexed to a pure rhombohedral structured Zn2SiO4 (α-phase)with cell constants and which are in good agreement with thevalues in the literatures [28–30]. Nevertheless, a lot of Zn2+ andMn2+ were absorbed into the silica particles by physical andchemical interactions. After the drying and annealing process at1200 1C, the Zn2+ and Mn2+ reacted with surface SiO2 to formZn2SiO4:Mn nanoparticles in SiO2 host matrix [28]. The averagegrain size of the crystallites ZnO:Mn, varying from 20 nm to 30 nm[18], has been estimated using Scherrer's formula. However, athigh temperature, Zn2+ and Si2+ species on the surface appear tobe mobile enough to move and diffuse inside the porous body andcontribute to the formation of Zn2SiO4:Mn phase. The sharpness ofthe diffraction peaks indicates the crystalline nature of Zn2SiO4:Mn particles of size about 65 nm [10,18].
The binding states of the compositional elements of ZnO:Mnnanoparticles were characterized by XPS studies. Fig. 3 shows thetypical core level peaks corresponding to Zn 2p, O 1s and Mn 2p ofthe ZnO:Mn nanoparticles. The XPS spectrum of Zn 2p peak (Fig. 3(a))exhibited the characteristic doublet corresponding to the peak at∼1021.14 eV for Zn 2p3/2 and at ∼1046.35 eV for Zn 2p1/2. The peakpositions of Zn 2p3/2 and Zn 2p1/2 are roughly equal to those of theundoped ZnO nanoparticles (i.e., Zn 2p3/2¼∼1022 eV and Zn2p1/2¼∼1045 eV) [31]. Due to the ion radii difference between Mn2+ (0.66 Å) and Zn2+ (0.60 Å), Mn with larger ionic radius replacing Znof the ZnO lattice could result in the increasing binding energy of Zn.This explains the slightly higher energy position of the peak centeredat 1021.14 eV than that of Zn in the bulk ZnO (1021.48 eV) [31]. InFig. 3(b), the O 1s peak is broad and asymmetric. The stronger peak at530.04 eV is attributed to O2− ions in ZnO and Mn−O bonds, whileanother at 532.21 eV is usually associated with the absorbed O2 [32].A broad peak centered around 641.47 eV is seen in Fig. 3(c), which isindicative of existence of Mn2+ ions [33,34]. In addition, it may benoted that the XPS peak for Mn 2p is very weak. This may be due tolow level of Mn doping and it also implies that the content of Mn ionsat the surface of the sample is low and Mn ions have been doped intothe interior of the nanoparticles. The binding energy of Mn 2p3/2 stateis located at 641.47 eV; no signals from metallic Mn (637.73 eV) andMn4+ ions (642.49 eV) are detected, indicating that the doped Mnions are mainly in divalent states [35].
Fig. 4 reports TEM observation of Mn doped ZnO nanopowder.It is shown that very small particles of ZnO:Mn are present in thispowder as prepared in the first step. The crystallites present a verysimilar shape with a narrow particle size distribution. The majorityof ZnO particles present in this powder have a size of about 25 nm,in a good agreement with the particle sizes deduced from XRDspectra [10,18]. Energy dispersive spectroscopy (EDX) analysisduring the TEM observation, shown in Fig. 4, confirms thepresence of manganese (Mn), in good agreement with XRD results.
We investigated the size and morphology of the SiO2/α-Zn2SiO4:Mn nanocomposites by TEM. Fig. 5 shows the TEMmicrographs of the samples Zn2SiO4:Mn, which indicate that thesize of well-crystallized Zn2SiO4 particles synthesized through thesol–gel process is about 60 nm. Taking into account the results ofcrystallite size measurements by XRD, it can be concluded that thecrystallite size is approximately equal to the particle size of ZnOpowder prepared in the present work [10].
EDX analysis, shown in Fig. 5, confirms the XRD results.However, no change in the isolated ZnO nanoparticles, either inshape or composition, was observed by TEM and EDX analysis.
3.2. Optical properties
UV–vis spectroscopic measurements at room temperature ofundoped ZnO and Mn doped ZnO in the range 200–1500 nm wereperformed. The absorption spectra of ZnO:Mn nanoparticles in the UVand visible range are presented in Fig. 6. The absorption curve

Fig. 4. Typical TEM photograph showing the general morphology of Mn doped zincoxide nanopowder and its EDX analysis.
Fig. 3. XPS spectra of (a) Zn 2p, (b) O 1s and (c) Mn 2p of the ZnO:Mn nanoparticles.
K. Omri et al. / Physica E 53 (2013) 48–54 51
exhibits an intensive absorption in the range 200–380 nm, with theabsorption edge between 300 and 370 nm, owing to the relativelylarge exciton binding energy [36,37]. Compared to the spectra of
undoped ZnO nanopowder, an additional broad absorption around420 nm was also observed after Mn incorporation [38,39]. Theexcitonic absorption for ZnO is at 373 nm as reported earlier [40].The blueshift in the excitation absorption clearly indicates thequantum confinement property of nanoparticles. In the quantumconfinement range the band gap of the particles increases, resultingin the shift of absorption edge to lower wavelength, as the particlesize decreases [41].
The optical band gap (Eg) for Mn-doped ZnO nanoparticles wasestimated from the theoretical relationship between Eg andabsorption coefficient (α) [21]. The point of extrapolation of thelinear part that meets the abscissa axis will give the value of theband gap energy (Eg) of the undoped ZnO and ZnO:Mn materials(inset of Fig. 6). The values obtained for the band gap energies ofpure ZnO is about 3.349 eV, whereas for ZnO:Mn it is around3.187 eV, corresponding to the violet–blue region of the electro-magnetic spectrum [21,36–39]. The band gap energies of the ZnOmaterials show a decrease after Mn incorporation. This is due tothe introduction of Mn defects in the bands, resulting in theabsorption of incident photons [36–39]. As a consequence, thelattice spacing of the ZnO nanoparticles is decreased. It is proposedhere that due to the strong internal forces, the band gap is affected

Zn2SiO4:Mn
20 nm
Fig. 5. TEM photograph showing the general morphology of the SiO2/α-Zn2SiO4:Mn nanocomposite.
Fig. 6. Absorption spectra of undoped and Mn-doped ZnO.
Fig. 7. Absorption spectra of (a) pure SiO2/Zn2SiO4 and (b) SiO2/α-Zn2SiO4:Mn. Theinset shows the absorption of Mn2+.
K. Omri et al. / Physica E 53 (2013) 48–5452
and the electrons taking part in the transition from the valenceband to the conduction band need greater energy to execute thejump. Thus, it accounts for the observed wider band gap of theZnO:Mn nanoparticles [38,42]. The value of optical band gap ofZnO:Mn nanopowder was found to decrease after Mn incorpora-tion and is in agreement with the results reported on Mn dopedZnO nanoparticles prepared by other techniques [38,41,42].
Fig. 7 shows the absorption spectrum of α-Zn2SiO4:Mn nano-particles in the silica matrix at room temperature. For the purposeof comparison, Zn2SiO4 nanoparticles without Mn doping are alsopresented in this figure as well. A strong absorption band with amaximum at 215 nm is observed in both α-Zn2SiO4:Mn andZn2SiO4 nanoparticles, indicating that this band originates fromthe absorption of Zn2SiO4 lattice. In fact, the typical value ofabsorption of Zn2SiO4 is at 220 nm (∼5.63 eV), which was theabsorption edge of Zn2SiO4 [43]. Furthermore, by a comparison ofthe absorption curve of Zn2SiO4 nanoparticles with that ofZn2SiO4:Mn nanoparticles, it can be clearly seen that there ismore absorption in the latter in the range 220–280 nm. Obviously,this is attributed to the absorption of Mn2+ charge transfertransition in Zn2SiO4 lattice. Due to the low concentration ofMn2+, the Mn2+ absorption is not strong [43]. The value obtainedfor the band gap energy of pure Zn2SiO4 is about 5.493 eV,whereas for α-Zn2SiO4:Mn it is around 5.347 eV (Fig. 7, inset) [44].
3.3. Photoluminescence property
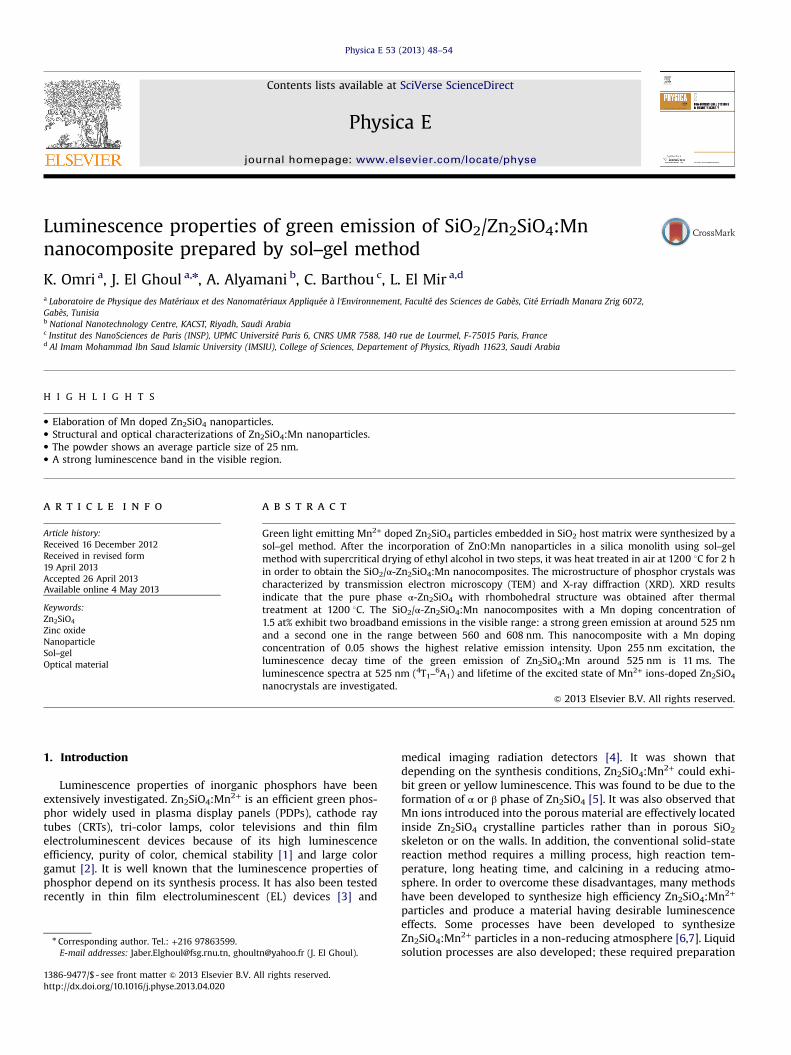
Fig. 8 shows the PL spectra excited at 255 nm of the SiO2/α-Zn2SiO4:Mn nanocomposites at different measurement tempera-tures. The spectrum shows two broadband emissions, the first onecentered at 525 nm and the second in the range 560–608 nm[45,46]. It is known that this green colored emission can beobtained by the spin flip transition of d-orbital electron, which isassociated with Mn2+ ion in tetrahedral site (4G–6S) [47]. A newluminescence band (560–608 nm) at 598 nm can be observed(Fig. 8, inset). This new peak can be attributed to the β phase ofZn2SiO4 [45]. In willemite the Mn2+ ions are situated at the slightlydistorted tetrahedral sites with four oxygen neighbors [29,47]. Inthis case, the green room temperature luminescence corresponds tothe vibronic band of the spin-forbidden 4T1–6A1 transition, with amaximum at 525 nm. The spectrum here agrees with the spectrumof typical green-emitting α-Zn2SiO4:Mn2+ that is based on the spin-forbidden transition from the lowest excited state 4T1(4G) to theground state 6A1(6S) of 3d5 electrons in Mn2+ ion [47,48].
When excited by electron beam, α-Zn2SiO4:Mn2+ producesgreen emission mainly through the following path: excitation intothe host lattice leads to the formation of electron–hole pairs,
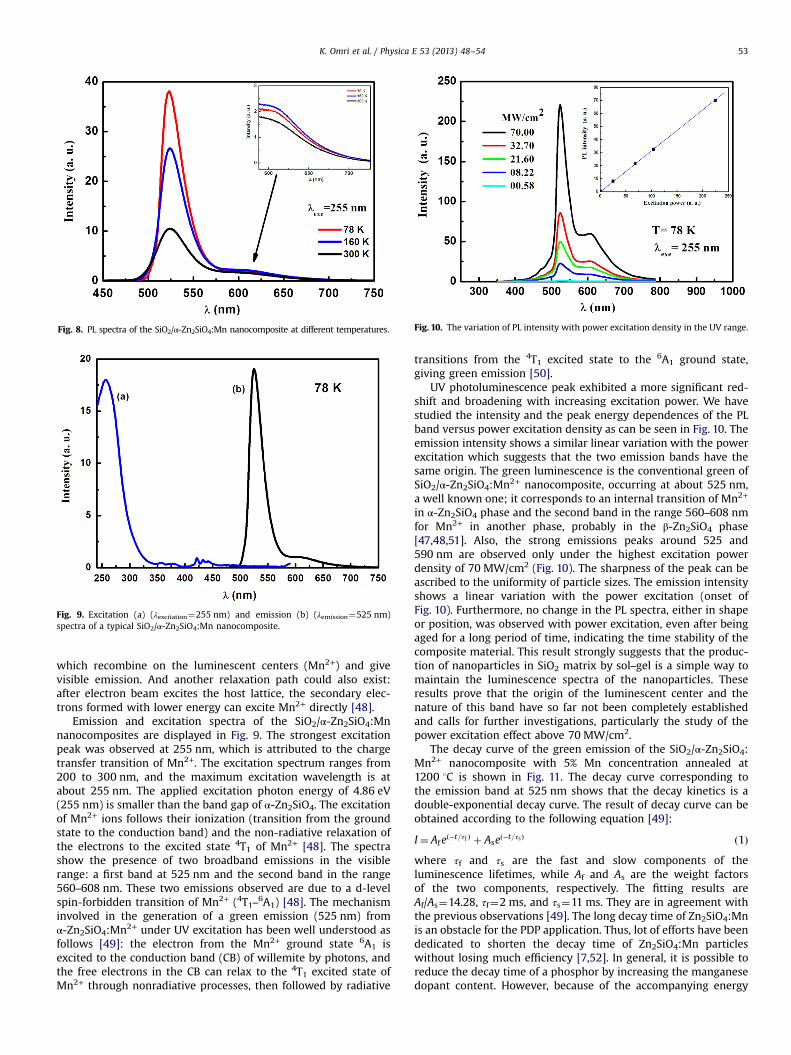
Fig. 8. PL spectra of the SiO2/α-Zn2SiO4:Mn nanocomposite at different temperatures.
Fig. 9. Excitation (a) (λexcitation¼255 nm) and emission (b) (λemission¼525 nm)spectra of a typical SiO2/α-Zn2SiO4:Mn nanocomposite.
Fig. 10. The variation of PL intensity with power excitation density in the UV range.
K. Omri et al. / Physica E 53 (2013) 48–54 53
which recombine on the luminescent centers (Mn2+) and givevisible emission. And another relaxation path could also exist:after electron beam excites the host lattice, the secondary elec-trons formed with lower energy can excite Mn2+ directly [48].
Emission and excitation spectra of the SiO2/α-Zn2SiO4:Mnnanocomposites are displayed in Fig. 9. The strongest excitationpeak was observed at 255 nm, which is attributed to the chargetransfer transition of Mn2+. The excitation spectrum ranges from200 to 300 nm, and the maximum excitation wavelength is atabout 255 nm. The applied excitation photon energy of 4.86 eV(255 nm) is smaller than the band gap of α-Zn2SiO4. The excitationof Mn2+ ions follows their ionization (transition from the groundstate to the conduction band) and the non-radiative relaxation ofthe electrons to the excited state 4T1 of Mn2+ [48]. The spectrashow the presence of two broadband emissions in the visiblerange: a first band at 525 nm and the second band in the range560–608 nm. These two emissions observed are due to a d-levelspin-forbidden transition of Mn2+ (4T1–6A1) [48]. The mechanisminvolved in the generation of a green emission (525 nm) fromα-Zn2SiO4:Mn2+ under UV excitation has been well understood asfollows [49]: the electron from the Mn2+ ground state 6A1 isexcited to the conduction band (CB) of willemite by photons, andthe free electrons in the CB can relax to the 4T1 excited state ofMn2+ through nonradiative processes, then followed by radiative
transitions from the 4T1 excited state to the 6A1 ground state,giving green emission [50].
UV photoluminescence peak exhibited a more significant red-shift and broadening with increasing excitation power. We havestudied the intensity and the peak energy dependences of the PLband versus power excitation density as can be seen in Fig. 10. Theemission intensity shows a similar linear variation with the powerexcitation which suggests that the two emission bands have thesame origin. The green luminescence is the conventional green ofSiO2/α-Zn2SiO4:Mn2+ nanocomposite, occurring at about 525 nm,a well known one; it corresponds to an internal transition of Mn2+
in α-Zn2SiO4 phase and the second band in the range 560–608 nmfor Mn2+ in another phase, probably in the β-Zn2SiO4 phase[47,48,51]. Also, the strong emissions peaks around 525 and590 nm are observed only under the highest excitation powerdensity of 70 MW/cm2 (Fig. 10). The sharpness of the peak can beascribed to the uniformity of particle sizes. The emission intensityshows a linear variation with the power excitation (onset ofFig. 10). Furthermore, no change in the PL spectra, either in shapeor position, was observed with power excitation, even after beingaged for a long period of time, indicating the time stability of thecomposite material. This result strongly suggests that the produc-tion of nanoparticles in SiO2 matrix by sol–gel is a simple way tomaintain the luminescence spectra of the nanoparticles. Theseresults prove that the origin of the luminescent center and thenature of this band have so far not been completely establishedand calls for further investigations, particularly the study of thepower excitation effect above 70 MW/cm2.
The decay curve of the green emission of the SiO2/α-Zn2SiO4:Mn2+ nanocomposite with 5% Mn concentration annealed at1200 1C is shown in Fig. 11. The decay curve corresponding tothe emission band at 525 nm shows that the decay kinetics is adouble-exponential decay curve. The result of decay curve can beobtained according to the following equation [49]:
I¼ Afeð−t=τf Þ þ Aseð−t=τsÞ ð1Þ
where τf and τs are the fast and slow components of theluminescence lifetimes, while Af and As are the weight factorsof the two components, respectively. The fitting results areAf/As¼14.28, τf¼2 ms, and τs¼11 ms. They are in agreement withthe previous observations [49]. The long decay time of Zn2SiO4:Mnis an obstacle for the PDP application. Thus, lot of efforts have beendedicated to shorten the decay time of Zn2SiO4:Mn particleswithout losing much efficiency [7,52]. In general, it is possible toreduce the decay time of a phosphor by increasing the manganesedopant content. However, because of the accompanying energy
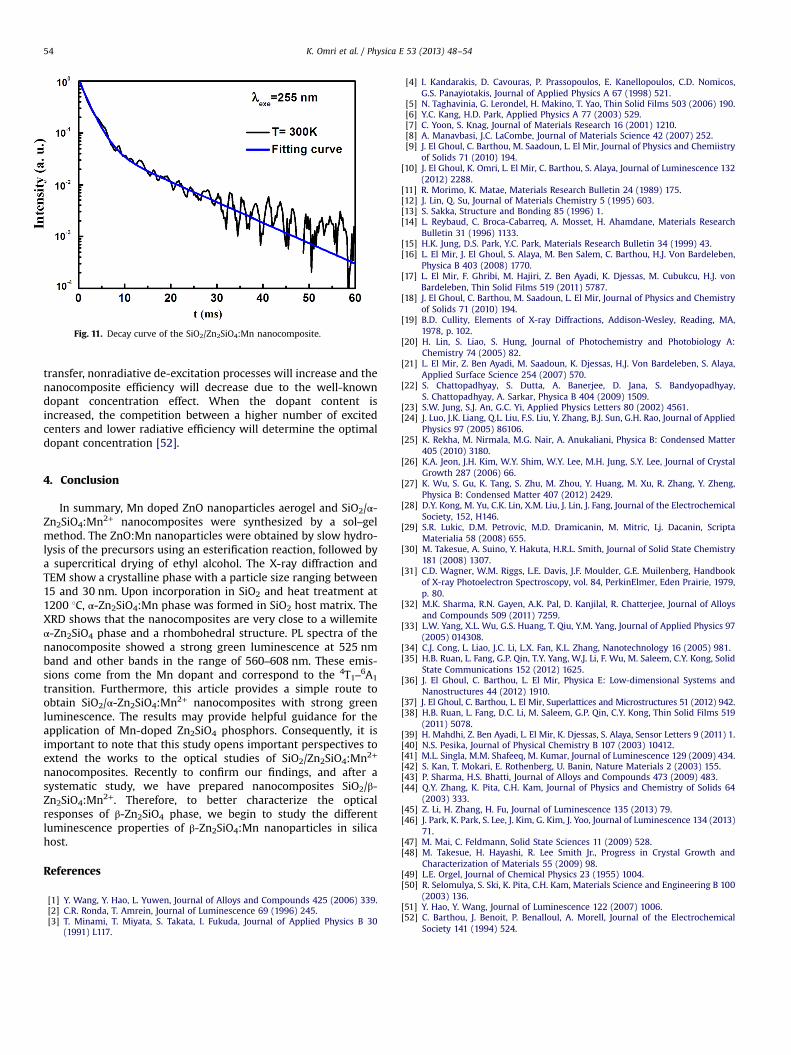
Fig. 11. Decay curve of the SiO2/Zn2SiO4:Mn nanocomposite.
K. Omri et al. / Physica E 53 (2013) 48–5454
transfer, nonradiative de-excitation processes will increase and thenanocomposite efficiency will decrease due to the well-knowndopant concentration effect. When the dopant content isincreased, the competition between a higher number of excitedcenters and lower radiative efficiency will determine the optimaldopant concentration [52].
4. Conclusion
In summary, Mn doped ZnO nanoparticles aerogel and SiO2/α-Zn2SiO4:Mn2+ nanocomposites were synthesized by a sol–gelmethod. The ZnO:Mn nanoparticles were obtained by slow hydro-lysis of the precursors using an esterification reaction, followed bya supercritical drying of ethyl alcohol. The X-ray diffraction andTEM show a crystalline phase with a particle size ranging between15 and 30 nm. Upon incorporation in SiO2 and heat treatment at1200 1C, α-Zn2SiO4:Mn phase was formed in SiO2 host matrix. TheXRD shows that the nanocomposites are very close to a willemiteα-Zn2SiO4 phase and a rhombohedral structure. PL spectra of thenanocomposite showed a strong green luminescence at 525 nmband and other bands in the range of 560–608 nm. These emis-sions come from the Mn dopant and correspond to the 4T1–6A1
transition. Furthermore, this article provides a simple route toobtain SiO2/α-Zn2SiO4:Mn2+ nanocomposites with strong greenluminescence. The results may provide helpful guidance for theapplication of Mn-doped Zn2SiO4 phosphors. Consequently, it isimportant to note that this study opens important perspectives toextend the works to the optical studies of SiO2/Zn2SiO4:Mn2+
nanocomposites. Recently to confirm our findings, and after asystematic study, we have prepared nanocomposites SiO2/β-Zn2SiO4:Mn2+. Therefore, to better characterize the opticalresponses of β-Zn2SiO4 phase, we begin to study the differentluminescence properties of β-Zn2SiO4:Mn nanoparticles in silicahost.
References
[1] Y. Wang, Y. Hao, L. Yuwen, Journal of Alloys and Compounds 425 (2006) 339.[2] C.R. Ronda, T. Amrein, Journal of Luminescence 69 (1996) 245.[3] T. Minami, T. Miyata, S. Takata, I. Fukuda, Journal of Applied Physics B 30
(1991) L117.
[4] I. Kandarakis, D. Cavouras, P. Prassopoulos, E. Kanellopoulos, C.D. Nomicos,G.S. Panayiotakis, Journal of Applied Physics A 67 (1998) 521.
[5] N. Taghavinia, G. Lerondel, H. Makino, T. Yao, Thin Solid Films 503 (2006) 190.[6] Y.C. Kang, H.D. Park, Applied Physics A 77 (2003) 529.[7] C. Yoon, S. Knag, Journal of Materials Research 16 (2001) 1210.[8] A. Manavbasi, J.C. LaCombe, Journal of Materials Science 42 (2007) 252.[9] J. El Ghoul, C. Barthou, M. Saadoun, L. El Mir, Journal of Physics and Chemiistry
of Solids 71 (2010) 194.[10] J. El Ghoul, K. Omri, L. El Mir, C. Barthou, S. Alaya, Journal of Luminescence 132
(2012) 2288.[11] R. Morimo, K. Matae, Materials Research Bulletin 24 (1989) 175.[12] J. Lin, Q. Su, Journal of Materials Chemistry 5 (1995) 603.[13] S. Sakka, Structure and Bonding 85 (1996) 1.[14] L. Reybaud, C. Broca-Cabarreq, A. Mosset, H. Ahamdane, Materials Research
Bulletin 31 (1996) 1133.[15] H.K. Jung, D.S. Park, Y.C. Park, Materials Research Bulletin 34 (1999) 43.[16] L. El Mir, J. El Ghoul, S. Alaya, M. Ben Salem, C. Barthou, H.J. Von Bardeleben,
Physica B 403 (2008) 1770.[17] L. El Mir, F. Ghribi, M. Hajiri, Z. Ben Ayadi, K. Djessas, M. Cubukcu, H.J. von
Bardeleben, Thin Solid Films 519 (2011) 5787.[18] J. El Ghoul, C. Barthou, M. Saadoun, L. El Mir, Journal of Physics and Chemistry
of Solids 71 (2010) 194.[19] B.D. Cullity, Elements of X-ray Diffractions, Addison-Wesley, Reading, MA,
1978, p. 102.[20] H. Lin, S. Liao, S. Hung, Journal of Photochemistry and Photobiology A:
Chemistry 74 (2005) 82.[21] L. El Mir, Z. Ben Ayadi, M. Saadoun, K. Djessas, H.J. Von Bardeleben, S. Alaya,
Applied Surface Science 254 (2007) 570.[22] S. Chattopadhyay, S. Dutta, A. Banerjee, D. Jana, S. Bandyopadhyay,
S. Chattopadhyay, A. Sarkar, Physica B 404 (2009) 1509.[23] S.W. Jung, S.J. An, G.C. Yi, Applied Physics Letters 80 (2002) 4561.[24] J. Luo, J.K. Liang, Q.L. Liu, F.S. Liu, Y. Zhang, B.J. Sun, G.H. Rao, Journal of Applied
Physics 97 (2005) 86106.[25] K. Rekha, M. Nirmala, M.G. Nair, A. Anukaliani, Physica B: Condensed Matter
405 (2010) 3180.[26] K.A. Jeon, J.H. Kim, W.Y. Shim, W.Y. Lee, M.H. Jung, S.Y. Lee, Journal of Crystal
Growth 287 (2006) 66.[27] K. Wu, S. Gu, K. Tang, S. Zhu, M. Zhou, Y. Huang, M. Xu, R. Zhang, Y. Zheng,
Physica B: Condensed Matter 407 (2012) 2429.[28] D.Y. Kong, M. Yu, C.K. Lin, X.M. Liu, J. Lin, J. Fang, Journal of the Electrochemical
Society, 152, H146.[29] S.R. Lukic, D.M. Petrovic, M.D. Dramicanin, M. Mitric, Lj. Dacanin, Scripta
Materialia 58 (2008) 655.[30] M. Takesue, A. Suino, Y. Hakuta, H.R.L. Smith, Journal of Solid State Chemistry
181 (2008) 1307.[31] C.D. Wagner, W.M. Riggs, L.E. Davis, J.F. Moulder, G.E. Muilenberg, Handbook
of X-ray Photoelectron Spectroscopy, vol. 84, PerkinElmer, Eden Prairie, 1979,p. 80.
[32] M.K. Sharma, R.N. Gayen, A.K. Pal, D. Kanjilal, R. Chatterjee, Journal of Alloysand Compounds 509 (2011) 7259.
[33] L.W. Yang, X.L. Wu, G.S. Huang, T. Qiu, Y.M. Yang, Journal of Applied Physics 97(2005) 014308.
[34] C.J. Cong, L. Liao, J.C. Li, L.X. Fan, K.L. Zhang, Nanotechnology 16 (2005) 981.[35] H.B. Ruan, L. Fang, G.P. Qin, T.Y. Yang, W.J. Li, F. Wu, M. Saleem, C.Y. Kong, Solid
State Communications 152 (2012) 1625.[36] J. El Ghoul, C. Barthou, L. El Mir, Physica E: Low-dimensional Systems and
Nanostructures 44 (2012) 1910.[37] J. El Ghoul, C. Barthou, L. El Mir, Superlattices and Microstructures 51 (2012) 942.[38] H.B. Ruan, L. Fang, D.C. Li, M. Saleem, G.P. Qin, C.Y. Kong, Thin Solid Films 519
(2011) 5078.[39] H. Mahdhi, Z. Ben Ayadi, L. El Mir, K. Djessas, S. Alaya, Sensor Letters 9 (2011) 1.[40] N.S. Pesika, Journal of Physical Chemistry B 107 (2003) 10412.[41] M.L. Singla, M.M. Shafeeq, M. Kumar, Journal of Luminescence 129 (2009) 434.[42] S. Kan, T. Mokari, E. Rothenberg, U. Banin, Nature Materials 2 (2003) 155.[43] P. Sharma, H.S. Bhatti, Journal of Alloys and Compounds 473 (2009) 483.[44] Q.Y. Zhang, K. Pita, C.H. Kam, Journal of Physics and Chemistry of Solids 64
(2003) 333.[45] Z. Li, H. Zhang, H. Fu, Journal of Luminescence 135 (2013) 79.[46] J. Park, K. Park, S. Lee, J. Kim, G. Kim, J. Yoo, Journal of Luminescence 134 (2013)
71.[47] M. Mai, C. Feldmann, Solid State Sciences 11 (2009) 528.[48] M. Takesue, H. Hayashi, R. Lee Smith Jr., Progress in Crystal Growth and
Characterization of Materials 55 (2009) 98.[49] L.E. Orgel, Journal of Chemical Physics 23 (1955) 1004.[50] R. Selomulya, S. Ski, K. Pita, C.H. Kam, Materials Science and Engineering B 100
(2003) 136.[51] Y. Hao, Y. Wang, Journal of Luminescence 122 (2007) 1006.[52] C. Barthou, J. Benoit, P. Benalloul, A. Morell, Journal of the Electrochemical
Society 141 (1994) 524.