Luminescence characterization and electron beam induced chemical changes on the surface of...
10
This article appeared in a journal published by Elsevier. The attached copy is furnished to the author for internal non-commercial research and education use, including for instruction at the authors institution and sharing with colleagues. Other uses, including reproduction and distribution, or selling or licensing copies, or posting to personal, institutional or third party websites are prohibited. In most cases authors are permitted to post their version of the article (e.g. in Word or Tex form) to their personal website or institutional repository. Authors requiring further information regarding Elsevier’s archiving and manuscript policies are encouraged to visit: http://www.elsevier.com/copyright
-
Upload
independent -
Category
Documents
-
view
0 -
download
0
Transcript of Luminescence characterization and electron beam induced chemical changes on the surface of...

This article appeared in a journal published by Elsevier. The attachedcopy is furnished to the author for internal non-commercial researchand education use, including for instruction at the authors institution
and sharing with colleagues.
Other uses, including reproduction and distribution, or selling orlicensing copies, or posting to personal, institutional or third party
websites are prohibited.
In most cases authors are permitted to post their version of thearticle (e.g. in Word or Tex form) to their personal website orinstitutional repository. Authors requiring further information
regarding Elsevier’s archiving and manuscript policies areencouraged to visit:
http://www.elsevier.com/copyright

Author's personal copy
Applied Surface Science 257 (2011) 3298–3306
Contents lists available at ScienceDirect
Applied Surface Science
journa l homepage: www.e lsev ier .com/ locate /apsusc
Luminescence characterization and electron beam induced chemical changes onthe surface of ZnAl2O4:Mn nanocrystalline phosphor
Shreyas S. Pitale ∗, Vinay Kumar, I.M. Nagpure, O.M. Ntwaeaborwa, H.C. Swart ∗
Department of Physics, University of the Free State, P. O. Box 339, Bloemfontein, ZA9300, South Africa
a r t i c l e i n f o
Article history:Received 9 May 2010Received in revised form 31 October 2010Accepted 2 November 2010Available online 10 November 2010
Keywords:CathodoluminescenceAuger electron spectroscopyX-ray photoelectron spectroscopy
a b s t r a c t
Luminescence characteristics and surface chemical changes of nanocrystalline Mn2+ doped ZnAl2O4 pow-der phosphors are presented. Stable green cathodoluminescence (CL) or photoluminescence (PL) witha maximum at ∼512 nm was observed when the powders were irradiated with a beam of high energyelectrons or a monochromatic xenon lamp at room temperature. This green emission can be attributedto the 4T1 → 6A1 transitions of the Mn2+ ion. Deconvoluted CL spectra resulted in two additional emissionpeaks at 539 and 573 nm that may be attributed to vibronic sideband and Mn4+ emission, respectively.The luminescence decay of the Mn2+ 512 nm emission under 457 nm excitation is single exponentialwith a lifetime of 5.20 ± 0.11 ms. Chemical changes on the surface of the ZnAl2O4:Mn2+ phosphor duringprolonged electron beam exposure were monitored using Auger electron spectroscopy. The X-ray photo-electron spectroscopy (XPS) was used to determine the chemical composition of the possible compoundsformed on the surface as a result of the prolonged electron beam exposure. The XPS data suggest that thethermodynamically stable Al2O3 layer was formed on the surface and is possibly contributing to the CLstability of ZnAl2O4:Mn phosphor.
© 2010 Elsevier B.V. All rights reserved.
1. Introduction
A phosphor that exhibits excellent thermal and chemical sta-bility (and high CL intensity) under prolonged electron beamirradiation in vacuum is more likely to be considered for appli-cations in wide color gamut displays, field emission and vacuumfluorescent displays. Oxide matrices have already been proved tobe chemically and thermally stable compared to their sulfide coun-terparts [1]. Among other oxide based matrices, zinc aluminate(ZnAl2O4) with a spinel structure has emerged as a prospective can-didate in such cutting-edge technological applications as reportedin recent studies on the development of this host material for a lowvoltage cathodoluminescence (CL) behaviour [2,3].
Although different synthesis techniques can be used to prepareZnAl2O4 phosphor, combustion has been the preferred techniquedue to its success in producing homogeneous and nanocrystallinealuminate phosphors with fine particles. In addition, the synthe-sis can be carried out at relatively low temperatures in a shortprocessing time [4]. The process involves an exothermic reactionbetween an oxidizer such as metal nitrates and an organic fuel, typ-ically urea (CH4N2O). The flame temperature during urea-assisted
∗ Corresponding authors. Tel.: +27 0 51 401 9749; fax: +27 0 51 401 3507.E-mail addresses: [email protected] (S.S. Pitale), [email protected]
(H.C. Swart).
combustion is high enough to enable some Al ions in the zinc alu-minate spinel structure to occupy tetrahedral sites, a phenomenontermed “spinel inversion” in the literature [5]. The partial inversecharacter of ZnAl2O4 obtained by urea combustion is worth inves-tigating because such structural changes may lead to varied opticalproperties [6].
Further, when the ZnAl2O4 host is doped with divalent man-ganese (Mn2+) ions, intense cathodoluminescence with highchromaticity could be observed [7]. In view of this, systematicinvestigations on the fabrication parameters were conducted byNagura et al. [8] who suggested a careful control over the cationicmolar ratio of Zn to Al atoms and enhancement of CL intensityby post-synthesis thermal treatments of ZnAl2O4:Mn2+. Althoughsome important fabrication factors like those mentioned abovehave been investigated, there is still a lack of information related todegradation behaviour of this phosphor under prolonged electronbeam exposure and the subsequent dynamical changes that couldoccur on the surface.
Electron bombardment can induce physical or chemical desorp-tion of ionic, neutral and molecular species on the surface and canalso promote decomposition. The surface chemical reactions havebeen explained in terms of electron stimulated surface chemicalreaction model (ESSCR), and these reactions are believed to yieldnew surface species causing reduction in CL output [9]. In the devel-opment of FEDs, it is important to develop phosphors which showhigh efficiency and good stability at low-voltage electron excitation
0169-4332/$ – see front matter © 2010 Elsevier B.V. All rights reserved.doi:10.1016/j.apsusc.2010.11.006

Author's personal copy
S.S. Pitale et al. / Applied Surface Science 257 (2011) 3298–3306 3299
and high current density. We note that in low voltage application,surface condition is critical because the electron penetration depthis very small. The CL brightness of a display depends on the currentdensity and electrical resistance of the phosphor. The resistance ofa phosphor can be changed under the electron bombardment nor-mally termed as charging behaviour. The reasons for these changesare the following: decomposition of a phosphor and contaminationof the phosphor surface by components of the vacuum atmosphere.The changes in the resistance of a phosphor layer result from theelectron-stimulated contaminations of the surface. The resistanceof a phosphor is normally decreased with the electron beam irra-diation. It rises from the formation of various defects in phosphormatrix where the metal ions and high conductive oxides can beproduced by electron-stimulated processes. Luminescence mech-anisms and surface properties are correlated. Especially, the lowvoltage cathodoluminescence (CL) may be more sensitive to sur-face contamination since the luminescent excitation depth by anelectron beam decreases as the electron beam energy (or the beampotential) is reduced. As a result, surface atomic and moleculardynamics, such as electron beam stimulated surface chemical reac-tions, diffusion, and evaporation, become important. The presentstudy is therefore intended towards understanding the chargingphenomenon and identifying the electron beam induced chemicalreaction by-products. The need to realize brighter cathodolumines-cence for high definition screens can be aided by improved packingdensity using nanocrystalline phosphor particles [10].
The possible changes of the CL intensity were monitored as afunction of various O pressures during prolonged electron beamexposure. The surface chemical reactions and reduction in the CLintensity induced by a prolonged exposure to electron beam at dif-ferent vacuum conditions were monitored using an in situ Augerelectron spectroscopy combined with the CL spectroscopy. Theeffects of excitation beam current density in various O2 pressureson the green cathodoluminescence from ZnAl2O4:Mn2+ nanocrys-talline phosphor is discussed. The chemical state of the surfacebefore and after degradation was determined by X-ray photoelec-tron spectroscopy.
2. Experimental
All the starting chemicals namely, zinc nitrate tetrahydrate(ZnNO3·4H2O), aluminium nitrate Al(NO3)3·9H2O, urea (CH4N2O)and manganese chloride tetrahydrate (MnCl2·4H2O) of AR gradewere purchased from Merck, South Africa and were used asobtained without further purification. The details of combustionsynthesis for the preparation of the ZnAl2O4 nanocrystalline phos-phors can be found elsewhere [4]. The dopant concentration wasfixed to 1 mol.%
X-ray diffraction (XRD) measurements were performed using aSiemens D5005 diffractometer with Cu K� radiation (� = 0.154 nm)in the 2� range of 20–70◦. Particle morphology was analyzed usingJEOL JEM-2100 high resolution transmission electron microscopy(HRTEM) at an accelerating voltage of 200 kV and SEM pictureswere collected using physical electronics PHI 700 Scanning AugerNanoprobe. Energy dispersive X-ray (EDS) measurements wereperformed using energy dispersive X-ray spectrometer attached toShimadzu SSX-550 electron microscope. Photoluminescence (exci-tation and emission) and luminescence decay measurements werecarried out at room temperature using the Varian Cary Eclipse flu-orescence spectrophotometer. Cathodoluminescence degradationmeasurements were carried out in an ultra high vacuum (UHV)chamber with a PHI 549 Auger spectrometer coupled with OceanOptics S2000 CL spectrometer. The Auger and the CL data werecollected simultaneously from the same spot when the powderphosphors were excited with a singular 12 �A primary electron
Fig. 1. XRD pattern along with the standard JCPDS file of combustion synthesizedZnAl2O4:Mn (1 mol.%) phosphor.
beam accelerated at 2 kV in the vacuum chamber maintained at1 × 10−7 Torr O2. The CL intensity was also monitored at a con-stant voltage of 2 kV and different beam current (0.5–20 �A) at10−8 and 10−7 Torr O2. An anavac-2 mass analyzer was used todetermine volatile gas species present in the chamber during elec-tron bombardment. The X-ray photoelectron spectroscopy (XPS)measurements were conducted using a PHI 5000 versa probe spec-trometer (analyser resolution ≤ 0.5 eV) using monochromatic Al K�radiation (h� = 1253.6 eV). The charging of samples during the X-rayirradiation was taken care of by neutralizing with slow electronsand ions during the data acquisition. The charge over compensationresulting in shifts in the measured binding energies was correctedusing C1s peak at 284.8 eV. The hemispherical analyzer functionedwith constant pass energy of 11.3 eV for high-resolution spectra.Measurements were performed using either a 1 eV/step and 45 minacquisition times (binding energies ranging from 0–1400 eV) widescans or a 1 eV/step and 20–30 min acquisition times for elemen-tal regions. The sample area analyzed was about 1 mm2 and thepressure during acquisition was less than 1 × 10⁻⁸ Torr.
The experimental curves were fitted using a multipack v8.2cdata analysis software provided with the PHI-5000 versa-probeX-ray photoelectron spectrometer that made use of a combina-tion of Gaussian–Lorentzian lines. No attempts were made to cleanthe surface to avoid tempering with the information on surfacechemical changes produced during Auger analyses.
3. Results and discussion
3.1. Phase identification and microstructural aspects
The X-ray diffraction patterns shown in Fig. 1 are consistentwith the ZnAl2O4 phase referenced in the JCPDS file No. 82-1043.The broadening of the diffraction peaks points to the presence ofnanocrystalline domains. Average crystallite size estimated fromthe diffraction line broadening (eliminating the instrument con-tributions) is 20 ± 5 nm. Fig. 2(A–D) shows the SEM micrographsof the combustion synthesized product at various magnifications.Due to evolution of large amount of gases, a well-known semi-continuous folded dense platelet like morphology was observed(Fig. 2(A)). Compositional analysis on the nanostructures probedby EDS shows that the powders were composed of the Zn, Al andO elements (Fig. 2(A) inset). Mn2+ was not detected due to a rel-atively low doping concentration. The platelet has a rich surfacecontaining mutually interconnected quasi-spherical particles as

Author's personal copy
3300 S.S. Pitale et al. / Applied Surface Science 257 (2011) 3298–3306
Fig. 2. (A, B, C and D) SEM micrographs of ZnAl2O4:Mn at different magnifications in increasing order of magnitude. (A) inset shows the EDS spectrum of the combustionsynthesized product. Quasi-spherical interconnected particles can be seen on the base of the platelet structures at the highest magnification. (E and F) TEM micrographs ofmesoporous ZnAl2O4:Mn where particles are embedded into individual platelets.
shown in Fig. 2(C and D). Mesoporous structure is evident from theTEM micrographs presented in Fig. 2(E and F) which is seen to benon-uniformly distributed throughout the matrix where the poreembedded into platelets can be viewed along with the aggregatedparticles. In a simultaneous oxidation and reduction process likecombustion, the reaction is very violent. This violent behaviour isattributed to hypergolic nature of evolving gases as the fuel decom-poses. Thus, a driving force (to which is coupled heat and masstransfer) shifts the system from its equilibrium state and modu-lates the surface free energy of the final crystals. The magnitude ofthe driving force pertaining to the ambient phase, where the crys-tal growth is considered to occur, decides the variations in growthforms. Even a stoichiometric ratio of fuel and oxidizer (which is con-sidered to be the workhorse of the combustion method) adoptedin the present synthesis is capable of driving the system far awayfrom its equilibrium state, thereby increasing the nucleation rate.This result in aggregation of many tiny crystals and in such a situa-tion, spherical polycrystalline aggregates or semi-spherulites mayappear due to radiating growth from the centre. In view of inho-mogeneous heat and mass transport in the reaction chamber, thedriving force may also have a spatial variance inside the reactionchamber ultimately leading to a difference in the rate of nucleationand an irregular distribution of morphological forms. The reaction
growth kinetics can easily be regulated by varying the fuel to oxi-dizer content to achieve specific morphological forms of the finalproduct. Finally, the porous network (Fig. 2(E)) is an outcome oflarge amount of gases escaping during the combustion process [5].
3.2. Photoluminescence and decay characteristics
Photoluminescence (excitation and emission) spectra of Mn2+
doped ZnAl2O4 powder phosphor are shown in Fig. 3(A). Theexcitation spectra comprises of four bands at 361, 386, 425 and457 nm that can be assigned to the transitions from multiplets4E(D), 4T2(D), 4A1(G)4E(G) and 4T2(G) of Mn2+ ion, respectively [11].Although there was a variation in intensity, the emission peak wasobtained at the same position (512 nm) for all the excitation wave-lengths. The most intense PL emission was obtained when excitingthe powder at 458 nm wavelength. The PL emission at 512 nmcorresponds to the 4T1 → 6A1 transitions of the Mn2+ ion locatedin the tetrahedral coordination of the Zn2+ site with low crystalfield strength within the spinel structure of ZnAl2O4. In additiona vibronic sideband was also observed as shown in Fig. 3(A). Thecontribution of this band to the emission process depends uponcoupling of phonon modes to the electronic transition momentsof the Mn2+ ion and on the phonon density of states. The 512 nm

Author's personal copy
S.S. Pitale et al. / Applied Surface Science 257 (2011) 3298–3306 3301
Fig. 3. (A) PL of ZnAl2O4:Mn (1 mol.%). Emission at 512 nm is recorded at �exc. = 457 nm and the excitation spectra is recorded at �em. = 512 nm. (B) Experimentally observedand single-exponential fitted decay curves along with the fitted decay parameters.
emitting state was populated using excitation pulses of 458 nmat room temperature and the temporal analysis of luminescencewas performed. The decay curve was fitted by a single exponen-tial process and no site to site differences between radiative andnon-radiative transition probabilities were observed at the chosendopant concentration. The decay curve and the corresponding fit-ting parameters are shown in Fig. 3(B). The observed lifetime of5.20 ± 0.11 ms is ascribed to the isolated Mn2+ centre.
3.3. Cathodoluminescence characteristics
The ZnAl2O4:Mn2+ (1 mol. %) mesoporous spinal was irradi-ated with a 2 mA/cm2 beam of electrons accelerated at 2 kV indifferent O2 pressures. Fig. 4 shows the CL spectrum for the datacollected at 1 × 10⁻⁸ Torr O2. The maximum (511 nm) of the CLintensity is essentially at the same position as that observed inthe PL data suggesting that the radiative relaxation processes ofMn2+ were not affected the source of excitation (i.e. photon versuselectrons). Additional signatures were detected in the longer wave-length region at 540–600 nm. Deconvolution of the CL spectrum interms of a Gaussian (amplitude version) line-shape function gaverise to three peaks at 511, 539 nm and 573 nm. Note that the peaks
Fig. 4. Cathodoluminescence (CL) of ZnAl2O4:Mn (1 mol.%) under electron beamexcitation of 2 keV, beam current density 2 mA/cm2 at 1 × 10⁻⁸ Torr O2 pressure.The CL emission is deconvoluted into three Gaussian bands marked as 1, 2 and 3.Additional spectral contribution is indicated in a rectangle (not included in curvefitting). Each band represents an electronic transition that is linked to a specificstructural arrangement as described in the text.
at 511 and 539 nm are similar to the 4T1 → 6A1 transitions of Mn2+
and vibronic sideband observed from the PL spectrum in Fig. 3(A).The peak at 573 nm can be associated with Mn4+ emission reportedin the literature [12]. Note that Mn4+ can be formed as a resultof inevitable oxidation of Mn2+ during the combustion process.The normal distribution of the cations is thermodynamically notalways the most stable situation, since the configurational entropycounteracts the site preference energy. Therefore, in the ZnAl2O4spinels, there is possibly a partial inversion in terms of the ran-dom site occupancy of the divalent and trivalent cations whichcan freely interchange interstices via diffusion. The divalent ions(Zn2+) and half of the trivalent ions (Al3+) are in the octahedral siteswhile the remaining trivalent cations have tetrahedral coordina-tion [13,14]. In the event of this partial inversion, it is most likelythat the Mn4+ formed from oxidation of Mn2+ ions occupy inter-stitial or octahedral sites rather than the tetrahedral ones that arepreferred by Mn2+ ions. The same has been observed as a red shiftof green emission from Mn2+ in ZnGa2O4 phosphor [12]. A slightmismatch of experimental and fitted CL data in the lower wave-length region (<490 nm shown as rectangle in Fig. 4) is due to thepresence of an extra spectral component. Due to non-convergenceof the fitted data, this component is not included in the final fit-ting. An O deficient ZnAl2O4, may contain O vacancies which mayact as defect centres and are known to produce pronounced effectson the valence band density of states (mainly composed of O2− 2porbitals) and can also split the conduction band edge orbitals (com-posed of Al3+ 1s and Al3+ 2p orbitals) in terms of lower symmetryenvironment of Al3+ [6]. In an isomorphic compound ZnGa2O4, asimilar blue emission was reported to be that due to charge trans-fer between Ga3+ and O2− [15]. On similar grounds, we may raisethe possibility of spectral contribution below 490 nm to be due tocharge transfer from Al3+ to O2−. Such transitions may shift towardslonger wavelengths (as compared to 430 nm for ZnGa2O4) whenstructural changes occur in Al–O octahedral by reducing site sym-metries due to formation of O vacancies.
3.4. Auger spectroscopy characterization
Variations on surface compositions during rapid CL degradationcan be mapped by Auger electron spectroscopy due to its high spa-tial resolution and shallow electron escape depth. The chemicalstate of the constituents in ZnAl2O4 can be inferred from the AESspectrum in terms of the intensity, energy and line shape of specificpeaks. The same is recorded as shown in Fig. 5(A) before, during andafter the electron beam irradiation at a pressure of 1 × 10⁻⁶ Torr O2with characteristic peaks of Zn, Al, C, and O observed at 995 eV,68 eV, 273 eV and 513 eV, respectively, before degradation. After
Author's personal copy
3302 S.S. Pitale et al. / Applied Surface Science 257 (2011) 3298–3306
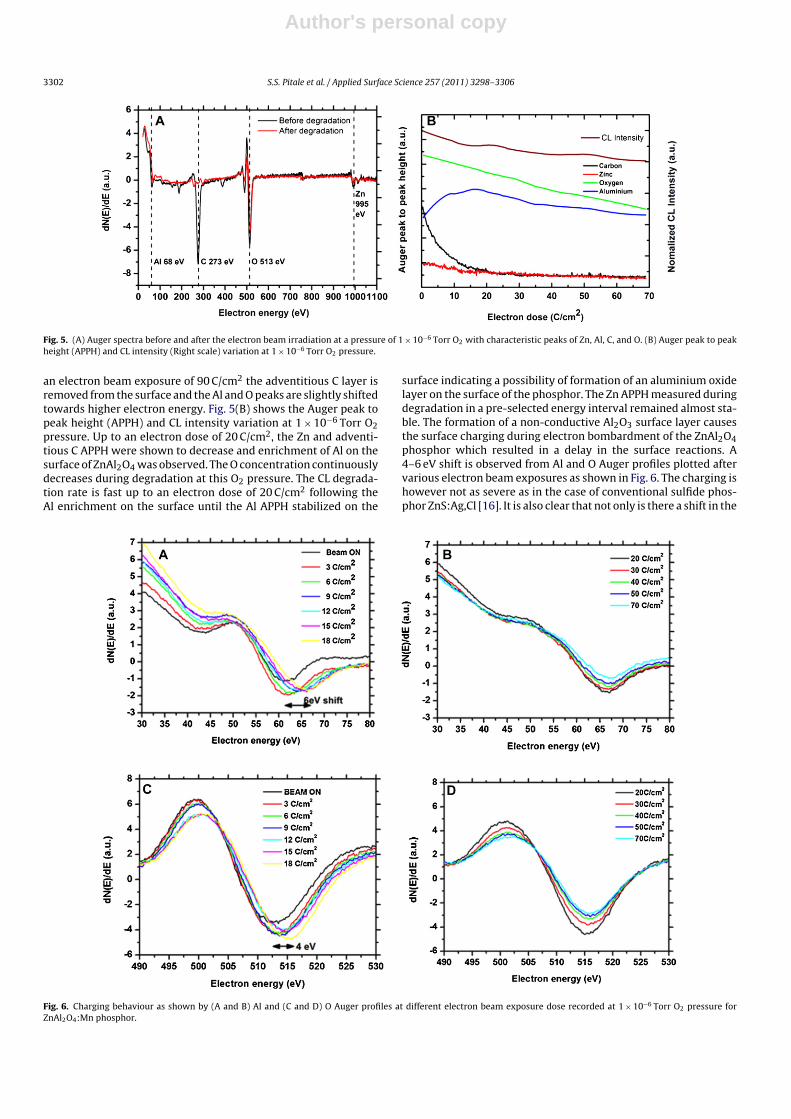
Fig. 5. (A) Auger spectra before and after the electron beam irradiation at a pressure of 1 × 10⁻⁶ Torr O2 with characteristic peaks of Zn, Al, C, and O. (B) Auger peak to peakheight (APPH) and CL intensity (Right scale) variation at 1 × 10⁻⁶ Torr O2 pressure.
an electron beam exposure of 90 C/cm2 the adventitious C layer isremoved from the surface and the Al and O peaks are slightly shiftedtowards higher electron energy. Fig. 5(B) shows the Auger peak topeak height (APPH) and CL intensity variation at 1 × 10⁻⁶ Torr O2pressure. Up to an electron dose of 20 C/cm2, the Zn and adventi-tious C APPH were shown to decrease and enrichment of Al on thesurface of ZnAl2O4 was observed. The O concentration continuouslydecreases during degradation at this O2 pressure. The CL degrada-tion rate is fast up to an electron dose of 20 C/cm2 following theAl enrichment on the surface until the Al APPH stabilized on the
surface indicating a possibility of formation of an aluminium oxidelayer on the surface of the phosphor. The Zn APPH measured duringdegradation in a pre-selected energy interval remained almost sta-ble. The formation of a non-conductive Al2O3 surface layer causesthe surface charging during electron bombardment of the ZnAl2O4phosphor which resulted in a delay in the surface reactions. A4–6 eV shift is observed from Al and O Auger profiles plotted aftervarious electron beam exposures as shown in Fig. 6. The charging ishowever not as severe as in the case of conventional sulfide phos-phor ZnS:Ag,Cl [16]. It is also clear that not only is there a shift in the
Fig. 6. Charging behaviour as shown by (A and B) Al and (C and D) O Auger profiles at different electron beam exposure dose recorded at 1 × 10⁻⁶ Torr O2 pressure forZnAl2O4:Mn phosphor.
Author's personal copy
S.S. Pitale et al. / Applied Surface Science 257 (2011) 3298–3306 3303
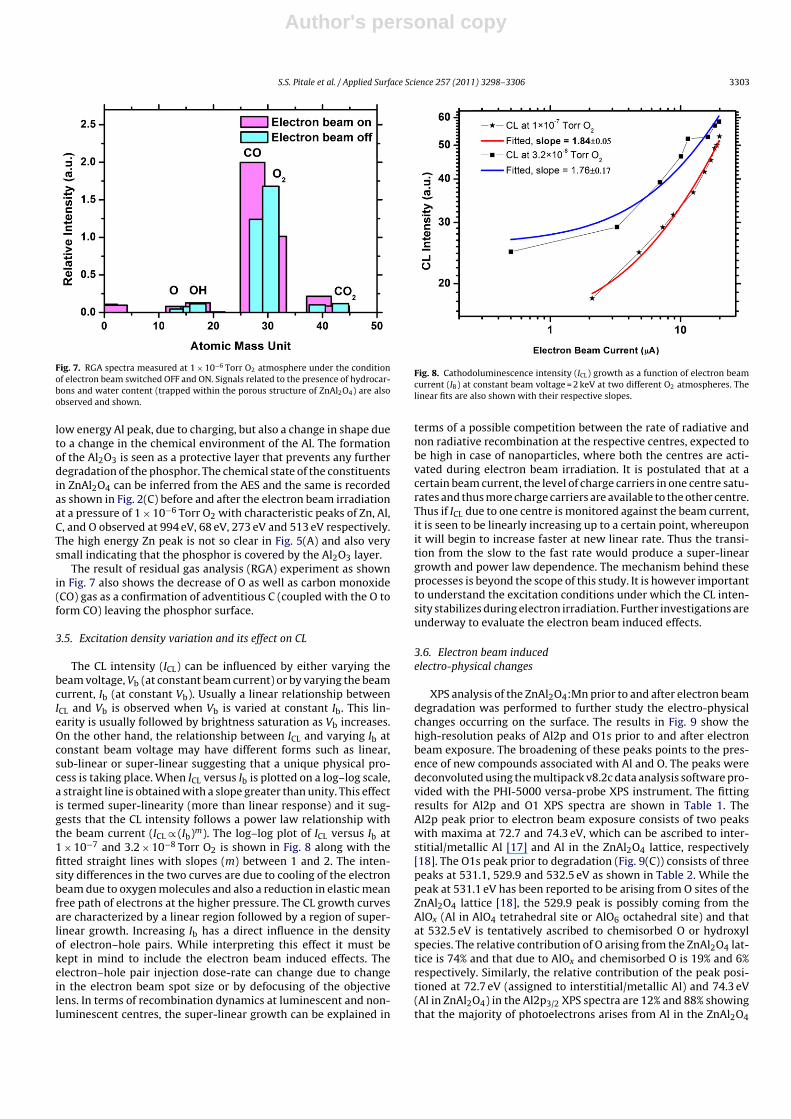
Fig. 7. RGA spectra measured at 1 × 10⁻⁶ Torr O2 atmosphere under the conditionof electron beam switched OFF and ON. Signals related to the presence of hydrocar-bons and water content (trapped within the porous structure of ZnAl2O4) are alsoobserved and shown.
low energy Al peak, due to charging, but also a change in shape dueto a change in the chemical environment of the Al. The formationof the Al2O3 is seen as a protective layer that prevents any furtherdegradation of the phosphor. The chemical state of the constituentsin ZnAl2O4 can be inferred from the AES and the same is recordedas shown in Fig. 2(C) before and after the electron beam irradiationat a pressure of 1 × 10⁻⁶ Torr O2 with characteristic peaks of Zn, Al,C, and O observed at 994 eV, 68 eV, 273 eV and 513 eV respectively.The high energy Zn peak is not so clear in Fig. 5(A) and also verysmall indicating that the phosphor is covered by the Al2O3 layer.
The result of residual gas analysis (RGA) experiment as shownin Fig. 7 also shows the decrease of O as well as carbon monoxide(CO) gas as a confirmation of adventitious C (coupled with the O toform CO) leaving the phosphor surface.
3.5. Excitation density variation and its effect on CL
The CL intensity (ICL) can be influenced by either varying thebeam voltage, Vb (at constant beam current) or by varying the beamcurrent, Ib (at constant Vb). Usually a linear relationship betweenICL and Vb is observed when Vb is varied at constant Ib. This lin-earity is usually followed by brightness saturation as Vb increases.On the other hand, the relationship between ICL and varying Ib atconstant beam voltage may have different forms such as linear,sub-linear or super-linear suggesting that a unique physical pro-cess is taking place. When ICL versus Ib is plotted on a log–log scale,a straight line is obtained with a slope greater than unity. This effectis termed super-linearity (more than linear response) and it sug-gests that the CL intensity follows a power law relationship withthe beam current (ICL ∝ (Ib)m). The log–log plot of ICL versus Ib at1 × 10−7 and 3.2 × 10⁻⁸ Torr O2 is shown in Fig. 8 along with thefitted straight lines with slopes (m) between 1 and 2. The inten-sity differences in the two curves are due to cooling of the electronbeam due to oxygen molecules and also a reduction in elastic meanfree path of electrons at the higher pressure. The CL growth curvesare characterized by a linear region followed by a region of super-linear growth. Increasing Ib has a direct influence in the densityof electron–hole pairs. While interpreting this effect it must bekept in mind to include the electron beam induced effects. Theelectron–hole pair injection dose-rate can change due to changein the electron beam spot size or by defocusing of the objectivelens. In terms of recombination dynamics at luminescent and non-luminescent centres, the super-linear growth can be explained in
Fig. 8. Cathodoluminescence intensity (ICL) growth as a function of electron beamcurrent (IB) at constant beam voltage = 2 keV at two different O2 atmospheres. Thelinear fits are also shown with their respective slopes.
terms of a possible competition between the rate of radiative andnon radiative recombination at the respective centres, expected tobe high in case of nanoparticles, where both the centres are acti-vated during electron beam irradiation. It is postulated that at acertain beam current, the level of charge carriers in one centre satu-rates and thus more charge carriers are available to the other centre.Thus if ICL due to one centre is monitored against the beam current,it is seen to be linearly increasing up to a certain point, whereuponit will begin to increase faster at new linear rate. Thus the transi-tion from the slow to the fast rate would produce a super-lineargrowth and power law dependence. The mechanism behind theseprocesses is beyond the scope of this study. It is however importantto understand the excitation conditions under which the CL inten-sity stabilizes during electron irradiation. Further investigations areunderway to evaluate the electron beam induced effects.
3.6. Electron beam inducedelectro-physical changes
XPS analysis of the ZnAl2O4:Mn prior to and after electron beamdegradation was performed to further study the electro-physicalchanges occurring on the surface. The results in Fig. 9 show thehigh-resolution peaks of Al2p and O1s prior to and after electronbeam exposure. The broadening of these peaks points to the pres-ence of new compounds associated with Al and O. The peaks weredeconvoluted using the multipack v8.2c data analysis software pro-vided with the PHI-5000 versa-probe XPS instrument. The fittingresults for Al2p and O1 XPS spectra are shown in Table 1. TheAl2p peak prior to electron beam exposure consists of two peakswith maxima at 72.7 and 74.3 eV, which can be ascribed to inter-stitial/metallic Al [17] and Al in the ZnAl2O4 lattice, respectively[18]. The O1s peak prior to degradation (Fig. 9(C)) consists of threepeaks at 531.1, 529.9 and 532.5 eV as shown in Table 2. While thepeak at 531.1 eV has been reported to be arising from O sites of theZnAl2O4 lattice [18], the 529.9 peak is possibly coming from theAlOx (Al in AlO4 tetrahedral site or AlO6 octahedral site) and thatat 532.5 eV is tentatively ascribed to chemisorbed O or hydroxylspecies. The relative contribution of O arising from the ZnAl2O4 lat-tice is 74% and that due to AlOx and chemisorbed O is 19% and 6%respectively. Similarly, the relative contribution of the peak posi-tioned at 72.7 eV (assigned to interstitial/metallic Al) and 74.3 eV(Al in ZnAl2O4) in the Al2p3/2 XPS spectra are 12% and 88% showingthat the majority of photoelectrons arises from Al in the ZnAl2O4

Author's personal copy
3304 S.S. Pitale et al. / Applied Surface Science 257 (2011) 3298–3306
101010151020102510301035104010451050105510600
500
1000
1500
2000
2500
Binding Energy (eV)
c/s
Zn2p1/2
Zn2p3/2
Undegraded
Degraded
6870727476788082848688
100
200
300
400
500
600
700
Binding Energy (eV)
c/s
6870727476788082848688
60
80
100
120
140
160
Binding Energy (eV)
c/s
524526528530532534536538540
200
300
400
500
600
700
800
900
1000
1100
1200
Binding Energy (eV)
c/s
525530535540
500
1000
1500
2000
2500
3000
3500
4000
Binding Energy (eV)
c/s
Al2p undegraded Al2p degraded
O1s undegraded O1s degraded
2
3
11
2
1
2
3
1
2
3
Fig. 9. XPS spectra of Al2p (A: undegraded; B: degraded), O1s (C: undegraded; D: degraded) and (E) Zn (2p1/2 and 2p3/2) in ZnAl2O4 prior to and after electron beam exposure.

Author's personal copy
S.S. Pitale et al. / Applied Surface Science 257 (2011) 3298–3306 3305
Table 1Gaussian deconvolution results for Al2p XPS spectra prior to and after electron beam exposure.
Element Fitting parameter Undegraded Degraded
Peak I Peak II Peak I Peak II Peak III
Al2p
B.E (eV) 72.65 74.27 72.70 74.29 74.61Rel. contribution% 11.93% 88.07% 8.82% 71.41% 19.77%Area 124 919 16 143 38FWHM 2.03 1.58 2.03 2.05 1.18�2 0.678 0.214
Table 2Gaussian deconvolution results for O1s XPS spectra prior to and after electron beam exposure.
Element Fitting parameter Undegraded Degraded
Peak I Peak II Peak III Peak I Peak II Peak III
O1s
B.E (eV) 529.87 531.10 532.48 530.18 531.39 532.92Rel. contribution% 19.01% 74.27 6.72% 38.69% 60.2% 1.11%Area 1226 4792 233 720 1120 21FWHM 2.03 1.58 2.20 1.68 1.2�2 0.678 0.575
lattice co-ordination and the rest is probably from residual Al ininterstitial positions.
Before considering the XPS results from the degraded phosphor,it is important to recall that the AES results from the degraded phos-phors gave a firsthand indication of modification of the Al Augerprofile. The peaks at 57 eV were shifted to 61 eV and also a changein shape was observed as the electron beam irradiation time pro-gressively increased and it was postulated to be an indication of theformation of Al2O3 from complex non-stoichiometric AlOx specieson the surface. The XPS signal of Al2p from the degraded phos-phor spot also reflects the above changes. The Al peak as shownin Fig. 9(B) is deconvoluted into three Gaussian bands positionedat 72.7, 74.3 and 74.6 eV. The first two peaks correlates with thoseobserved after deconvolution of Al2p peak of the undegraded phos-phor. The peak at 74.6 eV is due to the presence of a stoichiometricAl2O3 layer formed on the surface as a result of electron beam stim-ulated surface chemical reaction (ESSCR). The relative contributionof Al from ZnAl2O4, interstitial/metallic Al and that in Al2O3 co-ordination is 71%, 9% and 20%, respectively. The O1s XPS spectra ofthe degraded phosphor spot also shows three peaks at 530.2, 531.4and 532.9 eV attributed to O from Al2O3, ZnAl2O4 and chemisorbedO or water molecules respectively. The Zn 2p1/2 and Zn2p3/2 peaksbefore and after degradation are not significantly different fromeach other, except for the decrease in intensity due to the fact thatthe surface was covered by the Al2O3 layer, as seen in Fig. 9(D) andwere not deconvoluted. This is consistent with the APPH data. Basedon the XPS data (Fig. 9(A–D)), it is reasonable to conclude that Al2O3formed during prolonged electron bombardment in the presence ofthe O2 gas and this can be explained by the ESSCR model. This trans-formation is particularly favourable at 1 × 10⁻⁶ Torr O2 where thereis excess of O for the formation of thermodynamically stable Al2O3layer on the surface. It is most likely that the Al2O3 behaved likea protective layer preventing the phosphor from further degrada-tion that can be caused by moisture or any other contaminant in theatmosphere. This argument is supported by the CL data presentedin Fig. 7(A and B). Note that the CL degradation was fast duringthe interval 0–20 C/cm2 and was almost stable from 20 C/cm2 tothe end of degradation. It is therefore logical to suggest that the CLdegradation was fast in the beginning (0–20 C/cm2) because therewas no protective layer on the surface and once the Al2O3 formed(probably at >20 C/cm2) there was no further degradation.
The presence of wide band gap layer (Al2O3, Eg = 9.9 eV) onZnAl2O4 phosphor surface reinforced the probability of radiativerecombination thereby minimizing the rate of temporal decay ofthe CL intensity considerably. The initial decay of the CL intensity
results from a large concentration of non-radiative surface cen-tres generated during surface modification of phosphor (AlOx toAl2O3) and also from the delocalization of generated electrons atthe surface due to primary beam induced electric field, resultingin increase in the rate of non-radiative recombination betweenelectron and holes.
4. Conclusions
The experimental results on luminescent properties degrada-tion of the combustion synthesized ZnAl2O4:Mn nanoparticulatephosphor were presented. The CL degradation and the chemicalchanges on the surface were monitored simultaneously when thephosphor was exposed to low voltage electron beam. The intercon-nected spherical particles embedded on the surface of plate likestructures were observed from the TEM/SEM data. The main emis-sion peak associated with the 4T1 → 6A1 transitions of Mn2+ ionswas stable at ∼512 nm from both the CL and PL data suggestingthat the radiative relaxation processes on Mn2+ were not affectedby the nature of primary excitation. A broad CL spectrum arisesdue to multiple contributions from ZnAl2O4 nanoparticles. Decon-voluted CL spectra indicated that there was an additional peak inthe yellow-orange region and this was attributed to emission fromMn4+ that was possibly formed from oxidation of Mn2+. It is difficultto derive any quantitative information about actual Mn concen-tration in the +2 oxidation state. The Auger spectroscopy resultsrevealed shifting of Al and O line shapes, due to charging, duringdegradation at 1 × 10⁻⁶ Torr O2. Super-linear growth was observedfrom the CL intensity data monitored at different beam currentswhen the beam voltage was kept constant. The XPS results con-firm the formation of an Al2O3 layer on the surface of the degradedphosphor due to ESSCRs.
Acknowledgements
The authors would like to thank the South African NationalResearch Foundation (NRF) and the Material and Nano Science Clus-ter fund of the University of The Free State for financial support.
References
[1] V.Z. Mordkovich, H. Hayashi, M. Haemori, T. Fukumura, M. Kawasaki, Adv.Funct. Mater. 13 (2003) 519–524.
[2] E.M. Sanchez, M.G. Hipolito, J. Guzman, F. Ramos-Brito, J.S. Salazar1, R.M. Mar-tinez, O.A. Fregoso, M.I.R. Cortes, J.J.M. Delgado, C. Falcony, Phys. Status Solidi(a) 202 (2005) 102–107.

Author's personal copy
3306 S.S. Pitale et al. / Applied Surface Science 257 (2011) 3298–3306
[3] Z. Lou, J. Hao, Thin Solid Films 450 (2004) 334–340.[4] V. Singh, V. Natarajan, Jun-Jie Zhu, Opt. Mater. 29 (2007) 1447–1451.[5] T. Mimani, J. Alloys Compd. 315 (2001) 123–128.[6] A.A. Da Silva, A.S. Goncalves, M.R. Davalos, S.H. Santagneli, J. Nanosci. Nanotech-
nol. 8 (2008) 5690–5695.[7] Z. Lou, J. Hao, Appl. Phys. A 80 (2005) 151–154.[8] T. Nagura, H. Kominami, Y. Nakanishi, K. Hara, Jpn. J. Appl. Phys. 48 (2009)
092302–092306.[9] H.C. Swart, T.A. Trottier, J.S. Sebastian, S.L. Jones, P.H. Holloway, J. Vac. Sci.
Technol. A 14 (3) (1996) 1697–1703.[10] Jin Young Kim, Yong Chan You, Duk Young Jeon, Il Yu, Hong-Gun Yang, J. Vac.
Sci. Technol. B 21 (2003) 536–539.[11] V. Singh, R.P.S. Chakradhar, J.L. Rao, Dong-Kuk Kim, J. Lumin. 128 (2008)
394–402.
[12] C.F. Yu, P. Lin, J. Appl. Phys. 79 (1996) 7191–7197.[13] L. Zou, F. Li, X. Xiang, D.G. Evans, X. Duan, Chem. Mater. 18 (2006) 5852–
5859.[14] S. Mathur, M. Veith, M. Haas, H. Shen, N. Lecerf, V. Huch, S. Hufner, R. Haberkorn,
H.P. Beck, M. Jilavi, J. Am. Ceram. Soc. 84 (9) (2001) 1921–1928.[15] J.S. Kim, H.L. Park, C.M. Chon, H.S. Moon, T.W. Kim, Solid State Commun. 129
(2004) 163–167.[16] H.C. Swart, A.P. Greeff, P.H. Holloway, G.L.P. Berning, Appl. Surf. Sci. 140 (1999)
63–69.[17] J.F. Moulder, W.F. Stickle, P.E. Sobol, K.D. Bomben, Handbook of X-ray Photo-
electron Spectroscopy, Perkin-Elmer Corporation, Eden Prairie, MN, 1992, p.P18.
[18] R. Brian, Strohmeier, Surf. Sci. Spectra 3 (2) (1995) 128–134.