LP #11.indd - Books - International Rice Research Institute
196
-
Upload
khangminh22 -
Category
Documents
-
view
0 -
download
0
Transcript of LP #11.indd - Books - International Rice Research Institute

v
Contents
Foreword v
Section 1Rice and animals in the livelihoods of rural economies in Asia 3
Mercedita A. Sombilla
Improving crop-livestock production systems 18in rainfed areas of Southeast Asia
Ma. Lucila A. Lapar
Section 2Sustainable food-feed systems and improved livelihoods of the 29poor in rainfed lowland areas: socioeconomic components
El Sotheary
Current status of integrated crop-animal systems (ICAS) 46in Vietnam: a case study in the Mekong Delta
Le Thanh Duong, Nguyen Duy Can, and Tran Thi Phan
Evolution of integrated crop-animal systems 63in northern Vietnam
Dao The Anh, Pham Thi Hanh Tho, Vu Trong Binh,and Nguyen Ngoc Luan
A review of integrated crop-livestock (animal) 90systems in Indonesia
Sri Nastiti Jarmani, Arti Djatiharti, and Budi Haryanto
Integrated crop-animal systems in the Philippines: current status 104and future prospects
Grace C. Cataquiz, Fermina T. Rivera, Guadalupe O. Redondo,Rowena G. Manalili, Mary Jane R. Nievera, and Mercedita A. Sombilla
Integrated crop-animal systems in Thailand 117S. Simarak, B. Loapaiboon, K. Sommart, M. Duangjinda,V. Pattarajinda, P. Lowilai, T. Vongpralab, P. Sanchaisuriya,S. Kanharieng, and Y. Phasuk
Section 3Integrated crop-animal systems in rainfed 153rice lands: a Philippine study
F. Talens Rivera, P.A. Alviola, M.A. Sombilla, and G.C. Cataquiz
List of acronyms and abbreviations 187
Essential information on the Philippines 190

v
Integration of rice and livestock production is not new. Whathave changed over the years are the nature and roles of thecrop and animal components and the complexity of theirinteractions. The relationship between rice production andthe raising of carabao and a few other animals approximately40 years ago was based purely on need for subsistence. Thisrelationship has now evolved into more complex systems,as influenced by various socioeconomic, environmental,and political factors.
This book consists mainly of country monographs thatdescribe the status and direction of development of inte-grated crop-animal systems in the five main rice-growingcountries of Southeast Asia, Cambodia, Vietnam, Indone-sia, the Philippines, and Thailand. It emphasizes the grow-ing importance of crop-livestock integration as a path foragricultural intensification, especially among small produc-ers on marginal farm lands.
The publication of these country studies is part of alarger project that provides a more detailed characteriza-tion of integrated crop-animal systems on rice farms in South-east Asia. This project, “Sustainable Food-Feed Systems andImproved Livelihoods of the Poor in Rainfed Lowland RiceAreas,” was funded by the CGIAR Systemwide LivestockProgram (SLP) convened by the International LivestockResearch Institute (ILRI). The project was spearheaded by
Foreword
the International Rice Research Institute (IRRI) under theleadership of Dr. Mercedita A. Sombilla. This project alsoinvolved the participation of ILRI and various national in-stitutions in the project areas: the Cambodia AgricultureResearch and Development Institute; the Mekong DeltaFarming Systems Research and Development Institute, CanTho University (CTU), South Vietnam, and Vietnam Agri-cultural Science Institute (VASI) in North Vietnam; the Phil-ippine Rice Research Institute (PhilRice) and Central LuzonState University (CLSU) in the Philippines; the CentralResearch Institute for Animal Sciences (CRIAS) under theIndonesian Ministry of Agriculture in Indonesia; and theDepartment of Animal Science, which includes a FarmingSystems Unit, in Khon Kaen University in Thailand.
This continued strong partnership with various inter-national and national institutions has enabled the under-taking of other research projects that aim at improving thevalue of rice as feed for livestock and exploiting synergiesand decreasing trade-offs between the need for soil nutri-ents and livestock feed in rice-based systems.
ROBERT S. ZEIGLER CARLOS SERÉ
Director General Director GeneralIRRI ILRI

Section 1

2
3
In low-income societies in which people spend all their timein subsistence farming, an expanding agricultural sector isimportant for economic growth and rising income. The live-stock sector has a big role to play in this development, espe-cially in many parts of Asia, where rice and wheat produc-tion cannot be undertaken without livestock since the frag-mentation of land virtually rules out the use of mechaniza-tion. For many years, mixed farming systems with a live-stock component have been the overriding pattern of agri-culture among subsistence and small farm households inthe region. These still dominate the agricultural sector, es-pecially among small rice farm households. Whether theycontinue to do so in the coming decades will depend on theinteraction of various factors, such as population growth;rising income; the increasing scarcity of production re-sources, particularly land, labor, and water; the rate of tech-nological progress; the changing political environment; andthe move toward greater globalization.
Rice continues to be the main staple food in Asia, wheredemand will rise to 680 million tons in 2025. Cultivation ofrice will continue in this region, where the scarcity of pro-duction resources is becoming a serious threat. At the sametime, the region has exhibited a rapid increase in demandfor meat, milk, eggs, and other livestock products becauseof the income growth that brought about changes in dietarypatterns. These developments are a cause for concern, par-ticularly with regard to the competing use of productionresources and their impact on the poor rural households thatare involved in both crops and livestock. Questions emergedon whether the mixed crop-animal systems in Asia will flour-ish or will be replaced by more specialized productionschemes. An ongoing project on “Sustainable Food-FeedSystems and Improved Livelihoods of the Poor in RainfedLowland Areas: Socioeconomic Component” aims to shedlight on this question by examining studies among rice farmhouseholds with animal holdings in five countries to inves-tigate and understand the following:
• The characteristics of the changing role of animals inrice-farming households. Are changes apparent in therelative role of animals in rice-farming households? Ifyes, in what direction and to what extent?
Rice and animals in the livelihoodsof rural economies in AsiaMercedita A. Sombilla
• Household production decisions and resource alloca-tion. Does animal raising compete with rice cultiva-tion in the use of household resources? What factorsinfluence the allocation of resources, particularly be-tween rice cultivation and animal raising?
• What is the influence of technology development,government programs and policies, and marketchanges on the growth of rice-animal systems in thearea?
This paper provides background to the study. The firstsection provides a brief overview of the relative importanceof rice and livestock in the national economy of Asian coun-tries and presents the emerging trends of demand and theprospects of meeting this demand. The second section givesa brief characterization of mixed crop-animal systems andhighlights the important role of livestock among rice farmhouseholds. The third section discusses the future develop-ment of these systems.
Rice and livestock in the national economy of Asia
Rice occupies a position of overwhelming importance inAsian agriculture. As shown in Table 1, rice constitutes thebulk of the Asian diet. Effective per capita demand of riceranges from a low of about 60 kg per year in Japan to 208 kgper year in Myanmar. For many of the people in the poorercountries, rice is the main source of energy that enablesthem to execute their daily chores. It accounts for about50% of the annual per capita calorie intake in the region,reaching more than 70% in Bangladesh, Cambodia, andMyanmar (FAO database, 2003). Equally important is rice’srole in providing livelihood to the Asian population. Ricefarming is the single most important source of employmentand income for the rural people. Rice-based production sys-tems and their associated postharvest operations employnearly 1 billion people in the rural areas of developing coun-tries and about four-fifths of the world’s rice is grown bysmall-scale farmers in low-income countries (FAO 2003).This explains the relatively large contribution of rice toagricultural production, particularly in the 1960s and ’70s.In countries with per capita income of US$500 or less per

4
year, rice accounts for 20% to 33% of the gross domesticproduct (GDP) and 33% to 50% of the agricultural valueadded (Hossain and Fischer 1995).
The livestock sector has always been an integral com-ponent of the agricultural systems in Asia. It has thereforemade a significant contribution to economic development.Recent estimates show that livestock contributes from 6%to 20% of agricultural GDP in Southeast Asia and from 10%to 25% in South Asia (Devendra et al 1997, 2000, variouscountry statistical yearbooks). In China, the livestock sec-tor accounts for about 30% of the agricultural GDP (Statis-tical reports, various years). If the value of animal traction,animal transport, and manure is added, the proportion of thetotal product contributed by livestock would be muchhigher. Additionally, animal skins, wool, oil, and other re-sources are used as inputs in other industries.
The average per capita consumption of meat and otheranimal products is relatively low (Table 1). The past de-cades, however, witnessed massive annual increases in theaggregate consumption of animal products, as will be fur-ther discussed in the next section. This significant growthin demand led many scientists and experts to predict the
advent of a “livestock revolution” that would have pro-found implications, particularly for the resource base onwhich the sustainability of production systems depends(Delgado et al 1999).
Emerging trends in the demandfor rice and animal foodIncome growth, population increases, and changes in lifestyle are key determinants of food demand. Economic theorysays that, as per capita income increases, demand for staplefoods tends to decrease while demand for high-value prod-ucts, such as meat, eggs, milk, fruits, and vegetables, tendsto increase. This relationship is indicated by the incomeelasticity of demand, which shows the percentage increase(if positive) or decrease (if negative) in the demand for foodwith one percentage increase in per capita income. The in-come elasticity of demand for rice, other staple foods, andmeat products in some Asian countries is shown in Table 2.It can be noted from this table that, in the more developedcountries, such as Japan and South Korea, the respectiveincome elasticity for rice is negative. This indicates that, asper capita income in these countries rises, further per capita
Table 1. Effective demand of various commodities (kg per capita per year) in selected Asian countries, 2000.
Country Rice (milled) Wheat Maize Roots and tubers Vegetables Fruits Fish Meat
China 90.1 77.7 18.3 17.4 203.5 61.0 37.6 50.1Bangladesh 156.5 19.6 0.7 4.2 12.1 13.3 20.4 3.1India 75.7 57.2 9.1 5.9 62.5 62.4 7.4 4.5Indonesia 151.1 19.4 34.3 19.9 27.6 44.8 24.1 7.9Japan 59.4 43.4 12.0 7.6 111.6 61.6 78.7 43.8South Korea 89.1 53.1 18.9 4.1 232.2 91.5 52.8 46.1Malaysia 90.5 33.9 4.1 6.4 28.0 69.3 77.8 51.1Myanmar 207.9 3.8 4.8 1.5 63.6 42.9 30.2 9.3Philippines 101.8 28.4 4.0 9.6 61.6 148.2 33.8 26.8Thailand 109.1 10.2 6.4 4.9 37.1 120.4 36.5 24.3Vietnam 170.3 8.2 6.9 10.3 74.9 73.4 33.6 24.3
Source: FAO (2003).
Table 2. Income elasticity of demand parameters.
Country Wheat Rice Maize Other coarse Beef Pork Sheep/goats Poultry Eggs Milkgrains
India 0.20 0.19 –0.01 –0.03 0.63 0.58 0.58 0.96 0.55 0.58Pakistan 0.03 0.18 –0.10 –0.10 0.60 0.22 0.38 0.91 0.40 0.35Bangladesh 0.28 0.21 0.10 0.10 0.55 0.10 0.38 1.01 0.64 0.60Indonesia 0.26 0.18 0.25 –0.18 0.80 0.72 0.38 0.90 0.55 0.65Thailand 0.29 –0.02 –0.07 –0.10 0.77 0.75 0.26 0.73 0.40 0.54Malaysia 0.30 0.06 –0.15 –0.10 0.85 0.55 0.28 0.45 0.31 0.38Philippines 0.33 0.06 –0.15 –0.08 0.82 0.67 0.31 0.90 0.50 0.60Vietnam 0.35 0.20 0.25 0.05 0.82 0.60 0.36 0.89 0.53 0.75Myanmar 0.34 0.30 0.05 0.10 0.82 0.62 0.36 0.94 0.70 0.70China 0.23 0.10 –0.27 –0.07 0.85 0.48 0.46 0.84 0.31 0.70South Korea 0.22 –0.05 –0.20 –0.10 0.79 0.50 0.53 0.93 0.40 0.60Japan 0.25 –0.05 –0.18 –0.10 0.33 0.43 0.13 0.63 0.18 0.20
Source: Parameters in IMPACT (Rosegrant et al 1995, 1997, 2001).
5
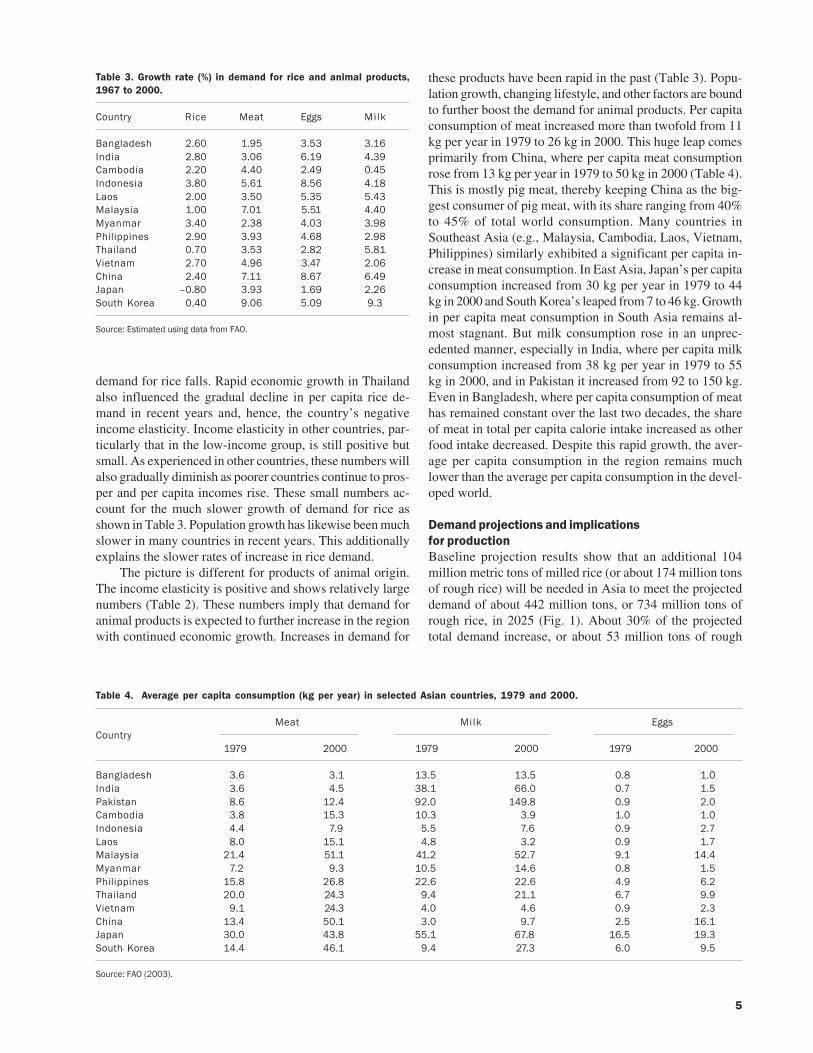
demand for rice falls. Rapid economic growth in Thailandalso influenced the gradual decline in per capita rice de-mand in recent years and, hence, the country’s negativeincome elasticity. Income elasticity in other countries, par-ticularly that in the low-income group, is still positive butsmall. As experienced in other countries, these numbers willalso gradually diminish as poorer countries continue to pros-per and per capita incomes rise. These small numbers ac-count for the much slower growth of demand for rice asshown in Table 3. Population growth has likewise been muchslower in many countries in recent years. This additionallyexplains the slower rates of increase in rice demand.
The picture is different for products of animal origin.The income elasticity is positive and shows relatively largenumbers (Table 2). These numbers imply that demand foranimal products is expected to further increase in the regionwith continued economic growth. Increases in demand for
these products have been rapid in the past (Table 3). Popu-lation growth, changing lifestyle, and other factors are boundto further boost the demand for animal products. Per capitaconsumption of meat increased more than twofold from 11kg per year in 1979 to 26 kg in 2000. This huge leap comesprimarily from China, where per capita meat consumptionrose from 13 kg per year in 1979 to 50 kg in 2000 (Table 4).This is mostly pig meat, thereby keeping China as the big-gest consumer of pig meat, with its share ranging from 40%to 45% of total world consumption. Many countries inSoutheast Asia (e.g., Malaysia, Cambodia, Laos, Vietnam,Philippines) similarly exhibited a significant per capita in-crease in meat consumption. In East Asia, Japan’s per capitaconsumption increased from 30 kg per year in 1979 to 44kg in 2000 and South Korea’s leaped from 7 to 46 kg. Growthin per capita meat consumption in South Asia remains al-most stagnant. But milk consumption rose in an unprec-edented manner, especially in India, where per capita milkconsumption increased from 38 kg per year in 1979 to 55kg in 2000, and in Pakistan it increased from 92 to 150 kg.Even in Bangladesh, where per capita consumption of meathas remained constant over the last two decades, the shareof meat in total per capita calorie intake increased as otherfood intake decreased. Despite this rapid growth, the aver-age per capita consumption in the region remains muchlower than the average per capita consumption in the devel-oped world.
Demand projections and implicationsfor productionBaseline projection results show that an additional 104million metric tons of milled rice (or about 174 million tonsof rough rice) will be needed in Asia to meet the projecteddemand of about 442 million tons, or 734 million tons ofrough rice, in 2025 (Fig. 1). About 30% of the projectedtotal demand increase, or about 53 million tons of rough
Table 3. Growth rate (%) in demand for rice and animal products,1967 to 2000.
Country Rice Meat Eggs Milk
Bangladesh 2.60 1.95 3.53 3.16India 2.80 3.06 6.19 4.39Cambodia 2.20 4.40 2.49 0.45Indonesia 3.80 5.61 8.56 4.18Laos 2.00 3.50 5.35 5.43Malaysia 1.00 7.01 5.51 4.40Myanmar 3.40 2.38 4.03 3.98Philippines 2.90 3.93 4.68 2.98Thailand 0.70 3.53 2.82 5.81Vietnam 2.70 4.96 3.47 2.06China 2.40 7.11 8.67 6.49Japan –0.80 3.93 1.69 2.26South Korea 0.40 9.06 5.09 9.3
Source: Estimated using data from FAO.
Table 4. Average per capita consumption (kg per year) in selected Asian countries, 1979 and 2000.
Meat Milk EggsCountry
1979 2000 1979 2000 1979 2000
Bangladesh 3.6 3.1 13.5 13.5 0.8 1.0India 3.6 4.5 38.1 66.0 0.7 1.5Pakistan 8.6 12.4 92.0 149.8 0.9 2.0Cambodia 3.8 15.3 10.3 3.9 1.0 1.0Indonesia 4.4 7.9 5.5 7.6 0.9 2.7Laos 8.0 15.1 4.8 3.2 0.9 1.7Malaysia 21.4 51.1 41.2 52.7 9.1 14.4Myanmar 7.2 9.3 10.5 14.6 0.8 1.5Philippines 15.8 26.8 22.6 22.6 4.9 6.2Thailand 20.0 24.3 9.4 21.1 6.7 9.9Vietnam 9.1 24.3 4.0 4.6 0.9 2.3China 13.4 50.1 3.0 9.7 2.5 16.1Japan 30.0 43.8 55.1 67.8 16.5 19.3South Korea 14.4 46.1 9.4 27.3 6.0 9.5
Source: FAO (2003).

6
rice will be accounted for by Southeast Asia, a large per-centage of which will be channeled to urban areas wherepopulation growth will be rapid. South Asia will need about95 million tons more to support the demand of its growingpopulation. Rice production in the region has to sustain anaverage growth rate of at least 1% per year to meet the pro-jected demand for rice in 2025. The annual growth rate inrice production from 1990 to 2000 was estimated at 1.6%(Table 5). This was mainly from growth in yield, which has
declined significantly from the 1.8% average growth rate in1967-80 and the 2.3% average growth rate in 1980-90. Thecontribution of area growth to total production is shown tohave increased in the last decade, but maintaining that levelof contribution will be difficult in the region because landis very scarce. Countries such as Myanmar, Cambodia, andLaos have potential for area growth, but much of this willdepend on the favorable development of the market policyenvironment. The 1% annual growth in rice production inthe future will most likely come from yield increases; thus,the continued critical role of technology development.
Meat consumption in Asia is projected to increase bymore than twofold from 77.2 million tons in 1997 to 164.4million tons in 2025, whereas milk consumption will risefrom 128.6 million tons to 284.8 million tons (Fig. 1). Thebulk of this demand will come from China, where the growthrate of meat demand is projected to be around 2.8%, with3.3% for milk. South Asia’s meat consumption is still pro-jected to be low, primarily because of the assumption thatthis region will continue to be vegetarian. Its milk con-sumption, however, is expected to almost triple in the next20 to 25 years. It is in Southeast Asia where the most rapidgrowth in meat demand will take place, at 3.1% per year,thereby raising the projected total consumption of meat inthe subregion from 8.9 million tons in 1997 to 20.9 milliontons in 2025.
The past growth performance of different livestock prod-ucts from 1979 to 2000 is shown in Table 6. The average
Fig. 1. Projected demand of milled rice in Asia, 1997 and 2025.Source: Rosegrant et al (1995), Sombilla et al (2001).
Table 5. Trends (in %) in rice production growth in Asia.
1967-80 1981-90 1990-2000Country
Area Yield Production Area Yield Production Area Yield Production
Cambodia –7.55 –3.19 –10.74 2.12 2.64 4.76 1.63 4.42 6.04Indonesia 1.05 3.54 4.60 1.61 2.29 3.90 1.21 “0.01 1.20Laos –1.43 1.48 0.05 –2.65 5.01 2.36 1.45 2.86 4.30Malaysia 0.49 2.17 2.67 –0.51 –0.72 –1.23 0.11 0.40 0.51Myanmar 0.15 3.10 3.24 –0.18 –0.03 –0.20 2.35 1.16 3.51Philippines 0.94 3.25 4.18 0.11 2.28 2.39 1.76 0.09 1.85Thailand 2.64 -0.06 2.58 0.24 0.73 0.96 1.52 1.23 2.75Vietnam 1.28 0.52 1.79 0.49 3.86 4.35 2.34 3.03 5.37Southeast Asia 0.87 2.08 2.95 0.60 2.02 2.62 1.69 1.08 2.76
Bangladesh 0.31 1.32 1.63 0.11 2.42 2.53 0.35 2.19 2.54Bhutan 2.06 0.00 2.06 –0.45 -2.58 –3.03 1.88 0.13 2.02India 0.75 1.41 2.16 0.53 3.18 3.71 0.59 1.38 1.98Nepal 0.84 -0.28 0.56 1.42 2.81 4.23 1.19 1.22 2.41Pakistan 2.64 1.91 4.55 0.72 –0.96 –0.24 1.79 2.98 4.77Sri Lanka 2.89 0.21 3.10 –0.75 1.42 0.67 0.20 0.73 0.94South Asia 0.76 1.37 2.13 0.46 2.83 3.29 0.61 1.57 2.17
China 1.01 2.20 3.21 –0.40 2.64 2.25 –0.55 1.27 0.73Japan –2.09 0.22 –1.87 –1.21 1.52 0.30 –1.91 1.15 –0.76North Korea 2.47 0.71 3.18 0.12 2.11 2.23 –0.93 “9.15 –10.08South Korea 0.25 3.16 3.42 0.35 2.12 2.48 –1.59 1.22 –0.37East Asia 0.77 1.88 2.65 –0.41 2.53 2.12 –0.66 1.12 0.46
Asia 0.79 1.77 2.56 0.25 2.33 2.58 0.59 1.01 1.60
Source: Estimated using FAO data.
���
���
���
���� �� ����� �� ���
����� ����
������
����
����
����
7
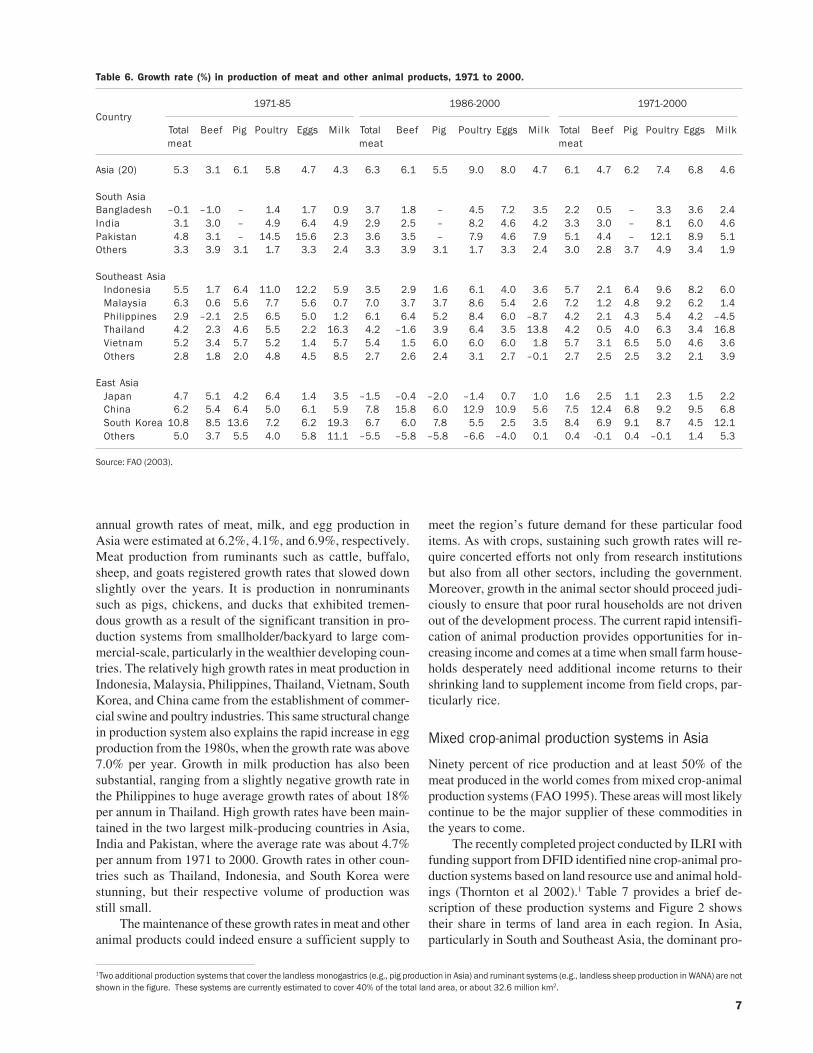
annual growth rates of meat, milk, and egg production inAsia were estimated at 6.2%, 4.1%, and 6.9%, respectively.Meat production from ruminants such as cattle, buffalo,sheep, and goats registered growth rates that slowed downslightly over the years. It is production in nonruminantssuch as pigs, chickens, and ducks that exhibited tremen-dous growth as a result of the significant transition in pro-duction systems from smallholder/backyard to large com-mercial-scale, particularly in the wealthier developing coun-tries. The relatively high growth rates in meat production inIndonesia, Malaysia, Philippines, Thailand, Vietnam, SouthKorea, and China came from the establishment of commer-cial swine and poultry industries. This same structural changein production system also explains the rapid increase in eggproduction from the 1980s, when the growth rate was above7.0% per year. Growth in milk production has also beensubstantial, ranging from a slightly negative growth rate inthe Philippines to huge average growth rates of about 18%per annum in Thailand. High growth rates have been main-tained in the two largest milk-producing countries in Asia,India and Pakistan, where the average rate was about 4.7%per annum from 1971 to 2000. Growth rates in other coun-tries such as Thailand, Indonesia, and South Korea werestunning, but their respective volume of production wasstill small.
The maintenance of these growth rates in meat and otheranimal products could indeed ensure a sufficient supply to
meet the region’s future demand for these particular fooditems. As with crops, sustaining such growth rates will re-quire concerted efforts not only from research institutionsbut also from all other sectors, including the government.Moreover, growth in the animal sector should proceed judi-ciously to ensure that poor rural households are not drivenout of the development process. The current rapid intensifi-cation of animal production provides opportunities for in-creasing income and comes at a time when small farm house-holds desperately need additional income returns to theirshrinking land to supplement income from field crops, par-ticularly rice.
Mixed crop-animal production systems in Asia
Ninety percent of rice production and at least 50% of themeat produced in the world comes from mixed crop-animalproduction systems (FAO 1995). These areas will most likelycontinue to be the major supplier of these commodities inthe years to come.
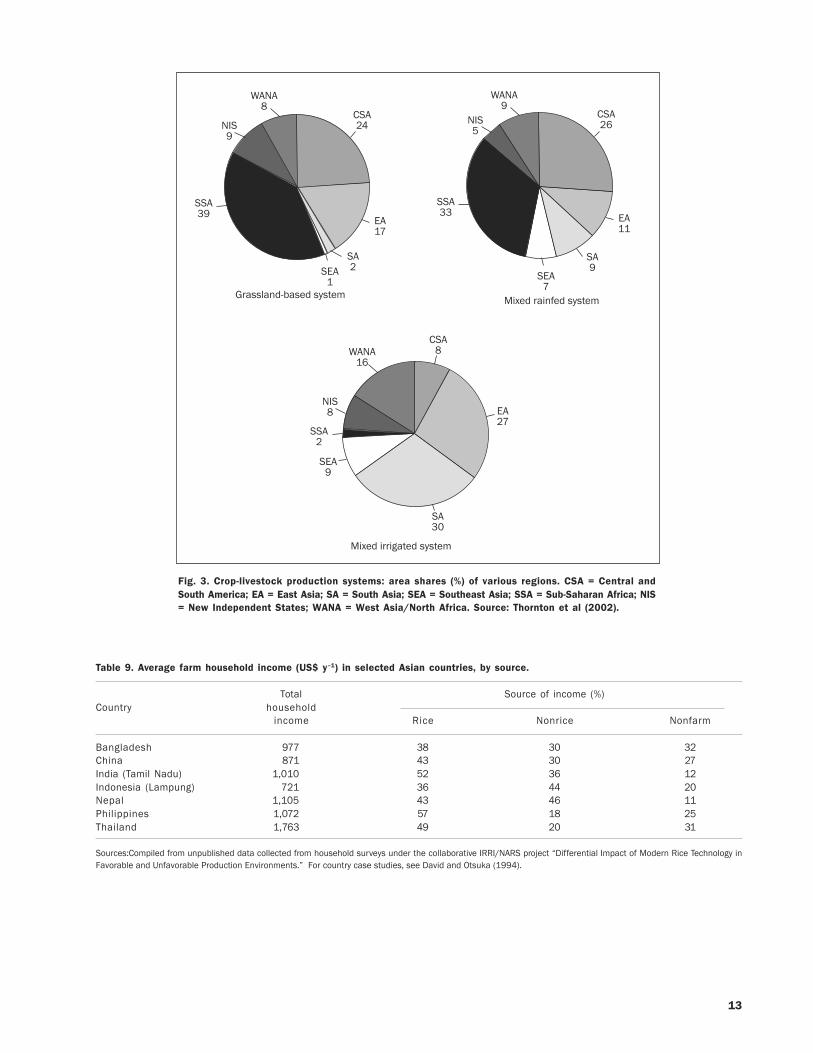
The recently completed project conducted by ILRI withfunding support from DFID identified nine crop-animal pro-duction systems based on land resource use and animal hold-ings (Thornton et al 2002).1 Table 7 provides a brief de-scription of these production systems and Figure 2 showstheir share in terms of land area in each region. In Asia,particularly in South and Southeast Asia, the dominant pro-
Table 6. Growth rate (%) in production of meat and other animal products, 1971 to 2000.
1971-85 1986-2000 1971-2000Country
Total Beef Pig Poultry Eggs Milk Total Beef Pig Poultry Eggs Milk Total Beef Pig Poultry Eggs Milkmeat meat meat
Asia (20) 5.3 3.1 6.1 5.8 4.7 4.3 6.3 6.1 5.5 9.0 8.0 4.7 6.1 4.7 6.2 7.4 6.8 4.6
South Asia Bangladesh –0.1 –1.0 – 1.4 1.7 0.9 3.7 1.8 – 4.5 7.2 3.5 2.2 0.5 – 3.3 3.6 2.4India 3.1 3.0 – 4.9 6.4 4.9 2.9 2.5 – 8.2 4.6 4.2 3.3 3.0 – 8.1 6.0 4.6Pakistan 4.8 3.1 – 14.5 15.6 2.3 3.6 3.5 – 7.9 4.6 7.9 5.1 4.4 – 12.1 8.9 5.1Others 3.3 3.9 3.1 1.7 3.3 2.4 3.3 3.9 3.1 1.7 3.3 2.4 3.0 2.8 3.7 4.9 3.4 1.9
Southeast AsiaIndonesia 5.5 1.7 6.4 11.0 12.2 5.9 3.5 2.9 1.6 6.1 4.0 3.6 5.7 2.1 6.4 9.6 8.2 6.0Malaysia 6.3 0.6 5.6 7.7 5.6 0.7 7.0 3.7 3.7 8.6 5.4 2.6 7.2 1.2 4.8 9.2 6.2 1.4Philippines 2.9 –2.1 2.5 6.5 5.0 1.2 6.1 6.4 5.2 8.4 6.0 –8.7 4.2 2.1 4.3 5.4 4.2 –4.5Thailand 4.2 2.3 4.6 5.5 2.2 16.3 4.2 –1.6 3.9 6.4 3.5 13.8 4.2 0.5 4.0 6.3 3.4 16.8Vietnam 5.2 3.4 5.7 5.2 1.4 5.7 5.4 1.5 6.0 6.0 6.0 1.8 5.7 3.1 6.5 5.0 4.6 3.6Others 2.8 1.8 2.0 4.8 4.5 8.5 2.7 2.6 2.4 3.1 2.7 –0.1 2.7 2.5 2.5 3.2 2.1 3.9
East AsiaJapan 4.7 5.1 4.2 6.4 1.4 3.5 –1.5 –0.4 –2.0 –1.4 0.7 1.0 1.6 2.5 1.1 2.3 1.5 2.2China 6.2 5.4 6.4 5.0 6.1 5.9 7.8 15.8 6.0 12.9 10.9 5.6 7.5 12.4 6.8 9.2 9.5 6.8South Korea 10.8 8.5 13.6 7.2 6.2 19.3 6.7 6.0 7.8 5.5 2.5 3.5 8.4 6.9 9.1 8.7 4.5 12.1Others 5.0 3.7 5.5 4.0 5.8 11.1 –5.5 –5.8 –5.8 –6.6 –4.0 0.1 0.4 -0.1 0.4 –0.1 1.4 5.3
Source: FAO (2003).
1Two additional production systems that cover the landless monogastrics (e.g., pig production in Asia) and ruminant systems (e.g., landless sheep production in WANA) are notshown in the figure. These systems are currently estimated to cover 40% of the total land area, or about 32.6 million km2.

8
duction systems are those involving mixed crop-animalsystems on rainfed and irrigated farms. Most of these farmsare predominantly rice-based, with subsidiary food cropssuch as maize, root crops, pulses, vegetables, etc. (Table 8).In East Asia, a significant portion of the production systemis based on grassland and is mostly accounted for by China,where, in the northeast of the country, the communal graz-ing area of Chinese Merino wool sheep abounds, and, in thesoutheast, significant cattle raising is found.
The mixed rainfed and irrigated systems are predomi-nantly followed by smallholder farms, where production ishighly integrated and diversified and where outputs arepartly for sale and partly for own consumption, whereasinputs are partly purchased and partly provided from ownresources. It is a long-time tradition that farm animals areused for production and draft power. These include cattleand buffalo, dairy cows, pigs, poultry, goats, and sheep.They are fed by-products and crop residues from the farm
and food refuse from the household. They are commonsources of protein (meat, eggs, and milk) for farming house-holds. The bigger ruminants are used for power in farm ac-tivities. It is estimated that 250 million working animalsprovide draft power for mixed farms that cover about 28%of the world’s arable land (FAO 1995).2 They are likely tocontinue to be used as draft animals for some time to comein South Asia (Pingali et al 1987). In East and SoutheastAsia, where mechanization is occurring rapidly, animals arenow grown more for their food value. The rapid rate ofmechanization has made possible the shift from large andsmall ruminants to animals such as pigs and chickens.
Figure 3 further indicates that it is also in these systemswhere most of the poor people live. Out of the 6.1 billionpeople in the world, about 4.7 billion are supported by theseproduction systems, including the landless category thatdoes crop farming and animal raising on rented land or inpublic areas (Fig. 4). And out of these 4.7 billion people,
2The poverty mapping project estimates that mixed cropping systems occupy 30% of global land area (Thornton et al 2002).
Table 7. Crop-livestock production systems.
Type Characteristics Crop-animal interactions
Grassland-based (LG)In temperate and tropical Main resource is the range lands, Very low to low, increasing in areas where crop
highlands (LGT) pastures, and forages. Less than cultivation is possible10 livestock units (LUs)a
In humid/subhumid subtropics (LGH)·In arid/semiarid tropics and
subtropics (LGA)
Mixed farming systems (M)· Relatively low land to cattle head ratio.Crop production mostly in rainfed areas.
Mixed rainfed temperate/tropical More than 10% of dry matter fed tohighlands (MRT)· animals comes from crop by-products
and stubbles.Mixed rainfed humid/subhumid
tropics/subtropics (MRH)·Mixed rainfed arid/semiarid
tropics/subtropics (LGA)·Mixed irrigated temperate/tropical Crop production mainly on Varies, generally weak to high dependency
highlands (MIT)· irrigated lands. More than 10% on intensity of crop cultivation andof dry matter fed to animals integration with market.comes from crop by-productsand stubbles.
Mixed irrigated humid/subhumidtropics and subtropics (MIH)·
Mixed irrigated arid/semiaridsubtropics (MIA)
aA measure that brings together the distribution of cattle, buffalo, sheep, goats, horses, donkeys, mules, and pigs, using special values of Jahnke (1982).Source: Thornton et al (2002).

9
26%, or 1.2 billion, are categorized as poor who live on lessthan US$1 a day.3 Seventy-one percent, or about 885 mil-lion, of these people are located in the Asian region, most ofthem in mixed irrigated and rainfed production systems.Mixed crop-animal farming enables poor rural householdsto maximize the use of their limited resources to increasetheir income, minimize their production risks, increase theirfood security, and improve the sustainability of farm enter-prises.
Rice cultivationThe importance of rice among rural households pertains toits being the major staple food and to its role as the majorsource of livelihood. Several in-depth village studies con-ducted by the International Rice Research Institute in col-laboration with policy research institutions in national sys-tems (country studies in David and Otsuka 1993) found thatfarm household income is at an average level of about $1,000year–1, of which 36–57% comes from rice cultivation (Table9). Working on others’ rice farms is the main source of em-ployment and livelihood for the landless and marginal farm-ers that constitute one-third to one-half of rural households.
Fig. 2. Projected increase in demand for meat (A) and milk (B),1997 and 2025. Source: Rosegrant et al (1995), Sombilla et al(2001).
��� �� ����� �� ��� ���
�� ����
������
���
���
���
���
���
��
�
���
���
���
���
���
��
�
����
����
�
�
�
�
Rice farm holdings are small and fragmented. The aver-age farm in most countries has no more than 1.5 ha. Thisarea is usually subdivided further into smaller parcels. Farmsspecializing in a single crop are rare. A typical farm house-hold grows rice along with many other subsistence crops inrice-based farming systems. And, as mentioned earlier, ani-mal raising is almost always a major component of this farm-ing system. Most of the rice produced is consumed by house-hold members. A marketable surplus usually occurs only onirrigated farms of 2 ha or more, where at least two rice cropscan be grown (Hossain 1998). Rice farms in upland andrainfed lowland areas are mostly subsistence-oriented.
Livestock and the poorLivestock are valuable among poor households primarilybecause they are a quick source of easy cash income, espe-cially for those with limited access to land and capital. Table10 shows some estimates of household income coming fromlivestock for households belonging to different incomestrata, farm holdings, and dietary adequacy. In Pakistan inthe mid-1980s, Adams and He (1995) found that about 25%of the poorest rural households’ income was derived fromlivestock compared with only 9% among the richer incomegroup. A similar picture appears in a case study conductedin the Philippines by Bouis (1991) for about the same timeperiod.
Foods that are derived from animal sources have majorimportance in optimizing human performance in chroni-cally mildly to moderately malnourished populations (Diaz-Briquiets et al 1992). Protein and micronutrient deficien-cies remain widespread in developing countries becausepeople subsist on diets that are almost entirely made up ofstarchy staples. The addition of milk and meat providesprotein, calcium, vitamins, and other nutrients that wouldmake a starchy meal more balanced. This explains the ap-parent importance of livestock among households with agreater incidence of malnourishment compared with house-holds that are well nourished (Table 10).
Small animals that graze on common-property pasturesor are fed household waste are an important activity forwomen. This is also a crucial activity as income earned bywomen is usually channeled into the family’s basic mainte-nance and nutrition. In India, dairy work is traditionally awomen’s domain (Rangnekar 1992) as swine raising is inthe Philippines and Thailand. Animals provide the micro-nutrient diversity needed primarily for child health and de-velopment.
Livestock income helpsdecrease inequalityToo little attention has been given to livestock as a meansof improving rural equity and overcoming poverty. Ruralincome collected from sample households in Indonesia andthe Philippines is analyzed to determine the contribution of
3There are several poverty indicators, but this is the widely cited indicator, hence its adoption here. The data indicate the number of people whocannot purchase a roughly similar basket of commodities.

10
Tabl
e 8.
Im
port
ant
crop
s an
d cr
oppi
ng p
atte
rns
in f
arm
ing
syst
ems
in A
sia.
Cou
ntry
Impo
rtan
t cr
ops
Cro
ppin
g pa
tter
nsD
omin
ant
rum
inan
tN
onru
min
ant
Sou
rces
Cam
bodi
aR
ice,
mai
ze,
root
s/tu
bers
,R
ice
mon
ocro
p (lo
wla
nds)
Cat
tlePi
gs,
chic
kens
ADB
(19
89)
Nes
bitt
puls
es,
oils
eeds
, to
bacc
o,R
ice
mon
ocro
p (u
plan
ds)
(per
sona
lsu
garc
ane,
jut
eR
ice
fallo
w (
upla
nds)
com
mun
icat
ion)
Ric
e-m
ungb
ean
or s
oybe
an (
upla
nds)
Indo
nesi
aR
ice,
mai
ze,
cass
ava,
sw
eet
Ric
e/m
aize
int
ercr
op (
Java
, Su
mat
era,
Sul
awes
i).C
attle
, bu
ffal
o, s
heep
,C
hick
ens,
pig
sIm
tiaz
et a
l (1
978)
pota
to,
soyb
ean,
pea
nut
Ric
e/so
ybea
n re
lay
crop
(Ja
va,
low
land
s)go
ats
FAO
(19
82)
Ric
e-fa
llow
-ric
e (u
plan
ds i
n sh
iftin
g cu
ltiva
tion)
ADB
(19
89)
Mai
ze-p
eanu
ts/s
oybe
an-m
aize
(M
adur
a, l
owla
nds)
Anw
arha
n (1
99
5)
Cas
sava
/mai
ze/r
ice/
pean
ut i
nter
crop
(Ja
va,
Dev
endr
a (1
99
5)
Kal
iman
tan,
Sum
ater
a in
shi
ftin
gcu
ltiva
tion)
(up
land
s)
Laos
Ric
e, m
aize
, ro
ot c
rops
,R
ice-
fallo
w-r
ice
(low
land
s; u
plan
ds i
n sh
iftin
g cu
ltiva
tion)
Cat
tle,
buff
alo
Pigs
, ch
icke
nsAD
B (
1989
)oi
lsee
ds,
puls
esR
ice-
mai
ze/c
assa
va/s
wee
t po
tato
-ric
e (u
plan
ds i
nB
ouah
om (
19
95
)sh
iftin
g cu
ltiva
tion)
Dev
endr
a (1
99
5)
Teak
/ric
e in
terc
rop
(upl
ands
)R
oder
et
al (
1995
)R
ice/
mai
ze i
nter
crop
(up
land
s)R
ice
mon
ocro
p (lo
wla
nds)
Mal
aysi
aR
ice,
mai
ze,
cass
ava,
pea
nut,
Ric
e m
onoc
rop
(upl
ands
and
low
land
s)C
attle
, bu
ffal
o,C
hick
ens,
pig
sFA
O (
1982
)ru
bber
, oi
l pa
lm,
caca
o,O
il pa
lm/r
ubbe
r m
onoc
rops
(lo
wla
nds)
goat
s, s
heep
ADB
(19
89)
coff
ee,
pepp
er,
toba
cco
Mya
nm
arR
ice,
mai
ze,
oils
eeds
, pu
lses
,R
ice
mon
ocro
p (lo
wla
nds)
Cat
tle,
buff
alo
Pigs
, ch
icke
nsSh
im e
t al
(19
81)
cott
on,
vege
tabl
es,
jute
Ric
e-pe
anut
/soy
bean
/sor
ghum
(up
land
s)FA
O (
1982
)S
esam
e-ri
ce (
low
land
s)AD
B (
1989
)R
ice-
pean
ut/m
ungb
ean/
chili
(lo
wla
nds)
Mai
ze/p
ea/b
ean/
pean
ut i
nter
crop
Ric
e-fa
llow
(up
land
s)
Phi
lippi
nes
Ric
e, m
aize
, ca
ssav
a, p
ulse
s,R
ice-
fallo
w-r
ice
Buf
falo
, ca
ttle
Pigs
, ch
icke
nsG
omez
(19
80)
oils
eeds
, co
conu
tR
ice-
mai
ze-r
ice
(low
land
s)FA
O (
1982
)R
ice-
mai
ze/c
assa
va-r
ice
ADB
(19
89)
Ric
e-m
ungb
ean-
fora
ge l
egum
es-r
ice
(upl
ands
)Fa
ylon
and
Alo
(1
99
5)
Mai
ze m
onoc
rop
(upl
ands
)D
even
dra
(19
95
)M
aize
/leu
caen
a in
terc
rop
Coc
onut
mon
ocro
pFr
uit
tree
mon
ocro
pR
ice-
mai
ze (
upla
nds)
Ric
e-m
aize
(lo
wla
nds)
Sug
arca
ne m
onoc
rop
(low
land
s)C
ocon
ut/c
offe
e/pi
neap
ple
(low
land
s)Po
tato
/cab
bage
/ric
e/le
gum
es,
inte
rcro
p (u
plan
ds)
cont
inue
d on
nex
t pag
e...
11
Thai
land
Ric
e, m
aize
, so
rghu
m,
cass
ava,
Ric
e m
onoc
rop
(nor
thea
st u
plan
ds a
nd l
owla
nds)
Buf
falo
, ca
ttle
Pigs
, ch
icke
nsPa
tano
thai
and
mun
gbea
n, s
oybe
an,
pean
ut,
Ric
e-fa
llow
-ric
e (lo
wla
nds)
Cha
roen
wat
ana
(197
8)
kena
f, c
otto
n, s
ugar
cane
Ric
e-m
aize
/veg
etab
les-
rice
(up
land
s)FA
O (
1982
)M
ungb
ean-
rice
-mun
gbea
nAD
B (
1989
)M
aize
-mun
gbea
n/so
ybea
n-m
aize
(ce
ntra
l pl
ains
) (lo
wla
nds)
Dev
endr
a (1
99
5)
Cas
sava
mon
ocro
p (lo
wla
nds)
Ken
af m
onoc
rop
(upl
ands
)
Viet
nam
Ric
e, m
aize
, ro
ots/
tube
rs,
puls
es,R
ice-
fallo
w-r
ice
(low
land
s)C
attle
, bu
ffal
oPi
gs,
chic
kens
ADB
(19
89)
oils
eeds
, su
garc
ane,
jut
eR
ice
cass
ava/
mai
ze/s
oybe
an/s
ugar
cane
-ric
eXu
an e
t al
(19
95)
Ric
e-pe
anut
(lo
wla
nds)
Ric
e-fa
llow
(up
land
s)R
ice
mon
ocro
p (u
plan
ds)
Ban
glad
esh
Ric
e, w
heat
, pu
lses
, oi
lsee
ds,
Rai
nfed
:C
attle
Chi
cken
sH
oque
(19
84)
jute
, su
garc
ane
Ric
e-w
heat
ADB
(19
89)
Ric
e-ri
ce-b
arle
y +
chi
ckpe
aAn
on (
1995
)U
plan
d ri
ce-b
arle
yR
eyno
lds
et a
l (1
995)
Upl
and
rice
-bar
ley
+ c
hick
pea
+ l
inse
edIr
rigat
ed:
Ric
e-ri
ceR
ice-
rice
-whe
atJu
te-m
usta
rdS
ugar
cane
-whe
at
Indi
aR
ice,
whe
at,
sorg
hum
, m
aize
,R
ainf
ed:
Cat
tle,
buff
alo,
Low
pop
ulat
ion
Hoq
ue (
1984
)pe
arl
mill
et,
puls
es,
oils
eeds
,R
ice-
whe
atsh
eep,
goa
tsAD
B (
1989
)co
tton
, su
garc
ane
Ric
e-ch
ickp
eaAn
on (
1995
)R
ice-
lent
ilR
eyno
lds
et a
l (1
995)
Ric
e-m
usta
rdIr
rigat
ed:
Ric
e-w
heat
Sug
arca
neR
ice-
rape
seed
/mus
tard
Tabl
e 8
cont
inue
d.
Cou
ntry
Impo
rtan
t cr
ops
Cro
ppin
g pa
tter
nsD
omin
ant
rum
inan
tN
onru
min
ant
Sou
rces
cont
inue
d on
nex
t pag
e...

12
Nep
alR
ice,
mai
ze,
whe
at,
finge
rR
ainf
ed:
Cat
tle,
buff
alo,
Chi
cken
sH
oque
(19
84)
mill
et,
oils
eeds
, po
tato
Ric
e-w
heat
shee
p, g
oats
ADB
(19
89)
Ric
e-fi
nger
mill
etAn
on (
1995
)R
ice-
whe
at-f
allo
wR
eyno
lds
et a
l (1
995)
Mai
ze/f
inge
r m
illet
-whe
atIr
rigat
ed:
Ric
e-ri
ceR
ice-
pota
toR
ice-
rice
-whe
atM
aize
-ric
e-w
heat
Pak
ista
nW
heat
, ri
ce,
mai
ze,
sorg
hum
,R
ainf
ed:
Shee
p, g
oats
Chi
cken
sH
oque
(19
84)
mill
et,
barl
ey,
chic
kpea
,R
ice-
pota
toAD
B (
1989
)ra
pese
ed,
cott
on,
suga
rcan
eSo
rghu
m-w
heat
+ m
usta
rdAn
on (
1995
)G
roun
dnut
-whe
atR
eyno
lds
et a
l (1
995)
Mai
ze +
bea
ns +
pot
ato
Irrig
ated
:R
ice-
whe
atM
aize
-whe
atC
otto
n-w
heat
Ric
e-ch
ickp
ea
Sri
Lan
kaR
ice,
mai
ze,
puls
es,
oils
eeds
,R
ainf
ed:
Cat
tle,
buff
alo
Chi
cken
sH
oque
(19
84)
cass
ava,
chi
lliR
ice-
onio
nsAD
B (
1989
)R
ice-
rice
Anon
(19
95)
Mai
ze-o
nion
sR
eyno
lds
et a
l (1
995)
Ric
e-po
tato
Irrig
ated
:R
ice-
rice
Sour
ce: T
able
6 in
Dev
endr
a et
al (
1997
and
200
0).
Tabl
e 8
cont
inue
d.
Cou
ntry
Impo
rtan
t cr
ops
Cro
ppin
g pa
tter
nsD
omin
ant
rum
inan
tN
onru
min
ant
Sou
rces
13
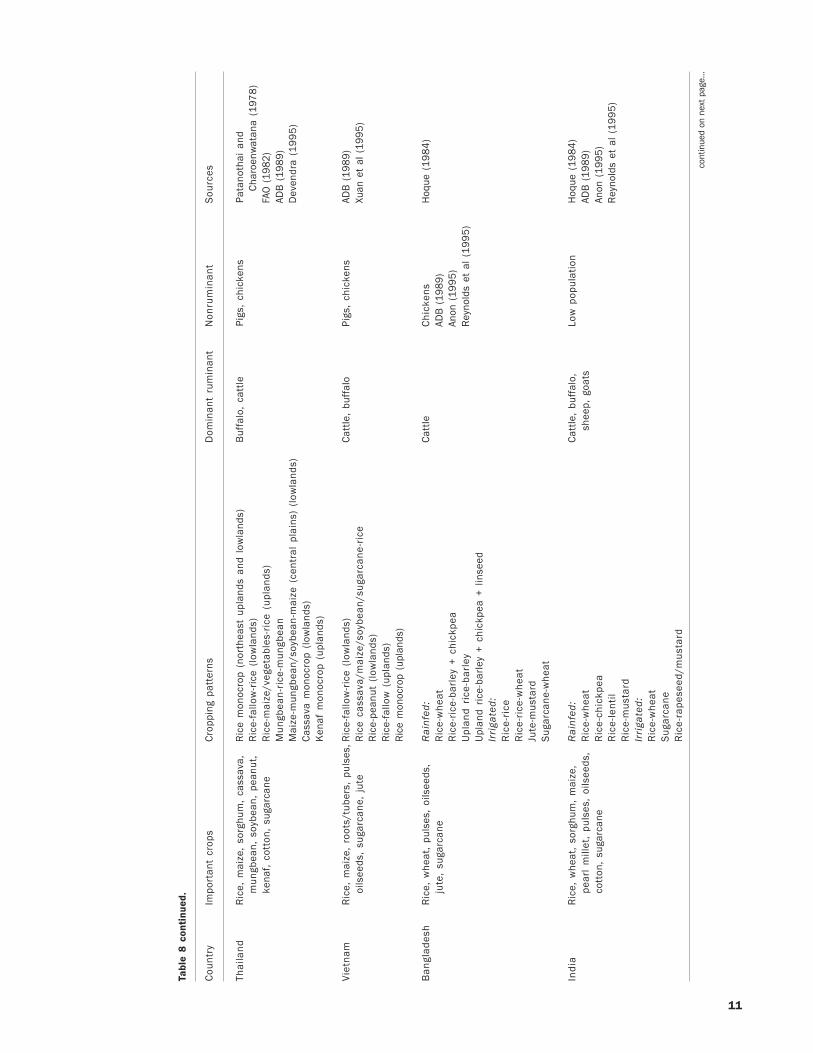
Table 9. Average farm household income (US$ y–1) in selected Asian countries, by source.
Total Source of income (%)Country household
income Rice Nonrice Nonfarm
Bangladesh 977 38 30 32China 871 43 30 27India (Tamil Nadu) 1,010 52 36 12Indonesia (Lampung) 721 36 44 20Nepal 1,105 43 46 11Philippines 1,072 57 18 25Thailand 1,763 49 20 31
Sources:Compiled from unpublished data collected from household surveys under the collaborative IRRI/NARS project “Differential Impact of Modern Rice Technology inFavorable and Unfavorable Production Environments.” For country case studies, see David and Otsuka (1994).
�����
� �
���
���
��
����
!���
"#��$�%&'��%��(� �)
���
��
� �
������
!��
����
���
*�+�%��##�� �%��(� �)
�����
� �
���
���
��
����
!���
*�+�%�#��,�%��(� �)
Fig. 3. Crop-livestock production systems: area shares (%) of various regions. CSA = Central andSouth America; EA = East Asia; SA = South Asia; SEA = Southeast Asia; SSA = Sub-Saharan Africa; NIS= New Independent States; WANA = West Asia/North Africa. Source: Thornton et al (2002).

14
Table 10. Livestock income in total household income.
Percent of Period/sizehousehold of sample Source
Country Wealth/poverty indicator Stratum incomefrom
livestock
Pakistan Household income stratum Lowest 1/5 25 1986-89, 727 Adams and He (1995)Highest 1/5 9 rural households
Pakistan Household income stratum Lowest 1/5 22 1986-87 to Alderman and Garcia Highest 1/5 6 1988-89 (1993)
Philippines Household income stratum Lowest 1/5 23 1984-85, 500 Bouis (1991)Highest 1/5 10 rural households
India (Andhra Landholdings Lowest 1/5 ofPradesh and land distribution 5 1997, 699Maharashtra) Highest 1/5 of households
land distribution 6India (Andhra Landholdings Landless 7 1975-78, 240
Pradesh and Largest landholders 15 householdsMaharashtra)Pakistan Landholdings Landless 14 1986-87, 727 Adams and He (1995)
Largest landlesslandholders 11
Pakistan Dietary adequacy Malnourished 16 1986-87, 1,082 Von Braun and Not malnourished 14 rural households Pandya Lorch (1991)
Philippines Dietary adequacy Malnourished 10 1983-84, 792 Von Braun and Not malnourished 9 rural households Pandya Lorch (1991)
Sri Lanka Dietary adequacy Malnourished 4 1984, 480 Von Braun and Not malnourished 1 rural households Pandya Lorch (1991)
������-��#��'�� �����)�$$�����, ���.��#�$�/�0�%�� #�'� ����'(.#�%�1 �����(� �)�������,�$$�-�2
3 ��#�4$�%$���5
���
"#��$�%&'��%�(� �)���
*�+�%�##�� �%
����
*�+�%#��,�%���� 3 ��#�
4$�%$���5��
"#��$�%&'��%�(� �)���
*�+�%�##�� �%
����*�+�%#��,�%����
�����6��'�$$����.��#�.��.$����� ��-�#$%�#��%�� #�'� �%���,�$$�-�2
Fig. 4. Where are the poor? Distribution of the poor who live on US$1 a day by production system. Source: Thornton et al(2002).

15
various income sources, including livestock, to overall in-come inequality. Results from two survey periods are ana-lyzed for each country: for the Philippines, 1992, with atotal sample of 772, and 1997, with a total sample of 915;for Indonesia, 1995, with a total sample of 1,158, and 1999,with a total sample of 1,591.4
The changes in the structure of rural household incomecan be gleaned from Table 11. The results show that thenumber of rural households engaged in agriculture as wellas the relative share of income from this sector increasedover the survey periods. This is contrary to past trends, inwhich the contribution of the agricultural sector was sup-posed to diminish over the years as the country prosperedeconomically. It should be noted that the more recent sur-veys were conducted during those periods when the finan-cial crisis affected much of Asia. The data seem to indicate,therefore, the tendency of people to go back to agriculturein times of economic slowdown. The data further indicatethat they return to agriculture to do more of other nonricefarm activities as the percentage of households that didnonrice farming increased in both countries, and quite sig-nificantly in Indonesia. The changes in the share of incomefrom other nonrice crops followed the same trend. The shareof income from rice cultivation remained unchanged in thePhilippines, whereas it declined in Indonesia.
The percentage of households involved in livestockactivities in the Philippines is relatively large at more than60% but the income share is small and remained almostunchanged over the survey periods. In Indonesia, ruralhouseholds that reported doing livestock activities com-prised only a quarter of the total sample households in 1995and this decreased to 17% in 1999. The share of livestockincome in total rural household income also decreased from
17% in 1995 to a mere 2% in 1999. Table 12 shows the Ginicoefficient computed from the income data. The values arealmost the same over the survey periods, which indicatesthat income inequality barely changed.5 Values are above0.5 except for the Philippines in 1997, when the Gini coef-ficient estimate was 0.49. Table 12 also shows two indicesthat further characterize the Gini coefficient. One is the rela-tive concentration coefficient, which indicates whether asource of income increases or decreases inequality. Theother is the factor inequality weight, which indicates themagnitude of the contribution of a particular income sourceto overall income inequality. The ith source of income issaid to increase (decrease) inequality if its concentrationcoefficient is greater (less) than unity. On the basis of thismeasure, all nonagricultural sources of income (aggregatedby major sectors) in both Indonesia and the Philippines areshown to have increased overall income inequality in thesample rural households. This means that, all things beingequal, additional increments of nonagricultural transfers willtend to increase overall income inequality. Income fromagriculture helps to decrease income inequality. The rela-tive impact, however, varies with the different incomesources. Income from game activities that include fishingand hunting in Indonesia increases income inequality. Thisis also the case for income from rice in the 1997 survey forthe Philippines as the estimated parameter is slightly above1. For both countries in both survey periods, income fromlivestock is shown to decrease income inequality rather thanincome from crops, particularly rice, except in 1995 for Indo-nesia, when the relative concentration coefficient is 0.75compared with the 0.48 estimated for crop-based income.The factor inequality weight, on the other hand, indicatesthe relative contribution of the various income sources to
Table 11. Changes in the structure of income.
Philippines Indonesia
Activity 1992 1997 1995 1999
% of Share of % of Share of % of Share of % of Share ofhousehold total household total household total household total
earning household earning household earning household earning householdincome from income income from income income from income income from incomethe source (%) the source (%) the source (%) the source (%)
Agriculture 94.8 35 96.0 40 68.0 33 91.5 55 Rice 45.1 16 45.2 16 49.4 18 37.2 11 Nonrice 84.2 13 87.7 19 – – 88.3 38 Fish/hunting – – – – 4.1 2 1.8 5 Livestock 64.8 6 61.9 5 26.8 13 17.2 2Nonagricultural 79.7 65 87.1 60 63.0 67 81.7 45 Remittances 40.9 21 44.8 17 31.3 18 53.3 9
Source: Household survey data from respective countries, collected by IRRI.
4 The surveys involved total household enumeration at the sites covered. The increase in sample respondents indicates the entrance of additional households at the sites.5 Results of the estimates should not be interpreted as implying the income inequality situation in the countries covered. The study is based on a nonrepresentative sampleof rural households.

16
overall income inequality. And the estimates indicate thatincome from crop-based activities has contributed muchmore to overall income inequality than either fishing/hunt-ing or livestock. One major reason for these results is thatcrop-based farming is very much related to land ownership,which is far more unevenly distributed than income, whilefishing, hunting, and livestock raising are not linked withland ownership. Earlier studies show an inverse relation-ship between farm size and livestock: small farms consis-tently have more animals per unit of land than large farms(Jabbar and Green 1983).
The contribution of income from agriculture that cov-ers primarily crop income, including rice, as well as incomefrom agricultural labor increased over the two-survey pe-riod in both countries. The contribution of livestock to to-tal income decreased substantially in Indonesia and so didthe contribution of other nonfarm activities except thosecoming from trade. The trend was similar in the Philippines,although the decline was milder. These results indicate thecontinuing predominance of land ownership as a majorsource of income.
Conclusions
Small farmers continuously face their most important prob-lem in everyday life—survival. Most of these farmers prac-tice mixed crop-animal systems primarily because of the
many positive features associated with increased produc-tivity, increased income, and improved sustainability. Forregions such as Asia, mixed crop-animal systems can prob-ably be regarded as the foundation for the production in-creases that improved food security and helped alleviatepoverty. Despite the recognized importance of these sys-tems, however, many problems and constraints still hindertheir further development. These constraints range from tech-nical to policy-related problems and issues that need imme-diate attention and support both from governments and in-ternational organizations. On the technical side, the mostcrucial is perhaps the need for a multidisciplinary team ofscientists/extension agents in which each one understandsanother discipline sufficiently to communicate effectivelywith other scientists/extension agents outside of their ownarea of expertise. Technologies that would help improveproductivity and promote sustainability of the systems arealso of great importance. On the policy side, agriculturalpolicies relating to small-farm development must be clearlylaid out on a long-term basis, and should not be distorted bypolicies that promote larger establishments. The proper iden-tification of the specific intervention measures to developcrop-animal systems further is based on a clear understand-ing of the systems—and where and how they operate.
Table 12. Decomposition of Gini coefficient: sources of income.a
Philippines IndonesiaInequality
1992 1997 1995 1999
Gini coefficient 0.55 0.49 0.57 0.55
Relative concentration coefficientAgriculture 0.66 0.78 0.65 0.90Rice 1.02 1.10 0.47 0.74Nonrice 0.22 0.51 – 0.88Fishing – – 1.34 1.69Livestock 0.56 0.71 0.71 0.79
Nonagriculture 1.19 1.15 1.23 1.12
Factor inequality weightAgriculture 0.24 0.32 0.26 0.48Rice 0.18 0.19 0.10 0.08Nonrice 0.03 0.09 – 0.33Fishing – – 0.06 0.06Livestock 0.03 0.04 0.10 0.02
Nonagriculture 0.76 0.68 0.74 0.52
aNote: Definition of income sources is as follows: agricultural income includes rice, nonrice, agricultural labor, fishery/hunting, and livestock. In Indonesia, land rental andequipment rental are included. Fishery and hunting: included as nonrice in the Philippines. In Indonesia (1999), the item reflects only fishery. Livestock: in the Philippines, datainclude labor income from doing livestock-related activities. Nonagricultural income includes government and services (transport, processing, and other service industries).Trade: in Indonesia (1999), this income source includes business. Industry: includes construction. Other income: includes remittances and other income.Source: Household survey data from respective countries, collected by IRRI.
17
References
Adams RH, He JJ. 1995. Sources of income inequality and pov-erty in rural Pakistan. Research Report 102. Washington,D.C. (USA): International Food Policy Research Institute.
Alderman H, Garcia M. 1993. Poverty, household food securityand nutrition in rural Pakistan. Research Report 96. Wash-ington, D.C. (USA): International Food Policy Research In-stitute.
Bouis H. 1991. The determinants of household-level demand formicronutrients: an analysis for Philippine farm households.Washington, D.C. (USA): International Food Policy Re-search Institute.
David C, Otsuka K. 1993. Differential impact of modern ricevarieties in Asia: an overview. In: David C, Otsuka K. Mod-ern rice technology and income distribution in Asia. Manila(Philippines): International Rice Research Institute. p 11-21.
David C, Cordova V, Otsuka K. 1993. Technological change,land reform, and income distribution in the Philippines. In:David C, Otsuka K. Modern rice technology and incomedistribution in Asia. Manila (Philippines): International RiceResearch Institute. p 51-106.
Devendra C, Thomas D, Jabbar MA, Kudo H. 1997. Improve-ment of livestock production in crop-animal systems in rainfedagro-ecological zones of South-East Asia. Nairobi (Kenya):International Livestock Research Institute.
Devendra C, Thomas D, Jabbar MA, Zerbini E. 2000. Improve-ment of livestock production in crop-animal systems in agro-ecological zones of South Asia. Nairobi (Kenya): Interna-tional Livestock Research Institute.
Delgado C, Rosegrant M, Steinfeld H, Ehui S, Courbois C. 1999.Livestock to 2020: the next food revolution. Washington,D.C. (USA): International Food Policy Research Institute,Rome (Italy): Food and Agriculture Organization of the UnitedNations, Nairobi (Kenya): International Livestock ResearchInstitute.
Diaz-Briquiets S, Cheny CC, Germano S. 1992. Nutrition CRSPfeasibility and planning activitiy. Arlington, Va. (USA): Casalsand Associates.
FAO. 1995. World animal review, 84/85. Rome (Italy): FAO.FAO. 2003. International Year of Rice 2004: concept paper. Rome
(Italy): Food and Agriculture Organization.FAOSTAT online database. 2003. Rome (Italy): Food and Agri-
culture Organization.Hossain M. 1998. Recent developments in the world rice market
and Vietnam rice economy: implications for prioritization ofrice research. Paper presented at the Vietnam-IRRI Col-laborative Work Plan Meeting, Hanoi, Vietnam, 11-13 No-vember 1998.
Hossain M, Fischer KS. 1995. Rice research for food securityand sustainable agricultural development in Asia: achieve-ments and future challenges GeoJournal 35:286-298.
Hossain M, Abdul Quasem A, Jabbar MA, Mokadem Akash M.1993. Production environments, modern variety adoption,and income distribution in Bangladesh. In: David C, OtsukaK. Modern rice technology and income distribution in Asia.Manila (Philippines): International Rice Research Institute.p 221-280.
Isvilanonda S, Wattanutchariya S. 1993. Modern variety adop-tion, factor-price differential, and income distribution in Thai-land. In: David C, Otsuka K. Modern rice technology andincome distribution in Asia. Manila (Philippines): Interna-tional Rice Research Institute. p 173-220.
Jabbar MA, Green DAG. 1983. The status and potential of live-stock within the context of agricultural development policyin Bangladesh. Aberystwyth (UK): The University Collegeof Wales. 113 p.
Jahnke HE. 1982. Livestock production systems and livestockdevelopment in tropical Africa. Kiel (Germany): KielerWisenschaftsverlag Vauk. 253 p.
Lin JY. 1993. The nature and impact of hybrid rice in China. In:David C, Otsuka K. Modern rice technology and incomedistribution in Asia. Manila (Philippines): International RiceResearch Institute. p 375-408.
Pingali PL, Bigot Y, Binswanger H. 1987. Agricultural mechani-zation and evaluation of farming system in Sub-SaharanAfrica. Baltimore, Md. (USA): Johns Hopkins UniversityPress.
Ramasamy C, Paramasivam P, Kandaswamy A. 1993. Irrigationquality, modern variety adoption, and income distribution:the case of Tamil Nadu in India. In: David C, Otsuka K.Modern rice technology and income distribution in Asia.Manila (Philippines): International Rice Research Institute.p 323-374.
Rangnekar S. 1992. Women in livestock production in rural India:animal production and rural development. In: Proceedingsof the Sixth AAAP Animal Science Congress. Vol. I.Bangkok, Thailand.
Rosegrant MW, Sombilla MA, Perez ND. 1995. Global foodprojection to 2020: implications for investment. Food, Agri-culture, and the Environment Discussion Paper No. 5. Wash-ington, D.C. (USA): International Food Policy Research In-stitute.
Sombilla MA, Hossain M. 2001. Rice and food security in Asia.In: Chern W et al, editors. Food security in Asia: economicsand policies. Cheltenham (UK) and Northampton, Mass.(USA): Edward Elgar Publishing.
Sudaryanto T, Kasryno F. 1993. Modern rice variety adoptionand factor-market adjustments in Indonesia. In: David C,Otsuka K. Modern rice technology and income distributionin Asia. Manila (Philippines): International Rice ResearchInstitute. p 107-128.
Thornton PK, Kruska RL, Henninger N., Kristjanson PM, ReitRS, Atieno F, Odero AN, Ndegwa T. 2002. Mapping pov-erty and livestock in the developing world. Nairobi (Kenya):International Livestock Research Institute.
Upadhyaya H, Thapa G. 1993. Modern variety adoption, wagedifferentials, and income distribution in Nepal. In: David C,Otsuka K. Modern rice technology and income distributionin Asia. Manila (Philippines): International Rice ResearchInstitute. p 281-322.
Von Braun J, Pandya-Lorch R, editors. 1991. Income sources ofmalnourished people in rural areas: micro-level informationand policy implications. Working Paper on Commercializa-tion of Agriculture No. 5. Washington, D.C. (USA): Interna-tional Food Policy Research Institute.
Notes
Author’s address: International Rice Research Institute, DAPOBox 7777, Metro Manila, Philippines.

18
Crop-livestock systems are the dominant farming systemsin rainfed areas of the humid and subhumid agroecologicalzones of Southeast Asia. Livestock are an integral, well-established component of these systems, providing greaterincome stability by acting as a capital reserve and supply-ing draft power, protein, and fertilizer. The Livestock Revo-lution predicts increasing demand for food of animal origin(Delgado et al 1999), which necessitates a correspondingsupply response in terms of higher animal numbers and out-puts. This will require further intensification of both spe-cialized nonruminant industrial systems and smallholdercrop-livestock systems that constitute the backbone of small-scale Asian agriculture. It is thus of paramount importanceto improve the productivity of crop-livestock systems be-cause of their potential to increase opportunities for im-proving food security and livelihoods, and thereby reducepoverty for the millions of smallholders in the region. Ajudicious strategy for the development of crop-livestocksystems in rainfed areas would also have implications fornatural resource management of the fragile and marginalareas where most of these systems are located. This paperpresents some research experience and lessons from an on-going project being implemented by the International Live-stock Research Institute in collaboration with its nationalpartners1 in Southeast Asia and China.
The Crop-Animal Systems ResearchProject (CASREN)
Extensive consultations with national partners in South-east Asia led to the identification of research in crop-live-stock systems as a high priority for ILRI in fulfilling itsglobal mandate in Asia. The CASREN Project is a collabo-rative, multidisciplinary research effort to generate tech-nology and policy options to increase the productivity ofsmallholder crop-livestock systems in Southeast Asia. It hasbeen supported by the Asian Development Bank (ADB)
Improving crop-livestock production systemsin rainfed areas of Southeast AsiaMa. Lucila A. Lapar
through a regional technical assistance grant (RETA 5812during 1999-2001 and RETA 6005 during 2002-04).
The CASREN Project has three overarching objectives:(1) enhance the productivity of crop-livestock systemsthrough improved technologies, (2) improve market par-ticipation, competitiveness, and trade of smallholders byidentifying appropriate policy options, and (3) strengthenNARES capacity to conduct crop-livestock research.
Crop-livestock interactions at benchmark sitesCASREN started field activities at five benchmark sites(BMS) in five countries in Southeast Asia and South China(see Fig. 1): (1) Kecamatan, Cilau subdistrict, Garut District,West Java, Indonesia; (2) Don Montano village, Umingan,Pangasinan Province, Northern Luzon, Philippines; (3)Amphur Muang District, Mahasarakham Province, north-east Thailand; (4) Dong Tam village, Dong Phu District,Bin Phuoc Province, South Vietnam; and (5) Bixi Xiang,Nanjian County, Yunnan Province, South China. A sixthBMS in Renhe Township in Sichuan Province, South China,was added in 2003. These countries contain ecological en-vironments and production systems representative of manyother sites in the region and have varying degrees of systemresearch capacity that needs to be supported for improvedeffectiveness. Table 1 shows the characteristics of the BMSin the five countries.
Rice-based cropping systems are common in these ar-eas, including other annual crops and tree crops, with a mixof both ruminants and nonruminants present in the con-tinuum of lowland and upland rainfed ecosystems. The pres-ence of both animal and crop diversity thus provides a vari-ety of crop-animal interactions. The effects of this diversityon productivity, livelihoods, and sustainable agricultureprovide major opportunities for research and development.Indeed, indications from baseline household surveys showthat income from animals contributes 10–25% to total farmincome. Feed-supply constraints are critical during the 5–
1These partners are the Central Research Institute for Animal Science in Bogor, Indonesia; Philippine Council for Agriculture, Forestry, and Natural Resources Research andDevelopment in Laguna, Philippines; Khon Kaen University in Khon Kaen, Thailand; Institute of Agricultural Sciences of South Vietnam in Ho Chi Minh City, South Vietnam;Yunnan Beef Cattle and Pasture Research Center in Kunming, South China; and the Sichuan Academy of Animal Sciences in Sichuan, South China.

19
7-month dry period at all of the BMS. This presents majorchallenges for feeds and feeding, and for the efficiency ofuse and/or protection of natural resources in these environ-ments.
One form of crop-livestock interactions prevalent atthe BMS is the use of crop residues as animal feed. In mostcases, this competes with other observed uses such as mulch-ing and as raw materials for roofing, particularly in the caseof rice straw. The use of rice straw as feed is very common atthe Thailand BMS, where farmers are engaged in dairy farm-ing, and in Yunnan Province, where the stocking rate isvery high (i.e., greater than 4 TLU2 ha–1) and pasture areasare limited. In the Philippines, the competing use of ricestraw as feed and as mulch has been observed, particularlyamong households that grow onions as a second crop.
Another form of crop-livestock interactions observedat the BMS is the use of animal manure as fertilizer for crops,particularly in Thailand, Indonesia, and China. In Vietnam,it is common for farmers to sell animal manure that has been
collected as well. Cattle manure is also used as feed in crop-livestock-fish systems.
Food-feed cropsRice straw is definitely the most abundant crop residue forfarmers in Southeast Asia and South China (see Fig. 2), butits use as feed is variable, in some cases because of compe-tition for other uses (e.g., mulch) or the lack of knowledgeon how to more efficiently use this feed resource. Crop resi-dues from maize are also commonly available. In recentyears, there has been a significant increase in the shares ofsugarcane residues in Thailand and sweet potato vines inIndonesia and South China relative to other types of cropresidues. These respond to shifts in cropping patterns inthese areas, which has some implications for the potentialuse of available feed resources by farmers.
The growing interest in food-feed crops is apparent inthe increasing cultivation of sweet potato and, to some ex-tent, maize and sugarcane; their crop residues are used as
Fig. 1. Location of benchmark sites. Source: Lapar and Jabbar (2003).
2Tropical livestock unit

20
feed, usually in combination with other types of roughages.Food-feed crops promote increased food production, sus-tain soil fertility, and provide dietary nutrients for animals(Devendra et al 2001). Thus, the development of food-feedsystems represents an important complementary strategy toincrease feed availability, food production, and sustainablecrop production systems in rainfed areas.
Technological intervention forproductivity improvement
The availability of feeds and their efficiency of use through-out the year represent the most important constraint affect-ing the productivity of animals within crop-animal systems(Devendra et al 2001). Collaborative research in this area isan important strategy in the CASREN project and the de-velopment and testing of technologies to improve feed pro-duction and use are key ingredients. Within CASREN, thefeed production and use technologies developed can be
grouped as targeted feed supplements, the use of dual-pur-pose crops, leguminous forages, and block licks using localresources. Manure and legumes were investigated as impor-tant contributors to sustained soil fertility. Table 2 shows asummary of the various technologies tested on-farm at theBMS.
Considerable challenges and opportunities still existin the region for institutional partnerships and interdisci-plinary research aiming to identify appropriate technolo-gies for the improvement of crop-livestock systems. Never-theless, the participatory approach adopted in technologytesting, validation, and diffusion has proved to be effectivein scaling up the adoption process.
Studies in economics and policy
Income from market participation is the key to boostingeconomic growth for nations and reducing poverty for indi-viduals (World Bank 2001). However, participation is not
Table 1. General characteristics and types of farming systems at each of the benchmark sites (BMS).
Vietnam Thailand Indonesia Philippines China
Location Dong Tam, Bin Phuoc Mahasarakham, Cilau, Garut Don Montano, Bixi Xiang,Khon Kaen Pangasinan Nanjian
Distance from Ho Chi Minh City (110) Khon Kaen (90) Bogor (180) Manila (220) Kunming (380)major city (km)
Rainfall (mm) 2,170 1,500 2,200 2,300 760
Climate Subhumid Subhumid Subhumid Subhumid Subhumid,subtropical
Dry season (months) 6 6–7 5–6 6 7
Agroecological zone Uplands Lowlands Uplands Lowlands Uplands
Predominant animal BC, Pi, Po DC, Pi, Po BC, Bu, S, G, Fi BC, Bu, G, Pi, Po BC, Bu, G, Pi, Pospeciesa
Type of crops Rice, cash crops, and Annual and cash Rice, cash crops, Rice, cash crops, Rice, tea, andperennial crops crops, fruit trees and fruit trees and fruit trees fruit trees
Main crop-animal Crop residues as Crop residues as Manure as fertilizer Crop residues Farm manure asinteractions feed, use of draft feed, manure as as feed fertilizer, crop
animals fertilizer, use of residues asdraft animals feed, use of
draft animals
Main resource Soil mining, erosion, Erosion, soil mining Soil mining, Soil mining Erosion, soildegradation problem deforestation erosion on sloping mining due to
land, deforestation intensity of cropproduction,deforestation
% contributions by 13 10–20 10–15 15–20 20–25livestock to total income
aBC = beef cattle, DC = dairy cattle, Bu = buffaloes, S = sheep, G = goats, Pi = pigs, Po = poultry, Fi = fish.Source of Data: Baseline socioeconomic survey of CASREN BMS, 1999.

21
Fig. 2. Relative shares of different types of crop residues in two periods. Source: Lapar and Jabbar (2003).

22
without barriers, given imperfect information and the het-erogeneous conditions and characteristics of economicagents. A key policy question then is whether thesmallholders, who need it most, will be able to participatein and benefit from the emerging market opportunities.Smallholder participation may be unlikely unless appropri-ate policies are in place because of some characteristics thatare inherent to smallholders, namely, their lack of capitalresources, inability to take advantage of economies of scale,and lack of access to information, coupled with the gener-ally poor infrastructure that is prevalent in rural areas wheresmallholders are largely located.
Studies in economics and policy within CASREN aretrying to understand these issues through several countrycase studies. These studies are aimed at developing andrecommending policy changes to improve market partici-pation, competitiveness, and trade for smallholders, andconducting policy dialogues with governments on thesepolicy issues. Brief descriptions of studies conducted from1999 to 2002 are presented below.
Livestock for rural income diversificationA comprehensive study on policy options for using live-stock to promote rural income diversification and growthwas undertaken in collaboration with the International FoodPolicy Research Institute (IFPRI) and the Ministry of Agri-culture and Rural Development (MARD).3 The study iden-tified three priority policy areas in the livestock sector forthe short term (next five years):
• The first priority will be to increase productivity tomeet the rapid growth of the domestic demand formeat and animal products. The productivity focus inthe short term will create the basis for an acceleration
of growth and will require the reorganization of thebreeding system, additional investment in artificialinsemination stations, and expanded commercialcredit targeted to breeding. Considerable expansionof investment in capacity and facilities of the researchand extension system will also be needed at the sametime to support the institutions required to promotethe generation and dissemination of improved breedsappropriate to the needs of smallholder producers.
• The second priority is to provide adequate incentivesto participants in the livestock system. This will im-ply maintaining market orientation while at the sametime fostering a more competitive environment, and aliberalized trade system, and supporting marketinginstitutions and facilities. Policies to encourage in-creased investment in improving market informationand setting up appropriate market places will facili-tate an increased flow of information between pro-ducers and consumers and at the same time improvethe bargaining power of smallholder producers. Thesewill potentially result in lower marketing margins,thus expanding production, consumption, and inter-regional trade.
• The third priority will involve setting up the regula-tory and institutional bases for effective health, sani-tary, and veterinary services, including an increase inresources devoted to capacity building of the veteri-nary practitioners, improved facilities for diagnosticsand epidemiology, and the privatization of the vet-erinarian profession. There will also be a need to setup and/or strengthen several inspection systems re-lated to health and environmental control in order toprotect both human and animal health.
Table 2. Technology options tested on-farm at the different benchmark sites.
Technology option Country
Treated rice straw as feed Thailand, IndonesiaUrea molasses block licks (UMBL) to supplement poor-quality roughages China, Indonesia, Philippines, Thailand, VietnamUse of low-cost concentrates formulated on-farm using China, Thailand locally available feed resourcesCassava hay production, and use as partial substitute of Thailand, Vietnam commercial concentratesHigh-yielding grasses for cut-and-carry systems China, Indonesia, Philippines, Thailand, VietnamTree legumes as foliage sources Indonesia, Philippines, ThailandIntroduction of legumes in food-feed systems Indonesia, Philippines, ThailandUse of sweet potato as dual-purpose crop IndonesiaUse of cassava as dual-purpose crop VietnamUse of grasses in hedgerows to control erosion in cassava plots VietnamIntroduction of cool-season legumes ChinaSoil-test-based fertilization in rice PhilippinesTreatment of manure (Bokashi system) IndonesiaNew cassava variety and fertilizer management VietnamDevelopment of measuring band to estimate liveweight in cattle Vietnam
Source: ILRI (2002).
3Details are in IFPRI (2001).

23
Competitiveness and efficiencyof pigs and poultryA study to investigate the sector competitiveness and effi-ciency of pig and poultry production was undertaken inVietnam.4 Some policy recommendations coming out of thefindings of the study include the following:
• Liberalization policy may improve efficiency andcompetitiveness in both poultry and pig productionin North Vietnam because of the economies of scaleobserved in that region such that flock and herd sizemay expand because of expectedly lower input pricesfrom liberalization. This policy will create the oppo-site effect in South Vietnam, where current marketconditions and policy are conducive to higher pri-vate profits vis-à-vis social profits. With liberaliza-tion policy creating pressure for output expansion,pig and poultry farms in the south will lose their costadvantages because of lower technical performance.
• To attain the production potential of improved breedsin smallholder conditions, much can be gained byimproving feed quality and management. Policy sup-port for better-quality feeds and better herd manage-ment will be important for keeping smallholders outof poverty and for getting them to participate in moremarket-driven rural development processes.
• Improved access to formal and informal education willhelp smallholders become more efficient and com-petitive. Public expenditure on extension and educa-tion and specialized training needs to be expandedbecause of the potential positive impact on small-holder efficiency. Moreover, these are services thatonly the public sector has the mandate to provide.
• Improved access to credit likewise promotes efficiencyby leveraging cash constraints to purchase good-qual-ity inputs and services. Policies to support the expan-sion of credit access and availability to smallholderswill be beneficial in this respect.
• The government should not get involved in the pro-vision of feed, stocks, and drugs because it is shownthat doing so will reduce efficiency, likely arisingfrom the poor quality and untimely delivery of suchinputs. To optimize the impact of public investmentsfor improving productivity and efficiency, the gov-ernment should not engage in the business of supply-ing inputs as dictated by liberalization policy butrather invest in more productive activities such aseducation and improved delivery of extension ser-vices.
A similar study on pigs in the Philippines has high-lighted three major issues that constrain smallholder com-petitiveness and efficiency of smallholder producers: feed
quality, animal health services, and genetics. 5 Potentiallyimportant policy recommendations arising from these find-ings include
• Streamlining of the feed control law to ensure properimplementation and enforcement, and subsequentlymake more transparent the quality classification offeed being sold in the market.
• Institutionalization of mechanisms and an incentivestructure for the development of institutional innova-tions, for example, collective action that will facili-tate the mitigation of transaction costs in productionand marketing that are stacked against smallholderproducers more than commercial ones. Policies toencourage private-public partnerships in livestockproduction and R&D appear to be promising.
• Policies to improve delivery of extension and animalhealth services will facilitate increased productivityand improve market participation by smallholder pigproducers. This will need to include training and tech-nical support for better management of improvedbreeds.
Market participation by smallholderlivestock producersA study on market participation decisions by smallholderlivestock producers in crop-livestock systems in the Philip-pines was conducted and came out with the following ma-jor findings and policy implications:6
• Smallholder livestock producers are consuming al-most twice the amount of home-produced livestockproducts as nonproducers consume on a per house-hold basis. This has important implications for secur-ing the availability and accessibility of better-qual-ity protein for smallholders for improved health andnutrition. Thus, policies to promote the expansion oflivestock production by smallholders will help im-prove food security and the health and nutrition sta-tus of smallholders who have less access to better-quality food otherwise.
• Increased animal holdings are important for engen-dering market access by smallholders. Thus, technol-ogy and policy options that will enhance incentivesto increase production will have potentially largeimpacts on engendering market participation. Here,promoting the adoption of animal productivity-im-proving technologies appears to be the most lucra-tive among policy options.
• Technology adoption is positively associated withhousehold size (as a proxy for labor resources). On theother hand, the availability of alternative occupationalopportunities (which takes labor away from livestockproduction) affects significantly the potency of so-
4Details are in Akter et al (2003).5Details are in Lapar et al (2002a).6Details of the descriptive analysis are in Calara and Lapar (2001). Details of the econometric estimation are in Lapar et al (2002b).

24
cial and economic prescriptions to facilitate technol-ogy adoption and market participation ofsmallholders. These competing effects, while they maybe location-specific, need to be examined very closelywhen targeting development objectives forsmallholders.
In addition to the above findings, it was also shown ina companion study that neighborhood effects are signifi-cant in market participation decisions by smallholder farm-ers at the BMS in the Philippines.7 This has major implica-tions for the important impacts of knowledge diffusion onfarmer decision-making. An understanding of the extent towhich pro-active agents influence neighbors and the extentto which this “ripple-effect” is passed on and the range of itsgeographic dispersion is important for policy-making pur-poses. Farmers are more likely to imitate their neighbors’success stories, all other things being constant. It is thuswell advised to consider this phenomenon in designingpolicy interventions in order to fine-tune expectations ofpolicy impacts and hence devise more realistic and feasibleoptions.
A similar study on market participation conducted inVietnam has shown that labor is important in engenderingmarket access, availability of land significantly affects en-try into ruminant markets, age (as a proxy for experience) isan important factor for entry into nonruminant markets, andthere are differential impacts across regions of policies af-fecting education, communal grazing land, and access tocredit. The latter finding gives emphasis to the need to tai-lor certain sector policy prescriptions to the requirementsand conditions of regions.8
Factors affecting technology adoption:the case of dual-purpose foragesConsistent with the objectives of CASREN and the focuson feed technology interventions, a case study to identifythe factors that facilitate the adoption of dual-purpose for-ages in rainfed areas was conducted in the Philippines.9 Aneconometric model was estimated to determine the signifi-cant factors for adoption. The results of the study showedthat, in addition to the biological aspects being critical tothe adoption of forage species, the socioeconomic aspectsof the farmer and the farm are important factors in engender-ing the adoption of forages among adopters of contourhedgerows. It was shown that, when a farmer is facing li-quidity or a capital constraint, there is less likelihood thatadoption of forages will take place because of the accompa-nying costs of adoption. This suggests that policies thatwill enhance farmer income and/or facilitate their access toexternal sources of capital such as credit will promote theadoption of technologies, in this case, forage species. Like-
wise, the role of education in facilitating the uptake of tech-nologies was shown to be important as implied by the re-sults of this study. Education is not necessarily confined toformal education, but rather could encompass the wholerange of training and extension activities that will promoteinformation and knowledge dissemination about a new tech-nology. Thus, programs to promote the adoption of foragespecies, for example, should emphasize the importance ofeducating farmers on the benefits of adoption. The implica-tion of the significance of the location dummy is that thepromotion of forage species may be more effective if tar-geted to specific areas or groups of people. In this particularcase, forage species for soil conservation and for feed arebest targeted to upland areas that are experiencing prob-lems of soil erosion and declining grazing areas. The soilconservation angle could thus be used as another effectiveavenue for increasing the adoption of forage species amongsmallholders.
Lessons learned
Some of the valuable lessons learned from the foregoingstudies conducted under CASREN are as follows:
• Sector policies that will support the macro-level poli-cies include those that will enhance technology adop-tion for productivity improvement, facilitate an envi-ronment conducive to institutional innovations thatwill promote market orientation, and provide the rightincentives for more equitable participation in and dis-tribution of benefits to the various stakeholders.
• Low levels of productivity are a constraint to live-stock-sector development, and increasing adoptionrates of productivity-enhancing technologies are wor-thy objectives of a development initiative. Policyconstraints to technology adoption such as limitedaccess to capital, low levels of education and train-ing, inadequate land and labor resources, and ineffec-tive and/or nonexistent regulatory mechanisms forsafeguarding producer and consumer welfare, amongothers, will need to be addressed to engender moreadoption and subsequently increase productivity lev-els. It is also worthwhile to mention that, in some cases,adoption may be constrained by the technology it-self, that is, the technology may not be the appropri-ate one for the types, capabilities, resources, and re-quirements of the target beneficiaries.
• Increased uptake of productivity-enhancing tech-nologies will likely engender more market participa-tion by smallholder livestock producers. Institutionalinnovations to promote increased adoption of thesetechnologies as well as to remove bottlenecks in in-put and output markets are important complementaryoptions to consider.
7Details are in Lapar et al (2003).8Details are in Holloway et al (2002).9Details are in Lapar and Ehui (2001).

25
• Improving farmer capacity through continuous train-ing and enhanced access to information should alsobe given due consideration in designing developmentpackages to address constraints to smallholder live-stock-sector development.
There is no guarantee that governments will immedi-ately or subsequently adopt the policy options identifiedfor recommendation. What will facilitate the increasedawareness and improve the likelihood of adoption of theseoptions is to undertake more policy workshops/dialoguesto discuss these policy issues and the identified options.Only when governments undertake concrete policy changesas a result of these intensive dialogues and consultationswill these initiatives be deemed successful. It will also beuseful to increase the level of policy advocacy activitiesthat should ideally be led by national collaborators, withcollaboration from international organizations as facilita-tors.
References
Akter S, Jabbar MA, Ehui SK, Goletti F. 2003. Competitivenessand efficiency in poultry and pig production in Vietnam.Socioeconomics and Policy Research Working Paper No.57. Nairobi (Kenya): International Livestock Research In-stitute. 61 p.
Calara A, Lapar MLA. 2001. Policy options for market-orientedlivestock production by smallholder producers in the Philip-pines, final report. Los Baños, Laguna (Philippines): Inter-national Livestock Research Institute. 125 p.
Delgado C, Rosegrant M, Steinfeld H, Ehui S, Courbois C. 1999.Livestock to 2020: the next food revolution. Food, Agricul-ture, and the Environment Discussion Paper 28. IFPRI/FAO/ILRI, Washington, D.C. (USA): International Food PolicyResearch Institute.
Devendra C, Sevilla C, Pezo D. 2001. Food-feed systems in Asia:review. Asian-Aust. J. Anim. Sci. 14(5):733-745.
Holloway G, Lapar MLA, Ehui S. 2002. Hierarchical modellingof policy options for smallholder entry into emerging mar-kets: evidence from Vietnam. Los Baños, Laguna (Philip-pines): International Livestock Research Institute. (Draftmanuscript.)
IFPRI (International Food Policy Research Institute). 2001. Policyoptions for using livestock to promote rural income diversifi-cation and growth in Vietnam. Final Report, Vols. I and II.Washington, D.C. (USA): IFPRI.
ILRI (International Livestock Research Institute). 2002. Increas-ing the contribution of livestock to improving productivity ofcrop-livestock systems in Southeast Asia (RETA 5812).Terminal report prepared for the Asian Development BankLos Baños, Laguna (Philippines): ILRI.
Lapar MLA, Catelo MA, Aragon C. 2002a. Comparative tech-nologies and performance of smallholder and commercialpig producers: a case study of the Philippines. Paper pre-sented at the workshop “Can Philippine Smallholder Pig Pro-ducers Survive: a joint workshop of UPLB-CEM, IFPRI,and ILRI under the CGIAR System-wide Livestock Pro-gram,” Quezon City, Philippines, 8 November 2002.
Lapar MLA, Ehui S. 2001. Factors affecting adoption of dual-purpose forages in the Philippine uplands. Paper presentedat the International Workshop on Forage Demand and Adop-tion by Smallholder Livestock Keepers, ILRI, Addis Ababa,Ethiopia, 18-20 June 2001. (Recently published in Agric.Syst. 81(2004):95-114.)
Lapar MLA, Holloway G, Ehui S. 2003. How big is your neigh-borhood?: spatial implications of market participation bysmallholder livestock producers. Paper presented at the 25thInternational Conference of Agricultural Economists, 16-22August 2003, Durban, South Africa.
Lapar MLA, Holloway G, Ehui S. 2002b. Policy options promot-ing market participation of smallholder livestock producers:a case study from the Philippines. Socioeconomics and PolicyResearch Working Paper No. 47. Nairobi (Kenya): Interna-tional Livestock Research Institute 21 p. (Subsequently pub-lished in Food Policy 28(2003):187-211.)
Lapar MLA, Jabbar M. 2003. A GIS-based characterization oflivestock and feed resources in the humid and sub-humidzones in five countries in Southeast Asia. Nairobi (Kenya):International Livestock Research Institute. 72 p.
World Bank. 2001. World development report 2002: building in-stitutions for markets. Washington, D.C. (USA): OxfordUniversity Press/World Bank.
Notes
Author’s address: International Livestock Research Institute(ILRI), DAPO Box 7777, Metro Manila, Philippines.
Acknowledgment: This paper has benefited from the contribu-tions and support of persons and institutions too many tomention individually. Any errors and/or omissions are thesole responsibility of the author.

26

Section 2

28

29
Delvert (1961) and Tichit (1981) have described two farm-ing systems that are widely practiced by Cambodian farm-ers: rice-based farming systems and multiple cropping sys-tems. Rice-based farming systems predominate and occupyaround 88% of the total cultivated land (Nesbitt 1997).Rubber and maize, which are the most important crops afterrice, have contributed greatly to the national economy. Sec-ondary cash crops consist of mungbean, tobacco, soybean,cassava, sweet potato, and sesame. Vegetable production isimportant along the Mekong River areas.
Rice-based farming systems vary according to the flood-ing regime, season, water level, cropping pattern, topogra-phy, and soil type. There are five rice ecosystems in Cambo-dia, but rainfed lowland conditions predominate in the areaand contribute 85.7% of the total rice production, whichconsists mostly of medium- to late-maturing varieties. Some92% of lowland rice is grown in the wet season as a singlecrop, with an average yield of 1.3 t ha–1. Rainfed lowlandrice is commonly transplanted on bunded fields. The up-land rice ecosystem, usually found at an elevation of 200 to1,000 m, covers only 8.3% of the total rice area. Most up-land rice is grown with shifting cultivation in forested areasin the north and northeast of Cambodia. Rice is broadcaston sloping land without bunds for two or five years. Humanpopulation densities are low, so fallow periods have notdecreased drastically.
Sustainable food-feed systems and improvedlivelihoods of the poor in rainfed lowland areas:socioeconomic componentsEl Sotheary
Rice farming systems include the household, animals,soil, weeds, insects, and other subsystems. The household,rice, and animal subsystems are integrated and interdepen-dent. The household provides labor and management, whilecrops provide feed, and the animals produce power, ma-nure, meat, milk, and capital. The farming system is part ofan agroecosystem consisting of nonagricultural systems,market and credit systems, and other institutions.
Any strategy for improving the conditions of small ru-ral households must be directed toward increasing the pro-ductivity of both crop and animal components of the farm-ing system. To identify such strategies, the nature, extent,and direction of integrated crop-animal systems (ICAS) hasto be properly and clearly understood.
Profile of the rice and animal sectors
The rice sector’s relative performance and contribu-tion to the economyThe Cambodian rice economy in the 1990s. Agriculture’scontribution to GDP declined from an estimated 52% in1990 to 34% in 2002, as agricultural growth lagged behindthat of the industrial sector (Table 1). However, agricultureis still by far the most important sector for Cambodia’seconomy, and will remain so throughout the Socio-Eco-nomic Development Plan II (SEDPII) period and beyond.
Table 1. Distribution of GDP by sectors and subsectors in % in constant 2000 prices.
YearEconomic activities
1998 1999 2000 2001 2002
Agriculture, fisheries, and forestry 43.7 40.8 37.6 36.4 33.5Crops 17.6 18.3 17.6 16.7 14.9Livestock and poultry 7.1 6.3 5.3 5.6 5.4Fisheries 12.9 11.4 11.3 11.4 11.0Forestry and logging 6.2 4.8 3.4 2.6 2.2
Industry 16.8 18.1 22.1 23.6 26.3Services 35.6 35.6 35.2 34.7 34.3
Source: Ministry of Planning (2003).

30
Paddy rice is by far the dominant agricultural crop, account-ing for 43% of value-added in the crop subsector in 1999.Nonrice crops contributed 29% of value-added, followedclosely by livestock with 28%.
Since the reforms of 1989, rice production in Cambo-dia has been done in a transition market economy. Agricul-ture is a priority in national development policy. Strategieshave been formulated to improve food security, stimulateeconomic growth, increase rural incomes, and develop agri-cultural export industries.
Cambodia is close to the center of origin of rice andfarmers in the region have grown rice for at least 2,000 years,and possibly longer in the case of upland rice. Natural se-lection has contributed significantly to the evolution ofvarious rice varietal types for different environments. Irri-gated rice production technologies were introduced 15,000years ago (Chandler 1993) and were widespread during theAngkorian period.
Since 1995, Cambodia has produced a rice surplus eachyear, although yield averages 1.8 t ha–1. This yield is lowerthan that of other rice-growing countries because most riceis produced in rainfed lowland ecosystems with climaticconstraints. The challenge of increasing rice production re-mains a major objective of Cambodian agricultural scien-tists.
Cultivated area, grain production, and average yield inthe wet and dry season increased from 1993 to 1999 (Table
2). Cultivated area in the wet season varied from 1.40 mil-lion to 1.85 million ha from 1993 to 1999. In 1994, thecultivated area was affected by flood and drought, whereas,in 1998 and 1999, the growth of output may have resultedfrom cultivating two rice crops (rice-rice). Wet-season riceproduction increased significantly from 2.0 million tons in1993 to over 3.4 million t in 1999.
Rice is cultivated in different ecosystems in Cambo-dia, including rainfed lowlands and uplands, and underflooded and/or deepwater conditions and in dry seasons(Table 3). The highest percentage of the rice-growing areais rainfed lowlands (84% in 1999). Early, intermediate, andlate-maturing varieties are located in upper, medium, andlower fields, respectively, to match water depth that is suit-able for different varieties. The characteristics of these vari-eties are well described by Javier (1997). Over the past de-cades, farmers have steadily shifted away from cultivatinglate-maturing (flowering after 15 November) rice varietiesto growing medium-maturing types (120–150 days if pho-toperiod-insensitive, and flowering between 15 October and15 November if photoperiod-sensitive varieties). The culti-vation of late-maturing rice decreased from 1.57 million to0.60 million ha over a 32-year period. A significant increasein area of early and medium-maturing varieties was criticalto improving rice production during this period.
Less than 3% of the Cambodian rice area is currentlyplanted to deepwater and/or floating rice. Small areas of
Table 2. Area planted to rice, grain production, yield, and population, Cambodia, 1900-1999.
Year Area planted (000 ha) Rice production (000 t) Grain yield (t ha–1) Human population (million) Export rice?
1900a 400 560 1.40 2.0 Yes1950a 1,657 1,576 0.95 4.3 Yes1960a 2,150 2,335 1.09 5.5 Yes1970a 2,399 3,184 1.33 7.0 Yes1980a 1,441 1,715 1.19 6.3 No1990a 1,890 2,500 1.32 8.7 No1999b 2,085 4,073 1.95 12.0 Yes
aSource: FAO electronic database (2000).bSource: Agricultural statistics (1999-2000).
Table 3. Production area (%) of different rice ecosystems in Cambodia.
Production area (%)Ecosystem
1967a 1981a 1995b 1999b
Wet season 93.8 93.4 91.7 88.9Rainfed lowland 77.9 86.7 85.7 84.0
Early 2.9 15.6 17.4 17.2Medium 12.4 17.0 35.4 38.9Late 62.6 54.1 32.9 27.9
Deepwater 15.9 6.7 4.1 2.6Rainfed upland – – 1.9 2.2
Dry season 6.2 6.6 8.3 11.1Total (000 ha) 2,508.2 1,441.0 2,038.1 2,153.9

31
upland rice are found in northeastern Cambodia. Dry-sea-son rice production is increasing in area with better yield.Of dry-season rice production, recession rice is most popu-lar. The other dry-season rice has supplementary irrigationand full irrigation. Although they represent only a smallproportion of dry-season rice, contributing only 18% of thenation’s total production in 1999, they are of increasingimportance to Cambodia’s food security and economicgrowth.
Characteristics of Cambodian rice-farming house-holds. Rural households in Cambodia number 1.5 millionand account for 85% of the national population. Eighty-two percent of the rural labor is engaged in agriculture, for-estry, and fishing, and the vast majority of this labor is en-gaged in rice production. The average rural household sizeis 5.5 persons (range of 3–7). The average age compositionof the rural household is 44% age 0–14, 52% age 16–64,and 4% age 65 and above. The average adult labor per house-hold is 2.9 persons. The percentage of rural householdsheaded by a female is estimated at 20% of the total numberof households. Heads of farm households tend to be elderly(40–50 years old) and have long farming experience (20–25 years) (Rickman et al 1995).
The average years of education for rural adults are 4.4years for males and 2.2 years for females. Rural adult lit-eracy rates, assessed at the simplest level of an ability toread and write a simple message, average 79% for men and51% for women.
Rice farm households in Cambodia are engaged in arange of activities to produce food and income. In additionto rice production, other field crops and vegetable produc-tion are undertaken. A fair amount of time is also spent inlivestock production, hunting, and fishing. Many house-holds are engaged in wage labor and small business (Helmers1997, Lando and Mak 1991).
Rice is the staple food for Cambodian people and themost important crop for food security. Rice represents 75%of nutrition intake on average, with per capita consumptionneeds estimated at 151 kg of milled rice or 250 kg of paddy,an average of 1.4 tons per household annually (MAFF 1996).This figure does not include rice requirements for growingseed, for compensating for postharvest losses, and for basicsocial and ceremonial purposes, which might easily amountto an additional 500 kg of paddy year–1. Vegetables, otherfield crops, and wild plants also contribute to the diet, butprecise quantities are difficult to measure. The major sourceof protein in Cambodia is fish, supplemented by smallerquantities of poultry, pork, and beef.
Rice production is one of the major activities under-taken by rural households that require a significant amountof labor. In most cases, the rice crop is grown using laborwith simple farming tools. Cattle or buffalo are the majorsources of power for plowing and harrowing. However, theuse of agricultural machinery in rice production is spread-ing (Rickman et al 1995). Several studies have been con-ducted regarding the amount of labor required to cultivate
1 ha of rice. Results indicate large variations in laborersamong farm households. Total average person-days ha–1 hasvaried from 85 to 114 days (Tichit 1981, Rickman et al1995). One study, which involved consecutive surveys ofthe same households during two seasons, found a mean of100 person-days ha–1, but the standard deviation of thesample was estimated at 48, which is very high (Pingali1988).
More than 90% of the labor requirement for rice pro-duction permanently involves farming jobs in the wet sea-son, given the dominance of rainfed lowland production.Within this season, labor demand is high for transplantingand harvesting (Nesbitt and Chan 1991). Households fre-quently experience labor shortages during these periods andthey usually hire or exchange labor to meet the peak de-mand. Different-maturing varieties (early-, medium-, andlate-maturing ones) are planted to avoid a labor shortage.
Different cropping operations require different demandson men and women because of common divisions of laborat the farm level. Women make up 60–65% of the agricul-tural labor. Land preparation and other activities are moreoften undertaken by men. Transplanting and general ani-mal husbandry are mainly done by women, but harvestingis done by both men and women (Paris 1992). There are,however, exceptions to these patterns according to differ-ences in the availability of household labor.
Rice production in the 1990s. From 1991 to 2000, riceproduction increased at a remarkable rate of 5.9%, far out-stripping the population growth of 2.8%. Average growthin 1996-2000 remained at 3.1% per year. This is mainlyattributed to the stronger cultivation of dry-season rice be-cause of the expanded use of high-yielding varieties suchas IR66. In 1996-2000, rice production in the dry seasongrew at an average of 4.8% annually vis-à-vis wet-seasonrice production, which grew at 2.8% annually. As a result,the share of dry-season rice in total production has increasedconsiderably, from 15% in 1991 to about 20% in 2000.Dry-season rice varieties are cultivated mostly for additionalincome. Wet-season rice, on the other hand, which is prima-rily cultivated with traditional varieties, whose taste is re-putedly of higher quality than that of modern varieties, ismostly channeled for home consumption.
Increased outputs in dry-season rice are different fromwet-season production. Dry-season production is essentiallyexplained by yield improvement, which averages about 3.2t ha–1 versus wet-season rice yield of 1.9 t ha–1. Wet-seasonrice production comes from an increase in area (74%). Inboth cases, variability of growth is quite high and muchhigher than the average growth rate (i.e., standard deviationof 8.5 and 11.5, respectively, for wet- and dry-season rice).
Rice in Cambodia is mainly cultivated under rainfedconditions. Irrigated rice area was estimated at 473,000 haduring 1997 and 1998 (about 23% of total rice area), ofwhich 11% is supplemental wet-season irrigation, 11% ispartial dry-season irrigation, and about 1% is fully irrigated.Rice double-cropping area is about 1% of total cultivatedarea.

32
The costs and returns of rainfed lowland and flood re-cession rice production systems, using existing and im-proved technologies, are summarized in Table 4.
Rice output in the rainfed lowland is mainly used forconsumption. In this situation, input costs are effectivelythe net expenses of staple food production. In flood reces-sion areas, farmers can produce surplus rice for sale with 1 ormore than 1 ha of rice field. With new technologies, rainfedlowland farmers may be able to produce a surplus quantityfor sale.
Prospects of rice production in Cambodia. Over thepast 10 years, rice production has increased to a level thathas made the country self-sufficient and able to export amodest surplus. Even though the exact amount of this sur-plus is not known because of inaccurate trade statistics andthe largely informal nature of rice trade, it is estimated thatabout 400,000 t of paddy and an additional 50,000 t ofmilled rice were exported in 2001.
The attainment of this exportable rice surplus could setthe basis for a debate about the role of rice in the future ofagriculture in Cambodia. One position advocates the needto increase the quality of rice, thus allowing Cambodianrice to be traded at a premium in international markets. Thisposition implies a strict selection of paddy varieties of fra-grant rice or local varieties such as Somaly and Phka Malis.Varietal selection, improvement of milling technology, andmarketing strategy are part of the approach that sees thefuture of rice in Cambodia as largely oriented toward fulfill-ing its internal food requirements first and exporting more
quantities of high-quality rice (perhaps in the range of200,000 to 300,000 t of high-quality rice). The average priceof paddy paid to farmers would be about twice the value ofhigh-yielding varieties such as IR66. This strategy impliesthat only a fraction of the total rice area would be cultivatedto these varieties because of the need for adequate soil andagroclimatic conditions. A sophisticated milling and mar-keting capacity would be developed, and only a relativelysmall number of farmers would cultivate this rice variety.This strategy implies an emphasis on the postharvest sys-tem and variety selection.
The second position advocates the need to increaseyield, mostly by disseminating new varieties such as IR66,the intensive application of fertilizers, and irrigated dry-season agriculture. This strategy emphasizes the key role ofagricultural extension in intensive agriculture, and the de-velopment of a seed system that increases the access ofsmallholders to improved genetic material. The increasedrice surplus would also be exported to world markets (thusstill requiring an improvement of postharvest systems) butnot to the high-quality segment of the market. Even thoughthe price of paddy would be lower than average prices, thehigher yield might still partly compensate farmers for thelower price and higher investment in inputs.
These two positions can be largely interpreted as the“Thai” approach and the “Vietnamese” approach to riceproduction expansion. One fundamental difference betweenthe two approaches is that the Thai approach will requiremore private investment and less public investment (in irri-
Table 4. Economic model of rainfed lowland rice production in Cambodia, 1995.a
Inputs Traditional system Improved systemItem
Unit Unit price (riels) Quantity (per ha) Value (riels) Quantity (per ha) Value (riels)
RevenuePaddyb kg 368 1,300 478,400 2,000 736,000Subtotal 478,400 736,000
CostSeedb kg 368 80 29,440 80 64,000Improved seedc kg 800 0Fertilizer
Ureab kg 680 0 50 34,000DAPb kg 864 0 75 64,800
Manure Carts 0 5 0 10 0Labor
Family Person-days 0 110 120Hired Person-days 3,000 0
Irrigation 0Hire draft powerd 95,650 1 95,650 1 95,650Equipment and materialsc 25,800 1 25,800 1 25,800Miscellaneous 0Subtotal 150,890 284,250
Net revenue 327,510 451,750Returns per person-day 2,977 3,764
aAssumptions of improved model: fertilizer and improved seed as shown with minimum water control (supplementary irrigation or good crop/water conditions). Quantities (perha) based on FAO data. Prices and values in Cambodian riels: US$1 = riels 2,500. bFAO (1995) unpublished farm-trial price data. cEstimate extrapolated from FAO 1993 data.dRickman et al (1995).

33
gation and extension system) than the Vietnamese approach.In terms of income of farmers, it is possible that the Thaiapproach has better returns than the Vietnamese approach.However, the limitation of the Thai approach is that it ishighly dependent on soil and land characteristics andweather pattern, whereas the Vietnamese approach is rela-tively more stable, given its higher dependence on irriga-tion.
Currently, Cambodia is following both strategies at thesame time. Private investment in high-quality rice mills hasoccurred over the last two years with some success bothwith farmers and in terms of exports to international mar-kets (by rice mills such as Angkor Kasekam and Paragon).At the same time, irrigation investment is increasing and, asseen above, dry-season irrigated areas are growing rapidly.
However, for the majority of Cambodian farmers, rice isstill cultivated for subsistence reasons. Even with the bettercultivars and methods of cultivation, income from rice islikely to be from only $100 to $200 per hectare. Unlessfarmers own larger fields, rice cultivation alone is unlikelyto be the main tool of poverty reduction in Cambodia.
Other constraints to expanding rice production. Inaddition to the technical constraints identified in previoussections, there are other constraints to further expandingrice production. Marketing of rice is a major economic ac-tivity in Cambodia, although comprehensive studies of therice marketing system are lacking and much rice trade isunrecorded. Rice is imported from and exported to bothVietnam and Thailand. Rice output is marketed for cashand is also traded as an exchange commodity for goods andservices in informal markets. It is primarily characterized bya high degree of fragmentation and inefficiency. The causesof fragmentation include poor physical and communica-tion infrastructure, which limits the movement of goods andinformation. This gives rise to a mismatch between rice sup-ply and demand across the country and over time. Pricedistortions reflect these imperfections. For example, in Sep-tember 1994, it was found that rice was selling in TakeoProvince for US$160 t–1 cheaper than in Phnom Penh, whichis only 70 km away, a price differential that is far in excessof the transportation cost. This fragmentation also meansthat returns to farmers are frequently low, with most profitaccruing to traders, wholesalers, and retailers (Cameron1995).
The rice industry, like the other agricultural subsectors,has a low capital base. This adversely affects the extent ofsuccessful marketing. Formal bank credit is unavailable tothe small-scale producers and agribusiness workers who arethe backbone of the industry. Credit availability in the ricemarket is dominated by informal moneylenders, who typi-cally charge 20–30% per month on cash loans and 100%interest on loans of rice in-kind over a 6-month period. Theyremain in business as they provide easy and timely accessto capital at the local level and face little competition inlocal credit markets. In 1995, none of Cambodia’s 31 bankswere involved in lending to agricultural producers and creditschemes of nongovernment/international organizations have
reached only 2.5% of Cambodian villages (Cameron 1995).Poor postharvest performance also affects the opera-
tions of the rice market. The traditional storage method ledto grain damage and loss by pests, and poor quality formarketing. Losses in transport are also high due to poorpackaging and handling. Finally, rice mills in Cambodiaare inefficient, producing milled rice with less than 60% ofpaddy. This is attributed to the use of low-quality and poorlymaintained milling machinery. Efficient milling shouldyield 70% milled rice of paddy. The current net loss causedby inefficient milling in economic terms is 9% of rough-rice value (Cameron 1995).
Human resources for developing the agricultural sectorremain a major constraint. The 36,000 public- and private-sector staff in the agricultural field frequently lack educa-tion and training in research, extension, and management.This is especially true of training in important areas such ashigh-quality technical training suitable to Cambodian con-ditions, modern modes of extension, and management op-erations in a market economy. Public-sector performance inagriculture is further constrained by institutional limitationsin management, a general lack of resources, and very lowsalaries.
Animal production systems and demand trendsAnimal resources. Animal resources include cattle, buffa-loes, pigs, poultry, and ducks that are commonly raised bysmall households by integrating crop-animal systems. In1995, there were 2.6 million cattle, 0.9 million buffaloes,2.2 million pigs, and 10.8 million chickens and ducks. Cur-rently, these are growing annually at 6.8%, 3.9%, 8.5%, and7.3%, respectively. Because the animal base was devastatedby the civil war from 1975 to 1979, these annual growthrates are impressive.
The order of importance of the species is cattle andbuffaloes, followed by pigs and poultry. Goats are kept onlyin small numbers by Muslims in periurban areas. The largeruminants are important for draft power and are thereaftersold for slaughter and use as meat. Buffaloes are used forland preparation on heavy soils and swampy areas. Onlymale cattle (mostly steers) are used for traction, but, in thecase of buffaloes, both males and females are used untilthey are slaughtered at 12 years of age. Farmers’ depen-dence on large ruminants for draft power is considerablebecause the traditional systems include manure for cropsand also because of their poverty status and lack of accessto credit for the purchase of small tractors. Some 1.2 millioncattle and 520,000 buffaloes provide 90% of the draft power,which is valued at US$60–80 million annually.
However, the numbers of draft animals are limited be-cause of the illicit trade in live animals abroad. Some 30%of the farmers do not own animals and have to hire them forland preparation or, in the form of exchange labor, farmersprovide male labor for rice transplanting and seeding. Milkproduction is in its infancy, but is likely to become moreimportant in the future with improvements in the livingstandards of the people and the open-market policy.

34
Nonruminants are also important, with pigs raised for meatproduction and income generation, and chickens and ducksfor eggs and meat. Pork is the preferred meat in both ruraland urban areas. The pig population shows evidence of up-grading through the use of improved European breeds suchas the large white.
The government has a 350-ha National Cattle Breed-ing Station at Phnom Tamao where Bos indicus is the nextgeneration of Brahman. Haryana cattle were introduced intoCambodia in the 1960s but their popularity remains mainlyin areas close to the Mekong. The unpopularity of Haryanacattle in other regions of the country is due to the poorquality and shortage of feed resources. The size of the formerbreed is being combined for draft purposes with the height,speed, and greater hardiness of the latter. The crossbreedingprogram, however, lacks a clear plan.
The great majority of livestock are raised as an integralpart of different types of farming systems, most of whichhave rice production as the major component. Some spe-cialized intensive meat and egg production and pig pro-duction are beginning to develop around major cities andtowns such as Phnom Penh and Battambang. While still inits infancy, this increasing trend is due primarily to the ex-pected higher income returns.
Animal production systems. Cambodia’s animal pro-duction systems are mainly extensive. Tethering of animalsin the field or close to the homestead is practiced widely tocollect dung for crop cultivation. More intensive systemsof ruminant production involving stall-feeding are uncom-mon. Pigs and poultry are fed mainly with kitchen wastesand rice bran; occasionally, limited amounts of purchasedconcentrates are provided. There is little or no investmentin housing. Pigs are slaughtered at 10–12 months of age atweights of 60–70 kg. Although poultry production is basedessentially on scavenging flocks, small-scale commercialproduction is increasing steadily. Production in these moreintensive systems is based on home-mixed feeds. Egg pro-duction from improved breeds is about 140–170 per bird intwo laying periods, compared with 60–70 eggs per year perbird for native birds. There are no specialized duck produc-tion systems. However, the meat and egg supply dependson two production systems, the 5–10 ducks per family andrice-duck systems. Ducks for meat consumption are releasedin paddy fields after harvesting and these ducks are fedpaddy rice in the evening. Ducks are kept for two layingseasons, in which they produce 150–180 eggs.
Feed resources. Feed resources in Cambodia are rela-tively small areas of native grasslands (about 315,000 ha);herbage from roadsides, wasteland, and rice stubble; andcrop residues, broken rice, and agro-industry by-products(AIBP) such as rice bran, soybean, and fish meal. The largegrassland areas are found in Kampong Thom Province(99,000 ha), with carrying capacity of about 2.5 adult oxenper ha. Most of the AIBP are exported to neighboring coun-tries for local use in pig and poultry production. The avail-ability of rice straw is influenced by the variety used (IRRIcultivars are short-straw types unlike the traditional long-
straw Cambodian varieties) and by harvest method (straw iscut relatively close to the ground level). In addition, hand-harvesting takes place over a long period, so that some ofthe early material would have decayed by the time animalsare allowed to graze the stubble.
Grazing for ruminants is severely limited in the dryseason and wet season. Both pasture and rice straw are oflow nutritive value, particularly in terms of digestibilityand protein. Mineral deficiencies, which have not been ac-curately assessed, may also be a constraint. Very little supple-mentation is practiced although limited efforts have beenmade to treat rice straw with urea. The cultivation and use ofleguminous forages are minimal. The onset of rains, on theother hand, increases mortality because of the release oflarge numbers of nematode larvae. Rain also floods much ofthe area, which, together with the areas brought under culti-vation, reduces the availability of herbage.
Feeding strategies. A feeding strategy for cattle andbuffalo is one component of an overall management strat-egy for livestock. As a consequence of the overall strategy,cattle and buffalo are in certain places at certain times, andwhat they eat is a function of what is available in that placeat that time. This is influenced by the following factors:
• Working requirements of the animals for plowing,harrowing, and other work for a crop. For plowing ricefields, or chamcar, that are near the house, the work-ing animal needs to be kept near the house.
• Working requirements for other draft work. For this,working animals may be working away from the housefor long periods, for example, when they are used topull carts when cutting wood in forests. This is com-monly done at times other than rice-related work.
• Other farming or nonfarming activities of the farmer.In many cases, cattle and buffalo management andmovement are not dictated by the needs of the ani-mal, but by the needs of the farmer to carry out certainactivities.
• Labor requirements of supervision and care, to avoidlivestock grazing or destroying rice fields, and to re-duce wandering and chances of theft. Children com-monly supervise cattle and buffalo when they are graz-ing during the day and return to the house duringschool days. This may mean that the cattle are takenout around 1100-1200 and return late in the after-noon.
• Lack of feed in the wet season (in lowland areas) be-cause of high water levels, and the lack of feed and/orwater in the dry season.
Table 5 gives some examples of different feed loca-tions of cattle and buffalo, the feed materials they may get,and the mode of animal supervision.
For a pig feeding strategy, rice bran is the basic ingredi-ent of most pig diets in Cambodia. In fact, the raising of pigscan be viewed partly as a means of adding value to rice branor just to save daily income when rice bran is purchased.Rice bran is of medium energy and its protein content is initself a reasonable feed for pigs. It can be estimated that rice

35
bran makes up about 50% of pig feed ingredients in Cam-bodia, although variation is significant.
A study in sow raising in Prey Veng showed that ricebran made up about 80% of the diet of breeding sows.
Farmers buy rice bran from the rice miller, who collectsrice bran as payment for the milling process. The quantity,quality, and cost of rice bran that is available at local ricemills are the major determinants of the number of pigs thatare raised in a village, how well they grow, and how profit-able the activity is.
The majority of rice grown in Cambodia is taken tolocal “farmer-supplied” mills. The miller usually takes by-products such as the finest broken rice, bran, and husk aspayment for the service of milling. Alternatively, a fee maybe charged, which may be 30–40 riels kg–1, at 1997 prices.
Surveys conducted at 10 rice mills showed their aver-age output (Table 6).
Variation is large in the output of whole kernel accord-ing to Table 6 and this is attributable to variations in thequality of equipment used by the miller. Mills should beable to produce a “mill-out rate” (the amount of whole grainproduced per ton of paddy) of 63% or better. Given the
current payment method for milling, there is little incentivefor millers to improve their performance above the currentlevel, estimated at 57% in the survey of Rickman et al (1995).
Milling with higher head rice output is achieved byreducing the amount of broken grain. The quality of branvaries greatly according to the amount of husk, which is afunction of the quality of the milling machine. This bran issold in the market as either first, second, or third grade. Thethird grade has significant amounts of husk. The husk has alarge amount of fiber, which pigs cannot digest; therefore,bran with high levels of husk is poor-quality feed.
Farmers readily recognize differences in bran qualityand relative price differences of the three types of bran arefairly constant even though the price of rice bran varies.
Rice grain is also commonly fed to pigs. It is cookedbefore giving it to the pigs, and the rice bran is added so thata kind of soup is made. The water in the soup is usually theonly water that the pigs get. Added also may be leaves orstems of water plants such as water convulvulus (ortrachuan) or duck weed. Banana stems, cut after harvestingfruit, which is usually twice a year, are also commonly fedto pigs. Pigs are also fed household scraps, and many pigs
Table 5. Different types of feeding management.
Location of animal Feed Supervision
House Rice straw Household
House Cut and carried grass, tree leaves, crop Householdleaves, residue, or other
Daily movement to field and Varies according to season and farming system Close or occasional supervision byreturn to house member of household, usually children,
or villager whose animals are joinedinto the herd. Animals may be tethered,but usually not.
Long-term movement: away from house Varies according to season and farming system. Close or occasional supervision byfor a long period of weeks or months Animals are left to the forest after member of household, or animals join
production period. a larger herd to be supervised by ahired person.No supervision is done butanimals are collected back in the earlyrainy season.
Table 6. Output of rice milling.
Component % Range Ownera Value kg–1 Value t–1 of paddy(US$) (US$)
Whole grain (<35% cracked) 54 47–62 Rice grower 0.30 162.00Cracked grain (noodle) 8 1–17 Miller 0.20 16.00Fine cracks 3 1.5–5 Miller 0.15 4.50Bran 11 8–14 Miller 0.10 11.00Husk 24 21–27 Miller 0.02 4.80Total 198.50
aSome variation occurs, but this seems to be the most common arrangement.Source: Rickman et al (1995), for ownership of the components and some indicative prices of the components.
36
are left to forage around the village for feed. The type andquantity of feed vary on a seasonal or area basis, and on thelabor requirements to collect the feed. For example, the col-lection of trachuan for pig feed ceased during periods whenthe family was busy with rice-field work. Rice wine produc-ers feed residue to the pigs.
The quality and quantity of feeds given to pigs are notsufficient for them to reach their productive potential. Toachieve this, more expensive feeds would be required. Giventhe price and the risk of pig sickness or death, farmers areusually not willing to invest in these feeds, even if theywere available. However, significant improvement couldbe made in pig nutrition by better use of locally availablefeeds and targeting protein-rich feeds to young pigs, as partof an overall better management of young pigs to reducetheir mortality.
Besides feeding with grain or kitchen wastes, chickensare free-range scavengers that are fed supplements, prima-rily energy supplements of white rice or paddy, which areusually cast over the ground in the yard of the house. Youngchicks may be given a supplement of white rice equivalentto 250 g per day per 10 chicks (an amount equal to one canor kompong). An adult hen with her chicks may be given50–250 g of paddy per day. Some farmers give nothing tothe chickens from November to April, considering that thereis sufficient rice in the rice fields on which they roam around.
Demand and supply of livestock and livestock prod-ucts. Livestock products such as meat and eggs are a sourceof protein, and fat is a source of energy. The demand forconsumption of pork (and pork fat), chicken meat, and eggsis the primary driving force for the raising of pigs, chickens,and ducks.
In contrast, the demand for beef consumption is for themost part secondary to the demand for cattle and buffalo forfarm operations, such as for soil preparation, for carryingproducts, and as a source of fertilizer.
Demand for livestock and livestock products comesfrom two entities of the livestock system: first from farmerswho use the animals in farm operations and second from theprivate sector, namely, the slaughterhouse owners as well asconsumers whose interest in the animals is primarily forfood. Most of the transactions that take place are carried outthrough middlemen.
Table 7 gives a summary of the demand for livestock,when they are alive, dead, or slaughtered.
Table 8 gives some indication of the complexity of themarketing processes that occur in the livestock system. Thequantity and direction of trade flows of the items listed areas yet poorly defined, although it is possible to make somebroad generalizations.
Domestic demand for meat and eggs is strongest in ar-eas where the population is concentrated, particularlyPhnom Penh. Therefore, most trade flow of meat and eggs isfrom different provinces to Phnom Penh.
Annual meat consumption per person in Cambodia hasbeen estimated at 12.4 kg per year, composed of 3.3 kg of
ruminant meat (mostly cattle, some buffalo) and 9.1 kg ofnonruminant meat (pigs and poultry).
This estimate is in broad agreement with other pub-lished estimates. Delvert (1961) quoted Baradat as estimat-ing annual intake of beef at 1.5 kg per person, pork at 6 kg,and chicken at 1–4 kg, making a total of 8.5–11.5 kg perperson per year. Tichit (1981) estimated domestic beef con-sumption in 1967 at an average of 3.27 kg per person peryear, with an estimated annual slaughtering of 8.5%(150,000 head) of the national cattle herd of 1,795,000 and1.7% (12,000 head) of the national buffalo herd (684,000).The same author estimated that clandestine slaughteringwas greater than officially declared by a factor of 1.3.
In this document, herd models for cattle and buffalo,and pigs and poultry, are constructed that attempt to giveindicative values for the annual average per person intakeof the various animal types. Table 8 summarizes the esti-mated annual average intakes of a variety of foodstuffs andthe amount of protein that they represent.
This intake is strongly skewed between rural and urbanpopulations: meat makes up a much smaller percentage ofthe protein intake among rural populations than urban. In-take of pork, duck meat, and duck eggs is traditionally con-sidered high among Chinese and Chinese-Khmers, who pre-dominantly belong to the merchant class of the towns andcities.
Quantifying the amount and types of food that farmerseat is difficult but a few generalizations can be made. Rice,fish, and green leafy vegetables are the main foods in therural Cambodian diet. Rice is estimated to make up 70% ofthe energy requirements of the average Cambodian villager,and up to 90% in poorer families (Mak, personal communi-cation).
Fish, either fresh or in the form of preserved prahoc, isthe most important source of protein, but intake varies sea-sonally. Frogs, crabs, shrimp, and birds scavenged from fieldsare also a major source of protein.
Farmers themselves consume relatively few livestockproducts. Chickens are commonly slaughtered at around 6months of age for special occasions. Farmers rarely con-sume chicken eggs, but this represents a very small part ofthe protein intake to meet the protein requirements of thefamily. As a guide, if a family of six raises two hens, andslaughters half of all chickens for home consumption, theprotein from the chickens would represent about 5–6% ofthe family’s protein requirements. Cattle, buffalo, and pigsare sold to slaughterhouses but their meat is rarely purchasedin return by the farmers. Pork and beef are commonly con-sumed at ceremonies. Animals that die from an accident orfrom disease in the village are commonly consumed by thevillagers.
Cambodia has long exported live animals to its neigh-boring countries, a trade flow that has been characterizedby large fluctuations in the number of animals exported andchanges in destination. This has been largely due to theextraordinary political and economic fluctuations within

37
Table 7. Demand for livestock and livestock products.
Livestock Live/dead Demand from Demand for
Cattle and buffalo Live Farmers Males for use as draft power, females for breedersFarmers To produce beef for saleSlaughterers For slaughter (domestic)Slaughterers For slaughter (export)Farmers outside Cambodia Export for draft use
Products Farmers Manure for fertilizerDead Farmersa EatingSlaughtered Domestic consumers Edible parts
Consumers outside Cambodia Edible partsTanneries Hides (exported)Animal feed makers Bones
Pigs Live Rice farmers Young pigs to fatten or breedMerchants Young pigs to fatten or breedSlaughterers For slaughter (domestic)Slaughterers For slaughter (export)
Deadb Farmersb EatingSlaughtered Domestic consumers Edible parts
Consumers outside Cambodia Edible partsAnimal feed makers Bones
Chickens Live Farmersa EatingMarket sellers For slaughter and sale
Products Farmersa EggsDeadb Farmersa EatingSlaughtered Domestic consumers Edible parts
Consumers outside Cambodia Edible partsDucks Live Farmers Young for raising for egg production
Farmers Young for raising for meat productionMarket sellers For slaughter
Products Farmers For eating eggsConsumers For eating eggs and baby duck eggs
Deadb Farmers EatingSlaughtered Domestic consumers Edible parts
International consumers Edible parts
aDenotes that middlemen are not usually involved. All other transactions are usually carried out with middlemen. bDistinction is made between dead animals and slaughteredanimals. Dead animals are those that die from disease or accident, usually in the village. It is common for farmers to sell a very sick animal to a middleman or slaughterer whenthey think it will die soon, for a discounted price. This type of animal may or may not be taken to a slaughterhouse; the meat will be sold at local markets. Animals that diein the village are commonly slaughtered in the village and the meat is sold locally. Farmers bury the bones of the animals in this case.
Table 8. Estimates of intake per person per year and kg of protein consumed per year for various foodstuffs.
Type kg (person–1 year–1) % protein kg protein person–1 year–1
Fish 40 40 16.0Cattle and buffalo 3 15 0.5Pigs 8 15 1.2Poultry 6.5 15 1.0Rice 150 6 9.0
Cambodia and neighboring countries over the last 40 years,which has created demand for food across porous interna-tional boundaries that are no barrier to a black market wheretrade is unregulated. The export of cattle, particularly breed-ing females, has at various times been illegal, having beenimposed by Cambodian governments at various times tostop the flow of animals that were considered better used forfarming, or breed calves to increase livestock numbers. Giventhe unrest in the region, it is not surprising that such laws
are almost impossible to enforce, with the result that ex-ports are not strictly controlled. Nevertheless, the sectionon cattle and buffalo production contains an estimate of thenumber of cattle and buffalo exported based on assump-tions of domestic beef consumption and the national herdstructure.
From 1950 to 1979, war in Vietnam increased demandfor rice and livestock for armies and refugees concentratedin the cities. Vietnam has continued its strong demand for
38
cattle and buffalo not only for meat but also for draft power.Pigs, buffalo, and rice bran were exported to Vietnam inearly 1997.
Economic growth in the 1980s in Thailand and Malay-sia fueled demand for cattle, among other agricultural prod-ucts, and informal reports indicate that this trade flow con-tinues despite the recent Asian economic crisis.
Past trends and current performance in livestock. Withthe exception of poultry, the growth rate of the animal stockhas not been particularly strong in Cambodia. Unfortunately,the lack of data on slaughtering and liveweight does notpermit drawing clear conclusions as to the growth perfor-mance of different species. Large animals in Cambodia (cattleand buffalo) are still used mostly for traction. Their numberhas declined over the past decades mostly as the result ofintroducing mechanization. Pigs also declined from 1996to 2000 because of the adverse effect of floods. Poultry madequite a remarkable growth in production, which reached anaverage of 8.8% of total livestock in 1996-2000.
Traditionally, large animals (such as cattle and buf-falo) are kept for draft power. Older animals are sold forslaughter in urban areas or for local consumption, and trad-ing of live animals among farmers is to replace old draftanimals. Movement of live animals across provinces andtrade in large live animals are not commercial.
Demand for meat in neighboring countries is projectedto increase. Thailand, Indonesia, and Malaysia are alreadyimporting large numbers of live animals. In Vietnam, a short-age of meat is expected in the near future as the living stan-dard is improving. The smuggling of live cattle across theborder from Cambodia to Vietnam occurs, but the number isstill relatively small. Findings from the SEDP (Socio-Eco-nomic Development Plan) field survey in the border areasof Thailand confirm that holding pens for live cattle alongthe border are established, and undeclared exports of livecattle to Thailand have been ongoing for several years.
In 2000, the Mong Rethy Investment Company (MRT),in a joint venture with the Malaysia RML Company, estab-lished the MRT-RML Livestock Corp. (Cambodia) Pty. Ltd.,based in Prey Nub District, Sihanouk Ville. Their facilitiesconsist of three holding sheds with a capacity of 2,500 head,which are held for 30–60 days for fattening, before they areloaded onto barges destined for Malaysia. Feed is boughtlocally, except for concentrate that is imported from Malay-sia.
To have sufficient live cattle supplies to fill the feed-lots, the company is collaborating with private agents in 13provinces, some of which are working with district agentswith private financing. The company provides scales as wellas information on quality requirements for the export oflive animals, for example, 40% of the supplied animals mustbe young bulls in good condition, preferably buffalo. Cam-bodian farmers commonly castrate young bulls for use asdraft animals, and supplies of young uncastrated animalsare therefore low. The preferred cattle come from Kratie Prov-ince; they have better resistance to disease and significantlyhigher weight gains than cattle from other provinces. Over-
all, buffalo are the preferred animal because of their goodweight gain and resistance to disease.
Since commencing this export two years ago, the com-pany has shipped more than 10,000 head of cattle to Malay-sia, of which 20% are buffalo. Small landing facilities, pre-viously used for the export of mineral sand, are used forloading the animals onto barges. Government inspectorsare reportedly present when the animals are loaded for ship-ment. The reported average cattle weight is 200–250 kgand the current company gate price is 3,000 riels per kgliveweight. Trucks with a trailer are provided to the agentsby the company for transportation of live animals, and theroad tax (e.g., from Kratie Province) is reportedly 80,000riels one-way.
The traditional pig breed is common in most ruralhouseholds and is an important source of protein. The intro-duced improved pig breed is imported from Thailand andVietnam by farmers located in border areas and Phnom Penh.Improvement to the local breed is taking place in private-sector operations by farmers buying imported boars.
There is an emerging pattern of farmers with improvedbreeds. These farmers have received training in animal hus-bandry and veterinary services, becoming village animalhealth workers and providing services to neighboringsmallholders at a low charge. Their farms become the vil-lage demonstration unit for improvement of animal hus-bandry, including pen building and the use of concentrates.Many of the concentrates come from the CP feed mill, butsome are prepared by farmers themselves, using local farmoutputs or by-products, mainly soybean, maize, rice bran,and dried fish.
Some animal health workers have set up small veteri-nary drug stores selling raw materials for feed and HIGROPokphand concentrates from the CP feed mill. In KampongCham, soybean processors use wastes from bean curd pro-cessing as pig feed. One farmer has built a biogas arrange-ment, using the gas as fuel for cooking.
These pig farms provide an increasing supply of pigs tothe local markets and to Phnom Penh. The marketing chainin the open-market system is short, both for input suppliesand finished products. A 20-kg improved breed piglet cur-rently costs approximately 85,000 riels. After 6 months, the100-kg pig sells at the farm gate to local collectors at 4,000riels per kg liveweight. The crossbreed sells at the farm gateat around 3,000 riels per kg. The incentive for farmers toraise improved breeds and application of proper animalhusbandry should adequately justify investment in newtechnologies.
Occasionally, imports of medium-sized pigs from Viet-nam cause a drop in the market price and local piggeriesencounter losses. For a short period, two to four trucks with70 pigs weighing 60–80 kg per head make daily deliveriesto Phnom Penh. The reason for these occasional importswas reported to be Vietnam’s internally distorted marketconditions, and this is not related to the supply shortageand high prices in Phnom Penh.

39
Socioeconomic aspects of animal production in thecontext of rice-farming systems. Four socioeconomic sur-veys of agriculture have been undertaken at different timesby different agencies. These have been largely of a diagnos-tic nature, with limited follow-up interventions. Those withspecific reference to animals have been undertaken mainlyby NGOs and, to a lesser extent, by the German Agency forTechnical Cooperation and IRRI. The International Devel-opment Research Centre (IDRC) is about to begin a six-month farming systems survey to include animals in thecontext of natural resource management. Analysis of datacollected indicates that the contribution of animals to totalfarm income is considerably high, but the extent of thisdepends on the wealth of farmers and their involvement inoff-farm activities. Preliminary data from a survey of house-holds by IRRI suggested that animals contributed 29% tototal farm income and 75% to agricultural income (Helmers1997, and personal communication). However, this variesaccording to the income level of farm households. For poor,middle, and wealthy households, the contribution of ani-mals to total income and agricultural income was 45% and75%, 25% and 80%, and 18% and 71%, respectively(Helmers 1997, and personal communication).
Constraints to animal production in Cambodia. Thethree major constraints to livestock production are diseases,feed sources and nutrition, and the low genetic potential ofnative breeds. However, the low genetic potential of localbreeds would probably improve with a better quality of feed.Diseases are problems for both ruminants and nonruminants.Their severity affects productivity and causes high mortali-ties with consequent loss of cash income. It has been ob-served that some contagious diseases cause a high rate ofmortality. Cattle and buffaloes commonly suffer from hem-orrhagic septicemia, blackleg, foot-and-mouth disease, andanthrax. Pigs are affected by swine fever, pasteurellosis andsalmonellosis, foot-and-mouth disease, and erysipelas.Newcastle disease and cholera are found in chickens andcholera is a common disease of ducks. Several diseases arefound but no specific steps have been taken to overcomethese by national organizations with international support.Five NGOs are involved actively in the training of localgovernment agents who undertake vaccination in villages.Diseases arise because of poor veterinary services. How-ever, it is likely that undernutrition and poor managementcontribute to these problems. Native breeds are perceivedto be of low productivity by farmers, and genotype is re-garded as a constraint to production. However, the realiza-tion of genetic potential may simply be a matter of improv-ing nutrition, management, and disease control rather thanthe introduction of exotic breeds of often dubious value.
There are clear opportunities to improve the ruminantfeed supply and its use. Urea treatment of straw and the useof nutritional blocks of urea, rice bran, and molasses arealready being promoted. Grasses such as Napier grass arebeing sown on paddy bunds, and herbaceous legumes suchas species of stylo could be sown on roadsides to be used byanimals. Multipurpose trees could also be sown on paddy
bunds and around households, while annual legumes couldbe established as relay crops in lowland rice. Significantdevelopments have been made in the last decade in theselection of legumes adapted to acid, infertile soils and theselegumes are more productive than the older Australian cul-tivars.
The majority of Cambodian farmers are too poor to in-vest in animal production without any support. The lack ofa government assistance project to support the rural poortogether with the high interest rate for loans from creditinstitutions discourage farmers from including animal pro-duction in their farming system. Unlike rice production,animal production needs to pay for medical care, includingmedicines, vaccinations, and veterinary costs, and somematerial and equipment are also costly. The developmentof ICAS, which involves different parties, rice and nonricecrops, and animal scientists and extension workers, couldface difficulty since crop and livestock specialists usuallycome from different institutes with different philosophies.
ICAS typology on rice-based farms
Crop-animal interactions benefit small farmers and contrib-ute to the sustainability of mixed farming systems. Draftanimals can speed up farming operations such as plowingand cultivating, and increase the land area prepared for crop-ping. Improved tillage requires extra power, for which re-sources of male labor are presently inadequate, while soilconservation operations such as terracing and ridging areunlikely to be done by male labor. Animals can provide therequired extra power.
The lower compaction resulting from land preparationusing animal traction, compared with tractor plowing, alsoreduces erosion hazards. In Cambodia, hillsides have beenleveled into terraces for rice fields, and then re-leveled us-ing draft animal power annually to ensure an even spread ofwater and its re-distribution to the lower paddies. Withoutsuch a system, erosion of rice fields would have made farm-ing unsustainable within a few years. The vast majority offarmers in the region could not afford to buy tractors toreplace draft animal power. The use of renewable animalpower instead of nonrenewable fossil fuels and tractors has,among other things, reduced carbon dioxide and carbonmonoxide emissions into the atmosphere.
There are many interactions between crops and farmanimals in Cambodia. At times, livestock may be the onlyway farmers can benefit from community resources, such asgrazing lands or forests. Livestock provide an alternativemarket for crops with the use of low-quality roughages andpoor-quality grains. In addition, livestock ownership pro-vides a safe investment that can be stored and that producesan increased return through reproduction and gain in bodyweight. This flexibility in marketing and savings adds tothe sustainability of farm enterprises and protects againstnatural calamities.
However, livestock do compete with food crops for landand labor. Forages may occupy land or can be intercropped

40
with food crops, planted in hedgerows, or confined to landtypes that are difficult to manage. Livestock definitely com-pete for farm labor, which is needed to feed and care for theanimals and process the resulting products.
Crop-animal interactionsThe integration of crop and animal production is particu-larly well developed in the rainfed lowland farming sys-tems of Cambodia, particularly those in smallholder agri-culture (Table 9).
Animal traction. Draft animal power has a long historyof use in smallholder farming systems in Cambodia. Largerruminants provide power for land preparation, soil conser-vation practices, and haulage.
Draft animal power is especially important in farmingsystems that are isolated from infrastructure and have a highland-to-population ratio. Both buffalo and cattle are usedfor farm power, although buffaloes are the most importantdraft animal in Cambodia.
Animal feed from crops. Crop production provides arange of residues and agricultural industry by-products(AIBP) that can be used by ruminants and nonruminants.These include cereal straws (e.g., rice and maize), sugarcanetops, grain legume haulms (e.g., peanut and cowpea), rootcrop tops and vines (e.g., cassava and sweet potato), oilseedcakes and meals (e.g., oil palm kernel cake, cottonseed cake,and copra cake), rice bran, pineapple and citrus pulp, cocoapod husks, coffee seed pulp, and bagasse.
In Asia as well as in Cambodia, rice straw is the princi-pal fibrous residue fed to more than 90% of the ruminants.
Weed control. Animals grazing vegetation under pe-rennial tree crops such as rubber, oil palm, and coconut cancontrol weeds and reduce the cost of herbicide use. In rub-ber, the cost of herbicides can be as much as 30% of the totalproduction cost in the early years of the plantation. Most ofthe native vegetation of grasses, legumes, and broadleaf
plants (often 60–70% of floristic composition), found inthe interrows of rubber plantations, is acceptable to rumi-nants such as sheep. Compared to using herbicides, whichneed protective measures to minimize contamination, theuse of sheep is safer for the operator and the environment.
Manure. Both ruminants and nonruminants providemanure for the maintenance and improvement of soil fertil-ity. Manure is used widely throughout Cambodia. Wherethe use of artificial fertilizers is low, soil fertility depletionis a major constraint to agriculture, particularly in the hu-mid and subhumid climates. Even when inorganic fertiliz-ers are applied, crop yields may not be maintained undercontinuous cultivation on poor-fertility sandy soils with alow buffering capacity. The use of only mineral fertilizerscan decrease soil pH and base-saturation and increase alu-minum toxicity. Organic materials applied in bulk can im-prove soil texture, promote better absorption of moisture,reduce runoff, and prevent crusting of the soil surface. Evensmall quantities of organic materials can bring about markedimprovements in the cation exchange capacity of soils.Manure is also valuable in reversing the deterioration insoil structure in sodic soils, characterized by a high contentof exchangeable sodium and low permeability.
A framework for describing livestock-rice systems. Afarming system can be described by the flows of three quan-tities: protein, energy, and cash. There are opportunities forexchange among these three categories (for example, en-ergy or protein can be bought or sold). But, in subsistenceand semisubsistence systems such as those found in ruralCambodia, these three flows are not well integrated throughthe cash economy. It makes sense to treat them separately,since all three need to be provided for the maintenance anddevelopment of rural households.
If this framework is accepted, the different contribu-tions of livestock and rice to “rice-based farming systems”become more readily apparent.
Table 9. Main crop-animal interactions in mixed farming systems.
Crop production Animal production
Crops provide a range of residues and Large ruminants provide power for operations such as land preparation and soil conservationby-products that can be used by practices.ruminants and nonruminants.
Native pastures, improved pastures, Both ruminants and nonruminants provide manure for the maintenance and improvement ofand cover crops growing under soil fertility. In many farming systems, manure is the only source of nutrients for cropping.perennial tree crops can provide Manure can be applied to the land or, as in nonruminant systems in Cambodia, to the watergrazing for ruminants. that is applied to vegetables whose residues are then used by nonruminants.
Cropping systems such as alley- The sale of animal products and the hiring out of draft animals can be used for cropcropping can provide tree production inputs such as fertilizer and pesticides. Animals grazing vegetation under treeforages for ruminants. crops can control weeds and reduce the use of herbicides in farming systems.
Animals provide entry-points for the introduction of improved forages into cropping systems.Herbaceous forages can be sown in annual and perennial crops and shrubs or treesestablished as hedgerows in agroforestry-based cropping systems.
41
Protein and energy are the most important componentsof food. This is not to belittle the importance of the othercomponents of food, such as vitamins and minerals, and acertain amount of fiber. Obviously, water is critical to anyform of life also. The use of a protein-energy-cash approachto understanding farming systems is not meant to precludethese other entities; it is intended simply as a framework forunderstanding and describing the major interactions in rice-livestock farming systems.
An analysis of how these three quantities—energy, pro-tein, and cash—flow within a farming system needs first toconsider the nature of the demand for each quantity: howmuch protein, energy, and cash are needed by a family overa year, when are they needed, and in what quantities?
Second, the analysis needs to consider how and whenthe quantities are produced, including the amount of eachquantity needed as an input to production, and when thatinput is needed.
Third, the method of storage of each of the quantitiesneeds to be taken into consideration to minimize lossesduring storage.
Last, there needs to be some consideration of how, withina specific farming system, the three quantities are inter-changed, or, in other words, how one quantity is convertedto another.
Rice is the major source of energy for Cambodian farm-ing families, and can be considered almost synonymouswith the word “energy” in the Cambodian farming system.It is needed every day and the amount needed varies ac-cording to the number of family members and the activitiesthey are carrying out. For example, a mother nursing a youngbaby will need extra rice to produce milk, and any memberof the household who is doing hard physical work will needextra rice to eat.
Rice requires labor (energy), which is an important in-put for production, both human and animal, which may ormay not be purchased with cash, depending on the indi-vidual situation. Cash is usually required to purchase seedand chemical fertilizer. The amount and availability of la-bor inputs for rice production depend on the rice produc-tion system—wet season, early wet season, dry season, float-ing. It is hard to set a fixed deadline for rice productionbecause it also obviously depends on the same factors.
Rice is mostly stored as paddy and taken to the mill formilling. Processing is usually a cash-free transaction. Paddyis stored relatively easily, and the risk of wastage from dam-age or theft can be kept to a minimum. Risks involvedrought, flood, pests, or other causes of crop failure or re-duced yield.
Rice can be exchanged for cash, which is a long way tosay “sold,” in cases when there is an excess above homeconsumption needs, or when cash is needed and rice is thebest alternative to sell. An advantage in converting rice tocash is that it is not “lumpy.” Small or large quantities ofrice can be sold. This is in contrast to the sale of animals,which is lumpy. The minimum you can sell is one head.
Income from rice selling is used to pay debt incurred bythe farmer and this is a form of converting rice to cash. Pay-ment with rice to pay back the hiring of animals is a form ofconverting rice to energy without a cash transaction. Theexchange of rice for protein is not a common practice.
An important point about rice production is that, onfarms where all the rice is used for human consumption, andcash has been spent on the crop (e.g., for fertilizer), rice is anet cash consumer.
In farming systems where rice is produced largely forsale, such as is often the case with dry-season recession rice,rice should not be considered as an energy source, but rathera cash source. There is obviously a large gray area in be-tween considering rice as a cash source on the one hand oras an energy source on the other: this will vary from farmerto farmer, year to year, and system to system. An under-standing of this concept is a key point in understanding afarming system.
Rice straw is a by-product of rice production that pro-vides a major energy source for cattle and buffalo. It is there-fore appropriate to consider it as a major energy product ofrice production. Rice straw is not needed year-round, but isneeded during those periods of the year when grazing is notavailable, which is usually in the late dry season and wetseason. Inputs to the production of rice straw are obviouslythe same as those for rice. The timing of production alsoobviously follows that of rice.
Rice straw is stored relatively easily, and losses fromdamage, usually by water, can be kept to a minimum bygood stack design and putting the stack in a place where itwill not get flooded. Rice straw can be processed into usefulfeeds, by combining it with water and other feeds, and intousable energy and protein by being fed to cattle and buf-falo. Rice straw is a tradable item: it is converted to energywhen it is used to pay laborers, and is converted to cash ifsold to other farmers.
Humans need protein every day and, similar to energy,the amount of protein needed by a family will depend onthe size, nature, and activities of the family members. Largerfamilies obviously need more protein than smaller families.Growing children need a greater portion of protein in theirdiet than do adults; a nursing mother needs a high amountof protein also for good milk production.
Protein produced and consumed by farm families isusually in the form of fish and chickens, in some cases alsochicken eggs. Variation is large among households in thesame farming system. There are various types of fish pro-duction: fish can be captured from wet-season canals, wet-season rice fields, lakes, and rivers, or cultivated in ponds.Chicken production varies little, mostly being free-rangehousehold scavengers with small amounts of feed supple-ments.
Inputs to production of fish and chickens vary but areusually relatively low in terms of both energy (labor) andcash. Of these production systems, pond fisheries probablyhave the highest inputs of labor for constructing ponds andcash for feed.
42
Wet-season canal fish capture, like dry-season lake orcanal capture, has inputs of only some labor and a smallamount of cash for equipment. Rice-field fishery capture’sonly input is some labor to dig a trench. Chicken raising hascost at the start of production for purchasing stock: feedingis mostly a direct conversion of paddy energy stores to pro-tein because the chickens may be fed some paddy.
The period of protein production varies according tothe source. Catching of fish is a common dry-season activ-ity for many farmers who travel to areas such as Tonle Sap orother lakes and ponds specifically for this purpose. Duringthe wet season, fish are captured from canals around ricefields. At the end of the wet season, when rice fields aredrying out and harvesting approaches, fish are captured fromrice fields. During the dry season, ponds dug near the housespecifically for fish capture are an important source of fish.
There is no specific seasonality of edible chicken avail-ability. Chickens could bring about disease outbreaks,which seem to commonly occur at the end of the dry season.Though less information is available on chicken diseaseoutbreaks, chickens will be sold or eaten in the face of anoutbreak of disease, and availability of edible chickens willincrease slowly again over the wet season.
Storage of fish protein is very common in Cambodianvillages, in the form of prahoc. In many areas, preservedfish is a major source of protein for the family for manymonths of the year. Digging of ditches near rice fields andof ponds near houses is in effect a form of storing live fish:these practices lead to an extended harvesting period be-yond the harvesting date. There is no form of storage ofchicken postslaughter. It is unusual to see chickens raisedbeyond the age of 6 months, which is the optimum time forselling or eating them, except for breeding birds.
It is clear from this discussion that there is considerableinterchange between protein and cash. Any of the aboveprotein sources, the various kinds of fish and chickens, canbe easily converted to cash, or vice-versa, according to theneeds of the family at certain times of the year and accord-ing to the type of farming system operated. One commonexample of conversion of fish protein to cash is the case offish raised in ponds near houses over the dry season: sellingthese fish at the end of the dry season earns cash for cel-ebrating the Khmer New Year.
This raises the question, similar to that noted above forrice, as to whether a certain activity in fish or chicken pro-duction should be classified as protein-producing or cash-producing. This may vary from farmer to farmer, from yearto year, and from farming system to farming system. Again,the understanding of this is a key to understanding the farm-ing system.
Fish and chickens can be sold at a minimum amount ofone. It is not appropriate to call them “lumpy” assets sincethey are so small. Preserved fish can be traded in small quan-tities.
It may be tempting to attempt to correlate the degree towhich cash is generated from each of these individual types
of protein production with the degree to which each indi-vidual type of production needs cash. This, in fact, is thebasic assumption made by those who carry out, for example,a gross margin analysis of any of the individual productiontypes, such as chicken raising or fishpond production. Ofcourse, the subsistence farming system is more complex thanthat, and this is one more reason to use a protein-energy-cash framework for understanding the farming system, ratherthan trying to convert all farm interactions to a commondenominator of cash.
The nature of a farmer’s need for cash is a complexissue: cash is needed to buy food not provided by the farm,for farm operating costs, for clothing and schooling costs,and for fulfillment of social and traditional activities suchas weddings or religious festivals. An analysis of a farmer’scash demands can become hopelessly complex to the pointwhere a roomful of sociologists and economists could beemployed full-time for years. This is not the aim of thosewishing to understand farming systems as a stepping-stonein doing something to help farmers.
Cattle, buffalo, and pigs can be considered primarily ascash producers for the farmer. But it is critical to understandthe differences among them.
Pigs are cash producers in the purest form. They areraised in response to a demand from the farmer to generatecash, which occurs whether or not a profit is made.
Production requires cash and a small labor input. Acapital cash input is required for the purchase of the pig andfor any housing. Cash is needed on a more or less daily basisfor feed, since rice bran is a basic feed and it must be boughtfrom the rice-miller. The rice portion of the diet may beconsidered an investment of energy for a future cash return.Extra cash will be needed for treatment if the pig is sick.
The amounts of inputs for growing fatteners are relatedto the pig’s stage of life: cash to buy the young pig, and anever-increasing daily amount to buy feed as the pig eatsmore as it gets older.
The time to sell is also related to the animal’s weight.There are two optimum weights for selling fatteners, either3–4 months after purchase or 6–8 months, which suit thetwo markets of farmers who wish to buy pigs to “finish” orthe slaughterhouse.
Farmers decide when they will buy piglets, and they donot have much leeway in deciding when to sell the pigs,with relatively little regard for seasonal conditions outsidetheir control. This means they can manage the need for in-puts and generation of outputs according to their own plan.This is in contrast to rice production, which is seasonallydetermined.
Fatteners are not the best means to save cash: to keepthem beyond the optimum selling weight is very inefficient.A high risk of sickness and death gives pig keepers evenmore risk.
Breeding sows, on the other hand, because of their longerproduction cycle, are more useful as cash savings that canbe mobilized at a range of times. The optimum sow age is

43
around 3–4 years, but the sows can be kept even longer ifthey can produce good litters and do not lose weight; then,they can be considered as efficient producers.
Breeding sows are better producers and stores of cashthan fatteners since they have a low sick or death rate. Fat-teners have the advantage of less capital cost, and they re-quire less experienced pig keepers.
Cattle are raised by farmers primarily in response to ademand for energy for draft power. However, cattle can gen-erate significant amounts of cash and can be considered as arich source of income. Breeding animals generate cashthrough sale or calves, and draft cattle through activitiessuch as transporting logs and draft power in farming.
Cattle production requires minimal cash inputs afterthe initial investment in stock and equipment, such as plows,harrows, and a cart as well. A purchase of a breeder requiresno further cash for equipment. Running costs are mostlyfamily labor and rice straw (energy) inputs, except for theongoing repair of equipment or treatment of sick animals.Both cattle and buffalo have the advantage of being able tograze in fields. Therefore, cattle can be considered as low-input production but they produce high energy and income.
Inputs are largely seasonally required, but, since theseare mostly noncash, the implications are only importantinsofar as they may divert labor from other tasks. Since chil-dren can be responsible for taking care of cattle, there islittle effect on key family labor for farm operations.
Cattle are an extremely efficient source of both cashand energy in Cambodian farming systems. Their long pro-ductive lifetime of up to 8–10 years means that they main-tain their value very well. They can lose weight during pe-riods of poor feed supply and during good times withoutserious penalty to their own well-being, as long as no severefeed shortage occurs when they are very young. This is incontrast to rice, which, because of its relatively short pro-ductive life, can be seriously affected by a range of set-backs. Young animals risk death or sickness as well as theft,whereas rice production does not face this problem.
The value of cattle is partly as a cash source as they canbe easily sold to existing markets as breeders, as draft ani-mals, or in terms of beef, either for domestic consumption orfor export. There is variation in mobilizing the cash assetaccording to the proximity to markets. In this aspect, cattleare a lumpy asset: a minimum of one head can be sold. Forthis reason, they tend to be sold when there is a “lumpydemand” for cash, such as when crop failure occurs.
Draft animals can be cash generators of an extremely“unlumpy” nature. Examples of such cash generation arelog transport or farm draft power. These are both examplesof converting the energy inside them to cash.
Buffaloes are adapted to soil preparation under wet orheavy soil conditions that do not suit cattle. They representan efficient storage of energy and cash, with a longer periodof productive life than cattle, although their susceptibilityto disease when they are young reduces this effectiveness.Because females can be used for plowing also compensatesfor the drop in cash-generating ability that comes from their
poor reproduction and relatively high young mortality rate.Buffaloes are not sold as easily as cattle because their meatis not popular in Cambodia, although there appears to be nosuch prejudice in neighboring Vietnam.
Competition between crops and livestock
Cambodia has an estimated 1.2–1.3 million farming house-holds. These farmers have been divided into four groupswith different agricultural practices and attitudes:
• Rice producers, most of whom produce rainfed low-land rice, own a few animals, and make a small in-come from sugar-palm tapping. Other rice farmers groweither flood recession paddy rice or floating paddyand earn money with seasonal work in cities and townsor by cutting and selling wood.
• Commercially minded nonrice farmers who produceand sell crops such as tobacco, fruit, and vegetableson river banks, such as vegetable farmers in Kien Svay.
• Upland farmers who make a living from permanent orseasonal crops such as soybean and mungbean, andkeep livestock integrated with the rice crop.
• Indigenous farmers who practice swidden agriculturein the northeast of the country.
Livestock and rice-farming systemsAt the farmer level, livestock production in most parts ofCambodia is so intimately related to rice production thatneither can be studied or understood in isolation from theother. Similarly, in the private sector, activities of thoseentities involved with processing and marketing of rice andrice by-products have a direct impact on livestock produc-tion, since rice by-products such as straw, broken rice, andrice bran are the basis of animal feeds.
Women and children in thecrop-livestock systemOne of the farming situations in which women and childrenmake a pronounced contribution to on-farm and nonfarmlabor is crop-animal production. On such mixed farms, thework is diverse and intensive so that family members (men,women, and children) need to help each other.
Generally, labor is rigidly divided between men andwomen in agriculture. Men are in charge of land prepara-tion, irrigation, fertilizer application, and mechanical thresh-ing, whereas women are responsible for soaking and broad-casting seeds, pulling seedlings, transplanting, weeding,controlling rats, harvesting, cleaning, drying, storing, ani-mal raising, feeding, purchasing, selling, and also socialactivities in the village (ceremonies, meetings, and credit).Male children do land preparation whereas female childrendo harvesting. Both male and female children do transplant-ing.
For animal care, women and children perform a majorrole in feeding, watering, and grazing. Furthermore, the con-trol, feeding, and marketing of swine and poultry on a back-yard farm are mostly done by women. This demonstrates

44
that the important contribution of women and children in acrop-livestock enterprise should be incorporated in researchmethodologies and analysis.
Attitudes toward livestockLivestock production and marketing are activities gener-ally divided along lines of ethnicity because of the variousreligious beliefs and customs of the different racial groupsin Cambodia.
The majority of Cambodian farmers are Khmers, whoseattitude toward livestock is strongly influenced by theirBuddhist religion, culture of subsistence, and emphasis onrice production. A Buddhism rule states that Buddhists haveto respect all living things and cannot treat animals badly,kill them, or raise them for slaughter. If a person does a badthing to an animal, that same thing will happen to the per-son in the future. This is known as committing a sin (tverbarb). There is no prohibition, however, on the eating ofmeat.
Despite these precepts, Khmers commonly raise pigsfor slaughter; cattle and buffalo, though raised mainly fordraft power, are destined for slaughter; poultry are also raisedfor slaughter. This shows a certain pragmatism in followingprecepts when family economic fortunes are at stake. Theextreme example of the prohibition of slaughtering seemsto largely remain, however, and the slaughtering business isrun by others: the Chinese dominate pig slaughtering andthe Cham people (Muslim) dominate cattle and buffaloslaughtering.
Chinese populations, who are, generally speaking, city-and rural-based merchants, also dominate the duck produc-tion system, and, not surprisingly, they are high consumersof pork, duck meat, and eggs. Cham people do not raise pigsor consume pork. Cham farmers in rice-growing areas oftenhave cattle-raising as a significant enterprise; they also raisesome goats and sheep. Many Vietnamese middlemen in thepig industry commonly provide services to farmers such ascastration of young male and female pigs.
Ethnic minorities in northeastern Cambodia believe inspirits that inhabit the environment, and that determine thefortunes of the people. As a result, their attitude toward ani-mals is entirely different from that of the Khmers. Theseminorities readily slaughter animals for sacrificial purposes.In farming practices, they do not use cattle or buffalo forplowing their upland fields, but these animals are highlyvalued for sacrificial purposes.
Intensification and sustainability of ICAS
Livestock development is foreseen as a potential livelihoodin rural areas for improving nutrition and generating in-come. Providing opportunities for the development ofsmallholders fits well with the government policy for foodsecurity and poverty reduction by supporting service forlivestock owners in animal husbandry, disease prevention,credit, and marketing. A medium- and long-term approach
is the privatization of the animal health, and productiontechnology and service sectors, which are to be managedand coordinated provincially and nationally by the Depart-ment of Animal Health and Production (DAHP), with a man-date from all stakeholders nationally and internationally(National Strategic Plan for Animal Health and Production,DAHP 2000). Improved profitability is needed, however, toencourage investment in livestock production. This is re-lated to the production of better-quality feed, which couldincrease livestock yield.
Farming systems that are ecologically, biologically, andsocioeconomically sound involve crops and animals andalso depend on their integration with other farm practices.The integrated crop-livestock farming system can be con-sidered sustainable because it focuses on the use of renew-able resources. Consequently, because of the efficient useof solar-energy-based resources (i.e., forages, crop residues,and by-products), there is less use of external inputs, fertil-izers, and pesticides that would affect the environment. Cropand animal integration would be an alternative methodol-ogy to maintain the environment.
The use of broken grains and by-products of rice andother crop production is a sound economic practice. Cropresidues are a major source of feedstuffs for ruminants. Ricestraw provides a major source of usable crop residue. Thepotential value for underused by-products should be fullyobtained.
Animal manure is an important source of nutrients tomaintain and improve soil fertility and minimize the use ofinorganic fertilizer. A major portion of important plant nu-trients ingested by ruminants is returned to the soil via fecesand urine. Of the plant nitrogen and minerals consumed bygrazing cows, 95% of the nitrogen and 96% of the mineralswere returned to the soil. Animal traction as a source of farmpower reduces the use of petroleum in farm operations, thusminimizing the polluting effect of fuel combustion for ma-chinery. With integrated rice-duck farming, ducks couldserve as a biological control for rice pests, including weedsand snails. This would reduce if not eliminate the use ofchemical pesticides, which harm both the environment andhumans.
These are just some of the sustainable characteristics ofthe integrated crop-livestock farming system. Conceptualmodels are needed to study the interrelationships and toidentify areas that need further investigation to derive im-proved alternative production systems.
There is a need for better management of the use ofadditional sustainable feed resources and credit availabil-ity to build stocks. The potential for increasing livestockproduction is a useful methodology for encouraging na-tional and international investment in commercial livestockfarms. This investment could boost local capital/credit andtechnology transfer, resulting in an improvement of localand household production and processing of raw materialsfor animal feed such as maize and soybean.

45
References
Cameron A. 1995. Overview of the marketing of agriculturalproducts in Cambodia. Ministry of Agriculture, Forestry, andFisheries, Phnom Penh, Cambodia.
Chandler DP. 1993. The beginnings of Cambodian history. In: Ahistory of Cambodia. 2nd ed. Boulder, Col. (USA): WestviewPress.
Delvert J. 1961. Le paysan cambodgien. Phnom Penh: Mouton &Co.
Helmers K. 1997. Rice in the Cambodian economy: past andpresent. In: Nesbitt HJ, editor. Rice production in Cambodia.Manila (Philippines): International Rice Research Institute.p 1-14.
Javier EL. 1997. Rice ecosystems and varieties. In: Nesbitt HJ,editor. Rice production in Cambodia. Manila (Philippines):International Rice Research Institute. p 39-81.
Lando RP, Mak L. 1991. Srey Ampal: a baseline survey of dryseason rice in Cambodia. Baseline Survey Report No. 4.Manila (Philippines): International Rice Research Institute.
MAFF (Ministry of Agriculture, Forestry, and Fisheries). 1996.Department of Planning and Statistics. Bulletin of Agricul-tural Statistics and Studies, No. 2. Phnom Penh, Cambodia.
Ministry of Planning. 2003. National Institute of Statistics. Bulle-tin of National Accounts of Cambodia 1993-2002, No. 7.Phnom Penh, Cambodia.
Nesbitt HJ, editor. 1997. Rice production in Cambodia. Cambo-dia-IRRI-Australia Project. Manila (Philippines): Interna-tional Rice Research Institute. 112 p.
Nesbitt HJ, Chan Phaloeun. 1997. Rice-based farming systems.In: Nesbitt HJ, editor. Rice production in Cambodia. Manila(Philippines): International Rice Research Institute. p 31-37
Paris TR. 1992. Providing a framework for gender impact as-sessment of CIAP’s technologies and identifying strategiesto address gender issues in CIAP’s research and trainingactivities. Cambodia-IRRI-Australia Project. Phnom Penh,Cambodia.
Pingali PL. 1988. Kampuchean rice economy: an overview ofthe constraints to output growth. Manila (Philippines): Inter-national Rice Research Institute.
Rickman JF, Om S, Khiev CT, Nhem S. 1995. Farm mechaniza-tion and crop production in Cambodia. Baseline Survey Re-port No. 5. Manila (Philippines): International Rice ResearchInstitute.
Tichit L. 1981. L’agriculture au Cambodge. Paris: L’AgencedeCooperation Cuturelle e Technique.
Notes
Author’s address: Socio-economics Program, Cambodia Agri-cultural Research and Development Institute (CARDI),Phnom Penh, Cambodia.

46
Current status of integrated crop-animalsystems (ICAS) in Vietnam: a case studyin the Mekong DeltaLe Thanh Duong, Nguyen Duy Can, and Tran Thi Phan
Executive summary
Being the main rice bowl of Vietnam, the Mekong Deltaregion produces more than one half of the total rice produc-tion of the country. The Delta currently has about 2 millionhectares under rice cultivation. Approximately 70% of therice area is irrigated or semi-irrigated lowlands and 30% israinfed lowlands. The Delta has three major rice croppingsystems: double, triple, and single rice cropping, of which80% of the area is cultivated with modern rice varieties.Triple rice cropping is practiced on alluvial soils under irri-gation and shallow or noninundated areas. Double rice crop-ping is most commonly practiced in the Delta and in flood-plain areas on slightly and medium acid sulfate soils, and inrainfed coastal areas. Single rice cropping (mainly tradi-tional local rice and medium-duration rice varieties) is prac-ticed in rainfed areas. Crops other than rice are mostly prac-ticed in double and single rice-cropping systems with up-land and field crops, or aquaculture with fish and shrimp(both in fresh and brackish water).
Although the Mekong Delta is famous for rice produc-tion, it can produce a remarkable amount of different kindsof fruits, fish, and, most recently, brackish-water shrimp (ti-ger and banana shrimp) for high-value exports. Besides riceand other crops, shrimp, and fish, farmers raise livestockand poultry for family consumption and for cash, of whichcattle, pigs, chickens, and ducks are the most common. Re-sults from recent farming systems research projects showedpositive responses in farm household livelihoods and eco-nomic viability when farmers practiced integrated farmingsystems. However, small-scale livestock production is mostcommon, and few farmers raise chickens on a large scale.According to the 2000 census, the number of head of majorlivestock by type are cattle, around 0.2 million head; buffa-loes, 0.064 million; and pigs, 2.97 million. Chickens andducks are mostly for home use, with 20–50 head per house-hold. In addition, the level of integration of livestock and poul-try with rice cultivation is different among agroecosystemsand depending on household economic situation.
The increase in demand for food, not only for rice butalso for other crops and protein products, including fish,
shrimp, meat, and milk, is expected to take place with afurther expansion of the population in the Delta to about17.7 million in 2005 and 18.9 million in 2010. As we ex-plain, the growth in the demand for meat and milk is of greatimportance as daily composition of the diet changes suchthat people will consume more animal protein and less rice.The role of animals in filling the needed total calorie re-quirements of the people will become more and more cru-cial. The largest source of animal protein among the smallfarm households has been from integrated crop-animal sys-tems (ICAS). These systems have so far been undertaken ona small scale and the types of animals integrated with riceand aquaculture vary by agroecosystem. Intensifying thesesystems is necessary to prepare for the expected increases inanimal requirement for food. Further development of ICAS,however, depends on factors that include technical aspectsand agro-physical conditions, socioeconomic conditions,and the political environment.
The project on “Sustainable food-feed systems andimproved livelihoods of the poor in rainfed lowland areas”is implemented to understand the dynamic behavior of farmhouseholds in the ICAS systems and to determine the waysto further strengthen these systems. This phase aims to pro-vide more detailed characterization of ICAS based on thesocioeconomic characteristics of farm households as wellas other nontechnical factors that influence these systemsin different locations and countries in Southeast Asia. Thiscountry monograph provides a backdrop of the project byreviewing the current status of integrated crop-animal sys-tems, particularly focusing on the Mekong Delta of Viet-nam, with the following objectives:
1. To describe the evolution of ICAS, especially in ricefarming systems.
2. To identify issues and gaps in the intensifications ofICAS.
3. To determine research and policy implications forintensifying and sustaining ICAS.
The entire endeavor aims to identify ways and meansto strengthen crop and animal systems to help farmers im-prove their well-being.
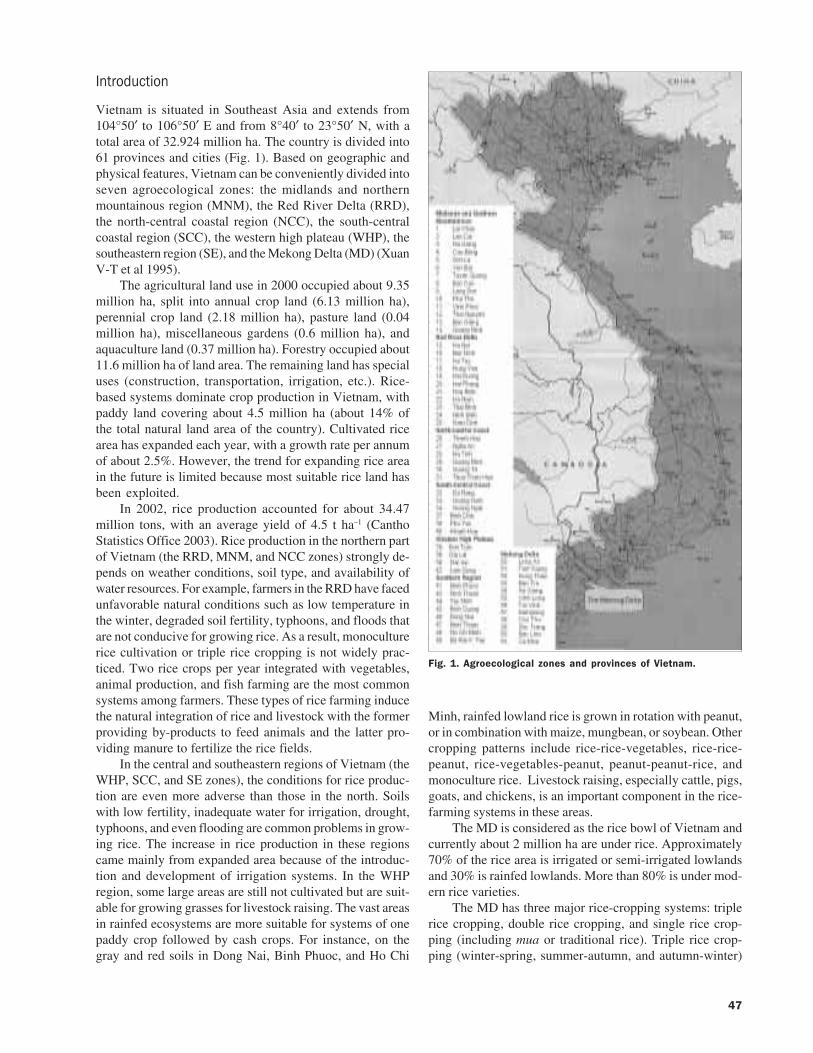
47
Introduction
Vietnam is situated in Southeast Asia and extends from104°50 to 106°50 E and from 8°40 to 23°50 N, with atotal area of 32.924 million ha. The country is divided into61 provinces and cities (Fig. 1). Based on geographic andphysical features, Vietnam can be conveniently divided intoseven agroecological zones: the midlands and northernmountainous region (MNM), the Red River Delta (RRD),the north-central coastal region (NCC), the south-centralcoastal region (SCC), the western high plateau (WHP), thesoutheastern region (SE), and the Mekong Delta (MD) (XuanV-T et al 1995).
The agricultural land use in 2000 occupied about 9.35million ha, split into annual crop land (6.13 million ha),perennial crop land (2.18 million ha), pasture land (0.04million ha), miscellaneous gardens (0.6 million ha), andaquaculture land (0.37 million ha). Forestry occupied about11.6 million ha of land area. The remaining land has specialuses (construction, transportation, irrigation, etc.). Rice-based systems dominate crop production in Vietnam, withpaddy land covering about 4.5 million ha (about 14% ofthe total natural land area of the country). Cultivated ricearea has expanded each year, with a growth rate per annumof about 2.5%. However, the trend for expanding rice areain the future is limited because most suitable rice land hasbeen exploited.
In 2002, rice production accounted for about 34.47million tons, with an average yield of 4.5 t ha–1 (CanthoStatistics Office 2003). Rice production in the northern partof Vietnam (the RRD, MNM, and NCC zones) strongly de-pends on weather conditions, soil type, and availability ofwater resources. For example, farmers in the RRD have facedunfavorable natural conditions such as low temperature inthe winter, degraded soil fertility, typhoons, and floods thatare not conducive for growing rice. As a result, monoculturerice cultivation or triple rice cropping is not widely prac-ticed. Two rice crops per year integrated with vegetables,animal production, and fish farming are the most commonsystems among farmers. These types of rice farming inducethe natural integration of rice and livestock with the formerproviding by-products to feed animals and the latter pro-viding manure to fertilize the rice fields.
In the central and southeastern regions of Vietnam (theWHP, SCC, and SE zones), the conditions for rice produc-tion are even more adverse than those in the north. Soilswith low fertility, inadequate water for irrigation, drought,typhoons, and even flooding are common problems in grow-ing rice. The increase in rice production in these regionscame mainly from expanded area because of the introduc-tion and development of irrigation systems. In the WHPregion, some large areas are still not cultivated but are suit-able for growing grasses for livestock raising. The vast areasin rainfed ecosystems are more suitable for systems of onepaddy crop followed by cash crops. For instance, on thegray and red soils in Dong Nai, Binh Phuoc, and Ho Chi
Minh, rainfed lowland rice is grown in rotation with peanut,or in combination with maize, mungbean, or soybean. Othercropping patterns include rice-rice-vegetables, rice-rice-peanut, rice-vegetables-peanut, peanut-peanut-rice, andmonoculture rice. Livestock raising, especially cattle, pigs,goats, and chickens, is an important component in the rice-farming systems in these areas.
The MD is considered as the rice bowl of Vietnam andcurrently about 2 million ha are under rice. Approximately70% of the rice area is irrigated or semi-irrigated lowlandsand 30% is rainfed lowlands. More than 80% is under mod-ern rice varieties.
The MD has three major rice-cropping systems: triplerice cropping, double rice cropping, and single rice crop-ping (including mua or traditional rice). Triple rice crop-ping (winter-spring, summer-autumn, and autumn-winter)
Fig. 1. Agroecological zones and provinces of Vietnam.
48
is practiced in the alluvial zone where irrigation is avail-able and where there is shallow water but no inundation.Double rice cropping (winter-spring and summer-autumncropping) is commonly practiced in the flood zone withslightly to medium acid sulfate soils (An Giang and DongThap), and in the rainfed coastal zone. Single rice cropping(mainly mua and medium-duration rice) followed by thecultivation of other crops or aquaculture is common inrainfed areas. Though the Delta is favorable for rice produc-tion, it is also suitable for different fruit trees, aquaculture,etc., all of which have been practiced by MD farmers. Forlivestock raising, cattle, buffaloes, pigs, goats, chickens,and ducks are the important animals kept by MD rice farm-ers. However, the level of interaction between crops andanimals is different among agroecosystems and the economicsituation of households.
Crop and animal production indifferent regions of the country
The major characteristics of each region and its agriculturalsituation, with emphasis on rice and animal production, aredescribed below.
The Red River Delta (RRD) regionGeographic and human resources. The RRD zone is com-posed of 11 provinces (Hanoi, Hai Phong, Ha Tay, HaiDuong, Hung Yen, Ha Nam, Nam Dinh, Thai Binh, NinhBinh, Vinh Phuc, and Bac Ninh), with a total area of about1.48 million ha. The RRD in 2000 had about 13.6 millionpeople. About 89.6% of the population lives in rural areas.The population density in the RRD is the highest in Viet-nam, with 928 persons km–2. Thus, landholding per house-hold is the smallest.
Physical features. The RRD zone is characterized byfour seasons and is primarily influenced by the tropicalmonsoon and northeastern winds. Average temperatureranges from 16.2 to 29.7 °C, with the coolest months fromDecember to February and warmest months in June and July.Average humidity is 71–86%. Annual rainfall is about 2,400mm, concentrated during July and August. Flash floodssometimes take place during this period, damaging newlytransplanted rice fields. Typhoons often occur in northernVietnam each year, causing damage to crops.
Soils in the RRD are mostly alluvium but degraded.Because of flood protection structures along the main rivercourse, redeposit of new sediments is minimal. This causessome areas to have low fertility and high acidity. The landis well irrigated and is designed mainly for rice production.
Crop and animal production. The RRD is the second-largest rice-growing region in Vietnam. Most of the riceland is irrigated, with two crops of paddy annually, the win-ter-spring (WS) and mua crops. According to the latest cen-sus, the harvested area of rice has not changed much and thegrowth rate per annum has remained low at 0.3% (Table 1).Rice yield in the RRD region increased from 4.44 t ha–1 in
1995 to 5.53 t ha–1 in 2000, registering an annual yieldgrowth of 4.4%. In 2000, total rice production in the RRDwas about 6.6 million tons of paddy, which is about 22% ofthe national rice production. Vegetables are grown inten-sively on a large scale.
Livestock production involves pigs, cattle, buffalo, andpoultry. Pig raising is most common among farming house-holds. By 2000, the pig population was 5.4 million head,contributing about 27% of the national pig population(Table 2). The integration of livestock production and ricefarming is primarily through the use of animal manure thatis composted and incorporated into paddy fields to furtherenrich the soil. Animals, on the other hand, are fed with cropby-products and crop residues.
The Midlands and NorthernMountainous (MNM) regionGeographic and human resources. The MNM zone stretchesfrom the northeast to the northwest mountainous areas ofnorthern Vietnam. It includes 14 provinces (Ha Giang, CaoBang, Lao Cai, Bac Can, Lang Son, Tuyen Quang, Yen Bai,Thai Nguyen, Phu Tho, Bac Giang, Quang Ninh, Lai Chau,Son La, and Hoa Binh), with a total area of about 10.09million ha. The population of the MNM in 2000 was 11.24million and it is composed of several minorities and ethnicgroups. The population density is extremely low, with 111persons km–2. About 84% of the total population lives inrural areas and the majority of these people pursue subsis-tence agriculture using traditional practices.
Physical features. The climate is similar to that of theRRD zone, with four seasons. Average temperature rangesfrom 15.9 to 28.8 °C (the coolest months are from Decemberto February; the warmest months are June and July). Aver-age humidity is 75–86%. Annual rainfall is about 2,200–2,400 mm, concentrated during May and August. Flashfloods occur often during the rainy season and likewise dam-age cultivated crops.
Soils in the MNM are mostly degraded gray soils andare poor in nutrients. Soil erosion is severe during the rainyseason because of heavy rains, deforestation, food produc-tion practices that cause soils loss, and fertility loss in hillsand mountainsides.
Crop and animal production. In the MNM zone, up-land rice production is practiced using the slash-and-burnmethod. Lowland rice is cultivated in watershed areas wherethere is irrigation. The MNM produces 2.5 million tons ofpaddy, which was only 7.6% of national rice production in2000 (Table 1). Yields average 4.0 t ha–1 for the northeastareas and 2.9 t ha–1 for the northwest areas. Cattle and espe-cially buffalo raising are common in hilly areas. In 2000,there were about 1.63 million head of water buffaloes, some56% of the national buffalo population. The high popula-tion of buffaloes in this region may be due to the animal’simportance among farmers primarily for draft power and formeat. The suitable weather conditions in the region allowfor the effective use of buffalo for land preparation. The pig
49
population is 4.4 million head and this represents 21.7% ofthe total pig population of the whole country (Table 2).
The North-Central Coastal (NCC) regionGeographic and human resources. The NCC is situated inthe central part of Vietnam and contains six provinces (ThanhHoa, Nghe An, Ha Tinh, Quang Binh, Quang Tri, and Thua
Thien Hue), with a total area of about 5.15 million ha. Thepopulation of the NCC in 2000 was 10.12 million, of which87.0% lived in rural areas. The population density is about196 km–2; the tendency of the majority is to concentratealong the coastlines while the ethnic minorities live in smalltribes in the mountains.
Table 1. Harvested area, yield, and production of paddy by major regions in Vietnam from 1995 to 2000.
Year Growth Region rate
1995 1997 1998 1999 2000 (%)
Whole countryHarvested area (103 ha) 6,765.6 7,099.7 7,362.7 7,653.6 7,654.9 2.5Yield (t ha–1) 3.69 3.88 3.96 4.10 4.25 2.8Production (103 t) 24,963.7 27,523.9 29,145.5 31,393.8 32,554.0 5.3
Red River DeltaHarvested area (103 ha) 1,193.0 1,197.0 1,203.1 1,202.8 1,212.4 0.3Yield (t ha–1) 4.44 4.86 5.13 5.46 5.53 4.4Production (103 t) 5,090.4 5,638.1 5,979.4 6,383.4 6,594.8 5.2
MNMHarvested area (103 ha) 656.8 664.4 667.4 671.1 686.5 0.9Yield (t ha–1) 2.86 3.32 3.42 3.73 4.04 6.9Production (103 t) 1,786.5 2,057.4 2,098.7 2,283.5 2,487.9 6.6
NCCHarvested area (103 ha) 682.2 692.0 677.5 677.9 694.7 0.4Yield (t ha–1) 3.14 3.61 3.42 3.89 4.06 5.1Production (103 t) 2,140.8 2,495.5 2,316.3 2,634.6 2,822.3 5.5
SCCHarvested area (103 ha) 422.5 429.7 424.6 434.8 422.6 0.0Yield (t ha–1) 3.35 3.68 3.68 3.92 3.98 3.4Production (103 t) 1,415.0 1,579.9 1,564.5 1,703.7 1,683.4 3.5
WHPHarvested area (103 ha) 173.2 170.0 164.7 166.0 175.9 0.3Yield (t ha–1) 2.44 2.81 2.56 3.08 3.33 6.2Production (103 t) 429.5 485.6 436.6 512.4 580.3 6.0
SEHarvested area (103 ha) 447.3 466.0 464.8 518.8 526.7 3.3Yield (t ha–1) 2.83 3.04 3.08 3.05 3.21 2.5Production (103 t) 1,269.8 1,417.4 1,431.4 1,581.5 1,691.5 5.7
MDHarvested area (103 ha) 3,190.6 3,480.6 3,760.6 3,986.7 3,921.9 4.2Yield (t ha–1) 4.02 3.98 4.07 4.08 4.36 1.6Production (103 t) 12,831.7 13,850.0 15,318.6 16,280.8 17,106.4 5.9
Source: General Statistics Office (2002) and our calculations.
Table 2. Population of major livestock in different agroecological zones in 2000.
Zone Cattle (head) Buffalo (head) Pigs (head)
Whole country 4,127,900 2,897,200 20,193,800Red River Delta 488,300 213,600 5,398,600Midlands & Northern Mountainous area 665,600 1,626,600 4,377,300North-Central Coast 890,600 679,000 2,944,000South-Central Coast 937,200 127,700 1,725,000Western High Plateau 524,900 68,400 1,122,800Southeastern Region 423,900 118,200 1,649,600Mekong Delta 197,200 63,700 2,976,600
Source: General Statistics Office (2002).
50
Physical features. The climate is somehow similar tothat of northern Vietnam, with its four seasons, but whichare not as distinct. The average temperature is 20 to 28.5 °C.Average humidity is 64–93%. Annual rainfall is about1,800–2,000 mm, concentrated during September and Oc-tober. Typhoons and tropical atmospheric depressions oc-cur often during the rainy season.
Soils in the NCC region are classified as moderatelyeroded hills and mountains on one side and sandy bars alongthe coast on the other. The arable lands are degraded andsandy, and poor in nutrients.
Crop and animal production. The NCC produces 2.8million tons of paddy, which was only 8.6% of national riceproduction in 2000. Yield averages about 4.0 t ha–1. At-tempts to develop irrigation systems for rice production havebeen slow due to inadequate water resources and unsuitablesoils. Hilly areas are suitable for growing pasture used forgrazing livestock. Cattle raising is common in hilly areas.The cattle population is 0.89 million and constitutes 21.6%of the national cattle population. The pig population is 2.94million head, which is 14.6% of the total pig population.
The South-Central Coastal (SCC) regionGeographic and human resources. Situated along the coast-line in the central part of Vietnam, this region has six prov-inces (Da Nang, Quang Nam, Quang Ngai, Binh Dinh, PhuYen, and Khanh Hoa), with a total area of about 3.3 millionha. Arable land is about 0.55 million ha and forest land is1.16 million ha. The population of the SCC was 6.62 mil-lion in 2000, with a population density of about 200 km–2.About 71% of the population lives in rural areas.
Physical features. This zone has mainly two seasons:rainy and dry. Average temperature is 22.5 to 30.4 °C. It ishot during the dry season. Average humidity is 72–87%.The rainy season has less than 1,400 mm of rainfall perannum. Locally, the annual rainfall of Binh Dinh is high, atabout 2,400 mm. Typhoons also occur in the region as oftenas in the NCC region.
Larger deltas in this region with alluvial soils are suit-able for rice production. Arable land is almost sandy silt,eroded and poor in nutrients.
Crop and animal production. In the SCC zone, riceproduction is quite good in major alluvial deltas. The riceland covers about 0.42 million ha. In 2000, the region pro-duced about 1.68 million tons of paddy or 5.2% of nationalrice production. Average yield is 4.0 t ha–1 but in Phu Yenaverage rice yield is relatively higher at 5.0 t ha–1. Otherimportant crops are coconut, cotton, beans, sesame, sugar-cane, fruits, and spices. Cattle are raised in herds of up to afew hundred head. In 2000, the cattle population was about0.937 million head and represented about 23% of the na-tional cattle population. The pig population is 1.7 million,representing 8.5% of the national pig population. House-hold farming systems include poultry production, whichprovides extra income to small-scale farmers.
The Western High Plateau (WHP) regionGeographic and human resources. This region has four prov-inces (Kom Tum, Gia Lai, Dac Lac, and Lam Dong), with atotal land area of about 5.45 million ha, of which arableland is about 1.23 million ha and forest land 2.99 millionha. The region contained 4.24 million inhabitants (in 2000),with a population density of about 77 km–2. There is a closeintegration of lowland Vietnamese people and several eth-nic minorities in this zone, where 73.5% of the populationlives in rural areas.
Physical features. This region has mild temperature andhigh humidity. The temperature average 20.0–24.0 °C andhumidity 80–95%. The coolest months are December andJanuary, with a temperature of 15–17 °C. Annual rainfall is1,800–2,400 mm, concentrated in the rainy season.
Most of the soils are characterized as reddish brownbasalt rich in nutrients. In recent years, however, significantsoil damage (soil erosion, soil loss, fertility loss, increasedacidity) has taken place because of the overexploitation bynew settlers of food production and coffee production, ex-tensive deforestation, and other economic activities deemedharmful to the environment.
Crop and animal production. The WHP has a largearea covered with forest. Rice has been cultivated in valleyswith irrigation, but upland rice is grown at higher elevationvia the shifting cultivation system. In 2000, the region pro-duced only 1.8% of the national rice production and yieldaveraged 3.3 t ha–1. The region has potential for producingindustrial crops such as rubber, coffee, tea, and fruit trees.Livestock production is mainly cattle, pigs, and chickens.In 2000, livestock production increased to 0.525 millionhead of cattle and 1.12 million head of pigs. In general, theclimatic and natural conditions of this zone are suitable fordairy cattle and chicken production.
The Southeastern (SE) regionGeographic and human resources. The SE region containseight provinces (Ninh Thuan, Binh Thuan, Dong Nai, BinhPhuoc, Ho Chi Minh, Tay Ninh, Binh Duong, and Ba Ria-Vung Tau), with a total natural area of about 3.47 millionha, of which arable land is 1.71 million ha and forest land1.02 million ha. The population in 2000 was 12.07 million,with a relatively high density of about 347 km–2 because ofthe population concentration in Ho Chi Minh City. Ex-cluding Ho Chi Minh, 72.2% of the region’s populationlives in rural areas.
Physical features. The climate in the SE region is warm,with average temperature of 26.4 to 28.8 °C (the coolestmonths are December-January, the warmest months April-May). Annual rainfall is 1,400–2,200 mm with rainfall con-centrated in May to August.
The soils in the region are classified into two majorgroups: reddish brown basaltic soils and degraded gray soilswith patches of acid sulfate soils adjacent to the MekongDelta.

51
Crop and animal production. In the SE region, the con-ditions for growing rice are unfavorable. In recent years,attempts have been made to install irrigation systems forrice production. As a result, the cultivated area of winter-spring paddy increased to 117,500 ha in 2000 vis-à-vis73,500 ha in 1995, with a growth rate of 3.3% per annum.Rice production in the SE region accounted for 1.27 mil-lion tons in 1995, which increased to 1.69 million tons in2000, with a current share of 5.2% of national rice produc-tion. The SE region is more suitable for growing industrialcrops. Rubber, coffee, tea, cashew, sugarcane, black pepper,and other high-value fruit trees grow well here. Other cropssuch as peanut, soybean, mungbean, sweet potato, cassava,etc., are also found. The region is also suitable for livestockproduction such as cattle, pigs, goats, and poultry. Variousfarming systems with the integration of crops and animalshave been practiced in the region. In 2000, the animal popu-lation was 0.42 million head of cattle, 0.12 million head ofbuffalo, and 1.65 million head of pigs.
The Mekong Delta (MD) regionGeographic and human resources. The MD consists of 12provinces (Long An, Dong Thap, An Giang, Tien Giang,Vinh Long, Ben Tre, Kien Giang, Can Tho, Tra Vinh, SocTrang, Bac Lieu, and Ca Mau) that cover about 3.97 millionha, representing about 12% of the total area of the country.The region lies at 104°50 to 106°50 E and 8°40 to 10°55N. The region is settled by major groups of Vietnamese,Cambodians, Chinese, and a small number of Cham people,an ethnic group with a population of 16.36 million. Thepopulation density is high, about 409 km–2 (in 2000). Some82.5% of the population lives in rural areas.
Physical features. The climate in the MD is warm andbelongs to monsoon tropical climate. Average temperatureis 26.4 to 28.8 °C. The MD region has two well-definedseasons: rainy and dry. The rainy season lasts from May toNovember (providing 80% of the rainfall) and the dry sea-son from December to April. The average rainfall is 1,000–2,000 mm. The rainfall distribution among the areas in theregion is different (a high of 2,000–2,400 mm in the forestareas and a low of 1,400–1,600 mm in the northeast). TheMekong Delta is influenced by the flow of the MekongRiver, the diurnal tidal movement of the East Sea (alsoknown as the South China Sea), and the semidiurnal tidalmovement of the Gulf of Thailand. The high rainfall com-bined with a high water discharge of about 40,000 m3 s–1 ofthe Mekong River results in regular floods of 0.5 to 3.0 mdeep during August to December on the poorly drained anddepressed areas. Serious flood damage occurs annually inthese areas.
The MD is a flat and low-lying region, which was formedthrough slow alluvial depositions. According to Sanh et al(1998), the major soil types of the MD include alluvial soilsthat cover about 28% of the Delta, acid sulfate soils thatcover 41%, and saline soils that cover 21%. The remainingsoils are mountainous soils and peat soils.
Crop and animal production. The MD is the most im-portant rice production area in Vietnam. In 2000, MD riceproduction reached about 17.0 million tons, with averageyield of 4.36 t ha–1. Rice-based systems with fruit trees, pine-apple, sugarcane, maize, and soybean are practiced. Inte-gration of livestock with rice-based farming systems takesplace in rainfed areas as well as in irrigated areas. In themountainous areas of Tri Ton, Tinh Bien, and Moc Hoa, inDuc Hoa and Duc Hue, which are adjacent to Cambodia,and in the high-elevation areas of Tra Vinh and Soc Trang,local cattle are a predominant component of the Khmer farmhousehold. Traditionally, the Khmer people keep cattle forboth draft and for entering into the livestock market at theborder with Cambodia. According to the 2000 census, thenumber of major livestock by type were cattle about 0.2million head, buffaloes about 0.064 million head, and pigsabout 2.98 million head. Chickens and ducks are also keptby rice farmers where the combined number of chickens andducks is 10–20 head per household and these are often usedfor home consumption.
General trends of rice and animal productionand demand in the Mekong Delta region
Vietnam agriculture has undergone tremendous changesduring the last two decades. These changes were acceler-ated in 1986 after the policy reform, often known as “Reno-vation.” In 1998, Vietnam became the world’s second-larg-est rice exporter. The rice surpluses that have entered theworld market came mainly from the Mekong Delta. As men-tioned earlier, the MD is the most important region for agri-cultural production in Vietnam. Because of this, the mono-graph focuses on the MD and characterizes the region interms of its rice and animal production activities.
Changes in rice production and demand trendsAgricultural production, especially rice production, con-tinues to play a dominant role in the economy, accountingfor over 23% of GDP. Attempts to produce more rice are stillthe main focus of the government as well as farmers in theMekong Delta.
Table 3 shows rice production performance in 1995-2000 and the projected growth of demand for rice up to2010 in the MD. The harvested area in the MD increased by4.21% in five years, from about 3.2 million ha in 1995 to3.9 million ha in 2000. However, area is expected to de-crease by 2010. Rice yield and production increased at 1.6%and 5.9% per annum, respectively, in 1995-2000. The in-crease in rice production in this period is a result of in-creases in both harvested area and yield. However, trends inrice yield and production are estimated to slow down in thefuture as indicated in Table 3.
Table 3 also compares the growth performance of ricein 1990-95 and 1995-2001 across the provinces constitut-ing the MD. Geographically, the MD consists of 12 prov-inces but only 7 are considered to have great potential for
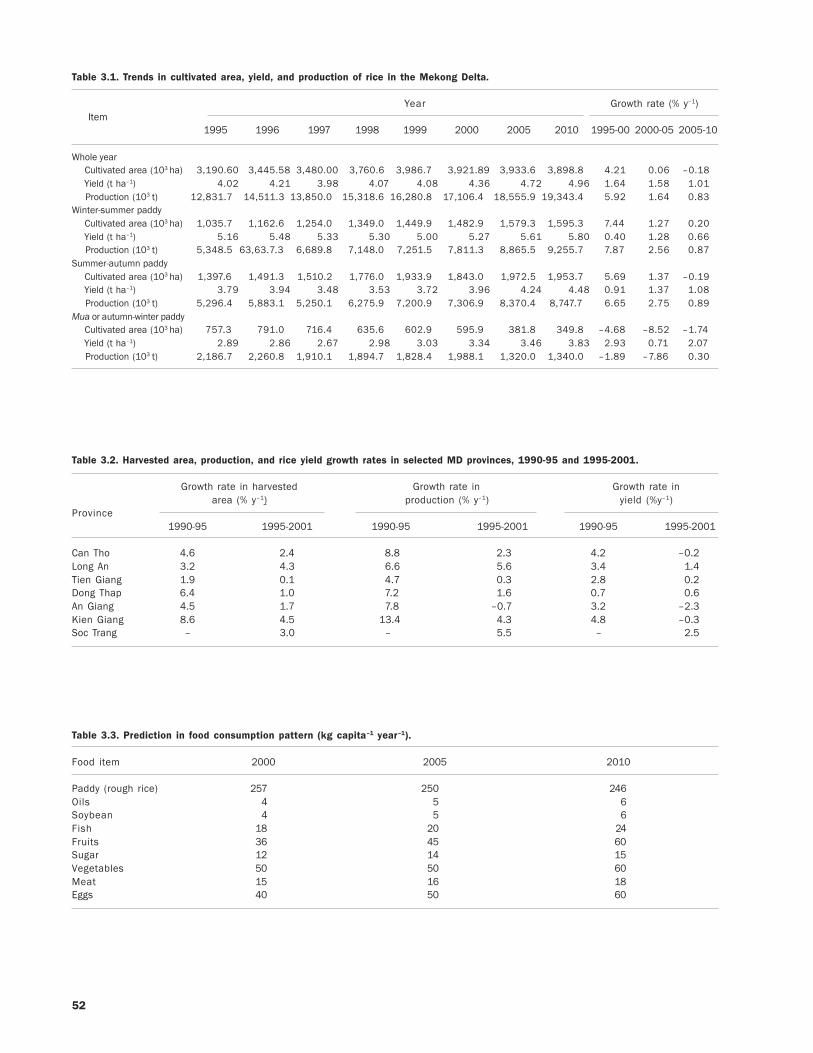
52
Table 3.2. Harvested area, production, and rice yield growth rates in selected MD provinces, 1990-95 and 1995-2001.
Growth rate in harvested Growth rate in Growth rate inarea (% y–1) production (% y–1) yield (%y–1)
Province1990-95 1995-2001 1990-95 1995-2001 1990-95 1995-2001
Can Tho 4.6 2.4 8.8 2.3 4.2 –0.2Long An 3.2 4.3 6.6 5.6 3.4 1.4Tien Giang 1.9 0.1 4.7 0.3 2.8 0.2Dong Thap 6.4 1.0 7.2 1.6 0.7 0.6An Giang 4.5 1.7 7.8 –0.7 3.2 –2.3Kien Giang 8.6 4.5 13.4 4.3 4.8 –0.3Soc Trang – 3.0 – 5.5 – 2.5
Table 3.1. Trends in cultivated area, yield, and production of rice in the Mekong Delta.
Year Growth rate (% y–1) Item
1995 1996 1997 1998 1999 2000 2005 2010 1995-00 2000-05 2005-10
Whole year Cultivated area (103 ha) 3,190.60 3,445.58 3,480.00 3,760.6 3,986.7 3,921.89 3,933.6 3,898.8 4.21 0.06 –0.18 Yield (t ha–1) 4.02 4.21 3.98 4.07 4.08 4.36 4.72 4.96 1.64 1.58 1.01 Production (103 t) 12,831.7 14,511.3 13,850.0 15,318.6 16,280.8 17,106.4 18,555.9 19,343.4 5.92 1.64 0.83Winter-summer paddy Cultivated area (103 ha) 1,035.7 1,162.6 1,254.0 1,349.0 1,449.9 1,482.9 1,579.3 1,595.3 7.44 1.27 0.20 Yield (t ha–1) 5.16 5.48 5.33 5.30 5.00 5.27 5.61 5.80 0.40 1.28 0.66 Production (103 t) 5,348.5 63,63.7.3 6,689.8 7,148.0 7,251.5 7,811.3 8,865.5 9,255.7 7.87 2.56 0.87Summer-autumn paddy Cultivated area (103 ha) 1,397.6 1,491.3 1,510.2 1,776.0 1,933.9 1,843.0 1,972.5 1,953.7 5.69 1.37 –0.19 Yield (t ha–1) 3.79 3.94 3.48 3.53 3.72 3.96 4.24 4.48 0.91 1.37 1.08 Production (103 t) 5,296.4 5,883.1 5,250.1 6,275.9 7,200.9 7,306.9 8,370.4 8,747.7 6.65 2.75 0.89Mua or autumn-winter paddy Cultivated area (103 ha) 757.3 791.0 716.4 635.6 602.9 595.9 381.8 349.8 –4.68 –8.52 –1.74 Yield (t ha–1) 2.89 2.86 2.67 2.98 3.03 3.34 3.46 3.83 2.93 0.71 2.07 Production (103 t) 2,186.7 2,260.8 1,910.1 1,894.7 1,828.4 1,988.1 1,320.0 1,340.0 –1.89 –7.86 0.30
Table 3.3. Prediction in food consumption pattern (kg capita–1 year–1).
Food item 2000 2005 2010
Paddy (rough rice) 257 250 246Oils 4 5 6Soybean 4 5 6Fish 18 20 24Fruits 36 45 60Sugar 12 14 15Vegetables 50 50 60Meat 15 16 18Eggs 40 50 60

53
rice production. Relatively high growth rates per annumwere exhibited in rice harvested area, yield, and productionin 1990-95, but later slowed down during 1995-2001.
Population trends and food demand. The Vietnamesepeople eat rice as a staple food. On average, rice consump-tion is about 422 grams capita–1 day–1 or 257 kg (rough rice)per year. Table 3 presents some figures that indicate theexpected food consumption pattern in Vietnam. The de-mand for rice in the daily meal will decrease but other foodnutrients, particularly those from animal origin, will in-crease. This trend is based on an economic principle. Whenincome is low, people obtain most of their nutrients fromstarchy foods (mainly rice) and per capita demand for rice ishigh. When income improves, per capita rice consumptionas food either declines or becomes stagnant, and consump-tion of other foods, particularly livestock products, tends toincrease (Ohga 1999 and Hossain 1999).
Table 4 shows the trends of population growth and pro-jected rice demand for 2005 and 2010. Rice consumptionshows an increase and parallels the growth in population.Rice consumption of the country was about 20 million tons(rough rice) in 2000 but is expected to increase to 21 mil-lion tons in 2005 and about 22 million tons in 2010. In theMekong Delta, the rice bowl of the country, rice consump-tion was about 4.21 tons in 2000 and is projected to in-crease to 4.41 tons and 4.64 tons in 2005 and 2010, respec-tively.
Demand of rice for export. As the rice belt of Vietnam,the Mekong Delta has produced rice not only for meetingdomestic demand for food in the country but also for ex-port. Almost all of the country’s rice exported to the worldmarket comes from the Mekong Delta. The amount of milledrice for export has increased year by year. It was about 2.7million tons in 1998 and 4.0 million tons in 2001 (Table 5).Growing rice for export continues to be the major focus of
Mekong Delta farmers. According to rice researchers, forVietnam rice exports to increase, the nation needs to paymore attention to improving the quality of exported ricerather than increasing its quantity.
Changes in the animal production sectorand demand trendsIn general, livestock production systems in the MD arelargely traditional. These systems cater primarily to theimmediate needs of farming households. For instance, farm-ers often keep animals to be used for special purposes (usu-ally planned) or just for home consumption. There is reallyno long-term strategy for animal production among house-holds. Changes are taking place now, however. Three majortypes of animal production systems have emerged: semi-industrial or industrial farms, medium-size commercial farms,and small-scale household or backyard farms. The semi-industrial or industrial farms are often state-run with largeherds. These state-run farms usually raise 500–1,000 pigs,200–500 cows, or 20,000–30,000 head of poultry. The me-dium commercial farms (mostly privately owned) usuallyraise 100–300 pigs, 1,000–10,000 chickens (layers), and10–100 cows. Small-scale farms usually consist of 2–4 pigs,2–5 cows, and 40–50 head of poultry, and are the backyardtype that still largely prevails among small households.
Tables 6 and 7 show the trends in livestock productionin 1990-95 and 1995-2001. Generally, animal productionin the MD has undergone a rapid change since 1990. Thecattle population decreased during 1990 to 1995 at –4.3%per annum. It again exhibited significant growth of about5% per annum from 1995 to 2000 in response to increaseddemand for beef as well as dairy products. For pigs andpoultry production, the growth rates per annum were rela-tively high in 1990 to 1995 at 15.3% and 12.6%, respec-tively. Growth rates were lower, however, in 1995-2001 at
Table 4. Trends of population growth and rice consumption demand.
Item 2000 2005 2010
Population (million people):Whole country 77.69 83.74 89.81Mekong Delta 16.38 17.67 18.90
Consumption (million tons, rough rice)Whole country 20.00 21.00 22.00Mekong Delta 4.21 4.41 4.64
Source: Statistical yearbook (2001) and our calculations.
Table 5. Rice production (milled rice) and exports from Vietnam from 1998 to 2002.
YearItem
1998 1999 2000 2001
Production (million t) 18.65 20.11 20.75 21.10Exports (million t) 2.7 4.56 3.37 4.00

54
3.1% and 4.9%, respectively. The slower growth rates of pigand poultry production in 1995-2001 came primarily fromthe reduction in the number of farmers keeping and raisingthese animals as profits were eroded because of decliningmarket prices while prices of production inputs remainedhigh.
Starting in 1990, the population of buffaloes and draftcattle decreased significantly because of the introductionof tractors for land preparation in rice farming. Only in a fewswampy areas or areas with low elevation were buffaloesand cattle kept for plowing or for transport.
Locally, types and numbers of animals raised vary fromlocation to location (Table 7). Cattle raising is rapidly be-ing developed in almost all provinces, but especially inLong An, Ben Tre, An Giang, Tra Vinh, Dong Than, andTien Giang. Recently, some new breeds of dairy cattle suchas Holstein-Friesan, Lai Sind, Charolaise, and Sahiwal havebeen introduced to the MD primarily because of govern-ment initiatives. At the early stage of this program, dairycows were kept on intensive state farms. In 2000, Song Haufarm of Can Tho Province and Luong An Tra farm of AnGiang Province started raising about 1,170 dairy cows, whichcan produce 1,000 good calves for the province and otherfarms in the region (Nghia 2002, Chi 2002).
Pig production, on the other hand, continued to grow,but at lower rates. Pig farms are found mostly in Tien Giang
Province, which accounts for 15% of the MD pig popula-tion. Buffaloes are mainly raised in Long An Province, withthe current population at 22,000 head. This accounts for37% of the MD buffalo population. The lowest buffalo popu-lation is in Vinh Long Province, with only 351 buffaloes.
Development of livestock production to supply meatand other livestock products for food consumption contin-ues to be the major focus of leaders and farmers alike in theMekong Delta. The major activities that the governmenthas recommended to further develop the livestock sector inthe region includes further development of pig farms, in-creasing the number of poultry farms, and development ofcattle herds, especially dairy cows, to supply milk for dairyfactories in the region.
Crop-animal systems in rice-based farmsin the Mekong Delta
A hypothetical ICAS typologyIn general, integrated rice-livestock farming systems are quitepopular in the MD. They are found to some extent in allagroecological zones. Rice is grown for both family con-sumption and marketing. Rice by-products such as rice branand rice straw are used for livestock production. Livestockthemselves play an important role in the economy and so-cial life of the farmers. Livestock are kept as a form of sav-
Table 6. Trends in livestock production in the Mekong Delta, 1990-95 and 1995-2001.
Growth rate in production (% y–1)Animals
1990-95 1995-2001
Buffaloes –4.2 –12.3Draft buffaloes –3.9 –17.5Cattle –4.3 5.1Draft cattle –10.6 –0.6Pigs 15.3 3.1Poultry 12.6 4.9
Table 7. Livestock growth rates in selected Mekong Delta provinces, 1990-95 and 1995-2001.
Growth rate in Growth rate in Growth rate in Growth rate inProvince buffalo (% y–1) cattle (% y–1) pigs (% y–1) poultry (% y–1)
1990-95 1995-2001 1990-95 1995-2001 1990-95 1995-2001 1990-95 1995-2001
Can Tho –28.5 –11.8 –48.7 13.4 2.9 2.8 –2.8 2.7Long An –11.4 –4.5 –7.2 5.3 2.4 2.2 8.1 1.7Tien Giang –19.5 –28.9 –12.3 4.4 11.2 2.7 9.5 0.4Ben Tre –9.8 –13.2 –1.8 7.0 7.5 3.7 1.8 8.4Dong Thap –27.3 –12.8 –31.0 3.5 –0.1 4.9 8.0 6.5An Giang –2.0 –7.8 –16.0 1.8 7.8 1.2 –1.6 5.3Kien Giang –17.0 –11.9 –10.7 2.7 3.1 4.0 –5.2 12.7Soc Trang – –27.2 – –7.8 – 3.9 – 5.8
Source: Data from Can Tho Statistical Department (2002) and our calculations.
55
ings that can easily be converted to cash in times of need,and they also make full use of family labor in the rural areasof the MD.
Based on data and information collected from a pri-mary survey at the provincial level, a typical ICAS has rice-based farms classified into seven types. One farm type iswithout any livestock holding, whereas the other six farmtypes have a livestock component. The six types are de-fined based on (1) economic status of rice farm households,that is, rich versus average/poor households, (2) the use ofcrop residues for animal feeding, and (3) the application ofmanure in fields. The most dominant farm types in the rainfedareas of the MD are types 5 and 6, described as follows:
Type 5: Rice household with animals and that usescrop by-products and residues for feed but which does notuse manure in fields as fertilizer.
Type 6: Rice household with animals and that usescrop by-products and residues for feed and applies manurein fields as fertilizer.
Farm types 4 and 7, in which households do not usecrop residues and other by-products, including manure, ap-pear to be nonexistent in this region. Cases of farm types 2and 3 are very few because the rich farm households oftenfeed their animals with concentrated feed or grasses that arepurchased in the city or at big business centers. Rich farmhouseholds have also used contract caretakers to take careof their animals and caretakers use manure.
In terms of ownership, the principal aspect identified isthat not all rice farmers own livestock, and the type of live-stock keeping is also different from farm to farm. Sanh et al(1998), in the results of a survey on the management prac-tices of crop-animal integration in the MD, showed thatbackyard animal raising is predominant; about 82% of thefarmers raised pigs while only 15% of them raised chickens,and some farmers raised ducks. In rainfed hilly and moun-tainous areas of An Giang Province, where cattle raising ofKhmer farm households is predominant, there are two waysof cattle keeping:
1. The owner himself takes care of his cattle.2. The owner shares taking care of his animals with an-
other farmer (caretaker), who does not own cattle byhimself. In this case, the owner and caretaker have anagreement in which all activities such as management
and feeding of cattle are the duties of the caretaker,and the sharing arrangement is as follows: (a) the firstoffspring (calf) is for the owner and the second one forthe caretaker, which allows the caretaker to start hisown cattle production; or (b) the caretaker receives apreviously agreed upon amount of money in returnfor his services. However, many poor caretakers oftensell their share because of a lack of money for dailyactivities, even before the calf is born.
ICAS among rice farm householdsin the Mekong DeltaIn the Mekong Delta, farm types 5 and 6 usually consist offour components: (1) a homestead with animal husbandryand a garden, (2) a fish pond for aquaculture and householdwater use, (3) dikes and orchards for perennial trees, and (4)cash crops and a paddy field for rice cultivation (Fig. 1).
The various components of the system interact witheach other. The greater these interactions are, the more vi-able or sustainable the system is. The main interaction be-tween livestock and the crop is in the form of livestockfeeding on crop residues or by-products and animal tractionor animal manure use for fields. Supplementary feeding oflivestock, especially cattle and buffaloes, with rice strawand crop residues is an important interaction. Large-scalepig and chicken raising is usually supplemented with pur-chased concentrated feeds. Cattle and buffaloes are usedoccasionally for land preparation and for transport. Veryfew cases of animal manure application in rice fields arerecorded. Animal manure is applied mostly in orchards andsometimes in fish pens or bio-gas processes.
The level of integration of ICAS also varies dependingon the physical environmental conditions. In freshwater al-luvial areas, rice-based farming systems are the most diver-sified. Results from a survey in Tan Phu Thanh village ofCan Tho Province showed that about 70% of the house-holds apply integrated farming systems with a combinationof 2–5 components (Dung et al 2000). Some integrated rice-based farming systems include
• Pigs + poultry + vegetables + fruit + aquaculture
• Pigs and bio-gas digester + vegetables + fruit + aqua-culture + rice
• Pigs and bio-gas digester + fruit + aquaculture + rice
Fig. 1. Typical rice farm in the Mekong Delta.

56
• Ducks + rice
• Cattle + earthworms + chickens + riceIn these systems, livestock are fed mainly with by-prod-
ucts from the farms (rice bran, broken rice), agro-industrialby-products (such as concentrated feeds from Con Co Ltd.company), aquatic plants collected from rice fields or ponds,and mixes with concentrated feeds that are purchased fromlocal markets. The manure from livestock raising is used asfeed for fish, fertilizer for fruit trees, or to produce bio-gasfor fuel. Nowadays, some farmers use livestock manure (es-pecially cow dung) to culture earthworms to feed poultry orfish.
Crop-animal systems by agroecologicalzones of the MDThere are some degrees of difference in ICAS amongagroecological zones in the MD. According to Sanh et al(1998), based on major agroecological characteristics suchas rainfall, temperature, soil type, topography, water re-sources, and vegetation, the Mekong Delta can be easilydivided into seven major “micro-zones” (agroecologicalzones): the freshwater alluvial areas, the Plain of Reeds, theLong Xuyen-Ha Tien quadrangle, hills and mountainousareas, the Trans-Bassac depression, Ca Mau Peninsula, andthe coastal zones (Fig. 2).
The freshwater alluvial zone. This zone is situatedalong the Trans-Bassac and Mekong rivers of the centralparts of the Mekong Delta, covering about 900,000 ha. Thiszone is well known as the most suitable area for rice and
fruit production. The common rice-based farming systemsare rice-rice-rice, rice-rice-upland crops, rice-rice-aquacul-ture, and rice-rice-rice + ducks. Figure 3 shows the rice-cropping calendar in some major zones of the Delta. Othercombinations between livestock and rice farming are alsofound in this zone. The major types of livestock in this zoneare water buffaloes, cattle, pigs, ducks, chickens, and somegoats. Farmers use rice straw, grass, and maize culms to feedcattle. Some farmers in Long An Province use rice strawtreated with urea fertilizer, rice bran, and native grasses tofeed cattle. Pigs are often fed rice bran and concentratedfeed, whereas chickens and ducks are fed with half-filledrice grains, rice bran, and some concentrates.
The Plain of Reeds. This area comprises a large part ofDong Thap Province and some parts of Long An Province,covering about 500,000 ha. This is the lowest place in theDelta (0.5 m below mean sea level). The soil is acid sulfate.Rice is cultivated where freshwater irrigation is available.The rice-rice system predominates. Some farmers practicethe integration of livestock and rice fields such as the rice-rice + duck system. Other farmers raise ducks by the thou-sands, herding from an already harvested rice field to an-other one and ducks can feed on dropped rice grains. Cattleand pig raising are not common in the area. Only in a fewplaces with higher elevation in Long An can some cattleand buffaloes be found.
The Long Xuyen-Ha Tien quadrangle. This zone is lo-cated in parts of An Giang and Kien Giang provinces, cov-ering about 400,000 ha. It is also dominated by acid sulfate
Fig. 2. Agroecological zones of the Mekong Delta.
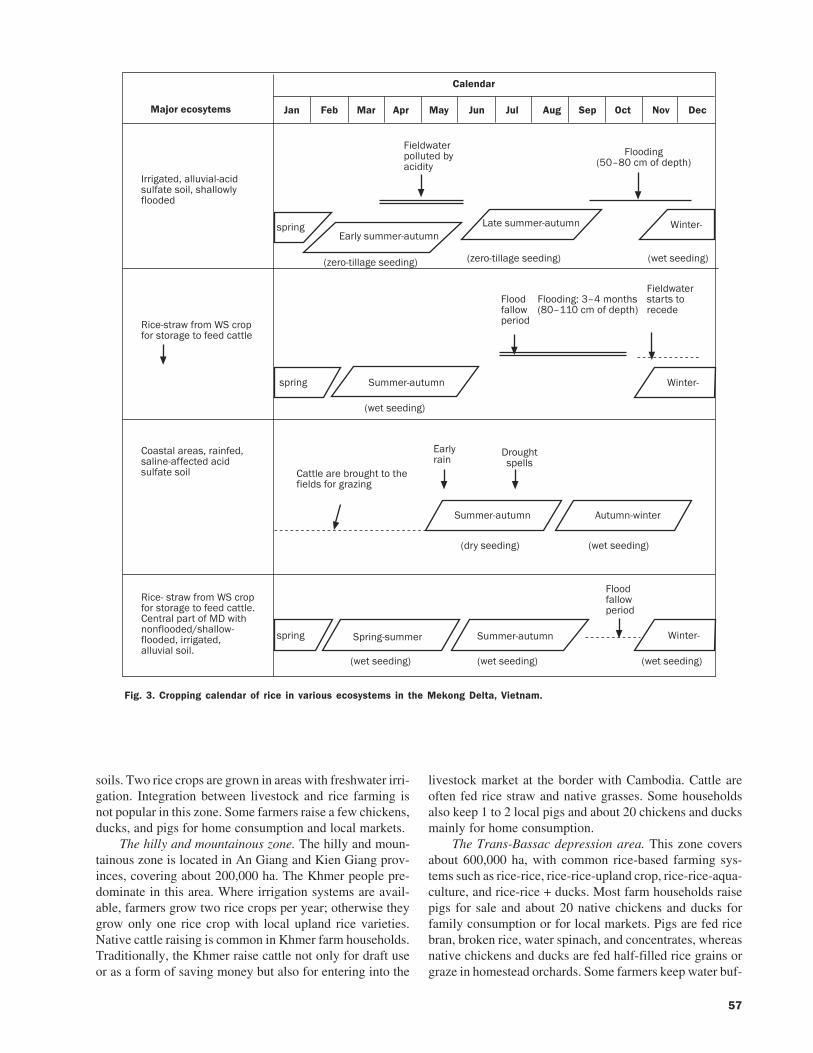
57
soils. Two rice crops are grown in areas with freshwater irri-gation. Integration between livestock and rice farming isnot popular in this zone. Some farmers raise a few chickens,ducks, and pigs for home consumption and local markets.
The hilly and mountainous zone. The hilly and moun-tainous zone is located in An Giang and Kien Giang prov-inces, covering about 200,000 ha. The Khmer people pre-dominate in this area. Where irrigation systems are avail-able, farmers grow two rice crops per year; otherwise theygrow only one rice crop with local upland rice varieties.Native cattle raising is common in Khmer farm households.Traditionally, the Khmer raise cattle not only for draft useor as a form of saving money but also for entering into the
livestock market at the border with Cambodia. Cattle areoften fed rice straw and native grasses. Some householdsalso keep 1 to 2 local pigs and about 20 chickens and ducksmainly for home consumption.
The Trans-Bassac depression area. This zone coversabout 600,000 ha, with common rice-based farming sys-tems such as rice-rice, rice-rice-upland crop, rice-rice-aqua-culture, and rice-rice + ducks. Most farm households raisepigs for sale and about 20 native chickens and ducks forfamily consumption or for local markets. Pigs are fed ricebran, broken rice, water spinach, and concentrates, whereasnative chickens and ducks are fed half-filled rice grains orgraze in homestead orchards. Some farmers keep water buf-
��1�&�� #-�,#�)���1#�.,�#�� �#��� ��,��%�1 $�6!�� #$�.# ��,�*7�-� ����,$��%�%8��$$�-&,$��%�%0��##�� �%0$$�/�$����$6
!�� $�#��0�#��,�%0�$���&,,�1 �%�1�%��$, �����$
��1�&� #-�,#�)���1#�.,�#�� �#��� ��,��%�1 $�
##�� �%0�$$�/�$&1�%��$, �����$0���$$�-$(,$��%�%
�.#����#$(���))�#&� �)�
9 ����))�#&� �)� ��� �#&
4:�#�& �$$������%���5 4:�#�& �$$������%���5 4-� ����%���5
;$��%,$$�-.�#��%
;$��%���2��<��)�� ��4��<����1)��,�%�. �5
;��$%- �#� # �� �#�1�%�
�))�#&� �)� ��� �#&
4-� ����%���5
�#$(#��
7#���� �.�$$�
�))�#&� �)� �� �)�&-�� �#
4-� ����%���54%#(����%���5
;$��%,$$�-.�#��%
��� �#&�))�#&� �)�.#���&��))�#�.#���
4-� ����%���54-� ����%���5 4-� ����%���5
! $��#��'#���� � �� ��,��$%��,�#��#:���
��� ��� �� � ��� � � � � � ��� ��� ��� �����������������
�������
;��$%- �#.�$$� �%�'(1�%� (
;$��%���4��<���1)��,�%�. �5
�.#���
Fig. 3. Cropping calendar of rice in various ecosystems in the Mekong Delta, Vietnam.
58
faloes and use them as draft power for land preparation.Rice straw and native grasses are common feeds for buffa-loes.
The coastal area. This zone covers about 600,000 ha.Rice production depends on rainwater. The major rice-basedfarming systems are rice-rice and rice-upland crop. There isa low use of crop by-products and crop residues for animalsand only rice straw is used to feed cattle during the dryseason. In higher elevation areas of Tra Vinh and Soc Trang,native cattle are an important component of Khmer farmhouseholds. Households with cattle often keep from 2 to 10for meat products and for draft use. Cattle are fed mainlyrice straw in the dry season and grasses, maize stems, ground-nut stems, and sweet potato leaves. Several rice farm house-holds also keep pigs and about 20–30 chickens and ducksfor both family consumption and local markets.
Ca Mau Peninsula. Ca Mau Peninsula covers about800,000 ha of three provinces: Kien Giang, Bac Lieu, andCa Mau. This zone is characterized by seasonally saline-affected soils and various rice-based farming systems underrainfed conditions. The common rice-based farming sys-tems are rice-aquaculture (shrimp/fish) and rice-rice. Mostfarmers often keep some pigs and poultry for family con-sumption and for local markets. Pigs are fed rice bran andconcentrates, whereas chickens and ducks are fed half-filledrice grains mixed with rice grains. Ducks are sometimes al-lowed to graze along the canals and paddy fields.
Reciprocity of animal raisingand rice farmingThe MD is an important region for both rice production andlivestock production. Like in other regions, farmers in theMD raise livestock in a traditional manner. It is estimatedthat about 80% of the population is engaged in raising live-stock, which are considered to be an important componentof rice farming. In particular, small farmers often keep live-stock to supply food (meat, eggs), to use as draft power(cattle and buffaloes) to use manure as fertilizer for crops,and for use as savings that can easily be converted into cashfor purchasing fertilizer, pesticides, and other inputs for riceproduction. Livestock are also kept as a form of securityagainst uncertainties.
The following crop-animal interactions are commonamong rice farm households in the MD.
Use of crop residues to feed animals and animal ma-nure as fertilizer in crops. The principal characteristic ofrice-based farming systems is the intensive use of land forrice and cash crop production. For that reason, farmers growhigh-yielding early-maturing rice varieties (IR64, MTL250,OMCS-2000, etc.), which can be harvested twice per year.Later, farmers rotate the land with mostly leguminous crops(groundnut, soybean, mungbean) or maize that can gener-ate income for households. Farmers use rice straw andgroundnut stems to feed their animals. Animal manure, onthe other hand, is applied to rice fields and/or groundnut toenrich the soil.
Contribution of rice farming to the sustainability ofanimal raising. Small-scale farmers produce rice mostly forhome consumption; only a small part of this production issold to middlemen who process it at local rice mills. By-products such as rice bran are used to feed pigs, and half-filled rice grains are used to feed chickens and ducks. Ricestraw, which comes from the rice harvested in the winter-spring rice crop (dry season), is stored and used to feed ani-mals during the dry season. In the wet season, animals arefed mainly with natural grasses. Supplementary feeds suchas rice bran and other crop residues (groundnut stems, maizestems, etc.) are also provided. The crop by-products are acontribution of rice farming to the sustainability of animalraising. The current system is different from the past whenfarmers practiced monoculture rice and thus avoided pro-duction diversity.
Using animals as draft power. Rice production in theMD uses farm machines, especially for land preparation.Using animals as draft power for plowing and leveling fieldstakes place in some areas where field conditions are diffi-cult for tractors to operate or the fields are small. Off-farmactivities from using animals as draft power or for transpor-tation can generate income for rice households.
Factors influencing changesin the direction of ICAS
The following factors could influence the possible direc-tion of ICAS.
Socioeconomic factorsBetter-off farmers tend to use chemical fertilizer and con-centrated feeds as they have enough money to purchasethem. Applying chemical fertilizers is a common practice athigh levels of 180–300 kg N per ha per annum, whereas theapplication of manure is not common for better-off farmers.There are some constraints to the wider application of ma-nure in paddy fields. Farmers are not aware of or lack knowl-edge on the importance of these organic materials. The useof manure as fertilizer is labor-intensive and time-consum-ing. Currently, the process of efficiently making and usingcompost needs to be investigated and results disseminatedrapidly to farmers. All these research results still need toreach farmers.
Where growing rice is not very profitable because ofpoor soil conditions, rich farmers convert rice lands to growforage. At present, few better-off farmers have forage landthat was originally paddy land. To support animal raising,the proportion of paddy land and forage should be consid-ered within the rice farm household level. From the eco-nomic aspect, land use for either paddy or forage is profit-able and this is also the question farmers raise.
Geographic characteristicsDifferent geographic characteristics (agroecological zones)can lead to different development of ICAS. For instance, inthe rainfed zones of the MD, the rice-cattle system is more
59
common, whereas, in the alluvial and irrigated zones, inten-sive rice farming, fruit trees, and poultry raising are popular.In the hilly and mountainous zone, where the Khmer mostlylive, the integrated rice-native cattle system is practiced asa traditional custom.
Government policyIn recent years, the Vietnamese government has had a policyto support resource-poor farmers in order to improve theliving standards of rural people under a national programcalled “Hunger alleviation and poverty reduction.” Low-interest credit is granted to poor farmers, especially credit topurchase piglets, beef cattle, and dairy cows. As an outcomeof this policy, several small farmers have started to raisepigs and even beef cattle and dairy cows. The governmentis now geared toward promoting intensification of crop andanimal production. These measures encourage rice farmersto diversify their rice-based farming systems, including live-stock integrated with rice farming. This policy especiallysupports the future integration of crop-animal systems inthe MD.
Technical aspectsFor rice production, direct seeding is replacing transplant-ing and improved rice is replacing local rice varieties in theMD. Farmers also practice row seeding, use of the leaf colorchart for more effective application of fertilizer, and inte-grated pest management. These technologies support ricefarmers in increasing yield and income from rice.
For animals, on the contrary, low-productivity breedsare predominant for all animal types kept by small-scalefarmers. These breeds are characterized by low genetic po-tential for meat and egg production and they have smallbody sizes and slow growth. In particular, some species suchas local cattle (in Tra Vinh, Long An, An Giang) and buffa-loes are late maturing and have small body size. Local pigs(heo co, heo moi) and native chickens grow slowly and havelow productivity; it takes about 8 months for pigs and 4months for chickens to be sold. These factors limit the ex-pansion of livestock raising, especially among poor farm-ers.
Extension and veterinary servicesAlthough the extension network has been established up tothe village level, its activities are more addressed to riceand crop issues than to livestock. The “top-down” approachin extension also limits the dissemination of new technolo-gies, including ICAS. The new participatory extension ap-proach could support ICAS development.
Women contribute most of their time to taking care oflivestock but they have less opportunity to use new tech-niques since they are rarely invited to attend workshops orextension clubs where they can get information to improvetheir knowledge and thus their farming potential. For in-stance, results from a survey of 277 households with animalproduction in three villages of Can Tho Province showedthat women contribute 95% of the labor in animal produc-
tion, but only 33% have knowledge on animal care andanimal diseases (Phan 1999). The credit and savings groupsof women that have been organized by the Women’s Unionshowed good results in supporting resource-poor farmers incredit management, using improved technologies, and gen-erating income.
Veterinary services are unable to cover all smallholdersof livestock in rural areas because of a lack of manpower,equipment, and facilities. As a result, animal diseases andillegal imports of livestock from neighboring countriesacross borders are uncontrolled. This is one reason for out-breaks of disease that occur every year, and the risk of ani-mal death is high.
Market opportunities and pricesMarket opportunities and prices of both animal productsand rice have remained unstable. Rice and animal produc-tion strongly depend on market demand and prices. Some-times, farmers have to reduce their animal population toavoid risk from low prices of animal products. ICAS sup-ports an increase in the use of by-products and crop resi-dues, which improves household income.
Natural disastersSerious flooding affects a large part of the MD every year.Raising livestock is difficult, and sometimes flood dam-ages all crops and animals. Animal diseases occur oftenduring and after flood, which influences the developmentof crop and animal production in some Delta areas.
Management of livestock and riceproduction systems
Management of livestockAnimal resources. The major livestock raised in the MD areruminants (cattle, buffaloes, goats) and nonruminants (pigs,chickens, ducks), even though types of animal holdingsvary from location to location. Raising of nonruminants isvery significant in the area. Most farmers raise crossbreedpigs (crossbreeds from Large White, Landrace, and Duroc).Local breeds such as Ba Xuyen and Thuoc Nhieu are stillused by many farmers, especial in remote areas (Manh 2002).Native chickens and imported species such as Tam Hoangand Luong Phuong chicken (from China) are commonlyraised on a small scale by rice farm households. For ducks,some of the more common varieties such as Muscovy duckare kept for meat, whereas Peking, CV2000, Khaki Campell,and Cherry Valley ducks are kept for both meat and eggs.These different types require different management tech-niques, and only professional farmers may be able to raiseducks or chickens. Today, many farmers raise ducks or chick-ens by contract with private companies. Farmers often re-ceive all inputs from the company such as seeds, feed, andeven extension services.
Feeding. Animals are fed with what is available fromfarms in terms of by-products (crop residues, rice straw, etc.).Supplementary feed is provided by concentrated feed. Cattle

60
are fed grasses and even rice straw during the dry season.More often, these are sufficient for animal holdings. Farm-ers now pay more attention to the quantity rather than qual-ity of feed for their animals.
Animal health care and diseases. Although the veteri-nary network was organized at the village level to help farm-ers in vaccination against common animal diseases, someendemic outbreaks still occur throughout the year. The com-mon disease in cattle and buffaloes is hemorrhagic septice-mia, which usually occurs at the onset of the rainy season.Common diseases in pigs are swine fever, salmonellosis,pasteurellosis, colibacillosis, and edema disease of youngpigs, and reproductive disorders of sows. Common diseasesof chickens are Newcastle, gumboro, pasteurellosis, vari-ola, and coccidiosis, while those of ducks are duck plague,pasteurellosis, and duckling influenza. Many farmers lackknowledge and information on veterinary issues, especiallyon the prevention of animal diseases.
Major constraints to animal production. Several fac-tors influence the production of livestock in the MD: (1) theeconomic status of farmers (the poorer and landless may nothave capital to invest in animals, which affects the numberof the animal population); (2) the market for products (lowprices of local market, lack of processing); (3) the availabil-ity of feed resources (rice straw; crop by-products insuffi-cient; growth affected by type of feed); and (4) veterinaryservices. Small farm households in remote areas usuallylack capital and therefore are unable to take advantage ofintegrating livestock with other farming activities. In manycases, the poor kept livestock as a form of savings that caneasily be converted to cash at short notice, and, especially,small farmers often kept poultry for household consump-tion. The market for products and feed resources are twoimportant factors that have influenced livestock produc-tion in the MD. The number and type of livestock stronglydepend on the market prices of outputs and inputs. For in-stance, pork production, which plays an important role inlivestock production in the MD, increases when the price ofpork is rising and the price of feed (mainly rice bran) is keptconstant and low.
Management of rice productionRice ecosystems. The MD region is the rice bowl of Viet-nam, with about 2.0 million ha devoted to growing rice.Rice production in the region accounts for 52% of nationalrice production, with yield averaging 5.27 t ha–1 for winter-spring (W-S) paddy and 3.96 t ha–1 for the summer-autumn(S-A) crop. Although a large part of MD land is suitable forrice, this has not been very profitable because of the highproduction cost while the farm-gate price is low. Rice farm-ers earn additional income through crop diversification. Asa result, various rice-based farming systems involving cashcrops, livestock, aquaculture, and fruit trees have proven tobe more profitable than monoculture of rice and are thuswidely practiced in the region.
The Mekong Delta has three major rice cropping sea-sons: winter-spring (W-S), summer-autumn (S-A), and wetseason or autumn-winter (A-W).
About 70% of the rice is grown on irrigated and/or semi-irrigated lowlands, and 30% is grown under rainfed low-land conditions. More than 80% of the area is under modernrice varieties. Average yield is 4.0–5.5 t ha–1. Mua or A-Wrice yield is 2.5–3.5 t ha–1. Direct seeding is the most com-mon crop establishment practice in the Delta.
Fertilizer application. Farmers often apply a high levelof chemical fertilizer (90–120 kg N ha–1) and use less or-ganic fertilizer. Farmers apply animal manure in rainfed ricefields. A few farmers use the leaf color chart to apply fertil-izer in order to reduce production costs.
Pest and disease control. More than 90% of the farmersin the MD use pesticides, and farmers use them quite heavily,averaging 1,081 g of active ingredient per ha. A consequenceof this profuse use of pesticides is that it limits the use ofrice straw to feed animals, especial for dairy cows.
Constraints to rice production. The major constraintsto rice production in the Mekong Delta are flooding duringthe rainy season, drought in the dry season, and extensiveareas with soil problems. Soil stresses affect more than halfof the rice land, especially in rainfed and nonirrigated areasin the Delta. As discussed earlier, the problem soils are mainlysaline and acid sulfate soils. Saline soils mainly in the coastalregion occupy about 0.8 million ha. Acid sulfate soils oc-cupy about 1.6 million ha, mainly in the Plain of Reeds andLong Xuyen-Ha Tien quadrangle. Rice yield varies greatly,depending on the degree of seriousness of soil problems.Average rice yield in areas with high acid sulfate is 2.6–3.6t ha–1 and in areas affected by salt is 2.4–3.5 t ha–1. In themore favorable areas, rice yield is 4.5–6.5 t ha–1.
Mekong Delta farmers face low income from rice pro-duction because of inappropriate government policy for thesector, unstable and low farm-gate prices, high productioncosts, an inefficient marketing system, and a lack of marketinformation.
The current level of infrastructure is inadequate to sup-port increases in agricultural production. Postharvest facili-ties are inadequate. For instance, storage space and rice-processing factories are not enough, and about two-thirdsof the farms have no access to drying areas.
Many small farmers in marginal areas in the MekongDelta live with great variability in their environment. Theylack the technical, economic, and institutional resources toovercome problems related to the environment and to im-prove rice cultivation and increase yield.
Potential for further developmentwith ICAS in rice farming
The integrated crop-animal system is an effective means topromote economic security and rural welfare improvementamong small-scale rice farmers. It also helps safeguard the

61
environment and is central to strengthening biodiversity inrice-based farming systems that cover the majority of thepresent government policy on “Change in the economicstructure of agricultural systems.” For these reasons, ICASmust be strengthened and promoted, not only at the level ofthe farm household but also on a wider regional scale. Pro-motion of ICAS should be a key component in governmentdevelopment policy. Along with this should be strong sup-port from national agricultural scientists and/or the interna-tional community, particularly for research and technologydevelopment.
Small-scale rice-based farming systems still play animportant role in the development of agriculture in theMekong Delta. The integration of livestock into the rice-based farming system could be seen as a way of improvinglivelihood and generating income for farmers. Observationsmade by several researchers as well as by farmers point tothe fact that rice monoculture among small farm householdsis not profitable. Supplemental economic activities on thefarm or in other landholdings such as growing vegetablesand other cash crops or raising animals or fish can indeedraise household income. Raising livestock is also not prof-itable without the integration of the crop component and/orother farm resources. Thus, more diversification of rice-basedfarming systems in combination with livestock raising is amajor priority of small-scale farmers in the MD.
In rainfed areas, especially in more remote areas, live-stock production systems are mainly backyard growing sys-tems with extensive management (no concentrated feedsare fed to animals). On these farms, the combination of ani-mals and rice fields shows some degrees of integration ascrop residues and by-products are used as the main supple-mentary feed. Native cattle are often fed rice straw and ricebran as a major supplemental feed in the dry season. Pigsand poultry are also fed rice bran, broken rice, and unfilledrice grains. These systems continue to be the most appropri-ate farming systems for small farmers, although the numberof backyard farms may decline further in the future, but thequantity of animals kept per household will increase.
Current trends likewise indicate that some farminghouseholds are gradually being transformed from subsis-tence livestock husbandry into commercial livestock pro-duction with semi-intensive or intensive systems. However,these types of farms occupy 10–20% of the total animalproduction of the Delta and are categorized as semi-inten-sive or intensive farms located close to the city. They keeplarge animals and practice more intensive management (suchas the primary use of concentrated feed and vaccinationservice). These types of farms exhibit very low interactionbetween crop and animal components.
In line with the current situation of animal productionand potential of ICAS in the region, commercial farms (thesefarms also exhibit very low interaction between crops and
animals) should be encouraged to meet the increasing mar-ket demand for meat and other animal products. At thesame time, however, ICAS should be developed further as apotential and effective measure of sustaining food produc-tion among small farm households to fight rural povertyand improve rural living standards.
Issues/gaps for ICAS successand sustainability in rice ecosystems
Considering the current situation of the livestock produc-tion sector and in line with the intensification andsustainability of ICAS, key research issues are identifiedbelow that should be considered priorities in the region:
• Based on the comparative advantages of eachagroecosystem and its potential, identifying suitabletypes of animals and crops that can promote appropri-ate ICAS in each agroecological zone.
• Conducting a socioeconomic analysis for ICAS, in-cluding studying the social-cultural acceptability ofICAS, using farm resources, using manure, the laborrequirement, and cost-benefit analysis (also to com-pare whether to grow forage or rice on some unfavor-able rice lands).
• Promotion of ICAS as the best approach to eliminat-ing rural poverty among rural poor farmers, especiallyin rainfed areas. A form of “farmer field school onICAS technologies” may be essential to introduce bothcrop production and animal husbandry skills to theseresource-poor farmers.
• Improving transfer of knowledge to farmers and vet-erinary services. From our findings, certain new po-tential technological innovations, which are benefi-cial to farmers, have yet to reach them. Small-scalefarmers often follow traditional practices and exten-sive management systems, especially backyard grow-ers, who do not pay attention to husbandry skills, sani-tation, feed composition, and vaccination. Usually,extension agents have provided only “what they haveand not what farmers need.” Linkages among exten-sion, research, veterinary services, and farmers needto be studied further.
• Supporting credit to farmers to develop ICAS. Almostall small farmers in remote areas have a lack of capitaland credit, and they are unable to take advantage ofintegrating animals into their farming system. Expe-riences from certain projects with credit support tosmall farmers in the region (women’s savings andcredit groups, a heifer project, etc.) showed a positiveeffect. A study on how to strengthen “micro-creditsystems” to support ICAS in the region could be valu-able.

62
References
Chi HH. 2002. Results of dairy cattle production in Song Haustate farm. Paper presented at the Workshop on the Devel-opment of Ruminant Production in the Mekong Delta, 9-11April 2002. (In Vietnamese.)
Dung LC, Tuyen NQ, Yamada R, Can ND. 2000. Farm house-hold status in Tan Phu Thanh village: results from the bench-mark survey in 2000. Proceedings of the 2000 Annual Work-shop of JIRCAS Mekong Delta Project. Can Tho University,Can Tho, Vietnam.
Hossain M. 1999. Long-term perspective of the demand-supplybalance for rice in Asia: implications for technological chal-lenges. In: Proceedings of the International Symposium onWorld Food Security, Kyoto, Japan. p 31-39.
Manh LH, Xuan Dung NN, Thanh VC, Hirata Y, Hayashidani H.2002. The distribution and genetic diversity of local pig vari-eties in the Mekong Delta, Vietnam. Bulletin of researchreports on environmental and agricultural sciences (1999-2001), Can Tho University, Can Tho, Vietnam.
Nghia NV. 2002. An outline of cattle breeding of Luong An Trafarm. Paper presented in the Workshop on the Developmentof Ruminant Production in the Mekong Delta, 9-11 April2002. (In Vietnamese.)
Ohga K. 1999. World’s food supply and demand prospects in 21stcentury. In: Proceedings of the International Symposium onWorld Food Security, Kyoto, Japan. p 9-15.
Phan TT. 1999. Roles of women in animal production in someprovinces in the Mekong Delta. Project report on “Revolv-ing loan for agricultural production of poor women in ruralareas.”
Sanh NV, Xuan V-T, Phong TA. 1998. History and future offarming systems in the Mekong Delta. In: Xuan V-T, MatsuiS, editors. Development of farming systems in the MekongDelta of Vietnam. JIRCAS, CTU, and CLRRI, Ho Chi MinhCity, Vietnam. p 16-80.
Xuan V-T, Hai LT, Loc CB. 1995. Research priorities for im-proving animal production by agro-ecological zone in Viet-nam. In: Global agenda for livestock research. Proceedingsof the consultation for the Southeast Asia Region, Interna-tional Rice Research Institute, Los Baños, Philippines, 10-13 May 1995. p 197-213.
Notes
Authors’ address: Mekong Delta Farming Systems Researchand Development Institute, University Campus II, 3/2 Street,Can Tho City, Can Tho, Vietnam.
Acknowledgments: The authors would like to express thanks toSLP/ILRI for funding this study and to IRRI for extendingthe invitation to us to participate in this project. Our specialthanks go to Mercedita A. Sombilla and Violeta G. Cordovafrom IRRI for their support for and advice on this study.
We would also like to express our appreciation and sin-cere thanks to all organizations and individuals for their col-laboration and providing information for this study. In par-ticular, we give our sincere thanks to L.L. Dung, Agricul-tural Extension Department of Long An Province; H.H.Thanh, Agricultural Extension Department of An Giang Prov-ince; P.T. Tai, Agricultural Extension Department of VinhLong Province; P.V. Nghi, Agricultural Extension Depart-ment of Tien Giang Province; D.V. Chuong, AgriculturalExtension Department of Tien Giang Province; Hua QuangTang, Department of Agricultural and Rural Developmentof Tien Giang Province; and N.T.Viet Nga, Veterinary De-partment of Tien Giang Province.
Without their help, this monograph could never have beencompleted. We hope that the monograph will help people tounderstand better the evolution of integrated crop and ani-mal systems, especially among rice-based farm householdsin the Mekong Delta of Vietnam.
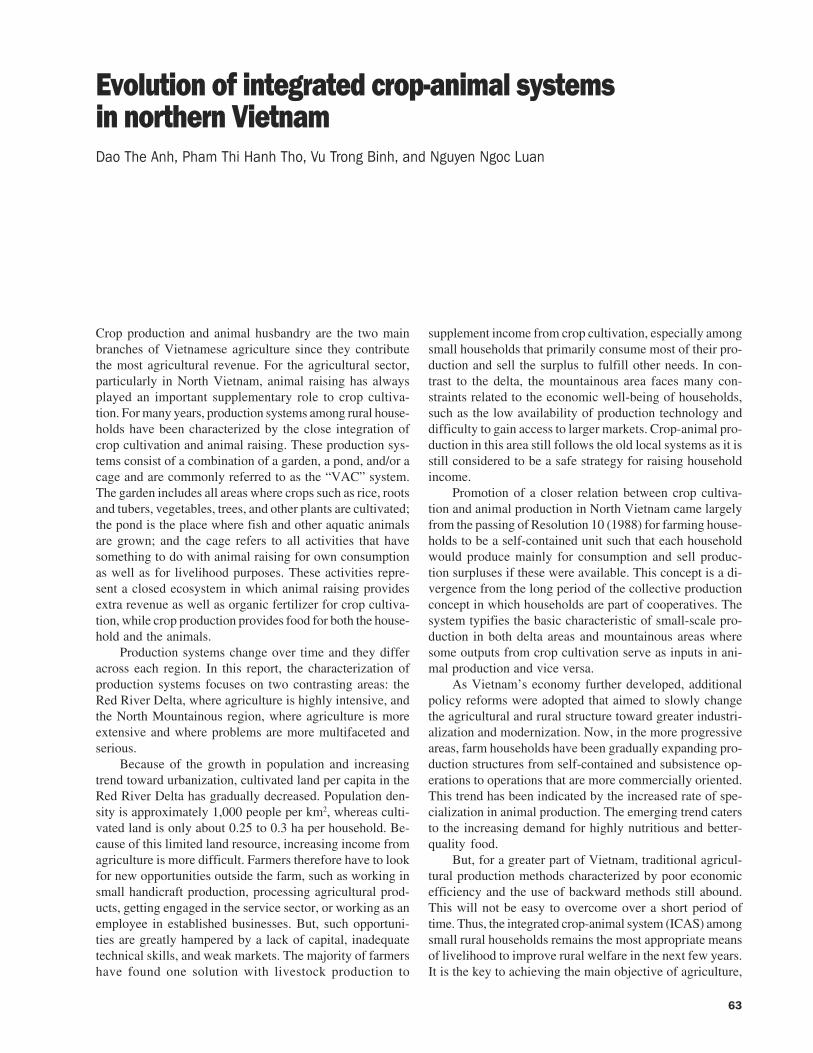
63
Evolution of integrated crop-animal systemsin northern VietnamDao The Anh, Pham Thi Hanh Tho, Vu Trong Binh, and Nguyen Ngoc Luan
Crop production and animal husbandry are the two mainbranches of Vietnamese agriculture since they contributethe most agricultural revenue. For the agricultural sector,particularly in North Vietnam, animal raising has alwaysplayed an important supplementary role to crop cultiva-tion. For many years, production systems among rural house-holds have been characterized by the close integration ofcrop cultivation and animal raising. These production sys-tems consist of a combination of a garden, a pond, and/or acage and are commonly referred to as the “VAC” system.The garden includes all areas where crops such as rice, rootsand tubers, vegetables, trees, and other plants are cultivated;the pond is the place where fish and other aquatic animalsare grown; and the cage refers to all activities that havesomething to do with animal raising for own consumptionas well as for livelihood purposes. These activities repre-sent a closed ecosystem in which animal raising providesextra revenue as well as organic fertilizer for crop cultiva-tion, while crop production provides food for both the house-hold and the animals.
Production systems change over time and they differacross each region. In this report, the characterization ofproduction systems focuses on two contrasting areas: theRed River Delta, where agriculture is highly intensive, andthe North Mountainous region, where agriculture is moreextensive and where problems are more multifaceted andserious.
Because of the growth in population and increasingtrend toward urbanization, cultivated land per capita in theRed River Delta has gradually decreased. Population den-sity is approximately 1,000 people per km2, whereas culti-vated land is only about 0.25 to 0.3 ha per household. Be-cause of this limited land resource, increasing income fromagriculture is more difficult. Farmers therefore have to lookfor new opportunities outside the farm, such as working insmall handicraft production, processing agricultural prod-ucts, getting engaged in the service sector, or working as anemployee in established businesses. But, such opportuni-ties are greatly hampered by a lack of capital, inadequatetechnical skills, and weak markets. The majority of farmershave found one solution with livestock production to
supplement income from crop cultivation, especially amongsmall households that primarily consume most of their pro-duction and sell the surplus to fulfill other needs. In con-trast to the delta, the mountainous area faces many con-straints related to the economic well-being of households,such as the low availability of production technology anddifficulty to gain access to larger markets. Crop-animal pro-duction in this area still follows the old local systems as it isstill considered to be a safe strategy for raising householdincome.
Promotion of a closer relation between crop cultiva-tion and animal production in North Vietnam came largelyfrom the passing of Resolution 10 (1988) for farming house-holds to be a self-contained unit such that each householdwould produce mainly for consumption and sell produc-tion surpluses if these were available. This concept is a di-vergence from the long period of the collective productionconcept in which households are part of cooperatives. Thesystem typifies the basic characteristic of small-scale pro-duction in both delta areas and mountainous areas wheresome outputs from crop cultivation serve as inputs in ani-mal production and vice versa.
As Vietnam’s economy further developed, additionalpolicy reforms were adopted that aimed to slowly changethe agricultural and rural structure toward greater industri-alization and modernization. Now, in the more progressiveareas, farm households have been gradually expanding pro-duction structures from self-contained and subsistence op-erations to operations that are more commercially oriented.This trend has been indicated by the increased rate of spe-cialization in animal production. The emerging trend catersto the increasing demand for highly nutritious and better-quality food.
But, for a greater part of Vietnam, traditional agricul-tural production methods characterized by poor economicefficiency and the use of backward methods still abound.This will not be easy to overcome over a short period oftime. Thus, the integrated crop-animal system (ICAS) amongsmall rural households remains the most appropriate meansof livelihood to improve rural welfare in the next few years.It is the key to achieving the main objective of agriculture,

64
which is to stabilize rural livelihood by increasing poten-tial sources of household income, creating jobs, improvingnutritional well-being, and contributing to a better and moresustainable environment. ICAS is also a tool to reduce therisk of both natural calamities and the unstable agriculturalproduct markets. As the role of the government in agricul-tural product markets diminishes and effective regulatoryinstitutions are still not in place, the domestic market forfood in Vietnam has been very unstable.
Research purpose and method
This monograph is a part of a socioeconomic study thatintends to understand the multifactoral and changing roleof animals in rice farm households of Vietnam, specificallyin the Red River Delta and North Mountainous areas. Themonograph aims to present a general picture of theagroecological conditions, characteristics, evolution, andtrend of crop-animal systems, especially in the light of achanging economic environment as well as technology de-velopment in Vietnam. It also aims to identify more specificissues and gaps that could be further examined in subse-quent studies. More specifically, this monograph has thefollowing objectives:
• Describe trends in rice, food crop, and livestock pro-duction and demand.
• Describe the evolution of ICAS, especially in rice farmareas.
• Identify issues/gaps that hinder further intensificationof ICAS.
• Determine research and policy implications for sus-tainable ICAS.
Evolution of the main rice-basedproduction systems at the regional level
Red River Delta areaNatural, social, and economic conditions. Land surface inthe Red River Delta is 12,614 km2. This is only 5% of thetotal surface area of the country, which is 330,900 km2. Thetotal delta surface covers more than 20% of the nation’ssurface area, most of which is concentrated in the delta ofthe Mekong River in southern Vietnam.
Most of the area in the Red River Delta is agriculturalland (857,515 ha or 58.6% of the total natural land as shownin Figure 1). However, the surface area of agricultural landper farming household or per capita is small and has gradu-ally decreased over time because of the high rate of urban-ization and population growth (Fig. 2).
From 1991 to 1998, the ratio of the average agricul-tural land per household decreased from 0.29 to 0.25 ha;agricultural land per capita also decreased from about 720to 630 m2. On the contrary, in the Mekong River Delta, theaverage agricultural land was more than 1 ha per householdand 0.2 ha per capita. As in the Red River Delta, these ratiosare declining over time.
Population in the Red River Delta increased from about13.1 million in 1991 to nearly 15 million in 2000, an aver-age growth rate of 1.3% per year (Fig. 3). About 80% of thepopulation is in rural areas. At the same time, the urbanpopulation increased from about 2.2 million to more than3.2 million (average growth of 3.6% per year), while therural population increased from nearly 11 million to morethan 11.7 million (average growth of 0.7% per year). In 1997,
;�#�� #(�$�%�6��
.�1�,�1�$�%��6��
��'� �%�$�%�6��
=����%�$�%��6��
��#�1�$ �#$$�%
��6��
�6��
�6��
�6��
�6��
�6��
���
���
���
���
������� ���� ���� ���� ���� ���� ���� ����
���������$%<� )��1.� <�
>�#
��#�1�$ �#$�$�%��������$%<�
��#�1�$ �#$�$�%�1.� <�
��
��
�
�
�
�
�
<����� ���� ���� ���� ���� ���� ���� ����
>�#���� ����
?�.�$ �����#�- ��# ��,�-��$��#�����
?�.�$ �����#�- ��# �����#'��#�
?�.�$ �����#�- ��# ����#�#$�#�
�
Fig. 1. Land-use status in the Red River Delta in 2000. Specificlands are public areas used for nonagricultural production, suchas a cemetery, etc. Source: GSO (2001).
Fig. 2. Evolution of agricultural land per capita and per household.Source: GSO (2000).
Fig. 3. Population growth rate of the Red River Delta.Source: GSO (2001).
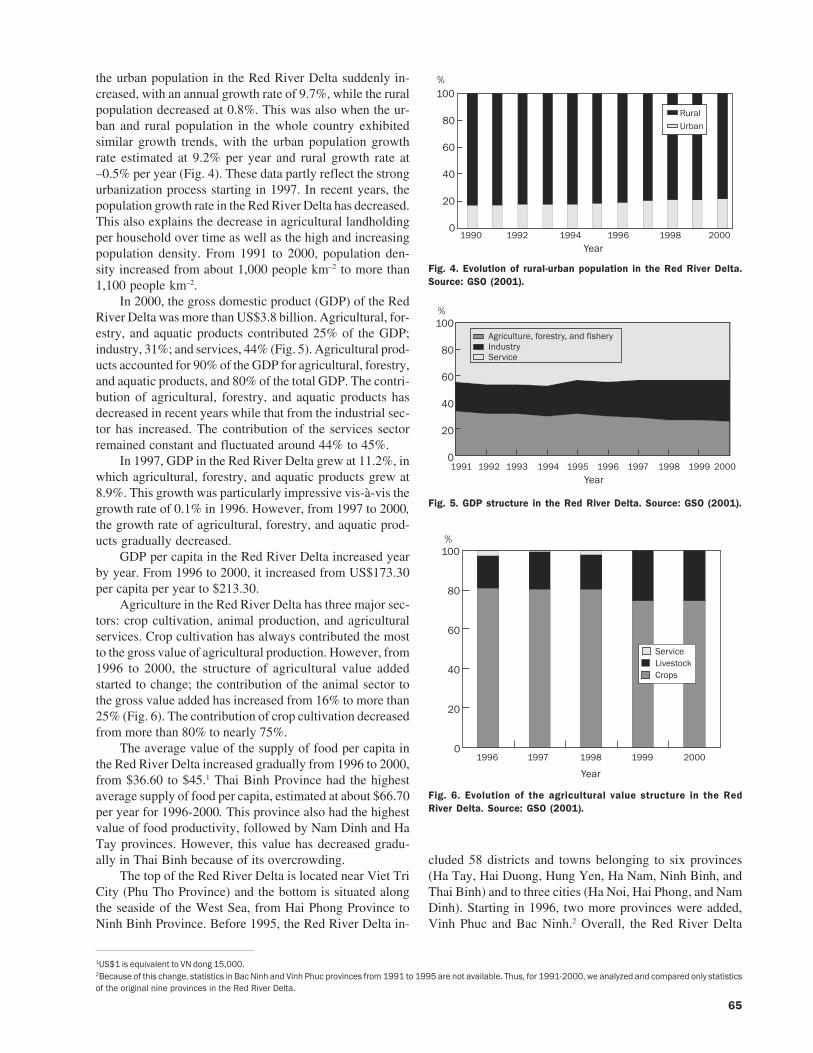
65
the urban population in the Red River Delta suddenly in-creased, with an annual growth rate of 9.7%, while the ruralpopulation decreased at 0.8%. This was also when the ur-ban and rural population in the whole country exhibitedsimilar growth trends, with the urban population growthrate estimated at 9.2% per year and rural growth rate at–0.5% per year (Fig. 4). These data partly reflect the strongurbanization process starting in 1997. In recent years, thepopulation growth rate in the Red River Delta has decreased.This also explains the decrease in agricultural landholdingper household over time as well as the high and increasingpopulation density. From 1991 to 2000, population den-sity increased from about 1,000 people km–2 to more than1,100 people km–2.
In 2000, the gross domestic product (GDP) of the RedRiver Delta was more than US$3.8 billion. Agricultural, for-estry, and aquatic products contributed 25% of the GDP;industry, 31%; and services, 44% (Fig. 5). Agricultural prod-ucts accounted for 90% of the GDP for agricultural, forestry,and aquatic products, and 80% of the total GDP. The contri-bution of agricultural, forestry, and aquatic products hasdecreased in recent years while that from the industrial sec-tor has increased. The contribution of the services sectorremained constant and fluctuated around 44% to 45%.
In 1997, GDP in the Red River Delta grew at 11.2%, inwhich agricultural, forestry, and aquatic products grew at8.9%. This growth was particularly impressive vis-à-vis thegrowth rate of 0.1% in 1996. However, from 1997 to 2000,the growth rate of agricultural, forestry, and aquatic prod-ucts gradually decreased.
GDP per capita in the Red River Delta increased yearby year. From 1996 to 2000, it increased from US$173.30per capita per year to $213.30.
Agriculture in the Red River Delta has three major sec-tors: crop cultivation, animal production, and agriculturalservices. Crop cultivation has always contributed the mostto the gross value of agricultural production. However, from1996 to 2000, the structure of agricultural value addedstarted to change; the contribution of the animal sector tothe gross value added has increased from 16% to more than25% (Fig. 6). The contribution of crop cultivation decreasedfrom more than 80% to nearly 75%.
The average value of the supply of food per capita inthe Red River Delta increased gradually from 1996 to 2000,from $36.60 to $45.1 Thai Binh Province had the highestaverage supply of food per capita, estimated at about $66.70per year for 1996-2000. This province also had the highestvalue of food productivity, followed by Nam Dinh and HaTay provinces. However, this value has decreased gradu-ally in Thai Binh because of its overcrowding.
The top of the Red River Delta is located near Viet TriCity (Phu Tho Province) and the bottom is situated alongthe seaside of the West Sea, from Hai Phong Province toNinh Binh Province. Before 1995, the Red River Delta in-
cluded 58 districts and towns belonging to six provinces(Ha Tay, Hai Duong, Hung Yen, Ha Nam, Ninh Binh, andThai Binh) and to three cities (Ha Noi, Hai Phong, and NamDinh). Starting in 1996, two more provinces were added,Vinh Phuc and Bac Ninh.2 Overall, the Red River Delta
���
��
��
��
��
����� ���� ���� ���� ���� ����
�
>�#
��#$=#'�
���
��
��
��
��
�����
>�#���� �������� ���� �������� ���� ���� ����
�
��#�1�$ �#�0�,�#�� #(0��%�,����#( �%�� #(�#/�1�
�������� �������� ����
���
��
��
��
��
�
�
�#/�1�9�/�� �1@!#�.�
>�#
Fig. 4. Evolution of rural-urban population in the Red River Delta.Source: GSO (2001).
Fig. 5. GDP structure in the Red River Delta. Source: GSO (2001).
Fig. 6. Evolution of the agricultural value structure in the RedRiver Delta. Source: GSO (2001).
1US$1 is equivalent to VN dong 15,000.2Because of this change, statistics in Bac Ninh and Vinh Phuc provinces from 1991 to 1995 are not available. Thus, for 1991-2000, we analyzed and compared only statisticsof the original nine provinces in the Red River Delta.

66
consists of 11 provincial areas with more than 80 districtsand 2,000 communes.
The Red River Delta has a dense river network thatextends widely over the entire surface of the area. All theriver systems of the Red River Delta are now protected by afull dike system that efficiently drains water from the twobig river systems: the Red River and Thai Binh River.
The Red River Delta is located in the monsoon climatezone. The climate is divided into two distinct seasons: thedry season and the rainy season. The dry season starts inNovember and ends in April and the rainy season goes fromMay to October. This region has alluvial deposits and rug-ged terrain (alternately high, low, and middle).
The Red River Delta is divided into three ranges:
• The northeast range toward the southwest.
• The central range: this structure is the deepest andthus becomes the hollow places of the Red River Delta.
• The southwest range.
Agroecological areas in the Red River Delta. The RedRiver Delta is divided into four agroecological areas (Fig.7):
1. Lowland area: This area is usually flooded and it isdifficult to diversify crop cultivation. It is located inNam Dinh, Nam Ha, and Ninh Binh provinces.
2. Dry crop area: This area is not flooded or irrigated. Itis easy to diversify crop plants but the area has lowproductivity.
3. Coastal area: This area is difficult to diversify but ithas high productivity (Thai Binh Province).
4. Intensive area: This area has the highest productivityper unit surface, with strong diversification and highyield (Hai Duong Province).
Most of the provinces that are included in the lowlandand dry crop areas have poor soils and thus low productiv-ity. Enriching these lands by applying fertilizer and otherinputs has been difficult because of farmers being unable togain extra income from off-farm activities as they are quite
far from markets and business centers. The coastal and in-tensive areas have rich soils that help in achieving higherproductivity. The potential for developing off-farm activi-ties in these areas is also greater.
Physical and climatic conditions, agroecological char-acteristics, and some socioeconomic variables have hadmuch influence on the farming households’ production sys-tems.
According to Table 1, six types of households are de-fined by combinations of several factors, including the sizeof land owned, income, and agroecological characteristics.The integration of crops and animals is different for eachhousehold category. Pigs are the most popular but otheranimals such as cattle and poultry are also present among afew households but in not enough number to make anysignificant contribution to household income. Pig produc-tion is the most developed in two types of households: thosebelonging to groups C and F. Households in group C, com-pared with the other groups of households with small landarea, are engaged in more diversified activities, both on-farm and off-farm, and have performed relatively well inthese activities. Pig raising has been one activity they havebeen able to develop more successfully. The large involve-ment in pig raising of households in group F, on the otherhand, is very clear. These households not only possess rela-tively large land areas but most of them are also more expe-rienced in animal breeding. Unlike group C, whose mem-bers are actively involved in off-farm work that providesthe capital for pig raising, those in group F mostly derivetheir financial support from pensions, money sent by rela-tives working abroad, etc. They are very successful in theircrop production, which is quite intensive. They use pigmanure in production, and hence incur some savings onfertilizer expenditures. These two groups are the more well-to-do households compared with the other households intheir respective groups. It is clear from the table that whatgives the income edge to these groups is their involvementin pig raising. Other households have either not ventured
Fig. 7. Agroecological zoning map of Red River Delta.
Legend
Intensive zoneCoastal zoneUpland zoneLowland zoneAll others

67
into pig raising or have not been successful with this activ-ity.
Characteristics of cropping systems in the Red RiverDelta. Cropping patterns in the Red River Delta closelyfollow those in other Southeast Asian countries with mon-soon climate. The climatic conditions and diverse soil char-acteristics have influenced the crop combination and crop-ping schedule as follows:
• The spring rice crop is started in January and har-vested at the beginning of June.
• The autumn rice crop is started at the beginning ofJuly and harvested in October.
• Vegetables or winter plants are cultivated from Octo-ber to January.
Crops usually consist of rice, vegetables, fruit trees,and annual industrial crops. Rice is cropped in most farmareas. Most of the irrigated lands are used for growing rice,vegetables, and fast-growing industrial trees. Highland oralluvial land is used for cultivating vegetables, fast-grow-ing industrial trees, and fruit trees. The cropping system ishighly intensive and involves cultivation of several cropswithin a year. Popular crop combinations include the fol-lowing:
• One rice crop with one spring rice crop or one summercrop
• Two rice crops, usually spring rice and summer rice
• Two rice crops and one winter crop: spring rice, sum-mer rice, and a winter crop
• One rice crop and one dry crop: a spring dry cropfollowed by summer rice
• One rice crop and two dry crops: a spring dry cropfollowed by summer rice and then a winter dry crop
• Dry-crop specialization in rainfed area: spring, sum-mer, and winter seasons have dry crops
• Four crops: spring rice, summer dry crop, summer rice,winter dry crop
• Spring rice, fish in summer, fruit trees on the farmborder
(Note: The spring rice crop covers the period of Febru-ary to June; the summer rice crop, from July to October; thewinter rice crop, from October to January; the summer drycrop, from June to August. The spring dry crops usuallyconsist of peanut, soybean, green bean; summer dry cropsare soybean; and winter dry crops are potato, maize, sweetpotato, and vegetables.)
The intensiveness of land use has necessitated the ap-plication of fertilizer to satisfy plant requirements. Fertil-izer supplements usually come from livestock manure.
Since 1991, the annual sown area of rice in the RedRiver area has increased very slowly and has fluctuatedaround 1 million ha (Fig. 8). Compared with the whole coun-try, the contribution of annual sown area of rice in the Red
Table 1. Main household types in the Red River Delta.
Cultivated area
Item Small land area Large land area
Income without labor Low Medium High Low Medium High
Type of land Lowland and Intensive and Intensive Lowland and Intensive and Intensivedry land coastal and low dry land coastal and low
Type of household (A) Small land (B) Small land (C) Small land (D) Poor (E) Middle (F ) Breedersarea, poor area, diversified area, diversified farmers farmers
agriculture economicsProductivity of plantsa – – ++ – – ++Off-farm activities – – = ++ – – – –Pig production – – – + = + ++Percent of total 15 21 5 24 33 2 respondents (%)Average surface 350–500 350–400 400–500 550–1,000 600–900 550–900 (m2 person–1)Average income year–1 40–50 70–100 130 60–70 80–100 120–200 (US$ person–1)
aBad development: –, very bad development: – –, normal development: =, good development: +, very good development: ++.Source: Dao The Anh and Jesus (1997). Classifying from data of VLSS (1993).
���� ���� ���� ���� ���� ���� ���� ����>�#�
�0���
�0���
�0���
����
���
�
�
�
�
�4 ���<�5�4�����5
���� ����
�#���,�.%%(>��$%��,�.%%(
Fig. 8. Paddy production in the Red River Delta. Source: GSO(2001).
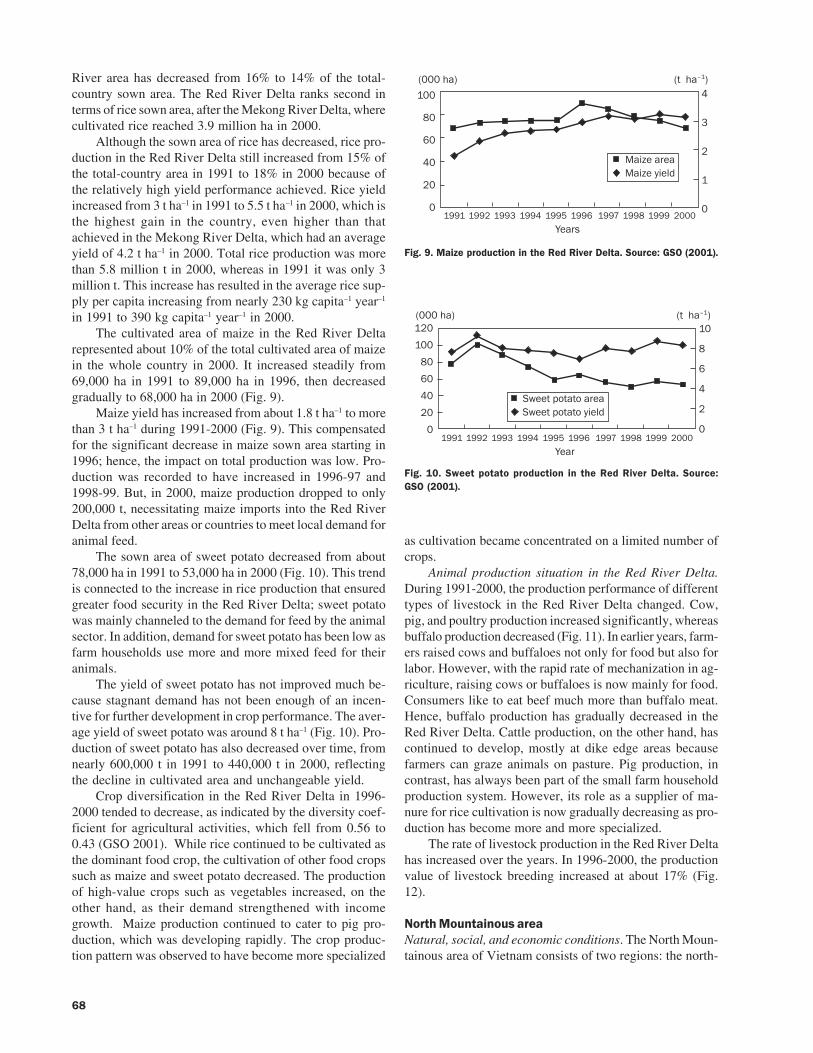
68
River area has decreased from 16% to 14% of the total-country sown area. The Red River Delta ranks second interms of rice sown area, after the Mekong River Delta, wherecultivated rice reached 3.9 million ha in 2000.
Although the sown area of rice has decreased, rice pro-duction in the Red River Delta still increased from 15% ofthe total-country area in 1991 to 18% in 2000 because ofthe relatively high yield performance achieved. Rice yieldincreased from 3 t ha–1 in 1991 to 5.5 t ha–1 in 2000, which isthe highest gain in the country, even higher than thatachieved in the Mekong River Delta, which had an averageyield of 4.2 t ha–1 in 2000. Total rice production was morethan 5.8 million t in 2000, whereas in 1991 it was only 3million t. This increase has resulted in the average rice sup-ply per capita increasing from nearly 230 kg capita–1 year–1
in 1991 to 390 kg capita–1 year–1 in 2000.The cultivated area of maize in the Red River Delta
represented about 10% of the total cultivated area of maizein the whole country in 2000. It increased steadily from69,000 ha in 1991 to 89,000 ha in 1996, then decreasedgradually to 68,000 ha in 2000 (Fig. 9).
Maize yield has increased from about 1.8 t ha–1 to morethan 3 t ha–1 during 1991-2000 (Fig. 9). This compensatedfor the significant decrease in maize sown area starting in1996; hence, the impact on total production was low. Pro-duction was recorded to have increased in 1996-97 and1998-99. But, in 2000, maize production dropped to only200,000 t, necessitating maize imports into the Red RiverDelta from other areas or countries to meet local demand foranimal feed.
The sown area of sweet potato decreased from about78,000 ha in 1991 to 53,000 ha in 2000 (Fig. 10). This trendis connected to the increase in rice production that ensuredgreater food security in the Red River Delta; sweet potatowas mainly channeled to the demand for feed by the animalsector. In addition, demand for sweet potato has been low asfarm households use more and more mixed feed for theiranimals.
The yield of sweet potato has not improved much be-cause stagnant demand has not been enough of an incen-tive for further development in crop performance. The aver-age yield of sweet potato was around 8 t ha–1 (Fig. 10). Pro-duction of sweet potato has also decreased over time, fromnearly 600,000 t in 1991 to 440,000 t in 2000, reflectingthe decline in cultivated area and unchangeable yield.
Crop diversification in the Red River Delta in 1996-2000 tended to decrease, as indicated by the diversity coef-ficient for agricultural activities, which fell from 0.56 to0.43 (GSO 2001). While rice continued to be cultivated asthe dominant food crop, the cultivation of other food cropssuch as maize and sweet potato decreased. The productionof high-value crops such as vegetables increased, on theother hand, as their demand strengthened with incomegrowth. Maize production continued to cater to pig pro-duction, which was developing rapidly. The crop produc-tion pattern was observed to have become more specialized
as cultivation became concentrated on a limited number ofcrops.
Animal production situation in the Red River Delta.During 1991-2000, the production performance of differenttypes of livestock in the Red River Delta changed. Cow,pig, and poultry production increased significantly, whereasbuffalo production decreased (Fig. 11). In earlier years, farm-ers raised cows and buffaloes not only for food but also forlabor. However, with the rapid rate of mechanization in ag-riculture, raising cows or buffaloes is now mainly for food.Consumers like to eat beef much more than buffalo meat.Hence, buffalo production has gradually decreased in theRed River Delta. Cattle production, on the other hand, hascontinued to develop, mostly at dike edge areas becausefarmers can graze animals on pasture. Pig production, incontrast, has always been part of the small farm householdproduction system. However, its role as a supplier of ma-nure for rice cultivation is now gradually decreasing as pro-duction has become more and more specialized.
The rate of livestock production in the Red River Deltahas increased over the years. In 1996-2000, the productionvalue of livestock breeding increased at about 17% (Fig.12).
North Mountainous areaNatural, social, and economic conditions. The North Moun-tainous area of Vietnam consists of two regions: the north-
���� ���� ���� ���� ���� ���� ���� ����>�#�
�4 ���<�5�4�����5
���� ����
*�:��#�*�:��(��$%
���
��
��
��
��
�
�
�
�
�
�
�4 ���<�5�4�����5
-�� �.� ��#�-�� �.� ��(��$%
��
�
�
�
�
�
���
���
��
��
��
��
����� ���� ���� ���� ���� ���� ���� ����
>�#���� ����
Fig. 9. Maize production in the Red River Delta. Source: GSO (2001).
Fig. 10. Sweet potato production in the Red River Delta. Source:GSO (2001).

69
east and northwest. There are 13 provinces in the north-east—Ha Giang, Cao Bang, Lao Cai, Lang Son, TuyenQuang, Yen Bai, Bac Kan, Thai Nguyen, Phu Tho, VinhPhuc, Bac Giang, Bac Ninh, and Quang Ninh—and threeprovinces in the northwest—Lai Chau, Son La, and HoaBinh.
The climate in the North Mountainous area is also di-vided into two distinct seasons, the dry and rainy seasons.The dry season starts in October to November and ends inMarch to April of the next year. During the dry season, theclimate of Bac Kan Province is cold and dry and the averagetemperature is 18 °C. Monthly rainfall during this seasonranges from 13.0 to 70.5 mm. The bulk of the rainfall (aver-age of about 82% of the total yearly rainfall) takes placeduring the rainy season. The maximum rainfall is in July,
with 263 mm. The temperature during this season rangesfrom 22.9 to 27.3 °C.
Total natural land in the North Mountainous area is103,106 km2. Agricultural land occupies approximately14%, whereas unused land occupies more than 45% (Fig.13).
Despite its small share, agricultural land per householdand per capita are 0.6 ha and 0.13 ha, respectively, whichare relatively higher than those reported in the Red RiverDelta of 0.08 ha per capita on average (Fig. 14). The averagelandholdings in this area have also decreased over the years.
From 1991 to 2000, the population in the North Moun-tainous area increased from 11 million to more than 13 mil-lion, with an average growth of 1.6% per year. The popula-tion is made up of various ethnic groups who live mainly in
�4���� 5�4������%5���
���
���
���
���
���
���
���
���
��
�
��0���
��0���
��0���
��0���
��0���
��0���
��0���
��0���
�0���
����� ���� ���� ���� ���� ���� ���� ����
>�#���� ����
��,,$�! $�?��?��$ #(
���)$�?��$ #(3 ��#�
���� ���� ���� ���� ����
�0���0���
�0���0���
�0���0���
�0���0���
�0���0���
�0���0���
�0���0���
�0���0���
�0���0���
���0���
�
A��%���
Fig. 11. Animal population and poultry production in the Red River Delta.Source: GSO (2001).
Fig. 12. Value of animal production in the Red River Delta. Source:GSO (2001).
��'� �%�$�%�6�� .�1�,�1�$�%
�6��
;�#�� #(�$�%��6��
��#�1�$ �#$�$�%��6��
=����%�$�%��6��
Fig. 13. Land use in the North Mountainous area in 2000. Note:Specific land consists of public areas used for nonagriculturalactivities such as a cemetery, etc. Source: GSO (2001).

70
the rural areas. The rural population still accounts for about85% of the area’s total population. Over the years, the urbanpopulation increased, with the highest growth rate at 8% in1997.
In 2000, GDP of the North Mountainous area was morethan $2,000 (Fig. 15). Agriculture had the largest percent-age contribution at 40%. During 1996-2000, GDP increasedat 9%, with industry averaging 15%, service 10%, and agri-cultural, forestry, and aquatic products combined at 6%.GDP per capita also increased from more than $100 in 1996to more than $133 in 2000. Despite this significant rise, percapita GDP in the North Mountainous area is still lowerthan in other areas.
The structure of agriculture in the North Mountainousarea has moved from crop cultivation and agricultural ser-vices toward animal production. Over 1996-2000, the pro-duction value of crop cultivation decreased from 78% tonearly 75% of the total production value of agriculture andso did the value of the agricultural service sector, from 5.2%to 0.2%. But, animal production increased from 16% to 25%(Fig. 16).
The average value of food supply per capita in the NorthMountainous area increased from about $25 in 1996 to more
than $32 in 2000. This number did not vary substantiallybetween provinces in the area. In this period, the northeastprovinces increased their percentage of food cultivation areafrom 61% to 65% vis-à-vis total cultivation area. However,the northwest provinces did not increase this share.
Characteristics of cropping systems in the North Moun-tainous area. During 1991-2000, the sown area of rice inthe North Mountainous area increased only a small amountfrom 820,000 to 845,000 ha (Fig. 17). But, from 2000 up tonow, the rate of growth has fallen even lower.
Total rice production increased year by year (from about1,600,000 t in 1991 to more than 3,200,000 t in 2000) de-spite cultivated area remaining at almost the same size. Thiswas due to the rapid increase in rice yield (from nearly 2 tha–1 in 1992 to nearly 4 t ha–1 in 2000; Fig. 19).
With the increase in rice production, paddy supply percapita also increased (from more than 135 kg capita–1 in
�4)��1.� <�5�4���������$%<�5
��#�1�$ �#$�$�%�.�#��������$%��#�1�$ �#$�$�%�.�#�1.�
�6��
�6��
�6��
�6��
�6��
�6��
�6��
�6��
�6��
����� ���� ���� ���� ���� ���� ���� ����
>�#
�0���
�0���
�0���
�0���
���
���
���
���
�
����
��
��
��
��
�����
>�#���� �������� ���� �������� ���� ���� ����
��#�1�$ �#�0�,�#�� #(0��%�,����#( �%�� #(�#/�1�
Fig. 14. Evolution of agricultural land in the North Mountainousarea. Source: GSO (2000). �������� �������� ����
���
��
��
��
��
�
�
>�#
�#/�1�9�/�� �1@!�$ �/ ���
Fig. 15. Evolution of GDP structure in the North Mountainous area.Source: GSO (2001).
�4�����5�0���
���
���
���
���
����� ���� ���� ���� ���� ���� ���� ����
>�#���� ����
�#���,��-�� �.� ��#���,�.%%(�4-��$��(�#5�#���,�)�:��#���,�1��/
Fig. 16. Evolution of agricultural value structure in the NorthMountainous area. Source: GSO (2001).
Fig. 17. Evolution of some main crop areas in the North Mountainousarea. Source: GSO (2001).

71
1991 to 245 kg capita–1 in 2000 on average); however, itwas still smaller than in other areas of the country.
For households at some locations in the North Moun-tainous area, maize was still considered the staple food. Inaddition, maize is the main feed for animals in various lo-calities. Cultivated area dedicated to maize increased gradu-ally (from nearly 200,000 ha to more than 300,000 ha over1991-2000). Following the increase in sown area, yield andproduction of maize also increased. In 2000, maize produc-tion reached nearly 700,000 t, with yield of about 2.3 t ha–1
(Figs. 17 and 18).Sown area of sweet potato has not changed much. It
fluctuated around 70,000 ha during 1991 to 2000. The high-est sown area recorded was 85,000 ha in 1993. From 1994 to1998, sown area of sweet potato decreased and its yield waslow and unstable, only 5–6 t ha–1. Production of sweet po-tato in the area in 2000 reached only 400,000 t (lower thanin 1991-93, especially in 1992, which was more than 540,000t).
In the North Mountainous area, cassava was primarilycultivated only after rice. It played an important role insupplying feed for animal production. The sown area ofcassava reached 85,000 ha in 2000 and occupied more than35% of the sown area of cassava in the whole country. From1991 to 2000, the sown area of cassava was unchanged (Fig.17). It fluctuated from 85,000 to 90,000 ha and reached ahigh of a little more than 100,000 ha in 1992. Yield ofcassava is now even lower than previous levels, and it hasalso been unstable over the years (about 8 t ha–1; Fig. 18).
The production of cows, buffaloes, pigs, and poultry inthe North Mountainous area all increased during 1991 to2000 (Figs. 19 and 20). While buffalo production in thewhole country decreased, buffalo production in the NorthMountainous area still increased to become the largest buf-falo meat-producing area (about 60% of buffalo productionof the country). The main reason for this situation is thatthere is still a strong demand for buffaloes for use as draftpower and transportation. Cow breeding in the North Moun-tainous area is mainly channeled only to meet beef demandfrom the local people or from people in nearby areas. Farm-ers raised cows and buffaloes by taking advantage of therich grazing pastures that are still abundant in the area.Households therefore did not have to spend much moneyon feed. Thus, the percentage of benefits in raising cowsand buffaloes was relatively high and has increased overtime.
The total value of animal production has increased morethan 1.9 times from 1996 to 2000, in which domestic ani-mals such as cows or buffaloes occupied nearly 70% (Fig.20).
Meat consumption in Vietnam
Consumption of meat per capita has increased rapidly inrecent years. Although the gap in consumption betweenurban and rural areas is still high, it is decreasing because ofthe strong growth in consumption in rural areas from 1992
�4 ��<�5��
��
�
�
�
�
����� ���� ���� ���� ���� ���� ���� ����
>�#���� ����
>��$%��,��-�� �.� �>��$%��,�.%%(>��$%��,�)�:�>��$%��,�1��/
�4������%5
�0���
�0���
�0���
�0���
�0���
���
���
���
���
����� ���� ���� ���� ���� ���� ���� ����
>�#���� ����
��,,$��4������%5! $��4������%5?����4��0������%5?��$ #(�4���� 5
�4���� 5
��0���
��0���
��0���
��0���
��0���
��0���
��0���
��0���
�0���
�
���)$?��$ #(3 ��#�
���� ���� ���� ���� ����
�0���0���
�0���0���
�0���0���
�0���0���
�0���0���
�0���0���
���0���
�
4)�$$����%���5
>�#
Fig. 18. Evolution of some main crop yields in the NorthMountainous area. Source: GSO (2001).
Fig. 20. Value of animal production in the North Mountainousarea. Source: GSO (2001).
Fig. 19. Animal population and poultry production in the NorthMountainous area. Source: GSO (2001).

72
to 1997 (10% per year). Moreover, the increase in meat con-sumption is relatively equal at all levels of the population.
According to a survey on living standards of the Viet-namese people, foodstuffs that were made available in themarket were valued at about $3,343 billion in the VietnamLiving Standard Survey (VLSS) for 1992-93 and increasedto $4,998 billion in the VLSS for 1997-98 (Moustier et al2003). In urban areas, consumption increased by 25% andin rural areas it was slightly lower at 23%. The urban marketshowed a much faster increase in consumption comparedwith the rural market, from 38% (1992-93) to 40% (1997-98). According to the FAO food balance sheet, while growthin overall food consumption fell, that for meat and veg-etable consumption increased. Meat consumption increasedfrom nearly 1 million t in 1985 to nearly 2 million t in 2000.According to Dang Tinh,3 domestic demand for milk hasalso increased rapidly, but the national capacity of the milksupply applied only 8% to the demand for consumption.Vietnam needed to import about $230 million worth of milkpowder every year.
Economic development led to an increase in averageincome per capita in both urban and rural areas and increasesin demand for rich protein products, especially pork prod-ucts. Pork consumption per head alone in the Red RiverDelta is about 8–9 kg capita–1 year–1 (IFPRI-MARD 1999-2001). Meat consumption differs across areas (Table 2). InHai Duong Province, according to Vu Trong Binh’s surveyin 1998 (Vu Trong Binh 2002), meat consumption was about12 kg capita–1 year–1 among medium-income households inrural areas, while the more affluent households had totalconsumption of rich protein food at 36 kg capita–1 year–1. InHai Phong and Ha Noi, meat consumption was about 30–35kg capita–1 year–1 among medium-income households, whiletotal rich protein food consumption was 80–90 kg capita–1
year–1 among the richer group. Based on statistics providedby Moustier (2003), egg consumption was about 2 kghead–1 year–1 in 1997.
The increase in pork consumption in rural areas wasmore rapid between the survey periods covering 1992-93and 1997-98 (Table 3). Also indicated for the same periodwas the much bigger magnitude of increase among the ruralpopulation. Table 4 indicates that the rate of increase inmeat consumption among individuals in the low-incomegroup was more rapid than that exhibited by the richer-income group.
The rapid development of consumption demand in ur-ban areas shows that many households, primarily those withhigh-income levels, have reached their saturation point forparticular food products, especially products of lower qual-ity. This pattern is no different from that experienced inmore advanced countries in Asia. Consumers in urban areas
Table 2. Meat consumption in some areas of Vietnam (kg person–1
year–1)
SiteMedium-income Rich (higher-
household income) household
Rural area (Hai Duong 12 36 Province)City: Ha Noi, Hai Phong 30–35 80–90
Source: Vu Trong Binh (2002).
Table 3. Growth rate of pork consumption in urban and rural areas.
Item Urban Rural Rural/urban ratio
Consumption (1992-93) in kg person–1 year–1 14.7 8.3 77%Consumption (1997-98) in kg person–1 year–1 18.9 12.5 51%% change 28.6 50.6Annual growth rate (% year–1) 5.7 10.0
Source: Vietnam Living Standard Survey for 1993 and 1998 in GSO (2000).
Table 4. Growth rate of pork consumption by income of different population levels.
Income quintileItem Average
1 2 3 4 5
Consumption (1992-93) in kg person–1 year–1 3.7 6.1 8.2 10.7 19.2 9.6Consumption(1997-98) in kg person–1 year–1 5.9 9.7 12.4 17.3 24.7 14.0% change 59.8 59.9 50.5 61.5 28.8 46.1Annual growth rate (% year–1) 12.0 12.0 10.1 12.3 5.8 9.2
Source: VLSS 1993 and 1998 in GSO (2000).
3Vietnam Agricultural Newspaper, Tuesday, No. 113, 25 June 2002.

73
tend to diversify their food intake and demand products ofhigher quality. This demand surpasses our present agricul-tural production ability as demonstrated by the market shareof high-quality foreign products.
Product quality
In general, consumers are likely to use high-quality prod-ucts, but there is a clear difference in demand between ur-ban and rural areas. In urban areas, 86% of households arenow more prepared to buy better-quality meat at a relativelyhigher price and 54% are more inclined to replace pig fatwith vegetable oil. Thus, it is difficult to sell pigs that havea thick layer of fat in urban areas. In rural areas, demand forhigh-quality meat is lower, and pig fat for cooking is stillvery much used, although recent trends have also indicatedits gradual substitution by vegetable oil.
The requirement for hygiene quality of meat in cities isclearly expressed in Table 5. Actually, if the products areclean and safe, consumers are prepared to pay higher prices,perhaps from 6% to 16% more than the basic price, depend-ing on their level of income.
Although Vietnam’s consumers are rapidly increasingthe quantity of pork they eat, they also require higher-qual-ity pork, such as a higher proportion of lean meat and hy-giene control. However, the domestic pork market poorlysignals these consumer preferences to producers. The pigmeat distribution process is scattered, with too many agentsthat do not specialize in product distribution. Agents thatretail to consumers are only interested in quality aspectsthat consumers are able to identify. Other quality aspects,such as hygiene, cannot yet be identified because of theabsence of product trademarks or government controls, andtherefore some meat quality aspects that cannot be identi-fied do not receive a price premium. On the other hand,producers face higher costs from increasing meat qualitybecause of the small scale of high-quality meat production.In this environment, producers have little incentive to in-crease the quality of their product.
Achieving economies of scale in the production ofhigh-quality meat would be an important step in reducingthe costs of breeding, animal collection, meat distribution,
and quality control. Currently, the small scale of produc-tion means that the risks of participating in the commoditychain are high and this is reflected in high transaction costsamong commodity agents (Vu Trong Binh and Casabianca1996). If the domestic market is not reorganized to ensurethat product quality becomes an important factor in the pricedetermination process, consumer demand will never be metby domestic production and the domestic market will riskbeing dominated by foreign companies.
Policy reforms and the development of agriculture
It was primarily in the rural areas where the transition fromcollective agriculture to the household economy took place.Because of difficulties in the management of upland nonricefood crops and animal production, it was decided that theseactivities should also be given to the household economyin addition to cultivation and home gardening. So, incomefrom households increased and surpassed that from the co-operatives. In some areas, peasants practiced the “under-ground contract” (khoan chui), in which paddy land wasleased to farmers for a fixed contribution to the cooperative.In these villages, production increased. In 1981, DirectiveNo. 100 was passed and adopted to legalize this institution,which was kept informal and hidden for some time. Viewedfrom an institutional perspective, this directive gave farm-ers the right to decide on use and return. In 1981, the house-hold started to be reconstituted as the major unit of agricul-tural production in place of the farm cooperatives. House-holds were allotted specific plots of land for managementunder a contract system. The cooperatives still held a mo-nopoly over the provision of inputs and the marketing ofoutput (Dao The Anh and Jesus 1998).
But farmers were not fully satisfied with the new sys-tem. In many villages where the “full contract” (khoan trang)was practiced, farm households seemed to be more satisfiedcultivating paddy fields that were leased to them and at thesame time were free from any responsibility to the coopera-tives. This initiative was the basis of Resolution No. 10 thatinitially established farmers’ right to decide their use ofcapital. Together with the abolition of the state procure-ment and supply system, the household economy system
Table 5. Requirement of hygiene quality of meat in Hai Phong.
ItemPercent of people
Good signalwho take notice
Butcher 73.6 Clean, shows no diseasePosition of store 34.0 Clean, far from roadHeight of meat table 71.7 >1 mCleanliness of meat table 62.3 Clean, made of concrete or tileCleanliness of tools 34.0 CleanWashing water 1.9 Using tap waterPackage 43.4 Made of plasticDon’t buy if not clean 47.2
Source: Vu Trong Binh (2002).

74
was almost resuscitated. But control over the land was stillunder the cooperatives. In 1988, Resolution No. 10 was re-enacted and strengthened, giving households decision rightsover the use of their resources, including land, although thestate retained ownership of the latter. Households’ right touse their land was in exchange for a land tax. By 1992, 6million of the 7 million hectares of agricultural land werefarmed under direct household-use rights, although the spe-cific arrangement varied from place to place (Dao The Anhand Jesus 1998).
Despite the existence of the 1987 land law that prohib-ited the sale of the land, an underground land market wasforming. The 1993 land law legalized this situation onlyunder a formal right of transfer of the land-use rights. In July1993, a revision of the land law allowed for the extension oftenure of use rights to 20 years and more importantly pro-vided for the transfer of use rights.
So, after three consecutive reforms, full rights regard-ing the main factors of production had been returned to thehousehold and the collective farming system had been com-pletely dismantled. This process occurred over 12 years and,during this time, the peasant household economy was be-ing reinforced to take full responsibility for agricultural pro-duction in the whole country.
These reforms had a positive impact on rice productionin the entire country. Vietnam quickly transformed itselffrom a rice importation situation to rice exportation.
Toward a greater focus on developmentof the livestock sectorWith rice now in surplus, the new challenge for agriculturalpolicy is to promote agricultural diversification in whichthe livestock sector would play a crucial role. Closer scru-tiny of policy for the livestock sector will help us under-stand how ICAS will fare in the coming years.
The Vietnamese government has always focused on thepolicy objective of promoting animal production and push-
ing this subsector to become a principal production activ-ity. But the government has had difficulties in realizing thispromotion policy. Every year, the state has a budget foragricultural research and development. Extension programsare often spread from the top to the bottom in the extensionnetwork. In general, extension programs on animal produc-tion are rather small in comparison with crop cultivationactivities. Nonetheless, the increase in budget for extensionin the last 10 years has proved that the government has beenpaying attention to agricultural development activities(Table 6).
The government extension system in the delta areaspays much more attention than in the mountainous areas tobreeding foreign pigs and dairy cows. In contrast, the localbudget of mountainous areas allocates only a small amountof the budget to animal development (Table 7).
Besides extension stations, other government actors inthe pig commodity chain play a role in preventing epidemicdiseases, such as veterinary networks from the central levelto the commune level (in delta areas) or district level (inmountainous areas). The salary of these veterinary networksis paid by the government. These networks are responsiblefor abattoir quarantine in order to be able to help meet ex-port demand.
Moreover, local breeding conservation and multipli-cation centers have been set up all over the country. Thesecenters play an important role in introducing new breeds tofarmers/pig raisers.
In conclusion, the pig and poultry commodity chainincludes actors such as producers, middlemen, traders, mar-ket vendors, external stakeholders, etc. The government isalso an actor with the tasks of investigating, supervising,and promoting commodity chains. Government policiesoften concentrate on quarantine, breed, and developmentprojects. Tax policies are also considered as a barrier toentry to the market. Many actors in the commodity chainare a nonstate institution, that is, the government does not
Table 6. Budget for governmental extension programs (US$).
Year CultivationAnimal Information and
Totalhusbandry extension
1993 $ 27,333 8,600 60,200 99,467% 27.5 8.6 60.5 100.0
1994 $ 574,400 187,933 98,667 861,000% 66.7 21.8 11.4 100.0
1995 $ 666,667 240,000 73,333 1,000,000% 66.6 24. 0 7.3 100.0
1996 $ 1,020,800 277,333 54,667 1,594,133% 66.0 17.9 3.5 100.0
1997 $ 1,226,667 326,667 93,333 1,900,000% 64.5 17.2 4.9 100.0
1998 $ 957,400 413,333 167,467 1,750,200% 54.7 23.7 9.5 100.0
1999 $ 825,067 397,800 160,867 1,777,733% 46.4 22.4 9.0 100.0
Source: Department of Agriculture-Forestry Extension (Ministry of Agriculture and Rural Development 2000).
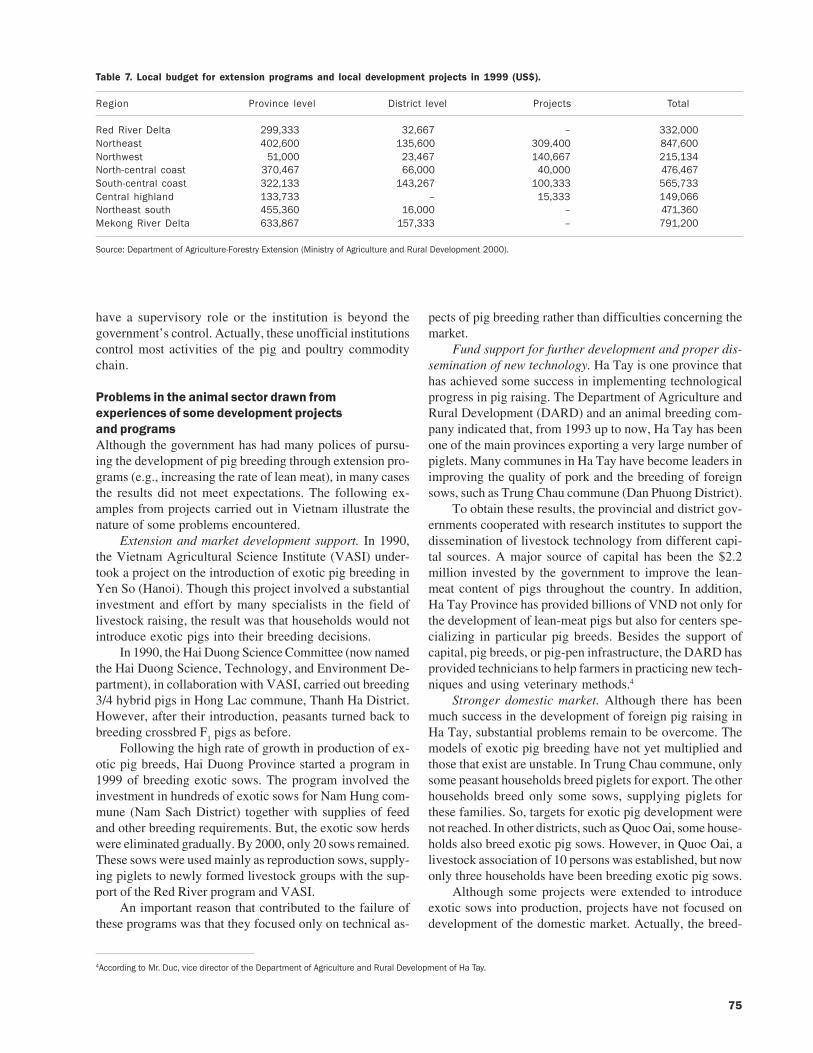
75
have a supervisory role or the institution is beyond thegovernment’s control. Actually, these unofficial institutionscontrol most activities of the pig and poultry commoditychain.
Problems in the animal sector drawn fromexperiences of some development projectsand programsAlthough the government has had many polices of pursu-ing the development of pig breeding through extension pro-grams (e.g., increasing the rate of lean meat), in many casesthe results did not meet expectations. The following ex-amples from projects carried out in Vietnam illustrate thenature of some problems encountered.
Extension and market development support. In 1990,the Vietnam Agricultural Science Institute (VASI) under-took a project on the introduction of exotic pig breeding inYen So (Hanoi). Though this project involved a substantialinvestment and effort by many specialists in the field oflivestock raising, the result was that households would notintroduce exotic pigs into their breeding decisions.
In 1990, the Hai Duong Science Committee (now namedthe Hai Duong Science, Technology, and Environment De-partment), in collaboration with VASI, carried out breeding3/4 hybrid pigs in Hong Lac commune, Thanh Ha District.However, after their introduction, peasants turned back tobreeding crossbred F
1 pigs as before.
Following the high rate of growth in production of ex-otic pig breeds, Hai Duong Province started a program in1999 of breeding exotic sows. The program involved theinvestment in hundreds of exotic sows for Nam Hung com-mune (Nam Sach District) together with supplies of feedand other breeding requirements. But, the exotic sow herdswere eliminated gradually. By 2000, only 20 sows remained.These sows were used mainly as reproduction sows, supply-ing piglets to newly formed livestock groups with the sup-port of the Red River program and VASI.
An important reason that contributed to the failure ofthese programs was that they focused only on technical as-
pects of pig breeding rather than difficulties concerning themarket.
Fund support for further development and proper dis-semination of new technology. Ha Tay is one province thathas achieved some success in implementing technologicalprogress in pig raising. The Department of Agriculture andRural Development (DARD) and an animal breeding com-pany indicated that, from 1993 up to now, Ha Tay has beenone of the main provinces exporting a very large number ofpiglets. Many communes in Ha Tay have become leaders inimproving the quality of pork and the breeding of foreignsows, such as Trung Chau commune (Dan Phuong District).
To obtain these results, the provincial and district gov-ernments cooperated with research institutes to support thedissemination of livestock technology from different capi-tal sources. A major source of capital has been the $2.2million invested by the government to improve the lean-meat content of pigs throughout the country. In addition,Ha Tay Province has provided billions of VND not only forthe development of lean-meat pigs but also for centers spe-cializing in particular pig breeds. Besides the support ofcapital, pig breeds, or pig-pen infrastructure, the DARD hasprovided technicians to help farmers in practicing new tech-niques and using veterinary methods.4
Stronger domestic market. Although there has beenmuch success in the development of foreign pig raising inHa Tay, substantial problems remain to be overcome. Themodels of exotic pig breeding have not yet multiplied andthose that exist are unstable. In Trung Chau commune, onlysome peasant households breed piglets for export. The otherhouseholds breed only some sows, supplying piglets forthese families. So, targets for exotic pig development werenot reached. In other districts, such as Quoc Oai, some house-holds also breed exotic pig sows. However, in Quoc Oai, alivestock association of 10 persons was established, but nowonly three households have been breeding exotic pig sows.
Although some projects were extended to introduceexotic sows into production, projects have not focused ondevelopment of the domestic market. Actually, the breed-
4According to Mr. Duc, vice director of the Department of Agriculture and Rural Development of Ha Tay.
Table 7. Local budget for extension programs and local development projects in 1999 (US$).
Region Province level District level Projects Total
Red River Delta 299,333 32,667 – 332,000Northeast 402,600 135,600 309,400 847,600Northwest 51,000 23,467 140,667 215,134North-central coast 370,467 66,000 40,000 476,467South-central coast 322,133 143,267 100,333 565,733Central highland 133,733 – 15,333 149,066Northeast south 455,360 16,000 – 471,360Mekong River Delta 633,867 157,333 – 791,200
Source: Department of Agriculture-Forestry Extension (Ministry of Agriculture and Rural Development 2000).
76
ing of exotic sows by household farmers mainly serves ex-port-oriented activities because funding sources are prima-rily concerned with the export market.
For poultry, the projects focused on the developmentof this sector had the most success on large farms with astrong domestic market linkage. There are only some re-gions where small and large farms benefited from develop-ment projects in the poultry sector. The main example ofthis was the introduction of new poultry strains such as Su-per C.V. and Super M, which were imported into Vietnamstarting in 1989 under the framework of a project titled “Re-search and Development of Duck Raising—VIE 86/007,”supported by the United Nations Development Programme(UNDP). In 1993, duck breeding developed strongly, to thepoint that the female duck population in the country is nowabout 75,000. Afterward, many breeds of water birds wereplaced into production. In addition to this, some projectshave introduced specific chicken strains with a twofoldpurpose (meat and eggs) into production in many regions ofthe country.
Some conclusions from these projectsThe main reason for the ineffectiveness of many govern-ment policies and projects seems to be constraints withinthe projects, such as the following:
• Exotic pig breeds require livestock conditions thatare much more demanding on peasants than local pigbreeds in households at present. For requirements con-cerning hygiene, nutrition, breeding facilities, and theprevention and treatment of epidemics and diseases,exotic breeds often surpass the ability of most peas-ants. The shift from breeding traditional breeds toexotic breeds requires a learning process to accumu-late experiences. Many peasants were not yet preparedthoroughly and many projects did not have suitabletraining and guiding methods. Naturally, the absenceof appropriate breeding conditions and learning pro-cesses led to high risks. At the end of these projects,some peasants could not continue raising the newbreeds.
• Presently, breeding high-productivity animals requiresa good understanding of the necessary breeding con-ditions and a basic level of investment; otherwise,product costs would increase substantially. However,most research on these conditions was based on theo-retical requirements from a biological perspectiverather than from the poor-farmer environment. To pro-mote high-productivity breeds, experiments in poor-farmer environments need to be conducted. But, up tonow, it is rare to see research institutes conductingsuch experiments because they often put out techno-logical regulations that were built from experimentsat stations; therefore, extension service offices find itvery difficult to find and give suitable recommenda-tions for poor farmers. The scale of breeding by poorfarmers is still small and no institutions are able toprovide linkages between these farmers and institu-
tions. In addition to the inability of small producersto gain economies of scale in production costs, theyhave some problems in gaining access to markets.Thus, while the quality of exotic pig products ishigher, the small level of production means that it isvery difficult for poor farmers to negotiate higher sell-ing prices that reflect the quality of the product. Col-lectors have to spend a substantial amount of timecollecting just a small amount of high-quality prod-ucts that in many cases results in their inability tooffer a higher price for these products. This problemalone is substantial enough to remove the benefits topeasants from taking up the production of exoticbreeds.
• Projects are often only interested in technical factorsof production, with almost no studies concerning eco-nomic and social factors. For this reason, many tech-nical studies have dealt with factors to promote theeconomic effectiveness that is expected of the project.
Constraints to the further development of livestock
Constraints related to input marketsPrice and quality of animal feed. According to IFPRI andthe MARD survey, the difference in the quality of animalfeed is reflected partly in its price. Animal feed produced bythe private sector in Vietnam is much less expensive thanfeed produced by foreign and government enterprises, butit has a lower quality. These private producers have a strat-egy of maximizing profit by concentrating on quantity ratherthan quality. This is also true for most livestock producersthat are focused on the quantity of their breeding ratherthan the quality of the meat they produce. In contrast, for-eign enterprises concentrate their efforts on products with ahigher quality that command higher prices. However, thetime will come when demand for high-quality meat prod-ucts will increase to the point where domestic livestockproducers will also have to provide high-quality animalfeed. Current producers of cheap animal feed need to investsoon in their capacity to produce with higher quality, im-prove their reputation for producing a consistent quality,and develop their trademark products. Only then will theseproducers be able to compete successfully with large for-eign enterprises that have positioned themselves well forfuture growth of the livestock industry.
Feed for exotic pigs requires industrial feed rich in pro-tein. The rate of raw protein in pig feed is still very low, only13.6% for fattening pigs (Table 8). The Vietnamese animalfeed industry is still in its infancy and product quality isoften inconsistent, even products made by large foreignenterprises such as CP from Thailand, Proconco, AmericanFeed (AF), and Cargill. The inconsistency of quality islargely due to the inability of small livestock breeders tomonitor the quality of feed over time and organize them-selves in such a way that their grievances are addressed iffeed quality lapses. There is also little pressure from thegovernment for animal feed producers to meet quality stan-
77
dards because of the lack of control of the sector. An ex-ample of this occurred in 2002 when a French company,Proconco, was discovered to have used animal protein im-ported from Europe into Vietnam for feed products. Regula-tions prohibit the use of such products because of the threatof mad cow disease.
The price of animal feed in Vietnam is relatively highin comparison with that in other countries in the region.This is one factor that raises the production cost of pigs andpoultry.
The price of animal feed is high not only for mixed feedbut also for raw materials such as maize and soybean, whichoften have higher prices than the world market price. Thelarge difference in prices between Vietnam and the worldmarket is mainly due to the government’s policy of protec-tionism for agricultural products. While this protectionismis supposed to benefit the poor farmers, many of them sufferfrom this policy. There is only an advantage for processingcompanies, especially for foreign companies, which receivequotas for imported products. The artificially high cost ofanimal feed obstructs efforts to improve the quality andcompetitiveness of the livestock commodity chain. If thegovernment wants to improve the competitiveness of allagricultural branches, it is necessary to have a strategy ofreducing the cost price of products in both livestock andcrop production. The way to assess changes to governmentpolicy is to determine the costs and benefits for all stake-holders affected by this change. From this perspective, thedecision to stimulate the livestock sector by removing pro-tectionist policies will also have to take into account thecosts imposed on the cultivation sector. In any case, Viet-nam will have to consider such issues as part of its prepara-tion for joining the ASEAN Free Trade Agreement (AFTA)and World Trade Organization (WTO) by around 2006.
Unstable quality and high price of animal breeds. Amajority of the pig breeds are produced and marketed byfarm families, primarily on a small scale (Table 9). Farm
families undertaking pig breeding on a larger scale are alsosubstantial, and about 75% of the total supply originatesfrom them. Although most pig breeds are supplied by farmhouseholds from small-scale production, only a few have agood understanding of crossbreed formulas. Consequently,knowledge of the advantages of a particular breed is lim-ited. For government-owned companies, the production costand selling price of a particular breed are often too high andprohibitive for household breeding. For exotic pig breeds,only in Ho Chi Minh City and Dong Nai Province can house-holds be found with these breeds. The Red River Delta nowhas only a few households with exotic pig breeds. In gen-eral, the use of exotic breeds depends on the scale of live-stock production. Big households raise many more exoticbreeds than small households (Table 10). Producing exoticpig breeds on government farms is often very expensive,and is not suited for poor farmers. Many breeds that wereraised for lean meat were not successful, either in terms ofthe quality achieved or to the extent to which farmers wereable to increase the weight of these pigs at the time of slaugh-ter. The main reason for this was poor nutritional diets.
Lack of capital for investment. According to Hoang VuQuang (1996), the agricultural communes in the Red RiverDelta were developing livestock and improving their or-chards. Thirty-five percent of the peasants borrowed capitalfrom official credit organizations such as banks or creditfunds and the remaining 65% did not borrow capital fromany source. Nonetheless, private borrowed capital still playsan important role in supplying capital for pig and poultrybreeding, given that 60% of medium households and 50%of poor households borrow capital from private sources. Thereason for this is because breeding domestic animals andpoultry is more capital-intensive than crop cultivation. Inparticular, pig breeding involves a long cycle of up to someyears for sows and yearly for meat pigs. However, a cycle forborrowed capital is around 1 year for a short-term loan facil-
Table 8. Rate of raw protein, classified by kind of feed and form ofowners’ production base (%).
EnterpriseItem
State Private Foreign
Feed for pregnant sows 19.1 14.4 22.7Feed for suckling pigs 19.2 16.5 19.5Feed for sows, waiting to be pregnant 15.0 13.0 13.0Feed for piglets 17.0 14.3 24.8Feed for fattening pigs 16.9 12.5 13.0Condensed feed for pigs 36.6 28.0 34.0Feed for egg-laying chickens 17.1 17.0 22.2Feed for pullets 18.4 17.0 31.5Feed for infant chickens 22.2 20.5 20.3Feed for not fully grown chickens 18.5 18.0 19.5Condensed feed for poultry 38.0 – 25.5Feed for dairy breeding 15.2 15.2 15.0
Source: IFPRI-MARD (1999-2001).
Table 9. Proportion of purchased pig breeds by farm type (%).
Sources of Farmers/ Otherpig race merchants
Governmentprivate
Others
Small scale 93.0 5.0 1.8 0.2Large scale 74.0 16.0 5.6 4.4
Source: IFPRI-MARD (1999-2001).
Table 10. Proportion of producers breeding partial- or full-bloodedforeign strains (%).
Type of household Pigs Chickens Ducks
Small 10.0 22.0 21.3Big 55.0 70.0 42.9
Source: IFPRI-MARD (1999-2001).

78
ity. There are many difficulties for households to shift fromcombining livestock production with subordinate agricul-tural products to specialize in livestock production. Thesehouseholds typically lack access to finance to repair andupgrade breeding facilities and buy new breeds.
The conditions offered by financial institutions are nowinsufficient for households that want to achieve large-scalepig farming, in terms of both the amount of the loan avail-able and the time required to repay it. This problem is par-ticularly the case with the Agricultural Bank. On the otherhand, loans available to poor households are too large fortheir purposes. Many poor households require only a verysmall amount of capital to buy new breeds. However, smallcredit funds do not exist and the larger lending institutionswill not cater to them.
Small-scale production. According to the research car-ried out in Ha Tay, Nam Dinh, and Hai Duong provinces (alllocated in the Red River Delta) by VASI and the FrenchScientific Organization for Tropical Agriculture (CIRAD),the livestock sector as a whole has not yet become special-ized and it has a tight relationship with other productionbranches, especially crop production.
However, the high capital intensity of pig breeding lendsitself to specialization because of the benefits of economiesof scale. Economies of scale imply that the incremental costof production decreases as the total production of pigs in-creases. As participants in the pig commodity chain takeadvantage of economies of scale, it is expected that produc-ers will become more concentrated and production priceswill decline. Similarly, intermediate agents, such as distribu-tors, can also take advantage of economies of scale. Forexample, the cost of distribution per unit of meat generallydecreases as the number of units distributed by a particularagent increases.
To benefit from economies of scale, it is necessary toremove the constraints faced by households in increasingtheir level of production, such as the lack of money avail-able for investments. Another important step would be tosearch for the most appropriate means for small-farmer house-holds to form organizations such as associations or coop-eratives that are able to obtain benefits of economies ofscale.
Risk from epidemics and disease. The potential threatof epidemics and disease is increasing day by day, espe-cially for imported breeds. These risks are great among live-stock producers and pose big constraints to households in-creasing their production scale.
Most veterinary services are provided by private indi-viduals who have shops only to sell veterinary medicineand animal feed. These shops do not provide animal main-tenance advice and care services and, if they do, they arepoorly managed and very deficient, resulting in poor medi-cine prescriptions and treatment quality. Farmers’ employ-ment of these services only results in increased productionand transaction costs, and hence ignores the importance ofanimal care and maintenance. Furthermore, this deficiencyand the weak system discourage small livestock producersfrom using new pig breeds. Table 11 compares the losses ofpig raisers who do not have veterinary consultation withthose who do. This research conducted by the Agrarian Sys-tems Department of VASI in Hai Duong Province indicatesthat farming households could substantially reduce the risksassociated with epidemics and disease when veterinary con-sultation takes place.
Constraints related to output marketsCapital for investment. A lack of capital is the factor pre-venting many farmers from taking part in the market. Thesefarmers are not able to achieve a sufficient scale of produc-tion to take advantage of economies of scale as well as op-portunities from the government to be able to borrow money(as owners of farms) or to participate in meat export pro-grams subsidized by the government. Poor households areunable to produce pigs with a high percentage of lean meatas they do not have enough capital to ensure appropriatebreeding conditions. Households face great difficulty bor-rowing a sum exceeding about $700 over the medium tolong term.
High costs of production. The costs of pig and poultryproduction in Vietnam are much higher than in most othercountries, even in Southeast Asia. Production costs are im-portant mainly because input costs are high, the productionscale is small, and new technology is lacking. This situa-tion led the government to subsidize the production of meat
Table 11. Comparison of economic and technical efficiency of veterinary consultations.
Monitoring itemsHouseholds didn’t take part Households took part
in veterinary consultation in veterinary consultation
Number of pigs monitored 1,317 1,421Number of pigs with disease 266 191Number of pigs that died because of disease 106 35Rate of pigs being contamintaed by disease (%) 20.2 13.4Rate pigs die/rate pigs get the disease (%) 39.8 18.3Veterinary expenses pig–1 month–1 when disease occurs (US$) 0.33 0.18Loss because of death and/or cheap selling ($) 1.37 0.42Total loss pig–1 ($) 2.36 1.15
Source: Survey of Agrarian Systems Department (2001).

79
for export over many years, which has diverted funds awayfrom programs that could have focused on lowering pro-duction costs.
Quality and hygiene of pig production. The quality ofpig meat depends on the particular pig breeds used andbreeding conditions. Because these factors differ across farm-ing households, quality varies substantially. However, onthe whole, the quality of pig meat is low in Vietnam. Hy-giene quality is not controlled tightly from the place ofproduction to the retail trade area. On the other hand, im-ported meat has a reputation for good hygiene and this willbe an important factor that drives the consumption of im-ported meat in Vietnam as its availability increases overtime. Vietnamese exporters of pork now face substantialdifficulties in passing the control barriers of many coun-tries.
Economies of scale. The low scale of production bymost pig and poultry farmers is the main factor that explainsthe difference in production costs in Vietnam compared withthose in other countries. The inability to take advantage ofeconomies of scale is also present in the transportation anddistribution sector of the livestock commodity chain, whichlargely explains the high transaction costs involved in mov-ing products to local and export markets. On the whole, ifVietnam does not overcome shortcomings of the lack ofeconomies of scale, it will probably lose its market sharewhen admitted to AFTA and the WTO.
Incomplete legal system. The government does not yethave clear standards and enforceable regulations concern-ing the transportation and slaughter of livestock. Private orgovernment agents acting in this field pay almost no atten-tion to quality standards. For example, abattoirs in Ha Noiare not subject to any hygiene standards. There is no defini-tion of what is an abattoir, where they are allowed to bebuilt, and the infrastructure and operating conditions thatmust be met. The lack of effectiveness of governmental in-stitutions in this field has made the slaughter of livestockdisorderly and the offices for controlling epidemics unableto fulfill their duties. In this environment, efforts by produc-ers to improve the quality of their products are largely wastedgiven the poor treatment of livestock from the farm gate tothe retail sector. These factors demonstrate the productionproblems faced by different agents throughout the commod-ity chain.
Communication obstacles. Many regions, especiallythe mountainous regions, face substantial communicationdifficulties, largely because of geographic and cultural di-visions combined with poor infrastructure and a lack of tech-nology. For example, there is a clear division of marketsbetween North and South Vietnam. Divisions also exist ona much smaller scale, such as communities in mountainousregions that simply do not interact with other nearby com-munities and have very limited access to large markets. Theprice of pork is much higher in these communities than inHa Noi and Ho Chi Minh City. Also, at present, many roadsystems were financed by foreign loans, which has increasedthe tax burden faced by many households. This situation
means that poor farmers are not able to afford communica-tion costs that increase day by day. Another constraint todistribution is police activities. According to the results ofstudies undertaken by IFPRI and the MARD as part of theDANIDA project in 2000, 20% to 30% of traders thoughtthat the police were the main obstruction they faced, and upto 70% of traders thought that the police obstructed theirtrade activity.
Limited information. Traders represent the main sourceof market information for poor-farmer households. Thegovernment’s role in providing market information is poorbecause of a disjointed communication network and its re-sponsibilities overlap among offices. Because of the extentof market divisions and differences in prices among regions,farmers cannot make informed production decisions thatwould maximize their income. Poor farmers do not knowthe destination of their products and therefore have littleinformation on the activities of the distribution agents theydeal with. The activities of many export programs are alsokept secret from producers. The shortage of informationmakes poor farmers unable to be active in their productiondecisions and they therefore become dependent on outputagents.
Development trends of crop-animal systems
Integrated crop-animal systems have been practiced by farm-ers in many areas across the country. In this paper, the mainareas identified are the Red River Delta and North Moun-tainous area. Each area has several differences in the form ofthe ICAS used.
Integrated crop-animal systems in North VietnamRed River Delta. Since the beginning of the disbanding ofstate cooperatives in 1988, households in the Red RiverDelta tended to diversify their products; however, they werestill mainly based on a small scale of production. In 1988-93, most of the households concentrated on intensive riceproduction to reach the target of food self-sufficiency. In1993, the Red River Delta was able to satisfy householdfood demand. Since then, farm production has continued todiversify and intensify the practice of ICAS based primarilyon dictates of the market.
Animal production has played a different role throughthe period as well as across geographic areas. Even at thebeginning of the reform (1988-93) toward greater emphasison household economics, subsistence agriculture expandedsuch that households also aimed at producing goods to trade.Quoc Tuan and Thai Tan communes showed that, from 1988to 1993, the number of households that produced purely forown consumption decreased in Thai Tan commune whilethere were none in Quoc Tuan commune. This meant thatthe process of producing goods for trade was strong in ruralareas even though no government action encouraged this.This was due to the ability of households to choose theireconomic activities to maximize their income.

80
Animal production systems during the self-sufficiencyperiod had the following characteristics:
• Animal production mainly took advantage of culti-vated crops. Livestock partially supplied the requiredfertilizer for plants, especially for rice and vegetables.
• Animal production combined with off-farm activitiessuch as producing soya curd or wine supplied feed foranimal raising. Moreover, these activities created alarge resource of capital to promote the developmentof animal breeding.
• Households that derived a significant income frompensions had sufficient capital to invest in animalbreeding.
• This type of breeding was combined with anotherhousehold-based activity such as “bonsai” growingor the cultivation of ornamental plants that are sold tosupplement income.
Several advantages and disadvantages were found.Households chose pig raising because problems entailed inmarketing pigs were minimal. Pig prices in the market weresomewhat stable and did not experience decreases. Like-wise, pig raising did not face much rigid competition. Therewere, however, some disadvantages. The biggest one wasthe capital-intensive nature of pig raising as well as theneed for technical skills that were very much lacking dur-ing that time because of the weak government extensionservice.
Crop-animal systems in the period of diversificationhad the following characteristics:
• Households diversified income by combining animalproduction and crop cultivation: diversification wasmainly toward maintenance of the rice crop but greatlysupplemented with pig production and vegetablegrowing such as onions or garlic. The goal was toproduce goods to participate in the market. Diversifi-cation of production activities continued as house-holds tried to find an appropriate activity on which toconcentrate and specialize.
• Households combined animal production with off-farm activities: focused efforts to stabilize commer-cial activity by steadily expanding animal produc-tion by increasing the number of animals regardlessof meat quality. This type of animal raising took ad-vantage of feed resources from off-farm activities (soyacurd and wine production) as practiced during theself-sufficiency period, and the opportunity to use in-dustrial feed and investments in good-quality pigbreeds.
• Households produced bonsai (and other ornamentalplants) while maintaining a diversified productionmixture of crops and animals: this type of productionaimed at protecting against market difficulties (suchas in 2000, when the price of bonsai went down). How-ever, bonsai have a long production cycle so it is dif-ficult to react to changes in the market.
• Some households planted bonsai or specialized inanimal raising to compensate for difficulties in thebonsai market. Many of them specialized in poultryraising.
• Some households that have been undertaking pig pro-duction started to target a more specialized market forhigh-quality meat. These households invested in ob-taining pigs from foreign breeds that yielded a higherpercentage of lean meat. In 1988, income from pigproduction accounted for nearly 40% of total income.In 2000, income from pig production accounted formore than 85% of total household income.
• Households that derived a significant portion of theirhousehold income from pensions: pig raising was themain production activity and rice continued on a muchsmaller scale because the income from pigs was betterthan that from rice.
The rice production of all types of households did notdecrease, but the relative proportion of rice in the total in-come did decrease.
Some advantages and disadvantages were found.
• Farmers received more scientific and technical knowl-edge and benefited from a more effective productionsystem from many national and international officesand organizations.
• From 1993 to 1997, the price of liveweight pork wasrelatively high while rice prices fell and animal feedprices were stable because of the stable supply ofmixed industrial feed and maize.
• Demand for meat increased.However, farmers still faced disadvantages such as
• A poor ability of poor farmers to be active in the mar-ket, which has led to a reduction in the competitive-ness of their products.
• A lack of market information provided to farmers byintermediary actors.
• A lack of capital, which has limited gains from econo-mies of scale.North mountainous area. For integrated crop-animalsystems,
• The Tay people diversify production to attain the self-sufficiency objective.
• Because the Kinh people do not have rice fields, theyenhance pig raising to produce lean meat. They alsoproduce other goods for trading, using capital accu-mulated and taking advantage of good relationshipswith lowlanders.
• Since 1998, these types of integrated crop-animal sys-tems have remained relatively unchanged. However,livestock decreased because of a decline in the pro-duction of animal feed (cassava and maize).
Several factors strengthened crop-animal integration:agroecological conditions, market demand and farmers’ability to approach the market, household income and thestructure of income, and the ethnic factor.

81
Samples of crop animal systems by agroecologicalareas in the Red River DeltaIn the Red River Delta, Nam Thanh District (Hai DuongProvince; after that, divided into two districts: Nam Sachand Thanh Ha) represents the delta area while Cho DonDistrict (Bac Kan Province) represents the mountainous area.
On the basis of its agroecological characteristics, NamThanh District is divided into four zones—lowland dikeedge, intensive area (winter crops), diversification area, andlitchi gardens. In this paper, only the two first zones arediscussed. The characteristics of these two agroecologicalzones are described in Table 12. These zones have potentialarea for winter crops that contribute the quantity necessaryfor livestock feed.
Intensive agriculture (winter-crop area). Quoc Tuan isone of the communes that is distinctly characterized as anintensive area because it lies near highway No. 183 to QuangNinh Province and its location is therefore convenient forcirculation and market access for winter crops. The winter-crop surface occupies a large area in the commune (65% ofthe whole cultivated area in 1993). Farmers’ capacity forintensive cultivation is well developed since the beginningof the cooperative period. Cultivated land is located insidefields as there is no dike edge land. The main crops are rice,onion, garlic, potato, sweet potato, maize, cucumber, etc.
The land-use coefficient is rather high at about 2.4 (Table13).
Rice, onion, and garlic provided, on average, about 7%to 10% of total household income. From 1988 to 2000, theincome structure of households in Quoc Tuan changed. Thecontribution from rice fell and the contribution from live-stock breeding increased, especially in pig breeding (Table14). In 2000, livestock breeding provided more than 32%of household income, in which the part from pigs was 20%.The location nearby the pig market is an important factorthat explained the growth in pig breeding in many house-holds in Quoc Tuan commune. In 2000, several householdsobtained income of about $1,200 from breeding pigs. Cowswere not developed because farmers had no alluvial land;thus, income from cows contributed only a small amount tototal income.
Lowland and dike edge area. Thai Tan commune (NamSach District, Hai Duong Province) is characterized by low-land and dike edge areas because it is located on an alluvialarea along the Thai Binh River, which is situated southwestof the commune. Thai Tan is located far from transportationinfrastructure so farmers have difficulty engaging in trade.The surface of cultivated land per capita is high because ofthe dike edge land (Table 15).
Table 12. Agroecological areas in Nam Thanh District.
AreaItem
Lowland, Intensivedike edge
Population density (people km–2) 973.6 1055.2Crop surface capita–1 (m2) 529.4 546.2Outside dike surface capita–1 (m2) 99.8 8.5Low rice-field surface capita–1 (m2) 25.1 12.5Number of cows ha–1 1.36 1.27Rate of commercial households (%) 0.9 1.8Winter crop surface capita–1 (1995-97) (m2) 269.1 330.5
Source: Dao The Anh et al (1997).
Table 13. Rice field surface and land use in Quoc Tuan communeby household economic class (1995).
Household classItem
Rich Middle Poor
Cultivated land surface (m2 capita–1) 544 605 598Rice field surface (m2 head–1) 972 1,220 1,181Winter-crop surface (m2 head–1) 346 227 227Land-use coefficient 2.4 2.4 2.4
Source: Dao The Anh et al (1997).
Table 14. Structure of average household income in Quoc Tuan commune from 1988 to 2000 (%).
YearSource of income
1988 1993 1997 2000
Rice 32.3 27.1 21.3 20.4Animal husbandry 19.6 17.2 32.6 32.3Pigs – – 28.9 20.2Poultry – – 3.7 11.8Cows – – – 0.3Off-farm activities 12.5 13.9 14.7 15.1Other income (retail, remittance, etc.) 35.6 41.8 31.4 32.2Total 100.0 100.0 100.0 100.0
Source: Dao The Anh (2003).

82
Although Thai Tan commune occupies a large surfacearea of the district, it has not yet exploited its maximumpotential as reflected by the low coefficient of land use. Thesurface of cultivated land inside the fields is actively wa-tered but cultivated land at dike edges is nonirrigated and isoften submerged from March to September so that onlyspring plants, vegetables, and beans are cultivated.
With a large surface of alluvial land, farmers here havedeveloped cow production. According to our householdsurveys in Thai Tan in 2000, the highest income gained byhouseholds reached $120 per capita (while in Quoc Tuan itwas only $26.70 per capita). Pig production represented20% of total income. In crop cultivation, rice was still themain crop. Income from rice in Thai Tan increased consid-erably during 1988-2000, from nearly $33 per capita in 1988to more than $60 per capita in 2000 (Dao The Anh 2003).But, the share of rice in total income decreased because ofthe diversification of household activities (Table 16).
Samples of specific crop-animal systems in the NorthMountainous areaDong Vien commune is located in the North Mountainousarea (northeast), in Cho Don District, Bac Kan Province.This commune is one of the richest because of its relativelysignificant rice cultivation and greater integration to mar-
kets and business centers of Cho Don and the provincialcapital of Bac Kan. The Tay people and the Kinh peopledominate the ethnic groups in Dong Vien commune. In thisagrarian system, rice is now a surplus commodity, withgreater production intensification in the rice fields of thevalley (Table 17).
The traditional livestock production system in the com-mune is closely connected with crop cultivation, but it hassome characteristics that are different from those of deltaareas. Pigs, buffaloes, cows, and poultry are the main live-stock, but they are bred on a small scale. In 1993, income
Table 15. Rice field surface and land use in Thai Tan commune in 1995 by household economic class.
Household classItem
Rich Middle Poor
Surface of cropped land inside field (m2 capita–1) 547 644 590Surface of cropped dike edge land (m2 capita–1) 205 360 238Surface of rice field (m2 capita–1) 1,044 1,094 1,181Surface of winter-crop plants inside field (m2 capita–1) 43 108 79Surface of winter-crop plants at dike edge (m2 capita–1) 205 360 238Total square of winter-crop plants (m2 capita–1) 248 468 317Coefficient of inside field use 1.99 1.87 2.13Coefficient of outside field use 2.14 1.71 1.80
Source: Dao The Anh et al (1997).
Table 16. Structure of average household income in Thai Tan commune from 1988 to 2000 (%)
YearSource of income
1988 1993 1997 2000
Rice 28.2 30.6 31.7 22.6Animal husbandry 39.3 32.0 26.0 33.1Pigs – – 18.9 19.9Poultry – – 7.1 11.0Cows – – 2.2Off-farm activities 12.2 11.6 5.6 9.0Other income (retail, remittance, etc.) 20.3 25.9 36.7 35.3Total 100.0 100.0 100.0 100.0
Source: Dao The Anh (2003).
Table 17. Main characteristics of Dong Vien commune, Cho DonDistrict, Bac Kan Province.
YearItem
1993 1998
Rice-field surface (ha) 134 155Hilly surface (ha) 456 17Forest surface (ha) 550 382Balance of rice production-consumption (t) –190 95Population density (people km–2) 106 107
Source: Dao The Anh (2001).
83
from animal production averaged 25% of total householdincome, with pig production accounting for 20%. Pig pro-duction was almost entirely dependent on cultivated cropssuch as cassava, maize, etc. This implies that livestock pro-duction could only be undertaken on a small scale. Animalproduction involved a long cycle and hence was not veryefficient. Only a small percentage of households now prac-tice highly intensive pig production.
Only the Kinh people go directly to the field to applyanimal and green manure to serve as fertilizer in rice fields.The other ethnic groups stock the manure in the village,close to where the irrigation water flows. They also use ani-mal manure to fertilize rice fields but, unlike the Kihnpeople, they do not take the manure to the fields and di-rectly spread it on the soil; they use the water flow fromirrigation to do the work. This is the traditional way of fer-tilizer application.
Ethnic groups have diversified production activities(Table 18). Crop cultivation is still practiced by a majority,especially among the H’mong. The Dao and the Kinh showthe greatest number of households engaged in livestockraising. Almost all households in the commune raise ani-mals, primarily pigs, to meet local demand, especially forspecial occasions related to religious ceremonies or festi-vals.
Table 19 compares production systems between theKinh and Tay groups and shows how these systems havechanged over time. Several factors influenced the changes,such as the deterioration of the landscape, lack of capital,and lack of market prospects for commodities. The slash-and-burn practice strongly decreased the cultivation ofrainfed rice, cassava, and maize as land degradation intensi-fied from 1992 to 1998. Areas for maize and cassava de-creased substantially or were wiped out, while rice cultiva-tion shifted from the rainfed system to irrigated system. Thiswas the general trend observed among the Tay groups, whoare primarily engaged in rice production, especially house-holds that have cultivated smaller areas of rice. Among thevery big Tay rice cultivators, however, the trend was a de-crease in rice cultivation as households became engaged inother activities, particularly those outside the farm.
Animal production became more significant among theethnic groups with the increase in animal holdings, espe-cially cows. Cattle production was more favorable for the
Tays, who had access to remaining sloping areas that werestill good for grazing. Likewise, the market for cattle wasbecoming better with the cattle meat price rising. Cattle, aswell as buffalo, are means for this group to accumulate capi-tal. Pig raising decreased, however, because of the lack offeed. The decrease in production of maize and cassava af-fected pig feed. Rice was also used as feed but its use as astaple food rather than as feed became especially intense,especially with the decrease in rainfed areas that used to becultivated to these crops.
The Kihn people are generally nonrice cultivators. Theyget rice as a share for rendering labor in rice cultivation.They are pig raisers but this activity was also affected by thescarcity of maize, cassava, and rice as feed. They were moreheavily engaged in nonfarm activities, especially in 1998,because of the existence of a closer family relationship withthe people in the Red River Delta.
Apricot plantations declined for all ethnic groups be-cause of the low commodity price caused by poor marketaccess. Other activities related to the forest emerged, how-ever, especially with the implementation of plantationprojects in these areas.
Determinants of crop-animal typologyfor livelihood strategiesHousehold livelihood strategies in this region consist ofone or more crop cultivation or livestock production sys-tems, sometimes combined with nonfarm income. House-hold activities can be classified into categories defined by acombination of crop cultivation and animal production. Forinstance, when a household grows rice in the lowlands, growsmaize and apricots on the slopes, and raises pigs for sellingand buffaloes for land preparation, three interrelated pro-duction systems can be identified: (1) a rice production sys-tem comprising rice cultivation and buffalo raising, (2) apig production system including maize cultivation for feed,and (3) an apricot tree cultivation system.
The rice-based production systems are
• Animal-rice system, including buffalo raising for draftpower.
• Mechanized rice cultivation, using own machines,which could also be rented out to other households.
• Manual rice cultivation, with mutual aid amonghouseholds in the same village.
Table 18. Diversification of production systems among the ethnic groups (%).
SystemEthnic group
Cultivation Livestock Nonfarm activities Forestry product
Tay 50.6 19.5 28.4 1.5Dao 65.5 26.7 6.2 1.6Kinh 45.7 29.3 16.7 8.3H’mong 80.4 18.7 0.4 0.5
Source: Duong Duc Vinh (2001).

84
Tabl
e 19
. Ty
polo
gy o
f pr
oduc
tion
sys
tem
s in
Don
g Vi
en c
omm
une
in 1
992
and
1998
.
Item
Type
of
hous
ehol
d
12
34
56
7
Perc
enta
ge7
88
3611
237
Ethn
ic g
roup
Kin
hK
inh
Tay
Tay
Tay
Tay
Tay
1992
Prod
uctio
n sy
stem
in
19
92
No
padd
y fie
ld,
No
padd
y fie
ld,
No
irri
gate
d pa
ddy
Sm
all
irri
gate
dIn
tens
ive
padd
yB
ig p
addy
fie
ld,
Very
big
sell
labo
r in
pad
dypi
g bu
sine
ss,
nonf
arm
fiel
d,cu
ltiv
ated
pad
dy
culti
vatio
n, s
elf-
lives
tock
pad
dy
fiel
ds
activ
ities
dev
elop
ed
2 se
ason
s of
ric
e f
ield
suff
icie
ncy
in r
ice
deve
lope
dfi
eld
Padd
y pr
oduc
ed c
apita
–1 (
kg)
37.5
0.0
156.
122
4.3
399.
145
7.2
758.
1Pi
gs (
aver
age
kg p
er h
ouse
hold
)90
.656
9.0
94.0
150.
819
2.9
231.
212
5.8
Cat
tle (
aver
age
no.
of h
ead
per
hous
ehol
d)0
.00
.01
.41
.43
.22
.41
.5Fr
uits
(VN
D 1
,000
cap
ita–
1 )a
69.6
420.
075
.848
.015
4.0
168.
924
8.7
Non
farm
act
iviti
es (
VND
1,0
00
cap
ita–
1)
277.
072
2.3
153.
525
2.4
231.
823
8.6
297.
0
1998
Prod
uctio
n sy
stem
in
19
98
No
padd
y fie
ld,
No
padd
y fie
ld,
Irri
gate
d pa
ddy
field
,Ir
riga
ted
padd
yIn
tens
ive
padd
yB
ig p
addy
fie
ld,
Padd
y fi
eld
sell
labo
r, o
ther
fore
st,
pig
busi
ness
culti
vate
d 2
field
inc
reas
ing,
cult
ivat
ion,
catt
le i
ncre
ased
,de
crea
sing
,ac
tivi
ties
dev
elop
ed
decr
ease
d, n
onfa
rmse
ason
s of
ric
e,fo
rest
self
-suf
ficie
ncy
pigs
dec
reas
edca
ttle
acti
viti
es d
evel
oped
othe
r ac
tiviti
es i
n ric
e, f
ores
tin
crea
sed
Padd
y pr
oduc
ed c
apita
–1 (
kg)
33.3
0.0
173.
335
3.2
366.
462
2.1
471.
3Pi
gs (
aver
age
kg p
er h
ouse
hold
)80
.025
0.0
60.0
82.2
100.
084
.265
.0C
attle
(av
erag
e no
. of
hea
d pe
r ho
useh
old)
00
3.7
4.3
3.0
5.8
3.0
Frui
ts (
VND
1,0
00 c
apita
–1 )
100.
075
.050
.02.
130
.677
.310
.0Pl
anta
tion
proj
ect
(VN
D 1
,00
0 c
apita
–1)
177.
80.
050
.011
1.2
130.
011
4.1
175.
0Fo
rest
(VN
D 1
,00
0 c
apita
–1)
46.7
30.0
7.1
11.8
11.9
5.3
22.1
Non
farm
act
iviti
es (
VND
1,0
00
cap
ita–
1)
266.
714
33.5
362.
360
9.3
457.
658
489
0
a US$
1 =
VND
15,
000.
Sou
rce:
Dao
The
Anh
(200
1).
85
On the hillsides, the following systems are found:
• Maize cultivation primarily for sales.
• Maize cultivation for pig farming combined with thepurchase of supplementary feed.
• Apricot tree cultivation, intercropped with maize fortwo to three years.
• Manglieta timber plantation, subsidized by the WorldFood Program.
Factors influencing the specific crop-animal systemadopted. Farmers decide about the amount of land and la-bor devoted to each system based on their access to meansof production, the relative profitability of production sys-tems, and the timing of competing peaks of labor require-ments.
Table 20 shows the advantages and constraints of typi-cal production systems that are available to farmers.
Profitability of production systems. The relative prof-itability, capital needs, and labor requirements of the differ-ent production systems in the commune appear in Table 21.Rice, the staple food of most families, continues to be ofstrategic importance, with relatively stable yield, althoughgenerating only an average income of $1.33 per workingday. The maize-pig system offers high profits without ini-tial investment because the maize is on sloping land. Thissystem is used by farmers having smaller rice fields. Pigfarming is most commonly practiced by households thatlack paddy areas but nevertheless have access to capital.
Timing of peak labor requirements. There are two peakperiods for labor demand: from March to April and from
June to July. At the time of planting a given crop and thenduring each peak period, the most important factor in thedecision made by farmers is marginal income per workingday (Table 22). In March to April, rice production is thehighest priority, both because it is profitable and because itensures household food security. Maize and apricots are thesecond priority. Rice and maize are rarely produced by thesame household on large areas because their demand forlabor would occur in the same period.
In June and July, labor is divided between maize andrice cultivation. If time is insufficient, families do not planta second maize cycle. For households with small rice-fieldareas, the high profitability of the maize-pig system makesit a common choice.
Quoc Tuan, Thai Tan, and Dong Vien are three com-munes with different agroecological conditions but all haveintegrated crop-animal systems in which rice plays an im-portant role in producing income and supplying feed forlivestock breeding, especially pig breeding.
The agroecological conditions have influenced thestructure of livestock production as well as methods of pro-duction, especially in taking advantage of natural resourcesappropriate for grazing cows and buffaloes.
Developing technology to support growthof the livestock industryVietnamese traditional livestock breeds often have low pro-ductivity in breeding and at slaughter. According toMolenat and Tran The Thong (1991), the most popularbreeds were Mong Cai, Muong Khuong, Lang Hong, Meo,
Table 20. Factors explaining the production combinations observed in Cho Don District.
Production system Advantages Constraints
Rice + buffalo Food security Limited by the availableBuffalo care maximizes labor paddy-field area use (employing both children and elderly people)
Rice + hand tractor Food security Large areas required to ensureGood return on investment investment profitability
Rice (hired labor) Eases pressure on family labor Low return on labor during labor peaks Food security less assured
Maize for sale No investment required Very low profitabilityMinimal available area and low return per unit of land
Maize + pigs Return on labor comparable Labor competition, especially during to rice fields harvesting periods
Maize + pigs with additional feed Substantial return on labor Significant initial investmentRegular work throughout year Labor competition, especially during
harvesting season
Apricots Potential good profit Unstable income
Source: Dang Dinh Quang (2002).

86
and some crossbred races such as Ba Xuyen, Thuoc Nhieu,Ba Tri, Nghia Binh’s white pig, etc. However, only MongCai have been popular in the northern and central regionsup to now. In fact, in the southern region, the Ba Xuyen andThuoc Nhieu are also crossbred between domestic and im-ported breeds developed from the end of the 19th century tothe beginning of the 20th century. In addition, many localpig breeds have not yet been thoroughly investigated toidentify their genetic characteristics. In general, informa-tion on types of breeds and geographic dispersion is verylimited. In the delta regions, sows of domestic breeds areusually raised with foreign boars to produce piglets for thesupply of meat. According to our research in Hai DuongProvince, 100% of the pigs for meat supply were crossbredpigs, and up to 50–60% of the sows were of Mong Cai Ibreeds. However, this proportion has been decreasing gradu-ally and is around only 20–30%. According to VASI re-search results in the framework of the Red River program,the proportion of crossbred pigs was around 30–45% inmountain region communes of Bac Can Province, and theremainder were local pig breeds. In the North Midland re-gions, the proportion of Mong Cai pigs was around 63%. Inthe Central region, the proportion of domestic pigs is stillhigher than in the Red River Delta, but, in the southernregion, few pure domestic breed pigs are raised.
Mong Cai I pigs have relatively large litter sizes ofaround 12 piglets. However, the number of piglets variesaccording to the number of farrows. In particular, some sowscan produce 16 piglets per farrow for up to 14 years. Whenlitter sizes are large, the quality and quantity of meat fromthe Mong Cai I sow is poor. It takes around 7 to 8 months toraise these pigs to a weight of about 40 kg. Compared withforeign breeds, the domestic ones have lower carcass qual-ity.
Changes in feed composition. Table 23 shows that thecomposition of pig feed changed substantially from 1993to 1997. There was a trend of increasing rice and decreasingrice bran in the diet composition. Maize was used only in asmall amount in 1993 but was always used by householdslocated at dike edges, where it was cultivated in large quan-tities. From 1993 to 1997, the maize component increasedconsiderably and became the main component of the feedformula. Feed from winter plants such as sweet potato orpotato was often used by households that cultivated thesewinter crops.
However, most farmers have still used rice products asthe main component of pig feed up to now. In 1998-2000 insome provinces in the Red River Delta, rice was used forfeed (Table 24).
Table 21. Relative profits and requirements of production systems.
Profits (VND 000)a Capital needs (VND 000) Labor requirementsProductionsystem Per working Per 1,000 m2 Rotated capital Initial Maximum area Peak
day cultivated per 1,000 m2 investment per laborercultivated (e.g., required per (m2) (larger
inputs, hired 1,000 m2 areas indicatelabor) lower labor
requirement)
Rice + buffalo 20 1,700 250 1,500 1,200 March and June-JulyRice + hand tractor 21 2,100 250 1,000 1,200Rice + hired labor 15 1,300 600 7,000 2,000Maize for sale 13 120 – – 2,500 JulyMaize for pigs 19 2,300 120 – 1,500Maize for pigs with 23 1,140 450 – 2,000 additional feedApricots 150 900 – – 6,000 March-April
aUS$1 = VND 15,000.Source: Dang Dinh Quang and Castella (2002).
Table 22. Income (in VND) of a working day during labor peaks.a
Period ApricotsRice double- Maize + labor- Maize + capital- Maize
cropping intensive pig farming intensive pig farming for sale
March-April 150,000 120,000 88,000 90,000 78,000June-July – 74,000 135,000 60,000 47,000
aThe income of a working day is equal to the ratio of the income per ha to the working time per ha during the peak labor period.Source: Dang Dinh Quang and Castella (2002).

87
Changes in pig breeds. The average number of pigs perhousehold in 1988 was only 3.7 per year; in 1998, this num-ber increased to 6.8.
Before 1962, pig breeds in Nam Thanh District wereonly two: Mong Cai and fat pigs. Since 1962, artificial in-semination methods began to develop in Nam Thanh, es-tablishing a movement of breeding of Mong Cai pigs. Ge-netically, pigs in Nam Thanh were crossbred with otherbreeds such as Mong Cai, Y, Dai Bach (large and white pig),and Landrace. Farmers tended to change from breeds with alow percentage of lean meat to ones with a high percentage(change from Mong Cai Yorkshire to Mong Cai Lan-drace).
Changes in the production structure. Farmers need tohave better knowledge about livestock production as wellas market characteristics when they expand the number ofpigs from around 30 to 100 per year. To minimize risk, farm-ers have changed from single production to group produc-tion (high-quality production group) with support from theRed River program. By organizing meeting groups, farmershave the opportunity to exchange technical information,increase product quality, reduce production costs (by jointlypurchasing animal feed), and be able to approach the mar-ket better.
In mountainous provinces such as Cho Don District,the structure of pig breeds has changed from breeding localpigs to crossbred pigs. Crossbred pigs have occupied a high
rate in areas that have much contact with large markets andtechnical research organizations. For communes that wereat more remote locations, local pigs were much more com-mon. However, across the whole district, local pigs still oc-cupied a high percentage of the total (77% in 1997).
During recent years, feed for animal production im-proved somewhat, but it is still mainly based on food cropssuch as maize or cassava. Supplement feeds are used only toa small degree in these areas.
Farmer organizations have been established with thesupport of some projects or programs but they involve onlytechnical exchanges, rather than other activities such as jointmarketing or combined veterinary support as in delta areas.
Conclusions
The integrated crop-animal system (ICAS) in northern Viet-nam, represented here by the Red River Delta and the NorthMountainous areas, is a popular system with a long-stand-ing development process. It can be considered as a habit ofthe agricultural production of Vietnamese farmers.
This system has many different characteristics, depend-ing on factors such as agroecological area, population dy-namics, market evolution, farming household conditions,institutional support, etc. However, the system is mainlythe integration between rice cultivation and pig produc-tion.
Table 23. Changes in the composition of pig feed in Cong Hoacommune from 1993 to 1997 (%).
YearType of food
1993 1997
Rice bran 49.2 24.6Rice 14.7 21.5Maize 8.3 33.8Solid food 0.0 5.4Other by-products 27.8 14.7
Source: Pham Van Duy et al (1998).
Table 24. Rice use by farming households.
Province
Item Ha Tay Nam Dinh
Phu Xuyen Hoai Duc Vu Ban Hai HauDistrict District District District
Proportion of paddy production sold (%) 42 33 33 33Proportion of paddy production for human self-consumption (%) 33 53 38 25Proportion of paddy production for animal feed (%) 25 14 29 42
Source: Jésus et al (2002).
88
The system has evolved over time:
• Continued integration of crop-animal production bydiversifying to a small scale to take advantage of foodcomplementation.
• Integrating crop-animal production on a larger scaleand applying more intensive techniques to promoteproduction efficiency of livestock and market inte-gration.
• Strengthening the specialization of cultivation, withlivestock breeding playing only a supplemental role.Contrary to this trend, farmers in some areas special-ize in breeding (pigs), with little cultivation. Thesetrends rely on collective action among farmers to cre-ate economies of scale. Household specialization inlivestock or crops needs a diversification betweencrops and animals at the regional level to avoid mar-ket risk.
However, the integration of crop-animal production ina small-scale household is most common in North Vietnam.This system will play a role in income diversification forpoor and middle-class people in the near future. Rich house-holds will specialize in different ways as with high added-value crops or pigs to intensify. The manure market in theRed River Delta is being built up because of this specializa-tion tendency. In the North Mountainous area, the produc-tion system of diversification will be developed with a strongcontribution of ICAS in the near future.
The evolution of ICAS has been mostly driven by farm-ers themselves, without influence by the state. This evolu-tion was clearly a reflection of supply and demand forcedby the market and its competitive nature. Especially, out-put markets are an important factor in the development pro-cess of ICAS. Food crop prices are decreasing for all cropsand diversification has some difficulties. In this context,animal products have a good price, but only for ones ofhigher quality. Thus, techniques applied in breeding weredifferent among areas to meet market demand. In the delta,livestock need to be more specialized to improve their qual-ity. But, generally, because of small-scale production, ICASwill still play a major role in sustaining household income.
Policies for promoting this integrated system are thesame as for agricultural diversification. Actually, these poli-cies lack a support role for households. Policies could pro-mote changes in land-use regulations, market liberalization,or the allocation of land-use certificates. Public investmentscould include road construction, electrification, or the pro-vision of other infrastructure. Institutional innovations couldinclude the development of cooperatives or farmer associa-tions, contract farming, improved market information, qual-ity control, or origin identity for agricultural products. In-come diversification that is sustainable in the long term anddoes not depend on government subsidies for inputs, ormarketing costs, is promising for Vietnamese households.
References
ASD-VASI (Agrarian Systems Department-VASI). 2001. Sur-vey on eco-pathology of pig livestock in Nam Sach Dictrict,Hai Duong Province.
Dao The Anh, Jesus F. 1997. L’agriculture du delta du FleuveRouge face aux réformes économiques. Cahiers Agricul-ture. Sept-Oct 1997. p 67-73.
Dao The Anh, Du Van Chau, Le Hoai Thanh. 1997. Approchemicro-économique de la différenciation des exploitationsagricoles dans le delta du Fleuve Rouge au Nord Vietnam.Cahiers Agriculture. Sept-Oct 1997. p 27-34.
Dao The Anh, Jesus F. 1998. Les réformes au Vietnam depuis1979 et leurs effets sur les ménages agricoles. ECOPOL-CIRAD. CIRAD Working Document no. 28.
Dao The Anh. 2001. Transition of household economics at ChoDon area. In: Research and development agriculture at moun-tainous area, summary record of the conference of five yearsof activities (1995-99) in Cho Don District, Bac Kan Prov-ince. Red River Program, Agricultural Publishing House.135 p.
Dao The Anh. 2003. Les réformes socio-économiques etl’adaptation par le choix d’activité des ménages ruraux dansle delta du Fleuve Rouge. Thèse de doctorat. Economieagricole, du développement rural et agro-alimentaire, Ecolenational supérieur d’ agriculture de Montpellier (ENSAM).400 p.
Dang Dinh Quang, Castella J.-C. 2002. Doi Moi in the mountains:land use changes and farmers’ livelihood strategies in BacKan Province, Vietnam. Hanoi (Vietnam): Agricultural Pub-lishing House. 281 p.
Duong Duc Vinh. 2001. Principal characteristics of productionsystems in Cho Don District and Red River program activi-ties. In: Research and development agriculture at mountain-ous area, summary record of the conference of five years ofactivities (1995-99) in Cho Don District, Bac Kan Province.Red River Program, Agricultural Publishing House. 135 p.
GSO. 2000. Statistical yearbook. Hanoi (Vietnam): General Sta-tistical Office.
GSO. 2001. Statistical yearbook. Hanoi (Vietnam): General Sta-tistical Office.
Hoang Vu Quang. 1996. The forms of peasant credit at Thanh Xacommune, Nam Thanh, Hai Hung. VASI Working Docu-ment. 80 p.
IFPRI–MARD. 1999-2001. Policy options for livestock in orderto promote agricultural diversification in Vietnam. Hanoi.
MARD. 2000. Department of Agriculture forestry extension data.Molenat M, Tran The Thong. 1991. Genetic and pig livestock in
Vietnam. IEMVT Working Document. CIRAD, Montpellier.107 p.
Moustier P, Dao The Anh, Figuié M. 2003. Food market andagricultural development in Vietnam 2003. MALICA(CIRAD-IOS-RIFAV-VASI). 108 p.
Pham Van Duy, Nguyen Xuan Hoan, Vu Trong Binh. 1998. Re-sults of alimentation supply and its impact on family live-stock. VASI Working Document. 49 p.
89
Vu Trong Binh, Casabianca F. 1996. La commercialisation de laviande porcine dans le district de Nam Thanh: actes duséminaire: “Agriculture familiale et gestion des ressourcesnaturelles dans le bassin du Fleuve Rouge,” Hanoi, 9-12April 1996. p 81-91.
Vu Trong Binh. 2002. La qualité des porcs dans le Nord du Viet-nam (Delta du Fleuve Rouge) entre organisation desproducteurs et évolution des systèmes de production. INA-PG. Paris, INA-PG. 300 p.
Notes
Authors’ address: Agrarian Systems Department (ASD), Viet-nam Agricultural Sciences Institute (VASI).
90
Indonesia is an agriculture-based country with rice as theprimary source of carbohydrate for the major portion of thepopulation. Rice farming has thus become the predominantway of living, especially for those who live in suburbanvillages. Livestock, primarily cattle, and buffaloes are im-portant components of the farming household because oftheir important role in providing draft power for land prepa-ration and other farm activities. The Green Revolution tech-nology that made possible the more intensive cultivationof land through the use of modern rice varieties, fertilizer,and irrigation brought about changes in agricultural prac-tices that affected both the rice and livestock productionsystems. As farmers continued to practice rice monocultureto increase production and adopted three cropping seasons,1
the use of mechanical power became more and more practi-cal to facilitate land preparation. Less attention was givento livestock raising, particularly to cattle and buffaloes,which therefore resulted in a decline in their population.This trend is apparent in the northern areas of Java Island,specifically in West Java. The growing popularity of ma-chinery for farm use was not the only reason for the declinein draft animal resources. Even farmers that continued tradi-tional agricultural systems in which animal traction for landpreparation was employed were gradually shifting to me-chanical traction because of the difficulty in keeping ani-mals with the increasing contraction of area for grazing andfor forage production.
Over the last five years, however, growth in rice pro-ductivity was observed to be leveling off. Agricultural ex-perts believe that the diminishing trend was due to the dete-rioration in soil quality because of organic matter contentdepletion with the intensive application of inorganic fertil-izers for a long period of time. They also believe that the useof animal manure could help enrich the soil again and im-prove its fertility. Concerns about environmental degrada-tion and its effect on production provide a strong basis forbringing livestock back as a major component in rice areas.
A review of integrated crop-livestock (animal)systems in IndonesiaSri Nastiti Jarmani, Arti Djatiharti, and Budi Haryanto
Crop-animal integration is thus once again being consid-ered not only as a means of promoting more sustainableproduction growth but also as a means of improving foodsecurity and farmer welfare. As such, the concept of crop-animal systems has now expanded to include both cattleand buffaloes and other animals such as chickens, ducks,pigs, sheep, and goats. In Indonesia, the raising of ducksand native chickens is a common sight among farm house-holds, even though at a small scale. Small ruminants, suchas sheep and goats, are almost always present in Indonesianvillages.
This monograph has two objectives: (1) to describe thedevelopment of crop-animal systems in Indonesia and (2)to assess existing models of crop-animal (livestock) sys-tems in rice and rice-based production areas with the aim ofidentifying components that would improve farmers’ wel-fare and promote sustainable increases in rice production.
The rice and livestock sectors
Profile of the rice economyThe rice sector in Indonesia remains the backbone of mostrural economies. Approximately 15 million farm families inIndonesia are cultivating more than 10 million ha of har-vested rice area. About 50% of the total rice area and about60% of the farm families are situated on the island of Java.Each farm household owns around 0.3 ha of land, on which4 to 5 family members depend for subsistence. The averagerice yield of 4 to 5 t ha–1 translates into an average incomefrom rice that ranges from 1 to 3 million rupiah (US$125–375 ha–1 or a monthly income of $25–75). On a per familybasis, production is much less because of the small land-holdings. Hence, rice is basically for home consumption.Only 30% of local production enters the market, whereas70% is retained by farm households. Out of the 30% mar-keted, a major part (80%) is traded through private chan-nels, whereas only 20% or less is traded through govern-
1Three cropping seasons are very common in Indonesia, particularly in Java. The first cropping season is cultivated to rice and usually starts during the wet season in October.This is followed by another rice crop that starts immediately after the first rice crop harvest around January. The third cropping season is the dry-season crop, which beginsin June and is planted to maize or to other horticultural crops.

91
ment channels (Arifin et al 2002). This situation has notbeen beneficial to farmers as they remain at the mercy ofunscrupulous traders.
Data from the Social Accounting Matrix (CBS 2001)indicated that the lowest income per capita was that fromagricultural employee households, followed by agriculturalhouseholds with landholdings of less than 0.5 ha. The ma-jority of rice farm households fall under the second cat-egory. Moreover, rural households in the wetland ecosys-tem that primarily derive their main source of income fromrice are the poorest vis-à-vis those in the dryland and coastalareas as indicated by the study of Adnyana et al (2000).Thus, the continued support of the government is essentialto further develop the rice sector because of the role it playsin promoting food security and in improving the well-be-ing of the rural economy, which is dominated by poor ricefarm households.
Rice production and demand trendsThe national government has always deemed the achieve-ment of rice self-sufficiency to be of strategic importance,hence, its all-out support to increase production. From 1970to 1984, rice production (in milled form) increased from11.8 million to 23.7 million t, at an average annual growthof 5.23% (Sudaryanto et al 2002). This growth was morethan the average growth in population during that sameperiod, which was 2.22% per annum. This enabled the coun-try to achieve rice self-sufficiency.
Average yield growth declined drastically in the 1980sto about 2.4% per year, with a negative growth rate of–0.13% per annum in the 1990s. Yield growth in the 1980sand 1990s thus averaged only about 1.18% per year, whichwas much lower than the population growth rate, which wasstill estimated at 1.75% per year. The slight increase in rice-harvest area was not enough to compensate for the reduc-tion in yield growth. The average growth rate in production
during the 1990s was estimated at only 1.28%, which wasalso below the population growth rate estimate. These de-clining growth rates in yield and production may constitutea partial response to the diminishing demand for the staplefood with economic progress and to farmers losing interestin rice production because of inadequate returns. The de-cline in yield growth rate may result from several causes,such as a lessening of input application as farmers respondto falling rice prices in the world market, the maintenanceof input use as farmers have already optimized their inputapplications, or because yield gaps across provinces are pro-gressively being closed.
Table 1 shows rice production statistics for 1990-2001.Total domestic rice production reached 50.46 million t in2001. As can be noted, this has come more from expansionof the irrigated area than from yield improvement. Yieldlevels have remained almost constant and currently aver-age around 4.5 t ha–1. Recent results of the application ofintegrated crop management in several provinces indicatedan increase in rice yield of 10–20% compared with thatobtained with farmers’ traditional practices, even thoughthe costs of inputs were higher. The increase in rice yieldresulted in an increase in net income of around $125 perhectare per season (Nur et al 2003, Sembiring et al 2003).On a per family basis, however, this is much less because theaverage area cultivated is less than 1 ha.
Despite the increases in production, substantial importsof rice were still needed to meet domestic demand, whichgrew at about 3.07% per year from 1981 to 1991. Officialrecords show that imports as high as 6 million t were re-ported in 1998 (Table 2; Sudaryanto et al 2002). The con-tinued strong growth in demand came from the use of riceother than as a direct food. Rice demand for direct foodconsumption was reported to have increased at only 0.21%annually (Sudaryanto et al 2002). This is due to the declinein per capita consumption that follows from sustained eco-
Table 1. Harvested area and production of rice in 1990-2001.
Rainfed rice Irrigated riceYear
Harvested area Production Average production Harvested area Production Average production(000 ha) (000 t) (t ha–1) (000 ha) (000 t) (t ha–1)
1990 1,125 2,353 2.09 9,377 42,825 4.57 1991 1,113 2,357 2.12 9,168 42,331 4.621992 1,304 2,826 2.17 9,799 45,414 4.631993 1,206 2,622 2.17 9,807 45,559 4.65 1994 1,240 2,682 2.16 9,494 43,959 4.63 1995 1,358 2,938 2.17 10,081 46,806 4.64 1996 1,318 2,913 2.21 10,251 48,488 4.70 1997 1,259 2,785 2.21 9,882 46,592 4.711998 1,255 2,754 2.20 10,476 46,483 4.441999 1,169 2,665 2.28 10,794 48,201 4.472000 1,176 2,692 2.30 10,618 49,207 4.632001 1,081 2,565 2.37 10,419 47,896 4.60
Source: CBS (2000, 2001).
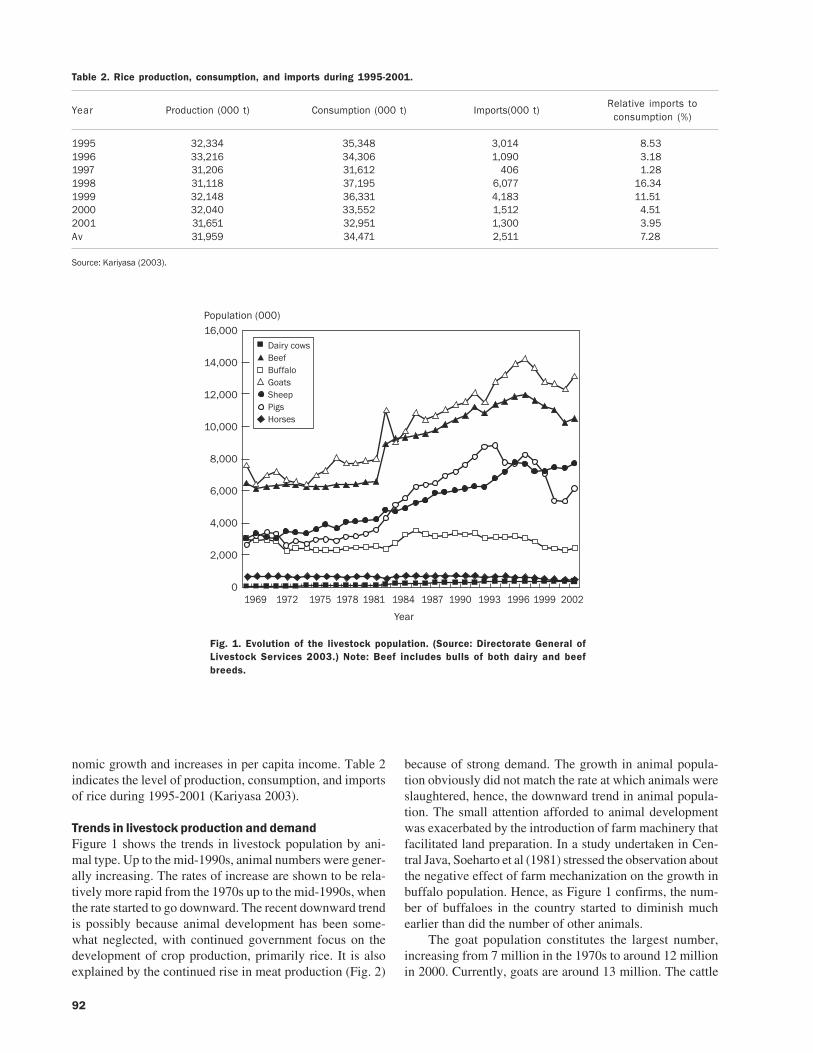
92
nomic growth and increases in per capita income. Table 2indicates the level of production, consumption, and importsof rice during 1995-2001 (Kariyasa 2003).
Trends in livestock production and demandFigure 1 shows the trends in livestock population by ani-mal type. Up to the mid-1990s, animal numbers were gener-ally increasing. The rates of increase are shown to be rela-tively more rapid from the 1970s up to the mid-1990s, whenthe rate started to go downward. The recent downward trendis possibly because animal development has been some-what neglected, with continued government focus on thedevelopment of crop production, primarily rice. It is alsoexplained by the continued rise in meat production (Fig. 2)
because of strong demand. The growth in animal popula-tion obviously did not match the rate at which animals wereslaughtered, hence, the downward trend in animal popula-tion. The small attention afforded to animal developmentwas exacerbated by the introduction of farm machinery thatfacilitated land preparation. In a study undertaken in Cen-tral Java, Soeharto et al (1981) stressed the observation aboutthe negative effect of farm mechanization on the growth inbuffalo population. Hence, as Figure 1 confirms, the num-ber of buffaloes in the country started to diminish muchearlier than did the number of other animals.
The goat population constitutes the largest number,increasing from 7 million in the 1970s to around 12 millionin 2000. Currently, goats are around 13 million. The cattle
Fig. 1. Evolution of the livestock population. (Source: Directorate General ofLivestock Services 2003.) Note: Beef includes bulls of both dairy and beefbreeds.
Table 2. Rice production, consumption, and imports during 1995-2001.
Year Production (000 t) Consumption (000 t) Imports(000 t)Relative imports to
consumption (%)
1995 32,334 35,348 3,014 8.531996 33,216 34,306 1,090 3.181997 31,206 31,612 406 1.281998 31,118 37,195 6,077 16.341999 32,148 36,331 4,183 11.512000 32,040 33,552 1,512 4.512001 31,651 32,951 1,300 3.95Av 31,959 34,471 2,511 7.28
Source: Kariyasa (2003).
7�#(�1�-����,��,,$�"� ����.?���B�#���
��0���
��0���
��0���
��0���
�0���
�0���
�0���
�0���
����� ���� ���� ���� ���� ���� ���� ���� ���� ���� ���� ����
>�#
?�.�$ ����4���5
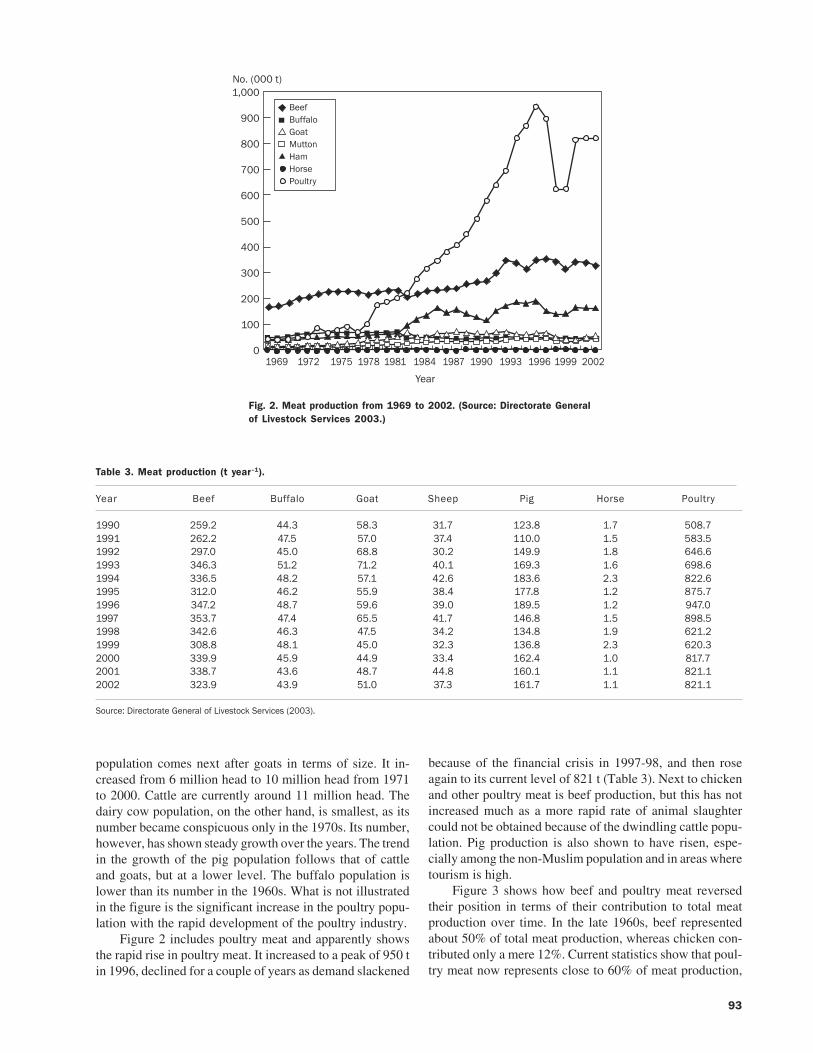
93
population comes next after goats in terms of size. It in-creased from 6 million head to 10 million head from 1971to 2000. Cattle are currently around 11 million head. Thedairy cow population, on the other hand, is smallest, as itsnumber became conspicuous only in the 1970s. Its number,however, has shown steady growth over the years. The trendin the growth of the pig population follows that of cattleand goats, but at a lower level. The buffalo population islower than its number in the 1960s. What is not illustratedin the figure is the significant increase in the poultry popu-lation with the rapid development of the poultry industry.
Figure 2 includes poultry meat and apparently showsthe rapid rise in poultry meat. It increased to a peak of 950 tin 1996, declined for a couple of years as demand slackened
because of the financial crisis in 1997-98, and then roseagain to its current level of 821 t (Table 3). Next to chickenand other poultry meat is beef production, but this has notincreased much as a more rapid rate of animal slaughtercould not be obtained because of the dwindling cattle popu-lation. Pig production is also shown to have risen, espe-cially among the non-Muslim population and in areas wheretourism is high.
Figure 3 shows how beef and poultry meat reversedtheir position in terms of their contribution to total meatproduction over time. In the late 1960s, beef representedabout 50% of total meat production, whereas chicken con-tributed only a mere 12%. Current statistics show that poul-try meat now represents close to 60% of meat production,
���,��,,$�"� *� ��B)B�#��?��$ #(
�0���
���
���
���
���
���
���
���
���
���
����� ���� ���� ���� ���� ���� ���� ���� ���� ���� ���� ����
>�#
��6�4���� 5
Fig. 2. Meat production from 1969 to 2002. (Source: Directorate Generalof Livestock Services 2003.)
Table 3. Meat production (t year–1).
Year Beef Buffalo Goat Sheep Pig Horse Poultry
1990 259.2 44.3 58.3 31.7 123.8 1.7 508.71991 262.2 47.5 57.0 37.4 110.0 1.5 583.51992 297.0 45.0 68.8 30.2 149.9 1.8 646.61993 346.3 51.2 71.2 40.1 169.3 1.6 698.61994 336.5 48.2 57.1 42.6 183.6 2.3 822.61995 312.0 46.2 55.9 38.4 177.8 1.2 875.71996 347.2 48.7 59.6 39.0 189.5 1.2 947.01997 353.7 47.4 65.5 41.7 146.8 1.5 898.51998 342.6 46.3 47.5 34.2 134.8 1.9 621.21999 308.8 48.1 45.0 32.3 136.8 2.3 620.32000 339.9 45.9 44.9 33.4 162.4 1.0 817.72001 338.7 43.6 48.7 44.8 160.1 1.1 821.12002 323.9 43.9 51.0 37.3 161.7 1.1 821.1
Source: Directorate General of Livestock Services (2003).

94
whereas the contribution of beef is down to about 20%.Production of the other kinds of meat has also risen, also ata gradual rate for exactly the same reason as in beef produc-tion.
Meat consumption per capita rose quite significantlyfrom 1981 to 1997 (Fig. 4), primarily because of the rapidexpansion of demand for poultry meat. Red meat consump-tion also increased but not as rapidly as did chicken andother poultry meat. The rise in poultry demand was fully
met domestically with the rapid development of the poultryindustry. In the case of red meat, however, increased de-mand was partially met by meat imports from other coun-tries as the domestic stock of animals was limited. In thecase of cattle, for example, the continued rise in demand forbeef affected the cattle population as productive cows wereslaughtered, making it rather difficult to find young calvesor yearlings for fattening purposes. Per capita consumptionof other livestock products such as eggs and milk is also
���� ���� ���� ���� ���� ���� ���� ���� ���� ���� ���� ����>�#
��
��
��
��
��
��
��
�
�
���,?��$ #(
���� ���� ���� ���� ���� ���� ���� ���� ���� ���� ���� ����>�#
*� ����*�$@
�
�
�
�
�
�
�
�
�
�
@��1.� <��(�#<�
Fig. 3. Contribution of beef and poultry meat to total meat production.(Source: Directorate General of Livestock Services 2003.)
Fig 4. Consumption of meat, eggs, and milk per capita per year.(Source: Directorate General of Livestock Services 2003.)

95
shown in Figure 4. Demand for these products has also beenon the rise.
Figure 4 also indicates how demand for meat was af-fected by the financial crisis in 1997 as consumers’ capac-ity to buy was affected. Meat consumption per capitadropped to 4 kg per year in 1997 to 2000 (Directorate Gen-eral of Livestock Services 2003). This indicates that de-mand for meat responds strongly to changes in income. Asthe economy recovered from the financial crisis, meat de-mand rose. Indonesia must be prepared for this trend in meatdemand with a stable and sustained economic growth.
Contribution of rice and the livestocksector to gross domestic productThe Central Bureau of Statistics (2001) indicated that thecontribution of food crops (e.g., rice, maize, and other graincrops) still constitutes the biggest share of the country’sGDP. This is followed by fisheries, livestock, and forestry,as can be noted in Figure 5. Rice still accounts for the bulkof the food crop contribution, but it is no longer the majorsingle contributor to GDP as it used to be prior to the mas-sive industrialization of the Indonesian economy in the1990s (Sudaryanto et al 2002). With income growth, thepopulation changed from working in the agricultural sectorto the nonagricultural sector since 1991, which resulted inthe increased contribution of the nonagricultural sector toGDP (CBS 2001). The contribution of the livestock sector,on the other hand, increased only slightly.
Extent of crop-animal integration
The role of livestock in rice production systemsIn earlier times, livestock were farmers’ primary assistantsin rice cultivation. Animal traction, provided by cattle andbuffaloes, was used a lot for land preparation. Nowadays,such use of these animals has tended to diminish with thegreater availability of machinery that is more convenientand practical for farmers to use, especially on the vast andflat irrigated farms where intensive planting is practicedand labor availability is low. As animal use in land prepara-tion slowly diminished, many families still continued tokeep animals because these were considered as a form ofsavings and as a social indicator of welfare status in ruralareas. A study conducted by Suradisastra (1984) found that79% of the farmers in a village in Bogor, West Java, indi-cated that they raised animals to be able to save money forfuture use, 3% responded that they kept animals for imme-diate cash during emergencies, and 18% indicated that theykept livestock only as a hobby or because they inheritedthe animals from their elders (Suradisastra 1984).
Richer farmers generally owned more animals, whereaspoorer families tended to keep animals through tenancy.Animal ownership was also related to the availability andaccessibility of feed. Most farmers obtained feed such asgrasses and forages outside of their own farms on estate croplands or other public land areas (Sabrani 1981). Animals
that are not used for land preparation are kept and takencare of and then sold when farmers need cash.
Transmigration areas, especially those located inSumatra, have generally employed cattle to prepare the landfor food crop production, particularly for rice. Many of theseareas, however, have now been developed into estate plan-tations such as rubber and oil palm, where animal traction isseldom used (Santoso and Prawiradiputra 1981). Recently,the government started to encourage the integration of cattleinto the plantation areas to promote and strengthen moresustainable production systems.
The role of nonruminants amongrice farm householdsIt is also common for rice farm households to keep and raisenonruminant animals around their homestead and in areasclose by their fields. Such animals include Kampong chick-ens, ducks, and pigs. The motivation for keeping Kampongchickens is not financial in nature but more related to non-economic reasons such as for filling leisure time or for self-consumption. In general, 86% of the farmers in a villagewould have these animals primarily for their own familyconsumption. Only 14% raise Kampong chickens for eco-nomic reasons (Martojoedo et al 1982). This explains whyit has been difficult to develop Kampong chicken produc-tion on a much larger scale. In rice-producing areas,Kampong chickens are more predominantly available thanin non-rice-producing areas.
Duck raising is also a traditional practice and has beenwell adopted by farmers. The social motives of raising ducksare to optimize the resource availability. Releasing them inrice fields after harvest and prior to planting helps reduce
Fig. 5. Contribution of agriculture to GDP. (Source: Central Bureauof Statistics 2001.)
���� ���� ���� ����
��0���
��0���
��0���
��0���
��0���
��0���
�0���
�
��$$�����.6
;#)�,��%�1#�.����,��%�1#�.�9�/�� �1@;�#�� #(;����#(
>�#

96
snail infestation as ducks feed on snails. Moreover, theirwastes serve to enrich the soil in rice fields. The manage-ment system basically consists of (1) those individuals main-taining a small holding of ducks (around 20) with intensiverice farming, (2) those individuals herding from 50 to 150ducks in rice fields after or during the time of harvest, and(3) individuals maintaining their ducks in confinement af-ter herding and giving them supplemental feed when theyare not herded. An observation of duck raisers in Cirebon(West Java) and Banyuasin (South Sumatra) indicated thatmost duck raisers cultivate food crops and additionally keepother livestock such as goats (Siregar and Sabrani 1981).Ducks are also raised to enhance farm household income.Different types of ducks are raised depending on the ur-gency of households to meet economic needs. Tegal ducksreach productive age earlier than crossbred or KhakiCampbell or Bali ducks. Under an intensive managementsystem, the ducks start to produce eggs at 6 to 8 months ofage. However, Khaki Campbell ducks produce more eggsthan the other strains. The only constraint of the KhakiCampbell ducks is that the egg color is white, which is notpreferred by consumers and therefore is more difficult tomarket (Hetzel 1981). Cost and return estimates show thatduck raising can give farmers net income of roughly $5 perbird over a 47-week period (Gunawan and Hetzel 1981).Farmers are also raising swan, turkey, and quail, even thoughin limited numbers. These poultry, except for quail, are notcommon in the villages. They are kept only as hobbies ratherthan for economic purposes.
Pigs are found in a limited number of villages, mostlyin North Sumatra, Bali, South Sulawesi, and WestKalimantan. Pigs are raised in backyards by small farmers aswell as in large-scale enterprises. Local breeds of pig arecommon in the backyards of farm households in Bali (Balipig) and the Nias Islands (North Sumatra). They are fed riceleftovers and other crop residues and are raised primarily forhome or ceremonial use. The large-scale pig enterprises usu-ally keep and raise exotic breeds, such as Hampshire, York-shire, Duroc, etc., which are sold in markets, mainly to resi-dent foreigners or visitors. However, interaction betweenpigs raised in large-scale systems and rice production doesnot exist because pigs are usually raised in a separate areafar from rice fields and are fed with rice residues or leftovers.
Feed resources from rice areasIn the intensively managed rice production areas, most ofthe lands are cultivated three times in a year. Feed resources,in the form of grasses or shrubs, for animals kept and raisedbecome very limited from farmers’ own fields. And, becauseof their tight schedule in rice production, farmers do notusually have the time to find fresh forages for their cattle.Hence, livestock in these areas are usually tethered at road-sides or in vacant arable areas. Rice straw as animal feed isnot a common practice, especially among traditional farm-ers that use grasses and other foliages for their cattle. Only afew farmers use this residue for additional feed. It is burned
after the grain is harvested, a habit that has not helped im-prove rice productivity because organic materials from ricestraw are lost and not put back into the soil.
Altering a cropping pattern in intensive rice produc-tion areas can be a means to produce more crop residue(waste) that can be used as animal feed and at the same timeenhance soil fertility. A cropping sequence of maize, dry-land rice, cassava, peanuts, and red bean on a 1-ha farm canproduce 814 kg of dry matter of residue that can provideadditional feed for 3.71 head of goats (Sudaryanto et al1982) to fulfill a year-round requirement. An issue thatarises, however, relates to the provision of feed for the ani-mals on a continuous basis. The availability of a single typeof agricultural residue at a certain time may not be appropri-ate as a sole source of feed. Therefore, the formulation ofseveral agricultural residues into a complete feed should beconsidered.
Promoting more sustainableproduction systemsSmall-scale livestock holders are generally subsistent and“zero-cost” producers. Animals are fed with natural grassestaken from roadsides, riverbanks, idle public lands, and cropresidues. Accounting for the costs and returns among thesefarmers is quite difficult. Family labor is usually not countedas a production cost, whereas noncash benefits derived fromthe use of animals in fields, animal manure, animals con-sumed at home, the elevation of social status, and leisure-time activities are rarely valued for inclusion in evaluatingthe relative returns of the production system (Mulyadi1986). What these small farmers desire most is stability.Hence, adding animals to mixed cropping systems has beenprevalent, particularly in the tropical regions of the world.
The practice of mixed animal-crop systems has not onlyenabled farmers to achieve the most out of their productionresources but also has helped promote more sustainable farm-ing. Animals consume crop residues or vegetative matterthat would just be thrown away as waste because of beingunfit for human consumption. In rice, the presence of live-stock will increase the use of rice straw rather than it justbeing burned. At the same time, the livestock will producemanure for organic fertilizers. The existing conditions ofagricultural land, with special reference to that used for riceproduction, tended to decrease its productivity because ofthe degradation of soil fertility and its physical structure.The lack of organic matter is considered as the main factorfor the reduction in soil productivity. The long-term effectsof the application of inorganic fertilizers have resulted inchanges in soil physical structure and texture, which bringsabout the inefficient absorption of soil plant nutrients. It isassumed that some plant nutrients are available adequatelyin the soil, but they are not readily available for absorptionby the plant. The addition of organic matter into the soil hasbeen one possibility for remedying the sick soil. The gov-ernment has tried to develop the crop-livestock system asthe primary means to supply adequate organic matter by
97
using livestock manure as the main source of material fororganic fertilizer. Results of this initiative are discussed inthe next section of this paper.
Small ruminants such as goats and sheep are an ex-tremely valuable source of cash income and hence they helpstabilize total farm income, especially when calamities hitthe areas, as these animals are sturdy and can usually sur-vive more difficult situations better than other types of ani-mals (Gaylord 1986).
Types of crop-animal systemsand their impact
Several models of crop-livestock system (CLS) can be ob-served around the country. The type of interaction betweenanimals and the land is largely determined by the biologi-cal adaptation of the animals to existing conditions as theseshould complement rather than compete with crop produc-tion in terms of land, water, and energy use, and nutrientuptake from the soil, as well as in helping to reduce diseaseor plant pests (Siregar et al 1981). The carrying capacity ofland as well as its potential for producing animal feed alsodetermine the types and quantities of livestock to be raised.Land area ownership is likewise related to the species oflivestock being kept by farmers. Therefore, it is uncommonto see farmers with 0.3 ha of land ownership keeping cattleat the same time.
The three-strata forage production systemThe use of livestock as a component in an integrated farm-ing system (food crops and livestock) was tried in SouthSumatra (Batumarta) in the 1980s (Ismail et al 1985). Themodel introduced involved keeping cattle, goats, and chick-ens and the cultivation of food crops. The model enabledfarmers’ income to increase by $1,500 per year. Subsequenttrials of the same model were carried out in other areas,which gradually led to the development of the three-strataforage production system (Nitis et al 1985). In this system,forages and the cash crop are cultivated after rice. Forageprovides a year-round supply of livestock feed while thecash crop is sold to augment income. This system helpedreduce soil erosion while increasing the carrying capacityof the area and increasing farmers’ income.
Yogyakarta livestock modelThe predominant crop-livestock model is the one that canbe found in Yogyakarta, in which the farmers have devel-oped a community of cattle shelters and used rice straw asthe main source of feed, with supplementation of rice branor cassava in limited amounts. The adoption of collectiveshelters has been advantageous for health care and artificialinsemination purposes. In this location, however, manurehas not been processed into organic fertilizer. The manureis only collected and allowed to stand for several monthsbefore being taken out to other areas, usually to the higherplain, and used for horticultural production. Therefore, the
system has not been a full closed cycle of nutrients, in whichthe source of cattle feed came from the rice field, and themanure being produced by the cattle should be applied backinto the rice field to maintain its soil productivity. Exactlythe same model was also developed in Nusa Tenggara Barat(West Nusa Tenggara) and East Java, but, in these areas,animal manure was also processed for organic fertilizer. Themodel developed in Central Java (Grobogan District) in-volved the government, which provided the cattle througha credit scheme. Farmer participation in the development ofthe model was a necessity. The cattle were for breeding pur-poses to increase the cattle population.
Iteration of the Yogyakarta model continued. A morerecent one was introduced in an intensive irrigated rice-producing area (Diwyanto and Haryanto 2003), in whichrice straw, after being treated by a fermentative process, wasused as the main source of fibrous feed for cattle. Concen-trated feed was given to fulfill the total nutrient require-ment. In the present model, the shelter system was a groupmodel in which sawdust was used as bedding material, mixedwith cattle manure and urine, and it was not replaced until3–4 weeks later. The collected cattle feces and urine com-bined with the bedding material were used as the main ma-terial for making organic fertilizer after being processedthrough a fermentative treatment. The process takes about 4weeks, with weekly piling up of the materials as needed.
Synergistic effects of crops and livestockon total agricultural production: experiencefrom various trial sitesAs indicated earlier, the effect of keeping livestock as acomponent of the agricultural system, in addition to themain cash crop, will be able to increase farmers’ income. Anincrease in efficiency of fertilizer use because of the use oforganic fertilizer from cattle manure has been observed atsome experiment stations.
Results of trials on the model crop-livestock systemcarried out in the eight provinces as reported by the Assess-ment Institute for Agricultural Technology (AIAT) are asfollows.
Lampung area. Lampung used to be one of the suppli-ers of livestock for meat to Jakarta and other areas; however,the cattle population decreased significantly because of thehigh rate of animal slaughter compared with the rate of in-crease in animal population. The population in 1996 wasmore than 520,000, but decreased to only 372,000 in 2000.With an area of 3,301,784 ha, 47.8% is used for agriculturaland estate crops. Agricultural residues have not been usedoptimally for feeding animals. Even residues such as ricestraw are burned in the field. The availability of phosphorusand potassium in the rice field is quite high, but these havenot become easily available for the plants because of theirslow absorption rate. The benefits of the rice straw havetherefore not been tapped fully. Neither was the cattle ma-nure fully used as organic fertilizer, even though tradition-ally some farmers have already applied the manure on theirrice crop.
98
Technology application was assessed in the area whereanimal manure was incorporated in the rice fields with burnedstraw. Results of these trials indicated an increase in riceproduction at 5–30% of the previous production. Table 4indicates about a 2 t ha–1 increase in rice production in areaswith applied organic fertilizer vis-à-vis the control areas.
In the villages of Astomulyo and Rukti Endah, farmerswere shown how to improve the nutritive value of rice strawthrough the fermentation process. However, feeding ricestraw solely for cattle requires supplementation with con-centrated feed.
West Java. The crop-livestock system model in WestJava was used in the village of Sukasenang, Banyuresmi,Garut District. At this location, 35 farmers were involved inthe activity within an area of 50 ha. The integrated farmingsystem included rice or maize cultivation, the raising ofcattle, and the development of fish ponds. The farmers weregrouped into two based on their application of technologyin rice cultivation. Group I adopted such technologies as(1) the use of an outstanding rice variety, (2) planting withthe legowo system, (3) urea fertilization based on the leafcolor chart, (4) phosphorus and potassium fertilization basedon recommendations, and (5) the integration of fisheries.Group II adopted similar technologies, except that the phos-phorus and potassium fertilization was only half of the levelin group I but organic fertilizer was applied at 1.5 t ha–1.Results of the trial indicated that the use of the leaf colorchart in urea fertilization proved to be more efficient whenthe fertilizer could be used only twice, at 14 and 42 daysafter planting, with 30 kg N ha–1 each time of application.This means that 30% of the urea fertilizer was saved. Ricestraw was not used for feeding cattle. Most was burned orburied in the soil while preparing the land for the next cul-tivation. The fermentation process of rice straw can improvethe nutritive value, which is indicated by an increase inprotein content from 4% to 9%.
The integration of fisheries into rice cultivation underthe legowo planting system resulted in 50% empty areaavailable for fish, with which farmers’ income can be in-creased, even though the fish growth rate was still under theoptimal rate (0.99 g day–1 versus 1.5 g day–1) because of thewater shortage.
Organic fertilizer was applied to the horticulture plan-tation at 1.5 t ha–1 at the time of soil preparation. The phos-phorus and potassium (KCl) fertilizers were given at half ofthe recommended rate, while urea was applied based on theleaf color chart. The results indicated that plant growth wasbetter when organic fertilizer was applied and the grain pro-duced was more filled.
Treated rice straw used as cattle feed resulted in a dailygain of 0.7 kg on average. The interesting thing was that allfeedstuffs for cattle fattening were derived from agriculturalresidues such as rice straw, maize straw, rice bran, corn sto-ver, and coconut waste. Manure from cattle was collectedfor organic fertilizer processes. The organic fertilizer wasused in horticultural cultivation during the dry season.
Central Java. The location of the crop-livestock sys-tem trial in Central Java is in the district of Grobogan, whichwas actually the continuation of a previous activity of thecrop-livestock system (CLS) since 1999, when this locationwas used as a milestone in the development of the crop-livestock model. The characteristics of the location wereindicated by a flat area, 40 m above sea level, soil pH was7.6 to 8.3, soil P
2O
5 and K
2O content was high at 141.3 and
51.0 mg 100 g–1 soil, respectively. Ambient temperatureranged from 26 to 36 ºC, with rainfall of 2,203 mm per year.Rice and maize are the predominant agricultural practices.Production was 5.8 to 7.1 t ha–1 for rice during the early wetseason and 5.0 to 5.6 t ha–1 for the late wet season. Maizeproduction was 6.8 t ha–1 of grain. The cattle used at thislocation were for breeding purposes; therefore, cows wereprimarily kept by farmers. Artificial insemination was used.Rice straw and maize straw are fed to cattle supplementedwith rice bran and maize bran.
Trial results indicated an increase in rice productionfrom 6.45 to 7.0 t ha–1 during the early wet season and from6.0 to 6.3 t ha–1 during the late wet-season cultivation.
The cattle pregnancy rate was 46% because of a rela-tively low adoption of technology by farmers who have notbeen used to cattle management. Cattle manure was pro-cessed for organic fertilizer and used as fertilizer for ricecultivation. It was observed that the integration of cattleinto agricultural practices can reduce production costs andincrease family labor use because of additional activity in
Table 4. Results of organic fertilizer use in rice production, Lampung, Indonesia.
Treatmenta
VariablePlus organic fertilizer Control
Rice grain production (t ha–1), dry-harvest 7.38 + 0.921 6.16 + 0.848Input production (Rp.) 1,160,500 + 102,122 554,143 + 172,897Manpower (Rp.) 1,469.700 + 180,700 1,333,600 + 153,300Total input cost (Rp.) 2,630,300 + 255,650 1,887,750 + 237,000Gross output (Rp.) 8,118,000 + 1,012,800 6,774,400 + 932,400Net output (Rp.) 5,487,750 + 827,160 4,886.700 + 816,200
aSome values are rounded up. Rp. 8,500 = US$1.
99
cattle management. Unfortunately, the grouped cattle shel-ter system has not been fully accepted by farmers because ofthe distance from the farmers’ home and security.
East Java. A crop-livestock system model was devel-oped in three villages, Curahtulis, Besukagung, andTanjungrejo. All locations are lowland, approximately 4–7m above sea level, with average rainfall from 1,001 to 1,500mm per year. The agricultural system is an irrigated rice-producing area. Most farmers involved in the crop-livestockmodel application have adequate experience in livestockmanagement, in which more than 90% have been involvedin livestock raising for more than 10 years. They are inter-ested in breeding so that they can obtain better animal per-formance, with better cattle reproductive ability. About 40%of the farmers have an elementary education level, and 20%to 53% have not completed elementary education. Only4% to 10% have attended high school. Most farmers owned0.4 to 0.6 ha of land, with livestock ownership of 1.5 to 1.8head per farm family. This is a general description of farm-ers in East Java. The agricultural commodities are rice, soy-bean, watermelon, and maize, except in Besukagung vil-lage, where tobacco is also planted. Rice production was 2to 7 tons of harvest-dried grain per ha, which was lower thanwith the previous system (7.2 to 8.6 tons of harvest-driedgrain per ha). The average service per conception of cattlewas 1.8 to 2, with a calving interval of 17.1 to 21.2 months.Rice straw has been used to feed cattle for a long time inEast Java; however, no treatment to obtain a higher nutri-tive value was used. Cattle manure has also been used asfertilizer without any additional treatment to improve itsquality. The use of manure for the land did not follow astandard procedure. However, farmers in Besukagung didnot use manure for fertilizing their land because they be-lieved that manure would reduce the quality of tobacco.Most rice straw is used as cattle feed (68–70%) in Curahtulisand Tanjungrejo, but only 10% in Besukagung. On the otherhand, 5–6% of the rice straw is burned, but 25% inBesukagung. Rice straw was fed at about 8–12 kg head–1
day–1.West Nusa Tenggara. Livestock in West Nusa Tenggara
have generally been collectively confined in communalshelters outside the farmers’ residence. Farmers usually ap-ply manure for soil fertilization. The adoption of collectiveshelters as the model of animal shelters has been advanta-geous for health care and artificial insemination purposes.Rice straw has been processed to increase its nutritive value.Manure is also processed for organic fertilizer.
South Sulawesi. The crop-livestock system in SouthSulawesi has not been fully developed. The effort to makecollective cattle shelters has not been successful becausefarmers prefer to bring the cattle back home and tether themunder the house. This is done because of the lack of securityfor the cattle if they are left in the collective shelter. Mostfarmers don’t use manure for fertilizer in rice fields. A studyon the use of manure as fertilizer showed that it did not havea significant effect on rice production. The use of rice strawfor feeding cattle has not been practiced because harvesting
is generally done by cutting the rice plant at the top andleaving behind most of the lower part of the straw in thefield. Therefore, farmers should cut the remaining part even-tually if the rice straw will be used as feed for cattle. Thismay be because natural grasses are sufficiently availableand therefore farmers do not use rice straw to feed their cattle.Social matters therefore become the main factor determin-ing a successful crop-livestock system.
Yogyakarta. The crop-livestock system in Yogyakartahas been practiced for a long time. The use of rice straw forfeeding cattle and the development of communal cattle shel-ters have been practiced. Manure, however, was not pro-cessed for organic fertilizer, but was collected and left forseveral months to allow organic matter degradation to takeplace naturally. This manure was not used for rice fields inYogyakarta but was taken to other areas, usually for horti-cultural cultivation in the upland areas of Wonosobo. Thecommunal cattle shelters are generally located at a similarsite, which is owned by the village government, and couldbe used by any farmers. The cattle are individually man-aged.
Bali. The crop-livestock system in Bali has not beenassessed completely. However, farmers were enthusiasticabout adopting the CLS that was introduced to them. Thefarmers themselves have been keeping cattle in the rice field,but rice straw is not used for feeding cattle since the farmerscan still find native grasses easily for feeding their cattle.
Integrated fish-animal farming systemIntegrating fish into the rice field during the first 4 weekswhen the water is still deep enough in the rice field has beenpracticed by some farmers, especially those in the irrigatedrice areas in West Java.
The integrated fish-animal farming system, such as thatbetween fish and chickens, has been practiced. Chickenshelters are built above the fish pond so that the chickenmanure and spilled feed could drop into the pond. The fishand duck system is also similar to the fish and chicken sys-tem. Duck shelters are built above the fish pond, with her-bivorous fish being kept in the pond.
Empirical data indicated that the fish-chicken systemcould increase farmers’ income up to 7-fold vis-à-vis fishfarming only. The integration of fish and sheep/goats isalso practiced in some areas. This fish-sheep system did notgive a daily income to farmers because the sheep/goats willonly be sold after being kept for 3 months. Therefore, thefish-sheep/goat system under small-scale management maynot be promising for development in rural areas (Jangkaruet al 1981).
Possibility of developing off-farmsmall-scale industriesThe development of the crop-livestock system model hasencouraged emerging new small businesses in the village,such as the development of agricultural services (workshopof agricultural machinery), agricultural shops (productioninputs, tools, information, etc.), and small-scale home in-

100
dustries (handicrafts, bakery, etc.), to take advantage of thefree time of farmers. If this development is supported bysmall-scale banking facilities such as credit schemes, theeconomy of the village should improve.
Crop-animal production system:issues and constraintsLivestock management. Several factors affect the potentialfor developing large ruminants, such as social, economic,and government policy and the integration of institutionsthat are related to the livestock subsector. The social factorsprimarily are related to the increase in the human popula-tion, improved education, and health awareness, for whichgood food becomes an unavoidable daily requirement ofindividuals. Improvement in tourism services will also af-fect the availability of good food. The increase in meat de-mand will influence the supply, which could lead to anincrease in slaughtering meat-producing livestock. There-fore, a higher demand for meat may reduce the livestockpopulation if appropriate management is not undertaken.
Cattle and buffalo. The increasing ruminant popula-tion requires an increase in roughage availability. Agricul-tural residues such as rice straw, corn stover, soybean, pea-nut haulm, and others can be used as feed resources for ru-minants. The potential of straw production throughout thecountry was large enough to support the roughage require-ments of millions of cattle. The nutritive quality of strawwas relatively low (Table 5) (Lebdosukojo 1983). The prob-lems in using agricultural wastes as feedstuffs for ruminantsis that the ruminants require supplemental feed (such asnatural grasses, legumes, etc.). Other problems are difficul-ties in collecting the materials, cost of collection, new tech-nology for needed nutritive improvement, etc.
The use of rice straw as feedstuff for buffaloes was notadequate to fulfill the animals’ needs; therefore, the ani-mals should be supplemented with concentrate diets. Feed-ing approximately 7.5 kg of rice straw (dry) and 2.5 kg ofconcentrate resulted in an increase in body weight gain of 6to 210 g per day. The total feed dry matter intake (DMI) wasapproximately 5.9 kg head–1 day–1, which equals 350 to 475g of protein under the assumption that the protein contentof rice straw was 4.04% (dry matter basis) (Zulbardi et al1983).
Buffaloes are considered to be more appropriate for landpreparation than cattle because they are more powerful andmore resistant to low-quality feed. Farmers use buffaloes tohelp in land preparation. Buffaloes are used for 5 hours perday and can help in preparing 0.18 ha of land. Plowing theland using buffalo traction is common in Central Java. Apair of buffaloes needs 6.5 days to finish plowing 1 ha ofland. Technically, irrigated land is easier to plow thannontechnically irrigated land, which is indicated by the dif-ference in land area that can be prepared by a pair of buffa-loes during 3 hours of work (0.099 versus 0.081 ha). Fork-ing the land is easier than plowing (0.64 ha for technicallyirrigated land and 0.48 ha for nonirrigated land) vis-à-visthe capacity for plowing the land as indicated above, even
though the duration of work is the same (3 h) (Sumadi andKuncoro 1982).
Traditional management of buffaloes provides simpleshelters, with the animals being herded in the grazing areaswithout supplemental feed, used for plowing agriculturalland, and used in a natural breeding system. However, aswith cattle, the population tends to decrease. Difficultiesfor improving the reproductive capacity of buffaloes maybe related to the unseen menstrual cycle and the lack ofmale buffaloes. Frozen buffalo semen was not readily avail-able for artificial insemination compared with frozen cattlesemen.
Sheep and goats. Feed availability throughout the yearis a limiting factor, especially among small ruminants insome areas. In rice-producing areas such as those in Cirebon(West Java), feed resources for farmers’ livestock are prima-rily obtained from lands owned by other farmers. About66% of the farmers use public land as the source of theirlivestock feed. Unlike in the highland areas in which horti-culture is the main farming system, feed resources for theirlivestock are obtained from farmers’ own land (Sabrani1982).
Raising sheep on marginal land usually has promisingresults for farmers. Because these animals are generally con-fined in sheds, they contribute less to land erosion and otherdetrimental effects on the soil. In addition, they also helpincrease farmers’ income. There is no significant relation-ship between keeping livestock (sheep) and land owningsince keeping sheep in a confined system does not require agreat deal of land. However, feed should be obtained fromother areas, such as in the forest vicinity, where grasses arecut and then carried to where the sheep are kept. They arefed twice a day. Forage offered was generally variable be-tween the rainy and dry seasons (Djadja et al 1982). In thehigher plain of Wonosobo, Central Java, the sheep werekept in confined shelters, and were fed with cut-and-carrygrasses and other leguminous leaves. Manure is not removedfrom the animal shelter, rather, the manure is left inside theshelter as bedding for the sheep. The manure is then takenout after 3–4 months and used for fertilizer on horticulturalland, including that cultivated to tobacco. The sheep could
Table 5. Protein and digestible dry matter content of agriculturalresidues.
CharacteristicsKind of straw
Protein content (%) Digestible DM (%)
Rice straw 4.51 39.2Maize straw, upper parts 7.44 49.2Maize straw, lower parts 4.77 45.3Sorghum straw 4.39 38.0Sweet potato vines 11.30 60.0Peanut haulm 11.08 52.9Soybean straw 10.56 52.9Sugarcane tops 5.63 42.7
Source: Lebdosukojo (1984).
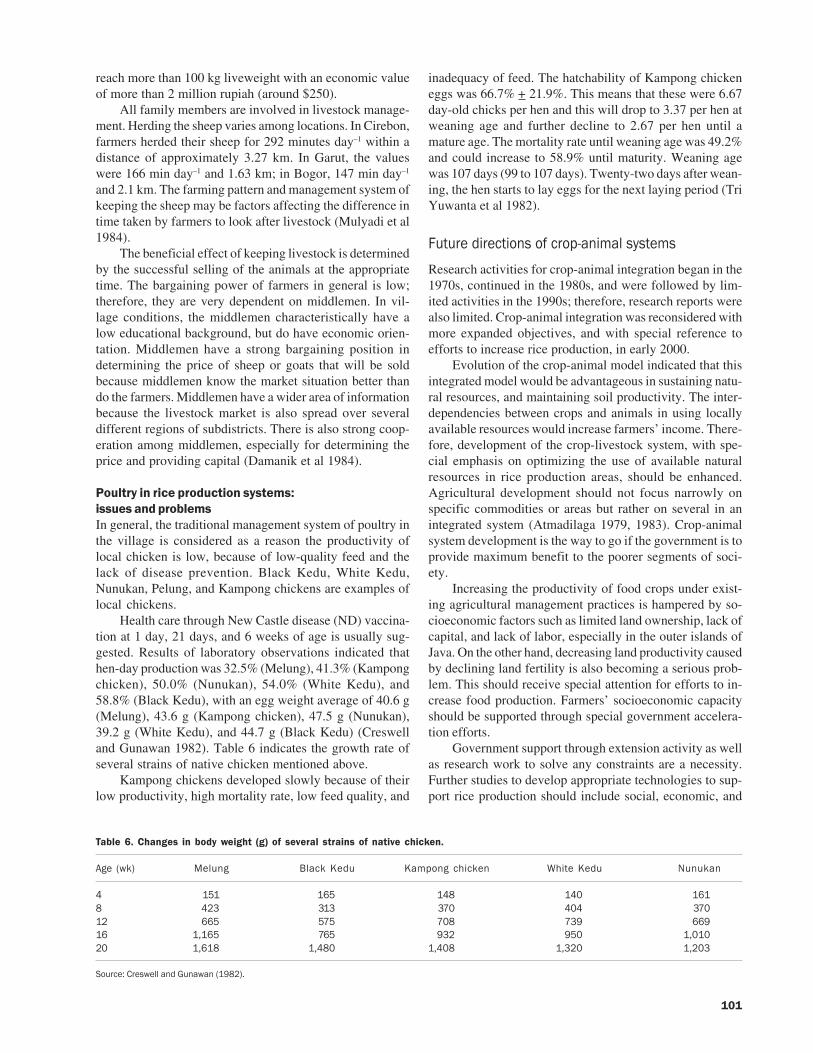
101
reach more than 100 kg liveweight with an economic valueof more than 2 million rupiah (around $250).
All family members are involved in livestock manage-ment. Herding the sheep varies among locations. In Cirebon,farmers herded their sheep for 292 minutes day–1 within adistance of approximately 3.27 km. In Garut, the valueswere 166 min day–1 and 1.63 km; in Bogor, 147 min day–1
and 2.1 km. The farming pattern and management system ofkeeping the sheep may be factors affecting the difference intime taken by farmers to look after livestock (Mulyadi et al1984).
The beneficial effect of keeping livestock is determinedby the successful selling of the animals at the appropriatetime. The bargaining power of farmers in general is low;therefore, they are very dependent on middlemen. In vil-lage conditions, the middlemen characteristically have alow educational background, but do have economic orien-tation. Middlemen have a strong bargaining position indetermining the price of sheep or goats that will be soldbecause middlemen know the market situation better thando the farmers. Middlemen have a wider area of informationbecause the livestock market is also spread over severaldifferent regions of subdistricts. There is also strong coop-eration among middlemen, especially for determining theprice and providing capital (Damanik et al 1984).
Poultry in rice production systems:issues and problemsIn general, the traditional management system of poultry inthe village is considered as a reason the productivity oflocal chicken is low, because of low-quality feed and thelack of disease prevention. Black Kedu, White Kedu,Nunukan, Pelung, and Kampong chickens are examples oflocal chickens.
Health care through New Castle disease (ND) vaccina-tion at 1 day, 21 days, and 6 weeks of age is usually sug-gested. Results of laboratory observations indicated thathen-day production was 32.5% (Melung), 41.3% (Kampongchicken), 50.0% (Nunukan), 54.0% (White Kedu), and58.8% (Black Kedu), with an egg weight average of 40.6 g(Melung), 43.6 g (Kampong chicken), 47.5 g (Nunukan),39.2 g (White Kedu), and 44.7 g (Black Kedu) (Creswelland Gunawan 1982). Table 6 indicates the growth rate ofseveral strains of native chicken mentioned above.
Kampong chickens developed slowly because of theirlow productivity, high mortality rate, low feed quality, and
inadequacy of feed. The hatchability of Kampong chickeneggs was 66.7% + 21.9%. This means that these were 6.67day-old chicks per hen and this will drop to 3.37 per hen atweaning age and further decline to 2.67 per hen until amature age. The mortality rate until weaning age was 49.2%and could increase to 58.9% until maturity. Weaning agewas 107 days (99 to 107 days). Twenty-two days after wean-ing, the hen starts to lay eggs for the next laying period (TriYuwanta et al 1982).
Future directions of crop-animal systems
Research activities for crop-animal integration began in the1970s, continued in the 1980s, and were followed by lim-ited activities in the 1990s; therefore, research reports werealso limited. Crop-animal integration was reconsidered withmore expanded objectives, and with special reference toefforts to increase rice production, in early 2000.
Evolution of the crop-animal model indicated that thisintegrated model would be advantageous in sustaining natu-ral resources, and maintaining soil productivity. The inter-dependencies between crops and animals in using locallyavailable resources would increase farmers’ income. There-fore, development of the crop-livestock system, with spe-cial emphasis on optimizing the use of available naturalresources in rice production areas, should be enhanced.Agricultural development should not focus narrowly onspecific commodities or areas but rather on several in anintegrated system (Atmadilaga 1979, 1983). Crop-animalsystem development is the way to go if the government is toprovide maximum benefit to the poorer segments of soci-ety.
Increasing the productivity of food crops under exist-ing agricultural management practices is hampered by so-cioeconomic factors such as limited land ownership, lack ofcapital, and lack of labor, especially in the outer islands ofJava. On the other hand, decreasing land productivity causedby declining land fertility is also becoming a serious prob-lem. This should receive special attention for efforts to in-crease food production. Farmers’ socioeconomic capacityshould be supported through special government accelera-tion efforts.
Government support through extension activity as wellas research work to solve any constraints are a necessity.Further studies to develop appropriate technologies to sup-port rice production should include social, economic, and
Table 6. Changes in body weight (g) of several strains of native chicken.
Age (wk) Melung Black Kedu Kampong chicken White Kedu Nunukan
4 151 165 148 140 1618 423 313 370 404 37012 665 575 708 739 66916 1,165 765 932 950 1,01020 1,618 1,480 1,408 1,320 1,203
Source: Creswell and Gunawan (1982).

102
ecological factors. This is important because the technolo-gies that will be introduced to existing practices should beaccepted socially, be economically feasible, and not dete-riorate ecological resources.
Technologies to improve the nutritive value of agri-cultural residues as well as technologies that would helpconvert manure into organic fertilizer are strongly encour-aged as their use has been found beneficial. The fact that thepotential of agricultural residues has not been used opti-mally, in parallel with the increasing cost of inputs in agri-cultural practices, such as the cost of fertilizers, pesticides,and insecticides, and labor and transportation, provides anincentive to introduce an integrated crop-animal system thatcould use available local resources in a maximal way. How-ever, capital availability at the farmers’ level may become amajor constraint to developing the integrated crop-animalsystem as a large amount of capital is required. The role ofgovernment becomes the key factor for the successful de-velopment of this integrated crop-animal system, especiallyin providing a source of capital. Moreover, governmentpolicy in terms of marketing of products should also bedirected to helping farmers so they will not be hurt by theuncontrollable fluctuation of prices of products, whether itbe rice or livestock.
Appropriate application of the Indonesia-ICM prescrip-tion (within a “Rice-Check Methodology”) especially inirrigated rice should be encouraged as it promotes moresustainable rice farming while strengthening the closer in-tegration of crops and animals. The components of this pre-scription are (1) adherence to a climate/crop-sequence-de-termined sowing date, (2) locally appropriate cultivars, (3)effective leveling and tillage management, (4) the use ofgood-quality seeds/seedlings, (5) the establishment of asufficient plant population to ensure adequate grain-sinksize for farmers’ target yield, (6) balanced plant nutrientmanagement, with demand-driven nitrogen topdressing, (7)P and K fertilizer application based on soil analysis, (8)animal manure to supply part of the rice N-supply, and (9)harvest and postharvest operations at appropriate grain-moisture.
The government policy to develop large ruminants hasbeen directed to improving farmers’ income and creatinglabor or job opportunities. Government, through its exten-sion units, should continue to promote animal managementbased on five proper measures: good heritage, good feedand feeding, good management, appropriate disease con-trol, and an appropriate marketing system.
References
Adnyana MO et al. 2000. Assessing the rural development im-pact of the crisis in Indonesia. CASER and the World Bank.
Arifin B, Munir A, Hartadi ES, Rachbini DJ. 2002. Food securityand markets in Indonesia: state-private sector interaction inrice trade. In: Kebijakan Perberasan dan Inovasi TeknologiPadi. Pusat Penelitian dan Pengembangan Tanaman Pangan.Badan Penelitian dan Pengembangan Pertanian. Hal. p 31-39.
Atmadilaga D. 1979. Ternak sebagai komponen usaha taniterpadu pada lahan kering di daerah transmigrasi. SeminarPola pengembangan usahatani terpadu pada lahan kering didaerah transmigrasi. Fakultas Pertanian. Unpad. Bandung.
Atmadilaga D. 1983. Ruminansia Besar dalam perspektif systempembangunan peternakan di Indonesia. Pros. PertemuanIlmiah Ruminansia Besar. Pusat Penelitian danPengembangan Peternakan. Bogor. Hal. p 122-132.
CBS (Central Bureau of Statistics). 2000. Statistical year book ofIndonesia. BPS, Jakarta.
CBS (Central Bureau of Statistics). 2001. Statistical year book ofIndonesia. BPS, Jakarta.
Creswell DC, Gunawan B. 1982. Pertumbuhan badan danproduksi telur dari 5 strain ayam sayur pada systempeternakan intensif. Pros. Seminar Penelitian Peternakan.Pusat Penelitian dan Pengembangan Peternakan. Bogor. Hal.p 236-240.
Damanik KI, Salangka MK, Ihalauw JOI, Sasongko G, Sulandjaridan S, Supardan EW. 1984. Peranan blantik dalam systemproduksi dan pemasaran kambing/domba di Jawa Tengah.Pros. Domba dan Kambing di Indonesia. Pusat Penelitiandan Pengembangan Peternakan. Bogor. Hal. p 220-225.
Directorate General of Livestock Services. 2003. Statistical bookon livestock 2002. Directorate General of Livestock Ser-vices, Department of Agriculture, Jakarta.
Diwyanto K, Haryanto dan B. 2003. Akselerasi peningkatanproduksi melalui Sistem Tanaman-Ternak. In: KebijakanPerberasan dan Inovasi Teknologi Padi. Pusat Penelitiandan Pengembangan Tanaman Pangan. Badan Penelitian danPengembangan Pertanian. Hal. p 93-102.
Djadja SK, Rukmana MP, Sulaeman, Hartati dan Mardjiwo. 1982.Prospek pengembangan ternak domba pada lahan kritis diJawa Barat. Pros. Seminar Penelitian Peternakan. PusatPenelitian dan Pengembangan Peternakan. Bogor. Hal. p151-155.
Gaylord M. 1986. The role of rural sociology in farming systemsresearch. Proceedings of the workshop on farming systemsresearch and development. Levine J, Sabrani M, editors.CRIAS. p 62-76.
Gunawan B, Hetzel DJS. 1981. Performans itik-itik local dansilangannya pada sistim peternakan secara extensive danintensif di Karawang. Pros. Seminar Penelitian Peternakan.Pusat Penelitian dan Pengembangan Peternakan. Bogor. Hal.p 424-429.
Hetzel DJS. 1981. Egg production characteristics of Alabio, Bali,Tegal and Khaki Campbell ducks under intensive manage-ment conditions. Proceedings of the Second Conference.Australian Association of Animal Breeding and Genetics,Melbourne.
Ismail IG, Djauhari A, Bambang P, Sabe W, McIntosh JL. 1985.Methodology, plans and progress of the crop/livestock sys-tems research in Batumarta, South Sumatra. Proceedings ofthe International Farming Systems Workshop, Sukarami.Agency for Agricultural Research and Rural Development.p 97-114.
Jangkaru Z, Djajadiredja R, Yunus M. 1981. Usaha pemeliharaanikan bersama ternak. Pros. Seminar Penelitian Peternakan.Pusat Penelitian dan Pengembangan Peternakan. Bogor. Hal.p 34-40.
Kariyasa K. 2003. Dampak tarif impor dan kinerja kebijakanharga dasar serta implikasinya terhadap daya saing berasIndonesia. Analisis Kebijakan Pertanian. Pusat Penelitian

103
dan Pengembangan Sosial Ekonomi Pertanian. 1(4):315-330.
Lebdosukojo S. 1983. Pemanfaatan limbah pertanian untukmenunjang kebutuhan pakan ruminansia. Pros. PertemuanIlmiah Ruminansia Besar. Pusat Penelitian danPengembangan Peternakan. Bogor. Hal. p 78-84.
Martojoedo SH, Dulatip N, Tawaf dan R, Amas U. 1982. Motifpemeliharaan ayam sayur pada petani peternak diKecamatan Ciamis. Pros. Seminar Penelitian Peternakan.Pusat Penelitian dan Pengembangan Peternakan. Bogor. Hal.p 249-257.
Mulyadi AN. 1986. Socio-economic constraints on livestock pro-duction within existing farming systems. Proceedings of theworkshop on farming systems research and development.Levine J, Sabrani M, editors. Center for Research in AnimalScience. p 51-61.
Mulyadi AN, Knipscheer dan HC, Mathius IW. 1984. Karakteristiksystem pemeliharaan domba dan kambing di Jawa Barat:Aspek tenaga kerja. Pros. Domba dan Kambing di Indone-sia. Pusat Penelitian dan Pengembangan Peternakan. Bogor.Hal. p 197-201.
Nitis IM, Lana K, Suarna M. 1985. Three-strata system for cattlefeeds and feeding in dryland farming area in Bali. Proceed-ings of the 2nd Monitoring Tour Crop-Livestock SystemsResearch. Nepal and Indonesia. p 245-271.
Nur M, Marwan dan HM, Basri AB. 2003. Pengelolaan TanamanTerpadu Nangroe Aceh Darussalam. Pros. LokakaryaPelaksanaan Program Peningkatan Produktivitas PadiTerpadu (P3T) Tahun 2002. Pusat Penelitian danPengembangan Tanaman Pangan. Badan Penelitian danPengembangan Pertanian.
Sabrani M. 1981. Prospek pengembangan kambing domba bagipetani kecil dan perlunya pendekatan keilmuan terpadu. Pros.Seminar Penelitian Peternakan. Pusat Penelitian danPengembangan Peternakan. Bogor. Hal. p 27-33.
Sabrani M. 1982. Respons pengembangan ternak domba terhadappola tanaman dan jumlah keluarga petani. Pros. SeminarPenelitian Peternakan. Pusat Penelitian dan PengembanganPeternakan. Bogor. Hal. p 145-150.
Sabrani M, Kusnadi U. 1986. Farming systems research (Indo-nesian experience). Proceedings of the workshop on farm-ing systems research and development. Levine J, SabraniM, editors. Center for Research in Animal Science. p 7-31.
Sabrani M, Sudaryanto B, Prabowo A, Tikupadang dan A,Suparyanto A. 1992. Dampak integrasi ternak dalamusahatani terhadap pendapatan. Pros. Agro-industriPeternakan di Pedesaan. Pusat Penelaitian danPengembangan Peternakan. Bogor. Hal. p 64-73.
Santoso dan B, Prawiradiputra R. 1981. Budidaya ternak di daerahtransmigrasi Sitiung. Pros. Seminar Penelitian Peternakan.Pusat Penelitian dan Pengembangan Peternakan. Bogor. Hal.p 86-95.
Sembiring H, Daniel M, Rinaldi, Siregar A., Akmal, Helmi,Sembiring T, Yusuf A, Thahir B, Ahyar, Sariman danMaezuki. 2003. Peningkatan Produktivitas Padi TerpaduSumatera Utara. Pros. Lokakarya Pelaksanaan ProgramPeningkatan Produktivitas Padi Terpadu (P3T) Tahun 2002.Pusat Penelitian dan Pengembangan Tanaman Pangan.Badan Penelitian dan Pengembangan Pertanian.
Siregar AP, Sabrani M. 1981. Prospek peternakan itik di daerahpantai. Pros. Seminar Penelitian Peternakan. Pusat Penelitiandan Pengembangan Peternakan. Bogor. Hal. p 419-423.
Siregar AR, Soediman S, Manurung dan T, Siregar AP. 1981.Budidaya ternak dalam usaha tani terpadu di daerahtransmigrasi. Pros. Seminar Penelitian Peternakan. PusatPenelitian dan Pengembangan Peternakan. Bogor. Hal.p 78-85.
Soeharto Pr, Nurtini dan Taryadi S. 1981. Masalah ternak kerbaudan mekanisasi pertanian. Pros. Seminar PenelitianPeternakan. Pusat Penelitian dan Pengembangan Peternakan.Bogor. Hal. p 161-168.
Sudaryanto B, Djamal dan S, Siregar ME. 1982. Produksi limbahpertanian dengan pola tanam tertentu untuk makanan ternak.Pros. Seminar Penelitian Peternakan. Pusat Penelitian danPengembangan Peternakan. Bogor. Hal. p 337-340.
Sudaryanto T, Simatupang P, Irawan B, Swastika DKS. 2002.Medium- and long-term prospects of rice supply and de-mand in Indonesia. In: Sombilla M, Hossain M, Hardy B,editors. Developments in the Asian rice economy. Proceed-ings of the International Workshop on Medium- and Long-Term Prospects of Rice Supply and Demand in the 21stCentury. Los Baños (Philippines): International Rice Re-search Institute. p 97-125.
Sumadi, Kuncoro. 1982. Hubungan antara kedalaman bajak,panjang garu dan luas sawah yang dikerjakan dengan ternakkerbau di Kabupaten Klaten. Pros. Seminar PenelitianPeternakan. Pusat Penelitian dan Pengembangan Peternakan.Bogor. Hal. p 69-77.
Suradisastra K. 1984. Sikap dan persepsi: Suatu karakteristikmental peternak dalam usaha pengembangan peternakandomba. Kasus desa Ciburuy, Cijeruk (Bogor). Pros. Dombadan Kambing di Indonesia. Pusat Penelitian danPengembangan Peternakan. Bogor. Hal. p 193-196.
Tri Yuwanta, Wihandoyo, Harimurti S. 1982. Hubungan prestasiayam kampong saat DOC, lepas induk dan dewasa kelaminpada kondisi pemeliharaan tradisional di pedesaan. Pros.Seminar Penelitian Peternakan. Pusat Penelitian danPengembangan Peternakan. Bogor. Hal. p 241-248.
Zulbardi M, Siregar dan AR, Mathius W. 1983. Jerami padidengan jagung dan dedak padi sebagai makanan kerbau.Pros. Pertemuan Ilmiah Ruminansia Besar. Pusat Penelitiandan Pengembangan Peternakan. Bogor. Hal. p 33-36.
Notes
Authors’ addresses: Sri Nastiti Jarmani and Budi Haryanto, Re-search Institute for Animal Production; Arti Djatiharti, Re-search Institute for Rice, Agency for Agricultural Researchand Development, Department of Agriculture, Indonesia.
Acknowledgments: The authors express their gratitude and ap-preciation for the support of funding by the SLP/ILRI and theopportunity to do this collaborative work with IRRI. Our deepgratitude also goes to other institutions whose inputs werevaluable in the preparation of this review of the crop-live-stock system in Indonesia.

104
There are around 1.2 million hectares of rainfed rice areas inthe Philippines, where potential for increasing agriculturalproduction is more difficult because of fragile and adverseconditions. Rice is grown only during the rainy season andyield growth is equally experiencing a declining trend.These reasons partly explain the high incidence of povertyon rainfed lowland and upland farms. Rice farmers are con-sidered among the poorest people.
Farm diversification has provided smallholders inrainfed lands with potential for improving welfare and pro-moting income security. While rice continues to be grown,other commodities, especially high-value crops, are increas-ingly being cultivated on the same piece of land to increaseproductivity and help boost income. Fruit trees such as cit-rus, mango, papaya, banana, etc., are established on the pe-riphery for food and for sale. A key and important compo-nent of farm diversification over the past years is animalraising. A carabao is almost always present for draft power.Smaller animals such as pigs and chickens are raised in smallnumbers for food, for sale, and for special occasions. In morerecent years, the establishment of on-farm aquaculture hasincreasingly been promoted.
Diversification in these environments, however, hasfaced problems. The most critical of these pertain to theneed for continued support, from both public and privateinstitutions, to the establishment of a good and effectiveextension, financial, and market system that would facili-tate their integration to the more progressive productionareas as well as to the nonfarm economy (www.sdnbd.org).
Objectives
This country monograph focuses on the animal componentof rice-based systems, primarily in rainfed areas. It aims tocharacterize the integrated development of rice and animalproduction by accomplishing the following more specificobjectives:
1. Describe the current status and prospects of produc-tion and demand of the rice and animal sectors in thecountry.
2. Identify various rice-animal systems and describetheir interactions.
Integrated crop-animal systems in the Philippines:current status and future prospectsGrace C. Cataquiz, Fermina T. Rivera, Guadalupe O. Redondo, Rowena G. Manalili, Mary Jane R. Nievera,and Mercedita A. Sombilla
3. Determine the factors that contribute to or impede thegrowth of integrated crop-animal systems (ICAS) inthe country.
4. Review government interventions, especially thosethat promote ICAS.
Profile of the crop and animal sectors
The country’s rice economyRice is the most dominant and important commodity inPhilippine agriculture. It contributes 16% to gross valueadded in agriculture, 3.5% to gross domestic product, and3.3% to gross national product. Its importance, however,relates more to its being the staple food of over 80% of thepopulation. Per capita consumption of rice has remainedalmost constant at about 100 kg per year over the last de-cade. The agricultural sector also employs 70% of the totallabor force that depends directly and indirectly on rice cul-tivation and marketing for its livelihood. About 44% of theincome of a Filipino family is spent on food and a quarter ofthat is spent on rice.
Despite this importance, however, sustaining its pro-duction growth to match demand and helping boost incomeamong rice farmers have increasingly become more diffi-cult (Fig. 1). Population has increased steadily at a much
��
��
�
�
�
�
�
?#�%�1 ����4)�$$���� 5 ?�.�$ ����4)�$$����5�
�
�
�
�
�
�
�
�
�
?#�%�1 ���=��?�.�$ ���
>�#���� ���� ���� ���� ���� ���� ���� ���� ���� ���� ���� ����
Fig. 1. Trend of population, rice production, and use, Philippines,1980-2001. Source: BAS (2003).
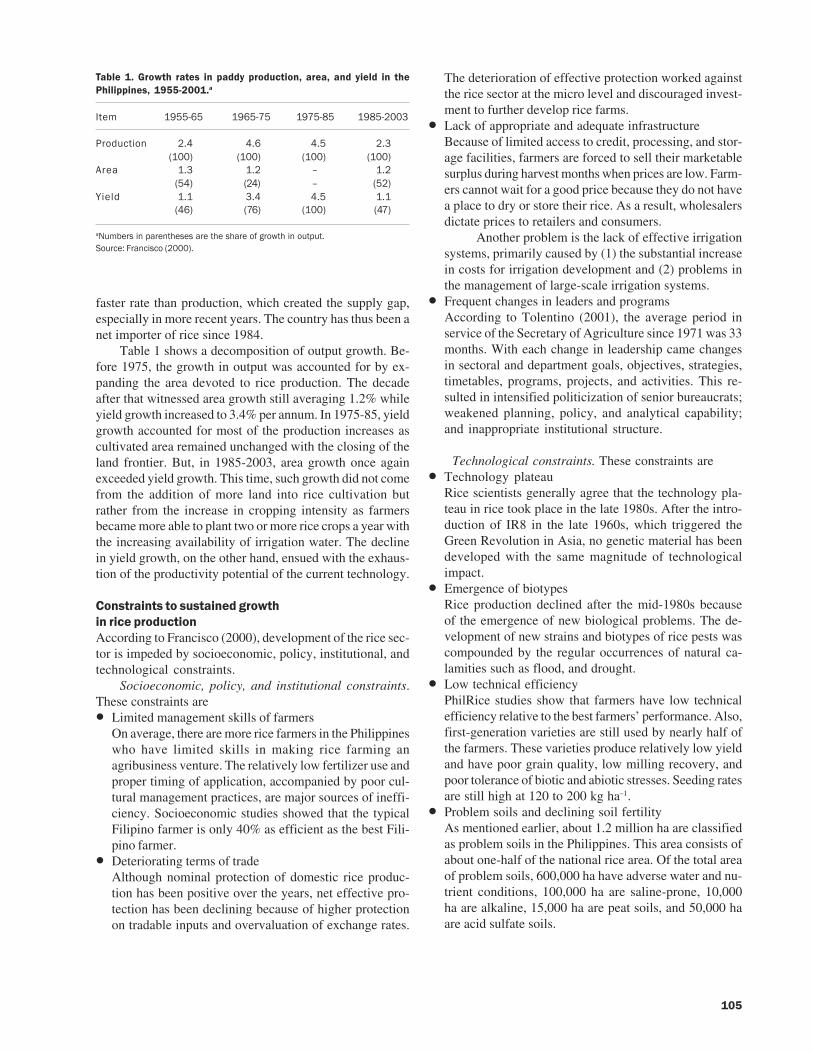
105
faster rate than production, which created the supply gap,especially in more recent years. The country has thus been anet importer of rice since 1984.
Table 1 shows a decomposition of output growth. Be-fore 1975, the growth in output was accounted for by ex-panding the area devoted to rice production. The decadeafter that witnessed area growth still averaging 1.2% whileyield growth increased to 3.4% per annum. In 1975-85, yieldgrowth accounted for most of the production increases ascultivated area remained unchanged with the closing of theland frontier. But, in 1985-2003, area growth once againexceeded yield growth. This time, such growth did not comefrom the addition of more land into rice cultivation butrather from the increase in cropping intensity as farmersbecame more able to plant two or more rice crops a year withthe increasing availability of irrigation water. The declinein yield growth, on the other hand, ensued with the exhaus-tion of the productivity potential of the current technology.
Constraints to sustained growthin rice productionAccording to Francisco (2000), development of the rice sec-tor is impeded by socioeconomic, policy, institutional, andtechnological constraints.
Socioeconomic, policy, and institutional constraints.These constraints are
• Limited management skills of farmersOn average, there are more rice farmers in the Philippineswho have limited skills in making rice farming anagribusiness venture. The relatively low fertilizer use andproper timing of application, accompanied by poor cul-tural management practices, are major sources of ineffi-ciency. Socioeconomic studies showed that the typicalFilipino farmer is only 40% as efficient as the best Fili-pino farmer.
• Deteriorating terms of tradeAlthough nominal protection of domestic rice produc-tion has been positive over the years, net effective pro-tection has been declining because of higher protectionon tradable inputs and overvaluation of exchange rates.
The deterioration of effective protection worked againstthe rice sector at the micro level and discouraged invest-ment to further develop rice farms.
• Lack of appropriate and adequate infrastructureBecause of limited access to credit, processing, and stor-age facilities, farmers are forced to sell their marketablesurplus during harvest months when prices are low. Farm-ers cannot wait for a good price because they do not havea place to dry or store their rice. As a result, wholesalersdictate prices to retailers and consumers.
Another problem is the lack of effective irrigationsystems, primarily caused by (1) the substantial increasein costs for irrigation development and (2) problems inthe management of large-scale irrigation systems.
• Frequent changes in leaders and programsAccording to Tolentino (2001), the average period inservice of the Secretary of Agriculture since 1971 was 33months. With each change in leadership came changesin sectoral and department goals, objectives, strategies,timetables, programs, projects, and activities. This re-sulted in intensified politicization of senior bureaucrats;weakened planning, policy, and analytical capability;and inappropriate institutional structure.
Technological constraints. These constraints are
• Technology plateauRice scientists generally agree that the technology pla-teau in rice took place in the late 1980s. After the intro-duction of IR8 in the late 1960s, which triggered theGreen Revolution in Asia, no genetic material has beendeveloped with the same magnitude of technologicalimpact.
• Emergence of biotypesRice production declined after the mid-1980s becauseof the emergence of new biological problems. The de-velopment of new strains and biotypes of rice pests wascompounded by the regular occurrences of natural ca-lamities such as flood, and drought.
• Low technical efficiencyPhilRice studies show that farmers have low technicalefficiency relative to the best farmers’ performance. Also,first-generation varieties are still used by nearly half ofthe farmers. These varieties produce relatively low yieldand have poor grain quality, low milling recovery, andpoor tolerance of biotic and abiotic stresses. Seeding ratesare still high at 120 to 200 kg ha–1.
• Problem soils and declining soil fertilityAs mentioned earlier, about 1.2 million ha are classifiedas problem soils in the Philippines. This area consists ofabout one-half of the national rice area. Of the total areaof problem soils, 600,000 ha have adverse water and nu-trient conditions, 100,000 ha are saline-prone, 10,000ha are alkaline, 15,000 ha are peat soils, and 50,000 haare acid sulfate soils.
Table 1. Growth rates in paddy production, area, and yield in thePhilippines, 1955-2001.a
Item 1955-65 1965-75 1975-85 1985-2003
Production 2.4 4.6 4.5 2.3(100) (100) (100) (100)
Area 1.3 1.2 – 1.2(54) (24) – (52)
Yield 1.1 3.4 4.5 1.1(46) (76) (100) (47)
aNumbers in parentheses are the share of growth in output.Source: Francisco (2000).
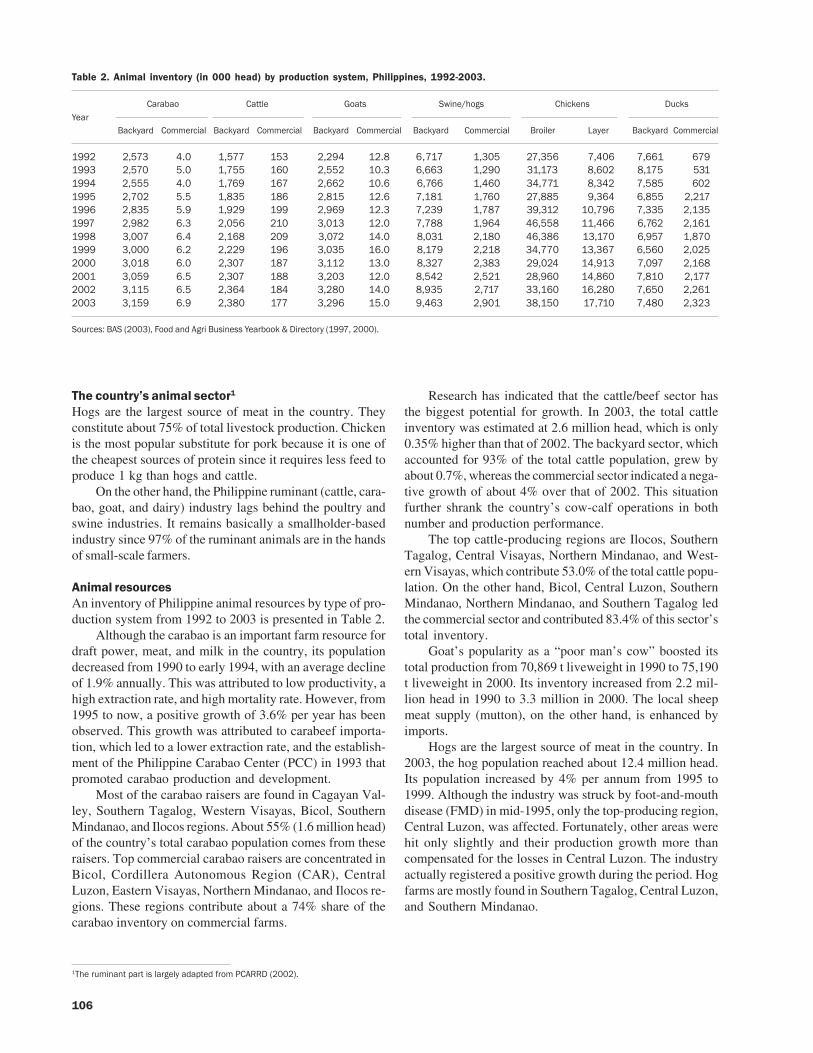
106
The country’s animal sector1
Hogs are the largest source of meat in the country. Theyconstitute about 75% of total livestock production. Chickenis the most popular substitute for pork because it is one ofthe cheapest sources of protein since it requires less feed toproduce 1 kg than hogs and cattle.
On the other hand, the Philippine ruminant (cattle, cara-bao, goat, and dairy) industry lags behind the poultry andswine industries. It remains basically a smallholder-basedindustry since 97% of the ruminant animals are in the handsof small-scale farmers.
Animal resourcesAn inventory of Philippine animal resources by type of pro-duction system from 1992 to 2003 is presented in Table 2.
Although the carabao is an important farm resource fordraft power, meat, and milk in the country, its populationdecreased from 1990 to early 1994, with an average declineof 1.9% annually. This was attributed to low productivity, ahigh extraction rate, and high mortality rate. However, from1995 to now, a positive growth of 3.6% per year has beenobserved. This growth was attributed to carabeef importa-tion, which led to a lower extraction rate, and the establish-ment of the Philippine Carabao Center (PCC) in 1993 thatpromoted carabao production and development.
Most of the carabao raisers are found in Cagayan Val-ley, Southern Tagalog, Western Visayas, Bicol, SouthernMindanao, and Ilocos regions. About 55% (1.6 million head)of the country’s total carabao population comes from theseraisers. Top commercial carabao raisers are concentrated inBicol, Cordillera Autonomous Region (CAR), CentralLuzon, Eastern Visayas, Northern Mindanao, and Ilocos re-gions. These regions contribute about a 74% share of thecarabao inventory on commercial farms.
Research has indicated that the cattle/beef sector hasthe biggest potential for growth. In 2003, the total cattleinventory was estimated at 2.6 million head, which is only0.35% higher than that of 2002. The backyard sector, whichaccounted for 93% of the total cattle population, grew byabout 0.7%, whereas the commercial sector indicated a nega-tive growth of about 4% over that of 2002. This situationfurther shrank the country’s cow-calf operations in bothnumber and production performance.
The top cattle-producing regions are Ilocos, SouthernTagalog, Central Visayas, Northern Mindanao, and West-ern Visayas, which contribute 53.0% of the total cattle popu-lation. On the other hand, Bicol, Central Luzon, SouthernMindanao, Northern Mindanao, and Southern Tagalog ledthe commercial sector and contributed 83.4% of this sector’stotal inventory.
Goat’s popularity as a “poor man’s cow” boosted itstotal production from 70,869 t liveweight in 1990 to 75,190t liveweight in 2000. Its inventory increased from 2.2 mil-lion head in 1990 to 3.3 million in 2000. The local sheepmeat supply (mutton), on the other hand, is enhanced byimports.
Hogs are the largest source of meat in the country. In2003, the hog population reached about 12.4 million head.Its population increased by 4% per annum from 1995 to1999. Although the industry was struck by foot-and-mouthdisease (FMD) in mid-1995, only the top-producing region,Central Luzon, was affected. Fortunately, other areas werehit only slightly and their production growth more thancompensated for the losses in Central Luzon. The industryactually registered a positive growth during the period. Hogfarms are mostly found in Southern Tagalog, Central Luzon,and Southern Mindanao.
1The ruminant part is largely adapted from PCARRD (2002).
Table 2. Animal inventory (in 000 head) by production system, Philippines, 1992-2003.
Carabao Cattle Goats Swine/hogs Chickens DucksYear
Backyard Commercial Backyard Commercial Backyard Commercial Backyard Commercial Broiler Layer Backyard Commercial
1992 2,573 4.0 1,577 153 2,294 12.8 6,717 1,305 27,356 7,406 7,661 6791993 2,570 5.0 1,755 160 2,552 10.3 6,663 1,290 31,173 8,602 8,175 5311994 2,555 4.0 1,769 167 2,662 10.6 6,766 1,460 34,771 8,342 7,585 6021995 2,702 5.5 1,835 186 2,815 12.6 7,181 1,760 27,885 9,364 6,855 2,2171996 2,835 5.9 1,929 199 2,969 12.3 7,239 1,787 39,312 10,796 7,335 2,1351997 2,982 6.3 2,056 210 3,013 12.0 7,788 1,964 46,558 11,466 6,762 2,1611998 3,007 6.4 2,168 209 3,072 14.0 8,031 2,180 46,386 13,170 6,957 1,8701999 3,000 6.2 2,229 196 3,035 16.0 8,179 2,218 34,770 13,367 6,560 2,0252000 3,018 6.0 2,307 187 3,112 13.0 8,327 2,383 29,024 14,913 7,097 2,1682001 3,059 6.5 2,307 188 3,203 12.0 8,542 2,521 28,960 14,860 7,810 2,1772002 3,115 6.5 2,364 184 3,280 14.0 8,935 2,717 33,160 16,280 7,650 2,2612003 3,159 6.9 2,380 177 3,296 15.0 9,463 2,901 38,150 17,710 7,480 2,323
Sources: BAS (2003), Food and Agri Business Yearbook & Directory (1997, 2000).

107
The chicken inventory grew by an average of 6% perannum from 1995 to 1999. The broiler chicken inventorysoared in 1996 because of the outbreak of FMD in the hogsector. Demand for pork slumped while buyers shifted tochicken and beef. Chicken production exhibited huge in-creases as integrators pursued stock expansions. Chickenproduction went up by almost 20% during the year. How-ever, when the hog industry recovered from FMD, the de-mand for chicken decelerated, resulting in an oversupplyand depressed prices for a long time.
The duck population also increased from 8.3 millionbirds in 1992 to 9.8 million in 2003. Duck production ispredominantly backyard.
Animal production systems
There are two types of animal production systems: back-yard or small-scale and commercial. The first one is pre-dominant, in which about 79% of the nonruminant animalinventory is classified as belonging to the backyard type.The number is 99% among the ruminant animal inventory,especially for carabao and goats, which are integral parts ofsmallholder farming systems. In 2000, 99.8% of the totalcarabao population of about 3.0 million was raised in back-yards, whereas the commercial sector contributed only 0.2%(Table 3). Commercial cattle production is bigger, coveringabout 7% of the total inventory. Among the nonruminants,chicken raising is the most commercialized, with 41% ofthe total inventory.
Demand and supply trends
Because of the increase in human population and improve-ment in income that enhanced consumers’ buying capacity,the demand for meat has grown in more recent years. During1980-95, total meat consumption increased by 41%. Con-sumption of beef and carabeef exhibited a much bigger in-crease (72%) during the same period.
Demand for milk and milk products equally increasedsuch that the gap between local milk production and actualdemand widened significantly. Local production amounted
to less than 1% of the total requirements. Milk and dairyproduct imports increased to fill this increasing gap. Thevolume of milk imports increased by 26.3% from 1992 to1998.
Beef cattleBeef consumption is income-responsive but price-inelas-tic. From an average of 2 kg capita–1 year–1, beef intake in-creased to 2.47 kg. However, this figure is still way belowthe 4.5 kg year–1 Recommended Dietary Allowance (RDA)established by the Food and Nutrition Research Institute(FNRI).
For the past ten years, demand for beef has graduallyincreased. To achieve such growth, at least 500,000 head ofcattle must be slaughtered annually. In 1999, about 24% ofthe total supply of 3.3 million head was slaughtered formeat. This was an increase of about 3.7% over the numberslaughtered in 1998.
Beef imports supplemented domestic production. Beefimports in 1995 to 1997 increased annually by 23%. Thevolume and value of beef imports increased by 38% and24%, respectively, from 1998 to 1999. In 2000, total beefimports were 43,900 t, amounting to $51.2 million (f.o.b.price). Beef products were mostly imported by hotels andrestaurants. From 1996 to 1998, the United States (55%),Australia (32%), India (5%), and New Zealand (3%) werethe major sources of imported bone-in beef, while othercountries shared 4%. For boneless imports, the major sourceswere Australia (51%), India (25%), New Zealand (7%), andthe U.S. (4%). The other countries shared 13%.
CarabaoThe average volume of local carabeef production from 1992to 1999 was 108,400 t. Total carabeef production in 2000reached 124,000 t, or an increase of 4.2% from the 1999figures. On average, 220,423 head, or 8% of the population,are slaughtered annually.
Carabao is an indigenous livestock resource whoseimportance in farming activities cannot be denied. The Phil-ippines has around only 3.2 million head. Local carabaoraisers could not possibly meet the country’s demand for
Table 3. Backyard and commercial livestock farms in the Philippines. Adapted from Rivera (2002).
Backyard Commercial TotalAnimal species
Inventory Share (%) Inventory Share (%) Inventory Share (%)
RuminantsCarabao 3,115,444 99.8 6,582 0.2 3,122,026 100Cattle 2,364,133 92.8 183,686 7.2 2,547,819 100Goats 3,280,139 99.6 13,761 0.4 3,293,900 100
NonruminantsHogs 8,935,400 76.7 2,717,300 23.3 11,652,700 100Chickens 75,889,231 58.6 53,705,367 41.4 129,594,598 100Ducks 7,650,162 77.2 2,261,107 22.8 9,911,269 100
108
carabeef, so we need to import it. Importation of buffalomeat started in 1993 at 436 t; in 1999, imports were 34,430t. Massive importation grew by 7,796.7% from 1993 to 1999.This increase was due to the increase in demand for carabeefbrought about by the increase in human population andincreasing buying capacity. In 2000, the government al-lowed importation of about 39,800 t of carabeef. This addsto our local supply of 71,600 t to meet our requirement of111,400 t. The demand for carabeef was also due to theincrease in the meat-processing sector, which consumesmuch of our locally produced and imported meat. Most ofthe carabeef produced by local raisers was sold to the wetmarkets, whereas that imported was taken directly to theprocessing plants for corned beef, sausages, burgers, andother processed meat products.
The increasing trend of replacing carabao with smalltractors has brought about the use of this animal as food.The rate of animal substitution by machines is 15–35% onirrigated farms and 3–5% in rainfed areas.
Small ruminantsDomestic per capita consumption of goat carcass increasedfrom 0.32 kg in 1995 to 0.33 kg in 1999. No increase hasbeen reported for the last seven years.
Hogs/swineIn 1995, hog raisers had a good start. There was an inven-tory buildup on both backyard and commercial farms. Un-fortunately, FMD struck in 1996. Consumers shied awayfrom pork, which resulted in a decrease in sales, of bothfresh meat and processed products. But when the diseasewas controlled, the demand for pork bounced back. How-ever, the supply was low because of FMD mortality and thedeliberate depopulation of farms to avoid losses from lowprices. This situation pushed pork prices up to a record high.
The country exports minimal amounts of pork but hasregularly imported the commodity. During the FMD scare,imports bloated by more than 800% in terms of value(US$7.6 million) as import restrictions were lifted.
ChickensChicken, which is the closest substitute for pork, enjoys atremendous boost whenever pork faces problems like theFMD outbreak in 1996. As the meat market normalizes, thechicken industry suffers problems of oversupply and de-pressed prices. The situation worsened with the entry ofimported chicken cuts in 1998. This entry of cheap chickentechnically smuggled in from the duty-free zones of Clarkreportedly hurt the industry in 1999.
The Philippines does not export chicken meat. Importscome mainly from the United States. The big integrators arethe main players in the industry. These companies use acontract growing scheme and thus have a direct hand in thecommercial sector. They are also the main sources of dressedchicken in urban areas, selling not only through upscalesupermarkets but also through wet markets, which have beenthe traditional outlets of backyard raisers (Food and Agri
Business Yearbook & Directory 2000).The integrators include Swift Foods Inc., Vitarich Cor-
poration, San Miguel Foods, Inc., Pure Foods Corp., andTysons. These integrators produce approximately 90% ofthe chicken supply. The balance comes from other commer-cial farms and backyard raisers. These integrators are alsoengaged in other product lines such as feeds, flour, and con-sumer products, including beverages and packaging mate-rials. Other product lines serve as support to poultry pro-duction.
DucksThe production of duck meat and eggs is mostly done onbackyard farms, as ducks are easier to care for than chick-ens. Furthermore, ducks generally use fiber more efficientlythan chickens; thus, most agricultural wastes and by-prod-ucts (e.g., palay and rice bran) make more suitable andcheaper feed alternatives. Recently, commercial feeds havealso become available.
Commercial farms are concentrated in Central Luzon,where duck feed (rice bran) is abundant. On the other hand,duck raisers mainly for egg production are concentrated inPateros and Laguna.
Constraints to development of the animal sector
Farmers are usually more concerned about activities relatedto crop production, particularly to rice, which is the staplefood, and high-value crops that help increase income. Sinceanimal production is primarily backyard, farmers have paidlittle attention to improved technologies that help increasefeed efficiency and animal productivity. Support programsand projects on improving animal management from gov-ernment as well as from private institutions are not as ampleas with crops. Technology development likewise is not asup to date.
The following sections point out several constraints.
Beef cattle• Low breeding base
• Absence of an organized beef cattle development andbreeding program
• Poor-quality feed
• Nonadoption of improved husbandry practices andforage technologies
• Unavailability of ranching areas, including squatterencroachment and land tenure problems in grazingareas
• Inefficient marketing system and structure
• Inadequate farm-to-market roads and processing fa-cilities
• Inadequate veterinary and extension services
Carabao• Biological characteristics of carabao. Inherently
longer gestation period than any domestic farm rumi-nants, average gestation of which is 310–315 days.

109
Given a postpartum service period of 60–90 days un-der optimum conditions, production of one calf peryear is not likely achievable even under the best con-ditions.
• Socioeconomic constraints. Carabao in the Phil-ippines are raised on smallholder farms. If the cara-bao is to be a vital economic unit for increasingfamily income, new approaches, strategies, andprograms should be developed.
• Import liberalization. Immediate and long-termeffects of carabeef importation should be analyzed.More efforts should be made to make local pro-duction more competitive. Likewise, the milk feed-ing program has to be institutionalized and sup-port to milk producers should be available.
• Credit policy. The major constraint to productionis capital. Hence, credit windows for smallholderfarmers should be created with affordable interestrates and accessible repayment schemes. This isalso true for other animals such as cattle, swine,and even chickens and for other crops such as rice,maize, and other vegetables for which starting capi-tal is very high.
Small ruminants• Attempts to raise goats commercially failed because
of the lack of technology and understanding of goatproduction management.
• High mortality rates in goats because of pneumoniaand other diseases such as hoof and mouth.
Swine/hogs• Local producers are not competitive with imports be-
cause of the low feed conversion ratio and small aver-age size of the litter of locally grown hogs.
• Costs of feed are relatively expensive because of thehigh price of maize, the principal cost component.
• Increased availability of pork substitutes due to tradeliberalization.
• Lack of good-quality slaughterhouses and storage andtransport facilities.
Chickens• The entry of cheaper chicken and chicken meat sub-
stitutes due to import liberalization.
• High cost of production because of high price ofmaize.
• Locally grown chicken is not competitive with im-ported chicken because the production costs of for-eign farms are far lower and their operations are moreefficient.
Ducks• Depressed prices of eggs in the local market and the
presence of imported substitutes, i.e., powdered eggs.Powdered eggs are imported eggs mainly from the
U.S., used by mayonnaise manufacturers and bakers,especially in making cakes. From 1990 to 2000, im-ports grew by 26%, amounting to 374 tons ($799,786in 2001).
Socioeconomic factors that influence the develop-ment of the crop and animal sectors
Several factors affect the trends in supply and demand ofboth crops and animals. The key ones are changes in in-come and in the number and structure of the population.Preferences for certain food types because of taste and ver-satility in their cooking preparation have likewise influ-enced production growth. Food requirements vary depend-ing on the rate at which income rises and various factorsthat influence the population structure such as decliningmortality, high fertility, and migration to urban areas(Hossain and Sombilla 1999).
The Philippine annual population growth rate is one ofthe highest in Southeast Asia (2.3%). This rate has remainedalmost constant from 1990 to 2000, while that of Singapore(1.0%) and Thailand (1.4%) continued to slow down. Atthis rate of growth, the Philippine population of 84 millionis bound to double by 2030. High population growth rate,continuing poverty and malnutrition, and unabated envi-ronmental degradation are making it difficult to balancecrop supply and demand (Royandoyan, 2002). Because ofthe seeming growth of poverty incidence, per capita intakeof rice has remained constant at about 100 kg per year. Thistrend is unlike those in other developing countries in South-east Asia such as Thailand, where per capita intake of ricehas been showing a declining trend. There is a need to findways to grow enough rice for the expanding population inthe coming decades, sustain higher rice production, andmaintain the natural resource base and protect the environ-ment. Since the most productive lands have been exhausted,the only way to progress is to achieve better resource use toincrease production per unit of land, increase the creativityof human resources, and put marginal rainfed lands intohigh-tech but low-input conservation agriculture.
To meet these challenges, the government has supportedprograms like hybrid and biotech rice. This new order ofproduction in rice gives hope to meeting the demands ofthe burgeoning population in the face of declining landdevoted to rice farming.
Growth in meat demand, on the other hand, has beenaffected not only by population growth but also by im-proved income and changing lifestyles and eating habits,especially when people move to urban areas. The rate ofurban migration has been increasing over time such that theurban population now makes up 48.05% of the total popu-lation. This growth in meat demand created incentives forthe emergence and proliferation of commercial feedlot fat-tening. Such operations, however, heavily depend on theimportation of feeder stocks. Those for cattle have comemostly from Australia (Fig. 2). From 1990 to 2000, feeder
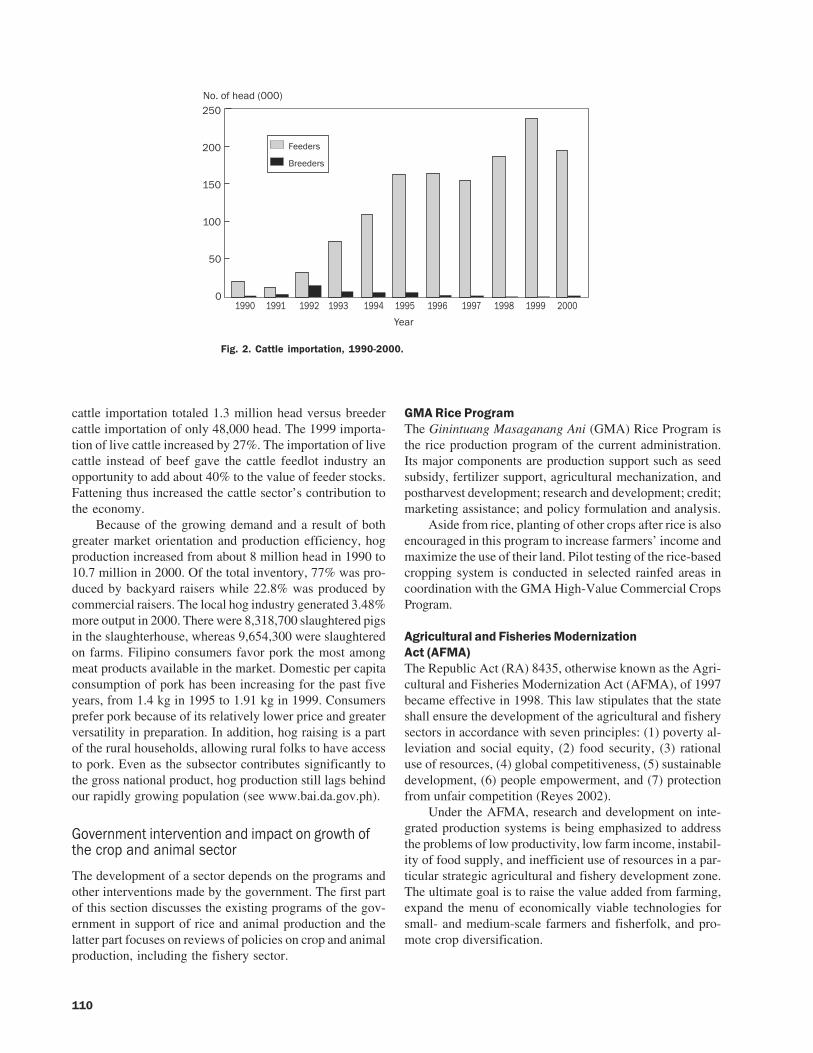
110
cattle importation totaled 1.3 million head versus breedercattle importation of only 48,000 head. The 1999 importa-tion of live cattle increased by 27%. The importation of livecattle instead of beef gave the cattle feedlot industry anopportunity to add about 40% to the value of feeder stocks.Fattening thus increased the cattle sector’s contribution tothe economy.
Because of the growing demand and a result of bothgreater market orientation and production efficiency, hogproduction increased from about 8 million head in 1990 to10.7 million in 2000. Of the total inventory, 77% was pro-duced by backyard raisers while 22.8% was produced bycommercial raisers. The local hog industry generated 3.48%more output in 2000. There were 8,318,700 slaughtered pigsin the slaughterhouse, whereas 9,654,300 were slaughteredon farms. Filipino consumers favor pork the most amongmeat products available in the market. Domestic per capitaconsumption of pork has been increasing for the past fiveyears, from 1.4 kg in 1995 to 1.91 kg in 1999. Consumersprefer pork because of its relatively lower price and greaterversatility in preparation. In addition, hog raising is a partof the rural households, allowing rural folks to have accessto pork. Even as the subsector contributes significantly tothe gross national product, hog production still lags behindour rapidly growing population (see www.bai.da.gov.ph).
Government intervention and impact on growth ofthe crop and animal sector
The development of a sector depends on the programs andother interventions made by the government. The first partof this section discusses the existing programs of the gov-ernment in support of rice and animal production and thelatter part focuses on reviews of policies on crop and animalproduction, including the fishery sector.
GMA Rice ProgramThe Ginintuang Masaganang Ani (GMA) Rice Program isthe rice production program of the current administration.Its major components are production support such as seedsubsidy, fertilizer support, agricultural mechanization, andpostharvest development; research and development; credit;marketing assistance; and policy formulation and analysis.
Aside from rice, planting of other crops after rice is alsoencouraged in this program to increase farmers’ income andmaximize the use of their land. Pilot testing of the rice-basedcropping system is conducted in selected rainfed areas incoordination with the GMA High-Value Commercial CropsProgram.
Agricultural and Fisheries ModernizationAct (AFMA)The Republic Act (RA) 8435, otherwise known as the Agri-cultural and Fisheries Modernization Act (AFMA), of 1997became effective in 1998. This law stipulates that the stateshall ensure the development of the agricultural and fisherysectors in accordance with seven principles: (1) poverty al-leviation and social equity, (2) food security, (3) rationaluse of resources, (4) global competitiveness, (5) sustainabledevelopment, (6) people empowerment, and (7) protectionfrom unfair competition (Reyes 2002).
Under the AFMA, research and development on inte-grated production systems is being emphasized to addressthe problems of low productivity, low farm income, instabil-ity of food supply, and inefficient use of resources in a par-ticular strategic agricultural and fishery development zone.The ultimate goal is to raise the value added from farming,expand the menu of economically viable technologies forsmall- and medium-scale farmers and fisherfolk, and pro-mote crop diversification.
Fig. 2. Cattle importation, 1990-2000.
����
>�#
���� ���� ���� ���� ���� ���� ���� ���� ���� ����
���
���
���
���
��
�
��6��,���%�4���5
;��%�#�
�#��%�#�

111
Policy environment for rice, animal,and fish sectors2
In the Philippines, a wide variety of intervention policieshad been introduced. Consequently, such measures had beenknown to alter directly and indirectly the price mechanismand incentive structure operating within the rice sector.Among these are sectoral and macroeconomic policies suchas exchange rate, tariffs, subsidies, incentives, transport, in-frastructure, and irrigation. Existing policies are summa-rized here.
Trade policies. Before the ratification of the GeneralAgreement on Tariffs and Trade–World Trade Organization(GATT-WTO), restrictive import quotas historically pro-tected rice production. As the mandated agency to handleimportation, the National Food Authority (NFA) has his-torically determined the country’s programmed rice require-ment. Thus, any imported rice that will penetrate the localmarket will be subjected to an intense quota requirement.However, with the ratification of GATT-WTO in 1994, thePhilippines agreed to transform its rice quota levels into itstariff equivalent rates.
As a commodity under the Green Box measure, the coun-try was mandated to lower its tariff levels to 40% by 2004.At present, the tariff level for rice is 50% and the NFA is theonly mandated institution to import the required amount ofrice. This will put local producers at a disadvantage be-cause of the large disparity in the price of locally producedand imported rice.
Rice production subsidies. A major feature of rice pro-duction in the Philippines during the 1970s up to the mid-1990s was the prevalence of subsidies on material inputsand credit. While this type of intervention had increasedthe use of modern rice varieties and techniques, recent farmproduction trends have been declining because of the con-straints posed by deteriorating technological change.
The Grain Enhancement Program (GPEP), launched in1993, provided for subsidized prices of seed and fertilizer.Although yield levels have increased substantially, theGPEP failed to satisfy the country’s domestic rice needs,thus prompting program management to shift from subsidy-to credit-based intervention systems. As a result, the GintongAni for Rice program was launched. It is a culmination ofthe lessons learned from the various GPEPs. Its main featureincludes accessibility to high-quality seed and fertilizerthrough credit.
At present, the new rice program of the government isthe Ginintuang Masaganang Ani (GMA) program. Amongits features is the availment of trade and fiscal incentives bythe private sector to invest in seed production andpostharvest equipment, which is intended to increase farm-ers’ profits. It also aims to promote high-quality seeds andcost-effective technologies such as the leaf color chart, bal-anced fertilization strategy, integrated pest management,synchronous planting, mechanization, and others.
As a signatory to the GATT-WTO, the Philippines re-moved all forms of distortionary subsidies. Although thecountry has identified rice as part of the Green Box com-modities, it has not yet availed of the Aggregate Measure ofSupport (AMS) for rice. The AMS is a form of assistance andis legitimate within the GATT-WTO accords.
The use of modern technologies such as high-qualityseeds, proper fertilizer, and pest management helped therice industry to perform well in increasing its productivity,and production has steadily increased. But still, the Philip-pines has remained a net importer of rice. This is primarilyattributed to the rapid increase in the country’s population.
Irrigation development. The trend of irrigation invest-ments during the 1970s up to the early ’80s substantiallyincreased, peaking in 1975, when the program accountedfor a 48% share of total public expenditures. Before the1990s, yearly irrigation expenditures accounted for approxi-mately 20% of total public expenditures and 40% ofagriculture’s expenditures. By the start of the 1990s, irriga-tion expenditures relative to agriculture fell to 10%. Conse-quently, the number of irrigated areas declined from 13% in1975 to 1.42% in the 1990s.
Transportation infrastructure. The transportation sys-tem in the Philippines remains inadequate and inefficient.Research indicated that road densities in prime agriculturalareas have been typically lower than those of roads in urbanareas. The lower road expenditure levels in rural agricul-tural areas reflect the historical policy bias in favor of urbancenters. This has caused farmers to be marginalized becauseof the inefficient transmission of prices from the farm to themarket and vice versa. This has primarily kept farmers frombeing integrated to the market and nonfarm economy.
Marketing, price determination, and rice reserves. Therice market is one where prices behave asymmetrically:changes in the retail rice price do not immediately influ-ence the price at the farm gate and vice versa. One reason forthis behavior has been stated earlier: the state of the country’sinfrastructure, particularly transportation conditions. An-other factor relates to the presence of middlemen who addcost to the marketing of palay (rough rice) and the inappro-priate government policies that distort rather than strengthenthe market environment.
One government policy that has been subject to criti-cal scrutiny is NFA’s rice procurement program, suppos-edly to maintain sufficient rice reserves to intervene insmoothing prices in times of market abnormalities. How-ever, because of the inefficiencies in a public-sector institu-tion, NFA procured only less than 6% annually of the totalrice production in 1988-99. NFA’s highest procurement leveloccurred in 1995, with a level equal to 5.74%, while thelowest occurred in 1995 (0.07%). With this level of pro-curement, it comes as no surprise that, for the past severalyears, NFA has been unsuccessful in influencing the pricesof palay.
2Adapted from work of Rivera (2002).

112
Industrial protection system and macroeconomic poli-cies and exchange rate. Another set of policies that havegained economic importance are those regulating macro-economic variables such as the exchange rate, monetaryand fiscal policies, as well as policies that influence theoverall trade regime. Such policies have important theoreti-cal implications. However, empirical evidence has revealeda significant and differential impact with regard to the in-centive structure of most developing economies. Estimatesshowed that distortions emanating from the exchange ratepolicy had large taxing effects.
In the Philippines, the pursuit of an import-led strategyencouraged the growth of high and restrictive tariff andnontariff barriers. The imposition of these restrictive tradeinstruments appreciated the peso. Uncoordinated macroeco-nomic policies in the past due to balance of payments prob-lems led to the further worsening of the peso appreciation,resulting in an exchange rate misalignment. The rate of de-viation of the actual exchange rate from its long-run equi-librium levels is called the exchange rate overvaluation.
Time-series estimates reveal that, over the past 30 yearsbefore the currency devaluation of 1997, the exchange ratewas overvalued from 24% in 1961 to 20% in 1996. This,however, exacerbated the disprotection received by the ag-ricultural sector and likewise penalized its most importantcrop, rice.
However, with the occurrence of the 1997 devaluation,it is expected that the magnitude of penalty in rice willdissipate, giving the commodity some leeway of protec-tion.
Agrarian reform. R.A 6657, known as the Comprehen-sive Agrarian Reform Program (CARP), which has been re-cently amended to include not only rice land but other ag-ricultural land as well, is benefiting tenants and all landlessworkers to become small landowner-producers. This lawcovers (1) land tenure improvement, (2) program beneficia-ries’ development, and (3) agrarian justice. Support servicesbeing provided to farmers-beneficiaries and affected land-owners intended to develop their agricultural enterprisesare research and extension, irrigation and postharvest fa-cilities, marketing assistance and farm-to-market roads, otherinfrastructure development and public works for barangaysite improvement, technical assistance, education and train-ing, financial assistance, and strengthening farmers’ coop-eratives.
Under this law, beneficiaries are being provided withpotable water and power resources. In Nueva Ecija, wherethe land reform program was inaugurated, the project launchincluded the linking of livestock development with cropproduction, the promotion of the area as an Agro-IndustrialDevelopment Area (AIDA), and piloting of crop-animal in-tegration among the low-income farmer-beneficiaries in de-pressed barangays under the Small Low Income Munici-palities (SLIM) and the Agrarian Reform Communities(ARCs) Programs. Funding for animal integration came fromthe Asian Development Bank (ADB), World Bank (WB),and Japan Bank International Corporation (JBIC).
Livestock and poultry development programsThe important actions that made up the livestock and poul-try program and policy environment from 1930 to the presentare presented and discussed here by relevant period.
1930-70Animal dispersion program. In the 1930s to 1960, the live-stock dispersal program took place, which included impor-tation of cattle and the purchase of local stocks for breedingpurposes. Some 4,856 head of cattle were dispersed duringthe program cycle, which ended in 1973.
The “piggy bank in the backyard” was also introducedduring this period. The Bureau of Animal Industry (BAI)provided piglets to recipients who enrolled in the program.
Philippine livestock promotion fund. This fund was usedfor the genetic improvement of livestock and distributionof improved breeds of animals; establishment, operation,and maintenance of stock farms, breeding stations, andslaughterhouses; manufacture of biological products; andresearch. Funds came from slaughter fees.
Tariff and customs law. The schedule of tariffs on live-stock products was 70% for poultry meat, 100% for eggs,15% for other meat, 60% for live poultry, and 0% for otherlive animals. Revenues generated were used to encouragelocal breeding of superior stocks and to conserve foreignexchange.
Genetic improvement. This involved the introductionof frozen semen and embryos of purebred animals, a muchcheaper method of importing exotic genetic material.
1970-80Livestock rehabilitation. The government initiated the “Op-eration Animal Rehabilitation Program,” which includedthe distribution of carabao for draft; breeding of piglets,goats, and boars in hog-raising areas; breeding of chicksamong poultry raisers; and the production of feeds andfeedstuffs for animals.
Bureau of Animal Industry regulations. The govern-ment regulated livestock and livestock product trade throughits licensing power along with the sole right to import liveanimals and meat products.
Bakahang barangay. A special credit program for back-yard cattle raisers was launched in 1977. This is a super-vised credit program designed to support small cattle rais-ers. It also aimed to transform every farm household into abackyard cattle feedlot and small cow-calf operator inte-grating crops, livestock, fish, and organic recycling into thefarming system.
1980-90The most dominant policies for livestock in the 1980s and’90s were the Comprehensive Agrarian Reform on Live-stock (CARL), the General Agreement on Tariffs and Trade(GATT), and the Medium-Term Livestock DevelopmentProgram (MTLDP). These programs targeted social equity,income enhancement and profitability of livestock farmers,global competitiveness, and sustainability.
113
Open market. Under GATT, the Philippines agreed to(1) convert all quantitative restrictions imposed on agricul-ture into tariffs, (2) reduce tariffs on agriculture, (3) reducedomestic subsidies, (4) reduce export subsidies, and (5) har-monize sanitary and phytosanitary measures.
Under this arrangement, small-farmer beneficiaries un-der CARP cannot compete with farm producers in othercountries who are mostly engaged in large-scale operations,enjoy government subsidies, use modern technologies, andsell their products cheaply, including livestock products.
Agricultural tariffication. The agricultural tarifficationact converted all quantitative restrictions on agriculturalproducts into tariffs and created the Agricultural Competi-tiveness Enhancement Fund; it also repealed a sectionalprovision of the Magna Carta of small farmers (RA 7607).
The Philippines has a slim chance of survival underthis arrangement as its crop, animal, and fish productionsystems use less advanced technologies and costly inputs.Raw materials for livestock feed are still imported. Lately,cheap meat products are being smuggled into the countryunder uncontrolled procedures; this can destroy the localanimal industry.
Executive Order 288 (1995). This provided a two-timetariff structure of 3% and 10% for raw materials and finishedproducts. Starting 1 January 2004, a uniform rate of 5% advalorem on the same articles will be enforced. ExecutiveOrder No. 313 (1996) set the in-quota and out-quota tariffrate for agricultural commodities, including livestock, poul-try, and other meat products.
Development plan. The Medium-Term Livestock De-velopment Plan (MTLDP), also known as the Gintong AniLivestock, lays the foundation for a productive, efficient,economic, and sustainable livestock and poultry industry.The gains in the livestock sector are ensured to be shared bysmall- and medium-scale livestock farmers.
National Dairy Administration (NDA). The NDA, cre-ated by R.A. 7884, became effective on 12 March 1995. Itenvisions a globally competitive dairy industry anchoredon an expanded base of empowered producers and proces-sors who operate sustainable cooperative dairy enterprises.
Fisheries policies. A total of 685 laws/policies, rules,and regulations on fisheries that emanated from the Officeof the President, senate/congress, and national governmentagencies were formulated, an average of 11 per year. Bysource of policy initiatives, the record shows that 352 (52%)came from government agencies such as the Bureau of Fish-eries and Aquatic Resources; 324 (47%) came from the De-partment of Environment and Natural Resources; 24 (3%)from the Central Bank, Philippine Coast Guard, and Philip-pines Ports Authority; and 14 (1.2%) from the Laguna LakeDevelopment Authority. About 211 (31%) came from theOffice of the President and 112 (17%) were enacted by thesenate/congress.
A majority focused on interventions to avert illegalfishing activities: 198 (29%); amending/modifying fisher-ies laws, 154 (23%); converting/creating schools of fisher-ies, 81 (11%); reorganizing/creating fisheries agencies/com-
mittees, 54 (8%); support services, 51 (7%); trade, 33 (5%);agrarian reform and fisheries association, 3 (0.4%) and 2(0.3%), respectively. Other areas of concern numbered 33(5%).
Sixteen studies were conducted on the implementationof fishery laws/policies, rules, and regulations. It was foundthat 11 of these studies reported that efforts to implementexisting policies/laws, rules, and regulations were ratherweak. Among the reasons given for this were (1) bribery andlack of political will, (2) laxity in enforcing the laws/poli-cies, rules, and regulations, (3) low compliance/poor en-forcement of laws and policies, (4) strict implementationnot achieved, (5) enforcement alone was not enough, and(6) there was no law/policy/ordinance to implement. Unfor-tunately, these deterring reasons are true for the fisheriessector and for all other sectors, in both agriculture andnonagriculture.
The potential of ICAS in rice-farming ecosystems, es-pecially in rainfed rice lands, is greatly influenced by gov-ernment policies affecting the rice, animal, and fish sector,and especially crop-animal/fish mixed livelihood ventures.Implementation of ICAS as a sustainable development strat-egy involves negotiations among the stakeholders involvedin the three development processes: community and farmhousehold development with the local government andstakeholders playing lead roles; lowland rice farmers, re-searchers, extension workers, entrepreneurs, government andnongovernment organizations, and consumers; and charac-terizing and understanding rainfed rice lands as a basis fortechnology design, improvement, innovation, and change.
ICAS typology in rice-based farming systems
Types of ICAS and extent of coverageThe dominant cropping pattern in the Philippines is shownin Table 4. Common crops grown are rice and maize, le-gumes, and vegetables. But only a few farmers grow fodderfor animals although this is a key component, particularlyin rainfed areas and hilly lands. Animals that are almostalways raised are carabao, cattle, goats, pigs, chickens, andducks. In some areas, sheep could be seen on farms. Fish-ponds that grow mainly tilapia are becoming increasinglyadopted.
The major producers of animals such as cattle, carabao,goats, chickens, and ducks are in regions I, III, VI, and CAR.It is in the CAR where interactions between crops and ani-mals are still strong.
It can be noted that, as with farms in other developingcountries, diversification has been widely practiced in thePhilippines. The extent of diversification among rice-basedfarms is further analyzed using data collected from two prov-inces, Nueva Ecija and Samar. Respondents were those whoplanted palay during the wet season and were raising ani-mals such as carabao, cattle, pigs, chickens, goats, and/orducks during the survey.
In Nueva Ecija, an equal percentage of rice-rice withanimals and rice-nonrice crop with animals was reported by

114
29% of the sample respondents in the town of Lupao. Thiswas followed by 18% of the respondents reporting rice-fal-low with animals. In Talugtug, 44% reported that they prac-ticed rice-rice with animals, followed by 42% with rice-fallow with animals.
In northern Samar, the most prevalent cropping patternwas rice-rice with animals. Only one respondent each prac-ticed rice-fallow and had no animals and rice-fallow withanimals. For San Roque, rice-rice with animals is practicedby 39% of the respondents, followed by 38% using rice-fallow with animals and 15% practicing rice-nonrice cropwith animals.
Profitability analysis of ICAS showed that animal pro-duction plays a big role in augmenting the income of ricefarmers. Sales from large animals could be a source of capi-tal for rice and other crop production; can finance otherhousehold expenditures such as schooling of children; canprovide basic needs such as clothing, electricity, and otheremergency expenses that the farmer’s family might face;and can be a source of food security for the family. Smallanimals such as chickens and ducks provide meat and eggsand goats provide milk. Animal by-products are also usedin crop production as fertilizer and crop by-products serveas feed in animal production.
Aside from rice farming, household respondents’ sourcesof additional income are from other agricultural activities:growing vegetables, root crops, fruits, or trees in homesteadareas; growing fish in ponds; and collecting nipa leavesand bamboo.
Crop-animal interactionsParis (1992), summarizing the results of a rice-based crop-livestock farming systems research activity in the Philip-pines and other Asian countries, enumerated crop-animalinteractions as follows:
1. Use of animal power in crop production, transporta-tion, and processing; and use of crop by-products
(straw, bran, and residues) by livestock and poultry.2. Use of animal manure to improve land productivity
and cut input costs.3. Minimizing production risks by combining crop and
livestock enterprises.4. Small-farm household consumption of milk, meat, and
eggs, thus substantially improving human nutritionand health.
5. Sale of livestock and poultry and their products toimprove and stabilize farm income for the purchase ofcash inputs and to offset household expenditures suchas school fees, social obligations, and health care.
The main issue in crop-animal interactions is the lackof methodology for measuring the benefits derived fromthem. It has been mentioned that there is a paucity of infor-mation on the socioeconomic benefits of crop-animal inter-actions. The major reasons given were lack of skilled socialscientists within national agricultural research and exten-sion systems; inadequate understanding of methodologiesfor crop-animal research; limited knowledge of the applica-tion of economic analysis for crop-animal interactions; over-emphasis on component technologies; lack of concern forgender and other socio-cultural implications for technol-ogy development and dissemination; poor linkage amongfarmers, researchers, extension workers, and rural develop-ment planners; and lack of village support mechanisms tosustain the adoption of new technologies.
Trends in the development of ICASDespite its growing importance, rainfed lowland rice hasonly recently received the attention it deserves. These landsare generally characterized as heterogeneous in any singlelocation, diverse across locations, and unpredictable every-where. In fact, the very ambiguity of the definition of rainfedlowland rice may account for the historic lack of attentiongiven to it (Mackill et al 1996). The first comprehensive
Table 4. Dominant cropping patterns in the Philippines.
Region Cropping pattern Major animals produced
I/CAR Rice-rice, rice-garlic, rice-tobacco, maize-white potato, Cattle, carabao, goats, hogs, chickensrice-legume, white potato-vegetable
II Rice-garlic, maize-maize, rice-rice, maize-legumes CarabaoIII Rice-rice, rice-legumes, rice-fallow Cattle, carabao, hogs, chickensIV Rice-rice, rice-fallow, coconut-coffee, pineapple, Hogs, chickens
rice-tomato-coconut monocropV Rice-rice, rice-maize, coconut + rice, Cattle
coconut + root crops, coconut + maizeVI Rice-rice, rice-maize, rice-fallow, maize-root crops Carabao, goats, hogs, chickensVII Maize-maize, rice-rice, rice-fallow, maize-root crops Cattle, goats, hogs, chickensVIII Rice-rice, rice-fallow, coconut monocrop, maize-fallow Chickens, hogs, carabaoIX Coconut monocrop, rice-rice, cassava-fallow, maize-fallow GoatsX Rice-rice, maize-maize CattleXI Rice-rice, maize-maize, coconut Chickens, ducks, hogsXII Maize-maize-maize, coconut, rice-rice Hogs
Source: Bureau of Agricultural Research and Extension Agenda.

115
book on characterizing and understanding rainfed environ-ments came out only in 2000 (Tuong et al 2000).
FSRD programs were implemented in rainfed rice landsby the national government, in tandem with the Interna-tional Rice Research Institute and state universities andcolleges engaged in agricultural and resource research andextension. Potentials of ICAS in any ecosystem need microbiophysical and socioeconomic characterization using par-ticipatory approaches to secure data.
Probably because of poor documentation and inad-equate reports on existing ICAS practices, related intensivepractices of small farmers in rainfed rice lands that includecrop-animal mixes were not reflected in local and nationalstudies.
Potentials for further development of ICAS
Total rice lands in the Philippines cover more than 3 mil-lion ha. Of this area, about 1.4 million ha are rainfed. One-half million ha of rainfed rice lands are drought-prone.Around 53% of the rainfed area is devoted to rice-basedcropping systems, with rice as the main crop, sometimesfollowed by another rice crop using shallow pumps. Mostsmall-scale animal production is found in this area.
Landholding per farm family is becoming smaller. From1971 to 1980, the average farm size decreased from 3.6 to2.8 ha and about 97% of all farms were below 5 ha. With thecurrent aggressive implementation of the Agrarian ReformProgram of the government, the number of smallholder farm-ers will continue to increase, while the average farm sizewill become even smaller. This trend will encourage maxi-mum use of farm resources through more diversified farm-ing systems.
The Philippines has attained self-sufficiency in poul-try, eggs, and pork. The phenomenal growth in the swineand poultry industries in the country could be attributed tothe rapid adoption of improved swine and poultry produc-tion technologies by farmers, accompanied by a consistentlyhigh demand for these animal products. The cattle, buffalo,and other ruminant production enterprises in the Philip-pines have remained mainly as small backyard operationsand are managed basically according to the traditional sys-tem (see www.fao.org).
Potential for strengthening ICAS is already indicatedin several entry points, which are identifiable in govern-ment thrusts, programs, and policies as follows:
1. Elimination of poverty, including its dimensions ofhunger, malnutrition/undernourishment, and disease,as a top agenda of the national government.
2. Department of Agriculture priority on modernizationof agriculture and fisheries for global competitive-ness and increasing exports, and evolution of totalfood/feed system agency-based research and devel-opment to farm family-centered participation.
3. DAR Program Beneficiaries Development and thesupport services provision in R.A. 6657, to which live-stock development is being linked in individual and
cooperative enterprises, such as the Tulong DairyCooperative in Pangasinan.
4. Partnership of local government units and the UnitedNations, with other foreign and local organizationsbeing involved, on a priority agenda that includespoverty elimination, reduction of infant mortality,reproductive health, gender equity, and environmen-tal care.
The Philippines has a well-developed livestock sector,yet, in spite of the profitability of integrated farming sys-tems demonstrated by local researchers, very few Filipinoshave adopted new technology. Perhaps more data and in-formation should be obtained through research coupled withan effective extension program.
References
Bureau of Agricultural Statistics. 2003. Carabao industry perfor-mance report: January–December 2002. Livestock and Poul-try Statistics Division, BAS-Department of Science andTechnology.
Bureau of Agricultural Statistics. 2003. Cattle industry perfor-mance report: January–December 2002. Livestock and Poul-try Statistics Division, BAS-Department of Science andTechnology.
Bureau of Agricultural Statistics. 2003. Chicken industry perfor-mance report: January–December 2002. Livestock and Poul-try Statistics Division, BAS-Department of Science andTechnology.
Bureau of Agricultural Statistics. 2003. Duck industry performancereport: January–December 2002. Livestock and Poultry Sta-tistics Division, BAS-Department of Science and Technol-ogy.
Bureau of Agricultural Statistics. 2003. Goat industry performancereport: January–December 2002. Livestock and Poultry Sta-tistics Division, BAS-Department of Science and Technol-ogy.
Bureau of Agricultural Statistics. 2003. Swine industry perfor-mance report: January–December 2002. Livestock and Poul-try Statistics Division, BAS-Department of Science andTechnology.
Food and Agri Business Yearbook. 1997. Pasig City (Philippines):University of Asia and the Pacific and Belgosa Publishing.
Food and Agri Business Yearbook & Directory. 2000. Universityof Asia and the Pacific, Millennium Edition.
Francisco S. 2000. Exploring the yield gap to attain self-suffi-ciency: some R, D and E imperatives. In: Opportunities andinitiatives in Philippine rice RD&E. Proceedings of the Phil-ippine Rice RD & E Scholars’ Forum. PhilRice-BAR.
Hossain M, Sombilla M. 1999. World grains market: implicationsfor a food security strategy. In: Cabanilla L, Paunlagui L,editors. Food security in the Philippines. Philippines: ISPPS/UP-CIDS.
Mackill J, Coffman WR, Garrity DD. 1996. Rainfed lowland riceimprovement. Los Baños (Philippines): International RiceResearch Institute.
116
PCARRD-DOST. 2002. National Ruminant Commodity R & DTeam 2001. R & D status and directions (2000 and beyond):ruminants. Los Baños (Philippines): Philippine Council forAgriculture, Forestry, and Natural Resource Research andDevelopment. 39 p.
Paris T. 1992. Socio-economic issues concerning women in ani-mal production. Paper presented at the Sixth Annual Sci-ence Congress, 22-28 November 1992. Bangkok, Thailand.
Reyes S. 2002. AFMA, food security and biotechnology. Foodand Agri Business Monitor. 18(7).
Rivera F. 2002. Integrated crop-animal systems in rainfedricelands: a Philippine study. Part of IRRI-ILRI-PhilRiceProject.
Royandoyan O. 2002. Food security: the role of rice research.FarmNews and Views 2nd and 3rd quarter 2002.
Tolentino B. 2002. Governance constraints to sustainable riceproductivity in the Philippines. In: Sombilla M, Hossain M,Hardy B, editors. Developments in the Asian rice economy.Proceedings of the International Workshop on Medium- andLong-Term Prospects of Rice Supply and Demand in the21st Century, 3-5 December 2001. Los Baños (Philippines):International Rice Research Institute. p 153-172.
Tuong TP, Kam SP, Wade L, Pandey S,. Bouman BAM, HardyB, editors. 2000. Characterizing and understanding rainfedenvironments. Proceedings of the International Workshopon Characterizing and Understanding Rainfed Environments,5-9 December 1999, Bali, Indonesia. Los Baños (Philip-pines): International Rice Research Institute. 488 p.
Notes
Authors’ addresses: G. Cataquiz, G. Redondo, R. Manalili, andM.J.R. Nievera, Philippine Rice Research Institute, Maligaya,Muñoz, Nueva Ecija; F.T. Rivera, Central Luzon State Uni-versity, Maligaya, Nueva Ecija; and M.A. Sombilla, Inter-national Rice Research Institute, Los Baños, Laguna, Phil-ippines.

117
Thailand’s diverse topographical and ecological characteristics account for the country’s diversefarming systems and farming practices. In the central region, where farms are relatively bigger thanin the other regions, the dominant farming system is still rice-based, but specialized productionactivities are common sights. Production of horticultural crops for commercial and export purposesis increasing, especially in areas where irrigation is abundant. Also common sights are the commer-cial poultry and swine farms, including the more specialized dairy farms. Integrated farms in theregion are declining. This is very much in contrast to the farming systems in the northern region,where wet rice in lowland or upland rice cultivation on mountain slopes is still very much integratedwith other crops and/or livestock. The majority of the households in this region are poor smallholderswho are engaged in forest-related activities with the huge forest that covers most of the landscape.High-value temperate horticultural crops have been introduced and grown in the highlands. Thenortheastern region is the poorest because of its meager natural resource endowment. It is nonethe-less a major livestock production area, especially for cattle and buffaloes, which are raised undersmallholder systems. Wet rice is a main production activity in the lowland, whereas, in the upland,commercial cash crops such as cassava and sugarcane are prevalent. Most of the farmers aresmallholders practicing rice-based integrated farming systems in both lowland and upland. Recently,sugarcane has been gradually replacing cassava because of market demand. The southern region ismore prosperous than the northern and northeastern regions. Besides shrimp culture and marinefishery, this region is covered by para-rubber, oil palm plantations, and orchards.
During the past few decades, policy reforms were instituted in Thailand that gave emphasis tostrengthening exports, in particular agricultural exports. These policies facilitated changes in farmingsystems, transforming the almost subsistence smallholdings in the northern, northeastern, andsouthern regions into more commercialized and specialized systems. This subsequently diminishedthe role of integrated systems and in their place came about the greater practice of monoculture thatrequired more inputs obtained from outside the farms. Monocropping, for example, expanded toforest areas in the northern region. This had a great impact on livestock raising because of thesector’s dependence on grazing areas, which gradually dwindled because of the shift in land use.
The importance of crop-animal integration remains intense, however, among the small andpoorer farming households in rural areas, especially in the northeastern region. Animal sales con-tinue to supplement income from crops, with higher prices of animals, especially cattle and buffa-loes. In this regard, the integrated crop-animal system (ICAS) needs to be sustained and the Thaigovernment recognizes this. Hence, more recent government projects such as the one-million-bahtvillage fund are partially meant to encourage farmers to continue practicing ICAS. The increasingregard for organic farming is another avenue being pursued to further strengthen ICAS. In the pastfew years, it has been observed that ICAS is indeed coming back in certain areas of Thailand.
Integrated crop-animal systemsin ThailandS. Simarak, B. Loapaiboon, K. Sommart, M. Duangjinda,V. Pattarajinda, P. Lowilai, T. Vongpralab, P. Sanchaisuriya,S. Kanharieng, and Y. Phasuk
Pressure to increase the supply of meat and other meat prod-ucts will continue to take place in the mixed crop-animalsystem as demand for these products continues to rise witheconomic growth. This has been the predominant system ofanimal production in the developing world (FAO 1995).More intensified development of this system is very ap-
pealing as the major actors and beneficiaries remain thesmall and landless farmers. The integrated crop-animal sys-tem has thus been often regarded as a potential strategy forreducing rural poverty, promoting food security, increasingland productivity, improving livelihood, and caring for theenvironment and natural resources. However, it has con-

118
tinuously become more and more difficult to sustain thecomplementarities between crop and animal activities inthe rice areas of Southeast Asia. This is especially the casein Thailand, where development trends have been gearedtoward more specialized production systems to cater to thegrowing export market. The rate of mechanization of farmproduction activities has increased, particularly in the irri-gated rice areas of the central region. The availability ofsoft credit terms fueled the demand for small tractors andthis has significantly decreased the demand for buffaloesfor draft power. Likewise, rural-urban migration, particu-larly of the younger members of rural households, also di-minished the labor force, which is a key input in rice andother farm activities.
But despite this increasing effort toward specialization,smallholders still make up the bulk of the Thai agriculturaleconomy. These farmers are still primarily involved in theproduction of not only rice and other crops, but also ofbuffaloes, beef cattle, and nonruminants in essentially mixedsubsystems. Goats and sheep are mainly found in the southof Thailand, where they are raised as a secondary enterpriseafter crop production and primarily for subsistence. In north-ern Thailand, both buffaloes and cattle graze under tree crops(tea, coffee, fruit trees) and in forests. Questions loom withregard to the future direction of the integrated crop-animalsystem in this country.
In this monograph, the potential for strengthening ICASis explored, especially along the direction of promotingmore sustainable agricultural development. It aims to presentthe direction of agricultural development as influenced bygovernment policies and programs and how such directionhas affected and will affect the promotion of integrated farm-ing systems, including the rice-animal system. More spe-cifically, the monograph intends to do the following:
• Describe the different variations of integrated crop-animal models in Thailand and identify where thesesystems have been commonly practiced based on theagro-physical properties of the different regions.
• Describe the extent of the linkages between crops, inparticular rice, and animals and determine how theselinkages have changed over time.
• Determine the influence of socioeconomic and policychanges on the production trends of major traditionalcrops as well as the promotion of high-value crops.How have these policies changed production systemsand crop-animal mixes?
• Discuss the potential of the integrated crop-animalsystem and identify its role as a strategy for povertyalleviation, food security, and livelihood improve-ment among smallholders. In this connection, the docu-ment also tries to identify specific problems needingto be solved to further develop ICAS so that it be-comes an effective tool to sustain production and in-crease farm income.
An introduction to Thailand
Thailand is in Southeast Asia. It covers an area of nearly513,115 km2, extending about 1,620 km from north to southand 750 km at its widest point from east to west. It is ap-proximately the same size as France, with a coastline ofapproximately 2,700 km along the Gulf of Thailand and865 km along the Indian Ocean. It shares land borders withMyanmar (Burma) in the north and west, the Andaman Seain the west, Laos in the north and northeast, Cambodia andthe Gulf of Thailand in the east, and Malaysia in the south(Fig. 1).
Fig. 1. Map of Thailand. Source: www.go-thailand.com.

119
Facts about thailand
Area: Thailand covers a land area of 513,115 km2.Lowest point: Gulf of Thailand at 0 m.Highest point: Doi Inthanon in the north at 2,576 m.Natural resources: Tin, rubber, natural gas, tungsten, tanta-
lum, timber, lead, fish, gypsum, lignite, fluorite.Agricultural exports: At present, Thailand is the number-
one exporter of rice, para-rubber, shrimp, chicken,and canned tuna.
Climate: The climate is subtropical, with long hours of sun-shine and high humidity. There are three seasons:the hot season from March to June, the rainy sea-son from July to October, and the cool seasonfrom November to February. The average low tem-perature is 20 ºC and the average high tempera-ture is 37 ºC. The geographic and climatic condi-tions make the country suitable for the cultiva-tion of a wide range of tropical and semitropicalagricultural crops.
Rainfall: The average rainfall pattern and average amountof rain in the country from 1961 to 1990 are shownin Figure 2. The rainy season usually begins inMay but can sometimes start as early as the middleof April. The amount of rainfall is still small dur-ing the early part of the season but peaks in Sep-tember. The season ends by mid- or late October.The amount of rainfall varies significantly eachyear. Frequent drought and short dry spells dur-ing the season cause fluctuations in crop produc-tivity, especially in rice. The central and south-ern regions receive more rain than the northernand northeastern regions. The rainy season in thesouth comes later than in the other regions.
Geographical regions
Thailand is divided into four distinct geographical regions.Northern region. This region is bordered by Myanmar
and Laos. It is primarily characterized by forested moun-tains at the lower extremities of the Himalayan foothills,
and fertile river valleys. It features diversity of low and up-land ecology, including hill tribes and forests as well as aninvigorating cool season. A majority of the people are sub-sistence smallholders with integrated farming systems. Evenin the highland on mountain slopes, rice-based farming withother crops or livestock is practiced. However,monocropping and high-value horticultural crops have beenon the rise.
Northeastern region. The northeast plateau is borderedin the north and east by the Mekong River and Laos, and inthe south largely by Kampuchea (Cambodia). The region isprimarily characterized by semiarid plateau with rollingtopography. Land is used mainly for crop growing (mainlyrice, sugarcane, and cassava) and livestock raising (such ascattle and buffaloes). It is a main livestock production area,especially of cattle and buffaloes. This is the most populousbut poorest region mainly because of its limited naturalresource endowment. Most of the farmers are subsistencesmallholders that practice integrated crop-animal produc-tion systems. In the last decade, however, a decline has beenobserved in the animal population and production becauseof the increased use of machinery to facilitate land prepara-tion as monocropping of upland crops such as kenaf, cas-sava, and sugarcane intensified. The role of animals in farm-ing households has once again gained importance in recentyears as their prices rise, especially for cattle and buffaloes,because of increasing demand for meat and dairy products.Some government projects have therefore been launched toencourage an increase in the production of cattle and buffa-loes within mixed-farming schemes.
Central region. This region is mainly flat and fertilebecause of its large rivers. This is the main rice-growingarea of Thailand. Geographically, the central region extendsfrom the rugged western mountains that border Myanmar toa plateau in the east and northeast; northward to NakhonSawan Province, where the Ping, Wang, Nan, and Yom riv-ers unite to form the Chao Phraya; and southward toPrachuap Khirikhan Province, where Thailand is compressedto its narrowest point, some 60 km wide between the west-ern mountains and the Thai Gulf. The Chao Phraya Riverflows southward to dissect Bangkok before entering the Gulf
C�
���
���
���
���
���
��
�
*�� �
))
;�' *# �.# *( C�� C�$ ��� �. 31 ��/ 7�1
Fig. 2. Average amount and pattern of rainfall in Thailand, 1961-90. Source: The MeteorologicalDepartment, Ministry of Information and Communications Technology (2003).

120
of Thailand. It largely irrigates the Central Plain, one of theworld’s major rice- and fruit-growing areas, and sustains anintricate network of canals that irrigate bountiful orchards.There are fewer subsistence smallholders in the central re-gion than in the other regions. Agricultural production dur-ing the past few decades has been primarily oriented to ca-ter to the export market, hence, the proliferation of commer-cialized and specialized farms.
Southern region. Geographically, southern Thailandextends through the Kra Isthmus from Chumphon, 460 kmsouth of Bangkok, to the Thai-Malaysian border. In the east,it is bordered by the Gulf of Thailand and in the west by theIndian Ocean. The region is hilly and mountainous and ismainly covered with rainforests, para-rubber, and oil palmplantations. The land is rich in mineral deposits. Lining thecoastal area from east to west are commercial shrimp andrice farms. Shrimp are channeled for domestic and exportmarkets. Compared with the people in northern and north-eastern Thailand, those in the south are economically betteroff. This area also receives the most annual rainfall.
Thailand’s economic structure
From the 4th 5-year National Economic Plan to the 8th(1977-81 to 1997-2002), the contribution of the agricul-tural sector to the gross domestic product (GDP) at 1988prices declined from 26.1% to 10.1% while the contribu-tion of the nonagricultural sector increased from 73.9% to89.9% (Table 1). In the 8th National Socioeconomic Plan,the gross value added from agriculture was baht 297,855million, while that from nonagriculture was baht 265,732million (Fig. 3). Percentage-wise, there has been a greatchange in both sectors, possibly as a result of the export-oriented and industrial policies that encouraged labor mi-gration from rural to urban areas, which facilitated changesin cropping practices (toward monocropping and the greateruse of external inputs), promoted deforestation, altered thelivestock population and production systems (toward morecommercialized and less small and integrated systems), andproduced other social changes.
Land ecosystems
Arable land in Thailand covers about 34% of the total landarea or 5.4 million hectares. Out of this, about 44,000 km2
are irrigated. Permanent crops cover about 6% of the totalland area, permanent pastures 2%, and forests and wood-land 26%. The remaining approximately 5.12 million ha or32% of the total land area are unclassified.
The land ecosystem can be regarded as a major crite-rion for land-use planning. It is also among the key factorsfor the development of appropriate models of mixed farm-ing systems. According to satellite image interpretations,soil maps, topographic maps, and other forms of informa-tion search, the land ecosystem can be divided into sevenunits (Fig. 4).
Unit F: Mountain and hill with dense forestThis unit can be divided into two subunits:F1: Consists of deep slopes on mountainsides, with
healthy evergreen forest and dipterocarp forest at lowerelevation. Soils are often shallow and not fully devel-oped, with sporadic rock outcrops. The area is bestmaintained as forest reserve and is not recommendedfor any form of agriculture.
Table 1. Average quarterly contribution and percentage of agricultural and nonagricultural sectors in gross domestic product (GDP),4th–8th National Socioeconomic Plan.
National Socioeconomic Plan (million baht)GDP
4th (1977-81) 5th (1982-86) 6th (1987-91) 7th (1992-96) 8th (1997-2001)
Agriculture 150,496 187,740 280,325 334,434 297,855Nonagriculture 426,116 800,364 1,601,053 2,475,939 2,657,318
(%)Agriculture 26.1 19.0 14.9 11.9 10.1Nonagriculture 73.6 81.0 85.1 88.1 89.9
���
��
��
��
��
�
�����������&��
����&�� ����&�� ����&�� ����&�� ����&����
��"7?
Fig. 3. Contribution of the agricultural and nonagricultural sectorsto gross domestic product, 4th to 8th National SocioeconomicPlan.
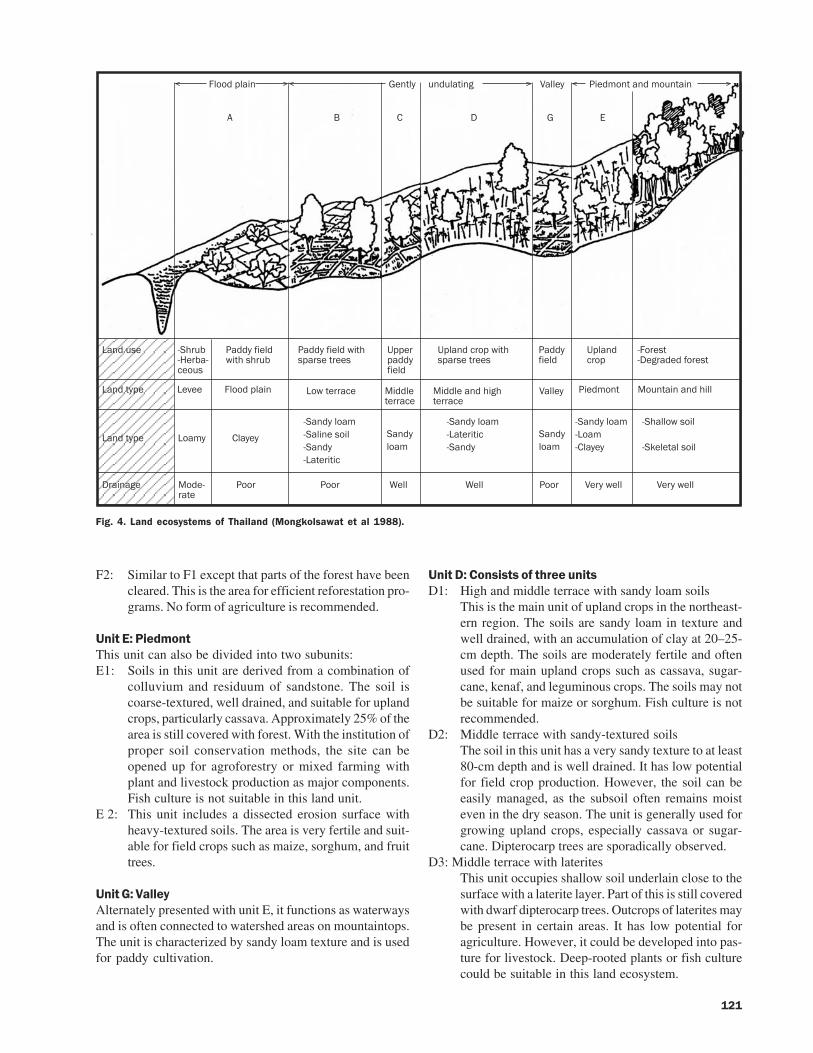
121
F2: Similar to F1 except that parts of the forest have beencleared. This is the area for efficient reforestation pro-grams. No form of agriculture is recommended.
Unit E: PiedmontThis unit can also be divided into two subunits:E1: Soils in this unit are derived from a combination of
colluvium and residuum of sandstone. The soil iscoarse-textured, well drained, and suitable for uplandcrops, particularly cassava. Approximately 25% of thearea is still covered with forest. With the institution ofproper soil conservation methods, the site can beopened up for agroforestry or mixed farming withplant and livestock production as major components.Fish culture is not suitable in this land unit.
E 2: This unit includes a dissected erosion surface withheavy-textured soils. The area is very fertile and suit-able for field crops such as maize, sorghum, and fruittrees.
Unit G: ValleyAlternately presented with unit E, it functions as waterwaysand is often connected to watershed areas on mountaintops.The unit is characterized by sandy loam texture and is usedfor paddy cultivation.
Unit D: Consists of three unitsD1: High and middle terrace with sandy loam soils
This is the main unit of upland crops in the northeast-ern region. The soils are sandy loam in texture andwell drained, with an accumulation of clay at 20–25-cm depth. The soils are moderately fertile and oftenused for main upland crops such as cassava, sugar-cane, kenaf, and leguminous crops. The soils may notbe suitable for maize or sorghum. Fish culture is notrecommended.
D2: Middle terrace with sandy-textured soilsThe soil in this unit has a very sandy texture to at least80-cm depth and is well drained. It has low potentialfor field crop production. However, the soil can beeasily managed, as the subsoil often remains moisteven in the dry season. The unit is generally used forgrowing upland crops, especially cassava or sugar-cane. Dipterocarp trees are sporadically observed.
D3: Middle terrace with lateritesThis unit occupies shallow soil underlain close to thesurface with a laterite layer. Part of this is still coveredwith dwarf dipterocarp trees. Outcrops of laterites maybe present in certain areas. It has low potential foragriculture. However, it could be developed into pas-ture for livestock. Deep-rooted plants or fish culturecould be suitable in this land ecosystem.
;$��%�.$�� "�� $(�������%�$ ��� A$$�( ?��%)�� ��%�)��� ��
� � ! 7 " �
&�#�'&B�#'&1����
?%%(�,��$%-� ����#�'
9�%����
9�%� (.� 9�/�� ;$��%�.$�� 9�-� �##1� *�%%$� �##1�
=..�#.%%(,��$%
?%%(�,��$%�-� ��.#��� #���
=.$�%�1#�.�-� ��.#��� #���
A$$�(*�%%$���%����� �##1�
?%%(,��$%
=.$�%1#�.
&;�#�� &7��#%�%�,�#��
?��%)�� *��� ����%���$$
9�%� (.�
&�%(�$�)&$�������$&�%(&9 �#� �1
9�)( !$(�( �%($�)
&�%(�$�)&9�)&!$(�(
�%($�)
&�%(�$�)&9 �#� �1&�%(
&�$$�-����$
&@�$� $����$
7#���� *�%�&# �
?��# ?��# ��$$ ��$$ ?��# A�#(�-�$$ A�#(�-�$$
Fig. 4. Land ecosystems of Thailand (Mongkolsawat et al 1988).

122
Unit C: Upper paddy areasThe forest in this unit has long been encroached upon andopened up for upland crop cultivation. Most of this unit isalso used for rice cultivation, as it is the staple food of thelocal people. However, rice areas are often left fallow, par-ticularly in drought years. Soils in this unit are similar tothose in unit D, but they have greater physical problemsthat are more difficult to manage.
Unit B: Low terraceFour subunits are under this ecosystem.B1: Low terrace with sandy loam soils
This unit is mostly used for paddy cultivation. Accu-mulation of alluviated clay is often present at a depthof 15 cm. This unit is suitable only for paddy growingduring the rainy season. Rice-fish culture could beintroduced in the area. Crop production in the dryseason is possible if there is irrigation.
B2: Low terrace with very sandy soilsThe soils in this unit are very sandy. Physical andchemical properties of the soils are unfavorable foragriculture. But the unit is still used for paddy culti-vation by farmers.
B3: Low terrace with saline soilsThe soils in this unit have been affected by salt. Sur-face encrustation of salt occurs during the dry season.These soils are underlain by rock salt. Paddy cultiva-tion is possible when the soils are waterlogged. Theycan be regarded as unsuitable for any form of agricul-ture.
B4: Low terrace with laterite soilsThis unit is used for paddy cultivation. Agriculturalpotential at this site is directly related to the depth ofthe underlying lateritic layer. Fish culture is suitablein this unit but pond construction could be a prob-lem.
Unit A: Flood plain and river leveeThis unit occupies flood plains with heavy-textured soils.The soils are fertile, with high paddy yield in most areas.The unit is suitable for fish culture if overflow water can becontrolled. The best farming system for this unit is wet-season paddy followed by vegetables and ICAS has a highpotential. The river levee is covered by trees and shrubs andis partly used for vegetable growing. This is mainly in thecentral region.
Other units: Coastal and mangrovesIn addition to the above units, Thailand also has coastaland mangrove land ecosystems that are mainly in the south-ern region. However, the mangroves have been overusedand are now relatively degraded by the increased undertak-ing of shrimp-farming activities that polluted the ecosys-tem.
Regional distribution of different units
The northern region is covered mostly by units F, E, and Gand some of unit D. The central region is covered mostly byunits A, B, and C and some of unit D. The northeasternregion is covered mostly by units B, C, and D and some ofA, G, and E. The southern region is covered mostly by unitsE and G and some of unit D. The coastal and mangroveareas are also mostly in this region. This distribution hasinfluenced the development of various models of crop andanimal integration.
Integrated farming system models
Rice-based mixed and integrated farming systems have beentraditionally practiced in Thailand. Despite the move to-ward more commercialized and specialized farms and agri-cultural activities, the systems have been maintained butbarely improved because of limited research and develop-ment activities conducted in the area. The systems can beclassified into different models based on their suitability inthe various land ecosystems described above.
Model 1. This model consists of native fish stocked inrice paddies, and that are mainly used for home consump-tion when harvested. No additional feed input is needed togrow the fish. Nutrients such as weeds, insects, and planktonsfrom rice fields serve as their feed. When the water recedes,fish are captured in a small pond at the lower corner of therice field. Their feces are left at the bottom of the fields, andthen fertilize the soil.
Model 2. Model 2 is a modification of the first modelbut, instead of stocking native fish varieties, the new high-yielding varieties are kept. Cultured fish need additionalfeed, such as rice bran and other crop residues, termitemounds, and/or commercial feed obtained from outside thesystem. Fish harvested are primarily for sale. A small por-tion is left for home consumption.
Rice-fish systems are found mainly in lowland areas inthe central region as well as in lower terraces of upland areasin other parts of the country, particularly in the northeasternand northern regions. The simple and traditional fish ponds(Model 1) remain the central focus of rice-based integrationbecause they are low-input systems. Productivity dependsto a large extent on the type of native fish stocked, the leveland duration of water, and the fertility of the paddy fields.With the decline in native fish stocks because of overhar-vesting, environmental degradation, and chemical pollu-tion from pesticide use, cultured fish were introduced, whichgreatly improved fish productivity. This enabled farm house-holds both a sufficient source of protein for their familyneeds and surpluses for sale in the market. The number ofimproved fish ponds (Model 2) is increasing tremendouslyeverywhere because of the information drive conducted byNGOs and subsidy provided by the government to promote

123
the system as a sustainable means to achieve the King’ssufficiency economy concept through effective and effi-cient management of small water resources.
Some problems have been hindering more rapid devel-opment of these systems, however. One is the labor scarcity,which has become more serious with the slower growth inpopulation as initiatives in family planning intensify, andwith increased migration, particularly of rural young people,to urban areas. Farmers have also indicated that theft is aproblem because fish ponds are situated away from the vil-lage settlements.
Recent modifications of the system have been its es-tablishment among rice fields. Crops are grown on the em-bankments that surround the pond for home consumption,for sale in the market, or for fish feed.
Model 3. Model 3 introduces intensive livestock rais-ing (mainly poultry and swine) into the rice-fish system.Fish-pond layout is better planned in this model because of
the addition of small livestock pens that are often con-structed on top of the pond. Animal wastes become feed forfish, but this could vary in different locations depending ontheir effect on water quality. The balance between the num-ber of animals and quality of water in the pond is criticaland must be carefully managed. Too much animal wastedeteriorates water quality and may affect the fish culturedin the pond. Animal manure also serves as fertilizer sincemud that settles at the bottom of the pond is scooped outand added to the surrounding fields, which are cultivatedwith rice, vegetables, fruit trees, and other crops. Crops orcrop residues may additionally be given to the fish or ani-mals as feed as well as commercial feed that is obtainedfrom outside the system. Fish and animals produced aremainly channeled to the market for sale.
The diversity and integration involved in the systemincrease its production sustainability. The developmentdirection, however, has been geared toward greater com-
Model 2. Rice-fish culture.
Model 1. Rice-fish capture.
124
mercialization. Adequate water resources are a prerequisitefor the much wider adoption of the system. In addition, theanimal-raising component necessitates the increased depen-dence on capital resources for the purchase of improvedanimal breeds, commercial feed, and veterinary care. Theneed for skilled labor also increases as the system becomesmore complex and more commercialized.
Model 4. This model is similar to the third model, butwith the addition of larger animals such as cattle or buffa-loes. Cattle contribute manure to the pond as well as crops.Again, care should be practiced to maintain the appropriatebalance between the number of livestock kept in cages ontop of the pond and water quality to prevent water degrada-tion that can later be detrimental. Large animals as part ofthe component are very limited.
Model 5. The fifth model is not a water-based systembut has a major field crop such as sugarcane along with rice.Livestock are native chickens and/or cattle. Rice straw isfed to the cattle and unhusked rice to the chickens. Othercrop residues are seldom used. Chickens are mainly for home
consumption although a small portion are sometimes sold.Cattle, on the other hand, are usually kept as a form of sav-ings and sold in times of emergency. Adding large live-stock to the system is now seldomly done because of thelimited grazing area and higher investment cost. The nutri-ent cycle is not complex in this system. Chicken and cattlemanure are directly deposited in fields since chickens areleft uncaged and go to the fields to find food while thecattle are usually tied in the middle of the paddies after riceis harvested to graze and eat the stubbles.
Model 6. Since most of the soybean is grown in low-land, the ICAS with soybean is usually associated with afish pond (water-based system). Native chickens and cattlemay be part of the system. The nutrient cycle concept issimilar to that of the other systems. Wastes from animals goto the fish, rice fields, or other crop fields and wastes fromfish go to the bottom of the pond and are then returned tothe rice fields. The use of cattle is similar to that in theprevious model.
Model 3. Rice/horticulture crop-animals.
Model 4. Rice-animals-fish.

125
Model 7. The seventh model is without the fish-pondcomponent. Chickens may be raised along with cattle.Wastes from cattle are used as fertilizer for rice or vegetables.The purpose for having livestock uncaged is similar to thatin the other systems.
In some areas in the southern region, goats are a tradi-tional part of the system. More recently, sheep have alsobeen introduced in the northern region under the King’sproject.
Table 2 summarizes the general distribution of the dif-ferent models of integrated farming systems in different re-gions of the country. This does not strictly mean that eachmodel is confined only to the regions indicated in the table.It can appear in other regions to a certain extent.
Crop-animal integration in rainfed rice areas
Most upland paddy areas are rainfed and located in the north-east region. Most of the farm systems in this area are rice-based but rice insufficiency remains a common problem.
Seasonal rainfall variations and soil infertility limit rice pro-ductivity. One important strategy for overcoming this prob-lem is to increase household income to enable householdsto purchase their rice needs from the market. Animal raisinghas provided the needed income supplement to these house-holds in the region. Traditional cattle and buffalo raising isstill a common sight on a number of rice farms in the north-
Model 5. Rice/sugarcane-animals.
Model 6. Rice/soybean-fish-cattle.
Table 2. Distribution of rice-based integrated farming systems.a
Model Land ecosystem unit Main regional distribution
1 A NE,C2 B1, B2, B3, G NE,C3 B1, B2, B3, G NE,C4 B1, B2, B3, G N,NE,C5 B1, B2, B3, G, and C NE6 B1, B2, B3, G NE7 A, B1, B2, B3, and G NE
aN = northern, NE = northeastern, and C = central region.

126
ern and northeastern regions. This practice has graduallydiminished in the central and southern regions. Animals arestill employed to prepare land, primarily during the wetseason when the fields are cultivated for rice. During the dryseason, paddy areas are used for grazing, where animals pri-marily feed on the rice stubbles. Rice straw as feed is impor-tant during the dry season as well as during the rainy seasonwhen paddy land is occupied by rice and other grazing ar-eas are not easily accessible. The importance of cattle andbuffalo manure as fertilizer is also gaining popularity be-cause of the increasing demand for organic crops and otherfarm produce. Manure trading is now showing great poten-tial for growing into a big business enterprise. All of thisplus the fact that cattle and buffaloes command relativelyhigh market prices have influenced the gradual return ofthese animals to fields.
The introduction of small rice-milling machines in vil-lages also encouraged pig raising in the region. But thisopportunity has been confined more to a few families andtheir relatives who are affiliated with rice mill owners whocould obtain rice bran for animal feed. The relatively well-off households raise modern breeds of pigs that need morefeed input in the form of rice bran and other feed concen-trates. They also practice more intensive care and manage-ment with the help of people with veterinary expertise.
Raising of native chickens is another traditional prac-tice attached to rice farming in all regions of the countryand more so in rainfed areas. Unhusked rice is used as feedfor the chickens. The system is low-input in nature. Chick-ens are used for home consumption, for sale, for rituals/ceremonies, or in exchange for labor employed.
Raising of fighting cocks is most common among small-holder rice farmers. It is rapidly expanding now not only inrainfed areas but throughout the country because of its ex-port potential, which gives the animals their more premiumprice. Cockfighting as a hobby, especially among richerhouseholds, is now becoming popular, with prizes at stakemaking it more and more enticing.
Expanding crop-animal endeavors in the rainfed envi-ronment has always been hindered by the limited availabil-ity of communal land and landholding size.
Demographic characteristics
The population estimate of Thailand in mid-2002 was62,354,402. The growth rate was computed at 0.88% in2001: a drastic drop from the 1.2% average growth rate esti-mated for 1990-2001. The recent growth rate estimate tookinto account the severe effect of AIDS infection, which low-ers life expectancy and increases infant mortality and deathrates. Changes in the distribution of population by age andsex also took directions that are beyond those that wereoriginally expected (CIA 2002). The pyramid shape of thepopulation structure in 2000 is expected to become a jarshape in 2025 as projected by the U.S. Census Bureau (Table3 and Fig. 5).
This indicates a more rapid expansion of population inthe age bracket 15–65. This is the economically active seg-ment of the population that would require sufficient foodand energy to do work; hence, the expected continued in-crease in demand for food.
There will also be continued pressure on the agricul-tural sector to produce more food surpluses for the increas-ing labor force that is projected to move out of agricultureinto industrial activities, especially with the current focuson the modernization of the industrial sector. Data from the1990 census reveal that, while the agricultural sector is still
Model 7. Rice/vegetables-animals.
Table 3. Projected age structure of the Thai population in 2025.
Age % Males Females
0–14 23.3 7,404,227 7,121,08315–64 69.9 21,469,186 22,090,520>65 6.8 1,868,632 2,400,754
Source: CIA (2002).

127
dominant in Thailand, the proportion of the labor force en-gaged in agriculture has declined from 79.3% to 66.0%during 1970-90. Labor force participation in the industryand service sectors, on the other hand, increased from 8.3%to 13.5% and 12.4% to 20.5%, respectively (NSO 2003).Table 4 shows that, at the beginning of 2004, only 34% ofthe labor force was engaged in agriculture and agriculture-related activities.
Regional distribution of Thailand’spopulation and incidence of poverty
Table 5 shows the regional distribution of Thailand’s popu-lation. It can be noted that about a tenth of the populationlives in Bangkok, the capital city. The northeastern regionaccounts for the highest number of people, with about 20million, followed by the northern region. The combinedtotal population of these regions accounts for almost 50%of the whole Kingdom. Table 6 also shows that povertyincidence among households is highest in the north andnortheast regions, with percentages of households underthe poverty line at 48% and 43%, respectively, of total
households. The poverty line for Thai people is less thanbaht 20,000. Note that about 36.2% of Thai householdshave income less than the poverty line, about 6% higherthan the government target of about 30%.
Migration trends in Thailand
Table 7 shows the movement of people within the countryand in and out of Bangkok and the other growth centers.Migrants to Bangkok and its vicinity have particularly beenthose in the 15–24 years’ age bracket, unmarried and onlyfinished a primary education. Recent migrants to Bangkok,however, especially those from the eastern seaboard andwithin the vicinity of regional growth centers, are mainly ofthe 25–34 age group. They are mostly males with second-ary and higher level of schooling and married persons. Mi-grants into the different regions also vary in terms of theiroccupational skills. In Bangkok, these people were mostlyengaged in service, crafts, and hired labor. In the Bangkokvicinity and eastern seaboard, the proportion engaged inwhite-collar occupations is equal to that engaged in blue-collar work, but, in regional growth centers, a majority of
Fig. 5. Pyramid of Thai population in 2000 and 2025. Source: U.S. Census Bureau, InternationalData Base.
��D��<����<����<����<����<����<����<����<����<����<����<����<����<����<��
�<��<�
�6�
��D��<����<����<����<����<����<����<����<����<����<����<����<����<����<��
�<��<�
�6� �6� �6� �6� �6� �6� �6� �6� �6� �6� �6� �6� �6� �6� �6�?�.�$ ����4���)�$$����5
���$�%2�����
���$�%2�����*$�� ;�)$��

128
Table 4. Number and percentage of employed persons by industry (in thousands) by region, 2004.
RegionIndustry
Total Bangkok Central Northern Northeastern Southern
Total 33,745.7 4,607.9 8,186.5 6,255.5 10,335.9 4,359.9Agriculture 11,612.4 44.2 2,198.4 2,856.5 4,574.1 1,939.21. Agriculture, hunting, 11,174.6 32.7 2,068.2 2,831.5 4,492.7 1,749.5
and forestry2. Fishing 437.8 11.5 130.2 25.0 81.4 189.7Nonagriculture 22,133.3 4,563.7 5,988.1 3,399.0 5,761.8 2,420.71. Mining and quarrying 64.9 5.6 25.8 4.5 27.2 1.82. Manufacturing 6,035.1 1,154.6 2,316.7 781.9 1,422.2 359.73. Electricity, gas, and 89.8 3.0 35.4 24.0 20.5 7.0
water supply4. Construction 2,221.2 187.9 384.0 459.9 978.0 211.45. Wholesale and retail trade, 5,677.6 1,065.4 1,374.3 902.0 1,532.3 803.7
repair of motor vehicles,motorcycles, and personaland household goods
6. Hotels and restaurants 2,338.7 568.1 573.9 343.7 460.4 392.67. Transport, storage, and 1,187.8 356.5 306.7 107.2 273.9 143.6
communication8. Financial intermediation 289.6 119.0 75.4 40.4 35.6 19.39. Real estate, renting, and 638.9 266.8 143.4 77.6 79.2 71.9
business activity10. Public administration and 968.8 179.4 217.0 152.8 304.7 114.9
defense, compulsorysocial security
11. Education 1,081.6 200.0 219.1 299.1 298.5 134.912. Health and social work 521.7 129.3 97.6 106.6 132.9 55.313. Other community, social, 733.8 205.4 158.5 129.2 165.7 75.0
and personal service activity14. Private households with 269.7 112.2 57.2 40.3 30.3 29.8
employed persons15. Extraterritorial organizations 6.4 5.5 0.3 – 0.6 –
and bodies16. Unknown 7.8 5.0 2.8 – – –
Percentage (%)
Total 100.0 100.0 100.0 100.0 100.0 100.0Agriculture 34.4 1.0 26.9 45.7 44.3 44.51. Agriculture, hunting, and forestry 33.1 0.7 25.3 45.3 43.5 40.12. Fishing 1.3 0.2 1.6 0.4 0.8 4.4Nonagriculture 65.5 99.0 73.1 54.3 55.7 55.51. Mining and quarrying 0.2 0.1 0.3 0.1 0.3 0.02. Manufacturing 17.9 25.1 28.3 12.5 13.8 8.23. Electricity, gas, and water supply 0.3 0.1 0.4 0.4 0.2 0.24. Construction 6.6 4.1 4.7 7.4 9.5 4.85. Wholesale and retail trade, 16.8 23.1 16.8 14.4 14.8 18.4
repair of motor vehicles,motorcycles, and personaland household goods
6. Hotels and restaurants 6.9 12.3 7.0 5.5 4.5 9.07. Transport, storage, and 3.5 7.7 3.7 1.7 2.6 3.3
communication8. Financial intermediation 0.9 2.6 0.9 0.6 0.3 0.49. Real estate, renting, and 1.9 5.8 1.8 1.2 0.8 1.6
business activity10. Public administration and 2.9 3.9 2.7 2.4 2.9 2.6
defense, compulsorysocial security
11. Education 3.2 4.3 2.7 3.7 2.9 3.112. Health and social work 1.5 2.8 1.2 1.7 1.3 1.313. Other community, social, and 2.2 4.5 1.9 2.1 1.6 1.7
personal service activity14. Private households with 0.8 2.4 0.7 0.6 0.3 0.7
employed persons15. Extraterritorial organizations 0.0 0.1 0.0 – 0.0 –
and bodies16. Unknown 0.0 0.1 0.0 – – –
Source: NSO (2004).
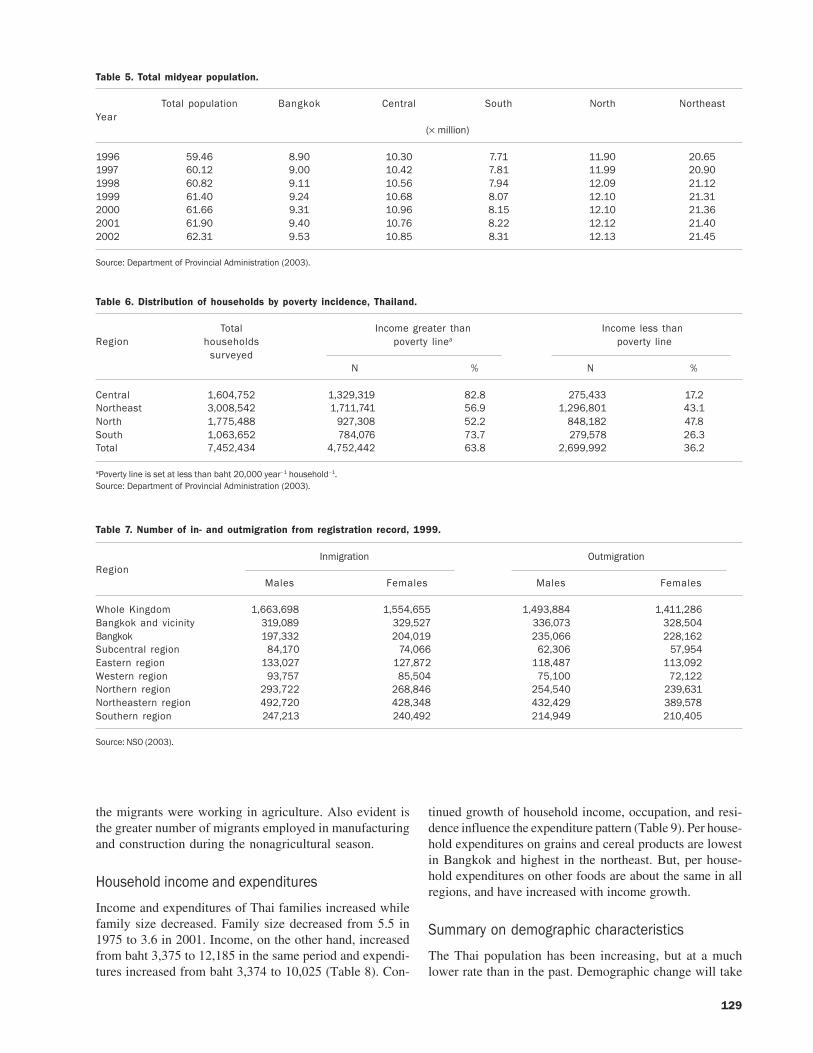
129
Table 5. Total midyear population.
Total population Bangkok Central South North NortheastYear
( million)
1996 59.46 8.90 10.30 7.71 11.90 20.651997 60.12 9.00 10.42 7.81 11.99 20.901998 60.82 9.11 10.56 7.94 12.09 21.121999 61.40 9.24 10.68 8.07 12.10 21.312000 61.66 9.31 10.96 8.15 12.10 21.362001 61.90 9.40 10.76 8.22 12.12 21.402002 62.31 9.53 10.85 8.31 12.13 21.45
Source: Department of Provincial Administration (2003).
Table 6. Distribution of households by poverty incidence, Thailand.
Total Income greater than Income less thanRegion households poverty linea poverty line
surveyedN % N %
Central 1,604,752 1,329,319 82.8 275,433 17.2Northeast 3,008,542 1,711,741 56.9 1,296,801 43.1North 1,775,488 927,308 52.2 848,182 47.8South 1,063,652 784,076 73.7 279,578 26.3Total 7,452,434 4,752,442 63.8 2,699,992 36.2
aPoverty line is set at less than baht 20,000 year–1 household–1.Source: Department of Provincial Administration (2003).
Table 7. Number of in- and outmigration from registration record, 1999.
Inmigration OutmigrationRegion
Males Females Males Females
Whole Kingdom 1,663,698 1,554,655 1,493,884 1,411,286Bangkok and vicinity 319,089 329,527 336,073 328,504Bangkok 197,332 204,019 235,066 228,162Subcentral region 84,170 74,066 62,306 57,954Eastern region 133,027 127,872 118,487 113,092Western region 93,757 85,504 75,100 72,122Northern region 293,722 268,846 254,540 239,631Northeastern region 492,720 428,348 432,429 389,578Southern region 247,213 240,492 214,949 210,405
Source: NSO (2003).
the migrants were working in agriculture. Also evident isthe greater number of migrants employed in manufacturingand construction during the nonagricultural season.
Household income and expenditures
Income and expenditures of Thai families increased whilefamily size decreased. Family size decreased from 5.5 in1975 to 3.6 in 2001. Income, on the other hand, increasedfrom baht 3,375 to 12,185 in the same period and expendi-tures increased from baht 3,374 to 10,025 (Table 8). Con-
tinued growth of household income, occupation, and resi-dence influence the expenditure pattern (Table 9). Per house-hold expenditures on grains and cereal products are lowestin Bangkok and highest in the northeast. But, per house-hold expenditures on other foods are about the same in allregions, and have increased with income growth.
Summary on demographic characteristics
The Thai population has been increasing, but at a muchlower rate than in the past. Demographic change will take
130
place so that the Thai population will increase the propor-tion of its economically active population. Migration fromrural areas to the city and urban growth centers will alsoincrease, thus the expected expansion of urban areas. Peopleworking in urban areas will definitely have different workand food consumption habits. A rise in income and attain-ment of higher levels of education are also expected to takeplace. All these factors will affect demand for food, and thusshould be considered in plans for agricultural development.Observations and recent trends seem to indicate that theinclination is toward more consumption of animal protein,as shown in Table 10.
Rice production
Rice is a dominant subsector of the country’s crop incomeand it continues to be the dominant economic activity offarmers in rural Thailand. The commodity has likewise con-tinued to be a major export crop. But, despite this, rice farm-ers are regarded to be among the poor. The Thai govern-ment has continued to support the industry not only to main-tain the competitive strength of Thai rice in the interna-tional market but also to help prevent the seemingly wors-ening welfare of rice farmers. Government attention has thusbeen more and more focused on restructuring cropping sys-
Table 8. Average monthly income and expenditures of households.
Average Average monthly Percent of Average monthly Percent ofYear household income of change expenditures of change
size household (baht)a per year household (baht) per year
1975-76 5.5 1,928 – 2,004 –1981 4.5 3,378 11.87 3,374 10.981986 4.3 3,631 1.45 3,783 2.311988 4.0 4,106 6.34 4,161 4.881990 4.1 5,625 17.04 5,437 14.311992 3.9 7,062 12.05 6,529 9.581994 3.8 8,262 8.16 7,567 7.661996 3.7 10,779 14.22 9,190 10.201998 3.7 12,492 7.65 10,389 6.321999 3.7 12,729 1.90 10,238 –1.452000 3.6 12,150 –4.55 9,848 –3.812001 3.6 12,185 0.29 10,025 1.80
aCurrency rate: baht 40 = US$1.Source: NSO (2003).
Table 9. Average household expenditures (baht) in a 7-day period for food, beverages, and tobacco by region and area, 2004.
RegionFood and Wholebeverages Kingdom Greater Central North Northeast South Municipal Non-
Bangkok area municipalarea
Percent of households 100.00 17.40 19.10 19.40 31.60 12.50 19.20 63.40Average household size (persons) 3.50 3.30 3.40 3.20 3.70 3.80 3.20 3.60Food prepared at home 547.64 585.70 565.89 465.30 529.62 640.96 548.64 538.07Grains and cereal 101.76 73.49 87.04 93.95 127.82 105.45 92.42 111.24ProductsRice 51.96 44.58 64.23 40.49 44.78 78.05 50.53 54.17Glutinous rice 31.53 2.55 2.63 41.45 69.23 1.56 21.67 41.31Rice and wheat flour and oats, 0.44 0.35 0.46 0.31 0.37 0.88 0.38 0.48 cassava flour, and corn flourNoodles, macaroni, and spaghetti 4.43 3.50 4.63 3.59 5.40 4.18 4.07 4.76Bread and cake 6.28 11.73 6.92 4.11 3.21 9.37 7.11 4.71Pastries 4.53 7.23 4.46 2.24 3.03 8.41 4.76 3.81Bean curd 1.53 2.43 2.64 0.93 0.92 1.19 2.52 1.03Other cereal products such 1.06 1.12 1.07 0.83 0.88 1.81 1.38 0.97 as malt, sago, malt flour, etc.Meat and poultry 99.72 90.45 96.23 90.06 111.17 102.41 96.37 102.91Lean pork 40.16 32.91 44.07 43.00 38.23 44.01 38.00 42.53Spareribs and other pork 7.50 9.16 8.84 8.24 5.11 8.29 8.18 6.91
Source: NSO (2004).

131
tems toward greater diversification and integration of pro-duction activities.
Trends in rice production
Cultivated area of rice (both dry and wet season) in thecountry has steadily increased from 60 million rai1 in 1992-93 to 66 million rai in 2001-02 (Table 11). Harvested areashows the same trend but is slightly lower in coverage. Pro-duction increased from 19 million t in 1992-93 to 26 mil-lion t in 2001-02 while yield per rai increased from 348 to419 kg during the same period. The farm-gate price, how-ever, fluctuated. From 1992-93 to 1995-96, the price re-mained slightly below baht 4,000. From 1996-97 to 1998-99, farm-gate prices gradually rose to reach close to baht7,000 in 1997-98. From 1999-2000 to 2001-02, the farm-gate price averaged around baht 4,700. The value of riceproduction followed the same trend as the farm-gate price,peaking in 1997-98 at baht 164 billion.
From 1999-2000 to 2001-02, the total and regional wet-season rice cultivated and harvested areas were more or lessstable (Table 12). The total cultivated area of the countryaveraged around 57 million rai, of which 12 million rai arefound in the north, 32 million rai in the northeast, 9.7 mil-lion rai in the central region, and only 2.5 million rai in thesouth. The trends in harvested area and its distribution acrossregions are similar to that in cultivated area. Total produc-tion, on the other hand, shows some variation across years,in which the highest recorded was about 21 million t in2001-02 and the lowest at about 19 million t in 1999-2000.For each region, total production showed an increasing trenduntil 2001-02, except in the south. The northeast achievedthe highest production (8–9 million t), followed by the north(4–5 million t), the central region (a little less than 5 milliont), and the south (0.7–0.8 million t). Yield per rai also re-flects the same pattern: 348 kg in 1999 and 380 kg in 2002.Yield per rai is highest in the central region and lowest inthe northeast (about 500 vs 300 kg, respectively).
Table 10. Number of livestock slaughtered by region, 1997-2000.
Year Total Bangkok and Subcentral Eastern Western Northern Northeastern Southernvicinity
Cattle1997 440,756 27,531 18,764 9,778 29,744 70,636 223,709 60,5941998 389,303 24,380 14,430 8,478 26,106 66,662 188,737 60,5101999 372,987 35,485 14,801 8,231 24,660 62,135 177,918 49,7572000 335,923 34,460 9,860 9,040 19,641 64,797 167,352 30,773Buffalo1997 124,875 10,487 9,409 15,465 364 18,708 66,791 3,6511998 98,993 5,926 6,040 14,351 51 18,715 50,763 3,1471999 103,464 3,112 15,953 14,300 246 22,472 44,787 2,5942000 110,199 2,220 10,964 14,973 296 25,211 55,189 1,526Swine1997 3,834,566 347,389 242,948 436,037 426,724 905,478 750,759 725,2311998 3,741,348 392,663 216,655 421,678 379,796 895,584 737,267 697,7051999 3,634,412 445,855 254,343 413,297 340,458 871,580 721,210 587,6692000 3,665,243 450,402 236,110 362,125 346,434 940,590 761,301 568,281
Source: Department of Livestock Development, Ministry of Agriculture and Cooperatives (2004).
Table 11. Wet- and dry-season rice: area, production, yield, and farm price and value, crop year 1992-93–2001-02.
YearPlanted area Harvested area Production Yield Farm price Value
(000 rai)a (000 rai) (000 t) (kg rai–1) (bahtb per ton) (million baht)
1992-93 60,453 57,248 19,917 348 3,286 65,4471993-94 59,251 53,015 18,447 348 3,727 68,7521994-95 60,677 56,095 21,111 376 3,857 81,4251995-96 63,353 56,870 22,016 387 4,764 104,8841996-97 63,728 57,920 22,332 386 5,522 123,3171997-98 64,189 61,955 23,580 381 6,962 164,1641998-99 62,698 59,447 22,999 387 5,756 132,3821999-2000 64,443 62,312 24,172 388 4,679 113,1012000-01 66,492 61,820 25,844 420 4,621 119,4252001-02 66,272 63,283 26,514 419 4,714 124,987
aLand unit: 6.25 rai = 1 ha. bCurrency rate: baht 40 = US$1.Source: Office of Agricultural Economics, Ministry of Agriculture and Cooperatives (2003).
1 1 hectare = 6.25 rai.
132
Dry-season rice cultivation is much less than wet-sea-son cultivation because of the scarcity of water for irriga-tion. Cultivated area fluctuated in all regions from 1999 to2001 (Table 13). The Central Plain has the largest culti-vated area, which ranged from 4.1 to 5.1 million rai in 1999-2000 and 2001-02. The extent of dry-season rice cultivatedarea in the north comes next, but this decreased from about2.9 million rai in 2000-01 to 2.5 million rai in 2001-02. Thenortheast cultivated area returned to about 0.63 million raiafter expanding to 0.89 million rai in 2000-01. The leastcultivated land is in the south (0.11–0.24 million rai). Again,
harvested area is closely related to cultivation area. Totaldry-season rice production ranged from 5.1 to 6 million tfrom 1999-2000 to 2000-01 and fell to 5.6 million t in 2001-02. The regional production trend closely reflects the trendshown by cultivated area. Yield per rai averaged 679, 697,and 672 kg in 1999-2000, 2000-01, and 2001-02, respec-tively. The southern region has the lowest yield per rai (452to 479 kg) while the central has the highest (700 to 736 kg).Compared with the yield gain in the wet season, yield in thedry season is relatively higher. However, over the three-year period, a general decline in yield has been more no-
Table 12. Wet-season rice: planted area, harvested area, production, and yield by region.
Planted area (raia) Harvested area (rai)Region
1999-2000 2000-01 2001-02 1999-2000 2000-01 2001-02
North 12,374,656 12,515,977 12,754,163 11,733,479 11,691,558 12,289,342Northeast 31,858,692 33,090,626 32,997,722 30,911,916 29,906,947 30,910,752Central 9,817,805 9,697,033 9,857,928 9,587,663 9,180,998 9,595,376South 2,531,342 2,471,017 2,228,192 2,488,271 2,346,355 2,135,330Total 56,582,495 57,774,653 57,838,005 54,721,329 53,125,858 54,930,800
Production (t) Yield (kg rai–1)Region
1999-2000 2000-01 2001-02 1999-2000 2000-01 2001-02
North 4,959,508 5,413,972 5,760,935 423 463 469Northeast 8,537,114 9,138,697 9,465,818 276 306 306Central 4,669,353 4,469,952 4,924,125 487 487 513South 849,694 765,748 747,680 341 326 350Total 19,015,669 19,788,369 20,898,558 348 372 380
aLand unit: 6.25 rai = 1 ha.Source: Office of Agricultural Economics, Ministry of Agriculture and Cooperatives (2003).
Table 13. Dry-season rice: planted area, harvested area, production, and yield by region.
Planted area (raia) Harvested area (rai)Region
1999-2000 2000-01 2001-02 1999-2000 2000-01 2001-02
North 2,869,908 2,985,859 2,593,866 2,831,496 2,980,490 2,558,934Northeast 639,739 871,875 628,516 599,643 863,166 616,510Central 4,110,685 4,632,115 5,093,134 3,924,453 4,627,127 5,060,089South 240,724 227,628 118,551 235,220 222,783 116,308Total 7,861,056 8,717,477 8,434,067 7,590,812 8,693,566 8,351,841
Production (t) Yield (kg rai–1)Region
1999-2000 2000-01 2001-02 1999-2000 2000-01 2001-02
North 1,852,948 2,201,129 1,732,304 654 739 677Northeast 301,010 451,066 287,238 502 523 466Central 2,889,187 3,301,594 3,543,164 736 714 700South 112,598 101,720 52,568 479 457 452Total 5,155,743 6,055,509 5,615,274 679 697 672
aLand unit: 6.25 rai = 1 ha.Source: Office of Agricultural Economics, Ministry of Agriculture and Coperatives (2003).
133
ticeable in the dry season than in the wet season. This isprobably due to the frequent droughts and insufficient irri-gation water that the country has recently experienced. Tohelp alleviate this problem, the Thai government has beentrying to get farmers to reduce dry-season rice cultivationby replacing it with crops that require less water, but thisprogram has not been very effective.
Regional variation in rice production
Great variation occurs in rice cultivation by region, particu-larly in the varieties grown and in production managementand processes.
Rice varietiesFarmers in Thailand grow several rice varieties. The morepopular varieties are RD1, 2, 3, 4, and 9, which arenonphotosensitive varieties grown widely in all seasons.These varieties are promoted by the government. Photosen-sitive varieties include San Pathong, Kumpai, Rueng Pratue123, Nangpaya 132, Jasmine 105, and RD 6. These are usu-ally grown only in the wet season. Other varieties also existbut their cultivation is very much attached to certain areasor ethnic groups because of their more distinct characteris-tics. In the north and northeast regions, glutinous rice isgrown mostly for consumption, whereas nonglutinous vari-eties are mostly for sale. Farmers in the central and southernregions, on the other hand, grow mostly nonglutinous rice.
Cultivation and other management practicesRice cultivation and management practices also vary byregion, primarily because of the differences in land eleva-tion, climatic conditions, and water availability. For plantestablishment, for example, three major systems are prac-ticed.
Upland rice system. This is practiced on high-eleva-tion land such as upland and mountain slopes with rela-tively little water available. Land preparation is minimal.Several seeds are buried in a shallow and small pit made bya sharp stick or similar tool. Seeds germinate by moisturefrom soil during the rainy season. Weeding is needed. Thispractice covers a small area in the northern and southernpart of the country.
Transplanted rice. This system is widely practiced andit can be divided into two phases. The first phase is germi-nation of rice seeds in a rice seedling bed. It takes about 30days for the seedlings to grow. When the seeds are ready,they are transplanted, which is the second phase of cultiva-tion. This is also known as direct-seeded rice cultivation.
Broadcast rice. This type of cultivation needs landpreparation. Rice seeds are broadcast into a prepared ricefield. This is also a type of direct-seeded rice cultivationand can be further classified according to different tech-niques in land preparation and seed preparation. This prac-tice is less extensive but suitable when drought is frequentor a labor shortage exists.
Most farmers practice the transplanting system on low-land farms between mountain ranges and the direct-seededrice system on upland farms located on the mountain slopesin the northern region, where most paddy land is rainfed,but a few areas are irrigated and, hence, are also cultivatedwith dry-season rice.
Paddy lands in the northeast region are mostly undu-lating and rainfed lowlands. They are frequently affectedby drought. In the northern part of the region, a majority ofthe farmers grow transplanted early-maturing varieties ofglutinous rice. In the southern part and in the area along theMekong River, a majority of the farmers grow late-maturingvarieties of both glutinous and nonglutinous rice. Eventhough the transplanting system predominates, the broad-cast system is spreading very fast. This region has the larg-est rice cultivated area but landholdings are small.
Most of the central region is alluvial and has the largestirrigated rice area. Nonglutinous rice is predominant. Wherethe water depth is 1–3 m during the flooding season, float-ing or deepwater rice varieties are used. Where there is anirrigation system, the rice paddy is cultivated in both thedry and wet seasons. Wet-season rice extends from May toJanuary, whereas dry-season rice extends from January toApril. Productivity is higher in this region than in the otherregions. The total cultivated area is smaller than that of thenorth and northeast regions but is much larger than that ofthe south. Farm size per household is bigger, however, andproduction is more commercially oriented.
Rice-growing areas in the southern region are rainfedlowland along the coast and lowland between mountainranges. This region has the smallest rice cultivated area.The onset of the rainy season comes earlier on the easterncoast but later than in the other regions. Most of the farmersgrow wet-season rice except in small irrigated areas wheredry-season rice can be grown. Direct-seeded rice on para-rubber plantations is practiced in some areas. Wet-seasonrice is harvested during November and February.
Hand tractors have mostly replaced animal power inland preparation in the central region. Likewise, harvestingmachines combined with threshing machines are also be-coming more popular in the region. Animal draft power isstill used in the northern and northeastern regions, whereasharvesting and threshing are still done by hand.
Fertilizer application. Recommended rates of fertilizerapplication also vary and are highly dependent on soiltypes.
In clayey, loamy, and clayey-loamy soils that are pre-dominantly found in the central, northern, and southern re-gions of the country, the recommended fertilizer use is asfollows:
1. Before transplanting: application of NPK (nitrogen,phosphorus, potassium), which could be 16-20-0, 18-22-0, or 20-20-0 at 20 kg rai–1).
2. Before flowering: application of ammonium sulfate(20% N) at 12–22 kg rai–1 or urea (45% N) at 6–10 kgrai–1.

134
In sandy, sandy loam, loamy sand, and sandy loamy-clayey soils that are predominant in the northeastern andsome parts of the southern region, the recommended fertil-izer use is
1. Before transplanting: application of NPK, which couldbe either 16-20-0 or 20-20-0 at 20 kg rai–1 in combi-nation with potassium oxide (60% K
2O) at 4 kg rai–1
or 16-16-8 at 25 kg rai–1.2. Before flowering: application of ammonium sulfate
(20% N) at 4–12 kg rai–1 or ammonium chloride (25%N) at 4–10 kg rai–1 or urea (45% N) at 2–6 kg rai–1.
For most farmers, especially smallholders, the recom-mended fertilizer use has not always been followed becauseof economic problems in terms of investments.
Other important crops
Besides rice, other important crops directly or indirectlyinteract with livestock such as sugarcane, cassava, and para-rubber. Brief information on these crops is given below.
SugarcaneSugarcane is mostly grown in the uplands of the northern,northeastern, and central regions. The cultivated area forsugarcane in the north is about half of that in the northeastor central regions, respectively (Table 14). Over the pastdecade, a surge in sugarcane area and production took place
in the northeast as sugar mills increasingly relocated to theregion.
The sugar industry was once dubbed one of thecountry’s promising industries until 1996-97. The years thatfollowed witnessed a downturn in both cane and sugar pro-duction because of a relatively weaker export market. Areacultivated to sugarcane contracted after that and so did pro-duction, with yield rai–1 having remained almost constant(Table 15). Whether such a trend continues will greatly de-pend on various reforms to improve production efficiency,deregulate domestic markets, and explore new avenues andpartners in the export market. Further development of theindustry is still among the top priorities of the Thai govern-ment as the industry is also dominated by small farmers andtheir families.
Sugarcane-livestock interactions are few. In fact, sug-arcane cultivation has often been in conflict with livestockgrazing area, especially in upland areas. Sugarcane by-prod-ucts such as molasses are widely used, however, as feedingredients, especially for dairy cattle. Potential use of othersugarcane by-products as feed is limited.
Para-rubberPara-rubber has been grown commercially in Thailand forover a century. Its by-products, from both sap and wood, arevaluable as they help promote economic growth in the re-gion. A plantation of these trees is mainly a smallholding
Table 14. Sugarcane production: cultivated area, production, and yield by region, 1998-99–2000-01.
Cultivated area (rai)a Production (t) Yield (kg rai–1)Region
1998-99 1999-2000 2000-01 1998-99 1999-2000 2000-01 1998-99 1999-2000 2000-01
North 1,322,019 1,287,954 1,181,312 11,391,153 12,097,791 10,391,682 8,616 9,393 8,797Northeast 2,068,315 2,064,494 1,994,493 18,859,249 20,341,991 18,153,103 9,118 9,853 9,102Central 2,344,240 2,292,099 2,245,382 20,081,165 21,054,496 20,525,497 8,566 9,186 9,141Total 5,734,574 5,644,547 5,421,187 50,331,567 53,494,278 49,070,282 8,777 9,477 9,052
aLand unit: 6.25 rai ha–1.Source: Office of Cane and Sugar Board and Office of Agricultural Economics (2003).
Table 15. Country sugarcane production: cultivated area, production, yield rai–1, price, and value, 1991-92–2000-01.
YearCultivated area Harvested area Production Yield Price t–1 Value
(000 rai)a (000 rai) (000 t) (kg rai–1) (baht) (baht million)
1991-92 5,791 5,729 47,480 8,288 336 15,9531992-93 6,267 6,198 39,827 6,426 359 14,2981993-94 5,355 4,997 37,823 7,569 468 17,7011994-95 5,887 5,767 50,597 8,774 435 22,0101995-96 6,279 6,156 57,974 9,417 386 22,3781996-97 6,314 6,127 56,394 9,204 410 23,1221997-98 5,897 – 46,873 7,949 507 23,7651998-99 5,735 – 50,332 8,776 470 23,6561999-2000 5,906 – 53,494 9,058 446 23,8582000-01 5,421 – 49,070 9,052 491 24,093
aLand unit: 6.25 rai = 1 ha.Source: Office of Cane and Sugar Board and Office of Agricultural Economics (2003).

135
and was believed to be most suitable only in the southernpart of Thailand. However, para-rubber plantations are nowexpanding into the northeast.
From 1992 to 2001, cultivated area increased slightlyand has averaged about 11 million rai (Table 16). Therewere slight increases in production and yield per rai duringthe same period. The price per kg fluctuated around baht 20except in 1995, when it rose to baht 31.
Interactions with livestock raising are also nil, exceptfor the use of plantation areas for grazing underneath trees.
CassavaLike sugarcane, cassava used to be one of Thailand’s im-portant export crops, especially for the European market,but that market declined markedly. This affected cassavaproduction, primarily the cultivated areas, which declinedover time after years of preferential trade with the EU. How-ever, it is still an important crop for farmers in the eastern
part of the central region and the northeast region because itis tolerant of drought and pests and easy to cultivate andlook after. It can grow well in upland areas with poor soilfertility. Expansion of cassava cultivation area causes a re-duction in livestock grazing land. The use of cassava asanimal feed has been employed but not fully exploited.
Total cultivated and harvested area for cassava declinedfrom 7.4 to 6.2 million rai and from 7.3 to 6.0 million raifrom 2000 to 2002, respectively. The northeast region ac-counts for the largest contribution to cassava production, inboth area and production (Table 17). However, yield per raiis not much different across the regions (2.6 to 2.9 t).
Livestock, fish, and shrimp
Livestock are the second most important subsector withinthe agricultural economy in terms of value added. Live-stock production is closely related to the crop production
Table 16. Para-rubber production: cultivated area, yield, price, and value, 1992-2001.
YearCultivated area Harvested area Yield Yield Price Value
(000 rai)a (000 rai) (000 t) (kg rai–1) (baht kg–1) (baht 1 million)
1992 11,124 8,872 1,712 192.96 16.80 28,761.61993 11,213 9,067 1,811 199.73 16.00 28,976.01994 11,308 9,213 1,988 215.78 22.64 45,008.31995 11,376 9,348 2,061 220.47 31.13 64,158.91996 11,444 9,495 2,121 223.38 27.53 58,391.11997 11,454 9,548 2,169 227.16 23.29 50,516.01998 11,494 9,595 2,162 225.32 23.06 49,855.71999 11,526 9,676 2,199 227.26 18.05 39,691.92000 11,558 9,768 2,378 243.00 21.52 51,175.02001 11,590 9,857 2,424 245.91 20.76 50,322.2
aLand unit: 6.25 rai = 1 ha.Source: Office of Agricultural Economics, Ministry of Agriculture and Cooperatives (2003).
Table 17. Regional distribution of cassava production.
Cultivated area (rai)a Harvested area (rai)Region
2000 2001 2002 2000 2001 2002
North 1,035,380 971,637 885,721 994,247 927,290 876,753Northeast 4,219,849 3,861,890 3,339,746 4,037,690 3,617,323 3,314,294Central 2,150,742 2,084,242 1,998,397 2,036,451 2,013,188 1,985,329Total 7,405,971 6,917,769 6,223,864 7,068,388 6,557,801 6,176,376
Production (t) Yield (kg rai–1)Region
2000 2001 2002 2000 2001 2002
North 2,669,761 2,549,433 2,298,346 2,685 2,749 2,621Northeast 10,472,343 9,829,443 8,791,606 2,594 2,717 2,653Central 5,922,180 6,016,925 5,778,356 2,908 2,989 2,911Total 19,064,284 18,395,801 16,868,308 2,697 2,805 2,731
aLand unit: 6.25 rai = 1 ha.Source: Office of Agricultural Economics, Ministry of Agriculture and Cooperatives (2003).

136
system and is characterized by joint products and services.And, as with fish, livestock have long been the main staplefood–providing dietary protein for the Thai people. Thischapter discusses Thailand’s development efforts in rela-tion to livestock, including dairy, beef fattening, cattle,buffalo, swine, poultry (broiler and native chicken), as wellas freshwater fish and shrimp production.
Cattle production
Cattle raising in Thailand is mainly practiced bysmallholders and is integrated with other activities, mainlyrice cultivation. The purpose of cattle raising is to providefinancial security as cattle can be sold when an immediateneed for cash arises or slaughtered for special occasions.The cattle population in Thailand was 4,900,614 head in2000; more than half of the total number are in the north-eastern region (2,522,961) and 943,251, 849,237, and585,165 head are raised in the northern, central, and south-ern regions, respectively (Table 18). The cattle populationstarted to drop in 1996 for various reasons. One major rea-son was the extensive practice of monocropping for com-mercial purposes that replaced subsistence systems. Farmmechanization by hand tractors that made land preparationmore efficient reduced grazing land. Low cattle prices alsocontributed to the population decline. In more recent years,the cattle population has been once again on the rise. Thereversal of the cattle price trend provides incentives to farm-ers to go back to cattle raising. Government policies andprograms have also been contributing to the gradual rees-tablishment of cattle farms among smallholders. This in-cludes the intensified campaign for integrated or organicfarming as well as the development of the program that in-volves the promotion of one product per village (e.g., one
million–one village) that will be discussed in more detaillater.
Two major subcomponents of cattle production in Thai-land involve dairy production and cattle fattening for beef.
Dairy productionPrior to 1942, dairy raising was in the hands of Indians orPakistanis who were then working with Kasetsart Univer-sity and the Department of Livestock Development (DLD)that started dairy production trials. In 1967, some farmersand the private sector began to realize that dairy farmingmight be a good addition to their agricultural activities.The highlight of dairy-farming history was when his Maj-esty the King of Thailand and King Frederic IX of Denmarkinaugurated the Thai-Danish dairy farm in January 1972. Ademonstration dairy farm and milk-processing center werealso established in the King’s palace in Bangkok, completewith a marketing arm and scheme. An intensive campaignto increase milk consumption, especially among schoolchildren, started in 1985 with the setup of a National Com-mittee for Milk Drinking Campaign. Milk consumption percapita was targeted to be increased from 2 L per person peryear in 1984 to 7, 18, and 25 L per person per year in 1989,1997, and 2001, respectively. However, because of the 1997economic crisis, the production of ready-to-drink milk wasaffected despite the expanded dairy production activities,in which the dairy cattle population increased from 209,880in 1992 to 365,209 in 2001 (Table 19). Market expansionslowed down at 5–10% per year. Milk consumption targetswere not attained but efforts in dairy development contin-ued.
With the industry’s well-established institutional setup,dairy farming now appears to be more stable and have greaterpromise of providing farmers with a good opportunity to
Table 18. The cattle population in Thailand (head).
RegionYear
Central Northeastern Northern Southern Total
1986 1,211,084 1,501,736 979,739 595,297 4,287,8561987 1,193,136 1,490,967 1,051,569 595,751 4,331,4231988 1,237,185 1,553,524 1,120,073 589,958 4,500,7401989 1,363,614 1,762,387 1,239,528 621,412 4,986,9411990 1,479,527 1,959,185 1,417,016 655,265 5,510,9931991 1,704,775 2,286,484 1,731,145 713,373 6,435,7771992 1,846,544 2,418,377 1,866,620 767,439 6,898,9801993 1,711,923 2,713,393 2,047,417 762,651 7,235,3841994 1,659,101 2,874,947 1,986,639 885,045 7,405,7321995 1,627,590 2,811,216 1,955,937 927,078 7,321,8211996 1,242,521 2,477,834 1,272,189 861,985 5,854,5291997 1,060,221 2,302,091 1,046,774 882,850 5,291,9361998 904,957 2,027,597 887,236 748,160 4,567,9501999 855,232 2,219,437 875,403 685,669 4,635,7412000 849,237 2,522,961 943,251 585,165 4,900,614
Source: Modified from Office of Agricultural Economics, and Department of Livestock Development of Thailand (2001).

137
increase income. Almost all dairy farmers are members ofdairy cooperatives, which are spread all over the countrywhere dairy production and related activities are present.Each cooperative becomes a member of the national dairycooperative. The Dairy Promotion Organization Northeast,Thailand (2000), reported that an average dairy farm-hold-ing size is 33.8 rai, with 13.4 head of dairy cattle, 4 or 5 headof which are milking cows. The average milk yield is 9.5 kgper cow per day, hence providing each average farm with atotal daily milk production of at least 38 kg. This is roughlyequivalent to a monthly gross income of about baht 15,490per month per farm.
Regional dairy production activities are shown in Table20. In 2001, there were 365,209 dairy cattle, most of whichwere concentrated in the central region, with a total numberat 242,034. The respective populations in the northeasternregion, northern region, and southern region are 87,038,29,243, and 6,894 head. Further expansion of the dairy in-dustry among the small farm holders, however, has beenaffected by the comparatively high initial investment toestablish a dairy farm. The other problem relates to fresh-milk marketing, which has occurred from time to time notbecause of a slack in demand but because of inefficientlocal market mechanisms.
Basically, dairy production in Thailand depends onboth roughage and crop by-products for feed. In areas where
there are pineapple-processing factories, palm oil mills, sug-arcane plantations, or any other major crop by-productsavailable, supplementary feeding of feed formulated by us-ing by-products combined with concentrate is used to main-tain full milk production throughout the year. In the centralregion, where corn, including baby corn, is produced andpasture is limited, corn stalks, baby corn residues, and ricestraw are commonly used in the feeding system. Dairy cattlefeeding the northern region is mainly the cut-and-carry sys-tem with little pasture area for grazing; thus, supplementalconcentrate feeding is important. Crop by-products such assoybean, rice straw, corn stalks, and by-products from brew-ery as part of the feeding system are also used. In the north-eastern region, a small pasture area of each farm is used forgrazing with concentrate supplement. Main-crop by-prod-ucts, cassava, and rice straw are used, unlike in the area ofthe lower northeast and northeast of the central region,where each farm has a larger area of pasture grazing and thecut-and-carry system is practiced. Here, farm mechaniza-tion with heavy equipment, such as a tractor and accesso-ries, is often used. Unlike in the systems in the southernregion where the main crops are para-rubber, oil palm, fruittrees, and coconuts and pasture area is limited, crop resi-dues are used as a part of concentrate feeding and roughagesources.
Beef fatteningBesides general cattle and buffalo raising, Thailand has alsodeveloped beef-fattening farms, but still in a limited quan-tity and intensity compared with dairy operations. Exoticbreeds are used for crossbreeding with native Brahman.Yearlings are sold for fattening while slaughtered cattle andbeef are sold in specific markets. To some extent, beef pro-duction has replaced frozen beef imports. Farmers in beef-fattening endeavors are also formed into cooperatives orgroups, especially in the central and northeastern regions.
Buffalo production
Buffaloes have been mostly raised by small farmers, prima-rily for animal power and secondarily for meat production.The buffalo population in Thailand was 1,702,223 head in2000, with the northeastern region accounting for the larg-est population (1,406,422 head). The buffalo population in
Table 19. Number of dairy cattle and milk production in Thailandduring 1992-2001.
Year Dairy cow (head) Milk production (t)
1992 209,880 217,9941993 224,007 255,0481994 241,500 205,4071995 265,254 307,2291996 286,932 343,3871997 307,964 385,7281998 323,254 437,1161999 339,265 464,5142000 352,010 520,1152001 365,209 564,313
Source: Modified from Office of Agricultural Economics, and Department of LivestockDevelopment of Thailand (2001).
Table 20. Dairy cattle and milk production by region.
Dairy cows (head) Fresh milk (t)Region 1999 2000 2001 1999 2000 2001
Northern 25,344 27,561 29,243 35,166 39,781 46,773Northeastern 84,714 84,790 87,038 99,997 113,648 129,557Central Plain 222,699 232,954 242,034 321,844 358,226 378,919Southern 6,508 6,705 6,894 7,507 8,460 9,064Total 339,265 352,010 365,209 464,514 520,115 564,313
Source: Modified from Office of Agricultural Economics, and Department of Livestock Development of Thailand (2001).

138
other regions was 151,829, 98,968, and 44,984 head in thenorthern, central, and southern areas, respectively (Table21). The population trend of buffalo has been downwardbecause of factors similar to those in the case of cattle butwith greater emphasis on the replacement of animal powerby hand tractors. The buffalo population is not expected toincrease to the same number as in previous years in the nearfuture since buffalo raising is comparatively more difficultthan cattle raising. More labor is needed to look after theanimals during watering and wallowing. In addition to thisis their great dependence on water, unlike cattle. Labor look-ing after cattle could attend to other activities at the sametime.
Pig production
Pig production in Thailand has changed from traditional orbackyard production based on forest and other agriculturalby-products and household wastes or leftovers as feed toindustrial production systems that are more dependent oncommercial feed and that involve more specialized equip-ment. It has also changed from raising low-yielding indig-enous breeds to the high-yielding exotic breeds. Thai swineproducers use three popular breeds of pig: Large white, Lan-drace, and Duroc. All these changes took place in the lastdecade, especially in the provinces around Bangkok, andcatered to more discerning markets such as Hong Kong andJapan. Traditional systems have continued to be observedin very limited areas, however, especially in rural areas farfrom the cities. But the proportion of these systems hasdwindled significantly over time.
Swine production and consumption have remainedstable during the past decade (Table 22). Unless the export
Table 22. Pig production and consumption in Thailand (millionhead).
Year Pig production Consumption
1992 8.67 8.341993 9.18 8.731994 9.79 9.851995 9.78 9.021996 10.23 9.461997 10.66 10.471998 9.38 10.091999 9.08 8.892000 9.48 9.362001 9.67 9.582001 9.80 9.70Growth rate (%) 0.46 1.02
Source: Modified from Office of Agricultural Economics, and Department of LivestockDevelopment of Thailand (2001).
Table 21. The buffalo population in Thailand (head).
RegionYear
Central Northeastern Northern Southern Total
1984 412,849 3,699,938 844,844 161,282 5,118,9131985 374,845 3,936,178 792,261 148,949 5,252,2331986 334,798 3,764,385 742,750 138,861 4,980,7941987 316,045 3,602,539 646,085 118,930 4,683,5991988 300,364 3,564,860 650,696 103,906 4,619,8261989 286,439 3,646,048 583,184 96,021 4,611,6921990 303,329 3,735,930 564,669 90,362 4,694,2901991 324,752 3,817,452 566,360 96,507 4,805,0711992 310,090 3,792,678 532,975 92,528 4,728,2711993 287,048 3,908,575 524,790 83,733 4,804,1461994 255,971 3,460,440 431,025 77,355 4,224,7911995 228,023 3,009,063 398,562 74,413 3,710,0611996 153,892 2,258,494 236,686 70,602 2,719,6741997 135,618 1,911,639 187,095 59,586 2,293,9381998 109,806 1,614,867 171,371 55,024 1,951,0681999 97,879 1,503,175 151,134 47,417 1,799,6052000 98,968 1,406,442 151,829 44,984 1,702,223
Source: Modified from Office of Agricultural Economics, and Department of Livestock Development of Thailand (2001).
market for pigs and pig meat expands further, the growthrates in pig production and consumption will be more orless maintained. Table 23 shows the regional distributionof pig-raising households in Thailand. The central regionaccounted for 3.9 million head in 2002. In the northeastern,northern, and southern regions, the populations were 1.4million, 1.1 million, and 0.7 million head, respectively.
More recent efforts to strengthen the pig industry werethe revival of the traditional system of pig raising in linewith the growing campaign toward the promotion of sus-tainable agricultural practices. This revival, however, in-volved more modern technology, especially that related tobreed selection, feed management, housing, and animal

139
health care. In 1992, 0.56 million households were raisingpigs but about 99.3% were just secondary pig raisers in thesense that they had other activities as their primary occupa-tion. These households took care of a few head in their back-yard or close by their homestead, primarily to supplementhousehold income. Included here are the traditional grow-ers, some of them still using indigenous breeds. Most ofthese farmers are owners of small rice mills or are related tothe owners of rice mills. They use the rice bran from ricemilling as supplemental feed for their animals. The primaryraisers, which account for only 0.7% of the pig-raisinghouseholds, devote full time to pig raising. These were fur-ther classified into three groups according to the number ofanimals they hold per farm: small farms (with less than 100head), 39.1%; medium farms (with 101–500 head), 40.0%;and big farms (with more than 500 head), 20.9%. The pro-portion of primary versus secondary pig raisers has notchanged. Current observations indicate that the primary pigraisers have grown to about a million and the proliferationof the medium to big farms has been more rapid, whereas thesmall farms have been decreasing. Some existing primarypig raisers have more than 5,000 sows per farm.
Primary pig raisers are further classified according towhether they are independent, on contract, or of a commer-cial type as follows:
Independent farms. Independent farms range from smallto large farmers, with animal numbers ranging from 1,984 to2,002. The owners are responsible for all investments oninputs. The feed supply for production on big farms is usu-ally their own formulation, which is a mixture of several rawfeed ingredients. In the small to medium farms, feed used isusually a mixture of raw feed materials that are available in
the local area (such as rice bran, broken rice, cassava, etc.)and commercial feed concentrates that are bought from themarket. These farmers are responsible for slaughtering andmarketing the animals.
Contractual pig raisers. Owners of contracted farmsare responsible for some inputs such as housing and equip-ment, labor, water, electricity, and land. The companies theyare in contract with are responsible for the animals, feed(which is mostly commercial feed), vaccine and medicines,technical advisers, and marketing. The farmer-contractorshares in pig sale proceeds, usually about baht 300 per fat-tening pig per crop or about baht 25,000 per 100 sows raisedper month.
Commercial or industrial farms. Commercial or indus-trial farms are companies that operate their business in avertically integrated fashion. They control every step fromselection of breeding stock to marketing pork in the market.The feed resources are mostly produced by the feed indus-try section of their own company. Feed concentrates pro-duced consist of raw materials from local and importedsources, especially protein sources (such as soybean mealand fish meal) from South America and China. Big indus-trial farms produce a large number of fattening pigs for do-mestic consumption (90% of production) and export toneighboring countries in Asia as processed products.
Poultry production
Among the subsectors within the livestock sector, the broilerindustry has become the most important in terms of exportearnings. Chicken production has been on the increase, too.Exports have been mostly to neighboring countries in the
Table 23. Number of pigs by region in Thailand.
RegionYear
Central Northeastern Northern Southern Total
1984 2,387,485 1,229,449 1,272,945 453,157 5,343,0361985 2,986,523 1,181,150 1,288,093 463,076 5,918,8421986 3,189,965 1,153,302 1,141,806 387,447 5,872,5201987 3,409,527 1,072,110 1,029,344 355,906 5,866,8871988 3,033,011 1,221,207 1,130,287 355,894 5,740,3991989 3,093,289 1,393,815 1,043,283 485,011 6,015,3981990 4,059,541 1,448,421 1,284,897 556,851 7,349,7101991 4,642,614 1,616,615 1,362,850 580,393 8,202,4721992 4,466,067 1,594,233 1,515,526 756,842 8,332,6681993 4,307,256 1,860,633 1,650,352 780,885 8,599,1261994 4,636,895 1,523,744 1,545,303 773,458 8,479,4001995 4,656,843 1,414,974 1,717,817 772,287 8,561,9211996 5,332,550 1,360,637 1,194,921 819,779 8,707,8871997 5,763,198 1,890,084 1,455,986 1,029,772 10,139,0401998 4,846,228 1,688,647 1,257,636 979,764 8,772,2751999 4,145,954 1,463,789 1,040,555 772,803 7,423,1012000 4,393,218 1,391,184 1,195,630 781,024 7,761,0562001 4,720,146 1,382,109 1,274,065 826,950 8,203,2702002 3,978,677 1,142,126 1,105,955 762,394 6,989,152
Source: Modified from Office of Agricultural Economics, and Department of Livestock Development of Thailand (2001).

140
region, primarily to Japan. New finished or semifinishedchicken products such as chicken balls and sausages arealso helping to boost Thai exports. Native chicken produc-tion remains in the hands of smallholders.
Broiler productionProduction of broilers in Thailand expanded dramaticallyover the period 1998-2000 (Table 24). The highest concen-tration of production is in the central region, with more than600 million birds. There were only 83 million, 169 million,and 64.1 million birds in the northeastern, southern, andnorthern regions, respectively.
Broiler production is mainly operated by big agro-in-dustry enterprises, for both domestic consumption and ex-port. In 1999, Thailand produced 848.0 million broilers, ofwhich 491.8 million are for domestic consumption and356.5 million for export. Besides broilers, native chickensalso contributed 13% to the total chicken meat produced.In the central part of Thailand in 1993, 6,029 commercialbroiler producers could be classified according to their size(Table 25).
Broiler production is vertically integrated. Figure 6shows the industrial broiler production system. The indus-try supplies inputs, chicks, feed, medicine and vaccine, hous-ing and equipment, and marketing to producers in a form ofcredit and manages the slaughterhouse and packing sys-tem. The industry also operates the feed industry, parentstock, veterinary products, hatchery, and slaughterhousedown to meat products and products for export. Producersunder contract simply operate the raising part. A smallamount of backyard chicken production goes through thisoperation.
Types of broiler producersIndependent broiler producers make their own investmentsin inputs just like those in pig production. The price ofbroilers very much depends on demand and supply. Theseproducers are limited in number.
Contracted producers, on the other hand, invest in hous-ing, equipment, and labor while the contractor industry sup-plies credit in kind in the form of chicks, feed, and vaccina-tions. The price of output as well as its market are guaran-
teed although sometimes these do not work well. Credit isdeducted from income derived from broilers sold.
Agribusiness-type farms usually cater to both local andexport markets. In 2002, 20 million chicks per week wereproduced from this type for domestic consumption and ex-port. In 2003, chicken meat exports to the European marketincreased because of concerns about food safety with theoutbreak of mad cow disease and bird flu. As a result, pro-duction expanded to 21.5–24.0 million chicks per week.Most of the big producers improved their production sys-tem and even tried to establish disease-free and high-qual-ity controlled-colony farms primarily to cater to the importdemand of the European market.
Native chicken productionNative chicken raising (13% of national chicken meat pro-duction) has been with smallholder farmers in Thai ruralsociety for a long time. It is part of their traditional liveli-hood. The native chickens are raised primarily for animalprotein, for entertainment (cock fighting), and minimallyfor sale in the domestic market as well as for the exportmarket. With the greater emphasis on genetic conservation,the production of native chickens has become more andmore popular.
Native chicken production is highest in the northeast-ern region, with 43.2 million birds. The numbers were 33.7million, 12.7 million, and 9.7 million in the northern, cen-tral, and southern regions in 2000, respectively (Table 24).Most native chicken production is for domestic consump-tion in both rural and urban areas, with a value of about baht5,960 million (baht 60 each) in 1999.
Table 24. Production of broilers, 1998-2000, and native chickens, 1997-99, by region (unit = no. of birds).
Broilers Native chickensRegion
1998 1999 2000 1997 1998 1999
Northern 61,676,927 63,555,931 64,090,285 30,691,302 30,859,312 33,733,067Northeastern 76,743,327 80,534,944 83,115,970 39,887,242 40,736,911 43,172,041Central Plain 614,456,148 640,157,348 674,289,629 12,050,452 12,090,309 12,720,223Southern 66,898,521 69,316,043 69,469,091 8,862,858 8,972,959 9,713,673Whole Kingdom 819,774,923 853,564,266 890,964,975 91,491,854 92,659,491 99,339,003
Source: Modified from Office of Agricultural Economics, and Department of Livestock Development of Thailand (2001).
Table 25. Classification of broiler producers according to farmsize.
Farm size (head) %
500–2,000 16.722,001–5,000 36.635,001–10,000 24.43Over 10,000 20.22
Source: Modified from Office of Agricultural Economics, and Department of LivestockDevelopment of Thailand (2001).
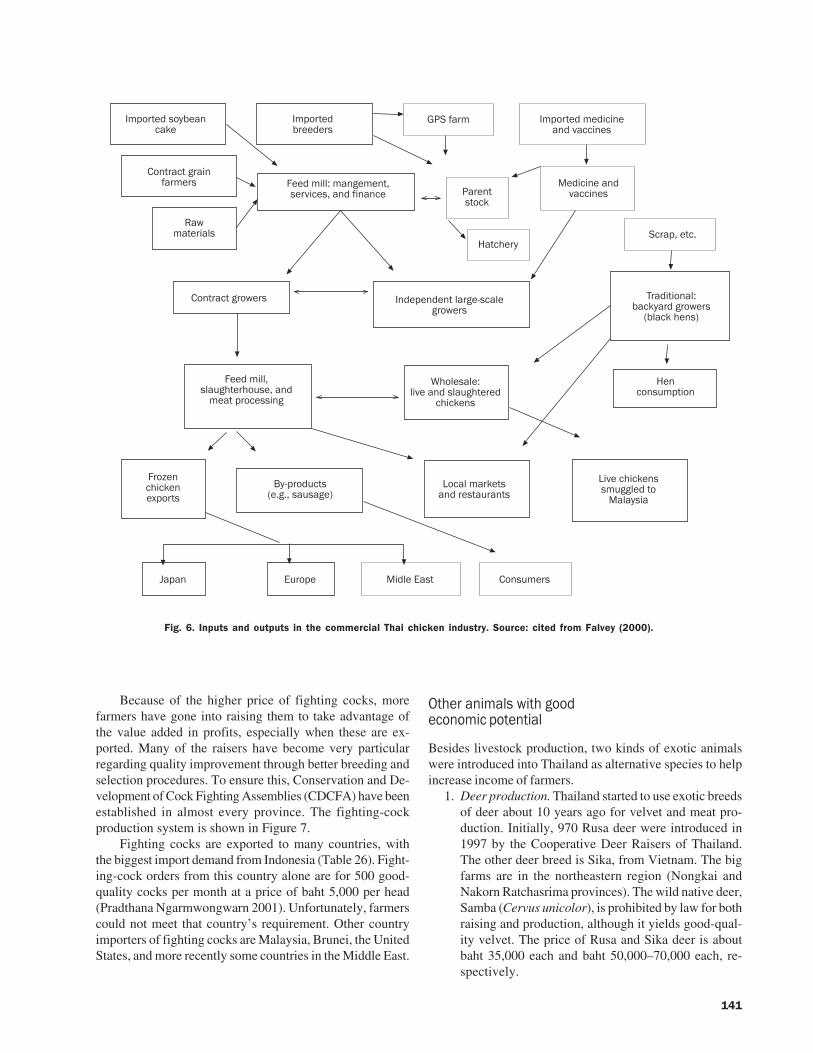
141
Because of the higher price of fighting cocks, morefarmers have gone into raising them to take advantage ofthe value added in profits, especially when these are ex-ported. Many of the raisers have become very particularregarding quality improvement through better breeding andselection procedures. To ensure this, Conservation and De-velopment of Cock Fighting Assemblies (CDCFA) have beenestablished in almost every province. The fighting-cockproduction system is shown in Figure 7.
Fighting cocks are exported to many countries, withthe biggest import demand from Indonesia (Table 26). Fight-ing-cock orders from this country alone are for 500 good-quality cocks per month at a price of baht 5,000 per head(Pradthana Ngarmwongwarn 2001). Unfortunately, farmerscould not meet that country’s requirement. Other countryimporters of fighting cocks are Malaysia, Brunei, the UnitedStates, and more recently some countries in the Middle East.
Other animals with goodeconomic potential
Besides livestock production, two kinds of exotic animalswere introduced into Thailand as alternative species to helpincrease income of farmers.
1. Deer production. Thailand started to use exotic breedsof deer about 10 years ago for velvet and meat pro-duction. Initially, 970 Rusa deer were introduced in1997 by the Cooperative Deer Raisers of Thailand.The other deer breed is Sika, from Vietnam. The bigfarms are in the northeastern region (Nongkai andNakorn Ratchasrima provinces). The wild native deer,Samba (Cervus unicolor), is prohibited by law for bothraising and production, although it yields good-qual-ity velvet. The price of Rusa and Sika deer is aboutbaht 35,000 each and baht 50,000–70,000 each, re-spectively.
).�# �%���('��1@�
).�# �%'#��%�#�
!�� #1 ��#��,#)�#� ;��%�)�$$2�)���)�� 0
��#/�1��0��%�,���1�
!�� #1 ��#�-�#�
�-) �#�$�
�%�.��%�� �$#��&�1$��#�-�#�
B 1��#(
?#�� � �1@
"?�,#) ).�# �%�)�%�1����%�/11����
;��%�)�$$0�$��� �#�����0��%
)� �.#�1������
���$��$�2$�/���%��$��� �#�%
1��1@���
;#�:��1��1@���+.�# �
�(&.#�%�1 �4�6�60������5
C.� ��#�.� *�%$���� !����)�#�
9�1$�)#@� ��%�#�� �#� �
9�/��1��1@����)���$�%� �
*$(��
B��1����). ���
�#%� ���$2'1@(#%��#�-�#�
4'$1@�����5
1#.0�� 16
*�%�1�����%/11����
Fig. 6. Inputs and outputs in the commercial Thai chicken industry. Source: cited from Falvey (2000).

142
Fig. 7. The fighting-cock raising system.
* ���
9(���
�1�' ���
�#��%�����%�#�����
�$�1 ��� !�$$���
�#������,�#�,�� ����4�<���)�� ��5
;��%
;��� �������#���.� �����)�� ��
�$$�%%�%�/$��
�<��)�� ��
��-��@�
��-��@�
�<���-��@�
�<��)�� ��
Table 26. Fighting cocks exported from Thailand.
Export 1998 1999 2000 2001 2002country
Birds Bahta Birds Baht Birds Baht Birds Baht Birds Baht
Total 1,937 953,900 3,628 4,702,260 5,437 6,446,000 5516 8,138,000 5666 3,089,900Indonesia 1,737 863,500 3,513 4,572,000 5,204 6,212,500 5272 7,801,000 4459 2,219,900Malaysia 25 12,500 0 0 75 37,500 112 194,000 266 359,000U.S. 6 3,000 7 6,500 17 31,000 18 14,000 30 15,000Philippines 11 3,000 0 0 0 0 0 0 0 0Myanmar 0 0 0 0 0 0 20 30,000 45 51,500Vietnam 0 0 0 0 2 2,000 0 0 2 1,000Brunei 10 5,000 26 31,220 14 7,000 14 7,000 31 15,500Laos 2 400 0 0 0 0 0 0 0 0Cambodia 0 0 20 4,000 0 0 0 0 1 500Hong Kong 0 0 0 0 55 65,000 0 0 0 0China 0 0 0 0 14 10,000 0 0 0 0France 0 0 0 0 17 20,000 10 20,000 11 5,500United Arab Emirates 0 0 0 0 15 23,000 12 6,000 23 11,500Kuwait 0 0 0 0 2 4,000 0 0 505 252,500Bahrain 0 0 0 0 5 0 42 58,000 286 154,500Switzerland 0 0 0 0 13 26,000 0 0 0 0Other 146 66,500 62 88,540 4 8,000 16 8,000 7 3,500
aCurrency rate: baht 40 = US$1.Source: International Animal Quarantine Station, Bureau of Disease Control andVeterinary Service, Department of Livestock Development (2001).
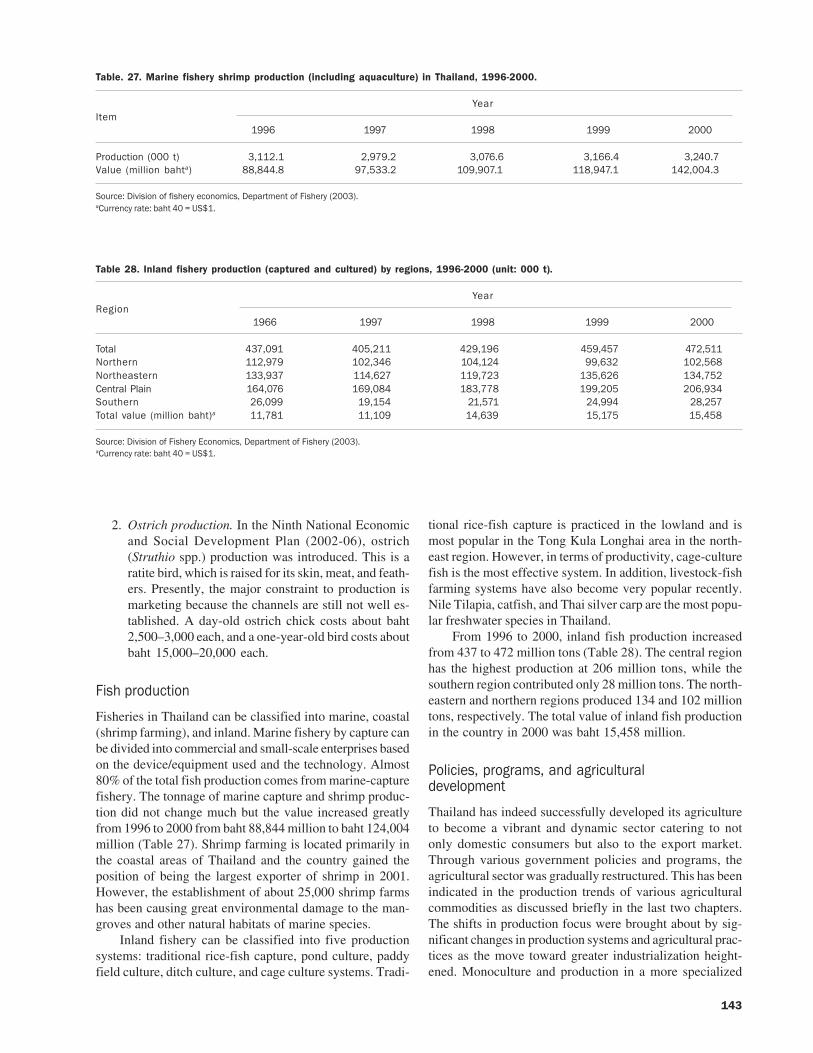
143
2. Ostrich production. In the Ninth National Economicand Social Development Plan (2002-06), ostrich(Struthio spp.) production was introduced. This is aratite bird, which is raised for its skin, meat, and feath-ers. Presently, the major constraint to production ismarketing because the channels are still not well es-tablished. A day-old ostrich chick costs about baht2,500–3,000 each, and a one-year-old bird costs aboutbaht 15,000–20,000 each.
Fish production
Fisheries in Thailand can be classified into marine, coastal(shrimp farming), and inland. Marine fishery by capture canbe divided into commercial and small-scale enterprises basedon the device/equipment used and the technology. Almost80% of the total fish production comes from marine-capturefishery. The tonnage of marine capture and shrimp produc-tion did not change much but the value increased greatlyfrom 1996 to 2000 from baht 88,844 million to baht 124,004million (Table 27). Shrimp farming is located primarily inthe coastal areas of Thailand and the country gained theposition of being the largest exporter of shrimp in 2001.However, the establishment of about 25,000 shrimp farmshas been causing great environmental damage to the man-groves and other natural habitats of marine species.
Inland fishery can be classified into five productionsystems: traditional rice-fish capture, pond culture, paddyfield culture, ditch culture, and cage culture systems. Tradi-
tional rice-fish capture is practiced in the lowland and ismost popular in the Tong Kula Longhai area in the north-east region. However, in terms of productivity, cage-culturefish is the most effective system. In addition, livestock-fishfarming systems have also become very popular recently.Nile Tilapia, catfish, and Thai silver carp are the most popu-lar freshwater species in Thailand.
From 1996 to 2000, inland fish production increasedfrom 437 to 472 million tons (Table 28). The central regionhas the highest production at 206 million tons, while thesouthern region contributed only 28 million tons. The north-eastern and northern regions produced 134 and 102 milliontons, respectively. The total value of inland fish productionin the country in 2000 was baht 15,458 million.
Policies, programs, and agriculturaldevelopment
Thailand has indeed successfully developed its agricultureto become a vibrant and dynamic sector catering to notonly domestic consumers but also to the export market.Through various government policies and programs, theagricultural sector was gradually restructured. This has beenindicated in the production trends of various agriculturalcommodities as discussed briefly in the last two chapters.The shifts in production focus were brought about by sig-nificant changes in production systems and agricultural prac-tices as the move toward greater industrialization height-ened. Monoculture and production in a more specialized
Table. 27. Marine fishery shrimp production (including aquaculture) in Thailand, 1996-2000.
YearItem
1996 1997 1998 1999 2000
Production (000 t) 3,112.1 2,979.2 3,076.6 3,166.4 3,240.7Value (million bahta) 88,844.8 97,533.2 109,907.1 118,947.1 142,004.3
Source: Division of fishery economics, Department of Fishery (2003).aCurrency rate: baht 40 = US$1.
Table 28. Inland fishery production (captured and cultured) by regions, 1996-2000 (unit: 000 t).
YearRegion
1966 1997 1998 1999 2000
Total 437,091 405,211 429,196 459,457 472,511Northern 112,979 102,346 104,124 99,632 102,568Northeastern 133,937 114,627 119,723 135,626 134,752Central Plain 164,076 169,084 183,778 199,205 206,934Southern 26,099 19,154 21,571 24,994 28,257Total value (million baht)a 11,781 11,109 14,639 15,175 15,458
Source: Division of Fishery Economics, Department of Fishery (2003).aCurrency rate: baht 40 = US$1.
144
and commercial manner took over the traditional systemspracticed prior to the adoption of the country’s 1st NationalEconomic and Social Development Plan; thus, the signifi-cant alteration of crop and animal mixes. The followingsection briefly discusses the various policies and programsthat influenced agricultural development and how these havebeen biased against the promotion and strengthening ofintegrated crop-animal systems.
Price intervention to promoteimport substitution
The 1st National Economic and Social Development Planin the early 1960s clearly indicated the dual role of theagricultural sector as a provider of foreign currencies neededto finance the move toward industrialization as well as aprovider of cheap food sources for the rapidly growing ur-ban and industrial population. As a provider of cheap food,agricultural policy emphasized further improvement of yieldand production intensification to increase productivity. TheCentral Plain of Thailand took advantage of the policy wherea full-scale Green Revolution took place. In this area, doubleand triple rice cropping became widespread with massiveapplications of fertilizer and pesticides. Farm mechaniza-tion, especially plowing tractors and combine-harvesters,was introduced and has predominated in the region sincethe mid-1980s. The monoculture of rice, in particular, leftlittle time for farm households to do anything else, not evenraise animals or cultivate other crops. This started the moveaway from integrated farming systems.
As Thailand is a major export earner, price interventionwas imposed in the form of export taxes on agricultural rawmaterials, including rice, primarily to increase the foreignexchange revenue of the government. At the same time,domestic price subsidies were provided to help raise farm-ers’ as well as millers’ income while passing on to consum-ers lower-priced food (Siamwalla 1991). This was in linewith the government’s cheap food policy that later on provedto be very expensive. In fact, government intervention didnot yield good results as farmers started to shift away fromproducing export goods such as rice. It also harbored ineffi-ciency among farmers even in the major production areas,which hurt the agricultural sector as a whole.
Market liberalization for exportpromotion and industrialization
The 1980s saw another change in Thailand’s trade policythat shifted explicitly in the direction of export promotion,thus reducing export taxes and devaluing the baht. At thesame time, protection of local industries and local tariffsdecreased. The liberalization of Thai trade and the financialsystems presumably promoted the expansion and commer-cialization of agriculture in formerly remote areas (Coxheadand Phagpraphan 1998). Farm production began to be ver-tically integrated with factory processing and agribusiness
management. These trends, along with infrastructure devel-opment, facilitated specialization in agricultural economieseven in those areas where subsistence concerns formerlydominated land-use decision-making. The restructuring ofthe agricultural system came about to curb the simultaneousoccurrence of the end of the land frontier, the fall in agricul-tural prices (particularly for staple crops), and the industrialboom that confronted Thai farmers with a cost-price squeeze.Government efforts gradually shifted production away fromupland rice and maize cultivation geared primarily for do-mestic consumption to the more intensive cultivation ofhigh-value crops such as sugarcane and cassava (because oftheir good export prospects until the late 1990s), and morerecently vegetables, flowers, fruit trees, bamboo, cattle, andmilk cows that were primarily absorbed by the manufactur-ing sector (TDRI 1995).
Various programs have been launched to promote andfacilitate agricultural restructuring. One such program is theOne Tambon One Product (OTOP) program that stimulateseach village to get involved in the local processing of food,including meat, fish, fruits, and/or vegetables rather thanselling them raw in the market. A similar program is the OneB Million One Village that provides capital investment forvillages to venture into expanding agricultural opportuni-ties and projects. As overall support for these developmentprograms, credit systems were expanded and strengthenedand farmers’ existing debts were restructured, extendingtheir debt payment for an additional three years.
The transformation of highland agriculture in northernThailand provides a vivid example of how the restructuringpolicy has made an impact so far. Just about two decadesago, food cultivation in the highlands of this region con-sisted almost exclusively of rice, maize, and minor veg-etable crops, all grown primarily for susbsistence. A major-ity of the rural population derived its income primarily fromagriculture. Animal-drwn carts were the only means of trans-portation over roads that became effectively impassableduring the rainy season. Poverty was endemic, and averagelevels of educational attainment extremely low. Today,however, most agriculture is commercially oriented, andremote households that once produced subsistence staplesalmost exclusively are now able to produce a much widerrange of crops—notably fruits and vegetables—for distanturban markets, taking advantage of paved roads, pickuptrucks, and cellular phones. Farm households, especiallytheir children, have increasingly participated in off-farmand urban labor markets. For the typical farm family, allthese changes have raised real income and reduced vulner-ability across seasons and years.
The overall success of the agricultural restructuringpolicy will still have to be evaluated, however, not only onthe basis of its economic impact but also its long-term effecton the environment, as this has primarily taken place in themore fragile upland areas. Much of this success is contin-gent upon the ability of the government to provide adequatetechnology to sustain and further improve productivity in

145
these crops as the private sector’s contribution may be muchsmaller than expected. It is also contingent upon the devel-opment of markets for these “new” high-value products thatwould encourage farmers to invest in infrastructure andequipment to sustain the systems. Except for rice, the do-mestic prices of all major agricultural products are deter-mined by prices in the world market, which Thailand hastoo small a part of to influence in any significant way.
Promotion of more sustainable agriculture
Past agricultural policies have harbored specialization andcommercialization, even in the remote rural areas, and driftedaway from what was once the traditional production systembased on integrated farming, including crop-animal inte-gration. Concerns about sustainability are now increasingfrom all sectors, including the government; hence, the King’snew theory of encouraging and reinvigorating agriculturalproduction based on the sustainable use of natural resourceswith minimal impact on ecosystems and the environment.The 8th and 9th National Economic and Social Develop-ment Plans embody more strongly, although vaguely, theconcept of “sustainable agriculture” based on natural farm-ing, organic farming, integrated farming, and agroforestry.With this new policy development, crop-animal integra-tion can again be at the forefront, especially in the country-side of the north and northeast regions where farmers arepoorest and income from crop cultivation, particularly rice,is most meager because of the small landholdings.
Policies specific to the developmentof the rice sector
Thailand aims not only to maintain its position as a topexporter of rice but also to dominate the market for high-quality rice. In line with this objective, greater efforts havebeen channeled into improving production efficiency andmaintaining high grain quality standards, thus the contin-ued focus on technology development through research,improvement of postharvest and infrastructure, more strate-gic market expansion, and promotion. Rice research sta-tions have long been established all over the country andall these are fully functioning. Research is geared primarilytoward higher-quality grain from breeding to marketing,but the achievement is still fragmented. Research on riceby-product development for value added is very much apart of the rice research agenda, but until now has beenlimited.
Rice exporting is mostly in the hands of the privatesector. However, government support is primarily for im-proving the mechanism to facilitate and expedite exportprocedures. It has also helped in advertising Thai rice bysetting up “road shows” in different countries to promoteThai products, such as rice, especially jasmine rice, and pro-mote new rice varieties such as organic rice. With its moreliberal market policy, the government no longer intervenesin commodity prices as it did before but tries to establish
different mechanisms to help keep the price from goingdown and to see to it that rice farmers receive a fair propor-tion of benefits from selling rice.
Specific policies to further developthe livestock sector
Numerous policies and initiatives directly or indirectly in-fluence livestock production, processing, and marketing.The more relevant ones that have implications for strength-ening integrated crop-animal systems are presented below.Note that some of these policies/initiatives have alreadybeen mentioned earlier.
Farmer debt restructuring. The program allowed a num-ber of indebted farm households, some of them involved inintegrated farming, a three-year grace period to repay theirloans. It also provided seed capital for raising cattle and/orbuffalo. This program supports the agricultural restructur-ing effort of the government.
One B million one village. One B million one villageappears to play an important role in reviving the livestockpopulation, especially cattle. Because of the high presentvalue of cattle, many farmers use their share of this avail-able budget to buy livestock and incorporate them ontotheir farms.
Sustainable agriculture. Organic farming, alternativeagriculture, or integrated farming systems are included.These practices are similar and they generate more demandfor livestock manure; thus, livestock can be integrated intothe systems and this in turn stimulates livestock raising andmanure trading. In certain provinces, organic farming hasbecome a provincial policy. Government and nongovern-ment agencies are involved in extending these practices.Local farmer organizations and their networks are creatingsocial movement in this direction. Organic livestock farmshave started to emerge now.
Sufficiency economy. This is proposed by the King andhas become a strong trend and more or less a developmentpolicy by emphasizing self-reliance. The system also cre-ated a similar demand for livestock raising and manure aswith the above group of practices.
Contract farming. Contract farming, though it has notbeen spelled out clearly as a policy, is increasing. The mostobvious activities are broilers, layers, swine, and fish.
Livestock bank. A livestock bank, especially cattle and/or buffalo banks, has long been promoted and establishedby the King, government, and nongovernment sectors. Fail-ure and success are reported.
Charity fund raising or donations. Charity fund rais-ing or donations as cash or as animals to save livestock,especially cattle or buffaloes, from being slaughtered havebeen with the Thais for a long time. This practice is basedon Buddhist beliefs and it is also linked to the livestockbank. Both the livestock bank and livestock fund havehelped in the redistribution of livestock back into rural ar-eas.

146
Slaughtering license. Issuing a license to slaughter pigs,cattle, and buffalo has recently been passed down to thetambon level. This resulted in more widespread meat sell-ing stalls in rural areas (issuing of the license is under theLocal Administration Department, Ministry of Interior).
Dairy promotion (1997-2001). This program is to in-crease the quality and quantity of milk production; the pro-duction target is 3.6 t per year per animal. Within five years,40,000 dairy cows would be extended to farmers. Beforethis program, there were policies related to dairy such asDairy Products Manufacturing (Ministry of Commerce1985), by which recombined-milk producers must use freshmilk to recombined milk or skimmed powder milk to freshmilk at a ratio of 1:1 or 1:20, respectively. This enlarged themarket for locally produced fresh milk and the dairy popu-lation. There has also been a program known as school-milksince 1994 for school children in rural areas. At present,local fresh-milk processors must buy fresh milk from farm-ers and supply school-milk to schools in the area. A milk-drinking campaign has also been promoted to increase milkconsumption.
Livestock development policy (2003). The Departmentof Livestock Development (DLD) has recently undergonesome restructuring to improve its delivery of services toefficiently and effectively meet public-sector needs. Thecommitments are embodied in the new livestock develop-ment policy and include
1. Research and development that aim to increase thepotential of livestock and livestock products in thecountry and abroad.
2. Technology transfer and service. There are two targetgroups for this service, subsistence farmers and com-mercial producers. The recently established center fortechnology transfer at the tambon level all over thecountry would be used as the coordinating body forsubsistence farmers.
3. Provision of basic infrastructure. Vaccine production,the central cattle and buffalo market, milk laboratoryfacility, and slaughterhouse would be improved and/or established.
4. Information technology. A national network of infor-mation by using information technology would beestablished to provide public accessibility.
5. Laws and regulations related to several isues involv-ing livestock would be revised or promulgated to pro-vide justice to both producers and consumers. Theseissues include food safety, standardization of live-stock farms, etc.
6. Cattle and buffalo market. A one-day-a-week cattleand buffalo market has long been promoted and hasbecome a normal activity in many areas. This marketstimulates a lot of movement of live livestock. How-ever, it produces both positive and negative effectson the livestock population. It is part of a livestockoutlet for farmers, but a group of traders could makean unfair profit. This facilitates the movement of live-
stock to the slaughterhouse, thus helping to reducethe livestock population.
Trends and potential of ICAS
ICAS development in the pastAfter industrial development, Green Revolution develop-ment, and several socioeconomic development plans, whichemphasize only economic gain and markets without con-cern about human resource development, equity, autonomy,and environmental value, Thailand realizes that changesare needed. Therefore, the 8th and 9th socioeconomic de-velopment plans emphasized human resource development,empowerment, good governance, a self-sufficient economy,environmental protection, and conservation and sustain-able development. Lessons learned from the past, particu-larly those that have a bearing on the growth of the agricul-tural sector and have affected its immediate beneficiaries,are summarized below:
1. Wider gap between rich and poor.2. Natural resource degradation and environmental pol-
lution.3. Extensive monocropping and less biodiversity.4. Unplanned urban development and growth that in-
creased dependence on the rural sector.5. Rural-urban labor migration within the country and
inmigration from neighboring countries.Extensive monocropping and changes in cropping pat-
terns imply many complications. These practices affectedthe animal sector. They reduced animal grazing area, pro-moted farm mechanization, decreased demand for cattle andbuffalo for draft, which affected their prices, and reducedthe animal population, especially cattle and buffaloes. Itshould be noted that the need for mechanization also re-sulted from the increased outmigration of farm labor to ur-ban areas. These practices also necessitated an increaseduse of chemical inputs to support the intensity of rice pro-duction. As farmers do not have sufficient capital to coverproduction expenditures needed, they start to depend onfinancial institutions or private lenders that charge very highinterest rates. Lastly, the practice of monocropping also in-creased deforestation and environmental degradation, whichgreatly affected the natural food resources on which ruralpeople depended. ICAS was weakened.
At the same time, the animal sector also witnessed thegrowth of commercial pig, broiler, and layer farms that haveto depend on feed sources that are external to the farm. Simi-lar to the rice farmers, the big animal growers also have todepend on financial establishments for their capital needsto purchase commercially produced animal protein and fishmeal. As both endeavors were meant to be market-oriented,they benefited some farmers but not all. A majority of thesmaller farmholders fell into a vicious circle of debt. Thisscenario is in contrast to the integrated (ICAS) and subsis-tence systems of the past when farmers were free of debt andwere more autonomous.

147
At present, only ducks and/or native chickens are gen-erally observed as an integrated component of rice farming.However, returns to the cattle and buffalo population, to alesser extent, are observed in certain areas where the crop-ping pattern is less competitive to livestock raising (graz-ing). This is probably also due to a more favorable price.
Potential for further ICAS developmentThe above scenario is a great challenge to the developmentof ICAS. Key questions are: How can ICAS be put back intothe present farming systems, which are different from thepast systems? What will be the system models? What shouldbe the strategies?
As indicated in the policy section, the last two nationalsocioeconomic development plans have adhered morestrongly to the principles of integrated farming, a favorablesign for ICAS to return as an important component in pro-duction systems. It is inevitable that the Thai populationwill increase in spite of successful family planning andpeople in the cities will advance further with higher educa-tion and more health consciousness. Demand for healthyanimal protein will certainly increase.
The strategy is to build up enough information to lo-cate the area and type of households that have potential forthe purpose. People in these areas must be helped to beready for ICAS. But this has to come with a concept of sus-tainable development, a self-sufficient economy, and self-reliance at the initial phase. At the same time, favorablepolicy must be reinforced with the horizontal integration ofall implementing agencies.
Research and development must be directed and inte-grated toward the purpose with budgetary support. It has tobe clear that results must be usable by the small farmholders.Therefore, participation of the concerned parties is a key tosuccess. Research organizations, policy, programs, planning,and goals have to be structurally reorganized. Research togain lessons learned from the ICAS-practicing farmers andtheir network will be useful for expansion. Research has toalso generate or improve existing techniques to increasethe population of appropriate breeds, improve feeding sys-tems, prevent disease, and do management withsustainability in mind. Sustainability must also be holisti-cally covered and clearly defined by all concerned partiesand linked with ICAS. In fact, ICAS is technically a part ofsustainable farming systems. Native breeds and indigenoustechnical knowledge have to be exploited and carefullyintegrated with modern knowledge.
On the other hand, commercial farms, where and whenappropriate, should be further developed. More research isalso needed, but with technical management these farmscan look after themselves. Strategically disease-free farmsand areas must be developed for export purposes. Animalprocessing and product quality standardization are neededfor the same purpose and for domestic consumption. Policyadoption and implementation for both small farmholdersand commercial farms must be carefully managed so thatthey are complementary instead of competitive.
Future ICAS (prospectus)It is clear from the view of population growth, migration,and expansion of urban areas that demand for animal pro-tein, including fish and shrimp, will increase in the future.On the other hand, the number of smallholders and house-hold size are declining, but a majority of them will continueto grow rice. At the same time, big enterprises related tolivestock production will expand because of both domesticand export demand. Key questions are, Who will practicerice-based ICAS? Where will it be practiced? What will bethe production systems? Answers to these questions are noteasy because Thailand is going through very dynamic so-cioeconomic changes. However, projection trends can bediscussed.
In the previous chapters, statistics indicated that broilerproduction will be operated by big commercial farms them-selves and through subcontract farms in a vertical fashion.These big operators will cover the complete cycle of pro-duction systems, from providing major inputs to marketingand export. The systems used are not smallholder ICAS.The industry is growing fast. A similar pattern follows forswine production but there is a larger proportion of inde-pendent commercial farms. Smallholder swine producers arelimited and sometimes integrated with rice-based fish rais-ing. Layer chickens are also in the hand of big enterprisesand independent commercial farms mostly concentrated inthe central region. However, limited rice-based layer inte-gration can be observed. Shrimp production is concentratedin the coastal area and mostly on big farms. It is expandingbecause of export demand. Therefore, the remaining live-stock production that can be integrated into rice-based farm-ing is native chickens, and other comparatively minor poul-try such as ducks or geese, buffalo, cattle, dairy cows, goats,and fish. However, the future practice of ICAS needs to bediscussed in terms of limitations and opportunities.
BuffaloThe declining buffalo population, labor outmigration, andloans from financial institutions for agricultural inputs hadcontributed to more and more farm mechanization and lessanimal (buffalo) power use. Even though small farm ma-chinery is relatively expensive and its function depends onmostly imported fossil fuel that is also expensive and notrenewable, livestock can be bred and raised by farmers withlow inputs and without pollution. But buffalo raising iscomparatively more difficult than cattle in terms of laborand water requirements. The buffalo population is concen-trated in the northeast region.
However, under labor-shortage circumstances, farmmachinery can help farmers finish their work faster and ontime and no labor is needed to look after the livestock. Manyyears of chemical fertilizer use resulted in a hardened soilsurface; therefore, ploughing by hand tractor is easier thanusing a buffalo. Therefore, the opportunity to include buf-faloes in the rice-based system by smallholders for animalpower is limited. But, the higher price and need for manure,especially in organic farming, and the availability of a suit-

148
able grazing area and village loan could provide some op-portunities.
CattleThe cattle population pattern is similar to that of buffaloes,but presently their population is increasing. The opportu-nity for low-input cattle raising under the rice-based systemis greater than for buffaloes because of the current higherprice and government village loan policy. Cattle are easierto raise because of less labor demand and available free feedresources. However, the continuing changes in croppingpatterns have limited grazing area and feed resources andthe higher initial investment may exclude smallholders.Integrated rice-based cattle raising is concentrated in thenortheast region.
DairyDairy production is mostly in the hand of smallholders, witha majority in the central region. Growth of dairy productionis very slow now because of the high investment cost, inten-sive management, and competition with the lower price ofimported powdered milk. Some farmers still hold on to therice-based system.
Native chickensLow-input native chicken raising will continue to be a partof rice-based farming systems among smallholders all overThailand. But growth of this system is very slow or constantbecause of frequent disease outbreaks. However, fightingcocks, which are also native, have raising systems that couldexpand among smallholders and beyond because of the highprice, export demand, and current trend of indigenous andcock-fighting sport value.
Other poultryOther poultry such as ducks will be raised by smallholdersunder low-input systems as with native chickens but verylimited in number compared with native chickens. But, somerelatively large farms using rice grain left over in the fieldfrom harvesting also exist in certain areas such as in theCentral Plain or other lowland areas.
GoatsGoats are raised by some smallholders in the southern partof the country, mostly in Muslim communities. They mayor may not be integrated with rice farming.
Freshwater fishingLow-input fish raising will be dominant in rice-based inte-grated farming for smallholders in all regions of the coun-try, especially in lowland areas where water resources canbe managed.
The practice of developing small ponds within land-holdings of households is growing very fast and will con-tinue to grow. Small fish ponds plus livestock such as cattle,native chickens, or other poultry, and minor crops in the
form of home gardens fit the King’s concept of a self-suffi-cient economy and his idea of small-scale sustainable watermanagement, which is now promoted by the King himselfand various government and nongovernment organizations.This practice goes well with the increasing trend of organicfarming and demand for healthy food. In the long term, in-vestment is very low. However, there are some limitationssuch as topography and water-holding capacity of the soil,especially in the southern, northeastern, and northern re-gions.
In conclusion, major animal protein production will bein the hand of big and specialized enterprises. Smallholderswill practice ICAS, but their number may decrease over time.At present, natural resources that have been used as bases oflivelihood by rural smallholders are declining fast. There-fore, the productive agricultural labor force continues tomove out of rural areas. In the long term, a new generationof people with higher education preferred to live in urbanareas. This will have a strong impact on ICAS development,unless the concept and values of self-reliance, local com-munity, and sustainable development are reintroduced ef-fectively.
The survival of ICAS depends on how the policies andmeasures discussed above are properly implemented. It alsodepends on the direction of the country’s development ob-jectives. If agricultural specialization and commercializa-tion, especially for export, are emphasized, integrated farm-ing systems, including ICAS, would decline. However, in-tegrated systems are still vital to poor smallholders’ sur-vival. Because they do not have access to high investmentcapital and large land resources, most of them practice inte-grated systems. Most of these farmers are in the northeastregion and to some extent in other regions. Particularly, inthe northeast region, cattle, buffaloes, and native chickenshave been part of their livelihood. Even though the cattleand buffalo populations have been declining, they are com-ing back to the scene. Moreover, land unit classificationswith different models of integration, presented earlier, areimportant in this region.
References
CIA. 2002. World’s fact book: Thailand. Central IntelligenceAgency. Available at www.odci.gov/cia/publications/factbook/index.html.
Coxhaed I, Phangpraphan J. 1998. Thailand’s economic boomand agricultural bust: some economic questions and puzzles.Staff paper series No. 419. Department of Agriculture andApplied Economics, University of Wisconsin-Madison.
Department of Livestock Development, Ministry of Agricultureand Cooperatives. 2004. Available at www.nso.go.th/syb2001/agricult2001.pdf.
Department of Provincial Administration. 2003. Population statusin Thailand during 2536-2544. Ministry of Interior, Bangkok.
Division of Fishery Economics, Department of Fishery. 2003.Available at www.fisheries.go.th/stat/t-612.htm.
149
Falvey L. 2000. Thai agriculture. Kasetsart University Press.International Animal Quarantine Station, Bureau of Disease Con-
trol and Veterinary Service, Department of Livestock De-velopment. 2001. Available at www.dld.go.th.
Mongkolsawat C, Laopaiboon B, Jaruratjamon P, Pakdee P,Ngarm-Sak S. 1988. Studies on models of mixed-farming asrelated to administration and management of natural re-sources and ecosystems: a case study of Ubon Ratchathani,Thailand. Faculty of Agriculture, Khon Kaen University.
NSO. 2003. National Statistical Office Thailand. Available atwww.nso.go.th/eng/stat/stat.htm.
NSO. 2004. National Statistical Office Thailand. Available atwww.nso.go.th/eng/stat/stat.htm.
Office of Agricultural Economics, and Department of LivestockDevelopment of Thailand. 2001. Available at www.oae.go.th/satatistic/yearbook/.
Office of Agricultural Economics, Ministry of Agriculture andCooperatives. 2003. Available at www.oae.go.th/statistic/index.html.
Office of Cane and Sugar Board and Office of Agricultural Eco-nomics. 2003. Available at www.oae.go.th/.
Siam Fighting Cock Magazine. 4(1):80.TDRI (Thailand Development Research Institute). 1995. Agri-
cultural diversification/restructuring of agricultural produc-tion systems in Thailand. Paper prepared for the Food andAgriculture Organization, United Nations.
The Metrological Department, Ministry of Information and Com-munications Technology. 2003. Available at www.tmd.go.th/index.php.
U.S. Bureau of the Census. 1998. International brief of worldpopulation at a glance: 1998 and beyond. U.S. Departmentof Commerce. Economics and Statistics Administration: IB/98-4. Available at www.census.gov/ipc/ prod/wp98/ib98-4.pdf.
Notes
Authors’ address: Department of Animal Science, Faculty ofAgriculture, Khon Kaen University, Khon Kaen 40002, Thai-land.

150

Section 3

152

153
Preface
This publication uses the Preface differently. For the firsttime perhaps, instead of using this space to examine high-lights and discuss their importance to the advancement ofintegrated crop-animal systems (ICAS) research and exten-sion (R&E), especially in the light of the changing ruralcommunity and agricultural, technological, and ecologicaldevelopment and policy decisions in the rainfed rice eco-system, we take this opportunity to explain the philosophy,vision, mission, goals, objectives, and core values for sup-porting the activities undertaken under it.
This Preface is a statement of principles, a preconditionto give direction to ICAS R&E as a strategy for easing thepain of living and improving welfare within a three-prongedsustainable development challenge at the barangay level—the local community and farm household; complex, diverse,and risk-prone (CDR) agriculture; and an Earth care sys-tems view.
Philosophy
Social justice is for all—less for the self, more for others,enough for all, and all for God.
Prioritizing and promoting ICAS on small rainfed low-land rice farms as an area of urgent concern will reducepoverty and inequality, and somewhat eliminate bias to-ward more well-endowed irrigated lowland rice farmer house-holds.
Vision
Productive small farmer entrepreneurs and their families livehappily and peacefully in safe, secure green communitieson 1.4 million ha of rainfed rice land providing the suste-nance required for all.
The Philippine vision of agriculture and fishery mod-ernization is clear—enough food (rice, fish, meat, milk, andeggs) on a poor family’s table, assured higher education,labor productivity, better nutrition and health, using and
Integrated crop-animal systems in rainfedrice lands: a Philippine studyF. Talens Rivera, P.A. Alviola, M.A. Sombilla, and G.C. Cataquiz
promoting environment-friendly technologies, with ourchildren’s children living happily in a safe, secure nationgoverned by professional leaders.
Mission
The sustainable productivity of small rainfed rice farms willreach about 40% from behavioral and social reform, ICASR&E methodological and technological reinventing, smallfarmer entrepreneurs’ ownership of competitive home-grownICAS enterprises, and the active participation and solidar-ity of farm families in their own sustainable development.
Goals
The goals are productivity, social acceptability, ecologicalsoundness, equity, economic viability, and efficiency(Agenda 21).
Objectives
The objectives are
• To improve smallholders’ livelihood systems.
• To reduce poverty and inequality and at the sametime improve human welfare.
• To use environment-friendly technologies such asICAS intensively without compromising the welfareof future generations.
• To manage available local resources and enjoy gov-ernment-NGO support services for appropriate ICAStechnology adoption while maintaining environmen-tal quality and conserving natural resources.
Suggested core values as a covenantof stakeholders in ICAS improvement,innovation, and change
The following values are essential: simplicity, integrity, andcommitment; accountability, responsibility, and transpar-ency; conservationism and volunteerism; a work ethic; andservant leadership and citizen modeling.
154
All this underscores the value of human and societalconditions as a prerequisite for supporting a farm house-hold total food/feed systems approach to sustainable agro-industrialization, of which ICAS R&E on rainfed rice farmsfor sustainable rural development is a major strategy.
Introduction
Small rice farmers, especially those on rainfed rice lands,are beset with multifarious problems. Among others are thehigh cost of living, costly farm inputs, including the LaNiña and El Niño phenomena, declining rice productivity,flooding of the market with cheaper imported products, trans-portation costs, the low price of paddy, and dwindling in-come. Hence, there is a common perception among thesefarmers that monocrop rice production is becoming a poorlivelihood option. On rainfed rice lands where one crop-ping season followed by fallow is common, the socioeco-nomic situation of small rice farmers may be even worse.
In contrast, some small rice farmers have traditionallypracticed mixed crop-animal farming. They use farm resi-dues, by-products and wastes, surplus grains, and leftoverfood scraps for raising animals. Casual observation showsthat cattle, carabao, goats, chickens, ducks, and sometimessheep and fish are the main species raised as primary orsecondary components with rice, maize, and vegetables. Thistype of farming is said to be better as it increases farm in-come by 20% or more. For many small farmers, animal rais-ing is a form of status symbol and security that anchors thefamily for the children’s education, expenditures for spe-cial family occasions, social obligations, and changinglifestyles, which in the Filipino culture are large expenseitems.
A new scenario looms ahead. Livestock and poultry arethe most important economic subsector over all agriculture.As population and urbanization increase, and economic re-form leads to higher gross domestic product (GDP), the de-mand for animal products will grow stronger. In the Philip-pines, the combined consumption of beef, mutton, chevon,pork, poultry, eggs, and milk rose by 50% from 1973 to1996 (Gonzales 1998). Domestic consumption alone willspur the growth of this sector. In the short term, this augurswell for animal producers and agribusiness entrepreneurs.
Fish, another potential ICAS component for increasingthe protein supply for Filipinos who eat rice and fish, willalso become important, especially if the chief waterways,both saline and fresh, continue to deteriorate in quality sothat Philippine fishery productivity, although growing now,may still decline if environmental care is not sustained.
At the same time, trends in rice production indicatethat becoming self-sufficient in this primary staple may stilltake a few years to attain, and rice exports for augmentingneeded foreign exchange an even longer time. The oppor-tunity to attain self-sufficiency and to export premium-qual-ity organic rice still forms part of making rainfed rice landsbecome more productive with livestock and poultry play-ing a triple role: community and farm household livelihood
systems; complex, diverse, risk-prone (CDR) agriculture;and a rainfed rice ecosystem improvement strategy.
Today, other benefits claimed from ICAS are better re-source use, increased production per unit of land and cost ofproduction, and improved nutrition and health because of alarger supply of protein.
Crop-animal interactions demonstrated that the use ofcrop residues and farm wastes as animal feed and the use ofanimal power and manure on crops are considered a goodstrategy for efficient resource allocation and environmentalconservation. Livestock and poultry can improve soil qual-ity as their manure is a natural ingredient for soil fertility.Partial or full organic fertilizer replacements can signifi-cantly reduce inorganic inputs and enhance soil conditions.
To find out more about the socioeconomics of ICAS,this study was undertaken, reviewing studies conducted forthe last two decades. The results will be used as backgroundresource material for a proposed project on sustainable food-feed systems and improved livelihoods of the poor on rainfedrice lands, with the Philippines, together with four othercountries in Southeast Asia, playing a catalytic role.
Rationale
Why is there a need to look at ICAS in the Philippines to-day? The following reasons are given:
1. As a strategy for increasing the productivity of rainfedrice lands and resource-use efficiency, alleviatingpoverty and inequality, practicing conservation agri-culture, and intensifying the role of women and youthsin total food/feed farming systems.
2. Livestock are becoming the most important subsectorin agriculture, as stated earlier, because of decliningincome from rice alone, runaway population growth,increased demand for meat, milk, eggs, and other prod-ucts because of more education, awareness of familynutrition and health, food substitutions such as ricefor maize, and changing lifestyles.
Results of the study are important inputs into identify-ing ICAS R&E issues and gaps and improving existing rice,animal, and fish policies that will also benefit the develop-ment and promotion of ICAS.
Objectives
The results of the study aim to provide useful knowledgefor rationalizing action on total food/feed ICAS technol-ogy development and promotion in the rainfed lowland riceecosystem.
More specifically, it aims to
• Review the ICAS R&E paradigms used.
• Characterize smallholder rice, animal, and fish pro-duction farms.
• Describe the socioeconomic context of ICAS in termsof the regional profile of rice ecosystems; macro sup-ply and demand trends in the rice, animal, and fishsector; regional poverty and causes; human welfare;

155
population growth and demographic change; andimplications for ICAS R&E.
• Describe the existing ICAS practices undertaken invarious rice ecosystems, and support research, exten-sion, and training structures and services.
• Describe the policy environment for the rice, animal,and fish sectors, including ICAS.
• Identify problems of ICAS small rice farmers and R&Estakeholders from the perspectives of the small ricefarmers as direct beneficiaries, and other stakeholdersproviding enabling conditions, from which to estab-lish recommendation domains.
Methodology
Methodology as used here refers to the procedures used forconducting a review of ICAS R&E studies. Briefly, theseprocedures are as follows:
1. Developing and using a framework for inventoryingthe ICAS R&E paradigms used.
2. Using secondary data to describe regional rice eco-systems, analyzing rice, animal, and fish macro sup-ply and demand trends, population growth and de-mographic change, regional poverty and causes, andhuman development achievement.
3. Characterizing ICAS in rice-farming communities andin R&E support structures and services.
4. Documenting ICAS practices to augment written re-ports about them.
5. Describing the policy environment for rice and ani-mal sectors.
6. Identifying ICAS problems and solutions.7. Writing a monograph.
Toward the use of a common ICAS R&E paradigm
The ICAS R&E general frameworkIn reviewing the status of ICAS R&E in the Philippines, anICAS paradigm is introduced (Chart 2), based on a generalframework (Chart 1), showing ICAS R&E as a three-pronged
).�# �/���7�1�����&)@���������#1��$$�1 ����9�/�$����%��(� �)�����%�����..�# ���#/�1��
���������� ���������
!�).$�+0%�/�#��0#��@&.#����#�1�$ �#�
���,�%�$�-$�%#�1���1��(� �)
!�))��� (��%,#)��������$%
�(� �)
).�# �/���!##(����1.1� (����.�(��1$��%������1���1���)�1����1�#1 �#�: �����1�&�#�1�$ �#$���$�����%�����..�# ���#/�1��
).�# �/��� !�� �1���$��(�?# �1�. �#(� !�����%������%�����..�# ���#/�1��
Chart 1. A general framework for ICAS R&E as a three-pronged sustainable development challenge inbalancing the imperatives of community and farm household, CDR agriculture, and the rainfed lowland riceecosystem.

156
sustainable development challenge with its imperatives fromthe community and farm household; complex, diverse, andrisk-prone (CDR) agriculture; and rainfed lowland rice eco-system perspectives. ICAS R&E is so vast a territory thatthere is a need to zero in on some common imperatives forall stakeholders to agree upon and work on.
Sustainable community development for improvingrainfed communities. Sustainable community developmentis needed for improving lowland rice-farming areas, whichmeans developing communities, families, educated and re-sponsible citizens, ecosystems, and civilization itself. Theimperatives of community and farm household develop-ment are to be identified and defined by stakeholders andgrouped into active local learning circles of ICAS R&E.
Sustainable agriculture through integrated crop-ani-mal systems. Agricultural development through ICAS as a
form of simultaneous conservation and economic activityis essential also for human life and civilization. It is meantto build the viability of rainfed lowland rice farming, whichlater, if viable, can be promoted in other ecosystems. ICASis an important strategy for developing the rainfed lowlandrice-farming market economy. In the past, agricultural pro-duction increased largely by expanding the area under cul-tivation.
The possibilities of continuing this trend are nearlyexhausted and present increases in production will have tocome almost entirely from the intensification of land useper unit area accompanied by appropriate agricultural tech-nology development and promotion. However, technologydevelopers and promoters have to initially face anontechnology problem in that small farm holders by andlarge do not easily shift to new, although promising, prac-
Chart 2. Suggested ICAS R&E paradigm.
�������!$�) ����,$$B(%#�$��(��$���,�%���#�1��$�%�
��������!#�.����)$�?�� �7���������%� !�
�����������1���?�$� �1$��� �#��?�(1����1���)�1�"$�'$� #%��?�$�1(
;#)��������$%4%�$ �)��0�-�)��0
�%�1��$%#��
�����#1��$$�1 ���
9�% � �# ���#�( * �#�$ ��1���1$ B�)�
����������������
�+ ������1�))���1 ���
!#�%� ?#�1������ *#@� ��� �,#� #�1 �#� ?�'$�1�� �$� ���8)��� ���
9�/�$����%��(� �)�
!#�..��� 9�/�� �1@8,��� 3,,&,#) ���,#)
����������������
����?#�%�1 �/� (0���1�$�11�. '�$� (0
�1�$���1$�����%����0��E�� (0�1���)�1�/�'�$� (0��,,�1���1(
157
tices. In the development of resource-limited rainfed areas,the ICAS, a veritable farming systems approach, assumesstrategic significance. A holistic farm perspective in thewhole technology improvement and human change pro-cess fits well into CDR ICAS technology use.
Ecological development. Ecological development re-produces the biological wealth and climatic conditions nec-essary for life and Earth. The imperatives of ecological de-velopment are to respect carrying capacity, conserve andrecycle resources, reduce farm and household waste, andmanage household and farm solid waste. Crop-animal inter-actions provide the key to ecological development at thehousehold and community level.
Sustainable development. Sustainable development isa process of bringing these three development processesinto balance with each other. The implementation of ICASas a sustainable development strategy therefore involvesnegotiations among the stakeholders involved in the threedevelopment processes—community and farm householddevelopment with the local government and stakeholdersplaying lead roles; lowland rice farmers, researchers, exten-sion workers, entrepreneurs, government and nongovern-ment organizations, and consumers; and characterizing andunderstanding rainfed rice lands as a basis for technologydesign, improvement, innovation, and change.
In this study, one observation is that the use of a com-mon ICAS R&E paradigm among researchers and extensionworkers is not explicit. For the component ICAS R&E work-ers, though, the simple diagram below seems to depict theframework used:
ICAS technology<<<<<<<>>>>>>> socially acceptable,component testing, technically andsingle discipline-based economically viable
• recipe-type R&E • researcher-ledon-station experi-mentation
• participatory R&E • farmer-led on-farmexperimentation
The farmer-led and researcher-led experimentation areinteractive in that the first identifies actual field problemsand the second helps solve them. The participatory R&Eelement, in which farmers play active learners’ roles, is anew development. Only the ARFSN and the CASREN re-searchers and extension workers use a holistic view similarto what is being recommended in this study.
The modal ICAS R&E paradigmBased on Chart 1, and full-blown farming systems para-digms developed by other researchers (Norman being oneof the pioneers), the modal ICAS R&E paradigm shown in
Chart 2 was designed. As shown in this chart, an ICAS isviewed as an intensive diversified small agribusiness enter-prise. The major factors influencing it are biophysical andsocioeconomic, represented by boxed parameters. Con-sumption and production sustainability require a livelihoodsystem like ICAS that preserves the ecological base for thisdevelopment strategy, although socioeconomic benefitsderived involve dynamic changes in the biophysical eco-system. In the operation of ICAS in rainfed rice lands, thesurvival, well-being, and integrity of life support systems atthe local and national levels are simultaneously consid-ered. Although different ICAS R&E spheres and elementsare boxed to delineate specific parts, they should not beseen in isolation from each other. Instead, they should beexamined with the woof and warp of a well-woven tapestry,simultaneously observing the intricate matrices of commu-nity and farm households, agriculture, and ecologicalsustainability imperatives and using these to advantage.
Sustainability is also defined as an improvement in theproductive performance of a system without depleting thenatural resource base upon which future performance de-pends (Lucas et al 2000).
We assume that the biophysical and socioeconomiccircumstances, when favorable, are the sets of conditionsfor operating on-farm, off-farm, and nonfarm livelihood ac-tivities in which ICAS plays a central role. Being convincedof its viability for attaining productivity, social acceptabil-ity, ecological soundness, equity, economic viability, andefficiency, a farm family opts to adopt market-oriented crop-animal mixed enterprises along a total food/feed system. Tooperationalize demand-driven multiple agribusiness enter-prises, however, requires an input-output market system inwhich around 200 small farmers, members of the Farm Busi-ness Resources Cooperative (FBRC), benefit in both ways.This idea has been operationalized in Aliaga, Nueva Ecija,where one of the authors is a volunteer consultant.
The socioeconomic sphere. As depicted in Chart 2, thefarm household, composed of adult men, women, and chil-dren, is at the heart of ICAS, indicating more socio-culturaland economic variables. At the same time, it is the centralproduction, processing, and marketing unit that feeds oracts upon natural resources of land, water, and energy aswell as material, technical, and human capital. Land, water,and energy are natural life-support systems, often adverselyaffected by the vagaries of nature. Material capital, which isalways scarce, refers to wealth or accumulated assets (land,money, animal/machine power, transportation, small-farminfrastructure, etc.) at the farm household’s disposal. Tech-nical capital refers to knowledge, both indigenous and bor-rowed, or results of on-farm and on-station R&E activities.Human capital refers to labor and capabilities for operatingICAS. Amplified by prompt and timely delivery of supportservices—extension/training, credit, processing and pack-aging, marketing, crop/animal husbandry, management thatconsiders a health information and care system vital to itssuccess, public utilities, and social amenities— ICAS adop-

158
tion can take place. All support services are enabling condi-tions and motivational forces that, if lacking, can stall ICASdevelopment and expansion.
Depending on the world view, aspirations, goals, andattitudes of a farm household, as well as local governmentpolitical will and resolve to provide a safe and secure com-munity, ICAS development can only succeed. The result ofthorough farm household and farm community appraisal, aspart of the socioeconomic circumstance, is thus importantto the understanding of dynamic human behavior, both in-dividually and as a group.
The socioeconomic sphere contains overlapping so-ciological, political, anthropological, psychological, andeconomic elements inherent in social, cultural, political,educational, and economic institutions and organizations.Institutions are patterned ways of human group behavior,whereas organizations are frameworks by which the work ofinstitutions is performed, providing the required channels,point of origin, flow of management direction, and controlto carry out a determined course of action (Iñigo 2000).This takes place even in the smallest organization such asthe farm family household.
This time, what are being inventoried are human andinstitutional resources, including processes, to understanda dynamic CDR agricultural system, such as ICAS, interact-ing with community rainfed rice lands while following off-farm and nonfarm livelihood systems. An appropriate glo-bal trade and policy environment can help push competi-tive ICAS enterprises right onto smallholder farms or intobackyards. There is still time for the Philippines to strive toenhance small farmers’ dream to become enterprising ICASoperators.
The biophysical sphere. The biophysical appraisal of acommunity where target farm households are situated andpromising ICAS technologies are proposed to be intensi-fied is also an important inventory and subject matter foranalysis. As shown in Chart 2, the major physical elementsare climate, rainfall, hydrology, soil, and the rainfed ricefarm itself within a fast-changing rural community and de-teriorating environment, especially a metamorphosing land-scape resulting from changing land use.
The biological resources are crops, animals and fish,and farming systems, as well as their residues and wastes.Pests, diseases, and weeds and the means of controlling themfall under this particular sphere.
Other uses of the suggested ICAS paradigm. The ICASparadigm has other uses that could be maximized as theproposed project progresses, as follows:
1. As a tool for developing a common understandingamong stakeholders of ICAS as a three-pronged chal-lenge of sustainable development at the local level—community and farm household, CDR agriculture, andrainfed rice ecosystem, including their imperatives(Chart 1) upon which the ICAS R&E paradigm (Chart2) is based.
2. As a common reference when developing a participa-tory ICAS R&E methodology that a CDR ICAS re-quires.
3. As a starting point for developing content of trainingmodules and ICAS information kits and establishinglocal learning circles of mixed groups (farmers, re-searchers, etc.).
4. As an outline for an ICAS project management plan,from database development and benchmarking to lo-cal information and communication technology (ICT)service delivery.
5. As an input into the ecoregional ICAS R&E for long-term economic growth and improved human well-be-ing.
Characterization of smallholder foodproduction farms and macro supplyand demand trends of rice and animals
The review of ICAS R&E in the Philippines was carried outagainst the backdrop of regional profiles of rice ecosystemsand small-scale rice, animal, and fish farming that charac-terizes most staple food production farms of the country,and the macro rice, animal, and fish supply and demandtrends in the Philippines.
Smallholder food production farmsIn this study, existing smallholder rice, animal, and fishfarms were described in terms of structure and productivity.
Smallholder rice production system. Following agrar-ian reform laws and policies, land distribution started in1978, the year when the “Land to the Tiller Program” wasfirst carried out and resulted in small-scale rice production.Rice production used to take place on big haciendas (largetracts of land) run by katiwala (farm managers) but ownedby encomenderos (large owners), a kind of rent capitalism.
Today, rice farms where most paddy palay is producedfor more than 80 million rice-eating Filipinos average onlyaround 2.0 ha or even less per family. In Region 1, it isreported that because of the parcellation of rice farms, mostlybecause of marriage of a jobless family member, the averagefarm size in some areas is around 0.5 ha. This may be smallerin some places. The Philippines’ per capita agricultural landavailability is 0.144 ha, whereas the farm household depen-dency ratio ranges from 0.17 to 0.33.
Average production on 1.7 million ha of irrigated ricelands is around 3.5 t ha–1 and on 1.4 million ha of rainfedrice much lower at around 2.3 t ha–1. These are the samefarms where animals, fish, vegetables, and other food/feedgrains are grown. Thus, when speaking of ICAS, except fora few commercial farms, these are the same small farms.
As a result of widespread implementation of the Com-prehensive Agrarian Reform Program (CARP), the bipolarlandowner-tenant tandem resulted in social structures ofsmallholder owner, amortizing owner, lessee, and newer

159
owner-tenant relationships. These were clear-cut distinctionsof farmer classes. Today, because of dynamic land transac-tions and markets, access to land with corresponding man-agement styles rather than ownership per se continues tobecome an important variable of small-scale rice farming.“Cultivatorship” is not necessarily ownership. It may bejust the right or access given to till the small farm, usuallyon landowner-kasugpong (landless worker), sangla (mort-gaged), rent or lease/contractual arrangements. These arenewer social classes in the rice-farming business.
The landowner-kasugpong tandem is calledporsyentuhan (percent). This is a kind of owner-tenant tiller-sharing system in which the kasugpong who performs allthe farm work except planting and harvesting, which useshired farm labor, derives 10–15% of net income from allenterprises every cropping season. The legal landowner hasin principle become an absentee landlord in much the sameway as before the CARP era.
The sangla system is an arrangement between the ownerand the mortgagor whereby the owner gets a substantialloan (sometimes called sanglang bili or arrangement to sell)and the latter continues to farm the land until the loan ispaid, or loses the land altogether after deciding to sell. Arent or lease arrangement is the usual way of seasonal oryearly payment of a sum representing a right to cultivatethe land.
These prevailing land markets connote varied land ar-rangements and management styles in Nueva Ecija (Riveraand Mangalindan 1989). Upon verification, they still existtoday. Because of changing land uses, some small farmerswhose landholdings are situated near urban centers havebecome instant millionaires by selling their farms.
Small rice farmers and food security. Food security isdefined by the Agriculture and Fishery Modernization Act(AFMA) as having safe and nutritious food available andaffordable to every Filipino at all times. The average Fili-pino spends 80% of income for food. Every family, how-ever, pays two or three times more than the Thai or Vietnam-ese households for their rice. Food security at the farm house-hold level depends on income level and the efficiency ofthe marketing system to quickly correct supply and demand
imbalances in local markets. More than 50% of rural fami-lies are living on incomes below the poverty threshold asthe average rural family earns about one-half of what theurban family earns.
Farm labor. As of 2001, agricultural labor totaled 11.3million, an increase of 8.2% from 10.4 million in 2000, butits share of the total employed remained constant at 37%.The 368,000 employed in agriculture are unpaid familyworkers, 250,000 are workers, and 234,000 are wage andsalary workers. Smallholders’ problems related to labor arescarcity at the peak of farming operations and higher wagerates.
The smallholder livestock and poultry production sys-tem. There are two animal production systems: (1) backyardor small-scale and (2) commercial. The first one prevails,with 79–99% for ruminants and nonruminants as a whole.For ruminants, the commercial scale is negligible, as cara-bao and goats are almost all small-scale. Cattle commer-cialization is somewhat intensive (10%). As shown in Table1, among the nonruminants, only chickens had a higherpercentage of commercialization (25%). For small-scaleanimal farms, there are also two kinds of operation, inde-pendent or integrated two-level strata or three-level stratabusiness enterprises, which are rare. In the independent ani-mal production system, there could be just one animal spe-cies, or there might be other farming enterprises, crops, andfish or animal species, each operated independently of theother or jointly in an integrated way.
In the latter case, the interactions would depend on thedegree of crop-animal integration from which the small farm-ers expect greater benefits.
Livestock and poultry in the Philippines are raised on asmall scale as pure, one species, or several species, or asintensive crop-animal mixed enterprises. The production ofcarabao (99.67%), goats (99%), cattle (88%), ducks (88%),hogs (83%), and chickens (72%) are through the “back-yard” system, in which field crops are invariably commonenterprises (Paris 1992). Commercial farms produce onlyabout 28% and 17% of chickens and hogs, respectively(Adriano 1989).
Table 1. Backyard and commercial livestock farms in the Philippines.
Animal Inventory Backyard commercial Total Sharespecies (000) (%)
Share (%) Inventory (000) Share (%) Inventory (000)
RuminantsCattle 1,498 90 160 10 1,658 100Carabao 2,475 99 4 1 2,479 100Goats 2,227 99 12 1 2,239 100
NonruminantsHogs 6,717 83 1,305 17 8,022 100Chicken 47,370 75 15,757 25 63,127 100Ducks 7,661 91 687 9 8,348 100
Source: BAS data.

160
Animals provide an important source of cash and foodfor farm families. Benefits from the animal component in anintegrated farming system are approximately 17–20% ofthe total gross cash income of these families. The bulk ofthis income is from cattle and swine raising.
Any improvement in the productivity of livestock andpoultry would therefore be beneficial to small backyard rais-ers, or rice or ICAS farmers, especially in terms of higherintake of eggs and meat and higher farm household income.
The smallholder fish production system. As in animalproduction, there are two fish production systems, small-scale and commercial, consisting of capture fishing andaquaculture production. The capture fishing system is com-posed of two subsectors: commercial and municipal cap-ture fishing. While most capture fishing is shared by the twosubsectors, inland capture fisheries are the smallest in thelevel of catch production. Cagauan (personal communica-tion, 2003) observed that inland aquaculture (mostly tila-pia culture) is passing from intensification to commercial-ization, with big players coming in as a result of the successof all-male Y-Y tilapia and the genetically improved farmedtilapia for efficient fingerling and breeder production, re-spectively.
Catches in capture fishing have dwindled over the yearsprimarily because of overfishing, resource-use conflicts,pollution, siltation, and, most importantly, the growingpoverty rate within the coastal areas.
It is well documented that, where the population growthrate is high, there poverty resides and, where poverty reigns,widespread overfishing and pollution occur.
The weak enforcement of property rights coupled withwidespread pollution from human settlements results in bothresource-use conflicts and the severe depletion of marineresources. At the same time, the intrusion of saline waterand heavy chemicals in inland fisheries potentially threat-ens the productivity of these farm resources.
Macro supply and demand trendsof rice and animalsThe simultaneous fuller development of the rice, animal,and fish sectors, as chief ICAS components in rainfed rice-farming communities, with the local government as jointlyresponsible, is the millennium challenge and opportunityto reduce poverty and inequality and protect the environ-ment through efficient but limited resource management.
Rice supply and demand trends. The Philippines hasmade notable progress in rice production in the last threedecades. Production increased from 4.1 million t in 1965 to10.5 million t in 1994, an annual increase of 3.3%, whichwas much faster than the growth of population.
Growth was achieved almost entirely through an in-crease in yield brought about by the gradual replacement oftraditional low-yielding cultivars with the modern high-yielding ones, supported by an expansion of irrigation andintensive use of chemical fertilizers. Rice yield increasedfrom 1.3 to 2.9 t ha–1 in 1965-94.
Growth has slowed down since the mid-1980s, with adrastic decline in public investment for the expansion andmaintenance of irrigation infrastructure and limited scopefor further expansion of areas under modern varieties as morethan 90% of the land is already covered. Since 1982, riceyield has increased by only 1.7% per year compared withthe 2.4% per year increase in population, largely erodingthe higher grain yields obtained earlier.
The demand for rice, however, continued to increasebecause of the high population growth rate. This may bedue to a poorly implemented family planning program upto now. Recent projections show that the population willstill grow at 1.3% per year by 2020, and it will take muchlonger to achieve a more stable population growth rate.Population is projected to increase by another 24% over thenext decade and by 56% over the next 25 years. Rice sup-plies must grow at this rate to maintain per capita consump-tion at the present level.
But per capita consumption itself may increase withthe alleviation of poverty as the economy moves out of thestagnancy experienced in the 1980s. The current consump-tion of cereal grains is about 30% lower than the norm setby the FAO (300 kg per person per year, including provi-sions for seeds and wastage) required to meet the energyneeds of individuals.
While the low cereal consumption is due to high levelsof consumption of fish and meat compared to countries atsimilar levels of income, it is also due to the large propor-tion of poor people who cannot afford to meet their grainneeds.
The conservative estimate of the income elasticity ofdemand for rice at present is 0.1. It is expected to becomenegative when poverty disappears and per capita incomereaches US$1,500. But this income level will not be reachedbefore 2010 even if the Philippines succeeds in sustaining arate of growth in gross national product (GNP) of 6% peryear. Thus, as per capita income grows, per capita rice con-sumption will increase only marginally.
The other factor that may put upward pressure onper capita rice consumption is the substitution of rice formaize as human food. The present per capita consumptionof maize in the Philippines is about 20 kg per person, one ofthe highest in Asia. The income elasticity of demand formaize, however, is –0.25. If per capita income increases at amore modest rate of 4% per year, consumption of maize ashuman food could decline by about 20% by 2010. Maize islikely to be substituted by rice.
Livestock and poultry supply and demand trends. Do-mestic livestock population trends indicate that, from 1929to 2001, with the exception of the 1940s (war years), stocksof ducks, hogs, and chickens steadily increased (Fig. 1).Poultry’s steady rise was almost entirely due to the intro-duction of new breeds of chicks coming from the U.S. afterthe war years (Fig. 2). It continued to rise because of theincreasing demand for eggs and chicken meat, which

161
prompted a steady supply of superior breeders, which pro-duce more eggs.
The hog population has also sustained its growth be-cause of the importation of superior swine. With variouscross combinations of local and imported breeds, the indus-try provided consumers with superior growth coupled withlocal adaptation to the Philippine climate. Also, improve-ments in feeding and general management have dramati-cally improved the hog industry’s performance (Gonzales1998).
However, for ruminants such as carabao, cattle, andgoats, the population performance has been slow relative toother livestock. During the late ’30s, carabao and to a majorextent cattle were the main sources of farm draft power. Thenative breeds during the 1940s were almost decimated, withhalf of their prewar population wiped out.
With the introduction of farm machines and equipment(4- and 2-wheel tractors) in the ’60s and their refinement inthe ’70s, the carabao population slowed considerably ow-ing to the substitution of animals by machines, especiallyduring land preparation. For cattle and goats, thepopulation’s lackluster performance was mainly due to the
slow commercialization process. Statistics show that almost90% of carabao, cattle, and goat production has emanatedfrom backyard raising, while the remaining 10% has beenshared by the commercial sector (Gonzales 1998).
The main market for the country’s livestock sector isstill the domestic market (Table 2). Given that the majordomestic poultry and livestock products have little com-petitive edge over their imported counterparts, the sectorhas no choice but to concentrate its efforts on the domesticmarket. Aside from the tariffs that are imposed on importedlivestock products, prospects from the domestic marketwould come from a high population growth rate and conse-quently high demand for livestock products.
Fish supply and demand trends. Figure 3 shows thecountry’s fish production trends by type of system from1991 to 2000. It is clear that, under capture fishing, themunicipal sector has been declining, whereas the commer-cial sector has been steadily increasing. The major reasonfor this trend is that the major fish resources from coastaland inland waters have been declining, probably becauseof the increase in production of commercial fishing compa-nies. Also, because of the overall decline in capture fishing,
��0���
��0���
�0���
�0���
�0���
�0���
�
4������%5
���� ���� ���� ���� ���� ���� ���� ���� ���� ���� ���� ���� ���� ���� ���� ����
7�1@�! $ $�!#'�B���"� �
>�#
��0���
��0���
��0���
��0���
�0���
�0���
�0���
�0���
�
4������%5
���� ���� ���� ���� ���� ���� ���� ���� ���� ���� ���� ���� ���� ���� ���� ����
>�#
Fig. 2. Trend in poultry population.
Fig. 1. Livestock and poultry supply from 1929 to 2004.
Table 2. Demand projections of beef, pork, and poultry (t), 1996-2004.
Year Beef Pork Poultry
1994-95 average consumption 147,576 776,286 319,7591996 157,463 828,297 341,1831997 168,014 883,793 364,0421998 179,270 943,007 388,4331999 191,281 1,006,188 414,4582000 204,098 1,073,603 442,2272001 217,772 1,145,535 471,8562002 232,362 1,222,285 503,4702003 247,931 1,304,179 537,2032004 264,542 1,391,559 573,195
Source: Gonzales (1997).
Fig. 3. Trends in fish production, 1991-2000.
�0���
�0���
�0���
���
���
���
���
�����
>�#���� ���� ���� ���� ���� ���� ���� ���� ����
?#�%�1 ����4���� 5
�E�1�$ �#�*���1�.$!�))�#1�$

162
commercial fishing has encroached on the fishing groundsof the municipal fishing sector. In contrast, the aquaculturesector has increased at a stable and steady rate. This is dueto the introduction of new and tested technologies such assex reversal and others, which have greatly enhanced thesector’s production level. It is projected that, in the nearfuture, most of the protein derived from fish will come fromthis sector.
According to Aguilar and Saclauso (2002), the averageper capita consumption from fish is approximately 36 kgcapita–1 year–1. Using this parameter to estimate the pro-jected demand for fish, it was found that the current level ofproduction cannot keep up with the country’s growing popu-lation. Without corresponding measures to increase produc-tion, the projected deficit would amount to 0.6 million twithin the next 2 years.
Population growth and economic situationof small rainfed rice farmers in the Philippines
The economic situation of small rice farmers is also viewedfrom the standpoint of population, poverty, and human de-velopment. Macro data were used in the analyses embrac-ing the entire populace but, nevertheless, by interpolation,the results of the analyses are applicable to rainfed farmers,as they are among the poorest of the poor.
Population growth and demographic changePopulation growth itself influences food demand and re-quirements. A rapid increase in population means greaterfood requirements. The ability to feed an increasing popu-lation depends on efforts to increase productivity. At thesame time, it should be emphasized that food requirementswill vary depending on structural changes in the popula-tion such as declining mortality, high fertility, and migra-tion to urban areas. Food demand, especially for meat, isgreatly affected by improved income, better education, andchanging lifestyles. The Philippine population can be char-acterized by increasing childbirth, declining mortality, andrural-urban migration.
The Philippine annual population growth rate, althoughit has continuously declined since 1970, is still one of thehighest in Southeast Asia (2.3%). This rate remained steadyfrom 1980 to 1995, while that of Singapore (1.0%) and Thai-land (1.4%) continued to slow down.
On the other hand, many people moved to the cities in1980-90, with the urban population growing by leaps andbounds (30%), to almost equal to the rural population. An-other historic fact is that the Philippine population of 80million today will probably double by 2030, and that of theworld’s 6 billion will probably double by 2050. Food secu-rity and affordability will have to be worked out today inpreparation for a future with so many mouths to feed hereand abroad.
The demographic composition of more young peopleand a growing population of women suggests newer tech-
nologies, product development, human capital improve-ment, and improved strategies of agricultural development,with women playing even more active roles. Since mostproductive lands have been exhausted, the only way toprogress is to achieve better resource use to increase pro-duction per unit of land, increase the creativity of humanresources, and put marginal rainfed lands into high-tech butlow-input conservation agriculture. With overseas employ-ment and armed conflicts drawing more men away from farms,women and children will have greater roles in food produc-tion. It can be mentioned in passing that women have tradi-tionally worked in the food/feed realm. Men are becomingprominent in the food business scene outside the home,however.
Poverty and inequality, and the place of ICASRegional profile of poverty and inequality. Table 3 showsthe official estimates of regional head-count poverty inci-dence of families in 1994, which ranges from a low of 8% inthe National Capital Region (NCR) or Metro Manila to ahigh of 60% in the Autonomous Region of MuslimMindanao (ARMM). Poverty incidence by province showsa much starker contrast. By interpolation, small rainfed farm-ers, who are among the poorest of the poor with their mar-ginal unproductive lands, were in the direst economic straits.
Inequality in human development (Table 4) shows thatMetro Manila (0.819 and above) has the highest humandevelopment index (HDI), composite score for life expect-ancy (in years), functional literacy (rate in percent), and realper capita income (in pesos). Eastern Visayas is shown tohave the lowest HDI (below 0.500).
Causes of poverty and inequality. According toBalisacan and Fujisaki (1999), the causes of poverty arefunctional illiteracy, land inequality, small farm size andlack of tenancy, poor agricultural terms of trade, lack ofirrigation, lack of roads, lack of electricity, and an unfavor-able political and economic environment.
Table 5 shows the relative importance of each causalfactor. Most of the identified causes are rural community-and agriculture-related, areas that for many years have beenneglected by the government.
In a way, agriculture, on which more than 70% of Fili-pinos depend for their livelihood, is both the root and thesolution of the interrelated problems of food security, pov-erty, inequality, and environmental protection forsustainability.
Functional literacy is defined as the proportion of theadult population that can read, write, and compose simplemessages. Land inequality is expressed by the farmers’ land-holding ratio, which has extreme values of one (perfect in-equality) and zero (perfect equality). Farm size is averagefarm size. Tenancy is defined as the ratio of area of farmsunder share tenancy to the total area of farms.
Irrigation is expressed as the ratio of irrigated to totalfarm area. Agricultural terms of trade are defined as the ratioof the price of agriculture to the price of nonagriculture.
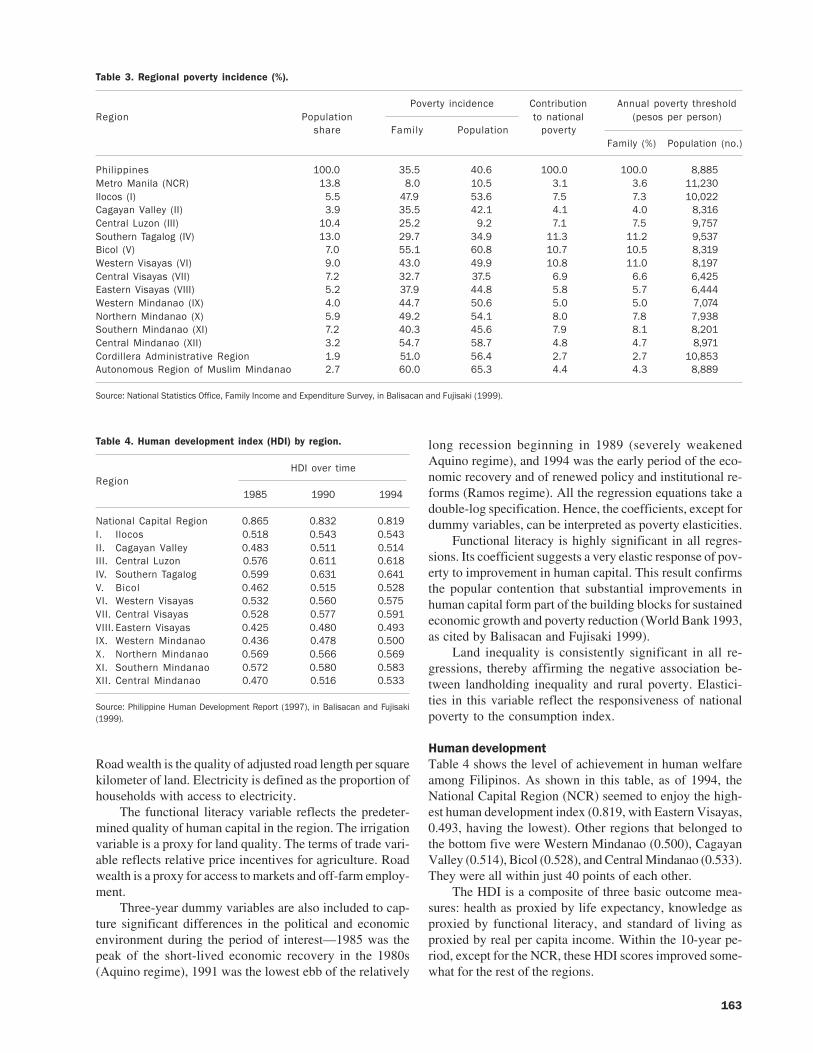
163
Road wealth is the quality of adjusted road length per squarekilometer of land. Electricity is defined as the proportion ofhouseholds with access to electricity.
The functional literacy variable reflects the predeter-mined quality of human capital in the region. The irrigationvariable is a proxy for land quality. The terms of trade vari-able reflects relative price incentives for agriculture. Roadwealth is a proxy for access to markets and off-farm employ-ment.
Three-year dummy variables are also included to cap-ture significant differences in the political and economicenvironment during the period of interest—1985 was thepeak of the short-lived economic recovery in the 1980s(Aquino regime), 1991 was the lowest ebb of the relatively
long recession beginning in 1989 (severely weakenedAquino regime), and 1994 was the early period of the eco-nomic recovery and of renewed policy and institutional re-forms (Ramos regime). All the regression equations take adouble-log specification. Hence, the coefficients, except fordummy variables, can be interpreted as poverty elasticities.
Functional literacy is highly significant in all regres-sions. Its coefficient suggests a very elastic response of pov-erty to improvement in human capital. This result confirmsthe popular contention that substantial improvements inhuman capital form part of the building blocks for sustainedeconomic growth and poverty reduction (World Bank 1993,as cited by Balisacan and Fujisaki 1999).
Land inequality is consistently significant in all re-gressions, thereby affirming the negative association be-tween landholding inequality and rural poverty. Elastici-ties in this variable reflect the responsiveness of nationalpoverty to the consumption index.
Human developmentTable 4 shows the level of achievement in human welfareamong Filipinos. As shown in this table, as of 1994, theNational Capital Region (NCR) seemed to enjoy the high-est human development index (0.819, with Eastern Visayas,0.493, having the lowest). Other regions that belonged tothe bottom five were Western Mindanao (0.500), CagayanValley (0.514), Bicol (0.528), and Central Mindanao (0.533).They were all within just 40 points of each other.
The HDI is a composite of three basic outcome mea-sures: health as proxied by life expectancy, knowledge asproxied by functional literacy, and standard of living asproxied by real per capita income. Within the 10-year pe-riod, except for the NCR, these HDI scores improved some-what for the rest of the regions.
Table 3. Regional poverty incidence (%).
Poverty incidence Contribution Annual poverty thresholdRegion Population to national (pesos per person)
share Family Population povertyFamily (%) Population (no.)
Philippines 100.0 35.5 40.6 100.0 100.0 8,885Metro Manila (NCR) 13.8 8.0 10.5 3.1 3.6 11,230Ilocos (I) 5.5 47.9 53.6 7.5 7.3 10,022Cagayan Valley (II) 3.9 35.5 42.1 4.1 4.0 8,316Central Luzon (III) 10.4 25.2 9.2 7.1 7.5 9,757Southern Tagalog (IV) 13.0 29.7 34.9 11.3 11.2 9,537Bicol (V) 7.0 55.1 60.8 10.7 10.5 8,319Western Visayas (VI) 9.0 43.0 49.9 10.8 11.0 8,197Central Visayas (VII) 7.2 32.7 37.5 6.9 6.6 6,425Eastern Visayas (VIII) 5.2 37.9 44.8 5.8 5.7 6,444Western Mindanao (IX) 4.0 44.7 50.6 5.0 5.0 7,074Northern Mindanao (X) 5.9 49.2 54.1 8.0 7.8 7,938Southern Mindanao (XI) 7.2 40.3 45.6 7.9 8.1 8,201Central Mindanao (XII) 3.2 54.7 58.7 4.8 4.7 8,971Cordillera Administrative Region 1.9 51.0 56.4 2.7 2.7 10,853Autonomous Region of Muslim Mindanao 2.7 60.0 65.3 4.4 4.3 8,889
Source: National Statistics Office, Family Income and Expenditure Survey, in Balisacan and Fujisaki (1999).
Table 4. Human development index (HDI) by region.
HDI over timeRegion
1985 1990 1994
National Capital Region 0.865 0.832 0.819I. Ilocos 0.518 0.543 0.543II. Cagayan Valley 0.483 0.511 0.514III. Central Luzon 0.576 0.611 0.618IV. Southern Tagalog 0.599 0.631 0.641V. Bicol 0.462 0.515 0.528VI. Western Visayas 0.532 0.560 0.575VII. Central Visayas 0.528 0.577 0.591VIII. Eastern Visayas 0.425 0.480 0.493IX. Western Mindanao 0.436 0.478 0.500X. Northern Mindanao 0.569 0.566 0.569XI. Southern Mindanao 0.572 0.580 0.583XII. Central Mindanao 0.470 0.516 0.533
Source: Philippine Human Development Report (1997), in Balisacan and Fujisaki(1999).
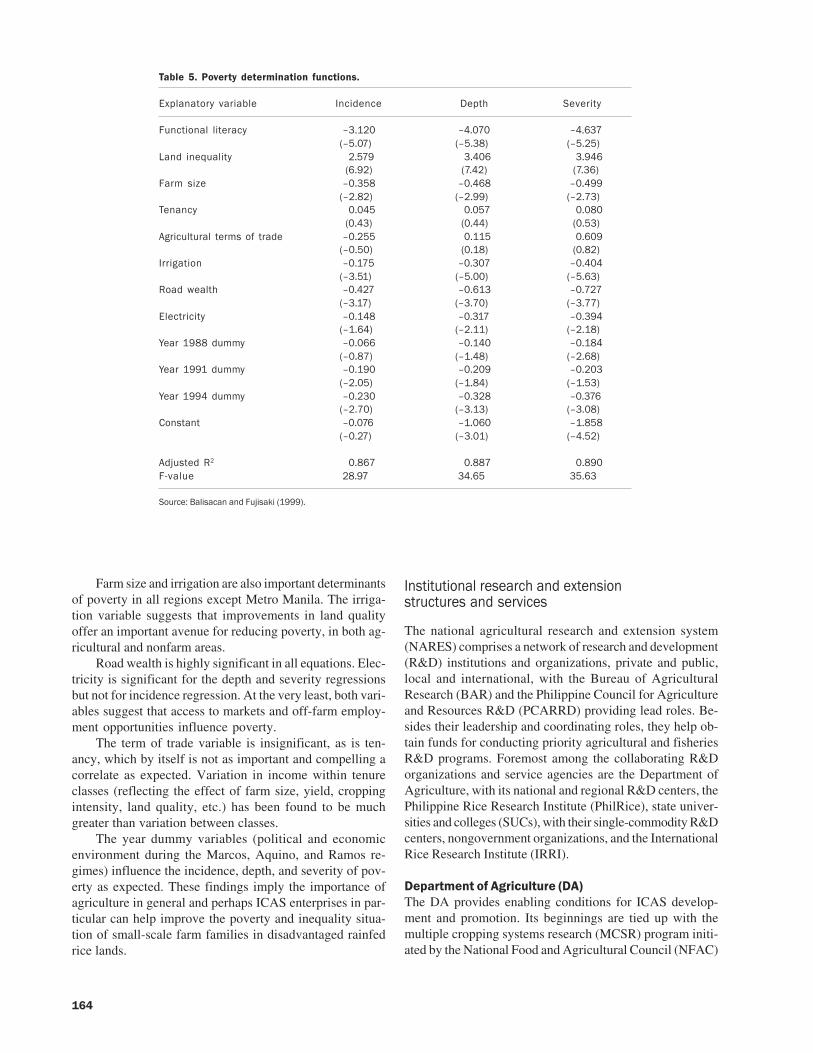
164
Farm size and irrigation are also important determinantsof poverty in all regions except Metro Manila. The irriga-tion variable suggests that improvements in land qualityoffer an important avenue for reducing poverty, in both ag-ricultural and nonfarm areas.
Road wealth is highly significant in all equations. Elec-tricity is significant for the depth and severity regressionsbut not for incidence regression. At the very least, both vari-ables suggest that access to markets and off-farm employ-ment opportunities influence poverty.
The term of trade variable is insignificant, as is ten-ancy, which by itself is not as important and compelling acorrelate as expected. Variation in income within tenureclasses (reflecting the effect of farm size, yield, croppingintensity, land quality, etc.) has been found to be muchgreater than variation between classes.
The year dummy variables (political and economicenvironment during the Marcos, Aquino, and Ramos re-gimes) influence the incidence, depth, and severity of pov-erty as expected. These findings imply the importance ofagriculture in general and perhaps ICAS enterprises in par-ticular can help improve the poverty and inequality situa-tion of small-scale farm families in disadvantaged rainfedrice lands.
Institutional research and extensionstructures and services
The national agricultural research and extension system(NARES) comprises a network of research and development(R&D) institutions and organizations, private and public,local and international, with the Bureau of AgriculturalResearch (BAR) and the Philippine Council for Agricultureand Resources R&D (PCARRD) providing lead roles. Be-sides their leadership and coordinating roles, they help ob-tain funds for conducting priority agricultural and fisheriesR&D programs. Foremost among the collaborating R&Dorganizations and service agencies are the Department ofAgriculture, with its national and regional R&D centers, thePhilippine Rice Research Institute (PhilRice), state univer-sities and colleges (SUCs), with their single-commodity R&Dcenters, nongovernment organizations, and the InternationalRice Research Institute (IRRI).
Department of Agriculture (DA)The DA provides enabling conditions for ICAS develop-ment and promotion. Its beginnings are tied up with themultiple cropping systems research (MCSR) program initi-ated by the National Food and Agricultural Council (NFAC)
Table 5. Poverty determination functions.
Explanatory variable Incidence Depth Severity
Functional literacy –3.120 –4.070 –4.637(–5.07) (–5.38) (–5.25)
Land inequality 2.579 3.406 3.946(6.92) (7.42) (7.36)
Farm size –0.358 –0.468 –0.499(–2.82) (–2.99) (–2.73)
Tenancy 0.045 0.057 0.080(0.43) (0.44) (0.53)
Agricultural terms of trade –0.255 0.115 0.609(–0.50) (0.18) (0.82)
Irrigation –0.175 –0.307 –0.404(–3.51) (–5.00) (–5.63)
Road wealth –0.427 –0.613 –0.727(–3.17) (–3.70) (–3.77)
Electricity –0.148 –0.317 –0.394(–1.64) (–2.11) (–2.18)
Year 1988 dummy –0.066 –0.140 –0.184(–0.87) (–1.48) (–2.68)
Year 1991 dummy –0.190 –0.209 –0.203(–2.05) (–1.84) (–1.53)
Year 1994 dummy –0.230 –0.328 –0.376(–2.70) (–3.13) (–3.08)
Constant –0.076 –1.060 –1.858(–0.27) (–3.01) (–4.52)
Adjusted R2 0.867 0.887 0.890F-value 28.97 34.65 35.63
Source: Balisacan and Fujisaki (1999).

165
in tandem with the University of the Philippines College ofAgriculture (UPCA) at Los Baños in the 1970s and ’80s.This grew out of the need to increase the income and im-prove the diet of small farmers and their families by maxi-mizing the use of land resources.
Table 6 chronicles the MCSR program and other re-lated farming systems approach (FSA) national and regionalagricultural development programs implemented by the DAand collaborating institutions. Those implemented after1987 were part of an existing policy and general strategy topromote agricultural development, which mandated greaterfarmer participation in agricultural development and theuse of a bottom-up self-reliant FSA for justice and equity(Executive Order No. 116, dated 30 January 1987).
Table 6 can be viewed as a much-traveled road mapthat traces the concerted effort made by the government andpartner organizations to pave the way to a vigorous farmingsystems research and development (FSRD), which includesICAS. The details of each step taken through relentless pur-suit of FSA in farmers’ fields, including biophysical andsocioeconomic characterization of sites, could not be shownas the information on hand was not adequate. Therefore,determining the potentials of ICAS in rice ecosystems couldalso not be reported.
Not until 1985 were animals and women food-process-ing enterprise development and participatory approachesduly incorporated in the rice-cattle farming system in rainfedand irrigated areas in Pangasinan, Luzon (Paris 2002). Sub-sequently, ICAS R&E expanded to other ARFSN/IRRI sitesin the Philippines.
Today, the DA, through the initiative of BAR, is inten-sifying and accelerating technology transfer in agricultureand fisheries through a farmer-centered agricultural resourcemanagement program. Community-based participatory ac-tion research (CPAR) has been put in place. This involveson-farm research (OFR) conducted in farmers’ fields andmanaged by farmers, coordinated and supervised by the re-gional integrated agricultural research centers (RIARCs).The objectives of CPAR are
1. To accelerate technology transfer from the technol-ogy-generating system to the farming and fishing com-munities and increase total farm productivity and in-come.
2. To make research more meaningful and responsive tothe needs of farmers/fisher folks.
3. To develop systematic feedback (regarding the farmsituation) to the research system.
4. To provide a mechanism for effective research-exten-sion interface at the provincial level, jointly by theDA and provincial local government unit (LGU), atthe municipal level, jointly by provincial and mu-nicipal LGUs, and at the barangay level, or in farmingcommunities, jointly by the municipal and barangayLGUs.
The various dimensions of CPAR are a (1) total farmapproach, (2) total technology approach, (3) total family
approach, (4) total community approach, and (5) marketand credit.
Asian Rice Farming Systems Network (ARFSN)and the International Rice Research Institute (IRRI)IRRI started its rice-based cropping systems research (CSR)work at the very beginning of its operation in 1960. Thiswas broadened into farming systems research in 1972. In1974, the scope of farming systems work was further ex-panded with the establishment of the Asian Cropping Sys-tems Network (ACSN), a collaborative effort among fivecountries in Southeast Asia: Philippines, Thailand, Viet-nam, Bangladesh, and India. It soon became the Asian Farm-ing Systems Network (AFSN) in 1983, and the Asian RiceFarming Systems Network (ARFSN) in 1985. By this time,it had expanded to include the animal component of small-holder farms in Asia. The basic procedures of the CSR R&Emethodology involving site selection and description, di-agnosis, extrapolation and design, testing, and evaluationwere used in ICAS R&E.
The ARFSN ICAS R&E sites in the Philippines werePangasinan (Region 1), representing both the rainfed andirrigated lowland rice ecosystem; Cavite (Region IV), up-land; and Tarlac (Region III), another rainfed site. ThePangasinan crop-livestock system, with the establishmentof legumes and grasses for fodder, Cavite rice-pig with cow-pea-cassava feed and feeding system interventions, andTarlac crop-livestock project, with setaria, napier, anddesmanthua on hedgerows as feed to improve the existingfeeding system, were viewed as successful ICAS R&E inthat the objectives of productivity, profitability, social ac-ceptability, ecological soundness, and sustainability wereattained. Both the Cavite and Tarlac projects were under-taken in collaboration with the DA Regional IntegratedAgricultural Research System (RIARS), now the RegionalIntegrated Agricultural Research Center (RIARC), as part ofan institution-building commitment of the ARFSN. In allcases, the MCSR methodology used in ICAS R&E was im-proved.
Both on-farm and on-station research experiments wereused. The farmer-led on-farm research defined the problem,while the researcher-led on-station research helped solvethe problem identified. Interdisciplinary research teams in-volving crop, animal, and social scientists worked togetherat a few sites.
Workshops and monitoring and evaluation tours wereorganized by the ARFSN, bringing together scientists fromAsia, Africa, and Latin America to discuss and exchangenotes on ICAS R&E. The objectives of these workshops andevaluation tours were to (1) identify and document method-ologies for the application and measurement of interactionsfor the development of sustainable crop-animal farmingsystems, (2) describe the different types of crop-animal in-teractions in different rice ecosystems, and (3) formulateresearch priorities and strategies appropriate to the devel-opment of crop-animal systems in different rice ecosystems.
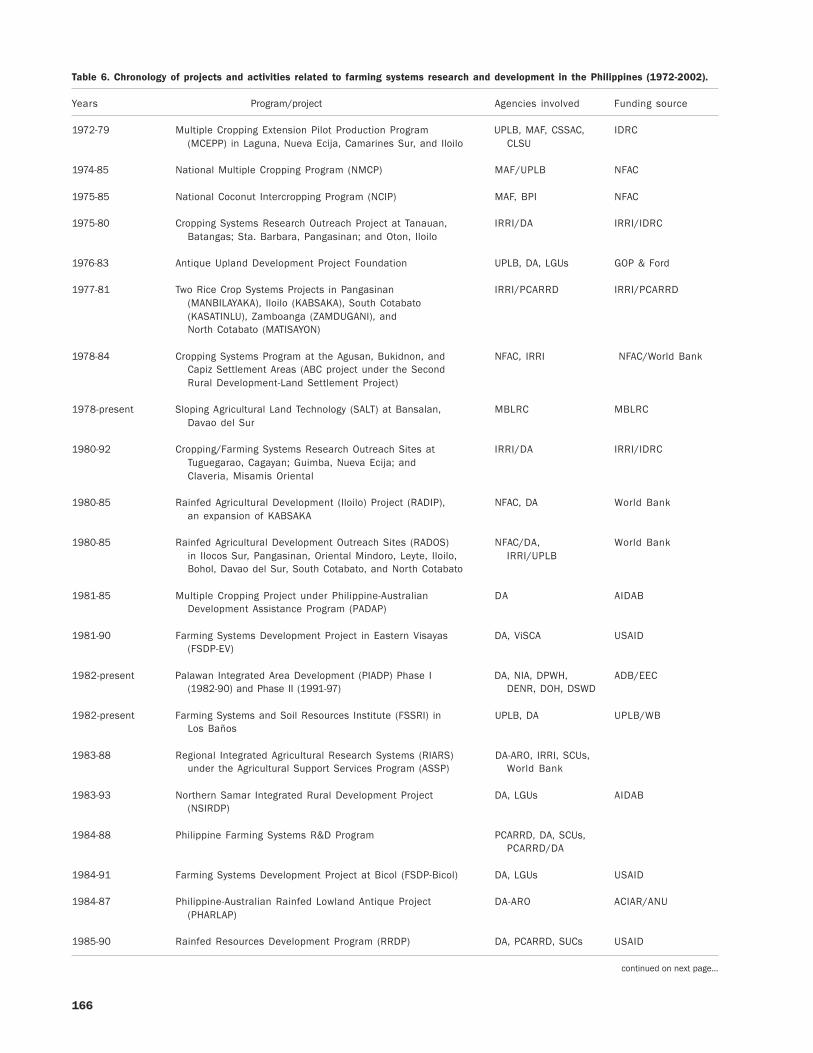
166
Table 6. Chronology of projects and activities related to farming systems research and development in the Philippines (1972-2002).
Years Program/project Agencies involved Funding source
1972-79 Multiple Cropping Extension Pilot Production Program UPLB, MAF, CSSAC, IDRC(MCEPP) in Laguna, Nueva Ecija, Camarines Sur, and Iloilo CLSU
1974-85 National Multiple Cropping Program (NMCP) MAF/UPLB NFAC
1975-85 National Coconut Intercropping Program (NCIP) MAF, BPI NFAC
1975-80 Cropping Systems Research Outreach Project at Tanauan, IRRI/DA IRRI/IDRCBatangas; Sta. Barbara, Pangasinan; and Oton, Iloilo
1976-83 Antique Upland Development Project Foundation UPLB, DA, LGUs GOP & Ford
1977-81 Two Rice Crop Systems Projects in Pangasinan IRRI/PCARRD IRRI/PCARRD(MANBILAYAKA), Iloilo (KABSAKA), South Cotabato(KASATINLU), Zamboanga (ZAMDUGANI), andNorth Cotabato (MATISAYON)
1978-84 Cropping Systems Program at the Agusan, Bukidnon, and NFAC, IRRI NFAC/World BankCapiz Settlement Areas (ABC project under the SecondRural Development-Land Settlement Project)
1978-present Sloping Agricultural Land Technology (SALT) at Bansalan, MBLRC MBLRCDavao del Sur
1980-92 Cropping/Farming Systems Research Outreach Sites at IRRI/DA IRRI/IDRCTuguegarao, Cagayan; Guimba, Nueva Ecija; andClaveria, Misamis Oriental
1980-85 Rainfed Agricultural Development (Iloilo) Project (RADIP), NFAC, DA World Bankan expansion of KABSAKA
1980-85 Rainfed Agricultural Development Outreach Sites (RADOS) NFAC/DA, World Bankin Ilocos Sur, Pangasinan, Oriental Mindoro, Leyte, Iloilo, IRRI/UPLBBohol, Davao del Sur, South Cotabato, and North Cotabato
1981-85 Multiple Cropping Project under Philippine-Australian DA AIDABDevelopment Assistance Program (PADAP)
1981-90 Farming Systems Development Project in Eastern Visayas DA, ViSCA USAID(FSDP-EV)
1982-present Palawan Integrated Area Development (PIADP) Phase I DA, NIA, DPWH, ADB/EEC(1982-90) and Phase II (1991-97) DENR, DOH, DSWD
1982-present Farming Systems and Soil Resources Institute (FSSRI) in UPLB, DA UPLB/WBLos Baños
1983-88 Regional Integrated Agricultural Research Systems (RIARS) DA-ARO, IRRI, SCUs,under the Agricultural Support Services Program (ASSP) World Bank
1983-93 Northern Samar Integrated Rural Development Project DA, LGUs AIDAB(NSIRDP)
1984-88 Philippine Farming Systems R&D Program PCARRD, DA, SCUs,PCARRD/DA
1984-91 Farming Systems Development Project at Bicol (FSDP-Bicol) DA, LGUs USAID
1984-87 Philippine-Australian Rainfed Lowland Antique Project DA-ARO ACIAR/ANU(PHARLAP)
1985-90 Rainfed Resources Development Program (RRDP) DA, PCARRD, SUCs USAID
continued on next page...
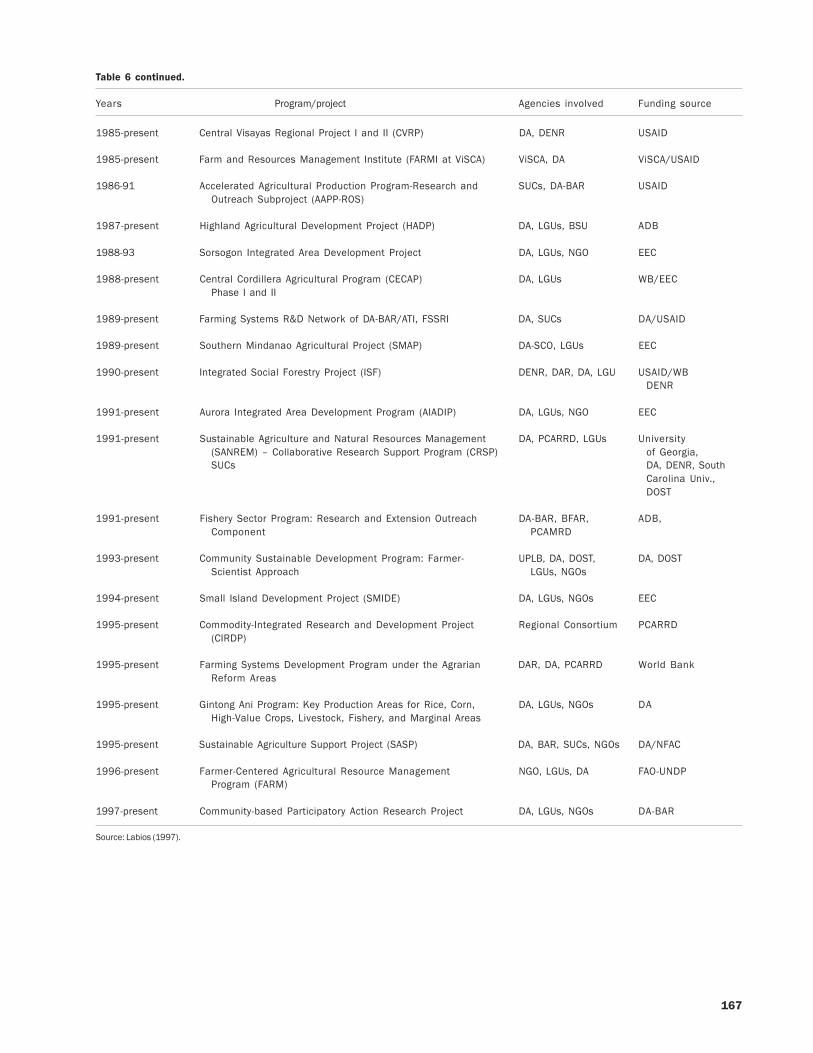
167
1985-present Central Visayas Regional Project I and II (CVRP) DA, DENR USAID
1985-present Farm and Resources Management Institute (FARMI at ViSCA) ViSCA, DA ViSCA/USAID
1986-91 Accelerated Agricultural Production Program-Research and SUCs, DA-BAR USAIDOutreach Subproject (AAPP-ROS)
1987-present Highland Agricultural Development Project (HADP) DA, LGUs, BSU ADB
1988-93 Sorsogon Integrated Area Development Project DA, LGUs, NGO EEC
1988-present Central Cordillera Agricultural Program (CECAP) DA, LGUs WB/EECPhase I and II
1989-present Farming Systems R&D Network of DA-BAR/ATI, FSSRI DA, SUCs DA/USAID
1989-present Southern Mindanao Agricultural Project (SMAP) DA-SCO, LGUs EEC
1990-present Integrated Social Forestry Project (ISF) DENR, DAR, DA, LGU USAID/WBDENR
1991-present Aurora Integrated Area Development Program (AIADIP) DA, LGUs, NGO EEC
1991-present Sustainable Agriculture and Natural Resources Management DA, PCARRD, LGUs University(SANREM) – Collaborative Research Support Program (CRSP) of Georgia,SUCs DA, DENR, South
Carolina Univ.,DOST
1991-present Fishery Sector Program: Research and Extension Outreach DA-BAR, BFAR, ADB,Component PCAMRD
1993-present Community Sustainable Development Program: Farmer- UPLB, DA, DOST, DA, DOSTScientist Approach LGUs, NGOs
1994-present Small Island Development Project (SMIDE) DA, LGUs, NGOs EEC
1995-present Commodity-Integrated Research and Development Project Regional Consortium PCARRD(CIRDP)
1995-present Farming Systems Development Program under the Agrarian DAR, DA, PCARRD World BankReform Areas
1995-present Gintong Ani Program: Key Production Areas for Rice, Corn, DA, LGUs, NGOs DAHigh-Value Crops, Livestock, Fishery, and Marginal Areas
1995-present Sustainable Agriculture Support Project (SASP) DA, BAR, SUCs, NGOs DA/NFAC
1996-present Farmer-Centered Agricultural Resource Management NGO, LGUs, DA FAO-UNDPProgram (FARM)
1997-present Community-based Participatory Action Research Project DA, LGUs, NGOs DA-BAR
Source: Labios (1997).
Table 6 continued.
Years Program/project Agencies involved Funding source

168
During the series of workshops, papers on the progress andresults of ICAS R&E and research methodology used inrice-based crop-animal systems and other crop-animal–basedfarming systems (wheat, root crop, etc.) were presented. TheARFSN was phased out, however, in 1996.
Philippine Rice Research Institute (PhilRice)PhilRice, with its Rice-Based Farming Systems (RBFS),works closely with discipline-oriented divisions of the in-stitute (Plant Breeding and Biotechnology; Agronomy,Soils, and Plant Physiology; Crop Protection; Rice Engi-neering and Farm Mechanization; Socioeconomics; andRice Chemistry and Food Science). Support service areas ofSeed Production and Health, Development Communicationand Training, and Technology Management and Servicesactively support the various RBFS activities. PhilRice hasestablished strong linkages with state universities and col-leges (SUCs) and other service agencies and NGOs for avigorous rice production program.
Among the common activities undertaken underinterdepartment arrangements are multilocation testing ofpromising component technologies of various aspects ofrice production and processing, pilot rice production pro-grams, and national production programs. PhilRice worksso that its promising component technologies are adoptedby farmer-users to improve rice productivity.
PhilRice has a Socioeconomics Division that has de-veloped a methodology for measuring the net profitability,net efficiency, and competitive advantage of different RBFScrop components. These aspects can be introduced to im-prove the current and future ICAS R&E methodology formeasuring the benefits of the livestock component whenadded to a purely crop-based farming system with rice asthe main crop.
The Institute also has a strong Food Science Division,which has developed potential rice-processing technolo-gies, among which is rice wine based on the local wine(tapuy) popular in Ifugao Province, and it is now becomingan export rice-based product.
Furthermore, PhilRice has a well-knit network of GOsand NGOs, at the national and regional levels, that can helppromote improved rice-based ICAS technologies for on-farmtesting and piloting. Its farmer-clientele who have been in-volved in on-farm rice experiments are quite willing to tryout improved integrated crop-animal technologies along atotal food/feed systems approach.
Philippine Council on Agriculture and ResourcesResearch and Development (PCARRD)The NARES in the Philippines consists of a network of na-tional and regional commodity R&E centers and regionalR&D consortia being coordinated by PCARRD, with its 15consortia in 15 regions of the country. A consortium is aquasi organization with research and service agencies in aregion as members, with either a DA or an SUC as the baseand secretariat. Its organization in the late 1970s and ’80s
was based on the decentralized management of agriculturaland resource R&D under the principles of cooperation, rel-evance, effectiveness, and efficiency. Its technology trans-fer and service delivery are much improved through user-oriented approaches—Farmer Scientists Bureau (FSB),Farmer Information Technology Systems (FITS), symposiaand business fora, and rewarding the outstanding perfor-mance of R&D centers and institutions by giving Pantas(expert), Tanglaw (light), and Ugnayan (coordination)Awards for excellence in agricultural and resource R&E.
Today, its Livestock Division (LD) spearheads theimplementation of an ICAS R&E program in the Philip-pines under the Crop-Animal Systems Research and Exten-sion Network (CASREN). Its LD and team of experts fromSUCs are carrying out a multidisciplinary, multiagency rice-rice + cattle farming system at two rainfed sites, Uminganand Don Montano, now being expanded to include threemore rainfed sites, Sta. Barbara, Calasiao, and Balungao, inPangasinan (Region I).
The International Livestock ResearchInstitute (ILRI)ILRI is a newcomer in Philippine ICAS R&E. It has spear-headed CASREN, involving the Philippines, China, Indo-nesia, Thailand, and Vietnam, signaling the start ofecoregional research. CASREN gives due recognition tolivestock in improving the sustainability of ICAS liveli-hood systems of farm households. The network embodiescontinuing activities on various aspects of ICAS R&E—improved understanding of the new ecoregional perspec-tives, policy options for promoting rural income, diversifi-cation in the livestock sector, GIS applications, improvedfeed production and use, design and ex ante analysis fortechnical interventions, methodologies for analyzing house-hold survey data, country characterization of rainfed sites,and ICAS technology development, promotion, and use.
Problems so far identified that could constrain the prac-tice of ICAS were restrictions to capital and inputs, to ac-cess to markets, and to diversity of household activities—crops, animals, household, off-farm interactions, culturalpreferences, and practices. Lessons learned were understand-ing complexities, developing improved component tech-nologies, and improved feeding, management, and animalhealth. CASREN is improving ICAS R&E perspectives andmethodology. Felt needs are the ex ante assessment as atool for identifying technical constraints, technology adop-tion (e.g., the fodder bank, a technology developed by ILRIin West Africa), complementarity of systems, componentresearch, and capacity development.
University of the Philippines atLos Baños (UPLB)Multiple cropping systems research (MCSR) in the Philip-pines formally started in 1971 as a joint UPLB College ofAgriculture (CA)-National Food and Agricultural Council(NFAC) national production program. The general objec-
169
tives were to increase the income of small farmers and im-prove their diet by maximizing the use of available landresources.
As a leading agricultural institution, UPLB was one ofthe SUCs with which ARFSN established a strong linkagefor pursuing an ICAS R&E program nation-wide. This insti-tution has strong crop, animal, and farming systems R&Dprojects. It has the right mix of capable agricultural scien-tists and relevant curricular programs, such as Livestockand Poultry, strongly supported by research, extension, andpublications. While the ARFSN has the rice technologiesand experts, UPLB has the crop and animal component tech-nologies and experts. R&E funds, however, being always inshort supply, have somewhat hampered ICAS R&E. UPLBcontinues to support ICAS R&E by including it among itspriorities in graduate and undergraduate research.
Central Luzon State University (CLSU)The major contribution of CLSU to ICAS R&E initiated byARFSN was its rice-fish farming system, which has not pro-gressed in the Philippines beyond the artisan type. Pingali(1998) gave several reasons why this may be so, but we arenot aware whether the reasons have been verified. Othermodified patterns that were tried, however, were rice-fish +duck + pig, rice-azolla + duck, and rice-fish + fingerlingproduction, the latter being a combination of grow-out andfingerling production.
Earlier, CLSU was an active partner in the CSR/MCSRzonification projects of UPLB, from which its FSA/FSRDtradition evolved. Later, together with this institution, theDA, and Kansas State University (KSU), a land-grant insti-tution in the U.S., they became major participants in theIntegrated Agricultural Production and Marketing Project(IAPMP), a national project of the FSRD genre under whichICAS R&R grew for a while. This was funded by the USAIDunder Title XII of the U.S. Congress (1978-83), after whichit did not prosper because of a lack of funds.
It had three components: policy, curriculum, and tech-nological packaging (“tech pack” for short). The DA wasthe lead agency in policy, UPLB in curriculum, and CLSUin tech pack, along a total food system of production, pro-cessing, and marketing. The identified tech packs werefarmer-proven technologies under small farmers’ conditionsacross rice ecosystems around a 15-km radius from CLSU,involving communities with zero to partial to full waterregimes. Among the major crop-animal packages tried on-farm were rice-rice + pig, rice-rice + poultry, rice-rice + fish,rice-rice + duck, and rice-rice + goat. The design and use oflivestock housing units, feed, and a feeding system wereamong the technology components. Support facilities ofthe total food/feed system approach were two commercialprocessing centers with provision for small- to medium-scalefeed and food product development and enterprise-build-ing ventures, and a farmers’ market.
Today, CLSU has strong carabao, goat, quail, and tila-pia on-station and on-farm R&E. Among its major contribu-
tions to the component crop/livestock/fish industry, whichcan find their way to ICAS technology improvement, areartificial insemination and frozen semen commercializationfor upgrading carabao. Upgrading native goat stocks throughvarious imported breeds (Anglo-Nubian, etc.), sex-reversed/genetically improved farmed tilapia strains, and a variety ofintegrated crop-animal-fish systems are among the poten-tial components for a vigorous revival of ICAS R&E.
The 25-cow dairy cooperative enterprise model inPangasinan, now being promoted in other regions all overthe country, and several goat cooperatives using upgradedAnglo-Nubian stocks, mostly in Nueva Ecija and Bulacan,can be added inputs in the proposed ICAS enterprises in atotal food/feed system.
For the participatory R&E methodology to help im-prove current ICAS R&E, lessons can be drawn from thefarmer-led organic fertilizer project under the Low ExternalInput for Sustainable Agriculture (LEISA) periurban veg-etable production and marketing project under the CLSU-AVRDC project, and the Central Cordillera AgriculturalProject (CECAP), all using participatory agricultural devel-opment perspectives, with university faculty as R&E lead-ers.
The Local Government Unit (LGU)-based participatoryextension of the Barangay Integrated Development for Ag-riculture and Nutrition Improvement (BIDANI) of CLSU canalso give cues on participatory ICAS R&E with a politicaldimension. The LGU is used as the owner and carrier of ruraldevelopment projects.
Other agencies/institutionsThe Don Mariano Marcos Memorial State University(DMMMSU), Visayas College of Agriculture (ViSCA), nowLeyte State University, and the Camarines Sur State Agri-culture College (CSSAC) were mentioned in a DA report tohave participated in the national ICAS R&E effort. Otherinstitutions might have ICAS R&E activities that we mayhave failed to retrieve because of certain limitations. Forexample, resource materials on hand are not complete.
Characterization of ICAS in rainfed lowland,upland, and hilly rice ecosystems
ICAS classificatory systemICAS can actually be classified according to variedagroecosystem and other classificatory descriptions as sug-gested below:
1. Agroecosystem, as fully or partially irrigated andunirrigated or rainfed lowland, hilly, or upland; shal-low drought-prone, shallow drought- and submer-gence-prone, shallow submergence-prone, and me-dium-deep and waterlogged; rice-based or other crop-based.
2. Geography as a locale descriptive of varied landscapesuseful in developing agro-tourism, which suggestssocial acceptability, technical feasibility, and equity;
170
includes regional (Regions I to XII, CAR, ARMM,and CARAGA) and zonal (Luzon, Visayas, andMindanao) as a dummy for ethnicity.
3. Other classificatory descriptions may refer to farm sizeas small (<1 ha) and big (>1 ha); government or non-government organization (GO-NGO) initiated or op-erated; extension provision by state universities andcolleges or service agencies; Department of Agricul-ture, Department of Agrarian Reform, etc., indicativeof management inputs for enabling conditions.
The Food and Agriculture Organization (FAO) of theUnited Nations has classified types of agricultural landsinto three, where ICAS technology may have been adopteddifferentially:
1. Low-potential lands—referring to rainfed with lowand uncertain rainfall.
2. High-potential lands—irrigated or naturally flooded,or rainfed with good rainfall.
3. Problem lands—with excessive rainfall, steep slopes,or poor soils.
This latter typology also signifies a form of suitabilityand sustainability measure that can be easily understood byfarmers. Forming a matrix of relationships using thesetypologies interacting with socioeconomic circumstances,for example, may yield newer information. This informa-tion was not used, however, when sorting on-farm ICAS.
As shown in Tables 7 and 8, on-farm and on-stationICAS technology development and promotion studies,mostly on component technology, were used as the mainsource for presenting ICAS: typology and geography, crop-animal interactions, socioeconomic benefits of livestock,and gender participation in ICAS. Table 7, which is for therainfed lowland and irrigated rice ecosystem, and Table 8,for the upland and hilly ecosystem, provide a summary ofcomponent studies upon which a part of this section is based.In Table 8, only the rice-based upland and hilly-land ICASwere included.
The ICAS could not, however, be classified completelyusing the above classificatory systems because of a lack ofinformation. Only the title of the ICAS projects, regional orprovincial/city locale, organizations or agencies concerned,and authors’/study leaders’ identity and components stud-ied could be mentioned.
ICAS typology and geographyThe common livestock and poultry components commonto rainfed lowland and irrigated, upland, and hilly lands arecarabao, cattle, goats, pigs, chickens, and ducks, and, tosome extent, sheep and fish, mainly tilapia. Common cropsgrown are rice and maize, legumes, and vegetables. Only afew farmers mentioned growing fodder for animals.
Not all regions have reported, so we could not surmisethat some of them did not consider ICAS technology adop-tion for the regions that reported, although the reports men-tioned ICAS being studied even when only component tech-
nologies were reported. The economic benefits of compo-nent technologies tested or verified were measured usingcost and return analysis.
There were more regions (5) that reported rice-basedICAS technology development and promotion activities inupland and hilly land than those in rainfed lowland andirrigated rice lands (9). The DA RIARCS were the most ac-tive ICAS R&E workers.
Socioeconomic benefits from ICASAdriano (1989) and Paris (1992) reported that crop-animalmixed farming provided the following socioeconomic ben-efits: a source of additional food supply, cash income, draftpower, security, and prestige.
Another socioeconomic benefit not mentioned here,but true at least for Nueva Ecija and Bulacan, is the contri-bution of carabao to annual festivities, recreation (carabaoraces), and animal beauty contests. Annually, CLSU has aMiss Carabao contest, each year declaring the best-lookingcarabao depicting both physical and nutritional care. Theuniversity participates in national and regional rodeo con-tests, and a national rodeo hall of famer is a perennial win-ner.
Crop-animal interactionsCrop-animal interactions involving plant residues and by-products can directly benefit animals, which, in turn benefitfarm families. The use of available weeds and tree leaves asfodder while crops use animal manure for faster growth re-duces waste and results in waste recycling and extra in-come. Thus, ICAS helps conserve the environment whileproviding food security and helping alleviate poverty. How-ever, other forms of interactions can have agronomic-socio-economic, farmer-researcher participatory, research-exten-sion, and GO-NGO links.
Paris (1992), summarizing the results of rice-based crop-livestock farming systems research in the Philippines andother Asian countries, enumerated crop-animal interactionsas follows:
1. Use of animal power in crop production, transporta-tion, and processing; and use of crop by-products(straw, bran, and residues) by livestock and poultry.
2. Use of animal manure to improve land productivityand cut input costs.
3. Minimizing production risks by combining crop andlivestock enterprises.
4. Small-farm household consumption of milk, meat, andeggs, thus substantially improving human nutritionand health.
5. Sale of livestock and poultry and their products toimprove and stabilize farm income for the purchase ofcash inputs and to offset household expenditures, suchas school fees, social obligations, and health care.
The main issue in crop-animal interactions is the lackof methodology for measuring the benefits derived fromthem. Paris (2002) mentioned that there is a paucity of in-
171
Table 7. Crop-animal/fish systems studies by region in rainfed lowland and irrigated rice lands in the Philippines, 1974-2001.
Title of project components Region/province Implementing agencies Year
Crop-livestock farming systems crop component Region I Pangasinan ARFSN, MAF, UPLB 1984
Crop-livestock research Region I Ilocos Sur DA 1987Ilocos Norte (2 sites)BenguetMt. ProvincePangasinan (2 sites)
Crop-animal systems research: Region I Pangasinan CASREN 2001the Philippine site
Integrated rice-fish and livestock-based farming Region II ISU 1981systems
Rice-fish culture trials at the Banaue Region II Ifugao CLSU 1988Agricultural Development Center
The productivity of mono-mixed grazed goats Region II ISU 1994and sheep
Influence of shelter on the performance of Region II Isabela ISU 1996grazing behavior of mono and mixed grazedgoats and sheep
Performance of carabao in the sulapi-based Region II Isabela ISU 1997ration with UMMB supplementation
Rice-rice cropping patterns using a combination Region II Isabela ISUof inorganic fertilizer and azolla + ducks
ISU New Hampshire chickens for security and Region II Isabela ISUalleviation of poverty
Varying levels of cassava meal in the Region II Isabela ISUperformance of growing pigs
Effect of mulberry leaf meal on the growth Region II Isabela ISUperformance of pigs at finishing state
Effects of kakawate leaf meal on the growth Region II Isabela ISUperformance of fattening pigs
Herbage production and persistence of selected Region II Isabela PCARRD, DA, CVIARC 2000-01lesser-known Philippine indigenous foddertrees and shrubs under Isabela conditions
On-farm verification trials of rice + ducks Region III Nueva Ecija DA –integrated farming systems
Exploratory trial on rice-fish culture Region III Nueva Ecija FAC, CLSU 1974
Improved rice-fish culture in the Philippines Region III Nueva Ecija FAC, CLSU 1978
Preliminary trial on integrated rice-fish-pig Region III Nueva Ecija FAC, CLSU 1985farming systems
Tilapia integrated rice-fish culture with azolla Region III Nueva Ecija FAC, CLSU 1986
Rainfed rice-based crop-livestock farming Region III Tarlac DA 1987systems research
continued on next page...

172
Transplanted rice + duck + transplanted rice Region IV Aurora DA 1989-92+ duck
Technology verification trial on transplanted Region IV Batangas DA-STIARC –rice + cattle fed with urea-treated rice straw
Transplanted rice + transplanted rice + duck Region IV Romblon DA –
Improving the performance of native chickens Region IV Cavite PhilRice –by feeding rice by-products, cowpea,cassava, and other farm products
Technology verification on crop-livestock Region IV Oriental Mindoro DA –integration with improved pasture
Farmer’s training on modern rice and rice-based Region IV Cavite PhilRice –production practices—use of organicfarm residue as compost and animalmanagement
Livestock integration in rice-based farming Region VII DA 1993-95systems
1. Different treatment methods to increase the feeding value of rice straw
2. Liveweight performance of junior bulls fed with different types of treated straw
Crop-livestock research in Leyte Region VIII ViSCA 1983
Crop-livestock technology verification trials Region IX DA 1990-92on rice-based cropping patterns
Integration of ducks with swine fattening in Region XI Surigao del Norte DA 1989-94rice-based cropping patterns
Adaptability and preference trial of improved Region XI Davao City DA 1992-95grasses and legume species
On-farm verification on the integration of ducks Region XI DA-SMIARC 1992-95and integrated pest management inrice-based cropping systems
On-farm verification of Bureau of Animal Industry 1994-95urea mineral molasses block supplement forgrowing/fattening cattle
Piloting of urea mineral molasses block for Region XI DA-SMIARC 1996-98growing/breeding cattle
Growth performance of goats fed with some Region XI DA-SMIARC 1996-98fodder species
Dried broiler waste-based concentrate for Region XI DA-SMIARC 1999backyard pigs
Dried broiler manure-based concentrate for Region XI DA-SMIARC 1999backyard poultry
Table 7 continued.
Title of project components Region/province Implementing agencies Year

173
Table 8. Description of crop-animal systems research in each region under Department of Agriculture (DA), 1990-94.
Region/province Land type System Component testing/intervention
CAR Banaue Upland terrace Rice + ducks, swine, chickens Use of snails for ducks
CAR BanaueRegion I Mt. Province Fruit trees + forage + cattle, goats Adaptability of different forages,
stocking rate of cattleRegion I La Union Hilly land Fruit trees + cattle, goats Collection and evaluation of
forages and pasture grassesRegion II Cagayan Hilly land Fruit trees + goats, cattle Assessment of seasonal diseases
of ruminantsRegion II Isabela Upland plain Carabao + upland cropping systems Feeding of snails to swine
Goats + pasture-based carabao Survey, diagnosis, and treatmentreproduction
Region IV Cavite Upland (Banana + upland rice + peanut Feeding schemes using+ green corn) + cattle indigenous feedstuff
Upland rice-cowpea + ipil-ipil Forage evaluation, animal health,with goats and sanitation improvement
Upland rice + green corn + Documentation of cattle and goatTapilan with goats fattening scheme
Upland rice + cowpea, cassava Gender analysis by product use+ native chickens, cattle
Region IV Laguna Upland Coconut + (corn + mung) + ducks Feeding schemes trialCoconut + (corn + mung) + swine
Region IV Quezon Upland Coconut + (corn + peanut) + cattleRegion IV Rizal Upland/hilly land Santol + kakawate + napier Improve breed and management
+ upland rice + cowpea + chickens of poultryRegion V Catanduanes Upland plain (Sweet potato + green corn + pasture) Upgrading carabao with Murrah
+ goats, carabao buffalo through artificial inseminationMilk performance of graded carabao
Region V Albay (Corn + cowpea + sweet potato Introduction of pasture legumes+ corn + cassava) + swine into native pasture
Region V Albay Upland plain (Corn + sweet potato + corn) + swine(Corn + peanut + corn) + cattle(Corn + green bean + corn) + cattle(Banana + pastures) + cattle
Region V Camarines Sur Upland (Coconut + root crops) + swineUpland (Upland rice + upland rice + corn)
+ chickensRegion V Camarines Norte Upland (Coconut + gabi + cassava) + swine Use of farm by-products
(Upland rice + peanut + green corn +sweet potato) + swine
Region V Masbate Upland (Corn + corn + mung + pasture) + cattle(Corn/sweet potato + squash) + swineMango + (upland rice + peanut)
+ goatsRegion V Sorsogon Hilly land Sloping agricultural land technology Integration of fodder trees on
+ goat smallholder farmsUpland (Cassava + mung) + ducksUpland plain (Cassava + green corn) + pastures
+ goatRegio VI Capiz Upland/hilly Crop integration with livestock and Evaluation of forage grasses and
poultry legumes
Region VI Aklan Upland/Hilly (Upland rice + green corn + peanut/ Night corraling for breedingpigeon pea + kakawate) + carabao system of carabao
Evaluation of different foragesLa Carlota Stock Farm Upland Pasture-based + carabao Hormone study on estrus
Synchronization in carabao
continued on next page...

174
Region VII Bohol, Cebu, Upland/hilly Verification trial on corn-based Cattle grazing on native/centro Negros, Siquijor + goat/cattle integration systems pasture with mineral
supplementationEvaluation of forage trees, grasses, and legumes in stripsImproved management schemes for crops and animals in hilly areas
Region VIII AES, Biliran, Upland Coconut + improved grasses Tethering study on sheep Leyte, Western Samar + goats, sheep
Weaning age performance of sheepFeed supplementation at different stages of pregnancy of sheep
Region VIII AES, Biliran, Upland Coconut + improved grasses Tethering study on sheep Leyte, Western Samar + goats, sheep
Weaning age performance of sheepFeed supplementation at different stages of pregnancy of sheep
Region IX Zamboanga City Upland (Upland rice + peanut) + goats Pasture/forage and animal shed development
(Fodder trees + pastures) + cattle Breeding of Philippine sheep with Barbado sheep
Region IX Zamboanga Upland (Coconut + coffee + forage) Dairy goat production del Sur + cattle
Crop-fish livestock system on freshwater
Region IX Zamboanga Upland Coconut + pasture + goats Stocking rate del Norte Upland (Coconut + upland rice + mung)
+ goats(Upland rice + corn) + goats Feeding study on goats
Region X Bukidnon Upland (Corn + corn + peanut) + swine, Profitability of backyard swinegoats production
CARAGA Surigao Upland (Coconut + pastures) + goat Chicken-freshwater fish trialRegion X Camiguin Upland (Coconut + grass/stylo) + cattleRegion X Misamis Oriental Upland Leguminous fodder + goats Adaptability of different forages
(Upland rice + corn + peanut/ipil, Integration of fodder trees askakawate, forages) + goats strip in sloping areas
Region XI Davao Oriental Hilly Integration of goats in Feeding practices/sources under Davao City hilly-land system different farming system scheme Davao City Upland Coconut + corn + corn +
pasture + goatsRegion XI Davao Sur Upland Coconut + (corn + corn-mung) Evaluation of upgraded goats
+ pasture + goats, cattleRegion XI South Cotabato Upland (Coconut + corn) + cattleRegion XII North Cotabato Upland (Corn + corn + peanut) + cattle Improved feeding and
managementRegion XII Sultan Kudarat Upland (Corn + corn + peanut) + cattle Upgrading of stockRegion XII Lanao del Norte Upland (Corn + corn + mung) + goats Health improvement, mineral
supplementation(Coconut + fodder trees) + cattle Screening of fodder trees as feed
Table 8 continued.
Region/province Land type System Component testing/intervention
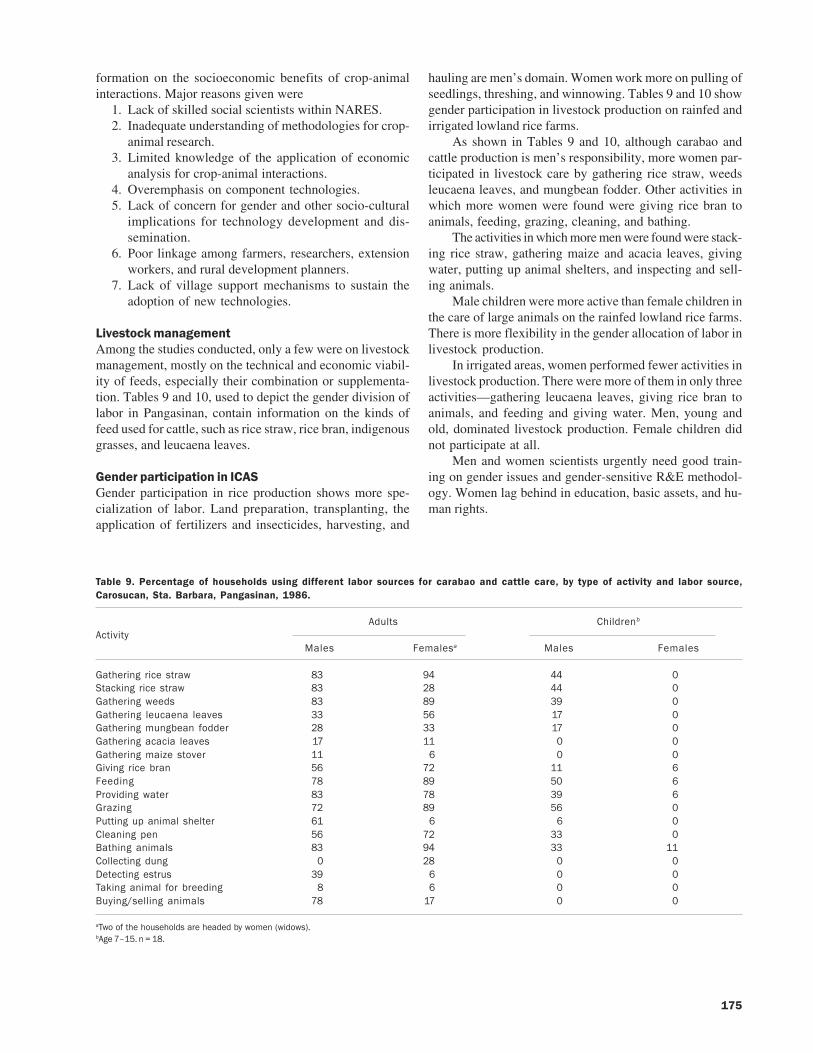
175
formation on the socioeconomic benefits of crop-animalinteractions. Major reasons given were
1. Lack of skilled social scientists within NARES.2. Inadequate understanding of methodologies for crop-
animal research.3. Limited knowledge of the application of economic
analysis for crop-animal interactions.4. Overemphasis on component technologies.5. Lack of concern for gender and other socio-cultural
implications for technology development and dis-semination.
6. Poor linkage among farmers, researchers, extensionworkers, and rural development planners.
7. Lack of village support mechanisms to sustain theadoption of new technologies.
Livestock managementAmong the studies conducted, only a few were on livestockmanagement, mostly on the technical and economic viabil-ity of feeds, especially their combination or supplementa-tion. Tables 9 and 10, used to depict the gender division oflabor in Pangasinan, contain information on the kinds offeed used for cattle, such as rice straw, rice bran, indigenousgrasses, and leucaena leaves.
Gender participation in ICASGender participation in rice production shows more spe-cialization of labor. Land preparation, transplanting, theapplication of fertilizers and insecticides, harvesting, and
hauling are men’s domain. Women work more on pulling ofseedlings, threshing, and winnowing. Tables 9 and 10 showgender participation in livestock production on rainfed andirrigated lowland rice farms.
As shown in Tables 9 and 10, although carabao andcattle production is men’s responsibility, more women par-ticipated in livestock care by gathering rice straw, weedsleucaena leaves, and mungbean fodder. Other activities inwhich more women were found were giving rice bran toanimals, feeding, grazing, cleaning, and bathing.
The activities in which more men were found were stack-ing rice straw, gathering maize and acacia leaves, givingwater, putting up animal shelters, and inspecting and sell-ing animals.
Male children were more active than female children inthe care of large animals on the rainfed lowland rice farms.There is more flexibility in the gender allocation of labor inlivestock production.
In irrigated areas, women performed fewer activities inlivestock production. There were more of them in only threeactivities—gathering leucaena leaves, giving rice bran toanimals, and feeding and giving water. Men, young andold, dominated livestock production. Female children didnot participate at all.
Men and women scientists urgently need good train-ing on gender issues and gender-sensitive R&E methodol-ogy. Women lag behind in education, basic assets, and hu-man rights.
Table 9. Percentage of households using different labor sources for carabao and cattle care, by type of activity and labor source,Carosucan, Sta. Barbara, Pangasinan, 1986.
Adults Childrenb
ActivityMales Femalesa Males Females
Gathering rice straw 83 94 44 0Stacking rice straw 83 28 44 0Gathering weeds 83 89 39 0Gathering leucaena leaves 33 56 17 0Gathering mungbean fodder 28 33 17 0Gathering acacia leaves 17 11 0 0Gathering maize stover 11 6 0 0Giving rice bran 56 72 11 6Feeding 78 89 50 6Providing water 83 78 39 6Grazing 72 89 56 0Putting up animal shelter 61 6 6 0Cleaning pen 56 72 33 0Bathing animals 83 94 33 11Collecting dung 0 28 0 0Detecting estrus 39 6 0 0Taking animal for breeding 8 6 0 0Buying/selling animals 78 17 0 0
aTwo of the households are headed by women (widows).bAge 7–15. n = 18.

176
Village women should have access to training on allkinds of skills and possibilities, to organize themselves andto participate in research. Gender sensitivity in farming sys-tems research is of recent date and its focus has been on cropproduction more than on animal production.
Available micro studies show that women’s participa-tion in animal production may vary by farm size, ecosys-tem, socioeconomic status, and type of household and be-cause of sociocultural and religious influence.
In the Philippines, season of participation and types ofhousehold (landless and family farmers with land) were com-pared. Men and women in farming families participate al-most equally in livestock production during the wet season(May to August). The contribution of women in the dryseason is lower than that of men. However, women in batchgroups are engaged more in swine production than in cattleproduction activities. The results indicate that, despite tra-ditional animals being men’s business, women participatesubstantially in their care. There is greater flexibility forlabor substitution in animal-care activities. Unlike in riceproduction, the extent of the involvement of householdmembers in decision-making and in doing actual work inraising carabao shows male dominance. The wife partici-pates significantly in decision-making regarding practicesthat require cash outlays (Adriano 1989). Swine productionand marketing are her sole responsibility.
Women also make policy decisions such as obtainingrice bran for feeding swine. Similar and other related obser-vations were made by Chua (in Adriano 1989), who men-tioned that women contributed 66% to preparing feed ra-tions, 60% to feeding, 57% to animals, and 66% to healthcare.
In chicken production, women make the nests, feed,gather the fowl, gather eggs, attend to newly hatched chicks,
clean and fill drinking-water trays, provide health care, dresschickens, and sell chickens and eggs in the market.
Tools for collecting gender-based information. Toolsused to collect gender-based information (Paris 2000) ap-plicable to ICAS studies were (1) selection of target sites/areas; (2) initial site characterization and problem diagno-sis of farming system; (3) identification of constraints toproductivity; (4) identification of technology options/plan-ning and designing experiments; (5) planning, designing,and testing of technology; (6) dissemination of technolo-gies; (7) sensitization of LGU people, researchers, policymakers, and development planners; (8) evaluation of im-pact; and (9) establishment of support mechanisms to sus-tain project activities (Paris 1992).
Gender analysis. Data for gender analysis includedcollecting information on activities of men and women farm-ers and children; access and control of resources; decision-making processes; equal participation of men and womenin all phases of R&E; benefits/incentives; and external fac-tors that may influence the productive activities of men andwomen of different religion, culture, history, economic sta-tus, and other relevant matters (Paris 1992).
Reasons given why analysis is important to ICAS tech-nology development and promotion are that no one’s inter-pretation is gender-neutral; each intervention generateschanges in gender relations, and continuous FSR analysiscreates the possibility to adjust changes so that they nolonger work against women’s position. Women, like men,want to be treated as experts and that is why separate inter-views of men and women are carried out (Paris 1992).
Socioeconomic issues concerning women’s participa-tion in livestock raising. The socioeconomic issues con-cerning women’s participation in ICAS as studied by Paris(1992) are the inadequate supply of locally available ani-
Table 10. Percentage of households using different labor sources for carabao and cattle care, by type of activity and labor source,Malanay, Sta. Barbara, Pangasinan, 1986.
Adults Childrenb
ActivityMales Femalesa Males Females
Gathering rice straw 74 63 26 0Stacking rice straw 89 37 32 0Gathering weeds 79 53 37 0Gathering leucaena leaves 11 53 11 0Gathering sugarcane tops 47 11 16 0Providing rice bran 37 47 11 0Feeding 79 74 37 0Providing water 68 74 37 0Grazing 79 68 32 0Putting up animal shelter 84 26 16 0Cleaning pen 79 74 32 0Bathing animals 79 42 37 0Detecting estrus 74 44 0 0Taking animal for breeding 58 0 0 0Buying/selling animals 47 21 0 0
aTwo of the households are headed by women (widows)bAge 7–15. n = 19.
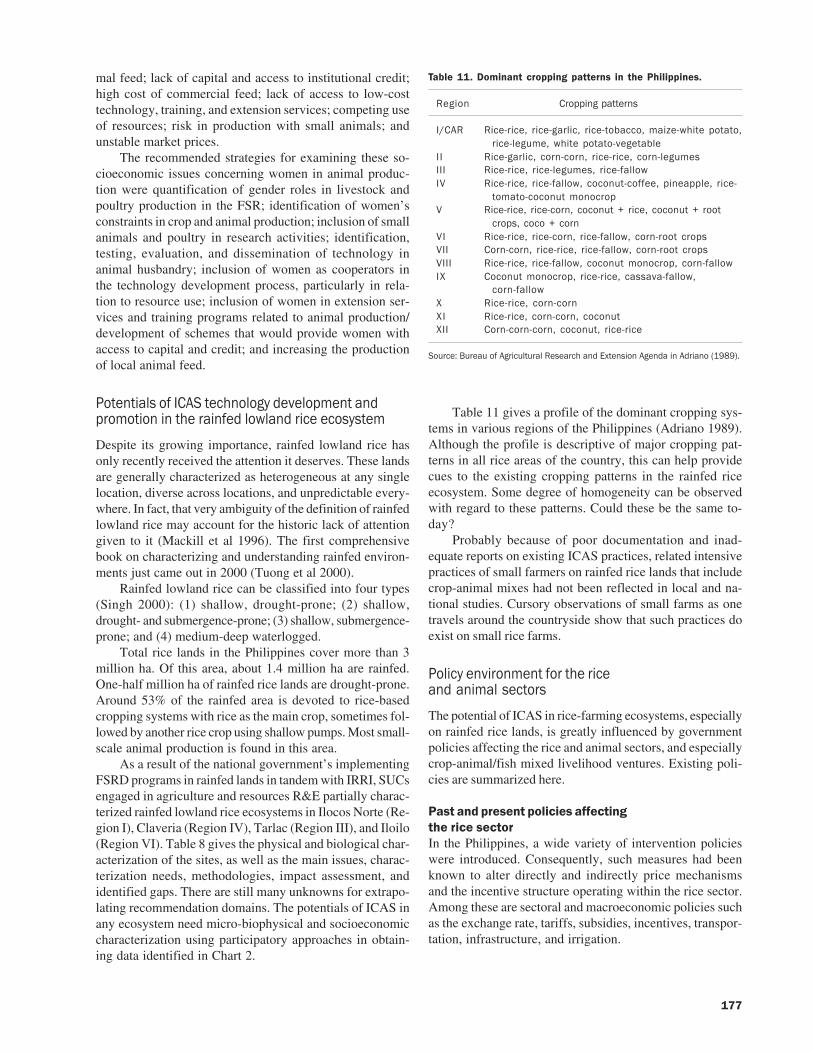
177
mal feed; lack of capital and access to institutional credit;high cost of commercial feed; lack of access to low-costtechnology, training, and extension services; competing useof resources; risk in production with small animals; andunstable market prices.
The recommended strategies for examining these so-cioeconomic issues concerning women in animal produc-tion were quantification of gender roles in livestock andpoultry production in the FSR; identification of women’sconstraints in crop and animal production; inclusion of smallanimals and poultry in research activities; identification,testing, evaluation, and dissemination of technology inanimal husbandry; inclusion of women as cooperators inthe technology development process, particularly in rela-tion to resource use; inclusion of women in extension ser-vices and training programs related to animal production/development of schemes that would provide women withaccess to capital and credit; and increasing the productionof local animal feed.
Potentials of ICAS technology development andpromotion in the rainfed lowland rice ecosystem
Despite its growing importance, rainfed lowland rice hasonly recently received the attention it deserves. These landsare generally characterized as heterogeneous at any singlelocation, diverse across locations, and unpredictable every-where. In fact, that very ambiguity of the definition of rainfedlowland rice may account for the historic lack of attentiongiven to it (Mackill et al 1996). The first comprehensivebook on characterizing and understanding rainfed environ-ments just came out in 2000 (Tuong et al 2000).
Rainfed lowland rice can be classified into four types(Singh 2000): (1) shallow, drought-prone; (2) shallow,drought- and submergence-prone; (3) shallow, submergence-prone; and (4) medium-deep waterlogged.
Total rice lands in the Philippines cover more than 3million ha. Of this area, about 1.4 million ha are rainfed.One-half million ha of rainfed rice lands are drought-prone.Around 53% of the rainfed area is devoted to rice-basedcropping systems with rice as the main crop, sometimes fol-lowed by another rice crop using shallow pumps. Most small-scale animal production is found in this area.
As a result of the national government’s implementingFSRD programs in rainfed lands in tandem with IRRI, SUCsengaged in agriculture and resources R&E partially charac-terized rainfed lowland rice ecosystems in Ilocos Norte (Re-gion I), Claveria (Region IV), Tarlac (Region III), and Iloilo(Region VI). Table 8 gives the physical and biological char-acterization of the sites, as well as the main issues, charac-terization needs, methodologies, impact assessment, andidentified gaps. There are still many unknowns for extrapo-lating recommendation domains. The potentials of ICAS inany ecosystem need micro-biophysical and socioeconomiccharacterization using participatory approaches in obtain-ing data identified in Chart 2.
Table 11 gives a profile of the dominant cropping sys-tems in various regions of the Philippines (Adriano 1989).Although the profile is descriptive of major cropping pat-terns in all rice areas of the country, this can help providecues to the existing cropping patterns in the rainfed riceecosystem. Some degree of homogeneity can be observedwith regard to these patterns. Could these be the same to-day?
Probably because of poor documentation and inad-equate reports on existing ICAS practices, related intensivepractices of small farmers on rainfed rice lands that includecrop-animal mixes had not been reflected in local and na-tional studies. Cursory observations of small farms as onetravels around the countryside show that such practices doexist on small rice farms.
Policy environment for the riceand animal sectors
The potential of ICAS in rice-farming ecosystems, especiallyon rainfed rice lands, is greatly influenced by governmentpolicies affecting the rice and animal sectors, and especiallycrop-animal/fish mixed livelihood ventures. Existing poli-cies are summarized here.
Past and present policies affectingthe rice sectorIn the Philippines, a wide variety of intervention policieswere introduced. Consequently, such measures had beenknown to alter directly and indirectly price mechanismsand the incentive structure operating within the rice sector.Among these are sectoral and macroeconomic policies suchas the exchange rate, tariffs, subsidies, incentives, transpor-tation, infrastructure, and irrigation.
Table 11. Dominant cropping patterns in the Philippines.
Region Cropping patterns
I/CAR Rice-rice, rice-garlic, rice-tobacco, maize-white potato,rice-legume, white potato-vegetable
II Rice-garlic, corn-corn, rice-rice, corn-legumesIII Rice-rice, rice-legumes, rice-fallowIV Rice-rice, rice-fallow, coconut-coffee, pineapple, rice-
tomato-coconut monocropV Rice-rice, rice-corn, coconut + rice, coconut + root
crops, coco + cornVI Rice-rice, rice-corn, rice-fallow, corn-root cropsVII Corn-corn, rice-rice, rice-fallow, corn-root cropsVIII Rice-rice, rice-fallow, coconut monocrop, corn-fallowIX Coconut monocrop, rice-rice, cassava-fallow,
corn-fallowX Rice-rice, corn-cornXI Rice-rice, corn-corn, coconutXII Corn-corn-corn, coconut, rice-rice
Source: Bureau of Agricultural Research and Extension Agenda in Adriano (1989).

178
Trade policies. Before the ratification of the GeneralAgreement on Tariffs and Trade-World Trade Organization(GATT-WTO), restrictive import quotas had historicallyprotected rice production. As the mandated agency tohandle importation, the NFA has historically determinedthe country’s rice requirement. Thus, any imported rice thatwill penetrate the local market will face intense quota re-quirements. However, with the ratification of GATT-WTOin 1994, the Philippines agreed to transform its rice quotalevels into tariff equivalent rates.
As a commodity under the Green Box measure, the coun-try was mandated to lower its tariff levels to 40% by 2004.The tariff level for rice was 50% and the NFA is the onlyinstitution mandated to import the required amount of rice.
Rice production subsidies. A major feature of rice pro-duction in the Philippines during the 1970s up to the mid-’90s was the prevalence of subsidies on material inputs andcredit. While this type of intervention had increased the useof modern rice varieties and techniques, recent farm pro-duction has been declining because of the constraints posedby deteriorating technological change.
The Masagana 99 and then the Grain EnhancementProgram (GPEP), which was launched in 1993, provided forsubsidized prices of seeds and fertilizer. Although yield levelshave increased substantially, the GPEP failed to satisfy thecountry’s domestic rice needs, thus prompting programmanagement to shift from subsidy- to credit-based inter-vention systems. As a result, the Gintong Ani for Rice pro-gram was launched. This program is a culmination of thelessons learned from the various GPEPs. Its main feature isaccessibility to high-quality seeds and fertilizer throughcredit.
At present, the new rice program of the government isthe Ginintuang Masaganang Ani (GMA). It avails of tradeand fiscal incentives for the private sector to invest in seedproduction and postharvest equipment, which is intendedto increase farmers’ profits. This program also aims to pro-mote high-quality seeds and cost-effective technologies suchas the leaf color chart, balanced fertilization strategy, inte-grated pest management, synchronous planting, mechani-zation, and others.
Being a signatory to the GATT-WTO, the Philippinesremoved all forms of distortionary subsidies. Although thePhilippines has identified rice as part of the Green Box com-modities, it has not yet availed of the Aggregate Measure ofSupport (AMS) for rice. The AMS is a form of assistance andis legitimate within the GATT-WTO accords.
Irrigation. Irrigation investments during the 1970s upto the early ’80s substantially increased, with 1975 as thehighest period, with approximately a 48% share of irriga-tion in total public expenditures.
During 1979-80, irrigation expenditures totaled ap-proximately 20% of the total public expenditure and 40%of agriculture’s expenditure. By the start of the ’90s, irriga-tion expenditure relative to agriculture fell to 10%. Conse-quently, the percentage of irrigated area declined from 13%in 1975 to about 1.42% by 1993 (David 1994).
Transportation infrastructure. The state of the trans-portation system in the country remains inadequate and in-efficient. It can be concluded that the road densities in primeagricultural areas have been typically lower relative to roadsin urban areas. The lower road expenditure levels in ruralagricultural areas reflect the historical policy bias in favorof urban centers. Because of this inherent bias against theagricultural sector, farmers have become marginalized be-cause of the inefficient price transmission from the farm tothe market. This has effectively kept farmers from becom-ing integrated in the farm-to-market rice continuum.
Marketing, prices, and rice reserves. Asymmetric pricebehavior is characteristic of the industry’s rice prices prima-rily because there is no market integration within the indus-try. A market is said to be integrated if increases in prices atthe farm gate are reflected in the retail price and decreases/increases in the retail price are reflected in the farm-gateprice. In the industry, asymmetry exists because changes inretail rice prices are not reflected in the price at the farmgate. Another factor that causes nonmarket integration isthe prevalence of bad roads, which inflate transportationcosts from the farm to the wholesale market. Another is thepresence of middlemen and inappropriate government policyintervention (such as the NFA procurement scheme), whichserves to add additional cost to marketing rough rice andmilled rice.
The Philippines has historically maintained rice bufferstocks in an effort to stabilize prices when they becomeunfavorable to the welfare of rice stakeholders. The govern-ment, through the NFA, has historically intervened in theprocurement of rice buffer stocks to preserve a politicallyaffordable price level. However, because of the inefficien-cies involved in a public-sector institution, the NFA pro-cured only less than 6% in 1988-99.
The NFA’s highest procurement level occurred in 1995,equal to 5.74%, while the lowest was observed in 1995(0.07%). With this level of procurement, it comes as no sur-prise that, for the past several years, the NFA has been un-successful in influencing farm-gate prices of rough rice.
Industrial protection system and macro policies. An-other set of policies that have gained economic importanceare those regulating macroeconomic variables such as theexchange rate, monetary and fiscal policies, and the overalltrade policy regime. Such policies have important theoreti-cal implications. However, empirical evidence as shown byGonzales (1997) and Bautista (in Adriano 1989) revealed asignificant and differential impact with regard to the incen-tive structure of most developing economies. Estimatesshowed that distortions emanating from the exchange ratehad large taxation effects.
Exchange rate and macroeconomic policies. In thePhilippines, the pursuit of an import-led strategy encour-aged the growth of high and restrictive tariff and nontariffbarriers. The imposition of these restrictive trade instrumentsappreciated the peso. Uncoordinated macroeconomic poli-cies in the past due to balance of payments problems led tothe further worsening of the peso appreciation, resulting in

179
an exchange rate misalignment. The rate of deviation of theactual exchange rate from its long-run equilibrium levels iscalled exchange rate overvaluation.
Time-series estimates reveal that, over the past 30 yearsbefore the currency devaluation of 1997, the exchange ratewas overvalued from 24% in 1961 to 20% in 1996. This,however, exacerbated the lack of protection received by theagricultural sector and likewise penalized its most impor-tant crop, rice.
However, with the occurrence of the 1997 devaluation,it is expected that the magnitude of the penalty in rice willdissipate, giving the commodity some protection leeway.
Livestock and poultry policy
1930-70In the policy climate for livestock and poultry from 1930 tothe present, the following important actions were taken.From the 1930s to 1960, the livestock dispersal programincluded the importation of cattle and the purchase of localstocks for breeding purposes. Some 4,856 head of cattlewere dispersed during the program cycle, which ended in1973.
The “Piggy Bank in the Backyard” program was alsointroduced in this period. This Bureau of Animal Industry(BAI) program provided piglets to recipients enrolled in it.
Philippine livestock promotion fund. This fund was usedfor the genetic improvement of livestock and distributionof improved breeds of animals; establishment, operation,and maintenance of stock farms, breeding stations, andslaughterhouses; manufacture of biological products; andresearch. Funds came from slaughter fees.
Tariff and customs’ law. The schedule of tariffs on live-stock products was 70% for poultry meat, 100% for eggs,15% for other meat, 60% for live poultry, and 0% for otherlive animals. Revenues generated were used to encouragelocal breeding of superior stocks and to conserve foreignexchange.
Genetic improvement. Frozen semen and embryos ofpurebred animals were imported, which represented a muchcheaper supply of exotic genetic material.
1970s-’80sLivestock rehabilitation. The government initiated the “Op-eration Animal Rehabilitation Program,” which includeddistribution of carabao for draft; breeding of piglets, goats,and boars in hog-raising areas; breeding of chicks amongpoultry raisers; and the production of feed and feedstuffs foranimals.
Bureau of Animal Industry regulations. The govern-ment regulated livestock and livestock product trade throughits licensing power along with the sole right to import liveanimals and meat products.
Bakahang Barangay. This special credit program forbackyard cattle raisers was launched in 1977.
1980s-’90sThe most dominant policies for livestock in the 1980s and’90s were the Comprehensive Agrarian Reform on Live-stock (CARL), the GATT, and the Medium-Term LivestockDevelopment Program (MTLDP).
Agrarian Reform. R.A. No. 6657 defined the structuralarrangements of the agricultural sector.
Open market. Under GATT, the Philippines agreed to(1) convert all quantitative restrictions imposed on agricul-ture into tariffs, (2) reduce tariffs on agriculture, (3) reducedomestic subsidies, (4) reduce export subsidies, and (5) har-monize sanitary and phytosanitary measures.
Agricultural tariffication. The agricultural tarifficationact converted all quantitative restrictions on agriculturalproducts into tariffs and created the Agricultural Competi-tiveness Enhancement Fund; it also repealed a sectionalprovision of the Magna Carta of small farmers (RA 7607).
Executive Order No. 288 (1995). This provided a two-time tariff structure of 3% and 10% for raw materials andfinished products. Starting 1 January 2004, a uniform rateof 5% ad valorem on the same articles was enforced. Execu-tive Order No. 313 (1996) set the in-quota and out-quotatariff rate for agricultural commodities with minimum ac-cess volumes.
Development plan. The Medium-Term Livestock De-velopment Plan, also known as the Gintong Ani Livestock,lays the foundation for a productive, efficient, economic,and sustainable livestock and poultry industry. Gains in thelivestock sector are ensured to be shared by small- and me-dium-scale livestock farmers.
National Dairy Administration (NDA). The NDA, whichwas created by RA 7884, became effective on 12 March1995. It envisions a globally competitive dairy industryanchored on an expanded base of empowered producersand processors who operate sustainable cooperative dairyenterprises.
Problems and recommendations
Problems as used here refer to difficulties, constraints, ques-tions, issues, and gaps in promoting ICAS, from which rec-ommendations were drawn. The problems were defined fromtwo perspectives: from the small farmers and from the re-searchers and extensionists. From the small farmers’ view,these problems were socioeconomic and biophysical. Fromthe researchers’ view, these were use of a common ICASR&E paradigm and participatory R&E methodology, mea-suring the economic benefits and sustainability of ICAS,agricultural research and extension and other support ser-vices, institutional and electronic networking, and the policyenvironment for attaining goals of ICAS enterprises.
Rainfed farmers’ problemsThe identified problems of small farmers in rainfed areascan be grouped into just two categories, socioeconomic andbiophysical spheres.
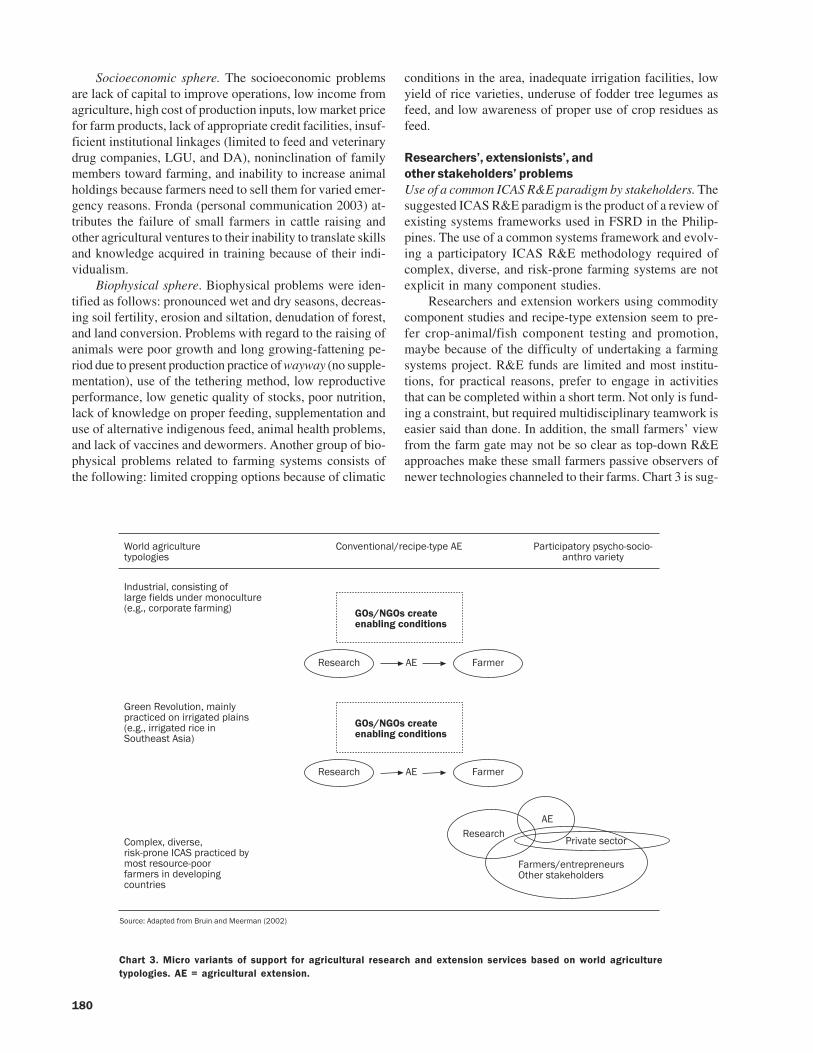
180
Socioeconomic sphere. The socioeconomic problemsare lack of capital to improve operations, low income fromagriculture, high cost of production inputs, low market pricefor farm products, lack of appropriate credit facilities, insuf-ficient institutional linkages (limited to feed and veterinarydrug companies, LGU, and DA), noninclination of familymembers toward farming, and inability to increase animalholdings because farmers need to sell them for varied emer-gency reasons. Fronda (personal communication 2003) at-tributes the failure of small farmers in cattle raising andother agricultural ventures to their inability to translate skillsand knowledge acquired in training because of their indi-vidualism.
Biophysical sphere. Biophysical problems were iden-tified as follows: pronounced wet and dry seasons, decreas-ing soil fertility, erosion and siltation, denudation of forest,and land conversion. Problems with regard to the raising ofanimals were poor growth and long growing-fattening pe-riod due to present production practice of wayway (no supple-mentation), use of the tethering method, low reproductiveperformance, low genetic quality of stocks, poor nutrition,lack of knowledge on proper feeding, supplementation anduse of alternative indigenous feed, animal health problems,and lack of vaccines and dewormers. Another group of bio-physical problems related to farming systems consists ofthe following: limited cropping options because of climatic
conditions in the area, inadequate irrigation facilities, lowyield of rice varieties, underuse of fodder tree legumes asfeed, and low awareness of proper use of crop residues asfeed.
Researchers’, extensionists’, andother stakeholders’ problemsUse of a common ICAS R&E paradigm by stakeholders. Thesuggested ICAS R&E paradigm is the product of a review ofexisting systems frameworks used in FSRD in the Philip-pines. The use of a common systems framework and evolv-ing a participatory ICAS R&E methodology required ofcomplex, diverse, and risk-prone farming systems are notexplicit in many component studies.
Researchers and extension workers using commoditycomponent studies and recipe-type extension seem to pre-fer crop-animal/fish component testing and promotion,maybe because of the difficulty of undertaking a farmingsystems project. R&E funds are limited and most institu-tions, for practical reasons, prefer to engage in activitiesthat can be completed within a short term. Not only is fund-ing a constraint, but required multidisciplinary teamwork iseasier said than done. In addition, the small farmers’ viewfrom the farm gate may not be so clear as top-down R&Eapproaches make these small farmers passive observers ofnewer technologies channeled to their farms. Chart 3 is sug-
Chart 3. Micro variants of support for agricultural research and extension services based on world agriculturetypologies. AE = agricultural extension.
��#$%��#�1�$ �#� (.�$�����
!��/�� ���$8#�1�.�& (.���� ?# �1�. �#(�.�(1��&��1��&� �#��/#�� (
�%�� #�$0�1����� �����,$#���,��$%����%�#�)���1�$ �#�4�6�60�1�#.�# ��,#)���5 ��������������
����� ������� � ���
����#1� �� ;#)�#
"#������/�$� ���0�)��$(.#1 �1�%�����##�� �%�.$���4�6�60��##�� �%�#�1������ ��� ����5
������������������� ������� � ���
����#1� �� ;#)�#
!�).$�+0�%�/�#��0#��@&.#���� !��.#1 �1�%�'()�� �#����#1�&.��#,#)�#�����%�/�$�.���1��� #���
;#)�#�8�� #�.#����#�3 ��#�� @���$%�#�
?#�/ ����1 �#
������#1�
��#1�2��%. �%�,#�)��#�����%�*��#)��4����5

181
gested as a starting point for developing participatory ICASR&E. The shift from active to facilitative R&E is delin-eated.
Suggested detailed ICAS R&E paradigm. Chart 2 cannow be used to operationalize the imperatives shown inChart 1. This is the starting point for detailing or consensusbuilding among ICAS R&E stakeholders on the elementsthat form part of the biophysical and socioeconomic spheres,and how they are to be defined, gathered, analyzed, mea-sured, and used for enterprise building.
By combining lessons from using the suggested ICASR&E paradigm and changing roles in a user-oriented tech-nology development and promotion, a participatory ICASR&E can be evolved.
Measuring the economic benefitsand sustainability of ICAS
Small farmers always want to know why ICAS technologywould be a better livelihood source. The question they usu-ally ask first is, Can it contribute significantly to existinglivelihood systems? They have to be convinced that it canmake their life better.
One of the weaknesses of the ICAS R&E methodologyat present is the inadequacy of socioeconomic measures fordetermining the benefits derived from it. The usual toolused is a cost and return analysis. Alviola et al (2002) usedseveral approaches that are recommended for determiningbenefits from the practice of ICAS.
With the membership of the Philippines in the GATT-WTO, the country with its agricultural sector is poised toembrace the inevitability of market globalization, especiallyin its array of agricultural products. This translates into thegradual opening of the agricultural sector as opposed toheavy protection and government intervention. And, as avital component of the agricultural sector, the ICAS modal-ity has no choice but to become globally competitive in itsrespective commodities/products.
However, for this system to succeed, compliance withthe new world economic order is not enough as these rulesserve only as transition points for the sector to be globallycompetitive. To be globally competitive is to possess theability to compete with other countries by being able toconvert resources in the most efficient manner, whether theyare land, labor, or raw materials from all sources.
Another dimension of crucial significance is the poten-tial of ICAS to provide security in food and other importantnonfood requirements. This revolves around the question,Can ICAS provide and sustain increasing welfare in termsof providing adequate financial resources to access betteropportunities and services? Another important point is thepotential capacity of ICAS to reduce poverty in areas wheremany marginal farmers reside. This assertion indicates that,with higher income through increased savings, farmers canaccess production technologies, which can yield an array ofinvestment choices to maximize income.
With these assertions, the use of economic tools such
as profitability and competitive methodologies becomesan imperative for understanding the socioeconomic param-eters behind ICAS and its crucial role in achieving competi-tiveness and reducing poverty.
Net profitability analysisThe profitability analysis assesses the financial viability ofdifferent commodities from the farm to the major wholesalemarkets. At the farm level, derived cost estimates were madeto reflect the various input and output (I/O) coefficients.
Given the input and output coefficients from the farmto wholesale markets, the profitability equation can be de-noted as
= TR – TC
where = net financial profit, TR = total revenue, and TC =total cost.
From the equation, a positive net profitability ( >0)denotes efficiency in production, hence an incentive to ex-pand production, while a negative net profitability ( <0)indicates loss. A net profit equal to 0 ( = 0) denotes neutral-ity and indifference in pursuing or disengaging from a pro-duction activity.
Measures of comparative advantage of an ICAScomponentThe theory of comparative advantage can help small farm-ers decide what crop or animal components they shouldraise and to what extent they should engage in the activity,improve their ICAS using a particular animal species com-ponent, and improve their household total food/feed liveli-hood systems. In the past, the domestic resource cost (DRC)framework was used in determining the comparative advan-tage of grains and vegetables such as maize, onion, andgarlic. To measure the comparative advantage of maize ac-cording to Gloria (2002), its border price is compared withthe social or economic opportunity cost of producing andmarketing maize if the Philippines produced it domesti-cally instead. If the opportunity cost is less than the borderprice of maize, the country is said to have a comparativeadvantage in producing it (Gloria 2002).
The DRC is defined as
DRC = b
kP s
k
Pbf – a
j Pb
jf
where Psk = shadow price of nontradable input k, Pb
f = border
price equivalent of 1 t of cattle in foreign currency, Pbjf =
border price equivalent of tradable input j in foreign cur-rency, b
k = quantity of the k nontradable input needed to
produce 1 t of crop, and aj = quantity of j tradable input
needed to produce 1 t of crop.The DRC can be thought of as the “own exchange rate”
of a particular production activity (in this case maize pro-duction), since the enumerator is expressed in local cur-

182
rency and the denominator in foreign currency. To be ameasure of comparative advantage, the DRC should be com-pared with the SER of the economy. If the DRC is less thanthe SER, this means that the opportunity cost of producingmaize is lower than the opportunity cost of importing thecommodity. The smaller the DRC relative to the SER, thegreater the comparative advantage of maize production.
Measuring the comparative advantage of incorporat-ing maize production into ICAS for rainfed rice lands couldhelp to improve total food/feed systems. Its comparativeadvantage should be measured in terms of its economic ben-efit and for potential of crop-animal interactions, which hasimplications for food security, poverty reduction, and agri-culture.
The domestic resource cost approachIt is always in the interest of trade economists to determinethe “relative position of competitiveness” of a country inthe production and trade of rice and rice-based commodi-ties. In this respect, the notion of relative position of com-petitiveness of a country has two dimensions. The first iscomparative advantage, which indicates whether it is eco-nomical to expand the production and trade of a commod-ity. The other is competitive advantage, which indicateswhether a country can successfully penetrate the world mar-ket for the trading of a single commodity or basket of com-modities.
Both of these measures use the DRC approach to esti-mate each respective comparative and competitive advan-tage indicator. The fundamental difference lies in the use ofprices. Whereas the comparative advantage parameter em-ploys shadow/economic prices (prices that should be re-flected in the absence of interventions), the competitiveadvantage uses market-based or financial prices (observedprice indices). Since the interest of this paper is to comparethe Philippines with the rest of the world, the competitiveadvantage indicator is used.
In this respect, the DRC is the ratio of the domestic costof production and the difference between the border priceof output and foreign cost.
In equation form, this is
Domestic cost in market price per unit of outputDRC = ------------------------------------------------------------------
Border price of output – foreign cost per unit of output in border prices
By dividing the DRC by the official exchange rate (OER),the competitive advantage measure can now be estimated.This ratio, known as the resource cost ratio (RCR), com-pares the cost of domestic production of a certain productwith the corresponding opportunity cost in the world mar-ket.
The parameter values range from less than to greaterthan unity. And it is in these range values where the com-petitive advantage or disadvantage of rice and other com-modities is determined.
The measure can be denoted as
RCR = DRC/ OER if
RCR < 1 (competitive advantage)RCR = 1 (neutral)RCR > 1 (competitive disadvantage)
From the criteria, it is clear that, if the cost of domesti-cally producing rice and other crops is greater than the op-portunity cost in the world market (RCR >1), the commod-ity has no competitive advantage. This means that the pro-ducer has to spend more than $1.00 of domestic resources toearn revenue equal to $1.00. Likewise, if RCR is less thanOER, the production activity has a competitive advantage.This implies that it takes less than $1.00 of domestic re-sources to earn revenue equivalent to $1.00.
Measuring the sustainability of ICAS as a proxy formeasuring benefits from crop-animal interactionsAnother central issue in the ICAS R&E methodology ismeasuring its sustainability benefits, which can be a proxyfor crop-animal interactions. In this regard, the measure-ment of the intensive rice-based multiple cropping systemsin Ilocos Norte in the northwestern part of Luzon, Philip-pines, can serve as a model for measuring the sustainabilitybenefits of ICAS. In the Ilocos Norte case, five crops—maize,garlic, mungbean, sweet pepper, and tomato—were inte-grated with rainfed lowland rice. Once an animal species (orseveral species) is integrated in a cropping pattern, it can betreated as one of the crops in measuring the sustainabilitybenefits of ICAS. Total factor productivity (TFP) is consid-ered for northwestern Luzon by Lucas et al (in Tuong et al2000).
TFP is considered to be a more meaningful conceptthan partial factor productivity for assessing sustainability(Harrington 1993). As all inputs and outputs are accountedfor, a declining trend in TFP is an indicator of possible deg-radation of the resource base, or unsustainability.
Although the definition requires the inclusion of allinputs and outputs, data limitations and valuation prob-lems mean that some inputs and outputs that can be easilymeasured and valued are generally included.
Externalities, such as environmental pollution, whichare difficult to value, are often excluded from TFP calcula-tions. Similarly, changes in prices of inputs and outputs canaffect TFP values over time despite the use of methods thatattempt to correct for many price effects (Rayner and Welham1995). Despite some of these practical limitations to calcu-lating TFP, the trend in TFP is considered to be a usefulindicator of sustainability and has been widely used(Capalbo and Antle, in Tuong et al 2000).
Following the method suggested by Rayner andWelham (1995), we used the Tornqvist-Thiel method tocalculate the TFP index. The Tornqvist-Thiel method isconsidered to be theoretically superior to other methodssince it is consistent with a flexible production function

183
that does not arbitrarily constrain the substitution possi-bilities between inputs.
The input index I(X)t is computed as
I(X)t = I(X)
t-1 exp[1/2" (s
it + s
i , t-1)1n x
it – 1n x
i, t-1)] (1)
where xit= quantity of input I in period t, s
it = share of input
I in total cost in period t;
witx
it
sit = —————, i ,k = 1, …n, and (2)
wktx
kt
witw
kt= actual prices of inputs in period t. Similarly, the
output index is computed as
I(Q)t = I(Q)
t-1exp[1/2 (r
jt + r
j, t-1) 1n q
jt – 1n q
j, t-1)] (3)
where qjt
= quantity of output j in period t, rjt = share of
output j in total revenue in period t,p
jtq
jt
rjt = —————, i ,j = 1, …m, and (4)
pitq
it
pjt,p
it = actual prices of outputs in period t. Finally, the TFP
index is obtained as the ratio of I(Q)t /I(X)
t.
The computation of these indices follows the follow-ing procedure. For each year, all crop outputs produced andall inputs used were included in the calculation. Analysiswas limited to the period 1992-97 as the data for 1991 and1998 were incomplete. A combination of province-leveldata was used in the analysis as farm-level data for 1992-94did not include all outputs for all farmers. On the outputside, provincial-level data on yield and farm-gate prices for1992-97 were used.
For the cost of production, data for individual crops foreach year were not available at the provincial level. Hence,farm-level data were used for this purpose. Indices of thevalue of outputs and inputs were subsequently obtainedusing equations 1 and 3.
Agricultural extension and othersupport services
Support services needed for intensifying and sustainingICAS are appropriate crop/animal/fish production, process-ing, product development and packaging, efficient marketchannels and marketing systems, farmer-proven technolo-gies, crop-animal health information and care schedules,training and communication, electronic networking, andparticipatory R&E approaches as newer ways of develop-ing and promoting technologies.
Evolution of a participatory agriculturalR&E appropriate for CDR ICASThe evolution of a participatory ICAS R&E has three inter-related steps as follows:(1) the use of suggested ICAS R&E systems framework, (2)evolution of participatory ICAS R&E as an agricultural de-velopment project using crop-animal/fish mixes, and (3)preparation of a manual.
Changing roles of ICAS R&E stakeholdersAs a result of the shift from top-down to bottom-up user-oriented project management, the creation of conditionsconducive to participatory ICAS R&E necessitates chang-ing the main role of stakeholders, from one of being direc-tive to one of being facilitative, an enabling role. Table 12represents newer roles of stakeholders. There has been abrief mention of the need for a participatory perspective inICAS R&E in many groups. Castillo (1983) asked the ques-tion, How participatory is participatory R&E?, as early as1978. According to her, this query has yet to be answeredand to be developed as a full-blown proceeding from thecurrent ICAS R&E methodology in use, which can be re-fined in actual practice.
A participatory ICAS R&E can be evolved starting withthe top-down methodology already in use. This can be doneby considering the following:
1. Incorporating bottom-up approaches—shifting rolesfrom active to facilitative (see Chart 3), using experi-ential hands-on learning instead of recipe-type ex-tension.
2. Incorporating participatory tools and techniques asfollows: participatory rural appraisal, focus interview,farmer field school, participatory technology devel-opment, farmers’ case studies, participatory processdocumentation, and others.
3. Developing technological packages to consist offarmer-proven technologies, derived from pilot-testedon-farm farmer research, to be translated into easy-to-understand information kits.
Preparation of a participatory ICAS R&E manual is partof a continuing commitment to improve the ICAS R&Emethodology. Results of participatory process documenta-tion research or retrospective process analysis can help theteam compile this.
Training and communication materialsOne of the constraints to our study is that there were onlylimited resource materials on ICAS R&E activities carriedout in a systems way in the rainfed lowland rice ecosystemin the Philippines. The reporting system may have causedthe seeming scarcity of such materials.
The recent research work of Paris (1992, 2001, 2002),Devendra (1995), and Devendra and Frio (2000) was exten-

184
sive but it relates to Asia, South Asia, and Southeast Asia. Itwas difficult to draw out the Philippine experience fromthis. Furthermore, the ICAS studies conducted were not al-ways on rice-based farming systems, nor in the rainfed low-land rice ecosystem. Retrieval of ICAS studies was difficult.
In reviewing the literature on rice-fish/animal farmingsystems, one of the facets that the authors considered usefulwas the production of information kits on farmer-provenintegrated agriculture-aquaculture technologies.
In 1992, the International Center for Living AquaticResources Management (ICLARM) spearheaded a two-week workshop in collaboration with the International In-stitute of Rural Reconstruction to produce an IntegratedAgriculture-Aquaculture Technology Information Kit forsmall farmers’ livelihood systems. Featured here were farmer-proven technologies of the Philippines, Thailand, and In-donesia.
They were written simply so that any layperson couldtranslate the information into practices. These were widelyshared among target users in the Philippines and through-out Asia. Procedures on how to prepare this type of kit canbe learned for preparing farmer-proven ICAS technologies.
Feldstein and Poats (1990) have suggested the use ofcase studies on participatory gender and development meth-odology for training the ICAS R&E team. Paris (2001) pre-sented the highly successful Sta. Barbara rice-cattle studyas one of the case studies in her book.
How to prepare and use case studies for training is foundin Feldstein and Poats’ book. Bruin and Meerman (2002)presented 16 years of participatory IPM R&E in Zanzibar ina book titled New Ways of Developing a Technology andmany lessons can be derived from their book to develop aparticipatory perspective in ICAS R&E projects. Participa-tory technology development and promotion can also belearned from the rich experiences of the National IrrigationAdministration (NIA) participatory approach program nowbeing further improved and used in the Southern Philip-pines Irrigation Sector (SOPI) water management programand the Low External Input for Sustainable Agriculture(LEISA) organic fertilizer technology transfer in the Philip-pines.
Institutional and electronic networkingOne of the major difficulties we face is weak institutionaland electronic networking. ICAS R&E data and informa-tion could not be easily retrieved.
The NARES are already in place, but linkage amongmember institutions is still weak. Each member of the estab-lished R&E system is fully aware of its functions, but elec-tronic connectivity is still deficient. Selected activities thatcould be undertaken are
1. Through the leadership of DA and PCARRD, furtherstrengthen the institutional network and electronicconnectivity.
Table 12. Changing roles of ICAS stakeholders as facilitators of rural development.
Partners Role changes Unique contributions
Farmers From passive recipients of Offering relevant physical,messages to active participants social, economic, andin their own development ecological context;process; self-learners farmer-proven ICAS;
Extensionists From provider of recipe- participatory facilitationtype messages to skillsfacilitator of learningprocesses
Researchers From detached scientists to Experimental designfacilitators and participants know-howin on-farm research
Private sector From chemical “pusher” to Participatory ICASpartner in a process moving R&E know-howtoward more ecologicalagriculture
GOs, NGOs, LGUs From organizing production, especially Process management,means to facilitating conditions resourcesconducive to participatorydevelopment; from projects definedin time and space supportinglong-term, open-endeddevelopment processes
Donors From financing limited projects to Create conditions conducive tosupporting open-ended knowledge-intensivedevelopment processes process; guide these processes;
provide technical back-up andresources
Source: Adapted from Bruin and Meerman (2002).

185
2. For those who have not done so, each member institu-tion of the network could put up its own Web site andlink with each other on the Web site.
3. NARES and members of the network could improveand update their database and include ICAS R&E forthose willing to participate in it.
4. Only a few SUCs out of a total of 176 (Table 13) offeragriculture and fishery curricular programs with in-structional, research, extension, and agribusiness en-trepreneurship thrusts and are active in ICAS R&E,even just with on-farm or on-station crop-animal/fishmixed component testing. One of their projects shouldbe a student/faculty study of farmer-led ICAS experi-ments, including evolution of the participatory R&Emethodology. Selected SUCs that will be involved inICAS R&E for each region, especially in the povertypockets of rainfed areas in Luzon, Visayas, andMindanao, should be strengthened. Undergraduateand graduate faculty and students conducting research,extension, and agribusiness entrepreneurship as partof their academic requirements are human resourcesthat can make a difference in their respective areas ofresponsibility. Most of their scholarly work can berechanneled to more vital household and rural com-munity food security enhancement in the regionswhere they are located.
5. Different institutions and organizations in the NARESand among SUCs contacted had fax and e-mail ser-vices. The DA RIARS and the regional offices of theCommission on Higher Education (CHED) are easierto contact. Interconnectivity needs to be improved.
Policy for sustainable ICAS enterprisesin rainfed lowland communities
Although policies for fuller development of the rice andanimal sectors are now in place, a fresher policy environ-ment needs to be established for the operation of competi-tive household enterprises within a total food/feed systemperspective where livestock play a distinct role. Accordingto an Asian Development Bank study, liberalization didnot curb poverty. Data on the country’s regions over theperiod 1988-2000, during which significant liberalizationtook place, indicated benefits to regional development.However, no direct impact on poverty reduction was ob-served.
Some data show this. It is therefore recommended thatpolicies be more explicit in targeting poor household foodsecurity, equity, and poverty reduction, and ICAS enter-prises as proposed seem to be a promising intervention.Another reason given for the resiliency of poverty in thecountry is the poor performance of foreign-funded projects.
The Philippine economy posted a 4.6% GDP and a 5.2%GNP in 2003. This surprising but pleasant economic perfor-mance exceeded the projected NEDA predictions for both.The important issue is, Does this redound to farm house-
hold growth and development? Policies to improve the live-lihood systems of farm households and communities aretherefore needed. Can ICAS achieve this?
References
Adriano MS. 1989. Role of women in livestock production in thePhilippines. Report prepared for FAO Regional Office forAsia and Pacific (RAPA), September 1987.
Alviola IV PA, Cataquiz GC, Francisco SR. 2002. The socioeco-nomic dimensions of rice-based farming systems. Maligaya,Science City of Muñoz (Philippines): PhilRice.
Balisacan AM, Fujisaki S, editors. 1999. Causes of poverty myths,facts, and policies: a Philippine study. Diliman, Quezon City(Philippines): University of the Philippines Press.
Bruin CA, Meerman F. 2002. New ways of developing agricul-tural technologies: Zanzibar experience in participatory in-tegrated pest management.
Castillo GT. 1983. How participatory is participatory?: a reviewof the Philippine experience. Manila (Philippines): Philip-pine Institute for Development Studies.
Devendra C. 1995. Environmental characterization of crop-ani-mal systems in rainfed areas: crop-animal interactions. In:Proceedings of an International Workshop, Khon Kaen,Thailand, 27 September-1 October 1993.
Devendra C, Frio AS, editors. 2000. Improving the contribution oflivestock to crop-animal systems. In: Rainfed areas in South-east Asia. Proceedings of the Second Workshop of the Crop-Animal Systems Research Network. Nairobi (Kenya): In-ternational Livestock Research Institute.
Feldstein H, Poats S. 1990. Women in rice farming systems:review report. Manila (Philippines): International Rice Re-search Institute. 40 p.
Table 13. Number of schools offering programs in agriculture andfisheries by region.
Higher education institutionsRegion Total
Agriculture Fisheries
I 4 4 4II 9 1 9III 15 2 15IV 12 9 19V 14 9 17VI 16 9 22VII 14 2 14VIII 15 6 18IX 9 1 9X 9 1 10XI 13 3 14XII 9 2 9CARAGA 5 3 5ARMM 5 1 5CARAGA 6 0 6NCR 3 0 3
Total 158 53 179
Source: Sanggalang and Papa (2000).

186
Gloria RAB. 2002. Changing comparative advantage of corn pro-duction in the Philippines: the years 1994 and 2000. An un-dergraduate paper in partial fulfillment of the requirementsfor the degree of Bachelor of Science in economics, Diliman,Philippines.
Gonzales LA. 1998. The growth leaders. Food and AgricultureIndustries. Food and Agribusiness Centennial Book.
Gonzales LA. 1997. The yellow corn livestock agribusiness: someagenda for action. Commissioned paper for AgribusinessSystems Action Plan (ASAP) of the Department of Agricul-ture. Manila (Philippines): STRIVE Foundation.
Iñigo CE. 2000. Management for Filipinos: principles and appli-cations. Revised edition. Quezon City (Philippines): DesignPlus.
Labios RV. 1997. Evaluation of intensive farming systems in thePhilippines. Paper presented at the 14th session on FarmManagement in Asia and the Far East, held on 2-5 Decem-ber 1997, Ho Chi Minh City, Vietnam.
Mackill D, Coffman WR, Garrity DD. 1996. Rainfed lowlandrice improvement. Los Baños (Philippines): International RiceResearch Institute.
Lucas MP, Pandey S, Villano RA, Culanay DR, Marcos TF.2000. Economics of intensive rainfed lowland rice-basedcropping systems in northwest Luzon, Philippines. In: TuongTP, Kam SP, Wade L, Pandey S, Bouman BAM, Hardy B,editors. Characterizing and understanding rainfed environ-ments. Proceedings of the International Workshop on Char-acterizing and Understanding Rainfed Environments, 5-9Dec 1999, Bali, Indonesia. Los Baños (Philippines): Interna-tional Rice Research Institute. p 391-403.
Paris TR. 2002. Crop-animal systems in Asia: socio-economicbenefits and impacts on rural livelihood. Agric. Syst. 71:147-168.
Paris TR. 2001. Bringing women from the margin to the main-stream of rice research and technology development: strat-egies and lessons learned. Unpublished thesis. University ofWestern Sydney, Hawkesbury, NSW, Australia.
Paris TR, Diaz CP, Morales AC, Luis JS. 1992. Integrating con-cerns for gender roles in farming systems research: a casein partially irrigated and rainfed farms in Central Luzon,Philippines. Los Baños (Philippines): Social Sciences Divi-sion, International Rice Research Institute. (Unpublishedmimeo.)
Paris TR. 1992. Socio-economic issues concerning women inanimal production. Paper presented at the Sixth Annual Sci-ence Congress, Bangkok, Thailand, 22-28 November 1992.
Pingali PL. 1995. Crop-livestock systems for tomorrow’s Asia:from integration to specialization. In: Davendra C, Sevilla C,editors. Crop-animal interactions. Proceedings. Los Baños(Philippines): International Rice Research Institute.
Rayner AI, Welham SJ. 1995. Economics and statistical consid-erations in the measurement of total factor productivity(TFP). In: Barnett V, Payne R, Steiner R, editors. Agricul-tural sustainability: economic, environmental, and statisticalconsiderations. New York (USA): John Wiley. p 23-28.
Rivera FT, Mangalindan MB. 1989. The structure of land trans-actions in Nueva Ecija. Central Luzon State University, Sci-ence City of Muñoz, Philippines.
Sanggalang RS, Papa AG. 2000. The status of agricultural edu-cation in the Philippines. National Agricultural and FisheryEducation System, Department of Education, Culture, andSports, Manila, Philippines.
Tuong TP, Kam SP, Wade L, Pandey S, Bouman BAM, HardyB, editors. 2000. Characterizing and understanding rainfedenvironments. Proceedings of the International Workshopon Characterizing and Understanding Rainfed Environments,5-9 Dec 1999, Bali, Indonesia. Los Baños (Philippines): In-ternational Rice Research Institute.
Acknowledgments
The authors wish to acknowledge the following persons forhelping make this monograph possible within a stipulatedsix-month period:
Dr. Tereso Abeella, dean, College of Fisheries, CLSUDr. Miladis M. Afidchao, Secretariat, CVARRD, Isabela State
UniversityDr. Teotimo M. Aganon, director of research, CLSUEngr. Feliciano Bolisay, NEUST, graduate student, CLSUDr. Rebecca Cagmat, consortium director, NOMCARRDProfessor Sonia S. Carbonell, CSSAC, graduate student, CLSUEngr. Elmer Castillo, Department of Agriculture, Region IV,
graduate student, CLSUMr. Rufo C. Chan, Jr., regional executive director, Region 10, DADr. Roger C. Chio, CESO III, regional executive director,
SMIARC, Region XIDr. Catalino R. dela Cruz, consultant, SOPIS, NIADr. Emilio M. Cruz, director, Small Ruminant Center, CLSUDr. Patricio Faylon, executive director, PCARRDDr. Josue A. Irabagon, dean, Institute of Graduate Studies, CLSUDr. Leonardo Gonzales, STRIVE Foundation, Los Baños, La-
gunaMr. Rolando V. Labios, Institution-Building, Bureau of Agricul-
tural Research, DADr. Maruja V. Lorica, Gender and Development Program direc-
tor, PCARRDDr. Filomeno Mamuad, director, Philippine Carabao Center,
CLSUEngr. Honorato Panahon, NEUST, graduate student, CLSUDr. Thelma R. Paris, Social Sciences Division, IRRIDr. Federico O. Perez, dean, College of Agriculture, CLSU; con-
sultant, CECAPMr. Rustico Pinili, farmer leader, Sto. Domingo, Nueva EcijaDr. Fe L. Porciuncula, associate director, CLSUDr. Eliseo L. Ponce, executive director, Bureau of Agricultural
Research, DADr. Arthur Razon, Isabela State UniversityDr. Beatriz P. del Rosario, deputy director, PCARRDDr. Leocadio Sebastian, executive director, PhilRiceDr. Ruben C. Sevilleja, vice president for academic affairs/direc-
tor, Freshwater Aquaculture Center, CLSUMr. Roger D. Silvia, research aide, CLSU-PhilRice-IRRI Mono-
graph Writing SubprojectDr. Luciano T. Talens, volunteer consultant, California, USADr. Rodolfo C. Undan, president, CLSUMs. Magdalena T. Wanawan, ATI, DA, graduate student, CLSU

187
AAPP-ROS Accelerated Agricultural Production Project-Research Outreach ProjectABC Agusan Bukidnon Capiz Settlement ProjectACIAR Australian Center for International Agricultural ResearchADB Asian Development BankAIADP Aurora Integrated Area Development ProjectAMS aggregate measures supportARFSN Asian Rice Farming Systems NetworkARMM Autonomous Region of Muslim MindanaoASSP Agricultural Support Services ProgramATI Agricultural Training InstituteBAEX Bureau of Agricultural ExtensionBAS Bureau of Agricultural ResearchBFAR Bureau of Fisheries and Aquatic ResourcesBPF Budhing Pilipinas FoundationBPI Bureau of Plant IndustryBRBDP Bicol River Basin Development ProjectBSWM Bureau of Soil and Water ManagementCAR Cordillera Autonomous RegionCASREN Crop-Animal Systems Research NetworkCECAP Central Cordillera Agricultural ProgramCHED Commission on Higher EducationCIRDP Community Integrated Research and Development ProjectCLSU Central Luzon State UniversityCPAR community participatory action researchCDR complex, diverse, risk-proneCSR cropping systems researchCTM cassava tuber mealCVRP Central Visayas Regional ProjectDA Department of AgricultureDANR Department of Agriculture and Natural ResourcesDBM dairy buffalo moduleDCR domestic cost ratioDENR Department of Environment and Natural ResourcesDOST Department of Science and TechnologyDTI Department of Trade and IndustryEF experimental farmersFAC Freshwater Aquaculture CenterFAO Food and Agriculture Organization of the United NationsFARM farmer-centered agricultural resource managementFARMI Farm and Resource Management InstituteFFS farmer field schoolFGD focus group discussionFP farmer practiceFRK farmer record keepingFSA farming systems approachFSDP-B Farming Systems Development Project-BicolFSDP-EV Farming Systems Development Project-Eastern VisayasFSRD farming systems research and developmentFSSRI Farming Systems and Soil Resources InstituteGATT General Agreement on Tariffs and TradeGDP gross domestic productGOs government organizations
List of acronyms and abbreviations

188
GPEP Grain Production Enhancement ProgramHADP Highland Agricultural Development ProjectHDI human development indexHEIs higher education institutionsICAS R&E integrated crop-animal systems research and extensionICAS integrated crop-animal systemsIDRC International Development Research CentreIEC information, education, and communicationIIRR International Institute for Rural ReconstructionILEIA Information Center for Low External Input and Sustainable AgricultureILRI International Livestock Research InstituteIPM integrated pest managementIRRI International Rice Research InstituteISF integrated small forestryJICA Japan International Cooperation AgencyKABSAKA Kabusugan sa Kaumahan (“Progress in Farming”)LEISA Low External Input and Sustainable AgricultureLGC local government codeLGU local government unitMAF Ministry of Agriculture and FoodMBCR marginal benefit-cost ratioNAFES National Agriculture and Fishery Education SystemNARES national agricultural research and extension systemNCIP National Coconut Intercropping ProgramNCR National Capital RegionNEDA National Economic and Development AuthorityNFA National Food AuthorityNGO nongovernment organizationNIA National Irrigation AdministrationNMCP National Multiple Cropping ProgramNMCPP National Multi-Cropping Production ProgramNSCB National Statistical Coordination BoardNSIRDP Northern Samar Integrated Research and Development ProjectNSO National Statistics OfficeOER official exchange ratePADAP Philippine-Australian Development Assistance ProgramPCC Philippine Carabao CenterPCSD Philippine Council for Sustainable DevelopmentPCAMRRD Philippine Council on Aquaculture and Marine Resources Research and DevelopmentPHDI Philippine human development indexPIADPI Palawan Integrated Area Development ProjectPIDS Philippine Institute for Development StudiesPLDT Philippine Long Distance Telephone CompanyR&E research and extensionRADIP Rainfed Agriculture Development (Iloilo) ProjectRADOS Rainfed Agriculture Development Outreach SitesRD&E research, development, and extensionREECS Research, Environment, Economic Center for Studies, Inc.RIARCs regional integrated agricultural research centersRRA rapid rural appraisalSALT sloping agriculture land technologySANREM sustainable agriculture and natural resources managementSASP Sustainable Agriculture Support ProjectSMAP Southern Mindanao Agricultural ProjectSMIARC Southern Mindanao Integrated Agricultural Research Center

189
SMIDE Small Island Development ProjectSOPIS Southern Philippines Irrigation SectorSUCs state universities and collegesTC total costTFP total factor productivityTMPCI Tulong Multi-Purpose Cooperative, Inc.TR total revenueUPCA University of the Philippines College of AgricultureUPLB University of the Philippines Los BañosUSAID United States Agency for International DevelopmentWIRFS women in rice farming systemsWTO World Trade Organization
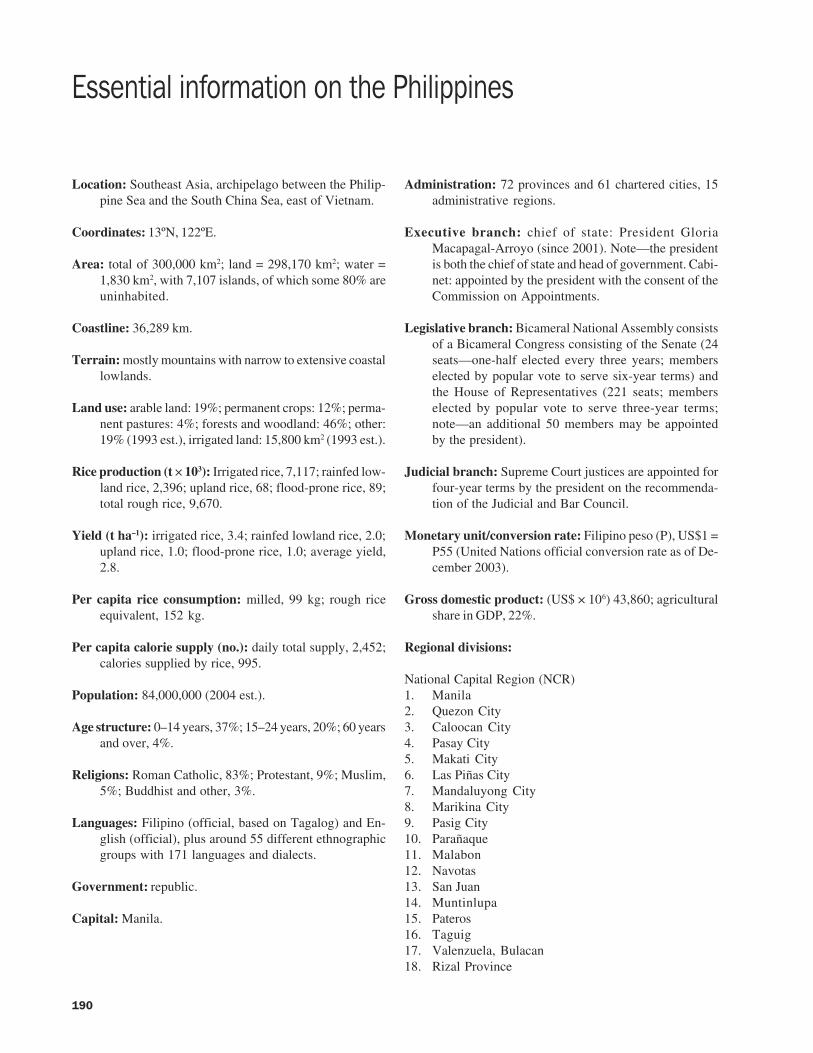
190
Location: Southeast Asia, archipelago between the Philip-pine Sea and the South China Sea, east of Vietnam.
Coordinates: 13ºN, 122ºE.
Area: total of 300,000 km2; land = 298,170 km2; water =1,830 km2, with 7,107 islands, of which some 80% areuninhabited.
Coastline: 36,289 km.
Terrain: mostly mountains with narrow to extensive coastallowlands.
Land use: arable land: 19%; permanent crops: 12%; perma-nent pastures: 4%; forests and woodland: 46%; other:19% (1993 est.), irrigated land: 15,800 km2 (1993 est.).
Rice production (t × 103): Irrigated rice, 7,117; rainfed low-land rice, 2,396; upland rice, 68; flood-prone rice, 89;total rough rice, 9,670.
Yield (t ha–1): irrigated rice, 3.4; rainfed lowland rice, 2.0;upland rice, 1.0; flood-prone rice, 1.0; average yield,2.8.
Per capita rice consumption: milled, 99 kg; rough riceequivalent, 152 kg.
Per capita calorie supply (no.): daily total supply, 2,452;calories supplied by rice, 995.
Population: 84,000,000 (2004 est.).
Age structure: 0–14 years, 37%; 15–24 years, 20%; 60 yearsand over, 4%.
Religions: Roman Catholic, 83%; Protestant, 9%; Muslim,5%; Buddhist and other, 3%.
Languages: Filipino (official, based on Tagalog) and En-glish (official), plus around 55 different ethnographicgroups with 171 languages and dialects.
Government: republic.
Capital: Manila.
Essential information on the Philippines
Administration: 72 provinces and 61 chartered cities, 15administrative regions.
Executive branch: chief of state: President GloriaMacapagal-Arroyo (since 2001). Note—the presidentis both the chief of state and head of government. Cabi-net: appointed by the president with the consent of theCommission on Appointments.
Legislative branch: Bicameral National Assembly consistsof a Bicameral Congress consisting of the Senate (24seats—one-half elected every three years; memberselected by popular vote to serve six-year terms) andthe House of Representatives (221 seats; memberselected by popular vote to serve three-year terms;note—an additional 50 members may be appointedby the president).
Judicial branch: Supreme Court justices are appointed forfour-year terms by the president on the recommenda-tion of the Judicial and Bar Council.
Monetary unit/conversion rate: Filipino peso (P), US$1 =P55 (United Nations official conversion rate as of De-cember 2003).
Gross domestic product: (US$ × 106) 43,860; agriculturalshare in GDP, 22%.
Regional divisions:
National Capital Region (NCR)1. Manila2. Quezon City3. Caloocan City4. Pasay City5. Makati City6. Las Piñas City7. Mandaluyong City8. Marikina City9. Pasig City10. Parañaque11. Malabon12. Navotas13. San Juan14. Muntinlupa15. Pateros16. Taguig17. Valenzuela, Bulacan18. Rizal Province

191
Cordillera Administrative Region (CAR)1. Abra2. Benguet (Baguio City)3. Ifugao4. Kalinga5. Apayao6. Mountain Province
Region I1. Ilocos Norte (Laoag City)2. Ilocos Sur3. La Union4. Pangasinan (Dagupan City and San Carlos City)
Region II1. Batanes2. Cagayan3. Isabela4. Nueva Vizcaya5. Quirino
Region III1. Bataan2. Bulacan3. Nueva Ecija4. Pampanga (Angeles City)5. Tarlac6. Zambales (Olongapo City)
Region IV1. Aurora2. Batangas (Batangas City and Lipa City)3. Cavite (Tagaytay City, Cavite City, and Trece Martires
City)4. Laguna (San Pablo City)5. Marinduque6. Occidental Mindoro7. Oriental Mindoro8. Palawan (Puerto Princesa City)9. Quezon (Lucena City)10. Rizal11. Romblon
Region V1. Albay (Legaspi City)2. Camarines Norte3. Camarines Sur (Naga City and Iriga City)4. Catanduanes5. Masbate6. Sorsogon
Region VI1. Aklan2. Antique3. Capiz (Roxas City)4. Guimaras5. Iloilo (Iloilo City)
6. Negros Occidental (Bacolod City, San Carlos City,Cadiz City, Bago City, La Carlota City, Silay City)
Region VII1. Bohol (Tagbilaran City)2. Cebu (Cebu City, Danao City, Lapu-Lapu City,
Mandaue City, and Toledo City)3. Negros Oriental (Bais City, Canlaon City, and
Dumaguete City)4. Siquijor
Region VIII1. Biliran2. Leyte (Tacloban City and Ormoc City)3. Southern Leyte4. Eastern Samar5. Northern Samar6. Samar (Calbayog City)
Region IX1. Basilan2. Zamboanga del Norte3. Zamboanga del Sur
Region X1. Bukidnon (Malaybalay City)2. Camiguin3. Misamis Oriental (Cagayan de Oro City and Gingoog
City)4. Misamis Occidental
Region XI1. Davao2. Davao del Sur3. Davao Oriental4. South Cotabato5. Sarangani
Region XII1. Lanao del Norte2. Cotabato3. Sultan Kudarat4. Cotabato City5. Marawi City
Autonomous Region in Muslim Mindanao (ARMM)1. Lanao del Sur2. Maguindanao3. Sulu4. Tawi-tawi
Caraga1. Agusan del Norte (Butuan City)2. Agusan del Sur3. Surigao del Norte (Surigao City)4. Surigao del Sur