Low-temperature study of field-induced antiferromagnetic-ferromagnetic transition in Pd-doped Fe-Rh
8
arXiv:0911.4552v1 [cond-mat.str-el] 24 Nov 2009 Low temperature study of field induced antiferro-ferromagnetic transition in Pd doped FeRh Pallavi Kushwaha, Archana Lakhani, R Rawat and P Chaddah UGC-DAE Consortium for Scientific Research University Campus, Khandwa Road Indore-452001, India. (Dated: November 24, 2009) The first order antiferromagnetic (AFM) to ferromagnetic (FM) transition in the functional mate- rial Fe49(Rh0.93 Pd0.07)51 has been studied at low temperatures and high magnetic fields. We have addressed the non-monotonic variation of lower critical field required for FM to AFM transition. It is shown that critically slow dynamics of the transition dominates below 50 K. At low temperature and high magnetic field, state of the system depends on the measurement history resulting in tun- able coexistence of AFM and FM phases. By following cooling and heating in unequal magnetic field (CHUF) protocol it is shown that equilibrium state at 6 Tesla magnetic field is AFM state. Glass like FM state at 6 T (obtained after cooling in 8 T) shows reentrant transition with increasing temperature; viz. devitrification to AFM state followed by melting to FM state. PACS numbers: 75.30.Kz, 72.15.Gd, 75.60.Nt I. INTRODUCTION FeRh and its nearby compositions have been subject of extensive theoretical and experimental studies due to their various interesting magnetic properties [1, 2, 3, 4, 5, 6, 7, 8, 9, 10, 11]. As prepared FeRh order in fcc lattice, where Fe and Rh atoms are randomly distributed [12]. With annealing, it order in CsCl type bcc structure, where Fe and Rh atoms occupy the corner and center positions of the cube, respectively. Magnetically, in the CsCl type bcc structure, FeRh shows a para to ferromag- netic (FM) transition around ≈ 650 - 670 K (T C ) [5, 6]. Magnetic moment of Fe and Rh atom in the FM state are reported to be ≈ 3.2μ B and ≈ 0.9μ B respectively [7]. With decreasing temperature, it shows a first order ferro (FM) to antiferromagnetic (AFM) transition. This transition is sensitive to FeRh composition and prepara- tion condition, therefore there is a large variation in FM to AFM transition temperature (T N ≈ 320 - 370 K) re- ported by various groups [1, 8, 9, 10]. In the AFM state, there is no magnetic moment on Rh and the magnetic structure is type II AFM, where ferromagnetic Fe lay- ers (111) are coupled antiferromagnetically to each other [7, 11]. This FM to AFM transition can also be influ- enced by the substitution of transition metal at Fe as well as Rh site [1, 6, 13]. Depending upon doping ele- ment ( e.g. Ir, Pt, Pd, Ni etc.) and concentration, T N can be shifted (upward/downward) over a wide temperature range [6]. The origin of FM to AFM transition in this sys- tem is still debated. Since this transition is accompanied with an abrupt change in lattice parameter and unit cell volume, Kittel exchange inversion model has been used to explain the transition [14]. However, this model fails to describe various features associated with this transi- tion like non-monotonic variation of T N with x in case of Fe 49 (Rh 1-x Pd x ) 51 [1], anomalous entropy change, van- ishing of Rh moment etc [1, 15]. Heat capacity measure- ments show four times higher electronic contribution to heat capacity in FM state when compared to AFM state [1, 16, 17]. This led Annaorazov et. al.[15] and Tu et. al [16] to suggested that band structure modification as the origin of FM to AFM transition. On the other hand Chen et al. [18] reported small difference in the optical conductivity of FM and AFM phases through their el- lipsometric studies. According to them, the low temper- ature difference in heat capacity of AFM and FM state has magnetic origin rather than electronic origin. Den- sity functional calculations of Gu et. al. [2] attributed the AFM-FM transition to the magnon (spin-wave) ex- citations. Besides the origin of the transition, interest in this system also arises due to their potential for techno- logical applications. This is because FM to AFM transi- tion is accompanied with large change in magnetization, resistivity, volume etc. and transition can be influenced by magnetic field as well as pressure [1, 10, 15, 19, 20]. As a consequence giant magnetocaloric effect [15, 21], elastocaloric effect [15], giant magnetoresistance [10, 13], magnetostriction [22, 23, 24] etc. have been observed in this system. Multilayers of FeRh/FePt films have been shown to form exchange spring system, which opens up the possibility for thermally assisted magnetic recording media [3]. Recently observation of laser induced ultra- fast switching between AFM and FM state on sub pi- coseconds timescale in FeRh has opened another area of investigation [4, 25]. In spite of extensive investigations in this system, there are limited studies on the AFM-FM phase coexistence. Most of these studies are focused around room tem- perature or above, which is closed to T N in the stud- ied system. A detail magnetization (M) investigation of Fe 49 Rh 51 thin films by Maat et. al. [26] showed hetero- geneous AFM to FM transition during warming irrespec- tive of substrate. However FM to AFM transition upon cooling on c-axis sapphire substrate film suggested ho- mogeneous nucleation and growth of AFM domain. This study also showed thermomagnetic irreversibility in M-H
Transcript of Low-temperature study of field-induced antiferromagnetic-ferromagnetic transition in Pd-doped Fe-Rh

arX
iv:0
911.
4552
v1 [
cond
-mat
.str
-el]
24
Nov
200
9
Low temperature study of field induced antiferro-ferromagnetic transition in Pd
doped FeRh
Pallavi Kushwaha, Archana Lakhani, R Rawat and P ChaddahUGC-DAE Consortium for Scientific Research
University Campus, Khandwa Road
Indore-452001, India.
(Dated: November 24, 2009)
The first order antiferromagnetic (AFM) to ferromagnetic (FM) transition in the functional mate-rial Fe49(Rh0.93Pd0.07)51 has been studied at low temperatures and high magnetic fields. We haveaddressed the non-monotonic variation of lower critical field required for FM to AFM transition. Itis shown that critically slow dynamics of the transition dominates below 50 K. At low temperatureand high magnetic field, state of the system depends on the measurement history resulting in tun-able coexistence of AFM and FM phases. By following cooling and heating in unequal magneticfield (CHUF) protocol it is shown that equilibrium state at 6 Tesla magnetic field is AFM state.Glass like FM state at 6 T (obtained after cooling in 8 T) shows reentrant transition with increasingtemperature; viz. devitrification to AFM state followed by melting to FM state.
PACS numbers: 75.30.Kz, 72.15.Gd, 75.60.Nt
I. INTRODUCTION
FeRh and its nearby compositions have been subjectof extensive theoretical and experimental studies due totheir various interesting magnetic properties [1, 2, 3, 4,5, 6, 7, 8, 9, 10, 11]. As prepared FeRh order in fcclattice, where Fe and Rh atoms are randomly distributed[12]. With annealing, it order in CsCl type bcc structure,where Fe and Rh atoms occupy the corner and centerpositions of the cube, respectively. Magnetically, in theCsCl type bcc structure, FeRh shows a para to ferromag-netic (FM) transition around ≈ 650 − 670 K (TC) [5, 6].Magnetic moment of Fe and Rh atom in the FM stateare reported to be ≈ 3.2µB and ≈ 0.9µB respectively[7]. With decreasing temperature, it shows a first orderferro (FM) to antiferromagnetic (AFM) transition. Thistransition is sensitive to FeRh composition and prepara-tion condition, therefore there is a large variation in FMto AFM transition temperature (TN ≈ 320 − 370 K) re-ported by various groups [1, 8, 9, 10]. In the AFM state,there is no magnetic moment on Rh and the magneticstructure is type II AFM, where ferromagnetic Fe lay-ers (111) are coupled antiferromagnetically to each other[7, 11]. This FM to AFM transition can also be influ-enced by the substitution of transition metal at Fe aswell as Rh site [1, 6, 13]. Depending upon doping ele-ment ( e.g. Ir, Pt, Pd, Ni etc.) and concentration, TN canbe shifted (upward/downward) over a wide temperaturerange [6]. The origin of FM to AFM transition in this sys-tem is still debated. Since this transition is accompaniedwith an abrupt change in lattice parameter and unit cellvolume, Kittel exchange inversion model has been usedto explain the transition [14]. However, this model failsto describe various features associated with this transi-tion like non-monotonic variation of TN with x in case ofFe49(Rh1−xPdx)51 [1], anomalous entropy change, van-ishing of Rh moment etc [1, 15]. Heat capacity measure-ments show four times higher electronic contribution to
heat capacity in FM state when compared to AFM state[1, 16, 17]. This led Annaorazov et. al.[15] and Tu et.al [16] to suggested that band structure modification asthe origin of FM to AFM transition. On the other handChen et al. [18] reported small difference in the opticalconductivity of FM and AFM phases through their el-lipsometric studies. According to them, the low temper-ature difference in heat capacity of AFM and FM statehas magnetic origin rather than electronic origin. Den-sity functional calculations of Gu et. al. [2] attributedthe AFM-FM transition to the magnon (spin-wave) ex-citations. Besides the origin of the transition, interest inthis system also arises due to their potential for techno-logical applications. This is because FM to AFM transi-tion is accompanied with large change in magnetization,resistivity, volume etc. and transition can be influencedby magnetic field as well as pressure [1, 10, 15, 19, 20].As a consequence giant magnetocaloric effect [15, 21],elastocaloric effect [15], giant magnetoresistance [10, 13],magnetostriction [22, 23, 24] etc. have been observed inthis system. Multilayers of FeRh/FePt films have beenshown to form exchange spring system, which opens upthe possibility for thermally assisted magnetic recordingmedia [3]. Recently observation of laser induced ultra-fast switching between AFM and FM state on sub pi-coseconds timescale in FeRh has opened another area ofinvestigation [4, 25].
In spite of extensive investigations in this system, thereare limited studies on the AFM-FM phase coexistence.Most of these studies are focused around room tem-perature or above, which is closed to TN in the stud-ied system. A detail magnetization (M) investigation ofFe49Rh51 thin films by Maat et. al. [26] showed hetero-geneous AFM to FM transition during warming irrespec-tive of substrate. However FM to AFM transition uponcooling on c-axis sapphire substrate film suggested ho-mogeneous nucleation and growth of AFM domain. Thisstudy also showed thermomagnetic irreversibility in M-H
2
and M-T measurement arising due to supercooling andsuperheating associated with first order transition. MFMstudy of Yokoyama et. al. [27] showed inhomogeneousnucleation of FM domains at a micrometer length scalein FeRh0.24Pd0.76 and attributed to the internal stresscaused by anisotropic lattice expansion at the transition.Manekar et al. [28] have studied the evolution of FMstate in superheated AFM state by MFM in Fe52Rh48.They showed the coexisting AFM and FM phase in thesub-micrometer length scale and nucleation and growthof FM phase coupled with topography on a time scaleof 104 sec. On the other hand studies at low temper-atures are rare in this system. Studies on fcc struc-tured nanoparticles of FeRh showed spin glass behaviorin magnetization measurement [8, 29]. Baranov et al.[1] have carried out detailed studies of AFM-FM transi-tion with various transition metal doping down to 2 K. In(Fe0.965Ni0.035)49Rh51 and Fe49(Rh0.92Pd0.08)51, wherethe TN is shifted to low temperature, they showed thatcritical field and hysteresis width follow T 2 and T 1/2 de-pendence, respectively. Below 5 K (for Ni) and 3.5 K (forPd), they have noticed scattered but substantially lowerhysteresis width (∆Hc) and upper critical field (field re-quired for AFM to FM transition) than the extrapolatedcurve obtained from high temperature data. These fea-tures have been attributed to macroscopic quantum tun-neling of magnetization through the energy barrier. Be-sides this, figure 2, 5 and 8 of Baranov et. al. [1] also re-veal non-monotonic variation of lower critical field show-ing a maxima at much higher temperature (≈ 60 K). Sim-ilar kind of non-monotonic variation of lower critical fieldhas been shown and addressed in Nd0.5Sr0.5MnO3 [30],Mn1.85Co0.15Sb [31]. There, such anomalous behaviorhas been explained in terms of critically slow dynamicsof the transition on measurement time scale, which givesrise to glass like arrested state (GLAS) at low temper-ature. In case of La5/8−0.4Pr0.4Ca3/8MnO3 (LPCMO)it has been shown that combination of glass transitiontemperature TG(H) and supercooling line T ∗(H) givesrise to non-monotonic hysteretic boundary [32]. GLASarises out of kinetic arrest of a first order magnetic tran-sition and is different from spin or cluster glass [33, 34].In analogy to structural glasses, GLAS shows devitrifi-cation on warming giving rise to large change in volumefraction of magnetic states [33]. GLAS and phase coex-istence are of current interest particularly in manganites[33]. Therefore the study of first order magnetic tran-sition in FeRh system provides an opportunity to checkthe universal feature of GLAS beyond manganites.
We have chosen Fe49(Rh0.93Pd0.07)51 for the presentstudy. This is because in Fe49(Rh1−xPdx)51 system, TN
is reported to decrease from ≈ 350 K ( x= 0) to ≈ 180 K(x=0.08) and then increase again with increasing x be-fore disappearing for x ≥ 0.13 [1]. Therefore TN is mini-mum around x ≈ 0.08. We carried out detailed magneto-transport studies on Fe49(Rh0.93Pd0.07)51 which showsthat dynamics of the transition becomes critically slowat low temperature and high magnetic field resulting in
a non-monotonic variation of lower critical field. It re-sults in coexistence of glass like arrested FM state andAFM state at low temperature. A CHUF (cooling andheating in unequal field) protocol [35] has been used tofind out the equilibrium state of the system. This is thefirst study where critically slow dynamics of the tran-sition is observed for AFM-FM transition accompaniedwith creation or vanishing of magnetic moment (on Rh).
II. EXPERIMENTAL DETAILS
The compound Fe49(Rh1−xPdx)51 with x = 0.07 wasprepared by arc melting the constituent elements of pu-rity better than 99.9% under high purity argon atmo-sphere. Small pieces, cut from the same ingot, werewrapped in Tantulam foil and sealed in a quartz tubein ≈ 10−6torr of vacuum and annealed at 9000C for 20hours. For crystal structure analysis and phase detec-tion, X-ray diffraction has been performed on polishedsurface of the ingot. The resistivity measurements werecarried out by standard four-probe technique using ahome made resistivity setup with 8 Tesla superconduct-ing magnet system from Oxford Instruments Inc., UK.All the in-field measurements were performed in longi-tudinal geometry except isothermal magnetoresistance(MR) measurements, which were performed in trans-verse geometry up to 14 Tesla using Physical PropertyMeasurement System (PPMS) from M/s. Quantum De-sign, USA. The magnetoresistance (MR) is defined asMR = ρ(H) − ρ(0) /ρ(0), where ρ(0) is the resistivityin zero field and ρ(H) is the resistivity in the presenceof magnetic field H. Magnetization measurements wereperformed using Vibrating Sample Magnetometer (VSM)option of PPMS.
III. RESULTS AND DISCUSSION
Figure 1 shows the X-ray diffraction pattern of as castand annealed Fe49(Rh0.93Pd0.07)51. As cast sample isindexed by considering the presence of both fcc (it isfct with lattice parameter a and c almost equal) andbcc structure and corresponding peaks in the figure aremarked by stars (*) and vertical lines (|) respectively.After annealing at 9000C for 20 hours, almost all of thefcc phase is converted into an ordered bcc structure. Thisobservation is consistent with the earlier studies [6, 23].
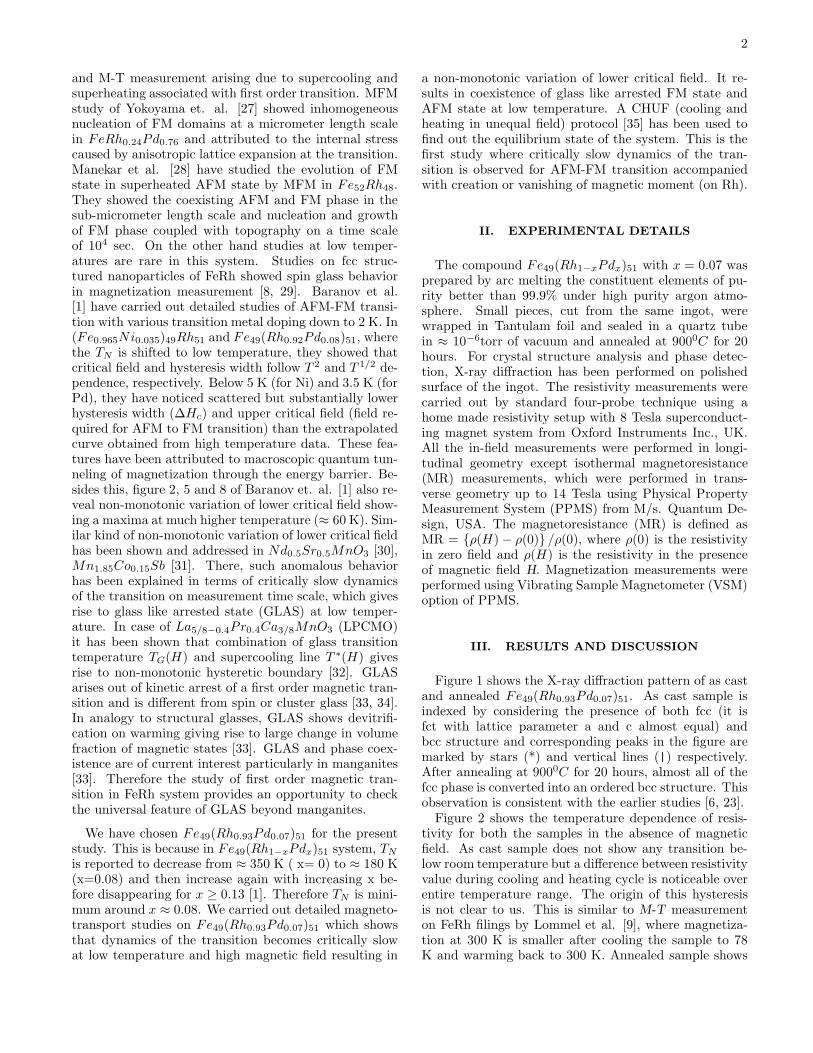
Figure 2 shows the temperature dependence of resis-tivity for both the samples in the absence of magneticfield. As cast sample does not show any transition be-low room temperature but a difference between resistivityvalue during cooling and heating cycle is noticeable overentire temperature range. The origin of this hysteresisis not clear to us. This is similar to M-T measurementon FeRh filings by Lommel et al. [9], where magnetiza-tion at 300 K is smaller after cooling the sample to 78K and warming back to 300 K. Annealed sample shows
3
20 40 60 80 100
50
100
150
200
250Fe
49(Rh
0.93Pd
0.07)
51
[b]
[a]
2 2
2
1 0
3
2 2
0
2 0
0
1 1
1
bcc peak * fcc peaks
**
**
*
annealed
as cast
2 2
0
2 1
1
2 0
0
2 1
0
1 1
1
1 1
0
1 0
0
In
tens
ity (a
rb. u
nit)
Angle (2 )
FIG. 1: X-ray diffraction pattern for [a] as cast and [b] an-nealed sample. Peaks marked by stars (*) and vertical lines(|) correspond to fct and CsCl type bcc structure respectively.
100 200 30025
50
75
100
Fe49
(Rh0.93
Pd0.07
)51
[b]
[a]
Annealed
as cast
Res
istiv
ity (
cm
)
Temperature (K)
FIG. 2: Resistivity behavior as a function of temperature for[a] as cast and [b] annealed sample. A first order transitionfrom FM (low resistivity) to AFM (high resistivity) state canbe clearly seen in annealed sample.
a sharp rise in resistivity with decreasing temperaturewhich indicates transition from low resistive FM phaseto high resistive AFM phase. During heating, a reversetransformation from AFM to FM state occurs at highertemperature resulting in a hysteresis, which is a signatureof first order nature of the transition. The transition tem-perature, taken as the inflection point of the resistivitycurve, is found to be ≈ 201 K during cooling and ≈ 222K during heating. Besides this, FM to AFM transition isquite broad as transition width during cooling as well asheating is found to be around 55 K. The studies aroundTN in analogous system has shown the presence of coex-isting AFM and FM phase and broadening is attributed
to residual lattice imperfection, chemical disorder alongwith the internal stress caused from anisotropic latticeexpansion [26, 27, 28]. Due to disorder, different regionshaving length scale of the order of the correlation lengthcan have different transition temperatures TN , and thisresults in broadening of transition line as well as super-cooling (T ∗, H∗)/superheating (T ∗∗, H∗∗) spinodals intoa band for a macroscopic sample [36]. Since we are in-terested in the study of first order AFM-FM transitionat low temperature, further studies are performed on an-nealed sample only, which will be discussed in the follow-ing sections.
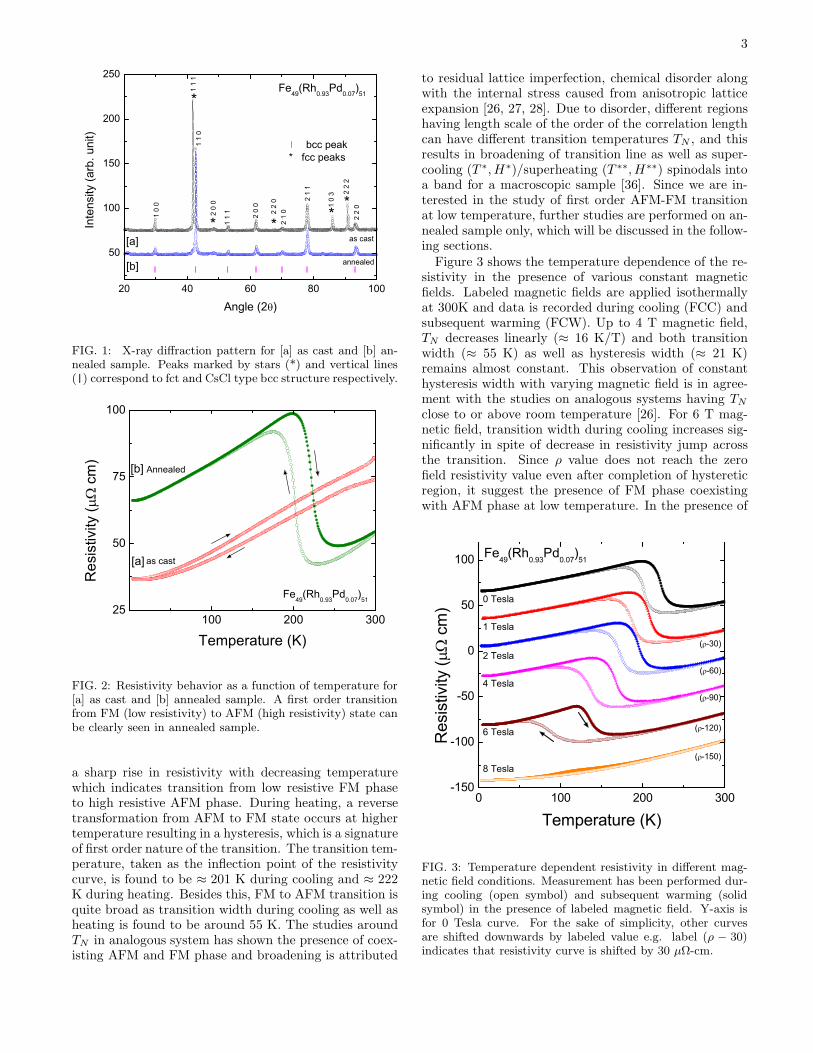
Figure 3 shows the temperature dependence of the re-sistivity in the presence of various constant magneticfields. Labeled magnetic fields are applied isothermallyat 300K and data is recorded during cooling (FCC) andsubsequent warming (FCW). Up to 4 T magnetic field,TN decreases linearly (≈ 16 K/T) and both transitionwidth (≈ 55 K) as well as hysteresis width (≈ 21 K)remains almost constant. This observation of constanthysteresis width with varying magnetic field is in agree-ment with the studies on analogous systems having TN
close to or above room temperature [26]. For 6 T mag-netic field, transition width during cooling increases sig-nificantly in spite of decrease in resistivity jump acrossthe transition. Since ρ value does not reach the zerofield resistivity value even after completion of hystereticregion, it suggest the presence of FM phase coexistingwith AFM phase at low temperature. In the presence of
0 100 200 300-150
-100
-50
0
50
100 Fe49(Rh0.93Pd0.07)51
( -150)
( -120)
( -90)
( -60)
( -30)
8 Tesla
6 Tesla
4 Tesla
2 Tesla
1 Tesla
0 Tesla
R
esis
tivity
( c
m)
Temperature (K)
FIG. 3: Temperature dependent resistivity in different mag-netic field conditions. Measurement has been performed dur-ing cooling (open symbol) and subsequent warming (solidsymbol) in the presence of labeled magnetic field. Y-axis isfor 0 Tesla curve. For the sake of simplicity, other curvesare shifted downwards by labeled value e.g. label (ρ − 30)indicates that resistivity curve is shifted by 30 µΩ-cm.
4
8 T magnetic field, there is no clear indication of FM-AFM transition, however, presence of small hysteresisindicates partial transformation of FM phase into AFMphase during cooling. These results show that with theapplication of magnetic field FM-AFM transition is sup-pressed only up to ≈ 50 K (instead of reducing toward 0K) and no FM to AFM transformation takes place belowthis temperature. It is worth noting here that even tran-sition metal substitution studies show abrupt vanishingof AFM-FM transition temperature with substitution (orfirst order transition with composition) and TN is alwaysfound to be either higher than 100 K or absent [1].
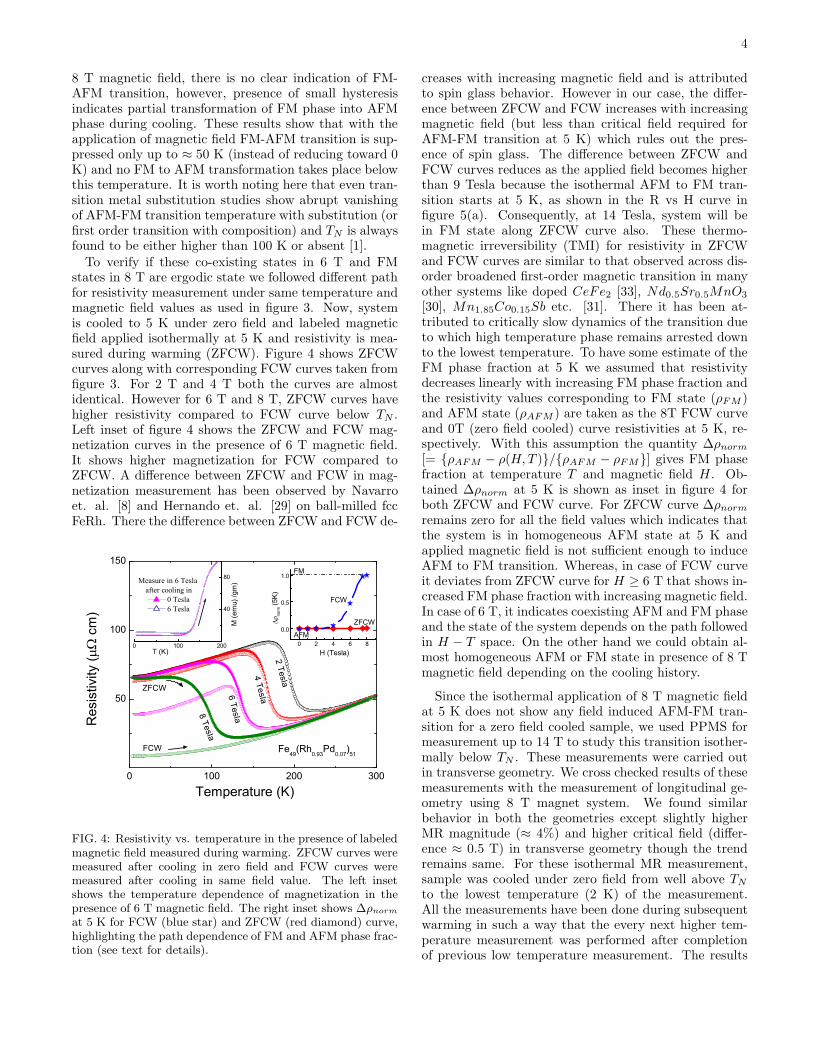
To verify if these co-existing states in 6 T and FMstates in 8 T are ergodic state we followed different pathfor resistivity measurement under same temperature andmagnetic field values as used in figure 3. Now, systemis cooled to 5 K under zero field and labeled magneticfield applied isothermally at 5 K and resistivity is mea-sured during warming (ZFCW). Figure 4 shows ZFCWcurves along with corresponding FCW curves taken fromfigure 3. For 2 T and 4 T both the curves are almostidentical. However for 6 T and 8 T, ZFCW curves havehigher resistivity compared to FCW curve below TN .Left inset of figure 4 shows the ZFCW and FCW mag-netization curves in the presence of 6 T magnetic field.It shows higher magnetization for FCW compared toZFCW. A difference between ZFCW and FCW in mag-netization measurement has been observed by Navarroet. al. [8] and Hernando et. al. [29] on ball-milled fccFeRh. There the difference between ZFCW and FCW de-
0 2 4 6 8
0.0
0.5
1.0
0 100 200
40
80
M (e
mu)
/gm
)Measure in 6 Tesla after cooling in
0 Tesla 6 Tesla
T (K)
FCW
ZFCW
no
rm (5
K)
FM
AFM
H (Tesla)
0 100 200 300
50
100
150
Fe49
(Rh0.93
Pd0.07
)51
2 Tesla
4 Tesla6 Tesla8 Tesla
ZFCW
FCW
Temperature (K)
Res
istiv
ity (
cm
)
FIG. 4: Resistivity vs. temperature in the presence of labeledmagnetic field measured during warming. ZFCW curves weremeasured after cooling in zero field and FCW curves weremeasured after cooling in same field value. The left insetshows the temperature dependence of magnetization in thepresence of 6 T magnetic field. The right inset shows ∆ρnorm
at 5 K for FCW (blue star) and ZFCW (red diamond) curve,highlighting the path dependence of FM and AFM phase frac-tion (see text for details).
creases with increasing magnetic field and is attributedto spin glass behavior. However in our case, the differ-ence between ZFCW and FCW increases with increasingmagnetic field (but less than critical field required forAFM-FM transition at 5 K) which rules out the pres-ence of spin glass. The difference between ZFCW andFCW curves reduces as the applied field becomes higherthan 9 Tesla because the isothermal AFM to FM tran-sition starts at 5 K, as shown in the R vs H curve infigure 5(a). Consequently, at 14 Tesla, system will bein FM state along ZFCW curve also. These thermo-magnetic irreversibility (TMI) for resistivity in ZFCWand FCW curves are similar to that observed across dis-order broadened first-order magnetic transition in manyother systems like doped CeFe2 [33], Nd0.5Sr0.5MnO3
[30], Mn1.85Co0.15Sb etc. [31]. There it has been at-tributed to critically slow dynamics of the transition dueto which high temperature phase remains arrested downto the lowest temperature. To have some estimate of theFM phase fraction at 5 K we assumed that resistivitydecreases linearly with increasing FM phase fraction andthe resistivity values corresponding to FM state (ρFM )and AFM state (ρAFM ) are taken as the 8T FCW curveand 0T (zero field cooled) curve resistivities at 5 K, re-spectively. With this assumption the quantity ∆ρnorm
[= ρAFM − ρ(H, T )/ρAFM − ρFM] gives FM phasefraction at temperature T and magnetic field H . Ob-tained ∆ρnorm at 5 K is shown as inset in figure 4 forboth ZFCW and FCW curve. For ZFCW curve ∆ρnorm
remains zero for all the field values which indicates thatthe system is in homogeneous AFM state at 5 K andapplied magnetic field is not sufficient enough to induceAFM to FM transition. Whereas, in case of FCW curveit deviates from ZFCW curve for H ≥ 6 T that shows in-creased FM phase fraction with increasing magnetic field.In case of 6 T, it indicates coexisting AFM and FM phaseand the state of the system depends on the path followedin H − T space. On the other hand we could obtain al-most homogeneous AFM or FM state in presence of 8 Tmagnetic field depending on the cooling history.
Since the isothermal application of 8 T magnetic fieldat 5 K does not show any field induced AFM-FM tran-sition for a zero field cooled sample, we used PPMS formeasurement up to 14 T to study this transition isother-mally below TN . These measurements were carried outin transverse geometry. We cross checked results of thesemeasurements with the measurement of longitudinal ge-ometry using 8 T magnet system. We found similarbehavior in both the geometries except slightly higherMR magnitude (≈ 4%) and higher critical field (differ-ence ≈ 0.5 T) in transverse geometry though the trendremains same. For these isothermal MR measurement,sample was cooled under zero field from well above TN
to the lowest temperature (2 K) of the measurement.All the measurements have been done during subsequentwarming in such a way that the every next higher tem-perature measurement was performed after completionof previous low temperature measurement. The results
5
-80
-60
-40
-20
0
Fe49
(Rh0.93
Pd0.07
)51
Mag
neto
resi
stan
ce (%
) 2K 5K 10K 25K 50K
0 2 4 6 8 10 12 14
-80
-60
-40
-20
0
Fe49
(Rh0.93
Pd0.07
)51
[b]
Magnetic field (Tesla)
50K 75K 100K
10 11H
5 6H
9 10 11H
6 7
[a]
H
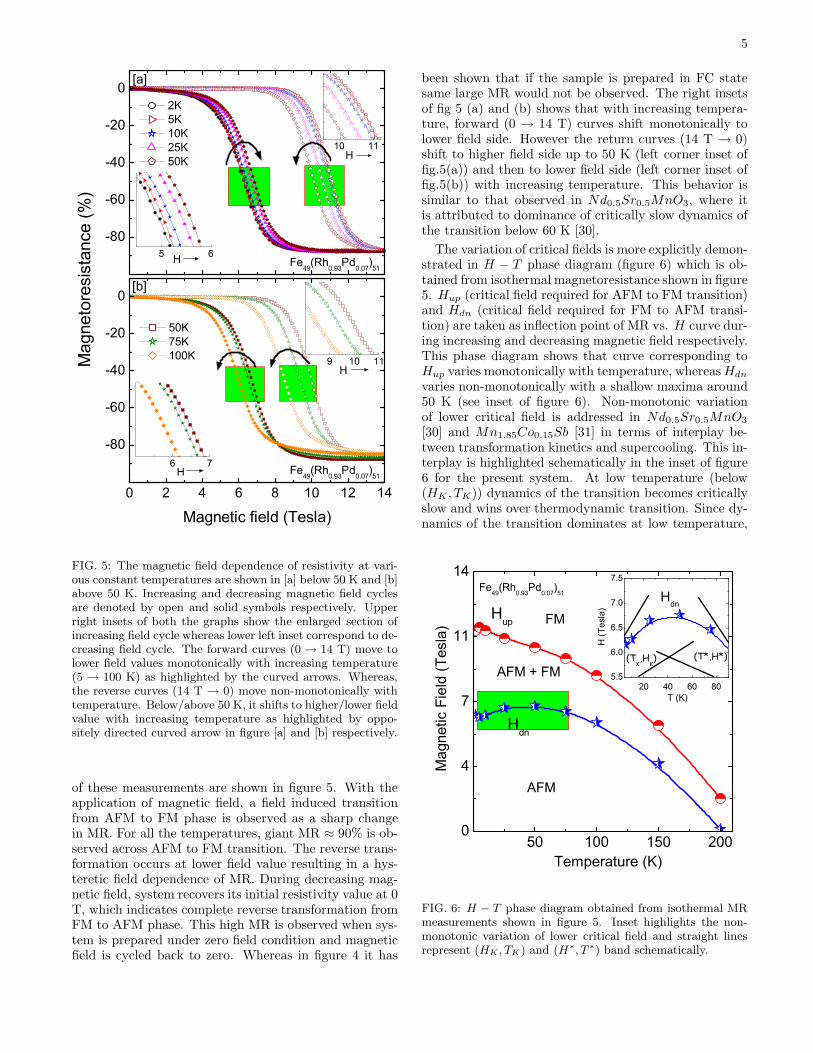
FIG. 5: The magnetic field dependence of resistivity at vari-ous constant temperatures are shown in [a] below 50 K and [b]above 50 K. Increasing and decreasing magnetic field cyclesare denoted by open and solid symbols respectively. Upperright insets of both the graphs show the enlarged section ofincreasing field cycle whereas lower left inset correspond to de-creasing field cycle. The forward curves (0 → 14 T) move tolower field values monotonically with increasing temperature(5 → 100 K) as highlighted by the curved arrows. Whereas,the reverse curves (14 T → 0) move non-monotonically withtemperature. Below/above 50 K, it shifts to higher/lower fieldvalue with increasing temperature as highlighted by oppo-sitely directed curved arrow in figure [a] and [b] respectively.
of these measurements are shown in figure 5. With theapplication of magnetic field, a field induced transitionfrom AFM to FM phase is observed as a sharp changein MR. For all the temperatures, giant MR ≈ 90% is ob-served across AFM to FM transition. The reverse trans-formation occurs at lower field value resulting in a hys-teretic field dependence of MR. During decreasing mag-netic field, system recovers its initial resistivity value at 0T, which indicates complete reverse transformation fromFM to AFM phase. This high MR is observed when sys-tem is prepared under zero field condition and magneticfield is cycled back to zero. Whereas in figure 4 it has
been shown that if the sample is prepared in FC statesame large MR would not be observed. The right insetsof fig 5 (a) and (b) shows that with increasing tempera-ture, forward (0 → 14 T) curves shift monotonically tolower field side. However the return curves (14 T → 0)shift to higher field side up to 50 K (left corner inset offig.5(a)) and then to lower field side (left corner inset offig.5(b)) with increasing temperature. This behavior issimilar to that observed in Nd0.5Sr0.5MnO3, where itis attributed to dominance of critically slow dynamics ofthe transition below 60 K [30].
The variation of critical fields is more explicitly demon-strated in H − T phase diagram (figure 6) which is ob-tained from isothermal magnetoresistance shown in figure5. Hup (critical field required for AFM to FM transition)and Hdn (critical field required for FM to AFM transi-tion) are taken as inflection point of MR vs. H curve dur-ing increasing and decreasing magnetic field respectively.This phase diagram shows that curve corresponding toHup varies monotonically with temperature, whereas Hdn
varies non-monotonically with a shallow maxima around50 K (see inset of figure 6). Non-monotonic variationof lower critical field is addressed in Nd0.5Sr0.5MnO3
[30] and Mn1.85Co0.15Sb [31] in terms of interplay be-tween transformation kinetics and supercooling. This in-terplay is highlighted schematically in the inset of figure6 for the present system. At low temperature (below(HK , TK)) dynamics of the transition becomes criticallyslow and wins over thermodynamic transition. Since dy-namics of the transition dominates at low temperature,
20 40 60 805.5
6.0
6.5
7.0
7.5
(TK,H
K) (T*,H*)
Hdn
T (K)
H (T
esla
)
50 100 150 2000
4
7
11
14Fe
49(Rh
0.93Pd
0.07)51
FM
AFM + FM
Mag
netic
Fie
ld (T
esla
)
Temperature (K)
AFM
Hdn
Hup
FIG. 6: H − T phase diagram obtained from isothermal MRmeasurements shown in figure 5. Inset highlights the non-monotonic variation of lower critical field and straight linesrepresent (HK , TK) and (H∗, T ∗) band schematically.
6
0 30 60 90 1209
12
15
M (e
mu
/gm
)Measured in 6 Tesla after 8 Tesla cooling
T(K)
0 50 100 150 200 250 300
20
40
60
80
100
120
Fe49(Rh0.93Pd0.07)51
R
esis
tivity
( c
m)
6 Tesla warming(8T cooled)
8 Tesla cooling
6 Tesla warming(FCW)
6 Tesla(FCC)
0 Tesla cooling
6 Tesla warming (ZFCW)
Temperature (K)
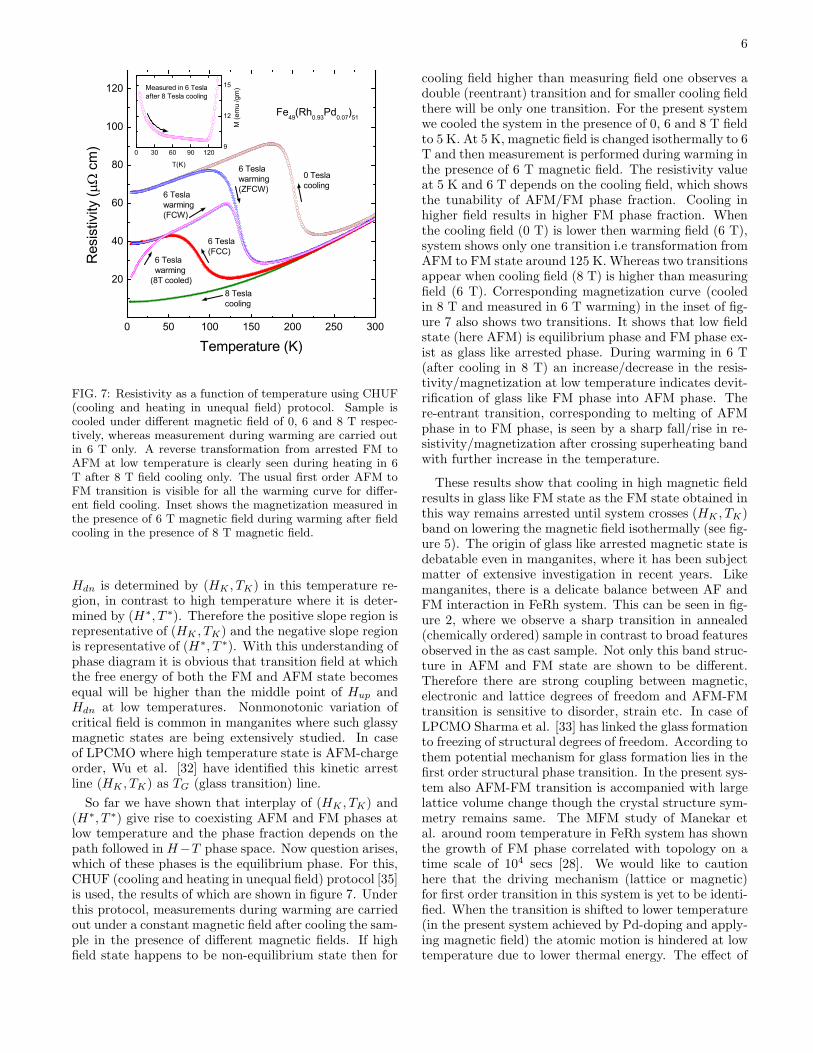
FIG. 7: Resistivity as a function of temperature using CHUF(cooling and heating in unequal field) protocol. Sample iscooled under different magnetic field of 0, 6 and 8 T respec-tively, whereas measurement during warming are carried outin 6 T only. A reverse transformation from arrested FM toAFM at low temperature is clearly seen during heating in 6T after 8 T field cooling only. The usual first order AFM toFM transition is visible for all the warming curve for differ-ent field cooling. Inset shows the magnetization measured inthe presence of 6 T magnetic field during warming after fieldcooling in the presence of 8 T magnetic field.
Hdn is determined by (HK , TK) in this temperature re-gion, in contrast to high temperature where it is deter-mined by (H∗, T ∗). Therefore the positive slope region isrepresentative of (HK , TK) and the negative slope regionis representative of (H∗, T ∗). With this understanding ofphase diagram it is obvious that transition field at whichthe free energy of both the FM and AFM state becomesequal will be higher than the middle point of Hup andHdn at low temperatures. Nonmonotonic variation ofcritical field is common in manganites where such glassymagnetic states are being extensively studied. In caseof LPCMO where high temperature state is AFM-chargeorder, Wu et al. [32] have identified this kinetic arrestline (HK , TK) as TG (glass transition) line.
So far we have shown that interplay of (HK , TK) and(H∗, T ∗) give rise to coexisting AFM and FM phases atlow temperature and the phase fraction depends on thepath followed in H−T phase space. Now question arises,which of these phases is the equilibrium phase. For this,CHUF (cooling and heating in unequal field) protocol [35]is used, the results of which are shown in figure 7. Underthis protocol, measurements during warming are carriedout under a constant magnetic field after cooling the sam-ple in the presence of different magnetic fields. If highfield state happens to be non-equilibrium state then for
cooling field higher than measuring field one observes adouble (reentrant) transition and for smaller cooling fieldthere will be only one transition. For the present systemwe cooled the system in the presence of 0, 6 and 8 T fieldto 5 K. At 5 K, magnetic field is changed isothermally to 6T and then measurement is performed during warming inthe presence of 6 T magnetic field. The resistivity valueat 5 K and 6 T depends on the cooling field, which showsthe tunability of AFM/FM phase fraction. Cooling inhigher field results in higher FM phase fraction. Whenthe cooling field (0 T) is lower then warming field (6 T),system shows only one transition i.e transformation fromAFM to FM state around 125 K. Whereas two transitionsappear when cooling field (8 T) is higher than measuringfield (6 T). Corresponding magnetization curve (cooledin 8 T and measured in 6 T warming) in the inset of fig-ure 7 also shows two transitions. It shows that low fieldstate (here AFM) is equilibrium phase and FM phase ex-ist as glass like arrested phase. During warming in 6 T(after cooling in 8 T) an increase/decrease in the resis-tivity/magnetization at low temperature indicates devit-rification of glass like FM phase into AFM phase. There-entrant transition, corresponding to melting of AFMphase in to FM phase, is seen by a sharp fall/rise in re-sistivity/magnetization after crossing superheating bandwith further increase in the temperature.
These results show that cooling in high magnetic fieldresults in glass like FM state as the FM state obtained inthis way remains arrested until system crosses (HK , TK)band on lowering the magnetic field isothermally (see fig-ure 5). The origin of glass like arrested magnetic state isdebatable even in manganites, where it has been subjectmatter of extensive investigation in recent years. Likemanganites, there is a delicate balance between AF andFM interaction in FeRh system. This can be seen in fig-ure 2, where we observe a sharp transition in annealed(chemically ordered) sample in contrast to broad featuresobserved in the as cast sample. Not only this band struc-ture in AFM and FM state are shown to be different.Therefore there are strong coupling between magnetic,electronic and lattice degrees of freedom and AFM-FMtransition is sensitive to disorder, strain etc. In case ofLPCMO Sharma et al. [33] has linked the glass formationto freezing of structural degrees of freedom. According tothem potential mechanism for glass formation lies in thefirst order structural phase transition. In the present sys-tem also AFM-FM transition is accompanied with largelattice volume change though the crystal structure sym-metry remains same. The MFM study of Manekar etal. around room temperature in FeRh system has shownthe growth of FM phase correlated with topology on atime scale of 104 secs [28]. We would like to cautionhere that the driving mechanism (lattice or magnetic)for first order transition in this system is yet to be identi-fied. When the transition is shifted to lower temperature(in the present system achieved by Pd-doping and apply-ing magnetic field) the atomic motion is hindered at lowtemperature due to lower thermal energy. The effect of

7
Pd doping appears to be similar to metallic glass wheremelting temperature (but not glass transition tempera-ture) is found to be strong function of composition [37].In fact even in the case of LPCMO thin film grown ondifferent substrate, glass transition temperature appearsto be less sensitive to substrate strain in comparison toAFM-FM transition temperature [38].
IV. CONCLUSIONS
To conclude we have studied first order AFM to FMtransition at low temperature using detailed magneto-transport studies on Fe49(Rh0.93Pd0.07)51. Similar toabrupt vanishing of TN with transition metal doping [1],these studies show gradual decrease of transition tem-perature but only down to 50 K and absence of AFM-FM transition below this temperature. Non-monotonicvariation of Hdn observed in isothermal MR measure-ment has been explained by the interplay of (HK , TK)and (H∗, T ∗) band. At low temperature and high mag-netic field, state of the system depends on the measure-ment history and can give rise to coexisting AFM and
FM state. Nature of coexisting AFM and FM phase hasbeen studied by following novel paths in H − T spacewhich shows FM state as GLAS and its devitrificationwith increasing temperature. The observed glass like fea-tures in the studied system are similar to glassy magneticstates observed in manganites and related systems. Theapplicability of the concepts developed in these studiesto the present system shows universality. Further micro-scopic studies will be helpful in understanding the glassybehavior in these systems.
V. ACKNOWLEDGMENTS
We thank N.P. Lalla, R.J. Choudhary and SureshBhardwaj for XRD measurements, V. Ganesan and SwatiPandya for isothermal magnetoresistance measurements,Alok Banerjee and Kranti Kumar for magnetization mea-surements. DST, government of India is acknowledgedfor funding the PPMS and VSM-PPMS used in thepresent study. Pallavi Kushwaha acknowledges CSIR,India for Senior Research Fellowship.
[1] N. V. Baranov, E. A. Barabanova, J. Alloys Comp. 219,139(1995).
[2] R.Y. Gu and V.P. Antropov, Phys. Rev. B 72, 012403(2005).
[3] Jan-Ulrich Thiele, Stefan Maat and Eric E. Fullerton,Appl. Phys. Lett. 82, 2859 (2003); K. Yu. Guslienko,O. Chubykalo-Fesenko, O. Mryasov, R. Chantrell, and D.Weller, Phys. Rev. B 70, 104405 (2004).
[4] G. Ju, J. Hohlfeld, B. Bergman, R. J. M. van deVeer-donk, O. N. Mryasov, J.-Y. Kim, X. Wu, D. Weller, andB. Koopmans,Phys. Rev. Lett. 93, 197403 (2004).
[5] J. S. Kouvel and C. C Hartelius, J. Appl. Phys. 33, 1343(1962).
[6] J. S. Kouvel, J. Appl. Phys. 37, 1257 (1966).[7] G. Shirane, C. W. Chen, P. A. Flinn, and R. Nathans, J.
Appl. Phys. 34, 1044 (1963); G. Shirane, R. Nathans andC. W. Chen, Phys. Rev. 134, A1547 (1964).
[8] E. Navarro, M. Multigner, A. R. Yavari and A. Hernando,Euro. phys. Lett. 35, 307 (1996).
[9] J. M. Lommel and J. S. Kouvel, J. Appl. Phys. 38, 1263(1967).
[10] P. A. Algarabel, M. R. Ibarra, C. Marquina, and A. delMoral, J. Galibert, M. Iqbal, and S. Askenazy, Appl. Phys.Lett.66, 3061 (1995).
[11] V. L. Moruzzi and P. M. Marcus, Phys. Rev. B 46, 2864(1992).
[12] C. C. Chao, P. Duwez, and C. C. Tsuei, J. Appl. Phys.42, 4282 (1971).
[13] N. V. Baranov, P. E. Markin, S. V. Zemlyanski, H. Mi-chor, G. Hilscher, J. Magn. Magn. Mater. 157-158, 401(1996).
[14] C. Kittel, Phys. Rev. 120, 335 (1960).[15] M. P. Annaorazov, S. A. Nikitin, A. L. Tyurin, K. A.
Asatryan and A. Kh. Dovletov, J. Appl. Phys. 79, 1689
(1996).[16] P. Tu, A. J. Heeger, J. S. Kouvel and J. B. Comly, J.
Appl. Phys. 40, 1368 (1969).[17] J. Ivrsson, G.R. Pickett and J. Toth, Phys. Lett. 35A,
167 (1971).[18] L.Y. Chen and D.W. Lynch, Phys. Rev. B 37, 10503
(1988).[19] M. Rajagopalan, Int. J. Mod. Phys. B 19, 3389 (2005).[20] R.C. Wayne, Phys. Rev. 170, 523 (1968).[21] M.P. Annaorazov, H.M. Guven, K. Barner, J. Alloys
Comp. 397, 26 (2005).[22] J.A. Ricodeau and D. Melville, J. Phys. (France) 35, 149
(1974).[23] M. R. Ibarra and P. A. Algarabel, Phys. Rev. B 50, 4196
(1994).[24] C. Marquina, M. R. Ibarra, P. A. Algarabel, A. Her-
nando, P. Crespo, P. Agudo, A. R. Yavari and E. Navarro,J. Appl. Phys. 81, 2315 (1997).
[25] J.-U. Thiele, M. Buess and C. H. Back, Appl. Phys. Lett.85, 2857 (2004).
[26] S. Maat, J.-U. Thiele and Eric E. Fullerton, Phys. Rev.B 72, 214432 (2005).
[27] Y. Yokoyama, M. Usukura, S. Yuasa, Y. Suzuki, H. Miya-jima and T. Katayama, J. Mag. Mag. Mater. 177-181 181(1998).
[28] M. Manekar, C. Mukhaerjee and S. B. Roy, Europhys.Lett. 80, 17004 (2007).
[29] A. Hernando, E. Navarro, M. Multigner, A. R. Yavari, D.Fiorani, M. Rosenberg, G. Filoti and R. Caciuffo, Phys.Rev. B 58, 5181 (1998).
[30] R. Rawat, K. Mukherjee, K. Kumar, A. Banerjee and P.Chaddah, J. Phys.: Condens. Matter 19 256211 (2007).
[31] Pallavi Kushwaha, R. Rawat and P. Chaddah, J. Phys.:Condens. Matter 20, 022204 (2008).
8
[32] W. Wu, C. Israel, N. Hur, P. Soonyong, S.-W. Cheongand A.De. Lozane, Nat. Mater. 5, 881 (2006).
[33] S. B. Roy, P. Chaddah, V. K. Pecharsky and K. A.Gschneidner, Jr., Acta. Mater. 56, 5895 (2008); P.A.Sharma, S. El-Khatib, I. Mihut, J.B. Betts, A. Migliori,S.B. Kim, S. Guha and S.-W. Cheong, Phys. Rev. B 78,134205 (2008).
[34] S. B. Roy and M.K. Chattopadhye, Phys. Rev. B 79,052407 (2009).
[35] A. Banerjee, Kranti Kumar and P. Chaddah, J. Phys.:
Condens. Matter 21, 026002 (2009).[36] Y. Imry and M. Wortis, Phys. Rev. B 19 3580 (1979);
Kranti Kumar, A. K. Pramanik, A. Banerjee, P. Chaddah,S. B. Roy, S. Park, C. L. Zhang, and S.-W. Cheong, Phys.Rev B 73, 184435 (2006).
[37] A. L. Greer, Science 267, 1947 (1995).[38] V.G. Sathe, Anju Ahalawat, R. Rawat and P. Chaddah
(private communication).