fvo-1100tr indirect fired heater trailer - Axis Portable Air
NANO EXPRESS Open Access
Low temperature-fired Ni-Cu-Zn ferritenanoparticles through auto-combustion methodfor multilayer chip inductor applicationsKhalid Mujasam Batoo1* and Mohammad Shahnawaze Ansari2
Abstract
Ferrite nanoparticles of basic composition Ni0.7-xZnxCu0.3Fe2O4 (0.0 ≤ x ≤ 0.2, x = 0.05) were synthesized throughauto-combustion method and were characterized for structural properties using X-ray diffraction [XRD], scanningelectron microscopy, transmission electron microscopy, and Fourier transform infrared spectroscopy [FT-IR]. XRDanalysis of the powder samples sintered at 600°C for 4 h showed the cubic spinel structure for ferrites with anarrow size distribution from 28 to 32 nm. FT-IR showed two absorption bands (v1 and v2) that are attributed tothe stretching vibration of tetrahedral and octahedral sites. The effect of Zn doping on the electrical properties wasstudied using dielectric and impedance spectroscopy at room temperature. The dielectric parameters (ε’, ε″, tanδ,and sac) show their maximum value for 10% Zn doping. The dielectric constant and loss tangent decrease withincreasing frequency of the applied field. The results are explained in the light of dielectric polarization which issimilar to the conduction phenomenon. The complex impedance shows that the conduction process in grownnanoparticles takes place predominantly through grain boundary volume.PACS: 75.50.Gg; 78.20; 77.22.Gm.
Keywords: nanoparticles, ferrites, dielectric constant, ac conductivity, impedance spectroscopy.
IntroductionThe study of ferrites has attracted immense attention ofthe scientific community because of their novel proper-ties and technological applications especially when thesize of the particles approaches to nanometer scale.More novel electrical and magnetic behaviors have beenobserved in comparison with their bulk counterpart[1,2]. In general, the transport properties of the nano-materials are predominantly controlled by the grainboundaries than by the grain itself [3]. Due to this rea-son, the magnetic materials have explored a wide rangeof applications and thus are replacing conventionalmaterials.In the last two decades, latest advancement in wireless
technology has explored the area of real-time communi-cation. Internet-accessible cell phones and high-speedwireless local area network are the best examples of this
technology. The core of these systems is based on aradio frequency [RF] circuit consisting of transmissionand receiving circuit blocks required in signal amplifica-tion, filtering, and modulation that in turn require hun-dreds of passive chip components such as capacitorsand inductors. Inductors adapted to RF circuits ofmobile devices are mostly multilayer chip inductors[MLCIs] and microspiral inductors. MLCIs were devel-oped in the 1980s by thick film printing and co-firingtechnologies using low temperature-sintered Ni-Cu-Znferrite and Ag. Recently, Ni-Cu-Zn ferrites have beendeveloped to meet a demand for miniaturization of elec-tronic components [4,5]. The ferrite powder needs to besintered below 950°C in order to co-heat with silverinternal electrodes (Tm approximately 962°C) and shouldhave low dielectric constants for MLCI application.Materials with high permeability are also required forreducing the number of layers in MLCIs and for realiz-ing the better miniaturization [6]. Further, ferrite nano-particles are commercially important for severalapplications such as in electromagnetic devices
* Correspondence: [email protected] Abdullah Institute for Nanotechnology, King Saud University, PO Box2460, Riyadh, 11451, Kingdom of Saudi ArabiaFull list of author information is available at the end of the article
Batoo and Ansari Nanoscale Research Letters 2012, 7:112http://www.nanoscalereslett.com/content/7/1/112
© 2012 Batoo and Ansari; licensee Springer. This is an Open Access article distributed under the terms of the Creative CommonsAttribution License (http://creativecommons.org/licenses/by/2.0), which permits unrestricted use, distribution, and reproduction inany medium, provided the original work is properly cited.
operating at radio frequencies where the superparamag-netic [SPM] properties have a strong influence inenhancing their quality of applications [7-9]. Nanoparti-cles of these materials exhibit interesting phase transi-tions from SPM state to ferri/ferromagnetic state or viceversa with a variation of temperature depending ontheir sizes. In this ferrite nanoparticle system, the Cucontent of the compositions was kept constant at 30 at.% of the A site (AB2O4 spinel); nonmagnetic Zn2+ ionsoccupy the tetrahedral A sites, replacing Fe3+ ions,which eventually go to octahedral B sites. Hence, zinccations magnetically dilute the system by making the A-B exchange interaction relatively weaker. This weakercoupling reduces the anisotropy energy of the system,which facilitates the onset of SPM relaxation in biggersize particles even at room temperature. Many reportsare available in the literature on Ni-Cu ferrites wherepeople have reported various properties of the studiedferrite material in bulk as well as in nanoscale form.Chakrabarti et al. [10] studied the magnetic propertiesof nanocrystalline Ni0.2Zn0.6Cu0.2Fe2O4 prepared using achemical route method, and they reported that below 80K, the nanoparticles exhibit superparamagnetism, andthe saturation magnetization increases with increasingparticle size. Seong et al. [11] investigated the structuraland electrical properties of Cu-substituted Ni-Zn fer-rites, and they have reported that the alternating current[ac] conductivity increases with increasing temperatureof the sample and frequency of the applied field. Roy etal. [12] reported the effect of Mg substitution on elec-tromagnetic properties of (Ni0.25Cu0.20Zn0.55)Fe2O4 fer-rite prepared through auto-combustion method, andthey found that the permeability and ac resistivityincreased while the magnetic loss decreased with theprogressive substitution. Jadhav et al. [13] reported thestructural, electrical, and magnetic properties of Ni-Cu-Zn ferrite synthesized by citrate precursor method, andthey reported that the dielectric properties (ε’ and tanδ)decreases with increasing frequency of the applied field.They further report that the maximum value of thesaturation magnetization was found for 20% Cu doping.However, as per our best search, we have not found
any detailed report in the literature on the dielectric andimpedance properties of Zn-doped Ni0.7-xCu0.3Fe2O4 fer-rite nanoparticles. Therefore, keeping in view the highdemand and importance of magnetic ferrite nanoparti-cles, we report in this paper the effect of Zn doping onthe structural, cationic distribution, and conductivityproperties of nanocrystalline Ni-Cu-Zn ferrites.
Experimental detailsMaterial preparationNanoparticles of Ni0.7-xZnxCu0.3Fe2O4 (0.0 ≤ x ≤ 0.2, x =0.05) were prepared by auto-combustion method using
‘AR’ grade Ni(NO3)2.6H2O, CuCl, Zn(NO3)2.6H2O, andFe(NO3)2.9H2O as raw materials. The stoichiometricmixtures of the mentioned materials were dissolved indeionized water, and few drops of ethyl alcohol wereadded to it. The solution was allowed for gel formationon the magnetic stirrer at 65°C with constant stirring.The gel formed was annealed at 200°C for 24 h, fol-lowed by grinding for 0.5 h. The dried gel was allowedto burn in a self-propagating combustion manner untilthe whole gel was completely burnt out to form a fluffyloose powder. The formed powder was heated for 4 h at600°C to remove any organic material present whilemaintaining the rate of heating and cooling at 5°C/minand then finally ground for 0.5 h.X-ray diffraction [XRD] (PANalytical X’Pert Pro,
Almelo, The Netherlands) with CuKa (l = 1.54 Å) wasused to study the single-phase nature and nano-phaseformation of the pure and doped Ni-Cu-Zn ferrite nano-particles at room temperature. The microstructural ana-lysis of the samples was carried out by field emissionscanning electron microscopy [FESEM] (JSM 7600F,JEOL Ltd., Akishima, Tokyo, Japan) and field emissiontransmission electron microscopy [FETEM] (Jeol 2010,Tokyo, Japan). The infrared spectra of the powders (aspellets in KBr) were recorded by Fourier transforminfrared spectrometry [FT-IR] (PerkinElmer Instruments,Waltham, MA, USA) in the range of 400 to 1,000 cm-1
with a resolution of 1 cm-1.The samples were pressed into circular disk-shaped
pellets, and silver coating was done on the oppositefaces to make parallel plate capacitor geometry with fer-rite material as the dielectric medium. The dielectricand impedance spectroscopy measurements were per-formed in the frequency range of 42 Hz to 5 MHz usingLCR HI-Tester (HIOKI 3532-50, HIOKI E.E. Corpora-tion, Nagano, Japan).
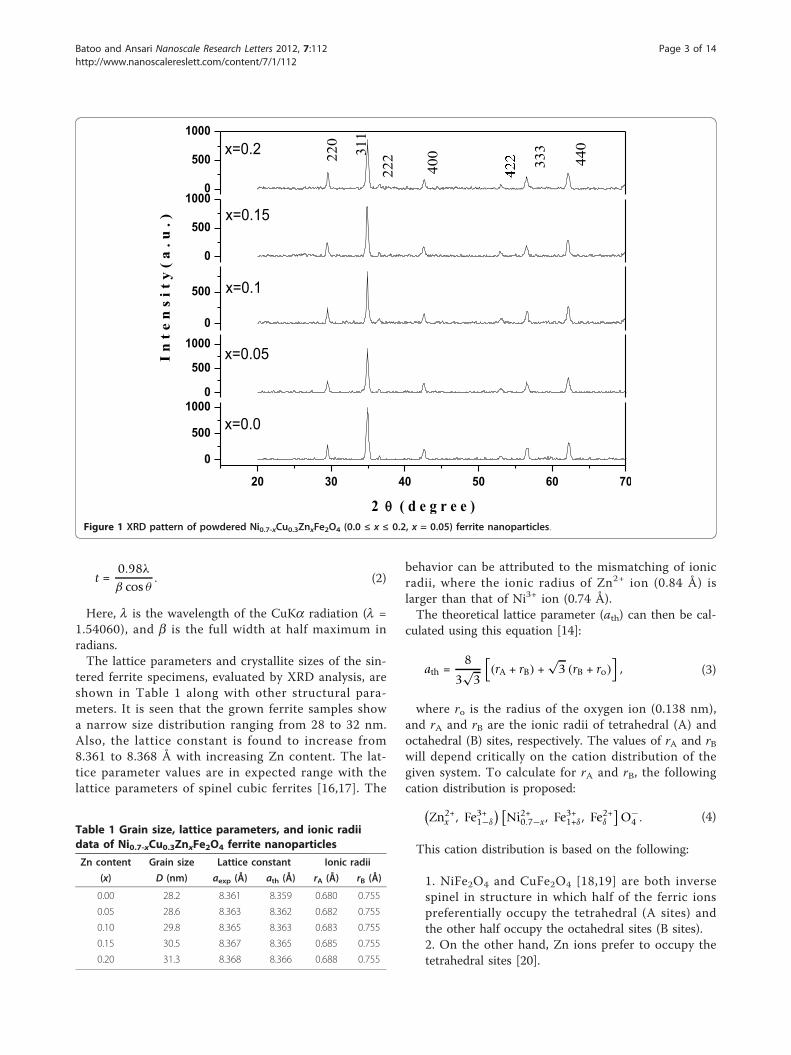
Results and discussionStructural characterizationXRD patterns of the sintered Ni0.7-xZnxCu0.3Fe2O4 fer-rites are shown in Figure 1. The most intense peaks inall specimens, indexed as (220), (311), (222), (400),(422), (333), and (440), are found to match well withsingle-phase cubic spinel (JCPS card number 08-0234).No additional phase corresponding to any structure instarting and doped samples was detected.The lattice parameter of the samples was determined
using this relation [14]:
aexp = dhkl
√h2 + k2 + l2. (1)
The average crystallite size was determined from thediffraction peak broadening with the use of the Scher-rer’s equation [15]:
Batoo and Ansari Nanoscale Research Letters 2012, 7:112http://www.nanoscalereslett.com/content/7/1/112
Page 2 of 14
t =0.98λ
β cos θ. (2)
Here, l is the wavelength of the CuKa radiation (l =1.54060), and b is the full width at half maximum inradians.The lattice parameters and crystallite sizes of the sin-
tered ferrite specimens, evaluated by XRD analysis, areshown in Table 1 along with other structural para-meters. It is seen that the grown ferrite samples showa narrow size distribution ranging from 28 to 32 nm.Also, the lattice constant is found to increase from8.361 to 8.368 Å with increasing Zn content. The lat-tice parameter values are in expected range with thelattice parameters of spinel cubic ferrites [16,17]. The
behavior can be attributed to the mismatching of ionicradii, where the ionic radius of Zn2+ ion (0.84 Å) islarger than that of Ni3+ ion (0.74 Å).The theoretical lattice parameter (ath) can then be cal-
culated using this equation [14]:
ath =8
3√
3
[(rA + rB) +
√3 (rB + ro)
], (3)
where ro is the radius of the oxygen ion (0.138 nm),and rA and rB are the ionic radii of tetrahedral (A) andoctahedral (B) sites, respectively. The values of rA and rBwill depend critically on the cation distribution of thegiven system. To calculate for rA and rB, the followingcation distribution is proposed:
(Zn2+
x , Fe3+1−δ
) [Ni2+
0.7−x, Fe3+1+δ , Fe2+
δ
]O−
4 . (4)
This cation distribution is based on the following:
1. NiFe2O4 and CuFe2O4 [18,19] are both inversespinel in structure in which half of the ferric ionspreferentially occupy the tetrahedral (A sites) andthe other half occupy the octahedral sites (B sites).2. On the other hand, Zn ions prefer to occupy thetetrahedral sites [20].
20 30 40 50 60 70
0
500
10000
500
10000
500
0
500
10000
500
1000
2 ( d e g r e e )
x=0.0
x=0.05
x=0.1
I n
t e
n s
i t y
( a
. u .
) x=0.15
440
333
400
333220
22231
1
x=0.2
Figure 1 XRD pattern of powdered Ni0.7-xCu0.3ZnxFe2O4 (0.0 ≤ x ≤ 0.2, x = 0.05) ferrite nanoparticles.
Table 1 Grain size, lattice parameters, and ionic radiidata of Ni0.7-xCu0.3ZnxFe2O4 ferrite nanoparticles
Zn content Grain size Lattice constant Ionic radii
(x) D (nm) aexp (Å) ath (Å) rA (Å) rB (Å)
0.00 28.2 8.361 8.359 0.680 0.755
0.05 28.6 8.363 8.362 0.682 0.755
0.10 29.8 8.365 8.363 0.683 0.755
0.15 30.5 8.367 8.365 0.685 0.755
0.20 31.3 8.368 8.366 0.688 0.755
Batoo and Ansari Nanoscale Research Letters 2012, 7:112http://www.nanoscalereslett.com/content/7/1/112
Page 3 of 14
3. During the sintering process, oxygen loss occurs,leading a part of Fe3+ ions to transform to Fe2+ forcharge compensation [14].
The data in Table 1 reveals that the values of the the-oretical lattice parameter (ath), calculated assuming thesuggested cation distribution formula, agree well withthose experimentally obtained (aexp).The mean radius of the ions at the tetrahedral site rtetr
and the octahedral site roct has been calculated accord-ing to these equations [21]:
rtetra = a√
3 (μ − 0.25) − Ro (5)
and
roct = a(
58
− μ
)− Ro, (6)
where Ro is the radius of the oxygen ion (Ro = 1.26 Å),and μ is the oxygen parameter. Here, we have taken thevalue μ = 0.375 by assuming that the spinel structure isnot deformed by Zn2+ doping [22,23].The variation of X-ray density Dhkl (theoretical),
apparent density (experimental) Dx, and porosity P as afunction of Zn2+ ion concentration (x) is reported inTable 2. The X-ray density of the prepared samples wascalculated using this formula [24]:
Dhkl =ZM
Na3, (7)
where Z is the number of molecules per unit cell (Z =8), M is the molecular weight, a is the lattice parameter,and N is the Avogadro’s number. The theoretical densityof the samples was calculated using this formula [24]:
Dx =m
Vr2h, (8)
where m, V, r, and h are the mass, volume, radius, andthickness of the samples, respectively. The porosity ofthe samples was calculated using this formula:
P = 1 − Dx
Dhkl× 100. (9)
The apparent density of the specimens is about 94% to95% of the corresponding X-ray densities. The data inTable 2 show that both densities decrease with increas-ing Zn content, i.e., the apparent density nearly reflectsthe same general behavior with the X-ray density.The increase of porosity and decrease of shrinkage
with increasing Zn2+ ion content are related to the rapiddensification of ferrite samples and also to the differencein specific gravity of the ferrite components since NiO(6.72 g cm-3) is heavier than ZnO (5.6 g cm-3) [25].Also, it is known that the porosity of ceramic samples isa result that came from two sources: the intragranularporosity [Pintra] and intergranular porosity [Pinter] [26].Thus, the total porosity P (in percent) could be writtenas the sum of the two types:
P (%) = (Pintra + Pinter) . (10)
Furthermore, it is reported that Pinter depends on thegrain size [27]. By the study of XRD and transmissionelectron microscopy [TEM] data of the samples, it isfound that as the Zn concentration increases from x =0.0 up to x = 0.2, there is no major change in the grainsize. Therefore, as Zn2+ ion content increases, Pinter
remains almost constant. Thus, according to Equation10, the increase of the total porosity P (in percent) ismainly due to the increase of Pintra with Zn2+ doping[28,29].The FETEM and FESEM micrographs of the synthe-
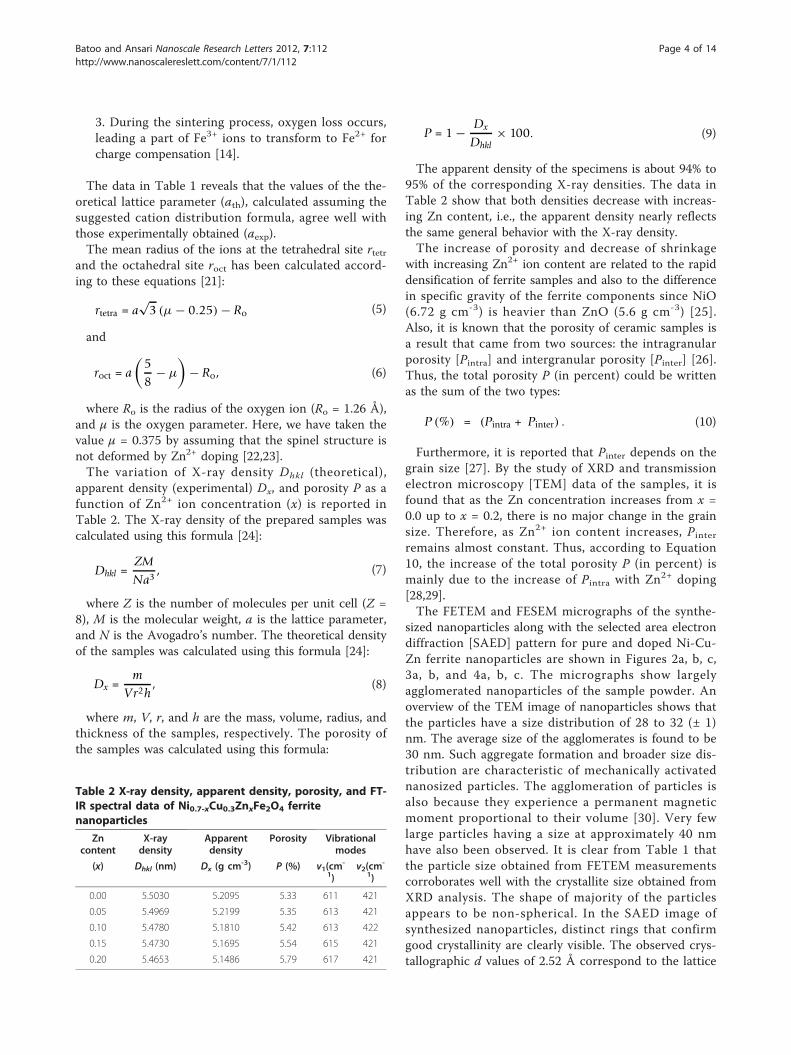
sized nanoparticles along with the selected area electrondiffraction [SAED] pattern for pure and doped Ni-Cu-Zn ferrite nanoparticles are shown in Figures 2a, b, c,3a, b, and 4a, b, c. The micrographs show largelyagglomerated nanoparticles of the sample powder. Anoverview of the TEM image of nanoparticles shows thatthe particles have a size distribution of 28 to 32 (± 1)nm. The average size of the agglomerates is found to be30 nm. Such aggregate formation and broader size dis-tribution are characteristic of mechanically activatednanosized particles. The agglomeration of particles isalso because they experience a permanent magneticmoment proportional to their volume [30]. Very fewlarge particles having a size at approximately 40 nmhave also been observed. It is clear from Table 1 thatthe particle size obtained from FETEM measurementscorroborates well with the crystallite size obtained fromXRD analysis. The shape of majority of the particlesappears to be non-spherical. In the SAED image ofsynthesized nanoparticles, distinct rings that confirmgood crystallinity are clearly visible. The observed crys-tallographic d values of 2.52 Å correspond to the lattice
Table 2 X-ray density, apparent density, porosity, and FT-IR spectral data of Ni0.7-xCu0.3ZnxFe2O4 ferritenanoparticles
Zncontent
X-raydensity
Apparentdensity
Porosity Vibrationalmodes
(x) Dhkl (nm) Dx (g cm-3) P (%) v1(cm-
1)v2(cm
-
1)
0.00 5.5030 5.2095 5.33 611 421
0.05 5.4969 5.2199 5.35 613 421
0.10 5.4780 5.1810 5.42 613 422
0.15 5.4730 5.1695 5.54 615 421
0.20 5.4653 5.1486 5.79 617 421
Batoo and Ansari Nanoscale Research Letters 2012, 7:112http://www.nanoscalereslett.com/content/7/1/112
Page 4 of 14
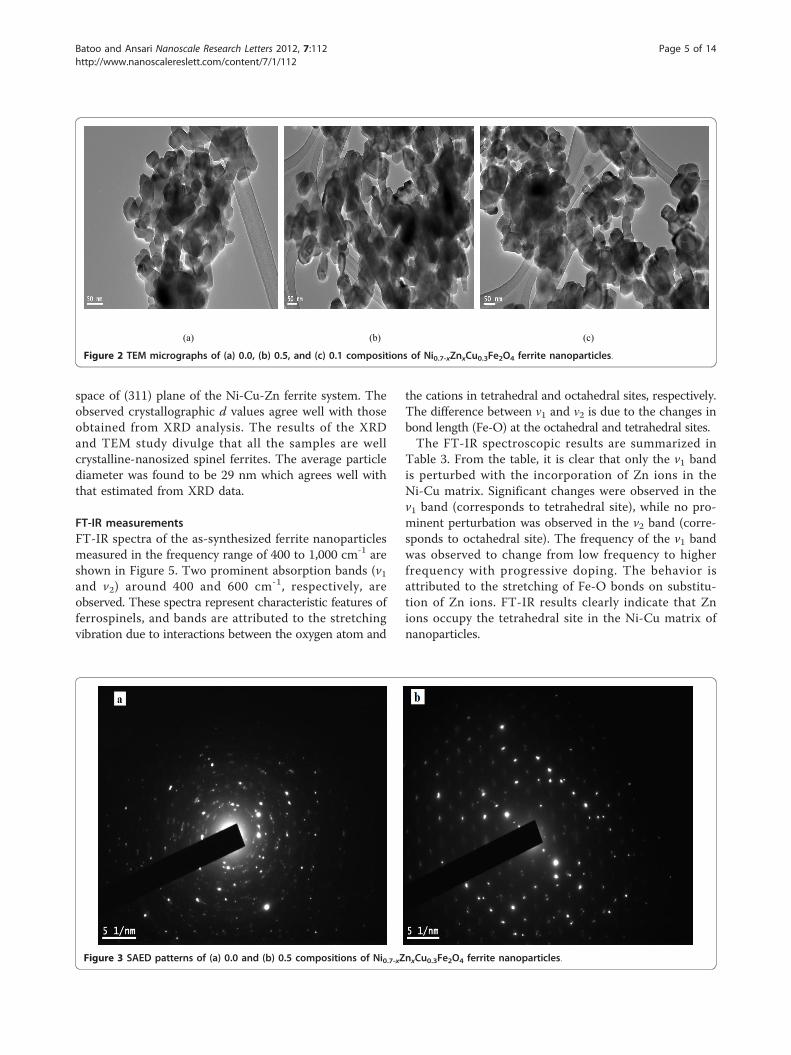
space of (311) plane of the Ni-Cu-Zn ferrite system. Theobserved crystallographic d values agree well with thoseobtained from XRD analysis. The results of the XRDand TEM study divulge that all the samples are wellcrystalline-nanosized spinel ferrites. The average particlediameter was found to be 29 nm which agrees well withthat estimated from XRD data.
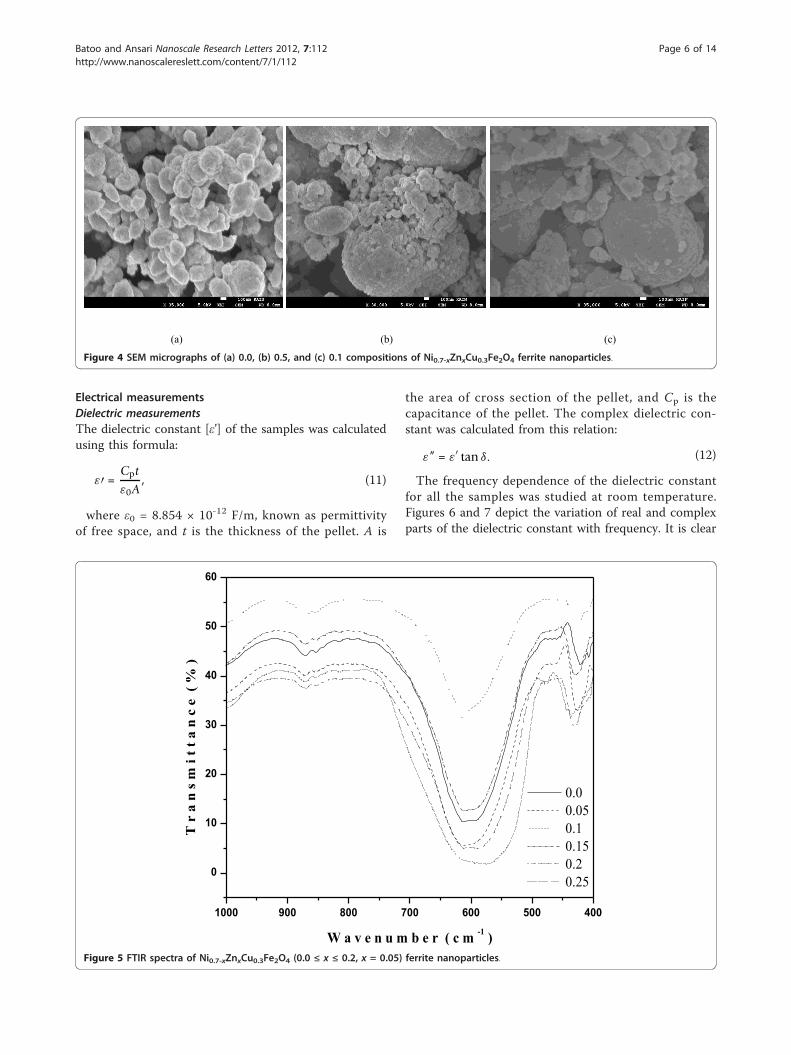
FT-IR measurementsFT-IR spectra of the as-synthesized ferrite nanoparticlesmeasured in the frequency range of 400 to 1,000 cm-1 areshown in Figure 5. Two prominent absorption bands (v1and v2) around 400 and 600 cm-1, respectively, areobserved. These spectra represent characteristic features offerrospinels, and bands are attributed to the stretchingvibration due to interactions between the oxygen atom and
the cations in tetrahedral and octahedral sites, respectively.The difference between ν1 and ν2 is due to the changes inbond length (Fe-O) at the octahedral and tetrahedral sites.The FT-IR spectroscopic results are summarized in
Table 3. From the table, it is clear that only the v1 bandis perturbed with the incorporation of Zn ions in theNi-Cu matrix. Significant changes were observed in thev1 band (corresponds to tetrahedral site), while no pro-minent perturbation was observed in the v2 band (corre-sponds to octahedral site). The frequency of the v1 bandwas observed to change from low frequency to higherfrequency with progressive doping. The behavior isattributed to the stretching of Fe-O bonds on substitu-tion of Zn ions. FT-IR results clearly indicate that Znions occupy the tetrahedral site in the Ni-Cu matrix ofnanoparticles.
(a) (b) (c)
Figure 2 TEM micrographs of (a) 0.0, (b) 0.5, and (c) 0.1 compositions of Ni0.7-xZnxCu0.3Fe2O4 ferrite nanoparticles.
Figure 3 SAED patterns of (a) 0.0 and (b) 0.5 compositions of Ni0.7-xZnxCu0.3Fe2O4 ferrite nanoparticles.
Batoo and Ansari Nanoscale Research Letters 2012, 7:112http://www.nanoscalereslett.com/content/7/1/112
Page 5 of 14
Electrical measurementsDielectric measurementsThe dielectric constant [ε’] of the samples was calculatedusing this formula:
ε′ =Cpt
ε0A, (11)
where ε0 = 8.854 × 10⁻¹² F/m, known as permittivityof free space, and t is the thickness of the pellet. A is
the area of cross section of the pellet, and Cp is thecapacitance of the pellet. The complex dielectric con-stant was calculated from this relation:
ε” = ε′ tan δ. (12)
The frequency dependence of the dielectric constantfor all the samples was studied at room temperature.Figures 6 and 7 depict the variation of real and complexparts of the dielectric constant with frequency. It is clear
(a) (b) (c)
Figure 4 SEM micrographs of (a) 0.0, (b) 0.5, and (c) 0.1 compositions of Ni0.7-xZnxCu0.3Fe2O4 ferrite nanoparticles.
1000 900 800 700 600 500 400
0
10
20
30
40
50
60
T r
a n
s m
i t t
a n
c e
( %
)
W a v e n u m b e r ( c m -1 )
0.0 0.05 0.1 0.15 0.2 0.25
Figure 5 FTIR spectra of Ni0.7-xZnxCu0.3Fe2O4 (0.0 ≤ x ≤ 0.2, x = 0.05) ferrite nanoparticles.
Batoo and Ansari Nanoscale Research Letters 2012, 7:112http://www.nanoscalereslett.com/content/7/1/112
Page 6 of 14
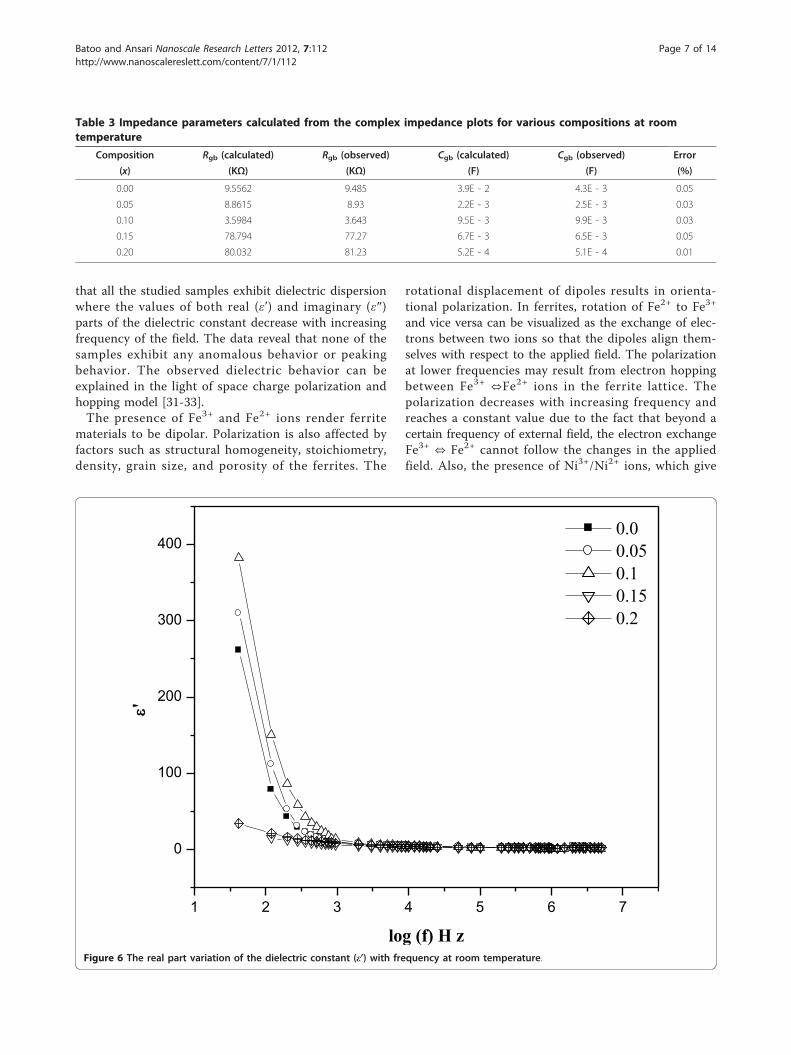
that all the studied samples exhibit dielectric dispersionwhere the values of both real (ε’) and imaginary (ε″)parts of the dielectric constant decrease with increasingfrequency of the field. The data reveal that none of thesamples exhibit any anomalous behavior or peakingbehavior. The observed dielectric behavior can beexplained in the light of space charge polarization andhopping model [31-33].The presence of Fe3+ and Fe2+ ions render ferrite
materials to be dipolar. Polarization is also affected byfactors such as structural homogeneity, stoichiometry,density, grain size, and porosity of the ferrites. The
rotational displacement of dipoles results in orienta-tional polarization. In ferrites, rotation of Fe2+ to Fe3+
and vice versa can be visualized as the exchange of elec-trons between two ions so that the dipoles align them-selves with respect to the applied field. The polarizationat lower frequencies may result from electron hoppingbetween Fe3+ ⇔Fe2+ ions in the ferrite lattice. Thepolarization decreases with increasing frequency andreaches a constant value due to the fact that beyond acertain frequency of external field, the electron exchangeFe3+ ⇔ Fe2+ cannot follow the changes in the appliedfield. Also, the presence of Ni3+/Ni2+ ions, which give
Table 3 Impedance parameters calculated from the complex impedance plots for various compositions at roomtemperature
Composition Rgb (calculated) Rgb (observed) Cgb (calculated) Cgb (observed) Error
(x) (KΩ) (KΩ) (F) (F) (%)
0.00 9.5562 9.485 3.9E - 2 4.3E - 3 0.05
0.05 8.8615 8.93 2.2E - 3 2.5E - 3 0.03
0.10 3.5984 3.643 9.5E - 3 9.9E - 3 0.03
0.15 78.794 77.27 6.7E - 3 6.5E - 3 0.05
0.20 80.032 81.23 5.2E - 4 5.1E - 4 0.01
1 2 3 4 5 6 7
0
100
200
300
400
'
log (f) H z
0.0 0.05 0.1 0.15 0.2
Figure 6 The real part variation of the dielectric constant (ε’) with frequency at room temperature.
Batoo and Ansari Nanoscale Research Letters 2012, 7:112http://www.nanoscalereslett.com/content/7/1/112
Page 7 of 14
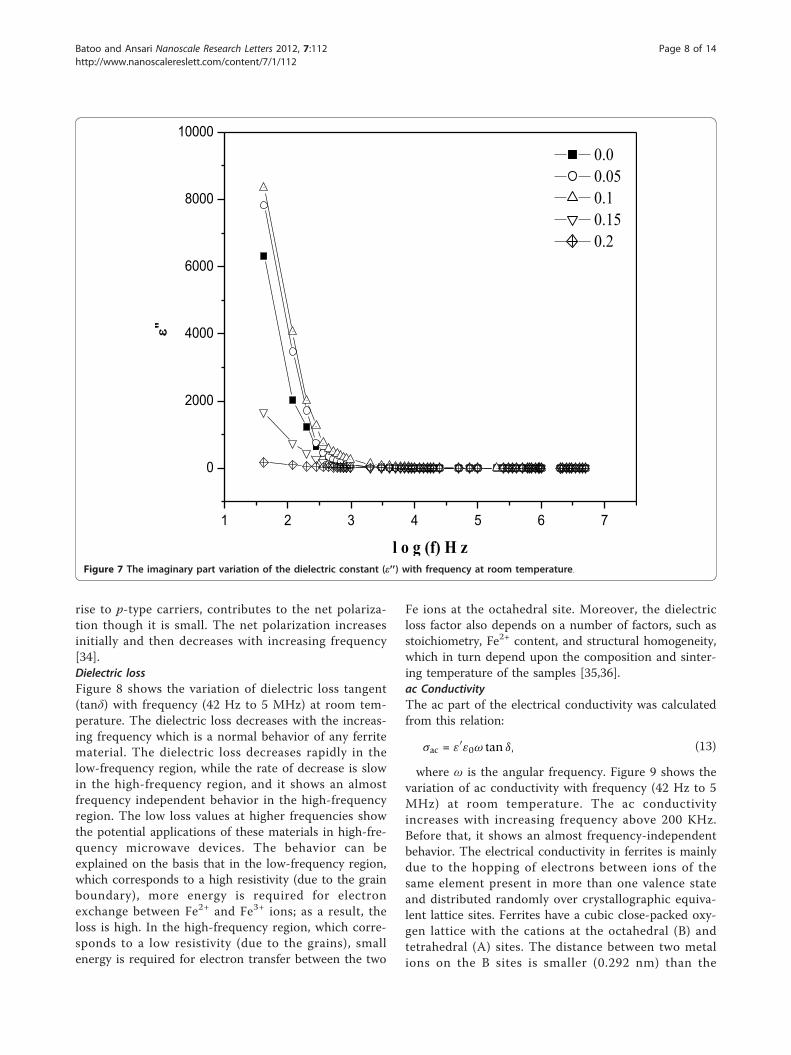
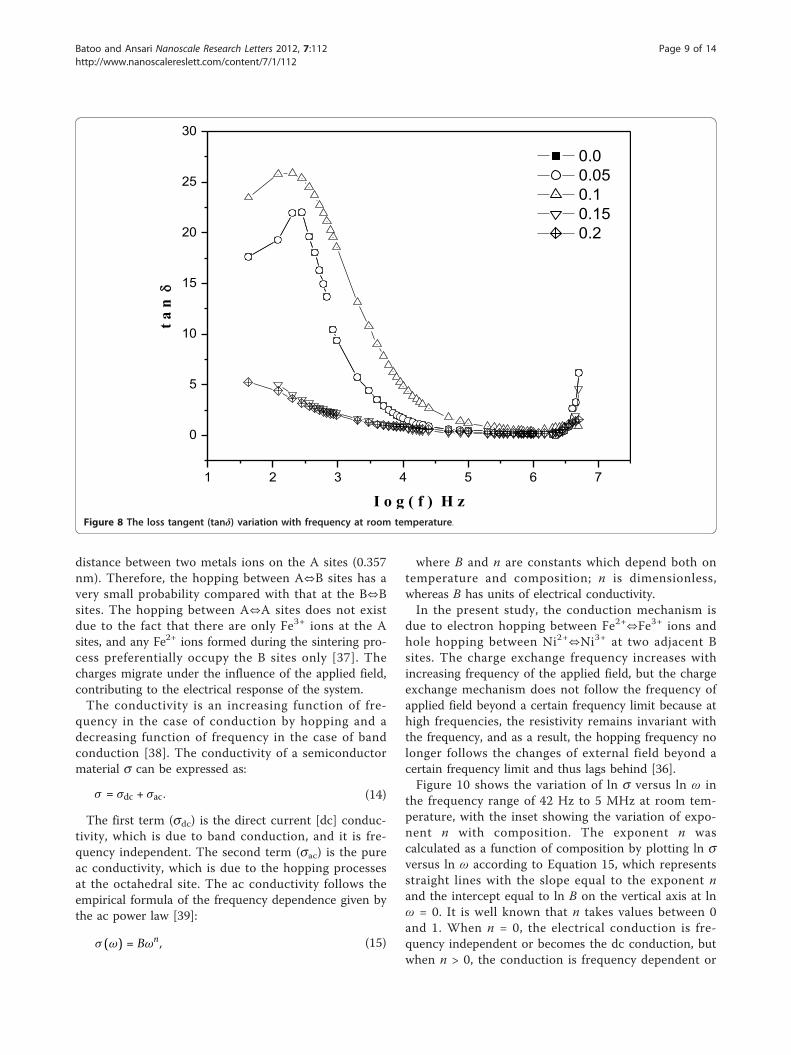
rise to p-type carriers, contributes to the net polariza-tion though it is small. The net polarization increasesinitially and then decreases with increasing frequency[34].Dielectric lossFigure 8 shows the variation of dielectric loss tangent(tanδ) with frequency (42 Hz to 5 MHz) at room tem-perature. The dielectric loss decreases with the increas-ing frequency which is a normal behavior of any ferritematerial. The dielectric loss decreases rapidly in thelow-frequency region, while the rate of decrease is slowin the high-frequency region, and it shows an almostfrequency independent behavior in the high-frequencyregion. The low loss values at higher frequencies showthe potential applications of these materials in high-fre-quency microwave devices. The behavior can beexplained on the basis that in the low-frequency region,which corresponds to a high resistivity (due to the grainboundary), more energy is required for electronexchange between Fe2+ and Fe3+ ions; as a result, theloss is high. In the high-frequency region, which corre-sponds to a low resistivity (due to the grains), smallenergy is required for electron transfer between the two
Fe ions at the octahedral site. Moreover, the dielectricloss factor also depends on a number of factors, such asstoichiometry, Fe2+ content, and structural homogeneity,which in turn depend upon the composition and sinter-ing temperature of the samples [35,36].ac ConductivityThe ac part of the electrical conductivity was calculatedfrom this relation:
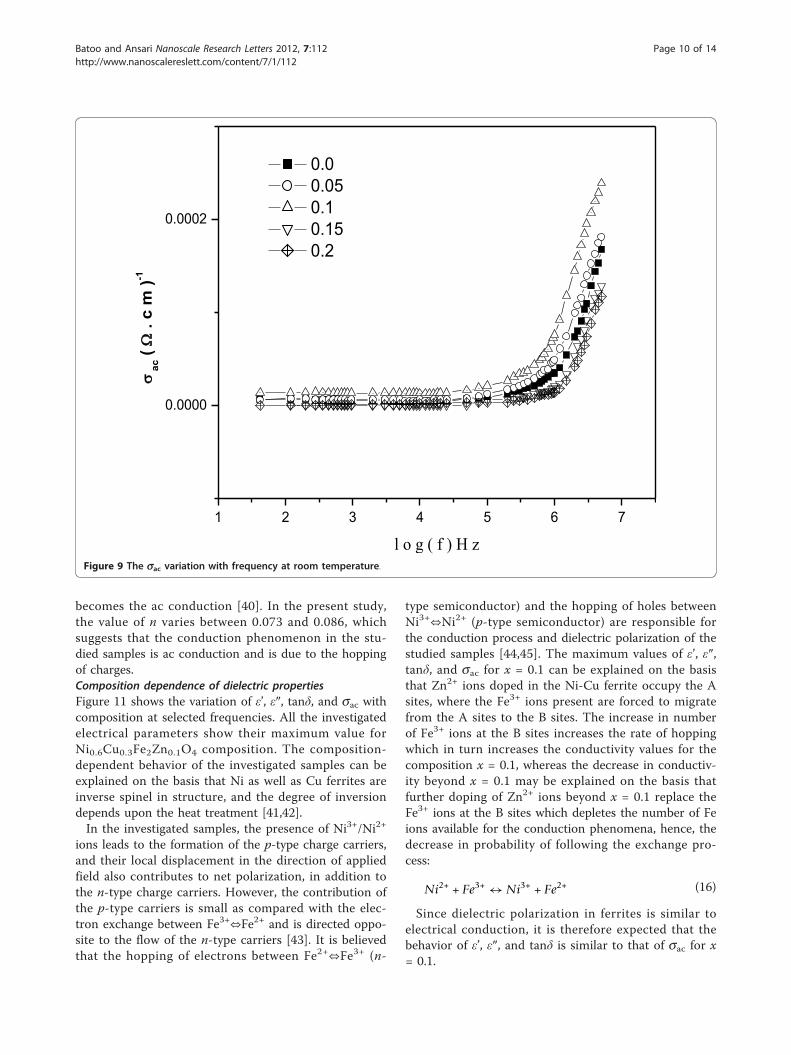
σac = ε′ε0ω tan δ, (13)
where ω is the angular frequency. Figure 9 shows thevariation of ac conductivity with frequency (42 Hz to 5MHz) at room temperature. The ac conductivityincreases with increasing frequency above 200 KHz.Before that, it shows an almost frequency-independentbehavior. The electrical conductivity in ferrites is mainlydue to the hopping of electrons between ions of thesame element present in more than one valence stateand distributed randomly over crystallographic equiva-lent lattice sites. Ferrites have a cubic close-packed oxy-gen lattice with the cations at the octahedral (B) andtetrahedral (A) sites. The distance between two metalions on the B sites is smaller (0.292 nm) than the
1 2 3 4 5 6 7
0
2000
4000
6000
8000
10000
"
l o g (f) H z
0.0 0.05 0.1 0.15 0.2
Figure 7 The imaginary part variation of the dielectric constant (ε″) with frequency at room temperature.
Batoo and Ansari Nanoscale Research Letters 2012, 7:112http://www.nanoscalereslett.com/content/7/1/112
Page 8 of 14
distance between two metals ions on the A sites (0.357nm). Therefore, the hopping between A⇔B sites has avery small probability compared with that at the B⇔Bsites. The hopping between A⇔A sites does not existdue to the fact that there are only Fe3+ ions at the Asites, and any Fe2+ ions formed during the sintering pro-cess preferentially occupy the B sites only [37]. Thecharges migrate under the influence of the applied field,contributing to the electrical response of the system.The conductivity is an increasing function of fre-
quency in the case of conduction by hopping and adecreasing function of frequency in the case of bandconduction [38]. The conductivity of a semiconductormaterial s can be expressed as:
σ = σdc + σac. (14)
The first term (sdc) is the direct current [dc] conduc-tivity, which is due to band conduction, and it is fre-quency independent. The second term (sac) is the pureac conductivity, which is due to the hopping processesat the octahedral site. The ac conductivity follows theempirical formula of the frequency dependence given bythe ac power law [39]:
σ (ω) = Bωn, (15)
where B and n are constants which depend both ontemperature and composition; n is dimensionless,whereas B has units of electrical conductivity.In the present study, the conduction mechanism is
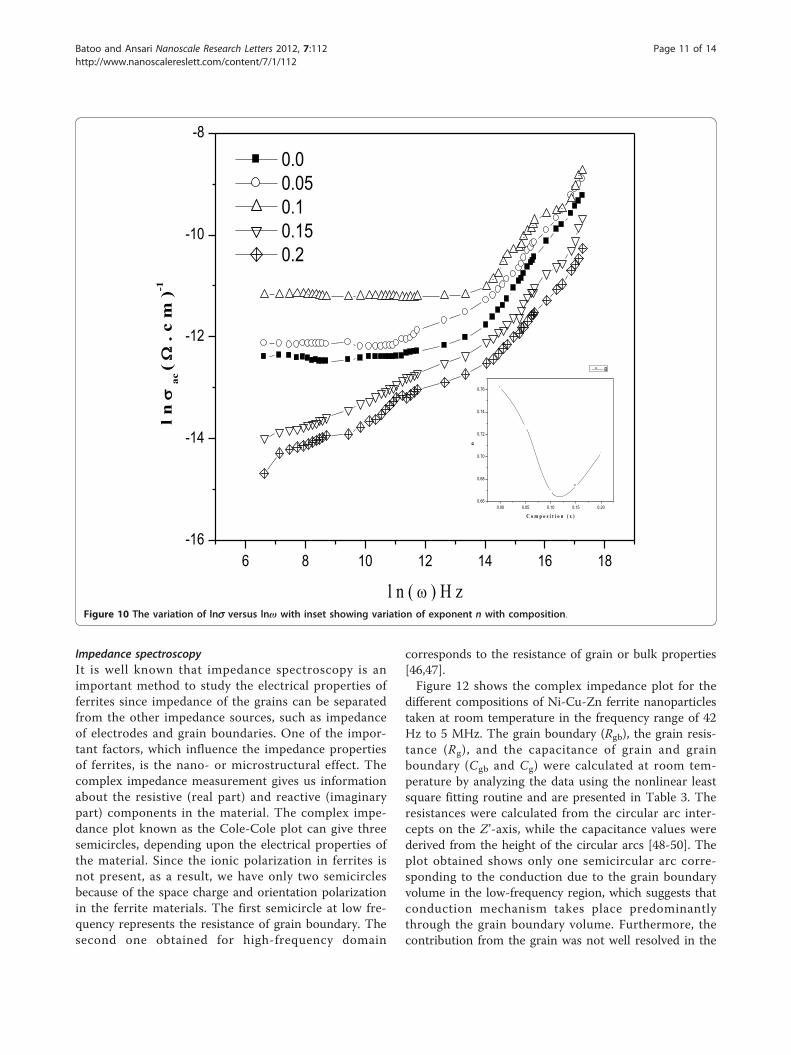
due to electron hopping between Fe2+⇔Fe3+ ions andhole hopping between Ni2+⇔Ni3+ at two adjacent Bsites. The charge exchange frequency increases withincreasing frequency of the applied field, but the chargeexchange mechanism does not follow the frequency ofapplied field beyond a certain frequency limit because athigh frequencies, the resistivity remains invariant withthe frequency, and as a result, the hopping frequency nolonger follows the changes of external field beyond acertain frequency limit and thus lags behind [36].Figure 10 shows the variation of ln s versus ln ω in
the frequency range of 42 Hz to 5 MHz at room tem-perature, with the inset showing the variation of expo-nent n with composition. The exponent n wascalculated as a function of composition by plotting ln sversus ln ω according to Equation 15, which representsstraight lines with the slope equal to the exponent nand the intercept equal to ln B on the vertical axis at lnω = 0. It is well known that n takes values between 0and 1. When n = 0, the electrical conduction is fre-quency independent or becomes the dc conduction, butwhen n > 0, the conduction is frequency dependent or
1 2 3 4 5 6 7
0
5
10
15
20
25
30
t a n
I o g ( f ) H z
0.0 0.05 0.1 0.15 0.2
Figure 8 The loss tangent (tanδ) variation with frequency at room temperature.
Batoo and Ansari Nanoscale Research Letters 2012, 7:112http://www.nanoscalereslett.com/content/7/1/112
Page 9 of 14
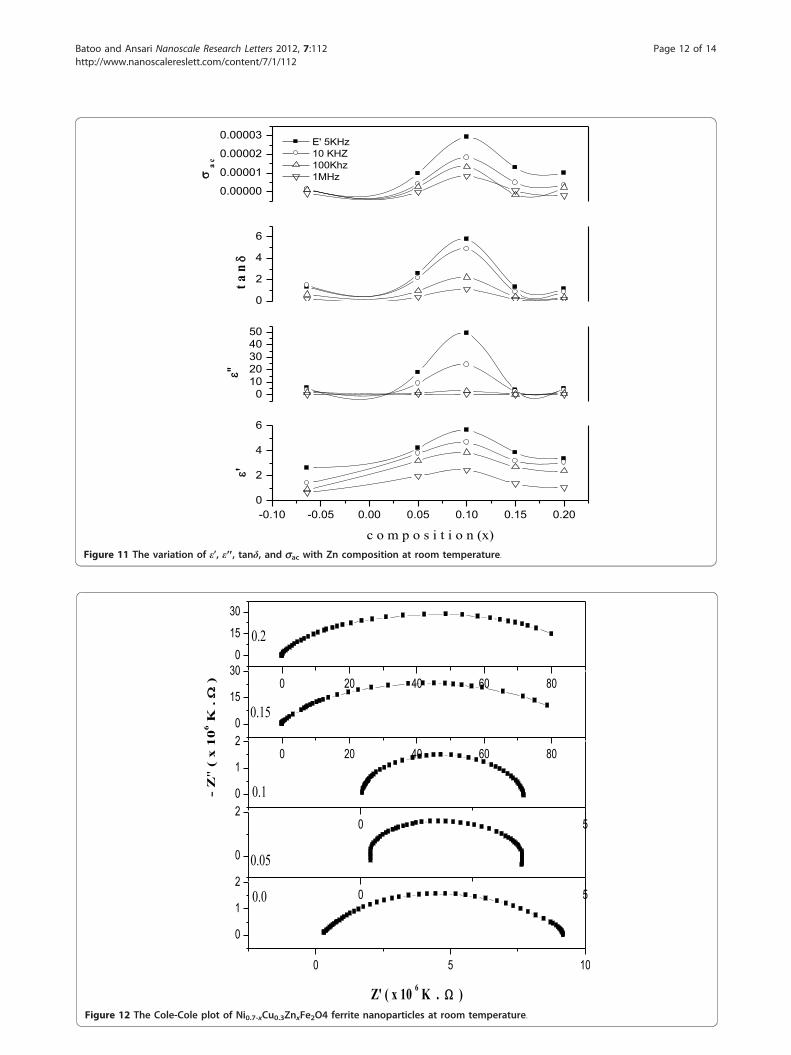
becomes the ac conduction [40]. In the present study,the value of n varies between 0.073 and 0.086, whichsuggests that the conduction phenomenon in the stu-died samples is ac conduction and is due to the hoppingof charges.Composition dependence of dielectric propertiesFigure 11 shows the variation of ε’, ε″, tanδ, and sac withcomposition at selected frequencies. All the investigatedelectrical parameters show their maximum value forNi0.6Cu0.3Fe2Zn0.1O4 composition. The composition-dependent behavior of the investigated samples can beexplained on the basis that Ni as well as Cu ferrites areinverse spinel in structure, and the degree of inversiondepends upon the heat treatment [41,42].In the investigated samples, the presence of Ni3+/Ni2+
ions leads to the formation of the p-type charge carriers,and their local displacement in the direction of appliedfield also contributes to net polarization, in addition tothe n-type charge carriers. However, the contribution ofthe p-type carriers is small as compared with the elec-tron exchange between Fe3+⇔Fe2+ and is directed oppo-site to the flow of the n-type carriers [43]. It is believedthat the hopping of electrons between Fe2+⇔Fe3+ (n-
type semiconductor) and the hopping of holes betweenNi3+⇔Ni2+ (p-type semiconductor) are responsible forthe conduction process and dielectric polarization of thestudied samples [44,45]. The maximum values of ε’, ε″,tanδ, and sac for x = 0.1 can be explained on the basisthat Zn2+ ions doped in the Ni-Cu ferrite occupy the Asites, where the Fe3+ ions present are forced to migratefrom the A sites to the B sites. The increase in numberof Fe3+ ions at the B sites increases the rate of hoppingwhich in turn increases the conductivity values for thecomposition x = 0.1, whereas the decrease in conductiv-ity beyond x = 0.1 may be explained on the basis thatfurther doping of Zn2+ ions beyond x = 0.1 replace theFe3+ ions at the B sites which depletes the number of Feions available for the conduction phenomena, hence, thedecrease in probability of following the exchange pro-cess:
Ni2+ + Fe3+ ↔ Ni3+ + Fe2+ (16)
Since dielectric polarization in ferrites is similar toelectrical conduction, it is therefore expected that thebehavior of ε’, ε″, and tanδ is similar to that of sac for x= 0.1.
1 2 3 4 5 6 7
0.0000
0.0002
ac (
.
c m
)-1
l o g ( f ) H z
0.0 0.05 0.1 0.15 0.2
Figure 9 The sac variation with frequency at room temperature.
Batoo and Ansari Nanoscale Research Letters 2012, 7:112http://www.nanoscalereslett.com/content/7/1/112
Page 10 of 14
Impedance spectroscopyIt is well known that impedance spectroscopy is animportant method to study the electrical properties offerrites since impedance of the grains can be separatedfrom the other impedance sources, such as impedanceof electrodes and grain boundaries. One of the impor-tant factors, which influence the impedance propertiesof ferrites, is the nano- or microstructural effect. Thecomplex impedance measurement gives us informationabout the resistive (real part) and reactive (imaginarypart) components in the material. The complex impe-dance plot known as the Cole-Cole plot can give threesemicircles, depending upon the electrical properties ofthe material. Since the ionic polarization in ferrites isnot present, as a result, we have only two semicirclesbecause of the space charge and orientation polarizationin the ferrite materials. The first semicircle at low fre-quency represents the resistance of grain boundary. Thesecond one obtained for high-frequency domain
corresponds to the resistance of grain or bulk properties[46,47].Figure 12 shows the complex impedance plot for the
different compositions of Ni-Cu-Zn ferrite nanoparticlestaken at room temperature in the frequency range of 42Hz to 5 MHz. The grain boundary (Rgb), the grain resis-tance (Rg), and the capacitance of grain and grainboundary (Cgb and Cg) were calculated at room tem-perature by analyzing the data using the nonlinear leastsquare fitting routine and are presented in Table 3. Theresistances were calculated from the circular arc inter-cepts on the Z’-axis, while the capacitance values werederived from the height of the circular arcs [48-50]. Theplot obtained shows only one semicircular arc corre-sponding to the conduction due to the grain boundaryvolume in the low-frequency region, which suggests thatconduction mechanism takes place predominantlythrough the grain boundary volume. Furthermore, thecontribution from the grain was not well resolved in the
6 8 10 12 14 16 18-16
-14
-12
-10
-8
0.00 0.05 0.10 0.15 0.200.66
0.68
0.70
0.72
0.74
0.76
n
C o m p o s i t i o n ( x )
B
l n
ac (
. c
m )
-1
l n ( ) H z
0.0 0.05 0.1 0.15 0.2
Figure 10 The variation of lns versus lnω with inset showing variation of exponent n with composition.
Batoo and Ansari Nanoscale Research Letters 2012, 7:112http://www.nanoscalereslett.com/content/7/1/112
Page 11 of 14
-0.10 -0.05 0.00 0.05 0.10 0.15 0.200
2
4
6
01020304050
0
2
4
6
0.00000
0.00001
0.00002
0.00003
'
c o m p o s i t i o n (x)
E' 5KHz 10 KHZ 100Khz 1MHz
"
t a n
a c
Figure 11 The variation of ε’, ε″, tanδ, and sac with Zn composition at room temperature.
0 5 10
0
1
20 5
0
20 5
0
1
20 20 40 60 80
0
15
300 20 40 60 80
0
15
30
Z' ( x 10 6 K . )
0.0
0.05
0.1
0.15
-
Z"
( x
10
6 K .
)
0.2
Figure 12 The Cole-Cole plot of Ni0.7-xCu0.3ZnxFe2O4 ferrite nanoparticles at room temperature.
Batoo and Ansari Nanoscale Research Letters 2012, 7:112http://www.nanoscalereslett.com/content/7/1/112
Page 12 of 14
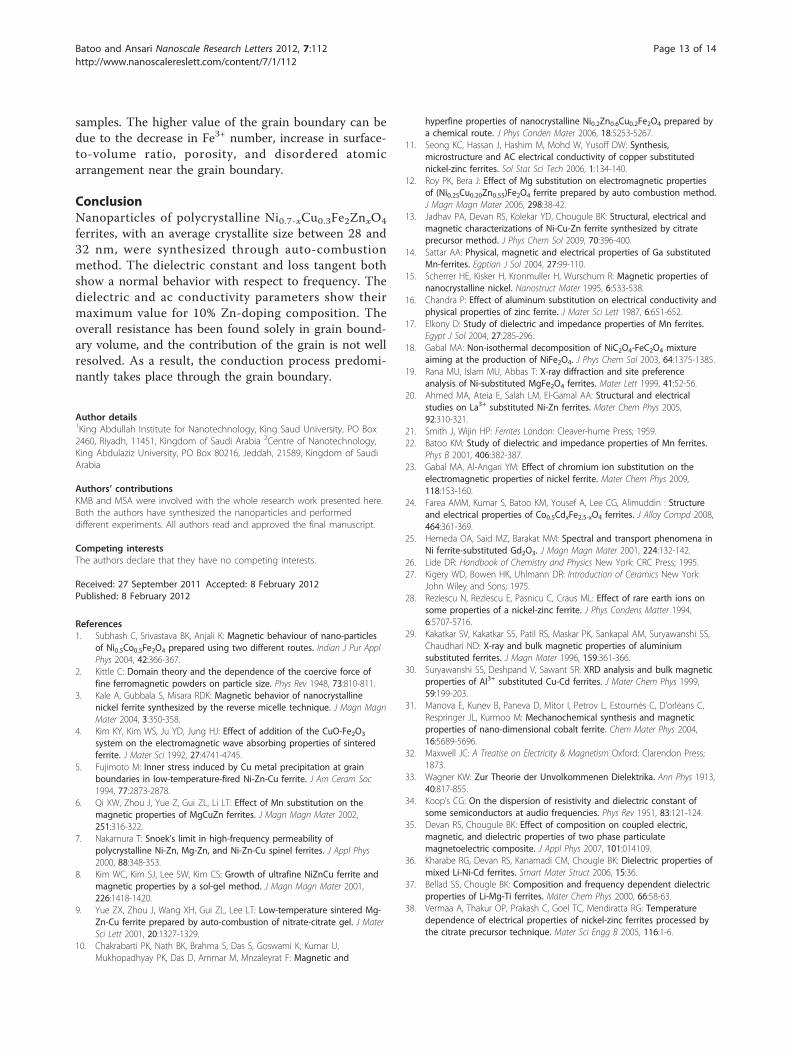
samples. The higher value of the grain boundary can bedue to the decrease in Fe3+ number, increase in surface-to-volume ratio, porosity, and disordered atomicarrangement near the grain boundary.
ConclusionNanoparticles of polycrystalline Ni0.7-xCu0.3Fe2ZnxO4
ferrites, with an average crystallite size between 28 and32 nm, were synthesized through auto-combustionmethod. The dielectric constant and loss tangent bothshow a normal behavior with respect to frequency. Thedielectric and ac conductivity parameters show theirmaximum value for 10% Zn-doping composition. Theoverall resistance has been found solely in grain bound-ary volume, and the contribution of the grain is not wellresolved. As a result, the conduction process predomi-nantly takes place through the grain boundary.
Author details1King Abdullah Institute for Nanotechnology, King Saud University, PO Box2460, Riyadh, 11451, Kingdom of Saudi Arabia 2Centre of Nanotechnology,King Abdulaziz University, PO Box 80216, Jeddah, 21589, Kingdom of SaudiArabia
Authors’ contributionsKMB and MSA were involved with the whole research work presented here.Both the authors have synthesized the nanoparticles and performeddifferent experiments. All authors read and approved the final manuscript.
Competing interestsThe authors declare that they have no competing interests.
Received: 27 September 2011 Accepted: 8 February 2012Published: 8 February 2012
References1. Subhash C, Srivastava BK, Anjali K: Magnetic behaviour of nano-particles
of Ni0.5Co0.5Fe2O4 prepared using two different routes. Indian J Pur ApplPhys 2004, 42:366-367.
2. Kittle C: Domain theory and the dependence of the coercive force offine ferromagnetic powders on particle size. Phys Rev 1948, 73:810-811.
3. Kale A, Gubbala S, Misara RDK: Magnetic behavior of nanocrystallinenickel ferrite synthesized by the reverse micelle technique. J Magn MagnMater 2004, 3:350-358.
4. Kim KY, Kim WS, Ju YD, Jung HJ: Effect of addition of the CuO-Fe2O3
system on the electromagnetic wave absorbing properties of sinteredferrite. J Mater Sci 1992, 27:4741-4745.
5. Fujimoto M: Inner stress induced by Cu metal precipitation at grainboundaries in low-temperature-fired Ni-Zn-Cu ferrite. J Am Ceram Soc1994, 77:2873-2878.
6. Qi XW, Zhou J, Yue Z, Gui ZL, Li LT: Effect of Mn substitution on themagnetic properties of MgCuZn ferrites. J Magn Magn Mater 2002,251:316-322.
7. Nakamura T: Snoek’s limit in high-frequency permeability ofpolycrystalline Ni-Zn, Mg-Zn, and Ni-Zn-Cu spinel ferrites. J Appl Phys2000, 88:348-353.
8. Kim WC, Kim SJ, Lee SW, Kim CS: Growth of ultrafine NiZnCu ferrite andmagnetic properties by a sol-gel method. J Magn Magn Mater 2001,226:1418-1420.
9. Yue ZX, Zhou J, Wang XH, Gui ZL, Lee LT: Low-temperature sintered Mg-Zn-Cu ferrite prepared by auto-combustion of nitrate-citrate gel. J MaterSci Lett 2001, 20:1327-1329.
10. Chakrabarti PK, Nath BK, Brahma S, Das S, Goswami K, Kumar U,Mukhopadhyay PK, Das D, Ammar M, Mnzaleyrat F: Magnetic and
hyperfine properties of nanocrystalline Ni0.2Zn0.6Cu0.2Fe2O4 prepared bya chemical route. J Phys Conden Mater 2006, 18:5253-5267.
11. Seong KC, Hassan J, Hashim M, Mohd W, Yusoff DW: Synthesis,microstructure and AC electrical conductivity of copper substitutednickel-zinc ferrites. Sol Stat Sci Tech 2006, 1:134-140.
12. Roy PK, Bera J: Effect of Mg substitution on electromagnetic propertiesof (Ni0.25Cu0.20Zn0.55)Fe2O4 ferrite prepared by auto combustion method.J Magn Magn Mater 2006, 298:38-42.
13. Jadhav PA, Devan RS, Kolekar YD, Chougule BK: Structural, electrical andmagnetic characterizations of Ni-Cu-Zn ferrite synthesized by citrateprecursor method. J Phys Chem Sol 2009, 70:396-400.
14. Sattar AA: Physical, magnetic and electrical properties of Ga substitutedMn-ferrites. Egptian J Sol 2004, 27:99-110.
15. Scherrer HE, Kisker H, Kronmuller H, Wurschum R: Magnetic properties ofnanocrystalline nickel. Nanostruct Mater 1995, 6:533-538.
16. Chandra P: Effect of aluminum substitution on electrical conductivity andphysical properties of zinc ferrite. J Mater Sci Lett 1987, 6:651-652.
17. Elkony D: Study of dielectric and impedance properties of Mn ferrites.Egypt J Sol 2004, 27:285-296.
18. Gabal MA: Non-isothermal decomposition of NiC2O4-FeC2O4 mixtureaiming at the production of NiFe2O4. J Phys Chem Sol 2003, 64:1375-1385.
19. Rana MU, Islam MU, Abbas T: X-ray diffraction and site preferenceanalysis of Ni-substituted MgFe2O4 ferrites. Mater Lett 1999, 41:52-56.
20. Ahmed MA, Ateia E, Salah LM, El-Gamal AA: Structural and electricalstudies on La3+ substituted Ni-Zn ferrites. Mater Chem Phys 2005,92:310-321.
21. Smith J, Wijin HP: Ferrites London: Cleaver-hume Press; 1959.22. Batoo KM: Study of dielectric and impedance properties of Mn ferrites.
Phys B 2001, 406:382-387.23. Gabal MA, Al-Angari YM: Effect of chromium ion substitution on the
electromagnetic properties of nickel ferrite. Mater Chem Phys 2009,118:153-160.
24. Farea AMM, Kumar S, Batoo KM, Yousef A, Lee CG, Alimuddin : Structureand electrical properties of Co0.5CdxFe2.5-xO4 ferrites. J Alloy Compd 2008,464:361-369.
25. Hemeda OA, Said MZ, Barakat MM: Spectral and transport phenomena inNi ferrite-substituted Gd2O3. J Magn Magn Mater 2001, 224:132-142.
26. Lide DR: Handbook of Chemistry and Physics New York: CRC Press; 1995.27. Kigery WD, Bowen HK, Uhlmann DR: Introduction of Ceramics New York:
John Wiley and Sons; 1975.28. Rezlescu N, Rezlescu E, Pasnicu C, Craus ML: Effect of rare earth ions on
some properties of a nickel-zinc ferrite. J Phys Condens Matter 1994,6:5707-5716.
29. Kakatkar SV, Kakatkar SS, Patil RS, Maskar PK, Sankapal AM, Suryawanshi SS,Chaudhari ND: X-ray and bulk magnetic properties of aluminiumsubstituted ferrites. J Magn Mater 1996, 159:361-366.
30. Suryawanshi SS, Deshpand V, Sawant SR: XRD analysis and bulk magneticproperties of Al3+ substituted Cu-Cd ferrites. J Mater Chem Phys 1999,59:199-203.
31. Manova E, Kunev B, Paneva D, Mitor I, Petrov L, Estournės C, D’orlėans C,Respringer JL, Kurmoo M: Mechanochemical synthesis and magneticproperties of nano-dimensional cobalt ferrite. Chem Mater Phys 2004,16:5689-5696.
32. Maxwell JC: A Treatise on Electricity & Magnetism Oxford: Clarendon Press;1873.
33. Wagner KW: Zur Theorie der Unvolkommenen Dielektrika. Ann Phys 1913,40:817-855.
34. Koop’s CG: On the dispersion of resistivity and dielectric constant ofsome semiconductors at audio frequencies. Phys Rev 1951, 83:121-124.
35. Devan RS, Chougule BK: Effect of composition on coupled electric,magnetic, and dielectric properties of two phase particulatemagnetoelectric composite. J Appl Phys 2007, 101:014109.
36. Kharabe RG, Devan RS, Kanamadi CM, Chougle BK: Dielectric properties ofmixed Li-Ni-Cd ferrites. Smart Mater Struct 2006, 15:36.
37. Bellad SS, Chougle BK: Composition and frequency dependent dielectricproperties of Li-Mg-Ti ferrites. Mater Chem Phys 2000, 66:58-63.
38. Vermaa A, Thakur OP, Prakash C, Goel TC, Mendiratta RG: Temperaturedependence of electrical properties of nickel-zinc ferrites processed bythe citrate precursor technique. Mater Sci Engg B 2005, 116:1-6.
Batoo and Ansari Nanoscale Research Letters 2012, 7:112http://www.nanoscalereslett.com/content/7/1/112
Page 13 of 14
39. In Proceedings of the International Conference on the Physics ofSemiconductors: 1962 July 16-20: Exeter. Edited by: Pollak M. London: TheInstitute of Physics and the Physical Society; .
40. Abo El Ata AM, El Nimra MK, Attia SM, El Kony D, Al-Hammadi AH: Studiesof AC electrical conductivity and initial magnetic permeability of rare-earth-substituted Li-Co ferrites. J Magn Magn Mater 2006, 297:33-43.
41. Al-Hiti M: AC electrical conductivity of Ni-Mg ferrites. J Phys D Appl Phys1996, 29:501-505.
42. Batoo KM, Kumar S, Lee CG, Alimuddin : Finite size effect and influence oftemperature on electrical properties of nanocrystalline Ni-Cd ferrites.Curr Appl Phys 2009, 9:1072-1078.
43. Balaji S, Selvan RK, Berchmans LJ, Angappan S, Suramanian K, Augustin CO:Combustion synthesis and characterization of Sn4+ substitutednanocrystalline NiFe2O4. Mater Sci Eng B 2005, 119:119-124.
44. Patankar KK, Mathe VL, Patil AN, Patil SA, Lotke SD, Kolekar YD, Joshi PB:Electrical conduction and magnetoelectric effect in CuFe1.8Cr0.2O4-Ba0.8Pb0.2TiO3 composites. J Electroceram 2001, 2:115-122.
45. Farea AMM, Kumar S, Batoo KM, Yousef A, Alimuddin : Influence offrequency, temperature and composition on electrical properties ofpolycrystalline Co0.5CdxFe2.5-xO4 ferrites. Phys B 2008, 403:684-701.
46. Batoo KM, Kumar S, Lee CG, Alimuddin : Influence of Al doping onelectrical properties of Ni-Cd nano ferrites. Curr Appl Phys 2009, 9:826-832.
47. Baruwati B, KumarRana R, Sunkara S, Manorma V: Further insights in theconductivity behaviour of nanocrysttaline NiFe2O4. J Appl Phys 2007,101:014302.
48. Inba H: Impedance measurement of single-crystalline and polycrystallinemanganese-zinc ferrites with various non-stoichiometries. J Mater Sci1997, 32:1867-1872.
49. Ponpandian N, Balaya P, Narayanasamy A: Electrical conductivity anddielectric behaviour of nanocrystalline NiFe2O4 spinel. J Phys CondensMater 2002, 14:3221-3237.
50. Bauerie JE: Study of solid electrolyte polarization by a complexadmittance method. J Phys Chem Solids 1969, 30:2657-2670.
doi:10.1186/1556-276X-7-112Cite this article as: Batoo and Ansari: Low temperature-fired Ni-Cu-Znferrite nanoparticles through auto-combustion method for multilayerchip inductor applications. Nanoscale Research Letters 2012 7:112.
Submit your manuscript to a journal and benefi t from:
7 Convenient online submission
7 Rigorous peer review
7 Immediate publication on acceptance
7 Open access: articles freely available online
7 High visibility within the fi eld
7 Retaining the copyright to your article
Submit your next manuscript at 7 springeropen.com
Batoo and Ansari Nanoscale Research Letters 2012, 7:112http://www.nanoscalereslett.com/content/7/1/112
Page 14 of 14
Copyright © 2022 FDOKUMEN