Low investment in sexual reproduction threatens plants adapted to phosphorus limitation
13
LETTER doi:10.1038/nature12733 Low investment in sexual reproduction threatens plants adapted to phosphorus limitation Yuki Fujita 1 , Harry Olde Venterink 2 , Peter M. van Bodegom 3 , Jacob C. Douma 4 , Gerrit W. Heil 5 , Norbert Ho ¨lzel 6 , Ewa Jabłon ´ ska 7 , Wiktor Kotowski 7 , Tomasz Okruszko 8 , Paweł Pawlikowski 7 , Peter C. de Ruiter 9 & Martin J. Wassen 10 Plant species diversity in Eurasian wetlands and grasslands depends not only on productivity but also on the relative availability of nutri- ents, particularly of nitrogen and phosphorus 1–4 . Here we show that the impacts of nitrogen:phosphorus stoichiometry on plant species richness can be explained by selected plant life-history traits, notably by plant investments in growth versus reproduction. In 599 Eurasian sites with herbaceous vegetation we examined the relationship between the local nutrient conditions and community-mean life-history traits. We found that compared with plants in nitrogen-limited commu- nities, plants in phosphorus-limited communities invest little in sexual reproduction (for example, less investment in seed, shorter flowering period, longer lifespan) and have conservative leaf economy traits (that is, a low specific leaf area and a high leaf dry-matter con- tent). Endangered species were more frequent in phosphorus-limited ecosystems and they too invested little in sexual reproduction. The results provide new insight into how plant adaptations to nutrient conditions can drive the distribution of plant species in natural eco- systems and can account for the vulnerability of endangered species. Species diversity is influenced both by overall nutrient availability and by nutrient stoichiometry—that is, how the ratio of available nutrients relates to their consumers’ requirements 5 . In terrestrial plant commu- nities the two nutrients that most frequently limit growth are nitrogen (N) and phosphorus (P) 6 . It has long been recognized that in sites that are N- or P-limited, the species assembly is different 5,6 ; this difference is also reflected in the occurrence of endangered species 1–3,7,8 , most of which are found in P-limited sites. The explanation of why these spe- cies are associated with P-limited sites may lie in their functional traits. In general, fast-growing species dominate in nutrient-rich environments, whereas slow-growing species dominate in nutrient-poor conditions 9,10 . With respect to the N:P stoichiometry, a number of studies indicate that low N:P-ratio environments favour fast-growing species with long roots, or species that fix N, whereas high N:P-ratio environments favour slow- growing species with specialized P uptake traits; for example, cluster roots, arbuscular mycorrhizae or high phosphatase activity 3,11–16 . The association between fast-growing species and low N:P ratios is also consistent with the growth rate hypothesis 17 , which states that a fast growth rate is enabled by high investment in P-rich RNA, resulting in relatively high leaf P concentrations and concomitant low N:P ratios. However, these particular traits do not necessarily explain differences in total species richness along N:P availability gradients and, more- over, it seems possible that the selection for these traits may depend on environmental conditions other than the relative availability of N and P. We looked for an explanation based on inherent plant life-history traits, particularly investments in growth versus reproduction. We had access to a large comparative data set, which enabled us to separate the effects of overall nutrient availability from those of N:P stoichiometry across many species. In addition, by linking our traits analysis to the Red List statuses of the species involved (Red Lists of seven different countries), we were able to assess the mechanisms that might account for why certain species are more vulnerable for extinction than others. 1 KWR Watercycle Research Institute, PO Box 1072, 3430 BB Nieuwegein, The Netherlands. 2 Plant Biology and Nature Management, Vrije Universiteit Brussel, Pleinlaan 2, 1050 Brussels, Belgium. 3 Department of Ecological Science, VU University Amsterdam, de Boelelaan 1085, 1081 HV Amsterdam, The Netherlands. 4 Centre for Crop Systems Analysis, Wageningen University, Droevendaalsesteeg 1, 6708PB Wageningen, The Netherlands. 5 Faculty of Science, Utrecht University, Princetonplein 5, 3584 CC Utrecht, The Netherlands. 6 Institute of Landscape Ecology, Faculty of Geosciences, University of Mu ¨ nster, Robert-Koch-Strasse 28, 48149 Mu ¨ nster, Germany. 7 Department of Plant Ecology and Environmental Conservation, Institute of Botany, University of Warsaw, Al. Ujazdowskie 4, Warsaw, Poland. 8 Warsaw University of Life Sciences, Faculty of Civil and Environmental Engineering, 02-722 Warsaw, Nowoursynowska 166, Poland. 9 Biometris, Wageningen University, PO Box 100, 6700 AC Wageningen, The Netherlands. 10 Environmental Sciences, Copernicus Institute of Sustainable Development, Faculty of Geosciences, Utrecht University, PO Box 80115, 3508 TC Utrecht, The Netherlands. 100 80 60 40 20 0 50 40 30 20 10 0 15 10 5 0 −1.5 −0.5 0.0 0.5 1.0 1.5 −1.5 −0.5 0.0 0.5 1.0 1.5 −1.5 −0.5 −1.0 −1.0 −1.0 0.0 0.5 1.0 1.5 Residual N:P ratio Number of species Residual N:P ratio Number of endangered species Residual N:P ratio Endangered species (%) a b c τ = 0.95 τ = 0.90 τ = 0.75 τ = 0.50 Figure 1 | Relationship between biodiversity indices of vascular plants and N:P ratio corrected for productivity effects. a–c, Tested biodiversity indices are the number of species (a), the number of endangered species (b), and the percentage of endangered species (c) (number of sites (n) 5 539). N:P ratio was corrected for the confounding effects of productivity by using the residual values of N:P ratio regressed by productivity (see Supplementary Discussion 1 and Extended Data Fig. 1). tth quantile regression functions (t 5 0.50, 0.75, 0.90, 0.95) are also shown. See Extended Data Fig. 2 for the 95% confidence intervals of the regression coefficients. The results were not biased by the selection of habitat types in our data set (Extended Data Fig. 3). 82 | NATURE | VOL 505 | 2 JANUARY 2014 Macmillan Publishers Limited. All rights reserved ©2014
-
Upload
independent -
Category
Documents
-
view
5 -
download
0
Transcript of Low investment in sexual reproduction threatens plants adapted to phosphorus limitation

LETTERdoi:10.1038/nature12733
Low investment in sexual reproduction threatensplants adapted to phosphorus limitationYuki Fujita1, Harry Olde Venterink2, Peter M. van Bodegom3, Jacob C. Douma4, Gerrit W. Heil5, Norbert Holzel6, Ewa Jabłonska7,Wiktor Kotowski7, Tomasz Okruszko8, Paweł Pawlikowski7, Peter C. de Ruiter9 & Martin J. Wassen10
Plant species diversity in Eurasian wetlands and grasslands dependsnot only on productivity but also on the relative availability of nutri-ents, particularly of nitrogen and phosphorus1–4. Here we show thatthe impacts of nitrogen:phosphorus stoichiometry on plant speciesrichness can be explained by selected plant life-history traits, notablyby plant investments in growth versus reproduction. In 599 Eurasiansites with herbaceous vegetation we examined the relationship betweenthe local nutrient conditions and community-mean life-history traits.We found that compared with plants in nitrogen-limited commu-nities, plants in phosphorus-limited communities invest little insexual reproduction (for example, less investment in seed, shorterflowering period, longer lifespan) and have conservative leaf economytraits (that is, a low specific leaf area and a high leaf dry-matter con-tent). Endangered species were more frequent in phosphorus-limitedecosystems and they too invested little in sexual reproduction. Theresults provide new insight into how plant adaptations to nutrientconditions can drive the distribution of plant species in natural eco-systems and can account for the vulnerability of endangered species.
Species diversity is influenced both by overall nutrient availability andby nutrient stoichiometry—that is, how the ratio of available nutrientsrelates to their consumers’ requirements5. In terrestrial plant commu-nities the two nutrients that most frequently limit growth are nitrogen(N) and phosphorus (P)6. It has long been recognized that in sites thatare N- or P-limited, the species assembly is different5,6; this differenceis also reflected in the occurrence of endangered species1–3,7,8, most of
which are found in P-limited sites. The explanation of why these spe-cies are associated with P-limited sites may lie in their functional traits.
In general, fast-growing species dominate in nutrient-rich environments,whereas slow-growing species dominate in nutrient-poor conditions9,10.With respect to the N:P stoichiometry, a number of studies indicate thatlow N:P-ratio environments favour fast-growing species with long roots,or species that fix N, whereas high N:P-ratio environments favour slow-growing species with specialized P uptake traits; for example, clusterroots, arbuscular mycorrhizae or high phosphatase activity3,11–16. Theassociation between fast-growing species and low N:P ratios is alsoconsistent with the growth rate hypothesis17, which states that a fastgrowth rate is enabled by high investment in P-rich RNA, resulting inrelatively high leaf P concentrations and concomitant low N:P ratios.However, these particular traits do not necessarily explain differencesin total species richness along N:P availability gradients and, more-over, it seems possible that the selection for these traits may depend onenvironmental conditions other than the relative availability of N andP. We looked for an explanation based on inherent plant life-historytraits, particularly investments in growth versus reproduction. We hadaccess to a large comparative data set, which enabled us to separate theeffects of overall nutrient availability from those of N:P stoichiometryacross many species. In addition, by linking our traits analysis to theRed List statuses of the species involved (Red Lists of seven differentcountries), we were able to assess the mechanisms that might accountfor why certain species are more vulnerable for extinction than others.
1KWR Watercycle Research Institute, PO Box 1072, 3430 BB Nieuwegein, The Netherlands. 2Plant Biology and Nature Management, Vrije Universiteit Brussel, Pleinlaan 2, 1050 Brussels, Belgium.3Department of Ecological Science, VU University Amsterdam, de Boelelaan 1085, 1081 HV Amsterdam, The Netherlands. 4Centre for Crop Systems Analysis, Wageningen University, Droevendaalsesteeg1, 6708PB Wageningen, The Netherlands. 5Faculty of Science, Utrecht University, Princetonplein 5, 3584 CC Utrecht, The Netherlands. 6Institute of Landscape Ecology, Faculty of Geosciences, University ofMunster, Robert-Koch-Strasse 28, 48149 Munster, Germany. 7Department of Plant Ecology and Environmental Conservation, Institute of Botany, University of Warsaw, Al. Ujazdowskie 4, Warsaw, Poland.8Warsaw University of Life Sciences, Faculty of Civil and Environmental Engineering, 02-722Warsaw, Nowoursynowska 166, Poland. 9Biometris, Wageningen University, PO Box 100, 6700 AC Wageningen,The Netherlands. 10Environmental Sciences, Copernicus Institute of Sustainable Development, Faculty of Geosciences, Utrecht University, PO Box 80115, 3508 TC Utrecht, The Netherlands.
100
80
60
40
20
0
50
40
30
20
10
0
15
10
5
0
−1.5 −0.5 0.0 0.5 1.0 1.5 −1.5 −0.5 0.0 0.5 1.0 1.5 −1.5 −0.5−1.0 −1.0 −1.0 0.0 0.5 1.0 1.5
Residual N:P ratio
Num
ber
of s
pec
ies
Residual N:P ratio
Num
ber
of e
ndan
gere
d s
pec
ies
Residual N:P ratio
End
ange
red
sp
ecie
s (%
)
a b cτ = 0.95τ = 0.90τ = 0.75τ = 0.50
Figure 1 | Relationship between biodiversity indices of vascular plants andN:P ratio corrected for productivity effects. a–c, Tested biodiversity indicesare the number of species (a), the number of endangered species (b), andthe percentage of endangered species (c) (number of sites (n) 5 539). N:P ratiowas corrected for the confounding effects of productivity by using the residual
values of N:P ratio regressed by productivity (see Supplementary Discussion 1and Extended Data Fig. 1). tth quantile regression functions (t 5 0.50, 0.75,0.90, 0.95) are also shown. See Extended Data Fig. 2 for the 95% confidenceintervals of the regression coefficients. The results were not biased by theselection of habitat types in our data set (Extended Data Fig. 3).
8 2 | N A T U R E | V O L 5 0 5 | 2 J A N U A R Y 2 0 1 4
Macmillan Publishers Limited. All rights reserved©2014

The data set consisted of 599 field plots in herbaceous ecosystems inEurasia, with data on plant species composition, aboveground produc-tivity of vascular plants as a proxy for overall nutrient availability, andthe N:P:potassium (K) ratio in the aboveground plant biomass as a proxyfor nutrient stoichiometry (See Supplementary Discussion 1). Sites con-sidered to be K-limited (n 5 60, based on N:K and K:P ratios1) wereexcluded from further analysis. Across the remaining part of the dataset (all N- and/or P- (co-)limited, n 5 539), species richness of vascularplants is highest at intermediate N:P ratios (N and P co-limitation;Fig. 1a), whereas the numbers of endangered species tend to be highestat higher N:P ratios (Fig. 1b) and the percentage of endangered species
rises as N:P ratios increase towards P limitation (Fig. 1c). For 446 her-baceous plant species occurring in the 539 plots, we retrieved 15 life-history plant traits related to nutrient acquisition, growth and reproductivestrategy (see Extended Data Table 1). After accounting for potentiallyconfounding effects of productivity on N:P ratio and community-meantrait values (see Extended Data Fig. 1), we found that plots with a highN:P ratio were significantly (P , 0.001) associated with the occurrenceof species with a small investment in sexual reproduction (such as lowseed number (Fig. 2f) and seed investment (Fig. 2g), late start of flower-ing (Fig. 2h), short flowering period (Fig. 2i), vegetative reproductionrather than reproduction by seeds (Fig. 2k, l), perennials rather than
Res
idua
l of
−1.0
0.0
1.0
−1
1
2
0
0
1
2
3
0
−0.6
−0.2
0.2
0.6
−5
5
10
15
20
−2
−1
−1.5 −0.5 0.5 1.5 0 0.2 0.4
−1.5 −0.5 0.5 1.5 0 0.2 0.4
−1.5 −0.5 0.5 1.5 0 0.2 0.4
−1.5 −0.5 0.5 1.5 0 0.2 0.4
−1.5 −0.5 0.5 1.5 0 0.2 0.4
Leaf
mas
sC
anop
y he
ight
SLA
LDM
C
Residual N:P
See
d m
ass
Variance
β = −0.049 NS
β = 0.069 NS
β = −0.323 ***
β = 0.42 ***
β = −0.057 NS
a
b
c
d
e
2
4
6
0
−2
−2
0
2
4
−1.0
0.0
1.0
2.0
−0.4
0.0
0.4
0.8
−0.5
0.0
0.5
1.0
−1.5 −0.5 0.5 1.5 0 0.2 0.4
−1.5 −0.5 0.5 1.5 0 0.2 0.4
−1.5 −0.5 0.5 1.5 0 0.2 0.4
−1.5 −0.5 0.5 1.5 0 0.2 0.4
−1.5 −0.5 0.5 1.5 0 0.2 0.4Residual N:P Variance
See
d n
umb
erS
eed
inve
stm
ent
Fl. s
tart
Fl. p
erio
dLa
tera
l sp
read
β = −0.403 ***
β = −0.408 ***
β = 0.329 ***
β = −0.499 ***
β = 0.061 NS
f
g
h
i
j
0
0
2
4
−4
−2
2
4
−4
−2
−2
6
0
2
4
0
2
4
−2
−2−1
0123
4
5
−1.5 −0.5 0.5 1.5 0 0.05 0.1
−1.5 −0.5 0.5 1.5 0 0.05 0.1
−1.5 −0.5 0.5 1.5 0 0.05 0.1
−1.5 −0.5 0.5 1.5 0 0.05 0.1
−1.5 −0.5 0.5 1.5 0 0.05 0.1Residual N:P Deviance
See
d r
epro
.V
eget
ativ
e re
pro
.Li
fesp
an
Pla
nt a
rchi
tect
ure
N fi
β = −0.193 ***
β = 0.209 ***
β = −0.172 ***
β = 0.07 NS
β = −0.238 ***
k
l
m
n
o
Figure 2 | Relationship between N:P ratios and community-mean traitvalues of herbaceous vascular plant species, after removing confoundingeffects of productivity. The residual values of N:P ratio (x axis) andcommunity-mean traits (y axis; Extended Data Fig. 4) regressed by productivitywere used (see Supplementary Discussion 1 and Extended Data Fig. 1).a–o, The 15 traits tested are canopy height (a, number of sites (n) 5 530), leafmass (b, n 5 525), specific leaf area (c, n 5 529), leaf dry matter content(d, n 5 525), seed mass (e, n 5 533), seed number per shoot (f, n 5 524), seedinvestment (g, n 5 523), month flowering started (h, n 5 528), floweringperiod (i, n 5 528), lateral spread (j, n 5 526), reproduction by seeds(k, n 5 528), vegetative reproduction (l, n 5 528), lifespan (m, n 5 531), plantarchitecture (n, n 5 533), and N fixation (o, n 5 502). Extended Data Table 1
gives abbreviations and trait units. Linear regression models are shown, plustheir standardized coefficient values (b) and two-tailed P values of thecoefficients (***P , 0.001; NS, not significant). Bar graphs show fractionof variance (for continuous traits) or deviance (for binary traits) ofcommunity-mean trait values explained by productivity and N:P ratio.Variances in community-mean trait values are separated into unique effectsof productivity (green) and N:P ratio (purple), and shared effects ofproductivity and N:P ratio (grey). Negative shared effects indicate that the traitis suppressed by interaction between productivity and N:P ratio. For thesetraits, total variance explained (dotted lines) is smaller than the sum of uniqueeffects of N:P ratio and productivity.
LETTER RESEARCH
2 J A N U A R Y 2 0 1 4 | V O L 5 0 5 | N A T U R E | 8 3
Macmillan Publishers Limited. All rights reserved©2014

annuals or biennials (Fig. 2m)) and less association with N fixers (Fig. 2o).Species occurring at high N:P ratio plots also had leaf traits characteristicof slow-growing species, such as low specific leaf area (SLA) (Fig. 2c)and high leaf dry-matter content (LDMC) (Fig. 2d). Some traits (suchas canopy height, leaf mass and plant architecture (monocot or eudicot))correlated strongly (P , 0.001) with productivity but not (P . 0.05)with N:P ratio, as shown by a dominant contribution of productivity totheir explained variance (Fig. 2a, b, n). The relationships between N:Pratio and particular plant traits also became apparent when species wereclassified into ‘strategies’ according to a previous paper18; that is, the N:Pratios correlated positively with abundance of ‘stress tolerators’ (P , 0.001),correlated negatively with abundance of ‘ruderals’ (P , 0.001), and werenot significantly correlated with abundance of ‘competitors’ (P . 0.05)(Fig. 3). Furthermore, a principal component analysis (PCA) indicatedthat the trade-off between seed and vegetative reproduction was stronglycorrelated (P , 0.001) with N:P ratio, with the unique effect of N:P ratiobeing stronger (21% of variation explained) than that of productivity(9% of variation explained), a finding that confirmed the robustness ofour analysis (See Supplementary Discussion 2).
We found three contrasting but not mutually exclusive relationshipsbetween nutrient availability or stoichiometry and life-history planttraits. First, overall nutrient availability—but not N:P stoichiometry—is related to traits involved in competition for light (for example, plantsize, ‘competitor’ strategy). Second, both N:P stoichiometry and overallnutrient availability are related to leaf economy traits (for example, specificleaf area, leaf dry-matter content). Previous studies have shown thatleaf economy traits are related to overall nutrient availability17,19, butour results show that fast-growing species also have an affinity for lowN:P ratio environments, independently of the overall nutrient availa-bility effect. Third, N:P stoichiometry is related to investment in sexualreproduction almost independently of overall nutrient availability; that
is, high N:P conditions (P limitation) correlated with low investment insexual reproduction. Such low investment restricts P losses, since repro-ductive organs are P-rich20. Classical allocation studies have shown thatplants can invest up to 50 to 60% of all acquired P in sexual reproduc-tion, and that this percentage is generally higher for P than for N andother elements21,22. Impaired investment in sexual reproduction underP limitation is also supported by experimental data23. An alternativestrategy for a plant is to produce few seeds in order to maintain a highP concentration per seed, which is an important factor for successfulrecruitment in P-impoverished soils24.
Our study clearly shows that endangered species have different suitesof functional traits than non-endangered species (permutational multi-variate analysis of variance (PERMANOVA), F1,281 5 2.67, P , 0.05).Compared with non-endangered species, they have a lower canopy height,less investment in sexual reproduction (fewer seeds and smaller seed massper individual), a shorter flowering period and a later starting time offlowering, and are perennials rather than annuals (all differences signi-ficant at least at the P , 0.05 level) (Fig. 4). The lower reliance of endan-gered species on seed reproduction is also seen in the PCA axis scores(Supplementary Discussion 2), and confirms the findings of previous
0
−0.2
0.0
0.2
0.4
−0.2
0.2
0.4
−0.2
0.0
0.2
0.4
−1.5 −0.5 0.5 1.5 0 0.2 0.4
−1.5 −0.5 0.5 1.5 0 0.2 0.4
−1.5 −0.5 0.5 1.5 0 0.2 0.4VarianceResidual N:P
C s
core
S s
core
Res
idua
l of
R s
core
β = −0.029 NS
β = 0.46 ***
β = −0.47 ***
a
b
c
Figure 3 | Relationship between N:P ratios and community-mean values forC, S and R scores of CSR strategy after removing confounding effects ofproductivity. a, C (competitor) scores. b, S (stress tolerator) scores. c, R(ruderal) scores. Confounding effects of productivity were removed using theresidual values of N:P ratio (x axis) and community-mean CSR scores (y axis)regressed by productivity. Number of sites (n) 5 528; see Fig. 2 legend forfigure specifications.
R score
S score
C score
Fl. period
Fl. start
Seedinvestment
Seed number
Seed mass
LDMC
SLA
Leaf mass
Canopyheight
N fixing
Plant architecture
Lifespan
Vegetativerepro.
Seed repro.
−0.6 −0.4 −0.2 0.0 0.2 0.4 0.6
−2 −1 0 1 2
Cohen’s d
Log-odds ratio
Figure 4 | Difference in trait values between endangered and non-endangered herbaceous vascular plant species. The difference was expressedwith Cohen’s d for continuous traits, and with log-odds ratios for binary traits.The number of endangered versus non-endangered species examined are(from top to bottom); 150/267, 123/237, 128/246, 121/239, 126/243, 113/226,101/223, 153/265, 153/265, 149/259, 149/259, 149/259, 149/253, 149/253,155/268, 152/281 and 157/289. Positive values of Cohen’s d or log-odds ratiosindicate that endangered species have higher trait values. 95% confidenceintervals are shown as whiskers. Lateral spread, for which effect size could notbe calculated, was not significantly different between endangered andnon-endangered species (two-tailed Mann–Whitney U-test, P . 0.05).
RESEARCH LETTER
8 4 | N A T U R E | V O L 5 0 5 | 2 J A N U A R Y 2 0 1 4
Macmillan Publishers Limited. All rights reserved©2014

studies comparing common with endangered or rare species (for example,a shorter flowering period25, smaller seed mass26 and poorer dispersalability27,28).
Endangered species occur more frequently under P-limited condi-tions (high N:P ratio environments) than can be explained by chance,as shown for temperate regions in our data set and in a previously studiedmuch more limited data set2 as well as for a tropical region8. Our traitanalysis provides two possible explanations for the frequent occur-rence of endangered species in P-limited conditions. The first is thatendangered species are often small and are therefore poor competitorsfor light. Small size is a major disadvantage when growing in produc-tive sites, but on poorly productive sites, which are associated with ahigh plant N:P ratio (see Supplementary Discussion 1), they face littlecompetition. Second, the relatively low investment of endangered speciesin sexual reproduction is characteristic of plant species under P limi-tation (high N:P ratio environments). Thus, both increased productivityof ecosystems and changed N:P stoichiometry potentially threaten thesurvival of such species; moreover, their low dispersal capacity makesthem vulnerable to such threats. The idea that endangered species arevulnerable for changes in the relative availabilities of N and P is sup-ported by a global study showing that species with a narrow geogra-phical range (that is, those more likely to become endangered) havehigher leaf N:P ratios than those with a wide range29. The exact mecha-nisms and potentially interacting processes that may explain why speciesvulnerable for extinction occur on P-limited sites need to be tested further.However, it is likely that large-scale P enrichment of herbaceous eco-systems that boosts productivity and ends P limitation causes speciesadapted to P limitation to be more vulnerable to extinction. Moreover,the low investment in sexual reproduction of these species, which is abeneficial trait in P-poor environments, is a drawback for their dis-persal ability. N fertilization will probably not promote survival ofendangered species, as there are a number of mechanisms for increas-ing P uptake from diverse forms of P in soil (for example, root exudates,mycorrhizae) under N-rich conditions30, and therefore P limitation mightnot be enhanced by N enrichment. Instead, to better protect endan-gered species, we should aim to preserve P-limited and poorly pro-ductive sites. Given that these sites are already scarce and scattered,that landscapes are increasingly human-influenced and urbanized,and that endangered species have less sexual reproduction (and so aredisadvantaged in long-distance dispersal), it is clear that these species’vulnerability for extinction is acute.
METHODS SUMMARYSpecies composition of vascular plants, their aboveground biomass (as a proxy forsite productivity), and N:P:K ratio in the biomass (as a proxy for relative availa-bility of N, P and K for plants) were recorded in 599 plots in herbaceous ecosystems.The selected ecosystems range from wet to moist conditions and include grass-lands, fens, bogs, marshes, reedland, floodplains and dune slacks in nine countriesin Eurasia. As N:P stoichiometry is our focus, K-limited plots (N:K ratio .2.1 andK:P ratio ,3.41; n 5 60) were excluded from further analysis. Of the total 491vascular plant species recorded, 172 endangered species were identified from thecombined Red Lists of seven of the countries. We examined the effects of N:P ratioon biodiversity indices (number of species, number and percentage of endangeredspecies) and community-mean values of 15 functional traits and Grime’s CSR(competitor, stress tolerator, ruderal) strategy of 446 herbaceous species retrievedfrom trait databases (see Extended Data Table 1). In all analyses, the confoundingeffects of productivity on the variables of interest were statistically removed (ExtendedData Fig. 1). For the effects of N:P ratio on biodiversity indices, quantile regressionanalysis was carried out between N:P ratios (corrected for productivity) and bio-diversity indices for the 0.50 to 0.95 quantiles. The impact of N:P ratio on community-mean trait values (both corrected for productivity) was tested using path analysis,and the relative contributions of productivity and N:P ratio to community-meantrait values were quantified by partitioning the explained variance of traits to uniqueand shared effects of productivity and N:P ratio. Furthermore, differences betweenendangered and non-endangered species in terms of their functional trait composi-tion were examined with a PERMANOVA. In addition, for each of 15 traits and CSRstrategy, the differences between endangered and non-endangered species wereexamined by Cohen’s d for continuous traits and log-odds ratio for binary traits.
Online Content Any additional Methods, Extended Data display items and SourceData are available in the online version of the paper; references unique to thesesections appear only in the online paper.
Received 15 July; accepted 3 October 2013.
Published online 17 November 2013.
1. Olde Venterink, H., Wassen, M. J., Verkroost, A. W. M. & de Ruiter, P. C. Speciesrichness–productivity patterns differ between N-, P-, and K- limited wetlands.Ecology 84, 2191–2199 (2003).
2. Wassen, M. J., Olde Venterink, H., Lapshina, E. D. & Tanneberger, F. Endangeredplants persist under phosphorus limitation. Nature 437, 547–550 (2005).
3. Ceulemans, T., Merckx, R., Hens, M. & Honnay, O. A trait-based analysis of the roleof phosphorus vs. nitrogen enrichment in plant species loss across North-westEuropean grasslands. J. Appl. Ecol. 48, 1155–1163 (2011).
4. Klaus, V. H. et al. Nutrient concentrations and fibre contents of plant communitybiomass reflect species richness patterns along a broad range of land-useintensities among agricultural grasslands. Persp. Plant Ecol. Evol. System. 13,287–295 (2011).
5. Cardinale, B. J., Hillebrand, H., Harpole, W. S., Gross, K. & Ptacnik, R. Separating theinfluence of resource ‘availability’ from resource ‘imbalance’ on productivity–diversity relationships. Ecol. Lett. 12, 475–487 (2009).
6. Elser, J. J. et al. Global analysis of nitrogen and phosphorus limitation of primaryproducers in freshwater, marine and terrestrial ecosystems. Ecol. Lett. 10,1135–1142 (2007).
7. Olde Venterink, H., Wassen, M. J., Belgers, D. M. & Verhoeven, J. T. A. Control ofenvironmental variables on species density in fens and meadows: importance ofdirect effects and effects through community biomass. J. Ecol. 89, 1033–1040(2001).
8. Lannes, L. S., Bustamante, M. M. C., Edwards, P. J. & Olde Venterink, H. Alienand endangered plants in the Brazilian Cerrado exhibit contrasting relationshipswith vegetation biomass and N:P stoichiometry. New Phytol. 196, 816–823(2012).
9. Lambers, H. & Poorter, H. Inherent variation in growth rate between higher plants:a search for physiological causes and ecological consequences. Adv. Ecol. Res. 23,187–261 (1992).
10. Aerts, R. & Chapin III, F. S. The mineral nutrition of wild plants revisited:a re-evaluation of processes and patterns. Adv. Ecol. Res. 30, 1–67 (2000).
11. Gusewell, S. Nutrient resorption of wetland graminoids is related to the type ofnutrient limitation. Funct. Ecol. 19, 344–354 (2005).
12. Gusewell, S. High nitrogen: phosphorus ratios reduce nutrient retention andsecond-year growth of wetland sedges. New Phytol. 166, 537–550 (2005).
13. Lambers, H., Raven, J. A., Shaver, G. R. & Smith, S. E. Plant nutrient-acquisitionstrategies change with soil age. Trends Ecol. Evol. 23, 95–103 (2008).
14. Olde Venterink, H. & Gusewell, S. Competitive interactions between two meadowgrasses under nitrogen and phosphorus limitation. Funct. Ecol. 24, 877–886(2010).
15. Fujita, Y., Robroek, B. J. M., de Ruiter, P. C., Heil, G. W. & Wassen, M. J. Increased Naffects P uptake of eight grassland species: the role of root surface phosphataseactivity. Oikos 119, 1665–1673 (2010).
16. Olde Venterink, H. Does phosphorus limitation promote species-rich plantcommunities? Plant Soil 345, 1–9 (2011).
17. Elser, J. J. et al. Biological stoichiometry from genes to ecosystems. Ecol. Lett. 3,540–550 (2000).
18. Grime, J. P., Hodgson, J. G. & Hunt, R. Comparative Plant Ecology: a FunctionalApproach to Common British Species. (Castlepoint Press, 2007).
19. Ordonez, J. C. et al. A global study of relationships between leaf traits,climate and soil measures of nutrient fertility. Glob. Ecol. Biogeogr. 18, 137–149(2009).
20. Kerkhoff, A. J., Fagan,W. F., Elser, J. J. & Enquist, B. J. Phylogenetic and growth formvariation in the scaling of nitrogen and phosphorus in the seed plants. Am. Nat.168, E103–E122 (2006).
21. Fenner, M. The allocation of minerals to seeds in Senecio vulgaris plants subjectedto nutrient shortage. J. Ecol. 74, 385–392 (1986).
22. Van Andel, J. & Vera, F. Reproductive allocation in Senecio Sylvaticus andChamaenerion Angustifolium in relation to mineral nutrition. J. Ecol. 65, 747–758(1977).
23. Vergeer, P., Rengelink, R., Joop Ouborg, N. & Roelofs, J. G. M. Effects of populationsize and genetic variation on the response of Succisa pratensis to eutrophicationand acidification. J. Ecol. 91, 600–609 (2003).
24. Lambers, H., Brundrett, M. C., Raven, J. A. & Hopper, S. D. Plant mineralnutrition in ancient landscapes: high plant species diversity on infertile soils islinked to functional diversity for nutritional strategies. Plant Soil 334, 11–31(2010).
25. Lahti, T., Kemppainen, E., Kurtto, A. & Uotila, P. Distribution and biologicalcharacteristics of threatenedvascularplants inFinland. Biol. Conserv.55, 299–314(1991).
26. Murray, B. R., Thrall, P. H., Gill, A. M. & Nicotra, A. B. How plant life-history andecological traits relate to species rarity and commonness at varying spatial scales.Austral Ecol. 27, 291–310 (2002).
27. Kunin, W. E. & Gaston, K. J. The biology of rarity—patterns, causes andconsequences. Trends Ecol. Evol. 8, 298–301 (1993).
28. Farnsworth, E. J. & Ogurcak, D. E. Functional groups of rare plants differ in levels ofimperilment. Am. J. Bot. 95, 943–953 (2008).
LETTER RESEARCH
2 J A N U A R Y 2 0 1 4 | V O L 5 0 5 | N A T U R E | 8 5
Macmillan Publishers Limited. All rights reserved©2014

29. Elser, J. J., Fagan, W. F., Kerkhoff, A. J., Swenson, N. G. & Enquist, B. J. Biologicalstoichiometryofplantproduction: metabolism, scalingandecological response toglobal change. New Phytol. 186, 593–608 (2010).
30. Vance, C. P., Uhde-Stone, C. & Allan, D. L. Phosphorus acquisition and use: criticaladaptations by plants for securing a nonrenewable resource. New Phytol. 157,423–447 (2003).
Supplementary Information is available in the online version of the paper.
Acknowledgements We would like to thank N. A. Soudzilovskaia for obtaining theRussian Red List of plant species, M. Soons, D. Ertsen and D. van der Goes forpermission to use their vegetation records, T. Markus and M. Stoete for drawing figuresand J. Burrough for editing the near-final draft. Y.F. was funded by the Utrecht Centre of
Geosciences, and the research in the Rospuda river valley was financed by the PolishMinistry of Science and Higher Education Grant no. N304 010 31/0414.
Author Contributions Y.F., H.O.V., N.H., E.J., W.K., P.P., T.O. and M.J.W. collected data;Y.F., H.O.V., P.M.v.B., J.C.D. and M.J.W analysed data; Y.F., H.O.V., P.M.v.B., P.C.d.R. andM.J.W. wrote the manuscript; J.C.D., G.W.H., N.H., E.J., W.K., P.P. and T.O. commented onthe manuscript; P.C.d.R., G.W.H. and M.J.W. were project leaders.
Author Information Reprints and permissions information is available atwww.nature.com/reprints. The authors declare no competing financial interests.Readers are welcome to comment on the online version of the paper.Correspondence and requests for materials should be addressed to M.J.W.([email protected]).
RESEARCH LETTER
8 6 | N A T U R E | V O L 5 0 5 | 2 J A N U A R Y 2 0 1 4
Macmillan Publishers Limited. All rights reserved©2014

METHODSPlot selection. We collected vegetation data on 599 plots from herbaceous eco-systems, including the 276 sites studied in ref. 2. The sample consists of grasslands,fens, bogs, marshes, reed beds and dune-slack vegetation. All plots are non-brackish,with moist to wet conditions, thus impacts of drought and salinity on species rich-ness were avoided. Only 19 plots are lightly fertilized (#100 kg N ha21 yr21), and102 plots are exposed to periodic river flooding. All plots are dominated by herba-ceous species (.50% cover). The plots were selected to span a wide geographicalrange of Eurasian countries: The Netherlands (255 plots), Poland (153), Russia(82), Germany (43), Belgium (20), Iceland (17), Sweden (10), Scotland (10) andBelarus (9). These plots encompass most of the west and central European low-lands. The flora in the country-wise partial data sets we collected is similar: onaverage, 86% (and a minimum of 70%) of the species recorded in any country hadalso been recorded in the other countries. For each plot, aboveground standingbiomass of vascular plants was harvested at the peak of the growing season; that is,from June to August. The harvested area ranged from 0.06 m2 to 1 m2. The contentof N, P and K in the biomass was analysed after Kjeldahl digestion31. Compositionof vascular plant species was recorded in or around the harvested area in plots of0.06 to 25 m2. The different plot sizes did not affect the relationships betweenbiodiversity and N:P stoichiometry (see Supplementary Discussion 3).Functional characteristics of species. Per species, we quantified those functionaltraits available in trait databases32–38 for most of the recorded plant species that areknown to be important for the growth or reproduction strategies of herbaceousplant species39 (See Extended Data Table 1 for an overview of traits, units andsources). We excluded woody species (45 species out of the total 491 species) fromthe trait analysis, as most woody species recorded in our plots were seedlings andtherefore the trait values available in databases (which are for adult individuals) arenot relevant. The selected traits were those related to competition for light (canopyheight, leaf mass), leaf economy traits (specific leaf area (SLA), leaf dry-mattercontent (LDMC)), seed traits (seed mass, number of seeds per individual, seedinvestment (that is, seed mass per individual, calculated as seed mass times numberof seeds per individual)), phenology traits (starting month of flowering, duration offlowering period), reproduction strategy traits (lateral spread, type of reproduc-tion, plant lifespan), a plant architecture trait (that is, eudicots or monocots), and anutrient acquisition trait (N fixation) (Extended Data Table 1). We note that seedinvestment is a trait that may be biased by the size of the plant. However, even whenwe corrected seed investment roughly for plant size, the relationship between N:Pratio and this trait did not change (Supplementary Discussion 4). Duration offlowering period (expressed in months) and starting month of flowering (rangingfrom January to August, and thus coded 1 to 8) were treated as continuous vari-ables. All continuous traits except LDMC and starting month of flowering werelog-transformed to adjust the right-skewed frequency distributions. Type of repro-duction, expressed on an ordinal scale with five classes, was converted into twobinary variables (reproduction by seeds and vegetative reproduction) to be used insubsequent analyses. Additionally, the CSR strategy18 was attributed to each speciesby using seven traits (canopy height, LDMC, leaf mass, SLA, flowering period,starting month of flowering, and lateral spread) according to a method describedpreviously40. When this method could not be applied because trait informationwas incomplete, the CSR classification in BioFlor36 was used. Ultimately, CSRclasses were defined for 408 out of 446 herbaceous species. For each species, scoresfor each primary component (C, competitor; S, stress tolerator; R, ruderal) wereassigned from its proportional contributions (for example, C scores are 1 for thestrategy ‘C’, 0.5 for ‘CS’, 0.33 for ‘CSR’ and 0.75 for ‘C/CR’41). In addition, we useda principal component analysis (PCA) to identify the major axes of variation inmultiple functional traits (see Supplementary Discussion 2).
For each plot, community-mean values (unweighted for the abundance of species)of continuous traits were calculated as an indicator of the mean response of theplant community to the site conditions. We treated the community-mean valuesof lateral spread, an ordinal trait, in the same way as those of continuous traits,because they were approximately normally distributed. For binary traits, the numberof species with 1s and 0s were counted per plot. Plots with fewer than three specieswith a valid trait value, and plots in which less than 50% of occurring herbaceousspecies had a valid trait value, were omitted from the analysis. The omitted plotsranged from 6 to 16 plots (average 10.7 plots) of the total (539 plots).Endangered species. We compiled a list of endangered species by combining theregional Red Lists of the Netherlands42, Germany43, Poland44, Sweden45, UK46,Iceland47 and the Novosibirsk region in Siberia48. The Red List of Belgium wasnot included, because the Belgian plots were near the border with the Netherlandsand their flora was comparable with the flora in the Dutch plots. We also did notuse the list of Belarus, because the number of plots in this country was small(n 5 9) and the flora in these plots overlapped with those of Poland. The RedList status of a species reflects both the decline of the habitat in the region and thesusceptibility of the species to the changing environment. Some species are Red
Listed in one country but not in others, because in those countries their habitat isnot deteriorating. For our analysis, only the susceptibility of an endangered speciesis relevant, not the region-specific habitat deterioration, because we are interestedin the mechanisms whereby species become endangered (that is, their functionaltraits). Therefore, we identified a species as ‘endangered’ if it is on at least oneregional Red List (meaning that this species has fragile characteristics that aresusceptible to environmental changes), and applied this new list to all plots. In thisway we corrected for habitat loss, which is largely region-specific. Note that we includedthe categories which refer to actual decline of the species (‘critically endangered’,‘endangered’ and ‘vulnerable’ species), but not the category which refers to the scar-city of the species (‘rare’). In this way, we excluded species which are always rareirrespective of environmental change. Of our 491 vascular plant species, we iden-tified 172 endangered species (157 herbaceous and 15 non-herbaceous species). Foreach plot, we counted number and percentage of endangered species. The latter isthe number of endangered species divided by the total number of species (3100)per plot.Data analysis approach. We are interested in the effects of nutrient stoichiometry(that is, the ratio between N and P availability for plants) on species diversity andon prevailing functional traits of species in plant communities, irrespective ofconfounding effects of overall nutrient availability. We use N:P ratios of above-ground plant biomass as a proxy for nutrient stoichiometry (see SupplementaryDiscussion 1 for a justification of using plant N:P ratio), and site productivity (thatis, aboveground biomass of vascular plants) as a proxy for overall nutrient avail-ability. As the consideration of N:P ratio is relevant only when a plot is limited orco-limited by N or P, we excluded K-limited plots (n 5 60) from the analysis. Weconsidered a plot as K-limited if the N:K ratio was more than 2.1 and the K:P ratiowas less than 3.4 (ref. 1).
We propose the following relationships between plant N:P ratio, site produc-tivity, species diversity and community-mean species traits (see also Extended DataFig. 1). Plant N:P ratio and site productivity are related through a scaling law proposedby the growth rate hypothesis29,49 (arrow a in Extended Data Fig. 1): plants grownin fertile environments (these tend to be fast-growing species) exhibit low biomassN:P ratios because of the high amount of P-rich RNA needed for rapid division ofcells50,51 (see Supplementary Discussion 1 for more details). We are aware of theopposite direction of effect too (that is, N:P ratio influencing site productivity),particularly at extreme values of N:P ratios, where a deficiency of N or P limits siteproductivity, but we consider this effect to be minor. Furthermore, we posit thatboth species diversity and community-mean trait values are influenced by site pro-ductivity and N:P ratio. However, there is an intrinsic difference between howthese drivers affect species richness and how they affect community-mean traits.Site productivity and N:P ratio ‘filter’ the community-mean traits (arrows e and d,respectively, in Extended Data Fig. 1b), acting on the mean of the community-mean trait values. In contrast, site productivity and N:P ratio ‘limit’ species diver-sity (arrows c and b, respectively, in Extended Data Fig. 1a), acting on the uppervalues of species diversity. Given the different nature of the relationships, weemployed two sets of methods to eliminate potential confounding factors fromour analysis. All analyses were performed in R52.Effects of N:P ratio on species diversity. A relationship between a dependentvariable (species diversity) and one or more limiting factors (site productivity andN:P ratio) can be tested with quantile regression analysis. Unlike conventionalregression, which considers solely changes in the mean of the response variable,quantile regression excludes the effect of unmeasured limiting factors53. It is there-fore a powerful method to analyse the change in the potential species diversity as afunction of the limiting factor; that is, N:P ratio, only.
We used three indices to assess species diversity: number of species (y1), numberof endangered species (y2), and percentage of endangered species over total num-ber of species (y3, which equals to 100?y2/y1). For the number of species andnumber of endangered species, we assumed a quadratic effect of N:P ratio, sinceprevious studies suggested that on an N:P ratio gradient there is an optimumbiodiversity rather than a continuously increasing biodiversity2. Both responsevariables were log-transformed (that is, ln(y1) and ln(y211)) to correct the right-skewed frequency distributions. For the percentage of endangered species, a logisticquantile regression analysis was applied to restrict the prediction to between 0and 100. Here we used ‘empirical logits’54, ln((y2 1 0.5)/(y1 2 y2 1 0.5)), instead ofnormal logits, ln(y2/(y1 2 y2)), to enable computation of logits when a plot has0% or 100% of endangered species. Effects of N:P ratio on species diversity indices(arrow b in Extended Data Fig. 1a), irrespective of the confounding effects of siteproductivity on N:P ratio (arrow a in Extended Data Fig. 1a), were examined byusing ‘the residual values of N:P ratio versus productivity’ (obtained from a linearregression model on a log–log scale) as an explanatory variable.
For each diversity index, the tth quantile regression function B(t) was deter-mined, indicating the approximately tth proportion of the observations found tobe below B(t) (ref. 55). As we are interested in the upper boundary of the relationship
LETTER RESEARCH
Macmillan Publishers Limited. All rights reserved©2014
when N:P ratio actively limits biodiversity, we examined high values of t only(t . 0.50). To evaluate the precision of the obtained model, 95% confidence inter-vals of the coefficients were computed with the rank inversion method55 (ExtendedData Fig. 2). These analyses were performed with the R package ‘quantreg’55.
The analyses were run for the complete data set. A control run was carried outon the data set excluding two dominant habitat types (fens and bogs). This testedwhether our analysis results could have been biased by habitats that may beseverely deteriorated (for example, fens and bogs in western Europe with desicca-tion problems) or that have intrinsically high or low N:P ratios (for example, bogstend to have high N:P ratios because this rainwater-fed ecosystem receives relativelyhigh N supply through atmospheric deposition but poor P supply) (Extended DataFig. 3). We did not find evidence for such bias.
We also tested whether other factors potentially related to P limitation (forexample, soil acidity, soil moisture) confound the association between N:P ratioand richness of endangered species (Supplementary Discussion 5), but this was notthe case.Effects of N:P ratio on community-mean traits. Our aim was twofold: to examine,first, the significance of N:P ratios in affecting community-mean trait values; andsecond, the explained variation in community-mean trait values by N:P ratios inaddition to and in interaction with productivity.
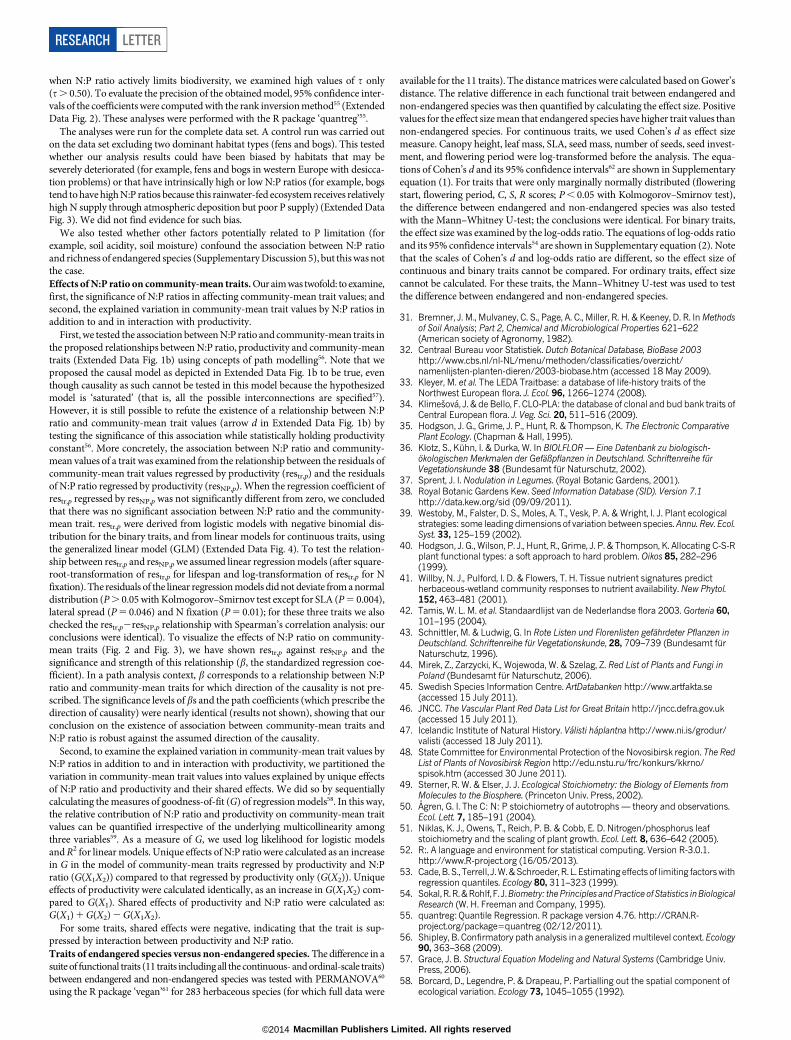
First, we tested the association between N:P ratio and community-mean traits inthe proposed relationships between N:P ratio, productivity and community-meantraits (Extended Data Fig. 1b) using concepts of path modelling56. Note that weproposed the causal model as depicted in Extended Data Fig. 1b to be true, eventhough causality as such cannot be tested in this model because the hypothesizedmodel is ‘saturated’ (that is, all the possible interconnections are specified57).However, it is still possible to refute the existence of a relationship between N:Pratio and community-mean trait values (arrow d in Extended Data Fig. 1b) bytesting the significance of this association while statistically holding productivityconstant56. More concretely, the association between N:P ratio and community-mean values of a trait was examined from the relationship between the residuals ofcommunity-mean trait values regressed by productivity (restr,p) and the residualsof N:P ratio regressed by productivity (resNP,p). When the regression coefficient ofrestr,p regressed by resNP,p was not significantly different from zero, we concludedthat there was no significant association between N:P ratio and the community-mean trait. restr,p were derived from logistic models with negative binomial dis-tribution for the binary traits, and from linear models for continuous traits, usingthe generalized linear model (GLM) (Extended Data Fig. 4). To test the relation-ship between restr,p and resNP,p we assumed linear regression models (after square-root-transformation of restr,p for lifespan and log-transformation of restr,p for Nfixation). The residuals of the linear regression models did not deviate from a normaldistribution (P . 0.05 with Kolmogorov–Smirnov test except for SLA (P 5 0.004),lateral spread (P 5 0.046) and N fixation (P 5 0.01); for these three traits we alsochecked the restr,p2resNP,p relationship with Spearman’s correlation analysis: ourconclusions were identical). To visualize the effects of N:P ratio on community-mean traits (Fig. 2 and Fig. 3), we have shown restr,p against resNP,p and thesignificance and strength of this relationship (b, the standardized regression coe-fficient). In a path analysis context, b corresponds to a relationship between N:Pratio and community-mean traits for which direction of the causality is not pre-scribed. The significance levels of bs and the path coefficients (which prescribe thedirection of causality) were nearly identical (results not shown), showing that ourconclusion on the existence of association between community-mean traits andN:P ratio is robust against the assumed direction of the causality.
Second, to examine the explained variation in community-mean trait values byN:P ratios in addition to and in interaction with productivity, we partitioned thevariation in community-mean trait values into values explained by unique effectsof N:P ratio and productivity and their shared effects. We did so by sequentiallycalculating the measures of goodness-of-fit (G) of regression models58. In this way,the relative contribution of N:P ratio and productivity on community-mean traitvalues can be quantified irrespective of the underlying multicollinearity amongthree variables59. As a measure of G, we used log likelihood for logistic modelsand R2 for linear models. Unique effects of N:P ratio were calculated as an increasein G in the model of community-mean traits regressed by productivity and N:Pratio (G(X1X2)) compared to that regressed by productivity only (G(X2)). Uniqueeffects of productivity were calculated identically, as an increase in G(X1X2) com-pared to G(X1). Shared effects of productivity and N:P ratio were calculated as:G(X1) 1 G(X2) 2 G(X1X2).
For some traits, shared effects were negative, indicating that the trait is sup-pressed by interaction between productivity and N:P ratio.Traits of endangered species versus non-endangered species. The difference in asuite of functional traits (11 traits including all the continuous- and ordinal-scale traits)between endangered and non-endangered species was tested with PERMANOVA60
using the R package ‘vegan’61 for 283 herbaceous species (for which full data were
available for the 11 traits). The distance matrices were calculated based on Gower’sdistance. The relative difference in each functional trait between endangered andnon-endangered species was then quantified by calculating the effect size. Positivevalues for the effect size mean that endangered species have higher trait values thannon-endangered species. For continuous traits, we used Cohen’s d as effect sizemeasure. Canopy height, leaf mass, SLA, seed mass, number of seeds, seed invest-ment, and flowering period were log-transformed before the analysis. The equa-tions of Cohen’s d and its 95% confidence intervals62 are shown in Supplementaryequation (1). For traits that were only marginally normally distributed (floweringstart, flowering period, C, S, R scores; P , 0.05 with Kolmogorov–Smirnov test),the difference between endangered and non-endangered species was also testedwith the Mann–Whitney U-test; the conclusions were identical. For binary traits,the effect size was examined by the log-odds ratio. The equations of log-odds ratioand its 95% confidence intervals54 are shown in Supplementary equation (2). Notethat the scales of Cohen’s d and log-odds ratio are different, so the effect size ofcontinuous and binary traits cannot be compared. For ordinary traits, effect sizecannot be calculated. For these traits, the Mann–Whitney U-test was used to testthe difference between endangered and non-endangered species.
31. Bremner, J. M., Mulvaney, C. S., Page, A. C., Miller, R. H. & Keeney, D. R. In Methodsof Soil Analysis; Part 2, Chemical and Microbiological Properties 621–622(American society of Agronomy, 1982).
32. Centraal Bureau voor Statistiek. Dutch Botanical Database, BioBase 2003http://www.cbs.nl/nl-NL/menu/methoden/classificaties/overzicht/namenlijsten-planten-dieren/2003-biobase.htm (accessed 18 May 2009).
33. Kleyer, M. et al. The LEDA Traitbase: a database of life-history traits of theNorthwest European flora. J. Ecol. 96, 1266–1274 (2008).
34. Klimesova, J. & de Bello, F. CLO-PLA: the database of clonal and bud bank traits ofCentral European flora. J. Veg. Sci. 20, 511–516 (2009).
35. Hodgson, J. G., Grime, J. P., Hunt, R. & Thompson, K. The Electronic ComparativePlant Ecology. (Chapman & Hall, 1995).
36. Klotz, S., Kuhn, I. & Durka, W. In BIOLFLOR — Eine Datenbank zu biologisch-okologischen Merkmalen der Gefaßpflanzen in Deutschland. Schriftenreihe furVegetationskunde 38 (Bundesamt fur Naturschutz, 2002).
37. Sprent, J. I. Nodulation in Legumes. (Royal Botanic Gardens, 2001).38. Royal Botanic Gardens Kew. Seed Information Database (SID). Version 7.1
http://data.kew.org/sid (09/09/2011).39. Westoby, M., Falster, D. S., Moles, A. T., Vesk, P. A. & Wright, I. J. Plant ecological
strategies: some leading dimensions of variation between species. Annu. Rev. Ecol.Syst. 33, 125–159 (2002).
40. Hodgson, J. G., Wilson, P. J., Hunt, R., Grime, J. P. & Thompson, K. Allocating C-S-Rplant functional types: a soft approach to hard problem. Oikos 85, 282–296(1999).
41. Willby, N. J., Pulford, I. D. & Flowers, T. H. Tissue nutrient signatures predictherbaceous-wetland community responses to nutrient availability. New Phytol.152, 463–481 (2001).
42. Tamis, W. L. M. et al. Standaardlijst van de Nederlandse flora 2003. Gorteria 60,101–195 (2004).
43. Schnittler, M. & Ludwig, G. In Rote Listen und Florenlisten gefahrdeter Pflanzen inDeutschland. Schriftenreihe fur Vegetationskunde, 28, 709–739 (Bundesamt furNaturschutz, 1996).
44. Mirek, Z., Zarzycki, K., Wojewoda, W. & Szelag, Z. Red List of Plants and Fungi inPoland (Bundesamt fur Naturschutz, 2006).
45. Swedish Species Information Centre. ArtDatabanken http://www.artfakta.se(accessed 15 July 2011).
46. JNCC. The Vascular Plant Red Data List for Great Britain http://jncc.defra.gov.uk(accessed 15 July 2011).
47. Icelandic Institute of Natural History. Valisti haplantna http://www.ni.is/grodur/valisti (accessed 18 July 2011).
48. State Committee for Environmental Protection of the Novosibirsk region. The RedList of Plants of Novosibirsk Region http://edu.nstu.ru/frc/konkurs/kkrno/spisok.htm (accessed 30 June 2011).
49. Sterner, R. W. & Elser, J. J. Ecological Stoichiometry: the Biology of Elements fromMolecules to the Biosphere. (Princeton Univ. Press, 2002).
50. Agren, G. I. The C: N: P stoichiometry of autotrophs — theory and observations.Ecol. Lett. 7, 185–191 (2004).
51. Niklas, K. J., Owens, T., Reich, P. B. & Cobb, E. D. Nitrogen/phosphorus leafstoichiometry and the scaling of plant growth. Ecol. Lett. 8, 636–642 (2005).
52. R:. A language and environment for statistical computing. Version R-3.0.1.http://www.R-project.org (16/05/2013).
53. Cade, B. S., Terrell, J.W.& Schroeder, R. L. Estimating effects of limiting factorswithregression quantiles. Ecology 80, 311–323 (1999).
54. Sokal, R.R.&Rohlf, F. J.Biometry: thePrinciples andPractice ofStatistics inBiologicalResearch (W. H. Freeman and Company, 1995).
55. quantreg:Quantile Regression. R package version 4.76. http://CRAN.R-project.org/package5quantreg (02/12/2011).
56. Shipley, B. Confirmatory path analysis in a generalized multilevel context. Ecology90, 363–368 (2009).
57. Grace, J. B. Structural Equation Modeling and Natural Systems (Cambridge Univ.Press, 2006).
58. Borcard, D., Legendre, P. & Drapeau, P. Partialling out the spatial component ofecological variation. Ecology 73, 1045–1055 (1992).
RESEARCH LETTER
Macmillan Publishers Limited. All rights reserved©2014

59. Graham, M. H. Confronting multicollinearity in ecological multiple regression.Ecology 84, 2809–2815 (2003).
60. Anderson, M. J. A new method for non-parametric multivariate analysis ofvariance. Austral Ecol. 26, 32–46 (2001).
61. vegan:Community Ecology Package. R package version 1.17-9. http://CRAN.R-project.org/package5vegan (released on 31/03/2011).
62. Howell, D. C. Statistical Methods for Psychology 8th edn (Wadsworth Publishing,2012).
LETTER RESEARCH
Macmillan Publishers Limited. All rights reserved©2014

Extended Data Figure 1 | Data analysis approach. a, b, Schematic proposedrelationships between site productivity (that is, aboveground biomass ofvascular plants; X2), N:P ratio in aboveground plant biomass (X1), andspecies diversity (a; X3) or community-mean traits (b; X4). Solid arrows arerelationships in which the explanatory variable is constrained by the responsevariable (direct causality); dashed arrows are relationships in which upperbound of the explanatory variable is constrained by the response variable(limitation). Arrow a represents the pattern predicted by the growth ratehypothesis (see Supplementary Discussion 1 for details). The effect of N:Pratio on species diversity (arrow b) was tested by quantile regression analysis(thus treating arrow c as another limiting factor) with the residual values of X1
versus X2 as an explanatory variable (thus removing the effect illustrated byarrow a). The effect of N:P ratio on a community-mean trait (arrow d) wastested by comparing the residual values of X1 versus X2 (thus removingthe effect illustrated by arrow a) with the residual values of X4 versus X2
(thus removing the effect illustrated by arrow e), using concepts ofpath analysis.
RESEARCH LETTER
Macmillan Publishers Limited. All rights reserved©2014

Extended Data Figure 2 | Ninety-five per cent confidence intervals of thequantile regression coefficients. a–c, Estimates (dots) and 95% confidenceintervals (bars) of quadratic and linear coefficients (b2 and b1, respectively)of quantile regression models are shown for the number of vascular plantspecies (a), the number of endangered species (b), and the percentage ofendangered species (c) regressed by N:P ratio corrected for productivity effects.The fitted models were (y1): ln(y1) 5 b0 1 b1x 1 b2x2 for number of species;
(y2): ln(y2 1 1) 5 b0 1 b1x 1 b2x2 for number of endangered species; and(y3 5 100*y2/y1): ln((y2 1 0.5)/(y1 2 y2 1 0.5)) 5 b0 1 b1x for percentage ofendangered species, where x is the residuals of plant N:P ratio regressed byproductivity. Models were examined for 50% (t 5 0.50) to 95% (t 5 0.95)quantiles. See Fig. 1 for the shape of the quantile regression models for t 5 0.50,0.75, 0.90, 0.95.
LETTER RESEARCH
Macmillan Publishers Limited. All rights reserved©2014

Extended Data Figure 3 | Effects of habitat types on relationships betweenresidual N:P ratio and biodiversity indices. Relationships between N:P ratiocorrected for productivity effects and the number of endangered species (a)and percentage of endangered species (b) are shown for different habitat types(left, 187 fens; middle, 56 bogs; and right, 296 other habitat types). Linear,rather than quadratic, quantile regression models were applied because formost quantiles the quadratic coefficients did not differ significantly from zero.tth linear quantile regression models (t 5 0.50, 0.75, 0.90, 0.95) are shown only
when the 95% confidence intervals of the linear coefficients of the regressionmodels were above or below zero for the majority of the quantiles. Number andpercentage of endangered species increased concomitantly with increasingN:P ratio (corrected for productivity) even in plots that are not fens andbogs, indicating that our findings on the relationship between N:P ratio andendangered species were not an artefact resulting from the stratified samplingof habitat types.
RESEARCH LETTER
Macmillan Publishers Limited. All rights reserved©2014

Extended Data Figure 4 | Relationships between community-mean traitvalues and plant N:P ratio. a–r, The tested traits are canopy height (a, numberof sites (n) 5 530), leaf mass (b, n 5 525), specific leaf area (c, n 5 529),leaf dry-matter content (d, n 5 525), seed mass (e, n 5 533), seed number pershoot (f, n 5 524), seed investment (g, n 5 523), starting month of flowering(h, n 5 528), flowering period (i, n 5 528), lateral spread (j, n 5 526),reproduction by seeds (k, n 5 528), vegetative reproduction (l, n 5 528), lifespan (m, n 5 531), plant architecture (n, n 5 533), N fixation (o, n 5 502),C score (p, n 5 528), S score (q, n 5 528) and R score (r, n 5 528). See Extended
Data Table 1 for abbreviations and units of the traits. Canopy height, leaf mass,specific leaf area, seed mass, number of seeds, seed investment, and floweringperiod were log-transformed before the calculation of community-meanvalues. For binary traits, plot mean values were shown as a fraction of specieswith 1s over total species (that is, sum of 1s and 0s) to allow graphicalpresentation. Standardized regression coefficients (b) of community-meantrait regressed by N:P ratio using GLM and their two-tailed p-values(***P , 0.001, **P , 0.01, *P , 0.05) are shown.
LETTER RESEARCH
Macmillan Publishers Limited. All rights reserved©2014

Extended Data Table 1 | List of functional traits of herbaceous vascular plant species. 14 species functional traits were retrieved from traitdatabases, and 2 binary traits (‘Reproduction by seeds’ and ‘Vegetative reproduction’) were derived from an ordinal trait (‘Type of reproduction’).For regression analyses of community-mean trait values (Fig. 2) and for effect-size calculation (Fig. 4), we did not use ‘Type of reproduction’ butthe two derived binary traits instead. The traits were retrieved for 446 herbaceous vascular plant species. Canopy height, leaf mass, SLA, seedmass, number of seeds, seed investment, and flowering period were log-transformed before all analyses.
*Month is strictly speaking an ordinal scale, but treated here as a continuous scale.{Range from January to August, thus coded as 1 to 8.{Community-mean values of lateral spread were treated as continuous variables, as lateral spread does not deviate from normal distribution.1 Expressed as the relative dependency on seed reproduction. The original categories in the database are: s (by seeds), ssv (mostly by seeds), sv (both by seeds and vegetatively), vvs (mostly vegetatively),v (vegetatively).
RESEARCH LETTER
Macmillan Publishers Limited. All rights reserved©2014