Low doses of 3-nitropropionic acid in vivo induce damage in mouse skeletal muscle
14
ORIGINAL ARTICLE Low doses of 3-nitropropionic acid in vivo induce damage in mouse skeletal muscle Elizabeth Herna ´ndez-Echeagaray • Nancy Gonza ´lez • Ange ´lica Ruelas • Ernesto Mendoza • Erika Rodrı ´guez-Martı ´nez • Rafael Antuna-Bizarro Received: 16 December 2009 / Accepted: 23 July 2010 / Published online: 24 August 2010 Ó Springer-Verlag 2010 Abstract Mitochondrial alterations are believed to play a critical role in the pathophysiology of neurodegenerative diseases and in some well-described myopathies. In the present study, we evaluated muscle changes in vivo after blocking the mitochondrial complex II of the respiratory chain by using 3-nitropropionic acid (3-NP). This neuro- toxin has been used as a pharmacological tool in animal models to address some of the metabolic modifications that might underlie central neurodegeneration; however, chan- ges in peripheral musculature have not been documented. We believe that skeletal muscles must be affected because their integrity highly depends on oxidative metabolism. Therefore, histochemical, ultrastructural, and biochemical changes were studied in the muscles of mice treated with low doses of 3-NP (15 mg/kg, i.p., for 5 days). 3-NP- treated mice displayed changes in alkaline phosphatase (APase), succinic dehydrogenase (SDH), and cytochrome c oxidase (COX) levels in the gracilis and gastrocnemius muscles. These changes were statistically significant for APase and SDH in both muscles and for COX only in the gastrocnemius. No significant alterations in acetylcholin- esterase (AChE) expression were observed in either mus- cle. Analysis of the muscle ultrastructure revealed mitochondrial atrophy as well as sarcomere and nuclei disorganization. At the biochemical level, nitric oxide (NO) and lipid peroxidation (LPO) changed in the muscles of 3-NP-treated mice, suggesting metabolic alterations due to oxidative stress. Early damage in the striatal tissue and behavioral modifications are also documented. Keywords 3-NP Muscle SDH Neurodegeneration Oxidative phosphorylation Introduction Substantial evidence indicates that one of the underlying mechanisms of neurodegeneration is a defect in bioener- getics; in particular, failures in mitochondrial complexes II, III, and IV may play a role in the pathogenesis of neuro- degenerative disorders in humans and in animal models of neurodegeneration [1–4]. The mitochondrial toxin 3-nitropropionic acid (3-NP) has been widely used to unravel the degenerative process underlying Huntington’s disease (HD) because its damage replicates with high fidelity the neuropathological hallmarks seen in patients afflicted with HD [5]. 3-NP blocks succinic dehydrogenase (SDH) in mitochondrial complex II and produces pathological changes in striatal tissue. Thus, 3-NP is a pharmacological tool that can reproduce the phenotype of disorders that exhibit striatal degeneration due to a mitochondrial dys- function, such as HD, type I glutaric aciduria, and certain inherited metabolic disorders [6]. Nevertheless, a defi- ciency in energy metabolism may damage non-neuronal tissue as well. For example, muscles need the energy supply from glycolysis and oxidative phosphorylation to participate in locomotion, heat production, and overall metabolism [7]. Indeed, neurodegenerative diseases that E. Herna ´ndez-Echeagaray (&) N. Gonza ´lez A. Ruelas E. Mendoza E. Rodrı ´guez-Martı ´nez Laboratorio de Neurofisiologı ´a del Desarrollo y la Neurodegeneracio ´n, Unidad de Biomedicina, FES-I, Universidad Nacional Auto ´noma de Me ´xico, Av. De Los Barrios # 1, Los Reyes Iztacala, C. P. 54090 Tlalnepantla, Mexico e-mail: [email protected]; [email protected] R. Antuna-Bizarro Instituto Nacional de Pediatrı ´a, C. P. 04530 Mexico city, Mexico 123 Neurol Sci (2011) 32:241–254 DOI 10.1007/s10072-010-0394-2
Transcript of Low doses of 3-nitropropionic acid in vivo induce damage in mouse skeletal muscle

ORIGINAL ARTICLE
Low doses of 3-nitropropionic acid in vivo induce damagein mouse skeletal muscle
Elizabeth Hernandez-Echeagaray • Nancy Gonzalez •
Angelica Ruelas • Ernesto Mendoza •
Erika Rodrıguez-Martınez • Rafael Antuna-Bizarro
Received: 16 December 2009 / Accepted: 23 July 2010 / Published online: 24 August 2010
� Springer-Verlag 2010
Abstract Mitochondrial alterations are believed to play a
critical role in the pathophysiology of neurodegenerative
diseases and in some well-described myopathies. In the
present study, we evaluated muscle changes in vivo after
blocking the mitochondrial complex II of the respiratory
chain by using 3-nitropropionic acid (3-NP). This neuro-
toxin has been used as a pharmacological tool in animal
models to address some of the metabolic modifications that
might underlie central neurodegeneration; however, chan-
ges in peripheral musculature have not been documented.
We believe that skeletal muscles must be affected because
their integrity highly depends on oxidative metabolism.
Therefore, histochemical, ultrastructural, and biochemical
changes were studied in the muscles of mice treated with
low doses of 3-NP (15 mg/kg, i.p., for 5 days). 3-NP-
treated mice displayed changes in alkaline phosphatase
(APase), succinic dehydrogenase (SDH), and cytochrome c
oxidase (COX) levels in the gracilis and gastrocnemius
muscles. These changes were statistically significant for
APase and SDH in both muscles and for COX only in the
gastrocnemius. No significant alterations in acetylcholin-
esterase (AChE) expression were observed in either mus-
cle. Analysis of the muscle ultrastructure revealed
mitochondrial atrophy as well as sarcomere and nuclei
disorganization. At the biochemical level, nitric oxide
(NO) and lipid peroxidation (LPO) changed in the muscles
of 3-NP-treated mice, suggesting metabolic alterations due
to oxidative stress. Early damage in the striatal tissue and
behavioral modifications are also documented.
Keywords 3-NP � Muscle � SDH � Neurodegeneration �Oxidative phosphorylation
Introduction
Substantial evidence indicates that one of the underlying
mechanisms of neurodegeneration is a defect in bioener-
getics; in particular, failures in mitochondrial complexes II,
III, and IV may play a role in the pathogenesis of neuro-
degenerative disorders in humans and in animal models
of neurodegeneration [1–4]. The mitochondrial toxin
3-nitropropionic acid (3-NP) has been widely used to
unravel the degenerative process underlying Huntington’s
disease (HD) because its damage replicates with high fidelity
the neuropathological hallmarks seen in patients afflicted
with HD [5]. 3-NP blocks succinic dehydrogenase (SDH)
in mitochondrial complex II and produces pathological
changes in striatal tissue. Thus, 3-NP is a pharmacological
tool that can reproduce the phenotype of disorders that
exhibit striatal degeneration due to a mitochondrial dys-
function, such as HD, type I glutaric aciduria, and certain
inherited metabolic disorders [6]. Nevertheless, a defi-
ciency in energy metabolism may damage non-neuronal
tissue as well. For example, muscles need the energy
supply from glycolysis and oxidative phosphorylation to
participate in locomotion, heat production, and overall
metabolism [7]. Indeed, neurodegenerative diseases that
E. Hernandez-Echeagaray (&) � N. Gonzalez � A. Ruelas �E. Mendoza � E. Rodrıguez-Martınez
Laboratorio de Neurofisiologıa del Desarrollo y la
Neurodegeneracion, Unidad de Biomedicina, FES-I,
Universidad Nacional Autonoma de Mexico,
Av. De Los Barrios # 1, Los Reyes Iztacala,
C. P. 54090 Tlalnepantla, Mexico
e-mail: [email protected];
R. Antuna-Bizarro
Instituto Nacional de Pediatrıa, C. P. 04530 Mexico city, Mexico
123
Neurol Sci (2011) 32:241–254
DOI 10.1007/s10072-010-0394-2

affect the nervous system exhibit changes in other parts of
the organism [8]. In particular, humans who develop HD
show many sensory and motor deficits [9–11], with weight
loss being a characteristic feature [12]. In the transgenic
mouse model of HD, protein inclusions [13] and mutant
huntingtin protein are found in skeletal muscle [14]. Motor
impairments may directly result from central neurodegene-
ration; however, it is also possible that peripheral distur-
bances could reflect a more general metabolic failure. If
true, this reasoning could explain, in part, the muscle
atrophy and body weight loss documented in HD patients
[12, 15], in transgenic HD mice [13, 14] and in patients
with metabolic dysfunction disorders [16, 17].
Until now, most of the studies carried out using the
mitochondrial neurotoxin 3-NP focused on evaluating
central damage [5, 6, 18, 19] even though in a number of
studies 3-NP was systemically administered [20]. A pio-
neering study on 3-NP toxicity in non-neural tissue
revealed a cardiac pathology in mice associated with
changes in succinate dehydrogenase activity [21]. Because
a breakdown in mitochondrial function induces oxidative
damage in mouse muscle [22], in this study, we wanted to
address the potential changes that 3-NP might generate
outside the brain. We believe that documenting modifica-
tions in skeletal muscle after uncoupling oxidative
metabolism provides insights about how early metabolic
failures may produce modifications in non-neural tissue,
which in turn could explain body weight changes observed
in neurodegenerative diseases. Therefore, in the present
study, histochemical, biochemical, and morphological
changes in mouse skeletal muscles were evaluated after
chronic inhibition in vivo of mitochondrial complex II with
low doses (15 mg/kg, i.p., for 5 days) of 3-NP in C57BL/6
mice. Besides the peripheral evaluations, striatal tissue was
processed for a TUNEL assay to document cellular damage
in the brain, and behavioral evaluations were carried out to
address motor disturbances.
Materials and methods
Animals
This study employed 30 juvenile C57BL/6 male mice
(30-days-old) bred by Harlan (Mexico) and housed at the
UBIMED, FES-I, UNAM, throughout the 3-NP treatment
period. The animals were kept on a 12-h/12-h light/dark
cycle with free access to food and water. Body weight was
measured during the 3-NP treatment period. The experi-
mental protocol followed the regulations established by the
Institutional Animal Care of the National Autonomous
University of Mexico and the NIH Guide for the Care and
Use of Laboratory Animals.
3-NP treatment
Fifteen mice were treated for 5 days with 3-NP (15 mg/kg,
i.p., 7.4 pH), and 15 control group animals were treated with
drug vehicle (phosphate buffer, 7.4 pH). On the sixth day,
animals were neurologically and behaviorally evaluated. On
the seventh day, 2 days after the last drug treatment, changes
in the hind limb muscle innervations, vascular supply, and
mitochondrial enzyme activity were evaluated with histo-
chemical techniques. Ultrastructural changes at the muscle
were documented with electron microscopy (EM), and oxi-
dative stress was addressed with biochemical procedures.
Muscle dissection
The mice used for histochemical evaluations (n = 10; 5 for
3-NP and 5 for control) were killed by cervical dislocation
under deep anesthesia induced by ether inhalation. Gas-
trocnemius and gracilis muscles were quickly excised from
both hind limbs and dissected from the deep part of the
lateral head and from the superficial part of both lateral and
medial heads. Muscle samples were immediately immersed
in cooled methylbutane liquid and stored at -80�C for
subsequent analyses.
Histochemical assays
Histochemical procedures were carried out in ten mice
(five muscles from 3-NP and five muscles from control; the
remnant muscles were used for immunohistochemical
evaluation). Fresh, frozen, transverse sections (20 lm)
taken throughout the midbelly region of the muscle were
obtained with a cryostat. Tissue sections were mounted on
different glass slides depending on the histochemical
analysis (SDH, COX, APase or AChE). The distance
between tissue sections on a glass slide for any histo-
chemical assay was 60 lm.
Succinate dehydrogenase (SDH)
SDH staining was used to identify slow contraction (oxi-
dative phosphorylation) from fast contraction (glycolytic)
fibers. Muscle slices used for SDH were incubated in
polyvinyl-alcohol, phosphate buffer (PB, 0.1 M, pH 7.4),
sodium succinate, and sodium azide in the presence of nitro
blue tetrazolium and phenazine methosulfate for 15 min on
a light-protected, cold surface. The slices were then rinsed
with distilled water.
Cytochrome c oxidase (COX)
COX staining also identifies oxidative phosphorylation
activity. Tissue slices used for COX were incubated for
242 Neurol Sci (2011) 32:241–254
123

12–15 h in PB (0.1 M, pH 7.4) containing 130 mM
sucrose, 6.702 lM cytochrome c, 100 lg/ml of catalase
units from bovine liver, and 1.54 mM 3,3-diaminobenzi-
dine at 37�C. After the incubation period, the slices were
rinsed three times in distilled water.
Alkaline phosphatase
Alkaline phosphatase (APase) was used to identify vascular
endothelium and evaluate changes in the muscle’s vessel
supply. The muscle slices used for APase were incubated in
the Blue Alkaline Phosphatase Substrate Kit III SK-5300
for 25 min. Afterwards, the slices were transferred into a
freshly prepared Tris–HCl buffer (100 mM, pH 8.5) for
5 min and later rinsed with distilled water.
Acetylcholinesterase
Motor endplates were visualized with the Acetylcholin-
esterase (AChE) staining. The muscle slices used for
AChE were incubated overnight in the dark at room
temperature in sodium acetate buffer (50 mM, pH 5.0,
adjusted with HCl) containing sodium acetate (0.1 M),
cupric sulfate (30 mM), glycine, acetylthiocholine iodide
(5 mg), and ethopropazine. The following day, the slices
were rinsed with distilled water and treated with 10%
solution of Na2S H20, pH 7.5 (adjusted with acetic acid),
for 5 min and later rinsed with distilled water. All slides
for histochemical assays were rinsed with distilled water
after the enzymatic reaction, dried, and covered with
Cytoseal TM 60.
Immunohistochemical identification of fiber type
Expression levels of myosin heavy chain (MHC) subtypes
were documented using Immunohistochemical (IHC) pro-
cedures. Remnant muscles from histochemical evaluations
(five from control and five from 3-NP-treated mice) were
used. Cryostat transverse sections (10 lm) of frozen mus-
cles were cut from the midbelly region of each muscle and
immunostained using monoclonal antibodies specific for
MHC. Briefly, sections were fixed in 4% paraformaldehyde
in PB (pH 7.4) for 2 h and then incubated at 4�C in
blocking serum (3% bovine serum albumin, 0.3% triton
X-100 and 0.025% sodium azide in phosphate buffer, pH 7.4)
for 12 h before being incubated overnight at 4�C with slow
type (myosin type 1, A4.951, 1:100) and fast type (myosin
type 2, N3.36, 1:100 and myosin type 2A, A4.74, 1:100,
Santa Cruz Biotechnology, Inc.) MHC antibodies in
blocking solution. Then, sections were washed three times
with phosphate-buffered saline (PBS). Biotinylated sec-
ondary antibody (1:500, Vector Laboratories, Inc., Bur-
lingame, CA, USA) in blocking serum was added for
90 min at room temperature. Sections were rinsed with
PBS, and the AB Vector kit (Vector Laboratories, Inc.,
Burlingame, CA, USA) was used to detect biotinylated
antibodies following the manufacturer’s instructions. Tis-
sue slices were cover slipped with mounting medium
(Fisher Scientific, Pittsburgh, PA, USA). Control experi-
ments were carried out by pre-absorbing the primary
antibodies with their corresponding antigens, omitting the
primary antibody or omitting both the primary and sec-
ondary antibodies. Counting of fiber types was performed
over the entire muscle cross-sections to establish the
number of each fiber type in relation to the total fiber
number. A total of six muscles collected from three control
mice and three mice treated with 3-NP were analyzed.
Electron microscopy
Animals were perfused with paraformaldehyde (4%) plus
glutaraldehyde (2.5%) and later postfixed with glutaralde-
hyde (2.5%) in a cacodylate buffer (pH 7.0, 0.1 M) for
1.5 h. Muscles were excised as previously described and
then rinsed for 10 min and postfixed with osmium tetroxide
(OsO4, 0.5%) in cacodylate buffer. OsO4 was rinsed with
cacodylate buffer alone, and the tissue was dehydrated by
immersion in increasing alcohol concentrations (70�, 80�,
90� and 100�) and propylene oxide. Tissue was pre-
embedded in epon-propylene oxide, 1:1, overnight and
later embedded in pure epon�. Tissue slabs of 1 lm were
stained with toluidine blue. Subsequently, ultra-thin
(60–70 nm) slices were contrasted using uranyl acetate
(3%) and lead citrate for visualization. Electron micro-
graphs were taken for further analysis. Brains from these
perfused mice were used for the TUNEL assay to evaluate
apoptotic death.
Evaluation of oxidative stress induction
NO
Nitric oxide production was evaluated indirectly by mea-
suring nitrates in the serum from blood samples. Blood
samples from 3-NP and control mice were centrifuged at
12,000 rpm for 15 min to separate nitrates from the serum.
To quantify nitrates, 0.1% of naphthyl ethylenediamine
dihydrochloride was mixed with Griess reagent (1% sul-
fanilamide and 5% phosphoric acid). In a plate of 96 wells,
serum samples (100 ll, different concentrations) and 75 ll
of Griess reagent were incubated at room temperature for
10 min and measured at 550–620 nm in an ELISA reader.
Absorbance spectrums of the colored azo compounds were
quantified using serial dilutions of sodium nitrite as the
standard reference curve. Data are expressed as absorbance
units.
Neurol Sci (2011) 32:241–254 243
123

LPO
Lipid peroxidation was measured using the lipid fluores-
cent products. Briefly, muscle from control (n = 3) and
3-NP-treated (n = 3) mice was weighed and homogenized
in 3 ml of saline solution (0.9% NaCl). Aliquots of 1 ml
were added to 4 ml of a chloroform–methanol mixture (2:1
v/v). After stirring, the mixtures were kept on ice for
30 min to permit phase separation, and then the fluorescent
of the chloroformed layer was measured in a Perkin–Elmer
LS50B luminescence spectrometer at 370 nm of excitation
and 430 nm of emission wavelength. The sensitivity of the
spectrometer was previously adjusted with a quinine stan-
dard solution (0.1 lg/ml). Results are expressed as fluo-
rescent units/g of wet tissue.
Evaluation of striatal damage
TUNEL
The brains of six perfused mice were dissected and
cryostat-cut in coronal sections (5 lm) to detect DNA
fragmentation with the TUNEL reaction kit (Apoptosis
Detection Kit, TA300, R&D Systems, Minneapolis, MN,
USA). In brief, slices were mounted on glass slides and
postfixed with formalin (10%) in 0.1 mM PBS and later
incubated in proteinase K (20 lg/ml) in 10 mM Tris–
HCl, pH 7.5, for 15 min at 18–24�C. After rinsing the
sections in distillated water, quenching solution (methanol
in 30% H2O2) was added for 5 min at 18–24�C and then
washed with distilled water and equilibrated for 5 min in
terminal deoxynucleotidyl transferase buffer (50 mM
Tris–HCl, pH 8.0, 1 mM MgCl2, 0.5 mg/ml BSA,
0.6 mM 2-mercaptoethanol sulfonic acid) at 18–24�C.
The labeling reaction was performed at 37�C for 1 h with
the Labeling Reaction Mix from the detection kit. The
reaction was stopped by using the TdT Stop Buffer for
5 min at 18–24�C. The tissue was washed twice for
15 min in distillated water, incubated with 50 ll of
diluted anti-BrdU for 1 h at 37�C, and then washed three
times with PBS-Tween 20 (0.05%). TUNEL labeling was
carried out using 50 ll of Streptavidin-HRP Solution for
10 min at 18–24�C. Samples were rinsed with distilled
water to stop the reaction and covered with 50 ll of
TACS Blue Label for 2–5 min. Finally, the tissue was
rinsed, dried, and cover slipped with Permount (Fisher
Scientific, Pittsburgh, PA, USA). TUNEL-labeled cells
that displayed densely labeled, small particles in the
cytoplasm (apoptotic bodies) and different types of
chromatin condensation around the margin of the nucleus,
forming either crescent caps or rings, were quantified by
light microscopy.
Cell counting
To count damaged cells stained by the TUNEL labeling,
images were visualized and captured with a microscope
equipped with a video camera coupled to a computer
monitor, and then the digital images were analyzed (Image
J, NIH). The analysis consisted of obtaining square probes
of 1 mm2 in 409 magnification to determine labeled cells.
The number of cells was obtained as an average of three
fields per section, ten sections per brain, and three mice per
experimental group.
Evaluation of motor disturbances
Motor disturbances were classified in terms of the presence
of dystonia and gait abnormalities. Dystonia classifications
consisted of 0 = none, 1 = intermittent dystonia of one
limb, 2 = intermittent dystonia of two limbs or permanent
dystonia of one limb, and 3 = permanent dystonia. Clas-
sifications for gait abnormalities were 0 = none and
1 = uncoordinated and wobbling gait.
Behavioral evaluations
We also evaluated orofacial dyskinesia and measured the
latency to paw clasping. To evaluate orofacial dyskinesias
in mice, spontaneous mouth movements were scored for
10 min by a hand-operated counter. Mice were observed
individually in their own Plexiglas cages, and mirrors were
placed at the back wall of the cage to permit the assessment
of vacuous chewing movements when mice were facing
away from the observer. To the latency to paw clasping,
mice were suspended by their tail above 10 cm from their
cages up to 120 s. Results are expressed as the mean ±
standard error.
Data analysis
Fiber number was counted in transverse muscle cross sec-
tions, taken at the middle of the muscle (five muscles for
each group), and then images of 2,000 lm2 per field were
analyzed (3–5 microscopic fields for each muscle). For
optical density analysis, the images of muscles were all
captured maintaining the same values for brightness and
gain. Ten sections per animal were captured and digitized to
estimate histochemical reactions for COX, SDH, APase and
AChE in control, and 3-NP-treated mice. Optical density
analysis was performed through a computer-assisted
imaging analysis system (Scion Image; Scion Corp, Beta
4.0.2). The optical density was measured only in transverse
sections of the gastrocnemius muscle to analyze the
differential reactivity of red and white fibers for SDH, and
244 Neurol Sci (2011) 32:241–254
123

COX histochemical activity; for AChE and APase expres-
sion, we evaluated both gastrocnemius and gracilis muscles.
The muscle data obtained from each mouse were averaged,
and statistical comparisons were made between experi-
mental and control groups using an unpaired Student’s t test
for two-group comparisons or a Mann–Whitney Rank Sum
Test for data where normality tests did not pass. All data
except that documenting striatal damage induced by 3-NP
were expressed as mean ± S.E.M. Statistical analysis was
conducted using SigmaStat statistical software for Win-
dows, version 2.03 (Systat Software, Inc.), and p \ 0.05
was considered to be statistically significant.
Reagents
3-Nitropropionic acid, sodium acetate, cupric sulfate, gly-
cine, acetylthiocholine, ethopropazine, sodium sulfite,
cytochrome c, catalase from bovine liver, 3,3-dıamino-
benzidine, polyvinyl-alcohol, sodium succinate, sodium
azide, nitroblue tetrazolium, phenazine methosulfate, and
paraformaldehyde were purchased from Sigma Chemical
Co. (St. Louis, MO, USA). Glutaraldehyde, osmium
tetroxide, propylene oxide and uranyl acetate were pur-
chased from Merck Co., Inc. (Whitehouse Station, NJ,
USA). Toluidine blue was from EMS (Electron Micro-
scopic Sciences, Hatfield, PA, USA). Blue alkaline phos-
phatase substrate Kit III SK-5300 was from Vector
(Vector�, SK-5300). Tris–HCl was from BioRad (Hercu-
les, CA, USA). Sucrose was from JT Baker, Inc. (Mal-
linckrodt Baker, Phillipsburg, NJ, USA), and Cytoseal
TM60 was from Richard-Allen Scientific (Kalamazoo, MI,
USA).
Results
In our experimental conditions, we did not observe body
weight changes (F6.629, p [ 0.062, one-way repeated
measures analysis of variance) or motor disturbances in
animals treated with 3-NP when compared with the control
group; however, signs of muscle alterations were docu-
mented through histochemical analysis, electron micro-
graphs and biochemical evaluations. Striatal damage
and changes in some behavioral parameters were also
documented.
Histochemical evaluations
Succinate dehydrogenase
We found small-diameter muscle fibers with reddish color
that were positive for SDH staining and large diameter
fibers with light color that were negative for SDH staining.
We evaluated the SDH-positive, small size fibers and found
a significant increase in the number of fibers stained for
SDH in gastrocnemius (t45 = -3.845, p = 0.001) and
gracilis (t49 = -5.585; p = 0.001) from 3-NP-treated
animals when compared with controls (Figs. 1a, b, 2a).
Optical density measurements of the SDH staining
showed greater intensity in the small fibers (t22 = -3.214,
Fig. 1 SDH and COX-positive
fibers increased in muscle of
3-NP-treated animals. a shows
SDH histochemical staining in
transverse sections of the
gastrocnemius muscle in the
control condition. SDH stains
small fibers (white arrow),
typical for slow contraction
fibers. Optical density and the
number of SDH-positive fibers
increased in 3-NP-treated
animals (b). c shows the COX-
positive fibers in control
gastrocnemius muscle, whereas
d displays the muscle of 3-NP-
treated animals. COX staining
increases in 3-NP-treated mice,
and it was present in both the
white and the red areas of the
muscle. Arrows show the red
area in both cases. Scale bar20 lm
Neurol Sci (2011) 32:241–254 245
123
p = 0.004) of animals treated with 3-NP than in their
respective controls (Table 1). We did not observe statistical
changes in the diameter size of SDH positive fibers
between the groups; however, the size of the white
fibers (SDH-negative fibers) was increased significantly
in 3-NP-treated animals (24.15 ± 1.83 lm) compared
with the control group (19.73 ± 1.02 lm) (t54 = -2.283,
p = 0.026).
Cytochrome c oxidase
The number of COX positive fibers increased significantly
(t51 = 2.437, p = 0.018) in the gastrocnemius muscle of
3-NP-treated mice without a significant change in the gracilis
muscle (Figs. 1c, d, 2b). Optical density analysis for COX
positive fibers in the gastrocnemius muscle also showed
statistical differences (t269 = -3.046, p = 0.003) in 3-NP-
treated animals vs. controls (Table 1). Note that COX
staining fibers increased in both the white and red areas of
the 3-NP-treated muscle (Fig. 1d).
Alkaline phosphatase
APase histochemical expression was used to evaluate the
vascular supply in the muscle. The number of stained
capillaries significantly increased in 3-NP animals in both
the gastrocnemius (t29 = -2.351, p = 0.026) and gracilis
muscles (t67 = -2.254, p = 0.027) when compared with
controls (Figs. 2c, 3a, b).
Acetylcholinesterase
We used the Tago’s method to visualize motor end plates.
The histochemical expression of AChE did not differ sig-
nificantly in either the gastrocnemius or the gracilis mus-
cles between control and treated animals (Figs. 2d, 3c, d).
Muscle atrophy
Structural and biochemical evaluations were centered only
in the gastrocnemius muscle of the control and 3-NP-treated
mice because there were no differences between the gracilis
and gastrocnemius muscles in the histochemical evaluations.
We chose to analyze the muscle ultrastructure with the aid of
EM. The micrograph of the control muscle displays a normal
appearance in its nuclei and sarcomere structure (Fig. 4a, c),
but 3-NP-treated muscles displayed changes in their cell
nuclei, which showed early signs of apoptotic damage when
compared with control muscle (Fig. 4b, white arrow). 3-NP-
treated muscles exhibited a disorganization of the sarco-
mere; in particular, Z bands were remarkably thicker
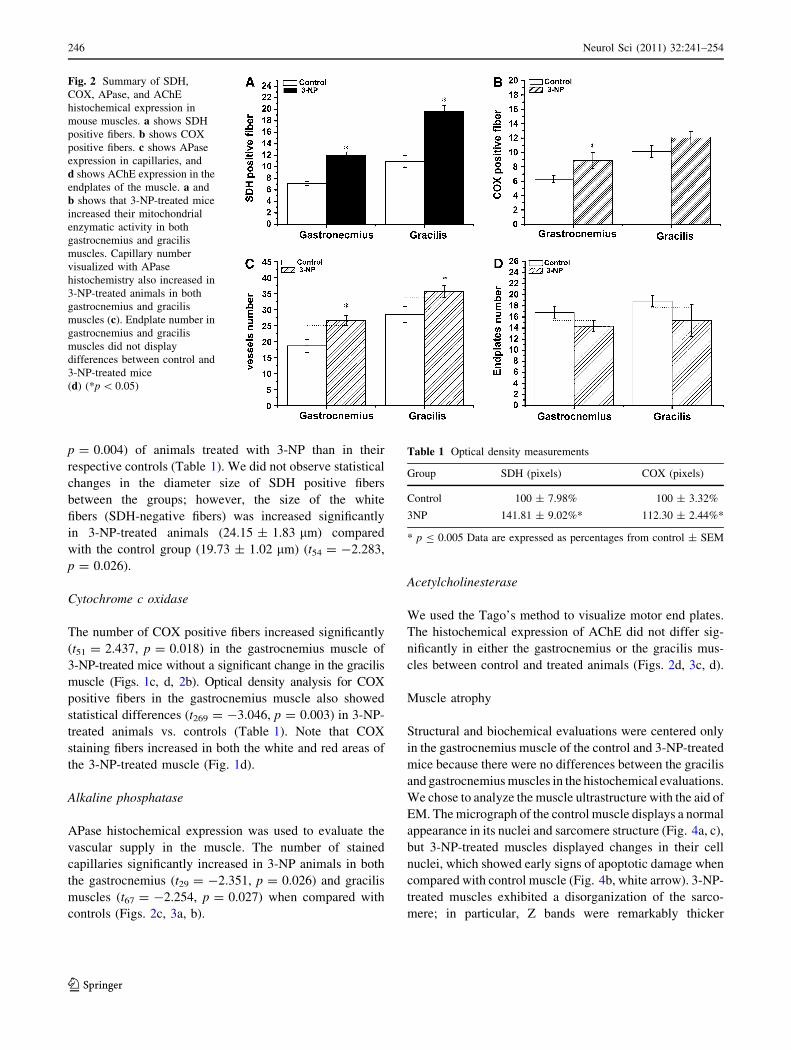
Fig. 2 Summary of SDH,
COX, APase, and AChE
histochemical expression in
mouse muscles. a shows SDH
positive fibers. b shows COX
positive fibers. c shows APase
expression in capillaries, and
d shows AChE expression in the
endplates of the muscle. a and
b shows that 3-NP-treated mice
increased their mitochondrial
enzymatic activity in both
gastrocnemius and gracilis
muscles. Capillary number
visualized with APase
histochemistry also increased in
3-NP-treated animals in both
gastrocnemius and gracilis
muscles (c). Endplate number in
gastrocnemius and gracilis
muscles did not display
differences between control and
3-NP-treated mice
(d) (*p \ 0.05)
Table 1 Optical density measurements
Group SDH (pixels) COX (pixels)
Control 100 ± 7.98% 100 ± 3.32%
3NP 141.81 ± 9.02%* 112.30 ± 2.44%*
* p B 0.005 Data are expressed as percentages from control ± SEM
246 Neurol Sci (2011) 32:241–254
123

(Fig. 4d, white arrow) than in control muscle (Fig. 4c, white
arrow). Also, M bands were weak in treated animals (Fig. 4d,
black arrow) compared with controls (Fig. 4c, black arrow).
In fact, some M bands were difficult to visualize in the
muscle of 3-NP-treated mice in contrast to the thickness of
their Z band. In addition, in the muscles of 3-NP-treated
mice, there was a notable augmentation in the number of
mitochondria measured per field in 7,0009. We evaluated
the SDH-positive micrographs (control 20.66 ± 6.16 vs.
138.16 ± 24.30 for 3-NP-treated mice, t10 = 4.687,
p \ 0.001), and their morphology showed signs of atrophy
(Fig. 4d, dashed black arrow; see also Fig. 5b, d) when
compared with the mitochondria in control muscles (Fig. 4c,
dashed black arrow; Fig. 5a). Figure 5 shows changes in the
amount of mitochondria in muscle from control and 3-NP-
treated mice. Mitochondria were densely distributed near the
cell nuclei in muscles from 3-NP-treated animals (Fig. 5b,
d), but not in control muscle (Fig. 5a, c). At higher magni-
fication, mitochondrial fission (Fig. 5d, white arrows),
atrophied mitochondria (Fig. 5d, black arrow), and vacuoles
(Fig. 5d, dashed black arrow) could be visualized. Finally,
Fig. 5b exhibits a dividing sarcomere (white arrow).
Fiber type examination
To further analyze if changes observed in muscle tissue were
due to the effects of 3-NP treatment on fiber composition,
muscle cryosections were immunostained with specific
myosin antibodies. The percentage of slow contraction fibers
(Type I) did not change in 3-NP-treated mice in comparison
with control mice (t18 = 1.857, p = 0.080). Fast contraction
fibers did not change in 3-NP-treated mice with respect to
control mice (Type II fibers, t18 = -0.360, p = 0.723; Type
IIA fibers, t18 = 0.866, p = 0.398, see Table 2).
Biochemical evaluations
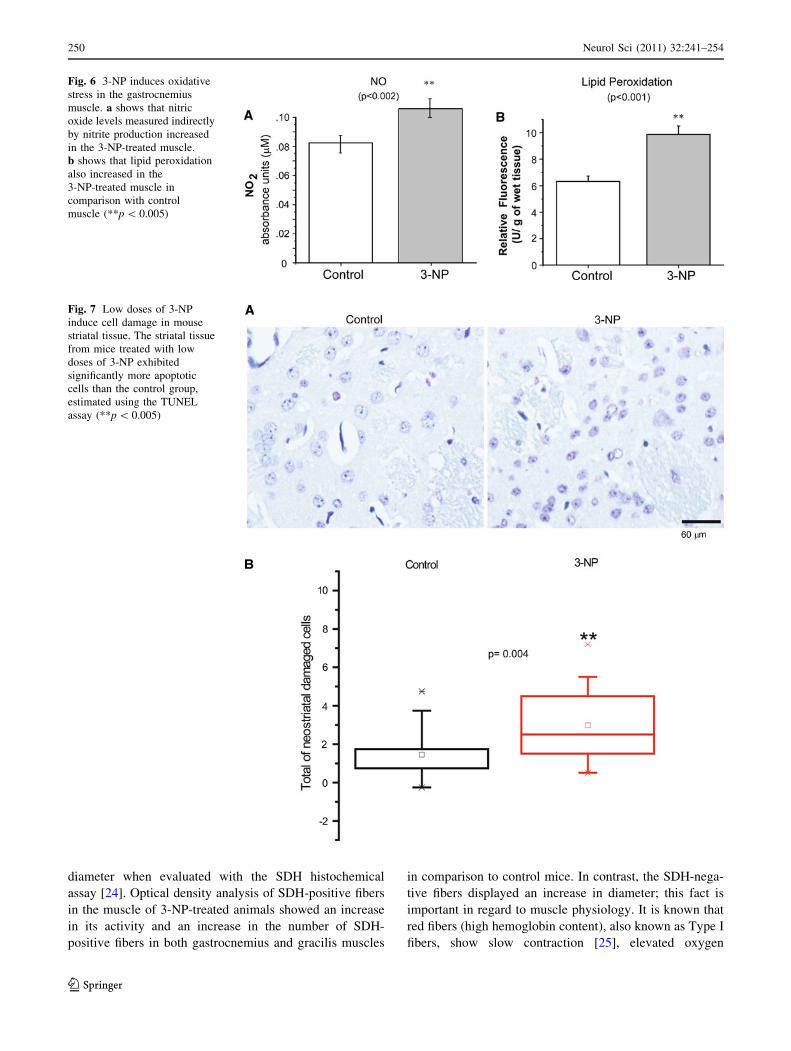
Nitrates and Nitrite levels in the muscle of 3-NP-treated
animals
The inhibition of oxidative phosphorylation may trigger an
increase in reactive oxygen species (ROS), inducing oxi-
dative stress and neuronal damage. To investigate if oxi-
dative stress underlies the 3-NP effects on muscle
alterations, we evaluated the presence of NO in the muscle
indirectly by measuring NO3-/NO2
- production. Levels
of NO3-/NO2
- increased significantly (t12 = -3.846,
p = 0.002, Fig. 6a) in 3-NP-treated mice (0.125 ± 0.009,
absorbance units) in comparison with control group
(0.07 ± 0.007, absorbance units).
LPO in 3-NP-treated animals
One of the harmful effects of the increase in NO levels is
the oxidation of fatty acids, a process called lipid peroxi-
dation. Therefore, LPO levels were also estimated. Our
evaluation demonstrated a significant increase in the LPO
levels in the gastrocnemius muscle of 3-NP-treated mice
Fig. 3 APase and AChE
histochemical staining. a shows
the alkaline phosphatase
histochemical reaction to
visualize capillaries in a
transverse section of the
gastrocnemius muscle in control
conditions. b exhibits muscle
from 3-NP-treated animals
(arrows point to capillaries).
c shows the histochemical
expression of AChE in
transverse sections of the
gastrocnemius muscle in the
control group to visualize
endplates, and d exhibits AChE
expression in the 3-NP-treated
animals. Scale bar 20 lm
Neurol Sci (2011) 32:241–254 247
123

(3-NP, 9.87 ± 0.63 vs. control 6.32 ± 0.39, t10 = 4.725,
p \ 0.001, Fig. 6b).
Central damage
Apoptotic damage in the striatum of 3-NP-treated animals
To evaluate if the same low doses of 3-NP that induced
muscle alterations also triggered apoptotic damage in the
striatum, a TUNEL assay was carried out. Figure 7a
illustrates representative images obtained from brain slices
of both control and 3-NP-treated mice. Figure 7b shows
that 3-NP significantly increased the TUNEL positive cells
in comparison with the control tissue (Mann–Whitney,
T = 5,945.500, p \ 0.004).
Behavioral assessment
Neurological evaluation of motor disturbances, such as gait
and dystonia, in the 3-NP-treated animals did not display
differences compared with the control mice. Alternatively,
we chose to study the presence of stereotyped and unco-
ordinated movements through the evaluation of orofacial
dyskinesia incidence and the latency for clasping behavior.
Orofacial dyskinesia
Figure 8a shows that, in a period of 10 min, 3-NP-treated
mice exhibited a significant increase (t18 = -9.287,
p \ 0.001) in orofacial dyskinesias (10.7 ± 0.3) over
control mice (6.3 ± 0.3).
Clasping behavior
Mice from the control and 3-NP-treated groups were also
evaluated on a tail suspension test. Control mice exhibited
a higher latency to clasp (150.4 ± 5.5 s) than 3-NP-treated
mice (79.1 ± 4.3 s), which was significant (t18 = 10.104,
p \ 0.001) (Fig. 8b).
Fig. 4 Ultrastructural analysis
of muscle. a (44009) and
c (20,0009) display electron
microscopy of the
gastrocnemius muscle from
control and b (4,4009) and
d (20,0009) show
gastrocnemius muscle from
3-NP-treated animals. The whitearrows in a and b indicate
changes at the cell nuclei. Note
the membrane invaginations in
the cell nuclei in b. c shows
normal sarcomere organization.
The M band is pointed out with
a black arrow; note that the M
band almost disappears in some
sarcomeres of 3-NP-treated
mice (d, black arrow), but the Z
bands get thicker (d, whitearrow) in the 3-NP-treated mice
in contrast to the control mice
(c, white arrow). The dashedarrow in d shows changes in the
mitochondrial number and
morphology. Scale bar 500 nm
248 Neurol Sci (2011) 32:241–254
123

Discussion
The present study demonstrated that juvenile mice treated
chronically with low concentrations of 3-NP have altered
muscle enzymatic staining for SDH, COX, and vascular
supply without changes in acetylcholinesterase activity in
both gastrocnemius and gracilis muscles. In addition, an
analysis of muscle ultrastructure revealed sarcomere dis-
organization, increased mitochondria number, and mor-
phological modifications in the gastrocnemius muscle of
3-NP-treated animals. The underlying mechanism of these
muscle changes might be due to the generation of oxidative
stress because 3-NP increased NO and LPO levels in the
muscle.
Mitochondrial enzyme activities
To monitor the activity of oxidative enzymes in our
experimental procedures, we evaluated SDH and COX
with histochemical procedures.
Succinic dehydrogenase
SDH is an enzyme of the respiratory chain and the tricar-
boxylic acid cycle [23]; it is used to identify oxidative
muscle fiber subtypes by its reddish staining [24]. As
previously described, we found a strong staining in small
muscle fibers and weak or no staining in fibers with large
Fig. 5 3-NP increases
mitochondrial number in the
gastrocnemius muscle.
a (7,0009) and c (12,0009) are
micrographs of control muscle.
There is no mitochondrial
proliferation near the cell nuclei
(a, black arrow). b (7,0009)
and d (12,0009) are
micrographs of gastrocnemius
muscle of 3-NP-treated mice.
b shows massive increase of
mitochondria, mainly located
near the cell nuclei. Note that
the Z bands of the sarcomere are
thick. The white arrow in
b shows an area where the
sarcomere is splitting. c and
d are magnifications of the
squares in a and b. In d, the
white arrows show
mitochondrial fissions, and the
black dashed arrow shows a
vacuole in a mitochondria.
Scale bar 500 nm
Table 2 Fiber type
Fibre type Control 3-NP
Type I 14.5 ± 0.2% 13.9 ± 0.2% t18 = 1.857, p = 0.080
Type II 76.9 ± 0.4% 77.1 ± 0.2% t18 = -0.360, p = 0.723
Type IIA 9.6 ± 0.1% 9.4 ± 0.1% t18 = 0.866, p = 0.398
Data are expressed as Mean ± SEM
Neurol Sci (2011) 32:241–254 249
123
diameter when evaluated with the SDH histochemical
assay [24]. Optical density analysis of SDH-positive fibers
in the muscle of 3-NP-treated animals showed an increase
in its activity and an increase in the number of SDH-
positive fibers in both gastrocnemius and gracilis muscles
in comparison to control mice. In contrast, the SDH-nega-
tive fibers displayed an increase in diameter; this fact is
important in regard to muscle physiology. It is known that
red fibers (high hemoglobin content), also known as Type I
fibers, show slow contraction [25], elevated oxygen
Fig. 6 3-NP induces oxidative
stress in the gastrocnemius
muscle. a shows that nitric
oxide levels measured indirectly
by nitrite production increased
in the 3-NP-treated muscle.
b shows that lipid peroxidation
also increased in the
3-NP-treated muscle in
comparison with control
muscle (**p \ 0.005)
Fig. 7 Low doses of 3-NP
induce cell damage in mouse
striatal tissue. The striatal tissue
from mice treated with low
doses of 3-NP exhibited
significantly more apoptotic
cells than the control group,
estimated using the TUNEL
assay (**p \ 0.005)
250 Neurol Sci (2011) 32:241–254
123

demands, and use oxidative metabolism as an energy
resource. Therefore, these fibers have high amounts of
mitochondria [26]. After blocking endogenous SDH with
3-NP, it is likely that the first mechanistic change in the
muscle was to produce more endogenous SDH to coun-
teract the SDH inhibition by 3-NP. It is known that mito-
chondrial complex II subunits are replaced in about 12 h
[27]. As we evaluated animal tissue 48 h after the last
doses of treatment, the system had time to synthesize new
SDH.
To evaluate if the increase in the diameter size of SDH-
negative fibers was associated with a transition in muscle
fiber composition due to changes in neuronal innervation
[7] or metabolic activity [28], immunocytochemical anal-
yses of myosin subtype were conducted, revealing that
fiber type composition was similar in muscles from control
and 3-NP-treated mice. These results are comparable to
what has been reported in the transgenic mouse model of
HD [13]. Alternatively, glycolytic activity may have
changed in the white fibers; we have seen an increase in the
mRNA of the glycolytic enzyme GADPH after 3-NP
administration in both striatal and muscle tissues (unpub-
lished data). White fibers (Type II fibers) are fast con-
tracting, have low levels of hemoglobin, have few
mitochondria, and need fast energy sources derived from
glycolysis [25]. Because oxidative phosphorylation was
blocked, it is likely that glycolysis was favored. This
explanation is consistent with the idea that muscle fibers
can change their energy source depending upon energy
demands without changing fiber type composition [28].
Further experiments need to be done to address this point.
Cytochrome c oxidase
COX is an oxidative enzyme, and its activity has been used
as a marker of oxidative metabolism in the brain [29]. Also,
in animals where mitochondrial biogenesis has been doc-
umented, COX expression is increased [30]. Therefore, we
evaluated its histochemical expression and found a significant
increase in COX activity in the muscle of 3-NP-treated
mice, indicating an increase in both mitochondrial activity
and oxidative phosphorylation (Fig. 1).
Changes in vascular supply
To evaluate the vascular supply, we used the alkaline
phosphatase histochemical assay, which stains endothelial
cells in capillaries [31] and has been used to evaluate cap-
illary supply [32]. The amount of stained capillaries
increased in 3-NP-treated animals in both gastrocnemius
and gracilis muscles. This increment can be due to an
increase in vasculogenesis produced by the hypoxia derived
from the inhibition of complex II in the mitochondria.
During vessel development, a mechanism based on hypoxia
is responsible for the release of angiogenetic growth factors
producing angiogenesis [33]; therefore, it is possible that in
adult muscle vasculogenesis is triggered during hypoxia,
oxygen deprivation, or inhibition of oxidative phosphory-
lation because the microcirculatory system is important for
providing optimal metabolic conditions and oxygen supply
to the muscle cells [26, 34]. The lateral gastrocnemius
muscle has a glycolytic fiber angiotype, but its medial part
has a mixture of oxidative and glycolytic fibers [35, 36].
Consequently, if oxidative phosphorylation was blocked, it
is likely that vasculogenesis led to an increase in the number
of capillaries to enhance oxygen supply.
Compensatory mechanisms after oxygen deprivation
In the present study, we observed a link between mito-
chondrial complex II inhibition and the enhancement of
SDH, COX, and alkaline phosphatase histochemical stain-
ing in 3-NP-treated animals, suggesting that more blood
supply was needed as a result of the oxidative phosphory-
lation blockage. We speculate that, after oxidative phos-
phorylation inhibition, the organism elevates its enzymatic
activity related to oxidative phosphorylation to counteract
any metabolic failure. Some studies report the initiation of a
protective mechanism after a brief inhibition of SDH with
3-NP, and this condition seems to depend on the timing of
Fig. 8 Low doses of 3-NP
induced changes in the numbers
of orofacial dyskinesias and
delayed the manifestation of
clasping behavior. Orofacial
dyskinesias (a) increased in 3-
NP-treated mice, and the
latency to clasp (b) was reduced
in comparison with the control
group. Changes were significant
in both cases (**p \ 0.005)
Neurol Sci (2011) 32:241–254 251
123

metabolic perturbations. For example, a short ischemic or
hypoxic episode may increase or decrease tolerance to a
subsequent cerebral or cardiac ischemic event. This process
is called chemical preconditioning. While a short-time
interval of preconditioning is needed to induce heart toler-
ance [21], in the brain, it may last a few days after a single
dose of 3-NP. In our study, 3-NP was administered for five
consecutive days in low doses, but further manipulations
such as ischemic manipulation were not carried out. Thus,
we doubt that chemical preconditioning is responsible for
our data. Also, it is known that complex II inhibition is not
necessary for chemical preconditioning [37]. It is also pos-
sible that the changes observed occurred because C57BL/6
mice are less susceptible to this mitochondrial toxin. If this is
true, the use of higher doses could result in a reduction of
enzymatic activity as previously demonstrated in cardiac
muscle [21]. However, we were not interested in analyzing
cellular processes in the brain and in non-neuronal tissue
when massive damage was produced. Instead, we studied the
early changes in neurodegeneration to stop or delay neuronal
and non neuronal damage, and consequently, we needed
lower doses of 3-NP in our studies. We support the idea that,
after inhibiting oxidative phosphorylation, the first mecha-
nism the body develops is the increase in mitochondrial
activity and mitochondrial number to counteract mito-
chondrial failure.
Mitochondrial increase
Histochemical assays did not give direct information about
the presence of mitochondrial damage after blocking com-
plex II of the respiratory chain, but EM visualization showed
both mitochondrial atrophy and an increase in mitochondrial
number. The increase in mitochondrial number correlates
very well with the SDH staining increase. Both the mito-
chondrial atrophy and increase may reflect a need for more
energy derived from oxidative phosphorylation.
This metabolic route requires oxygen, and consequently,
many more mitochondria are needed. However, mitochon-
drial increase could also underlie muscle degeneration as
mitochondrial proliferation has been linked to apoptosis in
some myopathies [38]. Mitochondria experience frequent
fission and fusion to regulate their number, morphology,
and function. Bossy-Wetzel et al. [39] have proposed that a
balance between mitochondrial fission and fusion events is
required for normal mitochondrial function; excessive
mitochondrial fission results in a mitochondrial malfunc-
tioning, which increases reactive oxygen species [40].
Muscle disorganization
In our experiments, we observed changes in the organiza-
tion of the sarcomere. In particular, Z lines appeared
disorganized, and M bands were sometimes absent. Z lines
are important structures in striated muscle fibers, which
provide stability and functional integration of the sarco-
mere. Additionally, Z lines play an important role in
myofibril assembly and in anchoring muscle filaments [41,
42]. M bands are composed of different proteins [43] and
glycolytic enzymes [42], which help to stabilize the sar-
comere. In muscle pathologies, sarcomeric proteins can
also be disorganized [44]; therefore, it is possible that the
modifications we observed in the sarcomere of 3-NP-trea-
ted muscles were due to the damage of structural proteins
in Z lines and M bands. Further experiments are necessary
to determine changes in the expression and assembly of
different sarcomeric proteins when oxidative metabolism is
uncoupled.
Underlying mechanism to muscle changes
Mitochondrial failure and oxidative stress activation seem
to underlie the enzymatic changes, muscle disorganization,
and mitochondrial increase observed in our study. To
corroborate the presence of oxidative stress, NO and LPO
levels were evaluated, confirming that mitochondrial mal-
functioning results in oxidative stress and ROS production
as previously suggested [40].
Behavioral changes and striatal damage
In previous reports, it has been described that 3-NP-treated
mice exhibit a progressive development of several behav-
ioral changes and alterations in motor activities, including
orofacial dyskinesias, increase in grooming, and cognitive
impairments [45, 46]. Using chronic administration of 3-NP
in low doses, we found a reduction in the latency to clasp
and abnormal clasping of the hind limbs and forelimbs after
being suspended by the tail. These results are in agreement
with observations made in transgenic HD mice [47].
Besides muscle alteration, striatal tissue from 3-NP-
treated mice exhibited an increase in damaged cells
(Fig. 7) and a reduction in calbindin positive neurons (data
not yet published). In transgenic HD mice, the develop-
ment of behavioral symptoms correlates with a medium
spiny neuron reduction in the striatum, identified by cal-
bindin [47]. We conclude that low doses of 3-NP also
affects striatal cells but to a lesser degree.
Functional implications of 3-NP effects at the periphery
Using systemic (i.p.), low doses of 3-NP, the present study
provided an opportunity to test the functional significance
of a reduced mitochondrial complex not just at the fore-
brain but also at the peripheral level. This approach showed
that inhibition of oxidative phosphorylation induced
252 Neurol Sci (2011) 32:241–254
123

changes in muscle enzymatic activity and ultrastructure. 3-
NP has been used as a model to study HD. If this mito-
chondrial toxin really imitates the neuropathological
changes observed in patients afflicted with HD, it is plau-
sible that abnormal mitochondrial function in non-neural
tissue during first stages of the disease may be responsible
for the body weight loss observed in patients afflicted with
the illness as a result of muscle damage [12, 15]. It is
interesting that experiments using uncoupling proteins of
oxidative phosphorylation, such as UCP proteins and
dinitrophenol, also produce a loss of weight in experi-
mental animals [48].
Although the cause of weight loss remains unclear in
several pathologies, it is possible that changes such as the
ones described in the present study could exacerbate
metabolic activity during the early stages of neurological
illnesses, producing high metabolic demands to counteract the
bioenergetics failure [49]. All these changes may generate
an increase in the energy consumed by the muscles; this
hypothesis has been suggested for many of the diabetogenic
neurodegenerative disorders in which alterations in oxida-
tive phosphorylation and mitochondrial metabolism are
compromised [50]. Also, in models of food restriction or
malnutrition, an animal’s size and body weight are most
affected to preserve brain functions [51, 52].
Our experimental findings could have implications for
the early clinical management of diseases in which mito-
chondrial failure is presumed because muscle atrophy
could conceivably exacerbate the pathological process.
Ongoing work in our laboratory is designed to further
characterize why relatively low insults in oxidative phos-
phorylation lead to brain and muscle atrophy in an animal
model of HD.
Acknowledgments We thank Dr. P. Maldonado for processing
muscle samples for LPO, Dr. I. Terrazas for his lab support in NO
evaluation, H. Barrera M Sc for his help in image acquisition and the
reviewers whose comments improved greatly the paper. This work
was supported by Consejo Nacional de Ciencia y Tecnologıa 42598
Grant, Programa de Apoyo a Proyectos de Investigacion e Innovacion
Tecnologica; IN209103 and IN201307 Grants.
References
1. Brennan WAJ, Bird ED, Aprille JR (1985) Regional mitochon-
drial respiratory activity in Huntington’s disease brain. J Neuro-
chem 44:1948–1950
2. Mann VM, Cooper JM, Javoy-Agid F, Agid Y, Jenner P, Schapira
AH (1990) Mitochondrial function and parental sex in Hunting-
ton0s disease. Lancet 336:749
3. Beal MF (2005) Mitochondria take center stage in aging and
neurodegeneration. Ann Neurol 58:495–505
4. Benchoua A, Trioulier Y, Zala D, Gaillard MC, Lefort N, Dufour
N, Saudou F, Elalouf JM, Hirsch E, Hantraye P, Deglon N,
Brouillet E (2006) Involvement of mitochondrial complex II
defects in neuronal death produced by N-terminus fragment of
mutated huntingtin. Mol Biol Cell 17:1652–1663
5. Brouillet E, Conde F, Beal MF, Hantraye P (1999) Replicating
Huntington’s disease phenotype in experimental animals. Prog
Neurobiol 59:427–468
6. Brouillet E, Jacquard C, Bizat N, Blum D (2005) 3-Nitroprop-
ionic acid: mitochondrial toxin to uncover physiopathological
mechanism underlaying striatal degeneration in Huntington0sdisease. J Neurochem 95:1521–1540
7. Zierath JR, Hawley JA (2004) Skeletal muscle fiber type: influ-
ence on contractile and metabolic properties. PLOS Biol
2(10):337–348
8. Schabitz WR, Glatz K, Schuhan C, Sommer C, Berger C, Sch-
waninger M, Hartmann M, Hilmar Goebel H, Meinck HH (2003)
Severe forward flexion of the trunk in Parkinson’s disease: focal
myopathy of the paraspinal muscles mimicking camptocormia.
Mov Disord 18:408–414
9. Bradshaw JL, Phillips JG, Dennis C, Mattingley JB, Andrewes D,
Chiu E, Pierson JM, Bradshaw JA (1992) Initiation and execution
of movement sequences in those suffering from and at-risk of
developing Huntington’s disease. J Clin Exp Neuropsychol
14:179–192
10. Aron AR, Watkins L, Sahakian BJ, Monsell S, Barker RA,
Robbins TW (2003) Task-set switching deficits in early-stage
Huntington’s disease: implications for basal ganglia function.
J Cogn Neurosci 15:629–642
11. Abbruzzese G, Berardelli A (2003) Sensorimotor integration in
movement disorders. Mov Disord 18:231–240
12. Robbins AO, Ho AK, Barker RA (2006) Weight changes in
Huntington’s disease. Eur J Neurol 13(8):e7
13. Sathasivam K, Hobbs C, Turmaine M, Mangiarini L, Mahal A,
Bertaux F, Wanker EE, Doherty P, Davies SW, Bates G (1999)
Formation of polyglutamine inclusions in non-CNS tissue. Hum
Mol Gen 8:813–822
14. Ribchester RR, Thomson D, Wood NI, Hinks T, Gillingwater TH,
Wishart TM, Court FA, Morton AJ (2004) Progressive abnor-
malities in skeletal muscle and neuromuscular junctions of
transgenic mice expressing the Huntington’s disease mutation.
Eur J Neurosci 20:3092–3114
15. Stoy N, McKay E (2000) Weight loss in Huntington’s disease.
Ann Neurol 48:130–131
16. Simoneau JA, Colberg SR, Thaete FL, Kelley DE (1995) Skeletal
muscle glycolytic and oxidative enzyme capacities are determi-
nants of insulin sensitivity and muscle composition in obese
women. FASEB J 9:273–278
17. Petersen KF, Durour S, Befroy D, Garcıa R, Shulman GI (2004)
Impaired mitochondrial activity in the insuline resistant offspring
of patients with type 2 diabetes. N Engl J Med 350:664–671
18. Beal MF, Brouillet E, Jenkins BG, Ferrante RJ, Kowall NW,
Miller JM, Storey E, Srivastava R, Rosen BR, Hyman BT (1993)
Neurochemical and histologic characterization of striatal excito-
toxic lesions produced by the mitochondrial toxin 3-nitroprop-
ionic acid. J Neurosci 13:4181–4192
19. Borlongan CV, Nishino H, Sanberg PR (1997) Systemic but not
intraparenquimal administration of 3-nitropropionic acid mimics
the neuropathology of Huntington’s disease: a speculative
explanation. Neurosci Res 28:185–189
20. Alexi T, Hughes PE, Knusel B, Tobin AT (1998) Metabolic
compromise with systemic 3-Nitropropionic acid produces stri-
atal apoptosis in Sprague-Dawley rats but no in BALB/c ByJ
mice. Exp Neurol 153:74–93
21. Gabrielson KL, Hogue BA, Bohr VA, Cardounel AJ, Nakajima
W, Kofler J, Zweier JL, Rodriguez ER, Martin LJ, de Souza Pinto
NC, Bressier J (2001) Mitochondrial toxin 3-Nitropropionic acid
induces cardiac and neurotoxicity differentially in mice. Am J
Pathol 159:1507–1520
Neurol Sci (2011) 32:241–254 253
123

22. Mansouri A, Muller FL, Liu Y, Ng R, Faulkner J, Hamilton M,
Richardson A, Huang TT, Epstein CJ, Van Remmen H (2006)
Alterations in mitochondrial function, hydrogen peroxide release
and oxidative damage in mouse hind-limb skeletal muscle during
aging. Mech Ageing Dev 127:298–306
23. Mailloux RJ, Beriault R, Lemire J, Singh R, Chenier DR, Hamel
RD, Appanna VD (2007) The tricarboxylic acid cycle, an ancient
metabolic network with a novel twist. PLoS ONE 2(1):e690
24. Hildebrand M, Goslow GE Jr (2002) Muscles and electric organs.
In: Analysis of vertebrate structure, 5th edn. John Wiley & Sons
Inc, New York, pp 169–178
25. Leary SC, Lyons CN, Rosenberger AG, Ballantyne JS, Stillman J,
Moyes CD (2003) Fibre-type differences in muscle mitochondrial
profiles. Am J Physiol Regul Integr Comp Physiol 285:817–826
26. Deveci D, Marshall JM, Egginton S (2001) Relationship between
capillary angiogenesis, fibre type, and fibre size in chronic sys-
temic hypoxia. Am J Physiol Heart Circ Physiol 281:241–252
27. Schulz JB, Matthews RT, Jenkins BG, Ferrante RJ, Siwek D,
Henshaw DR, Cipolloni PB, Mecocci P, Kowall NW, Rosen BR,
Beal MF (1995) Blockade of neuronal nitric oxide synthase
protects against excitotoxicity in vivo. J Neurosci 15:8419–8429
28. Bassel-Duby R, Olson EN (2006) Signaling pathways in skeletal
muscle remodeling. Annu Rev Biochem 75:19–37
29. Wong-Riley MTT (1989) Cytochrome oxidase: an endogenous
metabolic marker for neuronal activity. TINS 12:94–101
30. Di Mauro S, Tanji K, Binilla E, Pallotti F, Schon EA (2002)
Mitochondrial abnormalities in muscle and other aging cells:
classification, causes and effects. Muscle Nerve 26:597–607
31. Hansen-Smith FM, Watson L, Joswiak GR (1989) Postnatal
changes in capillary density of rat sternomastoid muscle. Am J
Physiol 257:344–347
32. Wagatsuma A, Tamaki H, Ogita F (2005) Capillary supply and
gene expression of angiogenesis-related factors in murine skeletal
muscle following denervation. Exp Physiol 90:403–409
33. Oettgen P (2006) Transcriptional regulation of vascular devel-
opment. Cir Res 89:380–388
34. Egginton S, Hudlicka O (2000) Selective long-term electrical
stimulation of fast glycolytic fibres increases capillary supply but
not oxidative enzyme activity in rat skeletal muscles. Exp Physiol
85:567–573
35. Fuentes I, Cobos AR, Segade LAG (1998) Muscle fibre types and
their distribution in the biceps and triceps branchii of the rat and
rabbit. J Anat 192:203–210
36. Ovalle WK, Dow PR, Nahirney PC (1999) Structure and distri-
bution and innervation of muscle spindles in avian fast and slow
skeletal muscle. J Anat 194:381–394
37. Riepe MW, Ludolph AC (1997) Chemical preconditioning a
cytoprotective strategy. Mol Cell Biochem 174:249–254
38. Aure K, Fayet G, Leroy JP, Lacene E, Romero NB, Lombes A
(2006) Apoptosis in mitochondrial myopathies is linked to
mitochondrial proliferation. Brain 129:1249–1259
39. Bossy-Wetzel E, Barsoum MJ, Godzik A, Schwarzenbacher R,
Lipton SA (2003) Mitochondrial fission in apoptosis, neurode-
generation and aging. Cur Op Cell Biol 15:706–716
40. Barsoum MJ, Yuan H, Gerencser AA, Liot G, Kushnareva Y,
Graber S, Kovacs I, Lee WD, Waggoner J, Cui J, White AD,
Bossy B, Martinou JC, Youle RJ, Lipton SA, Ellisman MH,
Perkins GA, Bossy-Wetzel E (2006) Nitric oxide induced mito-
chondrial fission is regulated by Dynamin related GTPases in
neurons. EMBO J 25:3900–3911
41. Barral JM, Epstein HF (1999) Protein machines and self assembly
in muscle organization. Bioessays 21:813–823
42. Clark KA, Mc Elhinny AS, Beckerle MC, Gregorio CC (2002)
Striated muscle cytoarchitecture: an intricate web of form and
function. Ann Rev Cell Dev Biol 18:637–706
43. Obermann WMJ, Gautel M, Steiner F, van der Ven PFM, Weber
K, Furst DO (1996) The structure of the sarcomeric M Band:
Localization of defined domains of myomesin, M-protein, and the
250-kD carboxy-terminal region of titin by immunoelectron
microscopy. J Cell Biol 134:1441–1453
44. Carpenter S, Karpati G. Pathology of skeletal muscle (2002)
Churchill Livingstone; London, pp. 634–635
45. Carter RJ, Lione LA, Humby T, Mangiarini L, Mahal A, Bates
GP, Dunnett SB, Morton AJ (1999) Characterization of pro-
gressive motor deficits in mice transgenic for the human Hun-
tington’s disease mutation. J Neurosci 19:3248–3257
46. Murphy KP, Carter RJ, Lione LA, Mangiarini L, Mahal A, Bates
GP, Dunnett SB, Morton AJ (2000) Abnormal synaptic plasticity
and impaired spatial cognition in mice transgenic for exon 1 of
the human Huntington’s disease mutation. J Neurosci
20:5115–5123
47. Hickey MA, Chesselet MF (2003) The use of transgenic and
knock-in mice to study Huntington’s disease. Cytogenet Genome
Res 100:276–286
48. Zaninovich AE (2005) Role of uncoupling proteins UCP1, UCP2
and UCP3 in energy balance, type 2 diabetes and obesity: syn-
ergism with the thyroid. Medicina 65:163–169
49. Mochel F, Charles P, Seguin F, Barritaul S, Coussieu C, Le
PerinL, Bouc Y, Gervais C, Carcelain G, Vassault A, Feingold J,
Rabier D, Durr A (2007) Early energy deficit in Huntington
disease: identification of a plasma biomarker traceable during
disease progression. PLoS ONE 7:e647
50. Ristow M (2004) Neurodegenerative disorders associated with
diabetes mellitus. J Mol Med 82:510–529
51. Woodall SM, Breier BH, Johnston BM, Gluckman PD (1996) A
model of intrauterine growth retardation caused by chronic
maternal undernutrition in the rat: effects on the somatotrophic
axis and postnatal growth. J Endocrinol 150:231–242
52. Clapham JC (2004) Treating obesity: pharmacology of energy
expenditure. Cur Drug Targets 5:309–332
254 Neurol Sci (2011) 32:241–254
123