Characterization of Endocrine Disrupting Effects of Bisphenol ...

STEATOHEPATITIS/METABOLIC LIVER DISEASE
Low Doses of Bisphenol A Induce Gene ExpressionRelated to Lipid Synthesis and Trigger Triglyceride
Accumulation in Adult Mouse LiverAlice Marmugi,1,2 Simon Ducheix,1,2 Frederic Lasserre,1,2 Arnaud Polizzi,1,2 Alain Paris,3
Nathalie Priymenko,1,2 Justine Bertrand-Michel,4 Thierry Pineau,1,2 Herve Guillou,1,2
Pascal G.P. Martin,1,2 and Laıla Mselli-Lakhal1,2
Changes in lifestyle are suspected to have strongly influenced the current obesity epidemic.Based on recent experimental, clinical, and epidemiological work, it has been proposedthat some food contaminants may exert damaging effects on endocrine and metabolicfunctions, thereby promoting obesity and associated metabolic diseases such as nonalco-holic fatty liver disease (NAFLD). In this work, we investigated the effect of one suspiciousfood contaminant, bisphenol A (BPA), in vivo. We used a transcriptomic approach inmale CD1 mice exposed for 28 days to different doses of BPA (0, 5, 50, 500, and5,000 lg/kg/day) through food contamination. Data analysis revealed a specific impact oflow doses of BPA on the hepatic transcriptome, more particularly on genes involved inlipid synthesis. Strikingly, the effect of BPA on the expression of de novo lipogenesis fol-lowed a nonmonotonic dose-response curve, with more important effects at lower dosesthan at the higher dose. In addition to lipogenic enzymes (Acc, Fasn, Scd1), the expressionof transcription factors such as liver X Receptor, the sterol regulatory element binding pro-tein-1c, and the carbohydrate responsive element binding protein that govern the expres-sion of lipogenic genes also followed a nonmonotonic dose-response curve in response toBPA. Consistent with an increased fatty acid biosynthesis, determination of fat in the livershowed an accumulation of cholesteryl esters and of triglycerides. Conclusion: Our worksuggests that exposure to low BPA doses may influence de novo fatty acid synthesis throughincreased expression of lipogenic genes, thereby contributing to hepatic steatosis. Exposureto such contaminants should be carefully examined in the etiology of metabolic diseasessuch as NAFLD and nonalcoholic steatohepatitis. (HEPATOLOGY 2012;55:395-407)
Changes in diet and lifestyle are leading causesfor the emergence of the metabolic diseasesassociated with obesity. Recently, the hypothe-
sis that a number of food contaminants acting asendocrine-disrupting chemicals may influence meta-bolic diseases has been proposed.1
Bisphenol A (BPA) is an endocrine disruptor highlyprevalent in our environment. It is used as the mono-mer of polycarbonate plastics and epoxy resins.2 Thehuman population is widely exposed to low levels ofBPA, primarily by way of the diet by migration fromfood and beverage containers.2 93% of urine samples
Abbreviations: Acc, acetyl-CoA carboxylase; BPA, bisphenol A; ER, estrogen receptor; FA, fatty acid; Fasn, fatty acid synthase; NAFLD, nonalcoholic fatty liverdisease; NASH, nonalcoholic steatohepatitis; PPAR, peroxisome proliferator-activated receptor; Scd1, stearoyl-CoA desaturase-1.From the 1INRA, TOXALIM (Research Centre in Food Toxicology), Toulouse, France; 2Universite de Toulouse, INP, UPS, TOXALIM, Toulouse, France; 3INRA,
Metarisk, Paris, France; and 4MetaToul, Plateau de lipidomique, INSERM, Toulouse, France.Received April 20, 2011; accepted August 31, 2011.Supported by grants from the ANR (PNRA-PlastImpact program and CES PerinaTox program) and by the INRA-FORMAS France-Sweden cooperative
program. A.M. is funded by a grant from INRA Animal Health Department and the Region Midi-Pyrenees. S.D. is funded by a grant from the Ministere del’Enseignement Superieur et de la Recherche.Address reprint requests to: Pascal G.P. Martin, ToxAlim UMR1331 INRA/INPT/UPS, Integrative Toxicology & Metabolism group, 180 chemin de
Tournefeuille, BP 93173, 31027 Toulouse Cedex 3, France. E-mail: [email protected]; fax: þ33 561285310.CopyrightVC 2011 by the American Association for the Study of Liver Diseases.View this article online at wileyonlinelibrary.com.DOI 10.1002/hep.24685Potential conflict of interest: Nothing to report.Additional Supporting Information may be found in the online version of this article.
395

collected from the National Health and NutritionExamination Survey (NHANES III) cohort revealeddetectable levels of BPA.3 As a protective measure theU.S. Environmental Protection Agency and the Euro-pean Food Safety Agency have established a tolerabledaily intake (TDI) of 50 lg/kg/day derived by apply-ing an uncertainty factor of 100 to the no-observed-adverse-effect level (NOAEL) of 5,000 lg/kg/daymainly based on liver and reproductive toxicity. How-ever, recent animal studies revealed that exposure toenvironmentally relevant BPA doses below the TDIalters biological functions such as reproductive func-tions, brain functions, and metabolic processes byinterfering with endocrine signaling pathways.4
Recent epidemiological studies showed an associa-tion between urinary levels of BPA and the prevalenceof diabetes, cardiovascular diseases, and elevatedmarkers of liver toxicity.5,6 These studies pointed tometabolic disorders as a potential impact of exposureto low doses of BPA. In agreement with this hypothe-sis, experimental evidence has accumulated that BPAcan alter several aspects of metabolic functions inrodents. Animal studies showed an increased bodyweight in offspring of mothers exposed to BPA duringgestation and/or lactation period.7 The increase inbody weight was more pronounced and persistent infemales than males and the effects were stronger at lowcompared with high doses of exposure. Such nonmo-notonic dose-response relationship have been reportedfor many actions of BPA.8-11 How perinatal BPAexposure may exert these effects remains to be deter-mined, but potential target tissues of BPA actionincluding adipose tissue and pancreas have beenstudied. Gestational exposure to BPA was shown toincrease adipose tissue mass at weaning associated withadipocyte hypertrophy and overexpression of lipogenicgenes.9,10,12 Low BPA doses were also shown toincrease leptin and to decrease adiponectin secre-tion.9,13 In vitro studies documented an increased lipidaccumulation and adipocyte differentiation afterexposure of 3T3L1 preadipocytes to BPA and otherendocrine-disrupting chemicals.14-16
Nadal and colleagues showed that BPA increases in-sulin synthesis and secretion with concurrent impactson glucose homeostasis.17,18 In vivo injection of 1, 10,or 100 lg/kg/day of BPA to adult male mice resultedin a significant dose-dependent decrease in glycemia inparallel to an increase in insulin from 30 minutes afterinjection.19 Isolated islets of pancreatic b-cells exposedto a range of BPA doses showed increased insulin con-tent following an inverted U-shape dose-responsecurve.20 The same group recently reported on similar
effects in pregnant mice and their offspring exposed to10 or 100 lg/kg/day of BPA.21
Thus, both the adipose tissue and the pancreas haveemerged as important targets of low BPA doses.Despite the important roles of the liver in whole bodyenergy homeostasis, little is known about the hepaticimpacts of exposure to environmentally relevant dosesof BPA. Here we evaluated the effects of oral exposureto 50 lg/kg/day (TDI) or 5,000 lg/kg/day (NOAEL)of BPA on mouse liver transcriptome. Initial genome-wide microarray screenings evidenced a predominantimpact of low BPA doses on lipid biosynthesis path-ways. Using a wide range of doses, we showed thatthese effects are specific to low, environmentallyrelevant doses of BPA and correlate with an increasedhepatic accumulation of neutral lipids.
Materials and Methods
Animals and Treatments. Six-week-old male CD1mice (Charles River, Les Oncins, France) divided intofive groups (n ¼ 6/group) were administered BPA byway of the diet for 28 days (housing at 22 6 2�C,12-hour light/dark). A standard diet (ingredients fromSAFE Diet, Augy, France) was formulated from maizestarch (49%), saccharose (24.4%), casein (14%),minerals mix (5%), peanut oil (2.5%), rapeseed oil(2.5%), cellulose (2%), vitamins mix (0.5%), andmethionine (0.1%). BPA (4,40-dihydroxy-2,2-diphenyl-propane, CAS# 80-05-7, Sigma-Aldrich, France) wasincorporated in the diet at 0 (controls), 0.05, 0.5, 5,or 50 ppm. Considering a diet consumption of 10%of the body weight per day, this corresponds to anoral exposure of 0 (controls), 5, 50 (TDI), 500, or5,000 lg of BPA/kg BW/day (NOAEL), respectively.In vivo studies were conducted under E.U. guidelinesfor the use and care of laboratory animals and wereapproved by an independent ethics committee.Blood and Organ Sampling. Blood was collected
at the submandibular vein in heparin-coated capilla-ries. Plasma was prepared by centrifugation (2,000g,10 minutes) and kept at �80�C until use. Followingeuthanasia, the liver and the perigonadic white adiposetissue (pWAT) were removed, weighed, dissected,snap-frozen in liquid nitrogen, and stored at �80�Cuntil use. Sampling was performed on two consecutivedays (n ¼ 3 mice/group per day) but no block effectwas statistically evidenced.Gene Expression Studies. Total RNA was extracted
with TRIzol reagent (Invitrogen, Cergy Pontoise,France). Transcriptomic profiles were obtained using
396 MARMUGI ET AL. HEPATOLOGY, February 2012

Agilent Whole Mouse Genome microarrays (4 � 44k)following the manufacturer’s instructions. Microarraydata and all experimental details are available in theGene Expression Omnibus (GEO) database (accessionGSE26728). For real-time quantitative polymerasechain reaction (qPCR), total RNA samples (2 lg)were reverse-transcribed using the High CapacitycDNA Reverse Transcription Kit (Applied Biosystems,Courtaboeuf, France). Primers for SYBR Green assaysare presented in Supporting Table 1. Amplificationswere performed on an ABI Prism 7300 Real TimePCR System (Applied Biosystems). qPCR data werenormalized by TATA-box binding protein (TBP) mes-senger RNA (mRNA) levels and analyzed withLinRegPCR.22
Immunoblot Analysis. Protein extracts were pre-pared using the Proteo-Jet cytoplasmic and nuclearextraction kit (Fermentas, Saint-Remy-les-Chevreuses,France). Following separation by sodium dodecyl sul-fate-polyacrylamide gel electrophoresis (SDS-PAGE),liver proteins were probed with primary antibodiesfrom Cell Signaling (b-actin: 4970; lamin A/C: 2032;ACLY: 4332; ACLY-P: 4331; ACC: 3662; FAS: 3189),Abcam (estrogen receptor [ER]: ab16460; GK:ab37796), Santa Cruz Biotechnology (LXR: sc-13068;SCD1: sc-14719), Lab Vision (SREBP-1c: MS-1207-P1ABX), Novus Biological (CHREBP: nb400-135),and secondary antibodies from Biotium (CF680 orCF770-labeled). G6PASE antibody was a gift fromDr. Gilles Mithieux.23 The images were analyzed onthe Odyssey Infrared Imaging system (Li-Cor, Lincoln,NE). Band intensities were normalized to those ofb-actin or lamin A/C.Biochemical Assays. Hepatic lipid content and FA
composition were determined as described.24 Plasmalevels of triglycerides, glucose, total cholesterol, low- orhigh-density lipoprotein (LDL, HDL) cholesterol weredetermined on a biochemical analyzer, COBAS-MIRAþ. Plasma insulin was assayed with the ultrasen-sitive mouse insulin enzyme-linked immunosorbentassay (ELISA) kit (Crystal Chem, Downers Grove, IL).Histology. Frozen liver samples were embedded in
Neg 50 (Fisher Scientific, Courtaboeuf, France). Sec-tions (5 lm, Leica RM2145 microtome, Nanterre,France) were stained with Oil-Red-O and hematoxy-lin/eosin and visualized with a Leica DFC300 camera(Leica).Statistical Analysis. All data were analyzed using R
(www.r-project.org). Microarray data were processedwith Bioconductor packages (www.bioconductor.org)as described in GEO entry GSE26728. Genes withq-value � 0.1 were considered differentially expressed
between BPA-treated and control animals. The enrich-ment of Gene Ontology (GO) Biological Processeswas evaluated using a conditional hypergeometric test(GOstats package). For data other than microarraydata, differential effects were analyzed by analysis ofvariance (ANOVA) followed by Student’s t tests with apooled variance estimate. P � 0.05 was consideredsignificant.
Results
Low BPA Doses Increase Plasma Insulin. MaleCD1 mice were exposed for 4 weeks to 0, 5, 50, 500,or 5,000 lg/kg/day of BPA by way of the diet. BPAexposure had no effect on body weight gain and rela-tive liver weight (Fig. 1A). However, a significantincrease in pWAT weight was observed in the animalsexposed to 50 lg/kg/day (Fig. 1A). Plasma insulin levelswere significantly increased following exposure to 5, 50,and 500 lg BPA/kg/day (Fig. 1B) with a maximal effectat the lowest dose. BPA had no significant effect onplasma glucose and total, LDL- or HDL-cholesterollevels. The animals exposed to 500 lg BPA/kg/daydisplayed a significant increase in plasma triglyceridelevels (Fig. 1B). To evaluate whether these observationswere specific to a mouse strain and of a mode of BPAexposure, we performed an experiment in C57BL/6Jmice exposed to the same BPA doses by way of thewater. Although the modulations were generally oflower amplitude than in CD1 mice, the results obtainedin this independent experiment were consistent withthose presented here (Supporting Fig. 1).Effects of BPA Reference Doses on Liver Tran-
scriptome. Using microarrays, we compared the tran-scriptome of liver samples from mice exposed to BPAreference doses (TDI: 50 lg/kg/day and NOAEL:5,000 lg/kg/day) to those from control animals. Theglobal impact of BPA-TDI or BPA-NOAEL is illus-trated by the distribution of raw P-values for geneexpression changes between BPA-treated groups andthe control group (Fig. 2A). The overabundance oflow P-values reflects the amplitude of the impact onthe transcriptome. Exposure to BPA-TDI (174 uniquegenes differentially expressed compared with controls:108 upregulated and 66 down-regulated; SupportingTable 2) had a stronger impact on liver transcriptomecompared with BPA-NOAEL (0 genes with q-value�10%). A heatmap of the average intensities for thecorresponding 196 unique oligonucleotide probes illus-trates the specific impact of BPA-TDI on the expres-sion of these genes compared with BPA-NOAEL.Among the up-regulated genes the nine GO categories
HEPATOLOGY, Vol. 55, No. 2, 2012 MARMUGI ET AL. 397

significantly overrepresented (q-value � 10%) were allrelated to lipid biosynthesis (Fig. 2B). Consistently,genes with increased expression at BPA-TDI includedgenes involved in de novo fatty acid (FA) synthesis(Acly: ATP citrate lyase, Acaca: Acetyl-CoA carboxylasealpha, Acacb: Acetyl-CoA carboxylase beta, Fasn) andelongation (Elovl6: long-chain FA elongase 6), in tri-glyceride synthesis (Gpat: glycerol-3-phosphate acyl-transferase) and cholesterol synthesis (Mvd: mevalonate(diphospho) decarboxylase, Lss: lanosterol synthase).The most strongly induced gene at BPA-TDI wasPnpla3 (patatin-like phospholipase domain containing3), a gene whose function is still poorly understoodbut whose genetic variability has been associated withthe severity of nonalcoholic steatohepatitis (NASH).25
Another member of this family, Pnpla5 (patatin-likephospholipase domain containing 5) was also inducedat the TDI. The Thrsp-Spot14 (thyroid hormoneresponsive Spot14 homolog) is the second most
strongly induced gene at BPA-TDI versus control. Itsoverexpression was previously shown to increase lipo-genesis in human hepatocytes.26 To identify enrichedfunctional categories among the regulated genes inde-pendently of the q-value/FDR threshold, we used geneset enrichment analysis (GSEA, data not shown).Results of GSEA for the up-regulated genes alsopointed to increased lipogenesis as the main and spe-cific impact of BPA-TDI. Interestingly, GSEA identi-fied an enrichment of peroxisome proliferator-activatedreceptor alpha (PPARa) target genes involved in FAoxidation among the down-regulated genes for bothBPA reference doses.Low BPA Doses Induce Hepatic Gene Expression
Related to Lipid Biosynthesis. Based on microarrayresults, we evaluated by qPCR the effects of a widerange of BPA doses (0, 5, 50, 500, and 5,000 lg/kg/day) on the expression of genes related to hepatic lipidmetabolism. Figure 3 illustrates that the effects of BPA
Fig. 1. Effects of different doses of BPA on body weight gain, on liver and adipose tissue weight, and on plasma parameters. (A) Body weightgain, liver weight (relative to body weight), and perigonadic white adipose tissue (pWAT) weight (relative to body weight) of male CD1 miceexposed orally for 28 days to different BPA doses (0, 5, 50, 500, and 5,000 lg/kg/day, n ¼ 6 animals/group). (B) Quantification of plasma in-sulin, glucose, triglycerides, cholesterol (total, HDL, LDL) from the same animals.
398 MARMUGI ET AL. HEPATOLOGY, February 2012

on key enzymes involved in lipogenesis (Fig. 3A), cho-lesterol biosynthesis (Fig. 3B), and to a lesser extent inglucose metabolism (Fig. 3C) follow a nonmonotonic
dose-response relationship. Key microarray findingswere confirmed for Acly, Acaca, Acacb, Elovl6, Fasn,Thrsp-Spot14 (Fig. 3A), Mvd, Lss (Fig. 3B), Gpat,
Fig. 2. Effects of BPA reference doses on liver transcriptome. mRNAs were extracted from the livers of male CD1 mice (n ¼ 6/group) exposedor not to a low (TDI: 50 lg/kg/day) or high dose (NOAEL: 5,000 lg/kg/day) of BPA. Hepatic transcriptomes were analyzed using Agilent WholeMouse Genome microarrays (4 � 44K). (A) Distribution of raw P-values corresponding to the comparison between BPA-treated and control group.The dashed lines illustrate the flat histogram that is expected in the absence of BPA effect. The overabundance of low P-values (peak on the leftof the histogram) illustrates graphically the global impact of the treatments on the transcriptome. The number of significant (q-value �10%) up-and down-regulated probes and of the corresponding number of genes are indicated. (B) The heatmap for the 196 probes significantly regulatedat BPA-TDI versus control illustrates the specific impact of the low dose (50 lg/kg/day) compared with the high dose (5,000 lg/kg/day). Redand green colors indicate values above and below the mean, respectively. Black color indicates values close to the mean. Only the mean valuesfor each group are represented in the heatmap but the hierarchical clustering was obtained from individual values using 1-Pearson correlationcoefficient as distance and the Ward’s criterion for agglomeration. Analysis of GO biological functions significantly enriched (q-value �10%)among the up-regulated genes clearly pointed to processes linked to lipid metabolism as the most robustly enriched.
HEPATOLOGY, Vol. 55, No. 2, 2012 MARMUGI ET AL. 399
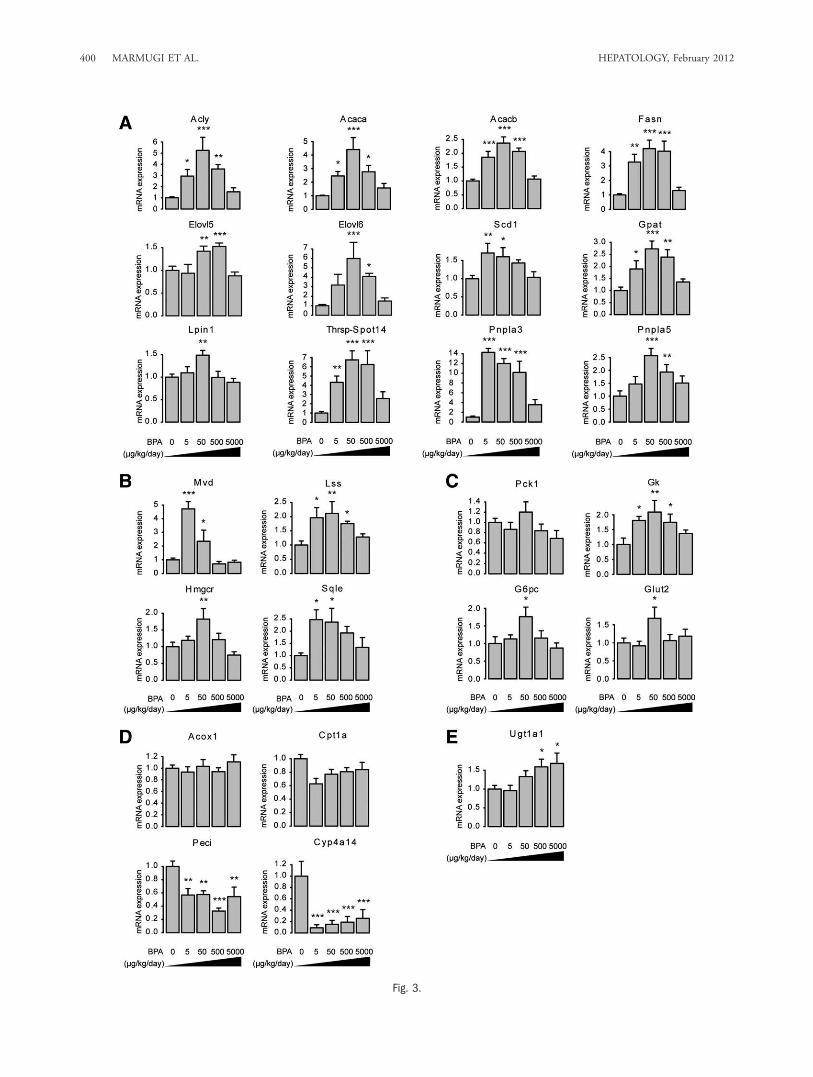
Fig. 3.
400 MARMUGI ET AL. HEPATOLOGY, February 2012

Pnpla3, and Pnpla5 genes (Fig. 3A). Similar patternsof expression were also observed for Elovl5 (FA elon-gation), Scd1 (synthesis of monounsaturated FA),Lpin1 (triglyceride synthesis, Fig. 3A), Hmgcr, andSqle (cholesterol biosynthesis, Fig. 3B). Because he-patic glucose and lipid metabolism are tightly linked,we analyzed the expression of genes involved in glu-cose homeostasis. A similar effect of BPA was observedfor both the phosphoenolpyruvate carboxykinase 1(Pck1) and the glucose-6-phosphatase (G6pc), whichare involved in gluconeogenesis (Fig. 3C). The mRNAexpression of glucokinase (Gk) which regulates glycoly-sis was also increased (Fig. 3C). An induction of themain hepatic glucose transporter (Glut2) was alsoobserved (Fig. 3C). These effects on glucose metabo-lism-related genes were almost exclusively significant atBPA-TDI and were of more modest amplitude com-pared with those affecting genes involved in lipidmetabolism.Based on GSEA results, we evaluated the effects of
BPA exposure on the expression of genes involved inFA oxidation. BPA had no effect on the expression ofAcox1 or Cpt1a involved in peroxisomal and mito-chondrial b-oxidation, respectively (Fig. 3D). However,all BPA doses reduced the expression of Peci involvedin the metabolism of unsaturated FA and of Cyp4a14,two target genes of PPARa (Fig. 3D).We also studied the impact of BPA on the mRNA
expression of genes involved in FA uptake and verylow-density lipoprotein (VLDL) secretion. The resultsobtained did not suggest an upregulation of thesepathways at low BPA doses (Supporting Fig. 2).Finally, we searched for a more classical monotonic
dose-response relationship between BPA exposure andgene expression. This led us to show that the expres-sion of UDP glucuronyltransferase 1a1 (Ugt1a1), anenzyme involved in the phase II metabolism of xenobi-otics and hormones, including estradiol is dose-dependently increased by BPA (Fig. 3E).
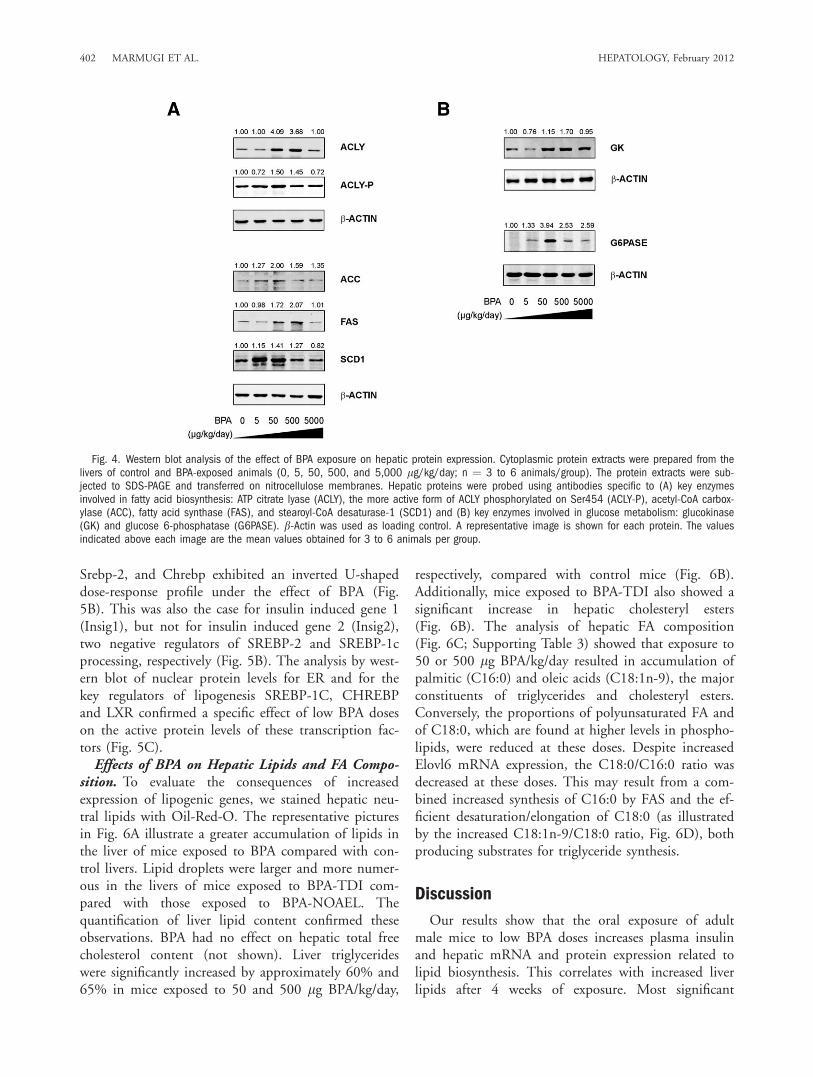
Western blot analysis for key lipogenic proteins(ACLY and its more active form phosphorylated onSer454: ACLY-P, ACC, FAS, and SCD1), for GK, andfor G6PASE showed protein levels consistent with themRNA changes (Fig. 4).Effects of BPA on Hepatic Transcription Factors.
In order to gain insight into the transcriptional mecha-nisms which could contribute to the effects of BPA onliver gene expression, we measured the expression ofdifferent transcription factors involved in the regula-tion of hepatic energy metabolism. These included sev-eral nuclear receptors: PPARa; the adipogenic regulatorPPARc; PPARb/d; liver X receptor alpha (LXRa);ERa; constitutive androstane receptor (CAR); preg-nane X receptor (PXR), and the hepatocyte nuclearfactor 4a (HNF4a). BPA had no significant effect onthe expression of Pxr and Hnf4a (Fig. 5A). Theexpression of Car was highest in control mice and wassignificantly reduced in mice exposed to 5 and 50 lgBPA/kg/day (Fig. 5A). On the opposite, ERa expres-sion was lowest in control mice and was significantlyincreased in mice exposed to 5 and 50 lg/kg/day (Fig.5A). We did not detect the expression of ERb in liversamples. Ppara expression was decreased almost 3-foldin mice exposed to 5 or 500 lg BPA/kg/day only (Fig.5A). Pparb/d expression was significantly increased byabout 50% in mice exposed to 500 lg BPA/kg/daybut a trend toward increased expression was alsoobserved at 5 and 50 lg/kg/day (Fig. 5A). Pparc andLxra expression were clearly increased by 4- and 2-fold, respectively, in the liver of mice exposed to BPA-TDI only (Fig. 5A). We also measured the expressionof sterol regulatory element binding protein 1c(SREBP-1c), a major regulator of de novo lipogene-sis,27 of sterol regulatory element binding protein 2(SREBP-2), which regulates cholesterol metabolism,28
and of carbohydrate response element binding protein(ChREBP), a transcriptional regulator of glucose andlipid metabolism.29 The expression of Srebp-1c,
Fig. 3. Effects of BPA exposure on hepatic gene expression related to lipogenesis, cholesterol biosynthesis, glucose metabolism, and fattyacid oxidation. Hepatic mRNAs from male CD1 mice exposed to different doses of BPA (0, 5, 50, 500, and 5,000 lg/kg/day) were used toassay by qPCR the relative expression of genes involved in (A) lipogenesis (Acly: ATP citrate lyase, Acaca: acetyl-CoAcarboxylase alpha, Acacb:acetyl-CoAcarboxylase beta, Fasn: fatty acid synthase, Elovl5 and Elovl6: elongation of long chain fatty acids family members 5 and 6, Scd1:stearoyl-CoA desaturase-1, Gpat: glycerol-3-phosphate acyltransferase, Lpin1: Lipin 1, Thrsp-Spot14: thyroid hormone responsive Spot14homolog, Pnpla3 and Pnpla5: patatin-like phospholipase domain containing 3 and 5) (B) cholesterol biosynthesis (Mvd: mevalonate (diphospho)decarboxylase, Lss: lanosterolsynthase, Hmgcr: Hmg-coenzyme A reductase and Sqle: squalene epoxidase) (C) glucose metabolism (Pck1: phos-phoenolpyruvate carboxykinase 1, Gk: glucokinase, G6pc: glucose-6-phosphatase, and Glut2: glucose transporter 2) (D) fatty acid oxidation(Acox1: acyl-coenzyme A oxidase 1, Cpt1a: carnitine palmitoyltransferase 1A, Peci: peroxisomal 3,2-trans-enoyl-CoA isomerase, Cyp4a14: cyto-chrome P450, family 4, subfamily a, polypeptide 14) (E) Ugt1a1: UDP-glucuronosyltransferase 1 polypeptide A1. All data were normalized toTBP (TATA-box binding protein) mRNA expression levels. Values shown are the mean 6 standard error of the mean (SEM) (n ¼ 6 per group).Data were analyzed by ANOVA followed by post-hoc Student’s test with a pooled variance estimate. Asterisk denotes a significant differencecompared with control condition (0 lg/kg/day of BPA): *P < 0.05; **P < 0.01; ***P < 0.001.
HEPATOLOGY, Vol. 55, No. 2, 2012 MARMUGI ET AL. 401
Srebp-2, and Chrebp exhibited an inverted U-shapeddose-response profile under the effect of BPA (Fig.5B). This was also the case for insulin induced gene 1(Insig1), but not for insulin induced gene 2 (Insig2),two negative regulators of SREBP-2 and SREBP-1cprocessing, respectively (Fig. 5B). The analysis by west-ern blot of nuclear protein levels for ER and for thekey regulators of lipogenesis SREBP-1C, CHREBPand LXR confirmed a specific effect of low BPA doseson the active protein levels of these transcription fac-tors (Fig. 5C).Effects of BPA on Hepatic Lipids and FA Compo-
sition. To evaluate the consequences of increasedexpression of lipogenic genes, we stained hepatic neu-tral lipids with Oil-Red-O. The representative picturesin Fig. 6A illustrate a greater accumulation of lipids inthe liver of mice exposed to BPA compared with con-trol livers. Lipid droplets were larger and more numer-ous in the livers of mice exposed to BPA-TDI com-pared with those exposed to BPA-NOAEL. Thequantification of liver lipid content confirmed theseobservations. BPA had no effect on hepatic total freecholesterol content (not shown). Liver triglycerideswere significantly increased by approximately 60% and65% in mice exposed to 50 and 500 lg BPA/kg/day,
respectively, compared with control mice (Fig. 6B).Additionally, mice exposed to BPA-TDI also showed asignificant increase in hepatic cholesteryl esters(Fig. 6B). The analysis of hepatic FA composition(Fig. 6C; Supporting Table 3) showed that exposure to50 or 500 lg BPA/kg/day resulted in accumulation ofpalmitic (C16:0) and oleic acids (C18:1n-9), the majorconstituents of triglycerides and cholesteryl esters.Conversely, the proportions of polyunsaturated FA andof C18:0, which are found at higher levels in phospho-lipids, were reduced at these doses. Despite increasedElovl6 mRNA expression, the C18:0/C16:0 ratio wasdecreased at these doses. This may result from a com-bined increased synthesis of C16:0 by FAS and the ef-ficient desaturation/elongation of C18:0 (as illustratedby the increased C18:1n-9/C18:0 ratio, Fig. 6D), bothproducing substrates for triglyceride synthesis.
Discussion
Our results show that the oral exposure of adultmale mice to low BPA doses increases plasma insulinand hepatic mRNA and protein expression related tolipid biosynthesis. This correlates with increased liverlipids after 4 weeks of exposure. Most significant
Fig. 4. Western blot analysis of the effect of BPA exposure on hepatic protein expression. Cytoplasmic protein extracts were prepared from thelivers of control and BPA-exposed animals (0, 5, 50, 500, and 5,000 lg/kg/day; n ¼ 3 to 6 animals/group). The protein extracts were sub-jected to SDS-PAGE and transferred on nitrocellulose membranes. Hepatic proteins were probed using antibodies specific to (A) key enzymesinvolved in fatty acid biosynthesis: ATP citrate lyase (ACLY), the more active form of ACLY phosphorylated on Ser454 (ACLY-P), acetyl-CoA carbox-ylase (ACC), fatty acid synthase (FAS), and stearoyl-CoA desaturase-1 (SCD1) and (B) key enzymes involved in glucose metabolism: glucokinase(GK) and glucose 6-phosphatase (G6PASE). b-Actin was used as loading control. A representative image is shown for each protein. The valuesindicated above each image are the mean values obtained for 3 to 6 animals per group.
402 MARMUGI ET AL. HEPATOLOGY, February 2012

Fig. 5. Effects of low BPA doses on the expression of master transcriptional regulators of hepatic lipid and glucose homeostasis. HepaticmRNAs from male CD1 mice exposed to different doses of BPA (0, 5, 50, 500, and 5,000 lg/kg/day) were used to assay by qPCR the relativemRNA expression of (A) nuclear receptors: the peroxisome proliferator-activated receptors alpha (Ppara), gamma (Pparc), beta/delta (Pparb/d),the liver X receptor alpha (Lxra), the estrogen receptor alpha (ERa), the constitutive androstane receptor (Car), the pregnane X receptor (Pxr),and the hepatocyte nuclear factor 4a (Hnf4a) (B) and of other transcriptional regulators of hepatic lipid and glucose metabolism: the sterolregulatory element binding transcription factor 1c (Srebp-1c) and its associated factor encoded by the Insulin induced gene (Insig2), the sterolregulatory element binding transcription factor 2 (Srebp-2) and its associated factor encoded by the insulin induced gene 1 (Insig1), and thecarbohydrate response element binding protein (Chrebp). All data were normalized to TBP (TATA-box binding protein) mRNA expression levels.Values shown are the mean 6 SEM (n ¼ 6 per group). Data were analyzed by ANOVA followed by post-hoc Student’s test with a pooledvariance estimate. Asterisk denotes a significant difference compared with control condition (0 lg/kg/day of BPA): *P < 0.05; **P < 0.01;***P < 0.001. (C) Immunoblots for ER, LXR, CHREBP, and SREBP-1c were performed as described in the legend of Fig. 4 except that nuclearproteins were extracted and analyzed and that LAMIN A/C was used as a loading control. The values indicated are the mean of the valuesobtained for 3 animals per group.

effects were observed for BPA doses within one orderof magnitude around the current TDI of 50 lg/kg/day.Conversely, virtually no effects were observed at theNOAEL (5,000 lg/kg/day). Agencies for risk assess-ment have established a ‘‘safe’’ TDI for BPA at 50 lg/
kg/day, but several studies have revealed that exposureto environmentally relevant BPA doses below the TDIalters various biological functions, including reproduc-tive, behavioral, metabolic, and immune systems.4
However, the molecular mechanisms underlying these
Fig. 6. Accumulation of triglycerides and cholesteryl esters and changes in the fatty acid profile in the livers of mice exposed to BPA lowdoses. (A) Oil-Red-O-staining of neutral lipids realized on histological sections of livers from mice exposed or not to a BPA low dose (TDI: 50lg/kg/day) or high dose (NOAEL: 5,000 lg/kg/day). Neutral lipids appear in red (original magnification �200). (B) Neutral lipids wereextracted from the liver of mice exposed to different doses of BPA (0, 5, 50, 500, and 5,000 lg/kg/day) by way of their diet. After extraction,lipids were analyzed by gas chromatography. The presence of internal standards enabled to quantify neutral lipids. Values shown are the mean6 SEM (n ¼ 6 per group). Data were analyzed by ANOVA followed by post-hoc Student’s test with a pooled variance estimate. *P < 0.05: sig-nificant difference compared with control condition (0 lg/kg/day of BPA). (C) The hepatic fatty acid composition of mice exposed to the fiveBPA doses (n ¼ 5 or 6 per group) were determined by gas chromatography of fatty acid methyl esters. The heatmap and the dendrograms wereobtained as described in the legend of Fig. 2. The clustering of the groups clearly identifies a specific impact of exposure to 50 and 500 lgBPA/kg/day on the fatty acid profile. It is characterized by increased proportions of saturated and monounsaturated fatty acids and reduced pro-portions of polyunsaturated fatty acids and C18:0. (D) A significant decrease in the C18:0/C16:0 ratio and a concomitant increase in theC18:1n-9/C18:0 ratio are observed in the livers of animals exposed to 500 lg BPA/kg/day.
404 MARMUGI ET AL. HEPATOLOGY, February 2012

low-level responses are still unknown. It was proposedthat down-regulation of receptors at higher hormoneor xenoestrogen levels may contribute to shape thesenonmonotonic curves. Some of BPA’s actions, includ-ing insulin production by the pancreas, were attributedto its ability to bind to nonclassical membrane estro-gen receptor as well as the G-protein coupled-receptor30 (GPR30) and to act through nongenomic path-ways.20,30 Interestingly, we observed that, contrary tolipid metabolism genes, Ugt1a1 expression displayed adose-dependent increase in response to BPA (Fig. 3E).Human UGT1a1 mRNA expression has been previ-ously reported to be increased by low BPA doses inHepG2 cells.31 This phase II enzyme is involved inthe metabolism of endogenous estrogens32 and hasalso been shown to catalyze BPA glucuronidation athigh substrate concentration.33 Whether the modestincrease in Ugt1a1 expression can interfere with theaction of BPA and/or endogenous estrogens may bedoubtful, but it suggests that different pathways withdifferent sensitivities to BPA are targeted dependingon the dose of exposure.The effects of BPA on insulin expression and secre-
tion have been described.17 Our results strongly sug-gest that the effects of BPA on insulin production bythe pancreas translate to transcriptional and functionalconsequences in the liver. Indeed, insulin is known toincrease glycolysis and lipogenesis by way of both post-translational protein modifications and transcriptionalmechanisms.34 SREBP-1c plays a major role in theregulation of these genes in response to insulin.35 LXRis thought to contribute to the effect of insulin onSrebp-1c gene expression.36 LXR also directly regulatesthe expression of lipogenic genes.37 Additionally, insu-lin also stimulates the proteolytic processing ofSREBP-1c,38 leading to increased mature nuclear formand subsequent induction of lipogenic gene expression.In addition to insulin, glucose stimulates glycolyticand lipogenic gene expression by activating theChREBP,29 which is itself under the transcriptionalcontrol of LXR.39 Insulin also induces the expressionof Spot14, which is required for induction of hepaticlipogenesis by thyroid hormone and insulin40,41 and ofPnpla3 by way of SREBP1-c.42 SREBP-2 expressionand activity are primarily regulated by low sterol levelsbut were also reported to respond to increased insulinlevels.43,44 SREBP-2 is a major transcriptional regula-tor of genes involved in cholesterol biosynthesis,including Hmgcr and Sqle.45 Thus, insulin is likely tocontribute to a large number of the regulationsobserved following BPA exposure. However, althoughthe expression of some genes (e.g., Pnpla3) parallels
plasma insulin levels, many other gene expression pat-terns do not strictly follow the insulin profile. More-over, the up-regulation of genes involved in neogluco-genesis (G6pc and Pck1, Fig. 3C) is unexpected in thecontext of high insulin levels. We cannot rule out thatother mechanisms, independent of insulin and possiblyinvolving direct effects of BPA on the liver, may con-tribute to the transcriptional impacts of low BPA dosesreported here.We have shown an accumulation of liver triglycer-
ides and cholesteryl esters together with associatedchanges in hepatic FA composition in the animalsexposed to low BPA doses. Among the mechanismspotentially involved in these effects (increased FAuptake, impaired secretion, increased lipogenesis, orreduced oxidation), our results point to an activationof lipogenesis and cholesterol biosynthesis as the majormechanism involved, potentially associated with an in-hibition of FA oxidation. Simple hepatic lipid accumu-lation is generally considered a benign and reversibleprocess that does not invariably progress to a more se-rious condition. However, inappropriate regulation ofhepatic de novo lipogenesis is now believed to facilitatethe generation of lipotoxic lipid intermediates thatcould contribute to the pathogenesis of NASH.46
NAFLD is strongly linked to overnutrition, underac-tivity, and insulin resistance,47 but many other factorsinitiating hepatic steatosis or supporting the progres-sion of NAFLD to NASH have been proposed.48
These include biologic or synthetic hepatotoxins, bac-terial endotoxins, and exposure to industrial petro-chemicals. Because hepatic steatosis may lead to moresevere pathologies such as NASH and fibrosis, theeffects of environmental pollutants on liver functionsshould be carefully examined.
Acknowledgment: We thank Colette Betoulieres,Raymond Gazel and Florence Blas Y Estrada for ani-mal care and technical assistance for animal experi-ments and Joelle Laffitte for help in setting up proteinanalyses. We thank Dr. Gilles Mithieux (INSERMU855) for the generous gift of the G6PASE antibody.We thank the staff members of the following Geno-Toul core facilities for technical assistance: MetaToul/Lipidomic, Genome & Transcriptome, Anexplo/Histo-pathology and Phenotyping.
References1. Grun F, Blumberg B. Endocrine disrupters as obesogens. Mol Cell
Endocrinol 2009;304:19-29.2. Vandenberg LN, Hauser R, Marcus M, Olea N, Welshons WV.
Human exposure to bisphenol A (BPA). Reprod Toxicol 2007;24:139-177.
HEPATOLOGY, Vol. 55, No. 2, 2012 MARMUGI ET AL. 405

3. Calafat AM, Kuklenyik Z, Reidy JA, Caudill SP, Ekong J, NeedhamLL. Urinary concentrations of bisphenol A and 4-nonylphenol in ahuman reference population. Environ Health Perspect 2005;113:391-395.
4. Richter CA, Birnbaum LS, Farabollini F, Newbold RR, Rubin BS,Talsness CE, et al. In vivo effects of bisphenol A in laboratory rodentstudies. Reprod Toxicol 2007;24:199-224.
5. Lang IA, Galloway TS, Scarlett A, Henley WE, Depledge M, WallaceRB, et al. Association of urinary bisphenol A concentration with medi-cal disorders and laboratory abnormalities in adults. JAMA 2008;300:1303-1310.
6. Melzer D, Rice NE, Lewis C, Henley WE, Galloway TS. Associationof urinary bisphenol a concentration with heart disease: evidence fromNHANES 2003/06. PLoS One 2010;5:e8673.
7. Rubin BS, Soto AM. Bisphenol A: perinatal exposure and body weight.Mol Cell Endocrinol 2009;304:55-62.
8. Rubin BS, Murray MK, Damassa DA, King JC, Soto AM. Perinatalexposure to low doses of bisphenol A affects body weight, patterns ofestrous cyclicity, and plasma LH levels. Environ Health Perspect 2001;109:675-680.
9. Miyawaki J, Sakayama K, Kato H, Yamamoto H, Masuno H. Perinataland postnatal exposure to bisphenol a increases adipose tissue mass andserum cholesterol level in mice. J Atheroscler Thromb 2007;14:245-252.
10. Somm E, Schwitzgebel VM, Toulotte A, Cederroth CR, CombescureC, Nef S, et al. Perinatal exposure to bisphenol a alters early adipogene-sis in the rat. Environ Health Perspect 2009;117:1549-1555.
11. Vandenberg LN, Maffini MV, Wadia PR, Sonnenschein C, Rubin BS,Soto AM. Exposure to environmentally relevant doses of the xenoestro-gen bisphenol-A alters development of the fetal mouse mammarygland. Endocrinology 2007;148:116-127.
12. Phrakonkham P, Viengchareun S, Belloir C, Lombes M, Artur Y, Cani-venc-Lavier MC. Dietary xenoestrogens differentially impair 3T3-L1preadipocyte differentiation and persistently affect leptin synthesis.J Steroid Biochem Mol Biol 2008;110:95-103.
13. Hugo ER, Brandebourg TD, Woo JG, Loftus J, Alexander JW, Ben-Jonathan N. Bisphenol A at environmentally relevant doses inhibits adi-ponectin release from human adipose tissue explants and adipocytes.Environ Health Perspect 2008;116:1642-1647.
14. Masuno H, Iwanami J, Kidani T, Sakayama K, Honda K. Bisphenol aaccelerates terminal differentiation of 3T3-L1 cells into adipocytesthrough the phosphatidylinositol 3-kinase pathway. Toxicol Sci 2005;84:319-327.
15. Masuno H, Kidani T, Sekiya K, Sakayama K, Shiosaka T, YamamotoH, Honda K. Bisphenol A in combination with insulin can acceleratethe conversion of 3T3-L1 fibroblasts to adipocytes. J Lipid Res 2002;43:676-684.
16. Sargis RM, Johnson DN, Choudhury RA, Brady MJ. Environmentalendocrine disruptors promote adipogenesis in the 3T3-L1 cell linethrough glucocorticoid receptor activation. Obesity (Silver Spring)2010;18:1283-1288.
17. Nadal A, Alonso-Magdalena P, Soriano S, Quesada I, Ropero AB. Thepancreatic beta-cell as a target of estrogens and xenoestrogens: implica-tions for blood glucose homeostasis and diabetes. Mol Cell Endocrinol2009;304:63-68.
18. Ropero AB, Alonso-Magdalena P, Garcia-Garcia E, Ripoll C, FuentesE, Nadal A. Bisphenol-A disruption of the endocrine pancreas andblood glucose homeostasis. Int J Androl 2008;31:194-200.
19. Alonso-Magdalena P, Morimoto S, Ripoll C, Fuentes E, Nadal A. Theestrogenic effect of bisphenol A disrupts pancreatic beta-cell function invivo and induces insulin resistance. Environ Health Perspect 2006;114:106-112.
20. Alonso-Magdalena P, Ropero AB, Carrera MP, Cederroth CR, BaquieM, Gauthier BR, et al. Pancreatic insulin content regulation by theestrogen receptor ER alpha. PLoS One 2008;3:e2069.
21. Alonso-Magdalena P, Vieira E, Soriano S, Menes L, Burks D, QuesadaI, et al. Bisphenol A exposure during pregnancy disrupts glucose home-
ostasis in mothers and adult male offspring. Environ Health Perspect2010;118:1243-1250.
22. Ruijter JM, Ramakers C, Hoogaars WM, Karlen Y, Bakker O, vanden Hoff MJ, et al. Amplification efficiency: linking baseline and biasin the analysis of quantitative PCR data. Nucleic Acids Res 2009;37:e45.
23. Rajas F, Jourdan-Pineau H, Stefanutti A, Mrad EA, Iynedjian PB,Mithieux G. Immunocytochemical localization of glucose 6-phospha-tase and cytosolic phosphoenolpyruvate carboxykinase in gluconeogenictissues reveals unsuspected metabolic zonation. Histochem Cell Biol2007;127:555-565.
24. Zadravec D, Brolinson A, Fisher RM, Carneheim C, Csikasz RI, Ber-trand-Michel J, et al. Ablation of the very-long-chain fatty acid elon-gase ELOVL3 in mice leads to constrained lipid storage and resistanceto diet-induced obesity. FASEB J 2010;24:4366-4377.
25. Rotman Y, Koh C, Zmuda JM, Kleiner DE, Liang TJ. The associationof genetic variability in patatin-like phospholipase domain-containingprotein 3 (PNPLA3) with histological severity of nonalcoholic fattyliver disease. HEPATOLOGY 2010;52:894-903.
26. Moreau A, Teruel C, Beylot M, Albalea V, Tamasi V, Umbdenstock T,et al. A novel pregnane X receptor and S14-mediated lipogenic path-way in human hepatocyte. HEPATOLOGY 2009;49:2068-2079.
27. Guillou H, Martin PG, Pineau T. Transcriptional regulation of hepaticfatty acid metabolism. Subcell Biochem 2008;49:3-47.
28. Sato R. Sterol metabolism and SREBP activation. Arch BiochemBiophys 2010;501:177-181.
29. Postic C, Dentin R, Denechaud PD, Girard J. ChREBP, a transcrip-tional regulator of glucose and lipid metabolism. Annu Rev Nutr 2007;27:179-192.
30. Alonso-Magdalena P, Laribi O, Ropero AB, Fuentes E, Ripoll C, SoriaB, et al. Low doses of bisphenol A and diethylstilbestrol impair Ca2þsignals in pancreatic alpha-cells through a nonclassical membrane estro-gen receptor within intact islets of Langerhans. Environ Health Perspect2005;113:969-977.
31. Hanet N, Lancon A, Delmas D, Jannin B, Chagnon MC, Cherkaoui-Malki M, et al. Effects of endocrine disruptors on genes associatedwith 17beta-estradiol metabolism and excretion. Steroids 2008;73:1242-1251.
32. Senafi SB, Clarke DJ, Burchell B. Investigation of the substrate specific-ity of a cloned expressed human bilirubin UDP-glucuronosyltransferase:UDP-sugar specificity and involvement in steroid and xenobiotic glu-curonidation. Biochem J 1994;303(Pt 1):233-240.
33. Hanioka N, Naito T, Narimatsu S. Human UDP-glucuronosyltransfer-ase isoforms involved in bisphenol A glucuronidation. Chemosphere2008;74:33-36.
34. Kersten S. Mechanisms of nutritional and hormonal regulation of lipo-genesis. EMBO Rep 2001;2:282-286.
35. Foufelle F, Ferre P. New perspectives in the regulation of hepaticglycolytic and lipogenic genes by insulin and glucose: a role for thetranscription factor sterol regulatory element binding protein-1c.Biochem J 2002;366:377-391.
36. Chen G, Liang G, Ou J, Goldstein JL, Brown MS. Central role forliver X receptor in insulin-mediated activation of Srebp-1c transcriptionand stimulation of fatty acid synthesis in liver. Proc Natl Acad Sci USA2004;101:11245-11250.
37. Schultz JR, Tu H, Luk A, Repa JJ, Medina JC, Li L, et al. Role ofLXRs in control of lipogenesis. Genes Dev 2000;14:2831-2838.
38. Hegarty BD, Bobard A, Hainault I, Ferre P, Bossard P, Foufelle F. Dis-tinct roles of insulin and liver X receptor in the induction and cleavageof sterol regulatory element-binding protein-1c. Proc Natl Acad Sci US A 2005;102:791-796.
39. Cha JY, Repa JJ. The liver X receptor (LXR) and hepatic lipogenesis.The carbohydrate-response element-binding protein is a target gene ofLXR. J Biol Chem 2007;282:743-751.
40. Brown SB, Maloney M, Kinlaw WB. ‘‘Spot 14’’ protein functions atthe pretranslational level in the regulation of hepatic metabolism bythyroid hormone and glucose. J Biol Chem 1997;272:2163-2166.
406 MARMUGI ET AL. HEPATOLOGY, February 2012
41. Kinlaw WB, Church JL, Harmon J, Mariash CN. Direct evidence fora role of the ‘‘spot 14’’ protein in the regulation of lipid synthesis.J Biol Chem 1995;270:16615-16618.
42. Huang Y, He S, Li JZ, Seo YK, Osborne TF, Cohen JC, Hobbs HH.A feed-forward loop amplifies nutritional regulation of PNPLA3. ProcNatl Acad Sci U S A 2010;107:7892-7897.
43. Xie X, Liao H, Dang H, Pang W, Guan Y, Wang X, et al. Down-regu-lation of hepatic HNF4alpha gene expression during hyperinsulinemiavia SREBPs. Mol Endocrinol 2009;23:434-443.
44. Kotzka J, Lehr S, Roth G, Avci H, Knebel B, Muller-Wieland D. Insu-lin-activated Erk-mitogen-activated protein kinases phosphorylate sterolregulatory element-binding protein-2 at serine residues 432 and 455 invivo. J Biol Chem 2004;279:22404-22411.
45. Nagai M, Sakakibara J, Nakamura Y, Gejyo F, Ono T. SREBP-2and NF-Y are involved in the transcriptional regulation ofsqualene epoxidase. Biochem Biophys Res Commun 2002;295:74-80.
46. Neuschwander-Tetri BA. Hepatic lipotoxicity and the pathogenesis ofnonalcoholic steatohepatitis: the central role of nontriglyceride fattyacid metabolites. HEPATOLOGY 2010;52:774-788.
47. Larter CZ, Chitturi S, Heydet D, Farrell GC. A fresh look at NASHpathogenesis. Part 1. The metabolic movers. J Gastroenterol Hepatol2010;25:672-690.
48. Cave M, Deaciuc I, Mendez C, Song Z, Joshi-Barve S, Barve S, et al.Nonalcoholic fatty liver disease: predisposing factors and the role ofnutrition. J Nutr Biochem 2007;18:184-195.
HEPATOLOGY, Vol. 55, No. 2, 2012 MARMUGI ET AL. 407
Copyright © 2022 FDOKUMEN