Night Time Vehicle Detection for Adaptive Beam and Collision Avoidance Systems
Upload
khangminh22Category
view
1download
0
Kristian Svinterud SørebøLow
-cost Navigation and Collision Avoidance System
NTN
UN
orw
egia
n U
nive
rsity
of S
cien
ce a
nd T
echn
olog
yFa
culty
of E
ngin
eerin
gD
epar
tmen
t of M
echa
nica
l and
Indu
stria
l Eng
inee
ring
Mas
ter’s
thes
is
Kristian Svinterud Sørebø
Low-cost Navigation and CollisionAvoidance System
Master’s thesis in Robotics and Automation
Supervisor: Amund Skavhaug
July 2020

Kristian Svinterud Sørebø
Low-cost Navigation and CollisionAvoidance System
Master’s thesis in Robotics and AutomationSupervisor: Amund SkavhaugJuly 2020
Norwegian University of Science and TechnologyFaculty of EngineeringDepartment of Mechanical and Industrial Engineering


Low-cost Navigation and Collision Avoidance System
Summary
As the technology related to autonomous ground vehicles(AGV’s) advance, more computationalpower is needed in order to realize the systems. At the same time low-cost single board comput-ers(SBC’s) with significant calculation power have become a common product. Consequently, themotivation for this master-project is to develop a low-cost navigation and collision avoidance sys-tem. Similar systems already exist, one example being the Turtlebot. The aim of this project isnot to develop an alternative to the Turtlebot, but rather a stand-alone sensor system that can beused by the Turtlebot and other robotic vehicles. The objective of the sensor-system is to provide arobotic vehicle equipped with the system enough information about the surrounding environmentso that it has the possibility to function efficiently and safely in a dynamic environment.
This thesis builds upon a pre-study conducted by the author of this thesis, which is included inAppendix A. The pre-study is a literature study of existing AGV technology where different tech-nologies are compared. Further, the pre-study explored the requirements for an AGV to be able tonavigate on its own, as well as operate safely around other agents, especially humans. The pre-studyconcludes with a conceptional design for a prototype sensor-system. This design was further devel-oped and documented throughout the scope of this project. In order to develop a sensor-systemcapable of providing the necessary data for an AGV to operate safely and efficiently a list of systemrequirements was declared at the beginning of this project. The main requirements being:
• The system should provide enough information about a large enough area and be able todetect all obstacles within the range of the system so that an AGV can react in time to avoidaccidents.
• The system should be able to automatically update the map of the working environment.• The system should have a method for keeping track of its position withing the working envi-
ronment.
Further, in the context of this thesis «low-cost» is defined as affordable for lab use withoutany extra support from the institute. Which at the Department of Mechanical and Industrial En-gineering(MTP), NTNU is around 5000 Norwegian kroners. As stated by prof. Amund Skavhaug.Therefore, the total cost of the system aims to be around 5000 Norwegian kroners. Additionally,the system aim to be easy to integrate with existing robotic vehicles. For this reason, as well asthe community support and existing packages available, the system is developed using the popularrobotic framework ROS. The main distribution used in relation to this project being ROS2 Dashing.The SBC used in the development of this project is the Raspberry Pi 4 Model B(RBPi4).
i

Low-cost Navigation and Collision Avoidance System
In order to realize the system requirements the sensor-system consist of three sub-systems. Oneobstacle avoidance grid consisting of both ultrasonic- and infrared range sensors. This combinationof sensors is chosen as both sensors has their strength and weaknesses, where the strengths of onetype of sensor covers the weaknesses of the other, and vice versa. Thus minimizing the change ofbeing unable to detect an obstacle and resulting in a system capable of detecting obstacles indepen-dent of the obstacles surface characteristics.
Further, for the purpose of automatic mapping the system utilizes an Intel Realsense D435 depthsensor. Which provides accurate depth data about the surrounding environment. Intel has releaseda ROS package for communicating with its depth sensor, and mapping is achieved using the existingROS package Rtabmap. Furthermore, a method utilizing a Raspberry Pi V2 camera and QR-codesattached to the roof was developed in order to estimate the position of the system.
To test the system and its capabilities a set of research questions were devised. The researchquestions, as well as the related experiments and results is presented in Chapter 7. The obstacleavoidance grid consisting of both ultrasonic- and infrared sensor proved able of detecting obstacleswithin their operating range independent of the obstacles surface characteristics. Suggesting thatan robotic vehicle equipped with this system should be able to detect both humans, other AGV’sand other obstacles within the working environment.
With the use of the Intel Realsense D435 and the ROS package Rtabmap the system was able tocreate three-dimensional maps of its surrounding environment. However, it is recommended to usean external and reliable source of odometry in order to achieve the efficiency needed for an AGVto automatically map the surrounding environment. Further, Rtabmap is not available for ROS2Dashing, thus ROS Melodic was used to perform mapping. Consequently the whole system is notyet integrated on the same ROS distribution.
By manually calibrating the Raspberry Pi V2 camera the system was able to estimate its posi-tion with varying accuracy utilizing QR-codes attached to the roof. The position is estimated withrespect to the detected QR-code, in which the QR-codes position with respect to the working envi-ronment is encoded. Using this information the position of the system with respect to the workingenvironment is estimated.
In conclusion the system showed good results in its aim to achieve the system requirements,but it is not a finalized system yet. Although the system is not complete, the basic groundwork hasbeen done - thus a low-cost navigation and collision avoidance system to build upon is available forfuture students.
ii

Low-cost Navigation and Collision Avoidance System
Sammendrag
Ettersom teknologien rundt autonome bakke-kjøretøy (AGV’er) stadig er i utvikling, trenger manogså mer datakraft for å realisere disse systemene. Samtidig er lav-kost ettkorts datamaskiner(SBC’er) med høy ytelse blitt et utbredt og tilgjengelig produkt. Derfor er motivasjonen bak dennemasteroppgaven å utvikle et lav-kost system for navigasjon og kollisjonsunngåelse. Det finnesallerede lignende systemer, et eksempel er Turtlebot. Målet med denne oppgaven er ikke å utvikleet alternativ til Turtlebot, men heller et sensorsystem som kan brukes av Turtlebot og andre au-tonome bakke-kjøretøy. Målet med systemet er at det skal være i stand til å gi robotkjøretøy nokinformasjon om de omkringliggende omgivelsene så de har muligheten til å operere trygt og effek-tivt.
Denne oppgaven bygger videre på et for-prosjekt skrevet av den samme forfatteren. Dette for-prosjektet er lagt ved som vedlegg, Appendix A. For-prosjektet er en litteraturstudie av eksisterendeteknologi for AGV’er. I for-prosjektet blir de eksisterende teknologiene sammenlignet og veid oppmot hverandre. Samtidig diskuteres det hva som kreves av et system for at en AGV skal kunneoperere trygt og effektivt i et dynamisk miljø. For-prosjektet konkluderer med et konsept for etsensor-system som oppfyller disse kravene. Dette konseptet er videreutviklet og dokumentert gjen-nom denne rapporten. For å sørge for at systemet som utvikles er i stand til å gi et robotkjøretøyden informasjonen den trenger, ble det satt opp et sett med krav i startfasen av dette prosjektet.Hovedkravene er:
• Systemet skal gi nok informasjon om det omkringliggende området slik aten AGV som brukersystemet kan unngå ulykker
• Systemet bør gi muligheten for å automatisk lage et kart av, og oppdatere eksiterende kartbasert på de omkringliggende omgivelsene.
• Systemet bør gi muligheten til å finne og følge AGVens posisjon i forhold til de omkring-liggende omgivelsene.
Videre, i sammenheng med denne oppgaven er «lav-kost» definert som rimelig nok til å kunnekjøpes inn til bruk i lab sammenheng uten noen spesiell støtte fra instituttet. Som på Institutt formaskinteknikk og produksjon (MTP) ved NTNU ligger på rundt 5000 Norske kroner, i følge prof.Amund Skavhaug. Derfor sikter systemet seg inn på å koste omkring 5000 Norske kroner. I tillegger det ønskelig at systemet er lett å integrere med eksisterende robotkjøretøy. Av den grunn i tilleggtil et aktivt utvikler-miljø og mange eksisterende verktøy er det valgt å utvikle systemet i ROS. ROSversjonen som i hovedsak brukes i dette prosjektet er ROS2 Dashing, og ettkorts maskinen somsystemet utvikles på en en Raspberry Pi 4 Model b(RBPi4).
iii

Low-cost Navigation and Collision Avoidance System
Med mål om å realisere de definerte kravene består systemet av tre sub-systemer. Et sub-systemfor å oppdage hindringer. Dette systemet består av både ultrasoniske- og infrarøde sensorer. Dennekombinasjonen av sensorer er valgt med bakgrunn i at hver av sensorene har sine styrker ogsvakheter, hvor styrkene til den ene overlapper svakhetene til den andre, og omvendt. Dette bidrartil at systemet er mer rustet for å kunne oppdage hindringer uavhengig av overflateegenskapene tilhindringen.Videre, for å automatisk kunne kartlegge de omkringliggende omgivelse benytter systemet seg aven Intel Realsense D435 dybde sensor. Intel har utviklet en egen pakke for å bruke denne sensorensammen med ROS. Kartlegging av omgivelsene gjøres ved å bruke ROS pakken Rtabmap. Utoverdette er det utviklet en metode som benytter seg av et Raspberry Pi V2 kamera og QR-koder i taketfor å estimere posisjonen til systemet.
For å teste systemet er det utarbeidet et sett med forskningsspørsmål. Forskningsspørsmålene,samt de utførte ekspimentene og resultatene er presentert i Kapittel 7. Systemet for å oppdagehindringer ved hjelp av ultrasoniske- og infrarøde sensorer ga gode resultater og var i stand til åoppdage hindringer innenfor deres rekkevidde uavhengig av overflateegenskapene til hindringen.Dette tyder på at et robotkjøretøy som bruker dette systemet bør være i stand til å oppdage men-nesker, andre robotkjøretøy og hindringer som skulle befinne seg i det samme området.Ved å bruke en Intel Realsense D435 sensor og ROS pakken Rtabmap var systemet i stand til ålage tre-dimensjonale kart av de omkringliggende omgivelsene. Dette var mulig både med og utenbruk av noen annen kilde for odometri. Uten å bruke en annen kilde for odometri var resultatenevarierende, og prosessen tok lang tid. Derfor anbefales å bruke odometri data fra en annen kildeen Intel Realsense D435 sensoren. Videre er ikke pakken Rtabmap tilgjengelig for ROS2 Dahsing,derfor ble ROS Melodic brukt for kartlegging. Det vil si at hele systemet ikke er integrert på densamme plattformen ennå.
Ved manuell kalibrering av Raspberry Pi V2 kamera var systemet i stand til å estimere posisjo-nen sin med varierende nøyaktighet, basert på QR-koder i taket. Posisjonen blir estimert ut ifraQR-koden. I QR-koden er kodens plassering i forhold til omgivelsene kodet inn. Ved å bruke denneinformasjon sammen med den estimerte posisjonen i forhold til QR-koden kan systemet estimeresin posisjon i forhold til de omkringliggende omgivelsene.
Som konklusjon har systemet vist gode resultater med tanke på å oppfylle de satte kravene, mensystemet er ikke ferdigutviklet ennå. Selv om systemet ikke er ferdig, har grunnarbeidet blitt gjort –resultatet er et lav-kost system for navigasjon og kollisjonsunngåelse som fremtidige studenter kanbygge videre på.
iv

Low-cost Navigation and Collision Avoidance System
Preface
This thesis concludes my master project at NTNU Trondheim carried out during the spring semesterof 2020. The idea for this project came about during a lunch meeting with Amund Skavhaug aboutan open project. Trough a discussion regarding my interests and technical background we landed ona project concerning a low-cost sensor system for autonomous ground vehicles (AGVs). We endedup with the title «Low-cost Navigation and Collision Avoidance System».
I would like to thank my supervisor Amund Skavhaug for his commitment and guidance through-out my final year at NTNU.
15-07-2020
v

Low-cost Navigation and Collision Avoidance System
Contents
Summary . . . . . . . . . . . . . . . . . . . . . . . . . . . . . . . . . . . . . . . . . . . . . . . iSammendrag . . . . . . . . . . . . . . . . . . . . . . . . . . . . . . . . . . . . . . . . . . . . . iiiPreface . . . . . . . . . . . . . . . . . . . . . . . . . . . . . . . . . . . . . . . . . . . . . . . . vContents . . . . . . . . . . . . . . . . . . . . . . . . . . . . . . . . . . . . . . . . . . . . . . . viList of Figures . . . . . . . . . . . . . . . . . . . . . . . . . . . . . . . . . . . . . . . . . . . . ixList of Tables . . . . . . . . . . . . . . . . . . . . . . . . . . . . . . . . . . . . . . . . . . . . . xiiListings . . . . . . . . . . . . . . . . . . . . . . . . . . . . . . . . . . . . . . . . . . . . . . . . xiiiAbbreviations . . . . . . . . . . . . . . . . . . . . . . . . . . . . . . . . . . . . . . . . . . . . xiv1 Introduction . . . . . . . . . . . . . . . . . . . . . . . . . . . . . . . . . . . . . . . . . . . 1
1.1 Background and motivation . . . . . . . . . . . . . . . . . . . . . . . . . . . . . . . . 11.2 Objectives . . . . . . . . . . . . . . . . . . . . . . . . . . . . . . . . . . . . . . . . . . 4
1.2.1 Research Objectives . . . . . . . . . . . . . . . . . . . . . . . . . . . . . . . . 41.3 Report Structure . . . . . . . . . . . . . . . . . . . . . . . . . . . . . . . . . . . . . . 5
1.3.1 Actions performed to ensure reliability . . . . . . . . . . . . . . . . . . . . . . 51.3.2 Literature studies . . . . . . . . . . . . . . . . . . . . . . . . . . . . . . . . . . 51.3.3 System requirements . . . . . . . . . . . . . . . . . . . . . . . . . . . . . . . . 51.3.4 Theory . . . . . . . . . . . . . . . . . . . . . . . . . . . . . . . . . . . . . . . . 51.3.5 Concept . . . . . . . . . . . . . . . . . . . . . . . . . . . . . . . . . . . . . . . 51.3.6 System development . . . . . . . . . . . . . . . . . . . . . . . . . . . . . . . . 51.3.7 Experiments, results and discussion . . . . . . . . . . . . . . . . . . . . . . . . 51.3.8 Discussion, conclusion and future work . . . . . . . . . . . . . . . . . . . . . . 5
2 Literature Studies . . . . . . . . . . . . . . . . . . . . . . . . . . . . . . . . . . . . . . . . 62.1 Developed methods . . . . . . . . . . . . . . . . . . . . . . . . . . . . . . . . . . . . . 6
2.1.1 Physical guidelines . . . . . . . . . . . . . . . . . . . . . . . . . . . . . . . . . 72.1.2 Beacons . . . . . . . . . . . . . . . . . . . . . . . . . . . . . . . . . . . . . . . 82.1.3 Natural Feature Navigation . . . . . . . . . . . . . . . . . . . . . . . . . . . . 92.1.4 Discussion . . . . . . . . . . . . . . . . . . . . . . . . . . . . . . . . . . . . . . 10
3 System requirements . . . . . . . . . . . . . . . . . . . . . . . . . . . . . . . . . . . . . . 123.1 Technical requirements . . . . . . . . . . . . . . . . . . . . . . . . . . . . . . . . . . . 12
3.1.1 Obstacle detection and avoidance . . . . . . . . . . . . . . . . . . . . . . . . . 123.1.2 Mapping and positioning . . . . . . . . . . . . . . . . . . . . . . . . . . . . . 13
3.2 Simplicity and life expectancy . . . . . . . . . . . . . . . . . . . . . . . . . . . . . . . 143.3 Cost and scope of the system . . . . . . . . . . . . . . . . . . . . . . . . . . . . . . . 143.4 Summary of requirements . . . . . . . . . . . . . . . . . . . . . . . . . . . . . . . . . 14
vi

Low-cost Navigation and Collision Avoidance System
4 Background theory . . . . . . . . . . . . . . . . . . . . . . . . . . . . . . . . . . . . . . . 154.1 Obstacle detection with ultrasonic-and infrared range sensors . . . . . . . . . . . . . 15
4.1.1 Ultrasonic distance measurement . . . . . . . . . . . . . . . . . . . . . . . . . 154.1.2 Infrared distance measurement . . . . . . . . . . . . . . . . . . . . . . . . . . 174.1.3 Obstacle detection with ultrasonic and infrared sensors . . . . . . . . . . . . . 17
4.2 Navigation and mapping . . . . . . . . . . . . . . . . . . . . . . . . . . . . . . . . . . 194.2.1 Pinhole camera model . . . . . . . . . . . . . . . . . . . . . . . . . . . . . . . 194.2.2 Stereo vision . . . . . . . . . . . . . . . . . . . . . . . . . . . . . . . . . . . . 214.2.3 Active IR stereo vision . . . . . . . . . . . . . . . . . . . . . . . . . . . . . . . 224.2.4 Odometry . . . . . . . . . . . . . . . . . . . . . . . . . . . . . . . . . . . . . . 234.2.5 SLAM . . . . . . . . . . . . . . . . . . . . . . . . . . . . . . . . . . . . . . . . 244.2.6 Occupancy grid mapping . . . . . . . . . . . . . . . . . . . . . . . . . . . . . . 25
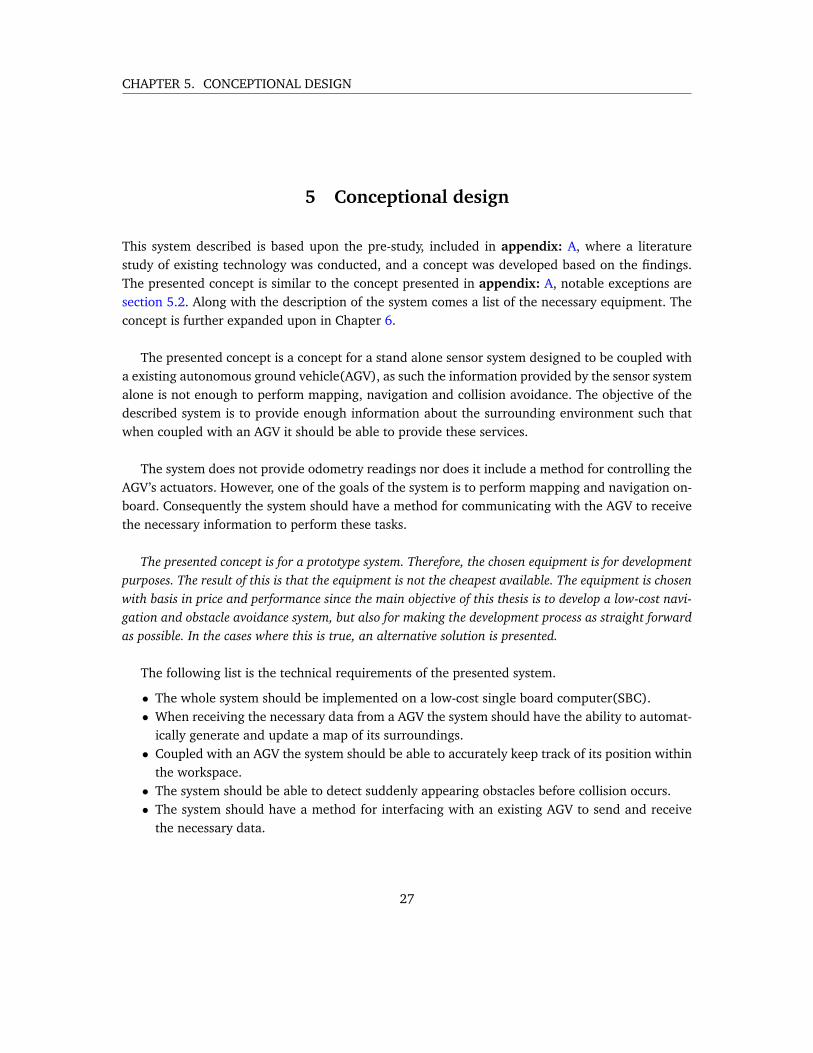
5 Conceptional design . . . . . . . . . . . . . . . . . . . . . . . . . . . . . . . . . . . . . . 275.1 Low-cost computer . . . . . . . . . . . . . . . . . . . . . . . . . . . . . . . . . . . . . 285.2 Mapping localization and navigation . . . . . . . . . . . . . . . . . . . . . . . . . . . 29
5.2.1 Obstacle detection . . . . . . . . . . . . . . . . . . . . . . . . . . . . . . . . . 315.2.2 Overall design of suggested prototype . . . . . . . . . . . . . . . . . . . . . . 32
6 System development . . . . . . . . . . . . . . . . . . . . . . . . . . . . . . . . . . . . . . 336.1 Sensors and equipment . . . . . . . . . . . . . . . . . . . . . . . . . . . . . . . . . . . 33
6.1.1 Total cost of the system . . . . . . . . . . . . . . . . . . . . . . . . . . . . . . 336.1.2 Raspberry Pi 4 model B, Single board computer(SBC) running the system . . 346.1.3 Arduino UNO, microcontroller for interfacing with range sensors . . . . . . . 346.1.4 Intel RealSense 435, depth sensor for navigation and mapping . . . . . . . . . 346.1.5 Raspberry Pi V2 camera, RGB camera for detecting visual landmarks . . . . . 346.1.6 GP2Y0A710K0F Sharp, Reflective Sensor, infrared range sensor for obstacle
detection . . . . . . . . . . . . . . . . . . . . . . . . . . . . . . . . . . . . . . 356.1.7 HC-SR04 ultrasonic sensor, ultrasonic range sensor for obstacle detection . . . 35
6.2 Hardware architecture . . . . . . . . . . . . . . . . . . . . . . . . . . . . . . . . . . . 366.2.1 Housing . . . . . . . . . . . . . . . . . . . . . . . . . . . . . . . . . . . . . . . 38
6.3 Development platform and programming language . . . . . . . . . . . . . . . . . . . 396.4 Software architecture . . . . . . . . . . . . . . . . . . . . . . . . . . . . . . . . . . . . 42
6.4.1 Visualization package . . . . . . . . . . . . . . . . . . . . . . . . . . . . . . . 446.4.2 Installation . . . . . . . . . . . . . . . . . . . . . . . . . . . . . . . . . . . . . 46
6.5 Obstacle detection . . . . . . . . . . . . . . . . . . . . . . . . . . . . . . . . . . . . . 476.6 Localization and mapping . . . . . . . . . . . . . . . . . . . . . . . . . . . . . . . . . 59
6.6.1 Visual landmarks . . . . . . . . . . . . . . . . . . . . . . . . . . . . . . . . . . 596.6.2 Detect center of QR-code . . . . . . . . . . . . . . . . . . . . . . . . . . . . . 616.6.3 Intel Realsense D435 depth sensor . . . . . . . . . . . . . . . . . . . . . . . . 706.6.4 Mapping . . . . . . . . . . . . . . . . . . . . . . . . . . . . . . . . . . . . . . . 71
6.7 Prototype . . . . . . . . . . . . . . . . . . . . . . . . . . . . . . . . . . . . . . . . . . 74
vii

Low-cost Navigation and Collision Avoidance System
6.7.1 Functionality of the system . . . . . . . . . . . . . . . . . . . . . . . . . . . . 747 Experiments, results and discussion . . . . . . . . . . . . . . . . . . . . . . . . . . . . . 77
7.1 Obstacle detection using low-cost range sensors . . . . . . . . . . . . . . . . . . . . . 777.1.1 Is the system capable of detecting obstacles independent of their surface char-
acteristics? . . . . . . . . . . . . . . . . . . . . . . . . . . . . . . . . . . . . . 787.1.2 Does the narrow viewing angle of the infrared sensor cause a problem? . . . . 81
7.2 Navigation using visual landmarks . . . . . . . . . . . . . . . . . . . . . . . . . . . . 827.3 Mapping . . . . . . . . . . . . . . . . . . . . . . . . . . . . . . . . . . . . . . . . . . . 84
7.3.1 Is it feasible to perform indoor mapping without external odometry? . . . . . 847.3.2 Is the system capable of accurately mapping larger more complex environ-
ments? . . . . . . . . . . . . . . . . . . . . . . . . . . . . . . . . . . . . . . . 877.4 Conclusion and discussion of experiments in relation to the system requirements . . 88
7.4.1 The system should provide enough information about a large enough area sothat an AGV can react in time to avoid accidents. . . . . . . . . . . . . . . . . 88
7.4.2 The system should have a method for keeping track of its position withingthe working environment. . . . . . . . . . . . . . . . . . . . . . . . . . . . . . 89
7.4.3 The system should be able to automatically update the map of the workingenvironment. . . . . . . . . . . . . . . . . . . . . . . . . . . . . . . . . . . . . 89
8 Discussion, conclusion and future work . . . . . . . . . . . . . . . . . . . . . . . . . . . 908.1 Cost, relevance and implementation . . . . . . . . . . . . . . . . . . . . . . . . . . . 90
8.1.1 Relevance . . . . . . . . . . . . . . . . . . . . . . . . . . . . . . . . . . . . . . 908.1.2 Implementation . . . . . . . . . . . . . . . . . . . . . . . . . . . . . . . . . . . 90
8.2 Development process . . . . . . . . . . . . . . . . . . . . . . . . . . . . . . . . . . . . 91Bibliography . . . . . . . . . . . . . . . . . . . . . . . . . . . . . . . . . . . . . . . . . . . . . 92A Pre-study . . . . . . . . . . . . . . . . . . . . . . . . . . . . . . . . . . . . . . . . . . . . . A1
viii
Low-cost Navigation and Collision Avoidance System
List of Figures
1 AGV following a path with the active inductive guidance method [1] . . . . . . . . . 12 AGV following the path with the use of a optical sensor [2]. . . . . . . . . . . . . . . 13 Illustration of AGV equipped with LIDAR sensing the surrounding environment [3]. . 24 Turtlebot3 series [4]. . . . . . . . . . . . . . . . . . . . . . . . . . . . . . . . . . . . . 35 AGV following a path with the active inductive guidance method [1] . . . . . . . . . 76 AGV following the path with the use of a optical sensor [2]. . . . . . . . . . . . . . . 77 Determining position of AGV with beacons. [5] . . . . . . . . . . . . . . . . . . . . . 88 Ultrasonic distance sensor failing to detect sound absorbing, and flat angled surface
[6] . . . . . . . . . . . . . . . . . . . . . . . . . . . . . . . . . . . . . . . . . . . . . . 169 Illustration of the working method of a infrared distance sensor [7] . . . . . . . . . . 1710 Illustration of two overlapping range sensors. . . . . . . . . . . . . . . . . . . . . . . 1811 Illustration of the pinhole camera model [8] . . . . . . . . . . . . . . . . . . . . . . . 1912 Illustration of the geometry describing the relation between the image plane and
3D-coordinates . . . . . . . . . . . . . . . . . . . . . . . . . . . . . . . . . . . . . . . 2013 Epipolar views [9] . . . . . . . . . . . . . . . . . . . . . . . . . . . . . . . . . . . . . 2114 Illustration of a active IR stereo sensors [10] . . . . . . . . . . . . . . . . . . . . . . . 2215 Blue line depicting the path of the robot before loop-closure, red line depicting the
path after loop-closure [11]. . . . . . . . . . . . . . . . . . . . . . . . . . . . . . . . . 2416 Illustration of a robot updating the occupancy grid map using sensor data . . . . . . 2517 Illustration of the logarithmic updating process . . . . . . . . . . . . . . . . . . . . . 2518 Arduino UNO . . . . . . . . . . . . . . . . . . . . . . . . . . . . . . . . . . . . . . . . 2819 Raspberry Pi 4 model B . . . . . . . . . . . . . . . . . . . . . . . . . . . . . . . . . . 2820 Intel Realsense D435 [12] . . . . . . . . . . . . . . . . . . . . . . . . . . . . . . . . . 2921 Position of QR-code and camera relative to each other . . . . . . . . . . . . . . . . . 3022 Illustration of the sensors detection range around the AGV. . . . . . . . . . . . . . . . 3123 Hardware architecture of proposed system. . . . . . . . . . . . . . . . . . . . . . . . 3224 Correlation between output voltage from IR-sensor and measured distance [13] . . . 3525 Hardware architecture of developed system. . . . . . . . . . . . . . . . . . . . . . . . 3626 Connection between Arduino UNO and range sensors (Figure made with Fritzing). . 3727 Housing for obstacle detection grid . . . . . . . . . . . . . . . . . . . . . . . . . . . . 3828 ROS 2 Dashing Diademata [14] . . . . . . . . . . . . . . . . . . . . . . . . . . . . . . 3929 RVIZ visualisation of turtlebot and LIDAR data [15] . . . . . . . . . . . . . . . . . . . 3930 Illustration of communication between devices. . . . . . . . . . . . . . . . . . . . . . 4231 Illustration of the data flow in the system . . . . . . . . . . . . . . . . . . . . . . . . 43
ix

Low-cost Navigation and Collision Avoidance System
32 Model of sensor housing with the coordinate system describing the position of eachrange sensor enabled . . . . . . . . . . . . . . . . . . . . . . . . . . . . . . . . . . . 45
33 Ultrasonic sensor fails to detect obstacles. . . . . . . . . . . . . . . . . . . . . . . . . 4734 Fleece jacket placed one meter from the sensors. . . . . . . . . . . . . . . . . . . . . 4835 Transparent surface placed 0.7 meters from the sensors. . . . . . . . . . . . . . . . . 4936 Obstacle detection grid consisting of ultrasonic and infrared sensors . . . . . . . . . . 5037 Obstacle detection grid consisting of ultrasonic and infrared sensors, live measure-
ment visualized using Rviz and Ros 2 . . . . . . . . . . . . . . . . . . . . . . . . . . . 5038 Data received from one ultrasonic sensor visualized in Rviz . . . . . . . . . . . . . . . 5639 Chess-pattern used to calibrate the camera . . . . . . . . . . . . . . . . . . . . . . . . 6040 Camera calibration flowchart [16] . . . . . . . . . . . . . . . . . . . . . . . . . . . . 6041 The vertices and the calculated center of the QR-code marked with circles. . . . . . . 6142 Estimated position of QR-code with respect to camera. . . . . . . . . . . . . . . . . . 6243 World - and QR coordinate system . . . . . . . . . . . . . . . . . . . . . . . . . . . . 6344 QR-code with three markers . . . . . . . . . . . . . . . . . . . . . . . . . . . . . . . . 6345 The six contours of the QR-marker . . . . . . . . . . . . . . . . . . . . . . . . . . . . 6446 The relationship between each marker represented as a triangle . . . . . . . . . . . . 6447 Rotation of QR-code around the z-axis with respect to the camera coordinate system 6548 Resulting translation between coordinate system after estimating distance and rota-
tion from picture of QR-code. Redline: x-axis, green line: y-axis, blue line: z-axis . . . 6649 Pure visual slam of an indoor room . . . . . . . . . . . . . . . . . . . . . . . . . . . . 7250 Visual slam with external odometry . . . . . . . . . . . . . . . . . . . . . . . . . . . . 7251 Illustration of an AGV implemented with the system, the transparent figures shows
the viewing angle of each sensor. Blue: ultrasonic- and infrared sensors, Yellow: Rasp-berry Pi V2 camera, Purple: Intel Realsense D435. . . . . . . . . . . . . . . . . . . . . 74
52 Total viewing angle of the system . . . . . . . . . . . . . . . . . . . . . . . . . . . . . 7653 Transparent surface placed 0.7 meters from the sensors. . . . . . . . . . . . . . . . . 7854 Fleece jacket placed one meter from the sensors. . . . . . . . . . . . . . . . . . . . . 7855 Sensor measurements from the open testing environment. The green lines represent
the walls, while the brown drawing represent the furniture within the range of thesensors. . . . . . . . . . . . . . . . . . . . . . . . . . . . . . . . . . . . . . . . . . . . 79
56 Measurements from an experiment where a test person walks around the field ofview of the sensor system wearing a fleece jacket, the green arrow indicates the pathof the test person. . . . . . . . . . . . . . . . . . . . . . . . . . . . . . . . . . . . . . . 80
57 Sensor measurement from experiment where a test person stood in between twoinfrared sensors, the green arrow indicates the position of the test person. . . . . . . 81
58 Path for testing the accuracy of the method utilizing visual landmarks . . . . . . . . . 8259 Resulting path after conducted experiments using QR-codes as visual landmarks . . . 8360 Pure visual slam of an indoor room . . . . . . . . . . . . . . . . . . . . . . . . . . . . 8561 Visual slam with external odometry . . . . . . . . . . . . . . . . . . . . . . . . . . . . 85
x

Low-cost Navigation and Collision Avoidance System
62 Floor plan of the living room/test environment. . . . . . . . . . . . . . . . . . . . . . 8563 Pure visual slam of an indoor room . . . . . . . . . . . . . . . . . . . . . . . . . . . . 8664 Visual slam with external odometry . . . . . . . . . . . . . . . . . . . . . . . . . . . . 8665 Floor plan of environment . . . . . . . . . . . . . . . . . . . . . . . . . . . . . . . . . 8766 Resulting 3D map after mapping . . . . . . . . . . . . . . . . . . . . . . . . . . . . . 87
xi

Low-cost Navigation and Collision Avoidance System
List of Tables
1 Advantages and disadvantages of described methods . . . . . . . . . . . . . . . . . . 102 Total cost of developed system. . . . . . . . . . . . . . . . . . . . . . . . . . . . . . . 33
xii

Low-cost Navigation and Collision Avoidance System
Listings
6.1 Setting up a new ROS2 workspace [17] . . . . . . . . . . . . . . . . . . . . . . . . . 406.2 Example of a workspace containing an arbitrary amount of packages [18] . . . . . . 406.3 Creating a python package in ROS2 . . . . . . . . . . . . . . . . . . . . . . . . . . . . 406.4 Set ROS_DOMAIN_ID . . . . . . . . . . . . . . . . . . . . . . . . . . . . . . . . . . . 416.5 List of packages in project workspace . . . . . . . . . . . . . . . . . . . . . . . . . . . 436.6 Model of the baselink and one attached sensor declared in an URDF file . . . . . . . 446.7 Install the necessary python dependencies using pip for python3. . . . . . . . . . . . 466.8 Build the workspace and the packages . . . . . . . . . . . . . . . . . . . . . . . . . . 466.9 Setting up the sensors [19], [20] . . . . . . . . . . . . . . . . . . . . . . . . . . . . . 526.10 Setting up the arduino and the timer for the ultrasonic sensors [19], [20] . . . . . . 536.11 EchoCheck function for ultrasonic sensors. [19], [20] . . . . . . . . . . . . . . . . . . 536.12 Arduino main-function. [19], [20] . . . . . . . . . . . . . . . . . . . . . . . . . . . . 546.13 Arduino function to publish the data from the range sensors. [19], [20] . . . . . . . . 556.14 Laserscan message [21] . . . . . . . . . . . . . . . . . . . . . . . . . . . . . . . . . . 556.15 Import the necessary libraries and initialize communication with Ardunio . . . . . . . 566.16 Initializing RangeToLaser node for publishing data from range sensors in ROS 2 . . . 576.17 Scan function in RangeToLaser class for receiving data from the arduino . . . . . . . 586.18 Import the necessary libraries and messages for the QRnavigationnode . . . . . . . . 676.19 Initializing QR_navigation node for publishing position and orientation data ob-
tained through the Raspberry Pi V2 camera . . . . . . . . . . . . . . . . . . . . . . . 686.20 The scan() member function of the class QR_navigation . . . . . . . . . . . . . . . . 696.21 Install the necessary ROS 2 dependencies . . . . . . . . . . . . . . . . . . . . . . . . 706.22 Install the necessary non-ROS debian packages . . . . . . . . . . . . . . . . . . . . . 716.23 Install ROS 2 Intel RealSense packages . . . . . . . . . . . . . . . . . . . . . . . . . . 716.24 Adding additional sensor to the URDF model of the system . . . . . . . . . . . . . . . 75
xiii
Low-cost Navigation and Collision Avoidance System
Abbreviations
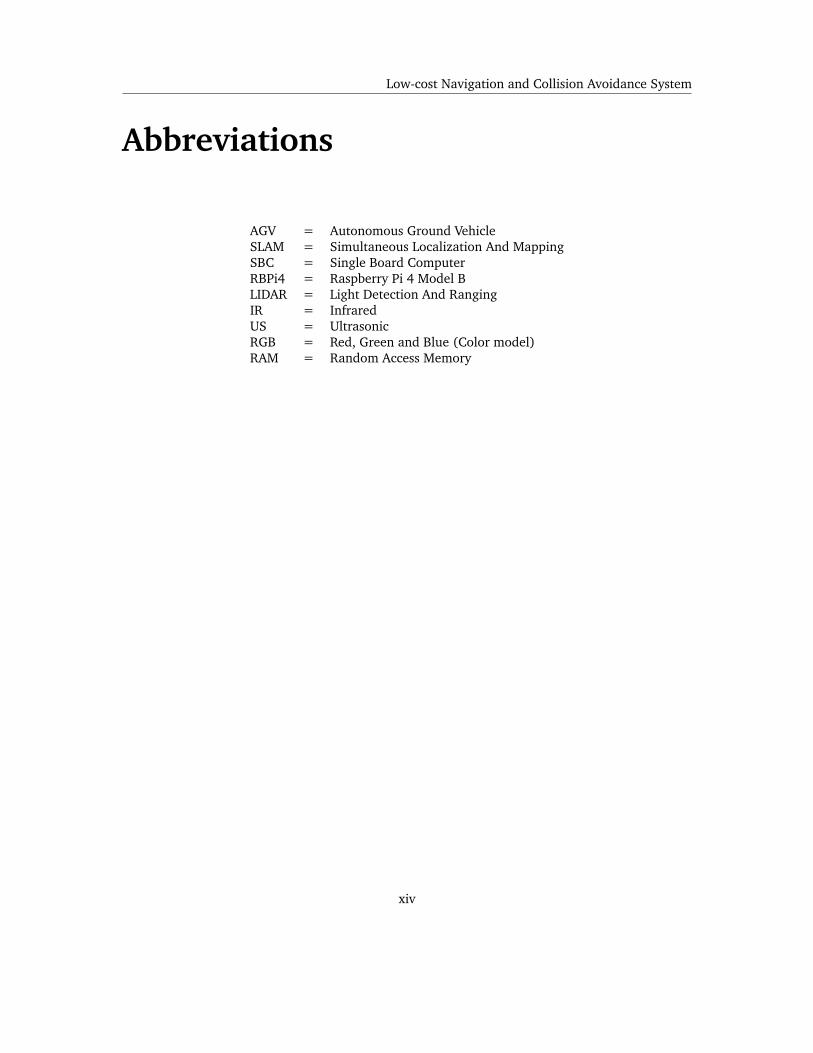
AGV = Autonomous Ground VehicleSLAM = Simultaneous Localization And MappingSBC = Single Board ComputerRBPi4 = Raspberry Pi 4 Model BLIDAR = Light Detection And RangingIR = InfraredUS = UltrasonicRGB = Red, Green and Blue (Color model)RAM = Random Access Memory
xiv

CHAPTER 1. INTRODUCTION
1 Introduction
1.1 Background and motivation
We develop robots to streamline production and to reduce the amount of manual labor. Robotic ma-nipulators are examples of robots developed to perform tasks previously done by hand. Autonomousground vehicles(AGV) are an example of robots developed to move objects from one place to an-other, or to carry out tasks such as cleaning and lawn mowing. In relation to industry, AGVs areoften used as a replacement for the traditional conveyor belt, as they can offer more flexibility andbe convenient in the context of batch production.
The older AVGs follow pre-determined paths in the form of some sort of physical guiding line.This is a limiting factor when it comes to flexibility. As well as being limited by little to no under-standing of the surrounding world, these systems are expensive to install and expand due to theneed for integrated guiding systems Figure 5, Figure 6.
Figure 1: AGV following a path with the activeinductive guidance method [1]
Figure 2: AGV following the path with the use ofa optical sensor [2].
In the later years the use of physical guidelines has been replaced by solutions that offer moreflexibility and freedom, allowing them to operate efficiently around both humans and other robots.For robots to be allowed to work in the same environment as humans there has to be reliable safetymeasures to avoid accidents. This means that the AGVs has to be equipped with accurate sensor-systems and programming so they have a broad enough understanding of the environment to adaptto their surroundings.
1

CHAPTER 1. INTRODUCTION
Figure 3: Illustration of AGV equipped with LIDAR sensing the surrounding environment [3].
These extra features makes the newer AGVs more complex. Consequently, more computationalpower is needed. In the meantime, low-cost of the shelf computers with significant calculationpower have become a common product, it is therefore desirable to extend upon this to develop alow-cost navigation and collision avoidance system. With respect to this thesis «low-cost» is definedas affordable for lab use by students without any extra support from the institute. Which usually isunder 5000 Norwegian kroner. As stated by prof. Amund Skavhaug.
Systems like this already exist, a popular one being the Turtlebot Figure 4. This is a robot kitwith open-source software. The aim of this thesis in not to create an alternative to the Turltebot,but rather a stand-alone sensor system that can be used by the Turtlebot and other robotic vehicles.The presented system is created with students in mind, with the aim being to create a tool thatcan be used in lab-work related to automation and robotic vehicles. Hence the code and hardwarearchitecture is well documented, and everything are open-source.
2

CHAPTER 1. INTRODUCTION
Figure 4: Turtlebot3 series [4].
Due to the COVID19 outbreak during the spring semester of 2020 a lot of students had to refor-mulate their master projects to be strictly theoretical. The reason behind this being that campus wasclosed for long periods of the semester, making it hard to perform lab-experiments. Together withmy supervisor Amund Skavhaug it was decided to go through with the practical part of the project,as it was concluded that a lot of the experiments could be conducted at home. However, sincecampus was closed it was hard to get the necessary equipment needed to develop the system andperform the necessary experiments, resulting in limited time to perform experiments and developthe actual physical system. Consequently, the project had to be scaled down, as it was not enoughtime to go through with the project as planned. The remaining work in relation to the project isdescribed at the end of the thesis.
3

CHAPTER 1. INTRODUCTION
1.2 Objectives
The objective of this master thesis is to develop a prototype low-cost navigation and collision avoid-ance system. The system aims to provide all the necessary information so that when implementedon an autonomous ground vehicle(AGV), the AGV can function in a dynamic environment aroundother flexible agents. Further it is preferable that the system runs on a low-cost single board com-puter(SBC). The aim of this project is not to develop new technology, but rather use existing tech-nology to develop a functioning prototype of a sensor system capable of providing enough infor-mation so that a robotic vehicle equipped with the system can function automatically. The workconducted in this thesis builds upon the research previously conducted by the author, described inAppendix A.
1.2.1 Research Objectives
1. Develop a sensor-system for obstacle detection.2. Develop a system for mapping and navigation.3. Implement the system on a low-cost single board computer(SBC)
The related research questions are defined and answered in Chapter 7.
4

CHAPTER 1. INTRODUCTION
1.3 Report Structure
Throughout the thesis choices made in relation to the developed system are discussed, this relatesto the different equipment and methods used in the development of the system. The reason whythis is not discussed in a distinct chapter alone is to make it easier to follow the thought processbehind each choice for the reader. The discussion around each choice is further elaborated on inChapter 8, together with a discussion around the results of each experiment.
1.3.1 Actions performed to ensure reliability
To ensure that the information used in the making of this thesis is reliable, the literature should befrom a collection of peer reviewed academic articles, established companies or from conversationswith experts in the respected field. In addition, by having a close collaboration with the supervisorall information is shared and reviewed together.
1.3.2 Literature studies
This chapter includes information from the conducted pre-study Appendix: A which the chosensystem presented in this thesis builds upon. It is included in the thesis to give the reader someadditional context as to why the developed system is chosen over other similar systems. For furtherreading, the whole pre-study is included in Appendix: A.
1.3.3 System requirements
Chapter 3 presents the requirements for a finalized low-cost system for navigation and obstacleavoidance.
1.3.4 Theory
Chapter 4 presents the relevant background theory. This serves as an introduction to the methodsused in the development of the system.
1.3.5 Concept
Chapter 5 presents the concept of which the final system is based upon. The concept is developedwith background in the pre-study conducted by the author [22].
1.3.6 System development
Chapter 6 presents the development process of the system, and the final product developed in thisproject. This includes both hardware and software solutions.
1.3.7 Experiments, results and discussion
Chapter 7 presents the experiments done in relation to each aspect of the developed system, theresult from each experiment and discussions around them. The chapter concludes with a discussioncomparing the results to the system requirements described in chapter Chapter 3.
1.3.8 Discussion, conclusion and future work
Chapter 8 concludes the thesis, presents a discussion around the project as a whole and givesrecommendations for future work related to the project.
5

CHAPTER 2. LITERATURE STUDIES
2 Literature Studies
This chapter is an excerpt of a pre-study related to this thesis conducted by the author. The pre-study isa literature study of existing systems related to autonomous ground vehicles(AGV’s). The thesis buildsupon the research described in the pre-study, and this chapter is included to give a reference to why themethods described in this thesis is chosen over other methods commonly used in relation to AGV’s. Asthe pre-study is an internally published thesis it is included in Appendix A for easy access.
This chapter gives an overview over some of the existing methods used in the control of au-tonomous ground vehicles(AGVs). Further, some of the different aspects of safely controlling a AGVin dynamic environments is discussed, which includes mapping, navigation and obstacle avoidance.Some of the different sensors and software solutions which is often used to carry out these tasksare described and evaluated in relation to the main objective of this thesis. That is to researchand determine if it is feasible to develop a low-cost navigation and obstacle avoidance system ona low-cost off the shelf computer. Consequently, the evaluation of different low-cost Single BoardComputers(SBCs) is given its own section at the end of this chapter.
2.1 Developed methods
There are many applications for automatic guided vehicles(AGVs), varying from handling of haz-ardous material, to automatic vacuum cleaners and lawn mowers. Through the years as technologyhas advanced, AGVs has advanced as well. This has resulted in more flexible solutions, which is oneof the main reasons why AGVs are so prevalent today. This flexibility is also what allows AGVs towork in dynamic environments around other agents, including humans. This increase in freedommakes safety a top priority. To ensure that no harm is done to people or objects, it is recommended tofollow several safety regulations. In Europe the standard «EN 1525, Driverless industrial trucks andtheir systems» is used as a standard for driverless indoor vehicles. In the book «Automated GuidedVehicle Systems» the author summarizes some of the regulations directly applicable to AGVs, themost relevant in relations to this projects is the following:
• «The personnel protection system is essential. It has to ensure that people or objects locatedon the drive path or on the envelope curve of the AGV together with its payload are reliablyrecognized. Should this occur, the vehicle has to safely come to a stop before persons or objectsare injured or damaged. Mechanical systems react to contact and are designed, e.g., as plasticbales or soft foam bumpers. Contact-free sensors scan the endangered areas ahead of thevehicle using laser, radar, infrared or ultrasound, or a combination of several technologies.»[23].
6

CHAPTER 2. LITERATURE STUDIES
In short this means that the AGV should have a system for obstacle avoidance.
Dependent on the complexity of the task there are developed different methods for the au-tonomous control of AGVs. A common way for AGVs to navigate is through the use of guidednavigation. This is carried out by retrofitting the workplace with the tools needed for the AGV tonavigate the environment. In an industrial environment this is often solved by the use of physicalguidelines or beacons. Other developed systems are not dependent on retrofitting of the workplace,and allows the AGV to navigate freely on its own. This comes at the cost of complexity, so the robotitself must be able to handle a larger amount of data, and perform complex data handling. This isa result of the AGV having to recognize its environment, as well as other agents operating withinthat environment. This section serves as a introduction to some of the most common methods re-lated to the automatic control of AGVs. The methods are described along with their advantages anddisadvantages, and they are compared to eachother with the main objective of this thesis in mind.
2.1.1 Physical guidelines
One of the simplest methods developed for the autonomous control of AGVs is the use of pre-determined paths that guide the vehicle. This is often solved either by a optical guidance track,made from a color that clearly contrast the floor or a inductive guidance track integrated in thefloor itself. Since a strip of coloured tape or paint on the floor is very exposed and easily damaged,the inductive guidance track is more often used in industrial environments.
Figure 5: AGV following a path with the activeinductive guidance method [1]
Figure 6: AGV following the path with the use ofa optical sensor [2].
With active inductive guidance tracks, the wires embedded in the floor carries a signal with a lowAC-voltage and frequency. Two coils are mounted under the vehicle at right angles to the conductorin which the alternating current of the guide wire induces a flowing current [23]. This allows theAGV to navigate its position according to the positing of the wire. With optical sensor technologythe AGV aims to keep the colored line in the center of view, changing its position according to thedisplacement of the colored line.
There are several ways of guiding the vehicle along a track, but the principle is the same - adjust
7

CHAPTER 2. LITERATURE STUDIES
the pose of the AGV in order to counter the displacement of the guidance track. Since the AGV isonly capable of following the path of the track, this method offers little flexibility. As a result thereis not much complexity associated with this method. This comes from the fact that the AGV hasno use for intelligence or an advanced sensor-system, since the only action besides following thepre-determined path is to stop if something is in its direct path. Besides the lack of flexibility thismethod comes with another downside. That is the time consuming and costly retrofitting of theworkspace that is needed to install such a system, as the guidance tracks must be installed beforethe AGV can function properly. As a result of this it is just as time consuming to make changes tothe system once it is installed, which makes expansion of the system difficult.
Another use of physical guidelines is to use them as barriers which the AGV is not allowedto cross. Automatic lawn mowers are free to move inside an marked area, and as soon as theyencounter the barrier they will turn around. In the terms of industry this can be used as a extrasafety precaution making sure the AGV does not enter a area it is not allowed to enter.
2.1.2 Beacons
The next step from AGVs dependent on physical guidelines are AGVs that uses beacons placedaround the working environment. The angle and distance to the beacons is calculated and used tocalculate the position of the AGV through triangulation. Since there is no physical guideline tellingthe AGV where to move, a map of the environment is optimal along with a system for determiningpaths telling the AGV where to move.
The calculated position of the AGV is then compared to the reference position given by thecalculated path and the control system adjust the AGV according to the path. Figure Figure 7 showshow beacons can be used in practice.
Figure 7: Determining position of AGV with beacons. [5]
This is simply a method for determining the position of the AVG. If the vehicle comes with a
8

CHAPTER 2. LITERATURE STUDIES
integrated map and a collision avoidance system this would allow for more flexible navigation.The positioning of the vehicle along with a map would allow the AGV to know its position inrelation to the surrounding objects, which makes it possible for path planning around the workingenvironment. Together with a collision avoidance system ensuring that the vehicle does not collidewith other agents or obstacles this method offers more flexibility. This new layer of flexibility is ahuge improvement from the previously described method. Rerouting of the AGVs paths would bemuch easier, since no changes would have to be done to the workspace itself. This makes it possiblefor the AGV to work in a dynamically changing environment, and with a collision avoidance system,around other flexible agents including people. The workplace still has to be retrofitted to the AGV, asbeacons would have to be installed. Still the retrofitting is not as an extensive as with a system basedon physical guidelines. As a result expansion of the system is easier. This comes at the cost for amore complicated sensor-system and the data handling that comes with the navigation and collisionavoidance system makes this solution more complex. Consequently, a more powerful computer isneeded.
2.1.3 Natural Feature Navigation
Natural feature navigation allows the AGV to navigate the environment without any retrofitting ofthe workplace. Instead the AGV rely on natural landmarks in addition to odometry to keep trackof its positioning. Odometry is the use of data from the motion sensors on the AGV to calculatethe change in position over time. This makes for a highly flexible system that is easy to install andexpand, but this comes at the cost of complexity. As it is no easy task to navigate with only the useof natural features. Usually expensive LIDARs or stereo cameras is needed in order to recognize thenatural landmarks as well as a powerful computer to handle all the sensor data.
9

CHAPTER 2. LITERATURE STUDIES
2.1.4 Discussion
In table 2.1.4 I have tried to systematize the advantages and disadvantages of the differentmethods described. This is done with the main objective of the thesis in mind.
Method Advantages Disadvantages
Physical guidelines
Well tested technology. Not flexible, paths can only bechanged by changing the floorinstallations.
Simple solution, not muchcomplexity associated.
Depending on chosen guide-lines, floor installations maybe costly.
Expansion is hard and timeconsuming.
If the guidelines is damaged,the system stops.
Beacons
Offers high precision if place-ment is well though out.
Retrofitting is still needed.
AGV can move freely withinarea fitted with beacons.
Retrofitting of new area is re-quired in order to expand thesystem.
Expansion is less costly thenwith physical guidelines.
Allows for effective operationwithin a dynamic environ-ment if additional system forobject avoidance is included.
Natural feature navigation Flexible Computational cost is highdue to the complexity of thesystem.
Easy to expand Depending on the workspace,it may not be natural uniquelandmarks.
Allows for operation within adynamic environment.
Table 1: Advantages and disadvantages of described methods
10

CHAPTER 2. LITERATURE STUDIES
When comparing the methods described in this section it is important to have the research ob-jective in mind. At first glance the use of physical guide lines seems like a good option. Especiallysince the complexity is low, and as a result of that the method is well suited for a low cost computer.However, the costs related to retrofitting the workplace, and the lack of flexibility outweighs thebenefits. That being said, some inspiration can be drawn from this approach, as physical lines canbe used in addition to a more flexible system to make sure the AGV does not enter areas it is notallowed to enter if a miscalculation were to happen.
Both the method involving beacons and natural feature navigation allows for a flexible AGVcapable of working efficiently in a dynamic environment. Natural feature navigation has the clearadvantage of not needing to retrofit the workspace, but this comes at the cost of a more complexproblems to solve. As a result of this it may be hard to implement on a low cost computer.
With this in mind the rest of the thesis focuses on the more flexible options, which is naturalfeature navigation, and methods involving beacons. While solutions relying on guidance lines willbe disregarded, since the retrofitting that comes with these methods are costly, and they do notmeet the criteria for flexibility needed.
11
CHAPTER 3. SYSTEM REQUIREMENTS
3 System requirements
In this chapter the requirements for a complete low-cost navigation and collision avoidance systemis presented. That is, as system capable of providing the necessary information such that an au-tonomous ground vehicle(AGV) equipped with the system can function safely and effectively in adynamic environment. Such a system has the ability to detect obstacles and provides tools for nav-igating the working environment. Further, the system should allow for flexible AGVs, able to adaptto changes in the working environment without much retrofitting. In addition to technical require-ments, requirements in relation to cost, system life expectancy and implementation of the systemare presented, as the main objective is to develop a low-cost system. Each of these requirements areelaborated further in their own sections.
3.1 Technical requirements
For an AGV to function safely and effectively within a dynamic environment it has to have theability to perceive information about the surrounding world, and use this information to navigateits surrounding while at the same time avoid accidents. A flexible system allows the AGV to adaptto changes in the working environment, without much retrofitting. As such, the key functions anavigation and collision avoidance system should include are:
• Reliable obstacle detection.• Reliable positioning within the working environment.• Ability to automatically update map of the working environment.
3.1.1 Obstacle detection and avoidance
The main concern of autonomous vehicles is the aspect of safety, especially since AGVs tends towork alongside humans. Consequently, it is crucial that the system is capable of detecting obstacleswithin a certain range of the AGV. With this information available, the AGV can act accordingly andprevent damage to itself, surrounding equipment and humans.
Consequently, the system should provide enough information about a large enough area suchthat the AGV running the system can react in time to avoid collision. There are multiple scenar-ios which can cause accidents, the main one being the AGV driving into obstacles. Therefore theobstacle avoidance system should provide the necessary information for the AGV to come to a fullstop before collision. This means that the detection range of the obstacle detection system shouldbe long enough so that the vehicle has time to stop. Depending on the speed of the vehicle, therange a AGV needs to come to a full stop may vary. Using the AGVs from the robotic lab at NTNUas a standard, their maximum speed is 1.5 m/s. Calculating the braking distance with equation
12

CHAPTER 3. SYSTEM REQUIREMENTS
Equation 3.1 and µ = 0.2 in the worst case, yields a braking distance of 0.57 meters.
s =v0
2
2 ∗ µ ∗ g (3.1)
Taking into consideration that the friction coefficient µ may vary, «obstacles» may approachthe AGV with speed of their own and that the AGV may need some time to react to the detectedobstacle, a detection range of 4-5 meters should be sufficient. This is also taking into account thatthe AGV will stop leaving some distance between itself and the obstacle.
Further, accidents may occur if other moving obstacles collide with the AGV. Consequently, it isbeneficial if the system can provide information about the surrounding environment in all direc-tions. This can be used to avoid accidents such as the AGV coming to a full stop if an obstacle ismoving towards it from behind. The main goal is not to develop a system capable of avoiding allaccidents, but a system able to provide enough information to the AGV controller such that it canuse the provided information to navigate safely.
In conclusion the requirements for the obstacle detection and avoidance system are:
• The system should provide enough information about a large enough area so that an AGV canreact in time to avoid accidents.
3.1.2 Mapping and positioning
For an AGV to work in a dynamic environment, perform tasks and to efficiently move from one placeto another, it should have some understanding of the environment it is working within. If not, theAGV will not have any way to localize its position within the environment, and therefore not havethe ability to plan routes from one point to another in the working environment. Consequently, thesensor-system should provide a method for performing mapping and navigation. The point of themap is to allow the an AGV to keep track of its own position in relation to the other obstacles withinthe working environment, allowing it to plan routes around these. For that reason the map shouldcontain all the stationary installation in the real world. Working environments are often undergoingchanges, which sometimes means new installations is installed, therefore the sensor-system shouldbe able to update the map [22].
In conclusion with mapping and navigation purposes the system should:
• Automatically create and/or update the map of the working environment.• Keep track of its position within the working environment.
13
CHAPTER 3. SYSTEM REQUIREMENTS
3.2 Simplicity and life expectancy
Industrial systems often comes with a guarantee for long life expectancy, as one would not want alot of additional cost for reparations and replacements of equipment. This however means that theequipment will be expensive to buy in the first place. With a low cost system the same robustnesscannot be promised, therefore it is desirable that the system is uncomplicated to debug and repairif necessary. This would also allow for simple implementation of new and better hardware, as low-cost equipment keeps getting better. Especially low-cost single board computers(SBCs).
Another desirable requirement is that the system is easy to implement. Which means that thesystem should be easy to connect to existing AGVs, both with respect to hardware and software.
3.3 Cost and scope of the system
The main objective of this thesis is the development of a low-cost navigation and object avoidancesystem. In relation to this thesis «low-cost» is defined as affordable for lab use by students withoutany extra support from the institute. Which usually is around 5000 Norwegian kroner. As stated byprof. Amund Skavhaug.
To achieve this it is desirable to implement the system on a low-cost SBC computer capable ofprocessing the data on-board. Further the collected overall cost of the system should not be muchmore than 5000 Norwegian kroner.
3.4 Summary of requirements
In order to develop a low-cost navigation and collision avoidance system capable of providingthe AGV with enough information to operate within a dynamic environment surrounded by otheragents, the following requirements should be upheld:
Requirement 1 The system should provide enough information about a large enough area and beable to detect all obstacles within the range of the system so that an AGV can react in time toavoid accidents.
Requirement 2 The system should be able to automatically update the map of the working envi-ronment.
Requirement 3 The system should have a method for keeping track of its position within the work-ing environment.
Requirement 4 The system should be easy to implement.Requirement 5 The system should be simple to repair and debug.Requirement 6 The total cost of the system should be less then or around 5000 Norwegian kroner.
The system presented in this thesis aim to uphold these requirements. A control system whichact upon the received information from the sensor system is not described, as this is not a part ofthe thesis. The degree to which it does uphold these requirements is presented and discussed inChapter 7 and Chapter 8.
14

CHAPTER 4. BACKGROUND THEORY
4 Background theory
This chapter serves as an introduction to the theory used in the development of this project, whichis the development of a low-cost navigation and collision avoidance system. In order to realize thisproject a multitude of different sensors work together to perform obstacle detection, navigation andmapping. This is a mixture of range sensors, visual sensors and depth sensors. Consequently, thetheory behind how these sensors work and the theory behind the methods used to perform mappingand navigation is explained. Further, specialized theory regarding the implemented methods anddevelopment platform is introduced in their respected section. This includes an introduction tothe robot operating system ROS2 (Section 6.3), how the different sensors interface with the system(Section 6.5) and the exact method of which the position and orientation of the system is calculatedbased on visual landmarks (Section 6.6). The reason for having the specialized theories in the samesections as the implemented methods are to present the implemented methods without the readerhaving to go back and look up the theory from this chapter. This chapter is based on the pre-studyconducted in relation to this thesis appendix: A, notable exceptions are Section 4.1.3, Section 4.2.1and Section 4.2.3.
4.1 Obstacle detection with ultrasonic-and infrared range sensors
In this section the theories behind two different kind of range sensors are explained. That beingthe ultrasonic and the infrared range-sensors, both of which has low-cost alternatives available forpurchase, making them a good fit for this project.
4.1.1 Ultrasonic distance measurement
Ultrasound operates at frequencies greater than what humans can hear, soundwaves over 20kHz isconsidered ultrasonic. The sensors consist of an emitter and a receiver. The emitter emits a sound-wave while the receiver waits for the emitted waves to be reflected back, before calculating thedistance based on the elapsed time. The distance is given by Equation 4.1.
D =t
2× c (4.1)
Where D denotes the distance from the sensor to the detected object, t denotes the elapsed timefrom emitting to receiving the waves, and c is the speed of sound. Since we only want to know thedistance between the sensor and the object, we have to divide the equation by 2. As the speed ofsound varies based on temperature and the material the waves propagate in, c must be adjustedbased on this. The speed of sound in air can be approximately calculated from Equation 4.2, whentreated as an ideal gas.
15

CHAPTER 4. BACKGROUND THEORY
c =√k ∗R ∗ T (4.2)
Where:
• k = ratio of specific heat• R = gas constant• T = temperature in kelvin
The main advantage of ultrasonic sensors is that they are easy to use and relatively cheap,besides this they prevail in poor lightning conditions as this does not effect the measurements. Thisalso means that the color of the obstacle does not matters, as the sensor will be able to detect it aslong as it reflects sound.
There are several disadvantages with ultrasonic sensors. One of them is its inability to detectsound absorbing objects, since they will not reflect the emitted signal. Another problem is the factthat if the surface of the obstacle is at to great an angle relative to the sensor, the signal will notbe reflected back to the sensor. These two scenarios are illustrated in 8. The last drawback with theultrasonic sensors is the variance in the speed of sound based on the temperature. If not accountedfor, this will produce errors in the distance measurements as the distance is calculated based on thespeed of sound. However, in relation to this thesis it is assumed that the variance in temperature inan indoor environment is small enough to be disregarded.
Figure 8: Ultrasonic distance sensor failing to detect sound absorbing, and flat angled surface [6]
16
CHAPTER 4. BACKGROUND THEORY
4.1.2 Infrared distance measurement
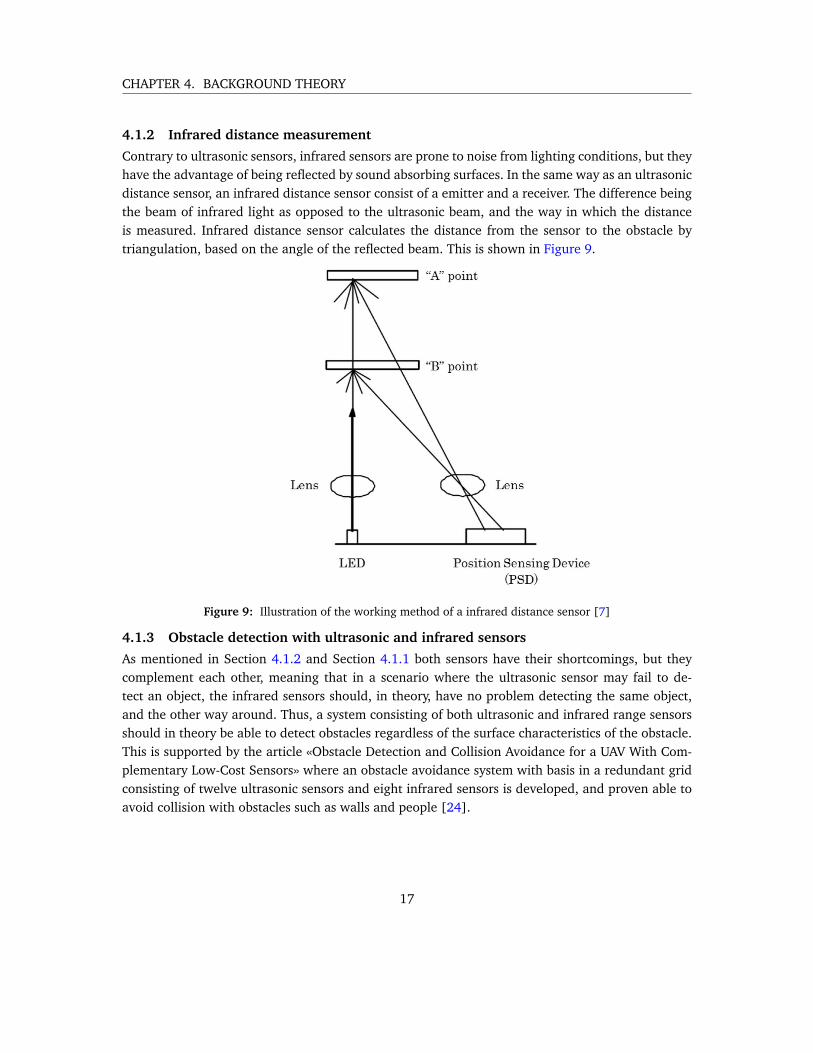
Contrary to ultrasonic sensors, infrared sensors are prone to noise from lighting conditions, but theyhave the advantage of being reflected by sound absorbing surfaces. In the same way as an ultrasonicdistance sensor, an infrared distance sensor consist of a emitter and a receiver. The difference beingthe beam of infrared light as opposed to the ultrasonic beam, and the way in which the distanceis measured. Infrared distance sensor calculates the distance from the sensor to the obstacle bytriangulation, based on the angle of the reflected beam. This is shown in Figure 9.
Figure 9: Illustration of the working method of a infrared distance sensor [7]
4.1.3 Obstacle detection with ultrasonic and infrared sensors
As mentioned in Section 4.1.2 and Section 4.1.1 both sensors have their shortcomings, but theycomplement each other, meaning that in a scenario where the ultrasonic sensor may fail to de-tect an object, the infrared sensors should, in theory, have no problem detecting the same object,and the other way around. Thus, a system consisting of both ultrasonic and infrared range sensorsshould in theory be able to detect obstacles regardless of the surface characteristics of the obstacle.This is supported by the article «Obstacle Detection and Collision Avoidance for a UAV With Com-plementary Low-Cost Sensors» where an obstacle avoidance system with basis in a redundant gridconsisting of twelve ultrasonic sensors and eight infrared sensors is developed, and proven able toavoid collision with obstacles such as walls and people [24].
17

CHAPTER 4. BACKGROUND THEORY
Another way to improve the capabilities of such a system is to have the measurement areas ofthe sensor overlap, preferably every angle within the measurement area should be covered by morethan one pair of sensors. Increasing the change of detection of an obstacle if one or more sensorsshould produce false measurements. Figure 10 shows an illustration of two overlapping sensors.The overlapping area is covered by both sensors, thus making measurements from this area morereliable than the two areas only covered by either of the sensors.
Figure 10: Illustration of two overlapping range sensors.
18

CHAPTER 4. BACKGROUND THEORY
4.2 Navigation and mapping
Besides being able to detect obstacles an automatic ground vehicle(AGV) requires methods for nav-igating the working environment, and in cases where there exist no prior map of the environmentit is advantageous if the AGV can create a map on its own. There are different ways of doing this, inrelation to this project the chosen methods are visual landmarks for navigation and simultaneouslocalization and mapping(SLAM) and occupancy grid mapping for both mapping and navigation.
Visual landmarks serves as distinct landmarks placed withing the working environment, of whichthe position is known. The AGV can use these landmarks to update its own position by calculatingits relative position in relation to the landmarks. For this a standard two-dimensional RGB camerais used. Therefore a subsection is dedicated to how a point in three-dimensional space is calculatedusing the pinhole camera model.
For SLAM and occupancy grid mapping to work, the sensor system must provide depth dataof the environment. The difference between a range sensor and a depth sensor is the resolution inwhich the sensor can provide information about the surrounding environment. To perform mappinga high resolution depth image of the environment is needed, this can either be a two-dimensionalimage describing the relative position of surrounding environments in a horizontal-plane, or athree-dimensional image describing the relative position in X, Y and Z - coordinates. Consequently,a subsection is dedicated to different ways of obtaining depth data. In addition a brief introductionto both algorithms is given in their own subsections.
4.2.1 Pinhole camera model
The pinhole camera model describes the relationship between a point in three-dimensional spaceand its projection onto a two-dimensional image plane of an ideal pinhole camera. This is illustratedin Figure 12.
Figure 11: Illustration of the pinhole camera model [8]
19

CHAPTER 4. BACKGROUND THEORY
In an ideal camera model we assume that the radius of the pinhole closes down to zero, so thatevery ray goes through the optical center of the camera and are then projected upon the imageplane. The distance from the pinhole to the image plane is called the focal length of the camera.The relationship between a point in three-dimensional space and its projection on the image planeis illustrated in Figure 12.
Figure 12: Illustration of the geometry describing the relation between the image plane and 3D-coordinates
Summarized the relationship between the 3D coordinates of a point P and the image coordinatesof the reflected point Q in the image plane is given by Equation 4.3.
y1y2
=f
x3∗ x1x2
(4.3)
Where y1 and y2 refers to the 2D coordinates of point Q in the image plane, x1, x2 and x3 refersto the real-world coordinates of point P and f is the focal length of the pinhole camera.
20

CHAPTER 4. BACKGROUND THEORY
4.2.2 Stereo vision
In order to map the environment, depth perception is needed, as we want to know the distancebetween the AGV and its surroundings. A commonly used method for obtaining depth perceptionis stereo-vision. Stereo-vision emulates the most common visual system we find in nature, whichis a set of two eyes. By receiving information about a scene from two cameras fixed in relationto each other, one can extract depth information. This is done by correlating points in the twodifferent images, then calculating the depth with triangulation. The problem is to find correlatingpixels in the two images, as searching through the whole two-dimensional image plane in order tofind matching pixels is very time consuming. Instead, since the pose of the two cameras is known,we use epipolar geometry, which describes the relation between three-dimensional points and theirprojection onto the two-dimensional image. This narrows the search for correlating pixels downfrom a two-dimensional array containing all the pixels to a one-dimensional array only containingthe pixels along a distinct line in the image plane. This line is called the epipolar line.
Figure 13: Epipolar views [9]
Figure 13 illustrates how one point, denoted by X can be anywhere on the line OL−X from theview of the left camera. Since it is only seen as a distinct point denoted by XL in a two-dimensionalimage plane. From the view of the right camera, OL−X is seen as a line and projected into the rightimage plane as the line eR − XR, which is the epipolar line. After searching through the epipolarline for a matching pixel, we have a known triangle from which the depth can be calculated.
21

CHAPTER 4. BACKGROUND THEORY
4.2.3 Active IR stereo vision
The performance of a stereo vision sensor depends on the degree to which it is capable of distinguishbetween features in the images it is taking. A problem for regular passive stereo vision sensors mayoccur when the scene consist of flat surfaces where it is difficult to distinguish between neighbouringpoints. With an active IR stereo vision sensor a texture projection of IR light is projected upon thescene which may help to add details to the scene outside of the visual spectrum. This additionaldetail makes it easier for the vision sensor to distinguish between the neighbouring points in theimages. This is illustrated in Figure 14
Figure 14: Illustration of a active IR stereo sensors [10]
22

CHAPTER 4. BACKGROUND THEORY
LIDAR technology
LIDAR is an acronym for Light Imaging And Ranging. LIDAR technology uses light pulses to illumi-nate its surroundings, and it measures the reflected light. There are two methods used to calculatedistance to the surrounding objects. It is either calculated based on time of flight or by analysing thewavelength of the received signal. With time of flight the distance is calculated with Equation 4.4.
D =t ∗ c2
(4.4)
Where D denotes the distance to the object, t is the travel time and c is the speed of light. This isdivided by two to give the distance between the objects.
The typical LIDARs used in robotics are spinning LIDARs, giving them a 360 degree viewingangle. Because the speed of light is so fast the frequency of the light pulses can be very high,resulting in a high resolution map of the environment. For robotic-mapping purposes there are twodifferent options available, either a two-dimensional LIDAR, or a three-dimensional LIDAR. A 2D-LIDAR sends out light beams only in the horizontal plane, while the 3D-LIDAR also send light beamsin the vertical axis, resulting in a 3D scan of its surroundings. Depending on the chosen LIDAR thiscan either be used to create a two-dimensional map or a three-dimensional map.
4.2.4 Odometry
Odometry is the use of sensor data to estimate change in position over time, and is often used inrelation to navigation and mapping in robotics. There are different methods for calculating odom-etry, one being to calculate odometry from the wheels of the robot. When the circumference of thewheels is known, and a sensor is keeping track of the rotations of the wheels the change in positioncan be calculated. Depending on the robot the position, velocity, angular velocity and orientationcan be estimated by comparing the odometric data from each wheel.
Odometric data can also be obtained by comparing sensor data of the surrounding environmentfrom one point in time to another, this is the case in visual odometry. With visual odometry distinctfeatures from the images are compared, and the odometry of the robot is estimated by comparingthe change in position of these features. In order for visual odometry to be effective there has to beenough distinct features in the scene for the sensor to capture.
23

CHAPTER 4. BACKGROUND THEORY
4.2.5 SLAM
SLAM is an acronym for Simultaneous Localization And Mapping. As the acronym implies, it is amethod for construction a map of an unknown environment, and at the same time keep track of theagents position within that environment. This is a hard problem to solve, as the path and positionof the agent is not known with certainty. The error in position correlates errors in the map it isconstructing, as a result both has to be estimated simultaneously [25].
Odometry estimates the position of the AGV in relation to its starting position based on datafrom motion sensors. AGVs can with rotary encoders on the wheels, and with the angle of thewheels estimate the change in position over time based on the sensor data. This data is howeverprone to error over time, and is therefore not a sufficient method to keep track of the location of theAGV. The SLAM-algorithms solution to this problem is loop-closure. Loop-closure is the re-visitingof previously observed landmarks where the positioning of the AGV is known with more certainty.This extra information of the pose increases the certainty of the previous poses as well [25]
Figure 15: Blue line depicting the path of the robot before loop-closure, red line depicting the path afterloop-closure [11].
Because of the complexity associated with the SLAM method, it is considered a hard problem tosolve, especially as the working environment gets bigger [26].
24

CHAPTER 4. BACKGROUND THEORY
4.2.6 Occupancy grid mapping
Occupancy grid mapping is a term representing a family of robotic algorithms that aim to generatemaps from sensor data assuming the pose of the robot is known. This is the key difference betweenthis method and the SLAM approach. The robot measures the distance to surrounding objects usingits sensors, the measurements are then translated from the robot frame to the global frame whereit is used to generate the occupancy grid map.
Figure 16: Illustration of a robot updating theoccupancy grid map using sensor data
An occupancy grid map is an array of occu-pancy variables. Each cell in the occupancygrid map is associated with one occupancyvariable. This is a binary random variablewith either the value 1 or 0, representing aoccupied or empty cell. If a cell is occupiedthis means that it is an obstacle in the corre-sponding position in the real-world.Building an occupancy grid map is based onprobabilistic calculations for each cell. Fromthese calculations a map containing eitherfree or occupied cells is constructed.
When generating the occupancy grid map every observed cell is given a value describing theprobability of that cell being either occupied or free. As these cells are observed again and againthrough overlapping measurements, the value they hold is updated with an update rule. This meansthat if a cell is measured to have the same state over and over, the probability of that cell havingthat exact state increases. This is illustrated in Figure 17. The lighter the color is, the more probableit is that the cell is free, the darker the color is, the more probable the cell is occupied.
Figure 17: Illustration of the logarithmic updating process
The accuracy of this method is highly dependent on to which degree the position of the vehiclecan be calculated accurately. Since the problem of mapping the position of other objects in relationto the position of the AGV alone is a straight forward problem to solve in comparison to having to
25

CHAPTER 4. BACKGROUND THEORY
calculate the position of the AGV at the same time [25], this method is a viable option. As a resultit can be assumed to be easier to implement on a low-cost computer.
26
CHAPTER 5. CONCEPTIONAL DESIGN
5 Conceptional design
This system described is based upon the pre-study, included in appendix: A, where a literaturestudy of existing technology was conducted, and a concept was developed based on the findings.The presented concept is similar to the concept presented in appendix: A, notable exceptions aresection 5.2. Along with the description of the system comes a list of the necessary equipment. Theconcept is further expanded upon in Chapter 6.
The presented concept is a concept for a stand alone sensor system designed to be coupled witha existing autonomous ground vehicle(AGV), as such the information provided by the sensor systemalone is not enough to perform mapping, navigation and collision avoidance. The objective of thedescribed system is to provide enough information about the surrounding environment such thatwhen coupled with an AGV it should be able to provide these services.
The system does not provide odometry readings nor does it include a method for controlling theAGV’s actuators. However, one of the goals of the system is to perform mapping and navigation on-board. Consequently the system should have a method for communicating with the AGV to receivethe necessary information to perform these tasks.
The presented concept is for a prototype system. Therefore, the chosen equipment is for developmentpurposes. The result of this is that the equipment is not the cheapest available. The equipment is chosenwith basis in price and performance since the main objective of this thesis is to develop a low-cost navi-gation and obstacle avoidance system, but also for making the development process as straight forwardas possible. In the cases where this is true, an alternative solution is presented.
The following list is the technical requirements of the presented system.
• The whole system should be implemented on a low-cost single board computer(SBC).• When receiving the necessary data from a AGV the system should have the ability to automat-
ically generate and update a map of its surroundings.• Coupled with an AGV the system should be able to accurately keep track of its position within
the workspace.• The system should be able to detect suddenly appearing obstacles before collision occurs.• The system should have a method for interfacing with an existing AGV to send and receive
the necessary data.
27

CHAPTER 5. CONCEPTIONAL DESIGN
5.1 Low-cost computer
The single board computer most fit for this project is the Raspberry PI 4 Model B(RBPi4). Partly dueto the price, the power of the computer and the community support for Raspberry PI. The RBPi4should be accompanied by a micro-controller, in this case a Arduino. The Arduino will serve as aslave to the RBPi4, communicating directly with the range sensors. The data from the Arduino issent to the RBPi4 for further processing. The reason why the arduino is used as a hub to commu-nicate with the range sensor is because of the lack of integrated input/output(I/O) ports on theRBPi4 and the existing libraries for using low-cost range sensors together with the arduino. Makingit easy for development purposes to have the arduino handle the communication with the sensors.This is not necessary, but it was deemed as the best choice for development purposes.
Figure 18: Arduino UNOFigure 19: Raspberry Pi 4 model B
Further, the RBP4 is a generic SBC, meaning it is not specialized for a specific task and has a lotof unnecessary extra equipment in relation to this project. This is not a problem when developingand testing a prototype, but a final product should use a barebone computer with no unnecessaryequipment, as this will reduce the cost of the system.
28
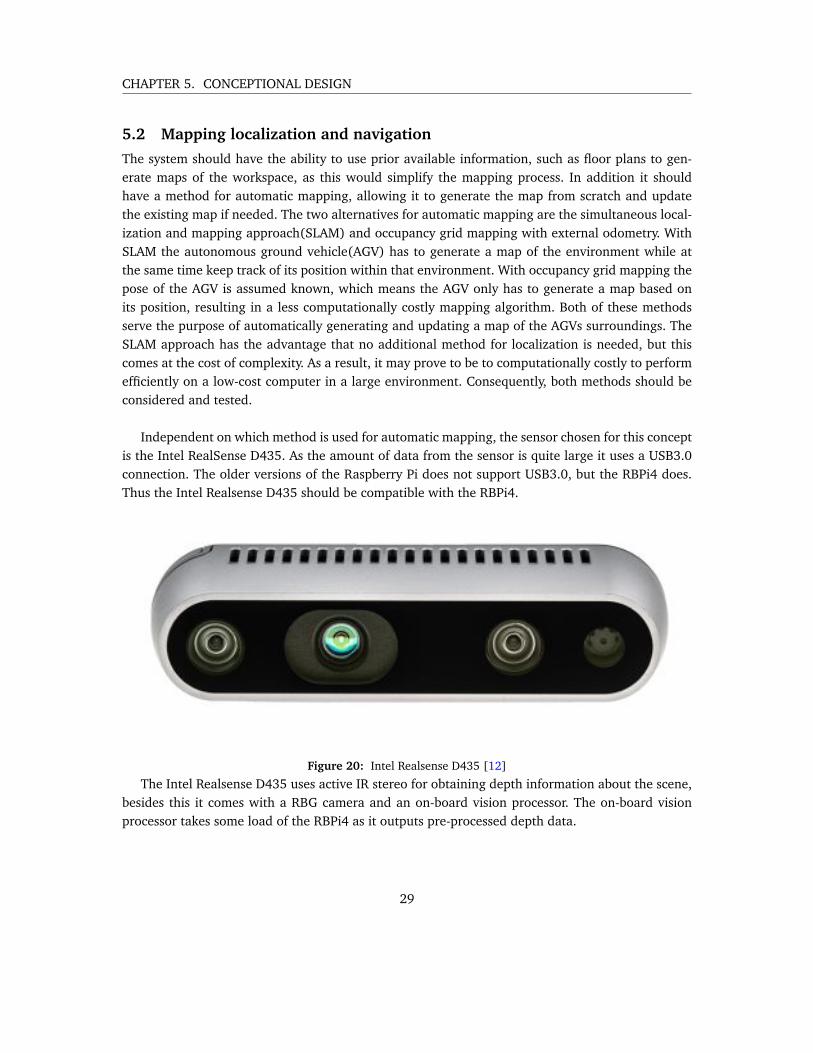
CHAPTER 5. CONCEPTIONAL DESIGN
5.2 Mapping localization and navigation
The system should have the ability to use prior available information, such as floor plans to gen-erate maps of the workspace, as this would simplify the mapping process. In addition it shouldhave a method for automatic mapping, allowing it to generate the map from scratch and updatethe existing map if needed. The two alternatives for automatic mapping are the simultaneous local-ization and mapping approach(SLAM) and occupancy grid mapping with external odometry. WithSLAM the autonomous ground vehicle(AGV) has to generate a map of the environment while atthe same time keep track of its position within that environment. With occupancy grid mapping thepose of the AGV is assumed known, which means the AGV only has to generate a map based onits position, resulting in a less computationally costly mapping algorithm. Both of these methodsserve the purpose of automatically generating and updating a map of the AGVs surroundings. TheSLAM approach has the advantage that no additional method for localization is needed, but thiscomes at the cost of complexity. As a result, it may prove to be to computationally costly to performefficiently on a low-cost computer in a large environment. Consequently, both methods should beconsidered and tested.
Independent on which method is used for automatic mapping, the sensor chosen for this conceptis the Intel RealSense D435. As the amount of data from the sensor is quite large it uses a USB3.0connection. The older versions of the Raspberry Pi does not support USB3.0, but the RBPi4 does.Thus the Intel Realsense D435 should be compatible with the RBPi4.
Figure 20: Intel Realsense D435 [12]
The Intel Realsense D435 uses active IR stereo for obtaining depth information about the scene,besides this it comes with a RBG camera and an on-board vision processor. The on-board visionprocessor takes some load of the RBPi4 as it outputs pre-processed depth data.
29

CHAPTER 5. CONCEPTIONAL DESIGN
Navigation using visual landmarks
Since it is unclear whether or not it is feasible to run SLAM on a RBPi4 as the area of theworkspace increases, an alternative method for navigation that can be used together with SLAMis proposed. The suggested method is to use visual landmarks in the roof, of which the position inthree-dimensional space is known to calculate the relative position of the sensor system. From thisthe position of the sensor system within the workspace can be calculated.
The proposed solution is to use QR-codes mounted in the roof holding its position withingthe workspace. Each QR-code will hold a x, y and z coordinate describing it position withing theworkspace, then since the distance from the QR-code to the RGB-camera on the sensor-system isknown, the position of the sensor-system relative to the QR-code can be calculated using the pinholecamera model described in Section 4.2.1. An illustration of this method is shown in Figure 21. Themethod used for calculating the position of the sensor system relative to the workspace is furtherexpanded upon in Chapter 6.
30

CHAPTER 5. CONCEPTIONAL DESIGN
Figure 21: Position of QR-code and camera relative to each other
5.2.1 Obstacle detection
The sensor used for mapping can also be used for obstacle detection. In comparison to the rangesensors with a measurement range of about four meters, the maximum range of the Intel RealsenseD435 is ten meters. This allows for longer range obstacle detection in the direction the sensor isfacing. Obstacle detection using stereo-vision has previously yielded good results [27]. Since it hasthe ability to perceive visual information, this information can be used for recognition and trackingas well. Potentially allowing the AGV to plan according to its perceived environment instead of juststopping when faced with a obstacle.
Figure 22: Illustration of the sensors detectionrange around the AGV.
Since the viewing angle of the Intel Re-alsense D435 is limited, an additionalsystem for obstacle detection is proposed.This is a short range obstacle detection sys-tem in the form of a redundant grid aroundthe AGV, consisting of multiple low-costultrasonic and infrared distance sensors. Asexplained in Section 4.1 these sensors com-plement each other, thus in theory givingthe system the ability to detect obstaclesindependent of the surface characteristics.This enables the system to detect people andequipment.
This system has been proved to yield goodresult in its ability to detect obstacles in-dependent of the surface characteristics, incomparison to a system consisting of only ul-trasonic sensors which fail to detect soft sur-faces such as clothes [24].
Figure 22 illustrates the detection range of the proposed system. The Intel Realsense D435 has aviewing angle of 87 degrees and a maximum range of ten meters. The depth sensor is accompaniedby a redundant grid consisting of ultrasonic- and infrared range sensors covering a viewing angleof 360 degrees.
The obstacle detection grid should consist of low-cost sensors. The suggested infrared- and ultra-sonic sensors are the «GP2Y0A710K0F Sharp, Reflective infrared Sensor» and the «URM07 - UARTLow-Power Consumption Ultrasonic Sensor». The sensors should form a redundant grid, meaningthe sensors should overlap to enable more reliable obstacle detection, since more than one pair ofsensors covers the same area. Figure 22 illustrates the detection area of the proposed system.
31

CHAPTER 5. CONCEPTIONAL DESIGN
5.2.2 Overall design of suggested prototype
In this subsection a suggested prototype is described. It includes the hardware needed to realizethe system described earlier. Which is a system providing the necessary information such that whencoupled with an autonomous ground vehicle(AGV) it should be capable of mapping and obstacleavoidance. The following list contains the suggested hardware needed to realize the system, exceptfor power supply and wiring.
• Raspberry Pi 4 Model B• Arduino UNO• Intel RealSense 435• GP2Y0A710K0F Sharp, Reflective Sensor x 8• URM07 - UART Low-Power Consumption Ultrasonic Sensor x 8
The Raspberry RBPi4 communicates with the Intel RealSense D435 via an USB3.0 connection.Communication between the RBPi4 and the Arduino is via serial communication. The sensors areconnected to the Arduino via the I/O pins on the Arduino board. As it exist multiple Arduino li-braries developed for interfacing with low-cost sensors the Arduino will take care of the rangemeasurements before sending these to the RBPi4.
Figure 23 shows the hardware architecture of the proposed sensor system.
Figure 23: Hardware architecture of proposed system.
32

CHAPTER 6. SYSTEM DEVELOPMENT
6 System development
The system described in this chapter is based of the concept presented in Chapter 5. In this chapterthe developed system is described along with the hardware and software used in development.The chapter concludes with a description of a prototype for a low-cost navigation and collisionavoidance system, as well as the experience gained from developing such a system. The prototypeis developed with the main objective of the thesis in mind, which is to develop a low-cost navigationand collision avoidance system. The system aims to uphold the system requirements presented inChapter 3.
6.1 Sensors and equipment
A variety of sensors and equipment make up the system as a whole. In this section each part isdescribed based on their functionality in relation to the task they are to perform. Some of theequipment is chosen because it is well suited for a project in development, but they may not be thebest choice for a finalized system, therefore recommendations for equipment better suited for thisare included.
6.1.1 Total cost of the system
With the main objective being to develop a low-cost system for navigation and obstacle avoidance,the equipment is chosen with this objective in mind. As stated in Section 3.3 the upper price limitfor such a system is around 5000 Norwegian kroner. The total cost of the system is shown in Table 2.
Equipment: Units: Supplier Cost per unit: Cost:Raspberry Pi 4model B
1 Atea 583.00 NOK 583.00 NOK
Ardunio Uno 1 Elfa 221.25 NOK 221.25 NOKIntel RealSensed435
1 Atea 2327.00 NOK 2327.00 NOK
Sharp reflectivesensor
8 Farnell 207.00 NOK 1656.00 NOK
HC-SR04 Ultra-sonic sensor
8 Elfa 44.88 NOK 359.04 NOK
Total cost: 5146.29 NOK
Table 2: Total cost of developed system.
As shown in the table the total cost of the system is 5146.29 NOK, which in within the pricerange of «around 5000 Norwegian kroners». The prices of the equipment used may vary fromsupplier to supplier, and if the equipment where to be bought in bigger batches, this may also affect
33

CHAPTER 6. SYSTEM DEVELOPMENT
the price. Further, the equipment is chosen based on simplicity in relation to development purposes.Consequently, there is lower cost options available.
6.1.2 Raspberry Pi 4 model B, Single board computer(SBC) running the system
The single board computer(SBC) chosen for this project is the Raspberry Pi 4 model B(RBPi4).With the main objective of the thesis in mind this SBC falls within a reasonable price range Table 2.Coupled with the large Raspberry Pi community, the wide range of resources available online andthe newly added computational power, it was concluded that this was a good choice for a SBC todevelop such a system [22]. The RBPi4 model used in the development of this project comes with4 giga byte(GB) RAM, as opposed to the 1 GB RAM the Raspberry Pi 3, could offer. As of now thereis also a RBPi4 model with 8GB Ram available. RAM is an abbreviation for random access memory,which is the short term data storage of the computer.
The RBPi4 can run different Linux distributions and it can run ROS 2, which is the roboticframework used in relation to software development, this is further elaborated upon in Section 6.3.As the RBPi4 is a SBC developed for general use, it comes with a lot of extra equipment that isnot necessary for a finalized system, but it serves as a good development platform. For a finalizedsystem a barebone-model with only the necessary ports for communication with the rest of thesystem would suffice.
6.1.3 Arduino UNO, microcontroller for interfacing with range sensors
Implemented in the system is a micro-controller in charge of communication with the range sensors.The reasoning behind this is the fact that the RBPi4 does not have the necessary I/0 ports to commu-nicate with all of the sensors. The chosen micro-controller is the Arduino UNO. The Arduino UNOserves the purpose of controlling and receiving information from the range-sensors. One of the mainadvantages of using a Arduino UNO is the existing driver for multiple low-cost range sensors, aswell as the low cost of the micro-controller itself. This makes it a good fit for development purposes.
Just as the RBPi4 is a general purpose SBC, the Arduino UNO is a general purpose micro-controller. Therefore a bare-bone model may be more fit for a finalized system.
6.1.4 Intel RealSense 435, depth sensor for navigation and mapping
The Intel Realsense 435i consist of an active infrared stereo-camera (Section 4.2.3), a high resolu-tion RGB camera and an on-board vision processor. The Intel Realsense can do image processingon-board, due to the integrated vision processor. The range for depth sensing is up to ten meters.[22].
6.1.5 Raspberry Pi V2 camera, RGB camera for detecting visual landmarks
The Raspberry Pi Camera V2 is a 8 megapixel Sony IMX219 sensor custom designed for the Rasp-berry Pi SBCs. It is capable of 3280 x 2464 pixel still images and support 1080p30, 720p60 andVGA90 video modes. It is easy to integrate and use with Raspberry Pi SBCs as they come with a
34

CHAPTER 6. SYSTEM DEVELOPMENT
port designed for the camera module. There are also build numerous third-party libraries for thecamera. Making it easier to develop applications based on the camera.
In relation to this system the camera serves the purpose of detecting visual landmarks in theform of QR-codes containing information about the landmarks position within the work environ-ment, which is then used to calculate the position of the camera, and therefore the system itself.
6.1.6 GP2Y0A710K0F Sharp, Reflective Sensor, infrared range sensor for obstacle de-tection
The GP2Y0A710K0F Sharp, Reflective Sensor is a distance measuring unit with a detection rangeof 100 to 500 cm. The sensor consists of a emitter, a receiver and a signal processing circuit. Themeasured distance is calculated through triangulation (Section 4.1). It outputs an analog voltagecorresponding to the measured distance. The correlation between output voltage and distance isshown in figure Figure 24. From the figure the measurement range of the sensor is obtained, as theoutput of any measured distances shorter than one meter equals the output of measured distanceslonger than one meter. Consequently, the minimum range of the sensor is one meter. The maximumrange is five meters, as the slope of the function begins to flatten out which makes it harder to todistinguish between measurements.
Figure 24: Correlation between output voltage from IR-sensor and measured distance [13]
6.1.7 HC-SR04 ultrasonic sensor, ultrasonic range sensor for obstacle detection
The HC-SR04 ultrasonic sensor is a distance sensor with a detection range of 2 to 400 cm, anda measuring angle of 15 degrees. The sensor unit consist of an ultrasonic emitter and receiver,
35

CHAPTER 6. SYSTEM DEVELOPMENT
and the measured distance is calculated by the time measured between emitting and receiving theultrasonic signal Section 4.1. The sensor outputs a digital value corresponding to the measureddistance.
6.2 Hardware architecture
As the functionality of the system is to perform navigation and collision avoidance the system canbe divided into two parts. The first part is the short range obstacle detection grid consisting of ul-trasonic range sensors and infrared range sensors. These are connected and controlled through theArduino input/output(I/O) ports. Ultrasonic and infrared range sensors each have their own ad-vantages and disadvantages, when put together they complement each other. Therefore the systemis well adjusted to detect obstacles independent of their surface characteristics [24]. Further, theArduino Uno is connected to the RBPi4 through a serial port, and delivers the readings from thesensors to the RBPi4. Serial communication also allows for programming the Arduino UNO fromthe RBPi4. Other communication protocols could be used instead, but for developing purposes us-ing serial-communication makes it easier and because the Arduino UNO only has a few analog I/Oports, two of which are used for I2C-communication. Serial was chosen as all the analog I/O portswere needed for interfacing with the sensors.
Figure 25: Hardware architecture of developed system.
36

CHAPTER 6. SYSTEM DEVELOPMENT
The reason why Arduino board was chosen to interface with the obstacle detection grid, asopposed to directly interfacing with the RBPi4 is because it is simpler and less time consuming toset up, which makes it great for development purposes. The Arduino comes with more I/O-portsand has libraries designed for interfacing with low-cost ultrasonic and infrared sensors. As for afinalized product, the Arduino would not be necessary.The ultrasonic sensors are connected with the digital input/output(I/O) pins on the Arduino board,while the infrared sensors are connected through analog I/O pins. Figure 26 shows how each sensorare connected to the Arduino microcontroller.
Figure 26: Connection between Arduino UNO and range sensors (Figure made with Fritzing).
The ultrasonic sensor has four connectors, which are connected as follows:
• Vcc: 5 volt supply voltage, in Figure 26 supplied through digital pin 13.• GND: One connector for ground connected to ground on the Arduino board.• Trig: Trigger pin which receive a signal to trigger the ultrasonic sensors, connected through
digital pin 10.• Echo: Echo pin connected to the ultrasonic receiver, it sends a signal to the Arduino UNO
when the ultrasonic sensor receives the reflected signal, also connected to digital pin 10.
The infrared sensor has five connectors, which are connected as follows:
• Vcc x 2: Two connectors for supply voltage, both connected to the 5 volts output on theArduino board
• GND x 2: Two connectors for ground, both connected to ground on the Arduino board.• Vout: A output connector for the output voltage from the sensor, which reflect the measured
distance.
37
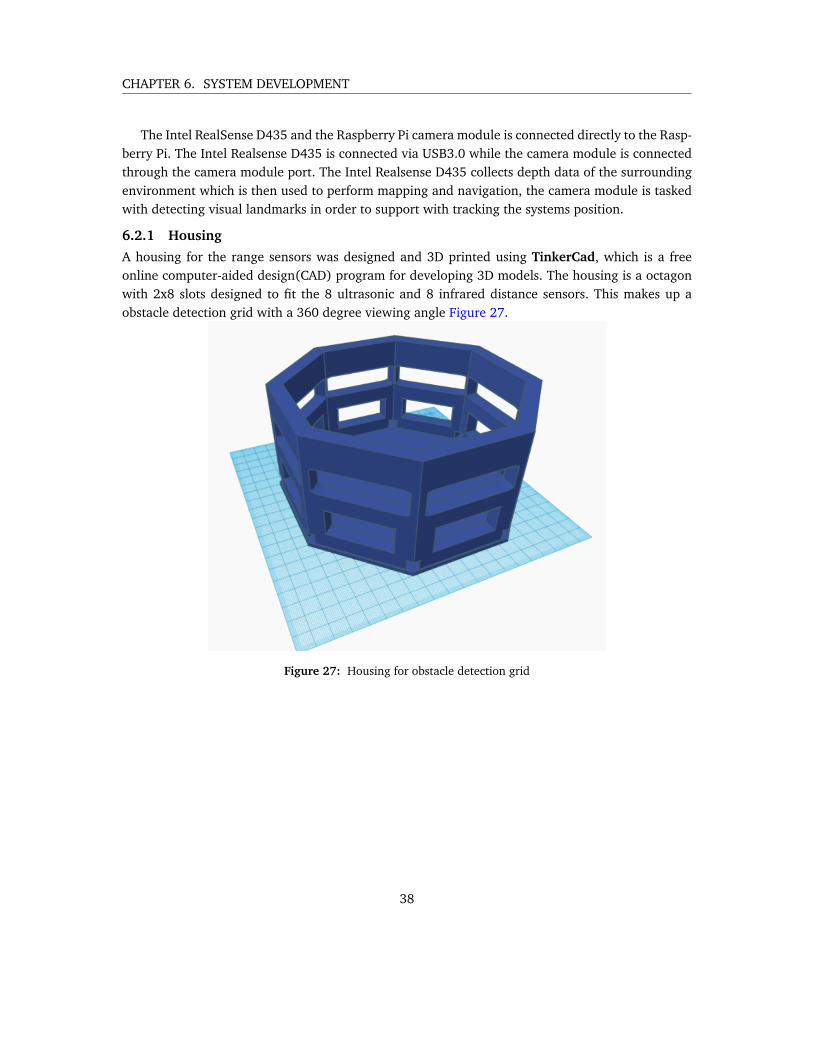
CHAPTER 6. SYSTEM DEVELOPMENT
The Intel RealSense D435 and the Raspberry Pi camera module is connected directly to the Rasp-berry Pi. The Intel Realsense D435 is connected via USB3.0 while the camera module is connectedthrough the camera module port. The Intel Realsense D435 collects depth data of the surroundingenvironment which is then used to perform mapping and navigation, the camera module is taskedwith detecting visual landmarks in order to support with tracking the systems position.
6.2.1 Housing
A housing for the range sensors was designed and 3D printed using TinkerCad, which is a freeonline computer-aided design(CAD) program for developing 3D models. The housing is a octagonwith 2x8 slots designed to fit the 8 ultrasonic and 8 infrared distance sensors. This makes up aobstacle detection grid with a 360 degree viewing angle Figure 27.
Figure 27: Housing for obstacle detection grid
38

CHAPTER 6. SYSTEM DEVELOPMENT
6.3 Development platform and programming language
As the system itself is a sensor system developed to provide the necessary information so that arobot can function automatically in a dynamic environment it should be easy to integrate and com-municate with, Chapter 3.
The chosen development platform is thereforethe robot operating system, ROS2. Which is a setof software libraries and tools for building robotapplications [28].
ROS 2 is the newest version of ROS. ROS 2supports multiple languages, the two most com-mon being python 3 and C++. The frameworkprovides a set of standard messages so that nodescan communicate with each other independent ofthe language the node is written in. Further ROS2 allows for communication between multiplecomputers. In the development of this systemthis has proven useful as the Raspberry Pi isrunning a barebone ROS2 version and bareboneUbuntu 18.04 making it difficult to observe whatis happening. Through communication with alaptop the data from the Raspberry Pi can bevisualized making it easier to debug the code.
For visualization ROS 2 uses Rviz, a graphical in-terface that allows for visualization of data. Plu-gins for different topics are available, such asrange sensors, point-clouds, odometry etc. Thismakes it possible to visualize the robot with theconnected sensors as well as the robot’s positionwithin maps. Figure 29 shows a visualization ofthe Turltebot3 in Rviz, with measurements fromthe LIDAR attached to the robot as visualized withred dots.
Figure 28: ROS 2 Dashing Diademata [14]
Figure 29: RVIZ visualisation of turtlebot and LIDARdata [15]
39

CHAPTER 6. SYSTEM DEVELOPMENT
ROS 2 workspace
Before going into the architecture of this system a brief introduction to ROS 2 is provided. Whendeveloping a new project it is a good practice to create a new directory containing the workspacefor that project, as it is important to have a good structure for the project both for the developer,and other people wanting to make use of it. The workspace will contain all the code developed forthe project. In Listing 6.1 the process for creating a new ros2 workspace i shown, the workspace iscalled «ros2_ws», short for ros2 workspace.
mkdir ros2_wsmkdir ros2_ws/src
Listing 6.1: Setting up a new ROS2 workspace [17]
ROS2 packagesThe newly created workspace contains afolder, called «src», this is the folder whereall the packages should be stored. In ROS2a package is a container for the code [18].Packages allows the developer to install andshare the code with other. In Listing 6.2a trivial ROS 2 workspace containing namount of packages is shown.
ROS2 packages use Ament as its build sys-tem, and Colcon as its build tool. This isnecessary as the code has to be convertedinto executables before it can run on thecomputer, this is the main task of the buildsystem. Depending on which language youchoose to write the code, the building toolfor that language must be declared whencreating the package.
workspace_folder/src/
package_1/CMakeLists.txtpackage.xml
package_2/setup.pypackage.xmlresource/package_2
...package_n/
CMakeLists.txtpackage.xml
Listing 6.2: Example of a workspace containingan arbitrary amount of packages [18]
A benefit of storing all the relevant packages for the project within a workspace is that insteadof building each package individually, all the packages in the workspace can be built using Colcon.Listing 6.3 shows the process of navigating to the src-folder and creating a new package called«my_first_package» within that folder.
cd /ros2_ws/src
ros2 pkg create --build -type ament_python my_first_packageListing 6.3: Creating a python package in ROS2
ROS 2 nodes
Further, each package can contain multiple nodes which essentially is the code executables. InROS 2 a good practice is to have each node be in charge of one task. For example one node is
40

CHAPTER 6. SYSTEM DEVELOPMENT
in charge of the systems range sensors, another one is in charge of the depth-sensor etc. One ofthe main advantages of using ROS 2 for robot development as opposed to creating a frameworkfrom scratch is the communication protocols. ROS 2 is a cross-platform, multi-language roboticframework. Using the communication tools offered by ROS 2, nodes can communicate with eachother independent of the language the code is written in and between multiple computers. Forcommunication between nodes, different nodes can publish data to any number of topics whilesimultaneously subscribe to any number of topics. ROS 2 topics acts as a bus from nodes to exchangemessages [29].
ROS 2 messages
A common communication interface in ROS 2 is messages. Standard messages in ROS 2 are used tocommunicate between nodes independent on the programming language. The .msg files are whatdescribes the fields of a ROS 2 message [30]. This way a node written in python can publish datathrough a ROS 2 message which then a node written in C++ can subscribe to. Each message ispublished with a custom topic name containing the published message. ROS 2 provides a multitudeof different messages for a wide variety of different sensors and data-types.
ROS 2 communication between multiple computers
As long as the computers are connected to the same network communication between multiplecomputerss is enabled by setting the same «ROS_DOMAIN_ID» on the computers. Listing 6.4 showshow this is achieved by setting the same «ROS_DOMAIN_ID» across multiple computers by simplytyping the following in a command shell.
export ROS_DOMAIN_ID =30
Listing 6.4: Set ROS_DOMAIN_ID
This allows for a computer to subscribe to topics published on another computer.
41
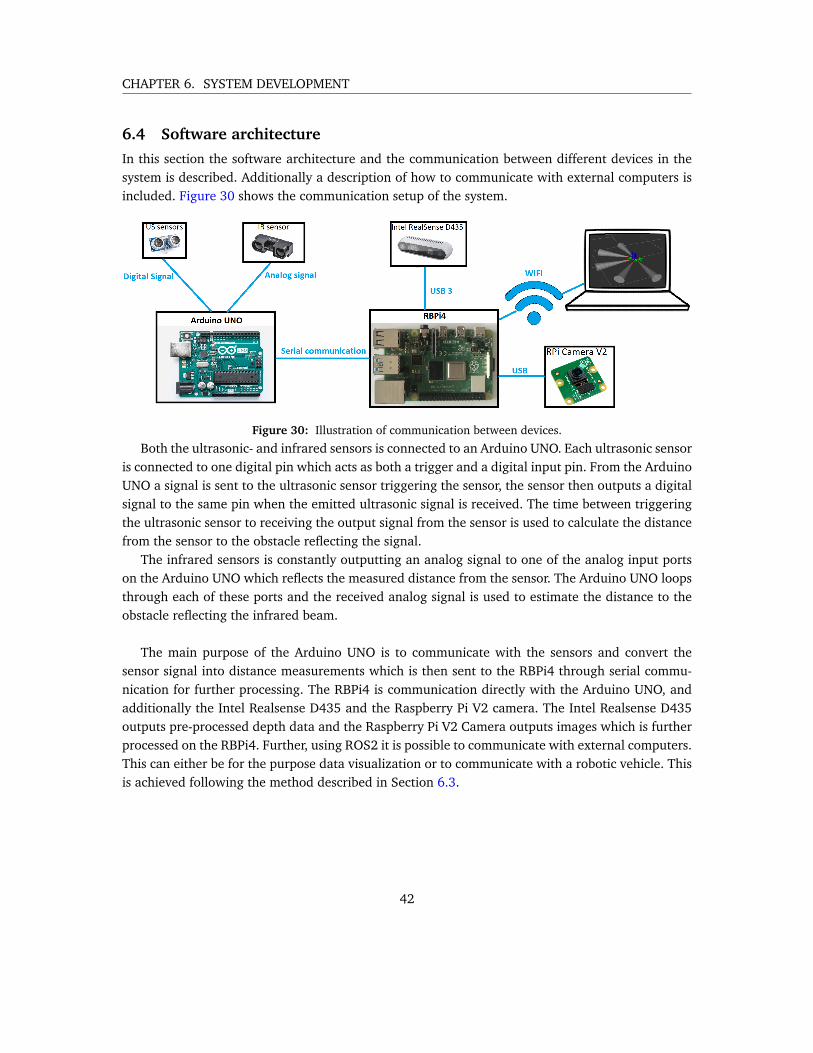
CHAPTER 6. SYSTEM DEVELOPMENT
6.4 Software architecture
In this section the software architecture and the communication between different devices in thesystem is described. Additionally a description of how to communicate with external computers isincluded. Figure 30 shows the communication setup of the system.
Figure 30: Illustration of communication between devices.
Both the ultrasonic- and infrared sensors is connected to an Arduino UNO. Each ultrasonic sensoris connected to one digital pin which acts as both a trigger and a digital input pin. From the ArduinoUNO a signal is sent to the ultrasonic sensor triggering the sensor, the sensor then outputs a digitalsignal to the same pin when the emitted ultrasonic signal is received. The time between triggeringthe ultrasonic sensor to receiving the output signal from the sensor is used to calculate the distancefrom the sensor to the obstacle reflecting the signal.
The infrared sensors is constantly outputting an analog signal to one of the analog input portson the Arduino UNO which reflects the measured distance from the sensor. The Arduino UNO loopsthrough each of these ports and the received analog signal is used to estimate the distance to theobstacle reflecting the infrared beam.
The main purpose of the Arduino UNO is to communicate with the sensors and convert thesensor signal into distance measurements which is then sent to the RBPi4 through serial commu-nication for further processing. The RBPi4 is communication directly with the Arduino UNO, andadditionally the Intel Realsense D435 and the Raspberry Pi V2 camera. The Intel Realsense D435outputs pre-processed depth data and the Raspberry Pi V2 Camera outputs images which is furtherprocessed on the RBPi4. Further, using ROS2 it is possible to communicate with external computers.This can either be for the purpose data visualization or to communicate with a robotic vehicle. Thisis achieved following the method described in Section 6.3.
42

CHAPTER 6. SYSTEM DEVELOPMENT
For the development of this project a newworkspace containing the relevant devel-oped packages was created. This includespackages for the range sensors, the RGBcamera used to assist in navigation. It alsoincludes other existing packages which is in-cluded in the workspace so that the projectis easy to install and share. This is mainlythe packages related to the Intel RealsenseD435 which is opensource from Intel. List-ing 6.5 shows the packages contained in theworkspace «SensorSystem_ws»
SensorSystem_ws/src/
range_sensor/
visualization/
qr_reader/
intel_realsense/
Listing 6.5: List of packages in project workspace
Each of these packages is in charge of one aspect of the system. The package range_sensor/contains a node which reads the sensor data from the Arduino UNO and publishes the data fromeach sensor on a distinct topic as a ROS message. The process of reading and publishing the datais explained further in Section 6.5. The package visualization/ is used to visualize the sensor data.This package is meant to run on a external computer communicating with the RBPi4. This is furtherexplained in Section 6.4.1. The qr_reader/ package is in charge of processing the images taken withthe Raspberry Pi V2 camera in order to detect QR-codes and estimate the position of the system.The method behind this, as well as the published messages is described in Section 6.6.1. The in-tel_realsense/ package contains the Intel Realsense package release by Intel. The package containsmultiple nodes to communicate and publish the data from the Intel Realsense D435. The usage ofthis package and the published data is further elaborated upon in Section 6.6.3 and Section 6.6.4
As mentioned earlier the main purpose of this system is to provide the necessary information sothat a robotic vehicle equipped with the system can use this information to navigate a workingenvironment efficiently and safely. All the data published through ROS2 is available to other
computer running the same ROS distribution if they are connected to the same network. Figure 31shows the available topics from the different packages and the general flow of data between the
developed packages.
Figure 31: Illustration of the data flow in the system
43

CHAPTER 6. SYSTEM DEVELOPMENT
6.4.1 Visualization package
The visualization package contains a model of the sensor-system, tying all the attached sensors to-gether. The model describes the system and the position of each sensor in relation to each other. Themodel itself is declared in a URDF-file. Here a base_link is declared, which in this case is the mainsensors-house. For each sensor a new link is declared, along with a transformation describing theposition of the sensors in relation to the main sensor house. Listing 6.6 shows the code declarationof the sensor house represented as a cylinder, the size of the cylinder is the size of the actual sensorhouse. It also shows the declaration of us_1 which represents the position of a ultrasonic sensorattached to the sensor house.
<?xml version="1.0" encoding="utf -8"?><robot name="sensor_system" >
<link name="base_link"><!-- Sensor -system housing -->
<visual ><geometry >
<!-- Cylinder and height 8cm and radius 8.25 cm --><cylinder length =0.08"radius="0.0825/ >
</geometry ></visual >
</link><!-- Ultrasonic sensors -->
<link name="us_1"></link>
<!-- Translation between base_link and sensor --><joint name="base_link_to_us_1" type="fixed">
<parent link="base_link"/><child link="us_1"/><!-- Translation of us_1 link with respect to base link -->
<origin rpy="0 0 0" xyz="0.0825 0 -0.0175"/></joint >
</robot >
Listing 6.6: Model of the baselink and one attached sensor declared in an URDF file
Each link has a distinct name, this declaration is used by the other packages to tie the correctsensors to its position in regard to the housing. This way the sensor readings will reflect the real-world position with respect to the sensors house. Since all the translations is declared in this file,there is no need to calculate the relative position when publishing the readings from the sensors.Another advantage of declaring a model of the system is that it allows for visualization of the model,as well as visualization of the readings from the sensors. Visualization makes it easier to debug thecode, and make sure that the correct sensor readings are in the correct position with respect tothe model. Figure 32 shows the model of the sensor house and the coordinate system describingthe relative position of each attached sensor. Each coordinate system consist of three axes. The
44

CHAPTER 6. SYSTEM DEVELOPMENT
illustrated model only have a collected 180 degree viewing angle, as opposed to the 360 degreeviewing angle proposed, this is elaborated further in Section 6.5. The meaning of each axis is asdescribed in the list below.
• Blue line: Z-axis• Green line: Y-axis• Red line: X-axis, the direction which the sensor is pointing
Figure 32: Model of sensor housing with the coordinate system describing the position of each range sensorenabled
45

CHAPTER 6. SYSTEM DEVELOPMENT
6.4.2 Installation
All the developed code is included in the digital appendix. This section explains how to install anduse the developed packages. One prerequisite to use the developed packages is that ROS2 Dashingis installed on the computer. To install the package for interfacing with the Intel Realsense D435,one should follow the steps described in Section 6.6.3. This section goes through the installationprocess of the package and all its dependencies, this process is also documented on the Intel GitHubaccount [31]. The package itself is included in the workspace, but the dependencies must still beinstalled in order to build the package and use it.
There is a few dependencies for using the other packages as well, that is OpenCV for python,Pyzbar, Picamera and Pyserial.
OpenCV is a machine vision library [32] used in relation to the Raspberry Pi V2 camera anddetection of QR-codes. Pyzbar is a library for detecting and reading QR- and barcodes [33]. Thisis also used in relation to detection of QR-codes. Picamera is a python library for interfacing withthe Raspberry Pi Cameras and Pyserial is a python library for serial communication, in this caseit is used to communicate with the Arduino UNO. These packages are installed by following theprocedure in Listing 6.7.
pip3 install opencv -pythonpip3 install pyzbarpip3 install picamerapip3 install pyserial
Listing 6.7: Install the necessary python dependencies using pip for python3.
When the necessary dependencies are installed and the workspace containing the packages is ei-ther cloned from is installed and unzipped. Then the workspace can be built running the commandsshown in Listing 6.8.
cd /SensorSystem_ws #Navigate to workspace foldercolcon build --symlink -install #Build all the packages in the
workspace
#Or , to only build one package:colcon build --packages -select <name of package >
Listing 6.8: Build the workspace and the packages
Each package contains ROS nodes, the nodes is executed by running the command: «ros2 run<name of package> <name of node>. By executing a node, the node will publish all relevanttopics. The published topics can be viewed by running the command: «ros2 topic list».
As previously mentioned the nodes and the related code is explained in the sections related tothe developed methods.
46

CHAPTER 6. SYSTEM DEVELOPMENT
6.5 Obstacle detection
As presented in Chapter 5 the concept for the short range obstacle detection was a 360 degreeredundant grid consisting of both ultrasonic-and infrared range sensors. Since the viewing angleof each sensor was less than expected, the developed grid only covers 180 degrees. The developedsensor grid instead will function as a «proof of concept».
The obstacle detection grid consist of both ultrasonic-and infrared range sensors, which in theoryallows for a sensor system more adapt at detecting surfaces independent on the surface character-istics. As mentioned in Section 4.1, the two sensors complement each other well, as in a situationwhere one of the sensors may fail, the other sensor should be able to detect the obstacle. Theinfrared sensor is prone to noise from lighting conditions and transparent surfaces which the in-frared rays will shine through, this, however does not affect the ultrasonic sensor as it operateswith soundwaves which is not affected by light. The ultrasonic sensor on the other hand may failto detect sound absorbing surfaces, such as clothing. The sound absorbing properties of a surfaceshould not affect the infrared sensor, as long as the surface reflects light the sensor should be ableto detect it.
Figure 33: Ultrasonic sensor fails to detect obstacles.
To further solidify this theory two experiments where completed, one where the obstacle hada sound absorbing surface which in this case was a fleece jacket, and one where the surface ofthe obstacle was transparent. In each experiment the distance from the obstacle to the ultrasonic -and infrared range sensor were the same. The resulting measurement are shown in Figure 56 andFigure 53.
47

CHAPTER 6. SYSTEM DEVELOPMENT
Figure 56 clearly shows that the infrared sensor is capable of detecting the fleece jacket, whilethe ultrasonic sensor is not able to determine the distance to the jacket. The reason behind thechoice of obstacle for this experiment is the importance of safety if an autonomous ground vehi-cle(AGV) is to work alongside humans. It is therefore crucial that a obstacle avoidance system icapable of detecting people int the working environment.
Figure 34: Fleece jacket placed one meter from the sensors.
48

CHAPTER 6. SYSTEM DEVELOPMENT
Figure 53 shows the results from an experiment where a transparent surface is placed 0.7 metersaway from the sensor, while the wall behind is 1.5 meters away from them. The infrared sensor isin this scenario not able to detect the obstacle because the infrared rays are not reflected by thesurface, instead the wall behind is detected. The measurements from the ultrasonic sensor on theother hand is not affected by the transparent surface, resulting in accurate measurements from thesensor.
Figure 35: Transparent surface placed 0.7 meters from the sensors.
49

CHAPTER 6. SYSTEM DEVELOPMENT
Obstacle detection grid
As mentioned in Chapter 5 the obstacle detection grid should be a redundant grid with a 360degree viewing angle. Instead, the presented one has a viewing angle of 180 degrees. This is aresult of the sensor having a narrower field of view than desirable. The effectual angle of the HC-SR04 ultrasonic sensor is 15 degrees, this is the out most angle a obstacle can be placed from thecenter of the sensor and still be detected, meaning the field of view of the sensor is 30 degrees. As aresult the viewing angle of the sensor system had to be narrowed down, in order for the ultrasonicsensors to overlap. The resulting system consist of nine ultrasonic sensor spread evenly across 180degrees and five infrared sensor spread evenly across 180 degrees. However, the viewing angle ofeach infrared sensor is a lot narrower than the viewing angle of the ultrasonic sensors, ultimately itdetects objects in a straight line from the sensor. Consequently, the infrared sensors have no overlap.Figure 36 shows the prototype of the sensor system, while Figure 37 shows live measurements fromthe system visualized in Rviz and ROS 2.
Figure 36: Obstacle detection grid consisting ofultrasonic and infrared sensors
Figure 37: Obstacle detection grid consisting ofultrasonic and infrared sensors, live measurementvisualized using Rviz and Ros 2
The time between each measurement from the sensors is constrained by the ultrasonic sensors,since they operate with the speed of sound, opposed to the infrared sensors which operate at thespeed of light. With the maximum operating range of the ultrasonic sensor being four meters, thesoundwaves have to travel eight meters at maximum.
t =s
v(6.1)
where s represents the distance and v represents the speed. With the speed of sound c beingapproximately 343 m
s the time between emitting and receiving a ultrasonic signal is estimated tobe 23.3 milliseconds. In order to prevent the ultrasonic sensors from interfering with each oth-ers measurements the time between each call is 30 milliseconds. Consequently, one measurementcycle takes approximately 0.27 seconds, which matches the time the program uses to update thepublished measurements. The time the program uses to run on cycle is obtained by running theArduino function millis() at the start of the main-program, then printing the result at the end ofthe program. From this the displacement of an obstacle relative to a moving autonomous groundvehicle(AGV) between sensor measurements is derived, in Section 3.1 the standard speed of an
50

CHAPTER 6. SYSTEM DEVELOPMENT
AGV was assumed to be 1.5ms . Using Equation 6.1 the displacement of a static obstacle which theAGV is heading directly towards amounts to 0.405 meters between each measurement. In the worstcase scenario where both the obstacle and the AGV is moving towards each other the displacementwould double. This is one of the drawbacks of using multiple ultrasonic sensors. However, depend-ing on how the AGV is programmed to react to obstacles, it should have enough time to stop beforecollision even in the worst case scenario.
The narrow viewing angle of the infrared sensor may prove a problem, depending on if obstaclessuch as humans are able to slip in between the rays of the infrared sensors without being hit bythem, this is elaborated further upon and tested in Chapter 7.
One solution would be to have the infrared sensors spin around in circles, covering 360 degrees,thus turning the infrared sensors in to a form of LIDAR. A problem with this would be the signal- and power transferring, as a slip ring would be necessary. Thus making the hardware-solutionmore complex and expensive. Another less complex solution is to have the infrared sensors rotateback and forth over a set angle, using a step-motor. This way each sensor would span a larger view-ing angle, without the need for a slip ring. Depending on the angular velocity of which the sensorwould rotate, some wear and tear of the sensor and its connectors over time will occur. However, ifimplemented correctly the low-cost infrared sensors would be easy to replace.
Reading sensor data
The range sensors are connected to the Arduino Uno microcontroller which is in charge of trig-gering the sensors, reading the sensor output and transform the received signal from the sensorsinto distance measurements. As mentioned earlier the reason why the Arduino is used to interfacewith the sensors is for development purposes, as it exist multiple libraries for interfacing with bothultrasonic-and infrared sensors available for the Arduino.
For interfacing with the sensors two Arduino libraries are used, NewPing.h which is a library forinterfacing with ultrasonic distance sensors, and SharpIR.h which is a library for interfacing withinfrared distance sensors. The following code snippets shows how to set up the Arduino to interfacewith two ultrasonic - and two infrared sensors. The number of sensors used in the example isreduced in order to make the code easier to read. Listing 6.9 shows how to setup the sensors inArduino using the NewPing - and SharpIR libraries.
51
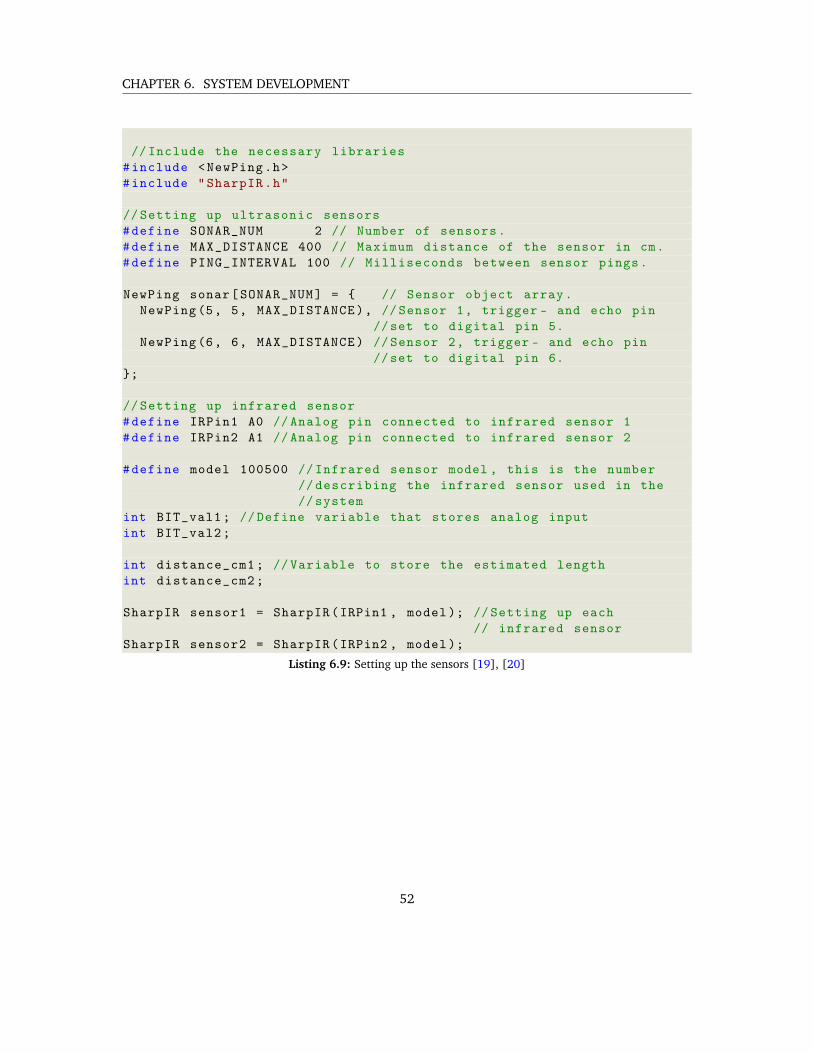
CHAPTER 6. SYSTEM DEVELOPMENT
// Include the necessary libraries#include <NewPing.h>#include "SharpIR.h"
// Setting up ultrasonic sensors#define SONAR_NUM 2 // Number of sensors.#define MAX_DISTANCE 400 // Maximum distance of the sensor in cm.#define PING_INTERVAL 100 // Milliseconds between sensor pings.
NewPing sonar[SONAR_NUM] = { // Sensor object array.NewPing(5, 5, MAX_DISTANCE), // Sensor 1, trigger - and echo pin
//set to digital pin 5.NewPing(6, 6, MAX_DISTANCE) // Sensor 2, trigger - and echo pin
//set to digital pin 6.};
// Setting up infrared sensor#define IRPin1 A0 // Analog pin connected to infrared sensor 1#define IRPin2 A1 // Analog pin connected to infrared sensor 2
#define model 100500 // Infrared sensor model , this is the number// describing the infrared sensor used in the// system
int BIT_val1; // Define variable that stores analog inputint BIT_val2;
int distance_cm1; // Variable to store the estimated lengthint distance_cm2;
SharpIR sensor1 = SharpIR(IRPin1 , model); // Setting up each// infrared sensor
SharpIR sensor2 = SharpIR(IRPin2 , model);
Listing 6.9: Setting up the sensors [19], [20]
52

CHAPTER 6. SYSTEM DEVELOPMENT
Listing 6.10 shows how the Arduino setup and the timer for the ultrasonic sensor.
void setup() //This function runs one time as the progra starts{
Serial.begin (9600); //Set the Arduino to transmit 9600 bits per//second , default for Arduino Uno
pingTimer [0] = millis () + 75; // First ping starts at 75ms, gives//time for the Arduino to start up// properly before running the code.
for (uint8_t i = 1; i < SONAR_NUM; i++) // Set the starting time//for each sensor.
pingTimer[i] = pingTimer[i - 1] + PING_INTERVAL;}
Listing 6.10: Setting up the arduino and the timer for the ultrasonic sensors [19], [20]
Listing 6.10 shows the function which checks the echo for each ultrasonic sensor.
void echoCheck (){// If ping received , set the sensor distance to//array.
if (sonar[currentSensor ]. check_timer ()) {cm[currentSensor] = sonar[currentSensor ]. ping_result/ US_ROUNDTRIP_CM;pingResult(currentSensor );
}}
Listing 6.11: EchoCheck function for ultrasonic sensors. [19], [20]
53

CHAPTER 6. SYSTEM DEVELOPMENT
Listing 6.12 shows the main function in which the data from the connected sensors is read andtransformed to distance measurements by the Arduino.
void loop(){
// BIT_val equals the input received at the analog pins on the// ArduinoBIT_val1 = analogRead(IRPin1 );BIT_val2 = analogRead(IRPin2 );
// Values read from the analog pins converted into distance[cm].//The "SharpIR.h" library has a function doing this for us.distance_cm1 = sensor1.distance ();distance_cm2 = sensor2.distance ();
// For -loop lopping through all the sensors in the sonar -array// containing all the ultrasonic sensors
for (uint8_t i = 0; i < SONAR_NUM; i++) {// Is it this sensor ’s time to ping?if (millis () >= pingTimer[i]) {
// Set next time this sensor will be pinged.pingTimer[i] += PING_INTERVAL * SONAR_NUM;// Make sure previous timer is canceled before starting a//new ping (insurance ).sonar[currentSensor ]. timer_stop ();// Sensor being accessed.currentSensor = i;// Make distance zero in case there ’s no ping echo for this// sensor.cm[currentSensor] = 0;// Do the ping (processing continues , interrupt will call// echoCheck to look for echo).sonar[currentSensor ]. ping_timer(echoCheck );
}}
}
Listing 6.12: Arduino main-function. [19], [20]
54

CHAPTER 6. SYSTEM DEVELOPMENT
The last code snippet shows how the Arduino publishes the data as a comma-separated listListing 6.13
void OutputResults () // Prints the results from each sensors , each//value i seperated by a comma.
{// Output result from ultrasonic sensors followed by result from// infrared sensor
Serial.print(cm [0]);Serial.print(’,’);Serial.print(cm [1]);Serial.print(’,’);Serial.print(distance_cm1 );Serial.print(’,’);Serial.println(distance_cm2 ); // Serial.println ends the line
}
Listing 6.13: Arduino function to publish the data from the range sensors. [19], [20]
Further the Arduino is connected to the RBPi4 running ROS 2 through serial connection. TheRBPi4 reads the values from the Arduino UNO through a serial port and transforms these to theright format used by ROS 2. In ROS 2 the readings from each sensor are connected to the correctlink, described in Section 6.4.1. As such each measurement is published at the correct coordinateswith respect to the sensor system. The readings from each sensor are published as a laserscanmessage in ROS 2, each assigned to its own topic which again is assigned to the corrects link onthe system model. The laserscan message is specified as shown in Listing 6.14. The reason whythe readings from the sensors is published as laserscan messages as opposed to range messages isfor the sake of simplicity and further processing of the data. Laserscan messages are supported bythe default Ros 2 mapping algorithms, therefore publishing them as laserscan messages enables theopportunity of having the range sensors support the depth sensor in relation to mapping.
std_msgs/Header header #Timestamp of first point in scan , andframe_id connecting the scan to the correctlink
float32 angle_min #Start angle of the scan [rad]float32 angle_max #End angle of the scan [rad]float32 angle_increment #Angular distance between measurements [rad]float32 time_increment #Time between measurements [seconds]float32 scan_time #Time between scans [seconds]float32 range_min #Minimum range value [m]float32 range_max #Maximum range value [m]float32 [] ranges #Range data [m]float32 [] intensities #Intensity data
Listing 6.14: Laserscan message [21]
55

CHAPTER 6. SYSTEM DEVELOPMENT
The data from the range sensors does nothave the best resolution, meaning that thethe received distance can not be pinpointedto one exact coordinate, instead in tellsus that an obstacle is detected somewherealong a curved line spanning the field of viewof the sensors. Publishing the data as a laser-scan message allows for publishing all thepoints where the obstacle may have been ob-served This is illustrated in Figure 38, wherethe red cylinder represents the sensor house,and the white line shows the data receivedfrom the sensor. Figure 38: Data received from one ultrasonic
sensor visualized in RvizThe following is the documented code from the node used to retrieve sensors measurements
from the Arduino and publish them as laserscan messages in ROS 2. The node is written in python.First the necessary libraries are imported, and the communication with the Arduino is initialized.Listing 6.15 shows the code snippet tasked with this.
#!/user/bin/env python #Tells the system that this is a python nodeimport rclpy #Contains the source code for the ROS client library
#for python packages
import std_msgs.msg #Standard ros messagefrom rclpy.node import Node #This is imported so the Node -class
#for python can be used
import serial #Library for serial communicationimport math #Math library for mathematical operationsfrom sensor_msgs.msg import LaserScan #Import the laser message
#Initialize communication with the Arduino.arduino = serial.Serial(’/dev/ttyACM0 ’, 9600, timeout =.1)
Listing 6.15: Import the necessary libraries and initialize communication with Ardunio
56
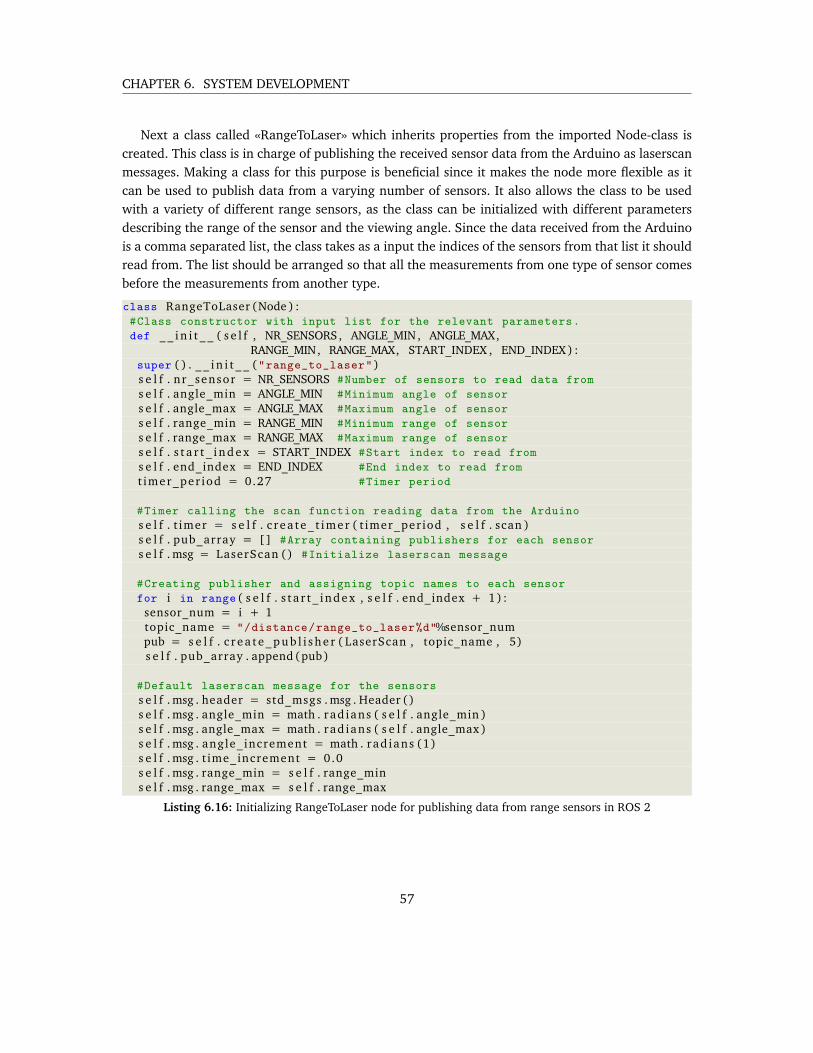
CHAPTER 6. SYSTEM DEVELOPMENT
Next a class called «RangeToLaser» which inherits properties from the imported Node-class iscreated. This class is in charge of publishing the received sensor data from the Arduino as laserscanmessages. Making a class for this purpose is beneficial since it makes the node more flexible as itcan be used to publish data from a varying number of sensors. It also allows the class to be usedwith a variety of different range sensors, as the class can be initialized with different parametersdescribing the range of the sensor and the viewing angle. Since the data received from the Arduinois a comma separated list, the class takes as a input the indices of the sensors from that list it shouldread from. The list should be arranged so that all the measurements from one type of sensor comesbefore the measurements from another type.
class RangeToLaser (Node ) :#Class constructor with input list for the relevant parameters.def _ _ i n i t _ _ ( s e l f , NR_SENSORS, ANGLE_MIN , ANGLE_MAX,
RANGE_MIN, RANGE_MAX, START_INDEX , END_INDEX ) :super ( ) . _ _ i n i t _ _ ("range_to_laser" )s e l f . nr_sensor = NR_SENSORS #Number of sensors to read data froms e l f . angle_min = ANGLE_MIN #Minimum angle of sensors e l f . angle_max = ANGLE_MAX #Maximum angle of sensors e l f . range_min = RANGE_MIN #Minimum range of sensors e l f . range_max = RANGE_MAX #Maximum range of sensors e l f . s t a r t _ i n d e x = START_INDEX #Start index to read froms e l f . end_index = END_INDEX #End index to read fromt imer_per iod = 0.27 #Timer period
#Timer calling the scan function reading data from the Arduinos e l f . t imer = s e l f . c r ea te_ t imer ( t imer_per iod , s e l f . scan )s e l f . pub_array = [] #Array containing publishers for each sensors e l f . msg = LaserScan () #Initialize laserscan message
#Creating publisher and assigning topic names to each sensorfor i in range ( s e l f . s t a r t _ index , s e l f . end_index + 1) :
sensor_num = i + 1topic_name = "/distance/range_to_laser%d"%sensor_numpub = s e l f . c r e a t e _ p u b l i s h e r ( LaserScan , topic_name , 5)s e l f . pub_array . append (pub)
#Default laserscan message for the sensorss e l f . msg . header = std_msgs . msg . Header ()s e l f . msg . angle_min = math . rad ians ( s e l f . angle_min )s e l f . msg . angle_max = math . rad ians ( s e l f . angle_max )s e l f . msg . angle_increment = math . rad ians (1)s e l f . msg . t ime_increment = 0.0s e l f . msg . range_min = s e l f . range_mins e l f . msg . range_max = s e l f . range_max
Listing 6.16: Initializing RangeToLaser node for publishing data from range sensors in ROS 2
57

CHAPTER 6. SYSTEM DEVELOPMENT
def scan ( s e l f ) :d i s t ance = [] #Empty array to store the distance measurementsranges = []s e l f . msg . header . stamp = s e l f . ge t_c lock ( ) . now ( ) . to_msg () #Time of scandata = arduino . r ead l i ne () #Get the data from the Arduinoif data : #If any data was received
data_array = d a t a _ s t r i n g . s p l i t (’,’) #Split the comma-separated values into#a list
if data and len ( data_array ) >= s e l f . nr_sensor : #Doublecheck that the data was#received correctly
#For-loop assigns the distance measurements to the distance-arrayfor i in range ( s e l f . s t a r t _ index , s e l f . end_index + 1) :
d i s t = data_array [ i ]if ( i == 0) :
d i s t = float ( d i s t [ 2 : ] )elif ( i == (len ( data_array ) − 1) ) :
d i s t = float ( d i s t [:−5])else :
d i s t = float ( d i s t )d i s t ance . append ( d i s t )
#A message for each topic containing the measurements is published.for i in range ( s e l f . nr_sensor ) :
ranges . append ( d i s t ance [ i ]∗0.01) #Convert the measurement from cm to m#Ranges contains the list of points where the obstacle may have been#observedranges = ranges∗abs ( s e l f . angle_min − s e l f . angle_max )header_id = s e l f . s t a r t _ i n d e x + ( i +1)s e l f . msg . header . frame_id = ’range_%d’%header_id #Assign the measurement to
#the correct link on the#system model
s e l f . msg . ranges = rangess e l f . pub_array [ i ] . pub l i sh ( s e l f . msg) #Publish message
Listing 6.17: Scan function in RangeToLaser class for receiving data from the arduino
58

CHAPTER 6. SYSTEM DEVELOPMENT
6.6 Localization and mapping
6.6.1 Visual landmarks
Visual landmarks will be an alternative and supplemental method for the SLAM approach to per-form navigation. The method presented is a method which calculates the position of the sensorsystem with respect to its real-world coordinates from QR codes attached to the roof using theRaspberry Pi camera the computer vision library OpenCV [32] and the Pyzbar library which is aready to use library for reading barcodes and QR-codes [33].
The QR code when decoded will return its own position in real-world coordinates, from whichthe camera can calculate the position of the sensor-system. In order to calculate the relative positionof the sensor system with respect to the QR-code the rotation of the QR-code is assumed to be inline with the real-world coordinate system. Consequently, the rotation between the QR-code andthe sensor-system describes the rotation between the sensor system and the real-world.
In order to determine the pose of the sensors system in real-world coordinates, the relativeposition between the QR-code and the sensor system must be calculated first. The vertical distancebetween the camera and the QR-code is assumed known, since the real-world coordinates of theQR-code is encoded in the QR-code itself. What is left to be estimated is the horizontal displacementbetween the camera and the QR-code. In order to estimate this the «pinhole camera model» is used,which describes the relationship between a point in three-dimensional space and its projection ontoa two-dimensional image plane of an ideal pinhole camera Section 4.2.1. Following is a systematicapproach for estimating the position of the QR-code in relation to the camera coordinate system.
1. Calculate the camera parameter matrix Equation 6.2.2. Detect the QR-code and calculate the position of its center in pixel coordinates.3. Calculate the normalized image coordinates of the center from the camera parameter matrix
and the pixel coordinates of the center, Section 6.6.2.4. Calculate the real-world displacement of the QR-code with respect to the camera coordinate
system by multiplying the normalized image coordinates with the vertical distance betweenthe camera and QR-code.
Camera parameter matrix
The camera parameter matrix «K» is defined as follows.
K =
fρw
0 u0
0 fρh
v0
0 0 1
(6.2)
Where f is the focal length of the camera, ρw and ρh is the size of the pixels in meters and u0,v0 is the center of the image in pixel coordinates. The camera parameter matrix is used to map thethree-dimensional world onto the image plane.
59

CHAPTER 6. SYSTEM DEVELOPMENT
The camera parameter matrix can either be found by using the data from the data-sheet of thesensor, or through calibration. Manually calibrating the camera ensures that the resulting cameraparameter matrix is customized for the specific camera used, as the exact specifications of thecamera may vary slightly from the specifications given by the data-sheet. To calibrate the camera amethod provided by OpenCV is used [16]. This method utilizes a chess-pattern, of which the sizeof the squares are known. Figure 39 shows the pattern used in calibration of the Raspberry Pi V2Camera.
Figure 39: Chess-pattern used to calibrate the camera
The calibration method uses multiple images of the chess-pattern from different viewpoints.Figure 40 shows the flowchart of the camera calibration process.
Figure 40: Camera calibration flowchart [16]
60

CHAPTER 6. SYSTEM DEVELOPMENT
6.6.2 Detect center of QR-code
For detecting and decoding QR-codes a python library called «pyzbar» is used. Which is a ready touse library for reading barcodes and QR-codes [33]. Besides reading QR-codes, the library can beused to find the corners of the QR-code in pixel-coordinates, from which the center can be calcu-lated.
Using the pyzbar.decode(image) function re-turns a list containing the decoded data from thecode, the type of code which was decoded, thesize of the decoded object and the coordinatesof each corner. From the coordinates describingthe pixel-coordinates of each corner, the geomet-ric center of the QR-code is calculated. The ge-ometric center of n amount of points describedby X - and Y-coordinates is calculated by Equa-tion 6.3.
Xcenter =X1 +X2 + ...+Xn
n
Ycenter =Y1 + Y2 + ...+ Yn
n
(6.3)Figure 41: The vertices and the calculated centerof the QR-code marked with circles.
Normalized image coordinates
The camera parameter matrix defines how a point in three-dimensional space is projected onto theimage plane. As such it can also be used to determine the position of a two-dimensional point onthe image plane in three-dimensional space. Equation 6.4 shows the relationship between a point(x,y) in pixel coordinates and its real-world counterpart X, Y, Z.
Z ∗
xy1
=
fρw
0 u0
0 fρh
v0
0 0 1
∗XYZ
(6.4)
By having Z equal to one the equation can be solved for the X - and Y-coordinate which repre-sents the normalized image coordinates. This is the projection of a point in three-dimensional spaceassuming onto a image plane where it is assumed that the focal length is equal to one measure-ment unit, in this case one meter. The resulting normalized image coordinates is given in the same
measurement unit. The normalized image coordinates is given on the form:
XY1
The correlating point in three-dimensional space is found from multiplying the normalized im-
age coordinates with the distance from the camera to the point Z.
61

CHAPTER 6. SYSTEM DEVELOPMENT
Relative position of QR-code with respect to the camera coordinate system.
From the normalized image coordinates the real-world relative position of the QR-code with respectto the camera coordinate system is calculated by multiplying the normalized image coordinates withthe vertical distance between the camera and the Qr-code. In Figure 42 the estimated position of aQR-code with respect to the camera coordinate system calculated from an image is visualized in athree-dimensional coordinate system.
Figure 42: Estimated position of QR-code with respect to camera.
62

CHAPTER 6. SYSTEM DEVELOPMENT
Calculating the pose of the camera with respect to the real-world coordinate system
Up until now the relative position of the QR-code with respect to the camera coordinate sys-tem have been estimated. The next step is to es-timate the position of the camera with respect tothe world coordinate system. In order to achievethis it is assumed that the coordinate system ofthe QR-code is aligned with the world coordinatesystem Figure 43. By estimating the rotation ofthe QR-code with respect to the camera coordi-nate system, the rotation of the camera with re-spect to the world coordinate system can be cal-culated.
Figure 43: World - and QR coordinate systemA QR-code typically consist of three markers, one in the upper right corner, one in the upper leftcorner and one in the bottom left corner Figure 44. The top of the QR-code is assumed to point inthe positive y-direction in the real-world coordinate system. It is further assumed that the z-axisin the camera coordinate system is pointing directly out of the camera in the same direction as thez-axis of both the world - and Qr-code coordinate system Figure 43. Consequently, only the rotationof the camera coordinate system around the z-axis must be calculated in order to determine therotation between the camera - and the world coordinate system.
Figure 44: QR-code with three markers
63
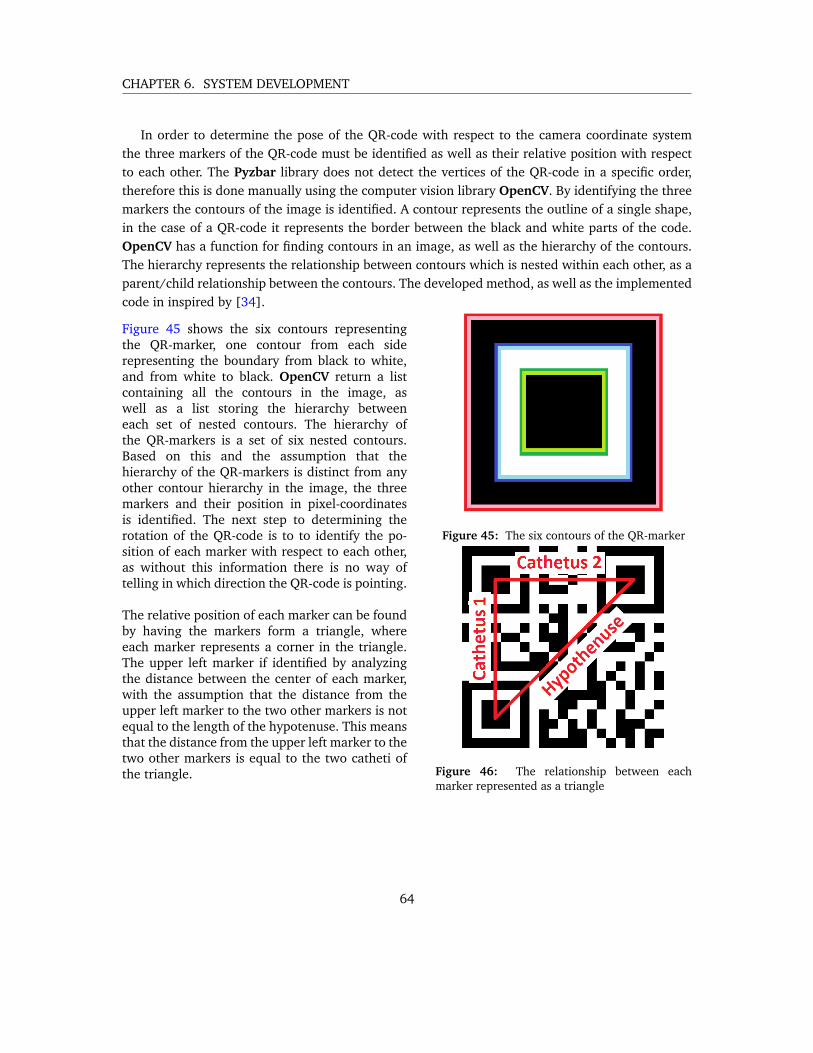
CHAPTER 6. SYSTEM DEVELOPMENT
In order to determine the pose of the QR-code with respect to the camera coordinate systemthe three markers of the QR-code must be identified as well as their relative position with respectto each other. The Pyzbar library does not detect the vertices of the QR-code in a specific order,therefore this is done manually using the computer vision library OpenCV. By identifying the threemarkers the contours of the image is identified. A contour represents the outline of a single shape,in the case of a QR-code it represents the border between the black and white parts of the code.OpenCV has a function for finding contours in an image, as well as the hierarchy of the contours.The hierarchy represents the relationship between contours which is nested within each other, as aparent/child relationship between the contours. The developed method, as well as the implementedcode in inspired by [34].
Figure 45 shows the six contours representingthe QR-marker, one contour from each siderepresenting the boundary from black to white,and from white to black. OpenCV return a listcontaining all the contours in the image, aswell as a list storing the hierarchy betweeneach set of nested contours. The hierarchy ofthe QR-markers is a set of six nested contours.Based on this and the assumption that thehierarchy of the QR-markers is distinct from anyother contour hierarchy in the image, the threemarkers and their position in pixel-coordinatesis identified. The next step to determining therotation of the QR-code is to to identify the po-sition of each marker with respect to each other,as without this information there is no way oftelling in which direction the QR-code is pointing.
The relative position of each marker can be foundby having the markers form a triangle, whereeach marker represents a corner in the triangle.The upper left marker if identified by analyzingthe distance between the center of each marker,with the assumption that the distance from theupper left marker to the two other markers is notequal to the length of the hypotenuse. This meansthat the distance from the upper left marker to thetwo other markers is equal to the two catheti ofthe triangle.
Figure 45: The six contours of the QR-marker
Figure 46: The relationship between eachmarker represented as a triangle
64

CHAPTER 6. SYSTEM DEVELOPMENT
Since the orientation of the QR-code in the image is arbitrary, the two remaining markers areidentified by analyzing their position with respect to each other and the marker in the upper leftcorner of the QR-code. The markers form a static triangle, where the relative position of the cornerswith respect to each other is constant. By analyzing the distance from the upper left marker to thehypotenuse and the sign of the slope of the hypotenuse, the two remaining markers are identified.
When the three markers are identified the rotation of the QR-code with respect to the camera canbe found by calculating the angle between the horizontal line with respect to the QR-code stretchingfrom the upper left marker, to the upper right marker, represented in Figure 46 as «Cathetus 2» andthe x-axis of the camera coordinate system. This gives the relative rotation of the QR-code aroundthe z-axis. See Figure 47 which shows a QR-code rotated -90 degrees with respect to the cameracoordinate system. The blue line is parallel to the x-axis of the camera coordinate system, whilethe red line is parallel to the x-axis of the QR-code coordinate system. The angle between themrepresents the rotation of the QR-code with respect to the z-axis.
Figure 47: Rotation of QR-code around the z-axis with respect to the camera coordinate system
65

CHAPTER 6. SYSTEM DEVELOPMENT
With the rotation θ and the position of the QR-code with respect to the camera coordinatesystem, and the position of the QR-code with respect to the world coordinate system, the positionand orientation with respect to the world coordinate system can be calculated. The translationmatrix describing the position and orientation of the Qr-code with respect to the camera coordinatesystem is defined as follows, Equation 6.5.
TCameraQR =
RCameraQR rCameraQR
000 1
(6.5)
Where RCameraQR represents the rotation of the QR-code around the z-axis and rCameraQR representsthe position of the QR-code with respect to the camera coordinate system.
RCameraQR =
cos(θ) −sin(θ) 0sin(θ) cos(θ) 0
0 0 1
(6.6)
RCameraQR =
XYZ
(6.7)
Further, the translation matrix describing the position and orientation of the camera with re-spect to the QR-code coordinate system is found by calculating the inverse of TQRCamera, resultingin TCameraQR . Taking into account the position of the QR-code in the world coordinate system whichis found by decoding the QR-code, the translation matrix TCameraWorld is found by adding the positionof the QR-code in the world coordinate system to the position of the camera in the QR-coordinatesystem. Figure 48 shows the resulting transformation between the QR-code coordinate system andthe camera coordinate. In this test the QR-code is placed on the floor with the camera looking downon it. The QR-code is rotated -90 degrees with respect to the camera coordinate system. Further,in this example the z-axis in the camera coordinate system is pointing out of the backside of thecamera.
Figure 48: Resulting translation between coordinate system after estimating distance and rotation from pic-ture of QR-code. Redline: x-axis, green line: y-axis, blue line: z-axis
66

CHAPTER 6. SYSTEM DEVELOPMENT
ROS 2 implementation
This method is implemented as a ROS 2 node which publishes a «PoseStamped» message contain-ing the pose of the system relative to a given coordinate system, and the time of which the messagewas published. Listing 6.18 shows the necessary libraries for publishing the data.
#!/user/bin/env python #Tells the system that this is a python nodeimport rclpy #Contains the source code for the ROS client library
#for python packagesimport std_msgs.msg #Standard ros messagefrom rclpy.node import Node #This is imported so the Node -class
#for python can be usedfrom geometry_msgs.msg import Pose #Message containing the position
#of the system in x,y - and z#-coordinates , and the rotation#given in the form of a#quaternion
from geometry_msgs.msg import Point #Position given in x,y - and z#-coordinates
from geometry_msgs.msg import Quaternion #The rotation of the systemfrom geometry_msgs.msg import PoseStamped #The published message
#containing the relative#position , orientation#and the a timestamp of#when the message#was published
Listing 6.18: Import the necessary libraries and messages for the QRnavigationnode
67

CHAPTER 6. SYSTEM DEVELOPMENT
Next a class calledQR_navigation is created, which inherits properties from the imported Node-class. The class is in charge of taking the image, processing it and publishing the data describing theposition and orientation of the system. Listing 6.19 shows the initialization of the QR_navigationnode.
class PosCamera (Node , t imer_per iod ) :def _ _ i n i t _ _ ( s e l f ) : #Class constructor
super ( ) . _ _ i n i t _ _ (’pos_camera’)#Timer calling the scan-functiont imer_per iod = t imer_per iod #Timer periods e l f . t imer = s e l f . c r ea te_ t imer ( t imer_per iod , s e l f . scan )message = PoseStamped () #Relative position and rotation and timestamps e l f . po int = Point () #Position given by x,y - and z coordinates e l f . quaternion = Quaternion () #Rotations e l f . pose = Pose () #Position and orintations e l f . msg = message #Initilizing the default message#Creating the publisher and assigning the topic names e l f . pub = s e l f . c r e a t e _ p u b l i s h e r ( PoseStamped , "agv/landmark_pose" , 5)
Listing 6.19: Initializing QR_navigation node for publishing position and orientation data obtained throughthe Raspberry Pi V2 camera
The position and orientation of the system is estimated by the previously described methodusing images from the Raspberry Pi V2 camera. For interfacing with the camera the python librarypicamera is used, which is a dedicated library to the Raspberry Pi cameras. The following list showsthe order of operations executed by the node.
1. The Raspberry Pi V2 camera is initiated through the picamera-library2. The node calls the camera to take a image, which is then published to a python stream3. The values from the stream is converted into a Numpy-array and decoded by the OpenCV
library to an image format the library can work with4. From the image the position and orientation of the system is found using the described
method5. The node publishes the position and orientation of the system relative to the given coordinate
system as a PoseStamped message.
68

CHAPTER 6. SYSTEM DEVELOPMENT
The processing happens in the function scan() which is a member-function of theQR_navigationclass. The function calls the non-member function PosRotCamera() which is a python implemen-tation of the described method. Then the information is published as a PoseStamped-message. Thescan() function is shown in Listing 6.20.
def scan ( s e l f ) :stream = io . BytesIO ()with picamera . PiCamera () as camera :
#Image captured as streamcamera . capture ( stream , format=’jpeg’)
#Data from stream converted to numpy-arraydata = np . f roms t r ing ( stream . getva lue ( ) , dtype=np . uint8 )#Numpy array decoded to OpenCV imageim = cv2 . imdecode ( data , 1)#Relative position and orintation of camera is estimatedr , p = PosRotCamera ( im)#Orientation of camera is converted into a quaternionr_w = math . s q r t ((1 + r [0][0] + r [1][1] + r [2][2])/2)r_x = ( r [2][1] − r [1][2])/(4∗ r_w)r_y = ( r [0][2] − r [2][0])/(4∗ r_w)r_z = ( r [1][0] − r [0][1])/(4∗ r_w)#Position x,y,z as a point-messages e l f . po int . x = p[0]s e l f . po int . y = p[1]s e l f . po int . z = p[2]#Rotation x,y,z,w as a quaternion -messages e l f . quaternion . x = r_xs e l f . quaternion . y = r_ys e l f . quaternion . z = r_zs e l f . quaternion .w = r_w#Pose messages e l f . pose . p o s i t i o n = s e l f . po in ts e l f . pose . o r i e n t a t i o n = s e l f . quaternion#PoseStamped messages e l f . msg . header = std_msgs . msg . Header ()#Present times e l f . msg . header . stamp = s e l f . ge t_c lock ( ) . now ( ) . to_msg ()#Frame of which the cameras relative position is estimated froms e l f . msg . header . frame_id = ’world’s e l f . msg . pose = s e l f . pose#Messaging is publisheds e l f . pub . pub l i sh ( s e l f . msg)
Listing 6.20: The scan() member function of the class QR_navigation
69

CHAPTER 6. SYSTEM DEVELOPMENT
6.6.3 Intel Realsense D435 depth sensor
Intel have released its own packages for using the Intel Realsense D400 series, which includes theIntel Realsense D435 with ROS 2. The packages, along with instructions is available on GitHub [31].These packages provides ROS 2 with methods to interface with and use the data published from thecamera. This includes color images, depth images, infrared images and pointclouds derived fromthe images. A pointcloud is a set out data points in space, each point is defined by its relative spacialposition with respect to the Intel Realsense depth sensor. In relation to mapping the pointcloud canbe used to perform SLAM or other mapping algorithms to create a three-dimensional map of theenvironment.
Further the package comes with an alternative to transform the pointcloud derived from thedepth data into a two-dimensional laserscan message, this is of the same format which the datafrom the range sensors is published, but with much higher accuracy. This data can be used in orderto create two-dimensional maps of the environment, and it would lessen the computational loadof running a mapping algorithm since the amount of published points is only in the xy-plane asopposed to the pointcloud which publishes points in the spacial-frame. Consequently, the amountof points to process are fewer.
Installing the Intel Realsense ROS 2 packages on Raspberry Pi
The procedure for installing the ROS 2 packages is obtained from Intels own GitHub account [31].The packages are compatible with ROS 2 Dashing, which is the version of ROS 2 used in the devel-opment of this project.
The first step is to install the necessary ROS 2 dependencies. This is ROS 2 packages which theIntel Realsense packages is dependent upon to function. This process is shown in Listing 6.21
sudo apt -get install ros -dashing -cv -bridgesudo apt -get install ros -dashing -librealsense2sudo apt -get install ros -dashing -message -filterssudo apt -get install ros -dashing -image -transport
Listing 6.21: Install the necessary ROS 2 dependencies
70

CHAPTER 6. SYSTEM DEVELOPMENT
The next step is to install non-ROS Debian packages which the Intel Realsense packages is de-pendent upon. This is shown in Listing 6.22.
sudo apt -get install libssl -devsudo apt -get install libusb -1.0-0-devsudo apt -get install pkg -configsudo apt -get install libgtk -3-devsudo apt -get install libglfw3 -devsudo apt -get install libgl1 -mesa -devsudo apt -get install libglu1 -mesa -dev
Listing 6.22: Install the necessary non-ROS debian packages
Finally the ROS 2 Intel Realsense packages can be installed, Listing 6.23.
sudo apt -get install ros -dashing -realsense -camera -msgsros -dashing -realsense -ros2 -camera
Listing 6.23: Install ROS 2 Intel RealSense packages
6.6.4 Mapping
Due to the lack of mapping related packages compatible with ROS 2, ROS Melodic was used in rela-tion to performing mapping using the Intel Realsense D435. The package used is Rtabmap, whichis ROS-wrapper for the library RTAB-Map, a RGB-D, stereo and LIDAR graph-based slam approach[35].
Using the Intel Realsense D435 with the Rtabmap-package allows for performing SLAM withonly the Realsense D435 alone. In order to ac hive this the position of the sensor is calculated atthe same time as mapping is performed, the general idea behind this is explained in Section 4.2.5.The process of determining the pose and orientation of the system using this method is called visualodometry. The pose and orientation are estimated by looking at distinct features in a sequence ofimages and comparing the relative position of the features from image to image.
The point-cloud generated from the Intel Realsense D435 is dense, meaning there is a lot ofdata to process, especially when performing pure visual-SLAM. It does however work on the RBPi4,although it is very slow and the odometry often fails and the sensor must return to a known pointwhere the odometry is known for it to re-calibrate. Since the output of the sensor is a three-dimensional rendering of the surrounding environment, the odometry is calculated in the x-, y-,and z-plane. This means that the pose, orientation linear velocity and angular velocity about allthree axes are calculated. As a result it is possible to perform handheld mapping where a person iscarrying the camera by hand. As mentioned this requires a lot of computational power, and provedto be a time and power consuming process. This is especially true in relation to indoor mapping,as the performance is better the more texture the scene has. In an indoor environment there is nota lot of texture to differentiate one part of a wall from another, making it hard to perform visual
71

CHAPTER 6. SYSTEM DEVELOPMENT
odometry. Further, in relation to indoor mapping the work-space is often planar. Consequently thereis no need to calculate the linear velocity along the z-axis or the twist about the x- and y-axes. As inmost cases these variables will be constant and equal to zero. The package Rtabmap allows for in-tegrating external odometry and disabling the visual odometry from the Intel Realsense D435. Thiscan be odometry from the wheels of the robot, or from any other source capable of providing odom-etry data. When testing the mapping capabilities of the system odometry data from a LIDAR wasused as an external source. The odometry is calculated by a node from the Rtabmap-package calledicp_odometry. This node calculates odometry data from laser_scan messages in ROS. Since the LI-DAR only operates in two dimensions, the motion along the z-axis and around the x- and y-axes isassumed to be zero. Consequently, the computational power needed to perform the odometry esti-mations is a lot lower than what is needed to perform odometry estimations in three-dimensionalspace. Using external odometry resulted in a much better performance. The LIDAR is not a part ofthe actual developed system and was used only to provide odometry data. Although it is possibleto perform mapping without the use of external odometry, it is not optimal as it is very slow andpower consuming. It is therefore recommended that the robotic vehicle equipped with the systemcan provide odometry data to the system. This can be odometry data calculated by encoders on thewheel, as the case is with the turtlebot. Figure 49 shows the resulting two-dimensional map frommapping a small room using pure visual SLAM while Figure 50 shows the result with and externalodometry source, in this case from a two-dimensional LIDAR.
Figure 49: Pure visual slam of an indoor room Figure 50: Visual slam with external odometry
72

CHAPTER 6. SYSTEM DEVELOPMENT
The blue line in the images indicates the estimated odometry of the system. The room itself haswhite walls without many distinct features, which is the reason why the map calculated using visualSLAM failed. Further, the outlying black part of both images seems to come from the fact that thereis a transparent surface there. Still, using external odometry the system was able to estimate a goodmap of the room.
73

CHAPTER 6. SYSTEM DEVELOPMENT
6.7 Prototype
As mentioned earlier the aim of the system is not to be a stand alone autonomous ground vehi-cle(AGV), but rather a sensor system capable of providing an existing robotic vehicle with enoughinformation about the environment so that it can perform mapping, navigation and obstacle detec-tion by making use of the tools the system provides. In theory the sensor data from the system isenough to perform these tasks, but in reality, some additional information is needed for the systemto function properly. That is mainly, odometry data for mapping and navigation purposes.
The aim of this project is not to develop a system that should replace industrial systems thatserves the same purpose, but rather develop a low-cost system which can be used by students inlab-work related to automation and robotic vehicles.
6.7.1 Functionality of the system
When it comes to functionality the system aims to provide sensor data that can be used for ob-stacle detection, navigation and mapping. The main sensors used in relation to obstacle detectionare ultrasonic- and infrared range sensors. For navigation and mapping it is the Raspberry Pi V2camera used to detect visual landmarks, and the Intel Realsense D435 used to accurately depict thesurrounding environment. Further, the information provided by the Intel Realsense D435 can beused together with the information provided by the range sensors for obstacle detection purposes.Figure 51 shows an illustration of an AGV(red square) equipped with the system, whereas the trans-parent figures illustrates the viewing angle of the different sensors. The ratio in this illustration doesnot depict the ranges of the sensors accurately.
Figure 51: Illustration of an AGV implemented with the system, the transparent figures shows the viewingangle of each sensor. Blue: ultrasonic- and infrared sensors, Yellow: Raspberry Pi V2 camera, Purple: IntelRealsense D435.
74

CHAPTER 6. SYSTEM DEVELOPMENT
Obstacle detection
The main concern when it comes to obstacle detection is that the system is capable of detectingobstacles independent of their surface characteristics, hence the use of both ultrasonic- and infraredrange sensors. As explained earlier in this chapter the one type of sensor prevails where the otherone fails, and vice versa. Thus, reducing the chance for an overall error in detecting an obstaclewithin the field of view of the system. The goal was to develop a redundant grid consisting of low-cost ultrasonic- and infrared sensors with a viewing angle of 360 degrees, but as the viewing angleof each sensor were narrower than anticipated, the overall viewing angle was narrowed downto 195 degrees. That being said, it is fairly easy to implement additional sensors to the system.Listing 6.24 shows how to add an additional sensor to the .URDF file showcased in Section 6.4.1.Further, additional sensors must be connected to the Arduino and accounted for in the Arduinocode and the ROS2 node, this procedure is explained in Section 6.5.
</link><!-- Adding additional sensor -->
<link name="new_sensor"></link>
<!-- Translation between base_link and sensor --><joint name="base_link_to_new_sensor" type="fixed">
<parent link="base_link"/><child link="new_sensor"/><!-- Translation of new_sensor link with respect tobase link --><!-- Add the real -world position of the sensor with respectto the base_link -->
<origin rpy="0 0 0" xyz="0.0825 0 -0.0175"/></joint >
</robot >
Listing 6.24: Adding additional sensor to the URDF model of the system
If this is to be done it is necessary with more input/output(IO) ports, subsequently the ArduinoUNO would have to be upgraded or one would have to use an additional Arduino UNO for inter-facing with the additional sensors. That being said, this type of system should be able to detectall obstacles within its field of view. By additionally using the Intel Realsense D435 which has amaximum detection range of ten meters for obstacle detection, the system can detect obstacles ap-proaching from the side at a range of 4 meters, and obstacles in the driving direction at a range often meters. The obstacle detection capabilities of the sensor grid are further explored in Chapter 7.Figure 52 shows the viewing angle and detection range of the system. Where the obstacle detectiongrid consisting of ultrasonic- and infrared sensors cover a viewing angle of 195 degrees and a rangeof four meters and the Intel Realsense D435 covers approximately an 87 degree viewing angle witha maximum range of approximately 10 meters.
75

CHAPTER 6. SYSTEM DEVELOPMENT
Figure 52: Total viewing angle of the system
Navigation and mapping
For the purpose of navigation and mapping two different sensors are used. The Raspberry Pi V2camera is used to detect QR-codes and estimate the position of the system, and the Intel RealsenseD435 is used to gather enough information about the surrounding environment, allowing for theuse of mapping-algorithms to generate maps of the environment.
In order to make use of the navigation method using QR-codes, QR-codes must be attached tothe roof and hold information about their own position in the workspace, which the system uses toestimate its own position in relation to the workspace. This can function as a stand-alone methodfor navigation, but can also be used together with additional methods such as odometry to keeptrack of the AGV’s position. Further, the Intel Realsense D435 can be used to perform navigationin a known three-dimensional map, using ROS packages such as the Rtabmap-package introducedearlier in this chapter. To summarize, the sensor system provides enough information about thesurrounding environment so that it should be possible to perform obstacle detection, navigationand mapping. Since the mapping is not running on ROS2, the system is not yet merged into onecompact system. The different aspects of the prototype is further explored and tested in Chapter 7
76

CHAPTER 7. EXPERIMENTS, RESULTS AND DISCUSSION
7 Experiments, results and discussion
In this chapter several experiments are presented with results and discussions. The aim of the con-ducted experiments is to test the capabilities of the developed system and to compare the resultsup against the system requirements described in Chapter 3. The chapter is divided into multiplesections, each related to a specific aspect of the system. Each section has its own introduction de-scribing the conducted experiments and the research questions related to the them. Further, theresults from the experiments is presented and discussed.
The chapter is divided into multiple sections to present the experiments, results and the relateddiscussions in a systematic manner. The chapter concludes with and overall discussion where thesystem as a whole is compared to the system requirements stated in Chapter 3.
7.1 Obstacle detection using low-cost range sensors
The main task of the obstacle avoidance system is to provide reliable obstacle detection, meaningthat the system should be able to detect obstacle within the operating range of the system, anddetect obstacles independent of the surface characteristics of the obstacle. The conducted experi-ments in relation to obstacle detection using low-cost range sensors aims to test the reliability ofthe sensors and the system as a whole. The first research question is:
• Is the system capable of detecting obstacles independent of their surface characteristics?
As mentioned in Section 6.5 the viewing angle of the infrared sensors is a lot narrower than theviewing angle of the ultrasonic sensors, which may cause a problem if an obstacle is able to getin between two infrared beams without being hit by them, thus not being detected by the infraredsensors. Consequently, the next research question is:
• Does the narrow viewing angle of the infrared sensor cause a problem, or will the in-frared sensors be able to detect the obstacle before they reach a critical distance fromthe sensor system?
Due to the COVID-19 outbreak no lab-facilities were available to perform the experiments in.Consequently, the area of which the experiments were carried out was not large enough to test thesystem to its full operating range.
To visualize the data from the experiments, a python script that communicates with the Arduinowas used. As opposed to visualize the data using Rviz and ROS 2, the python library Matplotliballows for a more comprehensible presentation of the data.
77

CHAPTER 7. EXPERIMENTS, RESULTS AND DISCUSSION
7.1.1 Is the system capable of detecting obstacles independent of their surface charac-teristics?
The two main reasons behind using both ultrasonic - and infrared sensors for obstacle detectionis to reduce the probability of an obstacle not being detected by the system, as the strength andweaknesses of the two sensor complement each other, Section 6.5, Chapter 6. The conducted ex-periments aims to test whether or not this theory holds true in real life.
Detecting surfaces using one ultrasonic - and one infrared sensor
The first experiment was to test the surface detecting capabilities of the system in a controlledenvironment, using one ultrasonic- and one infrared sensor, both pointing in the same directiontowards an obstacle from the same distance. Two experiments were conducted, one where the ob-stacle had sound absorbing properties, and one where the obstacle was a transparent surface. Thesewere briefly discussed in Section 6.5 and supported the premise that the two sensors complementedeach other.
Figure 53 shows the result from multiple scans from both sensors where a transparent obstacleis placed 0.7 meters away from the sensor. The ultrasonic sensor detects the obstacle, while theinfrared sensor instead detects the wall behind the transparent obstacle.
Figure 54 shows the results from multiple scans from both sensors where a fleece jacket whereplaced one meter away from the sensors. The plot shows the ultrasonic sensor having trouble de-termining the distance to the fleece jacket, while the infrared sensor has no problem detecting it.
The vertical axes represents the measured length, while the horizontal axes represents the num-ber of conducted scans.
Figure 53: Transparent surface placed 0.7 meters fromthe sensors.
Figure 54: Fleece jacket placed one meter from thesensors.
78

CHAPTER 7. EXPERIMENTS, RESULTS AND DISCUSSION
Obstacle detecting capabilities of the system
The next set of experiments were conducted to test the system as a whole, and especially its ca-pability to detect humans. The systems capability to detect humans is of out-most importance, asthe safety of the humans working in the same environment as a autonomous ground vehicle(AGV)must be guaranteed. As the two previous experiments shows, the combination of an ultrasonic- andinfrared sensor is capable of detecting obstacles that falls within either of the sensors weak-pointsin a controlled environment. Further, these experiment aims to test whether or not this holds truein a dynamic environment.
As mentioned in the introduction to this section there were no available lab-facilities to conductthese experiments, as a result the testing environment is not optimal as it is not large enough totest the maximum range of the sensors. An optimal environment would be a large enough area sothe sensor could be turned on without any obstacles within the range of the sensor. Then multipleexperiments could be conducted where obstacles were introduced at different controlled distancesfrom the sensor-system. Instead the environment in which the experiment was conducted is a livingroom full of furniture. The system itself is placed at a height in which it does not detect most of thefurniture. Still, it poses a problem as it is hard to measure an exact path with a known distance tothe sensor-system as the test person has to climb over furniture in order to make his way around thefield of view of the sensor system. Consequently, the scope of the experiments had to be reduced toone experiment where the test person walks around the field of view of the sensor system wearingthe same fleece-jacket used in the previous experiment.
In order to have a standard to compare the results with a plot of the sensor-measurement fromthe environment without any external obstacles introduced is shown in Figure 55. Here the wallsand furniture in the environment is illustrated. The red dots represent the measurements from theultrasonic sensors, while the blue dots represents the measurements from the infrared sensors.
Figure 55: Sensor measurements from the open testing environment. The green lines represent the walls,while the brown drawing represent the furniture within the range of the sensors.
79

CHAPTER 7. EXPERIMENTS, RESULTS AND DISCUSSION
Figure 56 shows the resulting plot after a test-person walked around the field of view of thesensor-system wearing a fleece-jacket. The red dots represents the measurements from the ultra-sonic sensors, while the blue dots represents the measurements from the infrared sensors. Thetest-person is wearing a fleece-jacket as it proved difficult for the ultrasonic sensors to detect in theprevious experiment.
Figure 56: Measurements from an experiment where a test person walks around the field of view of thesensor system wearing a fleece jacket, the green arrow indicates the path of the test person.
The plot shows that both sensors successfully detects the test person. As opposed to the resultfrom the experiment using one of each sensors under controlled circumstances.
Conclusion and discussing of experiment
Under controlled circumstances using one of each sensors the ultrasonic sensor had problems de-tecting sound absorbing surfaces, while the infrared sensor did not detect transparent surfaces. Thissupports the premise for the use of both to ensure detection. In the experiment where a test personwalked around the field of view of the sensor system wearing the same fleece-jacket that the ultra-sonic sensor previously had problems detecting both sensors were successful in detecting the testperson. This suggests that with the use of both ultrasonic- and infrared sensors the sensor-systemis well equipped to detect obstacles independent of their surface characteristics.
80

CHAPTER 7. EXPERIMENTS, RESULTS AND DISCUSSION
7.1.2 Does the narrow viewing angle of the infrared sensor cause a problem?
Since the viewing angle of the infrared sensor is narrow, it may cause a problem as obstacles inbetween the beams will not be detected by the infrared sensors. This was tested using a test personstanding one meter away from the sensor system in-between the beams of two infrared sensors.The results are shown in Figure 57. The green arrow indicates the position of the test person.
Figure 57: Sensor measurement from experiment where a test person stood in between two infrared sensors,the green arrow indicates the position of the test person.
As the results shows, the infrared sensors was not able to detect the test person, but the ultra-sonic sensors did.
Conclusion and discussion of experiment
The narrow viewing angle of the infrared sensors and the resulting gap in between the emittedinfrared beams allows for obstacles to be undetected by the infrared sensors in a controlled envi-ronment. As the idea behind the use of both ultrasonic- and infrared sensors is to ensure that anobstacle within the range of the sensor is detected, this is not optimal. However, this is in a con-trolled environment where the sensor system is not moving. In a scenario where an AGV is equippedwith the sensor system, it would be unlikely that an obstacle would move or be positioned such thatit would not cross any of the infrared beams emitted by the infrared sensors. This is however notyet tested, so it can not be concluded that this is the case. Another solution, which is mentioned inSection 6.5 is to rotate the infrared sensor back and fourth with the use of a stepper-motor. Thiswould increase the viewing angle of each infrared sensors, but it would also mean that the infraredsensor would be exposed to more wear and tear over time because of the movement.
81
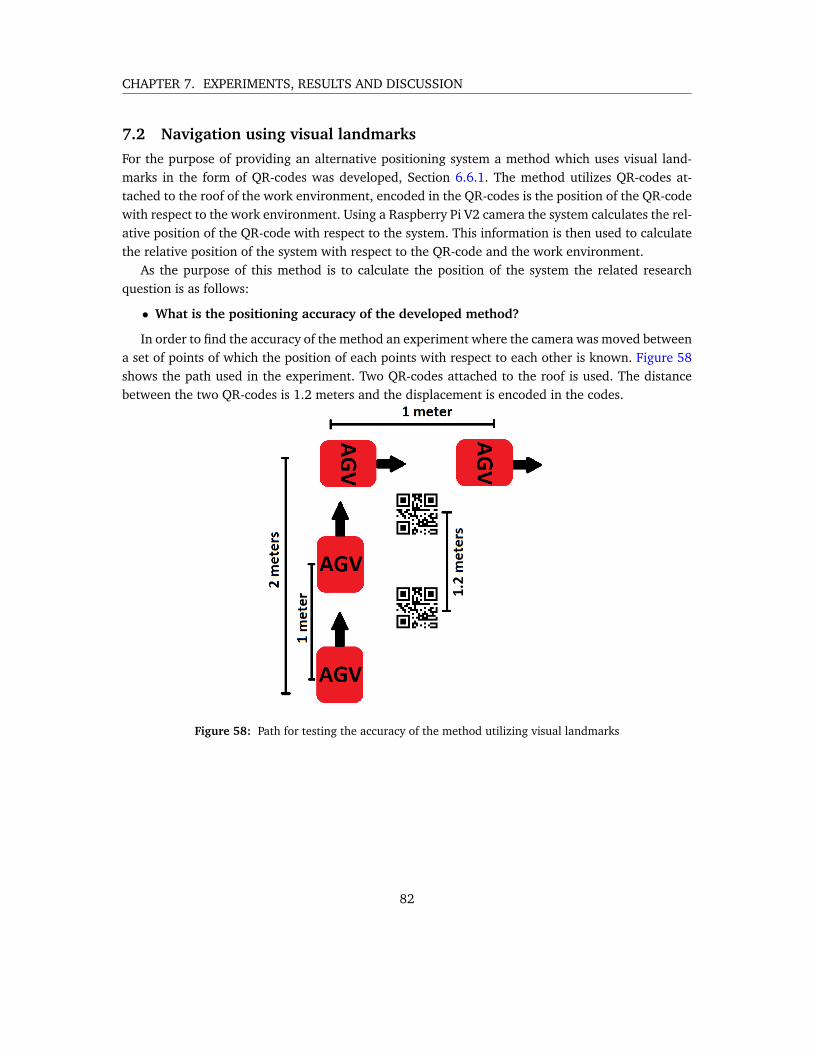
CHAPTER 7. EXPERIMENTS, RESULTS AND DISCUSSION
7.2 Navigation using visual landmarks
For the purpose of providing an alternative positioning system a method which uses visual land-marks in the form of QR-codes was developed, Section 6.6.1. The method utilizes QR-codes at-tached to the roof of the work environment, encoded in the QR-codes is the position of the QR-codewith respect to the work environment. Using a Raspberry Pi V2 camera the system calculates the rel-ative position of the QR-code with respect to the system. This information is then used to calculatethe relative position of the system with respect to the QR-code and the work environment.
As the purpose of this method is to calculate the position of the system the related researchquestion is as follows:
• What is the positioning accuracy of the developed method?
In order to find the accuracy of the method an experiment where the camera was moved betweena set of points of which the position of each points with respect to each other is known. Figure 58shows the path used in the experiment. Two QR-codes attached to the roof is used. The distancebetween the two QR-codes is 1.2 meters and the displacement is encoded in the codes.
Figure 58: Path for testing the accuracy of the method utilizing visual landmarks
82

CHAPTER 7. EXPERIMENTS, RESULTS AND DISCUSSION
Figure 59 shows the results of the experiment, where each point represents the four differentpositions of the AGV shown in Figure 58.
Figure 59: Resulting path after conducted experiments using QR-codes as visual landmarks
Conclusion and discussion of experiment
The system is able to utilize multiple visual landmarks to estimate its position. That being said,when comparing the results of the experiment to the path the system followed illustrated in Fig-ure 58, the position estimates does not accurately reflect the actual position of the system. It isoff with approximately -0.2 meters per traveled meter. A lot of this comes down to the calibrationof the camera and the resulting camera parameter matrix. A solution could be to tweak the posi-tion estimates to better reflect the actual position by multiplying with a constant factor or simplyre-calibrate the camera until the results more accurately reflects the actual position. However, mul-tiplying by a factor which gives satisfactory results would work given that the vertical distance tothe QR-codes attached to the roof is constant. If the vertical distance to the QR-codes varies, as aresult of the distance between the floor and the roof not being constant, this could also result in lessaccurate position estimates. In conclusion the method is capable of estimating the position of thesystem, and it does accurately reflect the direction of movement between each position estimate.However, the position estimates themselves does not accurately reflect the change in position of thesystem as it underestimates the relative position between measurements.
83

CHAPTER 7. EXPERIMENTS, RESULTS AND DISCUSSION
7.3 Mapping
The main task of the Intel Realesense D435 sensor is to provide the system with a tool which canbe used to perform mapping. This is an active infrared stereo sensor. This sensor is capable ofdepicting a three-dimensional rendering of the surrounding environment within its field of view.Together with mapping algorithms this allows the system to create three-dimensional and two-dimensional maps of the surrounding environments. The sensor can either perform mapping on itsown using visual SLAM, this means it has to create a map of its environment while at the sametime keep track of its own position within the environment. Another option is to use an externalsource of odometry which keeps track of the systems position withing the environment. Both ofthese methods will be tested. The package used to perform mapping in these tests is the Rtabmappackage. This package support pure visual SLAM using only the Intel Realsense D435 and mappingusing an external source of odometry. In this case the external odometry is provided by a 2D LIDARof which the package-function icp_odometry calculates the odometry data for us. Both methodswill be tested in the same environment and the results will be compared. Further, the results of thetests will be compared to a floor plan of the testing environment.As such, the first research question is:
• Is it feasible for an AGV to perform indoor mapping with an Intel Realsense D435 run-ning on a Raspberry Pi 4(RBPi4) without the use of external odometry?
Further, the systems capabilities when it comes to mapping larger and more complex areas istested. As with the experiments conducted in relation to obstacle detection, the testing environmentregarding mapping is not optimal. This is due to the lack of access to the lab facilities. Consequently,the testing environment is constrained to ground floor of a house. Even though the size of the test-ing environment is limited, it contains separated rooms and furniture. This makes the environmentmore complex than the environment used in the experiments regarding mapping presented in Sec-tion 6.6.4. That experiment where constrained to one room, testing in a larger area consisting ofmultiple separated rooms will further test the system’s ability to recreate accurate maps and ac-curately place the separated rooms in relations to each other. Consequently, the second researchquestion regarding mapping is:
• Is the system capable of accurately mapping larger more complex environments?
7.3.1 Is it feasible to perform indoor mapping without external odometry?
Using the Intel Realsense D435 and the Rtabmap package it is possible to perform mapping withoutany source of external odometry. Visual SLAM is highly dependent on distinct features presentin the scene that being mapped, as the position of these features from image to image is usedto calculate the odometry of the system. Depending on the environment there may not be manydistinct features available, which may cause a problem. Further, this is used to estimate the systemodometry in three-dimensional space, which maybe unnecessary since an AGV operating in anindoor environment usually will operate in a planar environment so the movement along the z-axis is equal to zero, as well as the rotation around the x- and y-axis. The first experiments were
84

CHAPTER 7. EXPERIMENTS, RESULTS AND DISCUSSION
conducted in a small room containing little key features as the walls all were the same color. This isthe same experiment presented in Section 6.6.4. As Figure 60 shows the system failed to map theenvironment, while it managed to map the same environment using external odometry as shownin Figure 61.
Figure 60: Pure visual slam of an indoor room Figure 61: Visual slam with external odometry
Another experiment was conducted in a different testing environment which was bigger, butcontained mote distinct features such as furniture and ornaments on the walls. Figure 62 shows thefloor plan of the environment as a reference to compare the resulting maps with.
Figure 62: Floor plan of the living room/test environment.
85
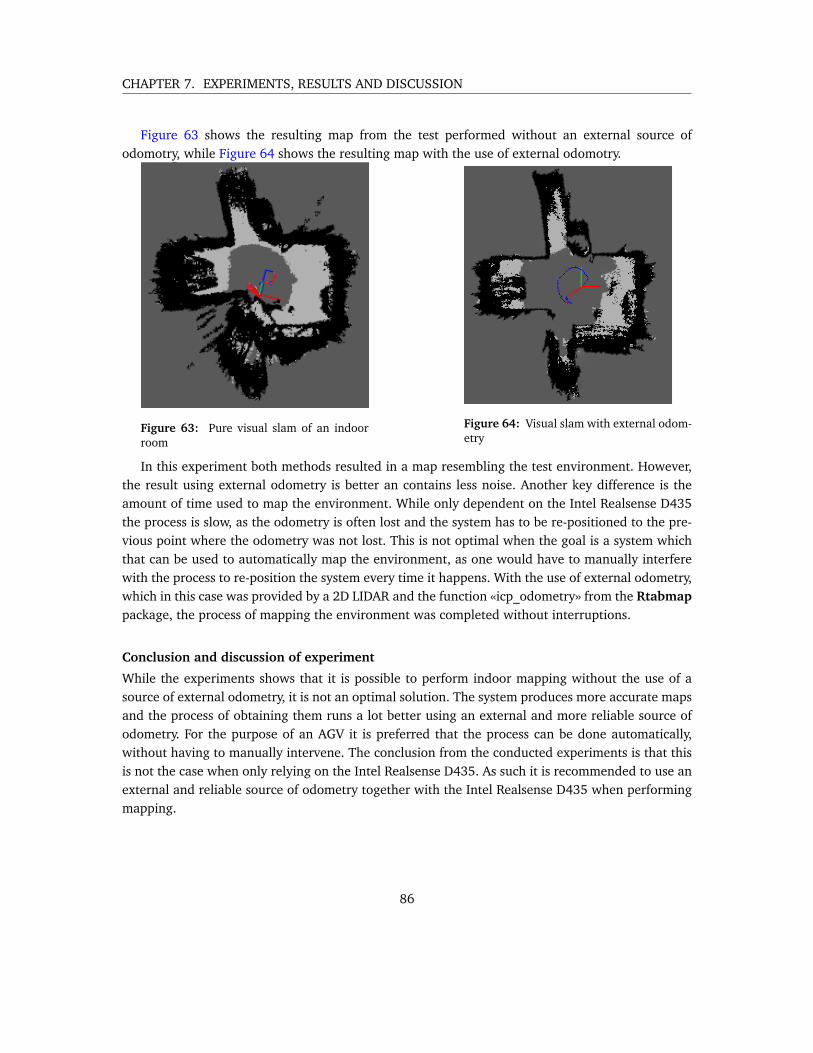
CHAPTER 7. EXPERIMENTS, RESULTS AND DISCUSSION
Figure 63 shows the resulting map from the test performed without an external source ofodomotry, while Figure 64 shows the resulting map with the use of external odomotry.
Figure 63: Pure visual slam of an indoorroom
Figure 64: Visual slam with external odom-etry
In this experiment both methods resulted in a map resembling the test environment. However,the result using external odometry is better an contains less noise. Another key difference is theamount of time used to map the environment. While only dependent on the Intel Realsense D435the process is slow, as the odometry is often lost and the system has to be re-positioned to the pre-vious point where the odometry was not lost. This is not optimal when the goal is a system whichthat can be used to automatically map the environment, as one would have to manually interferewith the process to re-position the system every time it happens. With the use of external odometry,which in this case was provided by a 2D LIDAR and the function «icp_odometry» from the Rtabmappackage, the process of mapping the environment was completed without interruptions.
Conclusion and discussion of experiment
While the experiments shows that it is possible to perform indoor mapping without the use of asource of external odometry, it is not an optimal solution. The system produces more accurate mapsand the process of obtaining them runs a lot better using an external and more reliable source ofodometry. For the purpose of an AGV it is preferred that the process can be done automatically,without having to manually intervene. The conclusion from the conducted experiments is that thisis not the case when only relying on the Intel Realsense D435. As such it is recommended to use anexternal and reliable source of odometry together with the Intel Realsense D435 when performingmapping.
86
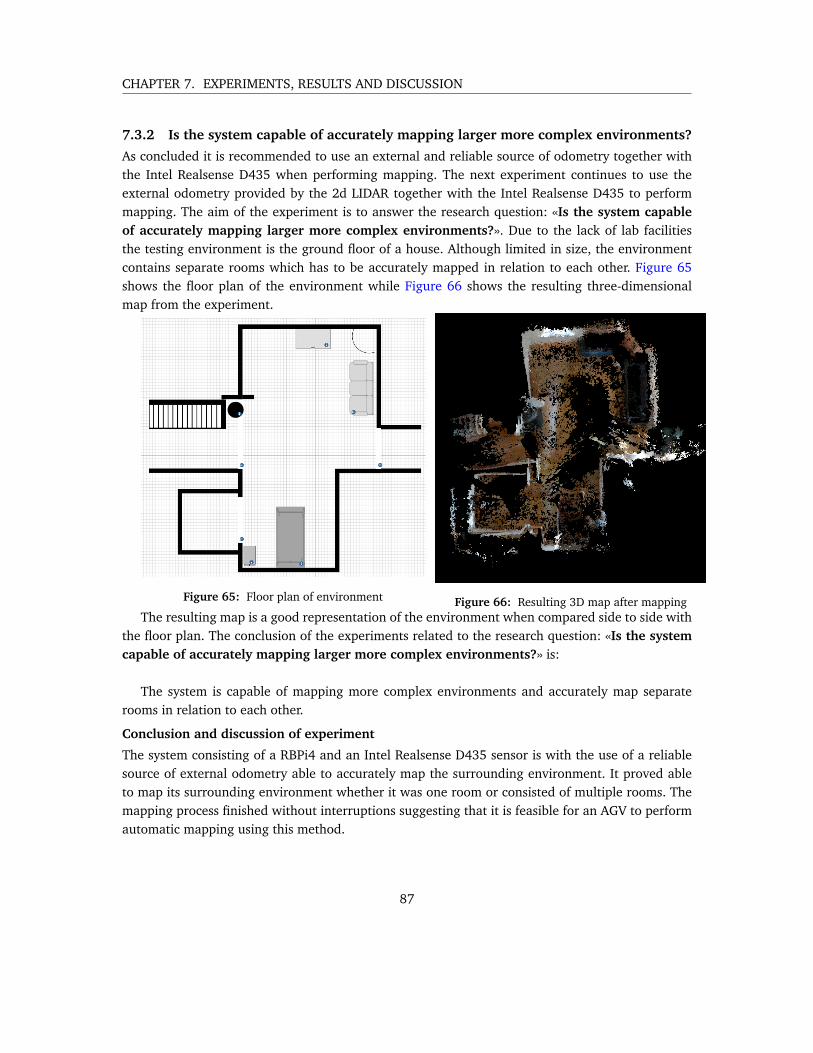
CHAPTER 7. EXPERIMENTS, RESULTS AND DISCUSSION
7.3.2 Is the system capable of accurately mapping larger more complex environments?
As concluded it is recommended to use an external and reliable source of odometry together withthe Intel Realsense D435 when performing mapping. The next experiment continues to use theexternal odometry provided by the 2d LIDAR together with the Intel Realsense D435 to performmapping. The aim of the experiment is to answer the research question: «Is the system capableof accurately mapping larger more complex environments?». Due to the lack of lab facilitiesthe testing environment is the ground floor of a house. Although limited in size, the environmentcontains separate rooms which has to be accurately mapped in relation to each other. Figure 65shows the floor plan of the environment while Figure 66 shows the resulting three-dimensionalmap from the experiment.
Figure 65: Floor plan of environment Figure 66: Resulting 3D map after mappingThe resulting map is a good representation of the environment when compared side to side with
the floor plan. The conclusion of the experiments related to the research question: «Is the systemcapable of accurately mapping larger more complex environments?» is:
The system is capable of mapping more complex environments and accurately map separaterooms in relation to each other.
Conclusion and discussion of experiment
The system consisting of a RBPi4 and an Intel Realsense D435 sensor is with the use of a reliablesource of external odometry able to accurately map the surrounding environment. It proved ableto map its surrounding environment whether it was one room or consisted of multiple rooms. Themapping process finished without interruptions suggesting that it is feasible for an AGV to performautomatic mapping using this method.
87
CHAPTER 7. EXPERIMENTS, RESULTS AND DISCUSSION
7.4 Conclusion and discussion of experiments in relation to the system re-quirements
To conclude the results from the experiments is compared to the technical system requirementsstated in Chapter 3. The technical requirements are as follows.
1 The system should provide enough information about a large enough area so that an AGV canreact in time to avoid accidents, Requirement 1.
2 The system should be able to automatically update the map of the working environment, Re-quirement 2
3 The system should have a method for keeping track of its position withing the working environ-ment, Requirement 3
These requirements are specified with the goal of an AGV utilizing this system to be able tonavigate a dynamic environment safely and efficiently. And the research questions stated in thischapter is centered around these. To compare the results to the technical requirements a systematicapproach going through each requirement at a time is used.
7.4.1 The system should provide enough information about a large enough area so thatan AGV can react in time to avoid accidents.
In Section 6.5 it is mentioned that one cycle of reading the measurements from all the sensors takes0.27 seconds, with the standard speed of an operating AGV assumed to be 1.5 m
s the worst casescenario where an AGV is on collision course with another AGV or a person walking towards at thesame speed, the traveled distance between each update would be 0.810 meters. In Chapter 3 thebraking distance of an AGV driving at 1.5 m
s is in the worst case 0.57 meters. In this scenario theupdate time could cause a problem, therefore the Intel Realsense D435 is heading in the drivingdirection of the AGV. The depth information from the sensor can not only be used for mapping pur-poses, but also to assist in detecting obstacles. Since the Intel Realsense D435 updates much faster,it would allow the AGV to react in time in situations like these. Further, the maximum distance ofthe sensor is approximately ten meters, allowing for obstacle detection in the driving direction ata longer range. Therefore an AGV equipped with this system should be able to operate a dynamicenvironment safely. This again depends on the control system steering the AGV, which is not ad-dressed in this thesis.
In order to operate safely it is not enough that the system is capable of providing informationabout a large enough area, it must also be capable of detecting all the obstacles within that area in-dependent of the characteristics of the obstacle. That is the reason behind the use of both ultrasonic-and infrared sensors. The conducted experiments shows that by utilizing both, the chance of an er-ror happening where neither of the sensors is able to detect an obstacle is minimized. One problemwith the sensor-system is the limited viewing angle of the infrared sensors. Under controlled cir-cumstances it is possible to bypass the infrared sensor if standing in between to beams. This couldcause a problem if the obstacle is sound absorbing and not detected by the ultrasonic sensors. This
88

CHAPTER 7. EXPERIMENTS, RESULTS AND DISCUSSION
is however not likely to be the case when equipped on an operating AGV, as it would be unlikelythat the obstacle would not cross any of the beams from the infrared sensors as they move (Sec-tion 7.1.2).
To conclude, the system is yet to be tested on an operating AGV, but the conducted experimentssuggests that it provide enough information about a large enough area allowing an AGV to operatesafely and avoid accidents.
7.4.2 The system should have a method for keeping track of its position withing theworking environment.
On its own, the system has two methods for keeping track of its own position within the environ-ment. One using the described method utilizing visual landmarks, and using the Intel RealsenseD435 along with Rtabmap. The latter is however not tested in this thesis.
Utilizing QR-codes as visual landmarks the system is able to accurately estimate the directionwhich it is heading, as documented in Section 7.2. On the other hand, the results were not satisfac-tory when it came to the accuracy of the actual position estimates.
7.4.3 The system should be able to automatically update the map of the working envi-ronment.
For the purpose of providing the necessary information to perform mapping, a Intel Realsense D435is used. Utilizing this sensor it is possible to perform SLAM solely based on the data from the sensor.However, the conducted experiments shows that this is not an optimal solution for the use of AGVs,as the process is slow and unstable. Instead, the experiments suggest that a better solution is toperform mapping utilizing an external source of reliable odomotry. This method produced moreaccurate maps and the process ran without interruptions. Utilizing this method also allowed formapping larger and more complex environments. Suggesting that it is a good fit for an operatingAGV aiming to map the working environment. The conducted experiments shows that it is possibleto perform visual SLAM with good results using a RBPi4 and an Intel Realsense D435 with theuse of external odometry. Running this system alone would allow for and AGV to automaticallymap and/or update a existing map of the surrounding environment. Thus, fulfilling the technicalrequirement.
In the context of this thesis the ROS melodic package Rtabmap is used. This package is not yetavailable for ROS2 Dashing in which the rest of the system is developed. Consequently, the wholesystem is not yet integrated on the same platform. With the aim to have a fully functional providingtools to perform obstacle detection, navigation and mapping, the system is not yet fully developed,as the it remains to integrate the whole system on the same platform.
89

CHAPTER 8. DISCUSSION, CONCLUSION AND FUTURE WORK
8 Discussion, conclusion and future work
In Chapter 7 the performance of the system is compared to the technical requirements specified inChapter 3. This chapter focuses on the requirements with respect to cost and implementation, therelevance of the project as well as the development process.
8.1 Cost, relevance and implementation
The name of the thesis is «Low-cost Navigation and Collision Avoidance System», the name reflectsthe objective which is to develop a low-cost navigation and obstacle avoidance system capable ofproviding robotic vehicles with sufficient information about the surrounding environment. In thecontext of this thesis low-cost is defined as «affordable for lab use without any extra support fromthe institute», which is usually around 5000 Norwegian kroner, as stated by Amund Skavhaug. Thetotal cost of the equipment used in the development of this system is 5146.29 Norwegian kroner,which falls within the suggested price-range.
8.1.1 Relevance
When it comes to the relevance of this project, the aim is not to develop a system which shouldbe used in industrial applications or be an alternative to similar systems like the Turtlebot. Thegoal is the development of a low-cost sensor system which can be used by the Turtlebot and otherrobotic vehicles for educational purposes, and allow autonomous ground vehicles(AGVs) utilizingthis system to perform obstacle avoidance, navigation and mapping. The system consist of differentsensors than what is provided by the Turtlebot, as such it would give students opportunity to workwith a wider range of sensors which are commonly used in robotic applications.
8.1.2 Implementation
Requirement 4 states that the system should be easy to implement. This does however depend onwhether or not the robotic vehicle on which the system is to be implemented also runs the sameROS distribution. If that is the case and both the system and the vehicle are connected to the samenetwork the communication between them is simple to initiate using the method described in Sec-tion 6.3. The system is developed for being integrated with other systems using ROS. The reasonfor this is that ROS is a universal framework for robotic applications and is widely used in the fieldof robotics.
Further, Requirement 5 states that the system should be simple to repair. As the system is nowthe hardware architecture is not complicated, and everything is documented in the thesis. If one or
90

CHAPTER 8. DISCUSSION, CONCLUSION AND FUTURE WORK
more sensor should stop working due to wear and tear, they can simply be replaced with a new oneby following the documentation given in the thesis.
8.2 Development process
The project documented throughout this thesis focuses on multiple aspect which together aims toprovide an AGV with the necessary information to operate safely and efficiently. This makes theproject in itself very broad, and the depth in which each aspect of the system is documented andexplored is limited due to the time scope of the master project. On the other hand, this was neverthe aim of the project. The aim of the project was to develop a low-cost navigation and collisionavoidance system utilizing existing technology and document the requirements needed for an AGVto be able to operate safely and efficiently.
By working with the different aspect which makes up the system as a whole, one get a goodunderstanding of what is actually needed when it comes to AGV’s. The requirements as well as thedeveloped system is documented throughout this thesis. The system itself is not finished yet, assome work is still needed to realize the system. Some suggested work for the future is:
• Test the obstacle avoidance grid on a moving vehicle.• Integrate the Intel Realsense D435 and a method for performing mapping in the same ROS
distribution as the rest of the system(ROS2 Dashing).• Further test and develop the method utilizing visual landmarks to achieve better accuracy.
Although the system is not finished, the groundwork has been done - thus a platform to furtherbuild upon is available for future students.
The project as a whole consists of both a theoretical part and a practical part. The practicalwork which was carried out and is documented throughout this thesis is based upon the previouslyconducted research documented in Appendix A. Although the practical part of the project was wellthought out beforehand, the process of utilizing this information to develop an actual system re-quires a lot of additional research. Consequently, the development process has been a mixture oflearning to use tools such as ROS while at the same time actually developing and building the sys-tem itself. With the benefit of hindsight I would suggest to have some knowledge within the useof ROS before embarking on a project like this. ROS offers a lot of relevant tools and developedmethods when it comes to robotics.
91

BIBLIOGRAPHY
Bibliography
[1] KG, G. 2019. Götting kg website. https://www.goetting-agv.com/components/inductive/introduction. Accessed: 2019-11-21.
[2] KG, G. 2019. Götting kg website. https://www.goetting-agv.com/components/optical/introduction. Accessed: 2019-11-21.
[3] Robotis. Emanual robotis. http://emanual.robotis.com/docs/en/platform/turtlebot3/simulation/. Accessed: 2020-27-05.
[4] Turtlebot3. https://www.turtlebot.com/. Accessed: 2020-15-05.
[5] Hellmann, D. 2019-09-17. Kinexon website. https://kinexon.com/solutions/agv-navigation. Accessed: 2019-11-21.
[6] ArcBotics. 2016. Arcbotics website. http://arcbotics.com/products/sparki/parts/ultrasonic-range-finder/. Accessed: 2019-02-12.
[7] How to use a sharp gp2y0a710k0f ir distance sensor with arduino. https://www.makerguides.com/sharp-gp2y0a710k0f-ir-distance-sensor-arduino-tutorial/. Ac-cessed: 2020-25-06.
[8] Mellish, B. Pinhole camera model. https://commons.wikimedia.org/wiki/File:Pinhole-camera.png. Accessed: 2020-12-05.
[9] Nordmann, A. 2007. Epipolar geometry.
[10] What is a stereo vision camera? https://www.e-consystems.com/blog/camera/what-is-a-stereo-vision-camera/. Accessed: 2020-04-06.
[11] Corso, N. & Zakhor, A. 2013. Loop closure transformation estimation and verification using 2d lidar scanners.
[12] Intel R© realsense depth camera d435. https://no.rs-online.com/web/p/depth-cameras/1720981/. Accessed: 2020-25-06.
[13] SHARP. Distance measuring sensor unit, 2018.
[14] 2019. Ros 2 dashing diademata. https://discourse.ros.org/t/ros-2-dashing-diademata-released/9365. Accessed: 2020-28-05.
92

BIBLIOGRAPHY
[15] Turltebot 3 rviz. http://emanual.robotis.com/docs/en/platform/turtlebot3/applications/. Accessed: 2020-28-05.
[16] Kaustubh Sadekar, S. M. Camera calibration using opencv. https://www.learnopencv.com/camera-calibration-using-opencv/. Accessed: 2020-24-06.
[17] 2020. Creating a workspace. https://index.ros.org/doc/ros2/Tutorials/Workspace/Creating-A-Workspace/. Accessed: 2020-28-05.
[18] 2020. Creating your first ros 2 package. https://index.ros.org/doc/ros2/Tutorials/Creating-Your-First-ROS2-Package/#what-is-a-ros-2-package. Accessed: 2020-28-05.
[19] Eckel, T. Newping arduino library. https://playground.arduino.cc/Code/NewPing/. Ac-cessed: 2020-30-05.
[20] Masino, G. Sharpir arduino library. https://github.com/qub1750ul/Arduino_SharpIR. Ac-cessed: 2020-30-05.
[21] Laserscan.msg. https://github.com/ros2/common_interfaces/blob/master/sensor_msgs/msg/LaserScan.msg. Accessed: 2020-30-05.
[22] Sørebø, K. S. 2019. Low-cost navigation and collision avoidance system.
[23] Ullrich, G. 2015. Automated Guided Vehicle Systems. Springer.
[24] Nils Gageik, Paul Benz, S. M. 2015. Obstacle detection and collision avoidance for a uav withcomplementary low-cost sensors. IEEE Access, (3), 599–609.
[25] Michael Montemerlo, S. T. 2007. Fast Slam. Springer, Berlin, Heidelberg.
[26] Aulinas, J., Petillot, Y., Salvi, J., & Llado, X. 2008. The slam problem: a survey. Frontiers inArtificial Intelligence and Applications, (184), 363–371.
[27] Drangsholt, M. A. Computer vision as an alternative for collision detection. Master’s thesis,NTNU, 2015.
[28] 2020. Ros 2 overview. https://index.ros.org/doc/ros2/. Accessed: 2020-05-13.
[29] Understanding ros 2 topics. https://index.ros.org/doc/ros2/Tutorials/Topics/Understanding-ROS2-Topics/. Accessed: 2020-30-05.
[30] About ros interfaces. https://index.ros.org/doc/ros2/Concepts/About-ROS-Interfaces/. Accessed: 2020-30-05.
[31] Ros2 wrapper for intel R© realsenseTM devices. https://github.com/intel/ros2_intel_realsense. Accessed: 2020-06-06.
93
BIBLIOGRAPHY
[32] Opencv webpage. https://opencv.org/. Accessed: 2020-01-06.
[33] Read one-dimensional barcodes and qr codes from python 2 and 3. https://pypi.org/project/pyzbar/. Accessed: 2020-01-06.
[34] Chen, J. Cameraposeestimation. https://github.com/czcbangkai/CameraPoseEstimation. Accessed: 2020-25-06.
[35] Rtab-map, real-time appearance-based mapping. http://introlab.github.io/rtabmap/.Accessed: 2020-20-06.
94

APPENDIX A. PRE-STUDY
A Pre-study
A1
Low-cost navigation andcollision avoidance system
Kristian Svinterud Sørebø
11-12-2019
Specialization ProjectDepartment of Mechanical and Industrial Engineering
Norwegian University of Science and Technology,
Supervisor: Prof. Amund Skavhaug

Low-cost navigation and collision avoidance system
Summary
The main objective of this thesis is to determine the possibilities for the development of a low-costnavigation and collision avoidance system for automatic ground vehicles(AGVs). The system shouldbe able to work in a dynamic environment around people. The focus of this thesis is the evaluationof existing technologies with respect to the main objective.
Several well established systems concerning the automatic control of AGVs are described andevaluated, before going into the different aspects which make up a complete system. Multiple meth-ods and technologies in relation to robotic mapping, positioning, navigation and obstacle avoidanceis described and evaluated. One of the main concerns in relation to the low-cost aspect of theprojects is that the whole system should run on a low-cost computer. Consequently a study of low-cost single board computers was done. Finally a concept for a low-cost system is presented, basedon the findings discussed in the paper. The concept consist of a system for automatic mapping ofthe AGVs surroundings, a method for real time positioning of the AGV and a system for obstacledetection.
i

Low-cost navigation and collision avoidance system
Preface
This thesis concludes my specialization project at NTNU Trondheim carried out during the au-tumn semester of 2019. The idea for this project came about during a lunch meeting with AmundSkavhaug about an open project. Trough a discussion regarding my interests and technical back-ground we landed on a project concerning a low-cost sensor system for autonomous ground vehicles(AGVs). We ended up with the title «Low cost navigation and obstacle avoidance system».
I would like to thank my supervisor Amund Skavhaug for his commitment and guidance through-out this semester.
11-12-2019
ii

Low-cost navigation and collision avoidance system
Contents
Summary . . . . . . . . . . . . . . . . . . . . . . . . . . . . . . . . . . . . . . . . . . . . . . . iPreface . . . . . . . . . . . . . . . . . . . . . . . . . . . . . . . . . . . . . . . . . . . . . . . . iiContents . . . . . . . . . . . . . . . . . . . . . . . . . . . . . . . . . . . . . . . . . . . . . . . iiiList of Figures . . . . . . . . . . . . . . . . . . . . . . . . . . . . . . . . . . . . . . . . . . . . vList of Tables . . . . . . . . . . . . . . . . . . . . . . . . . . . . . . . . . . . . . . . . . . . . . viAbbreviations . . . . . . . . . . . . . . . . . . . . . . . . . . . . . . . . . . . . . . . . . . . . vii1 Introduction . . . . . . . . . . . . . . . . . . . . . . . . . . . . . . . . . . . . . . . . . . . 1
1.1 Background and motivation . . . . . . . . . . . . . . . . . . . . . . . . . . . . . . . . 11.2 Objectives . . . . . . . . . . . . . . . . . . . . . . . . . . . . . . . . . . . . . . . . . . 1
1.2.1 Research Objectives . . . . . . . . . . . . . . . . . . . . . . . . . . . . . . . . 11.3 Tasks . . . . . . . . . . . . . . . . . . . . . . . . . . . . . . . . . . . . . . . . . . . . . 21.4 Project Scope and Report Structure . . . . . . . . . . . . . . . . . . . . . . . . . . . . 2
1.4.1 Actions Performed to Ensure Reliability . . . . . . . . . . . . . . . . . . . . . . 21.4.2 Literature Studies . . . . . . . . . . . . . . . . . . . . . . . . . . . . . . . . . . 21.4.3 Concepts . . . . . . . . . . . . . . . . . . . . . . . . . . . . . . . . . . . . . . 21.4.4 Conclusion and future work . . . . . . . . . . . . . . . . . . . . . . . . . . . . 2
2 Literature Studies . . . . . . . . . . . . . . . . . . . . . . . . . . . . . . . . . . . . . . . . 32.1 Developed methods . . . . . . . . . . . . . . . . . . . . . . . . . . . . . . . . . . . . . 3
2.1.1 Physical guidelines . . . . . . . . . . . . . . . . . . . . . . . . . . . . . . . . . 42.1.2 Beacons . . . . . . . . . . . . . . . . . . . . . . . . . . . . . . . . . . . . . . . 52.1.3 Natural Feature Navigation . . . . . . . . . . . . . . . . . . . . . . . . . . . . 62.1.4 Discussion . . . . . . . . . . . . . . . . . . . . . . . . . . . . . . . . . . . . . . 6
2.2 Mapping . . . . . . . . . . . . . . . . . . . . . . . . . . . . . . . . . . . . . . . . . . . 82.2.1 SLAM . . . . . . . . . . . . . . . . . . . . . . . . . . . . . . . . . . . . . . . . 92.2.2 Occupancy Grid Mapping . . . . . . . . . . . . . . . . . . . . . . . . . . . . . 102.2.3 Mapping technology . . . . . . . . . . . . . . . . . . . . . . . . . . . . . . . . 112.2.4 Structured light . . . . . . . . . . . . . . . . . . . . . . . . . . . . . . . . . . . 132.2.5 Discussion . . . . . . . . . . . . . . . . . . . . . . . . . . . . . . . . . . . . . . 14
2.3 Localization and navigation . . . . . . . . . . . . . . . . . . . . . . . . . . . . . . . . 162.3.1 Bluetooth 5.1 . . . . . . . . . . . . . . . . . . . . . . . . . . . . . . . . . . . . 162.3.2 Artificial landmarks . . . . . . . . . . . . . . . . . . . . . . . . . . . . . . . . 172.3.3 5G . . . . . . . . . . . . . . . . . . . . . . . . . . . . . . . . . . . . . . . . . . 182.3.4 Discussion . . . . . . . . . . . . . . . . . . . . . . . . . . . . . . . . . . . . . . 18
2.4 Obstacle detection . . . . . . . . . . . . . . . . . . . . . . . . . . . . . . . . . . . . . 19
iii

Low-cost navigation and collision avoidance system
2.4.1 Ultrasonic sensor . . . . . . . . . . . . . . . . . . . . . . . . . . . . . . . . . . 192.4.2 Infrared distance sensors . . . . . . . . . . . . . . . . . . . . . . . . . . . . . . 212.4.3 Discussion . . . . . . . . . . . . . . . . . . . . . . . . . . . . . . . . . . . . . . 21
2.5 Low-cost computers and interfacing . . . . . . . . . . . . . . . . . . . . . . . . . . . . 233 Concepts . . . . . . . . . . . . . . . . . . . . . . . . . . . . . . . . . . . . . . . . . . . . . 25
3.0.1 Low-cost computer . . . . . . . . . . . . . . . . . . . . . . . . . . . . . . . . . 253.0.2 Mapping localization and navigation . . . . . . . . . . . . . . . . . . . . . . . 263.0.3 Obstacle detection . . . . . . . . . . . . . . . . . . . . . . . . . . . . . . . . . 273.0.4 Suggested prototype . . . . . . . . . . . . . . . . . . . . . . . . . . . . . . . . 28
4 Conclusion and future work . . . . . . . . . . . . . . . . . . . . . . . . . . . . . . . . . . 30Bibliography . . . . . . . . . . . . . . . . . . . . . . . . . . . . . . . . . . . . . . . . . . . . . 31
iv

Low-cost navigation and collision avoidance system
List of Figures
1 AGV following a path with the active inductive guidance method [1] . . . . . . . . . 42 AGV following the path with the use of a optical sensor [2]. . . . . . . . . . . . . . . 43 Determining position of AGV with beacons. [3] . . . . . . . . . . . . . . . . . . . . . 54 Blue line depicting the path of the robot before loop-closure, red line depicting the
path after loop-closure [4]. . . . . . . . . . . . . . . . . . . . . . . . . . . . . . . . . 95 Illustration of a robot updating the occupancy grid map using sensor data . . . . . . 106 Illustration of the logarithmic updating process . . . . . . . . . . . . . . . . . . . . . 107 Epipolar views [5] . . . . . . . . . . . . . . . . . . . . . . . . . . . . . . . . . . . . . 128 Illustration of structural light [6] . . . . . . . . . . . . . . . . . . . . . . . . . . . . . 139 Illustration of the bluetooth 5.1 AoA and AoD method [7] . . . . . . . . . . . . . . . 1610 Illustration of the AGV localization using artificial landmarks [8]. . . . . . . . . . . . 1711 Ultrasonic distance sensor failing to detect sound absorbing, and flat angled surface
[9] . . . . . . . . . . . . . . . . . . . . . . . . . . . . . . . . . . . . . . . . . . . . . . 2012 Illustration of a infrared distance sensor . . . . . . . . . . . . . . . . . . . . . . . . . 2113 Left: twelve sectors corresponding to the twelve ultrasonic sensors. Right: eight sec-
tors corresponding to the eight infrared sensors [10]. . . . . . . . . . . . . . . . . . 2214 Illustration of the sensors detection range around the AGV. . . . . . . . . . . . . . . . 2715 Hardware architecture of proposed system. . . . . . . . . . . . . . . . . . . . . . . . 28
v

Low-cost navigation and collision avoidance system
List of Tables
1 Advantages and disadvantages of described methods . . . . . . . . . . . . . . . . . . 72 Advantages and disadvantages of SLAM and occupancy grid mapping. . . . . . . . . 113 Comparison of the specifications of three depth sensors. . . . . . . . . . . . . . . . . 15
vi

Low-cost navigation and collision avoidance system
Abbreviations
AGV = Autonomous Ground VehicleSLAM = Simultaneous Localization And MappingSBC = Single Board ComputerBLE = Bluetooth Low EnergyIMU = Inertial Measurement UnitAoA = Angle of ArrivalAoD = Angle of DepartureI2C = Inter-Intergrated-CircuitSCL = Serial ClockSDA = Serial DataSPI = Serial Peripheral InterfaceSCLK = Serial ClockMOSI = Master Output Slave InputMISO = Master Input Slave OutputSS = Slave Select
vii

Low-cost navigation and collision avoidance system
1 Introduction
1.1 Background and motivation
We develop robots to streamline production and to reduce the amount of manual labor. Robotic ma-nipulators are examples of robots developed to perform tasks previously done by hand. Autonomousground vehicles(AGV) are an example of robots developed to move objects from one place to an-other, or to carry out tasks such as cleaning and lawn mowing. In relation to industry AGVs areoften used as a replacement for the traditional conveyor belt, as they can offer more flexibility andbe convenient in the context of batch production.
The older AVGs follow pre-determined paths in the form of some sort of physical guiding line.This is a limiting factor when it comes to flexibility. In order for these robots to operate efficiently inan environment with other agents, everything has to be tailored around the AGV. As well as beinglimited by little to no understanding of the world around, these systems are expensive to install andexpand due to the need for integrated guiding systems.
In the later years the use of physical guidelines has been replaced by solutions that offer moreflexibility and freedom, allowing them to operate efficiently around both humans and other robots.For robots to be allowed to work in the same environment as humans there has to be reliable safetymeasurements to avoid accidents. This means that the AGVs has to be equipped with accuratesensor-systems and programming so they have a broad enough understanding of the environmentto adapt to their surroundings. These extra features makes the newer AGVs more complex, conse-quently more computational power is needed. These robots have been on the marked for a while,and they are being used all over the industry, but they are often expensive.
In the meantime, low-cost of the shelf computers with significant calculation power have becomea common product, it is therefore desirable to extend upon this to develop low-cost alternatives.
1.2 Objectives
The objective of this pre-study is to explore the possibilities for developing a low-cost navigationand collision avoidance system capable of working in dynamic environments around other flexibleagents on a low-cost computer. The objective is not to develop new camera or sensor technologyfrom scratch, but rather see what technology there are and how this can be used to develop a newsystem. Thus this is a feasibility study.
1.2.1 Research Objectives
• Conduct a survey of some of the existing systems.• How can navigation and collision avoidance-systems be tailored to low-cost, low-powered
1

Low-cost navigation and collision avoidance system
computers?• Develop concepts for low-cost system based on existing technology.
1.3 Tasks
To achieve the research objectives the following task will be studied and presented in this thesis.
• A description of some commonly used existing systems.• A literature study regarding standards and regulations• A literature study regarding collision avoidance.• A literature study regarding localization and navigation.• A discussion of the advantages and disadvantages of different low-cost computers.• Concept generation based on the finding gathered throughout the thesis.
1.4 Project Scope and Report Structure
1.4.1 Actions Performed to Ensure Reliability
To ensure that the information used in the making of this thesis is reliable, the literature should befrom a collection of peer reviewed academic articles, established companies or from conversationswith experts in the respected field. In addition, by having a close collaboration with the supervisorall information is shared and reviewed together.
1.4.2 Literature Studies
In chapter 2 the findings from the literature study is presented. The literature study covers a widearea, and was conducted at an early stage of the project to gain a grasp of the most importanttheory before conducting deeper research.
1.4.3 Concepts
In this chapter a suggested concept developed with the main objective of the thesis in mind, ispresented. The concept is based on the findings from the conducted studies, and should makeup a complete system consisting of solutions for mapping, navigation, localization and obstacleavoidance.
1.4.4 Conclusion and future work
Chapter 4 concludes the thesis and gives recommendations for future work.
2

Low-cost navigation and collision avoidance system
2 Literature Studies
This chapter gives an overview over some of the existing methods used in the control of autonomousground vehicles(AGVs). Further, some of the different aspects of safely controlling a AGV in dynamicenvironments is discussed, which includes mapping, navigation and obstacle avoidance. Some ofthe different sensors and software solutions which is often used to carry out these tasks are de-scribed and evaluated in relation to the main objective of this thesis. That is to research and deter-mine if it is feasible to develop a low-cost navigation and obstacle avoidance system on a low-costoff the shelf computer. Consequently, the evaluation of different low-cost Single Board Comput-ers(SBCs) is given it own section at the end of this chapter.
2.1 Developed methods
There are many applications for automatic guided vehicles(AGVs), varying from handling of haz-ardous material, to automatic vacuum cleaners and lawn mowers. Trough the years as technologyhas advanced, AGVs has advanced as well. This has resulted in more flexible solutions, which is oneof the main reasons why AGVs are so prevalent today. This flexibility is also what allows AGVs towork in dynamic environments around other agents, including humans. This increase in freedommakes safety a top priority. To ensure that no harm is done to people or objects, it is recommended tofollow several safety regulations. In Europe the standard «EN 1525, Driverless industrial trucks andtheir systems» is used as a standard for driverless indoor vehicles. In the book «Automated GuidedVehicle Systems» the author summarizes some of the regulations directly applicable to AGVs, themost relevant in relations to this projects is the following:
• «The personnel protection system is essential. It has to ensure that people or objects locatedon the drive path or on the envelope curve of the AGV together with its payload are reliablyrecognized. Should this occur, the vehicle has to safely come to a stop before persons or objectsare injured or damaged. Mechanical systems react to contact and are designed, e.g., as plasticbales or soft foam bumpers. Contact-free sensors scan the endangered areas ahead of thevehicle using laser, radar, infrared or ultrasound, or a combination of several technologies.»[11].
In short this means that the AGV should have a system for obstacle avoidance.
Dependent on the complexity of the task there are developed different methods for the au-tonomous control of AGVs. A common way for AGVs to navigate is trough the use of guided naviga-tion. This is carried out by retrofitting the workplace with the tools needed for the AGV to navigatethe environment. In an industrial environment this is often solved by the use of physical guide-lines or beacons. Other developed systems are not dependent on retrofitting of the workplace, and
3

Low-cost navigation and collision avoidance system
allows the AGV to navigate freely on its own. This comes at the cost of complexity, so the robotitself must be able to handle a larger amount of data, and perform complex data handling. This isa result of the AGV having to recognize its environment, as well as other agents operating withinthat environment. This section serves as a introduction to some of the most common methods re-lated to the automatic control of AGVs. The methods are described along with their advantages anddisadvantages, and they are compared to eachother with the main objective of this thesis in mind.
2.1.1 Physical guidelines
One of the simplest methods developed for the autonomous control of AGVs is the use of pre-determined paths that guide the vehicle. This is often solved either by a optical guidance track,made from a color that clearly contrast the floor or a inductive guidance track integrated in thefloor itself. Since a strip of coloured tape or paint on the floor is very exposed and easily damaged,the inductive guidance track is more often used in industrial environments.
Figure 1: AGV following a path with the activeinductive guidance method [1]
Figure 2: AGV following the path with the use ofa optical sensor [2].
With active inductive guidance tracks, the wires embedded in the floor carries a signal with a lowAC-voltage and frequency. Two coils are mounted under the vehicle at right angles to the conductorin which the alternating current of the guide wire induces a flowing current [11]. This allows theAGV to navigate its position according to the positing of the wire. With optical sensor technologythe AGV aims to keep the colored line in the center of view, changing its position according to thedisplacement of the colored line.
There are several ways of guiding the vehicle along a track, but the principle is the same - adjustthe pose of the AGV in order to counter the displacement of the guidance track. Since the AGV isonly capable of following the path of the track, this method offers little flexibility. As a result thereis not much complexity associated with this method. This comes from the fact that the AGV hasno use for intelligence or an advanced sensor-system, since the only action besides following thepre-determined path is to stop if something is in its direct path. Besides the lack of flexibility thismethod comes with another downside. That is the time consuming and costly retrofitting of theworkspace that is needed to install such a system, as the guidance tracks must be installed before
4

Low-cost navigation and collision avoidance system
the AGV can function properly. As a result of this it is just as time consuming to make changes tothe system once it is installed, which makes expansion of the system difficult.
Another use of physical guidelines is to use them as barriers which the AGV is not allowedto cross. Automatic lawn mowers are free to move inside an marked area, and as soon as theyencounter the barrier they will turn around. In the terms of industry this can be used as a extrasafety precaution making sure the AGV does not enter a area it is not allowed to enter.
2.1.2 Beacons
The next step from AGVs dependent on physical guidelines are AGVs that uses beacons placedaround the working environment. The angle and distance to the beacons is calculated and used tocalculate the position of the AGV trough triangulation. Since there is no physical guideline tellingthe AGV where to move, a map of the environment is optimal along with a system for determiningpaths telling the AGV where to move.
The calculated position of the AGV is then compared to the reference position given by thecalculated path and the control system adjust the AGV according to the path. Figure 3 shows howbeacons can be used in practice.
Figure 3: Determining position of AGV with beacons. [3]
This is simply a method for determining the position of the AVG. If the vehicle comes with aintegrated map and a collision avoidance system this would allow for more flexible navigation.The positioning of the vehicle along with a map would allow the AGV to know its position inrelation to the surrounding objects, which makes it possible for path planning around the workingenvironment. Together with a collision avoidance system ensuring that the vehicle does not collidewith other agents or obstacles this method offers more flexibility. This new layer of flexibility isa huge improvement from the previously described method. Rerouting of the AGVs paths wouldbe much easier, since no changes would have to be done to the workspace itself. This makes it
5

Low-cost navigation and collision avoidance system
possible for the AGV to work in a dynamically changing environment, and with a collision avoidancesystem, around other flexible agents including people. The workplace still has to be retrofitted tothe AGV, as beacons would have to be installed. Still the retrofitting is not as an extensive as with asystem based on physical guidelines. As a result expansion of the system is easier. This comes at thecost for a more complicated sensor-system and the data handling that comes with the navigationand collision avoidance system makes this solution more complex, consequently a more powerfulcomputer is needed.
2.1.3 Natural Feature Navigation
Natural feature navigation allows the AGV to navigate the environment without any retrofitting ofthe workplace. Instead the AGV rely on natural landmarks in addition to odometry to keep trackof its positioning. Odometry is the use of data from the motion sensors on the AGV to calculatethe change in position over time. This makes for a highly flexible system that is easy to install andexpand, but this comes at the cost of complexity. As it is no easy task to navigate with only the useof natural features. Usually expensive lidars or stereo cameras is needed in order to recognize thenatural landmarks as well as a powerful computer to handle all the sensor data.
2.1.4 Discussion
In table 2.1.4 I have tried to systematize the advantages and disadvantages of the differentmethods described. This is done with the main objective of the thesis in mind.
6
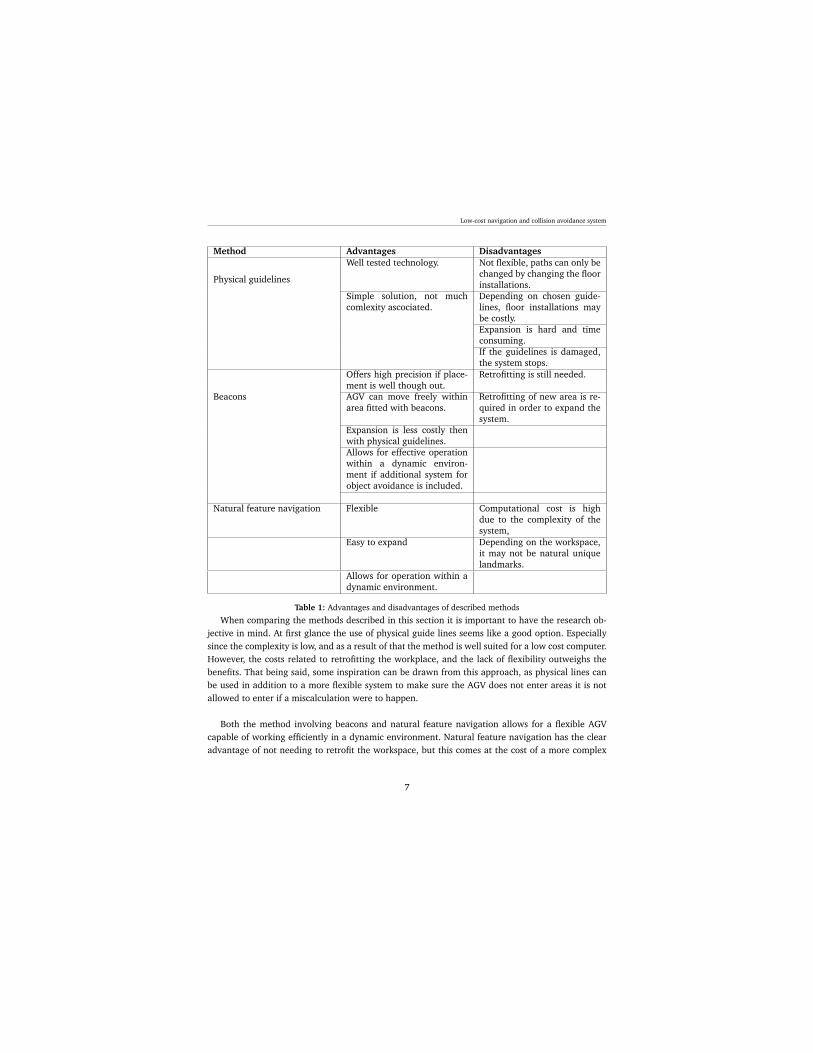
Low-cost navigation and collision avoidance system
Method Advantages Disadvantages
Physical guidelines
Well tested technology. Not flexible, paths can only bechanged by changing the floorinstallations.
Simple solution, not muchcomlexity ascociated.
Depending on chosen guide-lines, floor installations maybe costly.Expansion is hard and timeconsuming.If the guidelines is damaged,the system stops.
Beacons
Offers high precision if place-ment is well though out.
Retrofitting is still needed.
AGV can move freely withinarea fitted with beacons.
Retrofitting of new area is re-quired in order to expand thesystem.
Expansion is less costly thenwith physical guidelines.Allows for effective operationwithin a dynamic environ-ment if additional system forobject avoidance is included.
Natural feature navigation Flexible Computational cost is highdue to the complexity of thesystem,
Easy to expand Depending on the workspace,it may not be natural uniquelandmarks.
Allows for operation within adynamic environment.
Table 1: Advantages and disadvantages of described methods
When comparing the methods described in this section it is important to have the research ob-jective in mind. At first glance the use of physical guide lines seems like a good option. Especiallysince the complexity is low, and as a result of that the method is well suited for a low cost computer.However, the costs related to retrofitting the workplace, and the lack of flexibility outweighs thebenefits. That being said, some inspiration can be drawn from this approach, as physical lines canbe used in addition to a more flexible system to make sure the AGV does not enter areas it is notallowed to enter if a miscalculation were to happen.
Both the method involving beacons and natural feature navigation allows for a flexible AGVcapable of working efficiently in a dynamic environment. Natural feature navigation has the clearadvantage of not needing to retrofit the workspace, but this comes at the cost of a more complex
7
Low-cost navigation and collision avoidance system
problems to solve. As a result of this it may be hard to implement on a low cost computer.
With this in mind the rest of the thesis focuses on the more flexible options, which is naturalfeature navigation, and methods involving beacons. While solutions relying on guidance lines willbe disregarded, since the retrofitting that comes with these methods are costly, and they do notmeet the criteria for flexibility needed.
2.2 Mapping
For a AGV to work in a dynamic environment, perform tasks and to efficiently move from one placeto another, it should have some memory of the environment it is working within. If not, the AGVwill not have any way to localize its position within the environment, and therefore not have theability to plan routes from one point to another in the workspace. Consequently the AGV shouldhave an internal representation of the environment, and a way to localize itself within the map.The point of the map is to allow the AGV to keep track of its own position in relation to the otherobstacles in the workplace, allowing it to plan around these. For that reason the map should containall the stationary installation in the real world. Working environments is often undergoing changes,which sometimes means new installations is installed, therefore the AGV should be able to updatethe internal map.
Many buildings these days have three-dimensional building plans available, or at least two-dimensional floor plans. These drawings contain information that can be used to create a maprepresentation of the environment for the AGV. The problem is that they do not always containevery stationary item, as they are not necessarily updated every time a new installation is installed.Even so, they can and should be used to create the map representation, as they do contain preciseinformation about the dimensions. That being said, it is desirable to compliment this with a auto-matic mapping-method to keep the map up to date at all times.
In robotics mapping and localization goes hand in hand. In order for the map to be useful therobot should have some method of determining its position within the map. In robotic-mappingthere is different ways of obtaining maps of the environment, the complexity of these methodshighly depends on the method used to keep track of the position of the AGV. In this section someof these methods is described and compared based on advantages and disadvantages in relation tothe main objective of this thesis.
8
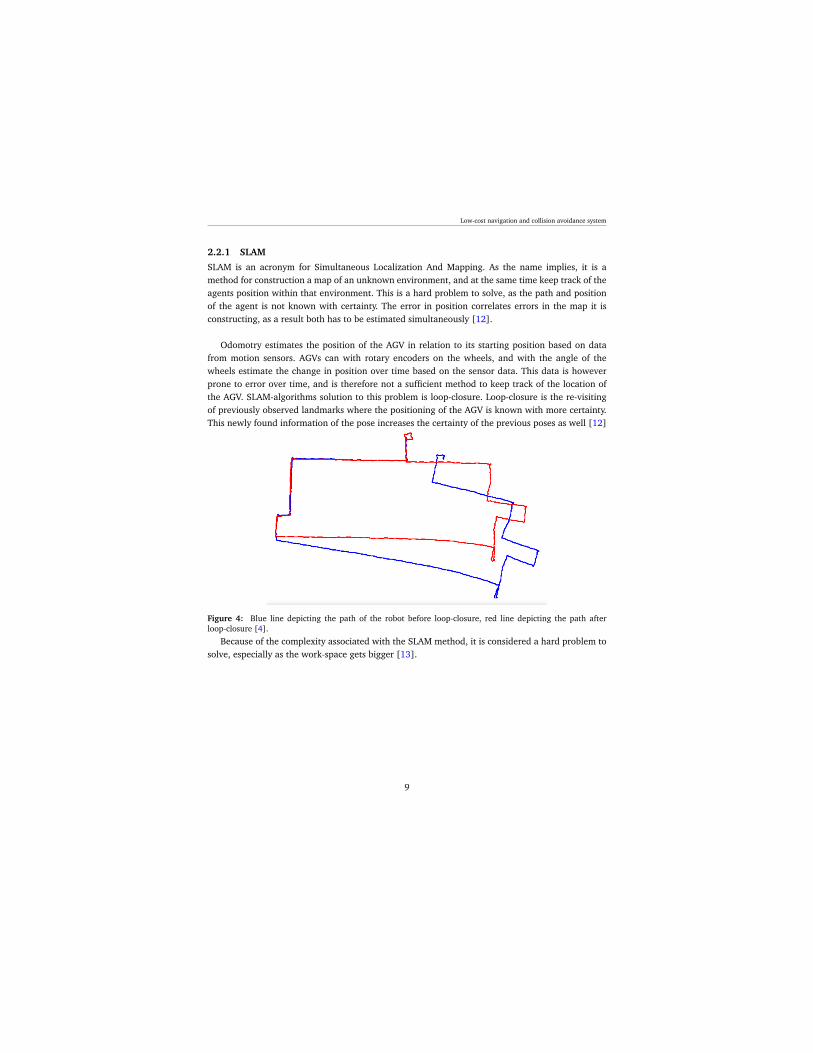
Low-cost navigation and collision avoidance system
2.2.1 SLAM
SLAM is an acronym for Simultaneous Localization And Mapping. As the name implies, it is amethod for construction a map of an unknown environment, and at the same time keep track of theagents position within that environment. This is a hard problem to solve, as the path and positionof the agent is not known with certainty. The error in position correlates errors in the map it isconstructing, as a result both has to be estimated simultaneously [12].
Odomotry estimates the position of the AGV in relation to its starting position based on datafrom motion sensors. AGVs can with rotary encoders on the wheels, and with the angle of thewheels estimate the change in position over time based on the sensor data. This data is howeverprone to error over time, and is therefore not a sufficient method to keep track of the location ofthe AGV. SLAM-algorithms solution to this problem is loop-closure. Loop-closure is the re-visitingof previously observed landmarks where the positioning of the AGV is known with more certainty.This newly found information of the pose increases the certainty of the previous poses as well [12]
Figure 4: Blue line depicting the path of the robot before loop-closure, red line depicting the path afterloop-closure [4].
Because of the complexity associated with the SLAM method, it is considered a hard problem tosolve, especially as the work-space gets bigger [13].
9

Low-cost navigation and collision avoidance system
2.2.2 Occupancy Grid Mapping
Occupancy grid mapping is a term representing a family of robotic algorithms that aim to generatemaps from sensor data assuming the pose of the robot is known. This is the key difference betweenthis method and the SLAM approach. The robot measures the distance to surrounding objects usingits sensors, the measurements is then translated from the robot frame to the global frame where itis used to generate the occupancy grid map.
Figure 5: Illustration of a robot updating the oc-cupancy grid map using sensor data
A occupancy grid map is a array of occu-pancy variables. Each cell in the occupancygrid map is associated with one occupancyvariable. This is a binary random variablewith either value 1 or 0, representing a oc-cupied or empty cell. If a cell is occupiedthis means that it is an obstacle in the cor-responding position in the real world.Building a occupancy grid map is based onprobabilistic calculations for each cell. Fromthese calculations a map containing eitherfree or occupied cells is constructed.
When generating the occupancy grid map every observed cell is given a value describing theprobability of that cell being either occupied or free. As these cells are observed again and againtrough overlapping measurements, the value they hold is updated with a update rule. This meansthat if a cell is measured to have the same state over and over, the probability of that cell havingthat exact state increases. This is illustrated in 6. The lighter the color is, the more probable it isthat the cell is free, the darker the color is, the more probable the cell is occupied.
Figure 6: Illustration of the logarithmic updating process
10

Low-cost navigation and collision avoidance system
The accuracy of this method is highly dependent on to which degree the position of the vehiclecan be calculated accurately. Since the problem of mapping the position of other objects in relationto the position of the AGV alone is a straight forward problem to solve in comparison to having tocalculate the position of the AGV at the same time [12], this method is a viable option. As a resultit can be assumed to be easier to implement on a low-cost computer.
Discussion
In table 2 I have tried to systematize the most important characteristics of both SLAM and occu-pancy grid mapping. This is done in order to compare the two methods, with the main objective ofthis thesis in mind.
Method Advantages Disadvantages
SLAMNo retrofitting needed Complex algorithm, the com-
putational cost is highHigh flexibility Complexity increases with
larger areasEasy to update map
Occupancy grid mapping Easy to update map withinworking area
Complementary method forpositioning is needed
Since the pose is assumed tobe known, the complexity de-creases
Cannot expand map withoutexpanding the chosen methodfor positioning
Table 2: Advantages and disadvantages of SLAM and occupancy grid mapping.
Both SLAM and occupancy grid mapping is suitable for this project, as both would allow forautomatically updating the map. The SLAM approach has a clear advantage in that no additionalretrofitting of the workplace is needed. Thus, reducing the costs as well as installation time. Thedrawback with SLAM is the computational cost associated with the method, and the fact that it getsincreasingly larger the bigger the scenario gets [13]. Consequently it may be infeasible to developa low cost navigation and collision avoidance system capable of preforming well in large industrialenvironments based on SLAM.
2.2.3 Mapping technology
The map should represent the workspace with high accuracy. A accurate map representation ofthe environment is obtained trough smart software solutions and accurate sensor measurements.Consequently reliable sensors for distance measurements is needed. This subsection presents somerelevant sensor technology and hardware solutions commonly used in mapping applications.
Stereo-vision technology
In order to map the environment, depth perception is needed, as we want to know the distancebetween the AGV and its surroundings. A commonly used method for obtaining depth perceptionis stereo-vision. Stereo-vision emulates the most common visual system we find in nature, whichis a set of two eyes. By receiving information about a scene from two cameras fixed in relation to
11

Low-cost navigation and collision avoidance system
another, one can extract depth information. This is done by correlating points in the two differentimages, then calculating the depth with triangulation. The problem is to find correlating pixelsin the two images, as searching trough the whole two-dimensional image plane in order to findmatching pixels is very time consuming. Instead, since the pose of the two cameras is known, weuse epipolar geometry. This narrows the search for correlating pixels down from a two-dimensionalarray containing all the pixels to a one-dimensional array only containing the pixels along a distinctline in the image plane. This line is called the epipolar line.
Figure 7: Epipolar views [5]
Figure 7 illustrates how one point, denoted by X can be anywhere on the line OL −X from theview of the left camera. Since it is only seen as a distinct point denoted by XL in a two-dimensionalimage plane. From the view of the right camera, OL − X is seen as a line and projected into theright image plane as the line eR−XR, which is the epipolar line. After searching trough the epipolarline for a matching pixel, we have a known triangle from which the depth can be calculated.
Lidar technology
LiDAR is a acronym for Light Imaging And Ranging. Lidar technology uses light pulses to illumi-nate its surroundings, and it measures the reflected light. There are two methods used to calculatedistance to the surrounding objects. It is either calculated based on time of flight or by laser trian-
12

Low-cost navigation and collision avoidance system
gulation. With time of flight the distance is calculated with 2.1.
D =t ∗ c2
(2.1)
Where D denotes the distance to the object, t is the travel time and c is the speed of light. Thisis divided by two to give the distance between the objects. With laser triangulation the distance iscalculated by the angle of the reflected beam, which will vary based on the distance to the reflectingobject.
The typical lidars used in robotics are spinning lidars, giving them a 360 degree viewing angle.Because the speed of light is so fast the frequency of the light pulses can be very high, resultingin a high resolution map of the environment. For robotic-mapping purposes there is two differentoptions available, either a two-dimensional lidar, or a three-dimensional lidar. A 2D-lidar sends outlight beams only in the horizontal plane, while the 3D-lidar also send light beams in the verticalaxis, resulting in a 3D scan of its surroundings. Depending on the chosen lidar this can eiter be usedto create a two-dimensional map or a three-dimensional map.
2.2.4 Structured light
Structured light 3D scanning is a method where a known pattern is projected on to a scene. Thelight source often operates outside of the visual spectrum so that it does not interfere with regularvision technologies. The structure of the pattern is known by the sensor, and the depth is calculatedbased on the distortion of the projected pattern.
Figure 8: Illustration of structural light [6]
13

Low-cost navigation and collision avoidance system
Microsoft kinect
Microsoft Kinect was originally developed as a gaming accessory for the Xbox-console. While it didnot gain much traction within the gaming community it became popular among developers, dueto the low-cost advanced sensors. The first version of kinect uses structured infrared light in orderto perceive depth. It also includes a regular RGB color camera. The Kinect V2 uses a time-of-flightinfrared depth camera in order to perceive depth, this functions much like a lidar sending out in-frared light and calculating the distance based on the travel time. The kinect V2 also comes with aimproved RGB camera.
Since the kinect sensors did not gain the anticipated traction in the gaming community, theyhave been taken out of production. Instead Microsoft developed the Azure Kinect DK, with artificialintelligence applications in mind, which was released in 2019. Azure Kinect DK consist of a timeof flight depth sensor, seven microphones, twelve megapixel RGB camera and a integrated inertialmeasurement unit. It can measure distances up to 5.46 meters with high accuracy and with theinertial measurement unit it can determine its pose in three dimensional space. The current pricefor a Azure Kinect DK depth sensor is 399$.
Intel RealSense
The Intel Realsense 435i consist of a active infrared stereo-camera, a high resolution RGB camera,a integrated inertial measurement unit and an on-board vision processor. With the active infraredstereo-camera the sensor combines regular stereo-vision with the information it gets from the pro-jected infrared pattern. The Intel Realsense can do image processing on-board, due to the integratedvision processor. The range for depth sensing is up to ten meters. Along with their product Intel hasopen source solution for different mapping algorithms. The price of a Intel RealSense 435i is 199$.
RPLIDAR A2M8 360 degree Laser Scanner
This is a 360 degree two-dimensional laser scanner. It measured distances based on laser triangu-lation and has a operating range between 0.15 - 12 meters with a accuracy of 1%. The laser outputpower meets the standard of FDA Class 1, which states "Considered non-hazardous. Hazard in-creases if viewed with optical aids, including magnifiers, binoculars, or telescopes." [14]. The priceis 319$.
2.2.5 Discussion
Three different depth sensors has been presented, and the related technology explained. The lidarsensor has the advantage of 360 degree view, compared to the limited view of the vision basessensors. The lidar however lacks the ability to perceive visual cues from the environment. This issomething that should be taken into consideration as having a vision system can be used for otherpurposes besides mapping, as a result of the additional information it can perceive. An example ofthis is to include the end-location of a package waiting to be moved by the AGV on the package.Another downside with the presented lidar is that it is limited to two-dimensions. As mentionedearlier 3D-lidars exist, but they are not within a reasonable price range for this project.
14

Low-cost navigation and collision avoidance system
Table 3 presents a comparison between three different depth sensors, based on the operatingrange, the included sensors and the cost of the sensor.
Depth-sensor Operating range Included sensors PriceRPLIDAR A2M8 0.15 meter - 12 meter Laser triangulation
sensor319$
Microsoft AzureKinect
0.5 meter - 5.46 me-ter
Time of flight depthsensor, inertial mea-surement unit, RGBcamera, microphonegrid
399$
Intel RealSenseD4351
2 meter - 10 meter Active infraredstereo-camera, in-ertial measurementunit, RGB camera, D4vision processor
199$
Table 3: Comparison of the specifications of three depth sensors.
As seen from table 3 the Intel RealSense D430i has the longest operating range of the twovision based sensor, it is also cheaper then the Azure Kinect DK which is the Kinect sensor that iscurrently being produced. Additionally it comes with a inertial measurement unit and a on-boardvision processor. This gives it the ability to off-load the computer as it can perform vision processingon-board. Having in mind the open-source resources made available from Intel in relation to roboticmapping, this is a good alternative for this project.
15

Low-cost navigation and collision avoidance system
2.3 Localization and navigation
As stated in 2.2, localisation and mapping goes hand in hand. We previously explored the conceptof simultaneous localization and mapping, which is a method to generate maps while at the sametime keep track of the AGVs position within that map 2.2.1. Another method we explored wasoccupancy grid mapping, which assumes that the pose of the AGV is known 2.2.2. If occupancygrid mapping is to be effective the AGV must have an additional method for determining the posewith high accuracy. Odometry is a useful method in calculating the pose of a AGV, but the methodis prone to error over time. This is a result of wear and tear of the wheels, and wheel slippage. Asa result it should be accompanied by another localization method which is not dependent on thedynamics of the AGV. Some of the most prevalent methods use beacons as a way to triangulate theposition of the AGV in the environment. This method for positioning is described in 2.1.2. In thissection some of the hardware solutions for localization utilizing beacons is evaluated.
2.3.1 Bluetooth 5.1
Bluetooth technology has been around for a long time and it is integrated in nearly all mobiledevices. The most commonly known use of bluetooth technology is communication between devicesfor sending and receiving data, but it has also had the ability to see if specific devices is withinproximity of another bluetooth device. Bluetooth 4.0 introduced Bluetooth Low Energy(BLE), whichis less costly and has a lower power consumption than its predecessors. Additionally they releasedBLE-beacons, which in turn opened up the opportunity to use bluetooth for indoor localizationapplications. Like other methods using beacons they rely on triangulation to estimate the positionof a device, this means the device must be within the range of three or more bluetooth beaconsin order for its position to be calculated. Each beacon comes with a range of approximately 70meters, and the accuracy is within a couple of meters. The distance to each beacon is calculated bythe strength of the signal. With bluetooth 5.1 two new concepts where introduced to the bluetoothtechnology, Angle of Arrival(AoA) and Angle of Departure(AoD).
Figure 9: Illustration of the bluetooth 5.1 AoA and AoD method [7]
16

Low-cost navigation and collision avoidance system
AoA and AoD introduced direction finding between two devices. This works by having multipleantennas in either the transmitting end, or the receiving end of the signal. Bluetooth 5.1 promisesaccuracy within centimeters in ideal conditions, and within a meter under normal circumstances.With the angle of departure and angle of arrival method the position of the AGV can be calculatedeven if it is within the range on only one beacon.
Bluetooth 5.1 offers high accuracy positioning with BLE-beacons. The technology has low powerconsumption and is a low-cost alternative. Additionally bluetooth technology is integrated in nearlyall mobile devices, which makes it highly available, as a result it is not likely to be replaced in recentyears. As a result of the availability, the low cost and the newly introduces technology it should beconsidered as a alternative for a positioning method.
2.3.2 Artificial landmarks
Beacons can also come in the form of artificial landmarks placed around the workspace. Each land-mark is given a individual design allowing the AGV to distinguish them from another with visiontechnology. The landmarks should stand out from its surroundings and be easy to identify for thevision system. A usual template for the landmarks is a binary black and white image.
A system using artificial landmarks will usually calculate it position over time using odometry.Since this method is prone to error over time, the calculations will be calibrated using the artificiallandmarks. Since the pose and the coordinates of the landmarks within the workspace is known tothe vision system on the AGV, the position of the AGV in relation to the landmark can be computedwith vision technology. One of the main advantages of this method is that it only requires a regularcamera, and the landmarks can be as simple as a black and white binary image on a paper, resultingin a low cost localization system.
Figure 10: Illustration of the AGV localization using artificial landmarks [8].
17

Low-cost navigation and collision avoidance system
2.3.3 5G
Finally 5G should be mentioned as an alternative as it is promised to play a huge part in the industryin the future. 5G is the new generation of mobile networks, which promises up to ten times higherspeeds than its predecessor 4G, and can handle a lot more traffic. It also promises high accuracyin relation to localization. As it is today, 5G is not a viable option for this project as it is not yetpublicly available, and may not be for a while.
2.3.4 Discussion
Both bluetooth 5.1 and artificial landmarks are viable options for indoor localization. Bluetooth 5.1promises high accuracy real time localization and is a relatively low cost alternative. In additionbluetooth it is a well known and integrated technology that is not likely to be replaced in the nearfuture. This makes bluetooth 5.1 a viable option for AGV localization.
The use of artificial landmarks and odometry is a low-cost way to do indoor localization. Themethod can be implemented on a regular camera, and costs in relation to the landmarks are lowdue to their simplicity. Earlier projects using this method has yielded results with high accuracywhen the AGV is within a certain distance of the landmark [15], though the accuracy is dependenton the camera resolution, the size of the landmark and the distance between the landmark and theAGV. If a stereo depth sensor is chosen for mapping purposes, a localization method using artificiallandmarks could be implemented on the same sensor, thus reducing costs. Based on this, the use ofartificial visual landmarks is a viable localization method for this project.
18

Low-cost navigation and collision avoidance system
2.4 Obstacle detection
With mapping and positioning the AGV has enough information to navigate a static environment.The problem occurs when other agents are introduced into that environment, and the AGV has towork alongside them. For the AGV to be able to perform safely and efficiently in a dynamic environ-ment, a protocol for object detection and avoidance is needed. As it is expected that the AGV willwork alongside humans it is crucial with a reliable system for object avoidance. This system shouldbe capable of detecting surfaces independent on the characteristics of the surface, as the propertiesof soft surfaces like clothing differs from hard surfaces. This means that the object avoidance systemlikely has to consist of different sensors working together. If the AGV has a system for automaticmapping, one could simply rely on the same sensor for object detection. Having in mind how crucialit is that the AGV can avoid accidents, a complementary system should be considered.
The most common way to avoid collision is to simply stop if an obstacle is to close to the vehicle,instead of planning a new route avoiding that obstacle. This is a simple, yet effective solution, asit is important for the people working there to be able to predict how the AGV will act in differentscenarios. That being said, this solution obstructs the workflow as the AGV has to come to a fullstop and wait for a clear path before it continuous with its task. Therefore a solution where theAGV could plan new routes according to the dynamically changing environment would be moreeffective. Independent on the solution for collision avoidance, the need for a sensor system ableto sense the AGVs surroundings is critical. Therefore this section focuses on some of the differentsensors technologies available within a reasonable price range.
2.4.1 Ultrasonic sensor
Ultrasonic sensors are a frequently used method for distance measurement and obstacle detection.Due to the low cost alternatives, they are used in both hobby projects and more extensive projectslike car parking systems. Ultrasonic distance sensors is best suited for close range applications, dueto the relatively slow speed of sound.
Ultrasound operates at frequencies greater then what humans can hear, soundwaves over 20kHzis considered ultrasonic. The sensors consist of a emitter and an receiver. The emitter emits a sound-wave while the receiver waits for the emitted waves to be reflected back, before calculating thedistance based on the elapsed time. The distance is given by 2.2.
D =t
2× c (2.2)
Where D denotes the distance from the sensor to the detected object, t denotes the elapsed timefrom emitting to receiving the waves, and c is the speed of sound. Since we only want to know thedistance between the sensor and the object, we have to divide the equation by 2. As the speed ofsound varies based on temperature and the material the waves propagate in, c must be adjustedbased on this. The speed of sound in air can be approximately calculated from 2.3, when treated as
19

Low-cost navigation and collision avoidance system
an ideal gas.
c =√k ∗R ∗ T (2.3)
Where:
• k = ratio of specific heat• R = gas constant• T = temperature in kelvin
The main advantages of ultrasonic sensors is that they are easy to use and relatively cheap,besides this they prevail in poor lightning conditions as this does not effect the measurements. Thisalso means that the color of the obstacle does not matters, as the sensor will be able to detect it aslong as it reflects sound.
There are several disadvantages with ultrasonic sensors. One of them is its inability to detectsound absorbing objects, since they will not reflect the emitted signal. Another problem is the factthat if the obstacle is at to great an angle relative to the sensor, the signal will not be reflectedback to the sensor. These two scenarios is illustrated in 11. The last drawback with the ultrasonicsensors is the variance in the speed of sound based on the temperature. If not accounted for, thiswill produce errors in the distance measurements as the distance is calculated based on the speedof sound.
Figure 11: Ultrasonic distance sensor failing to detect sound absorbing, and flat angled surface [9]
20

Low-cost navigation and collision avoidance system
2.4.2 Infrared distance sensors
Contrary to ultrasonic sensor infrared sensor are prone to noise from lightning conditions, but theyhave the advantage of being reflected by sound absorbing surfaces. In the same way as a ultrasonicdistance sensor, a infrared distance sensor consist of a emitter and a receiver, the difference beingthe beam of infrared light as opposed to the ultrasonic beam, and the way in which the distanceis measured. Infrared distance sensor calculates the distance from the sensor to the obstacle withtriangulation, based on the angle of the reflected beam. This is shown in 12.
Figure 12: Illustration of a infrared distance sensor
2.4.3 Discussion
Both ultrasonic distance sensors and infrared distance sensors are used to measure relatively shortdistances, often withing the range of a couple meters. They are relatively cheap, and is thereforea good alternative for a close range object detection system. As a result of the low-cost of a sensorin addition to the low computational burden of running the sensors, multiple sensors can be usedtogether.
As previously mentioned one could simply rely on the mapping sensor to perform object de-tection and avoidance. The problem with this is the limited range of view. With multiple low-costdistance measuring sensors it is possible to create a redundant grid around the AGV, capable of de-tecting objects from every angles. Previous work on the subject concludes that a obstacle detectiongrid should not rely on ultrasonic sensors alone, as they fail to detect soft surfaces such has clothes
21

Low-cost navigation and collision avoidance system
[16]. In the article «Obstacle Detection and Collision Avoidance for a UAV With ComplementaryLow-Cost Sensors» a obstacle avoidance system with basis in a redundant grid consisting of twelveultrasonic sensors and eight infrared sensors is developed, and proven able to avoid collision withobstacles such as walls and people [10]. The grid used is shown in 13.
Figure 13: Left: twelve sectors corresponding to the twelve ultrasonic sensors. Right: eight sectors corre-sponding to the eight infrared sensors [10].
Vision technology is another alternative for object detection and avoidance. Obstacle detectionusing stereo-vision has been shown to yield good results when implemented on a low-cost com-puter [17]. In contrast to ultrasonic and infrared distance sensors, stereo-vision has the ability toobtain visual information about the perceived scene and the obstacles within it. With further devel-opment of a low-cost obstacle detection system using stereo-vision, this information could be usedto perform obstacle recognizing and obstacle tracking.
22
Low-cost navigation and collision avoidance system
2.5 Low-cost computers and interfacing
The aim is to run the whole system on the Autonomous Ground Vehicle(AGV) itself, as a resultthe AGV should have an on-board computer with the necessary power to do so. Single Board Com-puters(SBCs) are complete computers built on a single circuit board. SBCs are small and compactwhich make them perfect for on-board computing on AGVs. There is a wide variety of availableSBC, some of the key factors we should consider in relation to this project is listed below.
• Cost of SBC.• Performance. It should have the necessary power to perform everything on-board.• Community support. An active community means there is a lot of resources available.
The most well known SBCs is the Raspberry Pi series. The first Raspberry Pi was realised in 2012,and they have developed new generations of SBCs since. Since the Raspberry Pi is so popular, ithas a huge and active community of developers contributing with new- and maintaining existingsoftware. However, it has not been the first choice for developers in relation to projects where highcomputational power is needed. Consequently it has not been regarded as the top choice for roboticmapping, which can be very computationally costly, especially SLAM. This is due to the fact thatother SBCs within a reasonable price range has offered more power and better performance. A al-ternative has been Odroid, who also has a active community behind it.
However, the Raspberry Pi 4 which was released in 2019 offers a lot better performance then itpredecessor and it is less costly then a SBC from Odroid. Along with the huge community behindRaspberry Pi, this makes it a good alternative for this project.
Interfacing
The SBC needs to send and receive information from the connected sensor and the actuators con-trolling the AGV. As a result it must have a protocol for interfacing with them. A common inter-facing protocol which allow multiple master devices to control multiple slave devices is the Inter-Integrated circuit(I2c) protocol. The protocol use two wires, a serial clock line(SCL) and a serialdata line(SDA). The SCL-line synchronizes the data transfer between the devices, while the SDA-line carries the actual data. It is a half-duplex bus, meaning communication can only flow in onedirection at a time. Each slave on the bus has its own unique address, meaning no additional linesis needed when a new device is added to the bus. This is a standard protocol for communicationbetween devices over short distances, and it is often included in low-cost sensors.
Another alternative is the Serial Peripheral Interface bus (SPI). SPI allows for communicationbetween a single master device and multiple slave devices, and compared to I2C the communicationis faster. This is due to the fact that it is a full-duplex bus, which allows for communication to andfrom the master simultaneously. The protocol generally uses four wires, Serial Clock(SCLK), MasterOutput Slave Input(MOSI), Master Input Slave Output(MISO) and Slave Select(SS), any additionaldevice needs its own wire.
23

Low-cost navigation and collision avoidance system
The I2C protocol is easier and cheaper to implement than the SPI protocol. Since no additionalwires is needed to connect multiple devices to the hub, it is better suited for systems where commu-nication between a large number of devices is needed and earlier systems have been successfullywith using the I2C protocol [10], despite the limited speed.. Making it a good fit for this project.
SBCs are great for computationally costly task, but not the best for real time controlling ofexternal hardware, and it is often the case that SBCs do not have the necessary input/output(I/O)ports to interface with a large number of external devices by itself. Therefore it is a good alternativeto have the SBC interface with a micro-controller that takes care of direct communication with thesensors and actuators. A popular low-cost micro-controller that is fit for this project is the Arduino.In such a system the Arduino will be in charge of direct control of the actuators, and collection ofdata from the external sensors. The Raspberry Pi will use the data gathered from the Arduino to dothe necessary calculations, and act as a master telling the Arduino the control sequences it shouldsend to the actuators.
24

Low-cost navigation and collision avoidance system
3 Concepts
In this section a concept for a navigation and collision avoidance system is presented along witha list of the necessary equipment. The concept is developed with basis in the content presented inthis thesis. The concept is made with the main objective of the thesis in mind, and should upholdthe following requirements.
• The whole system should be implemented on a low-cost single board computer(SBC).• The autonomous ground vehicle(AGV) should have the ability to automatically generate and
update a map of its surroundings.• The AGV should be able to accurately keep track of its position within the workspace.• The AGV should be able to detect suddenly appearing obstacles before collision occurs.
3.0.1 Low-cost computer
The suggested single board computer for this project is the Raspberry PI 4(RBP4). Partly due to theprice, the power of the computer and the community support for Raspberry PI. The RBP4 should beaccompanied by a micro-controller, in this case a Arduino. The Arduino will serve as a slave to theRBP4, communicating directly with the sensors. Additionally it will read from sensors connected tothe wheels of the AGV and directly control the actuators steering the AGV. Sending and receivinginformation to the RBP4 allows the RBP4 to perform odometry calculations for keeping track ofthe AGVs pose and use the information from the distance sensor in order to detect obstacles. TheRBP4 will use the received information together with the information from the vision depth sensorto decide the appropriate action for the AGV, the Arduino will carry out these actions based on thefeedback it gets.
The RBP4 is a generic SBC, meaning it is not specialized for a specific task and has a lot ofunnecessary extra equipment in relation to this project. This is not a problem when developingand testing a prototype, but a final product should use a barebone computer with no unnecessaryequipment, as this will reduce the cost of the system.
25
Low-cost navigation and collision avoidance system
3.0.2 Mapping localization and navigation
The AGV should have the ability to use prior available information, such as floor plans and threedimensional drawings of buildings to generate maps of the workspace. In addition it should havea method for automatic mapping, allowing it to generate the map from scratch and update the ex-isting map if needed. The two alternatives for automatic mapping is the simultaneous localizationand mapping approach(SLAM) and occupancy grid mapping. With SLAM the autonomous groundvehicle(AGV) has to generate a map of the environment while at the same time keep track of itsposition within that environment. With occupancy grid mapping the pose of the AGV is assumedknown, which means the AGV only has to generate a map based on its position, resulting in aless computationally costly mapping algorithm. Both of these methods serve the purpose of auto-matically generating and updating a map of the AGVs surroundings. The SLAM aproach has theadvantage that no additional method for localization is needed, but this comes at the cost of com-plexity. As a result it may prove to be to computationally costly to perform efficiently on a low-costcomputer in a large environment. Consequently both methods should be considered and tested.
Independent on which method is used for automatic mapping the sensor chosen for this conceptis the Intel RealSense 435i. The price for this sensor is relatively low, it is compatible with Rasp-berry PI 4, and Intel has open source libraries in relation to mapping, which can serve a resourcefor developing the software.
To perform occupancy grid mapping an additional method for localization is needed. Both blue-tooth 5.1 beacons and visual artificial landmarks serves this purpose. The advantage with visualartificial landmarks is that it only relies on a two dimensional camera and odomotry calculations toperform localization. This means that no additional hardware is needed, as it should be possible toimplement this on the Intel RealSense D435i which has a high quality RGB camera in addition tothe stereo depth sensor. As a result this is the first choice for localization. If it proves hard to per-form exact localization with this method, bluetooth 5.1 low energy(BLE) beacons is a alternativeas it allows for high accuracy real time positioning, it is easy to implement and the technology isrelatively low cost.
26

Low-cost navigation and collision avoidance system
3.0.3 Obstacle detection
The sensor used for mapping can also be used for obstacle detection. With the relatively long rangeof the Intel RealSense D435i it allows for long range obstacle detection in the direction the sensor isfacing. Obstacle detection using stereo-vision has previously yielded good results [17]. Since it hasthe ability to perceive visual information, this information can be used for recognition and trackingas well. Potentially allowing the AGV to plan according to its perceived environment instead of juststopping when faced with a obstacle.
Figure 14: Illustration of the sensors detectionrange around the AGV.
Since the viewing angle of the Intel Re-alSense D435i is limited an additionalsystem for obstacle detection is proposed.This is a short range object detection systemin the form of a grid around the AGV,consisting of multiple low-cost ultrasonicand infrared distance sensors. As explainedin 2.4 these sensors compliment eachother,thus giving the system the ability to detectobstacles independent of the surface charac-teristics. This enables the system to detectpeople and equipment.
This system has been proved to yield goodresult in its ability to detect obstacles in-dependent of the surface characteristics, incomparison to a system consisting of only ul-trasonic sensors which fail to detect soft sur-faces such as clothes [10].
The obstacle detection grid should consist of low-cost sensors. Alternatives for infrared and ul-trasonic sensors is the «GP2Y0A710K0F Sharp, Reflective infrared Sensor» and the «URM07 - UARTLow-Power Consumption Ultrasonic Sensor», both of which support I2C communication. The oper-ating angle of the ultrasonic sensor is 60 degrees, thus six sensor is enough to cover a 360 degreeviewing angle. Figure 14 illustrates the collision detection grid around the AGV and the range ofthe depth sensor.
27

Low-cost navigation and collision avoidance system
3.0.4 Suggested prototype
In this subsection a suggested prototype is described. It includes the hardware needed to realizethe system described earlier. Which is a system capable of mapping and positioning with SLAMand object detection with the same sensor in addition to a short range object detection grid. Thefollowing list contains the suggested hardware needed to realize the system, except for powersupply and wiring.
• Raspberry Pi 4 Model B• Arduino UNO• Intel RealSense 435i• GP2Y0A710K0F Sharp, Reflective Sensor x 8• URM07 - UART Low-Power Consumption Ultrasonic Sensor x 8
The Raspberry Pi 4 communicates with the Intel RealSense D435i via a USB connection. Com-munication between the Raspberry Pi 4 and the Arduino is via I2C, as well as the communicationbetween the Arduino and the ultrasonic and infrared distance sensors. The I2C protocol supportscommunication between multiple master and multiple slaves, allowing the Arduino to communi-cate with the array of ultrasonic and infrared sensors. The Arduino will also be in charge of steeringof the AGV, and reading from the odometry sensors.Figure 15 shows the hardware architecture of the proposed sensor system.
Figure 15: Hardware architecture of proposed system.
28

Low-cost navigation and collision avoidance system
The suggested system is based on a feasibility study and should not be regarded as final. Inorder to realize a fully functional prototype further testing is needed. As a result some alternativesare mentioned together with the description of the suggested system. Since it is unclear if it isfeasible to efficiently implement SLAM on a low-cost SBC, a method using occupancy grid mappingis suggested as an alternative. Additionally two methods for indoor localization is described. Indoorlocalization using visual artificial landmarks can be implemented without any hardware changesto the system, while indoor localization using bluetooth 5.1 beacons would need the necessarybluetooth equipment resulting in some additional costs.
29

Low-cost navigation and collision avoidance system
4 Conclusion and future work
This thesis presents an overview of some of the most relevant technologies in relation to the de-velopment of low-cost navigation and collision avoidance systems for autonomous ground vehi-cles(AGVs). In order to acquire the necessary flexibility to operate with efficiency in a dynamicwork environment, the AGV should have the possibility to move freely around the workspace. Thusa method for localization and navigation which allow this is needed. The two options presentedin this thesis is simultaneous localization and mapping(SLAM) and occupancy grid mapping. Thelatter being the best suited for a low-cost computer due to the computational cost of performingSLAM in large environments.
Safety is of huge importance in relation to AGVs. This comes as a result of the AGV being ableto efficiently work without damaging people, equipment or itself. Therefore a system for obstacledetection and avoidance is needed. It is important that this system is able to sense everything thatmay come into contact with the AGV. This means that the system should have the ability to senseobstacles independent of the characteristics of the obstacles surface. Such a system is presented,consisting of multiple infrared and ultrasonic distance sensors.
This thesis presents a feasibility study, and the presented concept is based on this. The presentedconcept should not be regarded as a finalized system, as further testing of the individual compo-nents is needed. Before developing a fully functional prototype the following tests should be carriedout.
• Testing of localization accuracy using SLAM and testing of localization accuracy using visualbeacons.
• Testing of both SLAM and occupancy grid mapping using visual beacons for mapping.• Testing of obstacle detection using stereo-vision.• Testing of the presented method for close range obstacle detection.
Based on the information gathered trough out this project, low-cost navigation and collisionavoidance systems seems to be possible to develop with the technology available today.
30

Low-cost navigation and collision avoidance system
Bibliography
[1] KG, G. 2019. Götting kg website. https://www.goetting-agv.com/components/inductive/introduction. Accessed: 2019-11-21.
[2] KG, G. 2019. Götting kg website. https://www.goetting-agv.com/components/optical/introduction. Accessed: 2019-11-21.
[3] Hellmann, D. 2019-09-17. Kinexon website. https://kinexon.com/solutions/agv-navigation. Accessed: 2019-11-21.
[4] Corso, N. & Zakhor, A. 2013. Loop closure transformation estimation and verification using 2d lidar scanners.
[5] Nordmann, A. 2007. Epipolar geometry.
[6] MoviMED. 2018. Movimed website. https://www.movimed.com/knowledgebase/what-is-structured-light-imaging/. Accessed: 2019-12-04.
[7] Laboratories, S. 2019. Silicon labs website. https://www.silabs.com/products/wireless/learning-center/bluetooth/bluetooth-direction-finding. Accessed: 2019-12-03.
[8] Dušan Nemec, Vojtech Šimák, A. J. M. H. E. B. 2018. Precise localization of the mobilewheeled robot using sensor fusion of odometry, visual artificial landmarks and inertial sensors.
[9] ArcBotics. 2016. Arcbotics website. http://arcbotics.com/products/sparki/parts/ultrasonic-range-finder/. Accessed: 2019-02-12.
[10] Nils Gageik, Paul Benz, S. M. 2015. Obstacle detection and collision avoidance for a uav withcomplementary low-cost sensors. IEEE Access, (3), 599–609.
[11] Ullrich, G. 2015. Automated Guided Vehicle Systems. Springer.
[12] Michael Montemerlo, S. T. 2007. Fast Slam. Springer, Berlin, Heidelberg.
[13] Aulinas, J., Petillot, Y., Salvi, J., & Llado, X. 2008. The slam problem: a survey. Frontiers inArtificial Intelligence and Applications, (184), 363–371.
[14] FDA. 2018. Fda website. https://www.fda.gov/radiation-emitting-products/home-business-and-entertainment-products/laser-products-and-instruments. Ac-cessed: 2019-12-04.
31

Kristian Svinterud SørebøLow
-cost Navigation and Collision Avoidance System
NTN
UN
orw
egia
n U
nive
rsity
of S
cien
ce a
nd T
echn
olog
yFa
culty
of E
ngin
eerin
gD
epar
tmen
t of M
echa
nica
l and
Indu
stria
l Eng
inee
ring
Mas
ter’s
thes
is
Kristian Svinterud Sørebø
Low-cost Navigation and CollisionAvoidance System
Master’s thesis in Robotics and Automation
Supervisor: Amund Skavhaug
July 2020
Copyright © 2022 FDOKUMEN