Night Time Vehicle Detection for Adaptive Beam and Collision Avoidance Systems
14
1 Amitabha Basu, Arpit Awasthi, Chandrakant Khandelwal and Jitendra Deshpande KPIT Cummins Infosystems Ltd., India Night Time Vehicle Detection for Adaptive Beam and Collision Avoidance Systems ABSTRACT This paper presents a novel and effective night time vehicle detection system for detecting vehicles in front of the camera-assisted host car. The proposed algorithm works for both oncoming vehicles (Head light detection) and preceding vehicles (Tail light detection). Image processing techniques are applied to the input frames captured by the forward looking camera fitted behind the windshield screen of the host car just near to the rear view mirror. The system uses a novel segmentation technique based on adaptive fuzzy logic, a novel statistical mean intensity measure and ‘confirmation – elimination’ based classification algorithm, and state of the art mutually independent feature based objects detection algorithm based on correlation matrix generation for the light objects identified in the scene. To distinguish true light objects from other false light objects present in the scene, it consists of shape and context based objects validation algorithm that uses properties like convex hull, collinear pattern and green – blue channels color variation. Detected objects are tracked based on matching of object properties. Distance and angle measurements are extracted for the objects using intrinsic camera parameter and geometry calculations. The proposed system is effective for multiple driver assistant applications like adaptive beam and forward collision warning. In multiple field tests, it is confirmed that system works efficiently in real time conditions. The system detects oncoming vehicle up to 1 km and preceding vehicles up to 250 m in ideal expressway. Keywords: Detection System, Camera-Assisted, Adaptive Fuzzy Logic, Statistical Mean Intensity, Correlation Matrix, Convex Hull, Collinear Pattern, Color Variation, Intrinsic, Adaptive Beam, Forward Collision Warning, Real Time, Field Tests. INTRODUCTION In the recent years, the road traffic has increased immensely owing to the growing number of motor vehicles. There is an alarming increase in global road crash injuries. Night time driving conditions pose even greater risks compared to day time due to reduced visibility. If only 25% of the driving is done at night, 55% of the driving fatalities occur during this period [1]. Moreover, the fatal crash rates at the night time are about three to four times that of the day time [2]. To address the safety concerns of the commuters at night, camera based Advanced Driver Assistant Systems (ADAS) like adaptive beam and collision avoidance have become intriguing areas of research for the global scientists and engineers. Adaptive beam system is a camera assisted autonomous lighting solution that prevents the glare of the host vehicle lamps on the other road users. At the same time, it provides the maximum visibility to the host driver. Collision avoidance system monitors the roadway in front of the host vehicle and warns the driver when a potential collision risk exists. As night time fatalities are more prominent [1], collision avoidance system requires being functional at night as well. In this paper, we propose a common night time vehicle detection solution that is effective for both the above systems. Due to severely limited cues available during night, many researchers have been working on detection of vehicles by recognition of head lamps and tail lamps. Camera based night time vehicle detection involves a series of image processing algorithms – objects segmentation, validation, classification, identification, tracking and physical measurements estimation. Copyright © 2013 SAE International and Copyright © 2013 SIAT, India 2013-26-0024 Published on 9 th -12 th January 2013, SIAT, India
-
Upload
independent -
Category
Documents
-
view
1 -
download
0
Transcript of Night Time Vehicle Detection for Adaptive Beam and Collision Avoidance Systems
1
Amitabha Basu, Arpit Awasthi, Chandrakant Khandelwal and Jitendra DeshpandeKPIT Cummins Infosystems Ltd., India
Night Time Vehicle Detection for Adaptive Beam and Collision Avoidance Systems
ABSTRACTThis paper presents a novel and effective night time vehicle detection system for detecting vehicles in front of the camera-assisted host car. The proposed algorithm works for both oncoming vehicles (Head light detection) and preceding vehicles (Tail light detection). Image processing techniques are applied to the input frames captured by the forward looking camera fi tted behind the windshield screen of the host car just near to the rear view mirror. The system uses a novel segmentation technique based on adaptive fuzzy logic, a novel statistical mean intensity measure and ‘confi rmation – elimination’ based classifi cation algorithm, and state of the art mutually independent feature based objects detection algorithm based on correlation matrix generation for the light objects identifi ed in the scene. To distinguish true light objects from other false light objects present in the scene, it consists of shape and context based objects validation algorithm that uses properties like convex hull, collinear pattern and green – blue channels color variation. Detected objects are tracked based on matching of object properties. Distance and angle measurements are extracted for the objects using intrinsic camera parameter and geometry calculations. The proposed system is effective for multiple driver assistant applications like adaptive beam and forward collision warning. In multiple fi eld tests, it is confi rmed that system works effi ciently in real time conditions. The system detects oncoming vehicle up to 1 km and preceding vehicles up to 250 m in ideal expressway.
Keywords: Detection System, Camera-Assisted, Adaptive Fuzzy Logic, Statistical Mean Intensity, Correlation Matrix, Convex Hull, Collinear Pattern, Color Variation, Intrinsic, Adaptive Beam, Forward Collision Warning, Real Time, Field Tests.
INTRODUCTIONIn the recent years, the road traffi c has increased immensely owing to the growing number of motor vehicles. There is an alarming increase in global road crash injuries. Night time driving conditions pose even greater risks compared to day time due to reduced visibility. If only 25% of the driving is done at night, 55% of the driving fatalities occur during this period [1]. Moreover, the fatal crash rates at the night time are about three to four times that of the day time [2].
To address the safety concerns of the commuters at night, camera based Advanced Driver Assistant Systems (ADAS) like adaptive beam and collision avoidance have become intriguing areas of research for the global scientists and engineers. Adaptive beam system is a camera assisted autonomous lighting solution that prevents the glare of the host vehicle lamps on the other road users. At the same time, it provides the maximum visibility to the host driver. Collision avoidance system monitors the roadway in front of the host vehicle and warns the driver when a potential collision risk exists. As night time fatalities are more prominent [1], collision avoidance system requires being functional at night as well. In this paper, we propose a common night time vehicle detection solution that is effective for both the above systems.
Due to severely limited cues available during night, many researchers have been working on detection of vehicles by recognition of head lamps and tail lamps. Camera based night time vehicle detection involves a series of image processing algorithms – objects segmentation, validation, classifi cation, identifi cation, tracking and physical measurements estimation.
Copyright © 2013 SAE International and Copyright © 2013 SIAT, India
2013-26-0024Published on9th-12th January 2013, SIAT, India
Symposium on International Automotive Technology 2013
2
Many researchers have explored various techniques for segmentation of illuminated objects at the night time [3 - 11]. In [3, 4] a red color component based method is proposed but other non-vehicle object pixels can have high red color component like bright yellow objects. This can lead to high false objects segmentation in urban conditions. Gray scale image based segmentation method [5] aids proper segmentation of white pixels but red pixels are diffi cult to segment in low illumination conditions, as pixels with high red color component and low green and blue color components are bright red in color but their corresponding gray scale values can be low. Also, their method failed to account for the change in scenarios where image statistics change drastically. A. Lopez et. al. [11] uses a red-clear pattern sensor to take advantage of the sensitivity of the sensor for segmenting the vehicle lights. However, the usage of this sensor limits the use of color descriptors as only red channel is available.
A few researchers observe the criticality of separating true light object (vehicle light objects) from the false objects (other non vehicle objects) [5], but none of them propose and defi ne adequate number of discriminators to remove all the false light objects in the scene. At night time, even traffi c signs, road signs etc. show refl ecting behavior and are captured as light blobs in the image. Though lot of published work has been done on traffi c sign detection and recognition in day time, there are very less number of researchers who worked on night time scenarios [7], whose work was based on the observation of Gaussian profi le in case of true light objects. However, profi ling solutions cease to work at distances greater than 150 m and both tail light objects and refl ectors (false objects) show similar intensity profi les.
For classification, many researchers used morphological operations, template matching and methods similar to ‘Viola Jones’ algorithm using cascade of Ada-Boost classifi er [12]. But above mentioned methods have their own limitations as now days; vehicle lights exist in different shapes and sizes. A lot of intra-class variations are found in shapes of rear lamps of the vehicle – round, oval, rectangle etc. Moreover, a training classifi er like Ada - Boost or Support Vector Machine is expensive in terms of the maintenance of huge data base and training efforts required.
To our best knowledge, only a few of the research efforts list the solution for detection of vehicles as far as 1 km (oncoming) and 250 m (preceding). For practical requirements of ADAS systems like Adaptive beam, it is crucial that far distant vehicles are also detected; else they have the hazard of blinding the host driver if the high beam of the target vehicle is switched on.
Here, we propose an effective and robust night vision detection algorithm addressing all the practical requirements of ADAS systems like Adaptive Beam and Collision Avoidance. We use a camera mounted behind the windshield of the care near the rear view mirror to capture the video
sets. We use lens with horizontal fi eld of view of 43o and a colored sensor array of size 752*480.
For segmentation of the light objects, we present a novel fuzzy based dynamic segmentation technique that is based on the automatic adjustment of segmentation thresholds based on the scenarios. Our method perfectly retains the shape and size of far distant tail lamps by extending the inspection of yellowish red pixels at the periphery of the objects apart from the usual search for red colored pixels.
Based on our extensive research, we present multiple solutions for validation of objects and removal of all types of false light objects that show properties similar to that of true lights. It is critical for system’s performance in urban conditions. No signifi cant work was available prior to this on categorized elimination of false light objects.
We present a state of the art objects identifi cation schematic that associates light objects to form a pair based on the correlation values. Further, we track and extract distance and angle values from the objects.
The paper is organized as follows: Firstly, we describe the algorithm to extract the blobs. Further, we discuss the strategy for objects recognition module that comprises of objects validation, classification and identification. This is followed by the algorithms for objects tracking and distance – angle estimation of the objects. Then, we present experimental observations and results in real scenarios to prove the effectiveness of our solution.
ALGORITHMBlobs ExtractionIt aims at extracting the pixels that are part of vehicle lights. Generally, head light objects are bright white and tail light objects have their core part white and red colored pixels at the periphery. We observed that sometimes, pixels in tail light objects are biased towards yellow color, depending on the illumination conditions and their orientation with respect to the camera. Therefore, we divide intensity pattern of the light objects into three sets of pixels based on Red-Green-Blue (RGB) color pattern of the light objects. Further, we apply fuzzy logic based technique on these extracted sets of pixels that gives us the fi nal segmented binary image.
ROI ExtractionWe start with cropping a Region Of Interest (ROI) from the input image based on the calibration settings of camera on the host vehicle. We use offl ine analysis to note the Vanishing Point (VP) in the image and defi ne ROItop certain rows above VP. This is done to encounter the real scenarios where such cases occur where the slope of the road is uneven or the vehicle is travelling uphill or downhill. False positives like street light objects that are present above ROItop get removed. We defi ne the lower vertical limit ROIbottom based on the

Symposium on International Automotive Technology 2013
3
position of the target vehicle in the image that is located 10 m far from the host vehicle. Refl ections caused by the lamps of the host vehicle on the bonnet or on the road (present below ROIbottom) also get removed. At the same time, ROI defi nition speeds up the processing time as only a part of original image is processed at later stages of the algorithm.
Pixels Set ExtractionWe divide the color pattern into three constituents - white pixels, red pixels and yellow pixels.
White Pixels Defi nitionHead light objects are bright and therefore appear white (saturated) in color. We also observe that yellowish pixels appear around the boundary of head light objects due to blooming. As white part is adequate in size for processing, we focus on extracting high intensity white pixels only. Yellow pixels that appear due to blooming are not extracted as their extraction cause merging of the two light objects. Hence, we are able to maintain better separation between the light objects and at the same time, we retain the true shape and size of the light source that is critical requirement of the extraction process.
We select pixels with gray intensity values greater than minGrayVal intensity value threshold and form a single channel image ‘white pixels image’ with pixel intensity values calculated using the formula given in Eqn. 1.
(1)where I is gray scale image, m and n are row and column positions of a pixel in the image.
Red Pixels Defi nitionThe core part of tail light object is white in color and is surrounded by red color at the periphery. Red channel value of a tail light pixel is greater than a predefi ned threshold and also greater than corresponding green and blue channel values. Difference between red and green channel values is greater than a predefi ned threshold Red Green Channel Offset. Additionally, the difference between green and blue channel values is greater than a predefi ned threshold Blue Green Channel Offset.
R(m,n) > BaseRedValue
R(m,n) > B(m,n) ,R(m,n)>G(m,n)
R (m,n)- G (m,n) > Red Green Channel Offset
G (m,n) - B (m,n) < Blue Green Channel Offset (2)
where,
R - Red channel of the input image
G - Green channel of the input image
B - Blue channel of the input image
For the pixels satisfying above mentioned conditions, we form a single channel image ‘red pixels image’ with pixel intensity values calculated using the following formula –
(3)For the pixels that do not satisfy the conditions, we set pixel intensity values to zero.
Yellow Pixels Defi nitionWe observe that the color of the tail light objects vary depending upon the ambient light conditions, orientation with respect to the camera and also based upon their positions from the host vehicle. A few reddish - yellow pixels appear both in the core and periphery of the tail light objects. It is critical to segment these pixels that belong to tail light objects to retain the true size else the tail light objects get under segmented. Degree of yellowness in these pixels depends a lot on green channel value. If green channel value is signifi cantly greater than blue channel value, the pixel color tends towards pure yellow color. We do not require pure yellow pixels to be segmented but only reddish yellow pixels. Hence, the difference between the two channels is kept below a particular limit Yellow offset Value.R (m,n) > Min Red Offset ValueG (m,n) - B (m,n)< Yellow offset Value (4)
For the pixels satisfying above mentioned conditions, we form another single channel image ‘yellow pixels image’ with pixel intensity values calculated using the following formula – Yellow Pixels Image (m,n) = 1For the pixels that do not satisfy the conditions, we set pixel intensity values to zero.
Firstly, we segment white and red pixels image using fuzzy logic described -
Adaptive Fuzzy LogicInput image has intensity values ranging from 0 to 255. We form an intensity map that maps each of these values to [0 1] scale, using S-membership function [13] as defi ned below -
(5)
where,z : Pixel intensity valuea : Minimum intensity value consideredb : (a + c) / 2c : Maximum intensity value in the image
Symposium on International Automotive Technology 2013
4
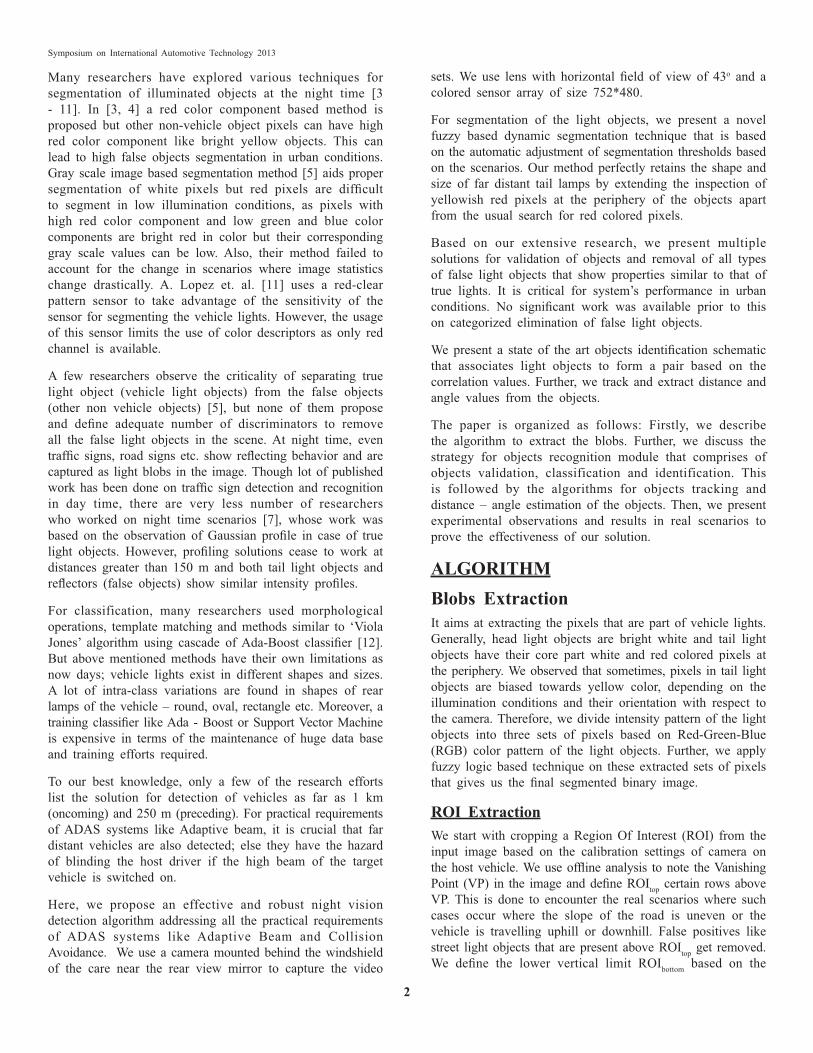
S-membership plot for a white pixels image is shown in Fig.1.
Objects RecognitionThis is the core module of Night Scene vehicle detection system. Refl ector light objects like lane keepers, lane markers, and traffi c Signs etc. show similar resemblance to that of target vehicle lamps. It is critical to selectively extract and recognize the vehicle light sources. We have implemented a state of the art Object Recognition module that comprises of following sub-modules –
1. Objects Validation
2. Objects Classifi cation
3. Objects Identifi cation
Objects ValidationIn a real world scene, the set of extracted light objects consists of vehicles’ light objects, refl ectors, traffi c signs and certain other nuisance objects. These other false light objects have properties very similar to that of vehicles’ light objects. Hence, it is crucial to distinguish between true light objects and false light objects.
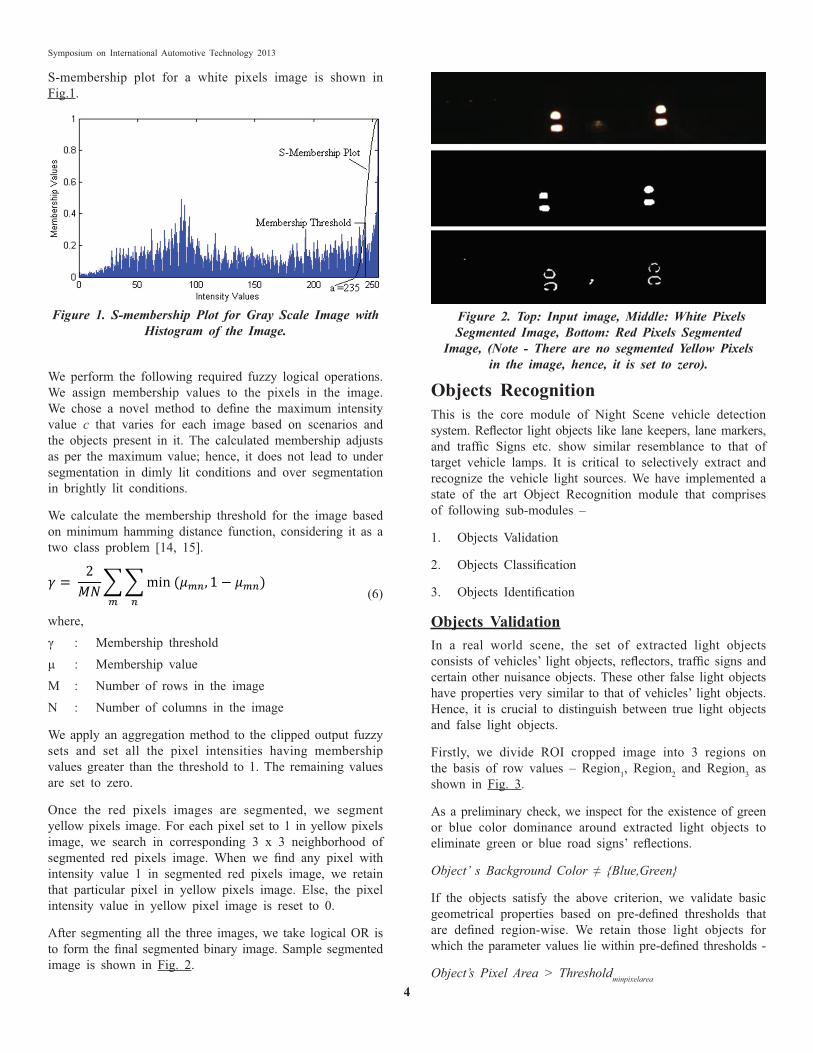
Firstly, we divide ROI cropped image into 3 regions on the basis of row values – Region1, Region2 and Region3 as shown in Fig. 3.
As a preliminary check, we inspect for the existence of green or blue color dominance around extracted light objects to eliminate green or blue road signs’ refl ections.
Object’ s Background Color ≠ {Blue,Green}
If the objects satisfy the above criterion, we validate basic geometrical properties based on pre-defi ned thresholds that are defi ned region-wise. We retain those light objects for which the parameter values lie within pre-defi ned thresholds -
Object’s Pixel Area > Thresholdminpixelarea
Figure 1. S-membership Plot for Gray Scale Image with Histogram of the Image.
We perform the following required fuzzy logical operations. We assign membership values to the pixels in the image. We chose a novel method to defi ne the maximum intensity value c that varies for each image based on scenarios and the objects present in it. The calculated membership adjusts as per the maximum value; hence, it does not lead to under segmentation in dimly lit conditions and over segmentation in brightly lit conditions.
We calculate the membership threshold for the image based on minimum hamming distance function, considering it as a two class problem [14, 15].
(6)
where,γ : Membership thresholdμ : Membership value M : Number of rows in the imageN : Number of columns in the image
We apply an aggregation method to the clipped output fuzzy sets and set all the pixel intensities having membership values greater than the threshold to 1. The remaining values are set to zero.
Once the red pixels images are segmented, we segment yellow pixels image. For each pixel set to 1 in yellow pixels image, we search in corresponding 3 x 3 neighborhood of segmented red pixels image. When we fi nd any pixel with intensity value 1 in segmented red pixels image, we retain that particular pixel in yellow pixels image. Else, the pixel intensity value in yellow pixel image is reset to 0.
After segmenting all the three images, we take logical OR is to form the fi nal segmented binary image. Sample segmented image is shown in Fig. 2.
Figure 2. Top: Input image, Middle: White Pixels Segmented Image, Bottom: Red Pixels Segmented
Image, (Note - There are no segmented Yellow Pixels in the image, hence, it is set to zero).
Symposium on International Automotive Technology 2013
5
Object’s Width > Thresholdminwidth
Object’s Bounding Box Area> Thresholdminboundingboxarea
Thresholdmaxaspectratio > Object’s Aspect Ratio>Thresholdminaspectratio
At this stage, we decompose the left - over false objects into two main types and present a series of algorithms to remove them -1. Refl ections of traffi c road signs removal2. Lane markers removal
Removal of Road Signs
For removal of road signs we have used shape, size and color based properties of the segmented light objects along with their locations in the image.
To identify and remove various types of road signs shown in Fig. 4, we implemented following algorithms – triangular boundary identifi cation, existence of Convex Hull, existence of bell shaped profi le across horizontal and vertical direction and color based G-B variation. For triangular boundary identifi cation, we calculate the horizontal pixel extent of the segmented object at top and bottom of bounding box. As shown in Fig. 5, there is a signifi cant difference between the horizontal extents at the apex and the base of the triangle. Additionally, we use convex hull property as a discriminator between vehicle light objects and refl ecting type road signs. All vehicle light objects should always satisfy convex hull property. An object is called a convex hull if all the points of a line joining any two points lie entirely within that object. Sample convex and non convex shapes are shown in Fig. 6. We defi ne parameter ‘object compactness’ (OC) as -
(7)
If OC of a particular object is lower than a particular threshold then we check for the non-segmented region (black pixels with intensity value = 0) in the region enclosed by bounding box of the object. For all those non-segmented black pixels we traverse in up, down, left and right directions
up to a certain distance (within the bounding box of the object) and examine whether some segmented pixels exist or not. If segmented pixels exist in all the four directions, then we confi rm non-segmented pixel as non-convex pixel.
Further, we compute a ratio called as critical ratio (CR) -
(8)
If CR > T (a pre-defi ned threshold), we call that object as a non-convex object and hence it cannot be considered as a true light object. Traffi c signs have signs and symbols written in black that are not segmented. This makes them a non-convex hull object. This property successfully discriminates between vehicle lights and traffi c lights.
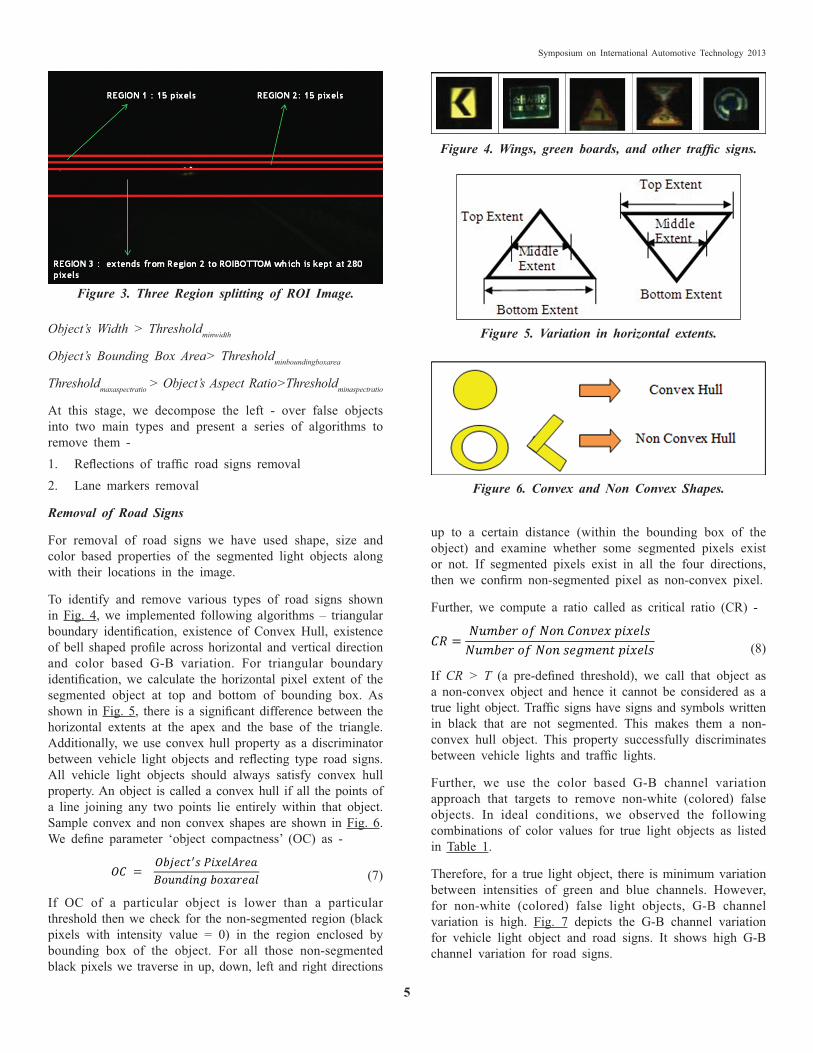
Further, we use the color based G-B channel variation approach that targets to remove non-white (colored) false objects. In ideal conditions, we observed the following combinations of color values for true light objects as listed in Table 1.
Therefore, for a true light object, there is minimum variation between intensities of green and blue channels. However, for non-white (colored) false light objects, G-B channel variation is high. Fig. 7 depicts the G-B channel variation for vehicle light object and road signs. It shows high G-B channel variation for road signs.
Figure 3. Three Region splitting of ROI Image.
Figure 4. Wings, green boards, and other traffi c signs.
Figure 5. Variation in horizontal extents.
Figure 6. Convex and Non Convex Shapes.

Symposium on International Automotive Technology 2013
6
Removal of Lane Markers
Lane markers are visible on the sides of the road. They are similar to vehicle light object in shape, size and brightness.
After observing features of lane markers, we make a few assumptions as follows - 1. There exists a faintly visible pole in the image below
the nearest lane marker. 2. They appear on sides (right or left) of the image.
As a strategy, we decide to detect the nearest lane marker fi rst by validating the existence of pole below it. Once it gets detected, we remove the next lane marker based on the co- linearity with respect to the fi rst one. We list the pseudo code for lane marker or lane keeper identifi cation below -
Step 1: Examine and select each light object to satisfy the following relation -
leftthreshold > xcentroid > rightthreshold (9)
where xcentroid is the x-coordinate of the centroid of the object and leftthreshold and rightthreshold are pre-defi ned thresholds.
Step 2: For each of the selected objects, select a window below the object with the size –
window(left,top,right,bottom) = [BBLeft-4* BBWidth, BBTop, BBRight + 4*BBWidth, BBTop + 4*BBHeight (10)
where BB denotes bounding box enclosing the light object.
Preprocess the window using Gamma correction (r = rγ, g = gγ, b = bγ with γ = 0.3) followed by inversion.
Step 3: Detect the stroke (thick edge) in the window.
Step 4: Due to shadow or poor illumination at night, stroke may appear as disconnected along its length in the image. Use a specifi c dilation shown in Fig. 8 to join the broken part.
Table 1. GB Values for True Light Objects.
Figure 7. GB Variation Plots for Vehicle Light Object and Road Signs.
Figure 8. Dilation Procedure for Stroke Detection.
If at least two pixels set to logical 1 exist in the top row then we dilate as shown above.
Step 5: Find length and average width of stroke. If its elongation ratio and stroke height exceeds pre-defined thresholds, then a lane marker is established.
Step 6: Co linearity Inspection - When one object is correctly classifi ed as a lane marker, we check the orientation between the established lane marker and two of the nearest light objects. If they are collinear to each other, we defi ne a line called as ‘road boundary line’ joining all the three points and extend the line beyond these three points in both directions.
Step 7: Retention of road boundary line - In certain frames, the nearest lane marker is not identifi ed; hence we require tracking the earlier detected road boundary line.
Step 7a: Search for the light objects within the subspace of earlier detected lane marker objects.
Step 7b: For all the light objects found in the search space, check for co linearity between them and perform steps (7c-7e), or else go to step 7f.
Step 7c: If objects are collinear, then compute slope of the road boundary line.
Step 7d: Additionally, compute d -
d = abs (SlopeCurrentframe - SlopePreviousframe) (11)
Step 7e: if d < thresholdslope then update the current road boundary line with the new joining line.
Step 7f: Update the current road boundary with previous road boundary
Fig. 9 to Fig. 11 show the intermediate results illustrating removal of lane markers.

Symposium on International Automotive Technology 2013
7
stage). We continue search in all 360 directions and count the percentage of the object’s perimeter covered by the reddish pixels. If the total count after searching in all the directions is greater than a pre-defi ned threshold, we divide each object into four boxes as shown in Fig. 12 and calculate mean intensities for each box. Considering these four mean intensities, we fi nd standard deviation value. If standard deviation is greater than a pre defi ned threshold, we classify the object as Tail light (TL) object.
Figure 9. Left Image is an Input Image with Lane Marker as Light Object and the Right Image is an
Enhanced Image in the Specifi ed Window Below Lane Marker.
Figure 10. Lane Marker Removal by Defi ning a Road Boundary Line.
Figure 11. Left Image Shows Calculated Road Boundary Line and the Right Image Shows Tracked Road
Boundary Line.
Objects Classifi cationWe propose a novel ‘confi rmation-elimination’ approach to classify light objects using peripheral color search scheme for rear vehicle lights and context based information for head lights.
We classify light objects into the following categories – Merged Lights (ML), Tail lights (TL), Confirmed Head Lights (HL), Probable Head Lights (PHL) and Unknown Lights (UL).
If the light object exceeds a pre-defined maximum area threshold, it is classifi ed as a merged light (ML). This is the case when a pair of head lights appears as a single merged light object in the image (at distances greater than 400 m from the host vehicle).
Tail light is classified based on its color property and statistical mean intensity of the corresponding gray scale intensity values of that object. It is observed that tail lights beyond 100 m are rich in reddish pixels. However, near distance tail lights are saturated with white pixels in the central region and red pixels appear only in the circumference. For each object, we search for reddish pixels in radial direction - from object’s center to its circumference (in RedPixelsImage that is constructed at blobs extraction
Figure 12. Box Wise Mean Intensity Calculation for Objects to Calculate Standard Deviation.
For the left over light objects, we adopt a context based approach. For the light object under inspection, we inspect for the existence of similar light object in left or right direction at same vertical level and also for the existence of refl ection below that object. We defi ne the search extent for inspection as a function of object height and width as shown in Eqn. 12
Searchextent = 3*maximum (objectheight,objectwidth) (12)
If we fi nd another light object within the search extent, we check for histogram similarity and area similarity between them. This is done with the motivation that light objects of same vehicle are of the same make and hence have similar illumination spectrum and sizes. For computing histogram similarity, we use the formula as given in Eqn. 13
(13)
where,
p (x) is probability distribution for fi rst object computed from histogram
q (x) is probability distribution for second object computed from histogram
X �� [0,255]
d (p,q) is histogram similarity
0 ≤ d (p,q) ≤1
For computing area similarity we use the following formula in Eqn. 14
(14)
Symposium on International Automotive Technology 2013
8
We call a pair of objects as histogram similar if d (p,q)exceeds a predefi ned threshold. Similarly, we call them area similar if area similarity exceeds a predefi ned threshold.
If the above criterions are satisfi ed, we classify the light object as probable head light (PHL). A set of PHL objects is a super set of Head light (HL) objects.
For PHL objects, we inspect for existence of refl ection below them. If the light object is a head light object and target vehicle’s high beam is switched on, then we get refl ection of the head light object on the road. On the other hand, tail light objects have too less illumination to cause refl ection on the road. However, due to perspective geometry, certain cases appear where far distant light objects have another set of true light objects vertically below them which are not refl ections. To segregate these cases, we defi ne Region1 in ROI cropped image as ‘refl ection barred zone’. In this region, we do not inspect for refl ection. Remaining ROI is defi ned as ‘refl ection prone zone’ where we inspect for refl ection. If refl ection is found below the light object, we confi rm the light object as HL.
Any other light will be categorized as unknown light object (UL).
Objects Identifi cationWe present a mutually independent feature based Objects Identifi cation module that builds vehicles by pairing lamps that are similar to each other. Correlation value matrix provides the schematic to measure the degree of similarity between two objects.
Objects Correlation Matrix Generation - Firstly, we built objects feature matrix as shown in Eqn. 15.
(15)
where,
Fij is jth feature of ith object.
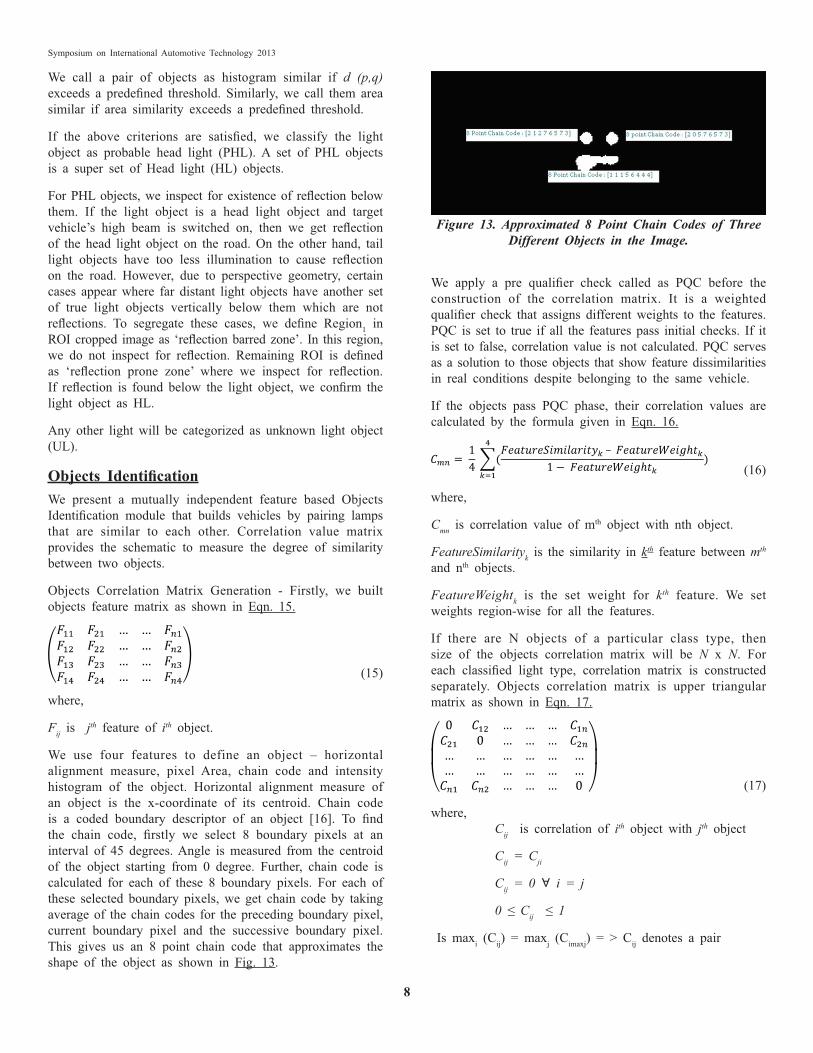
We use four features to define an object – horizontal alignment measure, pixel Area, chain code and intensity histogram of the object. Horizontal alignment measure of an object is the x-coordinate of its centroid. Chain code is a coded boundary descriptor of an object [16]. To fi nd the chain code, fi rstly we select 8 boundary pixels at an interval of 45 degrees. Angle is measured from the centroid of the object starting from 0 degree. Further, chain code is calculated for each of these 8 boundary pixels. For each of these selected boundary pixels, we get chain code by taking average of the chain codes for the preceding boundary pixel, current boundary pixel and the successive boundary pixel. This gives us an 8 point chain code that approximates the shape of the object as shown in Fig. 13.
We apply a pre qualifi er check called as PQC before the construction of the correlation matrix. It is a weighted qualifi er check that assigns different weights to the features. PQC is set to true if all the features pass initial checks. If it is set to false, correlation value is not calculated. PQC serves as a solution to those objects that show feature dissimilarities in real conditions despite belonging to the same vehicle.
If the objects pass PQC phase, their correlation values are calculated by the formula given in Eqn. 16.
(16)
where,
Cmn is correlation value of mth object with nth object.
FeatureSimilarityk is the similarity in kth feature between mth and nth objects.
FeatureWeightk is the set weight for kth feature. We set weights region-wise for all the features.
If there are N objects of a particular class type, then size of the objects correlation matrix will be N x N. For each classifi ed light type, correlation matrix is constructed separately. Objects correlation matrix is upper triangular matrix as shown in Eqn. 17.
(17)
where, Cij is correlation of ith object with jth object
Cij = Cji
Cij = 0 i = j
0 ≤ Cij ≤ 1
Is maxi (Cij) = maxj (Cimaxj) = > Cij denotes a pair
Figure 13. Approximated 8 Point Chain Codes of Three Different Objects in the Image.
Symposium on International Automotive Technology 2013
9
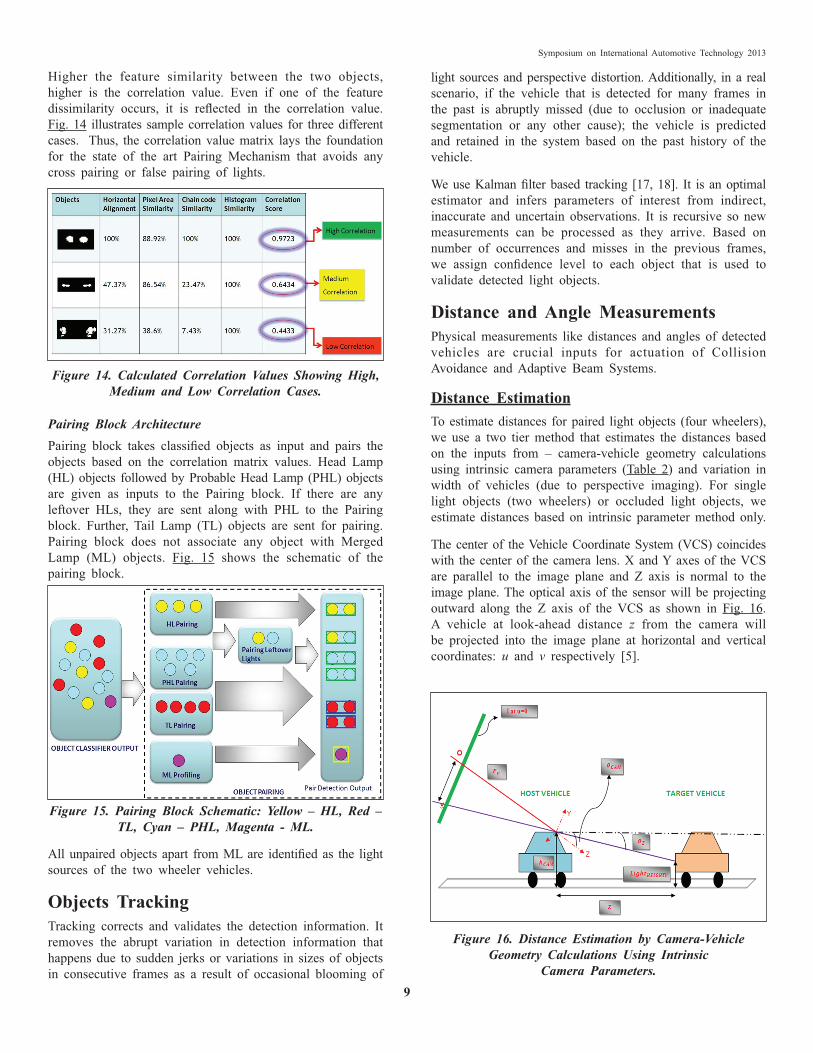
Higher the feature similarity between the two objects, higher is the correlation value. Even if one of the feature dissimilarity occurs, it is refl ected in the correlation value. Fig. 14 illustrates sample correlation values for three different cases. Thus, the correlation value matrix lays the foundation for the state of the art Pairing Mechanism that avoids any cross pairing or false pairing of lights.
light sources and perspective distortion. Additionally, in a real scenario, if the vehicle that is detected for many frames in the past is abruptly missed (due to occlusion or inadequate segmentation or any other cause); the vehicle is predicted and retained in the system based on the past history of the vehicle.
We use Kalman fi lter based tracking [17, 18]. It is an optimal estimator and infers parameters of interest from indirect, inaccurate and uncertain observations. It is recursive so new measurements can be processed as they arrive. Based on number of occurrences and misses in the previous frames, we assign confi dence level to each object that is used to validate detected light objects.
Distance and Angle Measurements Physical measurements like distances and angles of detected vehicles are crucial inputs for actuation of Collision Avoidance and Adaptive Beam Systems.
Distance EstimationTo estimate distances for paired light objects (four wheelers), we use a two tier method that estimates the distances based on the inputs from – camera-vehicle geometry calculations using intrinsic camera parameters (Table 2) and variation in width of vehicles (due to perspective imaging). For single light objects (two wheelers) or occluded light objects, we estimate distances based on intrinsic parameter method only.
The center of the Vehicle Coordinate System (VCS) coincides with the center of the camera lens. X and Y axes of the VCS are parallel to the image plane and Z axis is normal to the image plane. The optical axis of the sensor will be projecting outward along the Z axis of the VCS as shown in Fig. 16. A vehicle at look-ahead distance z from the camera will be projected into the image plane at horizontal and vertical coordinates: u and v respectively [5].
Figure 14. Calculated Correlation Values Showing High, Medium and Low Correlation Cases.
Pairing Block ArchitecturePairing block takes classifi ed objects as input and pairs the objects based on the correlation matrix values. Head Lamp (HL) objects followed by Probable Head Lamp (PHL) objects are given as inputs to the Pairing block. If there are any leftover HLs, they are sent along with PHL to the Pairing block. Further, Tail Lamp (TL) objects are sent for pairing. Pairing block does not associate any object with Merged Lamp (ML) objects. Fig. 15 shows the schematic of the pairing block.
Figure 15. Pairing Block Schematic: Yellow – HL, Red – TL, Cyan – PHL, Magenta - ML.
All unpaired objects apart from ML are identifi ed as the light sources of the two wheeler vehicles.
Objects TrackingTracking corrects and validates the detection information. It removes the abrupt variation in detection information that happens due to sudden jerks or variations in sizes of objects in consecutive frames as a result of occasional blooming of
Figure 16. Distance Estimation by Camera-Vehicle Geometry Calculations Using Intrinsic
Camera Parameters.
Symposium on International Automotive Technology 2013
10
From the geometry, the general equations to calculate pitch angle θcam, vertical angle θz and normal distance z is given in Eqn. 18.
(18)
The description of all the parameters used in the above equations is listed in Table 2. We propose to calculate θcam directly by measured values of hcam and NPcam. We do not require any type of measurement tool for measuring the pitch angle. By calculating z, we get host vehicle to target vehicle normal distance. The advantage of the intrinsic parameter based method is that it can successfully be used to estimate distances of two wheeler light sources as well.
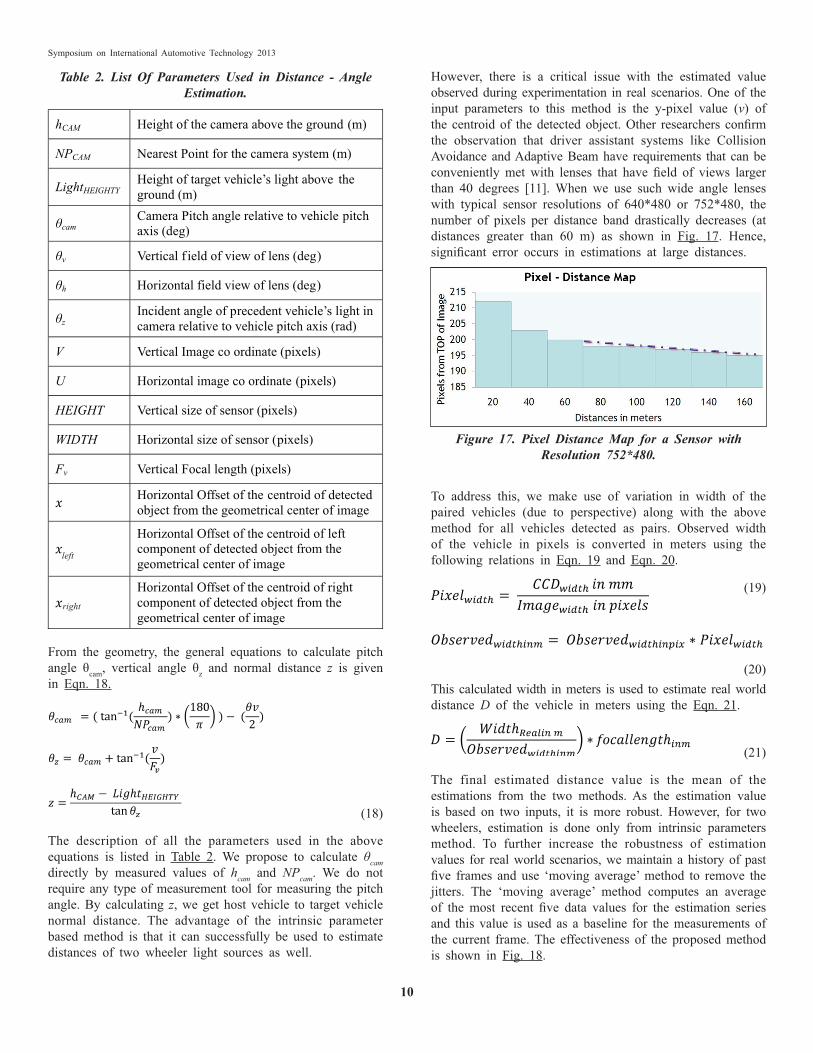
However, there is a critical issue with the estimated value observed during experimentation in real scenarios. One of the input parameters to this method is the y-pixel value (v) of the centroid of the detected object. Other researchers confi rm the observation that driver assistant systems like Collision Avoidance and Adaptive Beam have requirements that can be conveniently met with lenses that have fi eld of views larger than 40 degrees [11]. When we use such wide angle lenses with typical sensor resolutions of 640*480 or 752*480, the number of pixels per distance band drastically decreases (at distances greater than 60 m) as shown in Fig. 17. Hence, signifi cant error occurs in estimations at large distances.
Table 2. List Of Parameters Used in Distance - Angle Estimation.
Figure 17. Pixel Distance Map for a Sensor with Resolution 752*480.
To address this, we make use of variation in width of the paired vehicles (due to perspective) along with the above method for all vehicles detected as pairs. Observed width of the vehicle in pixels is converted in meters using the following relations in Eqn. 19 and Eqn. 20.
(20)This calculated width in meters is used to estimate real world distance D of the vehicle in meters using the Eqn. 21.
(21)
The final estimated distance value is the mean of the estimations from the two methods. As the estimation value is based on two inputs, it is more robust. However, for two wheelers, estimation is done only from intrinsic parameters method. To further increase the robustness of estimation values for real world scenarios, we maintain a history of past fi ve frames and use ‘moving average’ method to remove the jitters. The ‘moving average’ method computes an average of the most recent fi ve data values for the estimation series and this value is used as a baseline for the measurements of the current frame. The effectiveness of the proposed method is shown in Fig. 18.
(19)

Symposium on International Automotive Technology 2013
11
Horizontal Angle Estimation
Horizontal angle is measured with respect to the optical axis of the camera system. For a given pixel in the image, we use the horizontal offset of the centroid pixel position of the detected object from the center of the image to estimate the angle. From the geometry, the horizontal angle θhorz is given in the Eqn. 22.
(22)
The description of all the parameters used in the above equation is listed in Table 2. Additionally, we calculate left and right angles for the paired light objects where x in the Eqn. 22 is replaced by xleft and xright respectively.
EXPERIMENTAL RESULTSWe integrated the system with a camera and an onboard electronic control unit (ECU). The resolution of the camera used is 752*480 pixels. The computation time spent on processing one input frame depends on the complexity of the road scene (mainly on the number of blobs in the scene and objects to be processed). With our proposed algorithm, we achieve output Frames Per Second (FPS) = 12. We evaluate our system in both real time mode (fi eld tests with assembly installed behind the wind shield of the car near the rear view mirror with a specifi c mounting) and offl ine mode (on pre - captured video sets).
Apart from FPS, we defi ne DA as ‘Detection Accuracy’ (in percentage) and FPR as ‘False Positive Rate’ (per frame) to measure the performance of our proposed algorithm -
Additionally, we use another important metric ‘total number of discontinuities’ that indicates the number of times detection stops in between despite the continued presence of the vehicle light objects in the scene. This is very crucial for time critical systems like Adaptive beam and collision avoidance as even a few discontinuities in vehicle detection can adversely impact the response of these systems.
We test our algorithm in pure scenarios – containing only true positives or false positives as well as in mixed scenarios - true positives along with false positives. We use various test cases, like host car moving, host car stationary etc. for both oncoming and preceding traffi c and following results tabulated in Tables 3 to Table 5 are shown below. Videos (1-4) contain oncoming vehicles only (with high beam switched on) with distance range starting from 1 km. Videos (5-8) contain oncoming vehicles only (with low beam switched on) with distance range starting from 700 m. Videos (9-10) contain preceding vehicles only with distance range up to 250 m. Table 4 shows the results exclusively for false positives. In Table 5, we test in the scenarios where both oncoming and preceding vehicles are present along with false positive objects.
Figure 18. Removal of Jitters in Distance Estimation Values.
Table 3. Field Test Results for True Positives.
(23)
(24)

Symposium on International Automotive Technology 2013
12
We validated distance estimation values in real scenarios up to 160 m for paired light objects (four wheelers). The results are shown in Fig. 19. Average deviation observed in estimated values is 4.62%. The results show that proposed two tier estimation method ensures robustness even at distances larger than 100 m.
Table 4. Field Test Results for False Positives.
Table 5. Field Test Results for Mixed Videos.
Extensive online mode and offl ine mode evaluation proves the effectiveness of our proposed algorithm. We achieve average detection accuracy of 96.85% and average false positive rate of 0.053 in real scenarios. Total number of observed discontinuities is also nil in most of the video sets.
Figure 19. Distance Estimation Results.
A sample offl ine processed image frame is shown in Fig. 20 along with the estimated measurements.
Figure 20. Processed Image Frame Showing Detected Ve-hicle Enclosed in a Bounding Box Along with Estimated
Distance and Angle Values.
CONCLUSIONSThis paper presents a novel and effective Night time vehicle detection system as a common solution for adaptive beam and night time collision avoidance systems. We address practical challenges for the system like under-segmentation of the tail light objects by using adaptive fuzzy framework for the extraction of blobs. Based on extensive research and observations, we provide solutions to eliminate false light objects, classify true objects and defi ne a correlation based identifi cation module that avoids cross pairing issues. Further, we use tracking to provide robustness to the system and also extract distance – angle measurements for the objects. Our experimental results and fi eld tests confi rm that our solution works for a distance range as far as 1 km. In future, we plan to extend our solution to make the system work in adverse weather conditions - like rain, fog, mist etc.
Symposium on International Automotive Technology 2013
13
REFERENCES1. Dubrovin A., et al, “Application of Real-Time Lighting
Simulation for Intelligent Front-Lighting Studies”, Proceedings of the Driving Simulation Conference, pp.333-343, Paris, September 2000.
2. U.S. National Highway Traffi c Safety Admin. Traffi c Safety facts (2000).
3. R. Sukhthankar, “RACCOON- A Real-Time Autonomous Car Chaser Operating Optimally at Night”, Proc. of IEEE Intelligent Vehicles 1993.
4. Margrit Betke, Esin Haritaoglu, Larry S. Davis, “Real-time Multiple Vehicle Detection and Tracking from a Moving Vehicle”, Machine Vision and Applications (2000) 12: 69-83.
5. P.F. Alcantarilla, L.M. Bergasa et al, Department of Electronics. University of Alcal´aAlcal´a de Henares (Madrid), S1]pain “ Night Time Vehicle Detection for Driving Assistance LightBeam Controller”, 2008 IEEE Intelligent Vehicles Symposium Eindhoven University of Technology Eindhoven, The Netherlands, June 4-6, 2008.
6. Weihong Wang1;2, Chunhua Shen1;3, Jian Zhang1;2, Sakrapee Paisitkriangkrai1;2, 1NICTA 2University of New South Wales 3Australian National University “A Two-Layer Night-time Vehicle Detector”.
7. Julien Rebut, Benazouz Bradai, Julien Moizard, Adrien Charpentier VALEO, Driving Assistance Domain, FRANCE, “A Monocular Vision Based Advanced Lighting Automation System for Driving Assistance”, IEEE International Symposium on Industrial Electronics (ISlE 2009) Seoul Olympic Parktel, Seoul, Korea July 5-8, 2009.
8. Wei-Yen Wang, Senior Member, IEEE, Ming-Chih Lu, Hung Lin Kao, and Chun-Yen Chu, “Nighttime Vehicle Distance Measuring Systems”, IEEE TRANSACTIONS ON CIRCUITS AND SYSTEMS—II: EXPRESS BRIEFS, VOL. 54, NO. 1, JANUARY 2007.
9. SamYong Kim, Se-Young Oh, JeongKwan Kang and YoungWoo Ryu Department of Electronic and Electrical Engineering, Pohang University of Science and Technology, Kwangsoo Kim, Sang-Cheol Park and KyongHa Park, Telecommunication R&D Center Samsung Electronics Co., Ltd. Sa31, Hyojadong, Namgu, Pohang, Korea, “Front and Rear Vehicle Detection and Tracking in the Day and Night Times Using Vision and Sonar Sensor Fusion”.
10. Ronan O’Malley, Edward Jones, Member, IEEE, and Martin Glavin, Member, IEEE, “Rear-Lamp Vehicle Detection and Tracking in Low-Exposure color Video for Night Conditions”, IEEE TRANSACTIONS ON INTELLIGENT TRANSPORTATIONS SYSTEMS, Vol. 11, No. 2, June 2010.
11. Antonio L´opez1, J¨org Hilgenstock2, Andreas Busse3, Ram´on Baldrich1, Felipe Lumbreras1, and Joan Serrat1, “Nighttime Vehicle Detection for Intelligent Headlight Control”, ACIVS 2008;Juan-les-Pins;20 October 2008 through 24 October 2008;Code74361.
12. Chiung-Yao Fang, Associate Member, IEEE, Sei-Wang Chen, Senior Member, IEEE, and Chiou-Shann Fuh, Member, IEEE, “Road-Sign Detection and Tracking”, IEEE TRANSACTIONS ON VEHICULAR TECHNOLOGY, VOL. 52, NO. 5, SEPTEMBER 2003.
13. L. A. Zadeh, “A Fuzzy Algorithmic Approach to the Defi nition of Complex or Imprecise Concepts”, Int. J. Man. – Machine Studies (1976) 8, 249 – 291.
14. Manuel Guillermo Forero-Vargas and Oswaldo Rojas-Camacho Grupo Ohwaha Departamento de Ingenieria de Sistemas. Universidad Nacional de Colombia Facultad de Ingenieria: Universidad el Bosque – Escuela Colombiana de Ingenieria Santafe de Bogota COLOMBIA, “New Formulation in Image Thresholding using Fuzzy Logic”.
15. J. Dombi and L. Porkolab, “Measures of Fuzziness”, Annales Univ. Sci., Budapest, Sect. Comp. 12 (1991) 69-78.
16. Nor Amizam Jusoh and Jasni Mohamad Zain, “Application of Freeman Chain Codes: An Alternative Recognition Technique for Malaysian Car Plates”, IJCSNS International Journal of Computer Science and Network Security, VOL.9 No.11, November 2009
17. G. Welch and G. Bishop, “An Introduction to the Kalman Filter”, Dept. of Computer Science University of North Carolina at Chapel Hill, Chapel Hill, NC 27599-3175.
18. R.E. Kalman, “A New Approach to Linear Filtering and Prediction Problems”, Trans. ASME, J. Basic Eng., vol. 82, Mar. 1960.
19. Ernst D. Dickmans and Birger. Mysliwetz,“Recursive 3D Road and Ego State Recognition”, Transactions on Pattern Analysis and Machine Intelligence, Feb. 1992.

Symposium on International Automotive Technology 2013
14
The Technical Paper Review Committee (TPRC) SIAT 2013 has approved this paper for publication. This paper is reviewed by a minimum of three (3) subject experts and follows SAE guidelines.
All rights reserved. No part of this publication may be reproduced, stored in a retrieval system, or transmitted, in any form by any means, electronic, mechanical photocopying, recording, or otherwise, without the prior written permission of SIAT 2013.
Positions and opinions advanced in this paper are those of the author(s) and not necessarily those of SIAT 2013. The author is solely responsible for the content of the paper.
The Automotive Research Association of IndiaSurvey No. 102, Vetal Hill, Off Paud Road, Kothrud, PUNE 411038. Maharashtra, (INDIA)Tel.: +91-20-3023 1111 � Fax: +91-20-2543 4190Email: [email protected] in India
CONTACT INFORMATIONMr. Amitabha Saroj BasuTechnical Leader,KPIT Cummins Infosystems Ltd.,Pune 411057, India.Email: [email protected]