
A Bayesian copula model for stochastic claims reserving not those of the
Upload
khangminh22Category
view
0download
0
Loss Reserving with GLMs: A Case Study
Greg Taylor and Gr~inne McGuire
327

Loss reserving with GLMs: a case study
Greg Taylor
Taylor Fry Consulting Actuaries Level 8, 30 Clarence Street
Sydney NSW 2000 Australia
Professorial Associate, Centre for Actuarial Studies Faculty of Economics and Commerce
University of Melbourne Parkville VIC 3052
Australia
greg@taylor fry.com.au
and
Gr~iinne McGuire
Taylor Fry Consulting Actuaries Level 8, 30 Clarence Street
Sydney NSW 2000 Australia
Paper presented to the Spring 2004 Meeting of the Casualty Actuarial Society, Colorado Springs, Colorado,
16-19 May 2004
328

Summary
This paper provides a case study in the application of generalised hnear models ("GLMs") to loss reserving. The study is motivated by approaching the exercise from the viewpoint of an actuary with a predisposition to the application of the chain ladder ("CL").
The data set under study is seen to violate the conditions for application of the CL in a number of ways. The difficulties of adjusting the CL to allow for these features of the data are noted (Sections 3).
Regression, and particularly GLM regression, is introduced as a structured and rigorous form of data analysis. This enables the investigation and modelling of a number of complex features of the data responsible for the violation of the CL conditions. These include superimposed inflation and changes in the rules governing the payment of claims (Sections 4 to 7).
The development of the analysis is traced in some detail, as is the production of a range of diagnostics and tests used to compare candidate models and validate the final one.
The benefits of this approach are discussed in Section 8.
Keywords: chain ladder, generalised linear model, GLM, loss reserving, regression, superimposed inflation.
1. Introduction
Taylor (2000) surveys many of the methods of loss reserving. Although the chain ladder ("CL") (Chapter 3) is, in a number of ways, the most elementary, it is also still the most widely used by practitioners.
This method is based, however, on a very restrictive model whose conditions are likely to be breached quite commonly in practice. When this happens the method is liable to material error in the loss reserve it generates.
i f such error is to be corrected, the model itself must be subjected to some form ofcorrective action. This may be difficult on two scores:
• The CL falls within the category of model labelled phenomenological by Taylor, McGuire and Greenfield (2003). This means that it reflects little of the underlying mechanism of claim payment, and consequently the required form of correction may not be readily apparent.
• Even if the required form of correction can be identified, perseverance with the CL may be more tedious and less reliable than its abandonment in favour of a fundamentally different approach.
The present paper is concerned with a data set that manifestly fails to meet the conditions trader which application of the CL is valid. It then examines the
3 2 9

.
sorts of corrections reqmred, and how they might be implemented most efficiently.
It should be pointed out that there has been no necessity to trawl through numerous data sets to locate one that breaches CL assumptions. The data set used here relates to the Auto Bodily Injury claims of one of the Australian states. The consultancy with which we are associated deals with such claims in four states, and it is fair to say that any one of these could have been used as the example for the present paper.
The viewpoint taken will be that of a reserving actuary with a predisposition to the application of the CU The validity of tts application to the subject data set will be examined (Section 3), as will the materiality of the potential error it introduces. Analysis of the data set will then be directed to the identificauon of the various breaches of the CL conditions, and their consequences for a loss reserve.
The ultimate purpose of this analysis is not to produce a diatribe aga,nst the CL as such, since this may provide a perfectly useful piece of methodology under appropriate conditions. Rather, the purpose is to demonstrate how Generalised Linear Models ("GLMs") can provide a structured and rigorous form of data analysis leading to a loss reserving model.
T h e d a t a s e t
The data set relates to a scheme of Auto Bodily Injury insurance in one state of Australia. This form of insurance is compulsory, and includes no component of propeR' coverage.
The form of coverage, and other conditions under which the scheme operates, are legislated, but it is underwritten by private sector insurers subject to these conditions. Premium rates are partially regulated by the promulgation of acceptable ranges.
Insurers that participate m the underwriting are required to submit their claims data to a centralised data base. The data set used in the present paper is extracted from this data base. It comprises a unit record claim file, contaimng the following items of information:
• Date of injury; • Date of notification; • Histories of:
o FinalisecL,'unfinalised status (some claims re-open a~er having been designated finahsed), mcludmg dates of changes of status
o Paid losses o Case esttmates
• Various other claim characteristics (e.g. injur2, ., type, injury severity, etc) not used m the present paper.
330

The scheme of insurance commenced in its present form in September 1994, and the data base contains claims with dales of injury from then. It is current at 30 September 2003.
The purpose of the present paper is to illustrate loss reserving by means of GLMs, rather than to carry out a loss reserving consulting assignment. For this reason, analysis will be limited to finalised claims. Some justification for this course will become apparent as the analysis develops, but there will be no attempt to demonstrate beyond doubt that it is the best.
A consequence of this approach is that (for almost all purposes) data are required only in respect of flnalised claims. Exceptions are that:
The ultimate numbers of claims to be notified in each accident quarter have been estimated outside the paper, and will here be taken as given. In respect of each accident quarter, the total amount of losses paid to 30 September 2003, whether relating to finalised or unfinalised claims, is used to obtain estimates of outstanding claims in Sections 3.2 and 7.6.
Wherever paid loss amounts are used they have been convened to 30 September 2003 dollar values m accordance with past wage inflation experienced in the state concerned. This is done to eliminate past "normal" inflationary effects on the assumption that wage inflation is the "normal" inflation tbr this type of claim. Henceforth, any reference to paid losses will carry the tacit implication that they are expressed in these constant dollar values.
Naturally, claims inflation actually experienced differs from wage inflation from time to time, and is the subject of estimation in Sections 7.3.2 and .7.3.3. The excess of claims inflation over wage inflation is referred, to as superimposed inflation ("SI").
Appendix A. I provides a triangular summary of the paid loss data in the usual form. In conventional fashion, rows of the triangle represent accident quarters, columns development quarters, and diagonals experience quarters (or quarters of finalisation). Development quarters are labelled 0, I,..., w~th development quarter 0 coinciding with the accident quarter.
Let Pu denote claim payments in the (i,j) cell. Let C o denote their cumulative version:
C,, = ~. P,~ (2.1) l=O
Similarly, pVj and Cv,j denote the corresponding quantities in respect of just finalised claims. Appendix A.2 provides a triangular summar), of these. Each cell of the triangle contains the paid losses, whether paid in that quarter or earlier, in respect of claims finalised in the cell.
331

o
3.1
Let F,j denote number of claims finalised in the (id) cell. They are set out in Appendix A.3. Let G.j denote theu" cumulative version. Define average sizes of finalised claims, incremental and cumulative respectively, as follows:
S,j = pFj / F.j (2.2)
Tij = cFtj / Gij- (2.3)
Appendices A.4 and A.5 display these average claim sizes.
T h e c h a i n l a d d e r
Age-to-age factors
Appendix B derives age-to-age factors from the data of Appendix A.
The age-to-age factor linking cells (id) and ( i j+l) in the triangle of cumulative paid losses is
RF,j = cF,d.I / cFaj. (3. I )
These factors are tabulated in Appendix B.I.
Likewise, the age-to-age factor linking cells (id) and ( i j+l) m the triangle of cumulative average claim sizes (Appendix A.4) is
Qu = Ti,.i.i / T,I. (3.2)
These factors are tabulated in Appendix B.2.
Average age-to-age factors are displayed in Appendices B.I and B.2. Conventionally, these are taken over various past averaging periods, as some sort of test of stability of the factors over time.
Figures 3.1 and 3.2 chart the average age-to-age factors, showing clear indications of instability. In development periods 3 to about 10, the factors show a clear tendency toward higher values for more recent experience years (except the latest year, where they are lower).
332

Figure 3.1
Paymen ts in r espec t o f set t led c la ims: age- to -age f ac to r s f o r v a r i o u s ave rag ing pe r iods
100.00
g lo.oo ,.00JJnb. 1:0 2:1 3:2 4:3 5:4 6:5 7:6 8:7 9:8 10:9
Development quarters
i • Last 1 year • Last 2 years • Last 3 years • Last 4 years • All years I
Figure 3.2
Paymen ts in r espec t o f set t led c la ims: age- to -age
fac to rs f o r va r i ous ave rag ing per iods (cont 'd )
1.35 [
° lltlh,,. 1.25
1.20
~1.15
1.10
1.05
1.00 8:7 9:8 10:9 11:10 12:11 13:12 14:13 15:14 16:15 17:16
Development quarters
: • Last 1 year • Last 2 years • Last 3 years • Last 4 years •A l l years !
3.2 Sensitivity of loss reserve
While Figures 3.1 and 3.2 demonstrate that different averaging periods lead to different age-to-age, factors, and therefore to different loss reserves, the
333

materiality of the differences is not apparent. Table 3.1 sets out the loss reserves calculated according to the various averaging periods.
Inspection of Appendix B. 1 reveals that, while the age-to-age factors generally showed increasing trends over recent periods, those recorded in the September 2003 experience quarter (the last diagonal, were particularly low. Table 3.1 includes an examination of the effect of including or excluding this quarter's experience from the averaging.
Omission of the September 2003 experience prevents estimation of a loss reserve for that accident period. Therefore, the loss reserves set out in Table 3. I relate to all accident quarters except that one.
Table 3.1 Loss reserves according to different averaging periods for age-to-age factors
Averaging period
All experience quarters Last 8 experience quarters
Allexperience quarters except September 2003 Last8 experience quarters except September 2003
Loss reserve at 30 September 2003 (excluding September
2003 accident quarter) $B 1.61 1.68
1.78
1.92
Table 3.2 Loss reserve dissected by accident period
Accident quarter
Sep 00
Sep 0 I
Sep 02 Dec 02 Mar03 Jun 03
Total
Loss reserve at 30 September 2003 (excluding September 2003 accident
quarter) SM
176
165
171 124 59 58
1,785
334

The sensitivity of loss reserve to averaging period is considerable. The largest estimate is 19% larger than the smallest. However, a more detaded examination of the loss reserves quickly reveals that the tree sensitivity is much greater than this.
Table 3.2 sets out an accident quarter partial dissection of the "'All experience quarters except September 2003" reserve from Table 3.1. It is quite evident that the loss reserve is distorted downward in respect of the latest accident quarters.
This is due to the low cumulative paid losses at the end of this quarter, as evidenced by the low age-to-age factors in this quarter, which serve as the baseline for forecasting future paid losses.
The usefulness of the reserves in Table 3.1 is unclear in the presence of this factor. It is natural to correct for it by adjusting any loss reserve at 30 September 2003 (still excluding the September 2003 accident quarter) by forecasting it on the basis of paid losses to 30 June 2003. Specifically, this consists of:
• calculating a standard chain ladder loss reserve at 30 June 2003; and then
• deducting the forecast September 2003 quarter paid losses included in that reserve.
This makes sense only for reserves based on averaging that excludes the September 2003 experience quarter. Table 3.3 augments Table 3.1 to include such corrections.
Table 3.3 Loss reserves corrected and uncorrected for low September 2003 quarter paid loss experience
Averaging period
All experience quarters Last 8 experience quarters
All experience quarters except September 2003 Last 8 experience quarters except September 2003
Loss reserve at 30 September 2003 (excluding September
2003 accident quarter) Uncorrected Corrected
$B $B 1.61 1.68
1.78 1.94
1.92 2.35
Table 3.4, again dealing with the "All experience quarters except September 2003" case, shows that the corrections introduced into the last two rows of Table 3.3 do at least remove the most obvious implausibility in the trends of those loss reserves over recent accident periods.
335

This comes, however, at the cost of a considerable widening of the gap between the two versions of the chain ladder that respectively use all experience or just the last 8 experience quarters with the exception of the last. The larger of these two estimates is now 21% larger than the other, compared with 8% previously.
Table 3.4 Loss reserve by accident quarter
Accident quarter
Sep 00
Sep 01
Sep 02 Dec 02 Mar 03 Juo 03
Loss reserve at 30 September 2003 (excluding September 2003 accident quarter) - corrected as in Table 3.3
SM
96
121
137 119 101 114
Total 1,943
It is submitted that the actuary attempting application of the CL to the example data set is now confronted with a bewildering array of models, correctmns to models, and corrections to the correcuons.
The principal facts are that:
There are clear time trends in the data; One can attempt to deal with this by limiting the data on which the model relies to those of recent period. Here the example of averaging over the last 8 experience quarters is used, but there is no clear guidance to prefer 8 over say 4, or 6, or some other number. In any event, the last experience quarter appears fundamentally different from the preceding 7, and the extremely ad hoc procedure of dropping it has been adopted.
While the CL can be applied to any choice of data set, there is no apparent criterion for reliable choice of that data set. Moreover, the CL's phenomenological treatment of the trends is deeply unsatisfying. These trends must have a cause that resides somewhere in the detailed mechanics of loss payment. However, the formulaic nature of the CL renders it incurious as Io these details.
3 3 6

3.3 The effect of operational, time
It is common for the above type of instability to occur when rates of settlement of claims are changing over time. Berquist and Sherman (1972) suggest adjustment to loss reserving methods to take such movements into account.
They refer to "ultimate claims disposed ratio" to denote the proportion of an accident period's claims settled, and suggest that its outstanding claims should be in some way commensurate with the complement of settlement time. Reid (1978) introduced the term operational time to take the same meaning, and this terminology will be used below. This quantity is also referred to sometimes as "settlement time"•
Let N, denote the estimated number of claims incurred in ace=dent quarter i, i.e. the number ultimately to be not=fled in respect of this accident quarter. Then the operational time associated with (the end of) the (i,j) cell, denoted t.~ is
t,j = G,j / N,. (3.3)
Figure 3.3 plots how the operational times associated with various numbers of development years have changed over past accident quarters. It is seen that the operational time attained after 2 development years (i.e. at the end of development year I) increased from 33% for the September 1994 accident quarter to the 54% for the December 1998 accident quarter, and then declined somewhat for subsequent ace=dent quarters.
S~milar trends affected development years 2 and 3, but not lower or higher development periods.
Figure 3.3
Operational times for various development periods
100%
80%
60%
40%
et 0 20%
0%
03 03 03 (/) ¢/) ~ 09 ¢/) (/~
Acc iden t quarter
[ ---~-- After 1 dev yr I
- = - - After 2 dev yrs I
After 3 dev yrs I
After 4 dev yrs
- -~-- After 5 dev yrs
337

Figure 3.4 superimposes the plot of the quarterly age-to-age factor 3:2 on that of operational time at the end of development quarter 3. Figures 3.5 and 3.6 make the corresponding comparisons for age-to-age factors 7:6 and 11:10 respectively. In the first two of these cases, increases in age-to-age factors appear to coincide with increase in operational time, though the correlation is far fiom perfect.
Figure 3.4
Quarterly age-to-age factors 3:2 and operational times at end of development quarter 3
20%
=~ 15%
m : 1 0 % o
~. 5% 0
0%
I I
' _ ~ ~ ~ I , ,'P",~, , , , ~ '
¢J) U) t./) ¢/) U) tJ) rJ) ~ r/)
Acc iden t qua r te r
o Operational t=me - ~ - - Age-to-age factor 3:2 1
6.00
5.00
4.00
3.00 ?
2.00
1.00
0.00
Figure 3.5
Quarterly age-to-age factors 7:6 and operational times at end of development quarter 7
60%
55%
• ~ 50%
45% o
"~ 40%
O 35%
3O%
'~ ,", , . / ' , =e . . . . i , ' I . i ~ I ,
, , , , . ^ , ~ 2 ~ : , , , , ~ j , , ~ • ' ~ = " ;,I p p,-v .=
S d m':
Acc ident qua r te r
o Operat=onal time - 4 - - Age-to-age factor 7:6 j
1.70
1.60
1.50
1.40
1.30
1.20
1.10
338

Figure 3.6
Quarterly age-to-age factors 11:10 and operational times at end of development quarter 11
80%
i 7 0 %
o ' ~ 6 0 % Q. O
5O%
II , i i i q l 1 # t ~ t
- ~ Jl. I ~ ", / ,,
" h#' ' ji , ~
i Lw a
Acc ident quarter
I o Operational time - -=- -Age-to-age factor 11:10]
1.30
1.25
1.20 ,~
1.15 o
1.10 m
1.05
An ahernative means of controlling for changing operational times is to replace cumulative payments by cumulative average claim sizes in the analysis. The cumulative average claim size (of finalised claims) associated with the (id) cell, given by (2.3), may be expressed by means of (3.3) in the alternative form:
Tij = [cF,j / t,j] / Ni. ( 3 . 4 )
This shows that cumulative average claim size is a multiple of cumulative claim payments per unit of operational time. Such claim sizes might be more stable than payment based age-to-age factors in the presence of changing operational times.
Figure 3.7 plots the cumulative average claim sizes to the end of development quarter 3, for the various accident quarters, against the corresponding operational times. It is found that average claim sizes are not in fact insensitive to variations in operational time, but appear to display a better correlation with operational times than do age-to-age factors.
It will be seen later that this occurs because the claim sizes associated with a particular accident quarter tend to increase with increasing operational time.
A similar improvement in correlation is obtained for development quarter 7, as displayed in Figure 3.8. The corresponding results for development quarter I l are displayed in Figure 3.9.
339

Figure 3.7
Quarterly cumulative average claim size and operational times at end of development quarter 3
15%
10% 0
0 5%
I
/~ ' ~ , ~ . / ~ ~, ~ "~,~ .,,,,,,,,,,~,
° (/) u) o') u) (/) (/) (/) ~q o~
Accident quarter
o Operational time - 4 - - Average claim size I
$11.000
$10,ooo
$9,000 "~ E
$8,000 ~
$7.000 g
$6.000 >=
$5.000
Figure 3.8
Quarterly cumulatlve average claim size and o p e r a t i o n a l t i m e s a t e n d o f d e v e l o p m e n t q u a r t e r 7
6 0 %
55%
50%
'~ 45%
i 40%
O 35%
30%
j-~ ,'", T- ~
' r K~/IZ.... j / .,~ -
Accident quarter
L o Operational time - 4 - - Average claim szze ]
$23.000
$21.000 ._~ to $19.000 t=
$17.000
$15,ooo ~,
$13.000
$I 1,000
340

Figure 3.9
Quarterly cumulative average claim slze and operational times at end of development quarter 11
80%
~ 7 0 %
o ~ ~ %
o 50%
i i i
it._
. . . . . . .
Accident quarter
I o Operational t ime - -8- - A~erage claim size I
$35.000 $33.000 $31 ,oo0 .~ $29,000 = $27.000 .~
$25,000 i $23,000 $21.000 $19,000 $17,000
.
4.1
Exploration of triangular data on average claim size
Claim development measured by development quarter
The obsen,ations made on Figures 3.7 to 3.9 suggest that an average claim size analysis might be preferable to chain ladder analysis. Figures 4.1 to 4.3 therefore explore certain trends in average claim size. Each plots log(average size of finalised claims) against some variable. The triangular form of data is retained.
Figure 4.1 plots log(average size of finalised claims) against development quarter. This could have been carried out as a routine averaging process, but it proved efficient, and in fact more integrated with later sections, to obtain these averages through a modelling process.
Consider the model:
log S u = [3j + Eij, (4. I )
where
c.j - N(0, o), (4.2)
the % are stochastically independent, and the I~j, o are constants.
Equivalently,
341

Sij - logN(13j, o) (4.3)
For this model, simple regression estimates of the ~j are equal to the arithmetic means (taken over i) of the observed values of the log S 0. Figure 4.1 could have been derived in this way. EMBLEM software (see also Section 6) has been applied to fit the regression model (4.1) and (4.2) to the data, and the resulting estimates of the Igj plotted against j (see Figure 4.1). The same software is used to produce the remaining plots in this paper.
Figure 4.1 Average claim size by development quarter
i, N2
:%IQ~ : : = z
Figure 4.1 shows quite clearly how the average size of fmalised claims increases with development quarter, as foreshadowed in Section 3.3.
Figures 3.7 to 3.9 illustrated how (cumulative) average sizes of finalised claims have varied with accident period. Any such effect can be incorporated in the model represented by (4.1) and (4.2) by extending it to the following:
log S O = ~aj + 13ai + eij, (4.1a)
where the 13j in (4.1) are now denoted 13aj (the superscript d signifying that these coefficients relate to development quarters), and the accident quarter coefficients 13ai have also been introduced. The relation (4.2) is retained.
It is worth noting in passing that exponentiation of (4.1 a) yields
3 4 2

E[Sij] ffi K exp ~ . exp [B'i, (4.4)
where K is the constant, E[exp eij].
This is a model with multiplicative row and column effects, and hence is very closely related to the chain ladder. It is the same as the stochastic chain ladder of Hertig (1985) except that Hertig assumed the following in place of (4.2):
~j - N(0, oj). (4.2a)
Though related to the chain ladder of the type discussed in Section 3, models of this type differ from it, as was established by the exchange between Mack (1993, 1994), Mack (2000), Verrall (2000) and England and Verrall (2000).
Stochastic versions of the chain ladder have received extensive treatment in the literature (England and Verrall, 2002; Mack, 1993; Mack and Venter, 2000; Murphy, 1994; Renshaw, 1989; Verrall, 1989, 1990, 1991a, 1991b, 2000).
The coefficients 13aj and [3ai are no longer obtainable by simple averaging, but they are obtainable from simple (i.e. unweighted least squares) regression. Figure 4.2 gives the plot of the ~ai against i.
Figure 4.2 Regression estimate of trend in average claim size by accident quarter
NN
~ Z2 71::
343

The plotted values become less reliable as one moves from left to fight across the figure, because one is considering steadily less developed accident quarters. Hence the downward plunge at the right of the plot can be ignored. The indication is then that, when allowance for a development quarter trend of the type illustrated in Figure 4.1 is made, there remains an increasing trend in claim sizes over time.
The possibility of a time trend has been incorporated in the model in the form (4.1a), in which the specifc time dimension to which it is related is accident quarter, i.e. a row effect. It is possible, however, that the trend occurs over finalisation quarter, i.e. a diagonal effect, represented as follows:
log Sij ffi ]3 d + [3 f + Eij, (4.1b)
where k = i+j = calendar quarter of finalisation, and (4.2) is still assumed to hold.
FiRing this model to the data yields Figure 4.3 as the plot o f the [3 f against k. This also indicates a time trend. Adjudication on which of (4.1a) and (4.1h) provides the more appropriate representation of the trend may not be easy. This question will be deferred until Section 7 when rather more modelling apparatus is in place.
Figure 4.3 Regression estimate of trend in average claim size by finalisation quarter
344

4.2 Claim development measured by operational t ime
The use of operational time as a measure of claim development was introduced in Section 3.3. The models of Section 4. I may be re-formulated on the basis of it.
The operational time defined in (3.3) related to the end-point of time represented by the (i,j) cell. This was appropriate to the context of average claim sizes that were cumulative to that point. In the context of non- cumulative averages, as currently, the mid-value of operational time for the cell is more appropriate. This is
r, =~Et, +,,.,.,1 =*Fg +o,,_,]/N,
(4.5)
with the convention in the case j=0 that ti..t = GI..I = 0.
The quantity TO is a continuous variate in the sense that it may take any value
on the continuum [0,1]. It will be convenient, to convert it to a categorical variate by recognising.ranges of values in which it mtght lie.
For the present example, the interval [0,1] has been divided into 50 sub- intervals, [0%,2%), [2%,4%) ..... [98%,100%], labelled by the values 1,2,...,50. Then each cell average size S,j may be written in the alternative notation S,t, where t is the label corresponding to the mid-quarter operational time T o .
Then the re-formulation of model (4.1) in which j is replaced by T v as a
measure of development is as follows:
log S,t = 13, + e,t, (4.6)
with
ei, ~ N(0, o). (4.7)
the corresponding re-formulations of(4. I a) and (4. I b) are as follows:
log S,, = I~dt + 13°i + E;zt (4.6a) log Si, = ~d + 13r k + E,,. (4.6b)
The three models (4.6), (4.6a) and (4.6b) produce the plots in Figures 4.4 to 4.6 in place of 4.1 to 4.3.
345

Figure 4.4 Regression estimate of trend in average claim size by operational time
Note: The observation at operational time 53 should be ignored as it relates to a point with no data.
Figure 4.5 Regression estimate of trend in average claim size by accident quarter
346

Figure 4.6 Regression estimate of trend in average claim size by finalisation quarter
It is interesting to note, in connection with Figure 4.4, that the use of operational time appears also to have simplified the relation between average claim size and the measure of development of an accident quarter. Indeed, average claim size appears closely approximated by an exponential function of operational time over the interval of roughly [ 10%, 100%].
The actuary responsible for loss reserving against the example data set will by now have reached the following position:
Any conventional application of a paid loss CL is dubious (Section 3.2). It appears that analysis of average claim sizes may be preferable (Section 4.1). It may also be desirable to take operational time into account somehow (present sub-section). The incorporation of a paid loss development pattern (as a function of operational time) together with the simultaneous identification of a time trend was achieved in Figures 4.4, 4.5 and 4.6 by means of regression.
Further progress by means of modification ofa CL model appears difficult in the face of these observations.
347

.
5.1
Mode l l ing individual c la im data
Regression models
If one is impelled toward some form of regression modelling such as in Section 4.2, there is an argument that the regression may as well be carried out by reference to individual claim data as to the triangular summaries used there. The same models as applied in Section 4.2 can be formulated in terms of individual claims, and the use of data summaries then seems unnecessary and artificial.
As a preliminary to this, it will be useful to express (4.6) and its variants in a form more conventional for regression. Thus, (4.6) may be written as:
log S,~ = X,, [3 + ~,,, (5. I )
where [3 is the vector of quantities [3t, viz. ([31, [3., ..... [3so) r, with the superscript T denoting matrix transposition, and X,, is the row vector (X,,i, Xit2 ..... X,,~o) with X,~m = I if operational time label m is associated with Si,, and X,~,, = 0 otherwise.
Thus the operational time variate in (4.6) is represented as a 50-vector of binary components. Regression variates of this type are often referred to as class variates, or factor variates. The numerical values corresponding to the binary components are called levels. Factor variates enable further simplification of the regression equation, with (5. I) being written as:
log S = X [3 + ~, (5.2)
where log S is (with a slight abuse of notation) the column n-vector of all observations log S.,, taken in any convenient order, X is the nx50 matrix formed by stacking the n row vectors X,t, taken in the same order as the log S,t, and ~ is the n-vector of the c.,, also taken in the same order.
Let Y, denote the size of the r-th fmalised claim. This claim will have associated values of i, j and k=i+j=calendar quarter of finalisation. It will also have an associated value of t=operational time at finalisation. Let this collection of observations on the r-th claim be denoted Jr, j,, I~., tr.
The quantity tr may denote operational time specifically, or it may be converted to the categorical form described in Section 4.2. The latter is chosen for the purpose of the present paper.
The model described by (4.6) and (4.7) requires very little modification for application to individual claims. Expressed in the form (5.1), it becomes:
log Yr = X~ [3 + ~;r, (5.3)
with
348

5.2
~r -- N(0, (J) (5.4)
where Xr is the value of the operational time class variate applicable to the r-th claim and ~r is the stochastic error term eit associated with it.
Just as (5.1) was notationalIy contracted to (5.2), so (5.3) may be abbreviated
to:
log Y -- X l~ + e, (5.5)
The general idea underlying the models of Section 4.2 is that Yr takes the
form:
log Yr = function(ir,jr,kr,tr) + stochastic error (5.6)
and that this may be written in the linear form (5.3), and hence (5.5), with Xr denoting a row composed of variates derived from Jr, jr, kr, tr. These may or may not be factor variates.
Basic t rends
Consider the model represented by (5.3) and (5.4), with Xr denoting the operational time factor variate discussed there. Ordinary least squares regression estimation'of [3 yields Figure 5.1, which plots the components 13~, [32 ..... ~50 of [3 against their associated midpoint operational times 1, 3 ..... 99.
Figure 5.1 Individual claim regression estimate of t rend in average claim size by operational t ime
/
349

Not surprisingly, Figure 5.1 closely resembles Figure 4.4, although Figure 5.1 exhibits greater smoothness due to the fact that it is based on about 60,000 observations, compared with ½x38x39=741 in the case of Figure 4.4.
The other models of Section 4.2, namely (4.6a) and (4.6b), may also be adapted to the form (5.3) and (5.4). The adaptation of (4.6a), for example, yields a version of (5.3) in which Xr comprises factor variates for operational time and accident quarter respectively. Figure 5.2 plots the components of the parameter vector 13 relating to accident quarter.
Figure 5.2 Individual claim regression estimate of trend in average claim size by accident quarter
3.4o~
The adaptation of (4.6b) is similar but with Xr comprising factor variates for operational time and finalisation quarter respectively. Figure 5.3 plots the components of the parameter vector 13 relating to finalisation quarter.
The trends displayed in Figures 5.2 and 5.3 differ somewhat from those in Figures 4.5 and 4.6. Presumably, the additional information included in the regression through the use of individual claims has improved their estimation.
350

Figure 5.3 Individual claim regression estimate of trend in average claim size by finalisation quarter
5.3 Stochastic error term
The model (5.3) and (5.4) contains the stochastic error term ~, which by (5.4) is assumed normally distributed. That is, Yr is assumed log normally distributed. This is a convenient assumption for the conversion of a multiplicative model for Yr to an additive model for log Yr- However, one should check whether it is in accordance with the data.
This question may be investigated by means of residual plots. The residuals naturally adapted to the normal distribution are the Pearson residuals, defined as follows.
Consider the general model (5.5) and let ~,~ denote the regression estimates
of 13, a respectively. Define
Ix = E[log Y] = X 13 (5.7)
and
O=x#, (5.8)
the estimate of Ix, and hence the fitted value corresponding to Y.
351

The Pearson residual associated with observation Yr is
Rr P = (log Yr -- ~r ) / ~½ (5.9)
where ~ is the following estimator of V[RPr]:
n 2
= ~(log r,-~r) /("-P) (5.I0) r-I
with p the dimension of the vector l~, i.e. the number of regression parameters.
The Pearson residuals should be approximately unit normal distributed for large samples subject to (5.4). Figure 5.4 plots them for the model underlying Figure 5.3, indicating substantial negative skewness. This is confirmed by the alternative views of the residuals presented in Figures 5.5 and 5.6.
Figure 5.4
This suggests that the logarithmic transformation has over-corrected for the long tail of the Yr, i.e. these observations, while fight skewed, are shorter tailed than log normal. In this event, the choice of working with log transformed data, as in (5.5) is a poor one.
352

Figure 5.5 Figure 5.6
.
6.1
The exponential dispersion family and generalised linear models
The exponential dispersion family
One actually requires a distribution of the 8r that lies between normal and log normal in terms of long-tailedness. The exponential dispersion family (EDF) of likelihoods (actually quasi-likelihoods) provides a comprehensive family within which to search for a distribution with suitable tail length.
The EDF comprises the following family of quasi-likelihoods (Nelder and Wedderbum, 1972):
f(y;0,k) = a(k,y) exp ~. [y0 - b(0)] (6.1)
where 0,k are parameters and a(.) and b(.) are functions characterising the member of the family.
It may be shown that, for this distribution,
E[YI0,L] = b'(0) (6. I) Var[YI0,L] = b"(0)/L (6.2)
Denote b'(0) by ~t(0) whence, provided that la(.) is one-one,
Var[YI0,L] = V0t)/L (6.3)
for some function V(.) called the variance function.
Many applications of the EDF restrict the form of the variance function thus:
V(la ) = ~t p (6.4)
3 5 3

6.2
for some constant p_>0. This likelihood w,ll be referred to as EDF(p).
the quantity ~p = I /k is called the scale parameter .
Special cases of the EDF are:
p=O: normal p=l: Poisson p=2: gamma p=3: inverse Gaussian.
GeneraHsed linear models
Now let Y be a random n-vector, as m Section 5. Suppose YhYz,...,Yn to be stochastically independent drawings from the EDF likelihoods
f(yr;0r,k) = a(L, yr) exp k [y,O, - b(0,)] (6.5)
where the same k, a(.) and b(.) apply to all r.
Suppose further that It(0,) takes the form
I t ( 0 r ) = h'l(Xr~) (6.6)
for some one-one function h(.), called the link function, row p-vector X, and column p-vector I~.
With the same slight abuse of notation as occurred in connection with (5.2), the n relations (6.6) may be stacked into the form
It(0) = h~(Xl~) (6.7)
where 0 is the column n-vector with r-t.h component 0, and X is an nxp design matrix. The n-vector XI~ is called the linear response.
This specification of the vector Y ~s called a Generallsed Linear Model (GLM) (Nelder and Wedderbum, 1972). GLMs are discussed by McCullagh and Nelder (1989). Note that the general linear model arises as the special case o fa GLM with normal error term and identity 1,ink function.
The parameter vector I~ may be estimated by maximum likelihood. Generally, closed form solutions are not available, but various software products perform the estimation, e.g. SAS, S-Plus, EMBLEM. This paper uses the last of these, an interactive package produced by EMB Software Ltd of the UK.
Maximisation of the likelihood L[YI0,k] is equivalent to minimisation of the so-called deviance D[Y[0,k] where
3 5 4
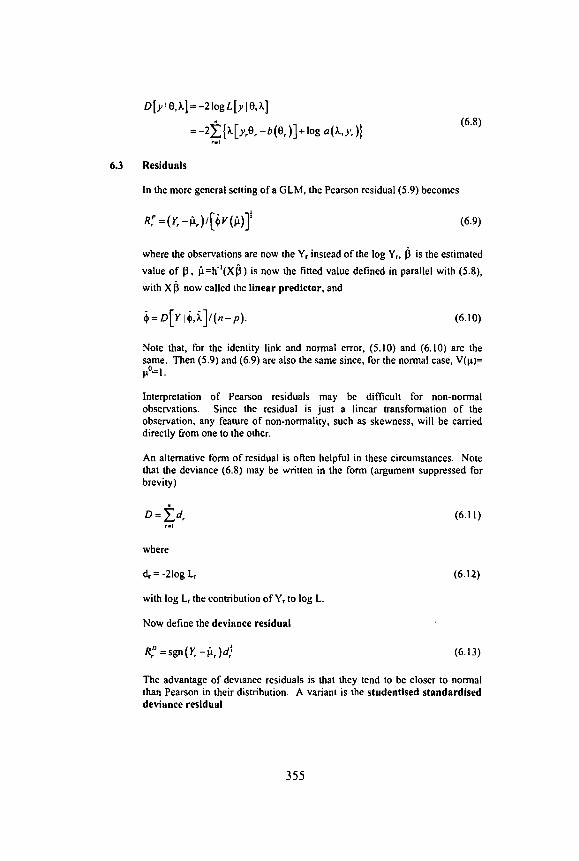
6.3
D[y ]0,~.] = -21ogL[y 10,~,]
= -2~=, {k [y,O, -b (O, )] + log a (k,y,)} (6.8)
Residuals
In the more general setting o fa GLM, the Pearson residual (5.9) becomes
R: .~(Y, - ~,)/[(~V (l~)] '~ (6.9)
where the observations are now the Yr instead of the log Yr, [3 is the estimated
value of 13, O=h1(X 0 ) is now the fined value defined in parallel with (5.8),
with XI3 now called the linear predictor, and
= D[Y I*,~.]/('-P). (6.10)
Note that, for the identity link and normal error, (5.10) and (6.10) are the same. Then (5.9) and (6.9) are also the same since, )'or the normal case, V(V.) = It °= 1.
Interpretation of Pearson residuals may be difficult for non-normal observations. Since the residual is just a linear transformation of the observation, any feature of non-normality, such as skewness, will be carried directly fi'om one to the other.
An alternative form of residual is often helpful in these circumstances. Note that the deviance (6.8) may be written in the form (argument suppressed for brevity)
O=~a, (6.11) e . l
where
dr = -2log Lr (6.12)
with log Lr the contribution of Yr to log L.
Now define the deviance residual
.d~ R, ~ = s g n ( Y , - I t ) , (6.13)
The advantage of devmnce residuals is that they tend to be closer to normal than Pearson in their disuibution. A variant is the studentised standardised deviance residual
355

o
7.1
R, ss° = R, D/[~(1- z, )j1" (6.14)
where zr is the r-th diagonal element of the nxn matrix x(xTx)IxT. These residuals tend to have a distribution close to unit normal.
Application of GLM to data set
Loss reserving with GLMs
Although the use of GLMs in loss reserving is not widespread, it is also not n e w .
The use of general (as distinct fiom generalised) linear models can be seen in Taylor and Ashe (1983), Ashe (1986) and Taylor (1988). These two authors were in fact using GLMs for loss reserving consulting assignments during the 1980's.
The general linear model is also inherent in the loss reserving of De Jong and Zehnwirth (1983), based on the Kalman filter, and the related ICRFS software (Zehnwirth, 2003), marketed since the late1980's.
Wright (1990) gave a comprehensive discussion of the application of GLMs to loss reserving. Taylor, McGuire and Greenfield (2003) also made use of them.
All of these models other than in the last reference were applied to summary triangles o f claims data, such as used in Section 4, rather than individual claims.
7.2 Choice of error distribution
As suggested at the start of Section 6. I, one requires an error distribution that lies between normal and log normal in terms of Iong-tailedness. Experimentation might begin with a gamma distribution. This is a more reahstic distribution of claim sizes than normal, its density having strictly positive support and positive skewness. It is, however, considerably shorter tailed than log normal.
Consider the gamma (i.e. EDF(2)) GLM corresponding to (5.5). It has the same X and 13, but observations are Y, instead of log Y,, and the link function is log. For example, the particular form of this model adapted to (4.6b) is as follows:
Y, - EDF(2) (7. I )
E[Y] = exp XI]. = exp [xd[5 a + X~'l~ f ] (7.2)
3 5 6

where X d and X f are factor variates for operational time and finalisation quarter respectively.
Fitting this model to the data set yields the residual plots set out in Figure 7.1•
Figure 7.1
r
Comparison of Figure 7.1 with 5.4 reveals that the use of a gamma rather than log normal error has corrected the most obvious left skewness of the residuals. However, Figures 7.2 and 7.3 give more detail of the residuals and indicate that they are not altogether satisfactory.
Figure 7.2 Figure 7.3
The studentised standardised residuals are expected to resemble standardised unit normal residuals. The largest 1,000 of these (from 60,050 observations) would numerically exceed 2.4. Figure 7.2 conforms reasonably well with this requirement, displaying residuals numerically exceeding a threshold value of roughly 2.6.
357

However, extreme values, up to 12, appear, indicating a much longer tail than normal. This abnormality in the residual plot is emphasised in Figure 7.3, which displays the largest 100 residuals. The unit normal range for these has a threshold value of about 3.1. the observed threshold exceeds 4, and all 100 residuals are positive.
Figure 7.6
These properties of the residual plots indicate that the distribution of claims sizes is longer tailed than gamma. As indicated by (6.3) and (6.4), a larger EDF exponent p will generate a longer tail. Therefore, one experiments with values of p>2 (gamma). Figures 7.4 to 7.6 are the residual plots for EDF(2.3) corresponding to Figures 7.1 to 7.3.
Figure 7.4 Figure 7.5 . . . . .
. . . . . . . . . . . . . . . . . . . . . . . . . .
~ ~ - ~ : ' 7 , , ~ % ~ @ ~ $~ ~ v a e i / ~ ' ~ ,
Figure 7.7
× .
Figure 7.4 shows that the shift to the longer tail of EDF(2.3) has over- compensated somewhat for the right skewness, producing a degree of left skewness. Figure 7.5 shows little change in the threshold value of the largest 1,000 residuals. However, Figure 7.6 shows considerable improvement in the treatment of the extreme tail.
The final choice of claim size distribution needs to balance these observations. Generally, the improved treatment of the tail would be expected to improve
358

7.3
7.3.1
robustness of the parameter estimation such that this more than offsets the unwanted skewness near the centro: of the distribution. The choice of EDF(2.3) will be retained for the remainder of this paper.
There is a practice, common among actuaries, of separately analysing "small" and "'large" claims, however defined, on the ground that the latter group are liable to distort the averaging processes inherent in modelling. It is worth remarking that the explicit incorporataon of a (relatively) long tailed error distribution in the model (such as EDF(2.3) as above), and the adoption of a procedure for parameter estimation that is consistent with this distribution, may eliminate the need for this practice.
Figure 7.7 displays a further residual plot in which residuals are plotted in box-whisker form against operational "time. The boxes correspond to the range between 10- and 90-percentiles, and the markers on the whiskers are placed at the 5- and 95-percentiles.
Once a tentative choice of claim size distribution has been made, it is necessary to examine plots of this type against each independent variate. These examinations seek two things:
• Trendlessness from left to fight (horizontality of the box centres) • Rough equality of dispersion (boxes all of about the same size).
Violation of the fast requirement indicates some dependency of the dependent variable on the independent vanate, not already accounted for in the model. The second requirement checks for homoscedastleity, i.e. that (6.3) holds for a value of q) that is constant over the entire range of the independent variate under scrutiny.
Refinement of the model design
Operational time
The model discussed in Section 7.2 still has the very elementary form set out in (7.1) and (7.2). The factor variate X a, defined in Section 5.1, has 50 levels, which means that ~d contributes 50 parameters to the model. Inspection of Figure 5.1 indicates, however, these 50 parameters can be closely represented as linearly related to operational time over much of the latter's range.
Write (7.2) in the form:
E[Yr] = exp Xrl~ = exp [Xa,~ a + XrrlB f ] (7.3)
where X a, and X r, are the values of the factor variates X a and X f assumed by the r-th observation.
Now replace this by the form:
359

E[Yr] = exp Xr[3 = exp [[3dl t~ + 13a2 max(0,10-tr) + 13a3 max(0,tr-80) + xfl3 f ] (7.4)
where tr is the value of operational time applying to the r-th observation, and [3dl, 13a2 and ~d3 are scalar parameters.
This is equivalent to representing the operational time trend in Figure 5.1 as a piecewise linear trend with breaks in gradient at operational times 10 and 80. The factor variate has been replaced by a set of continuous variates.
This enables operational time to be accommodated in the model by means of just 3 parameters, rather than 50. The factor variate representation of finalisation quarter is retained for the time being.
I f the model (7.4) is fitted to the data, with error term EDF(2.3), as suggested by Section 7.2, the operational time component of (7.4) is as shown by the piecewise linear plot in Figure 7.8. It is superimposed on the factor variate plot in the figure. The correspondence between the two representations is seen to be quite good, indicating that the 3-parameter representation captures essentially all the information of the 50-parameter one.
7.3.2 Superimposed inflation
Similar economies in the representation of finalisation quarter can be made. Figure 7.9 shows the plot of the parameter vector I~ f in the case of a factor variate fitted in the presence of the continuous representation of operational time, as in (7.4).
Figure 7.8 Continuous operational time variate
Figure 7.9 Factor variate representation of finalisation quarter
The trend displayed in the left portion; especially the left-most point, may be discounted, since the finalisation quarters here relate to the top left diagonals of the data triangles in Appendix A and contain comparatively little data. As might have been expected, Figure 7.9 is similar to Figure 5.3 over the range of finalisation quarters common to them.
3 6 0

One possibility would be to fit a linear trend from the beginning of 1997. An appropriate choice of model for the earlier finalisation quarters is unclear but, in view of the small quantity of data represented here and its antiquity, the model chosen is unlikely to affect estimation of a loss reserve unduly.
Consequently, Figure 7.10 relates to a model in which the linear trend assumed to apply to finalisation quarters from 1997 onwards is cavalierly assumed to apply to the earlier ones also, though with a step in claim sizes occurring at the start of 1997.
In this case, (7.4) is replaced by:
E[Yr] = exp [a + [~dl t~ + lid2 max(0,10-tr) + 13a3 max(0,tc-80) + 13fl kr + 13 f I(kr<97Q1)] (7.5)
where kr is the number of the finalisation quarter applying to the r-th observation, ct, 13 q and [~f2 are scalar parameters, and generally I(.) is the indicator function defined as follows:
I(c) = 1 if condition c holds; = 0 if it does not. (7.6)
The constant ct now becomes necessary, having previously been absorbed into ~f.
Figure 7.10 Continuous finalisation quarter variate
Figure 7.11 Additional break in finalisation quarter trend
the
The comparison in Figure 7.10 between the trend of constant gradient over finalisation quarter and the corresponding factor variate hints at an increase in gradient over the more recent finalisation quarters. Figure 7.11 therefore represents an alternative model in which the gradient changes at the end of the September 2000 quarter.
Formally, the model (7.5) is replaced by:
361

E[Yr] = exp [a~ 13el t, + 13d2 max(0,10-h) + 13a3 max(0,te--80) + [3fl I~. 13f2 max(0,k, - 2000Q3) + [~r I(kr<97QI)]. (7.7)
One will need to make a choice between models (7.4), (7.5) and (7.7), and possibly others. The choice can be made on the basis of the so-called information criteria, which reward goodness-of-fit but penalise additional parameters. For example, the Akaike Information Criterion (ALL") (Akaike, 1969) is defined as:
AIC = D + 2p (7.8)
where D denotes deviance and p number of parameters. Models with low values of the AIC are to be preferred.
Table 7.1 gives values of the AIC for the three models under consideration, showing that:
The factor variate model is dramatically inferior to the two involving continuous finalisation quarter variates; and Model (7.7), allowing for a change in gradient of the trend is the best of the three.
Table 7.1 AIC for different models of finalisation quarter effect
Model of finalisation quarter effect
Factor variate (7.4) Constant gradient trend (7.5) Change in gradient of trend (7.7)
AIC
-14,517.6 -14,566.6 -14,567.1
7.3.3 Interaction terms
The trend over finalisation quarter measures the increase in claim sizes in real terms over calendar time, and may therefore be interpreted as SI. Figure 7.1 I indicates that the preferred model estimates the factor of increase as about exp(0.22) over the 3 years fi'om September 2000 to September 2003, or equivalently more than 7% per annum.
While it is quite possible for smaller bodily injury claims to inflate at this rate, it is less usual for the larger and catastrophic claims. A question arises, therefore, as to whether larger and smaller claims might be subject to differing rates of SI.
If operational time is adopted as a proxy for distinguishing between large and small claims, then one might investigate whether different operational times are subject to different rates of SI. This is done by searching for statistically significant interaction effects between operational time and flnalisation quarter.
362

For this purpose, the 0-100 range of operational time is divided into the following 7 bands: 0-6, 6-14, 14-22, 22-40, 40-60, 60-80, 80-100, denoted b~,...b~ respectively. Let X bt denote the banded operational time factor variate, and let xbtr be its value for the r-th observation.
The following model is then fitted:
E[Yr] = exp [X"r~ ~t + xb'® ~r~13 b'®cf] (7.9)
where X" represents the set of three continuous operational time variates appearing in (7.7), X ~r represents the set of three continuous finalisation quarter variates in the same expression, and X b' ® cf denotes the 2 I-component vector of variates formed as the cartesian product of the 7-component X b' and 3-component X or. Cartesian products of this b'pe are called interaction variates in GLM parlance.
Model (7.9) may be written in the equivalent form:
E[Yr] = exp {~ + ~dl tr + [3d2 max(O, lO-t,) + [3d~ max(O,t.,-80) +
y , I(t~ ® bm) [[3~, k,+ [3rm~ max(O,k~ - 2000Q3) + 13fm3 I(Iq<97QI)] (7. I O) m - I
whose square bracketed member retains the same functional dependency on finalisation quarter as in (7.7), but separately for each operational time band.
f n l Note that the coefficients [3rm~, [3 ,,a, ]3 ,,o represent SI in operational time band bm.
Figure 7.12 provides a display of the interaction term when (7.9) is fitted to the data. Here "'opband7(m)" denotes band bin. For each of these bands, the model's linear predictor, as defined in Section 6.2, is plotted for t,=O. Features of the plot are as follows:
• The general level of claim size is seen to increase with increasing operational time band (as in Figure 7.8)
• While Figure 7.11 indicated the period since September 2000 to be subject to an increased rate of SI, it is now seen that this is confined to the operational time bands b,,, bj, and b~, which cover operational times 6..40. As hinted at the start of the present sub-section, the increased SI does not apply to the larger claims settled at the high operational times.
• The rate of Sl over recent periods, which is measured by the gradients of the paths appearing m Figure 7.12, peaks in operational time bands b3 and b4, i.e. in the range 14-40.
The last remark suggests that the interaction terms represented by the summation in (7.10) can be simplified by means of continuous variates. An example of such a simplification is the following:
363

E[Yr] = exp {it + 13dl tr + [~d2 max(0,10-t¢) + [~d 3 max(0,tr--80) + 13fl k~ +13 % max(0,k~- 2000Q3) + 13 q I(k~<97Q1) + r(t0 [1~%+ 1~2 max(0,k~- 2000Q3)]} (7.11)
where
"t(t) = min( 15,max(0,t- I 0)) - min(15,max(0,t-25)) (7.12)
i.e. 7(0 describes a function that is zero everywhere on the interval [0,100] except on the sub-interval (10,40), where it describes an isosceles triangle of height 15.
Figure 7.12 Interaction between SI and operational time
VTVTTTVVTVVTVVVTTTvVTVYVTVVVVVTVTT~ 0 o o o o e 0 °
o o o o o o ~ o o o o- • ~ o o o o o 0 o o o o O o O O O ~
• • • • • • • • & • & A • & • • • • & • • • & • • A • A • • & • & • • •
• 4 - opband7 (1)
• opband7 (2)
• opband7 (3)
opband7 (4)
v opband7 (5)
opband7 (6)
~- opband7 (7)
It can be seen that (7.11) comprises (7.7) plus a further term representing additional SI in the operational time range 10-40, at a rate that increases steadily fTom 0 at operational time 10 to a peak at operationaI time 25, and then declines steadily to 0 at operational time 40.
Fitting this model to the data produceslhe SI profile illustrated in Figure 7.13. Figure 7.14 provides the same type of display of model (7.11) as appears in Figure 7.12, and facilitates the comparison of model (7.11) with model (7.10). Here "opband7(m)" is as in the earlier figure, and "+opband7(m)" denotes the corresponding plot for the continuous model (7,11), i.e. the plot of the average linear predictor against k for tr=0 and tr® bin.
3 6 4

Figure 7.13 Profile of SI allowing for SI x operational time interaction
Superimposed inflation
30%
"o 25%
o
E • ,,- 20%
= ~ 15%
E 10%
== 5% e-
0% 0 10 20 30 40 50 60 70 80
Operational time
I Up to Sep 2000 After Sep 20001
Figure 7.14 Interaction between continuous SI and operational time variates
90 100
8.0 - ~ - ~ -
• 4, 4, 4, • $ ' 4 ' V V ' I ' ~ ' e e $ '$" 4' e , $ . v ,~ ,i, e e $ e .* $, * • * * ~ .
• ~ ( 4 )
365

The simplified model (7.11) is seen to produce a reasonable fit to the more elaborate (7.10). It would not be acceptable as it stands, as there are systematic discrepancies, particularly in relation to opband7(1). However, certain aspects o f this model will be superseded in Section 7.3.4, and so detailed improvement of it is not pursued here.
7.3.4 Accident quarter effects
Section 7.3.3 has already noted the change in rate o f SI at the end of September 2000, and how the rate changed much more at the low operational times than others. In fact, the legislation governing the scheme changed at precisely this date.
All subsequent accident periods were subject to limitations on payment of plaintiff costs, whose expected effect was to eliminate a certain proportion of smaller claims in the system. Larger claims were expected to be unaffected. The scheme of insurance, as modified by these changed rules, will be referred to as "the new scheme". Prior accident quarters make up the "the old scheme".
This strongly suggests that some or all of the SI observed at low operational times after September 2000 might constitute an accident quarter (row) effect rather than finalisation quarter (diagonal) effect. In this connection, it is noted from Figure 3.3 that virtually all of the exceptional operational times (<40) after September 2000 relate to the new scheme.
It is worthwhile returning to the average claim size data in respect o f the new scheme. This is done in Table 7.2.
Table 7.2 Average sizes of claim finaHsations for old and new schemes
Accident Average claim sizes (in 30/09/03 values) in development quarter quarter 0 I 2 3 4 5 6
$ $ $ $ $ $ $ $
Dee-9~ 547 6,035 8,934 11,699 18,397 18,062 26,086 32,13~ Mar-0( 5,050 5,185 6,958 14,904 13,504 20,746 22,489 27,87 c. Jun-0C 2,910 4,177 7.433 10,275 13.895 18,916 26,206 32,89~ Sep-0C 6.512 7,116 9,917 14,163 24,034 27,392 41,85] Dee-0( 221 24,393 29,70( Mar-01 792 2,5 20,672 29,574 39,96~ Jun-01 1,271 ~ ~ 16,207 21,294 34,237 40,81,~ Sep-01 1,258 12,012 21,726 25,997 26,019 38,15( Dee-01 1,355~ ~ 11,374 19,439 22,548 35,709 28,962 Mar-02 1,594 ,018 14,700 16,768 26,827 26,851 Jun-02 1,017 [.~ 8,669 12,905 17,750 25,063 Sep-02 3,484 ~ i ~ 5,982 14,379 18,852 Dee-02 8,102 ~ 6,493 10,714 Mar-03 1,182 ~ 2,931 Jun-03 2,327 Sep-03 103
3 6 6

7.4
The heavy horizontal line in the table marks the passage from old to new scheme. Claim sizes are seen to decline instantaneously and substantially on introduction of the new scheme.
The shaded area marks one in which the reduction in claim size is maintained. Below this shaded area, however, claim sizes increase rapidly, and by the December 2002 fmalisation quarter (the fourth last diagonal) are in excess of their old scheme counterparts.
The immediate reduction in claim sizes by the new scheme is certainly a row effect, and needs to be modelled as such. The subsequent increase in claim sizes can be viewed as either:
• a diagonal effect limited to low operational times (as in Section 7.3.3); or
• a row effect limited to low operational times.
In view of its likely origin in the new scheme, it is perhaps better regarded as the latter. This is the view taken in this paper, and reflected in the final model fitted to the data in Section 7.4. Details of the trend identification are similar to the examples dealt with above, and are not given here.
Final model
The final model fitted to the data set takes into account the issues discussed in Sections 7.1 and 7.2, and also includes a seasonal effect whereby the sizes of claims t'malised in the March quarter tend to be slightly lower than in other quarters. It takes the following form:
E[Y~] = exp {a + 13d I If 4- 13d 2 max(0,10-t~) + 13d3 max(0,t,,--80) + 13d4 l(h < 8) [Operational time effect]
+ 13~ l(k~=March quarter) ]Seasonal effect]
+ 13tl k¢ + 13r2 max(0,1~. - 2000Q3) + 13c3 l(k,<97Q 1 ) [Finalisation quarter effect]
+ k~ [13~f] t¢ + 13~f max(0,104,)] [Operational time xfinalisation quarter interaction]
+ max(0,35-tr) [13~1 + 13=2 i(ir > 2000Q3)]} [Operational time x accident quarter interaction]
(7.13)
where i, is the accident quarter applying to the r-th observation.
The model form (7.13) is set out in a series of components that isolate the different types of effects, labelled in italics on the right.
Comparison of it with (7. I I ) shows that:
367

• It retains the concept o f an operational time x finalisation quarter interaction, though this now: o has its peak rate of SI shifted from operational time 25 to 10; and o this profile o f SI applies to all finalisation periods, not just those
that fall within the new scheme. • There is heightened SI in the new scheme, but affecting all operational
times, not just the low range. • A part of what previously appeared as heightened SI in the new
scheme is now accounted for as an accident period effect, with a one- offshift in claim size at introduction of the new scheme, the size of the shift being largest at the low operational times and gradually decreasing with increasing operational time, until petering out at operational time 35.
Table 7.3 compares the AIC for model (7.7) with the final model, showing a considerable improvement achieved by the latter.
Table 7.3 AIC for final model and model (7.7)
Model of finalisation quarter effect
Model (7.7) Final model (7.13)
AIC
-14,567.1 -14,588.9
7.5 Validation of final model
While (7.13) may appear the best model achievable, it needs to satisfy a number of routine tests before its final acceptance. These are concerned with the properties of residuals, and are illustrated in Figures 7.15 to 7.20.
Figure 7.15 Figure 7.16
Figures 7.15 to 7.17 test for two things:
368

Trendlessness, from left to right, with respect to the major variates, checking that no systematic trend in the data remains uncaptured by the model; and Homoseedastieity, i.e. constant dispersion from left to fight.
Both of these tests are concerned just with trends rather than with the magnitude of the residuals. Hence standardisation is unnecessary (though it would do no harm), and just deviance residuals are displayed.
The possible trend at the extreme fight of Figure 7.17 is, o f course, based on very little data, as it relates to just the last three accident quarters. It has been ignored for the purposes of the present paper.
Figure 7.17 Figure 7.18
Figure 7.19 Figure 7.20
. . . . . . . . . . . . . . . . . . . . . . . . 7 . . . .
. . . . . . . . . . . . . . . . . . . . . . . . . . .
Figures 7.18 to 7.20 are concerned with the distribution of the residuals, with the same considerations as discussed in relation to Figures 7.4 to 7.6. Indeed, there is little difference to the naked eye between the two sets of graphs, showing that, once the EDF(2.3) error structure has been chosen, the rather extreme change in model from (7.2) to (7.13) has had little effect on the distribution of residuals.
369

7.6 Forecast of final model
Table 7.4 repeats Table 3.3, but supplemented by the loss reserve forecast by model (7.13). The following assumptions are made for the purpose of this forecast:
The experience of f'malised claims of an accident period is indicative offls ultimate average claim size. Future SI is as experienced to date in the new scheme. Future rates of claim finalisation are about the same as experienced over the most recent 8 quarters.
The first of these assumptions is fundamental to the forecasting methodology. it might be violated if, for example, at specific operational times, one observed a trend over time in the ratio of average amount paid to date on open claims to the average paid on finalised claims.
The second assumption has a major influence on the forecast, the third little influence.
Table 7.4 Loss reserves corrected and uncorrected for low September 2003 quarter paid loss experience
Averaging period
Chain ladder models: All experience quarters Last 8 experience quarters
All experience quarters except September 2003 Last 8 experience quarters except September 2003
GLM (7.13)
Loss reserve at 30 September 2003 (excluding September
2003 accident quarter) Uncorrected Corrected
$B
1.61 1.68
1.78 1.92
2.23
$B
1.94 2.35
The GLM (7.13) generates a loss reserve near the top of the range of CL results. While there is reasonable agreement with the CL version derived from the experience of the last 8 quarters but one and corrected for the anomalous experience of the last quarter, this is a very detailed choice, and one has no means of determining this model to be superior to many other contenders.
For example, why 8 quarters? Why not 67 Or 10? Why correct for just the last quarter ofexperience? Why not the last 2? In any event, Table 7.5 shows that, while this version of the CL may produce a total resen, e similar to that of the GLM, its composition by accident quarter is very different.
3 7 0

The former produces a reserve for the last accident year that is 19% higher than the GLM. This would lead to much higher estimates of average claim size, and hence to quite different pricing decisions for future underwriting periods.
Table 7.5 GLM and CL loss reserves by accident quarter
Accident quarter
Sep 94 - Dec 98
Mar 99 - Mar 02
Jun 02 Sep 02 Dec 02 Mar 03 Jun 03
Loss reserve at 30 September 2003 (excluding September 2003 accident quarter)
GLM (7.13) CL based on last 8 experience
$M
283
1,122
154 159 160 173 179
quarters except the last - corrected
200
I,I 74
183 199 201 206 192
Total 2,229 2,354
The validation devices represented in Figures 7.15 to 7.17 have the common feature that they are all l-dimensional summaries of residuals. While the residuals may be trendless over the single dimension, finahsation quarter, and may also be trendless over the single dimension, accident quarter, it is possible thai there are pockets of cells within the 2-dimensional triangle ,n which they tend to be systematically of the one sign.
Figure 7.21 provides a simple test of such an eventuality. For each cell of the accident quarter/development quarter triangle, it records the ratio:
Observed average size ofclaim finalisation / GLM fiued average size.
These ratios are colour coded: red if greater than 100%, blue if less. The fact that the numerical values of the ratios are too small to be legible in the figure as reproduced here does not detract from its value A cursory examination o f its colout patterns indicates a generally random scatter of red and blue.
There is no apparent congregation of cells of one or other colour in particular locations within the triangle. This confirms the trendlessness of the residuals over the whole of the 2-dimensional array.
371

Figure 7.21 Colour coded ratios of observed to fitted average claim sizes
Ratio of observed to average claim size in development quarter
. . . . . H . . . . i ~ ~ - - i - - o . m . . . . . . . . i l i a - - i ~ |
. C o n c l u s i o n s
The foregoing sections have dealt with a case study involving a loss triangle of obvious complexity. It contains multiple trends.
The triangle has been approached initially from the viewpoint of one with a predisposition to application of the CL. The trends then manifest themselves in the form of non-constancy of age-to-age factors over accident periods.
The complexity of the data set is reflected in the model of claim sizes fitted to it, which includes the following, in addition to the expected variation with operational time:
• a seasonal effect; • SI whose rate varies with operational time, and also passes though one
change-point; • recognition of a new scheme affecting accident periods after its
introduction, but with an effect that varies with operational time.
It is extremely difficult to accommodate such trends within the CL structure and estimate them efficiently. However, the GLM (7.13) adopted here does so parsimoniously, using just 13 parameters. This compares with the 73 parameters implicit in a CL applied to a triangle of dimension 37 even before the recognition of any trends.
372

The GLM is one example of a model with a fully stochastic specification, as opposed to the CL which is usually approached in practice as an algorithm (though the stochastic formulations mentioned in Section 4.1 may be noted). The stochastic framework provides a set of diagnostics that may be used to compare candidate models in a forntal and organised manner, and to validate the model finally selected.
The stochastic framework also allows a choice of the distributional form from which observations are assumed drawn. This enables an informed treatment of outliers.
These properties of the GLM are seen to be more than academic as this model generates a loss reserve that differs vastly from some CL applications. While one CL model is found to produce a somewhat similar reserve (Section 7.6), there is no apparent reliable basis for distinguishing that model as superior to other CL models.
In any event, though the CL model in question appears to produce a total loss reserve that is approximately correct, its dissection by accident period appears quite wrong. Specifically, it over-estimates average claim sizes of recent accident periods by margins approaching 20%. Such estimates, if incorporated m the business process, would be liable to lead to quite incorrect pricing decisions for the ensuing underx,,xiting penods.
Finally, but not of least significance, one emerges from the GLM fitting process described in Section 7 with a greatly enhanced understanding of one's data. Data exploration forms an integral part of the process, and the GLM provides the framework within which such exploration can be carried out efficiently.
The CL on the other.hand provides a sausage machine, a rigid and unenquiring algorithm. This is an advantage in terms of required resources. Only relatively low-skilled resources are required to apply it in its unmodified form. A serious disadvantage to be set against this is that it may produce a totally wrong result, that it may give precedence to process over substance.
The CL model may be described as a muhiplicative model with categorical accident and development period effects. This is a very simple design, which is highly convenient if justified. It is, however, a design that relies on an assumption ofan identical process affecting every accident period.
Beyond this, it is phenomenological in the sense that there is no specification of what that process is. If evidence appears that the CL design is invalid, the lack of process specification leaves one with no indication of how the design should be modified.
One may attempt modification on some empirical basis, such as trending age- to-age factors, but the empiricism ~tself is a recognition of the lack of understanding of the process. Indeed, because of this, there is in our view a strong case for abandonment of the CL immediately its simple design is found
373

to be violated. One is likely to be better served in this case by an attempt to build understanding of the process and then select the model design accordingly.
These arguments are presented not in the spirit of an anti-CL diatribe, but rather in recognition of the fact that, when the CL (or indeed any other h~ghly standardised model des~gu) turns out to be a poor device in practice, alternatives are required and use of a GLM may well be an effective alternative.
3 7 4

A.I Incremental paid losses
Append ix A Paid loss data
occident quar'.er 0
development q,arter ($0OO I 1 2 3 4 5 6 7 8 9
Sep-9~ Dec.9~ Mar.9. ¢ Jun-9E Sep-9. = Dec.9~ = M~r-9E Jun-9( Se~-9( Dec-9( Mar-9~ Jun-97 SeO-9~ Dec-97 i M~r-981 Jun-9E Sep-9~ Oec-9~ Msr-~ Jun-~ Sep-99 Dec-99 Mar-O0 Jun-00 5ep-00 Dec-00 Mar-01 Jun-01 Sep-01 Dec-01 Mar-02
1 61 273 934 1.320 1.017 492 393 1.111 2.0918 40 416 1,362 2.348 3671 2.823 2.207 3.031 5.083 4.987 30 581 1.352 2.452 1.678 1.704 2 603 4.747 3.078 3.868 24 493 1.641 1.504 1.972 3.581 3.318 3.248 4.805 5.714 28 689 876 1.973 2.639 3.823 2.588 4.270 5.290 7.363 59 239 751 1.698 2.526 2.209 3.319 4 812 4.316 4 181 30 268 1.300 2.016 2.732 3.036 3.317 4.058 3 614 3.978 27 488 1.444 1.715 2.492 3.405 3 534 3 471 4.759 8.035 19 459 1.188 2.383 3 485 3.097 3 346 5.426 6.796 6.364 7 315 1.439 2.278 3213 2900 5.411 4.532 4.548 5.668
56 381 1.216 2.615 2.290 3.195 5.206 6.497 4.561 7.066 7 488 1.813 2.054 2.970 3.433 5.971 4.222 6.311 4 334
45 557 1.270 2.763 2.714 4.640 3.783 5.336 6.592 10 645 45 447 1.734 2.767 4.107 3.660 5.290 8.830 7.564 6 157 17 385 1.593 3.050 3344 4.132 5.526 5.433 4.802 5.677 29 746 1.830 3.100 3 599 5.265 7 271 4.743 6.868 4.533
100 678 1.582 3 172 4.391 8.865 5 132 8.321 9.431 7.880 54 533 1.599 4 207 6 823 8.897 10.541 7.628 5.492 5.131 28 721 2.393 4.798 5.052 7.237 6 378 5.879 4.394 6.118 92 725 2.517 3.238 5455 5.472 7.317 4.549 8.027 6.979 65 649 1.419 3.913 3531 6.699 5.169 7.277 7.891 16.651 55 740 2.094 2.694 5.952 3.925 6.103 6.780 11.315 7.334 75 666 1.364 3.879 2.758 5.350 6.112 7.328 6.486 7.222 60 571 1.527 2.133 4.521 5.852 8414 6.501 9.512 6.807 76 810 1.156 2.825 3.602 8.354 7.015 10.612 9.707 9489 40 476 762 1.578 3 394 3.905 5 606 6.412 8.394 8.060 42 382 950 2.411 3 240 5.281 6 840 10.038 7.674 8.413 71 629 1.203 1.857 4.116 5.433 9.705 7.721 10.723 6.983 63 999 1.180 3.101 4.923 7.240 7.068 8.900 6.862 59 635 1,209 2.517 5.749 5.112 10.178 7.201 54 687 1.164 3.446 2.814 7.077 5.729
Jun-02 134 762 1.513 2.062 4.099 5.285 Sep02 67 719 1.316 2.630 3.243 Dec-02 94 475 978 1 650 Mar-03 71 473 689 Jun-03 56 450 Sep03 45
375
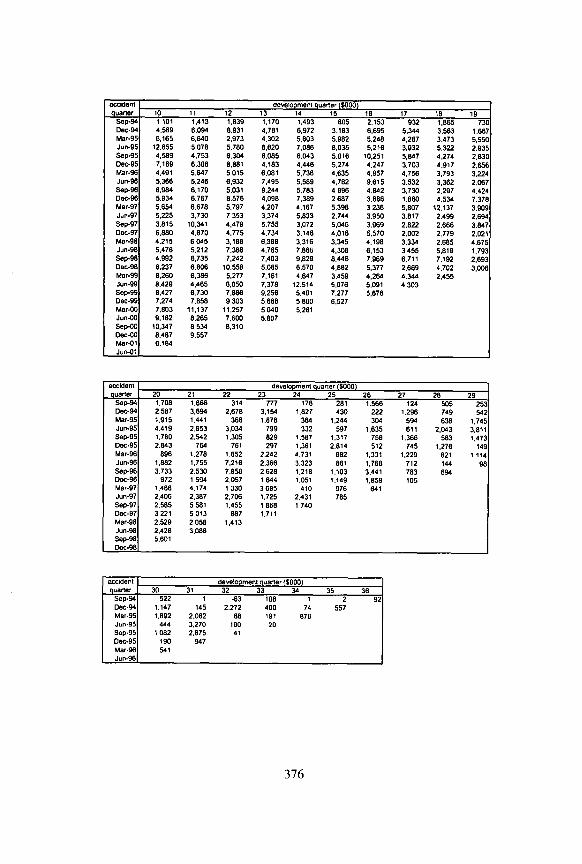
accident quarter 10
oeve~opmen= quarter (SO(X)) 13 14 15 16 ! I
Sep-94 1 101 1,413 1,839 1,170 1,493 805 2,153 932 1,865 73c Dec.94 4.569 6.094 8.931 4,781 6,972 3.183 6.695 5,344 3.563 1.66~ Mar.95 6,165 6,640 2,973 4,302 5,603 5,982 5,248 4,287 3,473 5,55C Jun-.85 12,655 5078 5.760 6,620 7,086 8.035 5,216 3,832 5,322 2,93E Sep-95 4,589 4,753 6.304 6.085 6,043 5.016 10,251 5,847 4.274 2,83C Dec-g5 7,169 6.308 8.881 4.183 4.446 5.274 4.247 3.703 4.917 2,65( Mar-96 4.491 5.647 5 015 6.081 5,736 4,635 4.857 4,756 3,793 3,224 Jun-96 5.366 5.246 6,932 7,495 5.589 4,762 9.615 3.532 3,362 2.067 Sep-9~ 6.984 6.170 5.031 9.244 5.783 4 996 4.842 3,730 2.297 4.424 Dec-96 5.834 6.767 8.576 4.098 7.389 2 687 3,886 1.880 4.534 7.37~ Mar-97 5.654 6.678 5,797 4.207 4.167 5.396 3 236 5.807 12.137 3.909 Jun-97 5,225 3,730 7 353 3,374 5,833 2,744 3,950 3,817 2,499 2.69,4 $ep-97 3.615 10.34t 4.479 5.755 3.072 5.046 3.969 2.822 2.666 3.847 Dec-87 6.860 4.670 4.775 4.734 3.146 4.016 5.570 2.002 2.779 2.021 Mar-g8 4.215 6045 3.188 6,368 3.316 3,345 4.198 3.334 2.685 4.675 Jun-98 5,476 5,212 7,386 4,765 7,866 4,308 6,153 3455 5,819 1,793 Se1~98 4,g92 6,735 7,242 7.403 9.829 8.446 7,969 6,711 7.192 2.693 Dec-98 6,237 6,806 10,558 5.085 6.570 4.882 5,377 2,669 4.702 3,00~ Mar-99 8.260 6,386 5,277 7.161 4.647 3.459 4,264 4.344 2.455 Jun-99 8,428 4,465 6,050 7,378 12.514 5,076 5,091 4 303 Sep-69 8.427 6.730 7,886 9.256 5.401 7.277 5.676 Dec-99 7,274 7,858 9 303 5,688 5 800 6,527 Mar-00 7.803 11,137 11.257 5040 5.261 Jun-00 8,162 8,265 7,600 5,867 Sep-60 10.347 8 534 8.310 Dec-60 8.487 9,557 Mar-01 6.164 Jun-01
accident quarter 20 21 22
developmentq~aner(5000} 23 24 25 26
Sep-94 1.708 1,866 314 777 176 281 Dec.94 2.587 3.694 2.678 3.154 1.827 430 Mar.95' 1.915 1,441 366 1,878 364 1,244 Jun.951 4,419 2,653 3.034 799 332 597 Sep-95 1,780 2,542 1,305 829 1,587 1,317 Dec.95 2,843 764 761 297 1,361 2,814 Mar-961 896 1,278 1,652 2,242 4,731 682 Jun-961 1,882 1,755 7,218 2.366 3,323 861 Sep-96 3.733 2.530 7.858 2 628 1.218 1.103 Dec-96 972 1 594 2.057 1 644 1.051 1.149 Mar-9; 1,488 4,174 1 330 3 695 410 976 Jun-97 2,406 2,387 2,706 1,725 2,431 785 Sep-97 2,585 5 581 1,455 1 868 1 740 Dec-9~ 3221 5013 887 1.711 Mar-9E 2,529 2 058 1,413 Jun-9 ~= 2,426 3,088 SOp-9E 5,601 Dec.9E
1.566 124 505 25: 222 1.296 749 54; 304 594 638 1,74~
1,635 611 2,043 3.81' 758 1.368 583 1,47: 512 745 1,276 14 c,
1,331 1,229 821 1 11~ 1,768 712 144 9~ 3.441 783 694 1.858 105
641
acodept quaMer 30 31
5ep94 522 1 Dec-94 1,147 145 Mar-9~ 1,892 2,062 Ju~-95 444 3,270 Sep-95 1 082 2.675 Dec-95 190 947 Mar-9(3 541 Jun-96
development quarter !$OO0} 32 33 34 35 36
-63 108 2.272 400
88 191 190 26 41
1 74
678
2 557
I i 92j I
376

A.2 Incremental paid losses in respect of flnalised claims
accldeLnt I deveropment querier of tlnal~satJon I$0001 quarter j o 1 2 3 4 5 6 7 8 9
Sep-94., 0 0 14 145 524 1.254 771 429 351 707 1.852 Dec-94 i 3 5 277 552 1.474 3.334 2.404 1.125 2.683 4.341 4.203 Mar-95 3 3 211 850 1.834 1.320 1.101 2.158 3.360 2.341 4.804 Jun-95 00 197 906 1 032 1.122 2.302 3.466 2.519 4.032 3352 Sep-95 09 293 423 862 2.141 3.461 2.323 2.710 4.087 3.792 Dec.95 54 4 120 212 1.081 2.000 2.055 2.594 3.368 2.876 6.20e Mar.g6: 0 O 105 794 1.466 2.345 2.280 2.987 2.049 4.942 3.889 Jun-96 O 0 178 869 1.209 1.760 2 353 1.953 4.481 4.497 3.499 Sep-96 53 145 743 1.741 1.963 2497 3.941 4.155 5.150 5.827 Dec-96 0.0 127 910 1.367 1 559 3.490 4.873 3.801 4.398 4.188 Mar-97[ 0 0 96 447 1.216 2.738 2.725 2.883 6.002 4.588 4.830 Jur~97 00 133 762 2.239 2.817 2.446 4.554 4.041 6.119 5.324 Sep-97 04 77 895 1.881 2.285 3.567 3.319 4.841 6.014 7.102 Dec-97 10.0 172 1.063 1.785 3.062 3.647 4.147 7.040 8 524 6.175 Mar-98 0 0 134 820 2.298 2.288 4.212 4.079 5.667 5.645 6.262 Jun-98 0 0 201 1.010 1.987 3.540 3.935 7.108 5.173 6.683 3.59! Sep-98 5 8 157 838 2.314 3 376 5.839 4.785 7.974 5.220 5.438 Dec-98 0.0 104 859 3.027 6.470 6.290 8.646 6.389 8.235 3.714 Msr.g9 O 4 215 1.327 3.884 4.278 7.361 4.166 8.488 3.916 3.60G Jun-99 0 2 192 1.798 2.708 4.636 5.046 5.928 3.868 5.073 5.491 Sep-99 02 231 861 3.100 3.046 4.407 3.779 4.531 7.213 12.155 Dec-99 1 6 368 1.58.1 2.234 4.581 2.727 4.513 5.496 10.138 8.289 Mar-O0 15 1 311 724 2.966 1.877 3.610 4.475 7.277 5.305 8.413 Jun-O0 5 8 192 959 1.500 2.626 4.407 8.700 5.428 9.670 6.131 Sep-O0 0.0 339 612 1.438 2.294 7.234 5.698 10.923 7.560 7.947 Dec-00 0 4 71 259 977 2.511 3 448 5.808 5.079 6.537 6.60g Mar-O1 0 8 62 387 1.750 2.478 5.230 8.033 9.273 7.673 7.299 Jun-01 3 8 217 574 1.317 3.501 4.791 8.593 7.265 9.867 6.865 .Sep-O 1 6 3 176 502 2.258 4.280 8.135 5.126 8.279 5.131 Dec-O 1 1 4 121 502 1.524 4.918 4.307 9.820 5.098 Mar-02 11 2 141 632 2.558 2.280 6.599 4.457 Jun-02 6 1 189 763 1.265 3.337 3.860 Sep-02 7.0 175 528 2 171 2.375 Dec-02 32.4 128 383 1.081 Mar-03 7.1 96 111 Jun-03 9 3 39 Sep-03 0 4
Note: Paid losses in finalisation quarter x include all amounts paid in quarters up to and including x for claims finalised in x.
377

arc=dent development quarter of flnwmation ($000) quarter 10 11 12 13 14 15 16 17 18
Sop-94 1.169 1.192 1.381 1.065 1.149 1.437 1.250 481 926 2.62~ Dec-94 3.439 3 270 5.306 10.651 7.187 4.929 4.616 4.471 8.490 3.10( Mar-95 5.531 5.555 5.758 3.769 3.443 5.781 3.887 6.597 5.242 5.36; Jun-95 3.898 6.602 11 973 6.055 4.933 6.079 7.011 7.515 4 888 5.30( .Sop-95 5.332 4.648 5.253 8 834 2.824 6.063 8.382 7.525 6.979 2.82 t Dec-95 4.295 4.173 7 276 4.211 7.421 5.877 7.486 3.928 5.070 3 58: Mar-�6 3.039 4.596 5.485 6.140 3.394 7.740 3 876 8.296 2.885 4.32E Jun-96 4.438 6 842 7.675 5.985 5.869 7.775 8.456 3.315 3.505 89; Sop-96 4.038 7.355 6.985 9.914 7.170 4.608 3.632 3.378 3.166 1.85; Dec-96 6.361 5805 6.119 4.438 8435 3.231 2.410 2.775 3.280 3.05C Mar-97 7.444 6.571 6.903 4.754 2.866 3.287 2.015 3.962 5.238 5.091 Jun.97 4.742 4.314 7.397 3.176 3.282 4.055 3,707 2.844 3 510 2.62.; Sop-97 6.485 10.205 4452 6.501 3.640 2.103 2.039 4.868 2.341 5.02. ¢ Dec-97 6.292 3.413 7.127 2.846 2.826 4.147 4.940 5.124 4.838 1.52E Mar-98 2.623 4 810 3.227 2.481 5 689 5.258 2.633 3 344 2.715 4.69 c Jun-90 5.203 3.783 4 OB4 6.255 7.258 7.690 6.548 4.481 5.312 2.087 Sop-98 5.117 3.893 7.186 7.966 5.599 11.969 7.303 7.723 7.488 10.00 c . Dec-98 4.587 5.634 9425 6.373 8.626 4.608 6.539 4.038 4.868 6.18~ Mar-99 4.916 9.749 5.366 8 804 5.391 3.899 3.736 4.402 2.483 Jun-99 11.923 4,247 7.727 4 678 9.901 6.165 4"279 7.077 Sep-99 9.317 8.123 8.999 7.495 6.069 0.988 4.428 Dec-99 9.088 7.461 8.498 4.853 7.232 6.023 Mar-00 6.589 6.830 11.414 6.911 4.560 Jun-O0 8.683 7.055 7.845 5.033 Sop-00 10.856 9.088 7.014 Dec-00 8.466 8.389 Mar.01 6.256 Jun-01
accident development quarter of flr~alLssUon I.~V000~ quartet 20 21 22 23 24 25 26 27 28 29
Sop-94 1.164 1.956 1.219 970 672 252 712 9 %265 1.414 Dec.94 2.619 4.602 2.271 2.610 1.556 2.682 253 825 610 1.318 Mar-95 1 957 1.618 1.326 658 1.033 741 4.524 675 421 472 Jun-95 3.270 1.673 8.170 2.822 850 1.295 1.362 2.958 1.286 1.070 SOp-95 1.469 3.770 426 2.141 1.934 1.547 1.183 631 7.640 816 Dec.95 2.073 2.000 1.702 201 2.263 3.465 1 538 356 311 738 MO~-96 510 1.096 1.137 2.827 1.604 1.265 722 2.736 1.011 4 683 Jun-°~5 6.680 1.443 3.234 7.912 3.951 1.476 2.503 1.631 500 809 Sop-96 4.437 2.836 3.828 4.531 2.256 1.533 1.817 4.079 1.814 Dec-96 2,642 6.086 6.398 1.682 %136 1.169 3.231 2.130 Mar-97 5,736 2.574 13 854 2.865 2.180 466 2.401 Jun-97 4.744 1.863 3.693 814 1.772 697 Sop.97 3.184 2.226 6 450 3 056 1.862 Dec-97 3.744 1.581 2.566 929 Mar-98 3.518 2.732 1.189 Jun-98 1.592 2.262 Se~98 3.478 Dec-98
acc.dem development quarter o1 I;nal*sation I$0001 quaner 30 31 32 33 34 35 36
Sep-94 140 0 1 009 0 8 Def... 94 1.147 1 935 1.076 1.827 1.166 Mar-95 2.932 1 329 298 1.787 %156 Jun-95: 1.398 1.603 914 963 Sop-95 1.143 327 84 Oec-951 862 397 Mar-96 147 Jur=-98
O 6~ 0
378

A.3 Numbers of claim flnalisations
acddenl quarter 0 1 2
deVelopmenl quarter of finaltssUon 3 4 5 8
SelP94 0 6 26 36 Dec-94 2 37 69 151 Mar-95 2 39 101 163 Jun-9fi 0 47 110 95 Sep-95 2 51 51 67 Dec.95 6 21 32 127 Mar-96 0 16 113 173 Jun-96 1 37 126 ' 143 Se~9(] 1 33 103 167 Dec-9~ 0 32 115 141 Mar-97 2 22 68 143 Jun-97 0 21 99 240 Sep-9? 5 19 140 • 191 Dec-91 2 48 125 197 Mar-98 0 33 122 198 Jun-9~ 0 40 130 188 Sep-9~ ~ 27 113 228 Dec-91~ 0 20 129 272 Mar-99 1 54 160 335 Jun-99 2 44 225 226 Sep-9~ 2 55 116 273 Dec.9~ 3 65 180 193 Mar-OC 3 69 107 204 Jun~C 3 49 138 150 SepOC 0 55 89 146 D e c ~ 3 29 68 135 Mar~ l 2 28 91 184 Jui~01 3 71 102 173 SeD-01 7 53 103 195 Dec-01 2 49 101 145 Mar-02 ? 58 96 180 Jun-02 6 55 96 110 SepO2 5 57 94 154 Dec-02 4 44 63 106 Mar~3 7 40 42 Jun~3 4 28 Sep-03 7
53 37 32 22 35 73 200 130 52 131 192 115 ~02 67 141 173 99 125 53 147 226 130 ~50 126
189 216 155 171 126 139 185 184 173 135 135 176 174 185 139 122 184 133 148 177 128 191 147 126 150 171 222 148 149 136 159 246 193 154 157 10S 246 205 149 187 123 139 215 180 176 158 166 116 175 217 170 190 181 161 242 188 205 178 181 126 196 239 171 187 143 146 256 220 264 163 168 110 227 270 208 257 138 119 381 302 306 190 147 98 304 338 196 164 109 79 307 236 193 108 116 103 214 201 148 152 162 279 253 155 173 173 282 170 140 179 202 268 155 192 192 238 333 ~70 242 134 167 307 215 264 168 164 240 203 255 182 185 138 219 260 208 237 186 184 225 232 260 181 198 157 202 242 205 221 145 259 204 278 182 148 252 167 192 162 130
379

accident qua~er 10 11 12
developmentquanetofflna,satJon 13 14 15 16
Sep-g¢ 30 26 32 26 32 18 ~9 13 9 Dec-94 104 100 142 136 104 68 49 48 61 Mar-9~ 96 135 137 100 75 84 60 63 39 Jun-9~ 95 134 118 77 77 81 72 64 53 Sep-9~ 157 126 98 ~07 77 68 56 61 39 Dec-9~ 126 104 111 79 79 62 57 37 41 Mar-gE 101 96 109 83 56 81 49 54 34 Jun-gE 111 101 126 89 75 64 61 37 35 Sep-gE 95 121 109 117 88 66 44 36 26 Dec-9( 136 99 124 69 81 56 24 24 15 Mar-9] 112 108 98 82 49 40 23 28 31 Jun-9~ 98 95 141 54 42 37 27 20 42 Sep9~ 117 122 77 57 41 28 27 55 36 Dec-9; |29 71 80 45 39 41 67 55 38 Mar-9~ 91 76 53 43 46 61 42 35 25 Jun-gE 111 79 64 69 114 72 80 55 49 Sep-gE 93 72 101 ~44 75 89 80 61 53 Dec-9E ?8 89 165 74 74 53 50 33 44 Mar-9~ 1Q6 197 105 116 67 42 45 54 21 Jun-9~ 225 89 135 75 78 64 52 50 Sep-9~ 138 138 130 90 64 65 47 Dec.9~ 162 130 122 87 81 64 Mar-OC 123 124 113 106 61 Jun-0( 132 112 131 65 $ep-O0 t16 141 116 Dec.O0 144 114 Mar~ l 127 J u n ~ l
10 27 38 48 26 31 20 11 13 33 39 24 42 20 27 30 46 46
accidenl qua~er 20 21 22
developmentqua~erofl/nallSafion 23 24 25 26
Sep-gz 9 10 12 8 7 3 Dac-O~ 33 34 25 18 9 8 Mar-9~ 20 23 12 10 6 5 Jun-9~ 27 17 15 8 7 3 Sep-9E 20 26 6 14 10 17 Dec-9E 22 22 t2 2 22 15 Mar-9( 9 13 15 29 14 10 Jun-~ 18 16 33 26 21 7 Sep-g( 16 29 25 21 10 11 Dec-9( 24 29 15 18 13 10 Mat.9~ 34 30 20 15 12 9 Jun-97 31 15 18 14 15 8 Sep-97 20 17 10 17 9 Dec-97 18 24 19 15 Mar-9~ 22 28 16 Jun-9E ~9 21 Sep-9~ 37 Dec-9E
1 1 4 3 6 7
10 8 5 13 17 10 12 9 6 15 6 3 5 12 11
16 13 4 7 12 5
10 6 8
accident quarter
Sep-9z Dec-9Z Mar-9 = . Jurt-9': SepgE Dec.gE Mar-9~ Jun-9~
development quarter of finaliSalkon 31 32 33 34 35 36
1 0 5 0 1 0 6 7 2 3 ;' 1 8 5 1 3 7 8 5 4 5 4 4 2 7 7 2
380

A.4 Incremental average sizes of I'malised claims
acc~ent quarter 0
Sepg=
development quartet of flnaliSaIJon 1 2 3 4 5 6 7 8 9 2,382 5,594 14,548 23,662 20,845 13.393 15952 20,187 25,30~
Dec-94 1.735 7.483 8.005 9.761 16.670 18 .494 21.625 20.482 22.610 36.551 Mar.95 1.636 5.401 8.415 11.250 12939 16 .427 15.306 19.423 23.650 38.43:: Jun.95 4.201 8.235 10.865 21.174 15 .658 15.338 19.380 26.883 26.601 Sep.95 433 5.741 8.280 12.863 11.326 16 ,024 14 .984 15.849 32.440 27.28; Dec-95 9.060 5.734 6,634 8.514 10.810 11.168 14 .994 24.945 21.316 35.26." Mar-96 6.532 7.028 8.476 13.478 12 .324 21.493 16.797 26.858 29.23 c Jun.96 4.820 6.896 8,456 11 .891 13 .291 15.259 23.460 30.592 2776; Sep-96 5.307 4.384 7.214 10.427 13.090 14 .603 17.752 28.077 34.566 42.841 Dec-96 3.967 7,915 9.696 9.805 14.188 25.250 24.684 28.015 39.88; Mar-97 4,351 6.578 8.504 11.132 13 .294 19.350 32.097 37.282 34.74E Jun-97 6.340 7.701 9.328 12.174 13 .587 25.875 25.577 36.860 45.901 Sep-97 73 4.063 6.393 9.849 13.056 10,439 19.525 25.478 33.226 44.11.. Dec-97 5.013 3.749 8.501 9.059 12.652 19 .397 20.226 39.553 47.096 49.00¢. Mar-98 4.069 6.720 11.608 11 ,671 17 .624 23.852 30.306 39.476 43.02E Jun-98 5.032 7.769 10 .571 13 .827 17 .887 26.926 31.734 40.262 32.68; Se1~98 5,828 5,832 7,420 10.149 14,871 21,627 23.007 31,026 37,829 45 701 Dec-98 5,181 6,660 11,127 16 ,982 20,827 28,255 33,628 50 ,021 37,89E Mar.99 401 3,986 8,292 11.595 14 ,073 21,779 21,256 39,558 35,930 45,57; Jun-99 111 4,363 7,990 11,984 15 102 21,380 30,718 35,818 43,731 53,31. = Sop-99 97 4.207 7,420 11 .354 14 .234 21.926 25.532 29.806 44,528 43.57E Dec-g9 547 5,663 8,785 11,578 18 ,108 17,596 26,086 31,767 35,942 48,75~ Mar-00 5,050 4,509 6.763 14,539 13 ,408 20.166 22,155 27 .151 34.228 43 82C Jun-00 1 940 3.922 6.948 10 .001 13 .678 18.518 26.t 27 31.930 39.958 45.75E Sep-O0 6.157 6.876 9.850 13.739 23,564 26.500 41.375 45.000 48,45iE Dec-00 147 2.464 3.807 7,235 10.462 16 .988 22.767 27.905 35.336 47.88¢. Mar-01 396 2.231 4,251 9,510 11,317 20,115 29,005 39,125 41,250 39.67C Jun-01 1.271 3.060 5.628 7.615 15.559 20.652 33 .051 40.138 49,832 43.731 Sop-01 898 3.317 4,878 11 ,581 21,188 25.352 25.003 37,460 35.387 Dec-01 678 2,463 4,966 10 ,511 18.989 21 ,111 35,324 28,008 Mard)2 1,594 2,429 6,579 14,210 15,408 26,188 26,690 Jun-02 1.017 3.443 7,947 11.497 17.380 23.825 SoI~02 1.394 3,072 5.600 14.098 18,272 Dec-02 8.102 2.g05 6.081 10.007 Mar-03 1.013 2,392 2.652 Jun-03 2.327 1,400 Sep-03 59
Note: Each entry is calculated as the quotient of the corresponding entries in Appendices A.2 and A.3.
381

accident development quarter o1 finalisatlon quarter 10 11 12 13 14 15 16 17 18 1 ~
Sep-94 38,981 45,863 43,155 40,948 35,968 79,834 65,785 37,000 102,906 262,77: Dec-94 33,065 32,703 37,365 78,315 69,106 72,480 94,207 93,147 139,178 114,82' Mar-95 57,613 41,147 42 ,031 37,687 45913 68,820 64,777 104,722 134,404 141.22, = Jun-95 41.032 49.272 101,466 78.637 64 070 75.045 97,381 117 429 92,234 110,54~ Sep-95 33.960 36.892 53.606 82.564 36.676 89 167 149,679 123 365 178.941 108.49<, Dec-95 34,086 40,123 65.550 53,308 93 ,931 94,785 131,331 106,164 123,663 115,56( Mar.96 30,093 47,875 50.320 73,979 60,599 95,555 79.094 153,636 84,868 216,39i Jut',-96 39,983 67.740 60,913 67,250 78,248 121,485 105,823 89,806 100,151 81,51,= Sep-96 42,509 60,787 64.080 84.732 81,474 69,821 82 547 93,824 121 783 142,84¢. Dec.96 46,771 58.639 49.350 64,319 104,134 57.695 100.423 115,642 218.638 92,43,= Mar-97 60.464 51.580 70,439 57 ,971 58.495 62,164 87.609 141,490 168.964 130.54E Jun-97 48,392 45,413 52,464 56.820 78,146 109,606 137,301 142,201 83,567 109,26z Sep-97 55,427 83 ,651 57,813 t14,059 88.783 75094 75,506 88,514 65.035 11965; De¢-97 48.775 48,073 89.093 63,252 72.469 101.136 73.730 93.165 134.379 76.37~ Mar-96 31,026 63 286 60,886 57,705 128,024 86 192 62,702 95,530 108,612 174,02,; Jun-98 46,875 47 ,891 63 ,811 76,160 63,667 106.801 81,854 81,477 108,414 69,581 Sep-98 55,025 54,074 71,146 55,322 74,652 134,479 91,283 126,607 14t,252 217,591 Dec-98 58,810 63,307 57,124 72,602 116,566 86,935 130781 122,363 110,631 134,531 Mar-99 46 377 49.490 51.105 75,895 80.459 92.833 83,014 81.526 118.236 Jun-99 52,992 47,720 57,234 62,371 126,934 96,335 82 298 141,547 Sep-99 67,518 59,729 69 ,221 83,279 94 824 138,272 94.214 Dec-99 56,099 57.395 69,656 55,780 89,260 94,104 Mar-00 53,568 55,077 101,005 55,766 74,750 Jun-0O 65,777 70 ,131 59,887 77,433 Sep-O0 93,585 64,453 60,465 Dec-O0 58,789 73,588 Msr-01 49.258 Jun-01
ecciden! quarter
Sel~94 Dec-g4 Mar-95 Jun-95 Sep-95 Dec-95 Mar-96 Jun-96 Sep-96 I Dec-96 I Mar-97: Jun-67 5ep-97 Dec.97 Mar-9~ Jun-9E Sep-9E Dec-9E
development quarter of nnalLsstton 20 21 22 23 24 25 26 27 28 29
129.349 195.633 101,579 121,257 95.978 84.158 712,264 6,764 316,169 282,728 76.351 135,363 90.855 145.01'1 172.933 335.296 84.477 104.109 87098 146445 97,834 70.355 110,518 65.824 172,169 148,164 452,372 84 ,431 84,166 78.663
121,116 98.383 411.325 352,690 121,433 431.789 104,799 174,005 128565 374.070 73.437 144,986 71.009 152,943 193.406 91,006 98.609 70.139 1.273300 116.584 94,241 90 905 141,654 100,275 102 849 230,998 102,517 59,253 103,639 105,413 56.632 84 235 75 ,801 97.496 114 575 126.450 144,4o~ 227.986 91.890 780,581
371.135 90,167 98.013 304 316 188 162 210,866 156.466 140.817 124 941 202.313 277.303 97.799 153.110 215.742 225.660 139.336 259.511 339.882 362.793 110.092 209.851 426.546 93.455 87416 118.887 323.074 355,008 168.714 85.802 692.725 190.969 181 670 51.736 300.116 153.029 124.170 205.154 58.125 118.166 67.164 159.195 130.970 644.990 179,757 206.663 207.985 65.860 135.046 61.946 159.924 97,586 74.291 54,887 107,701 94,013
acooent devetopmenl quarter Of I]nallSatton quarter 30 31 32 33 34 35 36
Sep94 139,507 201,849 6,200 633,54E Dec.94 191.107 276.459 537.824 608,937 166.449 Mar-95 366.509 265.796 297.888 595.605 165.077 Jun-9E 174,706 320,567 228,814 192,673 SaP-g- = 285,658 81.622 41,975 Dec-95 123,129 56,756 Mar-9~ 73,749 Jun-9E
382

A.5 Cumulative average sizes of finalised claims
acodent qua~er 0
Sep.94
development quader of flnahsabon 1 2 3 4 5 6 7 8 9 2,382 4,992 10,O51 16,013 17 ,144 16,512 16 .454 16,983 10 895
Dec-94 1,735 7,188 7,710 8,906 12,289 13,659 14 305 15 .353 16,798 18,904 Mar-95 1,636 5218 7,492 9,500 10 ,382 11,219 12,156 13 ,752 14,856 17,769 Jun-95 4,201 7,027 8474 10 ,681 12,300 13.312 14 ,289 16 ,261 17,463 Sep-95 433 5,540 6,889 9229 10 ,330 12,465 12.999 13 ,539 15,856 17.217 Dec-95 9,060 6.473 6,560 7.894 9.348 9,951 11.150 13 ,308 14 ,391 17.520 Mar-96 6 532 6.967 7,831 9 896 10,575 12,472 13 ,044 15.342 18.834 Jun*96 0 4,693 6.386 7,350 8827 10.077 10,950 13 ,462 15,756 16,992 Sep-96 5.307 4.411 6.518 8666 10 .127 11.352 13.030 15 ,268 17 .781 20.444 Dec-96 3.967 7,056 8,348 8.866 10.755 13,913 15 ,508 17,148 18.982 Mar-97 0 3,988 5,902 7,485 9,350 10,529 12,103 15 .761 18,073 19,878 Jun-97 8,340 7.463 8,706 10.003 10 857 13,696 15.420 18 256 20,595 Sep-97 73 3,232 5930 8,039 9,695 11,654 13,113 15.236 17 ,764 20,691 Dec-97 5,013 3,802 7,197 8.189 9.954 12,173 13,816 17 ,689 21 ,591 23,909 Mar-g8 4.069 6,156 9.214 10 .091 12 .376 14.422 17 ,014 19.506 21.899 Jun-98 5.032 7.125 8934 10 .974 12 .798 16.195 18 ,203 20,769 21.622 Sep-98 5.828 5,832 7.105 8.986 11 .227 14 ,470 16,123 19,001 20,769 22,638 Dec-98 5,181 6,462 9,476 13 ,042 15 ,172 t8,Oll 19 ,865 22,908 23,704 Mar-99 401 3,921 7,174 9,867 11 .364 14,317 15,297 |7,861 19 ,046 20251 Jbn-99 111 4,178 7.343 9.453 11 .610 13 .827 16 .471 18 .029 20,075 22270 Sep-gg 97 4,083 6.314 9,399 10.966 13.525 15.286 17,187 20,535 24 548 Dec-99 54? 5.438 7.867 9.491 12632 13.538 15.662 17 .994 21.420 24.242 Mar-O(~ 5.050 4,532 5.866 10.485 11.268 13 .537 15.462 18 ,135 20.015 23,024 Jun-OG 1,940 3.807 6.088 7.815 9.931 12585 16,673 18 .711 22,105 24027 Sep-0G 6,157 6,601 8,237 10 .247 15,598 17,993 22,959 25,583 27,965 Oec-OC 147 2.247 3.308 5,564 8.038 10,718 14 .011 16,279 18 ,991 21.764 Mar-01 396 2.108 3.719 7.213 8.928 12 ,638 16,070 20.516 23.242 25.132 Jun-01 1,271 2,987 4,517 6,053 9,779 12,909 17,822 21 ,061 25,003 26,830 Sep01 898 3,035 4,199 8,220 12 ,898 16,656 18 ,355 21,793 23,229 Dec-O 1 678 2,393 4,103 7,231 12,708 14,964 20,417 21,549 Mar-O; 1.594 2,339 4,867 9,799 11,4°J6 16,493 18,368 Jun-02 1,017 3,204 6,104 8,326 12,113 15,168 Sep-O~ 1,394 2.936 4,541 9.289 11.943 Dec-O~ 8,102 3,338 4,895 7,392 Mar-03 1,013 2.187 2.406 Jun-0 '~ 2,327 1,516 sepo.~ 59
Note: Each entry is calculated as the quotient of the corresponding entries in the cumulative versions of Appendices A.2 and A.3.
383

acc,Klent developtnent quartet ol fAnalisatlon quarter 10 11 12 13 14 15 16 1;' 18 19
20,617 22,362 23,993 25009 25,757 27,768 29,204 29 ,401 30 ,661 34,9~ Sep-9.4 De¢.94 20,149 21.127 22.745 27,587 30,180 31.840 33.555 35.118 38.475 39,54! Met-95 21 ,221 23,385 25,236 26,077 27,034 29,176 30,433 33,089 35,283 37,47; Jun-95 19,362 22,414 28,933 31 .471 33,054 35,096 37,678 40,509 41,987 43,71( Sep-95 19,202 20,740 22,820 26.683 27,127 29 ,471 33098 35,970 38 ,821 39,73~ Dec-95 19.126 20 ,681 23.969 25.423 28,658 31,021 34 211 35.687 37,896 38,86~ Mar-95 17.833 19,842 21.992 24.643 25,838 29.038 30,390 33.953 34,863 36.75; Jun-9e 18,903 22,338 25,450 27,703 29,900 33,174 35,568 38,827 37,783 38,03; Sep-96 21,969 25,109 27,755 31,827 34,050 35,309 36 ,391 37,448 38,554 39,23~ Dec.g6 21.610 23.995 25,888 27 .421 30.852 31.657 32.530 33 .571 35.010 35.97.' Mar-97 23.616 25,624 28,365 29.807 30.618 31 .78~ 32.496 34.169 36.422 38.36( Jun-97 22.449 23844 26,211 27.212 28.400 30.034 31.587 32 .761 33.868 34.79( Sep-97 23,287 27,649 28,965 31,627 32,885 33,510 34 ,101 35,618 38,145 37,85, = Dec-9? 25 .891 26,823 29,637 30 .471 31,354 32.864 34.259 35.866 37,593 37.96~ Mar.98 22,443 24,381 25,550 26,364 29,045 30,977 31,698 32,885 33,878 35,83~ Jun-98 23.323 24.447 25.853 27.720 29.796 32.505 34.362 35.550 37 .151 37,58; Sep-98 24.430 25.647 28,126 30,086 31,698 35.929 37.904 40.254 42 526 45,87 c. Dec-98 25.128 26.817 29,114 30543 33 ,281 34.477 38.460 37.612 38.895 40.61¢. Mar.95 21 .751 24.426 25.730 28.300 29.799 30.915 31.885 32.969 33.687 Jun.98 26.143 27.187 29.188 30.382 33.865 35 .661 38.726 38.977 Sep-g9 27.956 30,259 32.784 34.953 38,727 39.693 40.821 Dec-99 27.095 29,127 31.526 32,508 34 ,571 36.233 Met-00 25.312 27.402 31.828 33,107 34,348 Jun-O0 27 .121 29.666 31,622 33.047 Sep-,00 32,466 34.928 36,449 Dec-00 25,134 28,391 Mar-01 26,907 Jun-01
accident developmen! qtaarter o1 {]naliSatlon quarter 20 21 22 23 24 25 26 27 28 29
Sep.94 36,560 39,432 40.749 41.871 42,523 42 737 43,882 43.822 45,668 47,66(~ Dec.94 40223 41,852 42.462 43,372 43,944 45084 45,142 45.314 45,456 45,895 Mar-95 38 121 38,515 38,972 39,113 39 ,531 39,814 41,957 42,133 42,242 42,354 Jun-95 44.799 45,267 48,065 49,302 49,558 50,137 50,493 51,538 51,919 52,715 SelP95 40.072 41,417 41.504 42.266 43,000 43.393 43,711 43.824 47.334 47,56~ Dec-95 39 .501 40.083 40.707 40.768 41,457 42881 43,326 43,374 43,463 43,677 Mar-g6 36,844 37 ,161 37,457 38.333 38.866 39.302 39,562 40,677 40,953 43,122 Jun-g6 41.104 41,503 42.435 45.794 47.254 47,81t 48,650 49.225 49.370 49,663 $ep96 4~,126 41.934 43280 45.016 45.878 46.365 47,071 48,724 49.461 Dec.96 36.870 39,359 42,218 42,868 42,950 43,307 44 ,651 45,543 Mar-97 40659 41,350 47,936 49,0~3 49,807 49,816 50,806 Jun-97 36 645 37,303 38 802 38,935 39,517 39,702 Sep-97 39,027 39,776 42,661 43,762 44,454 Dec-97 39 .431 39 .731 40,579 40.729 Mar-98 37,230 38,082 38.372 Jun-98 37 801 38,437 Sep-98 46 609 Dec-98
accident development quarter of nna[isallon quarter 30 31 32 33 34 35 36
Sep-94 47.814 47,814 49,096 49.096 49.025 49.025 49,994 Dec-94 46,315 47,088 47,559 48 366 48,760 48,737 Mar-95 43.683 44,250 44 380 45 223 45,649 Jun-95 53.195 53 .851 54,193 54 531 Sep95 48.014 48,078 48,073 Dec-95 43,950 43,994 Mar-96 43,152 Jun-96
384

B.I Age-to-age factors based on
A p p e n d i x B A g e - t o - a g e factors
paid losses in respect of finalised claims
accident quader
Sep-Sul 0 I
development quarter of finallmation 2 3 4 5 6 7 8 11.18 4.28 2 83 1.40 1 16 1.11 1.20 1.4~
Dec-94 80 70 2.97 2.77 2 45 1 43 1 14 I 29 1.37 1.2( Mar-gS 65 38 4.97 2.72 1 46 1 26 1.41 1.46 1.22 I 3E Jun-05 5.59 1.94 1 53 1 71 1.62 1 28 1.35 1 2; Sap-95 339 23 2,44 2,20 2 36 1,93 1 32 1 29 1 33 1,2~ Dec-95 3 22 2,21 3 79 2 36 1,59 1,47 1 41 1 25 1,4~ Mar-g8 860 263 1 90 1,48 1,43 1 21 1 41 1 22 Jun-96 5,87 2 15 1 78 1,59 1 31 1 54 1 35 1,2C Sap-g6 28.26 5 95 2 95 1 75 1.54 1 56 1.38 1.34 1.2~ Dec-96 8 17 2,32 1,65 1 88 1 65 1 31 1 27 1 2¢ Mar-g7 567 324 258 161 140 15g 1,28 12 "~ Jun-97 6,73 3,50 1 84 1 43 1,56 1 32 1,38 1 20 Sap-97 212 34 12 54 2.93 1 80 1 69 1.38 1 40 1.36 1.31 Dec-97 18.20 6 82 2.43 2.01 1 60 1.43 1 51 1 41 1.21 Mar-98 7.11 3.41 1 70 1 78 1.42 1.41 1 29 1 25 Jun-98 6,02 2,64 2 11 1,58 1,67 1 29 1,29 1 12 SalP98 2802 6 13 3.31 202 1 87 1.38 1 48 1.21 t 1B De¢-98 9,29 4 14 2 82 1 60 1 52 1 25 1,26 1 0g Mar-99 538,07 7 15 3 52 1 70 1 76 1 24 1 31 1,14 1,11 Jun.99 883,69 10 35 2,38 1 99 1 54 1,41 1,18 1,21 1 19 SAD-89 1.195 05 4 72 3 84 1.73 1 61 1 32 1 2g 1 36 1 45 Dec-99 225,16 5 28 2,15 2 09 1 31 1,39 1 34 1 47 1 28 Mar-00 21,54 3 22 3,82 1,47 1 61 1 47 1,52 1 25 1 32 Jun-O0 34 02 5 84 2,30 1,g9 1 83 1 90 1,30 1 41 1 18 Sep-O0 2.81 2.51 1 96 2.54 1.48 1 62 1 26 1 22 Dec-O0 162 87 4 60 3,95 2,92 1,90 1,80 1,39 1 36 1,27 Mar-01 79 90 7,12 4 89 2 13 2,12 1 61 1 58 1 30 I 22 Jun-01 57 97 3,60 2,66 2 66 1 85 1 83 1 38 1,38 1 lg Sap-01 28 96 3 76 4 30 2 45 1 85 1.38 1.45 1.19 Dec-01 90,03 8 11 3 44 3 29 1 61 1 86 1,24 Mar-02 13,62 5 15 4 26 1 68 2 17 I 38 Jun-02 32,02 4 90 2 52 2,50 I 69 SelP02 26 13 3 89 4 g6 '1.82 Dec-02 4,94 3 39 2,95 Mar-03 14,49 2,00 Jun-03' 5 21 sepo3;
taSt 1 year 8 65 3.78 3 36 2 22 1 82 1 69 1 40 1.30 1.22 lasl 2 years 14 19 4 03 3 51 2.34 1.94 1 63 1.43 1 32 3 26 last 3 years 17 61 4 12 3 30 2.14 1.70 I 55 1.38 1.29 1 22 last 4 years 24 20 4 59 3 10 2.09 1 76 1 51 1 37 1 29 1 22 all ~ars 32.10 5 18 2 97 2.02 1 69 t 48 1 37 1 30 1.23
385

deVelopment qdarler of finallsafJon 13 14 15 16 171 03 10
BCCldont
quarter 10 1 l l 17 12 SelP94 1 19 1 16 Dec.94 1.17 1 14 1 20 Mar-95 1.31 1.24 I 20 Jun-95 1 21 I 29 1 41 Sep95 1 27 1 18 1 17 Dec-g5 1 21 1 17 1 25 Mar.96 1 15 1 19 1 19 Jun-96 1 21 1 27 1 24 Sep-96 1.15 1 24 1.19 Dec-96 1 26 1 19 I 17 Mat-97 1 29 1.17 1 18 Jun-97 1.17 I 13 1 20 Sep-97 1.22 1 28 1 10 Dec-97 1 18 1,08 1 16 Mar.98 1 09 1 14 1 08 Jun-98 1 16 1 10 1 10 Sop-98 1 14 1 09 1 16 Dec.98 1 10 1,12 1 17 Mar-99 1,14 1 24 1,11 Jun-99 1.34 1 09 1.15 Sop-99 1 24 1 17 1 16 Dec-99 1 23 1.15 1 15 Mar-a0 1,19 1 10 1 24 Jun-O0 1 22 1,16 1 14 Sop-O0 1 25 1.17 1 I1 Dec-00 1 27 1 21 Mar-01 1 16 Jun-01
1.11 1 11 1 33 1.17 1 11 109 1 15 1.10 125 106 1 12 1 18 118 108 1 15 1 13 122 113 1.10 1 18 1.10 1 06 1,07 1,07 1 13 1,06 1 05 1.05 1,06 1 13 1 11 1 14 1 15 1 09 1,08 1 13 1 16 1 08 1,08 1 16 1,11 1 00 1.07 1.10 1 10 1.07 108
1.12 1 09 1.10 1 08 1.07 1.14 I 08 1.13 1.12 1 12 1 11 1.13 1.16 1 12 1 12 1 14 1 06 1 18 1,08 1 15 1 15 1,11 1 05 1 07 1 05 1,05 1 06 1 04 1.05 1 06 1,04 1 07 1,08 1 07 1,05 1 03 1 03 1,07 1 07 1 08 1 08 1.10 1 05 1.06 1.13 1 10 1 06 1.18 1 09 1 09 1.06 1.08 1 05 1 06 1.05 1 06 1 08 1 05 1 08 1 11 105 1 08
1 06 113 1 09 1 07 1,10 1 08 I 05 1.05 1 04 I 05 1 08 1 06 1 03 1.07 1.04 1 07 1.08 1.05 1 03
1 Ie 104 1 OE 1.07 1 04 1 O5 1.07 1.01 1.02 1 05 1.08 104 1 07 1 02 1 07 1 O3 1 1(~ 106
Last 1 year last 2 years last 3 years last 4 years all years
I 22 1 17 1.15 1 09 1 10 1 08 1 23 1.17 1.15 1.10 1.11 1 10 1 20 1,15 1 14 1 10 1,10 1 09 1.19 1 15 1.15 I 10 1 10 I 09 1 20 1,17 1 17 1 12 1,11 1,10
1.06 1 07 1.06 1 07 1 07 I 07 1.05 1.06 1 06 1 06 1 06 1 05 1 07 1 07 1.06 1.05 108 107 106 105
accident quarter
development quarter of flnallsat,on 20 21 22 23 24 25 26
SelP94 Dec.94 Mar-95 Jun-95 Sep-95 Dec-95 Mar-06 Jun-96 Sap-g6 Dec-96 Mar-97 Jun-97 Sap-97 Dec.97 Mar-98 Jun-98 SeP-98 Dsc-98
1 06 1 10 1.06 1 04 1 03 1 01 1 03 1 06 1.03 1.03 1 02 1 03 1 03 1 02 1.02 1.01 1 01 1 01 1 04 1,02 1,07 1,03 1 01 1 01 1 02 1,05 1 01 I 03 1,02 1 02 1 03 1 03 1 02 1,00 1 03 1 04 1 01 1.02 1 02 1 04 1 02 1 02 1 09 1,02 1 04 1 00 1,04 1 02 1 06 1,03 1 04 1 05 1,02 1,02 1 04 1 08 1 08 1 02 1 01 1.01 1 08 1 03 1,17 1 03 1,02 1,00 1 07 1 03 1 05 1 01 1 02 1 01 1 04 1 03 1.08 1 03 1 02 1 05 1.02 1 03 1 01 1 05 1.04 1 02 1 02 1.03 1.03
1 03 1 00 1 05 1 05 100 101 101 101 106 101 101 101 1 01 1 03 1.01 1 02 1 01 1.01 1 08 1 01 1 02 1 00 1 00 1,01 1 01 1 03 1 01 1,06 1 03 1,02 1 00 1,01 1,02 1,04 1 02 1 04 1,02 1 02
la811 year lasl 2 years last 3 years Ilast 4 years Jail ),ears
1 04 1.03 1 04 1 02 1 02 1 01 1.03 1 03 1 01 1 02 1 05 I 04 1 06 1 04 1 02 I 02 1 02 1 02 1 02 1 02 1 05 1 03 1 05 1 03 1.02 I 01 1 02 1 02 1 01 1 04 1 02 1.06 1 01 1 01 104
386

acddenl development ¢~Jeffer o1 finehsBI,On quarter 30 31 32 33 34 35
Sep-94 1.00 1 00 1 04 1 00 1.00 1 00 Dec-94 I 01 1 02 1 01 1 02 1.01 1.00 Mar-95 1.04 1 02 1 00 1.02 1.01 Jun-95 1.01 1 01 1 01 1 01 Sap-95 1 01 1.00 1 O0 Dec-95 1.01 1 00 Mar-96 1 OO Jun-96
1 02
ast 1 year 1.01 1.01 1.01 1 01 1 01 O00 00(~ as1 2 years 1 00 1 01 1.01 asl 3 years esl 4 years zll years
B.2 Age-to-age factors based on average sizes of finalised claims
accident eevelopmers quaffer 01 flna,sa~on quarter 0 1 2 3 4 5 6 7 8
1 00 Se1>-94 2.10 2 01 1 59 Dec-94 4 14 1.07 1 16 1 38 Mar-95 3 19 I 44 1 27 1 09 Jun-95 1 67 1.21 1 26 Sap-g5 12 80 1 24 1 34 1 12 Dec-95 0 71 1 01 1 20 1.18 Mar-96 1 07 1 12 1.26 Jun-96 1 36 1 15 1.20 Sep-9~ 083 148 133 1.17 Dec-96 1.78 1.18 1.06 Mar-97 1.48 1.27 1 25 Jun-97 1.18 1 17 1.15 Sap-97 44.24 1.84 1 36 1.21 Dec-9T 0 76 1.89 1 14 1 22 Mar-98 1.51 1 50 1 10 Jun-98 1.42 1 25 1.23 Sap-98 1 00 1 22 1 28 1 25 0eC-98 1 25 1.47 1 38 Mar-99 9 78 1 83 1 38 1 15 Jun-99 37 55 1 76 1 29 I 23 Sap-99 41 93 1 55 1.49 1.17 Dec-99 9.93 1 45 1.21 1.33 Mar-00 O 90 1 29 1.79 1 07 Jun-0O 1 96 1 60 1.28 1 27 Sap-00 1.07 1 25 1.24 Oec-OO 15 27 1 47 1.68 1.44 Mar-Ot 5.33 1.76 1 94 1 24 Jun-01 2 35 1.51 1.34 1 62 Sap-01 3 38 1 38 1 96 1.57 Dec.Ol 3.53 1.71 1 76 1 76 Mar-02 1 47 208 201 1.17 Jun-02 3 15 1 91 1 36 I 45 Sap-02 2 11 1 55 2 05 1 29 De(;-02 041 147 151 Mar-03 2 16 1 10 Jun-03 0 65 SepO3
1 07 096 1 11 105 1.08 1 08 1 15 1 08 1 21 1.04 1 06 1.t2 1.07 1.18 1.14 1.09 1.12 1.15 1 21 1 29 1 13 1 15 1 09 1 26 120 1 13 122 1 13 123 1 17 1 17 1 27 129 111 1 16 1 19 1 26 I 07 1 19 1 10 1 23 I 13 1 07 1 16 1 20 1 14 1 27 1 32 1 52 1 15 1 33 1 31 1.42 1.27 1 32 1.38 1.29 1 10 1.18 1 30 1 43 1.11 1 25
107 113 1 07 1 04 1.19 1 05 1.23 1.17 111 130 113 1 16 1.28 1.18 1.12 1.18 1.10 1.17 1 O9 1.12 1.15 1 17 1.12 1.28 1 16 1.28 1.18 1.19 1 06
103 I 11 109 1 13 1 0 8 1 2C 1 14 1 07 1 17 109 108 122. 1 18 1 1C 1 17 I.OE 1.18 1.15 111 111 1 18 1.10 1.18 1.1 q 1.17 1 16 1.22 1 11 1.15 1.12 1.14 1.04 1.09 1 09 1 15 1 03 1 07 1 06 1 11 1 11 1 19 1 20 1 19 1 13 1 10 1 15 I 18 1 09 1 11 1.09 1 17 1 15 1 13 108 1 19 1.07 1 07
ast 1 year ast 2 years ast 3 years a$I 4 years all years
0.78 1 54 1.71 1 39 1 29 1 23 1.17 1.14 1 10 1.23 1 59 1.72 1 42 1 34 1 24 1.18 1.14 1 12 1 50 1 51 1 63 1 35 1 28 1 21 1 18 1.14 1.10 1.74 1.81 1.53 1 32 1 27 1 20 1.16 1 14 1 10 2.65 1 43 1 39 1.27 1 21 1 16 1.18 1 14 1 I1
387

acOdent quarter
SeD-94 1.09 11 12
1 08 1 05 1 08
developmem quarter of flrlallSatJon 13 14 15 16
I 04 1 03 1 08 1.05 1 01 1 04 1.1~ 1 21 1 09 1.05 1 05 1.05 1.10 1 0." 1 03 1 04 1 08 1 04 1.09 1 07 1 0( 1 09 1 05 1 06 1 07 1.08 1 04 1 0~ I 17 1.02 I 09 1 12 1 09 1 00 1 0; 106 113 108 110 104 105 102 1 12 105 1 12 105 1 12 103 10E 1.09 1.08 1 11 1.07 1.03 1 03 1 01 1.14 1 00 1 04 1.03 1 03 1 03 1 O; 1 06 1.13 1 03 1.03 1 03 1 04 1.0~ 1 05 1 03 1.04 1 02 1 05 1 07 1 0~ 1 04 1 04 1.06 1.05 1.04 1 03 1 0~ 1 09 1 04 1.02 1.02 1 04 1 01 1 0E I 03 1 03 1 05 1.04 1.05 1 05 1.01 1 03 1 10 1.07 1.02 1 04 1 03 1.0~ 1 07 1 07 1,09 1,06 1,03 1,05 1 01 1 07 1 05 1.13 1 05 1 06 1.06 1 0E 1 05 1 09 1 04 1 06 1 03 1.03 1.04 1 10 1 05 1,04 1 03 1 03 1,02 1.04 1.11 105 103 106 1 07 1 05 1 08 1 03 1.03 I 06 1 05 1.04 1 04 1 05
Dec-04 Mar-95 Jun-95 Sep-95 Dec-95 Mar-96 Ju~96 Sep-96 Dec-96 Mar.97 Jun-97 $ep-97 Dec-97 Mar-98 Jun-98 Sep-98 Dec.98 Mar-99 Jun-99 Sep-99 Dec-99 Msr-00 JurvO0 ,Sep-O0 Dec-00 Mar-01 Jun-01
1 07 1 19 1 10 111 116 1.12 1 08 1.09 1.08 1 06 1.11 1 I1 1 18 1,07 I 14 1.14 1.11 1 19 1 00 109 106 1 13 1 19 108 104 I 02 1 09 I 08 1 05 1 08 1 05 I 06 1 07 107 1 12 117 104 1.14 1 08 1 12 1.07 1 10 1.08 I 13 1.09 1 16 1 08 1 15 1 13 1 07
1 07
1 00 1 29 110 I 16 111 114 l i t 1 08 1,11 1 10 1 05 1.10 1 O5 1 06 1 10 1 09 1 05 I 07 1 0 5 1.08 1 16 1 07 I 0 4
ast 1 year 1 13 1 09 1 09 1 05 1.07 1 06 1 04 1 05 1 04 1 05 ast 2 years 113 109 108 105 1.07 1.07 104 1.04 1.04 104 asl 3 years 1.11 1 08 1 00 1 05 1 06 I 06 1 04 1 04 1.04 1 04 asl 4 years 1 . I0 1 08 1 08 1 06 1.07 1.06 1 04 1.05 1.04 1 0~ all yearn 1.11 1 09 1 09 1 07 1 06 1.06 1.05 1.05 1 05 1.04
accident quarler i j ]
developfnent quarter of flnalisa~on 23 24 25 26
Sep-94 1 04 1 08 1.03 1 03 1 02 1 01 Dec-94 1 02 t.04 1.01 1 02 1.01 1 03 Mar-95 1 02 1 01 1 01 1 00 1 01 1 01 Ju~95 1 02 1 01 1 06 1 03 1 01 1 01 Sep-95 1 01 1 03 1.00 1 02 1.02 1 01 Dec-95 1 02 1 01 1 02 1 00 1 02 1.03 Mar-96 I 00 1 01 1 01 1 02 1 01 1 01 Jun-00 I 08 | 01 1.02 1 08 1 03 I 01 SelC-96 1 05 1 02 1 03 1 04 1 02 1 01 Dec-96 1 02 1 07 1 07 1 01 1 01 1 01 Mar.97 1 06 1,02 1 16 1 02 1,02 1 00 Jun-97 1 05 1 02 1 04 1 00 1 01 1 00 Sep97 1 03 1.02 1.07 1 03 1 02 Dec-97 1 04 1 01 1.02 1 00 Mar-98 1.04 1.02 1 01 Jun-08 1 01 1 02 Sep-98 1 02 Dec-96
1 03 100 1 05 101 101 101 1 01 1 02 1 02 1.03 1.02
100 1 00 1 00 1 02 I 00 1 00 1 03 101 104 1 O2
104 1.00 1 O0 101 1 08 100 1.01 1 O0 1 02
104 1.01 I 0C 1 02 10Q 1.00 1.05 101
asl 1 year 1 02 I 02 I 04 1.01 1 01 1 01 ast 2 years 103 102 105 1.03 1.02 101 ast 3 years 1 03 1 02 1 04 1.02 1 02 1 01 ast 4 years 1 03 1 02 1 04 1.02 1 02 all ~ a r s 1 03
1 02 1.02 1 01 I 02 1.01 1.02 1 01 1 02 1.02 1.01 1.02
388

8cr..~ en! quanor
oevelopment quarter of flnallsa,on 31 32 33 34 35
~p -94 1 CO 1 CO Dec.94 1 01 1 02 Mar-95 1.03 1 01 Jun-gE 1 01 1 01 SeD-gE 1.01 1 CO Dec-9E 1.01 1 00 Mar-9~ 1.00 Jun-gE
1 03 1.00 1 CO 1 00 1.01 1 02 1 01 1.00 1.00 1 02 1 01 1.01 1.01 100
I 0:,
lasl I year last 2 years last 3 years last 4 yeats all years
1 01 1.01 1 01 1 01
100 101 101 100 101
1 O:
389

References
Akaike, H. (1969). Fitting autoregressive models for prediction. Annals of the Institute of Statistical Mathematics, 2 I, 243-247.
Ashe, F.R. (1986). An essay at measuring the variance of estimates of outstanding claims payments. ASTIN Bulletin, 16S, 99-I 13.
Berquist, J.R, and Sherman, R.E. (1977). Loss reserve adequacy testing: a comprehensive systematic approach. Proceedings of the Casualty Actuarial Society, LXIV, 123-185.
De Jong, P. and Zehnwirth. B. (1983). Claims reserving, state-space models and the Kalman filter. Journal of the Institute of Actuaries, I10, 157-182.
England, P.D. and Verrall, R.J. (2000). Comments on "A comparison of stochastic models that reproduce chain-ladder reserve estimates". Insurance: Mathematics a n d E c o n o m i c s , 26, 109-1 I I.
England, P.D. and Verrall, R.J. (2002). Stochastic claims reserving in general insurance. British Actuarial Journal, 8,443-518.
Hertig, J. (1985). A statistical approach to the IBNR-reserves in marine reinsurance ASTIN Bulletin, 15, 171-183.
McCullagh, P. and Nelder, J. (1989). Generalised Linear Models, 2 "d edition. Chapman and Hall.
Mack, T. (1993). Distribution-free calculation of the standard error of chain-ladder reserve estimates. ASTIN Bulletin, 23, 213-225.
Mack, T. (1994). Which stochastic model is underlying the chain ladder method? Insurance: Mathematics and Economics, 15, 133-138.
Mack, T. and Venter, G. (2000). A comparison of stochastic models that reproduce chain-ladder reserve estimates. Insurance: Mathematics and Economics, 26, 101- 107.
Murphy, D.M. (1994). Unbtased Loss Development Factors. Proceedings of the Casualty Actuarial Society, LXXXI, 154-222.
Nelder J.A. and Wedderburn R.W.M (1972). Generalized linear models. Journal of the Royal Statistical Society A, 135, 370-384.
Reid, D.H. (1978). Claim resen, cs in general insurance. Journal of the Institute of Actuaries, 105, 211-296.
Renshaw, A.E. (1989). Chain-ladder and interactive modelling (claims reserving and GLIM) Journal of the Institute of Actuaries, 116, 559-587.
390

Taylor G.C. (1988). Regression models in claims analysis i: theory. Proceedings of the Casualty Actuarial Society., LXXIV, 354-383.
Taylor, G. (2000). Loss reserving- an actuarial perspective. Kluwer Academic Publishers, Boston.
Taylor, G.C. and Ashe, F.R. (1983). Second moments of estimates of outstanding claims. Journal of Econometrics, 23, 37-61.
Taylor G., McGuire G. and Greenfield A. (2003). Loss reserving: past, present and future. Invited lecture to the XXXIVth ASTIN Colloquium, Berlin, 24-27 August 2003. Reproduced in the research paper series of the Centre for Actuarial Studies, University of Melbourne.
Verrall, R.J. (1989). A state space representation of the chain-ladder linear model, Journal of the Institute of Actuaries, 116, 589-610.
Verrall, R.J. (1990). Bayes and empirical Bayes estimation for the chain-ladder model, ASTIN Bulletin, 20, 217-243.
Verrall, R.J. (1991a). On the unbiased estimation of rese~,es from Ioglinear models. Insurance: Mathematics and Economics, 10, 75-80.
Verrall, R.J. (1991b). Chain-ladder and maximum likelihood, Journal of the Institute of Actuaries, 118, 489-499.
Verrall, R.J. (2000). An investigation into stochastic claims reserving models and the chain-ladder technique. Insurance: Mathematics and Economics, 26, 91-99.
Wright, T.S. (1990). A stochastic method for claims reserving in general insurance. Journal of the Institute of Actuaries, I 17,677-731.
Zehnwith, B (2003). ICRFS-Plus 9.2 Manual. Insureware Ply Ltd, St Kilda, Australia.
391

392
Copyright © 2022 FDOKUMEN