sIGNAL LOSS - The New Zealand Initiative
60
sIGNAL LOSS WHAT WE KNOW ABOUT SCHOOL PERFORMANCE MARTINE UDAHEMUKA FOREWORD BY DR MICHAEL JOHNSTON
-
Upload
khangminh22 -
Category
Documents
-
view
0 -
download
0
Transcript of sIGNAL LOSS - The New Zealand Initiative

$25.00
ISBN: 978-0-9941298-6-4 • print
978-0-9941298-7-1 • online/pdf RR26
The New Zealand Initiative
PO Box 10147
Wellington 6143
Signal Loss: What We Know About School Performance
As consumers, we like to make informed choices about the products and services we buy. Should choosing a school for our children be any different?
Signal Loss argues that though it is difficult to monitor school quality, it is vitally important to do so. Not only can monitoring of school quality identify problems. It can also identify best practice and help to spread it across the education system.
The first in a series of three reports, Signal Loss looks at the state of New Zealand’s schools and the way their performance is assessed and managed.
SIGNAL LOSS: WHAT WE KNOW ABOUT SCHOOL PERFORMANCE
MARTINE UDAHEMUKA
THE NEW ZEALAND INITIATIVE
sIGNAL LOSSWHAT WE KNOW ABOUT SCHOOL PERFORMANCEMARTINE UDAHEMUKAFOREWORD BY DR MICHAEL JOHNSTON

© The New Zealand Initiative 2016
Published by:
The New Zealand InitiativePO Box 10147Wellington 6143New Zealand
www.nzinitiative.org.nz
Views expressed are those of the authors and do not necessarily reflect the views of The New Zealand Initiative, its staff, advisors, members, directors or officers.
ISBN: 978-0-9941298-6-4 • print 978-0-9941298-7-1 • online/pdf
RR26
Typeset by The Little Design Company and cover design by Mollica Sokhom
Printed by Wickliffe Solutions

The New Zealand Initiative is an independent public policy think tank supported by chief executives of major
New Zealand businesses. We believe in evidence-based policy and are committed to developing policies that
work for all New Zealanders.
Our mission is to help build a better, stronger New Zealand. We are taking the initiative to promote a
prosperous, free and fair society with a competitive, open and dynamic economy. We develop and contribute
bold ideas that will have a profound, positive, long-term impact.
2016
sIGNAL LOSSWHAT WE KNOW ABOUT SCHOOL PERFORMANCEMARTINE UDAHEMUKAFOREWORD BY DR MICHAEL JOHNSTON


ABOUT THE AUTHOR 1
ACKNOWLEDGEMENTS 1
FOREWORD 3
EXECUTIVE SUMMARY 5
INTRODUCTION 7
CHAPTER ONE: STUDENT PERFORMANCE AT A GLANCE 11
1.1 KIWI STUDENTS COMPARED INTERNATIONALLY 11
1.2 KIWI STUDENTS COMPARED DOMESTICALLY 16
1.3 CONCLUDING REMARKS 19
CHAPTER TWO: SCHOOL PERFORMANCE AT A GLANCE 21
2.1 ERO REVIEWS 21
2.2 INTERVENTION FOR POORLY PERFORMING SCHOOLS 25
2.3 MISSED OPPORTUNITIES TO MANAGE POOR PERFORMANCE 27
2.4 CONCLUDING REMARKS 30
CHAPTER THREE: SOME FACTORS THAT PREVENT LEARNING FROM FAILURE 31
3.1 EFFECTIVE AND LESS EFFECTIVE TEACHERS: WHO KNOWS? 32
3.2 INEFFECTIVE PRINCIPAL LEADERSHIP 34
3.3 INEFFECTIVE SCHOOL BOARDS 35
3.4 SCHOOLS ARE RESTRICTED TO MAKE VITAL DECISIONS 35
3.5 PARENTAL CHOICE IS ALSO RESTRICTED 36
3.6 CONCLUDING REMARKS 38
CHAPTER FOUR: IMPROVED QUALITY SIGNALS POSSIBLE 41
4.1 INFORMATION FLOW ON STUDENT ACHIEVEMENT 41
4.2 WHERE THE SIGNAL GETS LOST 42
4.3 WHAT IS THE ALTERNATIVE? 42
4.4 WHAT COULD BE THE RESERVATIONS? 45
4.5 CONCLUDING REMARKS 45
CONCLUSION 47
BIBLIOGRAPHY 49
TABLE OF CONTENTS

TABLES, FIGURES AND BOXES
TABLE 1: PERCENTAGE OF ENROLLED STUDENTS AT OR ABOVE NATIONAL STANDARDS (2011–14) 16
TABLE 2: PERCENTAGE OF 18-YEAR-OLDS WITH NCEA LEVEL 2 OR EQUIVALENT (2011–14) 17
TABLE 3: SECONDARY SCHOOL QUALIFICATION ATTAINMENT AS A PROPORTION OF 18
ALL SCHOOL LEAVERS (2009–14)
TABLE 4: SCHOOL LEAVER UPTAKE IN ALTERNATIVE PATHWAYS (2011–14) 18
TABLE 5: CHANGE IN THE PERFORMANCE OF 786 SCHOOLS REVIEWED BY ERO (2014–15) 23
TABLE 6: STATUTORY INTERVENTION IN PERSISTENTLY POORLY PERFORMING SCHOOLS (2015) 26
TABLE 7: BREAKDOWN OF THE 7,000 STUDENTS AT HIGH RISK OF NOT ACHIEVING NCEA LEVEL 2 44
FIGURE 1: TIMSS YEAR 5 MATHS (1994–2011) 12
FIGURE 2: TIMSS YEAR 9 MATHS (1994–2011) 13
FIGURE 3: TIMSS YEAR 5 SCIENCE (1994–2011) 13
FIGURE 4: TIMSS YEAR 9 SCIENCE (1994–2011) 13
FIGURE 5: PIRLS YEAR 5 READING (2001–11) 14
FIGURE 6: PISA READING (2000–12) 15
FIGURE 7: PISA SCIENCE (2006–12) 15
FIGURE 8: PISA MATHS (2003–12) 15
FIGURE 9: ERO’S STOCKTAKE OF SCHOOL PERFORMANCE AS AT 30 JUNE 2015 (UPDATED IN 2016) 23
FIGURE 10: HOW THE 786 SCHOOLS MOVED BETWEEN ERO PERFORMANCE CATEGORIES (2014–15) 24
FIGURE 11: PROPORTION OF STUDENTS IN THE 67 SCHOOLS WITH LSMs OR COMMISSIONERS 26
(OCTOBER 2015)
FIGURE 12: TEACHER TURNOVER BY DECILE (2010–15) 33
FIGURE 13: EXAMPLE OF A VALUE-ADDED ASSESSMENT 43
BOX 1: ERO’S REVIEW PROCESS 22
BOX 2: THE CONTRIBUTION OF SCHOOL, TEACHER AND STUDENT LEVEL FACTORS 32
ON STUDENT ACHIEVEMENT

SIGNAL LOSS: WHAT WE KNOW ABOUT SCHOOL PERFORMANCE 1
ABOUT THE AUTHOR
MARTINE UDAHEMUKA
Martine is a Research Fellow at The New Zealand Initiative working on education policy. She has previously published research on migrant and refugee integration in New Zealand. Before moving to Wellington to work for the Ministry of Foreign Affairs and Trade, Martine held roles as student success advisor and learning consultant at Massey University, Palmerston North.
She holds a Masters of Arts in Industrial and Organisational Psychology with first class Honours from Massey University.
ACKNOWLEDGEMENTS
The author thanks all the school principals and staff from the Ministry of Education and the Education Review Office who generously gave their time. Thanks to Dr Michael Johnston, Laureate Professor John Hattie, John Taylor, Catherine Isaac and Roger Partridge for their comments on an earlier draft. Many thanks also to Dr Oliver Hartwich and Dr Eric Crampton for their expert advice and support during the project. Of course, responsibility for all views expressed and any remaining errors and omissions lies with the author.


SIGNAL LOSS: WHAT WE KNOW ABOUT SCHOOL PERFORMANCE 3
FOREWORD
Schools in New Zealand operate in a very different environment than they did 30 years ago. The Tomorrow’s Schools initiative, introduced in 1989, radically decentralised school governance and introduced an element of competition between schools that had not previously existed. For secondary schools, the tumultuous introduction of the National Certificate of Educational Achievement (NCEA) between 2002 and 2004 has revolutionised the senior school, with a far greater proportion of students retained into the final two years of school than before, and with a far greater proportion gaining qualifications. NCEA has also resulted in an almost overwhelming quantity of student achievement data, with multiple assessment results for every course, the majority of which are now assessed by schools themselves, rather than by end-of-year examinations. Since 2010, primary schools have been required to report annually the achievement of all students against National Standards in reading, writing and mathematics. Again, this has resulted in a great volume of data, not only in the form of standards judgements themselves, but also in a great range of standardised tests and other assessments, which are often used to support those judgements, as well as for other purposes.
The wealth of assessment data now available to schools presents both opportunities and challenges. Foremost among the opportunities is that schools can analyse data to improve teaching and learning. For example, data can be used for early identification of students at risk of low achievement, so that programmes can be enacted to support their success. Further analysis can be used to monitor those programmes and, where necessary, to indicate a need to modify them. Other potential uses of data include the evaluation of new approaches to teaching, self-evaluation by individual teachers, and monitoring of programmes of learning at departmental and whole-school levels.
Using data in these sorts of ways is not without potential pitfalls. For example, it is important to be aware of limitations on the reliability of individual assessments, the extent to which variables other than those included in an analysis might explain patterns observed in data and, especially when data is used to evaluate teaching, the risk of creating an environment in which teachers feel threatened. All of these risks can be managed, but to do so requires both a modicum of expertise with data analysis and a collegial school environment.
Perhaps the greatest downside of the abundance of educational data, especially in the competitive environment that has been in place since the introduction of Tomorrow’s Schools, is a tendency for the media to compare schools in so-called ‘league tables’, and for schools to advertise themselves by publishing data showing how much better they are doing than other nearby schools. This kind of use of data is often deliberately simplistic because the purpose is not to improve teaching and learning, but to create a sensational story or to gain a marketing advantage.
Schools must learn to make the most of the opportunities offered by assessment data, while avoiding the pitfalls and being able to make evidence-based responses to any mendacious use of data that stands to compromise their reputations. Unfortunately, many schools are not in a good position to do these things, largely because many teachers lack expertise and confidence in data analysis and interpretation. This is not the fault of teachers; when many currently-practicing teachers were trained, there was little to suggest that they would need these skills. Even now, skills in analysing data, or even sound assessment practice, comprise at best a minor part of teacher training programmes. For this, the education faculties of our universities must take responsibility, and seek to improve. There are some encouraging signs on this front, with many universities now offering Masters-level

THE NEW ZEALAND INITIATIVE4
teaching qualifications, some of which promote evidence-based practice.
These Masters programmes are just a beginning, and only a minority of pre-service teachers are presently undertaking them. Moving towards an environment in which teachers have the skills to use assessment data to improve their own practice, in which they feel confident to do so without
feeling pilloried, and in which educators are able to cogently respond to spurious or inaccurate use of data in the media will take time, political will, and substantial resources. It is my hope that Signal Loss by Martine Udahemuka will act as a spur to politicians, to educational leaders, to teachers, and to the universities that train them, to take this challenge seriously.
Dr Michael JohnstonSenior LecturerFaculty of EducationVictoria University of Wellington

SIGNAL LOSS: WHAT WE KNOW ABOUT SCHOOL PERFORMANCE 5
EXECUTIVE SUMMARY
School decline compromises the educational opportunities of students, the careers of teachers and school leaders, disturbs communities and costs governments millions of dollars.
— Kay Hawk1
New Zealand’s compulsory education sector benefits many students. Most young adults leave school having gained valuable skills that serve them well into adulthood. This is credit to hard-working students; engaged parents; committed sector leadership; and the quality of our school leaders and teachers. Our country and society leverage off the human and social capital drawn from a quality schooling experience.1
But 21st century New Zealand is facing particular challenges: an ageing workforce; a growing need for young people with adaptable skills; and an upward demand for better skilled and higher educated workers. The days when low-skilled school leavers could easily slide into jobs requiring only basic literacy and numeracy skills will increasingly become few and far between. It is thus vital to give students the tools they need to access further training and meaningful employment. The better qualified they are, the easier it is to adapt to changing work conditions. The cost of a poor education, on the other hand, presents ripple effects that go beyond the individual and hurt the growth, productivity and prosperity of the nation.
Thus, a true measure of the quality of an education system should be how it supports all students to reach their potential and gain skills to help them participate meaningfully in the labour market and contribute to citizenry. In New Zealand, a number of key indicators are used to judge how students and schools are doing. These include well-established international tests, national assessments, and independent school reviews.
1 Kay Hawk, “School Decline: Predictors, Process and Intervention,” Ph.D. thesis (Auckland: Massey University, 2008), 258.
This is the first report in a series of three examining the state of New Zealand’s student and school performance against these key indicators.
At first glance, average primary and secondary student performance in New Zealand is promising:
� The country’s top students are on par with the brightest students internationally.
� The proportion of students reaching national benchmarks is increasing year after year.
However, amid the good lies a layer of poor performance:2
� Performance in basic literacy and numeracy in international tests is declining.
� In 2014, 1 in 10 students left secondary school without a formal qualification; 1 in 5 left without a National Certificate of Educational Achievement (NCEA) Level 2 qualification.
� Though they are improving at a faster pace than the national average, Māori and Pasifika students continue to be over-represented in underachievement statistics.
The Education Review Office (ERO) evaluations also show most schools doing well and many others improving. But at 30 June 2015, 185 schools (8% of all state and state-integrated schools) were in ERO’s lowest performance tier. These schools lack the internal capability to manage significant concerns and need intervention.
2 The terms ‘poor performance,’ ‘underperformance’ and ‘failing schools’ are used interchangeably in the education literature – and in this report – to refer to performance that does not meet benchmarks against which the Ministry of Education, the Education Review Office, and schools evaluate school performance.
msokhom
Sticky Note
Marked set by msokhom

THE NEW ZEALAND INITIATIVE6
Persistent poor performance is an issue for many schools:
� 65 of the 185 schools (one-third) already in ERO’s lowest performance tier had not significantly improved their performance by their next review, despite intervention;
� 20 of the schools had performed poorly for eight to nine years on average, and some had persistently failed for more than a decade;
� 67 school boards were under Ministry of Education intervention and more than half (51%) of the students under these boards were in deciles 1–3.
Although the key performance indicators allow observers to know who is and who isn’t meeting national targets, and the Ministry knows which are the weakest schools in the country, this report argues that this is not sufficient because of the following systemic issues:
� Existing data on students is neither used to adequately determine whether they perform as expected, given their starting points, nor determine the academic quality of schools based on their student intake.
� Current teacher appraisal systems do not accurately differentiate between effective and less effective teachers.
� Teacher turnover is increasing, and it is greater in lower decile schools compared to higher decile schools.
� Ineffective governance, leadership and teaching are prevalent in most poorly performing schools.
� ERO and the Ministry do not formally evaluate interventions in poorly performing schools, teacher turnover trends, or leadership issues to understand what works, what does not and why. Systematic evaluations could help replicate successful interventions in schools facing similar challenges, and adjust or abandon those that do not work.
The introduction of NCEA in 2002 and of National Standards in 2010 has resulted in an abundance of data on student achievement. Furthermore, the push by the Government for evidence-based policy has seen the introduction of a one-stop shop of administrative data, namely, the Integrated Database Infrastructure (IDI) that safely houses long term data on individuals. These developments are yet to be optimally used in order to improve the quality signals of the teaching and learning that happens in schools – and ultimately support systematic school improvement efforts.
The demand for information on school performance comes from many people, which is why media agencies continue to produce annual school league tables. But these tables are poor indicators of how effective a school is in educating its students when compared to schools with a similar intake of students.
Thus, there needs to be much better use of the available data on schools and students.
Good information is key to raising standards in any sector. If a business fails to meet customer expectations and does not swiftly find solutions, it will organically lose to competition as customers choose to go elsewhere. But school choice for parents in New Zealand is limited by both restrictions on school enrolments and the substandard quality of publicly available information about schools’ relative strengths and weaknesses. This report finds that some schools, whose core business is to educate the country’s youth, continue to poorly perform – sometimes for a student’s entire schooling career.
This report is the first in a series of three dealing with the definitions, measurement and management of school success and failure. The report presents an overview of performance in primary and secondary schools, including initial observations about the problems associated with the analysis and distribution of information to improve student achievement.

SIGNAL LOSS: WHAT WE KNOW ABOUT SCHOOL PERFORMANCE 7
INTRODUCTION
Albert Einstein once quipped: “Education is what remains after one has forgotten what one has learned in school”. Though this is a witty saying, what students learn (and hopefully not forget) at school greatly matters.
A formal school qualification gives students foundational skills to draw on as adults and better supports them to participate in a dynamic and changing global economy. Low qualified school leavers – for example, those who left school without a National Certification of Educational Achievement (NCEA) Level 2 – are likely to face an uphill battle later in their life, including a higher risk of unemployment and welfare dependency.3
Improving school performance is thus vital as it directly affects the academic potential of hundreds and thousands of students over many years and in turn contributes to better post-school outcomes.
Parents and educators obviously care about the quality of schools. But others too should because of the broader impact of schools and that of a competent labour force on our society and our country.
For example, Treasury’s modelling suggests that if New Zealand improved its average performance on the OECD PISA test by 25 points, the country’s GDP would be expected to be 3% to 15% higher than it
3 Sarah Tumen, et al. found that tertiary studies enhanced later life outcomes (employment and reduction in benefit receipt) of school leavers with less than NCEA Level 2, but only if they had gone on to complete their tertiary programme. More than half (56%) did not complete the qualification. See Sarah Tumen, Sarah Crichton and Sylvia Dixon, “The Impact of Tertiary Study on the Labour Market Outcomes of Low-Qualified School Leavers,” Working Paper 15/07 (Wellington: New Zealand Treasury, June 2015).
would be otherwise by 2070.4 While advancing up to the top position on international league tables may be implausible for New Zealand, the figures give a sense of the stakes.
Compared to state schools in New Zealand, other sectors of the economy have greater transparency and accountability for performance, and a greater opportunity for consumers to punish bad performance and reward good service. All this depends on the quality of information available to customers.
Service providers send signals on price, location and customer satisfaction to tell you how good they are and help you choose based on what you value most. In a two-way exchange of information, customers voting with their feet provide feedback about service providers: those who respond may improve and those who do not will lose clients and organically fail. This is how competition usually works.
Competition works differently in New Zealand schools. Feedback mechanisms, which normally work well for other services, are not as robust in the school sector. Quality is thus harder to measure. Even when it is measured, results hardly tell the whole story. Instead of using meaningful measures of academic achievement, all too often shortcuts
4 The OECD’s Programme for International Student Assessment (PISA) tests 15-year-olds’ maths, reading and science knowledge. Treasury’s analysis is based on Eric Hanushek and Ludger Woessmann, “Do Better Schools Lead to More Growth? Cognitive Skills, Economic Outcomes and Causation,” NBER Working Paper No. 14633 (2009), in The Treasury, “Treasury’s Advice on Lifting Student Achievement in New Zealand: Evidence Brief” (Wellington: New Zealand Government, 2012).

THE NEW ZEALAND INITIATIVE8
are taken. For example, decile ratings5 and school performance on national targets are commonly used to signal quality.
Though these commonly used indicators say something about likely classmates and average achievement, they say little about whether a school is doing a good job for its students. Observers generally take that higher decile schools, private schools, and schools with high numbers of students meeting national benchmarks are the better schools. What is not clear is whether a student who, say, moves from a decile 1 school to a decile 7 school would necessarily do better. Or vice versa. Would that same student lose ground by moving from a decile 7 school to a decile 1 school? Unfortunately, current media rankings of schools or school performance statistics collated by the Ministry provide no answers.
International rankings too show how students in some countries can be more than a school year ahead of their Kiwi peers. However, we not only need to know how Auckland students compare with, say, students in Singapore but also students in Northland. Or indeed, between different schools in Northland.
Students come from different backgrounds, so it makes sense to compare like with like.
For example, a student’s family background, individual ability, and previous experience in
5 The Ministry uses a decile rating system to target school funding. The deciles indicate the extent to which schools draw students from low socioeconomic communities relative to other schools. Schools in decile 1 are the 10% of schools with the highest proportion of students from low socioeconomic communities, while schools in decile 10 are the 10% of schools with the lowest proportion of students from low socioeconomic communities. The lower the decile rating, the more equity funding the school receives. A school’s decile is based on the small Census area, where its students live rather than on the general geographic area of the school. The indicators taken into account include: household income; parents’ occupation and educational qualifications; household crowding; and parents’ receipt of income support benefits. A school’s decile reflects neither its quality of education nor its overall socioeconomic make-up. Ministry of Education, “School deciles,” Website.
education will influence how they perform in school. Nevertheless, beyond out-of-school factors, teachers and schools also contribute to a student’s academic achievement, and it is that impact that needs to be evaluated.
Parents6 should be able to tell if their child is performing as well as children from a similar background, in the same class, with another teacher, and at other schools. Parents and students need useful data to compare schools.
Teachers should be able to tell which of their students are progressing as expected, given the students’ characteristics and starting points. Teachers would also benefit from appropriate information to assess and improve their own performance.
School principals and board members require the same information to monitor teacher and school effectiveness, evaluate programmes, and make decisions on the direction of school policy. Finally, policymakers need evidence about which policies work and which do not.7
The Ministry can use the information to identify schools of consistent high quality. By the same token, poor performance at the school, teacher and student levels could also be identified earlier and remedial action taken.
This report examines the key indicators used to define, measure and manage school success and failure; provides a snapshot of performance statistics against these indicators; and highlights some of the factors that contribute to poor performance and hinder school improvement. The report focuses on the parts of the debate that are not well canvassed, particularly the problems associated with the analysis and distribution of data. It argues that though a wealth of data exists on students and schools, it is not being well analysed or effectively used to understand
6 The term ‘parents’ broadly includes caregivers and guardians.
7 Mark Harrison, Education Matters: Governments, Markets and New Zealand Schools (Wellington: Education Reform, 2004).

SIGNAL LOSS: WHAT WE KNOW ABOUT SCHOOL PERFORMANCE 9
how students and schools are doing. This can hinder early identification of issues as well as of effective practice, which ultimately hampers school improvement efforts.
The report is based on discussions8 with school principals, leading education practitioners and researchers, and staff from agencies such as the Ministry of Education (the Ministry), the Education Review Office (ERO), and the Post-Primary Teachers’ Association (PPTA). Although the report focuses on state and state-integrated schools, the issues discussed could very well apply to other forms of schooling in New Zealand.
This is the first report in The New Zealand Initiative’s series of three on managing school performance.
8 Discussions took place between July 2015 and February 2016. Therefore this report details matters as current at those dates.
The second report will outline practices in New Zealand and other countries that have successfully dealt with school failure. The third and final report will offer practical policy recommendations to address the issues identified.
Failure is important. Good systems experiment and not all experiments succeed. But continued failure cannot be business as usual. This series aims to contribute to improving the quality of our education system so students can be better supported to achieve their potential. To echo the concerns of Treasury Secretary Gabriel Makhlouf, “The economic and social costs of educational failure are too high – and the benefits of success too great – to be ignored”.9
9 Gabriel Makhlouf, “Economic Leadership: When Business Isn’t Usual,” Speech (Wellington: The Trans-Tasman Business Circle, 20 March 2012).


SIGNAL LOSS: WHAT WE KNOW ABOUT SCHOOL PERFORMANCE 11
ONE STUDENT PERFORMANCE AT A GLANCE
Parents want and value different things from their children’s schooling. They want their children to acquire social skills, learn discipline, and obtain basic skills such as how to read, write and count. Though schools have many objectives, their core business is to ensure students leave school having gained as many of the basic academic skills as they are able.
Proficiency in basic skills is a valuable indicator of school performance and a useful predictor of life success. The Ministry, schools and parents commonly use achievement statistics from key international and domestic tests to judge the performance of New Zealand students.
Three well-established international tests gauge how students compare in three subject areas against peers in other countries: TIMSS, PIRLS and PISA.
The Trends in Mathematics and Science Study (TIMSS) and the Progress in International Reading Literacy Study (PIRLS) assess the mathematics (maths), science and reading performance of primary and lower secondary students. Questions on these tests are curriculum-based and designed to reflect the skills and knowledge taught in respective countries.10
The Programme for International Student Assessment (PISA) measures how well 15-year-old students apply knowledge in maths, science and reading to solve real-life problems.
To compare student performance within the country, academic performance in a number of learning areas in state and state-integrated schools
10 Ian V.S. Mullis, Michael O. Martin, Ann M. Kennedy, Kathleen L. Trong and Marian Sainsbury, “PIRLS 2011 Assessment Framework” (Boston: TIMSS & PIRLS International Study Center, 2009)
is evaluated against the New Zealand Curriculum.11 Expectations about student achievement at each year level are broken down at the primary and secondary levels to set the direction for teaching and learning in these areas.12
National Standards sets the proficiency levels students are expected to attain in reading, writing and maths in the first eight years of schooling. The National Certificate of Educational Achievement (NCEA) sets clear achievement expectations for senior secondary students (Years 11–13). The focus at both levels of schooling is on ensuring students acquire basic numeracy and literacy skills.
This chapter provides a snapshot of New Zealand school performance statistics against international and domestic standards – and finds that recent higher levels of proficiency in domestic assessments are not being reflected in international tests.
1.1 KIWI STUDENTS COMPARED INTERNATIONALLY
Benchmarked international tests such as TIMSS, PIRLS and PISA provide a regular opportunity for participating countries to take stock and assess progress of their education systems. On average, New Zealand students outperform their international peers or perform just as well as those in the highest ranked countries on many of these tests. The problem, however, is the decline in performance.
11 The learning areas are English, the arts, health and physical education, learning languages, mathematics and statistics, science, social sciences, and technology. Ministry of Education, “The New Zealand Curriculum,” Website.
12 Ibid.

THE NEW ZEALAND INITIATIVE12
Primary and lower secondary school students
TIMSS and PIRLS test the curriculum knowledge of primary and lower secondary school students in maths, science and reading. About 60 countries, including 28 OECD countries, participated in either or both of the tests during 2010 and 2011.13
In the last testing rounds for all subjects (2010–11), New Zealand’s Year 5 and 9 students performed worse on average than their national counterparts in the preceding years (Figures 1–5). Although there were some improvements between the 1990s and the early 2000s in maths and science, performance has since been declining towards the same average levels of when the tests began in 1994 despite efforts by the government to lift student achievement.14
New Zealand students are particularly weaker in maths than in science and reading compared to international peers. Year 5 and 9 students have consistently performed below the international centrepoint in maths since the 1990s (Figures 1–2). Concerns with maths performance have been documented in-depth in The New Zealand Initiative report Un(ac)ccountable (2015).15
Performance in maths (TIMSS)
TIMSS measures Year 5 and 9 students’ proficiency in maths and science every four years or so.
About 5,600 Year 5 students from 180 schools in New Zealand took part in the last TIMSS maths
13 Megan Chamberlain and Robyn Caygill, “Key Findings from New Zealand’s Participation in PIRLS and TIMSS in 2010/11”, rev. ed. (Wellington: Ministry of Education, 2013).
14 Initiatives in the early 2000s included the National Curriculum, NCEA, National Standards, and the Numeracy Project.
15 Rose Patterson, “Un(ac)ccountable: Why Millions on Maths Returned Little” (Wellington: The New Zealand Initiative, 2015).
test in 2010–11. Their average performance was lower than the international centrepoint, and similar to that of students from Croatia, Spain and Romania.16 The performance trend shows improvements between 1994 and 2002–03, and then a significant decline between 2002–03 and 2010–11 (Figure 1).17
Figure 1: TIMSS Year 5 Maths (1994–2011)
Source: Robyn Caygill, Sarah Kirkham and Nicola Marshall, “TIMSS 2010/11: Year 5 Students’ Mathematics Achievement” (Wellington: Ministry of Education, 2013), 28.
About 5,330 Year 9 students from 158 schools in New Zealand took part in the last TIMSS maths test in 2010–11. Like their younger peers, Year 9 students’ most recent performance shows a downward trend.18 Performance declined to levels below the early 1990s when the test began and the difference was not statistically significant (Figure 2).19
16 New Zealand’s mean score in 2010–11 was significantly lower than the international centrepoint. Robyn Caygill, Sarah Kirkham and Nicola Marshall, “TIMSS 2010/11: Year 5 Students’ Mathematics Achievement” (Wellington: Ministry of Education, 2013), 27.
17 Ibid.18 New Zealand’s mean score in 2010–11 was significantly
lower than the international centrepoint. Robyn Caygill, Sarah Kirkham and Nicola Marshall, “TIMSS 2010/11: Year 9 Students’ Mathematics Achievement” (Wellington: Ministry of Education, 2013), 29.
19 Ibid.

SIGNAL LOSS: WHAT WE KNOW ABOUT SCHOOL PERFORMANCE 13
Figure 2: TIMSS Year 9 Maths (1994–2011)
Source: Robyn Caygill, Sarah Kirkham and Nicola Marshall, “TIMSS 2010/11: Year 9 Students’ Mathematics Achievement” (Wellington: Ministry of Education, 2013), 30
Note: New Zealand Year 9s did not participate in TIMSS Maths in 2006.
Performance in science (TIMSS)
New Zealand Year 5 students’ science performance steadily improved from 1994 to 2002–03 but has since worsened to below 1994 levels (Figure 3). The country’s mean score of 497 in 2010–11 was lower than that of all other participating English-speaking countries (Australia = 516; England = 529; the United States = 544). The gains of the 1990s have been lost, with performance now statistically similar to that of 1994.20
Figure 3: TIMSS Year 5 Science (1994–2011)
Source: Robyn Caygill, Sarah Kirkham and Nicola Marshall, “TIMSS 2010/11: Year 5 Students’ Science Achievement” (Wellington: Ministry of Education, 2013), 28.
20 Robyn Caygill, Sarah Kirkham and Nicola Marshall, “TIMSS 2010/11: Year 5 Students’ Science Achievement” (Wellington: Ministry of Education, 2013).
Year 9 students’ performance in science also showed some decline from 2002 to 2010–11, but after smaller gains (Figure 4). In this case as well, there has been no significant progress from 1994 to 2010–11.21
Figure 4: TIMSS Year 9 Science (1994–2011)
Source: Robyn Caygill, Sarah Kirkham and Nicola Marshall, “TIMSS 2010/11: Year 9 Students’ Science Achievement” (Wellington: Ministry of Education, 2013), 30.Note: New Zealand Year 9s did not participate in TIMSS Science in 2006.
Performance in reading literacy (PIRLS)
PIRLS test takes place every five years, with the first cycle in 2001. About 5,600 Year 5 students from 192 schools took part in PIRLS in 2010–11 and were ranked 23rd out of 45 countries in reading literacy. Though the last testing round showed a slight drop in average scores in reading literacy, New Zealand’s performance has remained above the international centrepoint since the test begun (Figure 5). However, New Zealand’s 2010–11 ranking was similar to that of Bulgaria, Slovenia and the Slovak Republic.22
21 Robyn Caygill, Sarah Kirkham and Nicola Marshall, “TIMSS 2010/11: Year 9 Students’ Science Achievement” (Wellington: Ministry of Education, 2013).
22 Megan Chamberlain and Robyn Caygill, “Key Findings from New Zealand’s Participation in PIRLS and TIMSS in 2010/11”, op. cit.

THE NEW ZEALAND INITIATIVE14
Figure 5: PIRLS Year 5 Reading (2001–11)
Source: Megan Chamberlain, “PIRLS 2010/11 in New Zealand”, rev. ed. (Wellington: Ministry of Education, 2014), 27.
When compared internationally, primary and lower secondary students in New Zealand show no sustained improvement on any of the international tests on basic knowledge in maths, science and reading. In fact, New Zealand students show a downward trend on many of the tests. As the questions on these international tests relate to the curriculum of participating countries, proficiency in the tests should reflect proficiency in domestic performance assessments. However, as shown in section 1.2, this is not the case.
Worse still, the following statistics suggest things do not get any better as students get older.
Secondary students compared internationally
Once every three years since 2000, the OECD’s PISA tests have been measuring how thousands of 15-year-olds, mainly from partner countries (and cities such as Shanghai and Hong Kong), apply maths, science and reading skills and knowledge to real-life problems.23
23 OECD, “PISA 2012 Results: What Students Know and Can Do – Student Performance in Mathematics, Reading and Science,” vol. I, rev. ed. (Paris: OECD Publishing, 2014).
Unlike TIMSS and PIRLS, PISA questions are not designed to test the curriculum knowledge of participating countries, but general knowledge in the three subjects.24 Although every testing round assesses students in the three subject areas, each round focuses on one area in-depth, for example, reading in 2000 and 2009, science in 2006, and maths in 2003 and 2012.25
New Zealand’s mean PISA score in all three subject areas has consistently remained above the OECD average. In addition, the best New Zealand students perform as well as the best scoring students in PISA. However, the 2012 PISA results suggest all may not be well with school performance in New Zealand.
Around 510,000 students from 65 countries and economies,26 including 34 OECD countries, participated in the 2012 PISA test. More than 5,000 randomly selected students from 177 schools in New Zealand took part that year.27
Although the same number of countries took part in 2009 and 2012, New Zealand’s position dropped from 7th place in reading, 7th in science, and 13th in maths in 2009 to 13th, 18th, and 23rd respectively in 2012.28
The drop in ranking was associated with an absolute decline in performance as the average score was lower on each of the three tests (Figures 6–8). In comparison, OECD average scores have remained relatively stable.
24 Ibid.25 Ibid. 26 Examples of economies or regions in the study are
Shanghai-China, Hong Kong-China and Macao-China. Steve May, Saila Cowles and Michelle Lamy, “PISA 2012: New Zealand Summary Report” (Wellington: Ministry of Education, 2013).
27 Ibid.28 OECD, “PISA 2009 Results: What Students Know and
Can do – Student Performance in Reading, Mathematics and Science” Vol. I (Paris: OECD Publishing, 2010); OECD “PISA 2012 Results: What Students Know and Can Do”, op. cit.

SIGNAL LOSS: WHAT WE KNOW ABOUT SCHOOL PERFORMANCE 15
Figure 6: PISA Reading (2000–12)
Source: Ministry of Education, “PISA 2012 – Summary of Results” (Wellington: New Zealand Government, 2013)
Figure 7: PISA Science (2006–12)
Source: Ministry of Education, “PISA 2012 – Summary of Results” (Wellington: New Zealand Government, 2013)
Figure 8: PISA Maths (2003–12)
Source: Ministry of Education, “PISA 2012 – Summary of Results” (Wellington: New Zealand Government, 2013)
In PISA 2012 (maths), New Zealand’s average score was 500 compared to the OECD’s 494 and Singapore’s 573 (Figure 8). In school-year terms, Singapore students were ahead of their Kiwi counterparts by an impressive 1.5 years29 of formal schooling.30
The 19-point difference in New Zealand’s average score between 2009 and 2012 indicates an absolute decline in the level of achievement. In fact, on a selection of unchanged maths questions over successive testing rounds, New Zealand students in 2012 scored 3% lower on each question compared to 2009.31
The 2012 decline in maths performance is also reflected in the proportions of students who perform at the highest level of proficiency and those who perform at the lowest levels when compared to 2003 results. In 2012, fewer students performed at the highest level (15%) than in 2003 (21%). Worse still is that the proportion of students who struggled to answer basic maths questions increased from 15% in 2003 to 23% in 2012.32
The general deterioration on these international indicators suggests New Zealand schools may not be equipping students with the same level of knowledge as in the previous few decades. It may be possible that since PISA tests a different group of 15-year-olds in each cycle – and its questions are not directly related to a country’s curriculum – a decline in performance may be associated with other changes affecting education in participating countries. However, that may not explain why
29 41 points correspond to the equivalent of one year of formal schooling or one grade level. Ibid.
30 Though there is debate about how useful it is to rank countries, it can still be useful to find out whether there are key lessons to learn from those countries or cities that consistently top the charts. See, for example, Svend Kreiner and Karl Bang Christensen, “Analyses of Model Fit and Robustness. A New Look at the PISA Scaling Model Underlying Ranking of Countries According to Reading Literacy,” Psychometrika 79:2 (April 2014), 210–231; Catherine Woulfe, “Education rankings ‘flawed’,” New Zealand Listener (4 December 2013).
31 Steve May, Saila Cowles and Michelle Lamy, “PISA 2012: New Zealand Summary Report”, op. cit.
32 Ibid.

THE NEW ZEALAND INITIATIVE16
the overall performance of New Zealand students is declining in TIMSS and PIRLS – tests that are designed to reflect participating countries’ curricula.
1.2 KIWI STUDENTS COMPARED DOMESTICALLY
Primary and intermediate students (Years 1–8)
The Ministry introduced National Standards for primary and intermediate schools in 2010. Teachers were to use the standards to inform themselves about student progress against expectations for their year level in reading, writing and maths.33 Minister of Education Hekia Parata set a target of 85% enrolled students to be meeting National Standards in these subjects by 2017.34
Year to year comparisons show that since 2011 greater numbers of Year 1 to 8 students are either at or above National Standards expectations. More Māori and Pasifika students too are making the mark. Unfortunately, fewer students from these groups are reaching the national average with almost 10 percentage points fewer in each subject in 2014 (Table 1).
Secondary students (Years 11–13)
NCEA was introduced in 2002 as the main qualification for secondary school students in Years 11–13. Students are expected to meet learning standards to gain credits towards NCEA Levels 1, 2 and 3. In general, students progressively work through these levels in Years 11–13.
The NCEA Level 2 qualification is widely regarded in the sector as a key foundation to further training and employment because of the levels of skills and knowledge students are expected to have
33 Ministry of Education, “National Standards,” Website.34 Ministry of Education, “Statement of Intent: 2014–2018,”
presented to the House of Representatives pursuant to section 39 of the Public Finance Act 1989 (Ministry of Education: New Zealand Government, 2014), 4.
35 Ministry of Education, “Delivering Better Public Service: Boosting Skills and Employment by Increasing Education Achievement for Young People” (Ministry of Education: New Zealand Government, 2012).
36 The goal is part of the Government’s Better Public Service (BPS) targets established in 2012. Ibid.
37 Education Review Office, “Evaluation at a Glance: Priority Learners in New Zealand Schools” (Wellington: New Zealand Government, 2012), 5.
Table 1: Percentage of enrolled students at or above National Standards (2011–14)
All numbers (%)
2011 2012 2013 20142017 Target
Read
ing
All 76.2 77.5 77.9 78.0 85.0
Māori 66.5 68.2 68.7 68.6 85.0
Pasifika 59.0 62.9 64.3 65.1 85.0
Writin
g
All 68.0 70.2 70.5 71.1 85.0
Māori 57.5 60.4 60.8 61.2 85.0
Pasifika 53.8 57.1 57.6 59.6 85.0
Mat
hs
All 72.2 73.6 74.6 75.2 85.0
Māori 62.5 63.6 64.6 65.0 85.0
Pasifika 56.7 59.6 60.9 62.0 85.0
Source: Ministry of Education, “Annual Report 2015 for the Year Ended 30 June 2015” (Wellington: Ministry of Education, 2015), 17.
acquired by this level of schooling.35 To that end, attainment of this qualification has become the key target against which secondary schools are judged. Indeed, the Government in 2012 set a goal that 85% of all 18-year-olds would have attained an NCEA Level 2 or equivalent qualification by 2017.36
The Ministry identified key levers to be used to achieve this goal: “stronger teacher accountability for improving students’ learning, information that is available to make appropriate decisions for and about students, and effective teaching”.37
SIGNAL LOSS: WHAT WE KNOW ABOUT SCHOOL PERFORMANCE 17
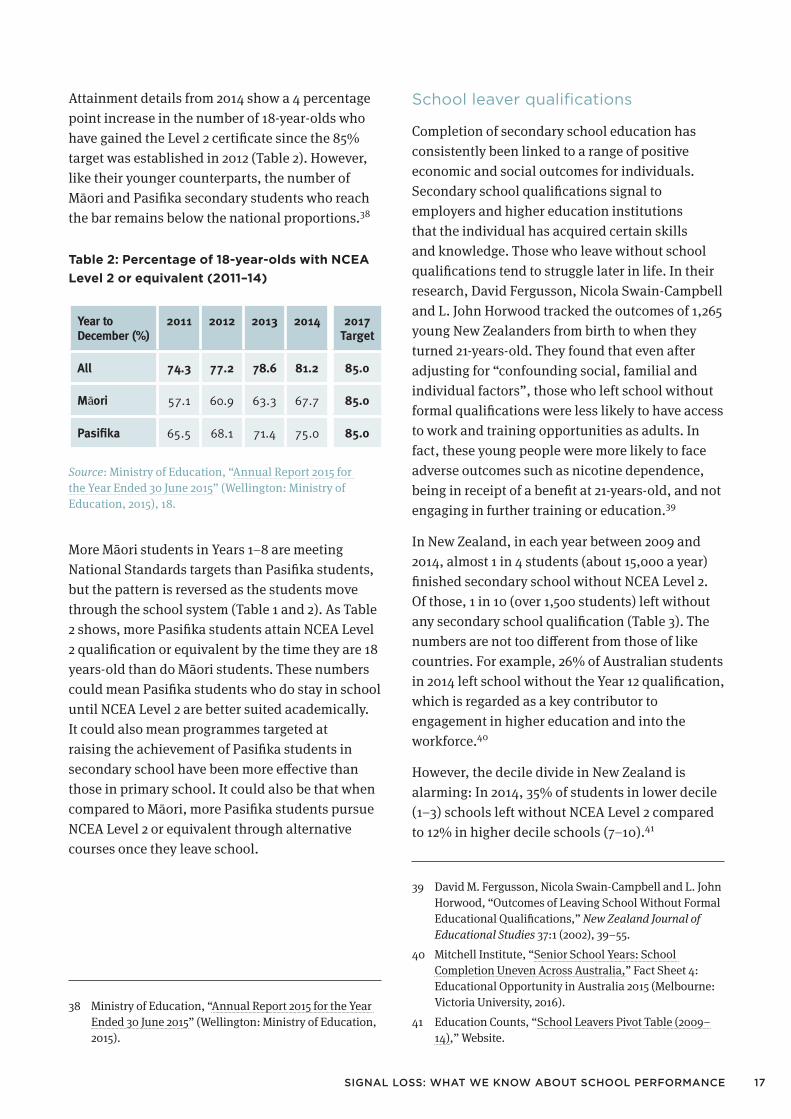
Attainment details from 2014 show a 4 percentage point increase in the number of 18-year-olds who have gained the Level 2 certificate since the 85% target was established in 2012 (Table 2). However, like their younger counterparts, the number of Māori and Pasifika secondary students who reach the bar remains below the national proportions.38
Table 2: Percentage of 18-year-olds with NCEA Level 2 or equivalent (2011–14)
Year to December (%)
2011 2012 2013 2014 2017 Target
All 74.3 77.2 78.6 81.2 85.0
Māori 57.1 60.9 63.3 67.7 85.0
Pasifika 65.5 68.1 71.4 75.0 85.0
Source: Ministry of Education, “Annual Report 2015 for the Year Ended 30 June 2015” (Wellington: Ministry of Education, 2015), 18.
More Māori students in Years 1–8 are meeting National Standards targets than Pasifika students, but the pattern is reversed as the students move through the school system (Table 1 and 2). As Table 2 shows, more Pasifika students attain NCEA Level 2 qualification or equivalent by the time they are 18 years-old than do Māori students. These numbers could mean Pasifika students who do stay in school until NCEA Level 2 are better suited academically. It could also mean programmes targeted at raising the achievement of Pasifika students in secondary school have been more effective than those in primary school. It could also be that when compared to Māori, more Pasifika students pursue NCEA Level 2 or equivalent through alternative courses once they leave school.
38 Ministry of Education, “Annual Report 2015 for the Year Ended 30 June 2015” (Wellington: Ministry of Education, 2015).
School leaver qualifications
Completion of secondary school education has consistently been linked to a range of positive economic and social outcomes for individuals. Secondary school qualifications signal to employers and higher education institutions that the individual has acquired certain skills and knowledge. Those who leave without school qualifications tend to struggle later in life. In their research, David Fergusson, Nicola Swain-Campbell and L. John Horwood tracked the outcomes of 1,265 young New Zealanders from birth to when they turned 21-years-old. They found that even after adjusting for “confounding social, familial and individual factors”, those who left school without formal qualifications were less likely to have access to work and training opportunities as adults. In fact, these young people were more likely to face adverse outcomes such as nicotine dependence, being in receipt of a benefit at 21-years-old, and not engaging in further training or education.39
In New Zealand, in each year between 2009 and 2014, almost 1 in 4 students (about 15,000 a year) finished secondary school without NCEA Level 2. Of those, 1 in 10 (over 1,500 students) left without any secondary school qualification (Table 3). The numbers are not too different from those of like countries. For example, 26% of Australian students in 2014 left school without the Year 12 qualification, which is regarded as a key contributor to engagement in higher education and into the workforce.40
However, the decile divide in New Zealand is alarming: In 2014, 35% of students in lower decile (1–3) schools left without NCEA Level 2 compared to 12% in higher decile schools (7–10).41
39 David M. Fergusson, Nicola Swain-Campbell and L. John Horwood, “Outcomes of Leaving School Without Formal Educational Qualifications,” New Zealand Journal of Educational Studies 37:1 (2002), 39–55.
40 Mitchell Institute, “Senior School Years: School Completion Uneven Across Australia,” Fact Sheet 4: Educational Opportunity in Australia 2015 (Melbourne: Victoria University, 2016).
41 Education Counts, “School Leavers Pivot Table (2009–14),” Website.

THE NEW ZEALAND INITIATIVE18
The numbers of those who left without any secondary school qualification in the same year were equally concerning – 22% in deciles 1–3 and 6% in deciles 7–10.
Table 3: Secondary school qualification attainment as a proportion of all school leavers (2009–14)
Attainment level by year
2009 2010 2011 2012 2013 2014
NCEA Level 3 or University Entrance Award
42% 43% 46% 49% 49% 50%
Below NCEA Level 2 (includes no formal qualification)
33% 30% 28% 25% 25% 23%
No formal qualification (below NCEA Level 1)
19% 17% 15% 14% 14% 13%
Source: Education Counts, “School Leavers Pivot Table (2009–14),” Website.
It might be better for those who are not suited for formal schooling to leave and be engaged in other activities. In recent years, alternatives such as the Youth Guarantee Fees-Free scheme have been giving another chance to those who were poorly served by formal education.42 The differences between Tables 2 and 3 suggest that a small number of school leavers do engage in post-school training and gain enough credits for an NCEA Level 2 or equivalent by age 18. Though uptake in the alternative programmes do not tell us what proportion of those without NCEA Level 2 each year sign up, the volumes suggest many do (Table 4).
42 Ministry of Education, “Annual Report 2015,” op. cit.
Table 4: School leaver uptake in alternative pathways (2011–14)
Year Left without NCEA Level 2*
Year Youth Guarantee Fees-Free Scheme**
2011 17,260 students 2012 8,901 youth
2012 15,196 students 2013 9,915 youth
2013 15,815 students 2014 13,283 youth***
Source: * Education Counts, “School Leavers Pivot Table (2009–14),” Website. **Ministry of Education, “Annual Report 2014 for the Year Ended 30 June 2014” (Wellington: Ministry of Education, 2014), 22. ***Ministry of Education, “Annual Report 2015 for the Year Ended 30 June 2015” (Wellington: Ministry of Education, 2015), 29
Although out of scope for this report, it is important to note that despite NCEA results being a key indicator of academic performance, the qualification has been subject to numerous debates within the education sector and in the public sphere since its introduction in 2002. Proponents claim that NCEA provides flexible pathways to academic success, particularly for students who want to pursue non-traditional courses. Opponents say the flexible nature encourages ‘credit farming,’ where students, teachers and schools opt for courses offering easy credits towards certification.43 However, a preliminary analysis using 2012–14 data from the New Zealand Qualifications Authority (NZQA) showed no evidence that students are indeed opting into credits that are easier to pass.44
43 See, for example, Peter Joyce, “System fatally flawed,” The Christchurch Press, cited in Muriel Newman, “How good is our education system?” (New Zealand Centre for Political Research, 4 June 2007); Peter Lyons, “NCEA pass rates hard for parents to cope with,” The New Zealand Herald (25 November 2015); Lisa Rodgers, “NCEA is not a pass or fail system,” The New Zealand Herald (26 November 2015).
44 Internal analysis by The New Zealand Initiative showed no obvious patterns consistent with credit farming. For example, courses with higher pass rates did not see enrolment increases as compared to courses with lower pass rates.

SIGNAL LOSS: WHAT WE KNOW ABOUT SCHOOL PERFORMANCE 19
Even so, a recently published paper suggests the NCEA numeracy and literacy requirements are not well aligned with other measures. On the basis of performance on the Literacy and Numeracy Adult Assessment Tool the researchers found that attainment of numeracy and literacy requirements below NCEA Level 3 cannot be taken as "... a high probability that students are operating at the literacy and numeracy benchmarks".45
Indeed, what students learn in secondary school might not translate well into the skills required to succeed in university. Therefore, this area warrants further research attention. Even still, current national indicators of student performance are problematic as they do not take into account student factors outside the control of schools and teachers (see Chapter 4).
1.3 CONCLUDING REMARKS
There are clear warning signs of poor performance in New Zealand’s compulsory school system. The system works well for the majority of students but not so well for many others, particularly Māori and Pasifika students. New Zealand’s languishing
45 Gill Thomas, Michael Johnston and Jenny Ward, “Alignment of Literacy and Numeracy Measures: Research for the Tertiary Education Commission” (Wellington: Maths Technology Ltd, 2014),6.
position in international tests is cause for concern, particularly compared to the improving domestic performance. Worse still is the increasing over-representation of low achievers in international tests.
Since 2000, New Zealand has made significant changes to its curriculum and national assessments to lift student achievement, which raises a number of questions. How can achievement improve on domestic measures but decline in international tests? Are today’s students learning differently and acquiring poorer maths skills than past students?
Although it is instructive to know how students are doing on average, aggregate performance statistics can miss how schools are doing for individual students. What happens in schools matters for individual student outcomes, and how New Zealand schools are working to improve achievement for their students matters for the entire education sector and the state of the nation.
Chapter 2 outlines the key mechanisms used to evaluate and manage the quality of New Zealand schools, and how schools are performing against these mechanisms. It also highlights some of the limitations of these mechanisms.
msokhom
Sticky Note
Marked set by msokhom
msokhom
Sticky Note
Marked set by msokhom


SIGNAL LOSS: WHAT WE KNOW ABOUT SCHOOL PERFORMANCE 21
TWO SCHOOL PERFORMANCE AT A GLANCE
What children bring to school (individual abilities, interest and effort in learning, not to mention the home environment) clearly influences their achievement. Some parents value education and they work hard to instil the same in their children, while others are disengaged and their children may start their education journey underprepared or even unmotivated.
Nevertheless, what happens within the school grounds also matters.
The quality of school leadership and teaching contributes to students reaching their intellectual, social, emotional, physical and cultural potential. To attain these goals, an effective education system needs mechanisms to monitor and evaluate the quality of its schools and staff. These mechanisms should support school improvement objectives by identifying and sharing effective practice, and also identifying and dealing with areas that need improvement.
The Education Review Office (ERO), on behalf of the Government, independently evaluates the quality of education in all New Zealand schools. ERO assesses key areas of school performance that contribute to student learning and wellbeing, and publishes each school’s results in a report on ERO’s website. These reports provide a useful lens through which the schools, the Ministry and the community judge the quality of New Zealand schools. Thus poorly performing schools are primarily identified through ERO’s evaluations, but ERO is not responsible for managing the performance of schools.
According to ERO’s measures, the majority of schools are doing well, thanks to strong leaders, effective teachers, and involved communities and parents. Unfortunately, thousands of students are also attending schools that are failing to meet ERO’s quality measures.
The Ministry too has mechanisms to identify schools that are poorly performing or at risk of poor performance. The Ministry’s regional advisors monitor school performance primarily via community complaints and the information schools provide to the Ministry (e.g. annual reports on student academic achievement, truancy and enrolment, and also operational information on school finances, human resources, and property management). 46
Outside ERO and Ministry monitoring channels, schools can also self-identify as needing external intervention.
Although poor performance is temporary for most schools, some schools, despite intervention, perform poorly for as long as, and in some cases longer than, the entire schooling career of their students – with possibly serious implications for the students in them and the state of our nation.
This chapter focuses on the performance of state and state-integrated schools in New Zealand.
2.1 ERO REVIEWS
ERO reviews the quality of education in every school in New Zealand based on information gathered from a number of sources. One major source is the Public Achievement Information (PAI) collected, collated and published by the Ministry about the academic performance of individual schools.47
This information allows comparisons of schools of similar student intake (ethnic and gender make-up), geographic location, decile and size.
46 Ministry of Education, “Review of Statutory Interventions in State and State Integrated Schools: Discussion Paper” (Wellington: New Zealand Government, 2014).
47 Ministry of Education, “Public Achievement Information (PAI),” Website.

THE NEW ZEALAND INITIATIVE22
ERO assesses the self-review documentation of schools (provided before the on-site review) along with their PAI. Both sets of data guide the review questions and focus.48
Using this information, ERO evaluates every school based on certain performance indicators. These indicators, which were last revised in 2015 with the aim to “consolidate a common understanding of
48 Education Review Office, “Preparing for the review,” Website.
quality” in the school sector cover areas that matter most in improving student achievement, progress and wellbeing:49
� school governance;
� leadership;
� teacher quality;
� school self-evaluation; and
� other social and academic dimensions that need to work together to achieve strong student outcomes.50
ERO’s school performance categories
A typical review involves meeting with a school’s board of trustees, leadership, teachers and students, and ends with ERO drawing up a publicly available school report that slots the school in one of three performance categories, differentiated by how soon ERO will return to review the school.51
The number of schools ERO reviews in a year depends on the status of each school at the time.
The duration between ERO’s school reviews, or ‘return time,’ indicates how ‘effective’ or ‘poor’ a school is, and is published in all school reports. The longer the return time, the more effective ERO considers the school to be in promoting student engagement, progress and achievement.
� Returning in 4–5 years (highly performing): This category was introduced in 2010 for a school with consistent high quality performance where ERO does not have any material concerns about the education and safety of students. ERO deems schools in this category as highly effective in evaluating their own strengths and weaknesses.
� Returning in 3 years (performing well): This category was revised in 2010 for a school with good performance where ERO does not have any material concerns about the education and safety
49 Education Review Office, “2014 Briefing to the Incoming Minister” (Wellington: New Zealand Government, 2014).
50 Education Review Office, “School Evaluation Indicators 2015 (Trial),” Website
51 Education Review Office, “Review process,” Website.
BOX 1: ERO’S REVIEW PROCESS
THE REVIEW PROCESS
ERO gives the school advance notice of review.
School sends review team documentation requested by ERO.
Review coordinator and board of trustees meet and agree on the process for the review.
Review team visits the school and talks with the board, staff and students. Review team analyses
school documentation and collects evidence.
Review team discusses interim findings with the board.
Unconfirmed (or draft) ERO report sent to the board within 20 working days of the end of
the review visit.
Board has 15 working days to give feedback.
Report finalised and made public two weeks later.
School takes action on review findings.
Source: Education Review Office, “How ERO reviews schools,” Website.

SIGNAL LOSS: WHAT WE KNOW ABOUT SCHOOL PERFORMANCE 23
of students. ERO is confident these schools have the internal capability to make changes on their own in the minor areas that need improvement.
� Returning over the course of 1–2 years (poorly performing): This category was introduced in 2010 for a school that fails to meet ERO’s performance expectations. ERO has concerns about the education and safety of students and considers these schools to lack the internal capability to adequately address serious concerns without external intervention. Before 2011, schools in this category were generally revisited after 1–2 years. Since the change, ERO and the Ministry work with these schools over the course of 1–2 years.
The majority of schools are doing well
ERO’s stocktake at 30 June 2015 shows that about 70% of all schools in New Zealand were performing well, and about 20% had demonstrated consistent high quality performance (Figure 9).
Most schools improve over time…
ERO reviewed 786 schools in the 2014–15 financial year. At the end of that cycle, there were slightly fewer poor performers and more high performers than had been at the start of the cycle in 2014 (Table 5).52
52 As the proportion of poorly performing schools remained relatively stable between 2014 and 2015, we wondered whether ERO might simply assign the worst eighth of schools to the lowest category and focus attention on them. In a world of finite resources this would make sense. But we could not conclude that remaining in the lowest tier meant there had not been any substantial improvement. The bar could simply have risen in that
Figure 9: ERO’s Stocktake of School Performance as at 30 June 2015 (updated in 2016)
Source: Based on data received from ERO (April 2016).
Note: Total numbers are provisional pending further internal auditing by ERO but are indicative of the status of schools at 30 June 2015. Numbers exclude private schools, partnership schools, and new schools that have not yet had an evaluation.
Table 5: Change in the performance of 786 schools reviewed by ERO (2014–15)
Performance status
Starting position: 1 July 2014 End position: 30 June 2015
Number of schools
Percentage of all schools reviewed
Number of schools
Percentage of all schools reviewed
4–5 year review (highly performing) 131 17% 159 20%
3 year review (performing well) 552 70% 529 67%
1–2 year review (poorly performing) 103 13% 98 13%
Total 786 100% 786 100%
Source: Based on data received from ERO (September 2015).
case. For a simple check, the author reviewed a sample of 1–2 year review reports and found that schools there were more likely to present with serious concerns that were affecting student learning and wellbeing. These schools were also more likely to be under Ministry intervention than schools in other categories. Therefore, ERO’s proportions likely reflect absolute rather than relative performance.

THE NEW ZEALAND INITIATIVE24
…nonetheless, persistent poor performance is a reality
If ERO is an adequate judge of quality, then an examination of how schools move between performance categories indicates net improvement.
Of the 786 schools reviewed in 2014–15 (Figure 10):
� 77 remained high performers; 151 had improved; and 410 continued to meet expectations but did not move up a tier;
� 115 schools lost ground and required external intervention to avoid further impact on student learning and wellbeing; and
� 33 out of 103 already poorly performing schools (one-third) had not improved by enough to be moved up a category, even after receiving interventions to address performance issues over 1–2 years.
Persistent poor performance was not unique to the most recent full year review cycle (2014–15). As Figure 9 illustrates, at 30 June 2015, ERO classified 185 (almost 8% of about 2,425 state schools) as poor performers. These schools were educating more than 35,500 students in 58 secondary and 127 primary schools.53 When requested, ERO advised they were unlikely to be ‘in a position to provide school history going back more than 3 reviews’.54 It was therefore not possible to determine how many of these 185 schools continue to appear in underperformance statistics review after review. Information on which kinds of schools move out of the bottom tier and stay out, and which do not, could help to understand what brings
53 In this breakdown, primary schools include full primary and contributing, and secondary schools include composite, intermediate and secondary.
54 Education Review Office, Email (November 2015).
Figure 10: How the 786 schools moved between ERO performance categories (2014–15)
3YEAR RETURN
3YEAR RETURN
YEAR REVIEW YEAR REVIEW
YEAR RETURN YEAR RETURN
77 schools
33 schools
81 schools
69 schools
1 school
410 schools
50 schools
4 schools61 schools
159schools
total
529schools
total
98schools
total
103 schools
reviewed
552 schools
reviewed
131 schools
reviewed
Starting position1 July 2014
Ending position 30 June 2015
Source: Infographic created by The New Zealand Initiative based on data received from ERO (September 2015). The pencils pointing upwards from left to right indicate a move up the performance tier; those pointing downwards indicate a move down; while the straight pencils indicate no change between 1 July 2014 and 30 June 2015.
SIGNAL LOSS: WHAT WE KNOW ABOUT SCHOOL PERFORMANCE 25
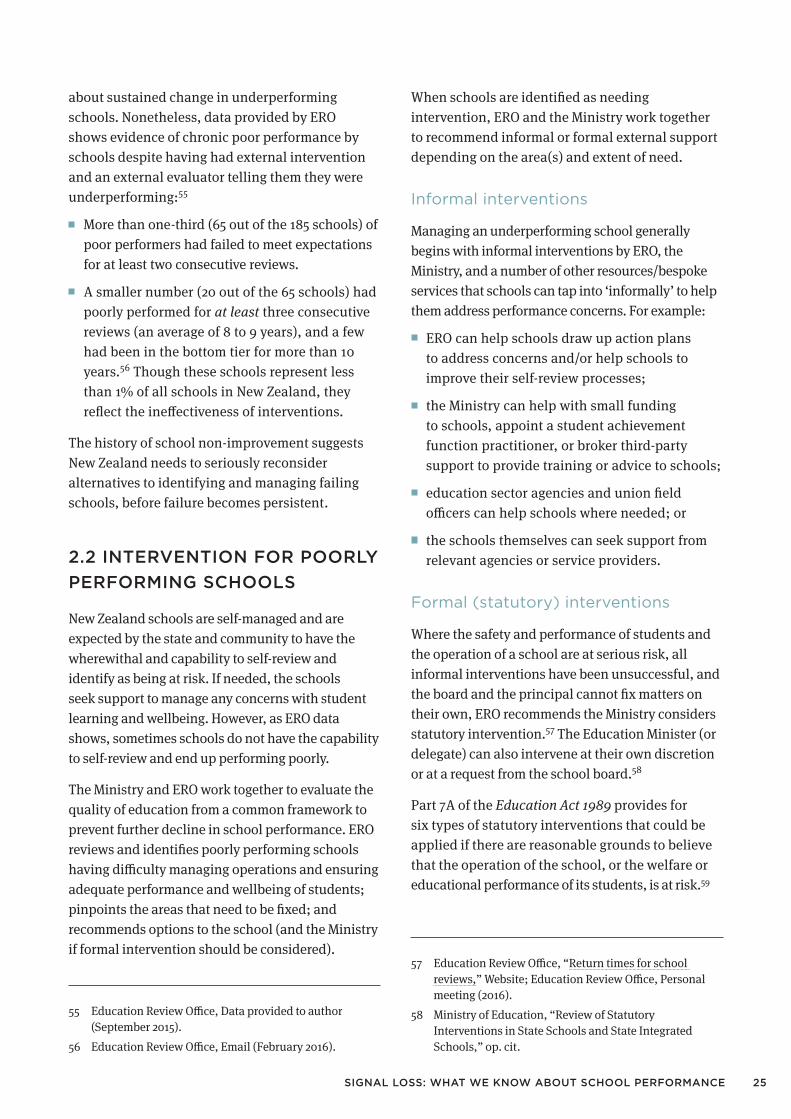
about sustained change in underperforming schools. Nonetheless, data provided by ERO shows evidence of chronic poor performance by schools despite having had external intervention and an external evaluator telling them they were underperforming:55
� More than one-third (65 out of the 185 schools) of poor performers had failed to meet expectations for at least two consecutive reviews.
� A smaller number (20 out of the 65 schools) had poorly performed for at least three consecutive reviews (an average of 8 to 9 years), and a few had been in the bottom tier for more than 10 years.56 Though these schools represent less than 1% of all schools in New Zealand, they reflect the ineffectiveness of interventions.
The history of school non-improvement suggests New Zealand needs to seriously reconsider alternatives to identifying and managing failing schools, before failure becomes persistent.
2.2 INTERVENTION FOR POORLY PERFORMING SCHOOLS
New Zealand schools are self-managed and are expected by the state and community to have the wherewithal and capability to self-review and identify as being at risk. If needed, the schools seek support to manage any concerns with student learning and wellbeing. However, as ERO data shows, sometimes schools do not have the capability to self-review and end up performing poorly.
The Ministry and ERO work together to evaluate the quality of education from a common framework to prevent further decline in school performance. ERO reviews and identifies poorly performing schools having difficulty managing operations and ensuring adequate performance and wellbeing of students; pinpoints the areas that need to be fixed; and recommends options to the school (and the Ministry if formal intervention should be considered).
55 Education Review Office, Data provided to author (September 2015).
56 Education Review Office, Email (February 2016).
When schools are identified as needing intervention, ERO and the Ministry work together to recommend informal or formal external support depending on the area(s) and extent of need.
Informal interventions
Managing an underperforming school generally begins with informal interventions by ERO, the Ministry, and a number of other resources/bespoke services that schools can tap into ‘informally’ to help them address performance concerns. For example:
� ERO can help schools draw up action plans to address concerns and/or help schools to improve their self-review processes;
� the Ministry can help with small funding to schools, appoint a student achievement function practitioner, or broker third-party support to provide training or advice to schools;
� education sector agencies and union field officers can help schools where needed; or
� the schools themselves can seek support from relevant agencies or service providers.
Formal (statutory) interventions
Where the safety and performance of students and the operation of a school are at serious risk, all informal interventions have been unsuccessful, and the board and the principal cannot fix matters on their own, ERO recommends the Ministry considers statutory intervention.57 The Education Minister (or delegate) can also intervene at their own discretion or at a request from the school board.58
Part 7A of the Education Act 1989 provides for six types of statutory interventions that could be applied if there are reasonable grounds to believe that the operation of the school, or the welfare or educational performance of its students, is at risk.59
57 Education Review Office, “Return times for school reviews,” Website; Education Review Office, Personal meeting (2016).
58 Ministry of Education, “Review of Statutory Interventions in State Schools and State Integrated Schools,” op. cit.

THE NEW ZEALAND INITIATIVE26
These interventions are applied at the board level rather than the principal level. Generally used as a last resort of the interventions, the Secretary of Education can appoint a Limited Statutory Manager (LSM) or a commissioner to a school. An LSM temporarily assumes some functions of the board, but not all, depending on the areas the board is failing to manage, such as personnel, finance or property issues. A commissioner assumes all powers of the board after it is dissolved by the Minister (or delegate) and until a new board is elected.60 Though the Ministry can intervene for reasons other than student achievement – for example for reasons related to board membership, constitution or processes – a school board that is unable to address governance and management issues at the lowest level of support for long periods of time could be an indication of school dysfunction.
At 30 October 2015, an LSM or a commissioner had been appointed to 67 schools teaching about 15,400 students. More than half (51%) of the students affected were in the lowest 1–3 decile schools (Figure 11).61
Figure 11: Proportion of students in the 67 schools with LSMs or commissioners (October 2015)
Source: Based on data received from the Ministry (October 2015).
59 Other lower-level statutory intervention types include the Secretary of Education requiring the board to provide specified information; seek specialist help; or prepare and implement an action plan to address specific issues. Ministry of Education, “Interventions: Guide for schools,” Website.
60 Ministry of Education, “Review of Statutory Interventions in State Schools and State Integrated Schools,” op. cit.
61 Ministry of Education, Data provided to author (October 2015).
Table 6 compares the number of ERO’s poorly performing schools with those under statutory interventions in 2015 and shows that:
� 19 of the 65 schools ERO classified as poor performers for at least two consecutive reviews had statutory interventions;
� 5 of the 20 schools ERO classified as persistently poorly performing for at least three consecutive reviews had statutory interventions (two as a result of ERO recommendations); and
� Lower decile and smaller schools were more likely to have been poorly performing over many years – and have a commissioner or an LSM appointed.
Table 6: Statutory intervention in persistently poorly performing schools (2015)
Num
ber of
con
secu
tive
times
in 1
–2 y
ear or
su
pple
men
tary
rev
iew
*
Bre
akdo
wn
of s
choo
ls
Bre
akdo
wn
by d
ecile
Ran
ge in
yea
rs o
f po
or
perfor
man
ce
At 3
0 Ju
ne 2
015*
*
Num
ber of
sch
ools
with
an
LSM
or Co
mm
issi
oner
at
30
Oct
ober
201
5
Two times
45 (30
primary and 15
secondary)
(5,933 students)
33 (Deciles
1–3)1–6 years 12
8 (Deciles
4–6)2–5 years 1
4 (Deciles 7–10)
2–4 years 1
At least three times
20 (15 primary
and 5 secondary)
(3,167 students)
16 (Deciles
1–3)3–7 years 5
4 (Deciles 4–6)***
4–5 yearsNo statutory intervention
Source: Based on data on statutory interventions (last column) received from the Ministry (October 2015), and the rest from ERO (September 2015).
Notes: *Prior to ERO’s current 1–2 year categorisation, poorly performing schools underwent a supplementary review sooner than the regular three years. ** Based on ERO data going back three previous reviews. *** No schools above decile 6 were in this category.
SIGNAL LOSS: WHAT WE KNOW ABOUT SCHOOL PERFORMANCE 27
2.3 MISSED OPPORTUNITIES TO MANAGE POOR PERFORMANCE
Inadequate data analysis
The Ministry and ERO apply formal or informal interventions based on performance reviews and on-site inspections. Nevertheless, persistent underperformance in some schools may indicate that current methods are ineffective. More systematic quantitative analyses of the interventions are needed to determine which type of interventions work (or do not work) for which types of school challenges and why.
However, neither the Ministry nor ERO carries out such analyses – and this is a major limitation in efforts to mitigate school underperformance in New Zealand. Although the Ministry requires the LSM and commissioner to provide monthly reports of school progress, and a final report at the end of an intervention, the Ministry does not evaluate the effectiveness of interventions as a whole. The Ministry also informally monitors schools after statutory intervention is complete, but does not formally evaluate the long-term success or otherwise of interventions.62
In fact, the Auditor-General’s 2008 review of boards of trustees stressed the need for better data on effective statutory interventions to improve board governance in the long run:
The Ministry has a range of information available on board performance that it could use better to identify boards at risk. However, as monitoring is not clearly defined, we cannot be sure that the Ministry is using the most appropriate sources of information.63
62 Ministry of Education, Personal meeting (August 2015).63 Controller and Auditor-General, “Ministry of Education:
Monitoring and Supporting School Boards of Trustees” (Wellington: Office of the Auditor-General, 23 June 2008), 6.
The review further suggested that the Ministry needs to:
� more actively monitor the whole school portfolio so that it identifies boards that would benefit from support earlier, and provide that support promptly, and
� improve how it monitors and assesses the effectiveness of statutory interventions.64
With its reviewers on the ground, ERO too is in a privileged position to conduct valuable sector-wide evaluations and produce national reports on Ministry priority areas.
Indeed, ERO produces national reports every year that bring together qualitative information on themes that are common in highly effective and less effective schools.65 However, ERO could make better use of its decades worth of data to drive sustained and system-wide changes in the school sector. Though information, for example, about principal and teacher changes in schools is shared between regional offices, ERO does not evaluate the resulting data to understand the impact of such changes on schools.66 Hence, ERO’s evaluations are limited by the extent to which it uses its data on schools.
According to results from the 2012 Performance Improvement Framework review of ERO:
One way ERO could improve leverage from its annual visits to around one third of all New Zealand schools and early childhood education services would be to make greater use of its database to investigate key weaknesses in the current educational system.... more could be
done to develop a deeper understanding of the most important areas for action to lift student achievement and participation. The review further states that: Appreciation from school principals over the content of the national reports was often accompanied by a plea for more guidance on what might be relevant for them in their schools and where in the reports to find that information.67
64 Ibid., 265 Education Review Office, “National Reports,” Website.66 Education Review Office, Personal Meeting (2016).
msokhom
Sticky Note
Marked set by msokhom
msokhom
Sticky Note
Marked set by msokhom

THE NEW ZEALAND INITIATIVE28
Maybe because of the Auditor General’s report and the 2014 review of statutory interventions, the Ministry is considering in its review of the Education Act 1989 improved mechanisms to monitor performance and intervene earlier in schools at risk of failure.68
Ineffective interventions
A third of New Zealand’s underperforming schools are persistent poor performers. In ERO’s experience ‘…effective school improvement that is sustainable does not happen quickly, especially in large schools which are complex organisations’.69
Nevertheless, ERO’s evaluations show that at least 20 – mostly smaller than average – schools educating thousands of students have underperformed, some for at least 10 years. A clear sign that neither formal nor informal interventions have worked for these schools. Or if they have worked, any resulting improvement has not been sustained.
Unclear accountability
There appears to be a conundrum or even blurred lines of accountability in a system where schools are meant to self-identify and seek help when needed, but where at the same time, the Ministry is accountable for the performance of schools. With the exception of the schools in ERO’s shortest review cycles, most other schools have a limited relationship with ERO or the Ministry.
In fact, views on the Ministry’s role shifted depending on who the author spoke to. Principals spoke of excess ‘meddling’ from the top but also complained of the lack of Ministry support.70
67 State Services Commission, the Treasury, and the Department of the Prime Ministry and Cabinet, “Performance Improvement Framework: Formal Review of the Education Review Office” (Wellington: New Zealand Government, 2012).
68 Office of the Minister of Education, “Update of the Education Act 1989”, Submission to Cabinet (Wellington: Ministry of Education)
69 Education Review Office, Email (April 2016) 70 School principals, Personal meetings (2015).
At the same time, Ministry staff spoke of the challenges in balancing their involvement in school matters in a system of self-managing schools, and watching from afar but generally waiting for schools to seek help.71
For example, one principal of a high achieving school said it was tough to get anyone from the Ministry to come to the school just to see how things are going: “We would usually hear from them when they are telling us off about something”.72
Similarly, 115 out of 180 principals (64%) surveyed in 2013 said that despite the increased focus on reporting from schools back to the Ministry, “...no-one outside the school took much notice of their annual plan or report”.73
The same survey found that fewer principals (68%) in the 2013 survey considered the advice received from the Ministry’s closest office as timely and appropriate than those (79%) surveyed in 2010.
This lack of clarity in responsibility for school performance could mean that some schools will slip through the cracks, and early warning signs not acted on in time to halt further decline.
When to provide support
Challenges schools face with property, financial and personnel management may not directly affect student outcomes initially. But if left unattended for years, together they can be an indication of ineffective school governance and leadership. For example, two principals who had taken over failing schools found clear warning signs of the schools having been in difficulty long before statutory intervention that saw the resignation of the then current principals.74
Both schools had accumulated more than $2 million in debt over a number of years (up to
71 Ministry of Education, Personal meeting (2015).72 Secondary school principal, Personal meeting (2015).73 Cathy Wylie and Linda Bonne, “Primary and
Intermediate Schools in 2013: Main Findings from the NZCER National Survey” (Wellington: New Zealand Council for Educational Research, 2014), 17.
74 Secondary and primary school principals, Personal meetings (2015).

SIGNAL LOSS: WHAT WE KNOW ABOUT SCHOOL PERFORMANCE 29
five years for one school). These indications of underlying quality issues should have been picked up through the Ministry’s work with schools, the schools’ annual reports, or ERO’s reviews and dealt with sooner. Instead, poor performance continued, resulting in poor student achievement and roll declines, until statutory intervention was the only solution left. This situation resonates with one principal’s view that: “The interventions are used to stop the rot”.75
However, with poor leadership and governance capability being the common factor in poorly performing schools, intervention can come too late to the detriment of students in these schools. Principals and board members who do not have the skills and abilities to manage aspects of school performance may also be less likely to know they are at risk and may not seek help.
Even after evidence of poor governance and ineffective leadership has been collected, it is not clear at which point statutory intervention is to be introduced. The Ministry relies on ERO’s reports as the key indicator of performance and an ad hoc system of monitoring and triggers. With ERO conducting its reviews in most schools every three years, schools having trouble may be identified later rather than sooner. Better monitoring and analyses of interventions could ensure schools receive the right kinds of support before underperformance becomes chronic.
Finding the right staff
The Auditor-General in 2008 questioned whether “the limited number of people in the group available for implementing statutory interventions is a disincentive for the Ministry to intervene or affects the length of time it takes to intervene”.76
75 Secondary school principal, Personal meeting (2015).76 Controller and Auditor-General, “Ministry of Education:
Monitoring and Supporting School Boards of Trustees,” op. cit., 6.
Discussions with Ministry staff suggest this remains a concern.
Ministry staff spoke of the increasing difficulty to find people with the right mix of skills willing to take on a struggling school. The 122 approved individuals who can take on the role of an LSM or commissioner may be the best from the pool of applicants; however, Ministry staff suggested that even their calibre is limited.
ERO staff too say many poorly performing schools struggle to get the right people to lead the school. The challenge is likely exacerbated by the fact that many of these schools are small and in lower decile areas. Of the 20 persistently underperforming schools, 15 had had at least one change in principal in the previous five years (with a few having had at least three principals in the same period). That the principal’s remuneration is commensurate with the size of the school roll may also explain the challenges of attracting experienced staff.77
The task of improving a school with a long history and culture of poor performance is an onerous one, so few are willing to take it on. In fact, a 2011 study on turnaround in New Zealand schools found that even principals who had been successful at rebuilding schools were unwilling to “tackle turnaround again”.78
To tackle these challenges, the Ministry established a Principal Recruitment Allowance scheme in early 2015 as part of the Investing in Education Success (IES) initiative to compensate principals willing to take over poor performing schools. The initiative is regarded as an informal intervention for schools with a principal vacancy. The scheme’s eligibility criteria include ‘significant underachievement, multiple 1-2 year ERO reviews and a history of statutory interventions without sustained changed’. By August 2015, nine principals had been hired but only one of the 20 persistently poorly
77 Ministry of Education, “Principal’s salary grades,” Website.
78 Bill Barker, “Turnaround Leadership: How Three Successful Leaders Turned Around Their Schools,” Ph.D. thesis (Auckland: Unitec Institute of Technology, 2011).

THE NEW ZEALAND INITIATIVE30
performing school had used the scheme to appoint a new principal.79
2.4 CONCLUDING REMARKS
Most boards and school leaders are managing the operations of their schools well. However, a smaller number are struggling to meet expectations year after year, despite ongoing and increasing levels of interventions.
Although both the Ministry and ERO track and monitor the progress of schools, neither agency formally evaluates the effectiveness of interventions to support sector-wide improvements.80
Worse still is that ERO is not optimally using the rich information it has gathered from evaluating
79 Ministry of Education, Response to information request under the Official Information Act 1982 (7 October 2015).
80 Ministry of Education and Education Review Office, Personal meetings (2015).
schools for more than two decades. Agencies and schools are thus missing a prime opportunity to learn what works and what does not.
Furthermore, ERO’s reviews, focus and questions are guided, though not solely, by the academic achievement information collated by the Ministry. However, these indicators of quality are problematic as they do not indicate which schools are doing the best for their students and which are merely coasting. This in turn speaks to the quality of signals that parents and the community receive about the relative performance of schools. Options for better signals are discussed in Chapter 4.
But before that, the following chapter highlights some of the factors that contribute to poor performance as well as those that can act as barriers to school improvement.

SIGNAL LOSS: WHAT WE KNOW ABOUT SCHOOL PERFORMANCE 31
THREE SOME FACTORS THAT PREVENT LEARNING FROM FAILURE
School failure can happen for many reasons: significant policy changes, staff turnover, and higher expectations imposed on schools, among others. Even highly effective schools can experience disruption, leading to a decline in performance. While failing to meet performance expectations is not in and of itself bad, what separates effective and ineffective schools is how swiftly they get themselves out of failure. Discussions with ERO and Ministry staff, and data received from the agencies suggest that this highly depends on the quality of the school’s governance, leadership and teaching. Though these areas have been researched in-depth elsewhere, it is instructive to highlight some of the related themes uncovered during the course of this research.
As Kay Hawk puts it:
Each child gets only one such educational opportunity, is powerless to influence the process and should be entitled to rely on adults to ensure their school is functioning as an effective learning organisation.81
Clearly, the responsibilities of teachers and school leaders are not only massive but also complex.
The effectiveness of school leaders and teachers are clearly interlinked. Capable boards will likely make good judgments when appointing and managing principals. Strong leaders will set the tone of the school and in turn attract and develop effective teachers. Quality teachers will work to ensure students reach their potential.
81 Kay Hawk, “School Decline: Predictors, Process and Intervention,” op. cit., 266.
Individual circumstances and the home environment play a pivotal role in student achievement, but research shows that the quality of a school’s leadership and teachers also influences student outcomes. For example, education researcher Robert Marzano synthesised research on the impact of schooling and teachers on student achievement.82 He analysed research on school education, mostly in the United States, from the 1960s to 2001 and found three key factors that contribute to student achievement and quantified how much each factor explains the differences in student achievement (Box 2).
In his meta-analysis, education researcher and Laureate Professor John Hattie found that teachers account for a greater variance in student achievement than Marzano suggests (about 30%), while what students brought with them accounted for about 50% of the variance and school related factors accounted for about 5-10%.83 Therefore, when it comes to what schools can control, teachers have the greatest impact on student achievement. It is, therefore, likely that some students may still experience effective teaching in a school under ERO’s regular review, just as a school classified as highly effective can still have classes where teaching is ineffective.
The key is to differentiate between the two.
82 Robert J. Marzano, A New Era of School Reform: Going Where the Research Takes Us (Aurora, Colorado: Mid-continent Research for Education and Learning, 2000).
83 John Hattie, “Teachers Make A Difference: What is the Research Evidence?” Australian Council for Educational Research Annual Conference on Building Teacher Quality (Melbourne: ACER, 2003),2.
msokhom
Sticky Note
Marked set by msokhom
msokhom
Sticky Note
Marked set by msokhom
msokhom
Sticky Note
Marked set by msokhom
msokhom
Sticky Note
Marked set by msokhom

THE NEW ZEALAND INITIATIVE32
3.1 EFFECTIVE AND LESS EFFECTIVE TEACHERS: WHO KNOWS?
It would be naïve to assume or believe that all of the 48,500 plus teachers in New Zealand are equally effective at what they do.84 However, it would be equally challenging to determine which teachers are most effective based on existing appraisal systems.
Though the Ministry and the Education Council of Aotearoa New Zealand (Education Council)85 list the criteria on which to assess teachers, schools have the autonomy to structure the appraisal process as they wish. Most principals spoken to for this report said they used classroom observations, self-review, and peer review formats. Principals of small schools also said they knew who their effective and least effective teachers were due to the size of their school and through “chats in staffrooms”.86 Though this may seem like an ad hoc way of appraising teachers, it is plausible that highly effective principals can indeed differentiate high from poor teaching quality from
84 Ministry of Education, “Annual Report 2015,” op. cit.85 The Education Council is the professional body for all
teachers. It aims to raise the status of the profession, strengthen accountability, and develop consistently high standards across the education system. Education Council New Zealand, “About the Education Council,” Website.
86 School principals, Personal meetings (2015).
these different sources of information. In fact, Ministry guidelines suggest teacher appraisals should rely on multiple sources. The problem is the varied extent to which teacher appraisal is linked to student outcomes, as shown by the Initiative’s research series on teacher quality in New Zealand.87
Inadequate teacher appraisals
New Zealand schools are not yet proficient at identifying quality performance in teaching. According to ERO, the OECD’s 2011 review of New Zealand’s evaluation and assessment framework found that:
...principal and teacher appraisal has been a requirement for many years, but its implementation across and within schools is variable. The OECD also concluded that: While New Zealand has well designed evaluation and assessment components, policy does not articulate an overall plan, therefore schools could not always see how evaluation and assessment at student, teacher, school, and education system levels link and complement each other.88
87 John Morris and Rose Patterson, “World Class Education: Why New Zealand Must Strengthen Its Teaching
Profession” (Wellington: The New Zealand Initiative, 2013). 88 Deborah Nusche, Dany Laveault, John MacBeath and
Paulo Santiago, “OECD Reviews of Evaluation and Assessment in Education: New Zealand 2011” (Paris: OECD Publishing, 2012) cited in Education Review Office, "Supporting School Improvement Through Effective Teacher Appraisal" (Wellington: New Zealand Government, 2014).4.
BOX 2: THE CONTRIBUTION OF SCHOOL, TEACHER AND STUDENT LEVEL FACTORS ON STUDENT ACHIEVEMENT
1. The school – factors such as administrative leadership, high expectations, the school climate, and
monitoring pupil performance explained 6.66% of the difference in student achievement.
2. The teacher – factors such as effective use of instructional strategies, effective classroom
curriculum, and effective classroom management explained 13.34% of the difference in studentachievement.
3. The student – factors such as students’ socioeconomic background, prior knowledge, aptitude,
and interest explained 80% of the difference in student achievement.
Source: Robert J. Marzano, A New Era of School Reform: Going Where the Research Takes Us (Aurora, Colorado: Mid-continent Research for Education and Learning, 2000).

SIGNAL LOSS: WHAT WE KNOW ABOUT SCHOOL PERFORMANCE 33
Subsequently, the Ministry commissioned ERO to review teacher appraisal systems, which found in 2013 that although there was evidence of good practice, “appraisal systems in the majority of schools...did not contribute sufficiently to improving teacher capability and student outcomes”.89
ERO’s 2014 survey of 193 primary schools found that teachers too were not always cognisant of their own effectiveness (or ineffectiveness). Though practice had improved, teacher self-review was still weak in half the schools. Teachers continued to use the same ineffective teaching techniques because they could not identify what in their practice needed to change.90
In July 2015, the Education Council contracted ERO to audit and moderate teacher appraisal processes for at least 10% of the practicing certificates issued or renewed in the previous 12 months as part of ERO’s school review. The objective is to ensure that appraisals made by professional leaders
endorsing these certificates are of a reasonable and consistent standard.91
Although this is a positive and necessary step, the extent to which effective and less effective practice will be identified remains limited. ERO judges the quality of evidence used by school leaders to endorse practising certificates, but it is not clear how the evidence will be linked to the impact individual teachers have on learner outcomes.
Teacher turnover: Who is in and who is out
Although teacher turnover can be disruptive, it is not necessarily always a bad thing. Reasons and trends in turnover data could signal a number of things. Highly effective teachers leaving could be a warning sign of school dysfunction and a call for remedial action. But if poorly performing teachers are leaving, it could be a positive sign and could indeed contribute to improved student achievement.
91 Education Review Office, “Education Council Audit,” Website.
Figure 12: Teacher turnover by decile (2010–15)
Source: Based on data received from the Ministry (September 2015).
in Primary Schools” (Wellington: New Zealand Government, 2014), 4.
89 Ibid.
90 Education Review Office, “Raising Achievement

THE NEW ZEALAND INITIATIVE34
Ministry data shows that the average teacher turnover has been increasing from 2010 to 2015, and more teachers leave lower decile schools than higher decile schools (Figure 12).92
It would be informative to know whether teachers leave lower decile schools for higher decile schools or leave the profession completely, and how much turnover is voluntary as compared to dismissal. Data on teacher turnover to see why and how often they leave schools could support school improvement efforts. However, the Ministry does not formally collect data on teacher mobility, let alone analyse it,93 so these questions cannot be answered with any degree of accuracy.
Other school systems are better at assessing teacher contributions and managing teacher performance in a way that is helpful to students. For example, Washington, D.C.’s IMPACT teacher evaluation system assesses teachers annually against multiple measures, including independent observations, self-review, student outcomes, and how much value a teacher adds to students’ learning over the course of a year (‘value-added’ measures).
The system is linked to high-stakes incentives, and is described as having transparent expectations and standards from the start. Effective teachers are rewarded and poorly performing teachers are sanctioned. The support and professional development given to teachers to improve practice is key to making the programme work.94
A recent evaluation of IMPACT showed a link between the attrition of ineffective teachers and improved student outcomes: on average, teachers who left were replaced with better performing
92 Data received from the Ministry (September 2015).93 Ministry of Education, Email (September 2015)94 Melinda Adnot, Thomas Dee, Veronica Katz and James
Whyckoff, “Teacher Turnover, Teacher Quality, and Student Achievement in DCPS,” Working paper No. 16-03 (Stanford: Center for Education Policy Analysis (CEPA), 2016).
teachers who subsequently lifted student achievement.95
Of course, this is one study and it is out of the United States. But the potential for better student outcomes through improved teacher appraisal and from making sure the right teachers are in the classrooms should not be ignored.
However, New Zealand does not yet have robust enough mechanisms to conduct high-stakes teacher assessments. Therefore, attempts to reward or sanction teacher practice would be dangerous. But better metrics to assess teacher quality are possible with the available data on students, at least at the senior secondary level, and could be used as part of a more effective holistic assessment (see Chapter 4).
3.2 INEFFECTIVE PRINCIPAL LEADERSHIP
The most common factor uniting poorly performing schools is poor leadership. Most of the 20 failing schools in ERO’s books have had a change in principal at least once in the last five years. In fact, in its 2014 briefing to the incoming Minister, ERO stated that the quality of school leaders is usually the key difference between schools with high achievers and those with low achievers.96 Hawk’s thesis too suggests school decline in New Zealand usually begins with principals, who provide an integral link between the board and the students, failing to recognise and address worsening problems.97
In particular, ERO highlights the lack of depth in data gathering and analysis by school leaders hinders improvement in the less successful schools. In its 2015 survey of schools, ERO found that the quality of information on student achievement provided to the board by the principal
95 Ibid.96 Education Review Office, “2014 Briefing to the Incoming
Minister,” op. cit.97 Kay Hawk, “School Decline: Predictors, Process and
Intervention,” op. cit.

SIGNAL LOSS: WHAT WE KNOW ABOUT SCHOOL PERFORMANCE 35
was limited. As a result, board members and trustees in these cases were unsure what the data told them about student achievement, and had little basis to plan strategies.98
3.3 INEFFECTIVE SCHOOL BOARDS
Details from the Ministry’s statutory interventions and ERO’s reports of persistent low performers show that some school boards have difficulty in meeting the demands on them. At 30 October 2015, 67 schools had some or all aspects of their board functions taken over by an external individual appointed by the Ministry.
The board has significant responsibilities for the overall governance of a school, which likely requires a specific skill set. The pool and calibre of candidates available for election can affect the overall performance of a school. Trustees are elected to boards as voluntary members and are supposed to be the voice of the school community.99 Low decile schools are over-represented in both ERO’s regular reviews and the Ministry’s schools needing statutory intervention. Boards in wealthier areas are more likely to draw on candidates with specific skills and experience useful for governing while boards in poorer neighbourhoods may have less relevant experience to draw upon.
Like in any other organisation, the quality of human resources in schools can make or break the organisation. The board is the legal employer of all school staff; attracting, hiring and managing the school principal and teachers is a key, if not the most important, responsibility of a school board. Often the personnel responsibilities for teachers and other staff are delegated to the principal, but
98 Education Review Office, “Raising Student Achievement Through Targeted Actions” (Wellington: New Zealand Government, 2015).
99 Education Counts, “Boards of trustees,” Website.
the board remains responsible for managing the principal.100
The quality of the board thus can be reflected in the quality of the school staff, at least at the principal level.
ERO’s 2013 survey of 200 schools showed that the majority of boards (86% primary and 88% secondary) had completed the mandated annual principal appraisals. However, most boards did not follow through to determine whether the appraisals were benefiting the school.101
Similarly, the Ministry’s 2014 review of issues affecting the governance of state schools indicates that as had been highlighted in the Ministry’s 2007 and 2008 board of trustee stock-take,
...access to reliable student achievement data and a good understanding of how to interpret it, is [still] a critical barrier to boards taking responsibility for improving student outcomes....102
3.4 SCHOOLS ARE RESTRICTED TO MAKE VITAL DECISIONS
While the self-managing schools are trusted by the Ministry to make the most effective decisions for their students, the infrastructure within which the schools operate acts to constrain this autonomy. Schools are for example restricted in how they manage one of the key contributor to student success – teacher quality. The state (through union negotiations) prescribes conditions on teacher hiring decisions, controls contracts and pay, and limits performance management (how easily good performance can be rewarded and how ineffective performance is managed).
100 Ibid.101 Education Review Office, “Supporting School
Improvement Through Effective Principal Appraisal,” (Wellington: New Zealand Government, 2014).
102 Ministry of Education, “Taskforce on Regulations Affecting School Performance: Governance of State Schools” (Wellington: New Zealand Government, 5 February 2014), 6.

THE NEW ZEALAND INITIATIVE36
Boards (or their delegates) are expected to appraise and manage teacher performance but are hampered by a short and tight rope by which they can exercise this responsibility. In fact, many principals interviewed for this report said their hands were tied when it came to dismissing teachers based on poor student achievement. One principal said, “the union would be on my back”, if they were to dismiss teachers of underachieving students.103
Teacher unions want to prevent sanctioning teacher performance. Indeed, rewarding or sanctioning teacher performance based on current student achievement measures could likely be harmful. The current performance targets are based on an arbitrary yardstick – one that expects students to meet proficiency standards largely determined by age group.104 But as Hattie and Marzano’s syntheses show, many other factors beyond age are associated with student learning. If the starting points of students are not taken into consideration when judging performance, then students and teachers face an uphill battle they cannot win.
103 School Principal, Personal Meeting (2015).104 Ministry of Education, “The New Zealand Curriculum,”
op. cit.
3.5 PARENTAL CHOICE IS ALSO RESTRICTED
School choice matters to New Zealand parents. When zoning restrictions were initially abolished in the early 1990s, many parents changed schools.105 But school choice is far more constrained today, than, say, choosing a child’s doctor, dentist or hairdresser. Under current regulations, schools have a captive clientele and face few consequences from parents’ choice.
First, parents are not always guaranteed a seat in a school of their choice if they live out of zone.106 Zoning for schools was partially re-introduced in the early 2000s to guarantee a place for children in the neighbourhood of popular schools. Where the school is oversubscribed, those out of the enrolment zone go into a ballot. The scheme makes sense in a world of limited resources.107 In their 2013 survey of primary and intermediate schools, Wylie and Bonne found that only 6% of parents said their child was not in a school of their first choice but among them 11% of Māori parents and
105 See, for example, Carrie Beaven, “Parental Choice or School Choice: Who Benefits from the Removal of Zoning?” New Zealand Annual Review of Education 12 (2003), 111–126; Nicholas Jones, “Decile changes: The interactive that will make you think twice about white flight from schools,” The New Zealand Herald (10 November 2014).
106 Enrolment schemes define a school zone and relevant procedures for selecting applicants who live outside the zone. Part 2 (11A-11Q) of the Education Act 1989, amended in the Education Amendment Act 2000, outlines situations where an enrolment scheme is needed, and the procedures for establishing, maintaining and ending a scheme. Approval from the Secretary for Education is needed to establish, modify or end a scheme. Ministry of Education, “Overview of the Education Act 1989: As Relevant to Primary and Secondary Education” (Wellington: New Zealand Government, 2014), 7.
107 The background report on enrolment schemes by the Taskforce on Regulations Affecting School Performance acknowledges that changes to enrolment schemes would need to consider a mechanism to ensure that schools are not overcrowded and that property is efficiently used. Ministry of Education, “Taskforce on Regulations Affecting School Performance: Enrolment Schemes (Wellington: New Zealand Government, 2014), 5.

SIGNAL LOSS: WHAT WE KNOW ABOUT SCHOOL PERFORMANCE 37
12% of Pasifika parents said their children were not in a school of their first choice. The commonly cited reasons for not accessing the first school of choice were ‘the school enrolment zone, cost and transport’.108 However, the real issue would be where parents’ only choice would be to send their child to the local school because it has empty seats, particularly if the empty seats are a reflection of the school’s perceived poor performance. 109
In other sectors, popular providers open new branches or expand in other ways. But many parents in New Zealand wanting to switch schools have to fork out thousands of dollars on real estate to live in the zoned area where the schools perceived as better (higher-decile) are located. Currently, there are no opportunities for such schools to take over poor performing schools or open up remote campuses to manage increased demand.
Second, the signals that parents rely on to make schooling decisions may be inadequate, particularly for parents who value academic achievement. Parents probably get a good sense of how schools are doing from many indicators: word of mouth, ERO reports, student achievement
108 Cathy Wylie and Linda Bonne, “Primary and Intermediate Schools in 2013”, op. cit.,129-130.
109 Though research evidence on the overall benefits of school choice both to the student and society is mixed. See, for example, New Zealand research by Carrie Beaven, “Parental Choice or School Choice,” op. cit. and US research by Caroline M. Hoxby, “School Choice and School Productivity (or Could School Choice be a Tide that Lifts All Boats?),” NBER Working Paper No. 8873 (2002). For a country like New Zealand that values liberty and personal freedom, it appears counterproductive to have restrictions that constrain choice in the education sector. The OECD also reports that generally student differences in achievement are larger within schools than between schools – PISA 2012 maths results showed that on average, 36% of differences for OECD countries were explained by the school a student attended compared to 54% by the teacher they had. The issue with New Zealand measures is we do not know how effective schools and teachers are at educating the types of students they have. More research on the benefits of school choice is warranted. Policies need to be considered with wider policy issues such as how they affect parents constrained by other social factors such as poverty.
information, etc. But having a ‘sense’ of the academic quality of the local school does not help in assessing whether their child might do better academically elsewhere.
Along with student achievement information, ERO’s schools reports serve as key tools to judge the quality of individual schools. However, ERO’s reports to the community and parents likely leaves them with more questions than answers. Undeniably, what goes on in a school is complex. This makes it challenging for ERO to capture everything that affects the quality of the school, while providing review information in a succinct and accessible manner. However, the overall quality of a school is not always apparent just looking at an ERO report, which may mean that parents need to read between the lines. Furthermore, ERO only publishes the previous three to four review reports on its website. So parents considering one of the 20 persistently failing schools discussed would not know the full performance history beyond what is available online. New parents who want to know how a school has done beyond the published reports (from an independent evaluator) would have to request the reports from the school or ERO. And it is even harder to compare the evaluation outcomes of different schools.
Potentially more limiting is that ERO’s positioning of schools with regards to how schools support student achievement is hindered by current indicators of academic achievement. School results on which ERO relies may mask cases of underperformance other than the obvious and visible because national benchmarks focus more on the end-goal and less on the learning that has happened during the course of the year. This is particularly so for schools with high achievers (i.e. high proportions of students ‘at’ or ‘above’ national targets), where it is unclear whether students are making the expected progress. These schools may not be reviewed for three to five more years, even if they may actually be underachieving relative to their capability. Others deemed poorly performing for not meeting national benchmarks may, in fact, have substantially improved their

THE NEW ZEALAND INITIATIVE38
students’ performance from far below expectations to almost meeting them. For example, a 87% achievement rate is no virtue if a school should have achieved a 95% pass rate. And a 70% pass rate is no vice if half the students were likely to have failed to meet targets. Although in the last few years ERO stopped including decile information on school reports, its evaluation results still positions the lower decile schools disproportionately at the bottom of the pack.
There are examples of other jurisdictions that have been more pragmatic in identifying success and failure. For example, evidence from Australia indicates that while 60% of schools are in good shape, almost one-third of Australia’s schools are “coasting” and “hiding behind high-achieving students but failing to secure any improvement in their performance”.110 The Australian quotes Professor Hattie:
We see successful schools as the high-achieving ones but I see successful schools as the high-growth or improving schools …111
Parents obviously want to know how their child’s school compares with other schools, which is why the media spends resources to produce league tables ranking schools on meeting national targets.112 On these tables, higher decile schools on average come up on top so decile rating continues to be synonymous with quality. But signals like decile rating or average school results provide no guarantee to parents that moving their child from a lower to a higher decile school would necessarily improve their child’s learning. The Ministry does
110 Justine Ferrari, “Brightest students coasting to failure,” The Australian (4 October 2014).
111 Ibid.112 But the media cannot provide any contextual analysis,
neither is it their job to do. They are in fact filling a gap created by ERO and the Ministry, who have superior expertise in education and access to primary data and can make meaningful comparisons between schools to help parents in school choice.
not analyse how student performance changes, if at all, when students move between deciles.113
The more significant problem is the tools used to brand schools as good or poor where schools with more harder-to-teach students because of socioeconomic backgrounds are regarded as low quality schools. In this regard, parents’ choice could be misguided by unreliable information about the relative quality of schools. The lower decile areas could become more impoverished if more families with greater social and human capital continue to move to higher decile zones. In fact, research proposes that when centrally determined zones were first removed in the early 1990s, students with high socioeconomic status (SES) were more likely to bypass their local school in favour of higher SES schools.114
3.6 CONCLUDING REMARKS
Educational research consistently points to the quality of school leaders and teachers as the key contributors to school success. Efforts to improve school performance should thus first lie with defining what effective practice looks like, accurately assessing it, and then managing it.
New Zealand schools have had more autonomy than in most other OECD countries since the reforms of the 1980s shifted decision-making powers from the state to principals and parents. Policymakers believed this would improve the education system, particularly academic outcomes
113 Ministry of Education, Email (September 2015).114 Hughes, David, Hugh Lauder, Sue Watson, Jennie
Hamlin and Ibrahim Simiyu, “Markets in Education: Testing the Polarising Thesis,” The Smithfield Project Phase Two: Fourth Report (Wellington: Ministry of Education, 1996), as cited in Carrie Beaven, “Parental Choice or School Choice,” op. cit., 116.

SIGNAL LOSS: WHAT WE KNOW ABOUT SCHOOL PERFORMANCE 39
for students from low socioeconomic backgrounds who had been historically left behind.115
One of the ways this was meant to happen was through the provision of decent information to parents about relative schools strengths. Parents were expected to influence the quality of schools by voicing their concerns or taking their children elsewhere.116
Fast forward more than 20 years and challenges with good sector information persist. Parents are being poorly served by currently available information about school success and failure, and are generally limited in what they can do about switching schools if they are dissatisfied. This may in turn provide little incentive for schools to retain standards or sustain improvement.
Most parents would not want to gamble on their child’s education and welfare. But parents deserve
115 Cathy Wylie, “Challenges Around Capability Improvements in a System of Self-managed Schools in New Zealand” (WestEd, 2012).
116 Mark Adams, “Tomorrow’s Schools Today: New Zealand’s Experiment 20 Years On,” Working Paper No. 09-01 (Mercatus Center, George Mason University, 2009).
better mechanisms to judge the effectiveness of a school’s leadership, teaching and governance when making school choices. In principle, resources could be more efficiently allocated if better performing schools were free to respond to demand, and persistently poor performers faced dwindling rolls and eventually closed, or were taken over.
In the absence of hard comparative data about how a particular school will work for their child, parents continue to rely on misguided measures of quality. Inevitably, lower decile schools will continue to get painted by the one poorly performing brush even if they were doing an outstanding job with their students. By the same measure, some higher decile schools will continue to get away with mediocrity. However, as Chapter 4 proposes, better signals are in fact feasible.


SIGNAL LOSS: WHAT WE KNOW ABOUT SCHOOL PERFORMANCE 41
FOUR IMPROVED QUALITY SIGNALS POSSIBLE
Outcomes on NCEA, National Standards and ERO reports are commonly used to judge school quality. Looking from the outside in and from the inside out, success in New Zealand against these indicators seems to belong to schools and students residing in the leafy suburbs. Teachers and students in affluent neighbourhoods consistently top performance ranking tables.117
And therein lies the problem.
What students bring to school and the classroom explains much of what they could end up getting out of school. To put it simply, differences in student intake can lead to different educational outcomes between classrooms and between schools. But as Hattie argues, these differences should not be used as excuses for not adding value to students while they are at school.118
This chapter proposes a better approach to define and evaluate school and teacher effectiveness – finer details will be explored in subsequent reports in this series.
4.1 INFORMATION FLOW ON STUDENT ACHIEVEMENT
The New Zealand school system does not suffer from a lack of data on student achievement. Schools regularly collect and collate achievement information that is shared between the schools and the Ministry. What needs improvement is how the available data is turned into useful information to help define, measure and manage performance.
117 For example Metro’s “The Best Schools in Auckland” compares academic performance between and within decile groupings; and Stuff’s “School Report” ranks all of New Zealand schools.
118 John Hattie, “What doesn’t work in education: The politics of distraction” (Pearson, 2015)
School principals are expected to provide student achievement data to the board. In turn, each board is expected to submit the information to the Ministry as part of the school’s annual reporting requirements demonstrating student achievement against nationally set targets.119 The level of information required from the school to the Ministry differs slightly by year level.
Primary school teachers (Years 1–8) are free to use a number of bespoke tools to assess their students’ achievement and progress against National Standards.120 However, there is no standardised assessment tool at these levels. Schools at these levels collect and collate individual level data for their own purposes but are required to send only school aggregate results data to the Ministry.
Senior secondary (Years 11–13) student-level achievement data is sent by schools to the Ministry for NCEA Levels 1–3 because assessments at these levels are standardised across schools. The different levels of information that is sent to the Ministry means tracking individual teacher and student performance by the Ministry would be a lot more difficult at levels other than NCEA Levels 1–3. Still, the Ministry has information on senior secondary achievement that allows it to draw comparisons between schools. For example, the Ministry’s school leaver documentation compares performance trends between similar schools (e.g. by size, decile and type) on a local, regional and national level. This is useful information that could help schools identify areas of focus in the coming year. Unfortunately, the Ministry only sends the
119 Ministry of Education, “Planning and reporting,” Website.
120 The e-asTTle, an online assessment tool that assesses students’ achievement and progress, and the Progressive Achievement Test (PAT), which assesses students’ baseline numeracy and literacy in Year 9, are common assessment tools used by schools.

THE NEW ZEALAND INITIATIVE42
documentation to schools about three-quarters of the way into the school year.
One principal said with regards to the timeliness of the information: “...we all receive it – last week!!! Too late to save us any time .… we’ve done the same thing months ago! And added “I suspect we just don’t worry about it [requesting the information sooner] because we do it ourselves .… too many big things to worry about! This is just white noise .…”121
4.2 WHERE THE SIGNAL GETS LOST
Just as all students cannot be expected to be the best academically, in sports or artistically, schools too cannot be good at educating all kinds of students, let alone be equally effective in all other aspects of schooling. It thus makes little sense to judge all schools by the same yardstick.
This is why there needs to be better ways for schools to signal what they are good at.
Many principals are frustrated that schools are pitted against each other on the basis of current measures of student achievement. For example, a principal who leads a school where 40% of students had English as Second Language (ESL) and required extra learning support said, “Next to my peers and other schools, my results don’t stack up”.122 Parents can see the league tables results are poor. But how can they tell whether their ESL children would do better elsewhere?
Since the Ministry evaluates school performance against its own targets, most schools focus their efforts on reaching those targets. But the issue is not with schools having standards to meet but that arbitrary benchmarks can lead to false judgments, which may in turn lead to, for example, an over-rating of schools or teachers with very capable students or an under-rating of schools with students with higher risks of underachievement.
121 Secondary school principal, Email (October 2015).122 Primary school principal, Personal meeting (2015).
This is less about undermining the benefits of targets and more about having goalposts that are not arbitrary but relevant to the contexts of schools and enable observers to make useful inferences about relative quality.
4.3 WHAT IS THE ALTERNATIVE?
Discussions with principals indicate that while schools with lower average achievement focused on pushing students closer to the national targets, higher performing schools sought alternative ways to assess how their students were performing against comparable students. In other words, the best schools were not those that regarded success as a box-ticking exercise but were more interested in moving students towards realising their potential.
Some independent service providers allow schools to assess the value they have added to their students, though there appears to be little up-take from schools.
For example, Canterbury University offers an assessment service where schools can assess their students’ progress. The university’s Centre for Evaluation and Monitoring (CEM) uses baseline assessments and a large national sample to statistically predict the amount of learning students should be expected to achieve in a given time period. Value-added models measure whether a student or classroom kept pace, lagged behind, or performed better than expected when compared to students with similar characteristics (Figure 13).123
CEM proposes that the benefits of using value-added assessments is that unlike national measures of student performance focus solely on achievement i.e on an end goal, the approach allows schools to assess the growth that has happened over the school year.
123 Centre for Evaluation and Monitoring, “Value Added Assessment” Website (The University of Canterbury).
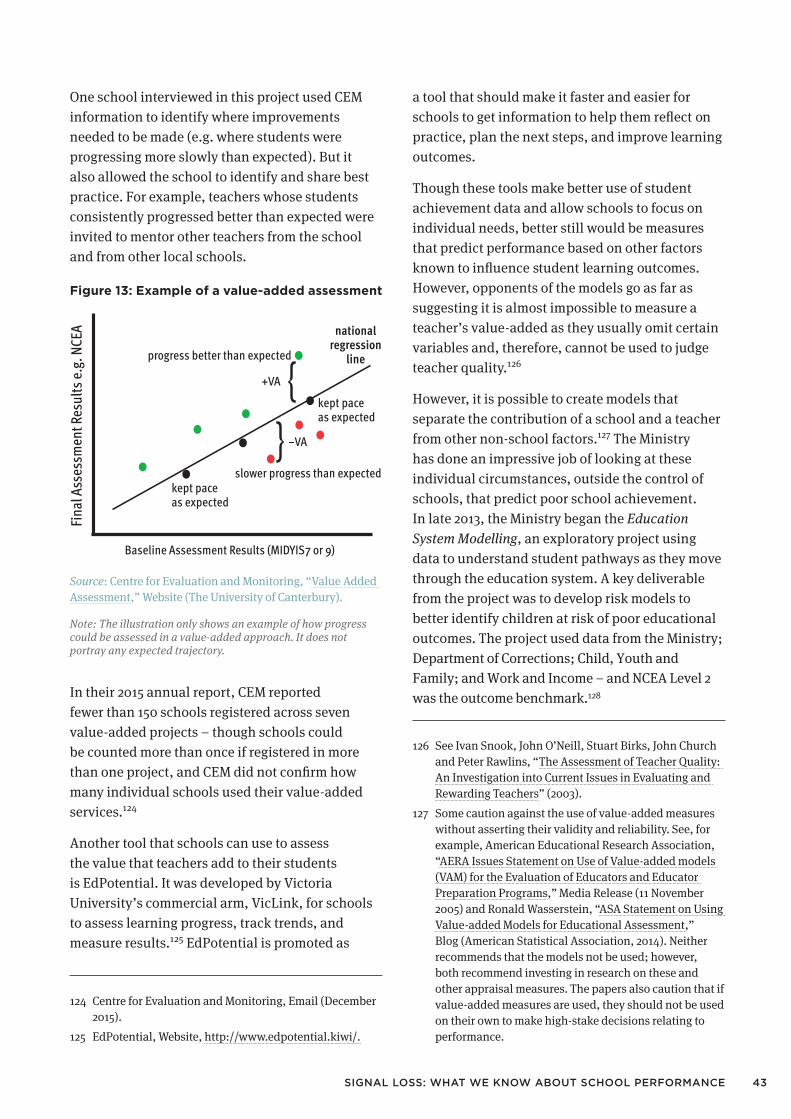
SIGNAL LOSS: WHAT WE KNOW ABOUT SCHOOL PERFORMANCE 43
One school interviewed in this project used CEM information to identify where improvements needed to be made (e.g. where students were progressing more slowly than expected). But it also allowed the school to identify and share best practice. For example, teachers whose students consistently progressed better than expected were invited to mentor other teachers from the school and from other local schools.
Figure 13: Example of a value-added assessment
Baseline Assessment Results (MIDYIS7 or 9)
progress better than expected
+VA
–VA
national regression
line
kept pace as expected
kept pace as expected
slower progress than expected
Fina
l Ass
essm
ent R
esul
ts e
.g. N
CEA
Source: Centre for Evaluation and Monitoring, “Value Added Assessment,” Website (The University of Canterbury).
Note: The illustration only shows an example of how progress could be assessed in a value-added approach. It does not portray any expected trajectory.
In their 2015 annual report, CEM reported fewer than 150 schools registered across seven value-added projects – though schools could be counted more than once if registered in more than one project, and CEM did not confirm how many individual schools used their value-added services.124
Another tool that schools can use to assess the value that teachers add to their students is EdPotential. It was developed by Victoria University’s commercial arm, VicLink, for schools to assess learning progress, track trends, and measure results.125 EdPotential is promoted as
124 Centre for Evaluation and Monitoring, Email (December 2015).
125 EdPotential, Website, http://www.edpotential.kiwi/.
a tool that should make it faster and easier for schools to get information to help them reflect on practice, plan the next steps, and improve learning outcomes.
Though these tools make better use of student achievement data and allow schools to focus on individual needs, better still would be measures that predict performance based on other factors known to influence student learning outcomes. However, opponents of the models go as far as suggesting it is almost impossible to measure a teacher’s value-added as they usually omit certain variables and, therefore, cannot be used to judge teacher quality.126
However, it is possible to create models that separate the contribution of a school and a teacher from other non-school factors.127 The Ministry has done an impressive job of looking at these individual circumstances, outside the control of schools, that predict poor school achievement. In late 2013, the Ministry began the Education System Modelling, an exploratory project using data to understand student pathways as they move through the education system. A key deliverable from the project was to develop risk models to better identify children at risk of poor educational outcomes. The project used data from the Ministry; Department of Corrections; Child, Youth and Family; and Work and Income – and NCEA Level 2 was the outcome benchmark.128
126 See Ivan Snook, John O’Neill, Stuart Birks, John Church and Peter Rawlins, “The Assessment of Teacher Quality: An Investigation into Current Issues in Evaluating and Rewarding Teachers” (2003).
127 Some caution against the use of value-added measures without asserting their validity and reliability. See, for example, American Educational Research Association, “AERA Issues Statement on Use of Value-added models (VAM) for the Evaluation of Educators and Educator Preparation Programs,” Media Release (11 November 2005) and Ronald Wasserstein, “ASA Statement on Using Value-added Models for Educational Assessment,” Blog (American Statistical Association, 2014). Neither recommends that the models not be used; however, both recommend investing in research on these and other appraisal measures. The papers also caution that if value-added measures are used, they should not be used on their own to make high-stake decisions relating to performance.

THE NEW ZEALAND INITIATIVE44
Almost 7,000 out of about 60,000 students were identified as at a high risk of not achieving NCEA Level 2:129
Table 7: Breakdown of the 7,000 students at high risk of not achieving NCEA Level 2
87% have a primary caregiver with less than NCEA Level 1
84% are children of parents/caregivers who received a benefit
64% have a CYF* notification
63% are Māori
53% are domiciled in highly deprived areas
36% are enrolled in low decile schools
27% have any number of stand downs/suspensions before Year 9
26% have a CYF finding of abuse or neglect
23% have poor attendance in Year 9
14% have NETs involvement
13% are ORS** funded
12% are orphans (or Unsupported Children’s Benefit)
10% are children of sole parents
Source: Information released by the Ministry of Education under the Official Information Act 1982 on 25 February 2016.
Note: *CYF: Child, Youth and Family; **ORS: Ongoing Resourcing Scheme (funding for special education).
128 Ministry of Education, Response to information request under the Official Information Act 1982 (25 February 2016).
129 Ibid.
The project’s objective was to identify students who may be at risk of not achieving NCEA Level 2 and better target interventions for them while they were still in school.
This kind of information can also be used to evaluate how effective schools and teachers are at educating different students. Fair comparisons would be more feasible with such data. As a simple illustration, suppose the majority of a teacher’s students have mothers without a secondary school qualification and are in receipt of a benefit. And suppose predictive modelling shows these students should make the equivalent of a half year’s progress in reading in a year. If students made nine months’ worth of progress at the end of the year, then their teacher would be considered to be doing a fantastic job. This should hold true even if the students’ achievement lags behind national targets. Of course, these measures should never be used solely to judge performance – instead, they should be part of a suite of evaluation tools that together show the quality of teaching. It would also give teachers a better yardstick to measure how well they are doing with what kinds of students. Principals could identify teachers who are effective and those who need support. The Ministry too could better support schools to maintain or raise standards.
It makes sense that if the risk factors that limit the chances of a student achieving a certain outcome are known, they should be considered when evaluating relative performance. In fact, much of the cross-agency information used for the Ministry’s Education System Modelling project is now held within Statistics New Zealand’s Integrated Data Infrastructure (IDI) database. IDI “combines information from a range of organisations (such as health and education data) to provide the insights government needs to improve social and economic outcomes for New Zealanders”.130
The project’s initial findings demonstrate that the vast amount of data available to the Ministry can
130 Statistics New Zealand, “Integrated Data Infrastructure,” Website.

SIGNAL LOSS: WHAT WE KNOW ABOUT SCHOOL PERFORMANCE 45
be used much more meaningfully to the benefit of the students in schools. However, the response to this author’s OIA request indicated that the Minister has not been provided with further advice about the use of IDI for improving schooling sector achievement because the work with IDI is in the early stages and the Ministry has been focused on arranging access to the data– even though the Ministry was one of the lead agencies to help establish IDI.131
4.4 WHAT COULD BE THE RESERVATIONS?
Better indicators are likely to meet less resistance if their objectives are transparent, clear, relevant, and most importantly, relate to improvement rather than just accountability.
Performance indicators are only as good as the extent to which they are accepted by professionals in the sector. The reluctance in the sector about being judged against existing metrics is probably warranted. Teachers would naturally resist having their performance judged without accounting for the students they teach. Value-added measures solve some of these problems, at least at the senior secondary level where student achievement data is available.
Assessing the same would remain a challenge at primary and lower-secondary schools, not only because student level information is not centrally collected (see section 4.1) but as student proficiency is currently judged by individual teachers and assessment is not standardised between teachers or schools. If performance were assessed against the subjective judgments of teachers, it could result in unintended consequences such as teachers providing misleading information about their students’ achievement. But there have been attempts to moderate teacher judgments at these levels, though uptake is minimal.
131 Ministry of Education, Response to information request under the Official Information Act 1982 (25 February 2016).
For example, the Progress and Consistency Tool (PaCT) was developed to “give teachers confidence [in their assessments on National Standards] that their interim and end of year Overall Teacher Judgments are based on valid information, consistent with those being made by other teachers, and also with their previous judgments”. The tool has been available to about 2,000 schools that report on National Standards since the first term in 2015, but only 151 schools had signed up at 30 June 2015 and 189 had expressed interest.132 But some teachers generally resist using the tool, fearing that the data could be used to judge school and teacher performance.133
4.5 CONCLUDING REMARKS
The current basis for judging the quality of teaching and learning in New Zealand schools is fraught with a number of challenges. The potential and pitfalls of judging school effectiveness against outcomes in NCEA, National Standards, and/or ERO reports are clear. But as outlined in this chapter, better tools are possible. These mechanisms could meet multiple objectives, including monitoring and tracking progress, school improvement, and accountability. They are realistic objectives that should be explored further by the Ministry.
The Ministry has access to a vast amount of data on students and their backgrounds, and can use this data to mitigate these risks and provide valuable information back to schools.
Efficient feedback mechanisms would mean schools that are not on track or are at risk of failure are earlier informed and can change course or seek support. Teachers can better identify which students are not keeping pace or progressing as expected. Principals can pinpoint sooner where classroom level issues persist and address them.
132 Ministry of Education, “Annual Report 2015 for the Year Ended 30 June 2015” , op. cit., 18.
133 Radio New Zealand, “School groups wary of National Standards computer system” (3 February 2016).

THE NEW ZEALAND INITIATIVE46
Schools and teachers can figure out which practices consistently produce positive results. Knowing which teacher is good with which kinds of students can help able and willing schools to match student needs to teachers. Such information allows for an improved and systematic approach to school improvement.
Businesses work much in the same way. They rely on constant feedback from consumers on how they are doing and adjust where needed. They also provide information to consumers that signal how they are doing compared to similar providers. The use of data held in vaults like IDI can provide more systematic mechanisms to monitor school and teacher performance.

SIGNAL LOSS: WHAT WE KNOW ABOUT SCHOOL PERFORMANCE 47
CONCLUSION
Imagine you are a business owner. If your business did not do well last year or the years before that, you would probably be out of business or at least lose money. If you do not find solutions swiftly, your customers would leave you for a competitor, and you would eventually close shop. But in New Zealand, there are some schools that make small improvements here and there but not enough to lift performance, yet they remain in operation. Meanwhile, the opportunities of thousands of students in these schools continue to be undermined. The government needs innovative solutions to address this history of non-improvement. Knowing which are the weakest schools in the country is not enough. Though according to both ERO and the Ministry considerable efforts have been made to support the persistent poorly performing schools, for a majority in the group, sustained change is certainly harder to pinpoint.
This report shows evidence of systemic failure in identifying excellent performance and dealing with underperformance. Parents, schools and teachers have limited ways of knowing how well students are achieving compared to others like them in other classrooms or other schools. The limited use of information means parents and students continue to rely on unreliable signals to make schooling decisions, while regulatory constraints limit opportunities for change and hinder innovative solutions. The Ministry and ERO are privy to rich datasets that could be better used to track and manage performance and will be explored in subsequent reports in this series.
It is laudable that the Ministry has recognised more needs to be done to lift the achievement of New Zealand students. In its review of the Education Act 1989, the Ministry is considering how to better support school boards to focus on what is important. The discussion document states:
With better and more timely information, parents, whānau and communities can have an active role in helping to improve achievement for their children and young people. The Act could allow for a set of indicators to be
established so schools and kura know what areas they need to report on. For example how well students are doing, and how the school or kura is managing its money.134
The discussion document also asks: “What should the indicators and measures be for school performance and student achievement and wellbeing?”
The true test of the quality of an education system should be determining the value it adds to its students in school and later life. Would it not be useful, for example, to know the long-term outcomes of the thousands of students who attended schools that have persistently underperformed according to existing indicators of quality? The Ministry’s Education System Modelling project and IDI data seem like decent starting points.
And so the analysis is not over. Knowing there is a problem is only half the work. The next report in this three-part series will examine how other international school systems and some local schools have dealt with persistent school failure. After all, the issues identified in this report are not unique to New Zealand.
In fact, there are examples of other jurisdictions using innovative ways to tackle persistent school failure, more systematically and deliberately, that are worth examining. For example, the United Kingdom is robustly working to hold persistent poor performers accountable. The United States is doing valuable work in conducting better teacher performance evaluations in ways that are promoting academic success.
Lessons learned from these places will inform the practical policy recommendations in the third and final report and help raise the quality of our education system to world class levels.
134 Ministry of Education, “Have Your Say About Updating the Education Act 1989: A Public Discussion Document” (Wellington: New Zealand Government), 9.


SIGNAL LOSS: WHAT WE KNOW ABOUT SCHOOL PERFORMANCE 49
BIBLIOGRAPHY
Adams, Mark. “Tomorrow’s Schools Today: New Zealand’s Experiment 20 Years On,” Working Paper No. 09-01 (Mercatus Center, George Mason University, 2009).
Adnot, Melinda, Thomas Dee, Veronica Katz and James Whyckoff. “Teacher Turnover, Teacher Quality, and Student Achievement in DCPS,” Working paper No. 16-03 (Stanford: Center for Education Policy Analysis (CEPA), 2016).
American Educational Research Association. “AERA Issues Statement on Use of Value-added models (VAM) for the Evaluation of Educators and Educator Preparation Programs,” Media Release (11 November 2005). http://www.aera.net/Newsroom/NewsReleases andStatements/AERAIssuesStatementontheUseof Value-AddedModelsinEvaluationofEducatorsand EducatorPreparationPrograms/tabid/16120/ Default.aspx.
Barker, Bill. “Turnaround Leadership: How Three Successful Leaders Turned Around Their Schools,” Ph.D. thesis (Auckland: Unitec Institute of Technology, 2011).
Beaven, Carrie. “Parental Choice or School Choice: Who Benefits from the Removal of Zoning?” New Zealand Annual Review of Education 12 (2003), 111–126.
Caygill, Robyn, Sarah Kirkham and Nicola Marshall. “TIMSS 2010/11: Year 5 Students’ Mathematics Achievement” (Wellington: Ministry of Education, 2013), https://www.educationcounts.govt.nz/publications/series/2571/114981/timss-201011-year-5-students-mathematics-achievement
——. “TIMSS 2010/11: Year 9 Students’ Mathematics Achievement” (Wellington: Ministry of Education, 2013), https://www.educationcounts.govt.nz/publications/series/2571/114981/timss-201011-year-9-students-mathematics-achievement.
——. “TIMSS 2010/11: Year 5 Students’ Science Achievement” (Wellington: Ministry of Education, 2013), https://www.educationcounts.govt.nz/publications/series/2571/114981/timss-201011-year-5-students-science-achievement.
——. “TIMSS 2010/11: Year 9 Students’ Science Achievement” (Wellington: Ministry of Education, 2013), https://www.educationcounts.govt.nz/publications/series/2571/114981/timss-201011-year-9-students-science-achievement.
Centre for Evaluation and Monitoring. “Value Added Assessment” Website (The University of Canterbury). https://www.cem.canterbury.ac.nz/projects.shtml.
Chamberlain, Megan. “PIRLS 2010/11 in New Zealand: An overview of findings from the third cycle of the Progress in International Reading Literacy Study (PIRLS)” rev. ed. (Wellington: Ministry of Education, 2014), http://www.educationcounts.govt.nz/__data/assets/pdf_file/0020/125057/PIRLS-2010-11-in-NZ-An-overview-of-findings-from-the-3rd-cycle-of-PIRLS.pdf.
Chamberlain, Megan and Robyn Caygill. “Key Findings from New Zealand’s Participation in PIRLS and TIMSS in 2010/11” (Wellington: Ministry of Education, 2012).
Controller and Auditor-General. “Ministry of Education: Monitoring and Supporting School Boards of Trustees” (Wellington: Office of the Auditor-General, 23 June 2008), http://www.oag.govt.nz/2008/boards-of-trustees.
David, Hughes, Hugh Lauder, Sue Watson, Jennie Hamlin and Ibrahim Simiyu. “Markets in Education: Testing the Polarising Thesis,” The Smithfield Project Phase Two: Fourth Report (Wellington: Ministry of Education, 1996), as cited in Carrie Beaven, “Parental Choice or School Choice: Who Benefits from the Removal of Zoning?” New Zealand Annual Review of Education 12 (2003), 111–126.
EdPotential. Website, http://www.edpotential.kiwi/. http://www.edpotential.kiwi/.
Education Council New Zealand. “About the Education Council,” Website, https://educationcouncil.org.nz/content/about-education-council.
Education Counts. “Boards of Trustees” , Website, https://www.educationcounts.govt.nz/data-services/data-collections/national/boards_of_trustees.
——. “School Leavers Pivot Table (2009–14),” Website, https://www.educationcounts.govt.nz/statistics/schooling/senior-student-attainment/school-leavers2/university-entrance-standard-numbers.
Education Review Office. “2014 Briefing to the Incoming Minister” (Wellington: New Zealand Government, 2014), http://www.ero.govt.nz/content/download/205162/3494755/version/2/file/ERO+BIM+2014.pdf.
——. “Education Council Audit,” Website, http://www.ero.govt.nz/Review-Process/Education-Council-Audit.
——. “Evaluation at a Glance: Priority Learners in New Zealand Schools” (Wellington: New Zealand Government, 2012), http://www.ero.govt.nz/National-Reports/Evaluation-at-a-Glance-Priority-Learners-in-New-Zealand-Schools-August-2012/Background.

THE NEW ZEALAND INITIATIVE50
——. “How ERO reviews schools,” Website, http://www.ero.govt.nz/Review-Process/For-Parents/How-ERO-reviews-schools.
——. “National Reports,” Website, http://www.ero.govt.nz/National-Reports.
——. “Preparing for the review,” Website, http://www.ero.govt.nz/Review-Process/Frameworks-and-Evaluation-Indicators-for-ERO-Reviews/Framework-for-School-Reviews/Preparing-for-the-review.
——. “Raising Achievement in Primary Schools” (Wellington: New Zealand Government, 2014), http://www.ero.govt.nz/National-Reports/Raising-achievement-in-primary-schools-June-2014.
——. “Raising Student Achievement Through Targeted Actions” (Wellington: New Zealand Government, 2015), http://www.ero.govt.nz/National-Reports/Raising-student-achievement-through-targeted-actions-December-2015.
——. “Return times for school reviews,” Website, http://www.ero.govt.nz/Review-Process/Return-Times-for-School-Reviews.
——. “Review process,” Website, http://www.ero.govt.nz/Review-Process.
——. “School Evaluation Indicators 2015 (Trial),” Website, http://www.ero.govt.nz/Review-Process/Frameworks-and-Evaluation-Indicators-for-ERO-Reviews/School-Evaluation-Indicators.
——. “Supporting School Improvement Through Effective Principal Appraisal,” (Wellington: New Zealand Government, 2014), http://www.ero.govt.nz/National-Reports/Supporting-school-improvement-through-effective-principal-appraisal-May-2014/National-Report-Summary-Supporting-school-improvement-through-effective-principal-appraisal.
——. “Supporting School Improvement Through Effective Teacher Appraisal” (Wellington: New Zealand Government, 2014), http://www.ero.govt.nz/National-Reports/Supporting-school-improvement-through-effective-teacher-appraisal-May-2014.
Fergusson, David, M., Nicola Swain-Campbell and L. John Horwood. “Outcomes of Leaving School Without Formal Educational Qualifications,” New Zealand Journal of Educational Studies 37:1 (2002), 39–55.
Ferrari, Justine. “Brightest students coasting to failure,” The Australian (4 October 2014).
Hanushek, Eric and Ludger Woessmann. “Do Better Schools Lead to More Growth? Cognitive Skills, Economic Outcomes and Causation,” NBER Working Paper No. 14633 (2009), in The Treasury, “Treasury’s Advice on Lifting Student Achievement in New Zealand: Evidence Brief” (Wellington: New Zealand Government, 2012), http://www.treasury.govt.nz/publications/media-speeches/speeches/economicleadership/sanz-evidence-mar12.pdf.
Harrison, Mark. Education Matters: Governments, Markets and New Zealand Schools (Wellington: Education Reform, 2004).
Hattie, John. “Teachers Make A Difference: What is the Research Evidence?” Australian Council for Educational Research Annual Conference on Building Teacher Quality (Melbourne: ACER, 2003), https://cdn.auckland.ac.nz/assets/education/hattie/docs/teachers-make-a-difference-ACER-(2003).pdf.
Hattie, John. “What doesn’t work in education: the politics of distraction” (Pearson, 2015), http://visible-learning.org/wp-content/uploads/2015/06/John-Hattie-Visible-Learning-creative-commons-book-free-PDF-download-What-doesn-t-work-in-education_the-politics-of-distraction-pearson-2015.pdf.
Hawk, Kay. “School Decline: Predictors, Process and Intervention,” Ph.D. thesis (Auckland: Massey University, 2008), http://mro.massey.ac.nz/handle/10179/1176?show=full.
Hoxby, Caroline, M. “School Choice and School Productivity (or Could School Choice be a Tide that Lifts All Boats?),” NBER Working Paper No. 8873 (2002).
Jones, Nicholas. “Decile changes: The interactive that will make you think twice about white flight from schools,” The New Zealand Herald (10 November 2014), http://www.nzherald.co.nz/nz/news/article.cfm?c_id=1&objectid=11355827.
Joyce, Peter. “System fatally flawed,” The Christchurch Press, cited in Muriel Newman, “How good is our education system?” (New Zealand Centre for Political Research, 4 June 2007), http://www.nzcpr.com/test-post-376/.
Kreiner, Svend and Karl Bang Christensen. “Analyses of Model Fit and Robustness. A New Look at the PISA Scaling Model Underlying Ranking of Countries According to Reading Literacy,” Psychometrika 79:2 (April 2014), 210–231.
Lyons, Peter. “NCEA pass rates hard for parents to cope with,” The New Zealand Herald (25 November 2015), http://www.nzherald.co.nz/secondary-education/news/article.cfm?c_id=315&objectid=11550641.
Makhlouf, Gabriel. “Economic Leadership: When Business Isn’t Usual,” Speech (Wellington: The Trans Tasman Business Circle, 20 March 2012).
Marzano, Robert, J. A New Era of School Reform: Going Where the Research Takes Us (Aurora, Colorado: Mid-continent Research for Education and Learning, 2000).
May, Steve, Saila Cowles and Michelle Lamy. “PISA 2012: New Zealand Summary Report” (Wellington, Ministry of Education, 2013), https://www.educationcounts.govt.nz/publications/series/PISA/pisa-2012/pisa-2012-new-zealand-summary-report

SIGNAL LOSS: WHAT WE KNOW ABOUT SCHOOL PERFORMANCE 51
Metro. “The Best Schools in Auckland,” Website, http://www.metromag.co.nz/city-life/education/the-best-schools-in-auckland-2015/.
Ministry of Education. “Annual Report 2014 for the Year Ended 30 June 2014” (Wellington: Ministry of Education, 2014), http://www.education.govt.nz/assets/Documents/Ministry/Publications/Annual-Reports/MOEAnnualReport2014-Web.pdf.
——.“Annual Report 2015 for the Year Ended 30 June 2015” (Wellington: Ministry of Education, 2015), http://www.education.govt.nz/assets/Documents/Ministry/Publications/Annual-Reports/MOE-Annual-Report-2015.pdf.
——.“Delivering Better Public Service: Boosting Skills and Employment by Increasing Education Achievement for Young People” (Ministry of Education: New Zealand Government, 2012), http://www.education.govt.nz/assets/Documents/Ministry/BPS/BPSYoungPeopleWEB.pdf.
——.“Have Your Say About Updating the Education Act 1989: A Public Discussion Document” (Wellington: New Zealand Government), http://www.education.govt.nz/assets/Documents/Ministry/consultations/Updating-the-Education-Act-1989-A-public-discussion-document.pdf.
——. “Interventions: Guide for schools,” Website, http://www.education.govt.nz/school/running-a-school/interventions-in-schools/interventions-guide-for-schools/.
——.“National Standards,” Website, http://nzcurriculum.tki.org.nz/National-Standards.
——.“Overview of the Education Act 1989: As Relevant to Primary and Secondary Education” (Wellington: New Zealand Government, 2014), http://www.education.govt.nz/assets/Documents/Ministry/Initiatives/Taskforce-on-Regulations-Affecting-School-Performance/TaskforceOverviewEdActPrimarySecondaryEducation.pdf.
——.”PISA 2012: Summary of Results” (Wellington: New Zealand Government, 2013), http://www.education.govt.nz/assets/Documents/Ministry/Publications/PISA/PISA2012PresentationSummary-of-results.pdf.
——.“Planning and reporting,” Website, http://www.education.govt.nz/school/running-a-school/reporting/.
——.“Principal’s salary grades,” Website, http://www.education.govt.nz/school/running-a-school/resourcing/principals-salary-grades/.
——.“Public Achievement Information (PAI),” Website, http://www.education.govt.nz/ministry-of-education/specific-initiatives/public-achievement-information-pai/.
——.“Review of Statutory Interventions in State and State Integrated Schools: Discussion Paper” (Wellington: New Zealand Government, 2014), http://www.nzpf.ac.nz/sites/default/files/MoE_Discussion_Paper_Sector_Review_of_Statutory_Interventions.pdf.
——.“School deciles,” Website, http://www.education.govt.nz/school/running-a-school/resourcing/operational-funding/school-decile-ratings/.
——. “Statement of Intent: 2014–2018,” presented to the House of Representatives pursuant to section 39 of the Public Finance Act 1989 (Ministry of Education: New Zealand Government, 2014), http://www.education.govt.nz/assets/Documents/Ministry/Publications/Statements-of-intent/2014SOI.pdf.
——.“Taskforce on Regulations Affecting School Performance: Enrolment Schemes (Wellington: New Zealand Government, 2014), http://www.education.govt.nz/assets/Documents/Ministry/Initiatives/Taskforce-on-Regulations-Affecting-School-Performance/TaskforceEnrolmentSchemes.pdf.
——.“Taskforce on Regulations Affecting School Performance: Governance of State Schools” (Wellington: New Zealand Government, 5 February 2014), http://www.education.govt.nz/assets/Documents/Ministry/Initiatives/Taskforce-on-Regulations-Affecting-School-Performance/TaskforceGovernanceOfStateSchools.pdf.
——.“The New Zealand Curriculum,” Website, http://nzcurriculum.tki.org.nz/The-New-Zealand-Curriculum.
Mitchell Institute. “Senior School Years: School Completion Uneven Across Australia,” Fact Sheet 4: Educational Opportunity in Australia 2015 (Melbourne: Victoria University, 2016), http://www.mitchellinstitute.org.au/fact-sheets/senior-school-years-school-completion-uneven-across-australia/.
Morris, John and Rose Patterson. “World Class Education: Why New Zealand Must Strengthen Its Teaching Profession” (Wellington: The New Zealand Initiative, 2013).
Mullis, Ian V.S, Michael O. Martin, Ann M. Kennedy, Kathleen L. Trong and Marian Sainsbury, “PIRLS 2011 Assessment Framework” (Boston: TIMSS & PIRLS International Study Center, 2009), http://timssandpirls.bc.edu/pirls2011/downloads/PIRLS2011_Framework.pdf.
Nusche, Deborah, Dany Laveault, John MacBeath and Paulo Santiago. “OECD Reviews of Evaluation and Assessment in Education: New Zealand 2011” (Paris: OECD Publishing, 2012), cited in Education Review Office, "Supporting School Improvement Through Effective Teacher Appraisal" (Wellington: New Zealand Government, 2014).1.
OECD. “Pisa 2009 Results: What Students Know and Can Do – Student Performance in Mathematics, Reading and Science,” vol. I (Paris: OECD Publishing, 2010), https://www.oecd.org/pisa/pisaproducts/48852548.pdf.

THE NEW ZEALAND INITIATIVE52
OECD. “PISA 2012 Results: What Students Know and Can Do – Student Performance in Mathematics, Reading and Science,” vol. I, rev. ed. (Paris: OECD Publishing, 2014), http://dx.doi.org/10.1787/9789264208780-en.
Office of the Minister of Education, “Update of the Education Act 1989”, Submission to Cabinet (Wellington: Ministry of Education), http://www.education.govt.nz/assets/Uploads/Cabinet-submission-Update-of-the-Education-Act-1989-6.pdf.
Patterson, Rose. “Un(ac)ccountable: Why Millions on Maths Returned Little” (Wellington: The New Zealand Initiative, 2015).
Radio New Zealand. “School groups wary of National Standards computer system” (3 February 2016).
Rodgers, Lisa. “NCEA is not a pass or fail system,” The New Zealand Herald (26 November 2015), http://www.nzherald.co.nz/opinion/news/article.cfm?c_id=466&objectid=11551647.
Snook, Ivan, John O’Neill, Stuart Birks, John Church and Peter Rawlins. “The Assessment of Teacher Quality: An Investigation into Current Issues in Evaluating and Rewarding Teachers” (2003), http://www.massey.ac.nz/massey/fms/Massey%20News/2013/9/docs/EPRG2013_Summary_Treasury.pdf.
State Services Commission, the Treasury, and the Department of the Prime Ministry and Cabinet. “Performance Improvement Framework: Formal Review of the Education Review Office” (Wellington: New Zealand Government, 2012), http://www.ssc.govt.nz/sites/all/files/pif-review-ero-may2012.pdf.
Statistics New Zealand. “Integrated Data Infrastructure,” Website, http://m.stats.govt.nz/browse_for_stats/snapshots-of-nz/integrated-data-infrastructure.aspx.
Stuff. “School Report,” Website, http://www.stuff.co.nz/national/education/school-report.
Thomas, Gill, Michael Johnston and Jenny Ward. “Alignment of Literacy and Numeracy Measures: Research for the Tertiary Education Commission” (Wellington: Maths Technology Ltd, 2014), https://www.tec.govt.nz/Documents/Reports%20and%20other%20documents/Alignment-of-Literacy-and-Numeracy-Measures.pdf.
Tumen, Sarah, Sarah Crichton and Sylvia Dixon. “The Impact of Tertiary Study on the Labour Market Outcomes of Low-Qualified School Leavers,” Working Paper 15/07 (Wellington: New Zealand Treasury, June 2015).
Wasserstein, Ronald. “ASA Statement on Using Value-added Models for Educational Assessment,” Blog (American Statistical Association, 2014), http://community.amstat.org/blogs/ronald-wasserstein/2014/04/09/asa-at-175-policy-asa-statement-on-value-added-models-for-educational-assessment.
Woulfe, Catherine. “Education rankings ‘flawed’,” New Zealand Listener (4 December 2013), http://www.listener.co.nz/current-affairs/education/education-rankings-flawed/.
Wylie, Cathy and Linda Bonne. “Primary and Intermediate Schools in 2013: Main Findings from the NZCER National Survey” (Wellington: New Zealand Council for Educational Research, 2014).
Wylie, Cathy. “Challenges Around Capability Improvements in a System of Self-managed Schools in New Zealand” (WestEd, 2012).

© The New Zealand Initiative 2016
Published by:
The New Zealand InitiativePO Box 10147Wellington 6143New Zealand
www.nzinitiative.org.nz
Views expressed are those of the authors and do not necessarily reflect the views of The New Zealand Initiative, its staff, advisors, members, directors or officers.
ISBN: 978-0-9941298-6-4 • print 978-0-9941298-7-1 • online/pdf
RR26
Typeset by The Little Design Company and cover design by Mollica Sokhom
Printed by Wickliffe Solutions

$25.00
ISBN: 978-0-9941298-6-4 • print
978-0-9941298-7-1 • online/pdf RR26
The New Zealand Initiative
PO Box 10147
Wellington 6143
Signal Loss: What We Know About School Performance
As consumers, we like to make informed choices about the products and services we buy. Should choosing a school for our children be any different?
Signal Loss argues that though it is difficult to monitor school quality, it is vitally important to do so. Not only can monitoring of school quality identify problems. It can also identify best practice and help to spread it across the education system.
The first in a series of three reports, Signal Loss looks at the state of New Zealand’s schools and the way their performance is assessed and managed.
SIGNAL LOSS: WHAT WE KNOW ABOUT SCHOOL PERFORMANCE
MARTINE UDAHEMUKA
THE NEW ZEALAND INITIATIVE
sIGNAL LOSSWHAT WE KNOW ABOUT SCHOOL PERFORMANCEMARTINE UDAHEMUKAFOREWORD BY DR MICHAEL JOHNSTON