Loss of Genetic Diversity among Ocelots in the United States during the 20th Century Linked to Human...
10
Loss of Genetic Diversity among Ocelots in the United States during the 20 th Century Linked to Human Induced Population Reductions Jan E. Janecka 1 * ¤ , Michael E. Tewes 1 , Linda Laack 2 , Arturo Caso 1 , Lon I. Grassman 1 , Rodney L. Honeycutt 3 1 Caesar Kleberg Wildlife Research Institute, Texas A & M University-Kingsville, Kingsville, Texas, United States of America, 2 Laguna Atascosa National Wildlife Refuge, Rio Hondo, Texas, United States of America, 3 Natural Science Division, Pepperdine University, Malibu, California, United States of America Abstract Ocelots (Leopardus pardalis) in the United States currently exhibit low levels of genetic diversity. One hypothesis for this observation is that habitat fragmentation, resulting from human induced changes in the landscape during the 20 th century, created island populations with highly reduced gene flow and increased genetic drift and inbreeding. In an effort to investigate this, we used a portion of the mitochondrial control region and 11 autosomal microsatellite loci to examine historical levels of genetic diversity and infer temporal changes in ocelot populations between 1853 and 2005. Levels of genetic diversity were higher in historical ocelot populations than in extant populations from Texas. The earliest documented loss of mitochondrial haplotype diversity occurred at Laguna Atascosa National Wildlife Refuge. The second extant population inhabiting private lands in Willacy County retained higher levels of genetic diversity through the 1990s, but subsequently lost diversity over the next decade. A similar pattern was observed for autosomal microsatellite loci. This supports the argument that low levels of genetic diversity in Texas are related to human induced population reductions and fragmentation, both of which threaten the remaining ocelots in the United States. At this time, the best means of mitigating the continued erosion of genetic variation are translocation of individuals either from larger populations in Mexico to Texas, or between the Texas populations. Citation: Janecka JE, Tewes ME, Laack L, Caso A, Grassman LI, et al. (2014) Loss of Genetic Diversity among Ocelots in the United States during the 20 th Century Linked to Human Induced Population Reductions. PLoS ONE 9(2): e89384. doi:10.1371/journal.pone.0089384 Editor: Jose Castresana, Institute of Evolutionary Biology (CSIC-UPF), Spain Received July 5, 2013; Accepted January 20, 2014; Published February 26, 2014 Copyright: ß 2014 Janecka et al. This is an open-access article distributed under the terms of the Creative Commons Attribution License, which permits unrestricted use, distribution, and reproduction in any medium, provided the original author and source are credited. Funding: This study was funded by Rob and Bessie Welder Wildlife Foundation, Texas Parks and Wildlife Department, United States Fish and Wildlife Service, The Tim and Karen Hixon Foundation and Mr. Frank Yturria. One of the co-authors was an employee of the United States Fish and Wildlife Service (Linda Laack), other than that the funders had no role in study design, data collection and analysis, decision to publish, or preparation of the manuscript. Competing Interests: The authors have declared that no competing interests exist. * E-mail: [email protected] ¤ Current address: Department of Biological Sciences, Duquesne University, Pittsburgh, Pennsylvania, United States of America Introduction The ocelot (Leopardus pardalis) is a small (,15 kilogram), solitary, Neotropical felid [1]. Although common throughout Central and South America, it is currently endangered in the United States [1– 3]. Historically, the ocelot’s distribution included Texas, Arkansas, Louisiana, and Arizona [3]. It was extirpated from the vast majority of its range in the United States during the 20 th century, and by the 1960s the distribution became restricted to southern Texas [1,3,4]. Throughout the 1970s and 1980s, the remaining populations of ocelot in Texas continued to experience declines. Currently, the last known breeding populations within the United States are predominantly confined to small habitat patches separated by <30 km of extensive croplands and more open rangeland [5–14]. Data from both telemetry and genetic analyses have confirmed that the human modified landscape separating these two populations represents a virtually impenetrable barrier to dispersal [9–15]. The two known ocelot populations in the United States are characterized by small effective population size (N e ,14), high genetic drift (F st = 0.163, P,0.001), and reduced genetic variation (H e = 0.399 in Laguna Atascosa National Wildlife Refuge [LANWR] and He = 0.553 in Willacy County) [11,12]. This may be the result of human activities in the early 1900s including uncontrolled harvesting of ocelots and extensive thornshrub habitat removal [3]. Information regarding the role that anthro- pogenic factors played in the loss of genetic diversity in ocelot populations in the United States has important implications for ocelot recovery efforts currently underway. For habitat specialists like the ocelot, fragmentation via anthropogenic perturbations disrupts connectivity between populations, increases human caused mortality, and contributes to demographic instability [16–18]. This also decreases genetic diversity and increases divergence as a consequence of drift and inbreeding [19]. Deleterious effects include loss of adaptive variation and an increase in the frequency of detrimental alleles [20,21]; both of these factors can lead to inbreeding depression [20–24]. The effects of inbreeding depression, loss of adaptive diversity, and demographic instability greatly increase extinction risks of small, fragmented populations [25–31]. Indeed, there are cases where rapid loss of genetic variation has contributed to local extinctions [21,26,27,32]. The impact of inbreeding and drift depends largely on both the length of time the population has remained small and the biology of the species. These processes also predictably affect neutral genetic variation [19,33]. Therefore, PLOS ONE | www.plosone.org 1 February 2014 | Volume 9 | Issue 2 | e89384
Transcript of Loss of Genetic Diversity among Ocelots in the United States during the 20th Century Linked to Human...
Loss of Genetic Diversity among Ocelots in the UnitedStates during the 20th Century Linked to Human InducedPopulation ReductionsJan E. Janecka1*¤, Michael E. Tewes1, Linda Laack2, Arturo Caso1, Lon I. Grassman1, Rodney L. Honeycutt3
1Caesar Kleberg Wildlife Research Institute, Texas A & M University-Kingsville, Kingsville, Texas, United States of America, 2 Laguna Atascosa National Wildlife Refuge, Rio
Hondo, Texas, United States of America, 3Natural Science Division, Pepperdine University, Malibu, California, United States of America
Abstract
Ocelots (Leopardus pardalis) in the United States currently exhibit low levels of genetic diversity. One hypothesis for thisobservation is that habitat fragmentation, resulting from human induced changes in the landscape during the 20th century,created island populations with highly reduced gene flow and increased genetic drift and inbreeding. In an effort toinvestigate this, we used a portion of the mitochondrial control region and 11 autosomal microsatellite loci to examinehistorical levels of genetic diversity and infer temporal changes in ocelot populations between 1853 and 2005. Levels ofgenetic diversity were higher in historical ocelot populations than in extant populations from Texas. The earliestdocumented loss of mitochondrial haplotype diversity occurred at Laguna Atascosa National Wildlife Refuge. The secondextant population inhabiting private lands in Willacy County retained higher levels of genetic diversity through the 1990s,but subsequently lost diversity over the next decade. A similar pattern was observed for autosomal microsatellite loci. Thissupports the argument that low levels of genetic diversity in Texas are related to human induced population reductions andfragmentation, both of which threaten the remaining ocelots in the United States. At this time, the best means of mitigatingthe continued erosion of genetic variation are translocation of individuals either from larger populations in Mexico to Texas,or between the Texas populations.
Citation: Janecka JE, Tewes ME, Laack L, Caso A, Grassman LI, et al. (2014) Loss of Genetic Diversity among Ocelots in the United States during the 20th CenturyLinked to Human Induced Population Reductions. PLoS ONE 9(2): e89384. doi:10.1371/journal.pone.0089384
Editor: Jose Castresana, Institute of Evolutionary Biology (CSIC-UPF), Spain
Received July 5, 2013; Accepted January 20, 2014; Published February 26, 2014
Copyright: � 2014 Janecka et al. This is an open-access article distributed under the terms of the Creative Commons Attribution License, which permitsunrestricted use, distribution, and reproduction in any medium, provided the original author and source are credited.
Funding: This study was funded by Rob and Bessie Welder Wildlife Foundation, Texas Parks and Wildlife Department, United States Fish and Wildlife Service, TheTim and Karen Hixon Foundation and Mr. Frank Yturria. One of the co-authors was an employee of the United States Fish and Wildlife Service (Linda Laack), otherthan that the funders had no role in study design, data collection and analysis, decision to publish, or preparation of the manuscript.
Competing Interests: The authors have declared that no competing interests exist.
* E-mail: [email protected]
¤ Current address: Department of Biological Sciences, Duquesne University, Pittsburgh, Pennsylvania, United States of America
Introduction
The ocelot (Leopardus pardalis) is a small (,15 kilogram), solitary,
Neotropical felid [1]. Although common throughout Central and
South America, it is currently endangered in the United States [1–
3]. Historically, the ocelot’s distribution included Texas, Arkansas,
Louisiana, and Arizona [3]. It was extirpated from the vast
majority of its range in the United States during the 20th century,
and by the 1960s the distribution became restricted to southern
Texas [1,3,4]. Throughout the 1970s and 1980s, the remaining
populations of ocelot in Texas continued to experience declines.
Currently, the last known breeding populations within the United
States are predominantly confined to small habitat patches
separated by <30 km of extensive croplands and more open
rangeland [5–14]. Data from both telemetry and genetic analyses
have confirmed that the human modified landscape separating
these two populations represents a virtually impenetrable barrier
to dispersal [9–15].
The two known ocelot populations in the United States are
characterized by small effective population size (Ne,14), high
genetic drift (Fst = 0.163, P,0.001), and reduced genetic variation
(He= 0.399 in Laguna Atascosa National Wildlife Refuge
[LANWR] and He=0.553 in Willacy County) [11,12]. This
may be the result of human activities in the early 1900s including
uncontrolled harvesting of ocelots and extensive thornshrub
habitat removal [3]. Information regarding the role that anthro-
pogenic factors played in the loss of genetic diversity in ocelot
populations in the United States has important implications for
ocelot recovery efforts currently underway. For habitat specialists
like the ocelot, fragmentation via anthropogenic perturbations
disrupts connectivity between populations, increases human
caused mortality, and contributes to demographic instability
[16–18]. This also decreases genetic diversity and increases
divergence as a consequence of drift and inbreeding [19].
Deleterious effects include loss of adaptive variation and an
increase in the frequency of detrimental alleles [20,21]; both of
these factors can lead to inbreeding depression [20–24].
The effects of inbreeding depression, loss of adaptive diversity,
and demographic instability greatly increase extinction risks of
small, fragmented populations [25–31]. Indeed, there are cases
where rapid loss of genetic variation has contributed to local
extinctions [21,26,27,32]. The impact of inbreeding and drift
depends largely on both the length of time the population has
remained small and the biology of the species. These processes also
predictably affect neutral genetic variation [19,33]. Therefore,
PLOS ONE | www.plosone.org 1 February 2014 | Volume 9 | Issue 2 | e89384
temporal changes at neutral loci provide a historical perspective on
the degree to which reductions in population size and gene flow
have impacted the overall viability of currently declining species.
In fact, there are strong correlations between neutral diversity and
adaptive variation, inbreeding depression, and extinction risks
[34–38].
If isolated populations of ocelot reveal evidence of a recent and
continued decline in genetic diversity, then this will influence the
decision-making process used in recovery planning. For instance,
under such a scenario, maintaining current ocelot habitat may not
be enough to offset the demographic and genetic consequences of
small effective population size, isolation, loss of adaptive variation,
and inbreeding. Translocations may be required to mitigate the
impact of inbreeding depression and reestablish metapopulation
connectivity, thus increasing the likelihood of ocelots persisting
until additional habitat either becomes available or is restored.
We therefore explored temporal change in genetic diversity by
examining historical (1853–1956) and extant ocelot populations
(1984–2005) occupying the Tamaulipan Biotic Province (TBP) of
southern Texas and northeastern Mexico. A portion of the
mitochondrial DNA (mtDNA) control region and 11 nuclear
microsatellite loci were used to address the following questions: (1)
What were historical levels of genetic variation in ocelot
populations in the United States? (2) Have levels of genetic
variation changed in these populations over the last 100 years?
Materials and Methods
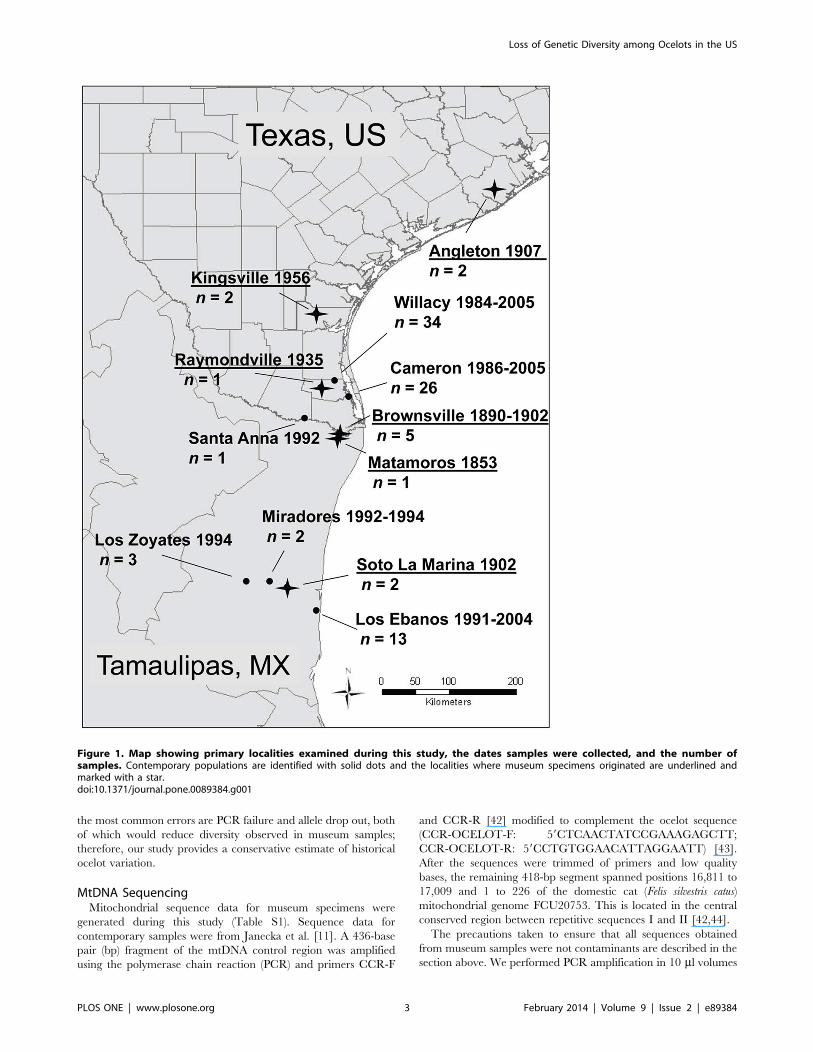
Sample CollectionMuseum samples (n = 15) used in this study were generously
provided by the National Museum of Natural History (NMNH) of
the Smithsonian Institution. Museum accession numbers and
information available on the specimens sampled are provided in
the Table S1. The historical samples were from the following
locations: (1) Brownsville, Texas (1890–1892, n= 5, A0044601,
A0044604, A0044605, A46491, and A0046119); (2) Angleton,
Texas (1907, n= 2, 150363 and 150364); (3) Raymondville, Texas
(1935, n = 1, 251587); (4) Kingsville, Texas (1956, n = 2, 287771
and 287774); (5) Matamoros, Tamaulipas, Mexico (1853, n= 1,
A1364); (6) Perez, Veracruz, Mexico (1893, n = 2, 132522 and
132524); and (7) Soto la Marina, Tamaulipas, Mexico (1902,
n = 2, 125716 and 125717) (Fig. 1).
A subset of mitochondrial and microsatellite data from Janecka
et al. [11,12] was used to compare genetic diversity of the above
historical samples to contemporary ocelot populations in Texas
and northeastern Mexico (Table S1). This included control region
sequences and genotypes for extant ocelots (n = 101) occurring in
the TBP, which is a combination of Nearctic and Neotropical
fauna and flora [39]. These ocelots were originally sampled during
telemetry studies conducted between 1984 and 2005 [5,8,13–
15,40,41] in the following study sites: (1) Laguna Atascosa
National Wildlife Refuge (LANWR), Cameron County, Texas
(Cameron, n= 40); (2) private ranches in northern Willacy
County, Texas (Willacy, n= 34); and (3) Los Ebanos Ranch,
Mexico (Mexico, n = 14, Fig. 1). Thirteen ocelots originated from
outside of the primary populations. These included the following
areas in Texas: (1) Santa Anna National Wildlife Refuge
(SANWR), Hidalgo County (live-capture 1992, n = 1); (2) Port
Brownsville, Cameron County (live-capture 1998, n= 1); (3) Port
Mansfield (road kills 1993 and 2004, n= 2); (4) Lyford, Willacy
County (road kill 1996, n= 1); (5) Sarita, Kenedy County (road
kills 1990 and 1997, n= 2); and (6) Highway 186, Willacy County
(road kill 1999, n= 1). Five ocelots were from two areas near
Abasolo, Tamaulipas, Mexico: (1) Miradores (live-capture 1992
and 1994, n= 2) and (2) Los Zoyates (live-capture 1994, n = 3).
Ethics StatementThere were no live animals trapped or handled during this
study. All samples from live animals represented archival material
collected by either Texas A&M University-Kingsville or Laguna
Atascosa National Wildlife Refuge during previous research
projects. Please refer to the original publications to obtain
information on the trapping and handling of ocelots [8,13–
15,40,41].
DNA ExtractionTotal DNA was extracted from museum specimens using a
PureGene DNA extraction kit (Gentra Systems, Minneapolis,
Minnesota, United States). Ten to 20 mg of crushed bone or diced
skin was placed in 600 ml of Cell Lysis Solution, 3 ml of ProteinaseK (20 mg/ml) was added, and the tubes were inverted 25X.
Samples were incubated at 55uC for 3 days with the addition of
1.5 ml of Proteinase K every 24 hrs. Tubes were periodically
inverted. After incubation, 3 ml of RNase Solution (4 mg/ml) was
added, tubes were inverted 25X, and incubated for 15 min at
37uC. Samples were cooled to 4uC for 10 min and 200 ml ProteinPrecipitation Solution was added. Tubes were then vortexed for
20 sec and centrifuged at 16,000 g for 5 min. The supernatant
was pipetted into 600 ml of 100% isopropanol with 1 ml of
glycogen. Tubes were inverted 50X and centrifuged at 16,000 g
for 3 min to pellet the DNA. The isopropanol was decanted and
tubes were inverted on clean absorbent filter paper. The DNA
pellet was washed with 600 ml of 70% ethanol, inverted 3X, and
centrifuged at 16,000 g for 1 min. Ethanol was decanted, tubes
were inverted on clean absorbent filter paper, and air dried for
20 min. The DNA pellet was hydrated in 40 ml of DNA Hydration
Solution at 65uC for 1 h and stored at 4uC.
Precautions Taken with Museum SamplesAll DNA extractions and PCR preparations of museum samples
were conducted in a lab dedicated to genetic analyses of museum
samples and physically separated from areas where work with
modern DNA was performed. There were no contemporary
samples of any species present in the museum lab. The equipment
used for the museum samples, including pipetmen, centrifuge,
refrigerator, freezer, tube racks, and heat blocks was either new, or
decontaminated and subsequently used solely for museum work.
Prior to each extraction or PCR preparation, all surfaces, bench
tops, and equipment were cleaned with 20% bleach. Irradiation
from a UV hood lamp was then used to destroy any remaining
potential DNA contaminants on tubes, tips, racks, and pipetmen.
Personnel working with ancient DNA wore clothes and shoes not
previously worn in a laboratory where modern DNA was handled.
Aerosol tips were used for all extractions and PCR preparations,
which were performed in a UV sterilized hood. Negative controls
were included with every extraction and monitored to ensure that
no trace contamination was present.
We did not repeat the sequencing or genotyping of museum
samples; however, the following evidence suggests that we had
data of sufficient quality for analysis: (1) We did not observe any
contamination in negative controls. (2) The two new haplotypes
observed in museum samples were never previously detected in
contemporary samples and were sequenced from both strands. (3)
We detected microsatellite alleles in museum samples that were
not previously observed in contemporary samples. (4) We did not
observe any genotypes with more than 2 alleles, which would have
suggested cross-contamination. (5) For low quality DNA samples
Loss of Genetic Diversity among Ocelots in the US
PLOS ONE | www.plosone.org 2 February 2014 | Volume 9 | Issue 2 | e89384
the most common errors are PCR failure and allele drop out, both
of which would reduce diversity observed in museum samples;
therefore, our study provides a conservative estimate of historical
ocelot variation.
MtDNA SequencingMitochondrial sequence data for museum specimens were
generated during this study (Table S1). Sequence data for
contemporary samples were from Janecka et al. [11]. A 436-base
pair (bp) fragment of the mtDNA control region was amplified
using the polymerase chain reaction (PCR) and primers CCR-F
and CCR-R [42] modified to complement the ocelot sequence
(CCR-OCELOT-F: 59CTCAACTATCCGAAAGAGCTT;
CCR-OCELOT-R: 59CCTGTGGAACATTAGGAATT) [43].
After the sequences were trimmed of primers and low quality
bases, the remaining 418-bp segment spanned positions 16,811 to
17,009 and 1 to 226 of the domestic cat (Felis silvestris catus)
mitochondrial genome FCU20753. This is located in the central
conserved region between repetitive sequences I and II [42,44].
The precautions taken to ensure that all sequences obtained
from museum samples were not contaminants are described in the
section above. We performed PCR amplification in 10 ml volumes
Figure 1. Map showing primary localities examined during this study, the dates samples were collected, and the number ofsamples. Contemporary populations are identified with solid dots and the localities where museum specimens originated are underlined andmarked with a star.doi:10.1371/journal.pone.0089384.g001
Loss of Genetic Diversity among Ocelots in the US
PLOS ONE | www.plosone.org 3 February 2014 | Volume 9 | Issue 2 | e89384
containing 0.2 mM of each dNTP, 1X PCR HotMaster Taq buffer
(Eppendorf, Hamburg, Germany), 0.25 units of HotMaster Taq,
0.25 mM of forward primer, 0.25 mM of reverse primer, 0.1 mg/1 ml bovine serum albumin (New England Biolabs, Ipswich,
Massachusetts, United States), and 10–20 ng DNA template.
Reaction conditions included an initial denaturing step of 94uC for
1 min followed by 50 cycles of 94uC for 15 sec, 54uC for 30 sec,
72uC for 60 sec, and a final extension step of 72uC for 2 min. PCR
products were sequenced using an ABI BigDye v. 1.1 Terminator
Kit (Applied Biosystems, Foster City, California, United States)
and an ABI 3100 automated sequencer by the Laboratory of Plant
Genomics and Technology or an ABI3730 in the Molecular
Cytogenetics and Genomics Laboratory, Texas A&M University.
Sequences were obtained in both directions, then aligned and
edited using SEQUENCHER v. 3.0 (Gene Codes Corporation,
Ann Arbor, Michigan, United States).
Microsatellite GenotypingEleven microsatellite loci (FCA008, FCA023, FCA035,
FCA043, FCA045, FCA077, FCA082, FCA096, FCA105,
FCA117, and FCA126) previously isolated and mapped in the
domestic cat were used [45]. In this study, genotyping data were
generated for museum specimens and three additional loci
(FCA043, FCA096 and FCA105) for contemporary Mexico
samples (Table S1). Remaining microsatellite genotypes were
from Janecka et al. [11,12]. PCR reactions were conducted in
10 ml reaction volumes containing 0.2 mM of each dNTP, 1X
PCR HotMaster Taq buffer, 0.25 units of HotMaster Taq,
0.24 mM forward primer, 0.24 mM reverse primer, 0.1 mg/mlbovine serum albumin, and 5–20 ng DNA template. Conditions
for PCR amplification included an initial denaturing step of 94uCfor 1 min, 50 cycles of 94uC for 30 sec, 53uC for 30 sec, 72uC for
60 sec, and a final extension step of 72uC for 2 min. PCR products
were visualized on a 1.2% agarose gel stained with ethidium
bromide (0.5 mg/ml) and then exposed to ultraviolet light.
Samples with visible PCR product were genotyped with an ABI
3100 automated sequencer in the Laboratory of Plant Genomics
and Technology and sized using GENOTYPER v. 2.0 (Applied
Biosystems).
MtDNA Data AnalysisSequence alignments were performed in CLUSTAL-X [46],
and population statistics including the number of variable sites,
haplotype diversity (H), nucleotide diversity (p) and mean number
of nucleotide differences were calculated in DNASP v. 4.10.8 [47].
A minimum spanning network of haplotypes was constructed in
ARLEQUIN v. 3.0 [48] and plotted to represent relationships
among haplotypes. Tests for departure of haplotype frequencies
from neutrality were performed using Tajima’s D test and Fu and
Li’s D test in DNASP [49,50].
Two methods were used to compare mtDNA variation in ocelot
populations. An exact test for population differentiation based on
haplotype frequencies was implemented in ARLEQUIN. Popula-
tion structure was tested using pairwise Fst estimates in
ARLEQUIN. Estimates of Fst were tested for significance against
the null distribution of Fst values obtained from 1,000 permuta-
tions of haplotypes under the null model of panmixia in
ARLEQUIN.
Microsatellite Data AnalysisMeasures of genetic variability, including expected heterozy-
gosity (He), observed heterozygosity (Ho), number of alleles (AN),
and number of private alleles (AP1) were estimated using
GENALEX v. 6.0 [51]. GENEPOP v. 3.1 [52] was used to test
for linkage disequilibrium and Hardy-Weinberg equilibrium
(HWE). Populations were tested for deviations from equilibrium
at each locus and across all loci in GENALEX. Bonferroni
corrections were applied to comparisons involving multiple tests
for HWE and linkage disequilibrium [53]. Allelic richness (AR1)
was estimated in FSTAT v. 2.3.9 and using the rarefaction
approach (AR2) in HP-RARE v. 1.1 [54,55]. Private alleles (AP2)
were also estimated using the rarefaction approach in HP-RARE
to take into account different sample sizes. Pairwise Fst between
populations was estimated using AMOVA analysis and tested for
significance with 9,999 permutations in GENALEX.
Results
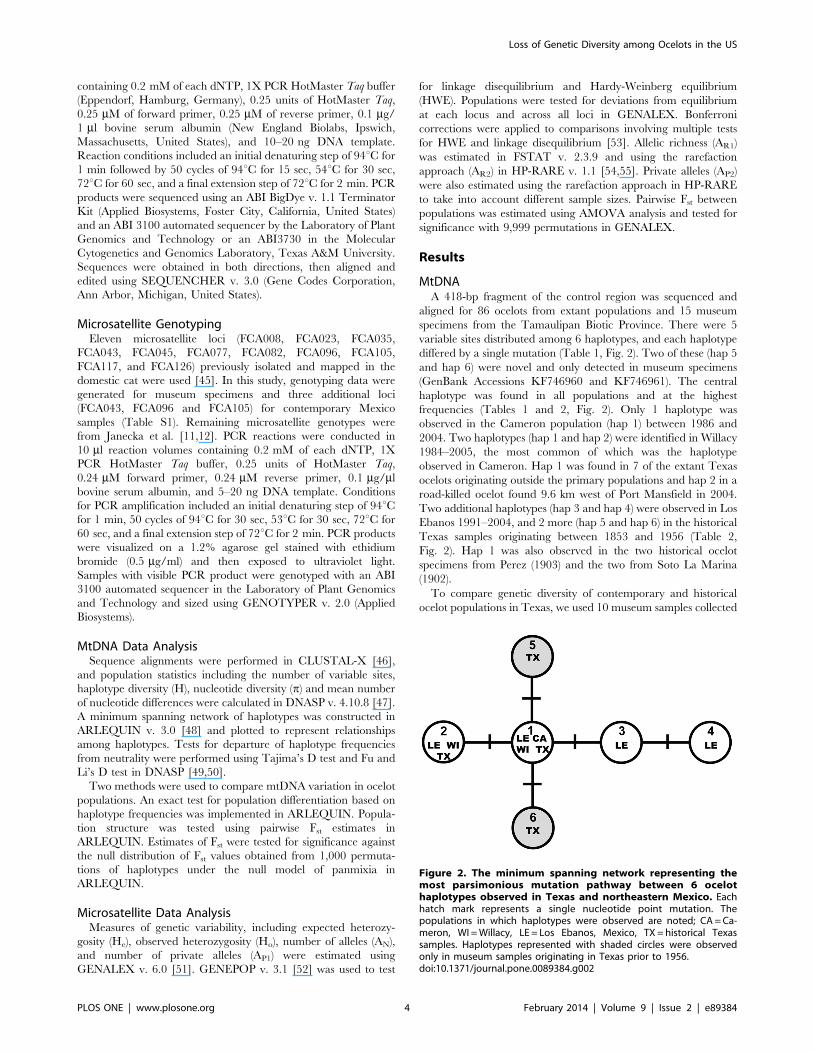
MtDNAA 418-bp fragment of the control region was sequenced and
aligned for 86 ocelots from extant populations and 15 museum
specimens from the Tamaulipan Biotic Province. There were 5
variable sites distributed among 6 haplotypes, and each haplotype
differed by a single mutation (Table 1, Fig. 2). Two of these (hap 5
and hap 6) were novel and only detected in museum specimens
(GenBank Accessions KF746960 and KF746961). The central
haplotype was found in all populations and at the highest
frequencies (Tables 1 and 2, Fig. 2). Only 1 haplotype was
observed in the Cameron population (hap 1) between 1986 and
2004. Two haplotypes (hap 1 and hap 2) were identified in Willacy
1984–2005, the most common of which was the haplotype
observed in Cameron. Hap 1 was found in 7 of the extant Texas
ocelots originating outside the primary populations and hap 2 in a
road-killed ocelot found 9.6 km west of Port Mansfield in 2004.
Two additional haplotypes (hap 3 and hap 4) were observed in Los
Ebanos 1991–2004, and 2 more (hap 5 and hap 6) in the historical
Texas samples originating between 1853 and 1956 (Table 2,
Fig. 2). Hap 1 was also observed in the two historical ocelot
specimens from Perez (1903) and the two from Soto La Marina
(1902).
To compare genetic diversity of contemporary and historical
ocelot populations in Texas, we used 10 museum samples collected
Figure 2. The minimum spanning network representing themost parsimonious mutation pathway between 6 ocelothaplotypes observed in Texas and northeastern Mexico. Eachhatch mark represents a single nucleotide point mutation. Thepopulations in which haplotypes were observed are noted; CA=Ca-meron, WI =Willacy, LE = Los Ebanos, Mexico, TX =historical Texassamples. Haplotypes represented with shaded circles were observedonly in museum samples originating in Texas prior to 1956.doi:10.1371/journal.pone.0089384.g002
Loss of Genetic Diversity among Ocelots in the US
PLOS ONE | www.plosone.org 4 February 2014 | Volume 9 | Issue 2 | e89384

in Texas and 1 ocelot museum specimen from Matamoros
(Figure 1). Brownsville and Matamoros are cities on either side of
the Rio Grande and represent the same area. Therefore, the
specimen from Matamoros was included among the historical
Texas samples. The highest levels of haplotype and nucleotide
diversity were observed in Los Ebanos (H= 0.733, SD=0.012;
p=0.00282, SD=0.00066) sampled between 1991 and 1998
(Table 1). Levels of genetic diversity in historical Texas ocelots
1853–1956 (H=0.673, SD=0.123; p=0.00191, SD=0.00049)
were comparable to those from the extant Los Ebanos population.
In Willacy, haplotype diversity decreased from H=0.536
(SD=0.123) in 1984–1990, to H=0.233 (SD=0.126) in 1994–
1998, and to H=0 in 2005 (Table 1). Nucleotide diversity in
Willacy was p=0.00128 (SD=0.00029) in 1984–1990 and
decreased to p=0.00056 (SD=0.00023) in 1994–1998 and to
p=0 in 2005 (Table 1).
Estimates of haplotype diversity in Los Ebanos, historical Texas
samples, and Willacy 1984–1990 were not significantly different.
However, haplotype diversity of the Willacy population in 1994–
1998 was significantly lower than in Los Ebanos (P,0.05).
Nucleotide diversity of the Los Ebanos population was also
significantly higher than the other populations sampled (P,0.05).
The historical samples from Texas had higher nucleotide diversity
than the contemporary Willacy and Cameron populations.
The greatest level of genetic differentiation was between the
Cameron 1996–1998 and Los Ebanos 1991–1998 populations
with Fst = 0.159 (P= 0.028) (Table 3). The lowest level of
differentiation was between the Willacy 1994–1998 and historical
Texas samples 1853–1956 with Fst =20.025 (P=0.357). Haplo-
type frequencies of the historical Texas samples were most similar
Table 1. Mitochondrial control region diversity of ocelots in Texas and Mexico.
Location Date Na VSb Haplotypes Hc SDd pe SD
All Ocelots 1853–2005 101 5 hap 1, 2, 3, 4, 5, 6 0.426 0.084 0.00127 0.00030
Contemporary Ocelots Sampled
Texas/Mexico 1986–2005 86 3 hap 1, 2, 3, 4 0.254 0.060 0.00077 0.00020
Texas - Combined 1986–2005 68 1 hap 1, 2 0.163 0.057 0.00039 0.00014
Cameron - Combined 1986–2005 26 0 hap 1 0 0 0 0
Cameron 1986–1989 11 0 hap 1 0 0 0 0
1996–1998 10 0 hap 1 0 0 0 0
2004–2005 5 0 hap 1 0 0 0 0
Willacy - Combined 1984–2005 34 1 hap 1, 2 0.258 0.009 0.00062 0.00021
Willacy 1984–1990 8 1 hap 1, 2 0.536 0.123 0.00128 0.00029
1994–1998 16 1 hap 1, 2 0.233 0.126 0.00056 0.00023
2005 10 0 hap 1 0 0 0 0
Other areas in Texasf 1990–2004 8 1 hap 1,2 0.250 0.180 0.00060 0.00043
Mexico - Los Ebanos 1991–1998 10 3 hap 1, 2, 3, 4 0.733 0.012 0.00282 0.00066
2001–2004 3 1 hap 1, 2 0.667 0.314 0.00319 0.00015
Other areas in Mexicog 1992–1994 5 1 hap 1 0 0 0 0
Historical Ocelots Sampled
Texas/Mexico 1853–1956 15 3 hap 1, 2, 5, 6 0.543 0.133 0.00146 0.00043
Texas 1853–1956 11 3 hap 1, 2, 5, 6 0.673 0.123 0.00191 0.00049
Mexico 1902–1903 4 0 hap 1 0 0 0 0
Number of variable sites, haplotypes, haplotype diversity, and nucleotide diversity for a 418-bp segment of the mitochondrial control region for 3 contemporary ocelotpopulations and historical ocelots sampled with museum specimens.aN =Number of samples.bVS =Variable sites.cH =Haplotype diversity.dSD= Standard deviation.ep=Nucleotide diversity.fAreas sampled outside of the two primary Texas populations including Santa Anna National Wildlife Refuge, Port Brownsville, Port Mansfield, Lyford, Sarita, andHighway 186 in Willacy County.gAreas sampled outside of the primary Mexico population including Los Zoyates and Miradores.doi:10.1371/journal.pone.0089384.t001
Table 2.MtDNA haplotype frequencies in ocelot populations.
Relative Frequency
Contemporary Historical
Haplotype Cameron Willacy Los Ebanos Mexico Texas
1 1.000 0.846 0.500 1.000 0.545
2 0 0.154 0.100 0 0.273
3 0 0 0.200 0 0
4 0 0 0.200 0 0
5 0 0 0 0 0.091
6 0 0 0 0 0.091
Haplotype frequencies in contemporary (1984–2005) and historical ocelotpopulations (Mexico 1902–1903 and Texas 1853–1956). Cameron and Willacyare counties in Texas, and Los Ebanos is in southern Tamaulipas, Mexico.doi:10.1371/journal.pone.0089384.t002
Loss of Genetic Diversity among Ocelots in the US
PLOS ONE | www.plosone.org 5 February 2014 | Volume 9 | Issue 2 | e89384
to the Willacy population and most divergent from the Cameron
population.
Microsatellite DataEleven microsatellite loci were genotyped in the historical
specimens and compared to contemporary samples. The micro-
satellite data set was archived in DRYAD. However, not all loci
were successfully genotyped in every museum sample; therefore,
data from only a mean of 5 samples per locus were obtained.
Genotypes for the same 11 loci were also obtained for a subset of
ocelots from contemporary populations (Table 4). After Bonferroni
correction, all loci were in HWE and showed no linkage
disequilibrium. Two loci were monomorphic in the Cameron
population (FCA043 and FCA096). All loci were polymorphic in
the other two extant populations and in historical samples.
Mean number of alleles was lowest in Cameron (AN= 2.46,
SE=0.37) and highest in Los Ebanos (AN= 4.36, SE=0.36;
Tables 4 and 5). Number of alleles in the historical Texas samples
(A= 3.82, SE=0.33) were comparable to Los Ebanos. Mean
number of alleles was not significantly different between Cameron
and Willacy; however, both were significantly (P,0.05) different
from Los Ebanos and the historical Texas samples. The number of
alleles was not significantly different between Los Ebanos and
historical Texas samples. Allelic richness estimated directly from
the population samples and using the rarefaction method in Texas
was highest in the historical population and lowest in Cameron
(Table 4). There were no private alleles in the Cameron
population, but there were 3 in Willacy (Table 4). In contrast,
11 alleles in the historical samples from Texas were not observed
in any contemporary population. The greatest number of private
alleles, 15, was observed in Mexico (Table 4). The estimated
private alleles based on rarefaction were also lowest in the two
contemporary Texas populations (Table 4).
Estimates of He for historical populations of ocelot in Texas
were similar to those observed in Los Ebanos, Mexico (Tables 4
and 5). Cameron had significantly lower He (P,0.05). In the
Texas historical sample, He was also significantly higher than in
Willacy (P.0.05). With only a mean of 5 samples per locus, the
sample size for the historical population was not high enough to
allow rigorous tests for genetic divergence. However, pair-wise Fstwas estimated between each population to examine the consis-
tency of the microsatellite data set with the mtDNA data. The
most divergent populations were Cameron and historical Texas,
with Fst = 0.367 (P,0.001), and the lowest divergence was between
Willacy and Los Ebanos with Fst = 0.146 (P,0.001) (Table 6).
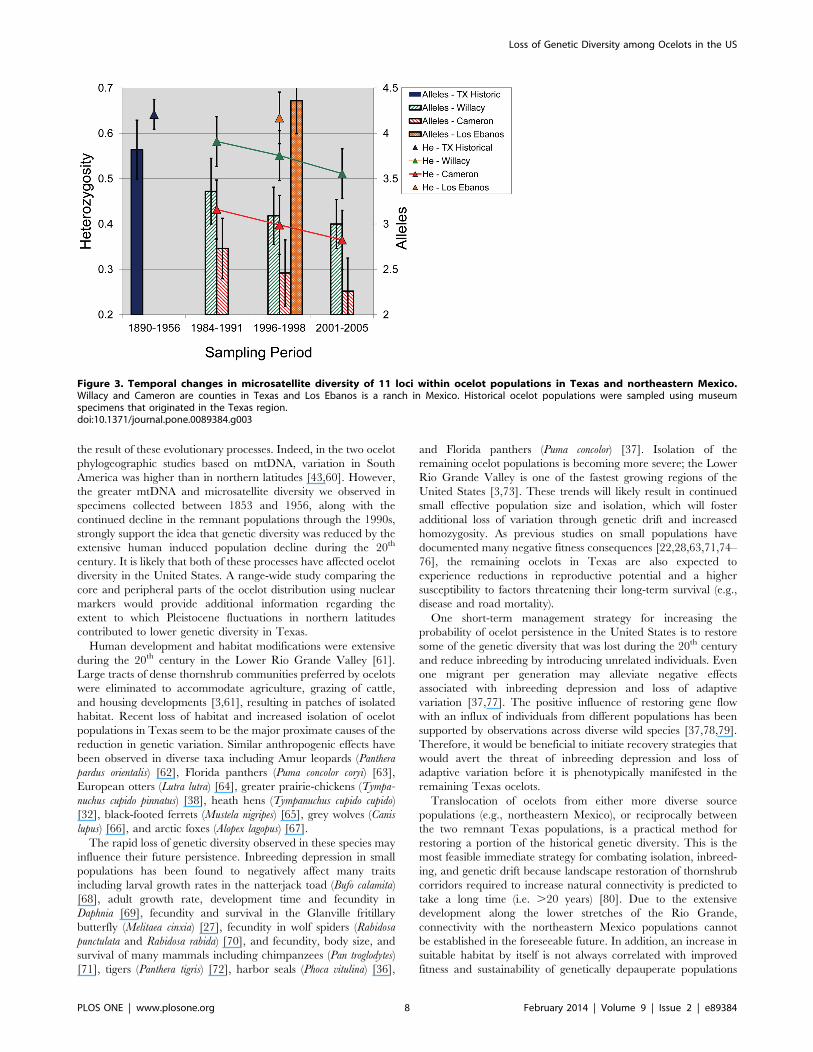
Change in Diversity from Mid-1980s to 2005We also examined temporal microsatellite variation between
1986 and 2005 in the two remaining Texas populations. Samples
from each of the areas were separated into 3 temporal groups:
Cameron (1) 1986–1989, n= 10, (2) 1996–1998, n= 10, and (3)
2001–2005, n=10 and Willacy (1) 1984–1991, n = 8, (2) 1996–
1998, n= 10, and (3) 2001–2005, n = 10. There was a reduction in
both allele number and He in each of the populations (Figure 3).
Cameron initially had He= 0.432 and AN= 2.73, but in more
recent samples the estimates dropped to He = 0.365 and
AN=2.36. The Willacy population showed a similar pattern, with
initial He = 0.582 and AN= 3.36 reducing to He = 0.511 and
AN=3.00. During each respective period, variation in Willacy was
higher than in Cameron.
Table 3. Levels of mtDNA population differentiation amongocelots.
Cameron WillacyLos Ebanos,Mexico
TexasHistorical
Cameron – 0.485 0.028*** 0.857
Willacy 0.055 – 0.065 0.357
Los Ebanos,Mexico
0.159 0.060 – 0.229
Texas Historical 0.108 20.025 0.039 –
Estimates of population differentiation derived from mtDNA control region. Thebottom left of the matrix shows pairwise Fst estimates. The top right of thematrix shows P-values for the exact test for genetic differentiation usinghaplotype frequencies. Significant values are noted with asterisks (i.e. ***).doi:10.1371/journal.pone.0089384.t003
Table 4. Microsatellite variation among ocelots from Texas and Mexico.
Locality Date Sampled Na Pb Hec SEd AN
e SE AR1f AR2
g AP1h AP2
i
All Samples 1890–2005 68 1.00 0.607 0.050 6.36 0.56 2.97 n/a n/a
Cameron 1996–2005 26 0.82 0.389 0.078 2.46 0.37 1.82 2.24 0 0.10
Willacy 1996–2005 23 1.00 0.561 0.042 3.18 0.33 2.35 2.86 3 0.26
Los Ebanos 1994–1998 10 1.00 0.634 0.058 4.36 0.36 3.08 3.85 15 1.26
Texas Historical 1890–1935 9j 1.00 0.642 0.034 3.82 0.33 3.13 3.70 11 1.06
Measures of genetic variation of 11 microsatellite loci among contemporary ocelots sampled in Texas (Willacy and Cameron), northeastern Mexico (Los Ebanos) andocelot museum specimens collected in the region (Texas Historical).aN = Sample size.bP = Polymorphic loci.cHe = Expected heterozygosity.dSE = Standard error.eAN =Number of alleles.fAR1 = Allelic richness estimated in FSTAT.gAR2 = Allelic richness estimated using rarefaction to account for samples size differences in HP-RARE.hAP1 = Private alleles.iAP2 = Private alleles estimated using rarefaction to account for samples size differences in HP-RARE.jDue to PCR failure the mean number samples per locus in museum specimens for which genotypes were obtained was 5.doi:10.1371/journal.pone.0089384.t004
Loss of Genetic Diversity among Ocelots in the US
PLOS ONE | www.plosone.org 6 February 2014 | Volume 9 | Issue 2 | e89384
Discussion
Comparisons of contemporary ocelot populations to historical
specimens provided strong evidence for a loss of genetic diversity
in Texas over the last 100 years. The historical Texas population
examined had haplotype and nucleotide diversity comparable to a
contemporary population in northern Mexico, and substantially
higher than what remains in Texas. Two of the haplotypes
observed in museum specimens were no longer detected among
extant ocelots. By the 1980s, the federally protected Cameron
population at Laguna Atascosa National Wildlife Refuge lost all
variability at the mtDNA control region sequenced in this study.
The population on private lands in Willacy County still retained 2
haplotypes through mid-1990s; however, by 2005 it was also fixed
for the haplotype present in Cameron. These observations are
consistent with the small effective population size previously
estimated in Texas circa 1995 (Ne,14 in Cameron and Ne,4 in
Willacy) [12] and complete population isolation [11]. In contrast,
ocelots in northeastern Mexico retained historical levels of mtDNA
diversity through 2004, suggesting larger ocelot populations south
of the United States.
The mtDNA haplotype no longer detected in either the Willacy
or Cameron populations was last observed in a road-killed ocelot
near Port Mansfield in 2004. This suggests that there may be
habitat in southern Texas adjacent to the known populations
harboring ocelots with more variation. The Willacy population
resides on the western and southern edge of large ranches that
have retained more native thornshrub habitat than areas
surrounding the Laguna Atascosa National Wildlife Refuge in
Cameron County. These private lands are critical for ocelot
recovery in the United States.
The microsatellites examined also depict genetic erosion in
Texas during the 20th century. Genotyping of museum samples
presents difficulties because of the degradation and low quantity of
DNA extracted from some specimens [56]. We unfortunately had
poor success, and as a consequence, the number of loci scored in
historical samples was low. Nevertheless, despite having genotypes
for a mean of only 5 ocelot specimens per locus, genetic diversity
was historically higher than in contemporary Texas populations. A
substantial number of alleles have disappeared. As with mtDNA
haplotypes, the remnant Texas populations continued to lose
microsatellite diversity through 2005. Cameron exhibited an 18%
reduction in He and Willacy had a 14% reduction. This further
corroborates that ocelots in Texas continue to experience genetic
drift and inbreeding as a result of small effective population size
and isolation [12].
Lower levels of neutral genetic diversity have been observed in
peripheral populations subjected to island effects during range
contractions and expansions [57,58] and for mammal populations
at higher latitudes [59]. The lower genetic diversity observed
previously in Texas ocelot populations [11,12,43] could have been
Table 5. Genetic diversity of individual microsatellite loci in ocelots from Texas and Mexico.
Cameron, Texas Willacy, Texas Los Ebanos, Mexico Texas Historical (1853–1935)
Locus Na ANb Ho
c Hed FIS
e N AN Ho He Fis N AN Ho He Fis N AN Ho He Fis
FCA008 26 4 0.73 0.73 20.01 23 4 0.83 0.71 20.16 10 4 0.80 0.67 20.19 5 3 0.40 0.58 0.31
FCA023 26 2 0.27 0.33 0.19 23 2 0.57 0.47 20.21 10 2 0.10 0.10 20.05 5 4 0.60 0.66 0.09
FCA035 26 3 0.65 0.55 20.19 23 4 0.83 0.65 20.28 10 6 0.80 0.80 0.00 5 5 0.40 0.74 0.46
FCA043 26 1 0.00 0.00 n/a 23 2 0.43 0.42 20.03 9 5 0.56 0.59 0.05 9 4 0.22 0.44 0.50
FCA045 25 2 0.48 0.40 20.19 23 3 0.83 0.64 20.30 9 4 0.56 0.70 0.20 5 4 0.20 0.74 0.73
FCA077 26 2 0.27 0.23 20.16 23 3 0.43 0.55 0.21 10 5 0.70 0.71 0.01 3 4 0.67 0.72 0.08
FCA082 26 3 0.54 0.57 0.05 23 4 0.83 0.66 20.26 9 4 1.00 0.66 20.51 3 2 0.33 0.50 0.33
FCA096 26 1 0.00 0.00 n/a 23 2 0.26 0.29 0.09 10 3 0.50 0.59 0.15 5 3 0.80 0.54 20.48
FCA105 26 2 0.27 0.23 20.16 22 2 0.64 0.50 20.28 10 6 0.60 0.78 0.23 3 4 0.67 0.72 0.08
FCA117 25 2 0.52 0.50 20.05 23 4 0.61 0.54 20.14 10 4 0.40 0.70 0.43 5 3 0.40 0.62 0.35
FCA126 26 5 0.88 0.74 20.19 23 5 0.87 0.76 20.14 10 5 0.90 0.70 20.29 7 6 0.71 0.80 0.10
Mean 26 2.5 0.42 0.39 20.08 23 3.2 0.65 0.56 20.14 10 4.4 0.63 0.63 0.00 5 3.8 0.49 0.64 0.23
SE 0.1 0.4 0.08 0.08 0.04 0.1 0.8 0.06 0.04 0.05 0.1 0.3 0.08 0.06 0.08 0.5 0.3 0.06 0.03 0.10
Genetic diversity estimates for microsatellites genotyped in two contemporary ocelot Texas populations, one contemporary Mexico population, and historical ocelotsamples.aN =Number of individuals genotyped for each locus.bAN =Number of alleles observed.cHo =Observed heterozygosity.dHe = Expected heterozygosity.eFis = Inbreeding coefficient.doi:10.1371/journal.pone.0089384.t005
Table 6. Pairwise Fst values estimated from microsatellitedata for 3 contemporary ocelot populations in Texas(Cameron and Willacy) and Mexico (Los Ebanos) and ocelotmuseum specimens collected in that region (Texas Historical).
Cameron WillacyLos Ebanos,Mexico
TexasHistorical
Cameron – ,0.001 ,0.001 ,0.001
Willacy 0.181 – ,0.001 ,0.001
Los Ebanos,Mexico
0.330 0.146 – ,0.001
Texas Historical 0.367 0.241 0.186 –
The P-values based on 9,999 permutations are above the diagonal.doi:10.1371/journal.pone.0089384.t006
Loss of Genetic Diversity among Ocelots in the US
PLOS ONE | www.plosone.org 7 February 2014 | Volume 9 | Issue 2 | e89384
the result of these evolutionary processes. Indeed, in the two ocelot
phylogeographic studies based on mtDNA, variation in South
America was higher than in northern latitudes [43,60]. However,
the greater mtDNA and microsatellite diversity we observed in
specimens collected between 1853 and 1956, along with the
continued decline in the remnant populations through the 1990s,
strongly support the idea that genetic diversity was reduced by the
extensive human induced population decline during the 20th
century. It is likely that both of these processes have affected ocelot
diversity in the United States. A range-wide study comparing the
core and peripheral parts of the ocelot distribution using nuclear
markers would provide additional information regarding the
extent to which Pleistocene fluctuations in northern latitudes
contributed to lower genetic diversity in Texas.
Human development and habitat modifications were extensive
during the 20th century in the Lower Rio Grande Valley [61].
Large tracts of dense thornshrub communities preferred by ocelots
were eliminated to accommodate agriculture, grazing of cattle,
and housing developments [3,61], resulting in patches of isolated
habitat. Recent loss of habitat and increased isolation of ocelot
populations in Texas seem to be the major proximate causes of the
reduction in genetic variation. Similar anthropogenic effects have
been observed in diverse taxa including Amur leopards (Panthera
pardus orientalis) [62], Florida panthers (Puma concolor coryi) [63],
European otters (Lutra lutra) [64], greater prairie-chickens (Tympa-
nuchus cupido pinnatus) [38], heath hens (Tympanuchus cupido cupido)
[32], black-footed ferrets (Mustela nigripes) [65], grey wolves (Canis
lupus) [66], and arctic foxes (Alopex lagopus) [67].
The rapid loss of genetic diversity observed in these species may
influence their future persistence. Inbreeding depression in small
populations has been found to negatively affect many traits
including larval growth rates in the natterjack toad (Bufo calamita)
[68], adult growth rate, development time and fecundity in
Daphnia [69], fecundity and survival in the Glanville fritillary
butterfly (Melitaea cinxia) [27], fecundity in wolf spiders (Rabidosa
punctulata and Rabidosa rabida) [70], and fecundity, body size, and
survival of many mammals including chimpanzees (Pan troglodytes)
[71], tigers (Panthera tigris) [72], harbor seals (Phoca vitulina) [36],
and Florida panthers (Puma concolor) [37]. Isolation of the
remaining ocelot populations is becoming more severe; the Lower
Rio Grande Valley is one of the fastest growing regions of the
United States [3,73]. These trends will likely result in continued
small effective population size and isolation, which will foster
additional loss of variation through genetic drift and increased
homozygosity. As previous studies on small populations have
documented many negative fitness consequences [22,28,63,71,74–
76], the remaining ocelots in Texas are also expected to
experience reductions in reproductive potential and a higher
susceptibility to factors threatening their long-term survival (e.g.,
disease and road mortality).
One short-term management strategy for increasing the
probability of ocelot persistence in the United States is to restore
some of the genetic diversity that was lost during the 20th century
and reduce inbreeding by introducing unrelated individuals. Even
one migrant per generation may alleviate negative effects
associated with inbreeding depression and loss of adaptive
variation [37,77]. The positive influence of restoring gene flow
with an influx of individuals from different populations has been
supported by observations across diverse wild species [37,78,79].
Therefore, it would be beneficial to initiate recovery strategies that
would avert the threat of inbreeding depression and loss of
adaptive variation before it is phenotypically manifested in the
remaining Texas ocelots.
Translocation of ocelots from either more diverse source
populations (e.g., northeastern Mexico), or reciprocally between
the two remnant Texas populations, is a practical method for
restoring a portion of the historical genetic diversity. This is the
most feasible immediate strategy for combating isolation, inbreed-
ing, and genetic drift because landscape restoration of thornshrub
corridors required to increase natural connectivity is predicted to
take a long time (i.e. .20 years) [80]. Due to the extensive
development along the lower stretches of the Rio Grande,
connectivity with the northeastern Mexico populations cannot
be established in the foreseeable future. In addition, an increase in
suitable habitat by itself is not always correlated with improved
fitness and sustainability of genetically depauperate populations
Figure 3. Temporal changes in microsatellite diversity of 11 loci within ocelot populations in Texas and northeastern Mexico.Willacy and Cameron are counties in Texas and Los Ebanos is a ranch in Mexico. Historical ocelot populations were sampled using museumspecimens that originated in the Texas region.doi:10.1371/journal.pone.0089384.g003
Loss of Genetic Diversity among Ocelots in the US
PLOS ONE | www.plosone.org 8 February 2014 | Volume 9 | Issue 2 | e89384
[78,79]. In a habitat-based population viability analysis model,
partnering the augmentation of Texas populations via transloca-
tions with the reduction of road mortality by constructing culverts
was an effective short-term strategy for decreasing ocelot
extinction probability [10].
Northeastern Mexico is the most appropriate source of
individuals for translocations to Texas based on the higher genetic
diversity, ecological similarity between these localities, and their
close phylogenetic relationship [11,43]. A previous mtDNA study
found parts of Central America also appear to be in the same
Evolutionary Significant Unit (ESU) as Texas and Mexico, despite
being currently classified as different subspecies [43]. Therefore, if
ocelots from Mexico are not available for translocations, then
other potential sources could include Central American countries
in this ESU, such as Belize. However, this phylogeographic
analysis was based on mtDNA; therefore, the ocelot ESU
designations need to be corroborated with nuclear markers.
Reciprocal translocations between the Willacy and Cameron
populations should be implemented immediately because this
would mimic natural connectivity, reduce inbreeding and drift,
and restore a substantial amount of historical variation, while
being financially, logistically, and politically more feasible than
translocations from foreign countries. The endangered ocelot is
the last Neotropical felid that still has viable breeding populations
in the United States. Management strategies should incorporate
restoration of genetic diversity and population connectivity to
ensure persistence and expansion of these remnant populations in
order to achieve recovery of the ocelot in its northernmost range
country.
Supporting Information
Table S1 Information on the ocelot museum specimenssampled during this study.(XLSX)
Acknowledgments
We thank Mr. Yturria for access to his ranch, the Smithsonian Institution
for loaning ocelot samples, and Robert D. Fisher (Smithsonian Institution)
for his assistance with sampling the specimens. This is publication # 13–
118 of the Caesar Kleberg Wildlife Research Institute and #712 of the
Rob & Bessie Welder Wildlife Foundation.
Author Contributions
Conceived and designed the experiments: JJ MT RH. Performed the
experiments: JJ AC LL. Analyzed the data: JJ AC LL. Contributed
reagents/materials/analysis tools: JJ MT LL RH. Wrote the paper: JJ MT
AC LL LG RH.
References
1. Sunquist ME, Sunquist F (2002) Wild cats of the World. Chicago, Illinois:
Univesity of Chicago Press.
2. USFWS (1999) Endangered and Threatened Wildlife and Plants. Washington
DC.
3. Tewes ME, Everett DD (1986) Status and distribution of the endangered ocelot
and jaguarundi in Texas. In: Miller SD, Everett DD, editors. Cats of the World:
Biology, Conservation, and Management Washington, D.C.: National Wildlife
Federation. 147–158.
4. Murray JL, Gardner GL (1997) Leopardus pardalis. Mammalian Species 548: 1–
10.
5. Haines AM, Grassman LI, Tewes ME, Janecka JE (2006) First ocelot (Leopardus
pardalis) monitored with GPS telemetry. European Journal of Wildlife Research
52: 216–218.
6. Haines AM, Janecka JE, Tewes ME, Grassman LI (2006) Surveying for the
endangered ocelot Leopardus pardalis in the United States using camera traps.
Oryx 40: 1–5.
7. Haines AM, Janecka JE, Tewes ME, Grassman LI, Morton P (2006) The
importance of private lands for ocelot Leopardus pardalis conservation in the
United States. Oryx 40: 90–94.
8. Haines AM, Tewes ME, Laack LL (2005) Survival and sources of mortality in
ocelots. Journal of Wildlife Management 69: 255–263.
9. Haines AM, Tewes ME, Laack LL, Grant WE, Young J (2005) Evaluating
recovery strategies for an ocelot (Leopardus pardalis) population in the United
States. Biological Conservation 126: 512–522.
10. Haines AM, Tewes ME, Laack LL, Horne JS, Young JH (2006) A habitat-based
population viability analysis for ocelots (Leopardus pardalis) in the United States.
Biological Conservation 132: 424–436.
11. Janecka JE, Tewes ME, Laack LL, Caso A, Grassman LI, et al. (2011) Reduced
genetic diversity and isolation of remnant ocelot populations occupying a
severely fragmented landscape in southern Texas. Animal Conservation 14:
608–619.
12. Janecka JE, Tewes ME, Laack LL, Grassman LI, Haines AM, et al. (2008) Small
effective population sizes of two remnant ocelot populations (Leopardus pardalis
albescens) in the United States. Conservation Genetics 9: 869–878.
13. Tewes ME (1986) Ecological and Behavioral Correlates of Ocelot Spatial
Patterns. Moscow, Idaho: University of Idaho.
14. Laack LL, Tewes ME, Haines AM, Rappole JH (2005) Reproductive life history
of ocelots Leopardus pardalis in southern Texas. Acta Theriologica 50: 505–514.
15. Laack LL (1991) Ecology of the Ocelot (Felis pardalis) in South Texas. Kingsville,
Texas: Texas A&M University-Kingsville.
16. Reed DH (2004) Extinction risk in fragmented habitats. Animal Conservation 7:
181–191.
17. Wilcox BA, Murphy DD (1985) Conservation strategy - The effects of
fragmentation on extinction. American Naturalist 125: 879–887.
18. Ferreras P, Aldama JJ, Beltran JF, Delibes M (1992) Rates and causes of
mortality in a fragmented population of Iberian lynx Felis pardina Temminck
1824. Biological Conservation 61: 197–202.
19. Wright S (1978) Evolution and the Genetics of Populations, Vol. 4; Variability
Within and Among Natural Populations. Chicago, Illinois: University of
Chicago Press.
20. Reed DH, Bryant EH (2001) The relative effects of mutation accumulation
versus inbreeding depression on fitness in experimental populations of thehousefly. Zoo Biology 20: 145–156.
21. Frankham R (1998) Inbreeding and extinction: Island populations. ConservationBiology 12: 665–675.
22. Crnokrak P, Roff DA (1999) Inbreeding depression in the wild. Heredity 83:260–270.
23. Frankham R (2010) Inbreeding depression: Inbreeding in the wild really doesmatter. Heredity 104: 124–124.
24. Reed DH, Nicholas AC (2008) Spatial and temporal variation in a suite of life-history traits in two species of wolf spider. Ecological Entomology 33: 488–496.
25. Lacy RC (1997) Importance of genetic variation to the viability of mammalianpopulations. Journal of Mammalogy 78: 320–335.
26. Frankham R, Ralls K (1998) Conservation biology - Inbreeding leads toextinction. Nature 392: 441–442.
27. Saccheri I, Kuussaari M, Kankare M, Vikman P, Fortelius W, et al. (1998)Inbreeding and extinction in a butterfly metapopulation. Nature 392: 491–494.
28. Brook BW, Tonkyn DW, Q’Grady JJ, Frankham R (2002) Contribution ofinbreeding to extinction risk in threatened species. Conservation Ecology 6.
29. O’Grady JJ, Brook BW, Reed DH, Ballou JD, Tonkyn DW, et al. (2006)Realistic levels of inbreeding depression strongly affect extinction risk in wild
populations. Biological Conservation 133: 42–51.
30. Reed DH, Briscoe DA, Frankham R (2002) Inbreeding and extinction: The
effect of environmental stress and lineage. Conservation Genetics 3: 301–307.
31. Reed DH, Lowe EH, Briscoe DA, Frankham R (2003) Inbreeding and
extinction: Effects of rate of inbreeding. Conservation Genetics 4: 405–410.
32. Johnson JA, Dunn PO (2006) Low genetic variation in the heath hen prior to
extinction and implications for the conservation of prairie-chicken populations.
Conservation Genetics 7: 37–48.
33. Wright S (1977) Evolution and the Genetics of Populations, Vol. 3;
Experimental Results and Evolutionary Deductions. Chicago, Illinois: Univer-sity of Chicago Press.
34. Reed DH, Frankham R (2003) Correlation between fitness and genetic diversity.Conservation Biology 17: 230–237.
35. Frankham R (2005) Genetics and extinction. Biological Conservation 126: 131–140.
36. Coltman DW, Bowen WD, Wright JM (1998) Birth weight and neonatal survivalof harbour seal pups age positively correlated with genetic variation measured by
microsatellites. Proceedings of the Royal Society B-Biological Sciences 265: 803–809.
37. Johnson WE, Onorato DP, Roelke ME, Land ED, Cunningham M, et al. (2010)Genetic restoration of the Florida panther. Science 329: 1641–1645.
38. Westemeier RL, Brawn JD, Simpson SA, Esker TL, Jansen RW, et al. (1998)Tracking the long-term decline and recovery of an isolated population. Science
282: 1695–1698.
39. Blair FW (1950) Biotic provinces of Texas. Texas Journal of Science 2: 93–117.
Loss of Genetic Diversity among Ocelots in the US
PLOS ONE | www.plosone.org 9 February 2014 | Volume 9 | Issue 2 | e89384
40. Caso A (1995) Home Range and Habitat Use of Three Neotropical Carnivores
in Northeast Mexico: Texas A&M University-Kingsville.41. Shindle DB, Tewes ME (2000) Immobilization of wild ocelots with tiletamine
and zolazepam in southern Texas. Journal of Wildlife Diseases 36: 546–550.
42. Jae-Heup K, Eizirik E, O’Brien SJ, Johnson WE (2001) Structure and patterns ofsequence variation in the mitochondrial DNA control region of the great cats.
Mitochondrion 1: 279–292.43. Janecka JE, Walker CW, Tewes ME, Caso A, Laack LL, et al. (2007)
Phylogenetic relationships of ocelot (Leopardus pardalis albescens) populations from
the Tamaulipan biotic province and implications for recovery. SouthwesternNaturalist 52: 89–96.
44. Lopez JV, Cevario S, Obrien SJ (1996) Complete nucleotide sequences of thedomestic cat (Felis catus) mitochondrial genome and a transposed mtDNA
tandem repeat (Numt) in the nuclear genome. Genomics 33: 229–246.45. Menotti-Raymond M, David VA, Lyons LA, Schaffer AA, Tomlin JF, et al.
(1999) A genetic linkage map of microsatellites in the domestic cat (Felis catus).
Genomics 57: 9–23.46. Thompson JD, Gibson TJ, Plewniak F, Jeanmougin F, Higgins DG (1997) The
CLUSTAL_X windows interface: flexible strategies for multiple sequencealignment aided by quality analysis tools. Nucleic Acids Res 25: 4876–4882.
47. Rozas J, Sanchez-DelBarrio JC, Messeguer X, Rozas R (2003) DnaSP, DNA
polymorphism analyses by the coalescent and other methods. Bioinformatics 19:2496–2497.
48. Excoffier L, Laval G, Schneider SH (2006) ARLEQUIN ver. 3.01 An IntegratedSoftware Package for Population Genetics Data Analysis. Berne, Switzerland:
Computational and Molecular Population Genetics Lab, University of Berne.49. Tajima F (1989) Statistical methods for testing the neutral mutation hypothesis
by DNA polymorphism. Genetics 123: 585–595.
50. Fu YX, Li WH (1993) Statistical tests of neutrality of mutations. Genetics 133:693–709.
51. Peakall R, Smouse PE (2006) GENEALEX 6: genetic analysis in Excel.Population genetic software for teaching and research. Molecular Ecology Notes
6: 288–295.
52. Raymond M, Rousset F (1995) Genepop (Version 1.2) Population geneticssoftware for exact tests and ecumenicism. Journal of Heredity 86: 248–249.
53. Rice WR (1989) Analyzing tables of statistical tests. Evolution 43: 223–225.54. Goudet J (2001) FSTAT, a program to estimate and test gene diversities and
fixation indices (version 2.9.3). http://www2unilch/popgen/softwares/fstathtm2010 November 14.
55. Kalinowski ST (2005) HP-RARE 1.0: a computer program for performing
rarefaction on measures of allelic richness. Molecular Ecology Notes 5: 187–189.56. Hofreiter M, Serre D, Poinar HN, Kuch M, Paabo S (2001) Ancient DNA.
Nature Reviews Genetics 2: 353–359.57. Lesica P, Allendorf FW (1995) When are peripheral populations valuable to
conservation?. Conservation Biology 9: 753–760.
58. Schwartz MK, Mills LS, Ortega Y, Ruggiero LF, Allendorf FW (2003)Landscape location affects genetic variation of Canada lynx (Lynx canadensis).
Molecular Ecology 12: 1807–1816.59. Sage RD, Wolff JO (1986) Pleistocene glaciations, fluctuating ranges, and low
genetic-variability in a large mamal (Ovis dalli). Evolution 40: 1092–1095.60. Eizirik E, Bonatto SL, Johnson WE, Crawshaw PG, Vie JC, et al. (1998)
Phylogeographic patterns and evolution of the mitochondrial DNA control
region in two neotropical cats (Mammalia, Felidae). Journal of MolecularEvolution 47: 613–624.
61. Jahrsdoerfer SE, Leslie DM (1988) Tamaulipan brushland of the Lower Rio
Grande Valley of South Texas: descriptions, human impacts, and managementoptions. US Fish and Wildlife Services, Biological Report 88: 36–63.
62. Uphyrkina O, Miquelle D, Quigley H, Driscoll C, O’Brien SJ (2002)
Conservation genetics of the Far Eastern leopard (Panthera pardus orientalis).Journal of Heredity 93: 303–311.
63. Roelke ME, Martenson JS, Obrien SJ (1993) The consequence of demographicreduction and the genetic depletion in the endagered Florida panther Current
Biology 3: 340–350.
64. Pertoldi C, Hansen MM, Loeschcke V, Madsen AB, Jacobsen L, et al. (2001)Genetic consequences of population decline in the European otter (Lutra lutra): an
assessment of microsatellite DNA variation in Danish otters from 1883 to 1993.Proceedings of the Royal Society B-Biological Sciences 268: 1775–1781.
65. Wisely SM, Buskirk SW, Fleming MA, McDonald DB, Ostrander EA (2002)Genetic diversity and fitness in black-footed ferrets before and during a
bottleneck. Journal of Heredity 93: 231–237.
66. Leonard JA, Vila C, Wayne RK (2005) Legacy lost: genetic variability andpopulation size of extirpated US grey wolves (Canis lupus). Molecular Ecology 14:
9–17.67. Nystrom V, Angerbjorn A, Dalen L (2006) Genetic consequences of a
demographic bottleneck in the Scandinavian arctic fox. Oikos 114: 84–94.
68. Rowe G, Beebee TJC, Burke T (1999) Microsatellite heterozygosity, fitness anddemography in natterjack toads Bufo calamita. Animal Conservation 2: 85–92.
69. Lynch M, Pfrender M, Spitze K, Lehman N, Hicks J, et al. (1999) Thequantitative and molecular genetic architecture of a subdivided species.
Evolution 53: 100–110.70. Reed DH, Nicholas AC, Stratton GE (2007) Inbreeding levels and prey
abundance interact to determine fecundity in natural populations of two species
of wolf spider. Conservation Genetics 8: 1061–1071.71. Ralls KJ, Ballou D, Templeton A (1988) Estimates of lethal equivalents and the
cost of inbreeding in mammals. Conservation Biology 1: 185–193.72. Roychoudhury AK, Sankhala KS (1979) Inbreeding in white tigers. Proceedings
of the Indian Academy of Sciences-Animal Sciences 88: 311–323.
73. Bureau USC (2005) 2000 Census.74. Wildt DE, Bush M, Goodrowe KL, Packer C, Pusey AE, et al. (1987)
Reproductive and genetic consequences of founding isolated lion populations.Nature 329: 328–331.
75. Keller LF, Waller DM (2002) Inbreeding effects in wild populations. Trends inEcology & Evolution 17: 230–241.
76. Liberg O, Andren H, Pedersen HC, Sand H, Sejberg D, et al. (2005) Severe
inbreeding depression in a wild wolf (Canis lupus) population. Biology Letters 1:17–20.
77. Newman D, Tallmon DA (2001) Experimental evidence for beneficial fitnesseffects of gene flow in recently isolated populations. Conservation Biology 15:
1054–1063.
78. Vila C, Sundqvist AK, Flagstad O, Seddon J, Bjornerfeldt S, et al. (2003) Rescueof a severely bottlenecked wolf (Canis lupus) population by a single immigrant.
Proceedings of the Royal Society of London Series B-Biological Sciences 270:91–97.
79. Madsen T, Shine R, Olsson M, Wittzell H (1999) Conservation biology -Restoration of an inbred adder population. Nature 402: 34–35.
80. Young JH, Tewes ME (1994) Evaluation of techniques for initial restoration of
ocelot habitat. Proceedings of the Annual Conference of SoutheasternAssociation of Fish and Wildlife Agencies 31: 336–342.
Loss of Genetic Diversity among Ocelots in the US
PLOS ONE | www.plosone.org 10 February 2014 | Volume 9 | Issue 2 | e89384