20th National Children's Science Congress 2012
151
-
Upload
khangminh22 -
Category
Documents
-
view
4 -
download
0
Transcript of 20th National Children's Science Congress 2012
20th National Children'sScience Congress 2012
Activity GuideSupported and catalysed by
National Council for Science & TechnologyCommunication (NCSTC)
Dept. of Science and Technology, Govt. of India
Published by
NCSTC-Network, New Delhi

Activity Guide
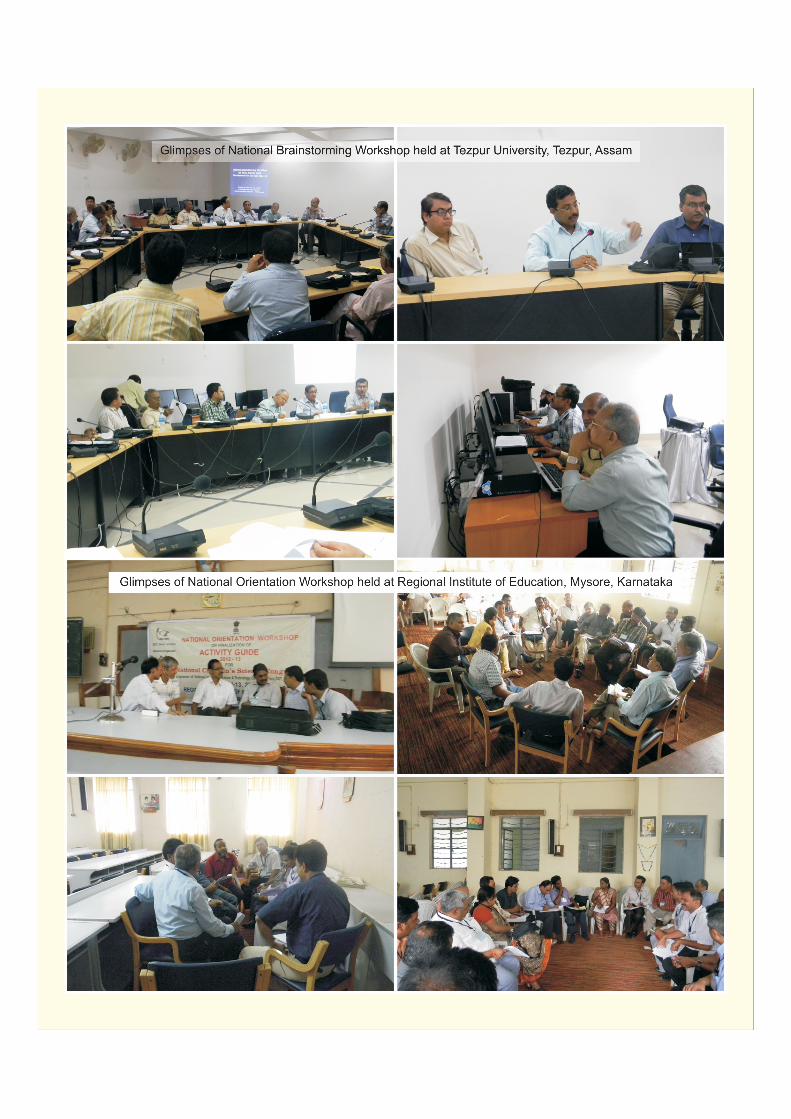
This resource material compiled in this publication was developed during the Brainstorming workshop held atTezpur University, Tezpur, Assam during May 2 to 4, 2012. Many suggestions given at the National Orientationworkshop at Regional Education Institute (REI), Mysore during June 11 to 13, 2012 have also been incorporated.
Core Working Group for activity guide development
Advisors
Prof. S. P. VermaDr D. K. Pandey
Working group
Jayanta Kr Sarma (Coordinator) U.N. Ravi KumarDr Pulin Bihari Chakravorty E. Kunikrishnan
Dr P. Pramod Sadhan MahapatraDr Bhim Prasad Sarmah Jaideep Baruah
Dr Lalit Sharma Sandeep Bhattacharjee
Illustrations byBiswajit Borah, Anamika Sarmah, Tekendrajit Saikia
Cover design : Sandeep Bhattacharjee
Published byNCSTC - Network
E-56, First Floor, Samaspur RoadPandav Nagar, Delhi - 110091
Email - [email protected]@hotmail.com
Telephone - 011-22799236Mobile- 09868404002
Catalysed and supported byNational Council for Science and Technology Communication (NCSTC),
Department of Science and TechnologyTechnology Bhavan, New Mehrauli Road, New Delhi - 110016,
Email ID: [email protected];Telephone no:01126535564/26590251

Preface
National Children's Science Congress (NCSC) is a countrywide programme of science popularisation infusingmethods of science in a manner of exploration and understating some simple day to day life related problemsand issues by children. In this process group of children are guided by their teacher and after their systematiclocal area study /research they take up follow-up action by communicating their findings and observations tolarger masses. The entire process involves subject experts, teachers, science activist, children, people in theproject area in understanding a problem from a scientific perspective and in times it develops a spirit ofscientific inquiry, which is the foundation of a scientific temperament.
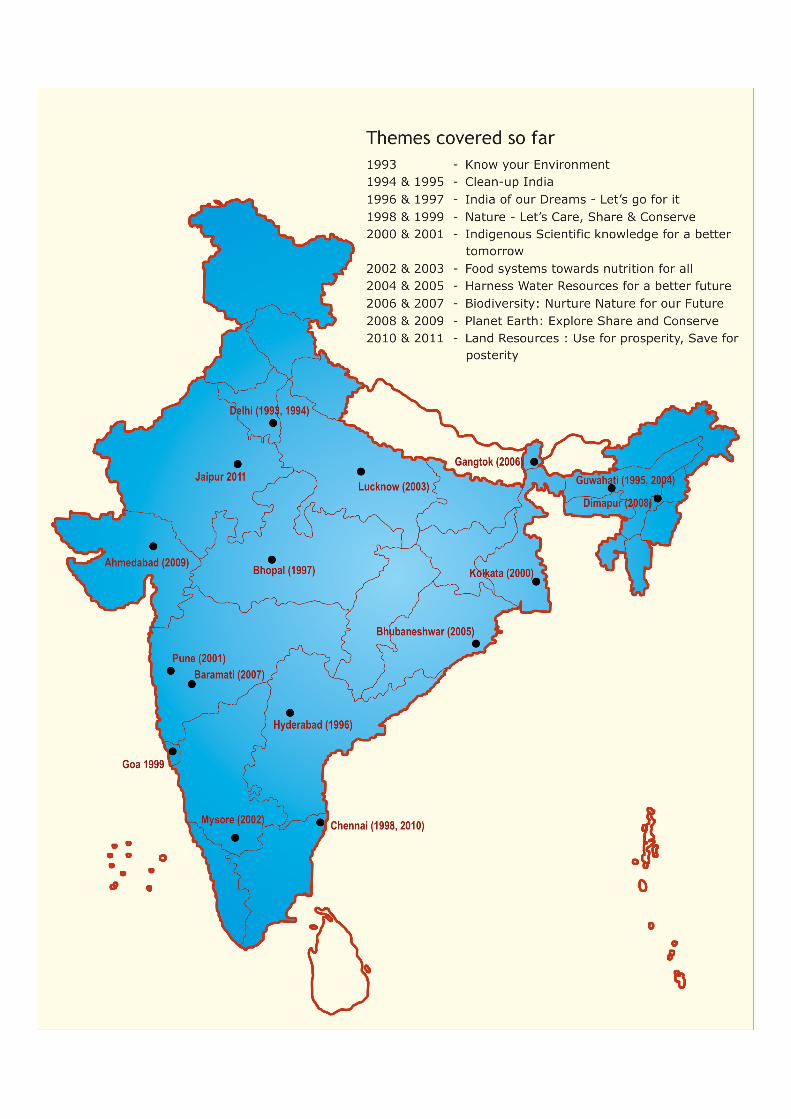
This programme is organized since 1993 with active participation of academia, science volunteer, governmentand non-government organizations, children and parents. It is continuing successfully only because of theactive support and able guidance of the National Council for Science and Technology Communication (NCSTC),Dept. of Science and Technology, Government of India. NCSTC-Network undertakes the responsibility ofnational coordination through its member organizations since its inception. In 2012 we are in the 20th year ofits progress and we have covered almost all the districts of India. The focal theme for this year (2012) and2013 is “Energy: Explore, Harness and Conserve”.
The present guide book is being published at a time when the international community is discussing the issueof “Sustainable Energy for All (SEFA)” at Rio de Janeiro. Energy is acknowledged as one of the criticalrequirement for all systems & processes on planet earth. Rational and optimal uses of energy will be able toreduce our carbon foot print and help in adaptation and mitigation initiatives of climate change. Shifting ofenergy base from non-renewable to renewable can develop green energy foundation and energy sustainability,which in turn can lead us to the path of sustainable development. It is expected that, through the initiatives ofour children some new thought and innovative ideas will evolve in the area of energy and understanding istransferred to the communities through their project studies.
This activity guidebook is basically designed for the state/district level academic committee members, teacherguide and science volunteer who will take the pain at grass root level to interact with the children about thethematic concerns and guide them to carry out project study in their local area on prioritized idea and issues.It is hoped that this activity guide may provide ample food for thought to our children, teacher guides andscience volunteers.
Lastly on behalf of NCSTC-Network we extend our heartlfelt thanks to NCSTC-DST, members of the coregroup and academic coordinators/ resource persons of all states & union territories including Kendriya VidyalayaSangathana and Jawahar Navodaya Vidyalaya Samiti who contributed their thought and suggested newproject ideas, for preparation of the present Activity guide book.
Patna dated 1st. July 2012 Prof. S.P. VermaChairman, NCSTC-Network
A Note from the National Programme CoordinatorChildren Science Congress (CSC) steps forward onto its twentieth year of its progression. It has been ajourney of learning together about science communication and pedagogical issues in educational transactions.Working with children cater their aspiration and motivate them to explore, analyse, learn and understand thephysical environment around them. The activities of last nineteen years reflect wide range of critical andinnovative ideas put forward by the children through their project works on variety of issues from differentnook and corner of the country. The process of doing project works on issues related to day-to-day life undera focal theme, adapting the methods of science of observation, measurement, validation and analysis hasturned into a movement of science popularisation in the nation.
In view of present day energy scenario, linking the gap of energy demand and supply, environmental issuesand energy generation, distribution and consumption along with issues of climate change and challenges ofsustainable development, it was decided to take up energy and its related issues as focal theme for the year2012 and 2013. Through a series of discussion in National Brainstorming Workshop, “Energy: Explore,Harness and Conserve” was decided as the broad focal theme.
This activity guide is brought out with the great efforts of the experts and resource persons involved in theNational Brainstorming Session and also the involvement of the State Academic Coordinators and resourcepersons of the State who had participated in the National Orientation Workshop, was of great help in finalisingthe activity guide book. The members of the core group had taken a lot of pain to carry out all the exercisesin designing and developing the content of the activity guide. It would not have been possible without theactive support of the Tezpur University, Assam and Regional Institute of Education, Mysore to carry out thenecessary exercises needed in the process. We are grateful to all the individuals and organisation, associatedin their own way in designing and development of the Activity Guide.
We hope that the activity guide will help the State and District Coordinators, Resource Persons, TeacherGuides and Evaluators to carry out their activities. As a result, the valuable and potential project ideas thatcomes up will prove to be useful to the society at large.
Any suggestion with regard to improvement in the activity guide is always welcome.
With best wishes
Acknowledgement
This activity guide for Children's Science Congress for the year 2012 and 2013 is the outcome ofNational Brainstorming Workshop held at Tezpur University, Tezpur Assam and National Orientation Workshopheld at Regional Institute Education, Mysore, Karnataka, we offer our special thanks for offering these asvenues to organise the workshops. Different experts from the field of energy, science communication andscience education from different parts of the country participated in the Workshop. Similarly, State AcademicCoordinators and State Resource Persons of different states, union territories, Kendriya Vidyalaya Sangathanand Jawahar Navodaya Vidyalaya Samiti participated in the National Orientation Workshop. We are indebtedto all the inputs put forward by each of the individuals who participated in the aforesaid workshops.
We are grateful to Prof. Mihir Kanti Chaudhuri, Honourable Vice-Chancellor of Tezpur University,Prof. Alak Kumar Buragohain, Register Tezpur University for their support to organize the National BrainstormingWorkshop at Tezpur University. We acknowledge the enterprising initiatives of Dr. Bhim Prasad Sarmah,Department of Mathematical Sciences and Mr. Sadhan Mahapatra, Department of Energy of Tezpur Universityfor their active support in organising the national brainstorming workshop and contributing further in editingthe subject content. We are also indebted to Dr. D. C. Baruah, HoD, Department of Energy, Tezpur Universityfor his inputs and advise. We are thankful to all the concerned faculty, official and staff of Tezpur University fortheir cooperation during the National Brainstorming Workshop.
We are also grateful to Science Communicators Forum, Kolkata and Society for Socio-Economic andEnvironment Protection, Nagaon, Assam, both NCSTC-Network members, for their valuable input and supportin organising the National Brainstorming Workshop at Tezpur.
It is only because of Mrs. Sreemathi Hari Prasad we were able to organize the National OrientationWorkshop at Mysore, we are indebted to her for her active support and advices. We acknowledge the supportof the faculty and officials of RIE in the national orientation workshop.
We are also thankful to Prof. S.P. Verma Chairperson, NCSTC, Network, Mr. R.S. Raghubanshi,General Secretary, NSCTC-Network, Dr Manoj Kr. Patowary, Regional Secretary, NCSTC-Network andDr. R.N. Ray, Bharat Jan Gyan Vigyan Samiti, Bhubaneswar, for their continuous support and advises.
We are indebted to the constant encouragement, support, and valuable inputs and guidance ofDr B.P. Singh, Scientist-G, Head, NCSTC, DST and Dr D. K. Pandey, National Programme Coordinator,CSC and Scientist-E, NCSTC, DST. We offer our sincere thanks to both of them. Thanks are due to entirefamily of NCSTC, DST for their catalytic support for the entire project.
On behalf of the group
Coordinator of the core group to develop activity guide

National Council for Science & Technology Communication (NCSTC)Department of Science and Technology (DST), Government of India
NCSTC is an apex Organisation of the Department of Science and Technology of Government of India thatendeavours to
Communicate Science and Technology Stimulate Scientific and Technological temper Coordinate and orchestrate such effortsGoals:
to create excitement concerning advances in Science & Technology to enable informed decision-making at the grass roots level to encourage intelligent debate on developmental issues
Important Activities
Research in thrust areas of science and technology communication; Development of scripts, films, video and radio programmes, books, slide sets, etc., on selected areas of
science and technology; Training (short term) for school teachers and activists of science & technology based voluntary organisations
in science communication; Development of science journalists through University Courses in Science and Technology Communication; Awards and recognition for outstanding science communicators; Coordination with state councils and networks of S& T based organisations; Developing capacity through science communication Field programmes for demonstrating innovative ideas of science popularisation, outreach and extension
activities including National Children's Science Congress, Science Day celebrations, promotion of voluntaryblood donation programmes, environmental awareness and positive action, etc., and
Promoting International Cooperation for mutual benefit.
For further details please contact
National Council for Science & Technology CommunicationDepartment of Science and TechnologyTechnology Bhavan, New Mehrauli Marg,New Delhi 110016Phones: 011-26521865/011-26590302Fax: 011-26521865Visit: http://www.dst.gov.in/scientific-programme/s-t_ncstc.htm
About NCSTC-NetworkThe NCSTC-Network, a voluntary organisation of 79 voluntary and Governmental organisation, is a union
organisation for science popularisation and for stimulation of scientific temperament among the people. It wasregistered in 1991 under Societies Registration Act-1860 of Delhi as an autonomous society (S-21587).
1. Genesis: Soon after the pioneering and massive science communication experiment the Bharat Jan VigyanJatha (BJVJ) of 1987 many voluntary groups were brought together by the efforts of NCSTC (DST) to organisethe Jatha in 1987.
The tremendous potential of the additional organisation sensitised and motivated through the Jathaexperience was realised by all concerned. But two years of efforts failed to attach these to the then existinggroup of 26 organisation. Therefore the NCSTC and some like minded non-Governmental organisations tookinitiative to bring these active groups together as NCSTC-Network. What followed was a series of intenseefforts, face-to-face consultations and these efforts culminated in the registration of this group as NCSTC-Networkon June 2, 1991.
What followed was watched by all. The Network remains a union of successful experiment in sciencepopularisation, bringing to the Government and the Non-Governmental sectors together in nation buildingexercise. It publishes books, co-ordinates National Children's Science Congress (NCSC), arranges scienceprogrammes, holds training workshops, spreads scientific attitude and, in short, bridges science and the commonperson.
2. National Children Science Congress: The National Children's Science Congress (NCSC), the mostvisible activity of the NCSTC-Network, catalysed and supported by NCSTC, DST has been instrumental inproviding a very creative channel to the children of the country and attracted children even from abroad. Itinvolves about half a million children, teachers and scientists and others every year who congregate from allover the country after a long series of school, district and state level programmes. For some years, the selectedentries are presented during the Indian Science Congress. A model in co-operative learning, NCSC reaches its20th year of organisation this year.
3. Membership of the NCSTC-Network: The membership is open to the science and technologycommunication organisations - Governmental as well as Non-Governmental. At present the member list includesState Science and Technology Councils, several Education Departments, in addition to a number of voluntaryorganisations including winners of National Awards for science popularisation. People of eminence in the fieldof science popularisation, are nominated as Fellows and Associates. Some essential eligibility conditions ofmembership are that the organisation must have science popularisation as primary concern in there charter,should have been active in the field for at least two years in a considerable geographical area which must bemore than half of the concerning persons state and should not be registered under FCRA.
Application forms may be obtained from the Delhi Office.NCSTC-Network
E-56 First Floor, Samaspur RoadPandav Nagar, Delhi 110091
Telefax: 011-22769236Website: www.ncstc-network.org | E-mail: [email protected]
ContentsPart-IAbout Children’s Science Congress (CSC)
1. CSC - the beginning --------------------------------------------------------------------------------------------- 32. CSC - an overview ----------------------------------------------------------------------------------------------- 33. Objectives ----------------------------------------------------------------------------------------------------------54. Relevance of CSC in the light of contemporary educational initiatives --------------------------------55. Eligibility of participants ----------------------------------------------------------------------------------------- 66. Modalities of participation -------------------------------------------------------------------------------------- 67. Nature of CSC Project ------------------------------------------------------------------------------------------- 68. Criteria of Good Projects ---------------------------------------------------------------------------------------- 79. Points to remember ---------------------------------------------------------------------------------------------- 710. Structure of the project report ---------------------------------------------------------------------------------- 711. Oral presentation: ------------------------------------------------------------------------------------------------ 812. Different level of Congress -------------------------------------------------------------------------------------- 813. Screening ----------------------------------------------------------------------------------------------------------914. Tentative Activity Schedule ------------------------------------------------------------------------------------- 915. Approaches of Evaluation -------------------------------------------------------------------------------------- 916. Organisers ------------------------------------------------------------------------------------------------------- 11Some important points for Participation in the Indian Science Congress’s -------------------------------- 14
Part-IIFocal Theme - “Energy: Explore, Harness and Conserve” --------------------------------------------------- 15
Sub-Theme-IEnergy Resources ----------------------------------------------------------------------------------------------------- 211. Introduction------------------------------------------------------------------------------------------------------ 232. Framework ------------------------------------------------------------------------------------------------------ 303. Model Project --------------------------------------------------------------------------------------------------- 304. Suggestive project ideas -------------------------------------------------------------------------------------- 38
Sub-Theme-IIEnergy Systems ------------------------------------------------------------------------------------------------------- 391. Introduction------------------------------------------------------------------------------------------------------ 412. Framework ------------------------------------------------------------------------------------------------------ 413. Source based Energy Systems ------------------------------------------------------------------------------- 424. Model Project --------------------------------------------------------------------------------------------------- 505. Suggestive project ideas -------------------------------------------------------------------------------------- 52
Sub-Theme-IIIEnergy and Society --------------------------------------------------------------------------------------------------- 531. Introduction------------------------------------------------------------------------------------------------------ 55

2. Framework ------------------------------------------------------------------------------------------------------ 563. Interrelated areas /dimensions ------------------------------------------------------------------------------- 564. Some important areas: ---------------------------------------------------------------------------------------- 595. Model Projects -------------------------------------------------------------------------------------------------- 606. Suggestive project ideas -------------------------------------------------------------------------------------- 64
Sub-Theme-IVEnergy and Environment -------------------------------------------------------------------------------------------- 651. Introduction------------------------------------------------------------------------------------------------------ 672. Framework ------------------------------------------------------------------------------------------------------ 683. Model Project --------------------------------------------------------------------------------------------------- 694. Suggestive project ideas -------------------------------------------------------------------------------------- 73
Sub-Theme-VEnergy Conservation and Management -------------------------------------------------------------------------- 751. Introduction------------------------------------------------------------------------------------------------------ 772. Energy Management ------------------------------------------------------------------------------------------ 773. Energy Conservation ------------------------------------------------------------------------------------------ 774. Energy Audit ---------------------------------------------------------------------------------------------------- 795. Model Projects -------------------------------------------------------------------------------------------------- 816. Suggestive project ideas -------------------------------------------------------------------------------------- 83
Sub-Theme-VIEnergy Planning and Modelling ------------------------------------------------------------------------------------ 851. Introduction------------------------------------------------------------------------------------------------------ 872. Energy planning and modelling: ---------------------------------------------------------------------------- 883. Framework ------------------------------------------------------------------------------------------------------ 894. Model Project --------------------------------------------------------------------------------------------------- 905. Suggestive Project Ideas -------------------------------------------------------------------------------------- 94
Project idea put forwarded by the participants in the national orientation workshop -------------------------- 95References -------------------------------------------------------------------------------------------------------------------- 97
Websites ---------------------------------------------------------------------------------------------------------------- 98Glossary ------------------------------------------------------------------------------------------------------------------- 100Appendix-I Calorific value ----------------------------------------------------------------------------------------- 109Appendix-II Energy Units ------------------------------------------------------------------------------------------- 111Appendix-III Electrical terms and units of measure ------------------------------------------------------------- 113Appendix-IV Sample of some energy conversion table -------------------------------------------------------- 116Appendix-V Energy equivalent of different items -------------------------------------------------------------- 118Appendix-VI Equivalents for Direct and indirect Sources of Energy on basis of out put power -------- 119
Calories of common food items (RAW) ---------------------------------------------------------- 119Calories cost of various activities for 60Kg. Person --------------------------------------------- 120
Annexure -I State wise qota ---------------------------------------------------------------------------------------- 121Annexure -II State Co-ordinators ----------------------------------------------------------------------------------- 122Annexure - III Members in the National Brainstorming Workshop -------------------------------------------- 126Annexure - IV Participants in the National Orientation Workshop on Finalization of Activity Guide
2012 and 2013 ---------------------------------------------------------------------------------------- 129Annexure - V Form-A (Registration Form) ------------------------------------------------------------------------ 137
Activity Guide 2012-13
Page 1
Part-I
About NCSC
Activity Guide 2012-13
Page 2
Activity Guide 2012-13
Page 3
About Children's Science Congress (CSC)
1. CSC - the beginningThe seeds of the programme of children's science congress (CSC), in the way of an exercise to carry out smallresearch activities at micro-level were planted in Madhya Pradesh by an NGO called Gwalior Science Center.It was later adopted by National Council for Science and Technology Communication (NCSTC), Departmentof Science and Technology (DST), Government of India for carrying out national level activities throughNCSTC-Network (a network of Non-Government and Government organisations working in the field ofscience popularization) as national organiser. It was a time when many of the country's crusaders of sciencecommunication were experienced with massive science communication exercise of Bharat Jana Bigyan Jathaand Bharat Jana Gyan Bigyan Jatha. It was felt that the large scale activities for developing scientific awarenessamong the masses are to be continued as regular activity, so, this programme was launched nationwide in1993, under the nomenclature of National Children's Science Congress (NCSC), with an expectation that itwould generate scientific temperament among the teachers and students, and spread among variousstakeholders of the society. The programme of NCSC has been fruitfully conducted for the last 19 years.
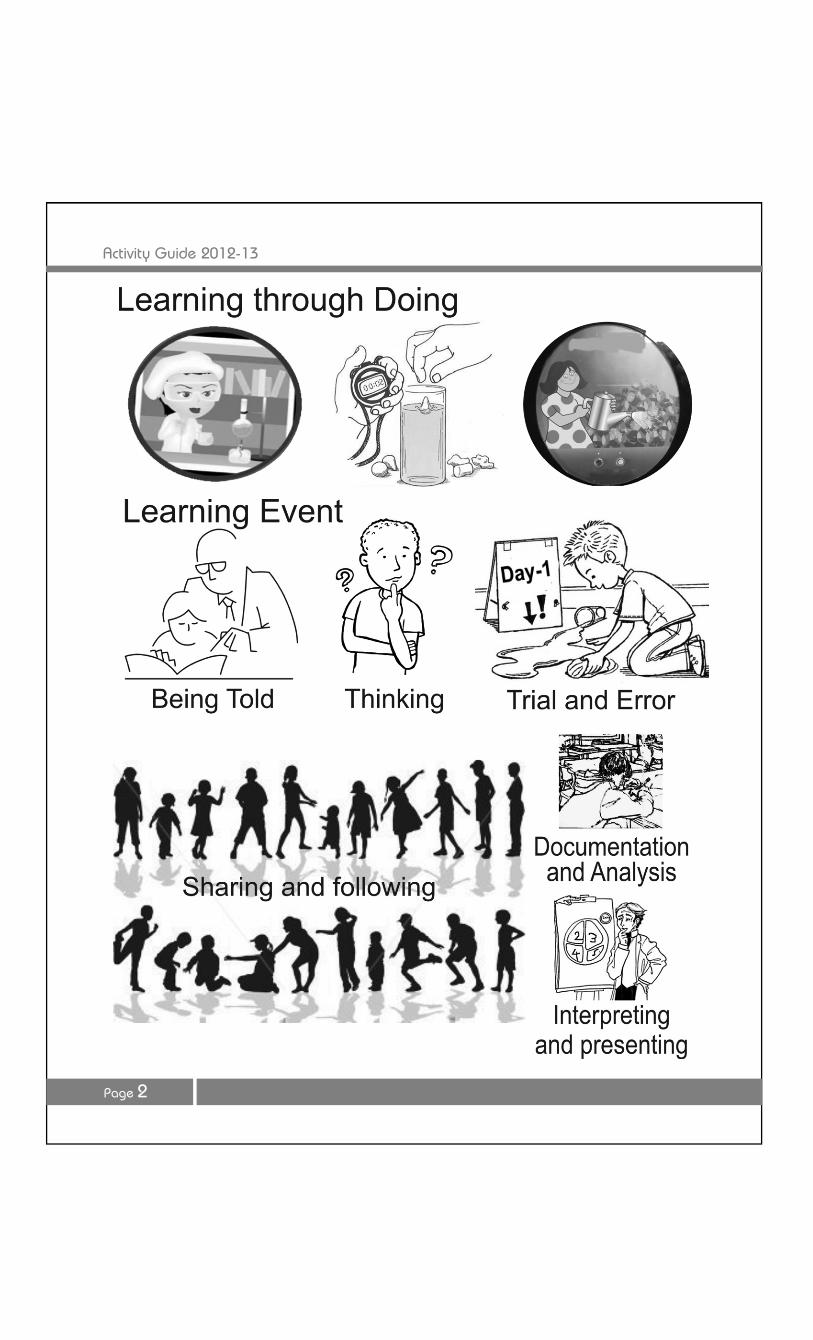
2. CSC - an overviewChildren's Science Congress is targeted to spread the concept of the method of science among the childrenthrough their project activities adopting the principle of ‘Learning through doing’. The mandate ofparticipation is that, the children will carry out a project on a particular topic in relation to theme and sub-theme decided for the year. The study is to be carried out in the neighbourhood of the children where theylive. For this, the students form a group with their like-minded friends/classmates and the study is carriedout under the supervision of a guide. It is noteworthy that, CSC programme is not only for the school goingchildren but is also open for the children outside the formal boundary of schools, in the age group of 10 to 17years (where 10 to 14 years is considered as junior group and 14 to 17 years as senior group). Further, it is notmandatory that a guide must be a school teacher; any person with fair knowledge of dealing with childrenand method of science is considered eligible to guide the children, but should not be a direct relative of anyof the children.
The exercises of project activities, as a thumb rule, encourage the children to explore, think, serve and wonder.It is capable to imbibe the following temperament/quality/skill of the children:
Observation, Making measurement, Making comparison and contrasts, Classification, Estimation, Prediction, Interpretation, Critical thinking, Creative thinking, Drawing conclusion and Cooperative skill
Activity Guide 2012-13
Page 4
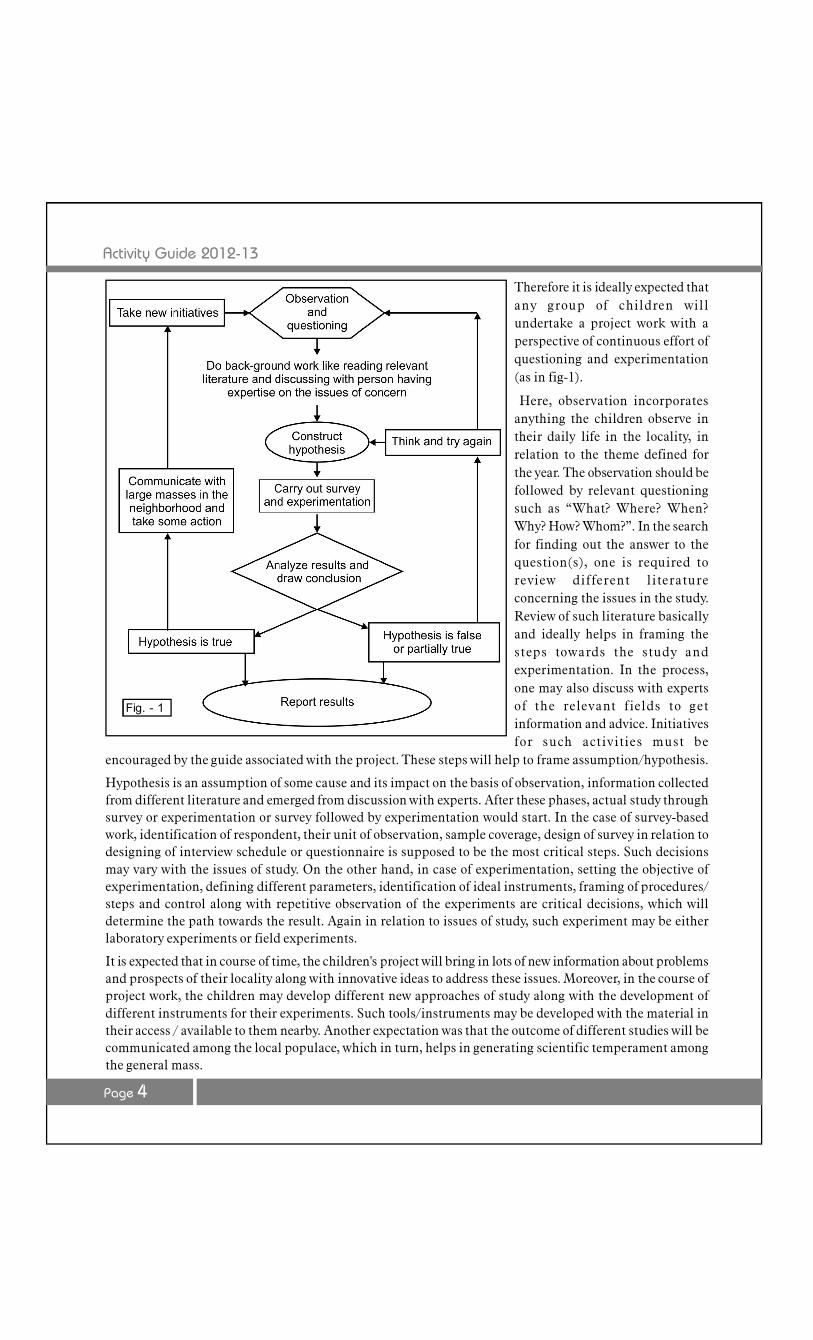
Therefore it is ideally expected thatany group of children willundertake a project work with aperspective of continuous effort ofquestioning and experimentation(as in fig-1).
Here, observation incorporatesanything the children observe intheir daily life in the locality, inrelation to the theme defined forthe year. The observation should befollowed by relevant questioningsuch as “What? Where? When?Why? How? Whom?”. In the searchfor finding out the answer to thequestion(s), one is required toreview different literatureconcerning the issues in the study.Review of such literature basicallyand ideally helps in framing thesteps towards the study andexperimentation. In the process,one may also discuss with expertsof the relevant fields to getinformation and advice. Initiativesfor such activities must be
encouraged by the guide associated with the project. These steps will help to frame assumption/hypothesis.
Hypothesis is an assumption of some cause and its impact on the basis of observation, information collectedfrom different literature and emerged from discussion with experts. After these phases, actual study throughsurvey or experimentation or survey followed by experimentation would start. In the case of survey-basedwork, identification of respondent, their unit of observation, sample coverage, design of survey in relation todesigning of interview schedule or questionnaire is supposed to be the most critical steps. Such decisionsmay vary with the issues of study. On the other hand, in case of experimentation, setting the objective ofexperimentation, defining different parameters, identification of ideal instruments, framing of procedures/steps and control along with repetitive observation of the experiments are critical decisions, which willdetermine the path towards the result. Again in relation to issues of study, such experiment may be eitherlaboratory experiments or field experiments.
It is expected that in course of time, the children's project will bring in lots of new information about problemsand prospects of their locality along with innovative ideas to address these issues. Moreover, in the course ofproject work, the children may develop different new approaches of study along with the development ofdifferent instruments for their experiments. Such tools/instruments may be developed with the material intheir access / available to them nearby. Another expectation was that the outcome of different studies will becommunicated among the local populace, which in turn, helps in generating scientific temperament amongthe general mass.
Fig. - 1
Activity Guide 2012-13
Page 5
In a nutshell, the CSC projects are simple, innovative, concerned with local issues related with day to day lifeand are carried out with very nominal cost, where the focus is more on logical interpretation and analysis ofissues, and finding out pragmatic solutions of generic nature to the possible extent, and not merely confinedto the study topic and corresponding model making.
3. ObjectivesThe primary objectives of the Children's Science Congress is to make a forum available to children of theage-group of 10-17 years, both from formal school system as well as from out of school, to exhibit theircreativity and innovativeness and more particularly their ability to solve a societal problem experiencedlocally using the method of-science.
By implication, the CSC prompts children to think of some significant societal problem, ponder over itscauses and subsequently try and solve the same using the scientific process. This involves close and keenobservation, raising pertinent questions, building models, predicting solutions on the basis of a model, tryingout various possible alternatives and arriving at an optimum solution using experimentation, field work,research and innovative ideas. The Children's Science Congress encourages a sense of discovery. It emboldensthe participants to question many aspects of our progress and development and express their findings invernacular.
4. Relevance of CSC in the light of contemporary educational initiatives
The basic approach of CSC on the principle of learning through doing onthe issues of children's immediate environment significantly caries thespirit and mandate of Education for Sustainable Development (ESD) ofUNESCO, National Curriculum Framework (NCF, 2005) and Right toEducation (RTE, 2009).
The modalities and approaches of CSC cater to the five pillars of learningof Education for Sustainable Development vividly, viz. learning to know,learning to do, learning to live together, and learning to be, learning totransform one self and society (Declaration of ESD in the 57th meeting ofthe United Nations General Assembly in December 2002, whichproclaimed the UN Decade of Education for Sustainable Development, 2005- 2014, refer - www.desd.org andwww.unesco.org)
The mandate of CSC which encourages children to observe, explore, experiment and wonder through aproject activity and its associated ways of participation and evaluation rightly takes care of the guidingprinciples of the NCF, 2005. Therefore, example of Children's Science Congress has been rightly cited inthe NCF documents under executive summary section, page ix (http://www.teindia.nic.in/Files/NCF-2005.pdf).
Similarly CSC activities also helps in materializing the approach of learning as framed in the Right of Childrenof Free and Compulsory Education (RTE) Act, 2005 [particularly in relation to article 6.1, section C (ii, iii, ivand v)].
More over the CSC activities, since 1993, has catered to many of the approaches and priorities of scienceeducation visualized in the National Programme of Sarba Siksha Abhijan (SSA) (refer SSA framework,http//ssakarnataka.gov.in/pdfs/aboutus/ ssa_framework%20.pdf) and Rashtriya Madhyamik Siksha Abhijan(RMSA) (refer - http://www.educationforallinindia.com/rastriya-madhymic-shiksha-mission-RMSM.pdf).
“A social movement alongthe lines of Children'sScience Congress should bevisualised in order topromote discovery learningacross the nation, andeventually throughout SouthAsia.” - National CurriculumFramework 2005, ExecutiveSummary, Page (ix)
Activity Guide 2012-13
Page 6
5. Eligibility of participants
It is open for children in the age of 10 to 14 years (lower age group) and from 14+ to 17 years (upper agegroup) as on December 31 of the calendar year.
A group of children not exceeding five, can do the project study under a teacher guide. A child scientist, who had already presented as a Group Leader at the National Level in one age-group,
can act as a co-worker in the subsequent year, in the same age group (lower / upper). Parents, whose child would participate in the Children's Science Congress in the ensuing year, should not
hold any portfolio in the organising committee of the CSC conducted at any level.
6. Modalities of participation
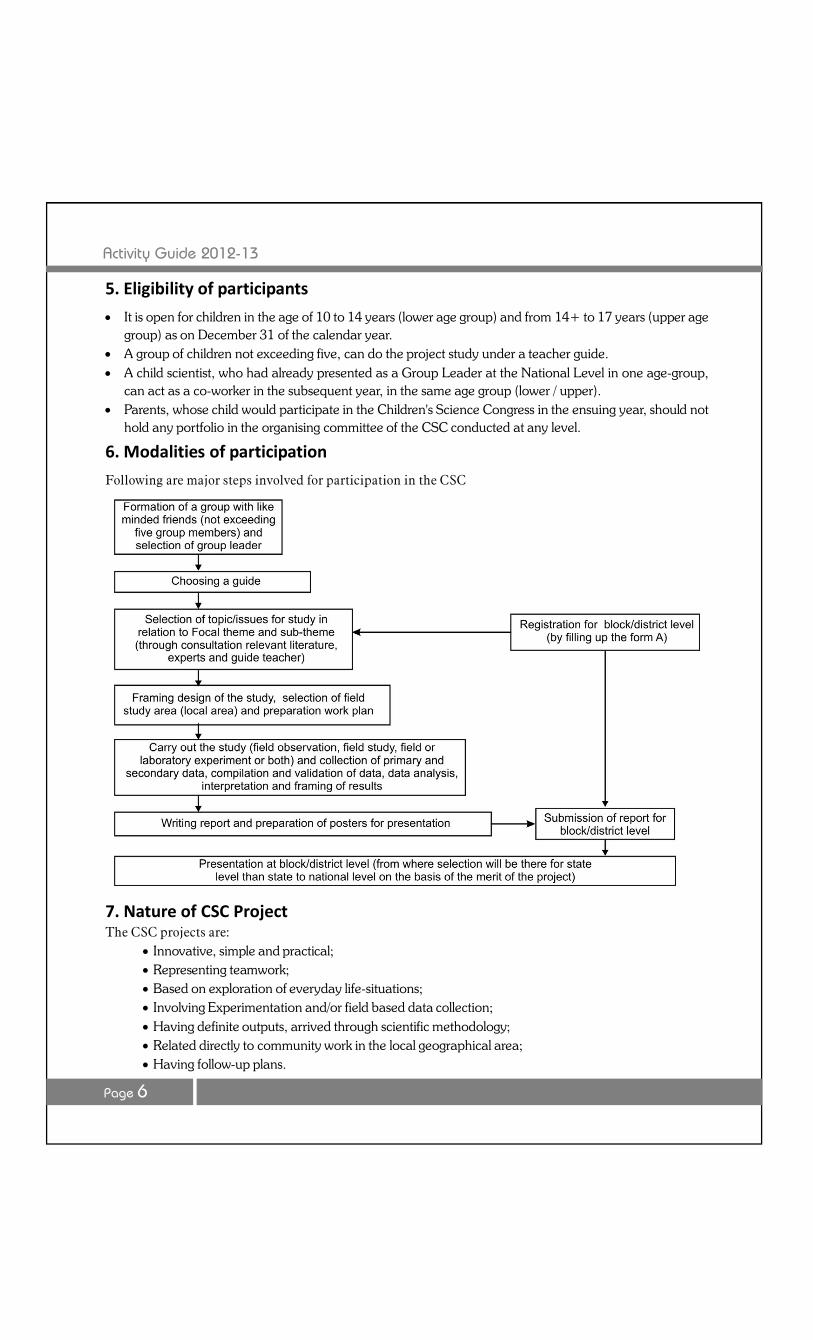
Following are major steps involved for participation in the CSC
7. Nature of CSC ProjectThe CSC projects are:
Innovative, simple and practical; Representing teamwork; Based on exploration of everyday life-situations; Involving Experimentation and/or field based data collection; Having definite outputs, arrived through scientific methodology; Related directly to community work in the local geographical area; Having follow-up plans.
Activity Guide 2012-13
Page 7
8. Criteria of Good Projects
As per past experience it has been found that projects which were rated very good had the following elementswhile implementing and documenting the project:
Proper understanding and definition of the problem undertaken. Quality and quantity of work, including team work, learning process, subject understanding and
efforts to validate the data collected. Relevance of the proposal to the community/school problem and impact of project on schoolmates,
neighbourhood community. Originality, innovation and creativity shown to understand the problem and find solution i.e. in
methodology and experiment design.
9. Points to remember
The project work of CSC must be carried out in a systematic way so that it can rightly reflect the method ofscience in the works. The issue of the study may demand experimental or survey works or both. In case ofexperimental works design and principle of the experiments are very important factor which may help to geta better result in a rational way. In such case parameters of observation and verification through the experimentand its logical selection must be reflected vividly along with sets of control and approaches of data validation.Similarly, in case of survey based project universe of the study, criteria of sample selection, sample coverage,design of questionnaire or interview schedule are very important along with approaches of data compilation,validation, analysis and interpretation. Prototype model or functional models are only encouraged to beused in project presentation if issues and methods of study really demands for it.
Log-Book- Proper work diary has to be maintained while carrying out the project work. The day-to-dayactivity has to be neatly noted in the form of a log-book, and should be submitted with the project report atthe time of submission. All the details, such as Project title, name of the group leader etc. should be writtenclearly on the cover.
10. Structure of the project report
The structure of the project report of CSC is as followi. Cover page - it must incorporate (in English/Hindi alongwith the language used)
Title of the project Name and address of Group leader and co-workers (including name of the District and State). Name and address of guide
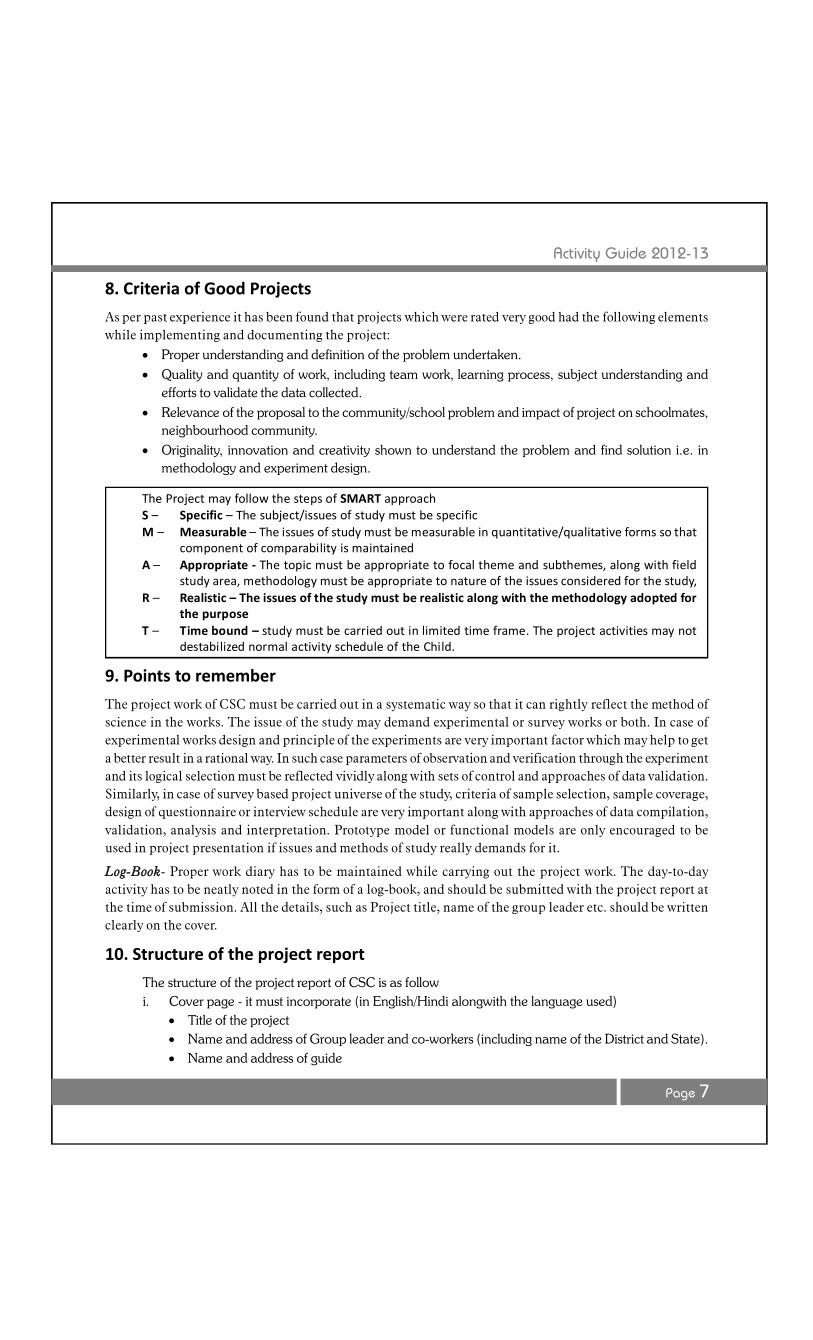
The Project may follow the steps of SMART approachS – Specific – The subject/issues of study must be specificM – Measurable – The issues of study must be measurable in quantitative/qualitative forms so that
component of comparability is maintainedA – Appropriate - The topic must be appropriate to focal theme and subthemes, along with field
study area, methodology must be appropriate to nature of the issues considered for the study,R – Realistic – The issues of the study must be realistic along with the methodology adopted for
the purposeT – Time bound – study must be carried out in limited time frame. The project activities may not
destabilized normal activity schedule of the Child.

Activity Guide 2012-13
Page 8
ii. Form - A ( Registration form) as in Annexure - V.iii. Abstract - in 250 words for lower age group and 300 words for upper age group (The English
translation of the abstract must be given if you write the report in any other language)iv. Contents- list of chapter with detail heading and sub-heading, list of table, chart, maps, etc. along
with references against page numbersv. Introduction- description on background of the studyvi. Aims and objectives of the studyvii. Hypothesisviii. Need statementix. Work planx. Methodologyxi. Observationsxii. Data analysis and interpretationxiii. Resultsxiv. Conclusionsxv. Solution to the problemxvi. Future planxvii. Acknowledgementxviii.References
The word limit for the written report for the lower age group is 2500 and that for the upper age group is 3500.The written report can be substantiated by including limited number of photographs, sketches, illustrationsand / or drawings, etc.
11. Oral presentation:Oral presentation at the technical sessions of the congress is a very important component of the entire process.Effective communication during presenting the issues of study, its objectives, methodology adopted for thestudy, important observation and findings, vital aspects on the way and approach to solve the problem oraddress problems is a very critical part of the exercise. Because only 8 minutes time is allotted for the purpose.Therefore, one has to plan pragmatically for the purpose. During presentation children have to use a maximumof 4 different posters. It must be prepared on 55 cm x 70 cm (21.6" x 27.5") drawing sheets (i.e. chart papers).If needed tools like Microsoft Power Point or any other such tools for presentation may be used.
Your posters should contain information on (1) The project title, (2) Names of the group members, (3)Objectives, (4) Map of the area, (5) Methodology, (6) Results, (7) Conclusion, (8) Solution to the problem.Depending upon the nature of the project the poster may or may not have a map and/or results.
12. Different level of CongressChildren's Science Congress is organised in three levels where the child scientists and their project works arescreened under common evaluation criteria. The evaluation of the project is done for its innovativeness,simplicity and practicality. On the basis of the merit of the project is selected for the next level. The threelevels are as follows:
Block /district level State level National level.
Activity Guide 2012-13
Page 9
The District/Block level Congress is the first level in which projects compete with one another and are screenedfor presentation at the State level Congress, the second level. Projects as per the State quota as indicated atAnnexure-I are selected from the State level for the Grand Finale - the National Children's Science Congress.Seven to eight lakh child scientists participate at various levels from the States and the Union Territories.
13. Screening
(i) The selection ratio at District/State Level and at State/National Level should be as follows:State: District = 1:15.(Out of 15 projects presented at District 1 will be screened for State Level.)
(ii) State/National = As per State quota indicated at Annexure - I.(iii) The selection ratio of Lower age group (10 to 14 years of age) to Upper age group (14+ to 17 years)
should be 40:60.
14. Tentative Activity Schedule Selection of subjects and activity for registration of teams : June-July Working on the project: Minimum two months District level Congress: By September -October State level Congress: By November National level Congress: 27-31 December ‘Kishore Vaigyanik Sammelan’ (at Indian Science Congress) from 3-7 January
15. Approaches of EvaluationThe innovative ideas and scientific methodology are the basis of a good project but one has to prove hiscommunication skills also to make others listen and understand his findings. For doing this, a total cooperationin the group is a must. Accept positive criticism within the group or even from outside and improve the workplan, this will bring award and recognition.
15.1. Evaluation Criteria
i) Originality of idea and concept: A unique or novel project idea which attempts to answer a specific question- (a hypothesis driven by curiosity to understand any concept related to focal theme). The idea shouldnot be an exact replication of the model projects as in this Activity Guide. A proper explanation oforigin of the idea may be demanded by the evaluator.
ii) Relevance of the project to the theme: This section focuses on how the project is relevant to the focal theme/sub-theme.
iii) Scientific understanding of the issue: Refers to the extent of knowledge the child scientist has in relation tothe project idea.
iv) Data collection: Systematic collection of information using relevant tools/interviews/questionnaire. Samplesize should be sufficient to support the issues under study.
v) Analysis: This includes tabulation, categorization/classification, and simple statistics as applicable tothe study.
vi) Experimentation/Scientific study/validation: Conducting of experiments/field study and validation applyingsimple methods of science. Experiment need not be every sophisticated or lab based, they could besimple, self developed and inexpensive too.

Activity Guide 2012-13
Page 10
vii) Interpretation and Problem solving attempt: To what extent the team has addressed the proposed hypothesisand the issue of the locality through the project.
viii) Team work: It refers to work division, cooperation and sharing among and beyond the team members(the child scientists).
ix) Background correction (Only at District level): In this case the background of the children is verified likegeographical location of their school, village, town etc. in relation to infrastructure, information andother input related facilities available with them. The logic is that children from difficult geographicalsituation must get some weightage in comparison to the children from advantageous geographicallocation. Non-school going children should also get some weightage in this criterion.
x) Report and Presentation: Written Report and Oral Presentation are evaluated separately. Reports areevaluated for its systematic presentation, tabulation of data in support of the project idea and the claritywith which the study is documented and explained. A Log Book (actually a Daily Diary) is mandatoryand should be authenticated over the signature of the guide teacher daily. The cover page of the LogBook should carry the names of the child scientists, the district and the Sate, in English. Marks awardedfor the presentation covers question and answer with evaluators, presentation of charts/posters,illustrations and other visuals.
xi) Follow up Action Plan (Only at State and National levels): The child scientists should try to find out scientificsolution to the bothering problem. Has the team conveyed the message to the community? How it wascommunicated? Will effort continue to involve more people till the problem is solved? Was any actionplan suggested? Credit shall be given for similar efforts.
xii) Improvement from the previous level (Only at State and National levels): This is to encourage the child scientiststowards their continuous involvement with the project for its improvement. Improvements on the workfrom District to state level and then from State level to the national level will be given marks separately.The evaluators shall specify the areas of improvement on a separate sheet of paper.
xiii) Additional page(s): These must be there in the Project Report with detail description of works ofimprovement done after the previous level (particularly on the basis of the evaluators' suggestion in theprevious level).
15.2. Evaluators
i) Evaluators may please note that the participating children are budding scientists from the age group of10 to 17 years with limited access to knowledge centres and therefore require encouragement. Havingunderstood their capabilities and capacities, the evaluators should provide them with constructive inputsand positive feedback.
ii) Evaluators should appreciate and value the efforts, innovativeness and confidence of the participatingchild scientists and ensure that their honest assessment work as a guiding light for future endeavours ofthe child scientists and each one goes back motivated, intellectually rich and more confident.
iii) Evaluators should evaluate the projects on the basis of subject matter and scientific content and are notinfluenced by the gadgetry used or oratory skills of the participants. They should avoid unwarrantedcomments and also avoid comparing the works of the child scientists with those carried out by seniormembers or scientists.
iv) Evaluators should avoid being any source of distraction to the child scientists while presentation is goingon and do not take the interactions with the participants as a test what the participating child does notknow, rather, they make efforts to know what the child scientist know about the subject area.
Activity Guide 2012-13
Page 11
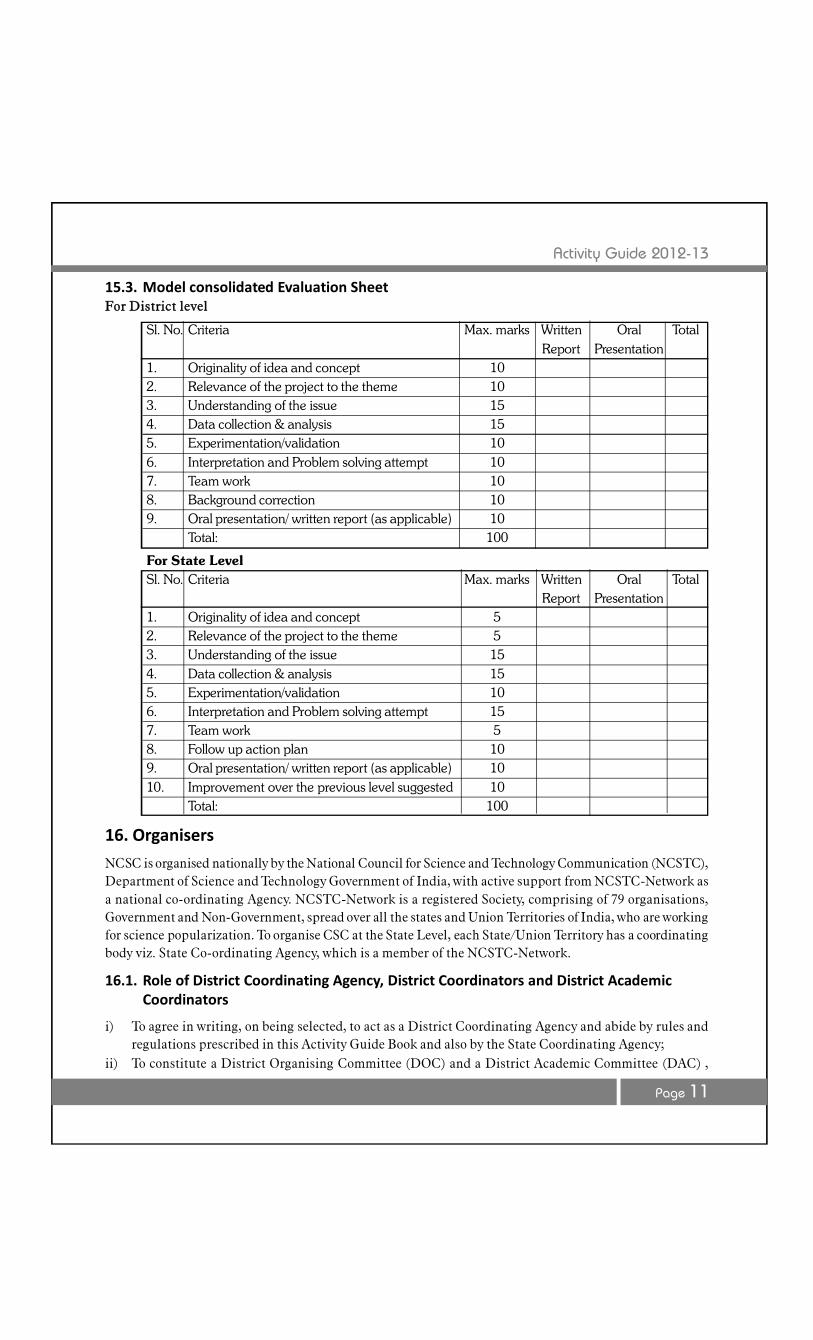
15.3. Model consolidated Evaluation SheetFor District level
Sl. No. Criteria Max. marks Written Oral TotalReport Presentation
1. Originality of idea and concept 102. Relevance of the project to the theme 103. Understanding of the issue 154. Data collection & analysis 155. Experimentation/validation 106. Interpretation and Problem solving attempt 107. Team work 108. Background correction 109. Oral presentation/ written report (as applicable) 10
Total: 100
For State LevelSl. No. Criteria Max. marks Written Oral Total
Report Presentation1. Originality of idea and concept 52. Relevance of the project to the theme 53. Understanding of the issue 154. Data collection & analysis 155. Experimentation/validation 106. Interpretation and Problem solving attempt 157. Team work 58. Follow up action plan 109. Oral presentation/ written report (as applicable) 1010. Improvement over the previous level suggested 10
Total: 100
16. Organisers
NCSC is organised nationally by the National Council for Science and Technology Communication (NCSTC),Department of Science and Technology Government of India, with active support from NCSTC-Network asa national co-ordinating Agency. NCSTC-Network is a registered Society, comprising of 79 organisations,Government and Non-Government, spread over all the states and Union Territories of India, who are workingfor science popularization. To organise CSC at the State Level, each State/Union Territory has a coordinatingbody viz. State Co-ordinating Agency, which is a member of the NCSTC-Network.
16.1. Role of District Coordinating Agency, District Coordinators and District AcademicCoordinators
i) To agree in writing, on being selected, to act as a District Coordinating Agency and abide by rules andregulations prescribed in this Activity Guide Book and also by the State Coordinating Agency;
ii) To constitute a District Organising Committee (DOC) and a District Academic Committee (DAC) ,
Activity Guide 2012-13
Page 12
minimum 7 (seven) members can be selected from teachers, activists, ex-child scientists, governmentofficials, officials of the local bodies etc. and send the lists to the State Coordinator by the date specified.The District Coordinators shall act as the Member-Secretary of both the Committees;
iii) To register groups of children (2 to 5 in one group) in Form A (Annexure V) and provide them withnecessary reference materials, kits and guidance. Number of groups registered to be intimated to theState Coordinator by the date specified;
iv) While registering the District Co-ordinator should be assured that, the age of the child scientist fallswithin the age as on 31st December of the calendar year. If need be a copy of the age-certificate may beretained by the District Co-ordinator, to avoid any confusion at later stages. Even while participating atthe National Congress, the State Co-ordinator may also keep a copy of the certificate.
v) To select schools from rural and urban area in an equal ratio;vi) To organise District level Teachers’ Orientation Workshops with the help of the State Coordinators;vii) To interact with local scientist and arrange for their periodic interaction with the registered group of
children, if required;viii) Try to involve at least 50 schools and 250 numbers of project in the district including those from informal
education systemix) Organise District level Congress, Orientation of Evaluators in consultation with the State Coordinators;x) To submit Feed-back Reports on all activities, containing names of schools and number of projects at
district level and follow up action taken on projects likely to become part of community action,photocopies of all Registration/Attendance Sheets for all Workshops/Meetings, Evaluation Sheets inoriginal, samples of certificates issued, mementos presented to child scientists, photo-documentationetc. related to CSC at the District level to the State Coordinator in the manner and by the date specified;
xi) To maintain a Bank Account and maintain Accounts at the District level and submit an audited Receipts& Payment Account to the State Coordinators by the date and in the manner specified;
xii) To maintain infrastructural facilities, including electronic communication facility such as internetconnectivity, fax etc.
xiii) To arrange review and mentoring of the projects selected for presentation at the State Level NCSC.
16.2. Role of State Coordinating Agency, State Coordinators and State Academic CoordinatorsThe State Coordinating Agency shall have the overall responsibility for the implementation of NCSC at theState level. The specific responsibilities shall be -
i) Constitute a State Organising Committee (SOC) and a State Academic Committee (SAC) whereminimum 7 (seven) members to be selected from teachers, activists, ex-child scientists, governmentofficials, officials of the local bodies, Network members in the State and other non-Network organisationsspecifically active in a region in the State, where the State Coordinating Agency does not have a reach).Submit the list of SOC, SAC, DOC and DAC along with project proposal for districts and state. TheState Coordinators shall act as the Member-Secretary of both the Committees;
ii) To constitute Regional Coordinators, if found necessary in case of big States and to involve SCERT,DIET, IRIS and organisations working with handicapped children/elder citizens and mediarepresentatives. Distribution of geographical area for organisational purposes etc. will be the prerogativeof the State Coordinators;
iii) To locate individuals, schools specially interested in other curricular activities;iv) To select District Coordinating Agencies and obtain consent letter from the respective organisation,
where they have to agree to abide by the guideline of CSC and willing to follow the guideline ofNCSTC,DST; NCSTC - Network and respective State Coordinating agency of the state.
Activity Guide 2012-13
Page 13
v) Organise Orientation Workshops of District Coordinators and teachers with the help of subject experts;vi) To coordinate translation of the Activity Guide Book to be used by the children, in local language and
make them available to the District Coordinators;vii) To maintain a Bank Account and maintain Accounts at the State level and submit an audited Receipts
& Payment Account to the funding agencies within three months of the date of event with a ProjectCompletion Report and a Utilization Certificate in the manner prescribed;
viii) To submit Feed-back Reports on all activities, samples of certificates issued, mementos presented tochild scientists, photo-documentation etc. related to CSC at the State level to the funding agency in themanner and by the date specified;
ix) To remit funds to District Coordinating Agencies by account payee cheques;x) To form linkages with Testing and Monitoring facilities available in the State (with NGOs as well as
Government), Municipal Corporations and other local bodies etc. to help children in betterimplementation (information collection/sample testing) of their activities( Identity Cards may be issuedto children registered for activities) through District Coordinators/State Coordinator;
xi) To arrange review and mentoring of the projects selected for presentation at the National Level ofNCSC.
xii) To ensure that Evaluation sheets, both written and oral are forwarded to the next higher level, i.e. fromdistrict to State and from State to National level, else the district / State contingent might not be registeredduring State/National level CSC.
xiii) State Academic Coordinators should work in close association with the district/State Coordinators forarranging evaluation process and shall make an effort to send one member from State AcademicCommittee as an Observer to the district level CSC. His/her signature on the selection list is mandatory.The entire process of evaluation is to be supervised by the Observer. Decision of the State AcademicCommittee shall be final word on the selection.
16.3. Note for State Coordinators and District Coordinators
i) The age limits for participation must not be less than 10 years and more than 17 years on December 31of the year.
ii) Relatives of District Coordinators, District Academic Coordinators, State Coordinators and StateAcademic Coordinators will not be selected for National CSC. They may leave the post for the year ifparticipation of the ward is desired.
iii) A child scientist cannot participate in the National Level CSC two times, as a group leader, in the sameage group.
iv) Two selected projects (one from lower age group and other from upper age group) from each state areselected to participate in ‘Kishore Vaigyanik Sammelan’ of Indian Science Congress held every yearduring January 3-7.
v) CSC projects meeting the following criteria may also apply to Technology Entrepreneurship PromotionProgram for support. The idea should be new/novel, The idea should have potentiality for translating it into working model/ prototype/process, The idea should be based on known scientific principle, The idea should have commercial feasibility/ technical viability.
vi) Proposals from individual innovators to convert an original idea / invention / know-how into workingprototype / processes. These proposals can be made by individuals or jointly with any sponsoring organisations.
Activity Guide 2012-13
Page 14
Selected projects will be provided financial support to undertake the above developments, patent supportand guidance, scientific / technical consultancy, fabrication assistance, market information and networkingwith related research lab/ institutes as required. For detailed information you may contact:
Techno-entrepreneur Promotion Programme,Ministry of Science & Technology, Post Bag No. 66, Hauz Khas, New Delhi -10016.
For further detail one may contactDr B.P. Singh
Scientist-G & Head, National Council for Science and Technology Communication (NCSTC)Dr D. K. Pandey
Scientist E & National Programme Coordinator of NCSCNational Council for Science and Technology Communication (NCSTC),
Department of Science and TechnologyTechnology Bhavan, New Mehrauli Road, New Delhi - 110016,
Email ID: [email protected];Telephone no:01126535564/26590251
Prof. S.P. VermaChairperson, NCSTC-Network
Mobile - 09835247590Email- [email protected]
Mr R.S. RaghuvanshiGeneral Secretary, NCSTC Network
NCSTC-Network , E-56, Pandav Nagar, New Delhi - 110091Email - [email protected]
[email protected] - 011-22799236
Mobile- 09868404002Or
State Coordinator of the Respective State (see annexure-II)
Some important points for Participation in the Indian Science Congress's'Kishore Vaigyanik Sammelan'
Any one of the co-worker (preferably second in the team) of the selected two best project of state levelcongress (one from lower age group and one from upper age group) will participate in this programme.
This session is a poster presentation session, so following aspects has to be taken care for participationi. Use four posters which was used earlier in the state congress (as suggested by the evaluators in the
state congress and mentors. It may be imroproved)ii. The poster must use English along with children's own languageiii. Keep a copy of the project reportiv. You will also have to keep copies of abstract in English separately (for distribution if required) with
details of the all team members, teacher guide and state represented mentioned clearly.
v. Poster can be designed in such a way that it is readable from a considerable distance and maintainthat excessive use colour does not create hurdles in reading and viewing
Children will be accompanied by an escort teacher.
Activity Guide 2012-13
Page 15
Part-II
Focal themeSub-themes
Activity Guide 2012-13
Page 16
Reflection of some thought on energy issues
“I’d put my money on the sun and solar energy. What a source of power! I hope we don’t have to wait ’til oiland coal run out before we tackle that”.
- Thomas Edison (1847-1931)1
“First, there is the power of the Wind, constantly exerted over the globe… Here is an almost incalculablepower at our disposal, yet how trifling the use we make of it”.
- Henry David Thoreau2
“Every time you look up at the sky, every one of those points of light is a reminder that fusion power isextractable from hydrogen and other light elements, and it is an everyday reality throughout the Milky WayGalaxy”.
-Carl Sagan3
I believe that the average guy in the street will give up a great deal, if he really understands the cost of notgiving it up. In fact, we may find that, while we're drastically cutting our energy consumption, we're actuallyraising our standard of living."Is the minor convenience of allowing the present generation the luxury of doubling its energy consumptionevery 10 years worth the major hazard of exposing the next 20,000 generations to this lethal waste?"
- David R. Brower4
“The climate challenge illustrates how we have to change. The developing countries need more support andopportunities to develop and use clean energy. Because if the current situation continues, then the world willnot be able to handle this burden”.
- Gro Harlem Brundtland5
"Energy Policy will be and should be driven by environmental policy in the future”.- Timothy Wirth6
1. Thomas Alva Edison (February 11, 1847 - October 18, 1931) was an American inventor and businessman. He developed manydevices that greatly influenced life around the world, including the phonograph, the motion picture camera, and a long-lasting,practical electric light bulb.
2. Henry David Thoreau (July 12, 1817 - May 6, 1862) was an American author, poet, philosopher, abolitionist, naturalist, taxresister, development critic, surveyor, historian, and leading transcendentalist. He is best known for his book Walden, a reflectionupon simple living in natural surroundings, and his essay Civil Disobedience, an argument for individual resistance to civilgovernment in moral opposition to an unjust state.
3. Carl Sagan (1934-1996), American Scientist, Social Activist, who was awarded the "Nuclear Age Peace Foundation's PeaceLeadership Award"
4. David Brower (1912-2000) , American Environmentalist Co-Founder Sierra Club, Friends of the Earth,Earth Island Institute
5. Gro Harlem Brundtland, Former Director-General of the World Health Organization, who was awarded the 2001 World EcologyAward
6. Timothy Wirth, American Politician, Environmental Advocate and President of the Better World Campaign an UN initiatives
Activity Guide 2012-13
Page 17
"Energy: Explore, Harness and Conserve"Energy is considered as a crucial input parameter for day to day work and for economic development of a country.Per capita energy consumption is one of the key deciding factors of the level of well-being of any society or for anycountry. It is also referred through the relationship between economic growth and energy consumption.
In reality, economic development of any region or a country largely depends on how its energy requirementsare satisfied. Every production process has certain amount of energy requirement. Hence, availability ofquality energy is crucial for overall scientific and technological progress of any country.
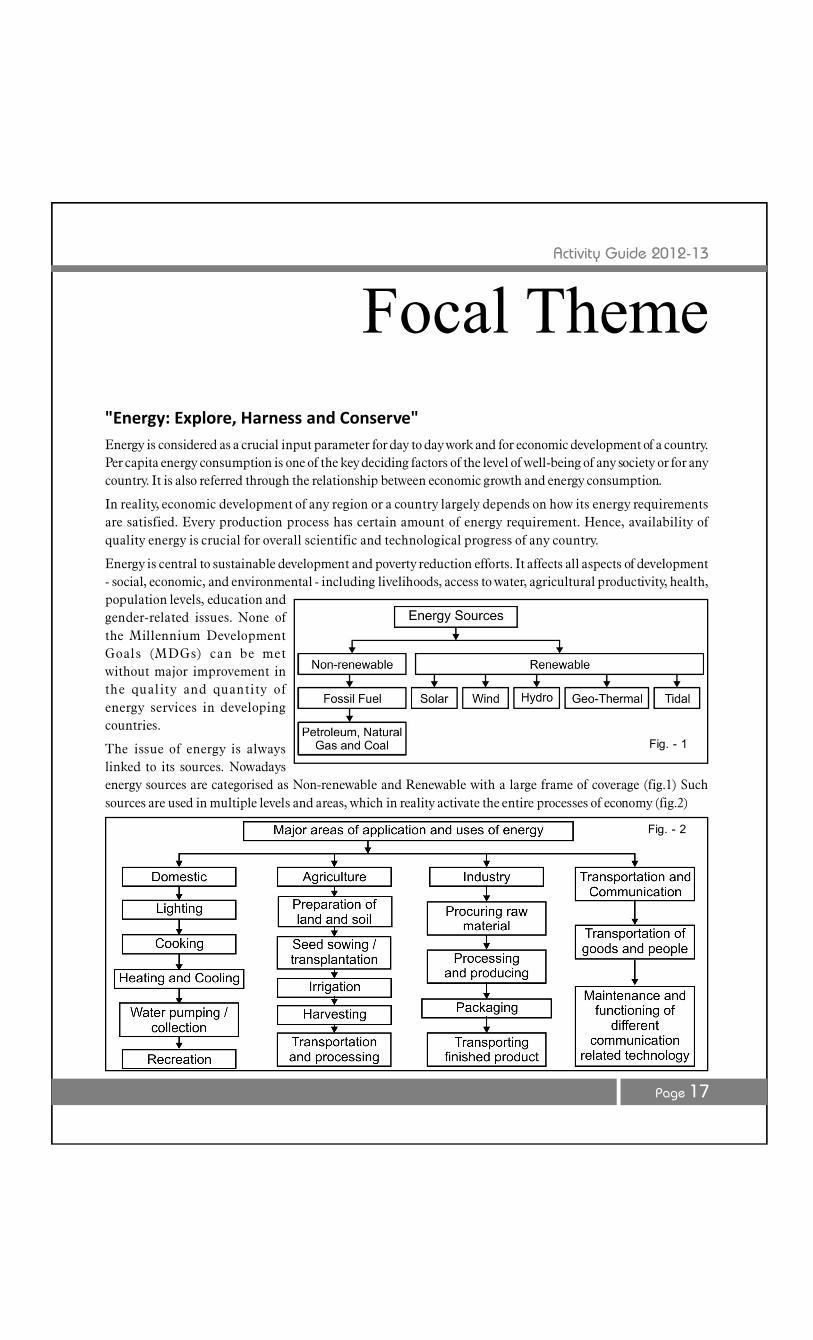
Energy is central to sustainable development and poverty reduction efforts. It affects all aspects of development- social, economic, and environmental - including livelihoods, access to water, agricultural productivity, health,population levels, education andgender-related issues. None ofthe Millennium DevelopmentGoals (MDGs) can be metwithout major improvement inthe quality and quantity ofenergy services in developingcountries.
The issue of energy is alwayslinked to its sources. Nowadaysenergy sources are categorised as Non-renewable and Renewable with a large frame of coverage (fig.1) Suchsources are used in multiple levels and areas, which in reality activate the entire processes of economy (fig.2)
Focal Theme
Fig. - 1
Fig. - 2
Activity Guide 2012-13
Page 18
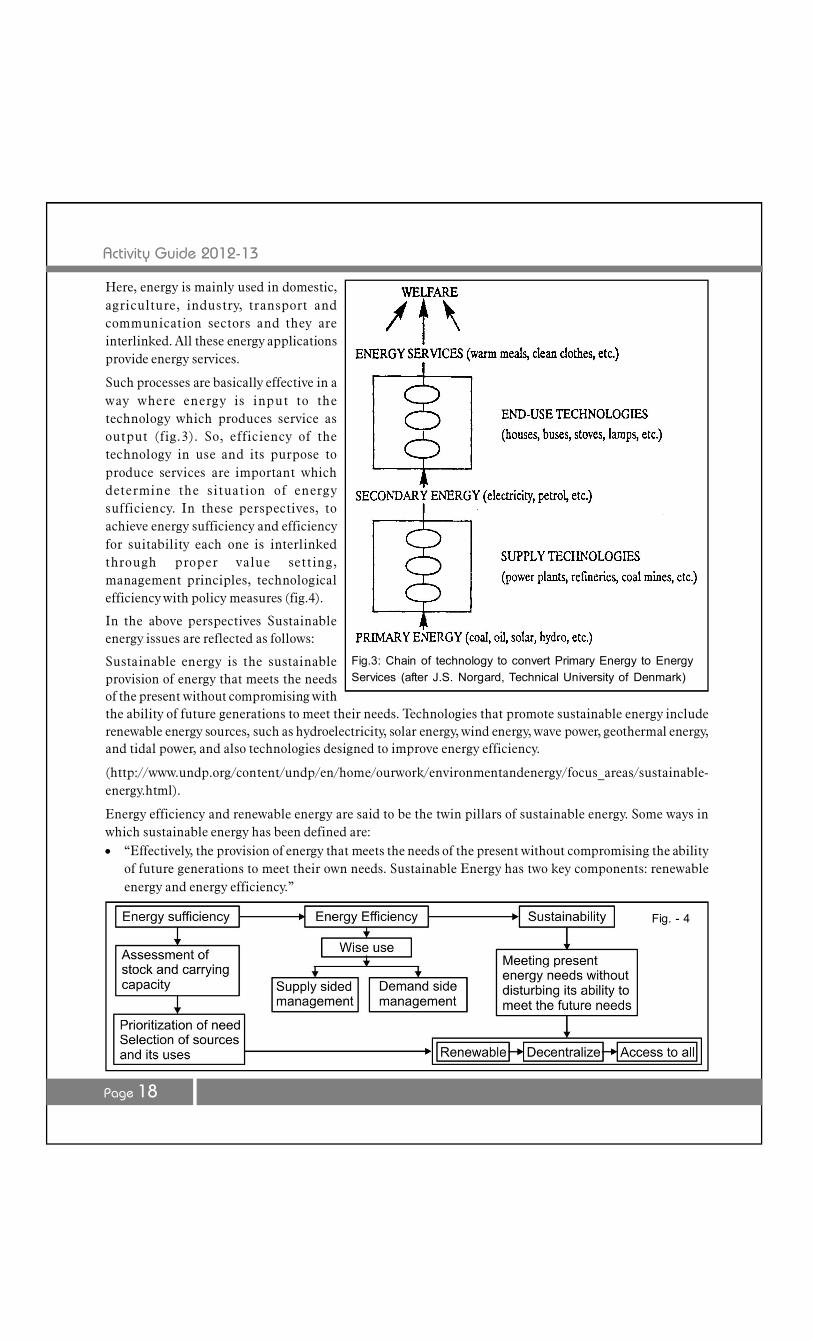
Here, energy is mainly used in domestic,agriculture, industry, transport andcommunication sectors and they areinterlinked. All these energy applicationsprovide energy services.
Such processes are basically effective in away where energy is input to thetechnology which produces service asoutput (fig.3). So, efficiency of thetechnology in use and its purpose toproduce services are important whichdetermine the situation of energysufficiency. In these perspectives, toachieve energy sufficiency and efficiencyfor suitability each one is interlinkedthrough proper value setting,management principles, technologicalefficiency with policy measures (fig.4).
In the above perspectives Sustainableenergy issues are reflected as follows:
Sustainable energy is the sustainableprovision of energy that meets the needsof the present without compromising withthe ability of future generations to meet their needs. Technologies that promote sustainable energy includerenewable energy sources, such as hydroelectricity, solar energy, wind energy, wave power, geothermal energy,and tidal power, and also technologies designed to improve energy efficiency.
(http://www.undp.org/content/undp/en/home/ourwork/environmentandenergy/focus_areas/sustainable-energy.html).
Energy efficiency and renewable energy are said to be the twin pillars of sustainable energy. Some ways inwhich sustainable energy has been defined are: “Effectively, the provision of energy that meets the needs of the present without compromising the ability
of future generations to meet their own needs. Sustainable Energy has two key components: renewableenergy and energy efficiency.”
Fig.3: Chain of technology to convert Primary Energy to EnergyServices (after J.S. Norgard, Technical University of Denmark)
Fig. - 4
Activity Guide 2012-13
Page 19
“Dynamic harmony between equitable availability of energy-intensive goods and services to all peopleand the preservation of the earth for future generations”. And, “the solution will lie in finding sustainableenergy sources and more efficient means of converting and utilizing energy”.
“Any energy generation, efficiency & conservation source where resources are available to enable significantportion of energy generation in long term”.
“Energy which is replenished within a human lifetime and causes no long-term damage to the environment”. Energy efficiency remains a cost effective way of improving the environmental impact of energy use,
increasing security, improving competitiveness and providing affordable services. (“The Twin Pillars ofSustainable Energy: Synergies between Energy Efficiency and Renewable Energy Technology and Policy”.www.aceee.org.)
Energy sufficiency is some time considered as normative concept to make differences between need andgreed and prefer for the best. However, the growing concern for climate change and energy security nowmeans that energy sufficiency is something that warrants serious consideration. It looks beyond technicalenergy efficiency measures and address the challenging issue of curbing consumer demand for energy servicesin an ethically acceptable fashion. It also implies a need to recognize limits and to establish acceptableminimum standards for energy services. (Derby Sarah “Enough is as good as a feast- sufficiency as policy”ECEEE-2007, Summer Study, Saving Energy- Just do it! P. 111-119).
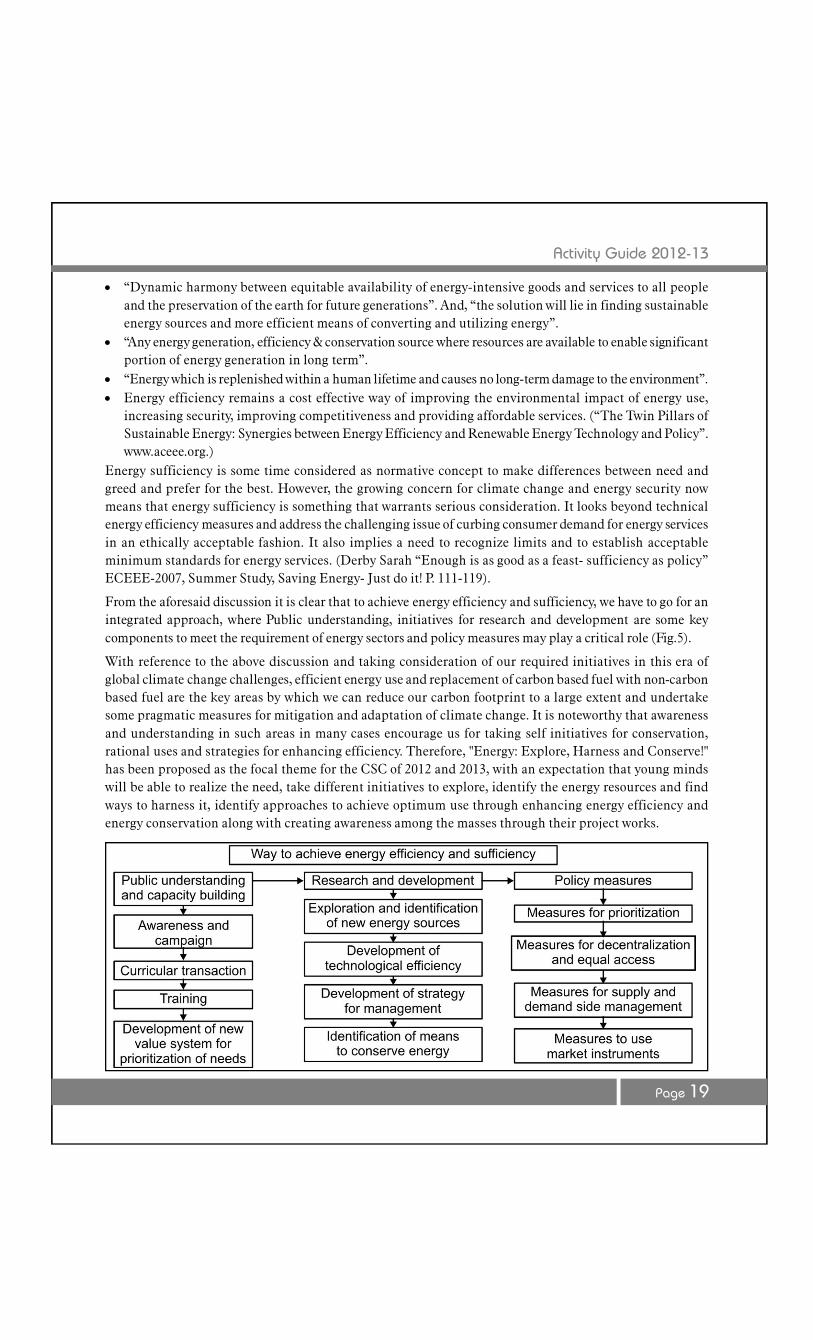
From the aforesaid discussion it is clear that to achieve energy efficiency and sufficiency, we have to go for anintegrated approach, where Public understanding, initiatives for research and development are some keycomponents to meet the requirement of energy sectors and policy measures may play a critical role (Fig.5).
With reference to the above discussion and taking consideration of our required initiatives in this era ofglobal climate change challenges, efficient energy use and replacement of carbon based fuel with non-carbonbased fuel are the key areas by which we can reduce our carbon footprint to a large extent and undertakesome pragmatic measures for mitigation and adaptation of climate change. It is noteworthy that awarenessand understanding in such areas in many cases encourage us for taking self initiatives for conservation,rational uses and strategies for enhancing efficiency. Therefore, "Energy: Explore, Harness and Conserve!"has been proposed as the focal theme for the CSC of 2012 and 2013, with an expectation that young mindswill be able to realize the need, take different initiatives to explore, identify the energy resources and findways to harness it, identify approaches to achieve optimum use through enhancing energy efficiency andenergy conservation along with creating awareness among the masses through their project works.
Activity Guide 2012-13
Page 20
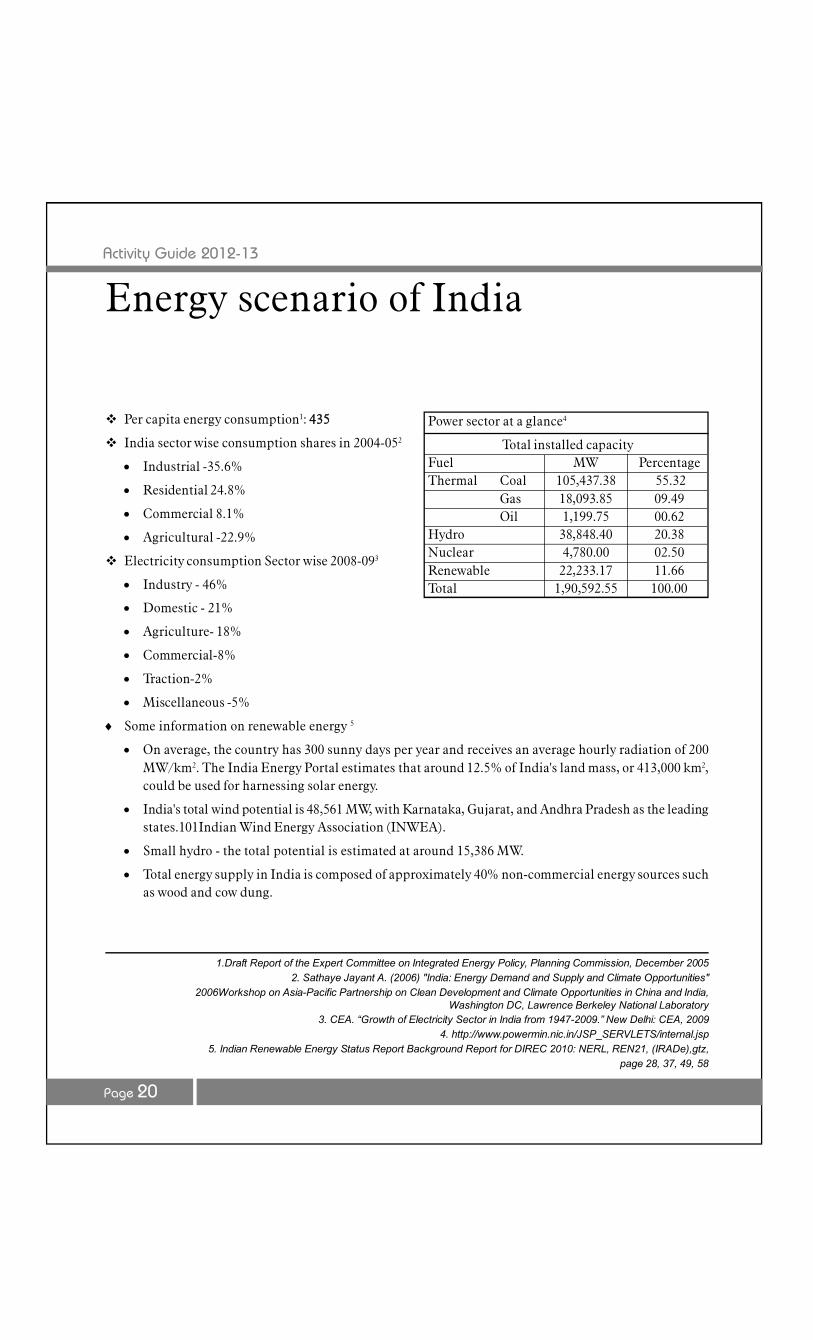
Per capita energy consumption1: 435
India sector wise consumption shares in 2004-052
Industrial -35.6%
Residential 24.8%
Commercial 8.1%
Agricultural -22.9%
Electricity consumption Sector wise 2008-093
Industry - 46%
Domestic - 21%
Agriculture- 18%
Commercial-8%
Traction-2%
Miscellaneous -5%
Some information on renewable energy 5
On average, the country has 300 sunny days per year and receives an average hourly radiation of 200MW/km2. The India Energy Portal estimates that around 12.5% of India's land mass, or 413,000 km2,could be used for harnessing solar energy.
India's total wind potential is 48,561 MW, with Karnataka, Gujarat, and Andhra Pradesh as the leadingstates.101Indian Wind Energy Association (INWEA).
Small hydro - the total potential is estimated at around 15,386 MW.
Total energy supply in India is composed of approximately 40% non-commercial energy sources suchas wood and cow dung.
Power sector at a glance4
Total installed capacityFuel MW PercentageThermal Coal 105,437.38 55.32
Gas 18,093.85 09.49Oil 1,199.75 00.62
Hydro 38,848.40 20.38Nuclear 4,780.00 02.50Renewable 22,233.17 11.66Total 1,90,592.55 100.00
1.Draft Report of the Expert Committee on Integrated Energy Policy, Planning Commission, December 20052. Sathaye Jayant A. (2006) "India: Energy Demand and Supply and Climate Opportunities"
2006Workshop on Asia-Pacific Partnership on Clean Development and Climate Opportunities in China and India,Washington DC, Lawrence Berkeley National Laboratory
3. CEA. “Growth of Electricity Sector in India from 1947-2009.” New Delhi: CEA, 20094. http://www.powermin.nic.in/JSP_SERVLETS/internal.jsp
5. Indian Renewable Energy Status Report Background Report for DIREC 2010: NERL, REN21, (IRADe),gtz,page 28, 37, 49, 58
Energy scenario of India
Activity Guide 2012-13
Page 21
Sub-Theme-I
Energy Resources

Activity Guide 2012-13
Page 22
Dr. P.B. ChakrabortyDr. L.N. HarshDr. Subhas Chandra SamantaMr. Amarjeet SinghMs. Sudeep Kaur
Working Group of the sub-theme
Activity Guide 2012-13
Page 23
1. Introduction
Energy inputs are the critical components of national economic activity of our country, which contributes inincreasing the gross domestic product (GDP) at an average annual rate of over 7% since 2004. However, it isbelieved by all concerned around the world that the conventional sources of energy, particularly the fossilfuels, will get exhausted by the turn of this century. It is, therefore, essential to identify the different energyresources, their potential reserves, and sustainability.
All the energy sources are divided into two groups- Renewable and Non- renewable.
1.1. Renewable Energy:
Renewable energy includes solar, wind, hydel, bio-mass and geothermal resources.
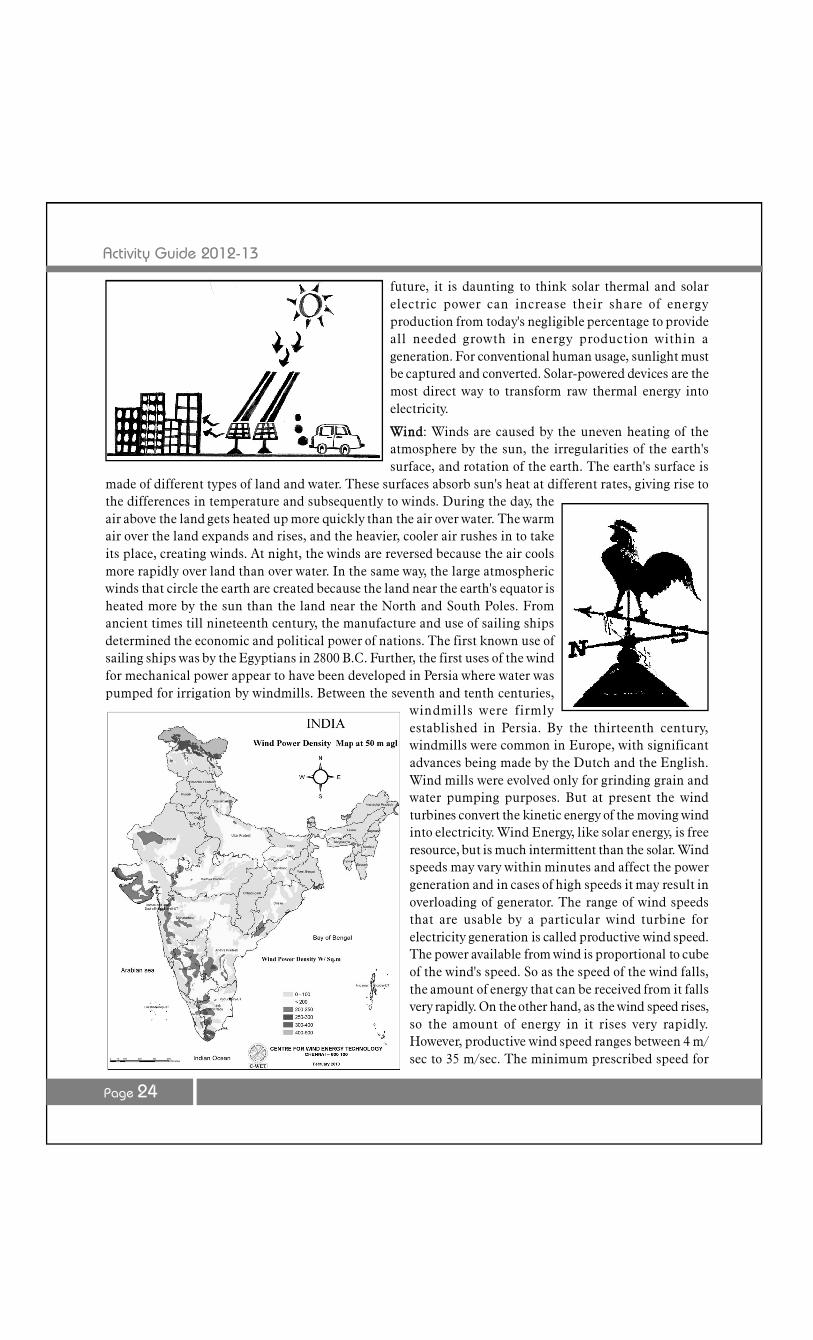
Solar: The sun's rays, or solar energy, have been used since the beginning of time and is vital to all livingthings. In addition to solar energy being a constant resource, heat and electricity are other forms of energywhich can be made from free and unlimited source of solar energy. The sun is although 93 million milesaway, but there would have been no life on earth without it. From growing crops to heating our homes, wehave become more dependent on sun then ever before, as new technologies harness its energy to supply theneeds of our present-day society.
It is the unique source from which fuel is madedirectly or indirectly. The sun creates convectiveheat currents that stir the winds in ouratmosphere. The sun drives the hydrologicalcycle causing water to evaporate and condense.Plants also process radiant energy through aprocess called photosynthesis.
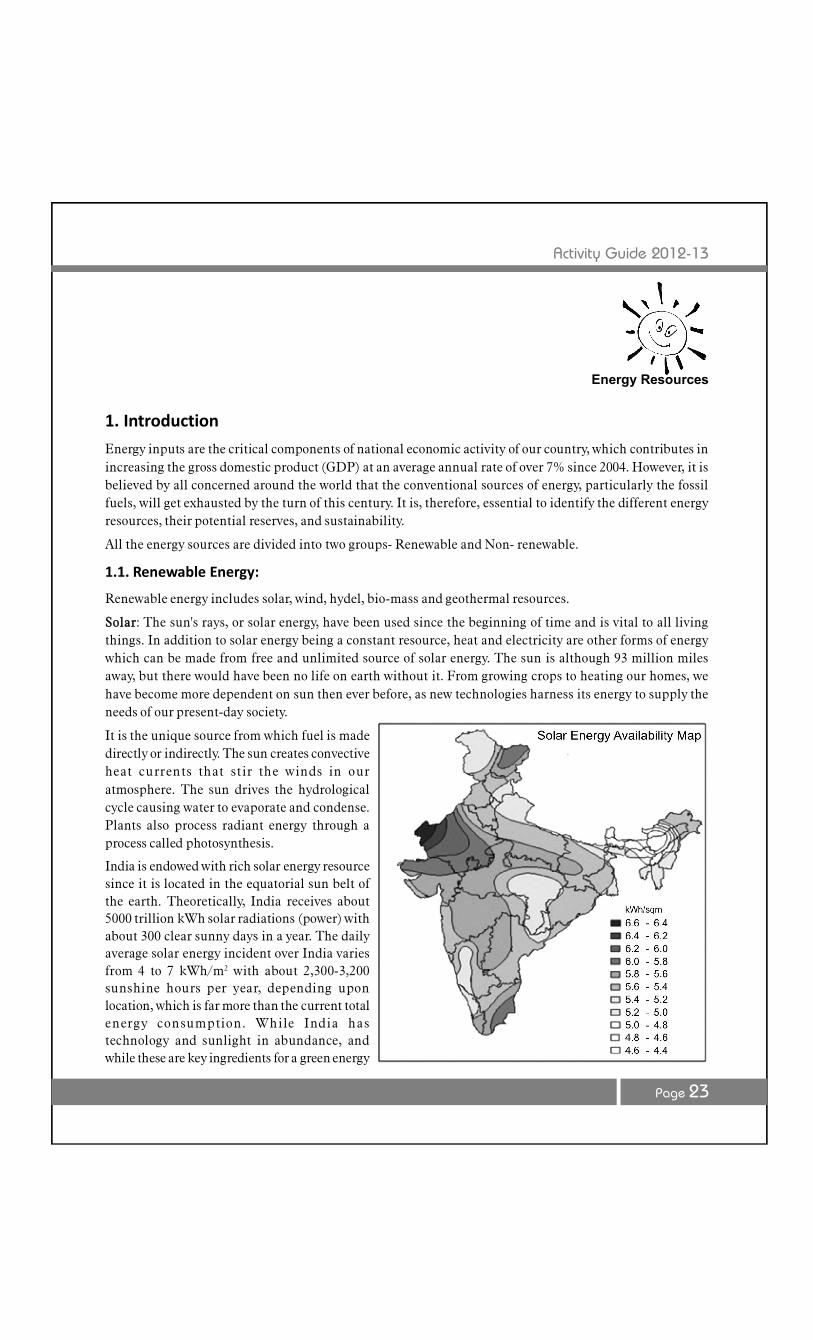
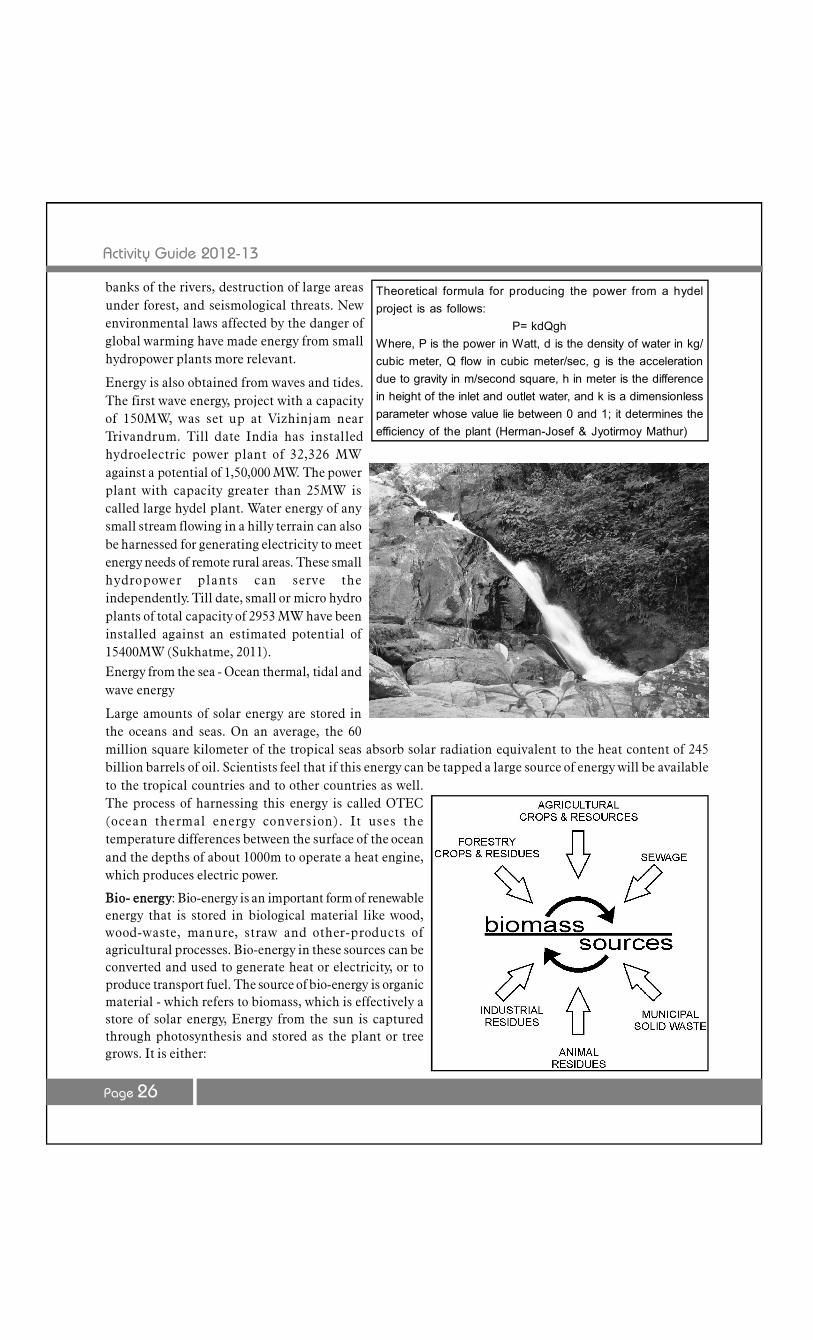
India is endowed with rich solar energy resourcesince it is located in the equatorial sun belt ofthe earth. Theoretically, India receives about5000 trillion kWh solar radiations (power) withabout 300 clear sunny days in a year. The dailyaverage solar energy incident over India variesfrom 4 to 7 kWh/m2 with about 2,300-3,200sunshine hours per year, depending uponlocation, which is far more than the current totalenergy consumption. While India hastechnology and sunlight in abundance, andwhile these are key ingredients for a green energy
Energy Resources
Activity Guide 2012-13
Page 24
future, it is daunting to think solar thermal and solarelectric power can increase their share of energyproduction from today's negligible percentage to provideall needed growth in energy production within ageneration. For conventional human usage, sunlight mustbe captured and converted. Solar-powered devices are themost direct way to transform raw thermal energy intoelectricity.
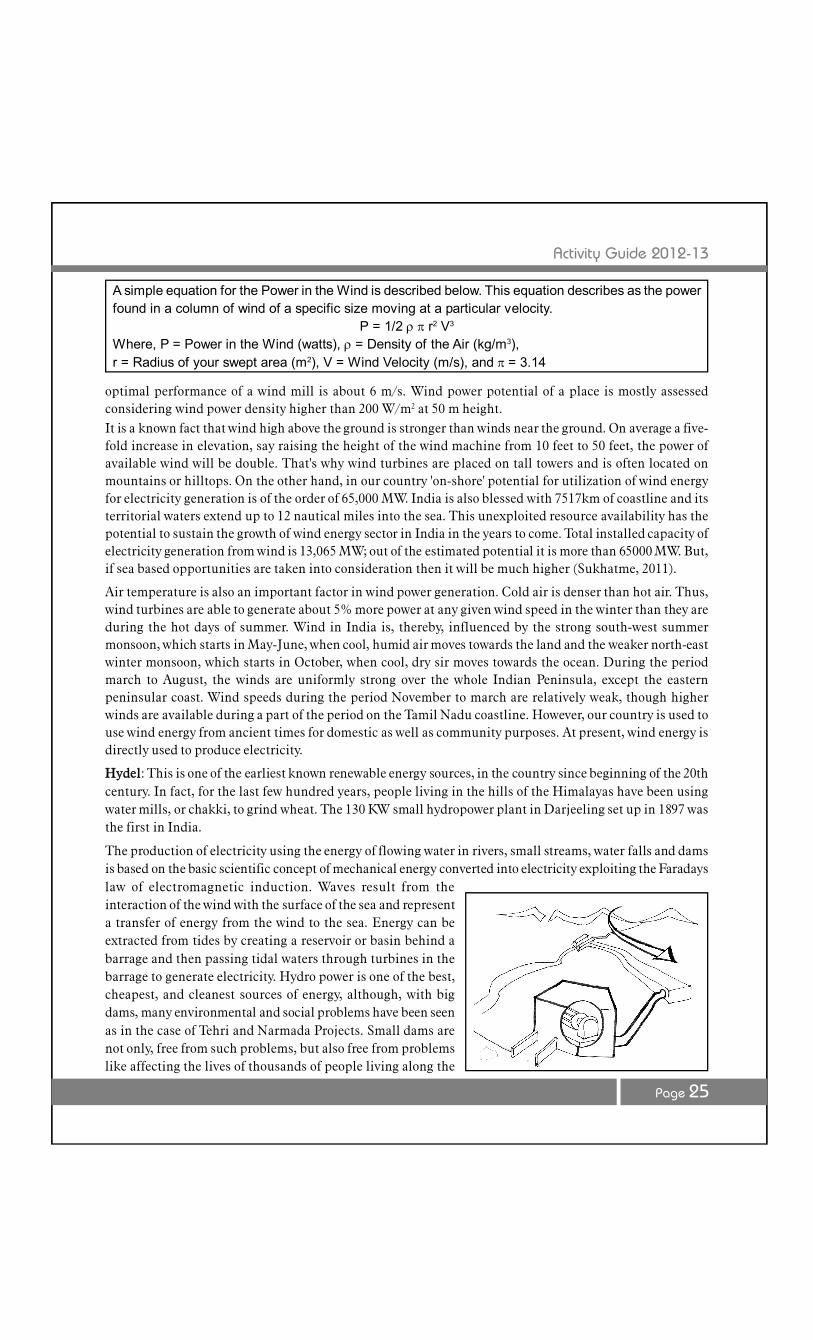
Wind: Winds are caused by the uneven heating of theatmosphere by the sun, the irregularities of the earth'ssurface, and rotation of the earth. The earth's surface is
made of different types of land and water. These surfaces absorb sun's heat at different rates, giving rise tothe differences in temperature and subsequently to winds. During the day, theair above the land gets heated up more quickly than the air over water. The warmair over the land expands and rises, and the heavier, cooler air rushes in to takeits place, creating winds. At night, the winds are reversed because the air coolsmore rapidly over land than over water. In the same way, the large atmosphericwinds that circle the earth are created because the land near the earth's equator isheated more by the sun than the land near the North and South Poles. Fromancient times till nineteenth century, the manufacture and use of sailing shipsdetermined the economic and political power of nations. The first known use ofsailing ships was by the Egyptians in 2800 B.C. Further, the first uses of the windfor mechanical power appear to have been developed in Persia where water waspumped for irrigation by windmills. Between the seventh and tenth centuries,
windmills were firmlyestablished in Persia. By the thirteenth century,windmills were common in Europe, with significantadvances being made by the Dutch and the English.Wind mills were evolved only for grinding grain andwater pumping purposes. But at present the windturbines convert the kinetic energy of the moving windinto electricity. Wind Energy, like solar energy, is freeresource, but is much intermittent than the solar. Windspeeds may vary within minutes and affect the powergeneration and in cases of high speeds it may result inoverloading of generator. The range of wind speedsthat are usable by a particular wind turbine forelectricity generation is called productive wind speed.The power available from wind is proportional to cubeof the wind's speed. So as the speed of the wind falls,the amount of energy that can be received from it fallsvery rapidly. On the other hand, as the wind speed rises,so the amount of energy in it rises very rapidly.However, productive wind speed ranges between 4 m/sec to 35 m/sec. The minimum prescribed speed for
Activity Guide 2012-13
Page 25
optimal performance of a wind mill is about 6 m/s. Wind power potential of a place is mostly assessedconsidering wind power density higher than 200 W/m2 at 50 m height.It is a known fact that wind high above the ground is stronger than winds near the ground. On average a five-fold increase in elevation, say raising the height of the wind machine from 10 feet to 50 feet, the power ofavailable wind will be double. That's why wind turbines are placed on tall towers and is often located onmountains or hilltops. On the other hand, in our country 'on-shore' potential for utilization of wind energyfor electricity generation is of the order of 65,000 MW. India is also blessed with 7517km of coastline and itsterritorial waters extend up to 12 nautical miles into the sea. This unexploited resource availability has thepotential to sustain the growth of wind energy sector in India in the years to come. Total installed capacity ofelectricity generation from wind is 13,065 MW; out of the estimated potential it is more than 65000 MW. But,if sea based opportunities are taken into consideration then it will be much higher (Sukhatme, 2011).
Air temperature is also an important factor in wind power generation. Cold air is denser than hot air. Thus,wind turbines are able to generate about 5% more power at any given wind speed in the winter than they areduring the hot days of summer. Wind in India is, thereby, influenced by the strong south-west summermonsoon, which starts in May-June, when cool, humid air moves towards the land and the weaker north-eastwinter monsoon, which starts in October, when cool, dry sir moves towards the ocean. During the periodmarch to August, the winds are uniformly strong over the whole Indian Peninsula, except the easternpeninsular coast. Wind speeds during the period November to march are relatively weak, though higherwinds are available during a part of the period on the Tamil Nadu coastline. However, our country is used touse wind energy from ancient times for domestic as well as community purposes. At present, wind energy isdirectly used to produce electricity.
Hydel: This is one of the earliest known renewable energy sources, in the country since beginning of the 20thcentury. In fact, for the last few hundred years, people living in the hills of the Himalayas have been usingwater mills, or chakki, to grind wheat. The 130 KW small hydropower plant in Darjeeling set up in 1897 wasthe first in India.
The production of electricity using the energy of flowing water in rivers, small streams, water falls and damsis based on the basic scientific concept of mechanical energy converted into electricity exploiting the Faradayslaw of electromagnetic induction. Waves result from theinteraction of the wind with the surface of the sea and representa transfer of energy from the wind to the sea. Energy can beextracted from tides by creating a reservoir or basin behind abarrage and then passing tidal waters through turbines in thebarrage to generate electricity. Hydro power is one of the best,cheapest, and cleanest sources of energy, although, with bigdams, many environmental and social problems have been seenas in the case of Tehri and Narmada Projects. Small dams arenot only, free from such problems, but also free from problemslike affecting the lives of thousands of people living along the
A simple equation for the Power in the Wind is described below. This equation describes as the powerfound in a column of wind of a specific size moving at a particular velocity.
P = 1/2 r2 V3
Where, P = Power in the Wind (watts), = Density of the Air (kg/m3),r = Radius of your swept area (m2), V = Wind Velocity (m/s), and = 3.14
Activity Guide 2012-13
Page 26
banks of the rivers, destruction of large areasunder forest, and seismological threats. Newenvironmental laws affected by the danger ofglobal warming have made energy from smallhydropower plants more relevant.
Energy is also obtained from waves and tides.The first wave energy, project with a capacityof 150MW, was set up at Vizhinjam nearTrivandrum. Till date India has installedhydroelectric power plant of 32,326 MWagainst a potential of 1,50,000 MW. The powerplant with capacity greater than 25MW iscalled large hydel plant. Water energy of anysmall stream flowing in a hilly terrain can alsobe harnessed for generating electricity to meetenergy needs of remote rural areas. These smallhydropower plants can serve theindependently. Till date, small or micro hydroplants of total capacity of 2953 MW have beeninstalled against an estimated potential of15400MW (Sukhatme, 2011).Energy from the sea - Ocean thermal, tidal andwave energy
Large amounts of solar energy are stored inthe oceans and seas. On an average, the 60million square kilometer of the tropical seas absorb solar radiation equivalent to the heat content of 245billion barrels of oil. Scientists feel that if this energy can be tapped a large source of energy will be availableto the tropical countries and to other countries as well.The process of harnessing this energy is called OTEC(ocean thermal energy conversion). It uses thetemperature differences between the surface of the oceanand the depths of about 1000m to operate a heat engine,which produces electric power.
Bio- energy: Bio-energy is an important form of renewableenergy that is stored in biological material like wood,wood-waste, manure, straw and other-products ofagricultural processes. Bio-energy in these sources can beconverted and used to generate heat or electricity, or toproduce transport fuel. The source of bio-energy is organicmaterial - which refers to biomass, which is effectively astore of solar energy, Energy from the sun is capturedthrough photosynthesis and stored as the plant or treegrows. It is either:
Theoretical formula for producing the power from a hydelproject is as follows:
P= kdQghWhere, P is the power in Watt, d is the density of water in kg/cubic meter, Q flow in cubic meter/sec, g is the accelerationdue to gravity in m/second square, h in meter is the differencein height of the inlet and outlet water, and k is a dimensionlessparameter whose value lie between 0 and 1; it determines theefficiency of the plant (Herman-Josef & Jyotirmoy Mathur)
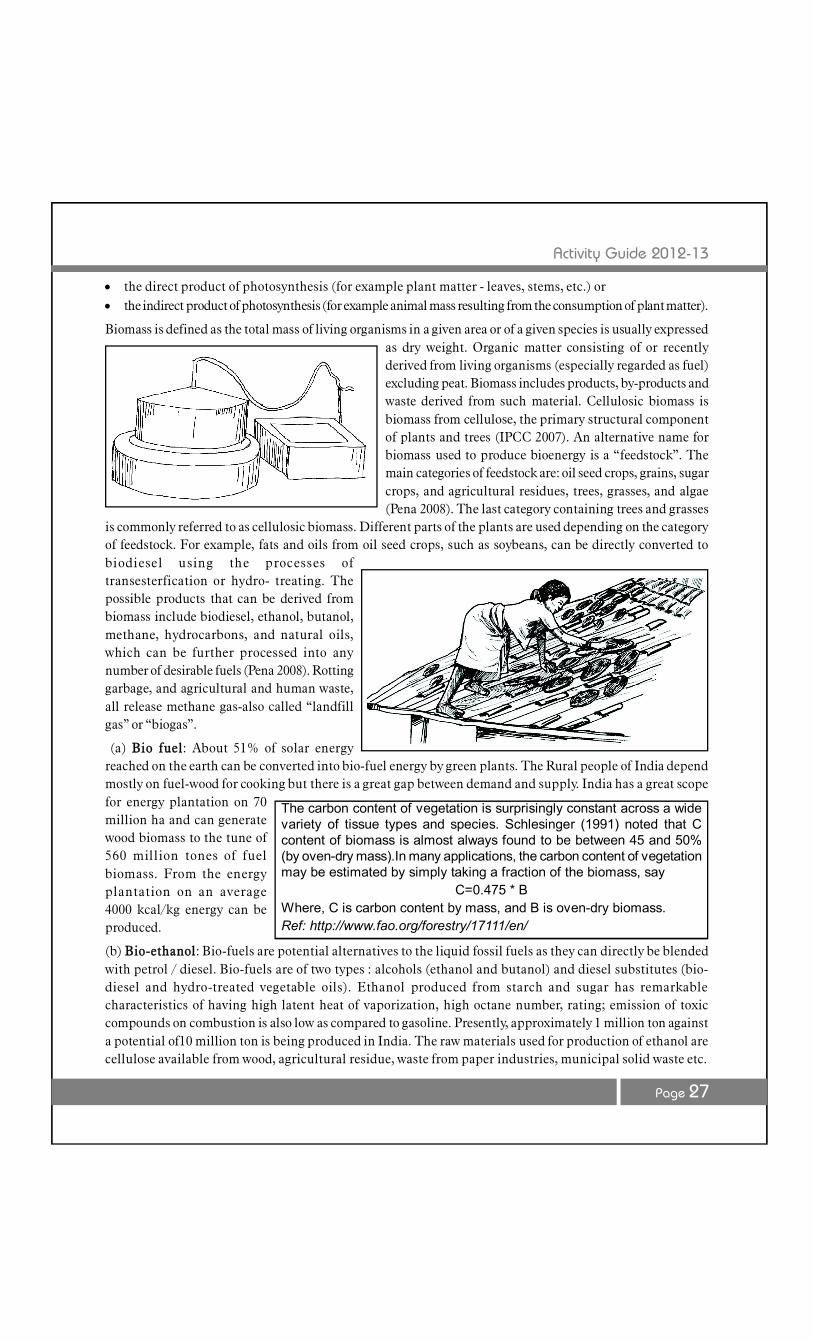
Activity Guide 2012-13
Page 27
the direct product of photosynthesis (for example plant matter - leaves, stems, etc.) or the indirect product of photosynthesis (for example animal mass resulting from the consumption of plant matter).
Biomass is defined as the total mass of living organisms in a given area or of a given species is usually expressedas dry weight. Organic matter consisting of or recentlyderived from living organisms (especially regarded as fuel)excluding peat. Biomass includes products, by-products andwaste derived from such material. Cellulosic biomass isbiomass from cellulose, the primary structural componentof plants and trees (IPCC 2007). An alternative name forbiomass used to produce bioenergy is a “feedstock”. Themain categories of feedstock are: oil seed crops, grains, sugarcrops, and agricultural residues, trees, grasses, and algae(Pena 2008). The last category containing trees and grasses
is commonly referred to as cellulosic biomass. Different parts of the plants are used depending on the categoryof feedstock. For example, fats and oils from oil seed crops, such as soybeans, can be directly converted tobiodiesel using the processes oftransesterfication or hydro- treating. Thepossible products that can be derived frombiomass include biodiesel, ethanol, butanol,methane, hydrocarbons, and natural oils,which can be further processed into anynumber of desirable fuels (Pena 2008). Rottinggarbage, and agricultural and human waste,all release methane gas-also called “landfillgas” or “biogas”.
(a) Bio fuel: About 51% of solar energyreached on the earth can be converted into bio-fuel energy by green plants. The Rural people of India dependmostly on fuel-wood for cooking but there is a great gap between demand and supply. India has a great scopefor energy plantation on 70million ha and can generatewood biomass to the tune of560 million tones of fuelbiomass. From the energyplantation on an average4000 kcal/kg energy can beproduced.
(b) Bio-ethanol: Bio-fuels are potential alternatives to the liquid fossil fuels as they can directly be blendedwith petrol / diesel. Bio-fuels are of two types : alcohols (ethanol and butanol) and diesel substitutes (bio-diesel and hydro-treated vegetable oils). Ethanol produced from starch and sugar has remarkablecharacteristics of having high latent heat of vaporization, high octane number, rating; emission of toxiccompounds on combustion is also low as compared to gasoline. Presently, approximately 1 million ton againsta potential of10 million ton is being produced in India. The raw materials used for production of ethanol arecellulose available from wood, agricultural residue, waste from paper industries, municipal solid waste etc.
The carbon content of vegetation is surprisingly constant across a widevariety of tissue types and species. Schlesinger (1991) noted that Ccontent of biomass is almost always found to be between 45 and 50%(by oven-dry mass).In many applications, the carbon content of vegetationmay be estimated by simply taking a fraction of the biomass, say
C=0.475 * BWhere, C is carbon content by mass, and B is oven-dry biomass.Ref: http://www.fao.org/forestry/17111/en/
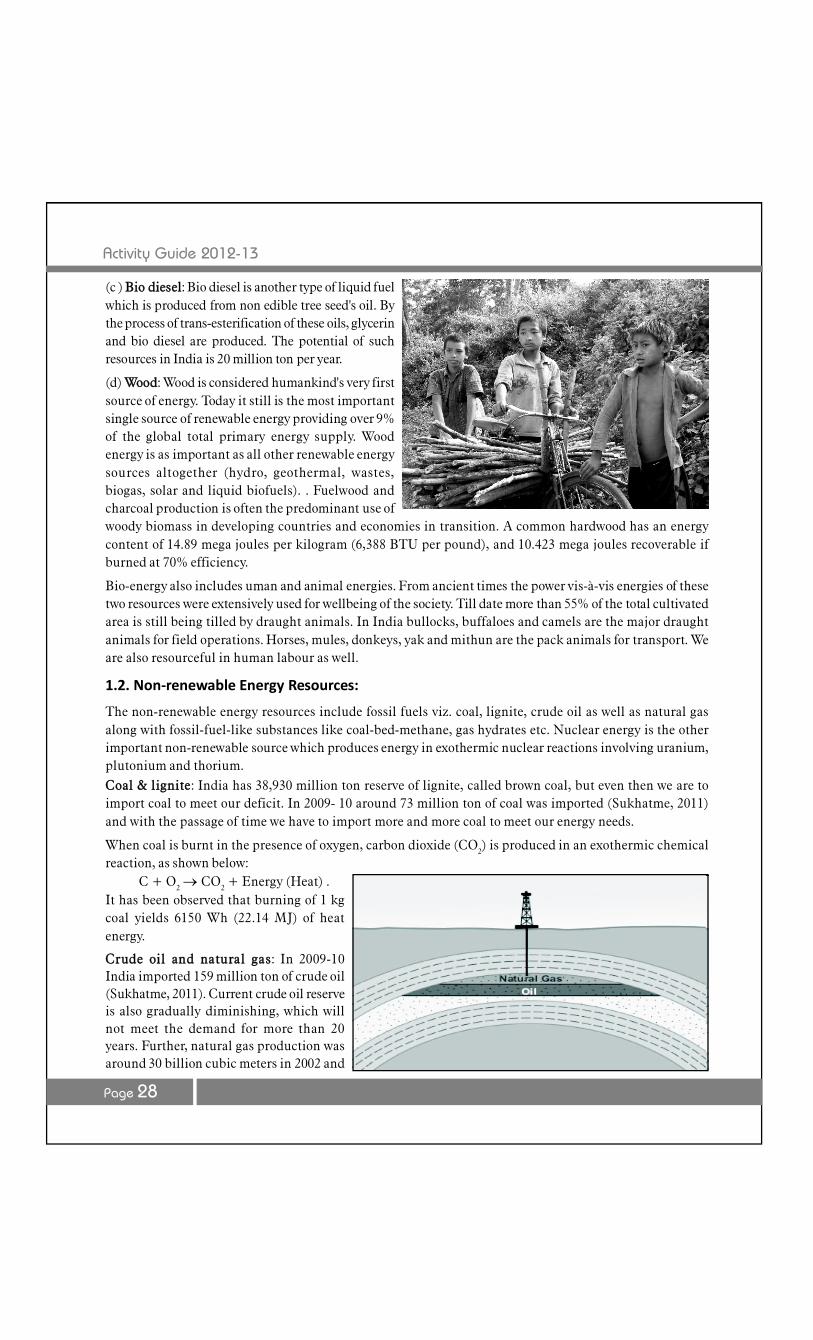
Activity Guide 2012-13
Page 28
(c ) Bio diesel: Bio diesel is another type of liquid fuelwhich is produced from non edible tree seed's oil. Bythe process of trans-esterification of these oils, glycerinand bio diesel are produced. The potential of suchresources in India is 20 million ton per year.
(d) Wood: Wood is considered humankind's very firstsource of energy. Today it still is the most importantsingle source of renewable energy providing over 9%of the global total primary energy supply. Woodenergy is as important as all other renewable energysources altogether (hydro, geothermal, wastes,biogas, solar and liquid biofuels). . Fuelwood andcharcoal production is often the predominant use ofwoody biomass in developing countries and economies in transition. A common hardwood has an energycontent of 14.89 mega joules per kilogram (6,388 BTU per pound), and 10.423 mega joules recoverable ifburned at 70% efficiency.
Bio-energy also includes uman and animal energies. From ancient times the power vis-à-vis energies of thesetwo resources were extensively used for wellbeing of the society. Till date more than 55% of the total cultivatedarea is still being tilled by draught animals. In India bullocks, buffaloes and camels are the major draughtanimals for field operations. Horses, mules, donkeys, yak and mithun are the pack animals for transport. Weare also resourceful in human labour as well.
1.2. Non-renewable Energy Resources:
The non-renewable energy resources include fossil fuels viz. coal, lignite, crude oil as well as natural gasalong with fossil-fuel-like substances like coal-bed-methane, gas hydrates etc. Nuclear energy is the otherimportant non-renewable source which produces energy in exothermic nuclear reactions involving uranium,plutonium and thorium.Coal & lignite: India has 38,930 million ton reserve of lignite, called brown coal, but even then we are toimport coal to meet our deficit. In 2009- 10 around 73 million ton of coal was imported (Sukhatme, 2011)and with the passage of time we have to import more and more coal to meet our energy needs.
When coal is burnt in the presence of oxygen, carbon dioxide (CO2) is produced in an exothermic chemicalreaction, as shown below:
C + O2 CO2 + Energy (Heat) .It has been observed that burning of 1 kgcoal yields 6150 Wh (22.14 MJ) of heatenergy.
Crude oil and natural gas: In 2009-10India imported 159 million ton of crude oil(Sukhatme, 2011). Current crude oil reserveis also gradually diminishing, which willnot meet the demand for more than 20years. Further, natural gas production wasaround 30 billion cubic meters in 2002 and

Activity Guide 2012-13
Page 29
remained same till 2009. With new discoveries of oil reserve base inKrishna-Godavari basin annual production has increased up to 47.91billion cubic meters during 2009-10 (Sukhatme, 2011). In recent past, asignificant amount of crude oil has been explored in western part ofRajasthan. Natural gas is used for production of electricity as well asdomestic and industrial consumption and till date 17,456 MW ofelectricity has been produced using natural gas (Sukhatme, 2011).
Besides these energy resources, coal-bed-methane and gas hydrates arealso considered as most important source; and coal-bed-methane is themajor component of natural gas found in the coal mines. It may bementioned as example - while drilling well, water comes out first andthen methane flows out of the well due to reduction of pressure. Thereare abundant reserves of gas hydrates in the deep sea of Andamans andKrishna - Godavari basin (Sukhatme, 2011).
Geo- thermal energy: Deepinside the earth, the rocks are ina super heated molten formcalled magma. Sometimes waterthat seeps into the earth, throughcracks in the rocks, comes incontact with this molten magma.This results in the water gettingsuper-heated.
This hot water can reachtemperatures of more than 1500C. That's a lot hotter than boilingwater, which boils 1000 C. As thewater heats up, it rises up to thesurface of the earth and spews
Story From the fieldUse of Solar Energy for CookingAt Shanti Kunj Haridwar for cooking of daily food 3 LPG cylinders were being used daily. Now, the institute has installed a 160m2
Steam Generating Parabolic Dish Solar Cooking System for preparation of daily meal (Dalia and Khichiri) for 1000 persons.The system is consisting of 10 parabola of 16 m. dia each with headers, pipeline and auto tracking system etc. The steamgenerated is transferred to stainless steel utensils for cooking of food.After installation of dish system in April, 2010, the institute is saving 1 LPG cylinder daily on an average and approximately300 cylinders annually, i.e., Rs. 1.20 Lakh annually.The cost of system Rs. 27 Lakhs has been subsidized by MNRE, GoI & State Govt. (Rs. 16 Lakh). The balance cost hasbeen born by beneficiary organization.
Bio-gas for refrigerationAt Deep frozen Semen preservation centre of Uttarakhand live stock development centre, Rishikesh, Dehradun, of 50 bulls dungwas being used for manure production only. By the financial help of MNRE GoI & State Govt. the centre has installed a bio gas plantof 25 m3 capacity with 3 Kw power generations. The power generated is being used for chaff cutting for bulls. Thus, 3 kw electricityis being saved daily assuming maximum load of 2 Kw @ Rs. 3 per unit, which approximately saves Rs. 4000/-per day.
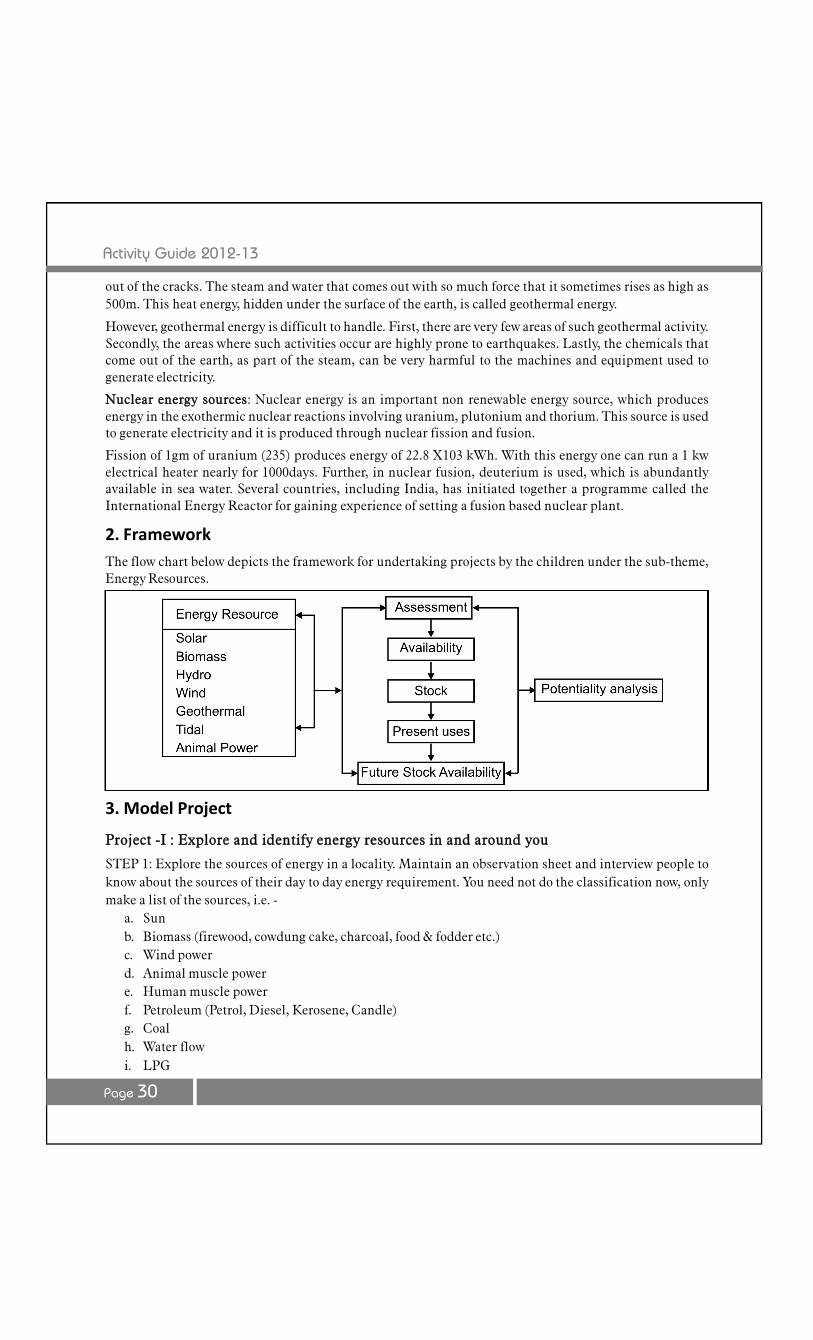
Activity Guide 2012-13
Page 30
out of the cracks. The steam and water that comes out with so much force that it sometimes rises as high as500m. This heat energy, hidden under the surface of the earth, is called geothermal energy.
However, geothermal energy is difficult to handle. First, there are very few areas of such geothermal activity.Secondly, the areas where such activities occur are highly prone to earthquakes. Lastly, the chemicals thatcome out of the earth, as part of the steam, can be very harmful to the machines and equipment used togenerate electricity.
Nuclear energy sources: Nuclear energy is an important non renewable energy source, which producesenergy in the exothermic nuclear reactions involving uranium, plutonium and thorium. This source is usedto generate electricity and it is produced through nuclear fission and fusion.
Fission of 1gm of uranium (235) produces energy of 22.8 X10³ kWh. With this energy one can run a 1 kwelectrical heater nearly for 1000days. Further, in nuclear fusion, deuterium is used, which is abundantlyavailable in sea water. Several countries, including India, has initiated together a programme called theInternational Energy Reactor for gaining experience of setting a fusion based nuclear plant.
2. FrameworkThe flow chart below depicts the framework for undertaking projects by the children under the sub-theme,Energy Resources.
3. Model Project
Project -I : Explore and identify energy resources in and around you
STEP 1: Explore the sources of energy in a locality. Maintain an observation sheet and interview people toknow about the sources of their day to day energy requirement. You need not do the classification now, onlymake a list of the sources, i.e. -
a. Sunb. Biomass (firewood, cowdung cake, charcoal, food & fodder etc.)c. Wind powerd. Animal muscle powere. Human muscle powerf. Petroleum (Petrol, Diesel, Kerosene, Candle)g. Coalh. Water flowi. LPG
Activity Guide 2012-13
Page 31
STEP 2: Now, with the help of local expert and books try to know the origin of the sources and try to classifythem into BIOTIC and ABIOTIC -
Biotic Abiotica. Biomass a. Sunb. Animal muscle power b. Windc. Human muscle power c. Petroleum* (Petrol, Diesel, Kerosene, Candle)
d. Coale. Water flowf. LPG
*Petroleum sources although originates from plants and animals, by the time they transform to usable energyforms, they become abiotic.
STEP 3: Then try to classify the sources as renewable and non-renewable
Renewable Non-renewablea. Sun a. Petroleum (Petrol, Diesel, Kerosene, Candle)b. Biomass b. Coalc. Animal muscle power c. LPGd. Human muscle powere. Wind powerf. Water flow
STEP 4: Then explore various usage of the different forms of energy found in the locality through observationand interview of local people in the following format-
Sources Current usage (imaginary) Possible usagea. Sun a. Drying, heating, lighting a. Cooking, water heating, electricity
(small scale) generation, vehicle running. Large scalerural electrification/ Solar power grids
b. Biomass b. firewood, charcoal, b.Energy cake, bio-electricty using biomassfood & fodder etc. gasifier, bio diesel
c. Wind c. Water lifting c. Electricity generationd. Animal muscle power d. Agriculture, Transporte. Human muscle power e. Agriculture, Transport,
other physical workf. Petrol f. Vehicle running, electricity
generationg. Diesel g. Vehicle running, electricity
generationh. Kerosene h. Household lighting, cookingi. LPG i. Cooking d.Vehicle running, industrial use,j. Coal j. Cooking e. Thermal power,k. Water flow k. Not used f. Micro/ Pico-hydel
STEP - 5. Experimentation for possible use/effective -optimum useIdentify any one of the sources already identified and try to bring out some way to establish possible uses orenhancing effectiveness of optimal use through an experiment and observation based on a functional model/field base experiment - observation.
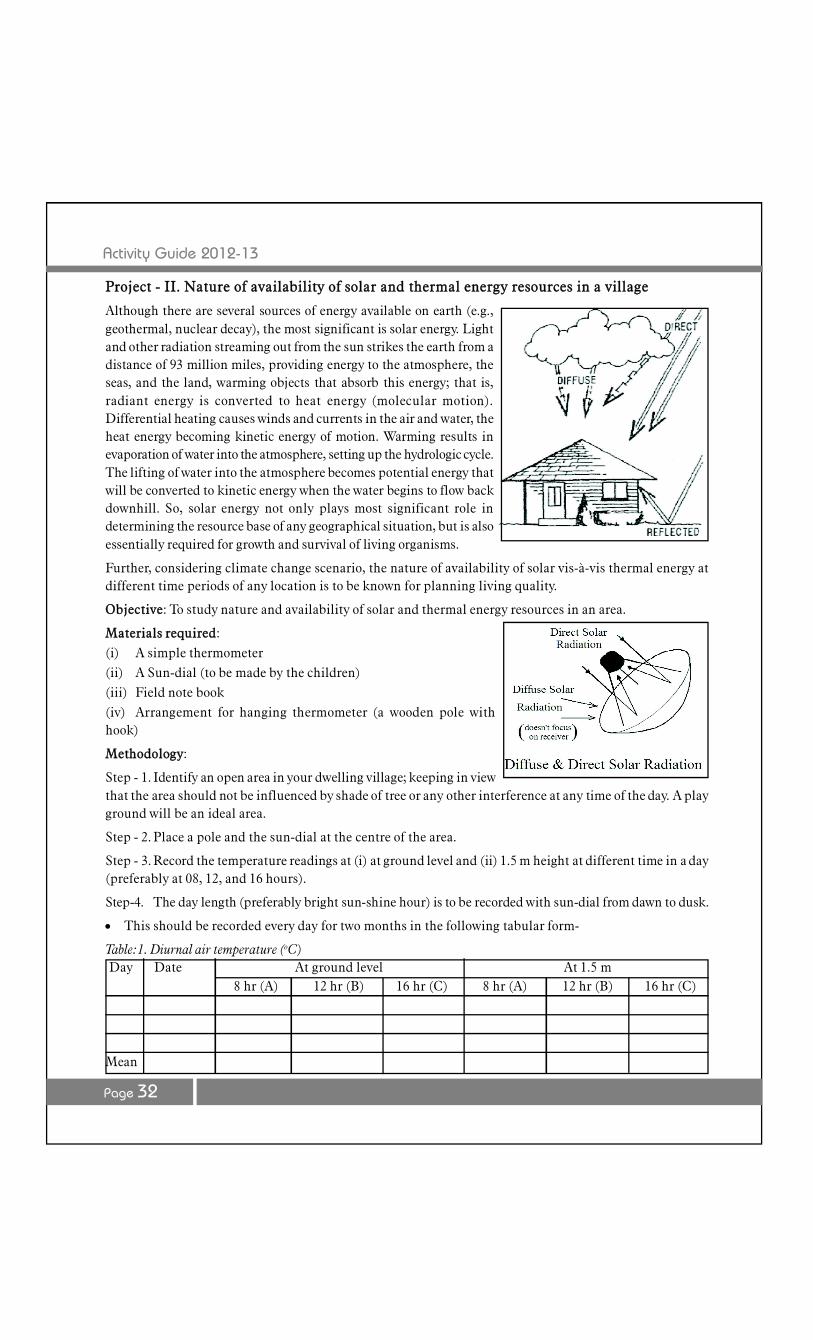
Activity Guide 2012-13
Page 32
Project - II. Nature of availability of solar and thermal energy resources in a village
Although there are several sources of energy available on earth (e.g.,geothermal, nuclear decay), the most significant is solar energy. Lightand other radiation streaming out from the sun strikes the earth from adistance of 93 million miles, providing energy to the atmosphere, theseas, and the land, warming objects that absorb this energy; that is,radiant energy is converted to heat energy (molecular motion).Differential heating causes winds and currents in the air and water, theheat energy becoming kinetic energy of motion. Warming results inevaporation of water into the atmosphere, setting up the hydrologic cycle.The lifting of water into the atmosphere becomes potential energy thatwill be converted to kinetic energy when the water begins to flow backdownhill. So, solar energy not only plays most significant role indetermining the resource base of any geographical situation, but is alsoessentially required for growth and survival of living organisms.
Further, considering climate change scenario, the nature of availability of solar vis-à-vis thermal energy atdifferent time periods of any location is to be known for planning living quality.
Objective: To study nature and availability of solar and thermal energy resources in an area.
Materials required:(i) A simple thermometer(ii) A Sun-dial (to be made by the children)(iii) Field note book(iv) Arrangement for hanging thermometer (a wooden pole withhook)
Methodology:
Step - 1. Identify an open area in your dwelling village; keeping in viewthat the area should not be influenced by shade of tree or any other interference at any time of the day. A playground will be an ideal area.
Step - 2. Place a pole and the sun-dial at the centre of the area.
Step - 3. Record the temperature readings at (i) at ground level and (ii) 1.5 m height at different time in a day(preferably at 08, 12, and 16 hours).
Step-4. The day length (preferably bright sun-shine hour) is to be recorded with sun-dial from dawn to dusk.
This should be recorded every day for two months in the following tabular form-
Table:1. Diurnal air temperature (oC)Day Date At ground level At 1.5 m
8 hr (A) 12 hr (B) 16 hr (C) 8 hr (A) 12 hr (B) 16 hr (C)
Mean
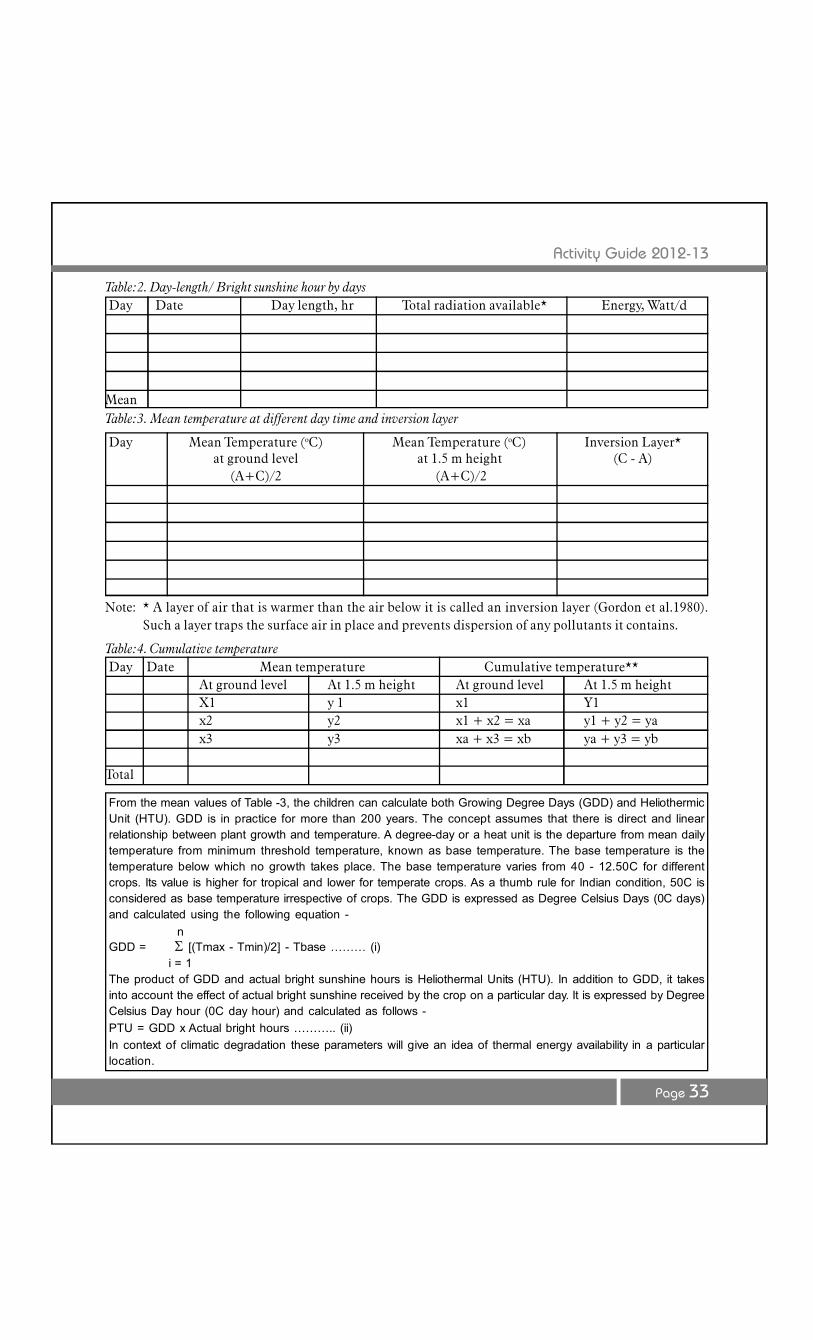
Activity Guide 2012-13
Page 33
Table:2. Day-length/ Bright sunshine hour by daysDay Date Day length, hr Total radiation available* Energy, Watt/d
MeanTable:3. Mean temperature at different day time and inversion layer
Day Mean Temperature (oC) Mean Temperature (oC) Inversion Layer*at ground level at 1.5 m height (C - A)
(A+C)/2 (A+C)/2
Note: * A layer of air that is warmer than the air below it is called an inversion layer (Gordon et al.1980).Such a layer traps the surface air in place and prevents dispersion of any pollutants it contains.
Table:4. Cumulative temperatureDay Date Mean temperature Cumulative temperature**
At ground level At 1.5 m height At ground level At 1.5 m heightX1 y 1 x1 Y1x2 y2 x1 + x2 = xa y1 + y2 = yax3 y3 xa + x3 = xb ya + y3 = yb
Total
From the mean values of Table -3, the children can calculate both Growing Degree Days (GDD) and HeliothermicUnit (HTU). GDD is in practice for more than 200 years. The concept assumes that there is direct and linearrelationship between plant growth and temperature. A degree-day or a heat unit is the departure from mean dailytemperature from minimum threshold temperature, known as base temperature. The base temperature is thetemperature below which no growth takes place. The base temperature varies from 40 - 12.50C for differentcrops. Its value is higher for tropical and lower for temperate crops. As a thumb rule for Indian condition, 50C isconsidered as base temperature irrespective of crops. The GDD is expressed as Degree Celsius Days (0C days)and calculated using the following equation -
nGDD = [(Tmax - Tmin)/2] - Tbase ……… (i)
i = 1The product of GDD and actual bright sunshine hours is Heliothermal Units (HTU). In addition to GDD, it takesinto account the effect of actual bright sunshine received by the crop on a particular day. It is expressed by DegreeCelsius Day hour (0C day hour) and calculated as follows -PTU = GDD x Actual bright hours ……….. (ii)In context of climatic degradation these parameters will give an idea of thermal energy availability in a particularlocation.
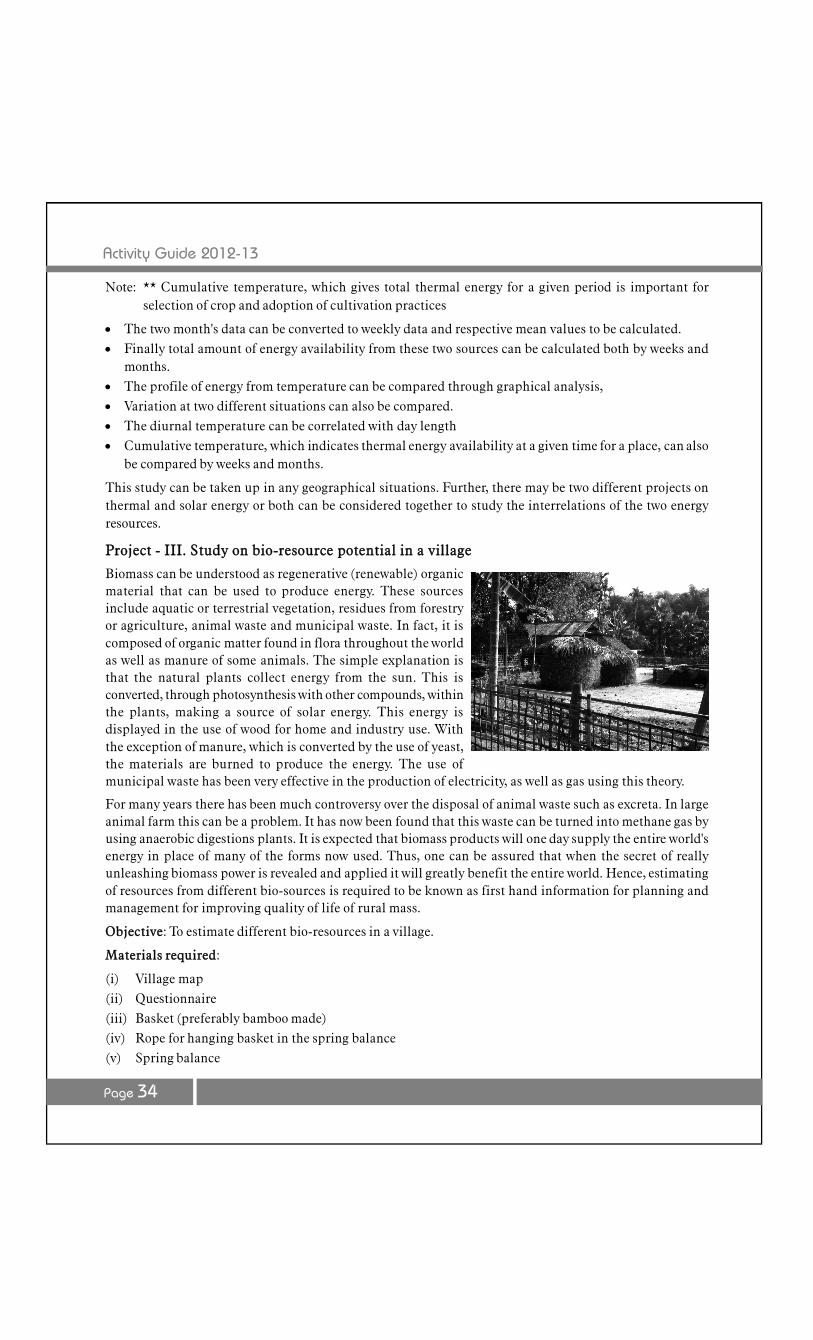
Activity Guide 2012-13
Page 34
Note: ** Cumulative temperature, which gives total thermal energy for a given period is important forselection of crop and adoption of cultivation practices
The two month's data can be converted to weekly data and respective mean values to be calculated. Finally total amount of energy availability from these two sources can be calculated both by weeks and
months. The profile of energy from temperature can be compared through graphical analysis, Variation at two different situations can also be compared. The diurnal temperature can be correlated with day length Cumulative temperature, which indicates thermal energy availability at a given time for a place, can also
be compared by weeks and months.
This study can be taken up in any geographical situations. Further, there may be two different projects onthermal and solar energy or both can be considered together to study the interrelations of the two energyresources.
Project - III. Study on bio-resource potential in a village
Biomass can be understood as regenerative (renewable) organicmaterial that can be used to produce energy. These sourcesinclude aquatic or terrestrial vegetation, residues from forestryor agriculture, animal waste and municipal waste. In fact, it iscomposed of organic matter found in flora throughout the worldas well as manure of some animals. The simple explanation isthat the natural plants collect energy from the sun. This isconverted, through photosynthesis with other compounds, withinthe plants, making a source of solar energy. This energy isdisplayed in the use of wood for home and industry use. Withthe exception of manure, which is converted by the use of yeast,the materials are burned to produce the energy. The use ofmunicipal waste has been very effective in the production of electricity, as well as gas using this theory.
For many years there has been much controversy over the disposal of animal waste such as excreta. In largeanimal farm this can be a problem. It has now been found that this waste can be turned into methane gas byusing anaerobic digestions plants. It is expected that biomass products will one day supply the entire world'senergy in place of many of the forms now used. Thus, one can be assured that when the secret of reallyunleashing biomass power is revealed and applied it will greatly benefit the entire world. Hence, estimatingof resources from different bio-sources is required to be known as first hand information for planning andmanagement for improving quality of life of rural mass.
Objective: To estimate different bio-resources in a village.
Materials required:
(i) Village map(ii) Questionnaire(iii) Basket (preferably bamboo made)(iv) Rope for hanging basket in the spring balance(v) Spring balance

Activity Guide 2012-13
Page 35
Methodology:
Step -1: A village where the participating children dwell the need to be selected
Step - 2. Using questionnaire following information is to be collected.(i) Name of the village (with JL number)(ii) Area of the village (To be marked in the map)(iii) Number of household(iv) Number of people per household(v) Number of labour force(vi) Amount of farm and/or kitchen waste(vii) Types and number of domesticated animals
Type of animal NumberCowBullockBuffalo
SheepGoatHen
Finding the amount of animal dung/ excreta available/household/day
Step - 4 If the village is very large, children will have to undertake survey in some randomly selected householdsof the village. The number of household should be more than 50. They will visit the cowshed and measurethe amount of cow dung with the help of basket and spring balance. This should be repeated for 3 - 5 days inthe sample households.
Step - 5 The amount of farm waste available per day isalso to be measured and estimated for yearly availability
Step - 6 The average amount of dung/excreta availablein the sample household will be used to calculate totalamount of dung/excreta available in the village in a year.The seasonal differences, where ever possible, can alsobe calculated.
Step - 7 Finally total amount of excreta and waste forthe village is to be calculated.
Step - 8 The whole bio- resources are to be converted in form of energy using conversion factors.
Step - 9 The total labour force also to be converted in terms of energy multiplying by the conversion factor
Table: Conversion factors
Particulars Energy conversion factorHuman labour 0.1779 MJ/man-hrBullock 1.34 MJ / bullockCow dungFarm waste 80 - 200 kCal/kg
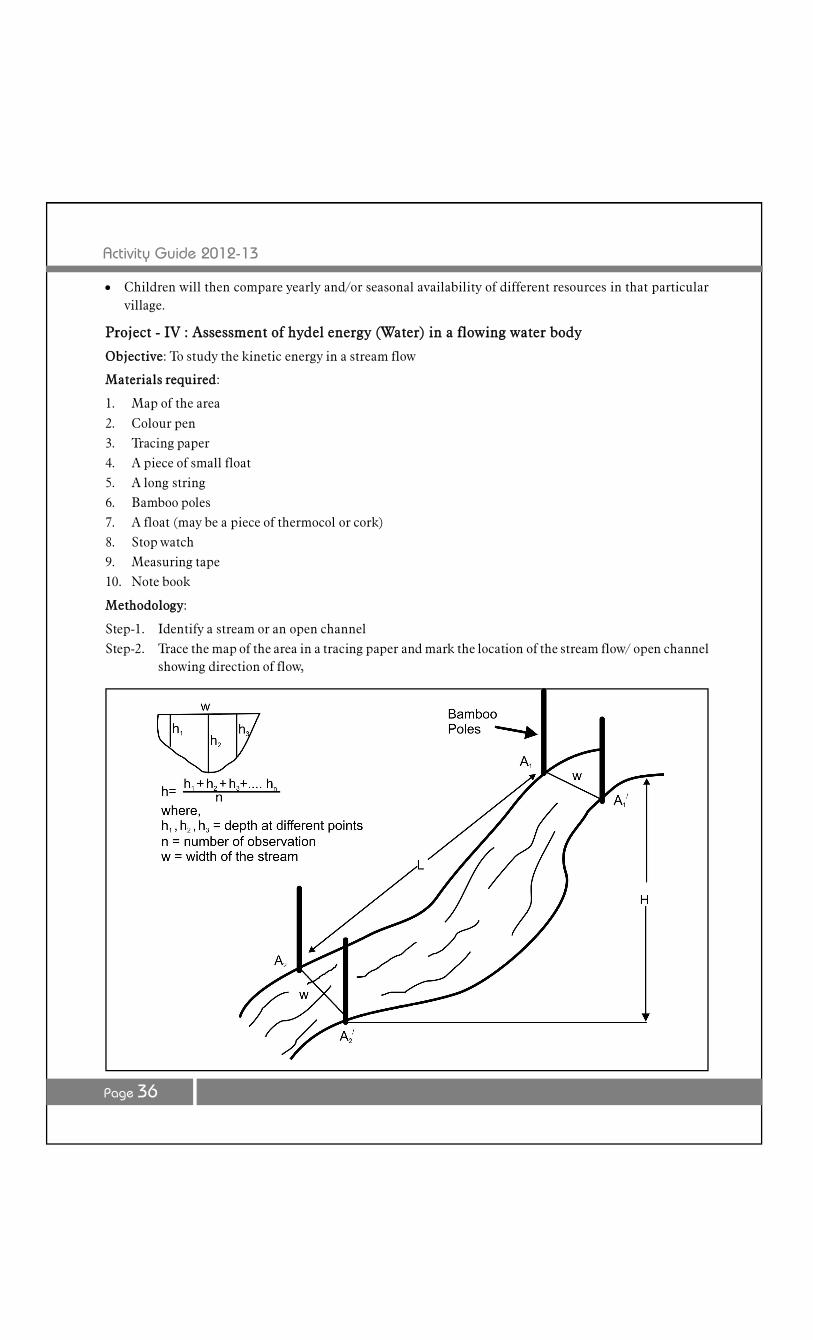
Activity Guide 2012-13
Page 36
Children will then compare yearly and/or seasonal availability of different resources in that particularvillage.
Project - IV : Assessment of hydel energy (Water) in a flowing water body
Objective: To study the kinetic energy in a stream flow
Materials required:
1. Map of the area
2. Colour pen3. Tracing paper4. A piece of small float5. A long string6. Bamboo poles7. A float (may be a piece of thermocol or cork)8. Stop watch9. Measuring tape10. Note book
Methodology:
Step-1. Identify a stream or an open channelStep-2. Trace the map of the area in a tracing paper and mark the location of the stream flow/ open channel
showing direction of flow,
Activity Guide 2012-13
Page 37
Example :
ONE EXPERIMENT: Possibility of generating micro-hydel power in a small scale
Objective: To demonstrate generation of electricity using a micro/ pico hydel in a locality using the availablewater flow in a stream/ water fall
Methodology:
1. Identify a stream in the locality with natural water flow
2. If needed, make a small check dam to retain water temporarily to give enough pressure for turbines tomove at optimum speed
3. Make a generator using magnet, handmade coil and turbine (may be a fan)
4. Use the generator and the water flow of the stream to generate electricity
5. Connect the generator to a bulb to demonstrate generation of energy
Expected outcome:
Understand the basic principle of hydro-power generation and have a model production unit. It gives theopportunity to have a decentralised, community managed production unit, which can be operated by thecommunity without depending on the public supply system.
Step-3. Visit the site and identify a segment along the length of the stream.
Step-4. Fix two bamboo poles at two ends of the segment (mark A1 & A2). Now fix another two bamboopoles on the other side of the stream opposite to the locations of A1 & A2 and will be considered asA1
/ and A2/. Tie a string/rope between A1 and A1
/ & A2 and A2/
Step-5. Then measure distance between A1 and A2 (L).Step-6. Using bamboo poles measure the depth of the channel at different locations and find their average (h).Step-7. Measure the width of the channel at different locations and find their average (w)Step-8. Place a float at the top of the channel on the line A1A1
/.Step-9. With the stop watch record the time the float takes to reach line A2A2
/.
Step-10. Kinetic Energy of the channel can then be calculated as described below-
(i) cross sectional area of the channel, Ao = l x w (SqM or m2)
(ii) depth of the flow, h (m)
So, the volume of water in the section = Ao* h (CuM or m3)
Since density of water is 1, so Volume = M (mass), g
(iii) Velocity, v = L (length of the channel section)/ time (m/sec)
Finally, Kinetic energy of the flow will be calculated using the following equation
KE = ½ M* v2
Note: This study can be undertaken before and after the rainfall, thereby a comparative study on energy ofa flowing channel can be made.
Activity Guide 2012-13
Page 38
4. Suggestive project ideas
(i) Quantification of heat generated in exothermic chemical reactions (such as burning of coal, wood,charcoal, gas etc
(ii) Identification of estimation of components of the gas produced from cow dung, kitchen waste, humanwaste, tree leaves etc.
(iii) To study potential wind velocity in an area.
(iv) Estimation of incidence of solar radiation
(v) Estimating biomass energy stock in a school compound
(vi) Measuring kinetic energy in a stream
(vii) Comparative study on thermal energy availability in open and closed spaces in urban area.
(viii)Collection and recording of different plant parts and seeds available for use as food and fuel.
(ix) Estimating Growing Degree Days (GDD) using time-scale recording of atmospheric temperature
(x) Measuring and correlating air and soil temperature and thermal resources
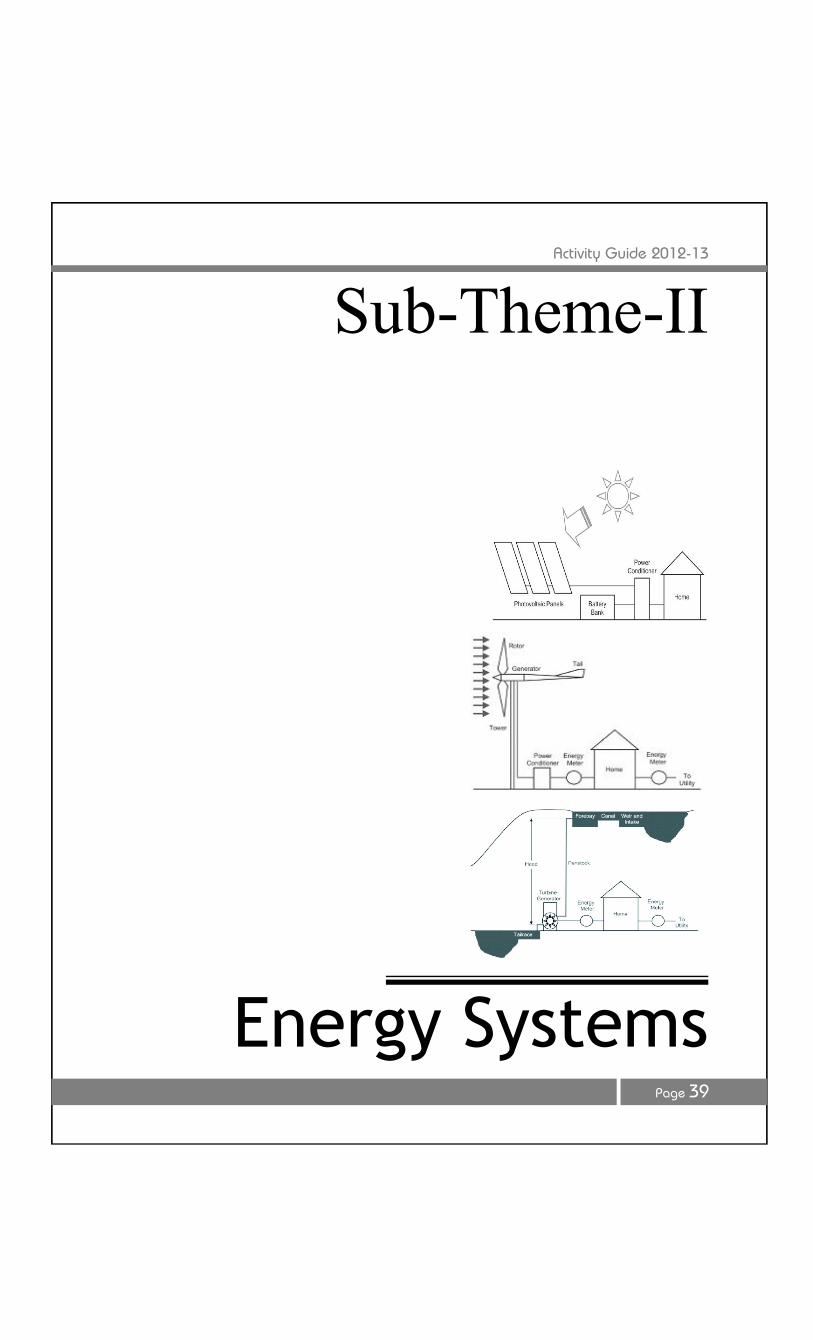
Activity Guide 2012-13
Page 39
Sub-Theme-II
Energy Systems

Activity Guide 2012-13
Page 40
Dr. P. PramodMr. Sadhan MahapatraProf. S.P. VermaMr. Jayanta Kr Sarma
Working Group of the sub-theme
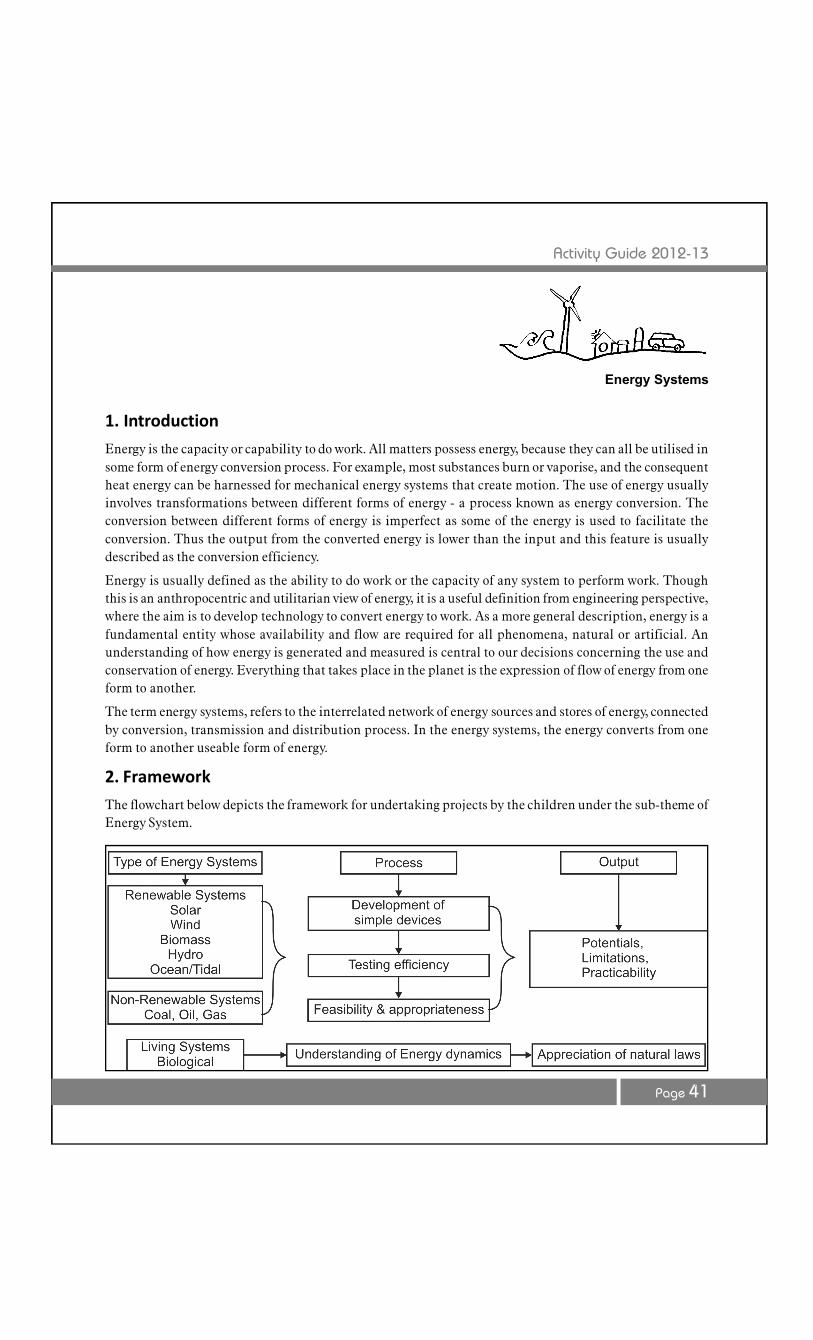
Activity Guide 2012-13
Page 41
1. Introduction
Energy is the capacity or capability to do work. All matters possess energy, because they can all be utilised insome form of energy conversion process. For example, most substances burn or vaporise, and the consequentheat energy can be harnessed for mechanical energy systems that create motion. The use of energy usuallyinvolves transformations between different forms of energy - a process known as energy conversion. Theconversion between different forms of energy is imperfect as some of the energy is used to facilitate theconversion. Thus the output from the converted energy is lower than the input and this feature is usuallydescribed as the conversion efficiency.
Energy is usually defined as the ability to do work or the capacity of any system to perform work. Thoughthis is an anthropocentric and utilitarian view of energy, it is a useful definition from engineering perspective,where the aim is to develop technology to convert energy to work. As a more general description, energy is afundamental entity whose availability and flow are required for all phenomena, natural or artificial. Anunderstanding of how energy is generated and measured is central to our decisions concerning the use andconservation of energy. Everything that takes place in the planet is the expression of flow of energy from oneform to another.
The term energy systems, refers to the interrelated network of energy sources and stores of energy, connectedby conversion, transmission and distribution process. In the energy systems, the energy converts from oneform to another useable form of energy.
2. Framework
The flowchart below depicts the framework for undertaking projects by the children under the sub-theme ofEnergy System.
Energy Systems
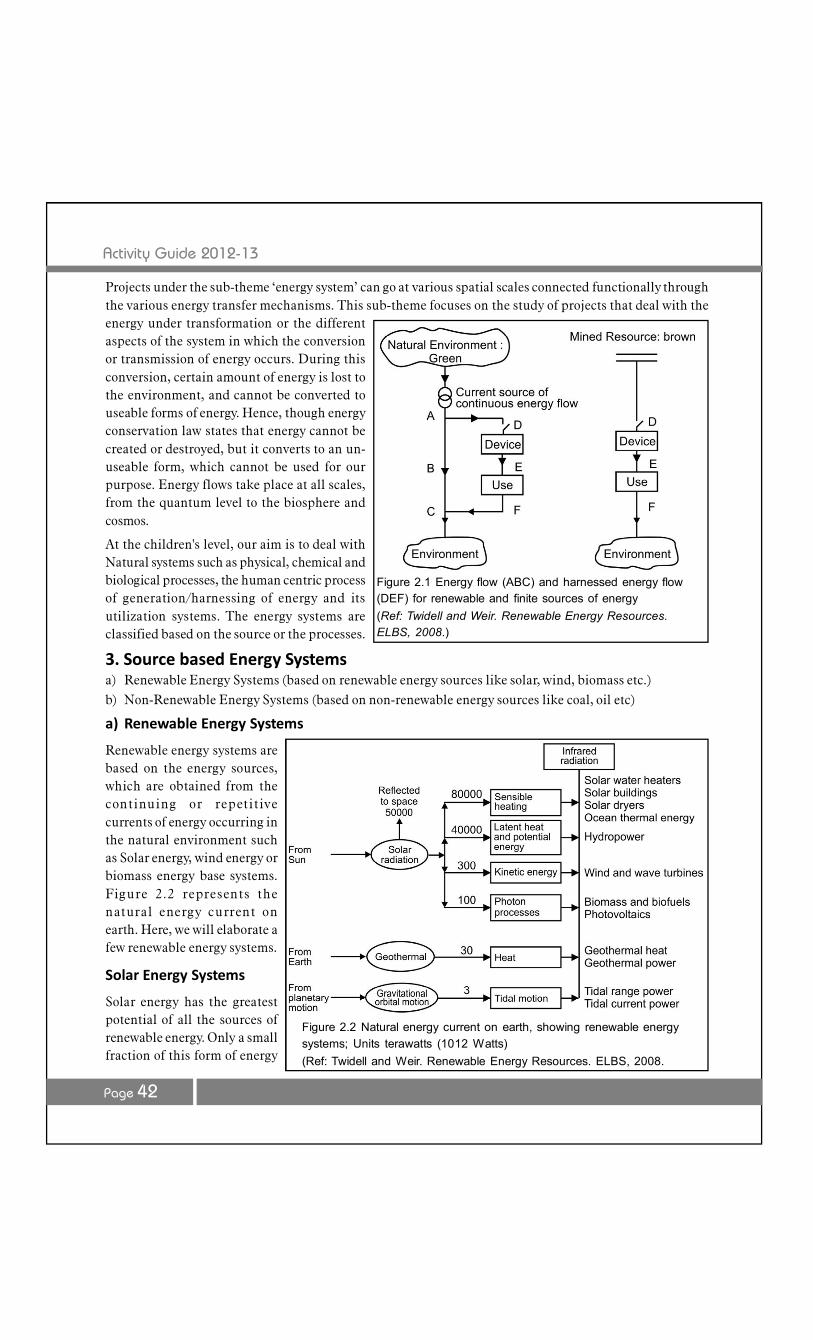
Activity Guide 2012-13
Page 42
Projects under the sub-theme ‘energy system’ can go at various spatial scales connected functionally throughthe various energy transfer mechanisms. This sub-theme focuses on the study of projects that deal with theenergy under transformation or the differentaspects of the system in which the conversionor transmission of energy occurs. During thisconversion, certain amount of energy is lost tothe environment, and cannot be converted touseable forms of energy. Hence, though energyconservation law states that energy cannot becreated or destroyed, but it converts to an un-useable form, which cannot be used for ourpurpose. Energy flows take place at all scales,from the quantum level to the biosphere andcosmos.
At the children's level, our aim is to deal withNatural systems such as physical, chemical andbiological processes, the human centric processof generation/harnessing of energy and itsutilization systems. The energy systems areclassified based on the source or the processes.
3. Source based Energy Systemsa) Renewable Energy Systems (based on renewable energy sources like solar, wind, biomass etc.)b) Non-Renewable Energy Systems (based on non-renewable energy sources like coal, oil etc)
a) Renewable Energy Systems
Renewable energy systems arebased on the energy sources,which are obtained from thecontinuing or repetitivecurrents of energy occurring inthe natural environment suchas Solar energy, wind energy orbiomass energy base systems.Figure 2.2 represents thenatural energy current onearth. Here, we will elaborate afew renewable energy systems.
Solar Energy Systems
Solar energy has the greatestpotential of all the sources ofrenewable energy. Only a smallfraction of this form of energy
Figure 2.2 Natural energy current on earth, showing renewable energysystems; Units terawatts (1012 Watts)(Ref: Twidell and Weir. Renewable Energy Resources. ELBS, 2008.
Figure 2.1 Energy flow (ABC) and harnessed energy flow(DEF) for renewable and finite sources of energy(Ref: Twidell and Weir. Renewable Energy Resources.ELBS, 2008.)
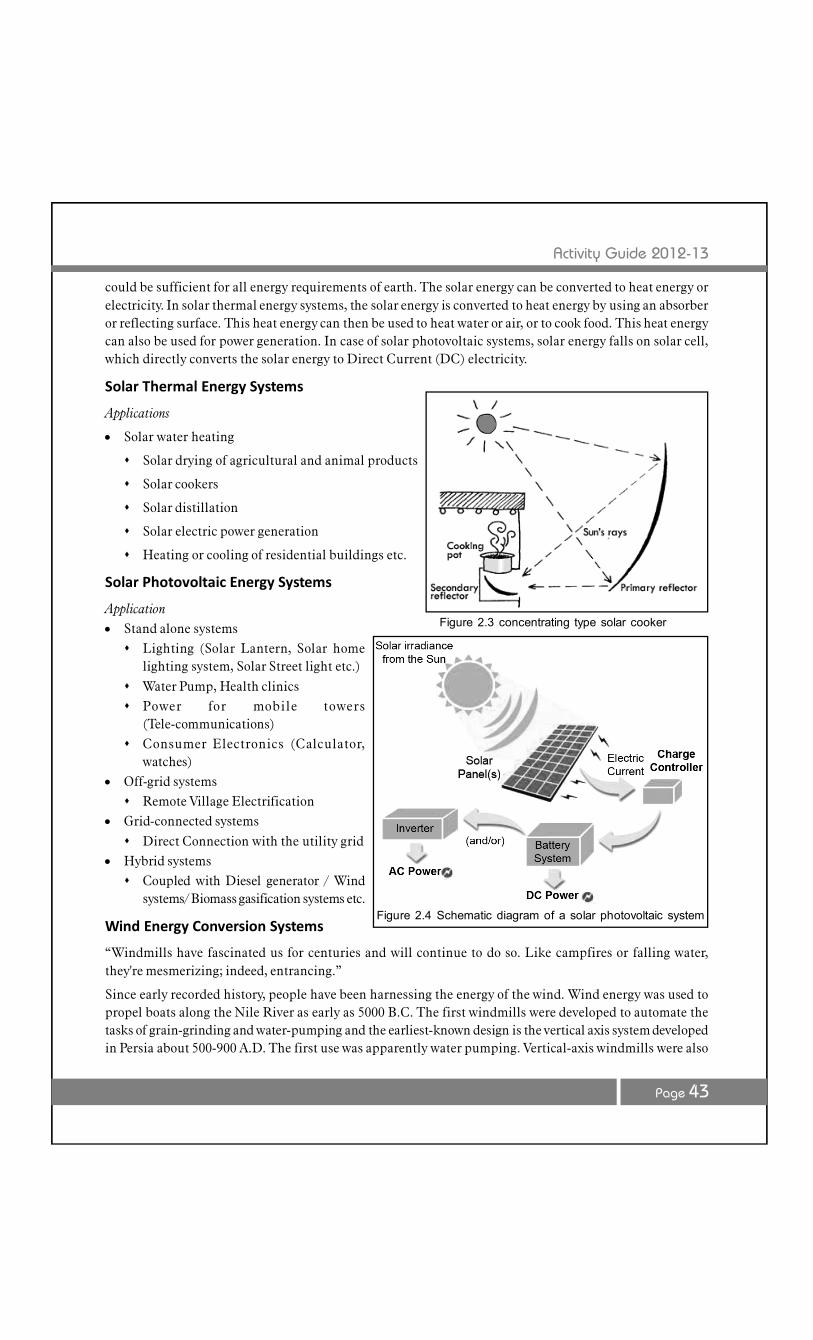
Activity Guide 2012-13
Page 43
could be sufficient for all energy requirements of earth. The solar energy can be converted to heat energy orelectricity. In solar thermal energy systems, the solar energy is converted to heat energy by using an absorberor reflecting surface. This heat energy can then be used to heat water or air, or to cook food. This heat energycan also be used for power generation. In case of solar photovoltaic systems, solar energy falls on solar cell,which directly converts the solar energy to Direct Current (DC) electricity.
Solar Thermal Energy Systems
Applications
Solar water heating
Solar drying of agricultural and animal products
Solar cookers
Solar distillation
Solar electric power generation
Heating or cooling of residential buildings etc.
Solar Photovoltaic Energy Systems
Application Stand alone systems Lighting (Solar Lantern, Solar home
lighting system, Solar Street light etc.)
Water Pump, Health clinics Power for mobile towers
(Tele-communications) Consumer Electronics (Calculator,
watches) Off-grid systems Remote Village Electrification
Grid-connected systems
Direct Connection with the utility grid Hybrid systems Coupled with Diesel generator / Wind
systems/ Biomass gasification systems etc.
Wind Energy Conversion Systems
“Windmills have fascinated us for centuries and will continue to do so. Like campfires or falling water,they're mesmerizing; indeed, entrancing.”
Since early recorded history, people have been harnessing the energy of the wind. Wind energy was used topropel boats along the Nile River as early as 5000 B.C. The first windmills were developed to automate thetasks of grain-grinding and water-pumping and the earliest-known design is the vertical axis system developedin Persia about 500-900 A.D. The first use was apparently water pumping. Vertical-axis windmills were also
Figure 2.3 concentrating type solar cooker
Figure 2.4 Schematic diagram of a solar photovoltaic system
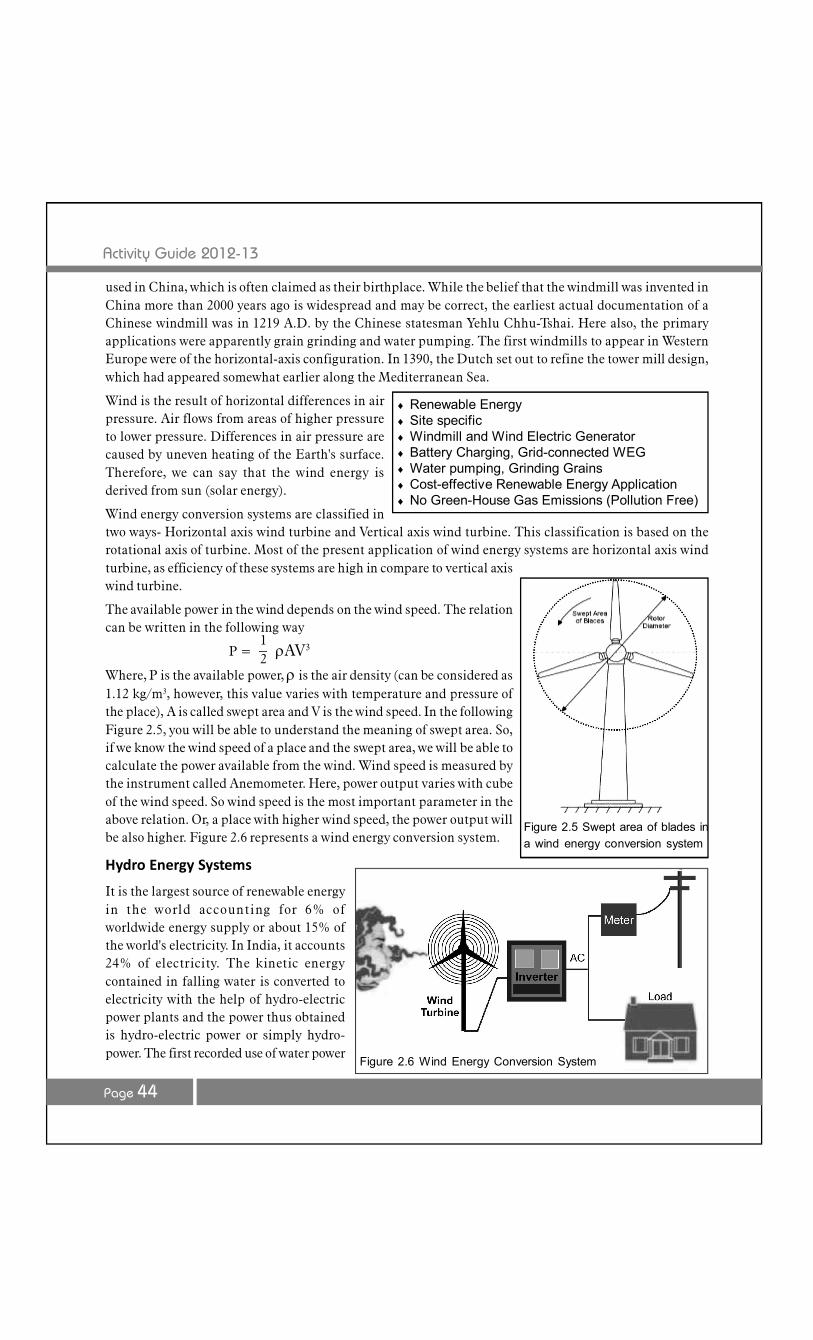
Activity Guide 2012-13
Page 44
used in China, which is often claimed as their birthplace. While the belief that the windmill was invented inChina more than 2000 years ago is widespread and may be correct, the earliest actual documentation of aChinese windmill was in 1219 A.D. by the Chinese statesman Yehlu Chhu-Tshai. Here also, the primaryapplications were apparently grain grinding and water pumping. The first windmills to appear in WesternEurope were of the horizontal-axis configuration. In 1390, the Dutch set out to refine the tower mill design,which had appeared somewhat earlier along the Mediterranean Sea.
Wind is the result of horizontal differences in airpressure. Air flows from areas of higher pressureto lower pressure. Differences in air pressure arecaused by uneven heating of the Earth's surface.Therefore, we can say that the wind energy isderived from sun (solar energy).
Wind energy conversion systems are classified intwo ways- Horizontal axis wind turbine and Vertical axis wind turbine. This classification is based on therotational axis of turbine. Most of the present application of wind energy systems are horizontal axis windturbine, as efficiency of these systems are high in compare to vertical axiswind turbine.
The available power in the wind depends on the wind speed. The relationcan be written in the following way
Where, P is the available power, is the air density (can be considered as1.12 kg/m3, however, this value varies with temperature and pressure ofthe place), A is called swept area and V is the wind speed. In the followingFigure 2.5, you will be able to understand the meaning of swept area. So,if we know the wind speed of a place and the swept area, we will be able tocalculate the power available from the wind. Wind speed is measured bythe instrument called Anemometer. Here, power output varies with cubeof the wind speed. So wind speed is the most important parameter in theabove relation. Or, a place with higher wind speed, the power output willbe also higher. Figure 2.6 represents a wind energy conversion system.
Hydro Energy Systems
It is the largest source of renewable energyin the world accounting for 6% ofworldwide energy supply or about 15% ofthe world's electricity. In India, it accounts24% of electricity. The kinetic energycontained in falling water is converted toelectricity with the help of hydro-electricpower plants and the power thus obtainedis hydro-electric power or simply hydro-power. The first recorded use of water power
Renewable Energy Site specific Windmill and Wind Electric Generator Battery Charging, Grid-connected WEG Water pumping, Grinding Grains Cost-effective Renewable Energy Application No Green-House Gas Emissions (Pollution Free)
12P = AV3
Figure 2.5 Swept area of blades ina wind energy conversion system
Figure 2.6 Wind Energy Conversion System
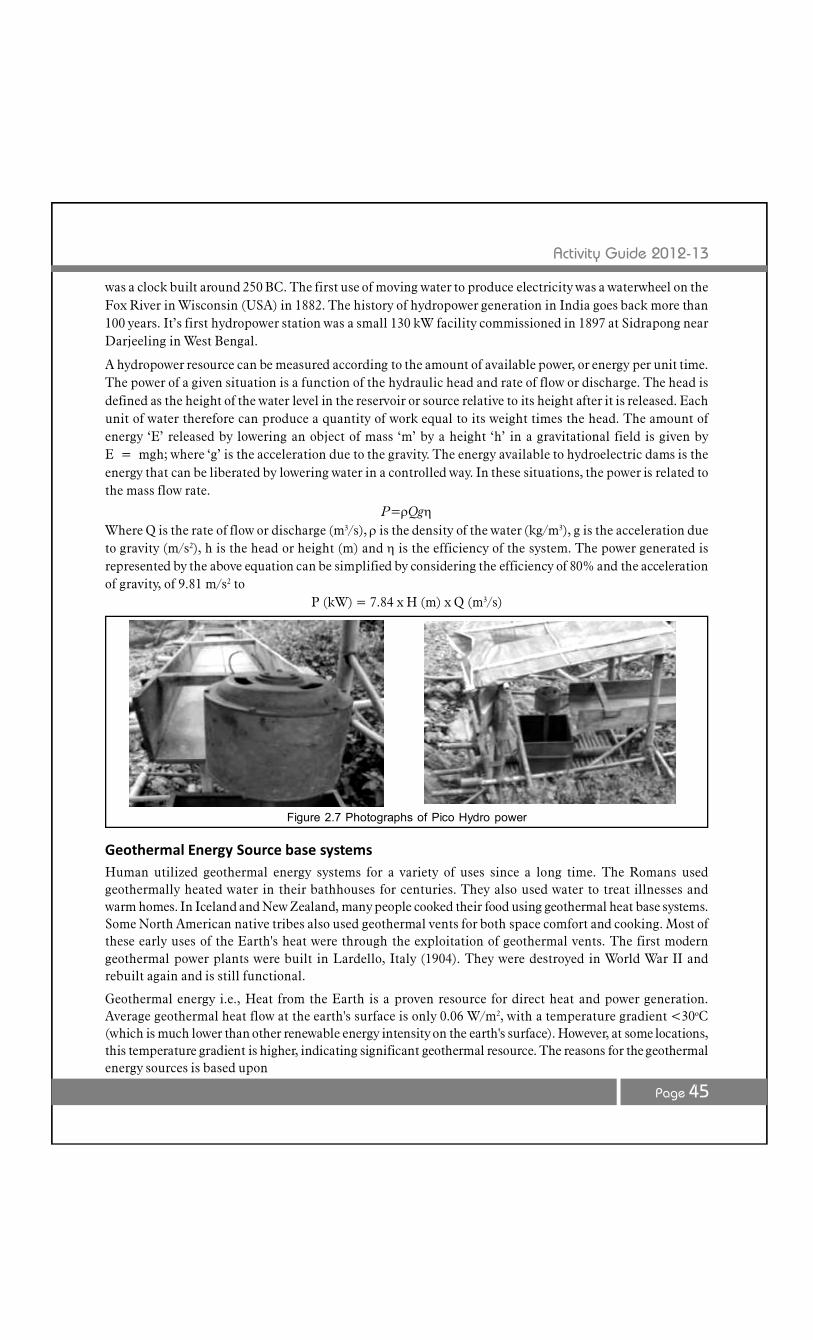
Activity Guide 2012-13
Page 45
was a clock built around 250 BC. The first use of moving water to produce electricity was a waterwheel on theFox River in Wisconsin (USA) in 1882. The history of hydropower generation in India goes back more than100 years. It’s first hydropower station was a small 130 kW facility commissioned in 1897 at Sidrapong nearDarjeeling in West Bengal.
A hydropower resource can be measured according to the amount of available power, or energy per unit time.The power of a given situation is a function of the hydraulic head and rate of flow or discharge. The head isdefined as the height of the water level in the reservoir or source relative to its height after it is released. Eachunit of water therefore can produce a quantity of work equal to its weight times the head. The amount ofenergy ‘E’ released by lowering an object of mass ‘m’ by a height ‘h’ in a gravitational field is given byE = mgh; where ‘g’ is the acceleration due to the gravity. The energy available to hydroelectric dams is theenergy that can be liberated by lowering water in a controlled way. In these situations, the power is related tothe mass flow rate.
P=QgWhere Q is the rate of flow or discharge (m3/s), is the density of the water (kg/m3), g is the acceleration dueto gravity (m/s2), h is the head or height (m) and is the efficiency of the system. The power generated isrepresented by the above equation can be simplified by considering the efficiency of 80% and the accelerationof gravity, of 9.81 m/s2 to
P (kW) = 7.84 x H (m) x Q (m3/s)
Geothermal Energy Source base systemsHuman utilized geothermal energy systems for a variety of uses since a long time. The Romans usedgeothermally heated water in their bathhouses for centuries. They also used water to treat illnesses andwarm homes. In Iceland and New Zealand, many people cooked their food using geothermal heat base systems.Some North American native tribes also used geothermal vents for both space comfort and cooking. Most ofthese early uses of the Earth's heat were through the exploitation of geothermal vents. The first moderngeothermal power plants were built in Lardello, Italy (1904). They were destroyed in World War II andrebuilt again and is still functional.
Geothermal energy i.e., Heat from the Earth is a proven resource for direct heat and power generation.Average geothermal heat flow at the earth's surface is only 0.06 W/m2, with a temperature gradient <30oC(which is much lower than other renewable energy intensity on the earth's surface). However, at some locations,this temperature gradient is higher, indicating significant geothermal resource. The reasons for the geothermalenergy sources is based upon
Figure 2.7 Photographs of Pico Hydro power
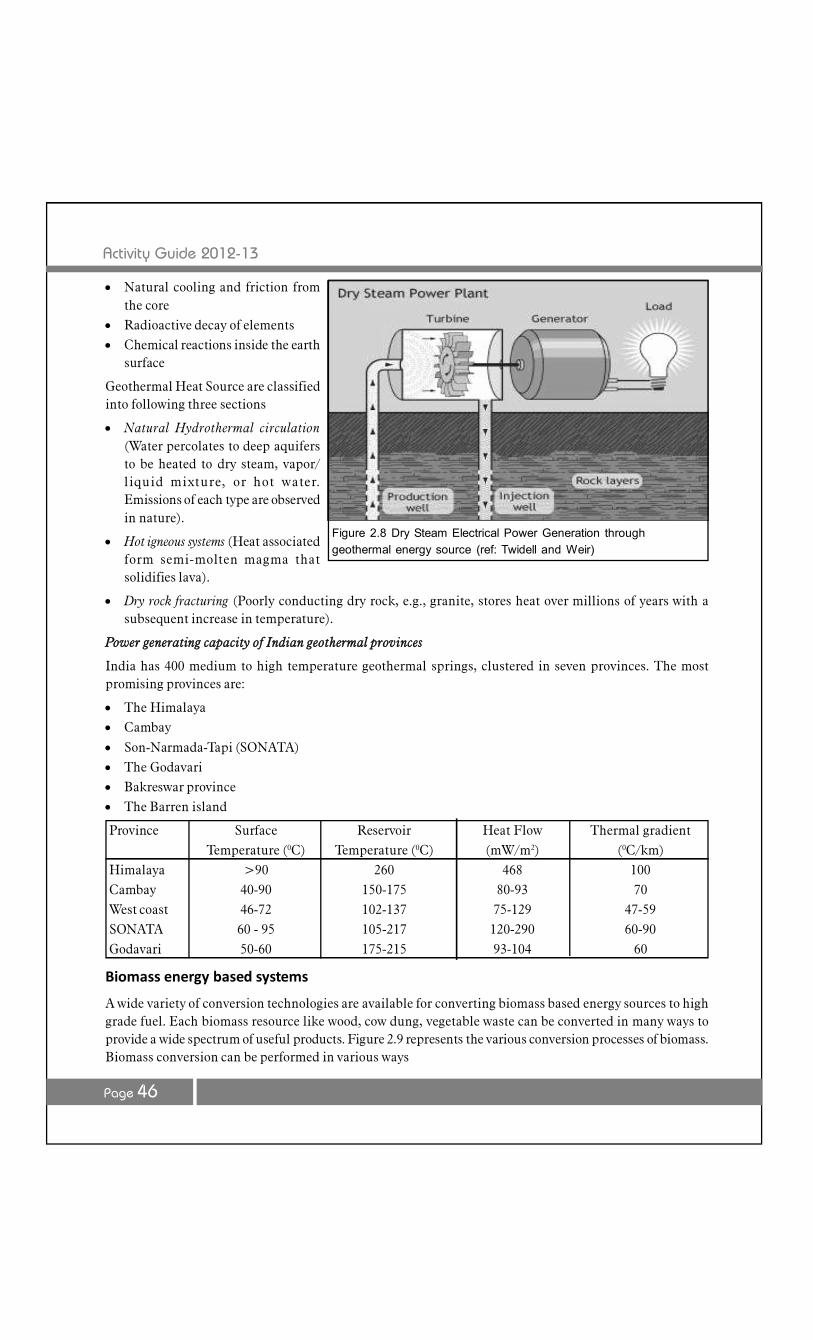
Activity Guide 2012-13
Page 46
Natural cooling and friction fromthe core
Radioactive decay of elements Chemical reactions inside the earth
surface
Geothermal Heat Source are classifiedinto following three sections
Natural Hydrothermal circulation(Water percolates to deep aquifersto be heated to dry steam, vapor/liquid mixture, or hot water.Emissions of each type are observedin nature).
Hot igneous systems (Heat associatedform semi-molten magma thatsolidifies lava).
Dry rock fracturing (Poorly conducting dry rock, e.g., granite, stores heat over millions of years with asubsequent increase in temperature).
Power generating capacity of Indian geothermal provinces
India has 400 medium to high temperature geothermal springs, clustered in seven provinces. The mostpromising provinces are:
The Himalaya Cambay
Son-Narmada-Tapi (SONATA) The Godavari Bakreswar province The Barren island
Province Surface Reservoir Heat Flow Thermal gradientTemperature (0C) Temperature (0C) (mW/m2) (0C/km)
Himalaya >90 260 468 100Cambay 40-90 150-175 80-93 70West coast 46-72 102-137 75-129 47-59SONATA 60 - 95 105-217 120-290 60-90Godavari 50-60 175-215 93-104 60
Biomass energy based systems
A wide variety of conversion technologies are available for converting biomass based energy sources to highgrade fuel. Each biomass resource like wood, cow dung, vegetable waste can be converted in many ways toprovide a wide spectrum of useful products. Figure 2.9 represents the various conversion processes of biomass.Biomass conversion can be performed in various ways
Figure 2.8 Dry Steam Electrical Power Generation throughgeothermal energy source (ref: Twidell and Weir)
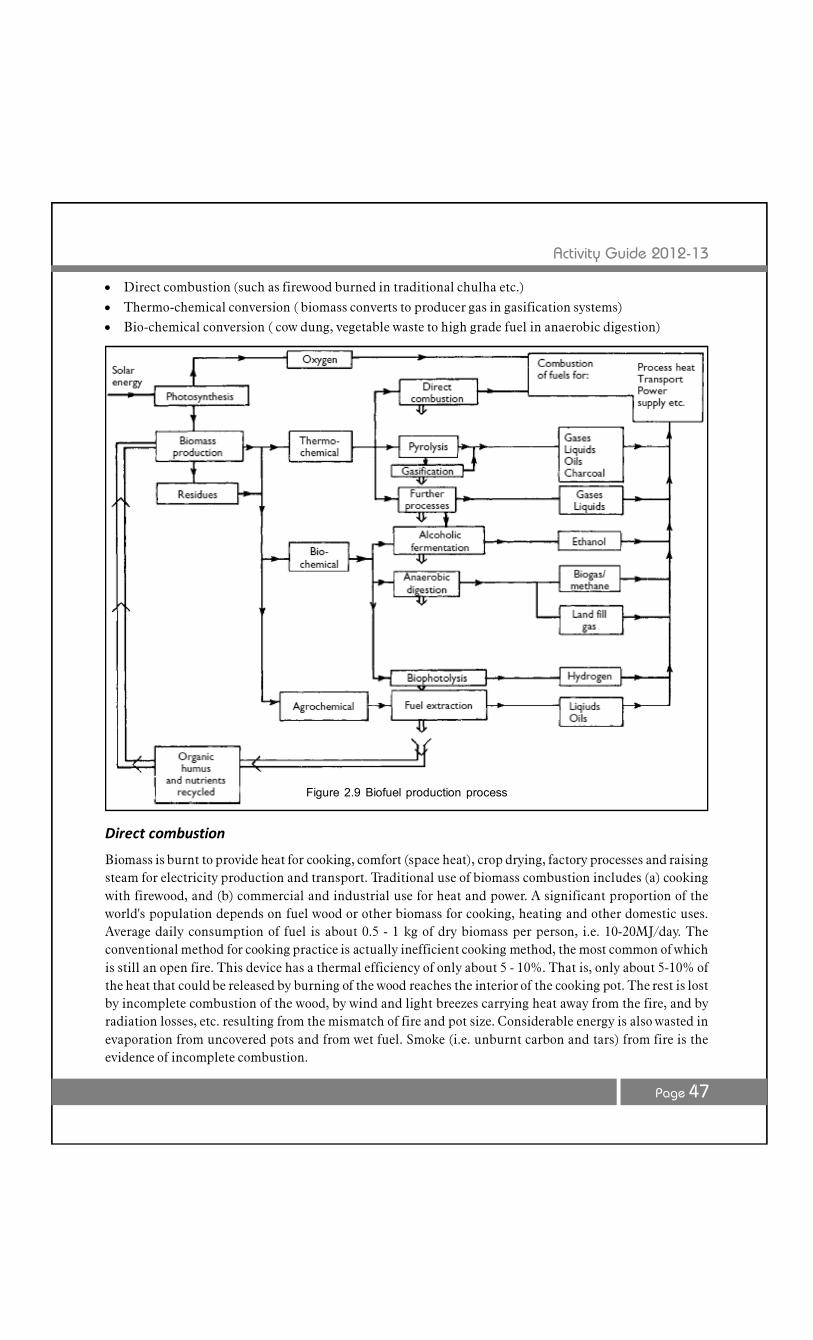
Activity Guide 2012-13
Page 47
Direct combustion (such as firewood burned in traditional chulha etc.)
Thermo-chemical conversion ( biomass converts to producer gas in gasification systems) Bio-chemical conversion ( cow dung, vegetable waste to high grade fuel in anaerobic digestion)
Direct combustion
Biomass is burnt to provide heat for cooking, comfort (space heat), crop drying, factory processes and raisingsteam for electricity production and transport. Traditional use of biomass combustion includes (a) cookingwith firewood, and (b) commercial and industrial use for heat and power. A significant proportion of theworld's population depends on fuel wood or other biomass for cooking, heating and other domestic uses.Average daily consumption of fuel is about 0.5 - 1 kg of dry biomass per person, i.e. 10-20MJ/day. Theconventional method for cooking practice is actually inefficient cooking method, the most common of whichis still an open fire. This device has a thermal efficiency of only about 5 - 10%. That is, only about 5-10% ofthe heat that could be released by burning of the wood reaches the interior of the cooking pot. The rest is lostby incomplete combustion of the wood, by wind and light breezes carrying heat away from the fire, and byradiation losses, etc. resulting from the mismatch of fire and pot size. Considerable energy is also wasted inevaporation from uncovered pots and from wet fuel. Smoke (i.e. unburnt carbon and tars) from fire is theevidence of incomplete combustion.
Figure 2.9 Biofuel production process
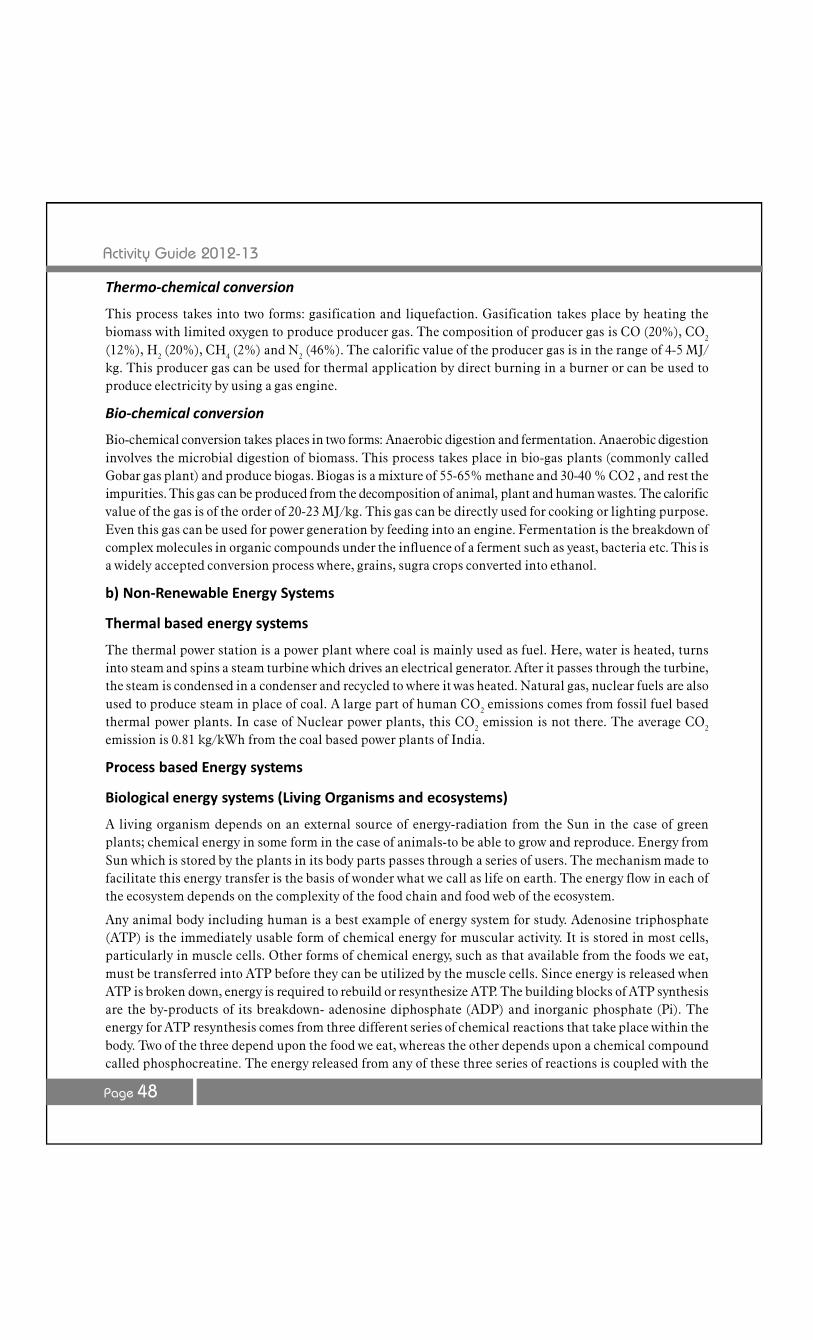
Activity Guide 2012-13
Page 48
Thermo-chemical conversion
This process takes into two forms: gasification and liquefaction. Gasification takes place by heating thebiomass with limited oxygen to produce producer gas. The composition of producer gas is CO (20%), CO2
(12%), H2 (20%), CH4 (2%) and N2 (46%). The calorific value of the producer gas is in the range of 4-5 MJ/kg. This producer gas can be used for thermal application by direct burning in a burner or can be used toproduce electricity by using a gas engine.
Bio-chemical conversion
Bio-chemical conversion takes places in two forms: Anaerobic digestion and fermentation. Anaerobic digestioninvolves the microbial digestion of biomass. This process takes place in bio-gas plants (commonly calledGobar gas plant) and produce biogas. Biogas is a mixture of 55-65% methane and 30-40 % CO2 , and rest theimpurities. This gas can be produced from the decomposition of animal, plant and human wastes. The calorificvalue of the gas is of the order of 20-23 MJ/kg. This gas can be directly used for cooking or lighting purpose.Even this gas can be used for power generation by feeding into an engine. Fermentation is the breakdown ofcomplex molecules in organic compounds under the influence of a ferment such as yeast, bacteria etc. This isa widely accepted conversion process where, grains, sugra crops converted into ethanol.
b) Non-Renewable Energy Systems
Thermal based energy systems
The thermal power station is a power plant where coal is mainly used as fuel. Here, water is heated, turnsinto steam and spins a steam turbine which drives an electrical generator. After it passes through the turbine,the steam is condensed in a condenser and recycled to where it was heated. Natural gas, nuclear fuels are alsoused to produce steam in place of coal. A large part of human CO2 emissions comes from fossil fuel basedthermal power plants. In case of Nuclear power plants, this CO2 emission is not there. The average CO2
emission is 0.81 kg/kWh from the coal based power plants of India.
Process based Energy systems
Biological energy systems (Living Organisms and ecosystems)
A living organism depends on an external source of energy-radiation from the Sun in the case of greenplants; chemical energy in some form in the case of animals-to be able to grow and reproduce. Energy fromSun which is stored by the plants in its body parts passes through a series of users. The mechanism made tofacilitate this energy transfer is the basis of wonder what we call as life on earth. The energy flow in each ofthe ecosystem depends on the complexity of the food chain and food web of the ecosystem.
Any animal body including human is a best example of energy system for study. Adenosine triphosphate(ATP) is the immediately usable form of chemical energy for muscular activity. It is stored in most cells,particularly in muscle cells. Other forms of chemical energy, such as that available from the foods we eat,must be transferred into ATP before they can be utilized by the muscle cells. Since energy is released whenATP is broken down, energy is required to rebuild or resynthesize ATP. The building blocks of ATP synthesisare the by-products of its breakdown- adenosine diphosphate (ADP) and inorganic phosphate (Pi). Theenergy for ATP resynthesis comes from three different series of chemical reactions that take place within thebody. Two of the three depend upon the food we eat, whereas the other depends upon a chemical compoundcalled phosphocreatine. The energy released from any of these three series of reactions is coupled with the
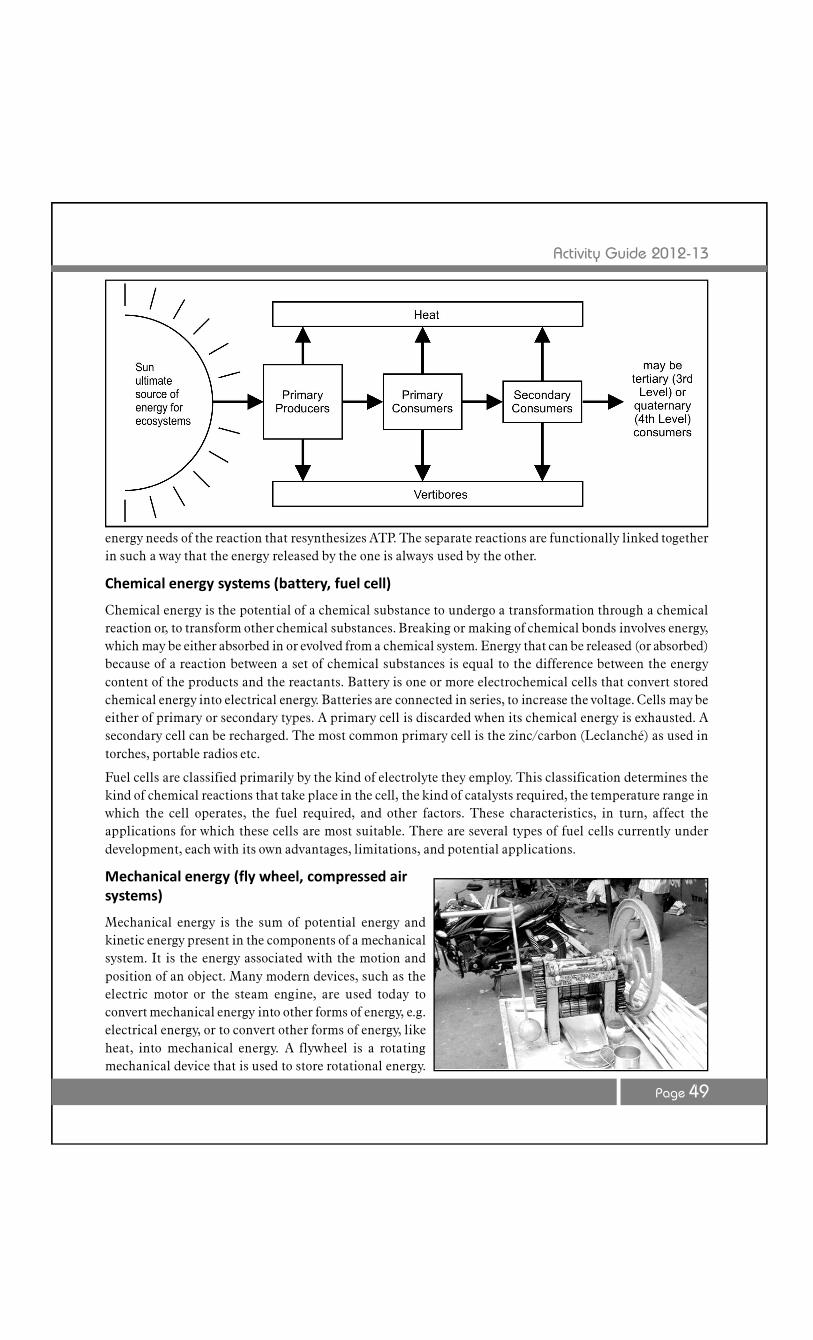
Activity Guide 2012-13
Page 49
energy needs of the reaction that resynthesizes ATP. The separate reactions are functionally linked togetherin such a way that the energy released by the one is always used by the other.
Chemical energy systems (battery, fuel cell)
Chemical energy is the potential of a chemical substance to undergo a transformation through a chemicalreaction or, to transform other chemical substances. Breaking or making of chemical bonds involves energy,which may be either absorbed in or evolved from a chemical system. Energy that can be released (or absorbed)because of a reaction between a set of chemical substances is equal to the difference between the energycontent of the products and the reactants. Battery is one or more electrochemical cells that convert storedchemical energy into electrical energy. Batteries are connected in series, to increase the voltage. Cells may beeither of primary or secondary types. A primary cell is discarded when its chemical energy is exhausted. Asecondary cell can be recharged. The most common primary cell is the zinc/carbon (Leclanché) as used intorches, portable radios etc.
Fuel cells are classified primarily by the kind of electrolyte they employ. This classification determines thekind of chemical reactions that take place in the cell, the kind of catalysts required, the temperature range inwhich the cell operates, the fuel required, and other factors. These characteristics, in turn, affect theapplications for which these cells are most suitable. There are several types of fuel cells currently underdevelopment, each with its own advantages, limitations, and potential applications.
Mechanical energy (fly wheel, compressed airsystems)
Mechanical energy is the sum of potential energy andkinetic energy present in the components of a mechanicalsystem. It is the energy associated with the motion andposition of an object. Many modern devices, such as theelectric motor or the steam engine, are used today toconvert mechanical energy into other forms of energy, e.g.electrical energy, or to convert other forms of energy, likeheat, into mechanical energy. A flywheel is a rotatingmechanical device that is used to store rotational energy.
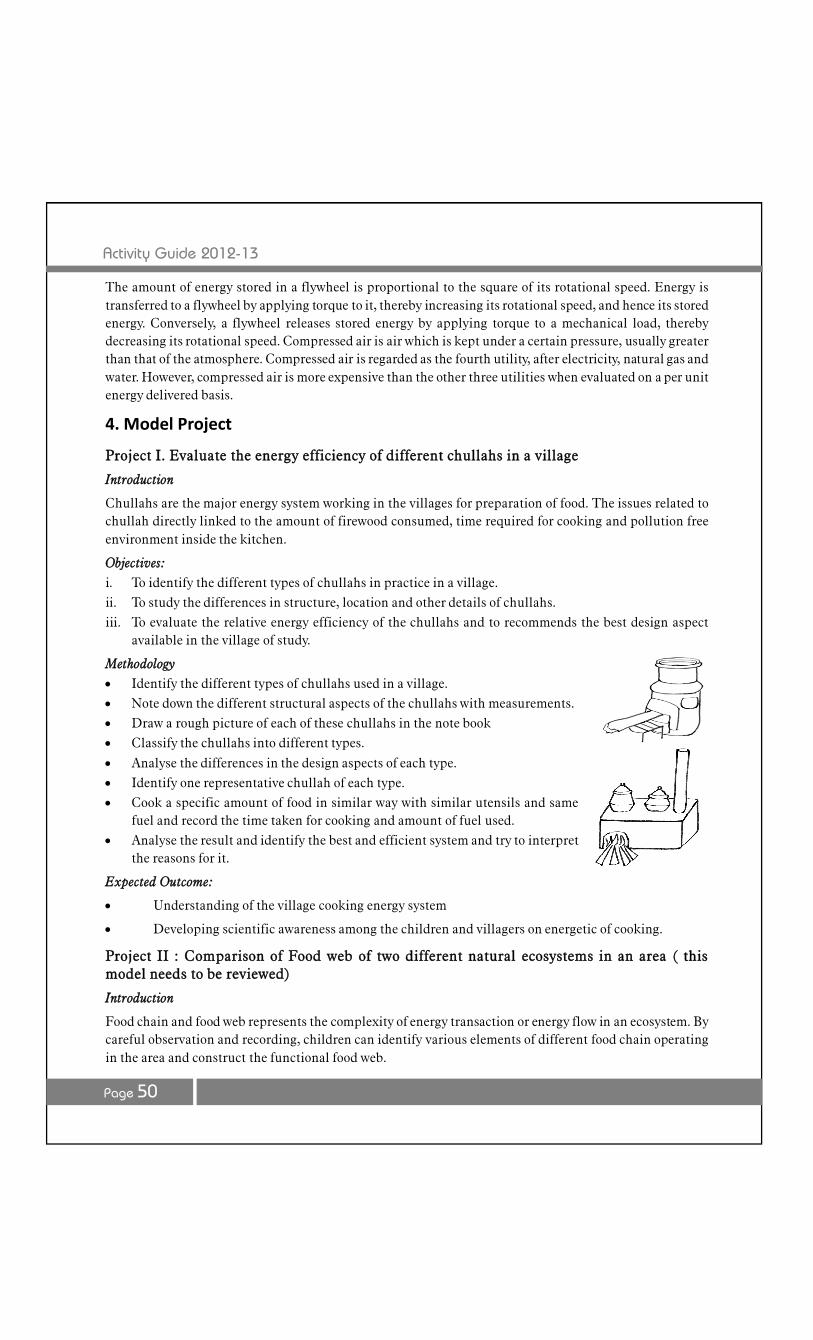
Activity Guide 2012-13
Page 50
The amount of energy stored in a flywheel is proportional to the square of its rotational speed. Energy istransferred to a flywheel by applying torque to it, thereby increasing its rotational speed, and hence its storedenergy. Conversely, a flywheel releases stored energy by applying torque to a mechanical load, therebydecreasing its rotational speed. Compressed air is air which is kept under a certain pressure, usually greaterthan that of the atmosphere. Compressed air is regarded as the fourth utility, after electricity, natural gas andwater. However, compressed air is more expensive than the other three utilities when evaluated on a per unitenergy delivered basis.
4. Model Project
Project I. Evaluate the energy efficiency of different chullahs in a village
Introduction
Chullahs are the major energy system working in the villages for preparation of food. The issues related tochullah directly linked to the amount of firewood consumed, time required for cooking and pollution freeenvironment inside the kitchen.
Objectives:i. To identify the different types of chullahs in practice in a village.ii. To study the differences in structure, location and other details of chullahs.iii. To evaluate the relative energy efficiency of the chullahs and to recommends the best design aspect
available in the village of study.
Methodology Identify the different types of chullahs used in a village. Note down the different structural aspects of the chullahs with measurements. Draw a rough picture of each of these chullahs in the note book Classify the chullahs into different types.
Analyse the differences in the design aspects of each type. Identify one representative chullah of each type. Cook a specific amount of food in similar way with similar utensils and same
fuel and record the time taken for cooking and amount of fuel used. Analyse the result and identify the best and efficient system and try to interpret
the reasons for it.
Expected Outcome:
Understanding of the village cooking energy system
Developing scientific awareness among the children and villagers on energetic of cooking.
Project II : Comparison of Food web of two different natural ecosystems in an area ( thismodel needs to be reviewed)
Introduction
Food chain and food web represents the complexity of energy transaction or energy flow in an ecosystem. Bycareful observation and recording, children can identify various elements of different food chain operatingin the area and construct the functional food web.

Activity Guide 2012-13
Page 51
Objectives
i. To identify the food chains of two different natural ecosystems in the areaii. To construct the food web of each of these area and study the difference.iii. To construct the approximate energy flow diagrams applicable for the ecosystems under study.
Materials required:
Binoculars, Magnifying glasses, microscope, notebook, pen/pencil etc
Methodology:
Identify two different ecosystems of similar special aspects for study. Mark the boundaries and make an approximate manual map of the area depicting the changes of micro
ecosystems of the area. Observe and note down different organisms and their activities. Identify directly or by taking photos, in the case of soil insects collect a few of them and identify using a
magnifying glass or a microscope. Record all observations of eating and being eater with details of time and date. Construct the simple food chains first, later develop it in to the working food web of the system.
It is estimated that only less than 7 % of the solar energy is used in photosyntheis at each trophic level ofenergy transfer there is similar loss of energy.
Construct an approximate energy flow diagram and appropriate energy pyramid for the two ecosystemsunder study.
Compare the energy flow scenario between the ecosystems, interpret the result discuss the energytransaction and its implications.
Expected Outcome:
Understanding and appreciating the energy transactions inthe natural ecosystems.
Tertiary consumer
1- Unit of Energy Secondary consumer
10 Unit Energy
Primary consumer100 Unit Energy
1000 Units of Energy
Producer
Fig: Example of Energy transformation in trophic levels, Source: Seuj Prayas Published by: Assam ScienceTechnology and Environment Council, Guwahati, Assam
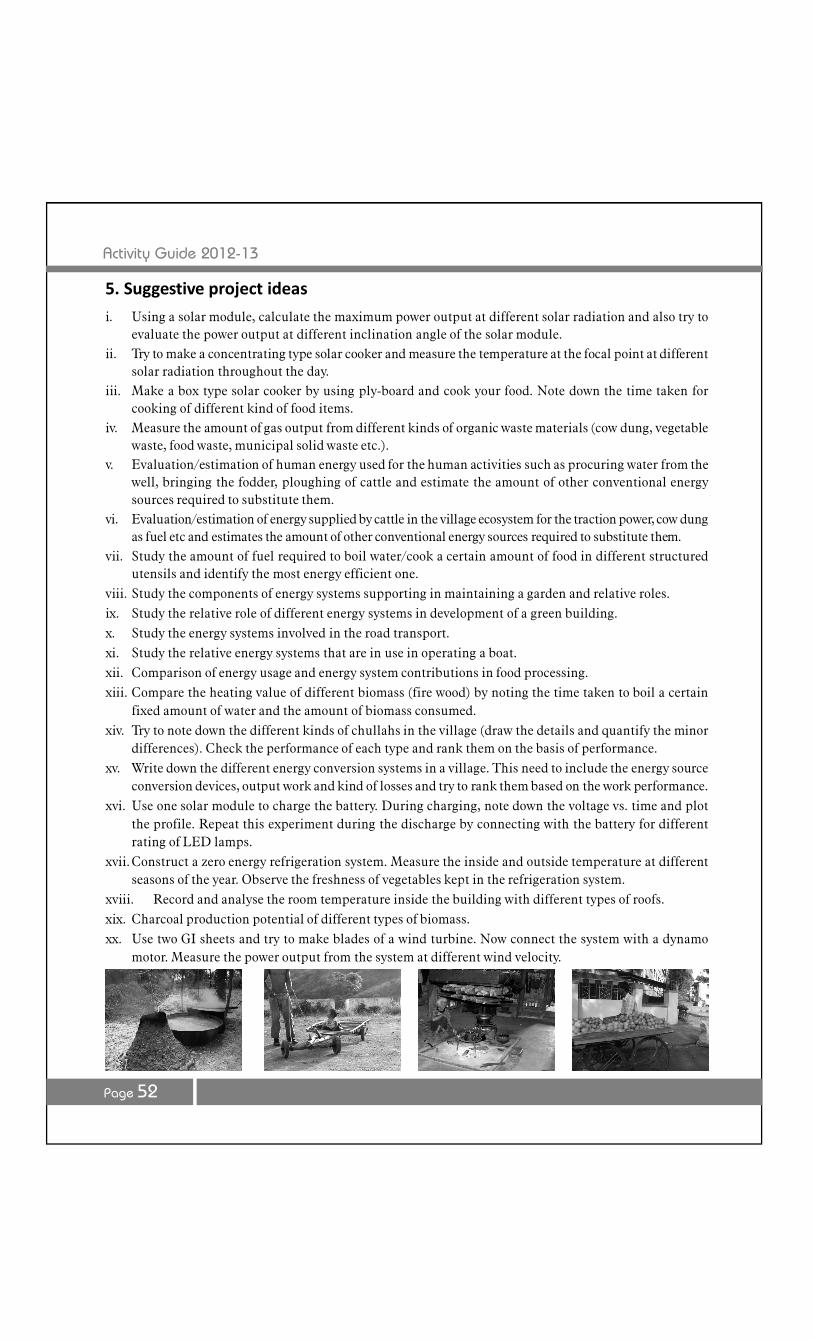
Activity Guide 2012-13
Page 52
5. Suggestive project ideas
i. Using a solar module, calculate the maximum power output at different solar radiation and also try toevaluate the power output at different inclination angle of the solar module.
ii. Try to make a concentrating type solar cooker and measure the temperature at the focal point at differentsolar radiation throughout the day.
iii. Make a box type solar cooker by using ply-board and cook your food. Note down the time taken forcooking of different kind of food items.
iv. Measure the amount of gas output from different kinds of organic waste materials (cow dung, vegetablewaste, food waste, municipal solid waste etc.).
v. Evaluation/estimation of human energy used for the human activities such as procuring water from thewell, bringing the fodder, ploughing of cattle and estimate the amount of other conventional energysources required to substitute them.
vi. Evaluation/estimation of energy supplied by cattle in the village ecosystem for the traction power, cow dungas fuel etc and estimates the amount of other conventional energy sources required to substitute them.
vii. Study the amount of fuel required to boil water/cook a certain amount of food in different structuredutensils and identify the most energy efficient one.
viii. Study the components of energy systems supporting in maintaining a garden and relative roles.ix. Study the relative role of different energy systems in development of a green building.x. Study the energy systems involved in the road transport.xi. Study the relative energy systems that are in use in operating a boat.xii. Comparison of energy usage and energy system contributions in food processing.xiii. Compare the heating value of different biomass (fire wood) by noting the time taken to boil a certain
fixed amount of water and the amount of biomass consumed.xiv. Try to note down the different kinds of chullahs in the village (draw the details and quantify the minor
differences). Check the performance of each type and rank them on the basis of performance.xv. Write down the different energy conversion systems in a village. This need to include the energy source
conversion devices, output work and kind of losses and try to rank them based on the work performance.xvi. Use one solar module to charge the battery. During charging, note down the voltage vs. time and plot
the profile. Repeat this experiment during the discharge by connecting with the battery for differentrating of LED lamps.
xvii. Construct a zero energy refrigeration system. Measure the inside and outside temperature at differentseasons of the year. Observe the freshness of vegetables kept in the refrigeration system.
xviii. Record and analyse the room temperature inside the building with different types of roofs.xix. Charcoal production potential of different types of biomass.xx. Use two GI sheets and try to make blades of a wind turbine. Now connect the system with a dynamo
motor. Measure the power output from the system at different wind velocity.
Activity Guide 2012-13
Page 53
Sub-Theme-III
Energy and Society

Activity Guide 2012-13
Page 54
Dr. A.K. GoswamiMr. Jaideep BaruahMr. U.N. RavikumarDr. V.P. SinghMr. Simanta Kalita
Working Group of the sub-theme
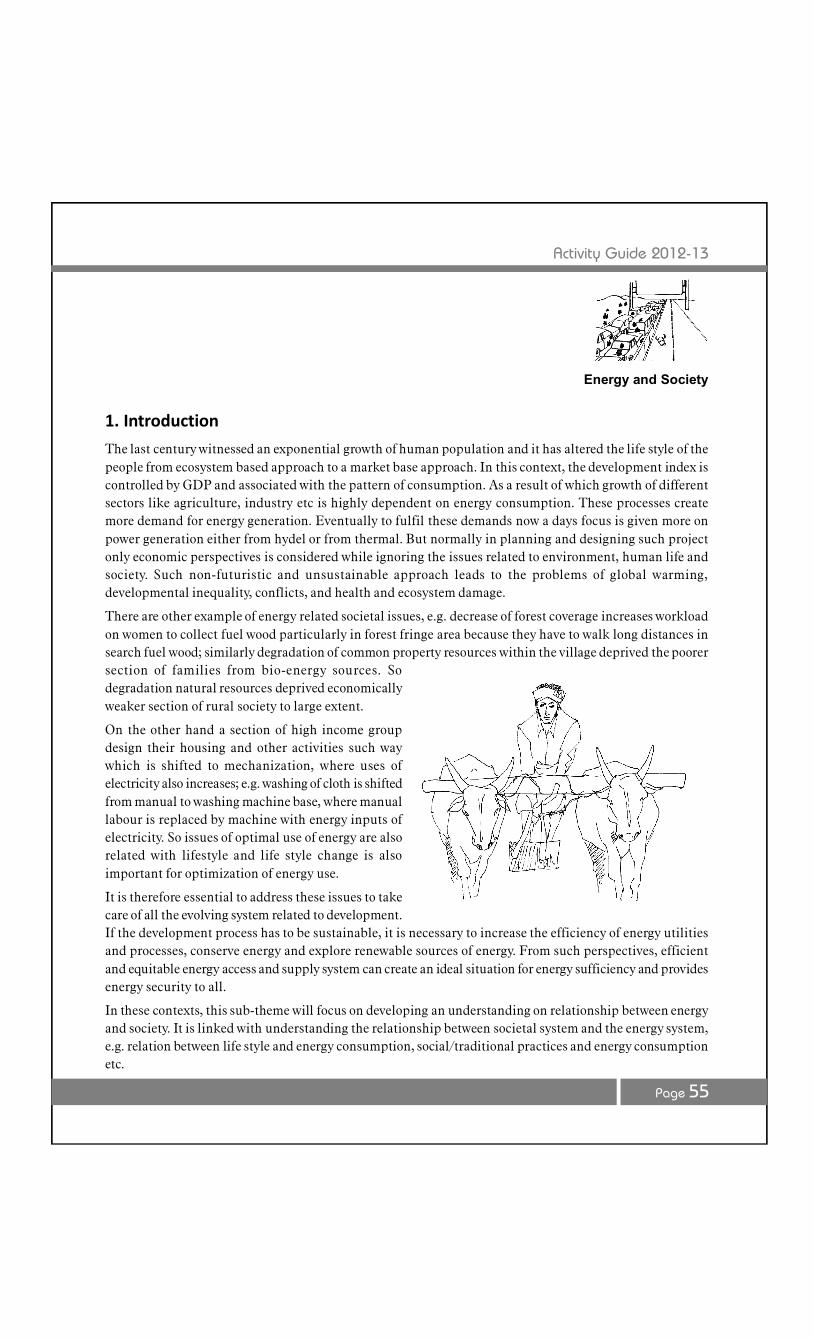
Activity Guide 2012-13
Page 55
1. Introduction
The last century witnessed an exponential growth of human population and it has altered the life style of thepeople from ecosystem based approach to a market base approach. In this context, the development index iscontrolled by GDP and associated with the pattern of consumption. As a result of which growth of differentsectors like agriculture, industry etc is highly dependent on energy consumption. These processes createmore demand for energy generation. Eventually to fulfil these demands now a days focus is given more onpower generation either from hydel or from thermal. But normally in planning and designing such projectonly economic perspectives is considered while ignoring the issues related to environment, human life andsociety. Such non-futuristic and unsustainable approach leads to the problems of global warming,developmental inequality, conflicts, and health and ecosystem damage.
There are other example of energy related societal issues, e.g. decrease of forest coverage increases workloadon women to collect fuel wood particularly in forest fringe area because they have to walk long distances insearch fuel wood; similarly degradation of common property resources within the village deprived the poorersection of families from bio-energy sources. Sodegradation natural resources deprived economicallyweaker section of rural society to large extent.
On the other hand a section of high income groupdesign their housing and other activities such waywhich is shifted to mechanization, where uses ofelectricity also increases; e.g. washing of cloth is shiftedfrom manual to washing machine base, where manuallabour is replaced by machine with energy inputs ofelectricity. So issues of optimal use of energy are alsorelated with lifestyle and life style change is alsoimportant for optimization of energy use.
It is therefore essential to address these issues to takecare of all the evolving system related to development.If the development process has to be sustainable, it is necessary to increase the efficiency of energy utilitiesand processes, conserve energy and explore renewable sources of energy. From such perspectives, efficientand equitable energy access and supply system can create an ideal situation for energy sufficiency and providesenergy security to all.
In these contexts, this sub-theme will focus on developing an understanding on relationship between energyand society. It is linked with understanding the relationship between societal system and the energy system,e.g. relation between life style and energy consumption, social/traditional practices and energy consumptionetc.
Energy and Society
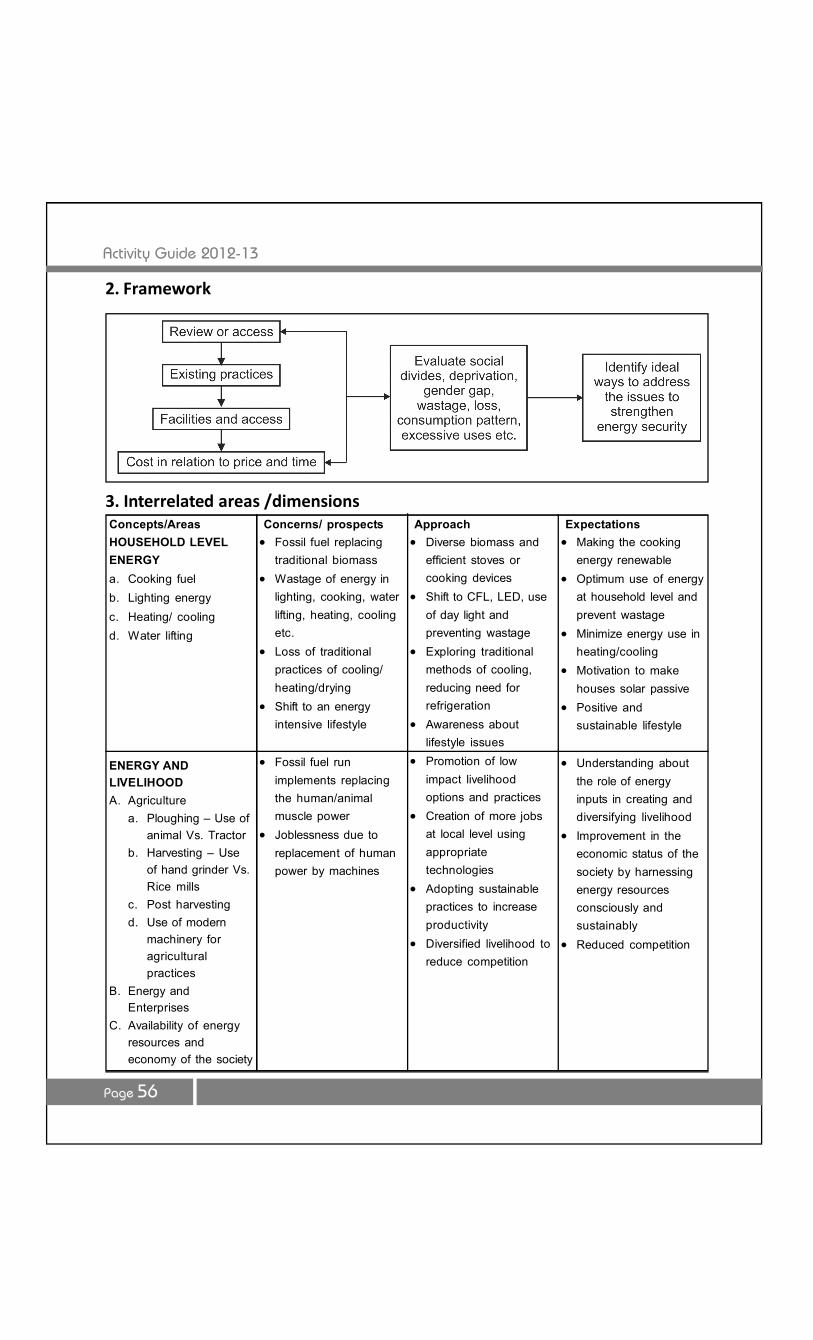
Activity Guide 2012-13
Page 56
2. Framework
3. Interrelated areas /dimensions
HOUSEHOLD LEVELENERGYa. Cooking fuelb. Lighting energyc. Heating/ coolingd. Water lifting
ENERGY ANDLIVELIHOODA. Agriculture
a. Ploughing – Use ofanimal Vs. Tractor
b. Harvesting – Useof hand grinder Vs.Rice mills
c. Post harvestingd. Use of modern
machinery foragriculturalpractices
B. Energy andEnterprises
C. Availability of energyresources andeconomy of the society
Fossil fuel replacingtraditional biomass
Wastage of energy inlighting, cooking, waterlifting, heating, coolingetc.
Loss of traditionalpractices of cooling/heating/drying
Shift to an energyintensive lifestyle
Fossil fuel runimplements replacingthe human/animalmuscle power
Joblessness due toreplacement of humanpower by machines
Diverse biomass andefficient stoves orcooking devices
Shift to CFL, LED, useof day light andpreventing wastage
Exploring traditionalmethods of cooling,reducing need forrefrigeration
Awareness aboutlifestyle issues
Promotion of lowimpact livelihoodoptions and practices
Creation of more jobsat local level usingappropriatetechnologies
Adopting sustainablepractices to increaseproductivity
Diversified livelihood toreduce competition
Making the cookingenergy renewable
Optimum use of energyat household level andprevent wastage
Minimize energy use inheating/cooling
Motivation to makehouses solar passive
Positive andsustainable lifestyle
Understanding aboutthe role of energyinputs in creating anddiversifying livelihood
Improvement in theeconomic status of thesociety by harnessingenergy resourcesconsciously andsustainably
Reduced competition
Concepts/Areas Concerns/ prospects Approach Expectations
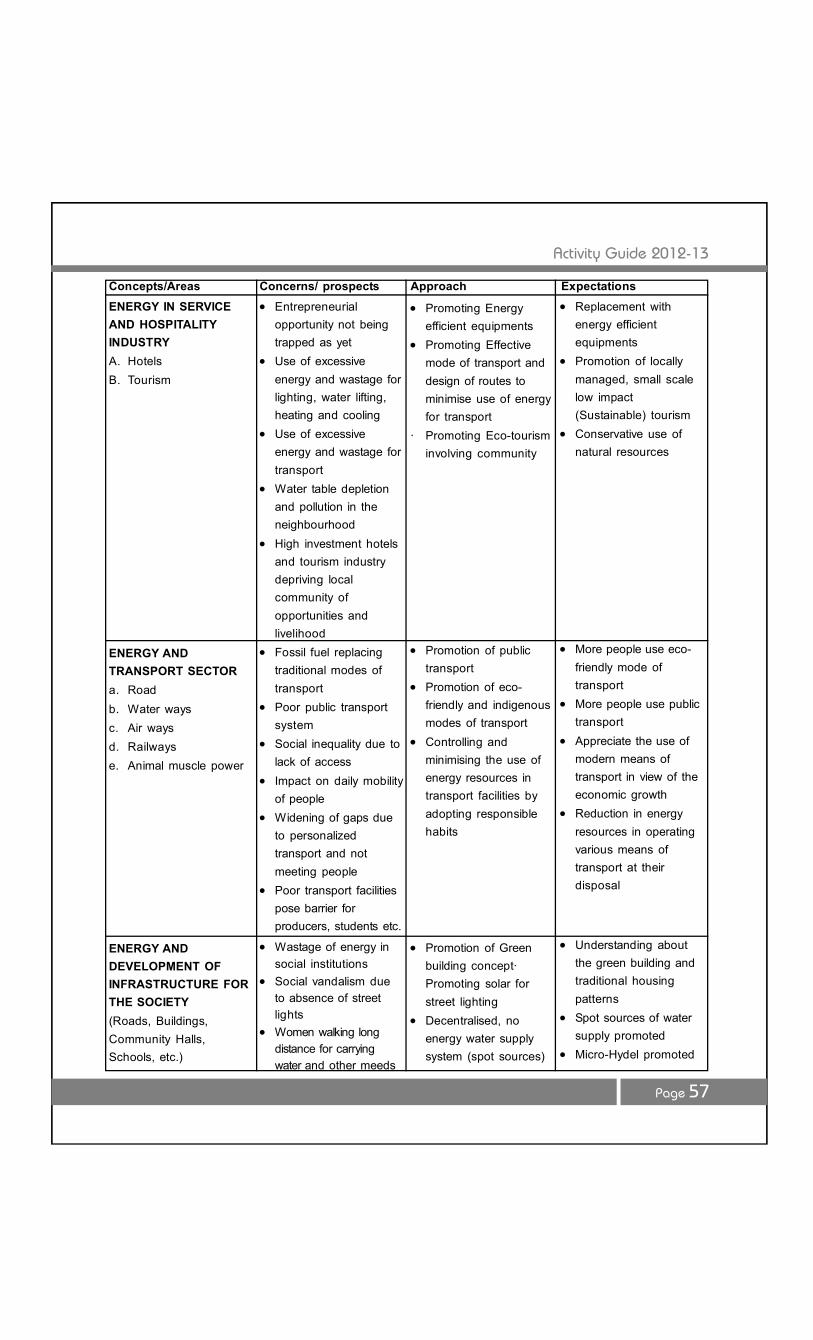
Activity Guide 2012-13
Page 57
ENERGY IN SERVICEAND HOSPITALITYINDUSTRYA. HotelsB. Tourism
ENERGY ANDTRANSPORT SECTORa. Roadb. Water waysc. Air waysd. Railwayse. Animal muscle power
ENERGY ANDDEVELOPMENT OFINFRASTRUCTURE FORTHE SOCIETY(Roads, Buildings,Community Halls,Schools, etc.)
Entrepreneurialopportunity not beingtrapped as yet
Use of excessiveenergy and wastage forlighting, water lifting,heating and cooling
Use of excessiveenergy and wastage fortransport
Water table depletionand pollution in theneighbourhood
High investment hotelsand tourism industrydepriving localcommunity ofopportunities andlivelihood
Fossil fuel replacingtraditional modes oftransport
Poor public transportsystem
Social inequality due tolack of access
Impact on daily mobilityof people
Widening of gaps dueto personalizedtransport and notmeeting people
Poor transport facilitiespose barrier forproducers, students etc.
Wastage of energy insocial institutions
Social vandalism dueto absence of streetlights
Women walking longdistance for carryingwater and other meeds
Promoting Energyefficient equipments
Promoting Effectivemode of transport anddesign of routes tominimise use of energyfor transport
· Promoting Eco-tourisminvolving community
Promotion of publictransport
Promotion of eco-friendly and indigenousmodes of transport
Controlling andminimising the use ofenergy resources intransport facilities byadopting responsiblehabits
Promotion of Greenbuilding concept·Promoting solar forstreet lighting
Decentralised, noenergy water supplysystem (spot sources)
Replacement withenergy efficientequipments
Promotion of locallymanaged, small scalelow impact(Sustainable) tourism
Conservative use ofnatural resources
More people use eco-friendly mode oftransport
More people use publictransport
Appreciate the use ofmodern means oftransport in view of theeconomic growth
Reduction in energyresources in operatingvarious means oftransport at theirdisposal
Understanding aboutthe green building andtraditional housingpatterns
Spot sources of watersupply promoted
Micro-Hydel promoted
Concepts/Areas Concerns/ prospects Approach Expectations
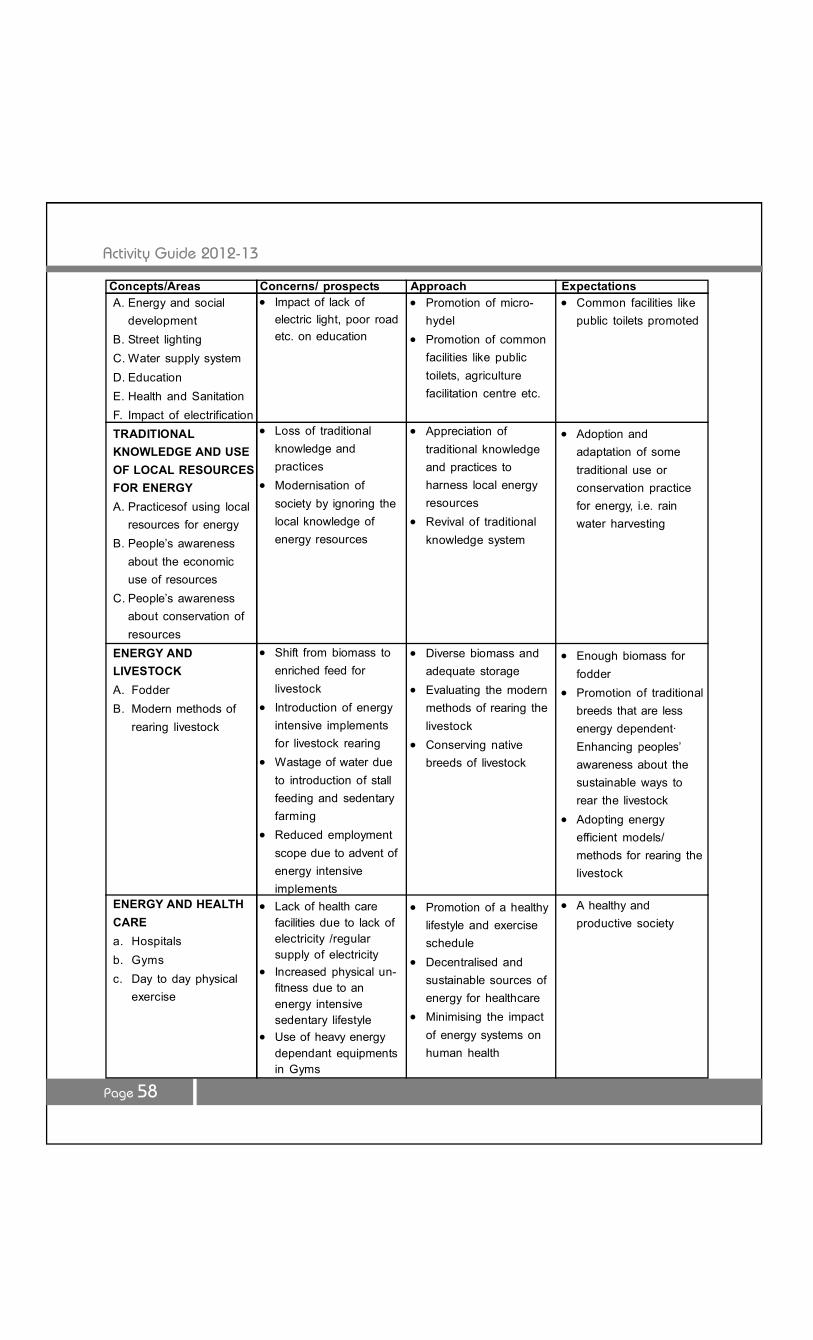
Activity Guide 2012-13
Page 58
Impact of lack ofelectric light, poor roadetc. on education
Loss of traditionalknowledge andpractices
Modernisation ofsociety by ignoring thelocal knowledge ofenergy resources
Shift from biomass toenriched feed forlivestock
Introduction of energyintensive implementsfor livestock rearing
Wastage of water dueto introduction of stallfeeding and sedentaryfarming
Reduced employmentscope due to advent ofenergy intensiveimplements
Lack of health carefacilities due to lack ofelectricity /regularsupply of electricity
Increased physical un-fitness due to anenergy intensivesedentary lifestyle
Use of heavy energydependant equipmentsin Gyms
A. Energy and socialdevelopment
B. Street lightingC. Water supply systemD. EducationE. Health and SanitationF. Impact of electrificationTRADITIONALKNOWLEDGE AND USEOF LOCAL RESOURCESFOR ENERGYA. Practicesof using local
resources for energyB. People’s awareness
about the economicuse of resources
C. People’s awarenessabout conservation ofresources
ENERGY ANDLIVESTOCKA. FodderB. Modern methods of
rearing livestock
ENERGY AND HEALTHCAREa. Hospitalsb. Gymsc. Day to day physical
exercise
Promotion of micro-hydel
Promotion of commonfacilities like publictoilets, agriculturefacilitation centre etc.
Appreciation oftraditional knowledgeand practices toharness local energyresources
Revival of traditionalknowledge system
Diverse biomass andadequate storage
Evaluating the modernmethods of rearing thelivestock
Conserving nativebreeds of livestock
Promotion of a healthylifestyle and exerciseschedule
Decentralised andsustainable sources ofenergy for healthcare
Minimising the impactof energy systems onhuman health
Common facilities likepublic toilets promoted
Adoption andadaptation of sometraditional use orconservation practicefor energy, i.e. rainwater harvesting
Enough biomass forfodder
Promotion of traditionalbreeds that are lessenergy dependent·Enhancing peoples’awareness about thesustainable ways torear the livestock
Adopting energyefficient models/methods for rearing thelivestock
A healthy andproductive society
Concepts/Areas Concerns/ prospects Approach Expectations
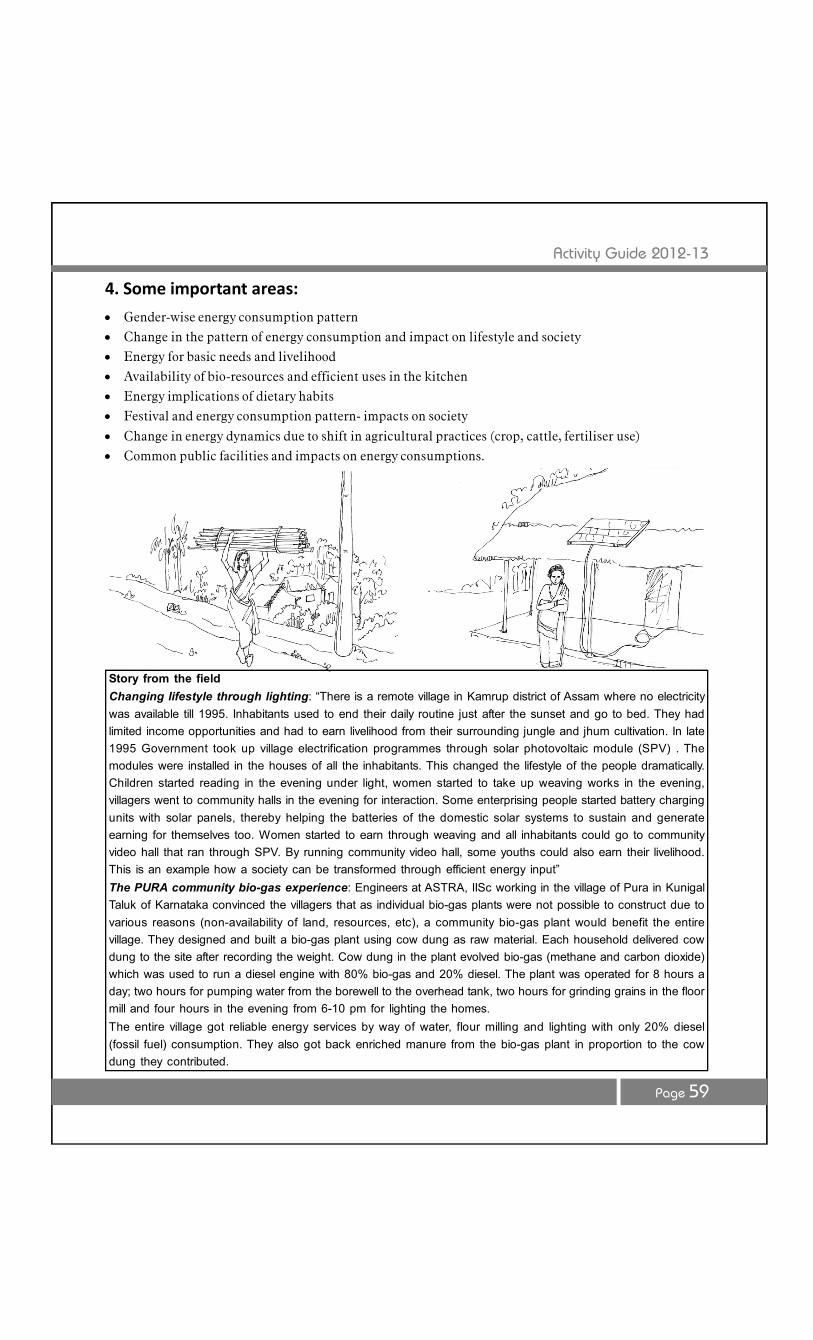
Activity Guide 2012-13
Page 59
4. Some important areas:
Gender-wise energy consumption pattern Change in the pattern of energy consumption and impact on lifestyle and society Energy for basic needs and livelihood Availability of bio-resources and efficient uses in the kitchen Energy implications of dietary habits Festival and energy consumption pattern- impacts on society
Change in energy dynamics due to shift in agricultural practices (crop, cattle, fertiliser use) Common public facilities and impacts on energy consumptions.
Story from the fieldChanging lifestyle through lighting: “There is a remote village in Kamrup district of Assam where no electricitywas available till 1995. Inhabitants used to end their daily routine just after the sunset and go to bed. They hadlimited income opportunities and had to earn livelihood from their surrounding jungle and jhum cultivation. In late1995 Government took up village electrification programmes through solar photovoltaic module (SPV) . Themodules were installed in the houses of all the inhabitants. This changed the lifestyle of the people dramatically.Children started reading in the evening under light, women started to take up weaving works in the evening,villagers went to community halls in the evening for interaction. Some enterprising people started battery chargingunits with solar panels, thereby helping the batteries of the domestic solar systems to sustain and generateearning for themselves too. Women started to earn through weaving and all inhabitants could go to communityvideo hall that ran through SPV. By running community video hall, some youths could also earn their livelihood.This is an example how a society can be transformed through efficient energy input”The PURA community bio-gas experience: Engineers at ASTRA, IISc working in the village of Pura in KunigalTaluk of Karnataka convinced the villagers that as individual bio-gas plants were not possible to construct due tovarious reasons (non-availability of land, resources, etc), a community bio-gas plant would benefit the entirevillage. They designed and built a bio-gas plant using cow dung as raw material. Each household delivered cowdung to the site after recording the weight. Cow dung in the plant evolved bio-gas (methane and carbon dioxide)which was used to run a diesel engine with 80% bio-gas and 20% diesel. The plant was operated for 8 hours aday; two hours for pumping water from the borewell to the overhead tank, two hours for grinding grains in the floormill and four hours in the evening from 6-10 pm for lighting the homes.The entire village got reliable energy services by way of water, flour milling and lighting with only 20% diesel(fossil fuel) consumption. They also got back enriched manure from the bio-gas plant in proportion to the cowdung they contributed.
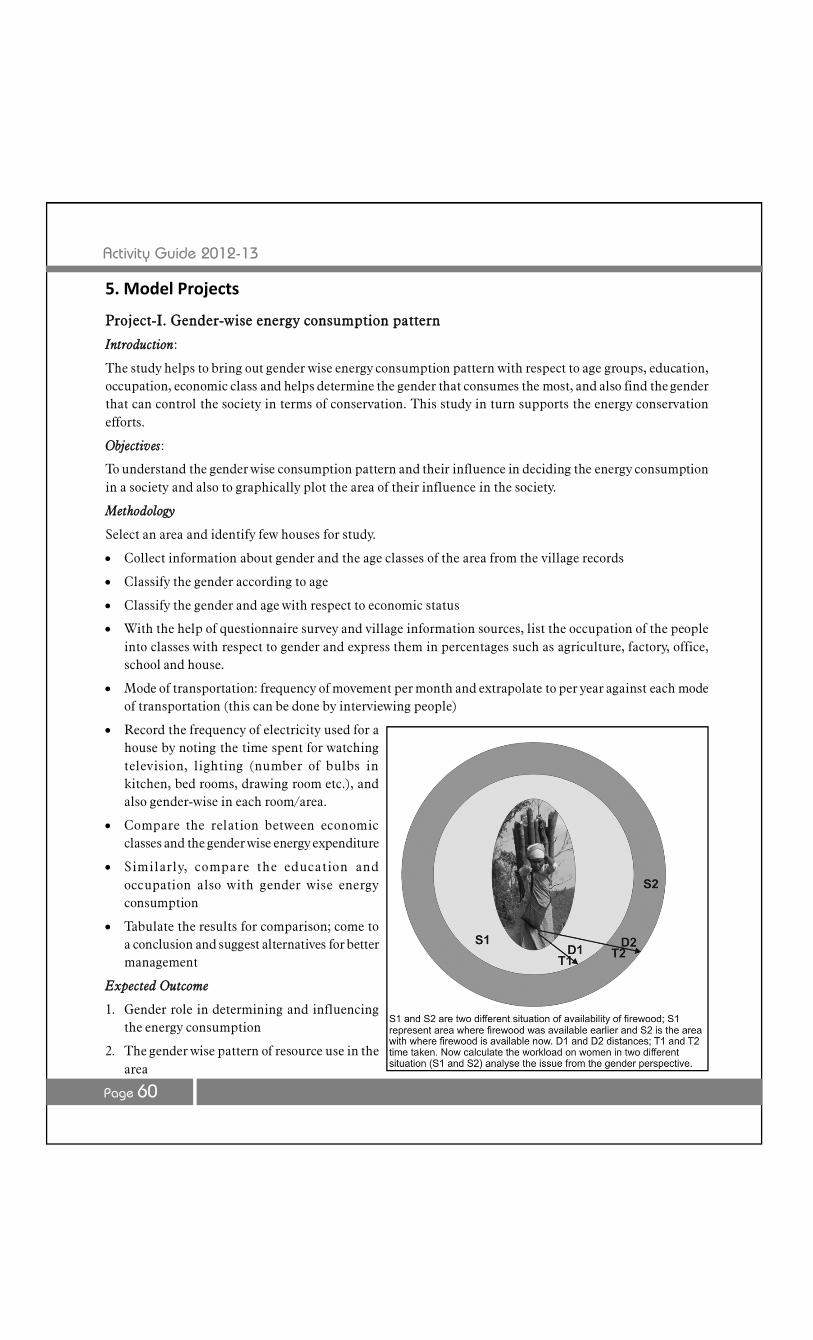
Activity Guide 2012-13
Page 60
5. Model Projects
Project-I. Gender-wise energy consumption pattern
Introduction:
The study helps to bring out gender wise energy consumption pattern with respect to age groups, education,occupation, economic class and helps determine the gender that consumes the most, and also find the genderthat can control the society in terms of conservation. This study in turn supports the energy conservationefforts.
Objectives:
To understand the gender wise consumption pattern and their influence in deciding the energy consumptionin a society and also to graphically plot the area of their influence in the society.
Methodology
Select an area and identify few houses for study.
Collect information about gender and the age classes of the area from the village records
Classify the gender according to age
Classify the gender and age with respect to economic status
With the help of questionnaire survey and village information sources, list the occupation of the peopleinto classes with respect to gender and express them in percentages such as agriculture, factory, office,school and house.
Mode of transportation: frequency of movement per month and extrapolate to per year against each modeof transportation (this can be done by interviewing people)
Record the frequency of electricity used for ahouse by noting the time spent for watchingtelevision, lighting (number of bulbs inkitchen, bed rooms, drawing room etc.), andalso gender-wise in each room/area.
Compare the relation between economicclasses and the gender wise energy expenditure
Similarly, compare the education andoccupation also with gender wise energyconsumption
Tabulate the results for comparison; come toa conclusion and suggest alternatives for bettermanagement
Expected Outcome
1. Gender role in determining and influencingthe energy consumption
2. The gender wise pattern of resource use in thearea
Activity Guide 2012-13
Page 61
Project -II. Energy implications of food and diet
Introduction
Food is the energy source of all living beings. With the invention of fire and with the social evolution, varietiesof food habits arose. Food preparation also accordingly evolved and has grown complex over time. Nowadaysthe food preparation activities have started consuming a lot of energy and time. From survival it has movedon to become a lifestyle statement. It will be interesting to compare the calorific output of each food item andthe energy necessary to prepare it.
Objectives
To assess the energy required to preparequantities of different food items, which willprovide equal calorie of energy
Methodology1. Select different food items of different food styles (Traditional Indian, Traditional to your locality, modern
food items, Chinese, etc.)2. Identify the calorific value of each of the food items, by an expert consultation if necessary3. Identify the quantities of different types of food items required to provide a particular, given calorie of
energy4. List out the processes and duration in the course of preparation of each food item5. Calculate the energy input in all the cooking processes for each item6. Estimate the energy required for preparing each types of food required to produce particular quantities
of energy7. The results can be illustrated by graphs, box plots etc.8. Draw your conclusion.
Social relevance of the project
This study will help to identify the students to understand the energy costs of taste and lifestyle, which willgive a new outlook to the students about the real value of food and their energy implications.
Project - III. Energy spent to stay fit
Introduction
Energy is a valuable resource of mankind. The resources should be conserved and used for constructivepurposes. Nowadays lot many people are regularly exercised in the health clubs and gymnasiums to stay fit.Such exercises lead to burning extra calories of energy from the food taken and avoid the cholesterol formationin the body. This can be easily overcome by managing the qualities and quantities of food consumed, (whichis very important in case of country facing food security problems), and by a physically active lifestyle. Anassessment of the energy spent in health clubs and gymnasiums, we will get an idea about how much of theenergy which has to be used for the constructive purposes are being used to “stay fit”.
Objective
Quantify the energy requirement to stay fit
Materials required
Pen, papers, etc.
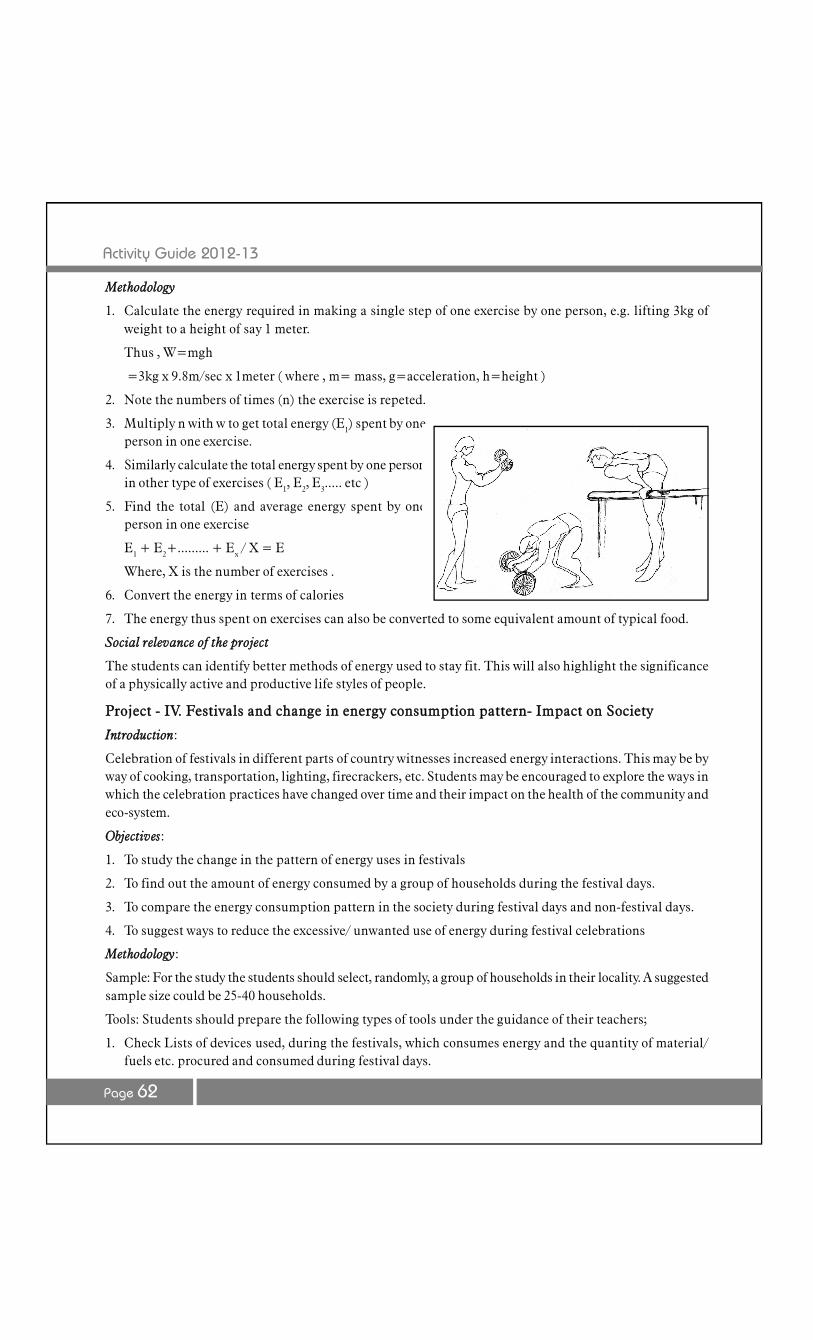
Activity Guide 2012-13
Page 62
Methodology
1. Calculate the energy required in making a single step of one exercise by one person, e.g. lifting 3kg ofweight to a height of say 1 meter.
Thus , W=mgh
=3kg x 9.8m/sec x 1meter ( where , m= mass, g=acceleration, h=height )
2. Note the numbers of times (n) the exercise is repeted.
3. Multiply n with w to get total energy (E1) spent by oneperson in one exercise.
4. Similarly calculate the total energy spent by one personin other type of exercises ( E1, E2, E3..... etc )
5. Find the total (E) and average energy spent by oneperson in one exercise
E1 + E2+......... + Ex / X = E
Where, X is the number of exercises .
6. Convert the energy in terms of calories
7. The energy thus spent on exercises can also be converted to some equivalent amount of typical food.
Social relevance of the project
The students can identify better methods of energy used to stay fit. This will also highlight the significanceof a physically active and productive life styles of people.
Project - IV. Festivals and change in energy consumption pattern- Impact on Society
Introduction:
Celebration of festivals in different parts of country witnesses increased energy interactions. This may be byway of cooking, transportation, lighting, firecrackers, etc. Students may be encouraged to explore the ways inwhich the celebration practices have changed over time and their impact on the health of the community andeco-system.
Objectives:
1. To study the change in the pattern of energy uses in festivals
2. To find out the amount of energy consumed by a group of households during the festival days.
3. To compare the energy consumption pattern in the society during festival days and non-festival days.
4. To suggest ways to reduce the excessive/ unwanted use of energy during festival celebrations
Methodology:
Sample: For the study the students should select, randomly, a group of households in their locality. A suggestedsample size could be 25-40 households.
Tools: Students should prepare the following types of tools under the guidance of their teachers;
1. Check Lists of devices used, during the festivals, which consumes energy and the quantity of material/fuels etc. procured and consumed during festival days.
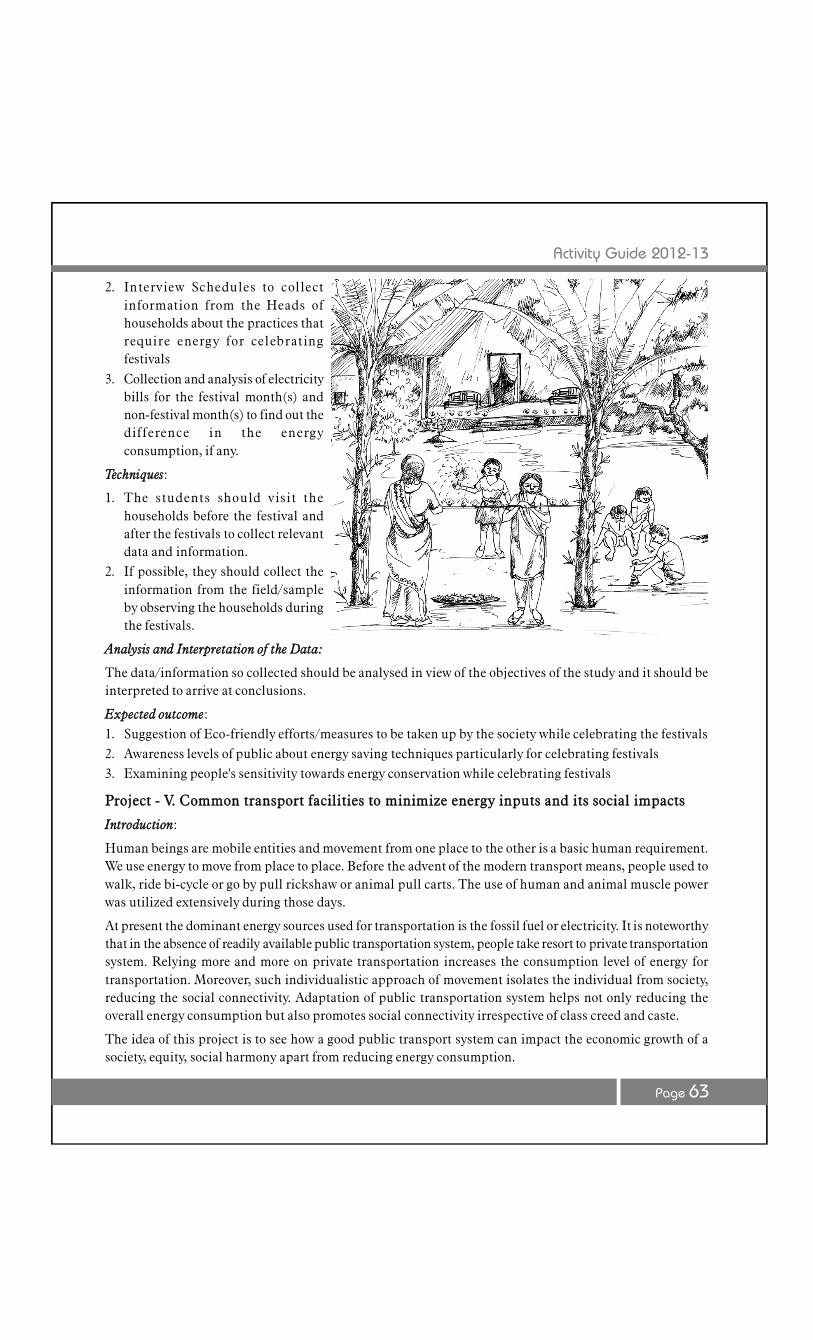
Activity Guide 2012-13
Page 63
2. Interview Schedules to collectinformation from the Heads ofhouseholds about the practices thatrequire energy for celebratingfestivals
3. Collection and analysis of electricitybills for the festival month(s) andnon-festival month(s) to find out thedifference in the energyconsumption, if any.
Techniques:
1. The students should visit thehouseholds before the festival andafter the festivals to collect relevantdata and information.
2. If possible, they should collect theinformation from the field/sampleby observing the households duringthe festivals.
Analysis and Interpretation of the Data:
The data/information so collected should be analysed in view of the objectives of the study and it should beinterpreted to arrive at conclusions.
Expected outcome:1. Suggestion of Eco-friendly efforts/measures to be taken up by the society while celebrating the festivals2. Awareness levels of public about energy saving techniques particularly for celebrating festivals3. Examining people's sensitivity towards energy conservation while celebrating festivals
Project - V. Common transport facilities to minimize energy inputs and its social impacts
Introduction:
Human beings are mobile entities and movement from one place to the other is a basic human requirement.We use energy to move from place to place. Before the advent of the modern transport means, people used towalk, ride bi-cycle or go by pull rickshaw or animal pull carts. The use of human and animal muscle powerwas utilized extensively during those days.
At present the dominant energy sources used for transportation is the fossil fuel or electricity. It is noteworthythat in the absence of readily available public transportation system, people take resort to private transportationsystem. Relying more and more on private transportation increases the consumption level of energy fortransportation. Moreover, such individualistic approach of movement isolates the individual from society,reducing the social connectivity. Adaptation of public transportation system helps not only reducing theoverall energy consumption but also promotes social connectivity irrespective of class creed and caste.
The idea of this project is to see how a good public transport system can impact the economic growth of asociety, equity, social harmony apart from reducing energy consumption.
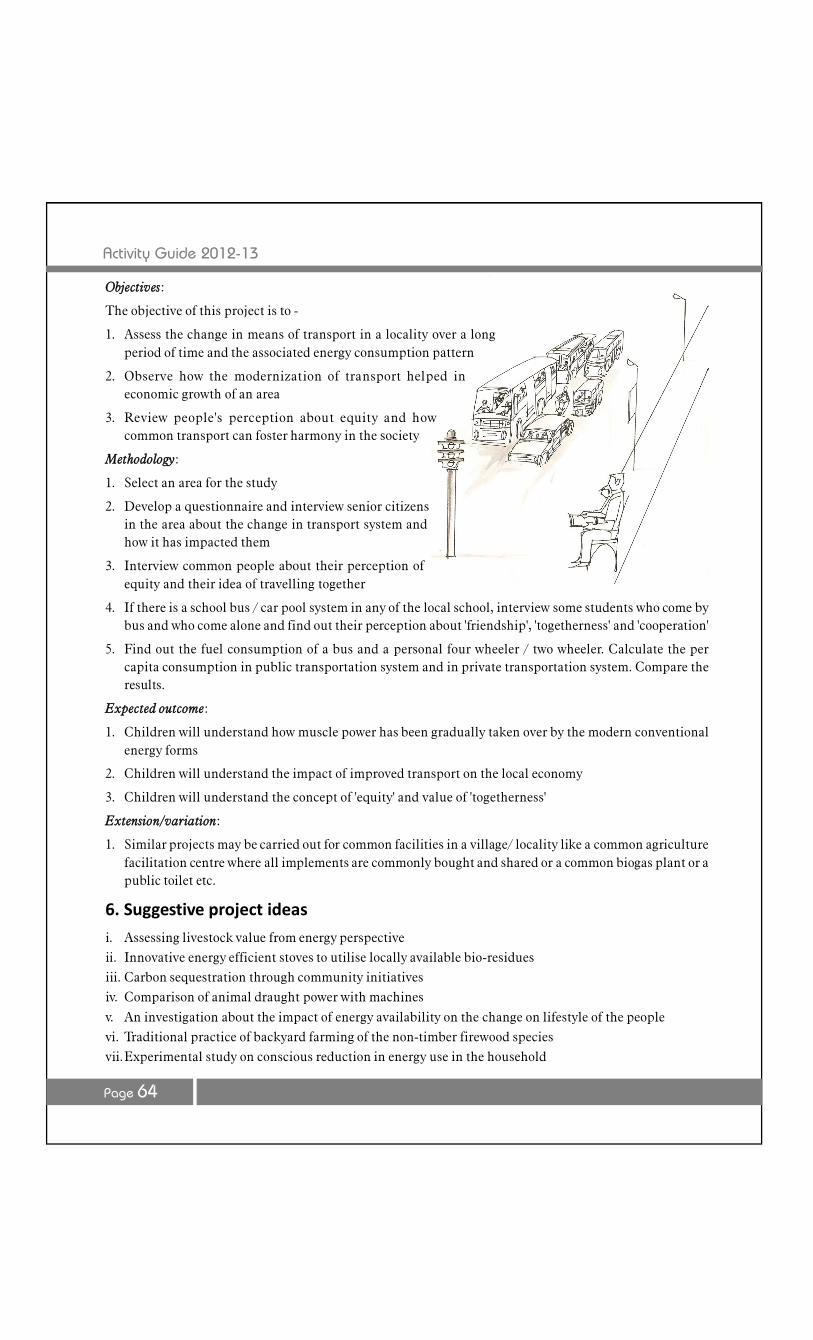
Activity Guide 2012-13
Page 64
Objectives:
The objective of this project is to -
1. Assess the change in means of transport in a locality over a longperiod of time and the associated energy consumption pattern
2. Observe how the modernization of transport helped ineconomic growth of an area
3. Review people's perception about equity and howcommon transport can foster harmony in the society
Methodology:
1. Select an area for the study
2. Develop a questionnaire and interview senior citizensin the area about the change in transport system andhow it has impacted them
3. Interview common people about their perception ofequity and their idea of travelling together
4. If there is a school bus / car pool system in any of the local school, interview some students who come bybus and who come alone and find out their perception about 'friendship', 'togetherness' and 'cooperation'
5. Find out the fuel consumption of a bus and a personal four wheeler / two wheeler. Calculate the percapita consumption in public transportation system and in private transportation system. Compare theresults.
Expected outcome:
1. Children will understand how muscle power has been gradually taken over by the modern conventionalenergy forms
2. Children will understand the impact of improved transport on the local economy
3. Children will understand the concept of 'equity' and value of 'togetherness'
Extension/variation:
1. Similar projects may be carried out for common facilities in a village/ locality like a common agriculturefacilitation centre where all implements are commonly bought and shared or a common biogas plant or apublic toilet etc.
6. Suggestive project ideas
i. Assessing livestock value from energy perspectiveii. Innovative energy efficient stoves to utilise locally available bio-residuesiii. Carbon sequestration through community initiativesiv. Comparison of animal draught power with machines
v. An investigation about the impact of energy availability on the change on lifestyle of the peoplevi. Traditional practice of backyard farming of the non-timber firewood speciesvii.Experimental study on conscious reduction in energy use in the household
Activity Guide 2012-13
Page 65
Sub-Theme-IV
Energy and Environment

Activity Guide 2012-13
Page 66
Prof. E. KunhikrishnanDr. R.K. KoleDr. R.N. RayDr. D.K. PandeyDr. Manoj Kr. Patowary
Working Group of the sub-theme
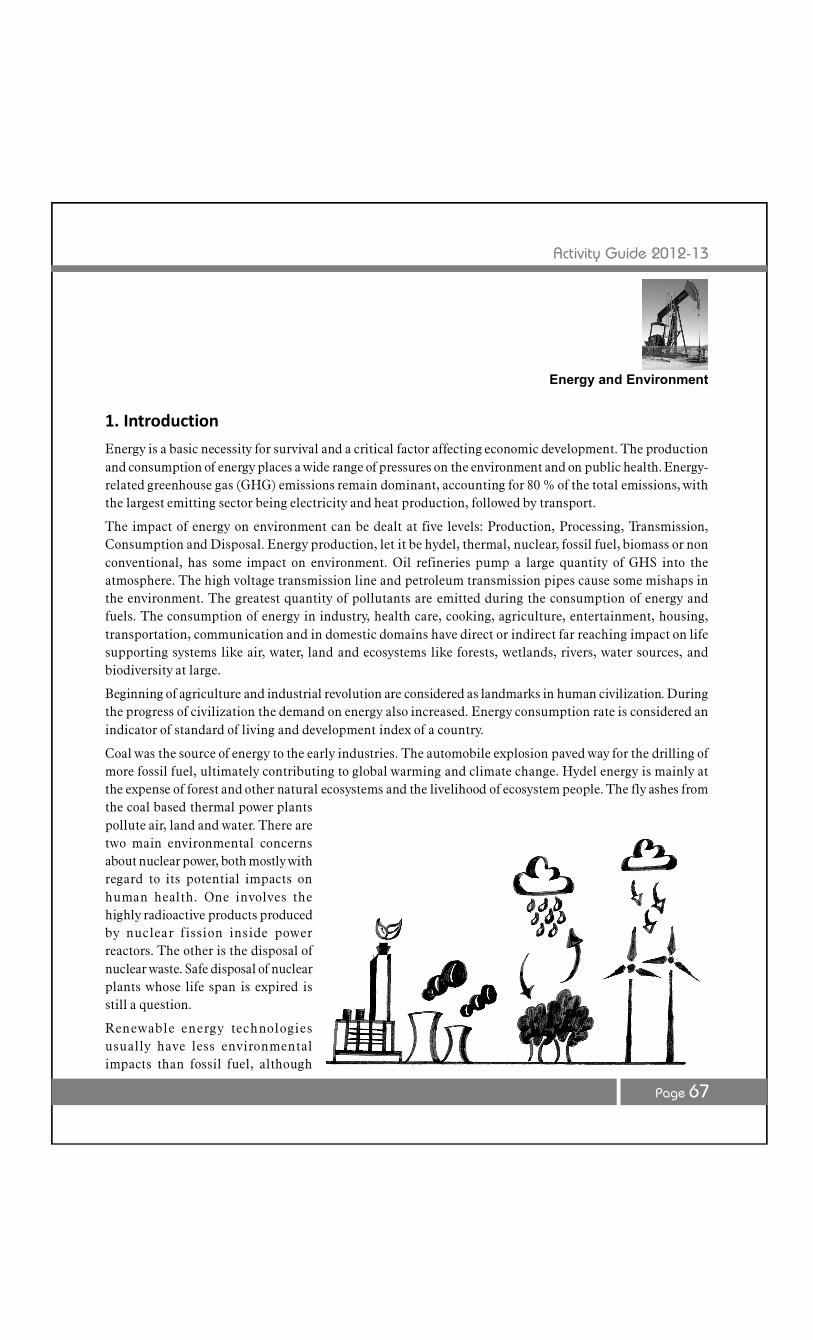
Activity Guide 2012-13
Page 67
1. Introduction
Energy is a basic necessity for survival and a critical factor affecting economic development. The productionand consumption of energy places a wide range of pressures on the environment and on public health. Energy-related greenhouse gas (GHG) emissions remain dominant, accounting for 80 % of the total emissions, withthe largest emitting sector being electricity and heat production, followed by transport.
The impact of energy on environment can be dealt at five levels: Production, Processing, Transmission,Consumption and Disposal. Energy production, let it be hydel, thermal, nuclear, fossil fuel, biomass or nonconventional, has some impact on environment. Oil refineries pump a large quantity of GHS into theatmosphere. The high voltage transmission line and petroleum transmission pipes cause some mishaps inthe environment. The greatest quantity of pollutants are emitted during the consumption of energy andfuels. The consumption of energy in industry, health care, cooking, agriculture, entertainment, housing,transportation, communication and in domestic domains have direct or indirect far reaching impact on lifesupporting systems like air, water, land and ecosystems like forests, wetlands, rivers, water sources, andbiodiversity at large.
Beginning of agriculture and industrial revolution are considered as landmarks in human civilization. Duringthe progress of civilization the demand on energy also increased. Energy consumption rate is considered anindicator of standard of living and development index of a country.
Coal was the source of energy to the early industries. The automobile explosion paved way for the drilling ofmore fossil fuel, ultimately contributing to global warming and climate change. Hydel energy is mainly atthe expense of forest and other natural ecosystems and the livelihood of ecosystem people. The fly ashes fromthe coal based thermal power plantspollute air, land and water. There aretwo main environmental concernsabout nuclear power, both mostly withregard to its potential impacts onhuman health. One involves thehighly radioactive products producedby nuclear fission inside powerreactors. The other is the disposal ofnuclear waste. Safe disposal of nuclearplants whose life span is expired isstill a question.
Renewable energy technologiesusually have less environmentalimpacts than fossil fuel, although
Energy and Environment
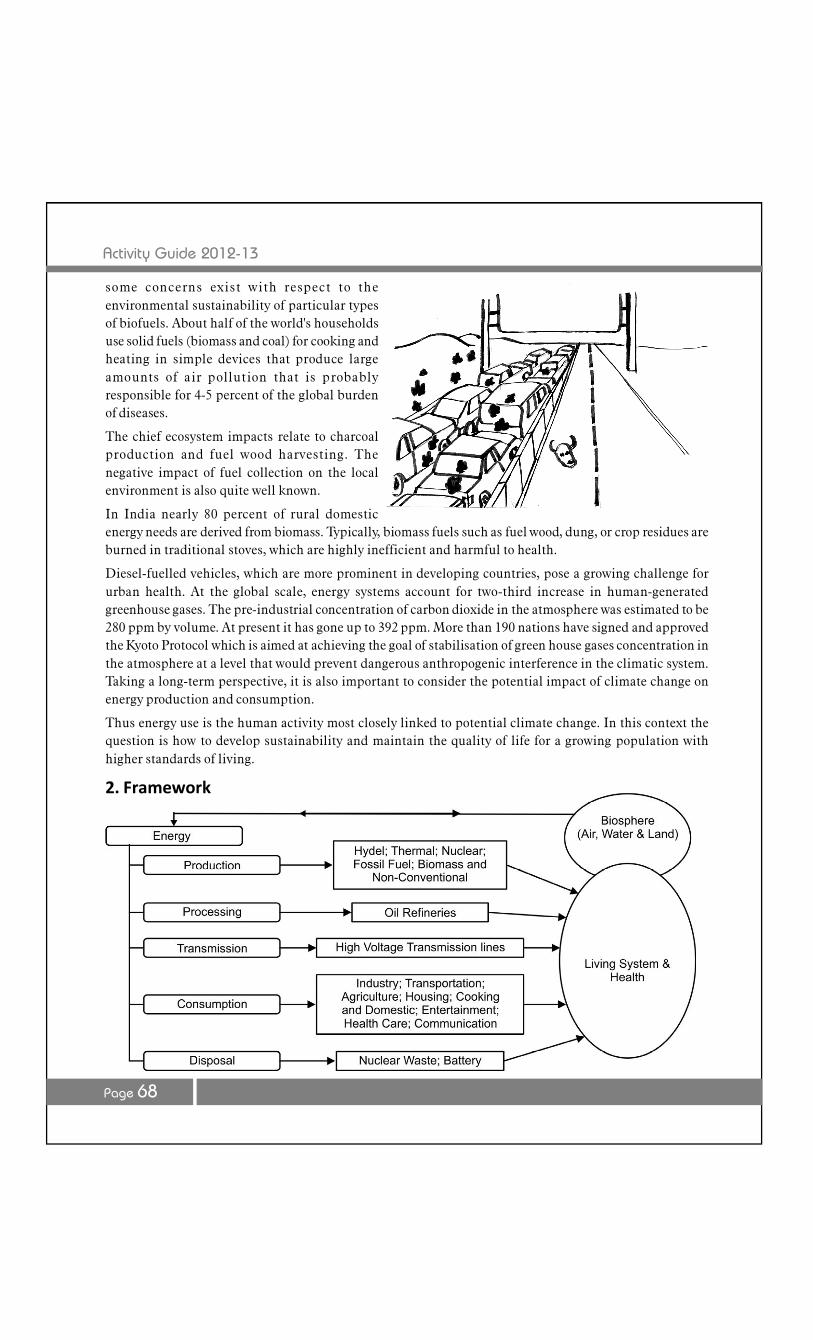
Activity Guide 2012-13
Page 68
some concerns exist with respect to theenvironmental sustainability of particular typesof biofuels. About half of the world's householdsuse solid fuels (biomass and coal) for cooking andheating in simple devices that produce largeamounts of air pollution that is probablyresponsible for 4-5 percent of the global burdenof diseases.
The chief ecosystem impacts relate to charcoalproduction and fuel wood harvesting. Thenegative impact of fuel collection on the localenvironment is also quite well known.
In India nearly 80 percent of rural domesticenergy needs are derived from biomass. Typically, biomass fuels such as fuel wood, dung, or crop residues areburned in traditional stoves, which are highly inefficient and harmful to health.
Diesel-fuelled vehicles, which are more prominent in developing countries, pose a growing challenge forurban health. At the global scale, energy systems account for two-third increase in human-generatedgreenhouse gases. The pre-industrial concentration of carbon dioxide in the atmosphere was estimated to be280 ppm by volume. At present it has gone up to 392 ppm. More than 190 nations have signed and approvedthe Kyoto Protocol which is aimed at achieving the goal of stabilisation of green house gases concentration inthe atmosphere at a level that would prevent dangerous anthropogenic interference in the climatic system.Taking a long-term perspective, it is also important to consider the potential impact of climate change onenergy production and consumption.
Thus energy use is the human activity most closely linked to potential climate change. In this context thequestion is how to develop sustainability and maintain the quality of life for a growing population withhigher standards of living.
2. Framework
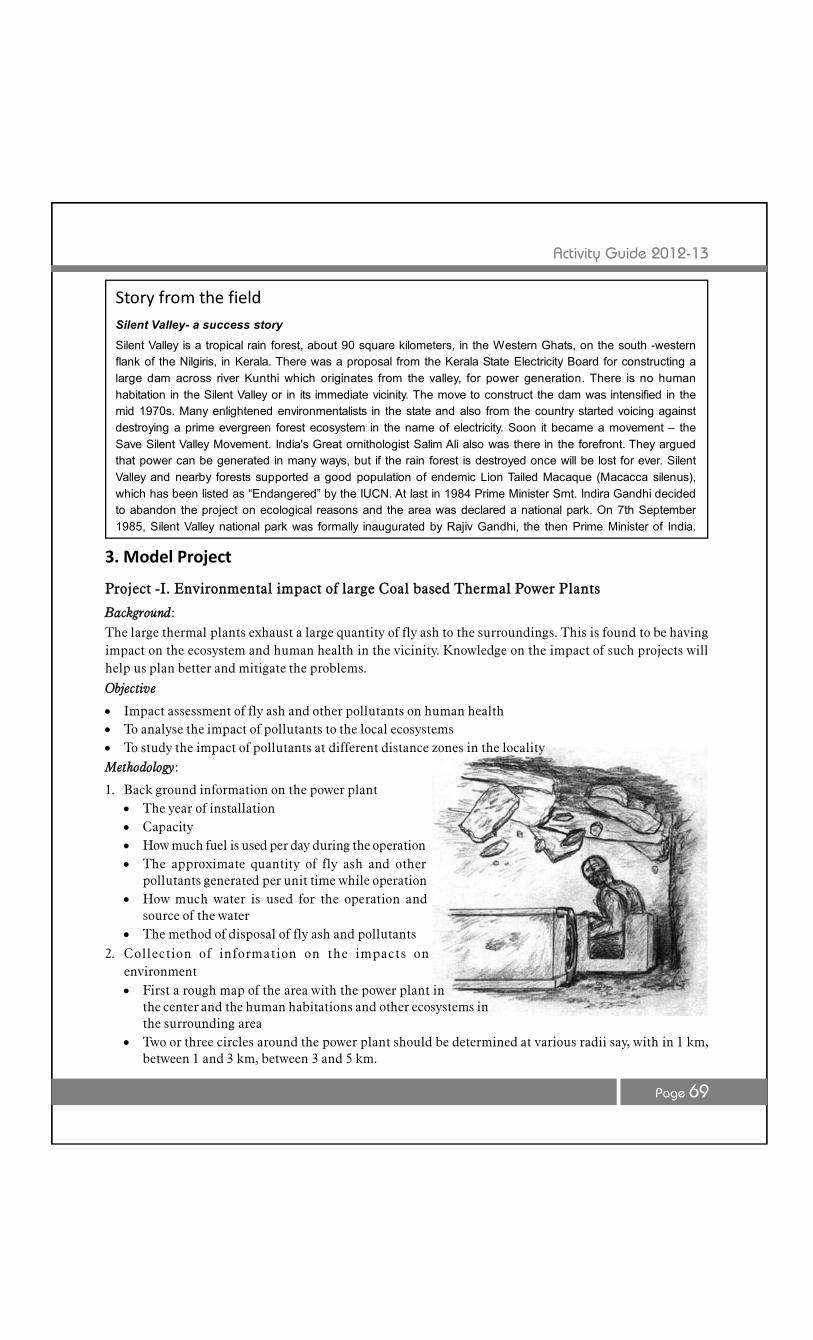
Activity Guide 2012-13
Page 69
3. Model Project
Project -I. Environmental impact of large Coal based Thermal Power Plants
Background:The large thermal plants exhaust a large quantity of fly ash to the surroundings. This is found to be havingimpact on the ecosystem and human health in the vicinity. Knowledge on the impact of such projects willhelp us plan better and mitigate the problems.
Objective
Impact assessment of fly ash and other pollutants on human health To analyse the impact of pollutants to the local ecosystems To study the impact of pollutants at different distance zones in the localityMethodology:
1. Back ground information on the power plant The year of installation Capacity How much fuel is used per day during the operation The approximate quantity of fly ash and other
pollutants generated per unit time while operation How much water is used for the operation and
source of the water The method of disposal of fly ash and pollutants
2. Collection of information on the impacts onenvironment First a rough map of the area with the power plant in
the center and the human habitations and other ecosystems inthe surrounding area
Two or three circles around the power plant should be determined at various radii say, with in 1 km,between 1 and 3 km, between 3 and 5 km.
Story from the fieldSilent Valley- a success story
Silent Valley is a tropical rain forest, about 90 square kilometers, in the Western Ghats, on the south -westernflank of the Nilgiris, in Kerala. There was a proposal from the Kerala State Electricity Board for constructing alarge dam across river Kunthi which originates from the valley, for power generation. There is no humanhabitation in the Silent Valley or in its immediate vicinity. The move to construct the dam was intensified in themid 1970s. Many enlightened environmentalists in the state and also from the country started voicing againstdestroying a prime evergreen forest ecosystem in the name of electricity. Soon it became a movement – theSave Silent Valley Movement. India's Great ornithologist Salim Ali also was there in the forefront. They arguedthat power can be generated in many ways, but if the rain forest is destroyed once will be lost for ever. SilentValley and nearby forests supported a good population of endemic Lion Tailed Macaque (Macacca silenus),which has been listed as “Endangered” by the IUCN. At last in 1984 Prime Minister Smt. Indira Gandhi decidedto abandon the project on ecological reasons and the area was declared a national park. On 7th September1985, Silent Valley national park was formally inaugurated by Rajiv Gandhi, the then Prime Minister of India.
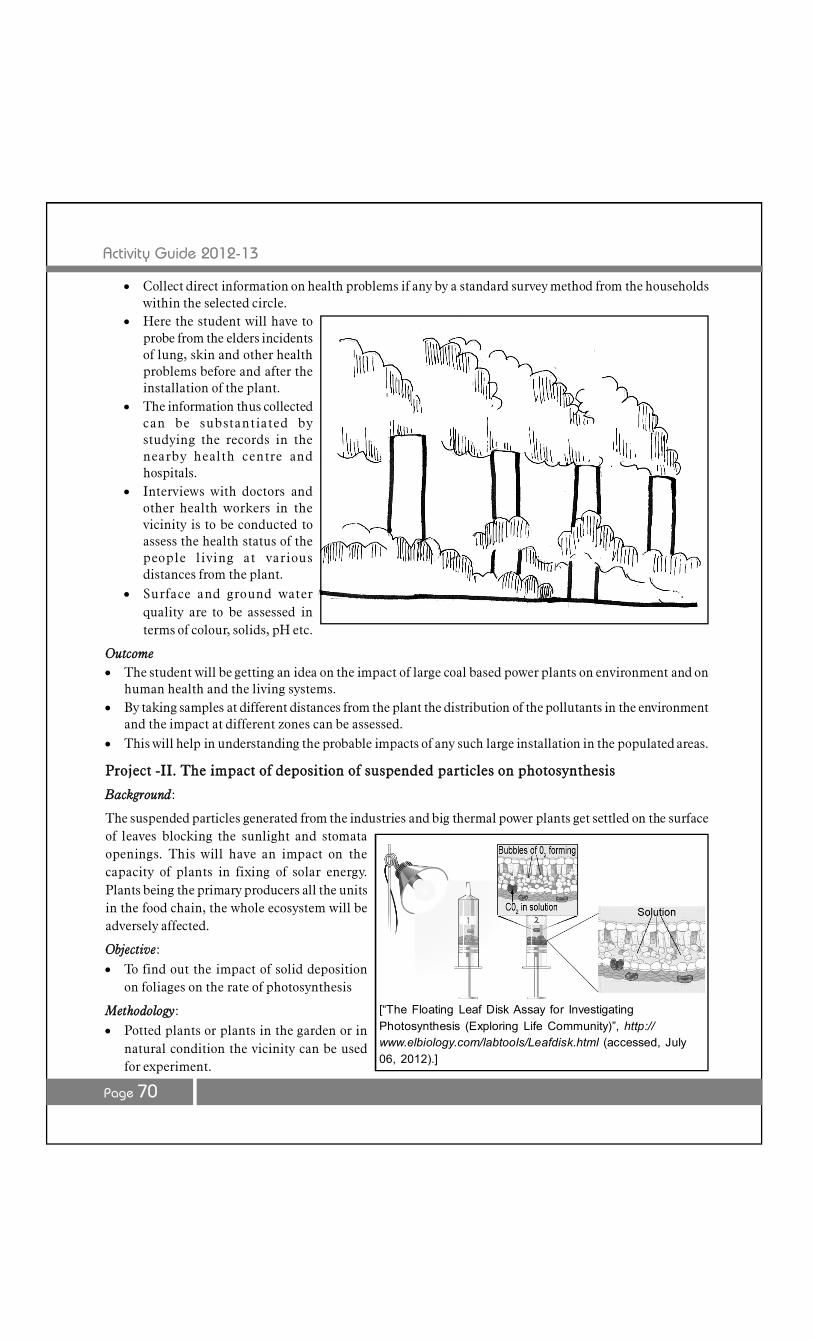
Activity Guide 2012-13
Page 70
Collect direct information on health problems if any by a standard survey method from the householdswithin the selected circle.
Here the student will have toprobe from the elders incidentsof lung, skin and other healthproblems before and after theinstallation of the plant.
The information thus collectedcan be substantiated bystudying the records in thenearby health centre andhospitals.
Interviews with doctors andother health workers in thevicinity is to be conducted toassess the health status of thepeople living at variousdistances from the plant.
Surface and ground waterquality are to be assessed interms of colour, solids, pH etc.
Outcome The student will be getting an idea on the impact of large coal based power plants on environment and on
human health and the living systems. By taking samples at different distances from the plant the distribution of the pollutants in the environment
and the impact at different zones can be assessed. This will help in understanding the probable impacts of any such large installation in the populated areas.
Project -II. The impact of deposition of suspended particles on photosynthesis
Background:
The suspended particles generated from the industries and big thermal power plants get settled on the surfaceof leaves blocking the sunlight and stomataopenings. This will have an impact on thecapacity of plants in fixing of solar energy.Plants being the primary producers all the unitsin the food chain, the whole ecosystem will beadversely affected.
Objective: To find out the impact of solid deposition
on foliages on the rate of photosynthesis
Methodology: Potted plants or plants in the garden or in
natural condition the vicinity can be usedfor experiment.
[“The Floating Leaf Disk Assay for InvestigatingPhotosynthesis (Exploring Life Community)”, http://www.elbiology.com/labtools/Leafdisk.html (accessed, July06, 2012).]
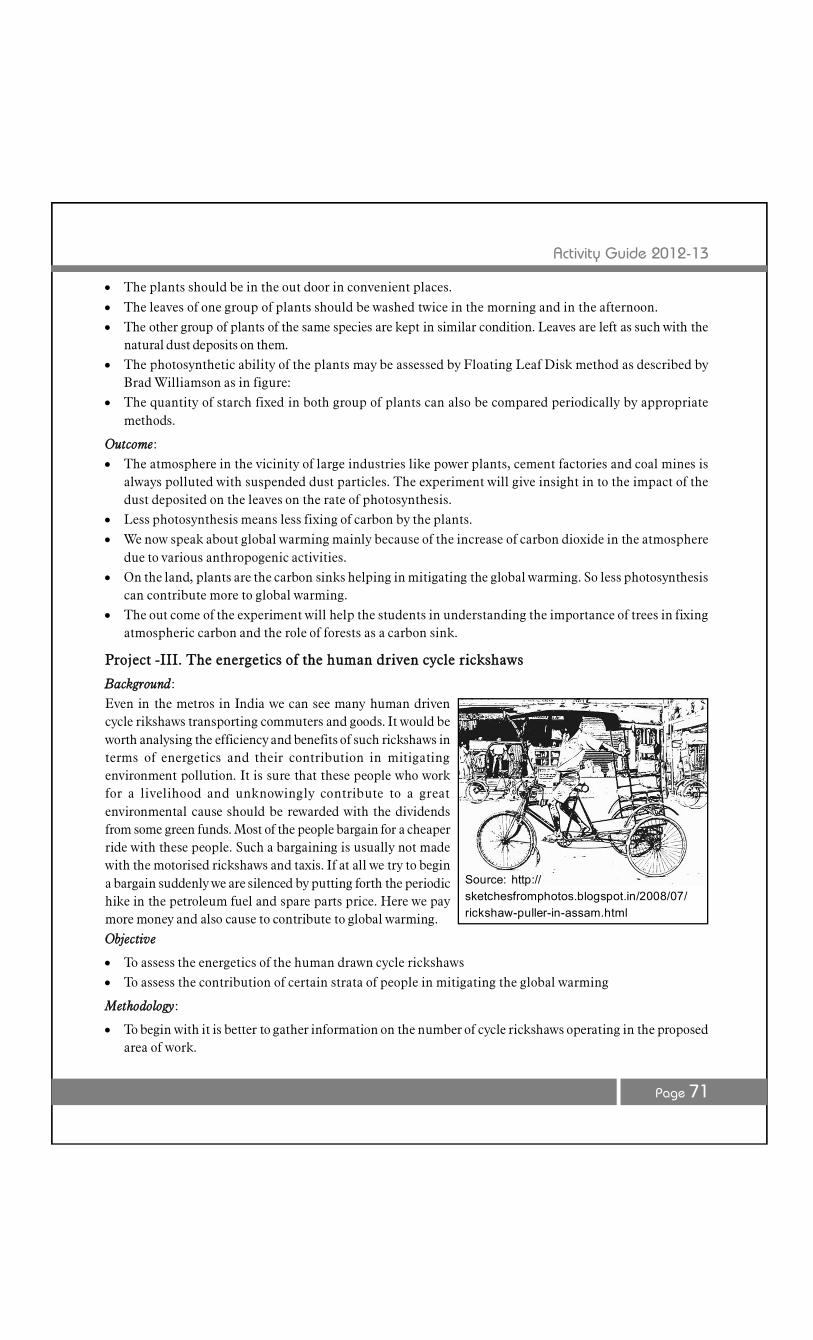
Activity Guide 2012-13
Page 71
The plants should be in the out door in convenient places.
The leaves of one group of plants should be washed twice in the morning and in the afternoon. The other group of plants of the same species are kept in similar condition. Leaves are left as such with the
natural dust deposits on them. The photosynthetic ability of the plants may be assessed by Floating Leaf Disk method as described by
Brad Williamson as in figure: The quantity of starch fixed in both group of plants can also be compared periodically by appropriate
methods.
Outcome: The atmosphere in the vicinity of large industries like power plants, cement factories and coal mines is
always polluted with suspended dust particles. The experiment will give insight in to the impact of thedust deposited on the leaves on the rate of photosynthesis.
Less photosynthesis means less fixing of carbon by the plants. We now speak about global warming mainly because of the increase of carbon dioxide in the atmosphere
due to various anthropogenic activities. On the land, plants are the carbon sinks helping in mitigating the global warming. So less photosynthesis
can contribute more to global warming. The out come of the experiment will help the students in understanding the importance of trees in fixing
atmospheric carbon and the role of forests as a carbon sink.
Project -III. The energetics of the human driven cycle rickshaws
Background:Even in the metros in India we can see many human drivencycle rikshaws transporting commuters and goods. It would beworth analysing the efficiency and benefits of such rickshaws interms of energetics and their contribution in mitigatingenvironment pollution. It is sure that these people who workfor a livelihood and unknowingly contribute to a greatenvironmental cause should be rewarded with the dividendsfrom some green funds. Most of the people bargain for a cheaperride with these people. Such a bargaining is usually not madewith the motorised rickshaws and taxis. If at all we try to begina bargain suddenly we are silenced by putting forth the periodichike in the petroleum fuel and spare parts price. Here we paymore money and also cause to contribute to global warming.Objective
To assess the energetics of the human drawn cycle rickshaws To assess the contribution of certain strata of people in mitigating the global warming
Methodology:
To begin with it is better to gather information on the number of cycle rickshaws operating in the proposedarea of work.
Source: http://sketchesfromphotos.blogspot.in/2008/07/rickshaw-puller-in-assam.html
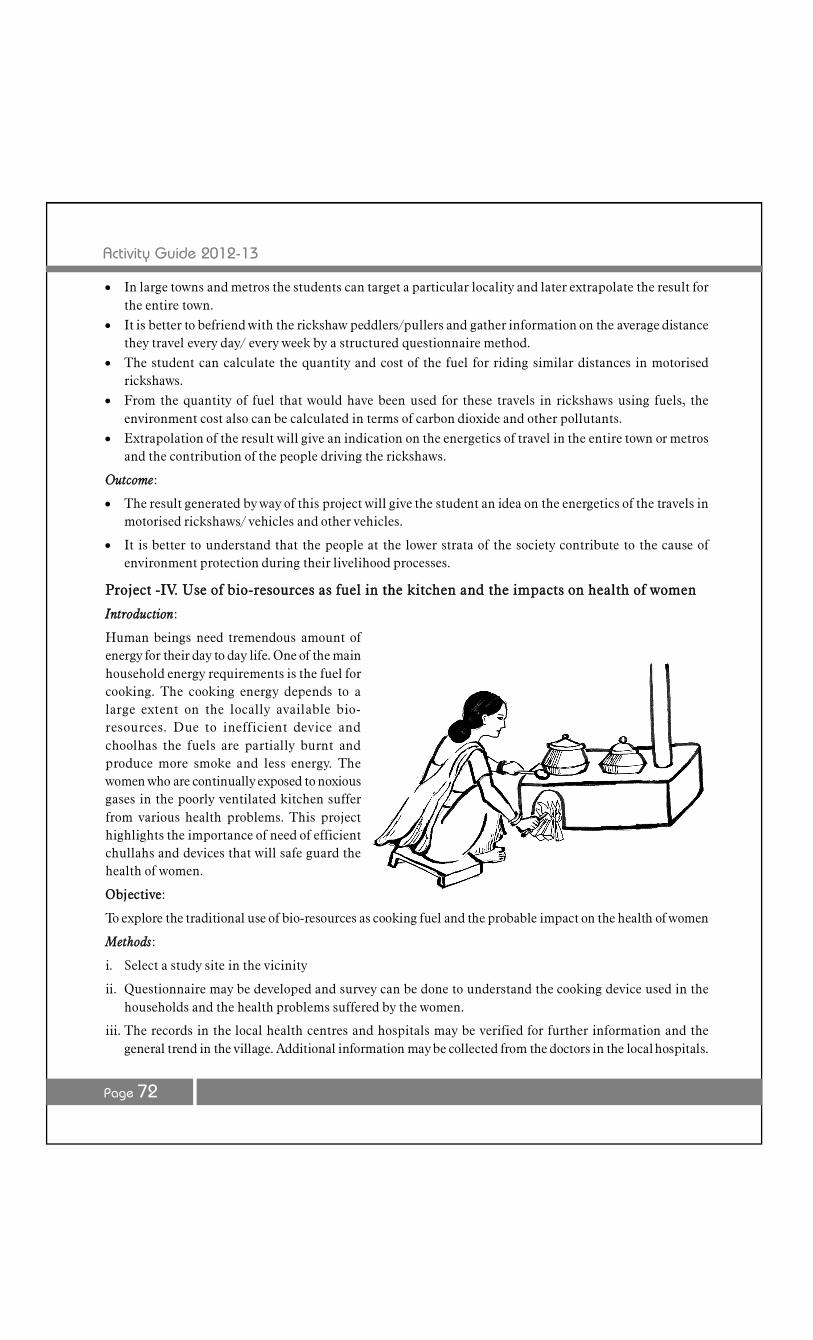
Activity Guide 2012-13
Page 72
In large towns and metros the students can target a particular locality and later extrapolate the result forthe entire town.
It is better to befriend with the rickshaw peddlers/pullers and gather information on the average distancethey travel every day/ every week by a structured questionnaire method.
The student can calculate the quantity and cost of the fuel for riding similar distances in motorisedrickshaws.
From the quantity of fuel that would have been used for these travels in rickshaws using fuels, theenvironment cost also can be calculated in terms of carbon dioxide and other pollutants.
Extrapolation of the result will give an indication on the energetics of travel in the entire town or metrosand the contribution of the people driving the rickshaws.
Outcome:
The result generated by way of this project will give the student an idea on the energetics of the travels inmotorised rickshaws/ vehicles and other vehicles.
It is better to understand that the people at the lower strata of the society contribute to the cause ofenvironment protection during their livelihood processes.
Project -IV. Use of bio-resources as fuel in the kitchen and the impacts on health of women
Introduction:
Human beings need tremendous amount ofenergy for their day to day life. One of the mainhousehold energy requirements is the fuel forcooking. The cooking energy depends to alarge extent on the locally available bio-resources. Due to inefficient device andchoolhas the fuels are partially burnt andproduce more smoke and less energy. Thewomen who are continually exposed to noxiousgases in the poorly ventilated kitchen sufferfrom various health problems. This projecthighlights the importance of need of efficientchullahs and devices that will safe guard thehealth of women.
Objective:
To explore the traditional use of bio-resources as cooking fuel and the probable impact on the health of women
Methods:
i. Select a study site in the vicinity
ii. Questionnaire may be developed and survey can be done to understand the cooking device used in thehouseholds and the health problems suffered by the women.
iii. The records in the local health centres and hospitals may be verified for further information and thegeneral trend in the village. Additional information may be collected from the doctors in the local hospitals.
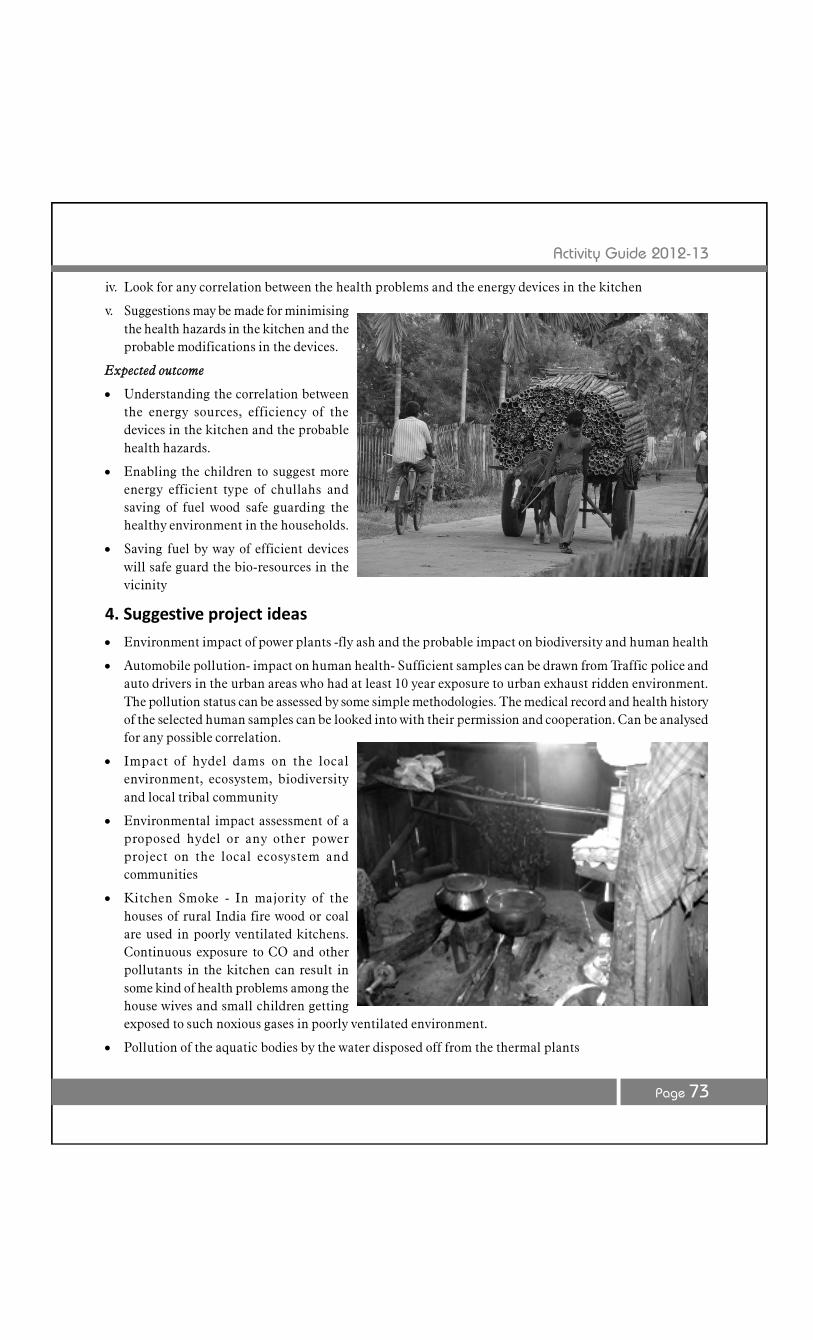
Activity Guide 2012-13
Page 73
iv. Look for any correlation between the health problems and the energy devices in the kitchen
v. Suggestions may be made for minimisingthe health hazards in the kitchen and theprobable modifications in the devices.
Expected outcome
Understanding the correlation betweenthe energy sources, efficiency of thedevices in the kitchen and the probablehealth hazards.
Enabling the children to suggest moreenergy efficient type of chullahs andsaving of fuel wood safe guarding thehealthy environment in the households.
Saving fuel by way of efficient deviceswill safe guard the bio-resources in thevicinity
4. Suggestive project ideas
Environment impact of power plants -fly ash and the probable impact on biodiversity and human health
Automobile pollution- impact on human health- Sufficient samples can be drawn from Traffic police andauto drivers in the urban areas who had at least 10 year exposure to urban exhaust ridden environment.The pollution status can be assessed by some simple methodologies. The medical record and health historyof the selected human samples can be looked into with their permission and cooperation. Can be analysedfor any possible correlation.
Impact of hydel dams on the localenvironment, ecosystem, biodiversityand local tribal community
Environmental impact assessment of aproposed hydel or any other powerproject on the local ecosystem andcommunities
Kitchen Smoke - In majority of thehouses of rural India fire wood or coalare used in poorly ventilated kitchens.Continuous exposure to CO and otherpollutants in the kitchen can result insome kind of health problems among thehouse wives and small children gettingexposed to such noxious gases in poorly ventilated environment.
Pollution of the aquatic bodies by the water disposed off from the thermal plants
Activity Guide 2012-13
Page 74
Animals death on the power lines: many animals are electrocuted in the rural and urban areas. An analysiscan be made on such incidents and suggestions can be given to mitigate such mishaps
Insects congregating around lights and probable impact on its population
Congregation of insects around lights and congregation of predators like geckos and probable impacts
Impact of wind generators on birds and otheranimals: Though a devise for non conventionalenergy, there are reports how with the bladesof wind turbines are causing death of birds,including the migrants.
Impact of pollution from the coal mining areason the drinking and irrigation water
Impact of sulphur and dust accumulation onagriculture in the neighbourhood of miningareas.
Energy consumption in the brick industries- firewood utilisation and probable impacts
Fire wood collection and probable impact on forest and biodiversity
Photosynthesis - in dust polluted environment and dust free environment.
Agriculture- energy utilisation in different agriculture practices and its impacts
Energy utilisation in differentirrigation practices and efficiencyof the system
Energy in land preparation,harvesting, transportation andprocessing and cost benefit analysisandprobable alternate ways.
Energy efficiency of food in termsof energy consumption and energyyield
Battery disposal and impact onenvironment- impact on animalslike earth worms and other soilmicro-fauna.
Solid waste - probable impact onenvironment while energyproduction. A lot of dioxin, sulphur dioxide, carbon monoxide, carbon dioxide and other toxic gases arereleased into the atmosphere during the process. The students can suggest alternate ways for the disposalof the wastes.

Activity Guide 2012-13
Page 75
Sub-Theme-V
Energy Conservationand Management

Activity Guide 2012-13
Page 76
Dr. H.C. PradhanDr. Bhim Prasad SarmahMr. Ranjan Kumar SwainDr. Partha Pratim DuttaDr. Dipak NathDr. Atanu K. Dutta
Working Group of the sub-theme
Activity Guide 2012-13
Page 77
1. Introduction
Energy is the driver of growth. International studies on human development indicate that India needs muchlarger per capita energy consumption to provide better living conditions to its citizens. But such growth hasto be balanced and sustainable. Two important concepts here are energy management and conservation.
Planning commission of India has estimated that India has conservation potential at 23% of the totalcommercial energy generated in the country. India's energy requirement comes from five sectors; agriculture,industry, transport, services and domestic, each having considerable saving potential. For example, energycosts amount to 20 percent of the total production cost of steel in India which is much higher than theinternational standards. Similarly the energy intensity per unit of food grain production in India is 3 - 4times higher than that in Japan. Sustainable growth also implies that our energy management and energyconservation measures are eco-friendly and accompanied by minimum pollution, in particular minimumcarbon emission. The key concepts of this subtheme are elaborated below.
2. Energy Management
The fundamental goal of energy management is to produce goods and provide services with the least costand least environmental effect.
Definition
Energy management is a process that not only manages the energy production from different energy harvestingresources (solar, nuclear, fossil fuel) but also concerns optimal utilization at the consumer devices.
Another comprehensive definition is “The judicious and effective use of energy to maximise profits (minimisecosts) and enhance competitive positions”.
Objective
The objective of Energy Management is to achieve and maintain optimum energy procurement and utilisation,throughout the organization and:
To minimise energy costs / waste without affecting production, comfort and quality. To minimise theenvironmental effects.
3. Energy Conservation
Energy, irrespective of its form is a scarce commodity and a most valuable resource. However, if we look atthe predicted future human population figures and consider the probability that the individual life expectationwill increase, we see that energy could, in the future, be in short supply. Unless that supply is increased, itwill be a source of friction in human affairs.
Energy Conservation and Management
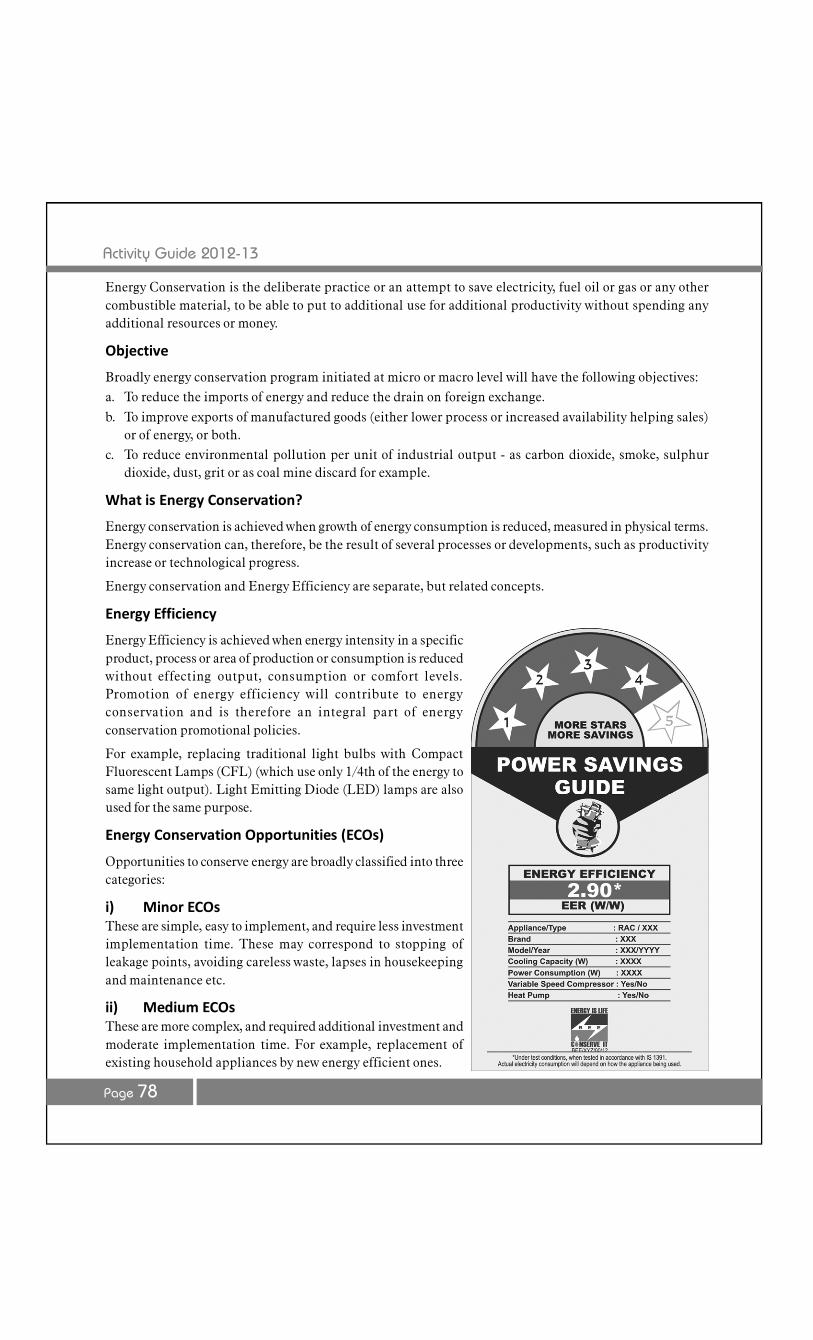
Activity Guide 2012-13
Page 78
Energy Conservation is the deliberate practice or an attempt to save electricity, fuel oil or gas or any othercombustible material, to be able to put to additional use for additional productivity without spending anyadditional resources or money.
Objective
Broadly energy conservation program initiated at micro or macro level will have the following objectives:a. To reduce the imports of energy and reduce the drain on foreign exchange.
b. To improve exports of manufactured goods (either lower process or increased availability helping sales)or of energy, or both.
c. To reduce environmental pollution per unit of industrial output - as carbon dioxide, smoke, sulphurdioxide, dust, grit or as coal mine discard for example.
What is Energy Conservation?
Energy conservation is achieved when growth of energy consumption is reduced, measured in physical terms.Energy conservation can, therefore, be the result of several processes or developments, such as productivityincrease or technological progress.
Energy conservation and Energy Efficiency are separate, but related concepts.
Energy Efficiency
Energy Efficiency is achieved when energy intensity in a specificproduct, process or area of production or consumption is reducedwithout effecting output, consumption or comfort levels.Promotion of energy efficiency will contribute to energyconservation and is therefore an integral part of energyconservation promotional policies.
For example, replacing traditional light bulbs with CompactFluorescent Lamps (CFL) (which use only 1/4th of the energy tosame light output). Light Emitting Diode (LED) lamps are alsoused for the same purpose.
Energy Conservation Opportunities (ECOs)
Opportunities to conserve energy are broadly classified into threecategories:
i) Minor ECOsThese are simple, easy to implement, and require less investmentimplementation time. These may correspond to stopping ofleakage points, avoiding careless waste, lapses in housekeepingand maintenance etc.
ii) Medium ECOsThese are more complex, and required additional investment andmoderate implementation time. For example, replacement ofexisting household appliances by new energy efficient ones.
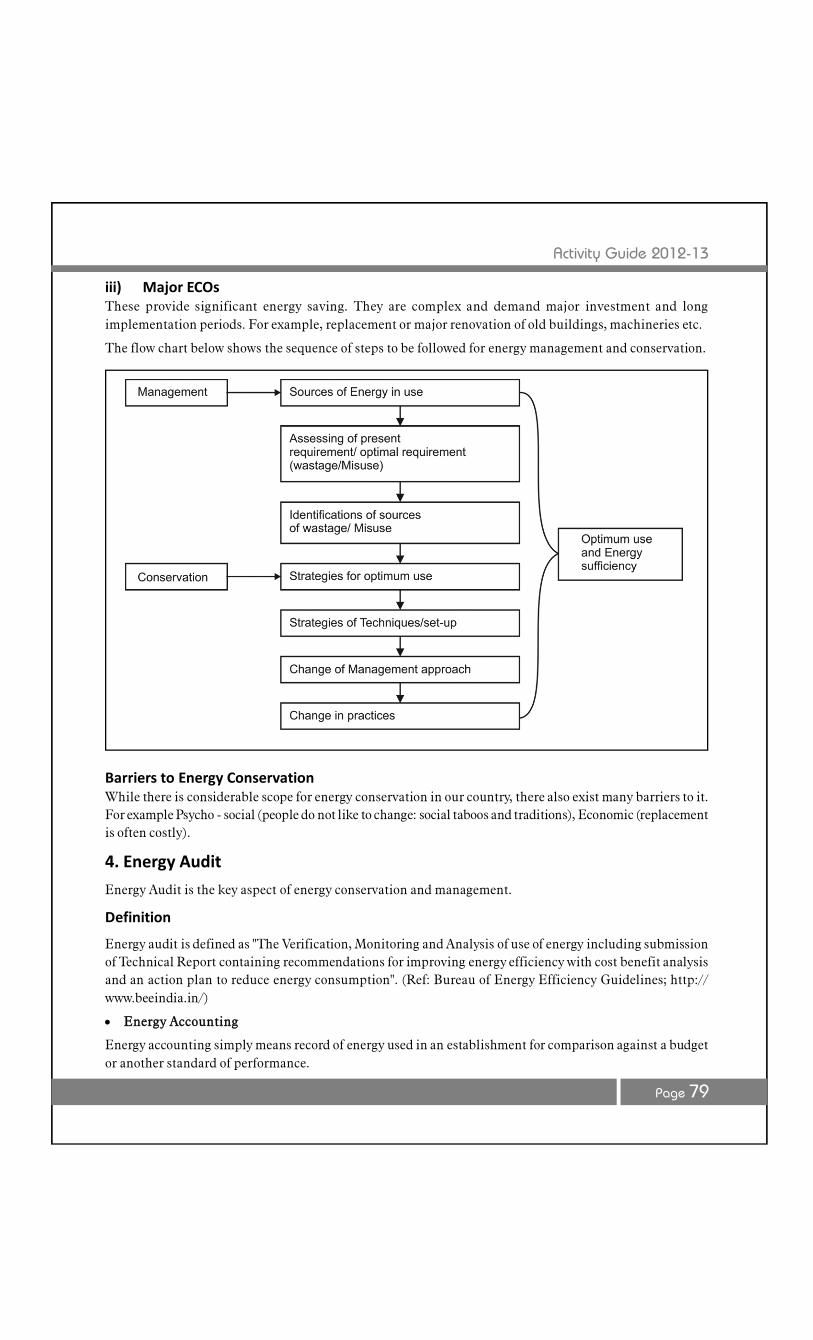
Activity Guide 2012-13
Page 79
iii) Major ECOsThese provide significant energy saving. They are complex and demand major investment and longimplementation periods. For example, replacement or major renovation of old buildings, machineries etc.
The flow chart below shows the sequence of steps to be followed for energy management and conservation.
Barriers to Energy ConservationWhile there is considerable scope for energy conservation in our country, there also exist many barriers to it.For example Psycho - social (people do not like to change: social taboos and traditions), Economic (replacementis often costly).
4. Energy Audit
Energy Audit is the key aspect of energy conservation and management.
Definition
Energy audit is defined as "The Verification, Monitoring and Analysis of use of energy including submissionof Technical Report containing recommendations for improving energy efficiency with cost benefit analysisand an action plan to reduce energy consumption". (Ref: Bureau of Energy Efficiency Guidelines; http://www.beeindia.in/)
Energy Accounting
Energy accounting simply means record of energy used in an establishment for comparison against a budgetor another standard of performance.
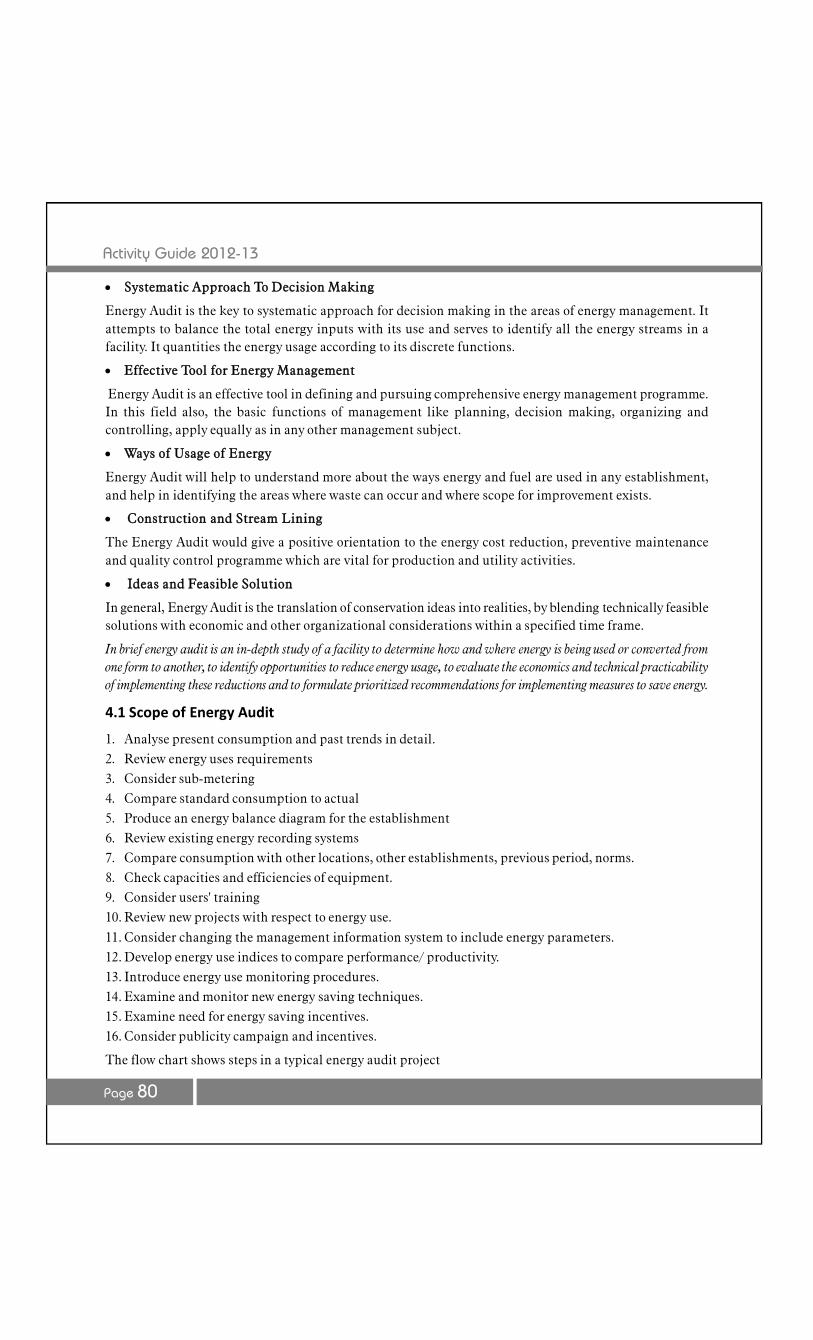
Activity Guide 2012-13
Page 80
Systematic Approach To Decision Making
Energy Audit is the key to systematic approach for decision making in the areas of energy management. Itattempts to balance the total energy inputs with its use and serves to identify all the energy streams in afacility. It quantities the energy usage according to its discrete functions.
Effective Tool for Energy Management
Energy Audit is an effective tool in defining and pursuing comprehensive energy management programme.In this field also, the basic functions of management like planning, decision making, organizing andcontrolling, apply equally as in any other management subject.
Ways of Usage of Energy
Energy Audit will help to understand more about the ways energy and fuel are used in any establishment,and help in identifying the areas where waste can occur and where scope for improvement exists.
Construction and Stream Lining
The Energy Audit would give a positive orientation to the energy cost reduction, preventive maintenanceand quality control programme which are vital for production and utility activities.
Ideas and Feasible Solution
In general, Energy Audit is the translation of conservation ideas into realities, by blending technically feasiblesolutions with economic and other organizational considerations within a specified time frame.
In brief energy audit is an in-depth study of a facility to determine how and where energy is being used or converted fromone form to another, to identify opportunities to reduce energy usage, to evaluate the economics and technical practicabilityof implementing these reductions and to formulate prioritized recommendations for implementing measures to save energy.
4.1 Scope of Energy Audit
1. Analyse present consumption and past trends in detail.2. Review energy uses requirements3. Consider sub-metering4. Compare standard consumption to actual5. Produce an energy balance diagram for the establishment6. Review existing energy recording systems7. Compare consumption with other locations, other establishments, previous period, norms.8. Check capacities and efficiencies of equipment.9. Consider users' training10. Review new projects with respect to energy use.
11. Consider changing the management information system to include energy parameters.12. Develop energy use indices to compare performance/ productivity.13. Introduce energy use monitoring procedures.14. Examine and monitor new energy saving techniques.15. Examine need for energy saving incentives.16. Consider publicity campaign and incentives.
The flow chart shows steps in a typical energy audit project
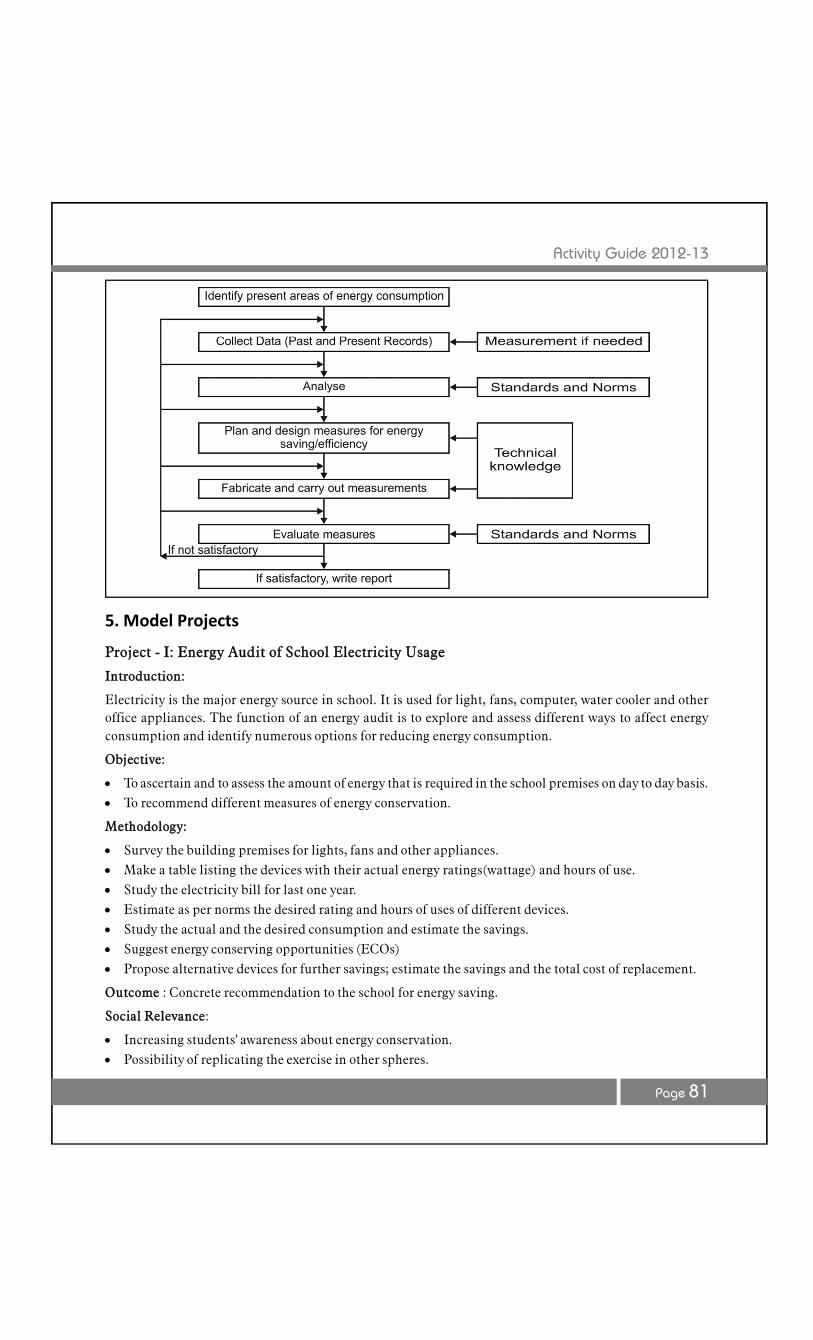
Activity Guide 2012-13
Page 81
5. Model Projects
Project - I: Energy Audit of School Electricity Usage
Introduction:
Electricity is the major energy source in school. It is used for light, fans, computer, water cooler and otheroffice appliances. The function of an energy audit is to explore and assess different ways to affect energyconsumption and identify numerous options for reducing energy consumption.
Objective:
To ascertain and to assess the amount of energy that is required in the school premises on day to day basis. To recommend different measures of energy conservation.
Methodology:
Survey the building premises for lights, fans and other appliances. Make a table listing the devices with their actual energy ratings(wattage) and hours of use. Study the electricity bill for last one year. Estimate as per norms the desired rating and hours of uses of different devices. Study the actual and the desired consumption and estimate the savings. Suggest energy conserving opportunities (ECOs) Propose alternative devices for further savings; estimate the savings and the total cost of replacement.
Outcome : Concrete recommendation to the school for energy saving.
Social Relevance:
Increasing students' awareness about energy conservation. Possibility of replicating the exercise in other spheres.

Activity Guide 2012-13
Page 82
Story from the fieldVillage level biogas plant as source of cooking fuel
A village in Kolhapur district of South Maharashtra has very effectively implemented this eco-friendly project.It uses gobor from the villege for running a Gobor Gas Plant which supplies cooking fuel to the village. Earlierthe villagers used wood as a fuel for cooking. They are now saving 113 Tonnes of wood per year, which meanssaving forest trees over a large area. The villagers are very proud of their achievement which they have beenable to do with the help of a NGO.
Irrigation without expenses for energy
The same village under the guidance of the same NGO has taken up another energy saving project. Thevillage has set up a water reservoir on a hill 4.5 Km. Away. The reservoir supplies water almost round the year.The villagers have laid pipe lines which reach their farms and irrigate them. The water flows from the reservoirto the farms by gravity and no pump is needed for the irrigation. It is estimated that the villagers are savingabout 70,000 units (KWHrs.) of electricity annually by this method. In money terms, this is saving of about Rs.4,00,000/- per year. It is to be noted that, the farms are set up on 48 acres of waste land. So, land which wasuseless, has been made productive at practically zero recurring cost, an achievement certainly remarkable.
Source: www.Venumadhuri.org
Project II: Understanding Green Building
Introduction
Green building (also known as green construction or sustainable building) refers to a structure that usesnatural material for construction and utilizes natural resources such as, light, wind, water for comfortableliving without depending much on conventional energy sources. Such building contributes a lot towardsconservation of conventional energy sources.
This study helps to bring out the salient features of the concept of green building with a hands on experiment.
Objective:
To understand the concept of green building with reference to daylight, wind, temperature.
Methodology:
Choose a colony of identical quarters of same type (say type A) Identify houses of different orientations say north-south, east-west etc. Choose the building with of north-south orientation as the green building. Record temperature, humidity in rooms at different times on the same day. Repeat for rainy day, sunny day, cloudy day Do the same exercise for different seasons. Arrive at a conclusion for best orientation
Explain the same with respect to Sun Diagram or principles of solar passive architecturer which will beprovided to the students.
Expected outcome:
For a particular locality the best orientation of house will be understood. This may affect town-planning orresidential colony planning using the green concept.
Activity Guide 2012-13
Page 83
Project: III: Role of Renewable Energy in Disaster Management
Introduction
During disaster situation, there may be large scale disruption in the normal functioning of the vital serviceslike telecommunication, electricity etc. due to wide range of damage to important infrastructure and facilities.Renewable energy (like solar energy) based devices may play vital role in immediate restoration of thesevital services in disaster affected areas.
Objective:
To study the scope of using renewable energy in disaster management.
Methodology:
Select a natural hazard prone area.
Assess the probable threats and damage potential in the locality.
Collect data of households, important resources and vital services in the locality.
Estimate the total energy required for maintaining day to day activities and operating vital services.
Explore the conventional energy sources in place to meet the energy requirements.
Explore the alternative arrangements in place, based on renewable energy, for emergency management.
Check the utility and efficiency of alternative renewable energy based systems in place.
Determine further needs of alternative energy sources / devices.
Suggest probable solutions to meet the requirements.
Expected outcome:
Such a study will help the vulnerable community to understand their disaster risk and respond accordinglyto make alternative arrangements for emergency management based on renewable energy sources.
6. Suggestive project ideas
1. School Water Audit2. Audit of School Food Services3. Recycling at School4. Recycling at Home
5. Energy Audit at Home6. Energy Audit at a Hospital7. Energy Conservation in a Village household8. Energy accounting for a solar green house9. Energy accounting of a brick kiln10. Energy accounting of flour mill11. Energy accounting at the works of a potter/blacksmith12. Energy audit of a restaurant13. Energy Audit of a shopping complex14. Energy audit of a garment factory
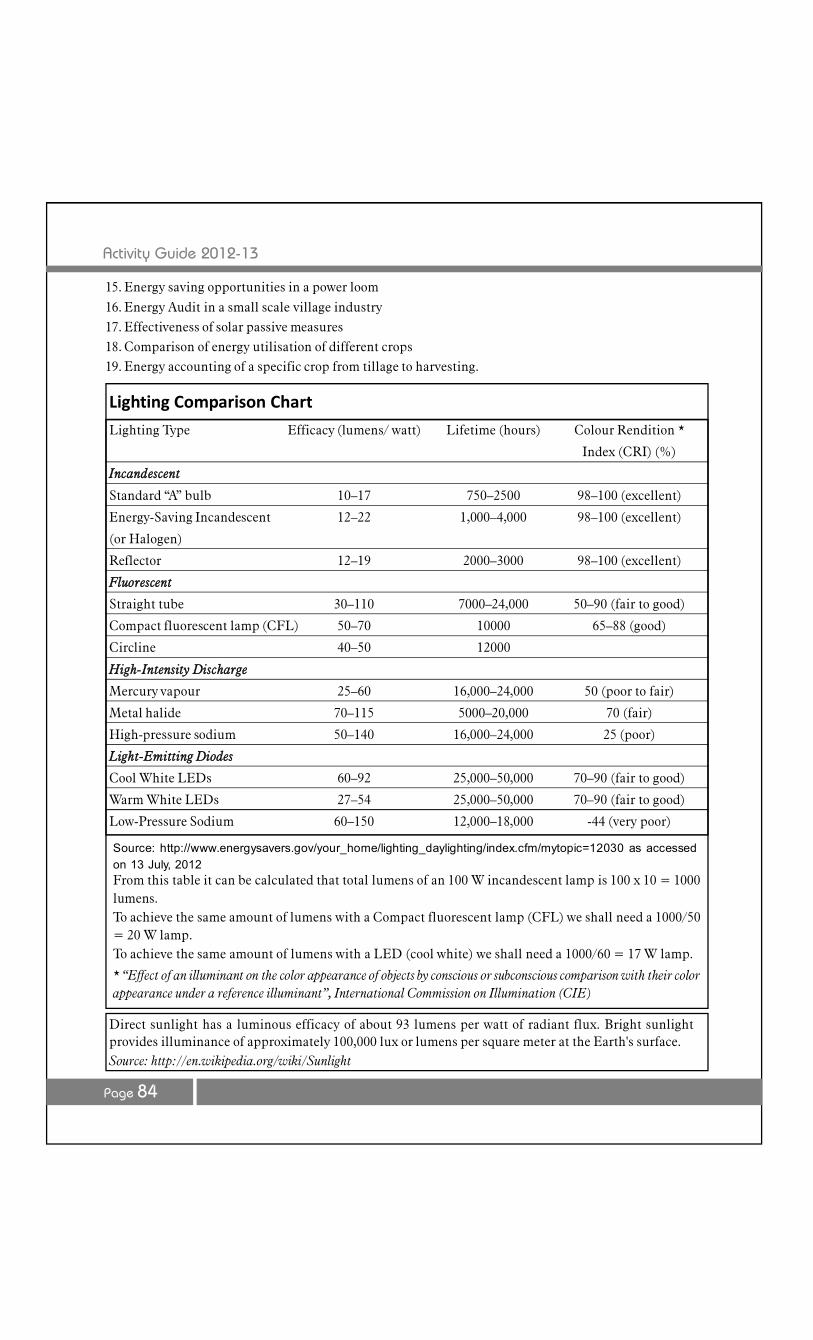
Activity Guide 2012-13
Page 84
Lighting Comparison Chart
Lighting Type Efficacy (lumens/ watt) Lifetime (hours) Colour Rendition *
Index (CRI) (%)
Incandescent
Standard “A” bulb 10–17 750–2500 98–100 (excellent)
Energy-Saving Incandescent 12–22 1,000–4,000 98–100 (excellent)
(or Halogen)
Reflector 12–19 2000–3000 98–100 (excellent)
Fluorescent
Straight tube 30–110 7000–24,000 50–90 (fair to good)
Compact fluorescent lamp (CFL) 50–70 10000 65–88 (good)
Circline 40–50 12000
High-Intensity Discharge
Mercury vapour 25–60 16,000–24,000 50 (poor to fair)
Metal halide 70–115 5000–20,000 70 (fair)
High-pressure sodium 50–140 16,000–24,000 25 (poor)
Light-Emitting Diodes
Cool White LEDs 60–92 25,000–50,000 70–90 (fair to good)
Warm White LEDs 27–54 25,000–50,000 70–90 (fair to good)
Low-Pressure Sodium 60–150 12,000–18,000 -44 (very poor)
15. Energy saving opportunities in a power loom
16. Energy Audit in a small scale village industry17. Effectiveness of solar passive measures18. Comparison of energy utilisation of different crops19. Energy accounting of a specific crop from tillage to harvesting.
Source: http://www.energysavers.gov/your_home/lighting_daylighting/index.cfm/mytopic=12030 as accessedon 13 July, 2012From this table it can be calculated that total lumens of an 100 W incandescent lamp is 100 x 10 = 1000lumens.To achieve the same amount of lumens with a Compact fluorescent lamp (CFL) we shall need a 1000/50= 20 W lamp.To achieve the same amount of lumens with a LED (cool white) we shall need a 1000/60 = 17 W lamp.
* “Effect of an illuminant on the color appearance of objects by conscious or subconscious comparison with their colorappearance under a reference illuminant”, International Commission on Illumination (CIE)
Direct sunlight has a luminous efficacy of about 93 lumens per watt of radiant flux. Bright sunlightprovides illuminance of approximately 100,000 lux or lumens per square meter at the Earth's surface.Source: http://en.wikipedia.org/wiki/Sunlight
Activity Guide 2012-13
Page 85
Sub-Theme-VI
Energy Planningand Modelling

Activity Guide 2012-13
Page 86
Prof. A. SrinivasanMr. Jayanta Kr SarmaDr. Lalit SharmaSheeraz KirmaniDr. Kishor Kumar BaruahMr. Sandeep Bhattacharjee
Working Group of the sub-theme
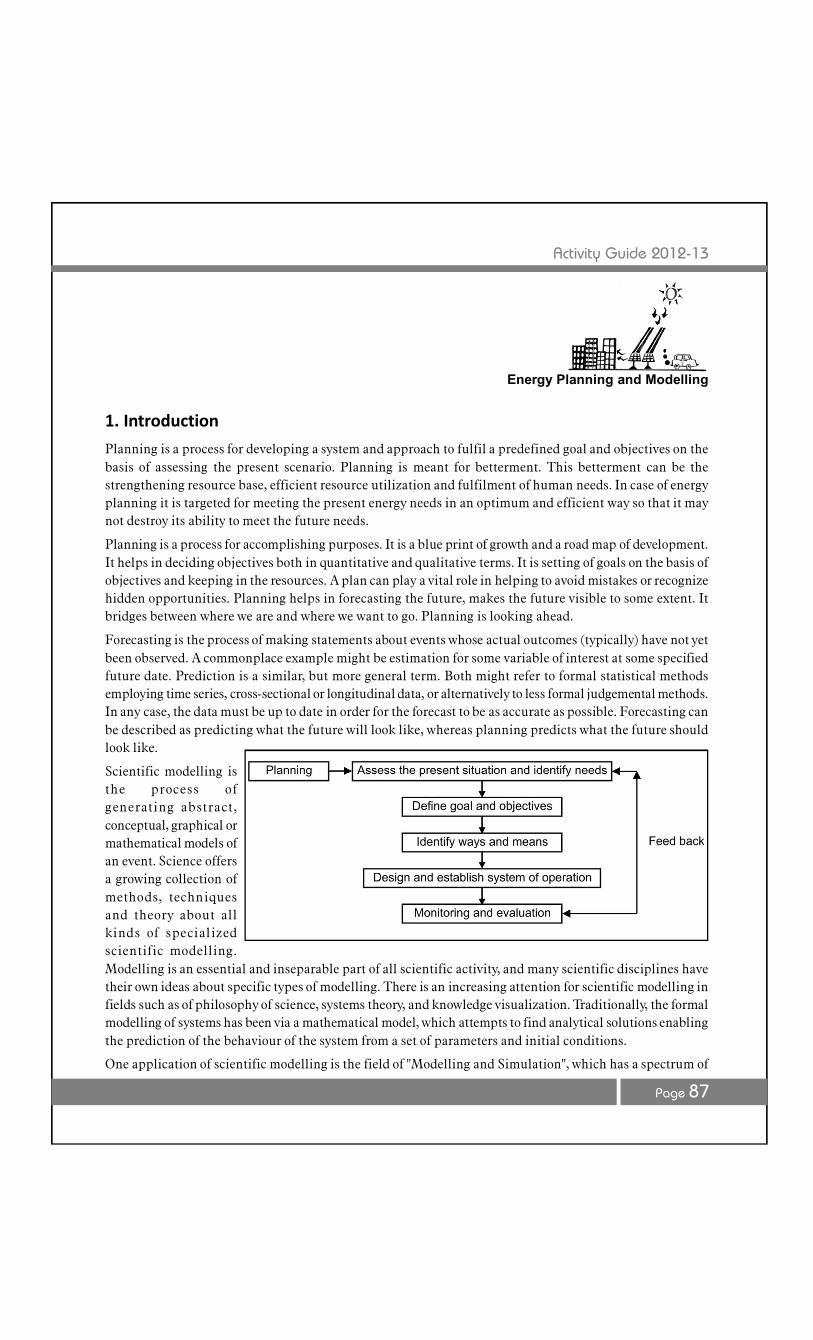
Activity Guide 2012-13
Page 87
1. Introduction
Planning is a process for developing a system and approach to fulfil a predefined goal and objectives on thebasis of assessing the present scenario. Planning is meant for betterment. This betterment can be thestrengthening resource base, efficient resource utilization and fulfilment of human needs. In case of energyplanning it is targeted for meeting the present energy needs in an optimum and efficient way so that it maynot destroy its ability to meet the future needs.
Planning is a process for accomplishing purposes. It is a blue print of growth and a road map of development.It helps in deciding objectives both in quantitative and qualitative terms. It is setting of goals on the basis ofobjectives and keeping in the resources. A plan can play a vital role in helping to avoid mistakes or recognizehidden opportunities. Planning helps in forecasting the future, makes the future visible to some extent. Itbridges between where we are and where we want to go. Planning is looking ahead.
Forecasting is the process of making statements about events whose actual outcomes (typically) have not yetbeen observed. A commonplace example might be estimation for some variable of interest at some specifiedfuture date. Prediction is a similar, but more general term. Both might refer to formal statistical methodsemploying time series, cross-sectional or longitudinal data, or alternatively to less formal judgemental methods.In any case, the data must be up to date in order for the forecast to be as accurate as possible. Forecasting canbe described as predicting what the future will look like, whereas planning predicts what the future shouldlook like.
Scientific modelling isthe process ofgenerating abstract,conceptual, graphical ormathematical models ofan event. Science offersa growing collection ofmethods, techniquesand theory about allkinds of specializedscientific modelling.Modelling is an essential and inseparable part of all scientific activity, and many scientific disciplines havetheir own ideas about specific types of modelling. There is an increasing attention for scientific modelling infields such as of philosophy of science, systems theory, and knowledge visualization. Traditionally, the formalmodelling of systems has been via a mathematical model, which attempts to find analytical solutions enablingthe prediction of the behaviour of the system from a set of parameters and initial conditions.
One application of scientific modelling is the field of "Modelling and Simulation", which has a spectrum of
Energy Planning and Modelling
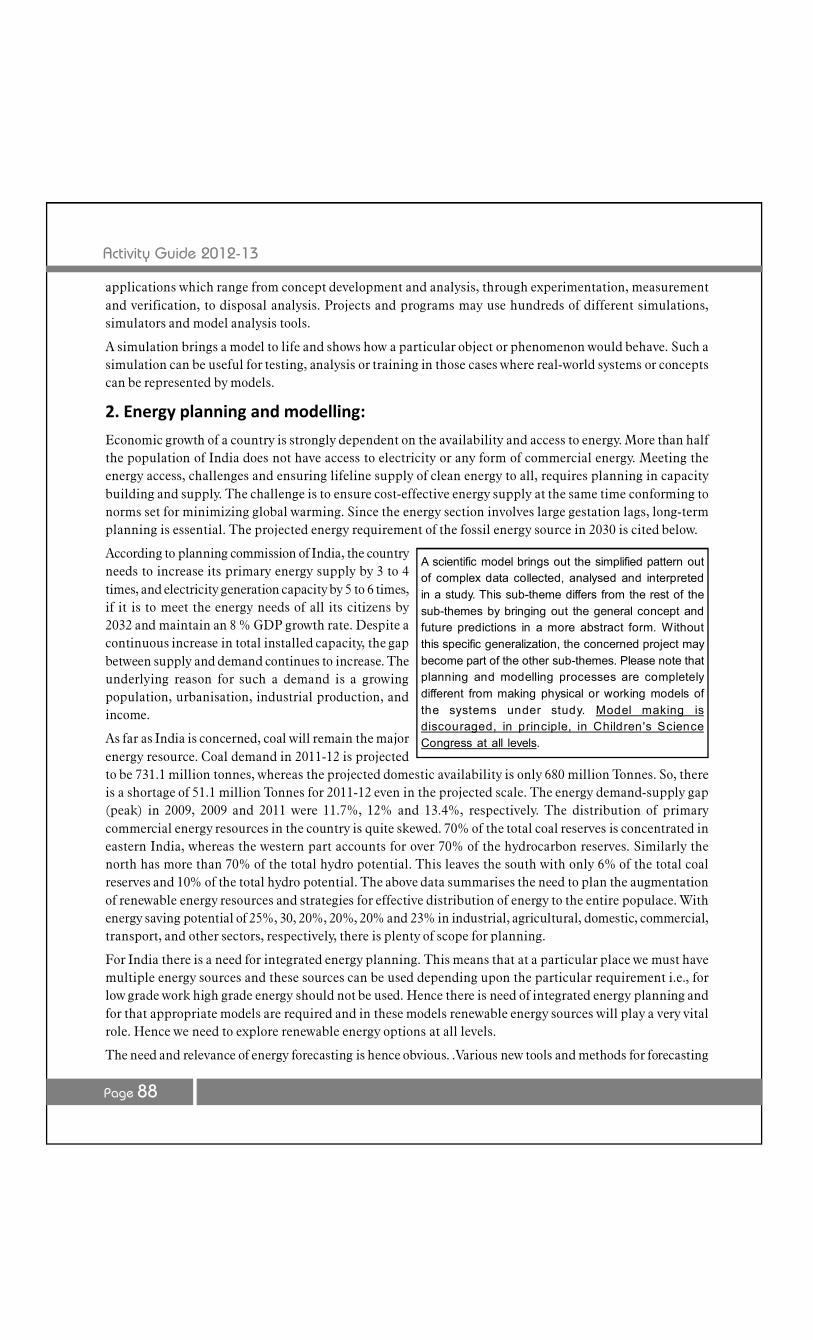
Activity Guide 2012-13
Page 88
applications which range from concept development and analysis, through experimentation, measurementand verification, to disposal analysis. Projects and programs may use hundreds of different simulations,simulators and model analysis tools.
A simulation brings a model to life and shows how a particular object or phenomenon would behave. Such asimulation can be useful for testing, analysis or training in those cases where real-world systems or conceptscan be represented by models.
2. Energy planning and modelling:
Economic growth of a country is strongly dependent on the availability and access to energy. More than halfthe population of India does not have access to electricity or any form of commercial energy. Meeting theenergy access, challenges and ensuring lifeline supply of clean energy to all, requires planning in capacitybuilding and supply. The challenge is to ensure cost-effective energy supply at the same time conforming tonorms set for minimizing global warming. Since the energy section involves large gestation lags, long-termplanning is essential. The projected energy requirement of the fossil energy source in 2030 is cited below.
According to planning commission of India, the countryneeds to increase its primary energy supply by 3 to 4times, and electricity generation capacity by 5 to 6 times,if it is to meet the energy needs of all its citizens by2032 and maintain an 8 % GDP growth rate. Despite acontinuous increase in total installed capacity, the gapbetween supply and demand continues to increase. Theunderlying reason for such a demand is a growingpopulation, urbanisation, industrial production, andincome.
As far as India is concerned, coal will remain the majorenergy resource. Coal demand in 2011-12 is projectedto be 731.1 million tonnes, whereas the projected domestic availability is only 680 million Tonnes. So, thereis a shortage of 51.1 million Tonnes for 2011-12 even in the projected scale. The energy demand-supply gap(peak) in 2009, 2009 and 2011 were 11.7%, 12% and 13.4%, respectively. The distribution of primarycommercial energy resources in the country is quite skewed. 70% of the total coal reserves is concentrated ineastern India, whereas the western part accounts for over 70% of the hydrocarbon reserves. Similarly thenorth has more than 70% of the total hydro potential. This leaves the south with only 6% of the total coalreserves and 10% of the total hydro potential. The above data summarises the need to plan the augmentationof renewable energy resources and strategies for effective distribution of energy to the entire populace. Withenergy saving potential of 25%, 30, 20%, 20%, 20% and 23% in industrial, agricultural, domestic, commercial,transport, and other sectors, respectively, there is plenty of scope for planning.
For India there is a need for integrated energy planning. This means that at a particular place we must havemultiple energy sources and these sources can be used depending upon the particular requirement i.e., forlow grade work high grade energy should not be used. Hence there is need of integrated energy planning andfor that appropriate models are required and in these models renewable energy sources will play a very vitalrole. Hence we need to explore renewable energy options at all levels.
The need and relevance of energy forecasting is hence obvious. .Various new tools and methods for forecasting
A scientific model brings out the simplified pattern outof complex data collected, analysed and interpretedin a study. This sub-theme differs from the rest of thesub-themes by bringing out the general concept andfuture predictions in a more abstract form. Withoutthis specific generalization, the concerned project maybecome part of the other sub-themes. Please note thatplanning and modelling processes are completelydifferent from making physical or working models ofthe systems under study. Model making isdiscouraged, in principle, in Children's ScienceCongress at all levels.
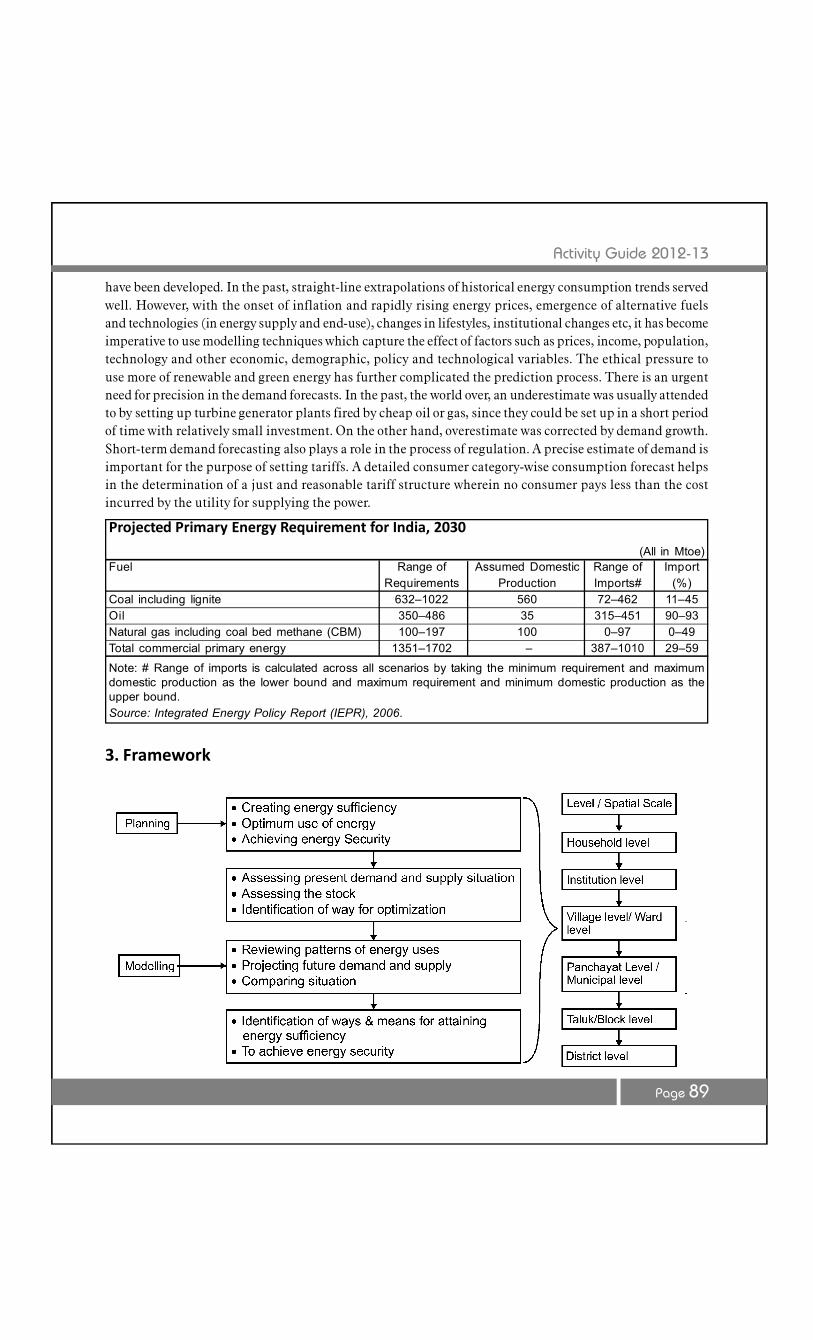
Activity Guide 2012-13
Page 89
have been developed. In the past, straight-line extrapolations of historical energy consumption trends servedwell. However, with the onset of inflation and rapidly rising energy prices, emergence of alternative fuelsand technologies (in energy supply and end-use), changes in lifestyles, institutional changes etc, it has becomeimperative to use modelling techniques which capture the effect of factors such as prices, income, population,technology and other economic, demographic, policy and technological variables. The ethical pressure touse more of renewable and green energy has further complicated the prediction process. There is an urgentneed for precision in the demand forecasts. In the past, the world over, an underestimate was usually attendedto by setting up turbine generator plants fired by cheap oil or gas, since they could be set up in a short periodof time with relatively small investment. On the other hand, overestimate was corrected by demand growth.Short-term demand forecasting also plays a role in the process of regulation. A precise estimate of demand isimportant for the purpose of setting tariffs. A detailed consumer category-wise consumption forecast helpsin the determination of a just and reasonable tariff structure wherein no consumer pays less than the costincurred by the utility for supplying the power.
3. Framework
Projected Primary Energy Requirement for India, 2030
(All in Mtoe)Fuel Range of Assumed Domestic Range of Import
Requirements Production Imports# (%)Coal including lignite 632–1022 560 72–462 11–45Oil 350–486 35 315–451 90–93Natural gas including coal bed methane (CBM) 100–197 100 0–97 0–49Total commercial primary energy 1351–1702 – 387–1010 29–59
Note: # Range of imports is calculated across all scenarios by taking the minimum requirement and maximumdomestic production as the lower bound and maximum requirement and minimum domestic production as theupper bound.Source: Integrated Energy Policy Report (IEPR), 2006.
Activity Guide 2012-13
Page 90
4. Model Project
Project -I : Micro-level energy planning and modelling - start from your school
At micro-level, which comprise of your home, classroom, school, village or the likes, you can take up projectson energy planning and modelling. But before venturing into this let us understand the reason for undertakingit. Applications of energy are varied and for same application, different energies can be utilized, thus at thefirst step we need to understand energy services. Say for example, if drying clothes is an objective, it can beachieved by electricity (dryer in washing machine) or sunlight (spreading under the sun). So we need toidentify the application and options available for energy services. In short, planning is nothing but matchingthe need with sources available for optimization.
An exercise to be carried out at your school
1. Identify any one key area which you intend to plan for, let us say, fuel consumption.
2. We know that students reach school either walking, cycling, by school bus, public transport or their ownvehicles. Now fuel is being consumed while you and / or your friends are being dropped and / or pickedup from the school. Since vehicles are not only guzzlers of fuel but also loads the environment withpollution, which necessitates planning for optimal utilization of energy resources, and this can be donein the following way;
3. To begin with you need to collect some basic information like;
a. Number of students in your class / schoolb. Number of students coming to school by different modes (i) walking, (ii) cycling, (iii) two wheeler,
(iv) four wheeler, (v) shared vehicle, (vi) school bus, (vii) public transport, or (viii) othersc. For two and four wheelers used, how much is the mileage given by the vehicle (km/litre) and how
many trips are made by the vehicle (it would be 4 if dropped and picked up by someone and 2 ifvehicles are self-driven
d. Also gather information about the distance of their residence from the schoole. Depict the data graphically and analyse.
4. Analysis of data would include fuel consumption by two and four wheelers used on daily basis. Thiswould provide you with an idea about level to which fuel can be conserved. In addition, how much levelof air and sound pollution (carbon dioxide load and decibel levels) is added to the environment.
Children like you who tried their hands on such ideas, not only developed the models but won thelaurels at national and international levels.
Electricity production at SabarimalaSabarimala, a pilgrimage site in Kerala, is thronged by around ten million devotees who offer coconut filledwith clarified butter (ghee) which is placed in the burning fire. The continuous fire burning for almost threemonths period generates a lot of heat energy, which if is trapped and utilized for steam generation; enormousamount of electricity can be produced thereby to take care for the requirements for festival period.
Self-cooling of CPUCPU, which gets heated with continuous use of the computer, if is covered with jacket carrying water, thewater gets condensed and in turn keep the CPU cool.
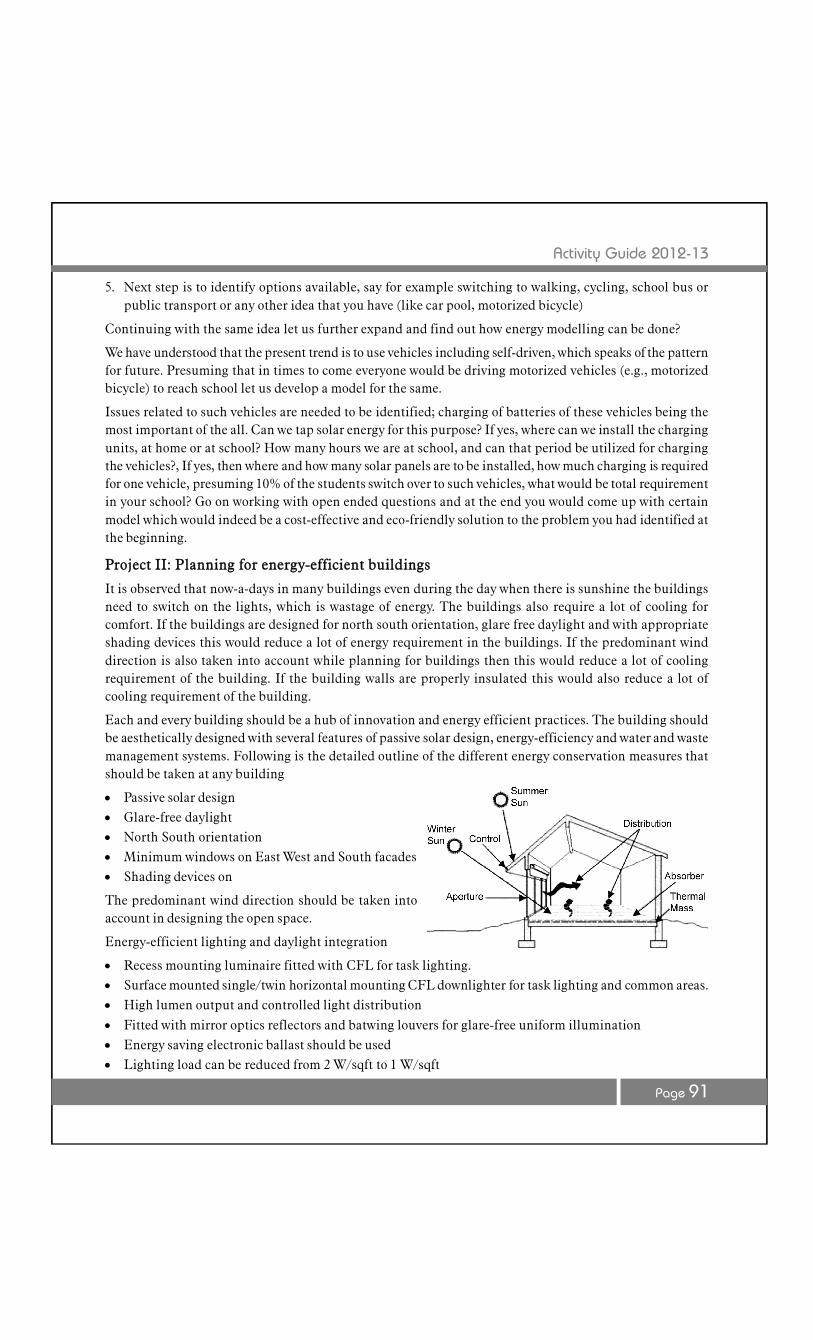
Activity Guide 2012-13
Page 91
5. Next step is to identify options available, say for example switching to walking, cycling, school bus orpublic transport or any other idea that you have (like car pool, motorized bicycle)
Continuing with the same idea let us further expand and find out how energy modelling can be done?
We have understood that the present trend is to use vehicles including self-driven, which speaks of the patternfor future. Presuming that in times to come everyone would be driving motorized vehicles (e.g., motorizedbicycle) to reach school let us develop a model for the same.
Issues related to such vehicles are needed to be identified; charging of batteries of these vehicles being themost important of the all. Can we tap solar energy for this purpose? If yes, where can we install the chargingunits, at home or at school? How many hours we are at school, and can that period be utilized for chargingthe vehicles?, If yes, then where and how many solar panels are to be installed, how much charging is requiredfor one vehicle, presuming 10% of the students switch over to such vehicles, what would be total requirementin your school? Go on working with open ended questions and at the end you would come up with certainmodel which would indeed be a cost-effective and eco-friendly solution to the problem you had identified atthe beginning.
Project II: Planning for energy-efficient buildings
It is observed that now-a-days in many buildings even during the day when there is sunshine the buildingsneed to switch on the lights, which is wastage of energy. The buildings also require a lot of cooling forcomfort. If the buildings are designed for north south orientation, glare free daylight and with appropriateshading devices this would reduce a lot of energy requirement in the buildings. If the predominant winddirection is also taken into account while planning for buildings then this would reduce a lot of coolingrequirement of the building. If the building walls are properly insulated this would also reduce a lot ofcooling requirement of the building.
Each and every building should be a hub of innovation and energy efficient practices. The building shouldbe aesthetically designed with several features of passive solar design, energy-efficiency and water and wastemanagement systems. Following is the detailed outline of the different energy conservation measures thatshould be taken at any building
Passive solar design Glare-free daylight North South orientation Minimum windows on East West and South facades Shading devices on
The predominant wind direction should be taken intoaccount in designing the open space.
Energy-efficient lighting and daylight integration
Recess mounting luminaire fitted with CFL for task lighting. Surface mounted single/twin horizontal mounting CFL downlighter for task lighting and common areas. High lumen output and controlled light distribution
Fitted with mirror optics reflectors and batwing louvers for glare-free uniform illumination Energy saving electronic ballast should be used Lighting load can be reduced from 2 W/sqft to 1 W/sqft
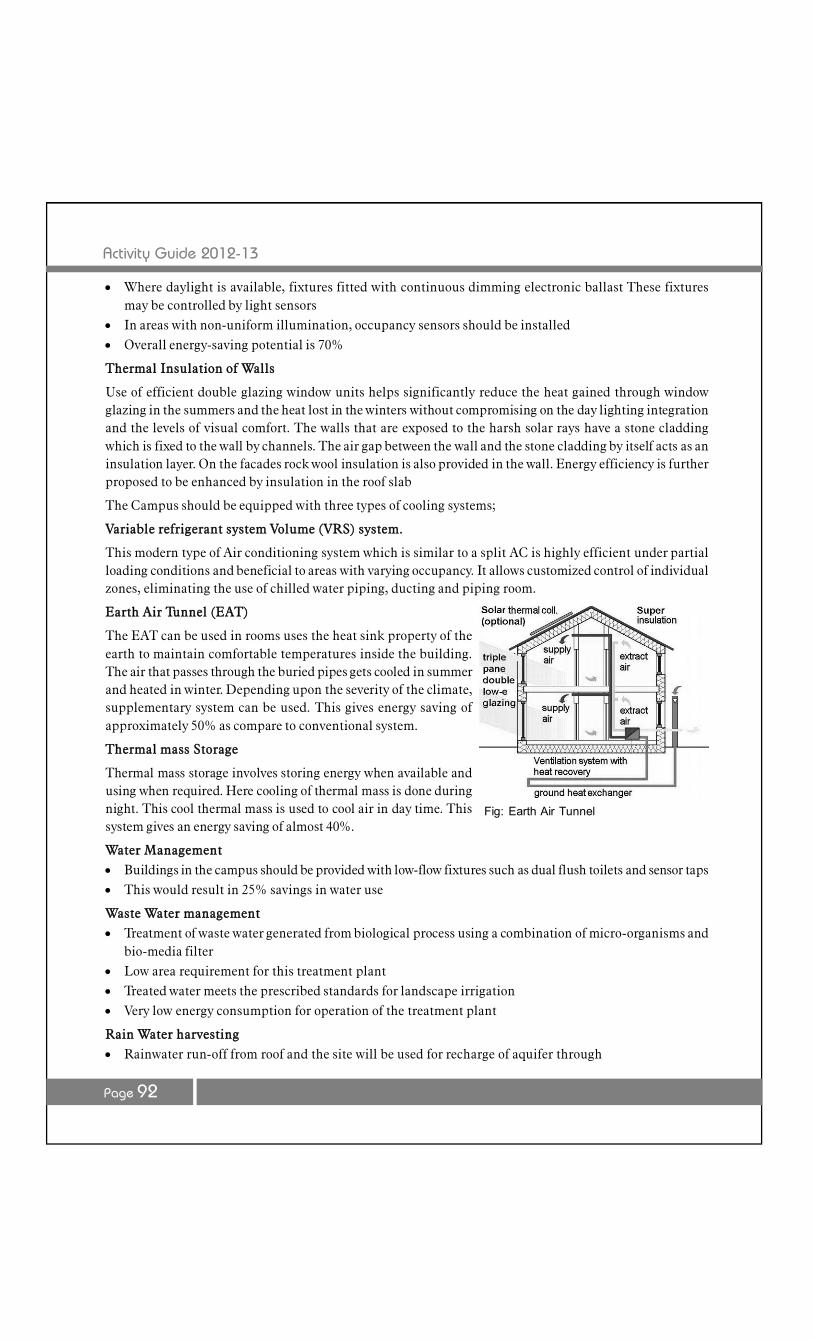
Activity Guide 2012-13
Page 92
Where daylight is available, fixtures fitted with continuous dimming electronic ballast These fixturesmay be controlled by light sensors
In areas with non-uniform illumination, occupancy sensors should be installed Overall energy-saving potential is 70%
Thermal Insulation of Walls
Use of efficient double glazing window units helps significantly reduce the heat gained through windowglazing in the summers and the heat lost in the winters without compromising on the day lighting integrationand the levels of visual comfort. The walls that are exposed to the harsh solar rays have a stone claddingwhich is fixed to the wall by channels. The air gap between the wall and the stone cladding by itself acts as aninsulation layer. On the facades rock wool insulation is also provided in the wall. Energy efficiency is furtherproposed to be enhanced by insulation in the roof slab
The Campus should be equipped with three types of cooling systems;
Variable refrigerant system Volume (VRS) system.
This modern type of Air conditioning system which is similar to a split AC is highly efficient under partialloading conditions and beneficial to areas with varying occupancy. It allows customized control of individualzones, eliminating the use of chilled water piping, ducting and piping room.
Earth Air Tunnel (EAT)
The EAT can be used in rooms uses the heat sink property of theearth to maintain comfortable temperatures inside the building.The air that passes through the buried pipes gets cooled in summerand heated in winter. Depending upon the severity of the climate,supplementary system can be used. This gives energy saving ofapproximately 50% as compare to conventional system.
Thermal mass Storage
Thermal mass storage involves storing energy when available andusing when required. Here cooling of thermal mass is done duringnight. This cool thermal mass is used to cool air in day time. Thissystem gives an energy saving of almost 40%.
Water Management Buildings in the campus should be provided with low-flow fixtures such as dual flush toilets and sensor taps This would result in 25% savings in water use
Waste Water management Treatment of waste water generated from biological process using a combination of micro-organisms and
bio-media filter Low area requirement for this treatment plant Treated water meets the prescribed standards for landscape irrigation Very low energy consumption for operation of the treatment plant
Rain Water harvesting Rainwater run-off from roof and the site will be used for recharge of aquifer through
Fig: Earth Air Tunnel
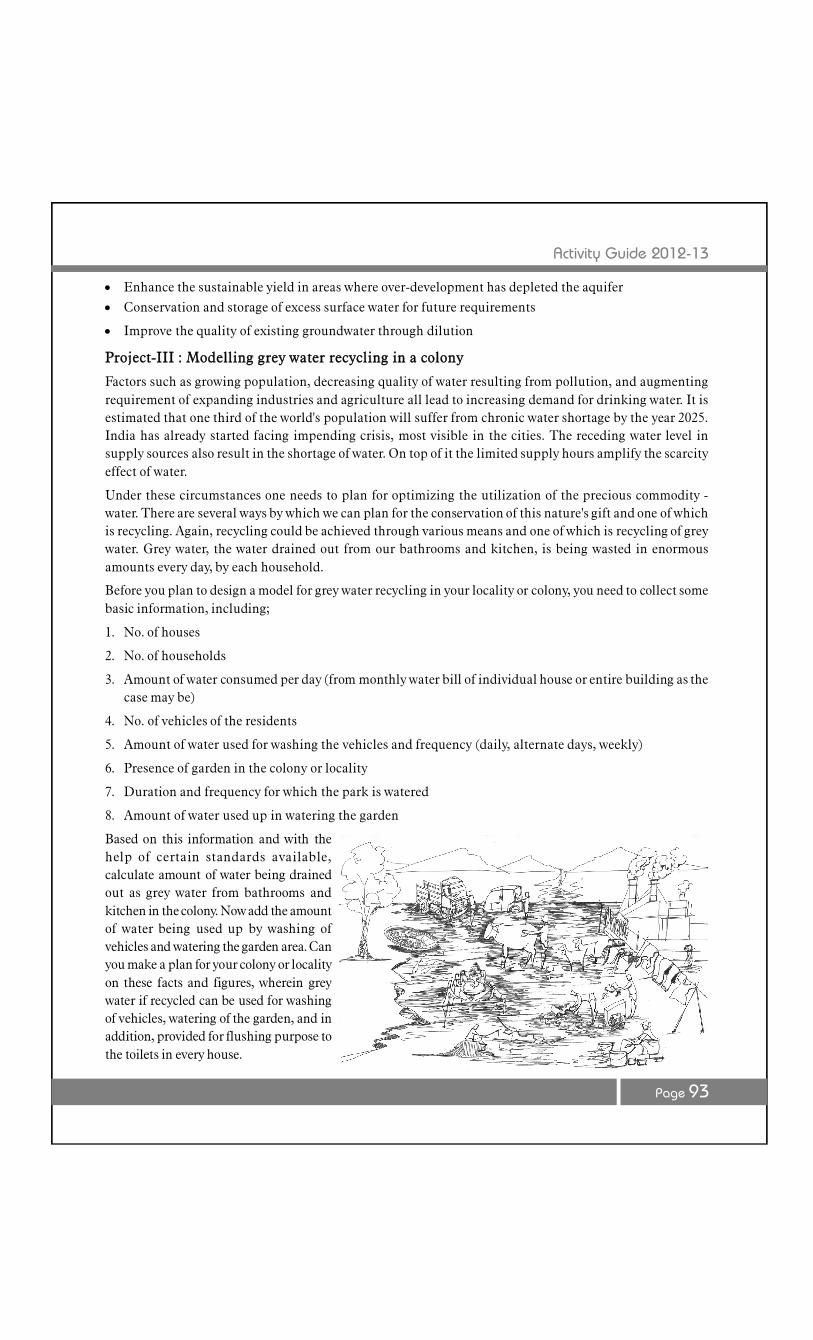
Activity Guide 2012-13
Page 93
Enhance the sustainable yield in areas where over-development has depleted the aquifer
Conservation and storage of excess surface water for future requirements
Improve the quality of existing groundwater through dilution
Project-III : Modelling grey water recycling in a colony
Factors such as growing population, decreasing quality of water resulting from pollution, and augmentingrequirement of expanding industries and agriculture all lead to increasing demand for drinking water. It isestimated that one third of the world's population will suffer from chronic water shortage by the year 2025.India has already started facing impending crisis, most visible in the cities. The receding water level insupply sources also result in the shortage of water. On top of it the limited supply hours amplify the scarcityeffect of water.
Under these circumstances one needs to plan for optimizing the utilization of the precious commodity -water. There are several ways by which we can plan for the conservation of this nature's gift and one of whichis recycling. Again, recycling could be achieved through various means and one of which is recycling of greywater. Grey water, the water drained out from our bathrooms and kitchen, is being wasted in enormousamounts every day, by each household.
Before you plan to design a model for grey water recycling in your locality or colony, you need to collect somebasic information, including;
1. No. of houses
2. No. of households
3. Amount of water consumed per day (from monthly water bill of individual house or entire building as thecase may be)
4. No. of vehicles of the residents
5. Amount of water used for washing the vehicles and frequency (daily, alternate days, weekly)
6. Presence of garden in the colony or locality
7. Duration and frequency for which the park is watered
8. Amount of water used up in watering the garden
Based on this information and with thehelp of certain standards available,calculate amount of water being drainedout as grey water from bathrooms andkitchen in the colony. Now add the amountof water being used up by washing ofvehicles and watering the garden area. Canyou make a plan for your colony or localityon these facts and figures, wherein greywater if recycled can be used for washingof vehicles, watering of the garden, and inaddition, provided for flushing purpose tothe toilets in every house.

Activity Guide 2012-13
Page 94
Projection for optimal utilization and conservation of water would not only cheer you up but also ensure thesmile on the faces of future generation.
Project IV : Assessing present energy usage and projection for future requirement
Now let us consider your village or locality, wherein we would explore usage of energy and based on whichwe would try to project future requirements. To begin with, we would find out and collect following informationon different applications and types of energy used;
1. Total energy used for cookinga. No. of LPG cylinders required for a monthb. Total weight of fuel woods requiredc. Other sources used like electricity for heating (total wattage /1000 * number of hours used per day),
kerosene, charcoal etc.
2. Total energy used for other types of heating3. Total energy required for lighting like electricity, kerosene or other types of lamps used4. Total fuel consumed for travelling including daily usage like going to school/office etc. and occasional
travelling5. Total energy used for agriculture, may be in the homestead for watering, ploughing and also the man-
days used.6. Total energy used for entertainment like TV, music systems etc. or AC.
After summing the energy used for different purposes, divide the total by the number of members of each ofthe sample household of each group. The average of the total energy utilized for each group would give usthe per capita energy requirement.
Based on the trend of rise in population, the data for which can be obtained from the census information orcompetent authorities, of previous three decades, we can project the future population of the locality. Thiswould give us the total energy requirement for an area. Likewise, we can also assess the energy requirementfor different applications; like cooking, lighting, agriculture, etc.
5. Suggestive Project Idea
i. Assessing the energy (solar, wind and biomass) generation potential of any particular society or village
ii. Economic projections for energy generation from local energy resources
iii. Model for optimization of energy usage
iv. Planning for low energy buildings
v. Energy planning for transport sector
vi. Modelling of windows for optimal utilization of energy
vii. Modelling of home/office interiors for efficient power consumption
viii. Modelling of energy efficient cooking systems
More information in Page 96
Activity Guide 2012-13
Page 95
1. Advantage of public transportation - an evaluation
2. Awareness on energy conservation
3. Assessment of energy consumption school campus
4. Assessment of electricity loss in an human habitat area
5. Assessment energy consumption pattern in preparation of different type of food
6. Evaluation of energy requirement of different cooking device and identification of energy efficient devices
7. Energy audit in home
8. Energy audit of residential school
9. Assessing energy potentialities of different biomass
10. Assessing pattern of solar energy over an area
11. Assessing energy potentialities of different plant parts
12. Assessing wind energy potentialities in a coastal area
13. Assessing energy potentialities of cow dung cake
14. Estimation of energy consumption in irrigation using water pump
15. Identification different cooking fuel and evaluating their energy efficiency
16. Assessing intensity of solar radiation
17. Assessing electricity consumption in a locality
18. Assessing cold energy from fire fly
19. Assessing potentialities of zero energy refrigeration system uses in traditional society
20. Harnessing energy through microbial fuel cell using mud of lake/pond/tank/river
21. Improvisation of traditional chulla for multipurpose uses
22. Studies on use of firewood as fuel and its impact on indoor pollution
23. Impact electricity transmission line and street light on flora and fauna of a locality
24. Impact of raw coal transportation on human life
25. Traffic jam, energy consumption and pollution
26. Assessing impact of firewood collection on flora and fauna of a locality
27. Assessing energy potentialities and scope of improvisation of traditional water mill
28. Identification non-edible oil bearing seeds and its energy potentialities
29. Assessing biomass waste generated from agricultural practices and its energy potentialities
30. Assessing cow dung availability of village and estimating its energy potentialities
Project idea put forwarded by the participants in the national orientationworkshop
(Project title only)
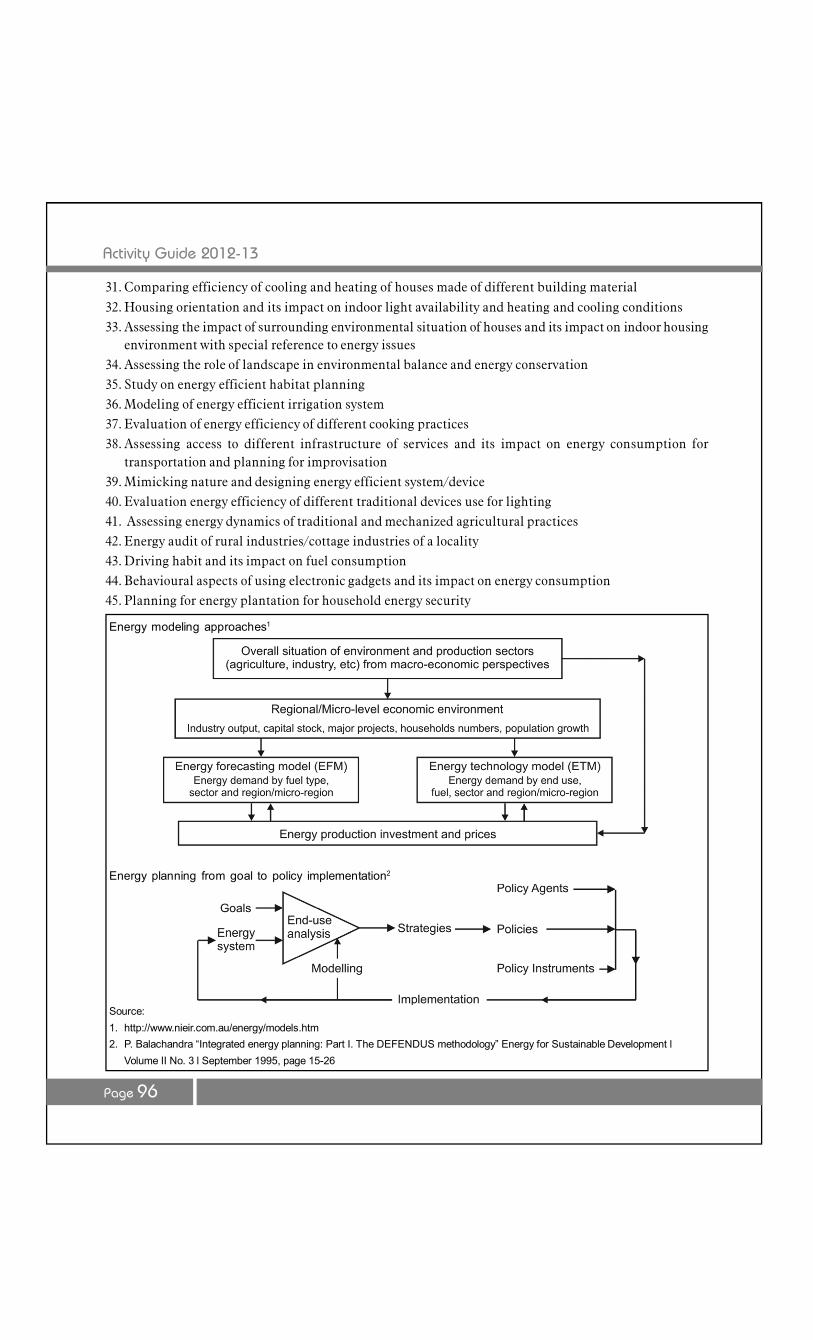
Activity Guide 2012-13
Page 96
31. Comparing efficiency of cooling and heating of houses made of different building material
32. Housing orientation and its impact on indoor light availability and heating and cooling conditions33. Assessing the impact of surrounding environmental situation of houses and its impact on indoor housing
environment with special reference to energy issues34. Assessing the role of landscape in environmental balance and energy conservation35. Study on energy efficient habitat planning36. Modeling of energy efficient irrigation system37. Evaluation of energy efficiency of different cooking practices38. Assessing access to different infrastructure of services and its impact on energy consumption for
transportation and planning for improvisation39. Mimicking nature and designing energy efficient system/device40. Evaluation energy efficiency of different traditional devices use for lighting41. Assessing energy dynamics of traditional and mechanized agricultural practices42. Energy audit of rural industries/cottage industries of a locality43. Driving habit and its impact on fuel consumption44. Behavioural aspects of using electronic gadgets and its impact on energy consumption45. Planning for energy plantation for household energy security
Source:1. http://www.nieir.com.au/energy/models.htm2. P. Balachandra “Integrated energy planning: Part I. The DEFENDUS methodology” Energy for Sustainable Development l
Volume II No. 3 l September 1995, page 15-26
Energy modeling approaches1
Energy planning from goal to policy implementation2
Activity Guide 2012-13
Page 97
References
Anne Welle-Strand , Graeme Ball, Mariann Viksaas Hval, Monica Vlaicu (2012) “Electrifying solutions:Can power sector aid boost economic growth and development?” Energy for Sustainable Development16 (2012) 26-34
Annual Report, Ministry of New and Renewable Sources, GoI, 2008
Atmanand, Amit K. Gupta, and Rishabh Raman “Energy and Sustainable Development-An IndianPerspective” World Academy of Science, Engineering and Technology 54 2009, P. 128-133
Basalla George, “Energy and Civilization”, in Science, Technology and the Human Prospect, ChaunceyStarr, ed. (New York: Pergamon Press, 1980), 39-52.
Bossel H ( 1998) “Earth at a Crossroads: Path to a Sustainable Future” Cambridge University Press
D. Logan, C. Neil, and A. Taylor, Modelling Renewable Energy Resources in Integrated Resource Planning,RCG/Hagler, Bailly, Inc. Boulder, Colorado
Darby Sarah (2007) “Enough is as good as a feast - sufficiency”
ECEEE 2007 SUMMER STUDY SAVING ENERGY - JUST DO IT! 111 - 120
Energy Information Administration, “International Energy Annual-2006”
Environmental Education Handbook (Standard VI-VIII) : Teachers' Resource: Centre for EnvironmentEducation, Ahmedabad
Gordon AJ, Ryle GJA, Webb G (1980) The relationship between sucrose and starch during "dark" exportfrom leaves of uniculm barley. J Exp Bot 31: 845-850
Hermann-Josef Wagner, Jotirmay Mathur. 2011. Introduction to Hydro Energy Systems:Basics.Technologyand Operation. Springe. P.43
Indian Renewable Energy Development Agency Ltd (IREDA) annual report for the FY 2002 - 2003.
Indian Renewable Energy Status Report ( 2010) , NERL, RENZI, GTZ,IRADE
Konstantinos D. Patlitzianas and Kolybiris Christos (2012) "Effective financing for provision of renewableelectricity and water supply on islands" Energy for Sustainable Development 16 (2012) 120-124
Leo Schrattenholzer, Energy Planning Methodologies and Tools, Encyclopedia of Life Support Systems(EOLSS), EOLSS Publishers, Oxford, UK. International Institute for Applied Systems Analysis o Schlossplatz1 o A-2361 Laxenburg o Austria
Ministry of Non-Conventional Energy Sources (MNES) annual report for the FY 2002 - 2003.
Nathan Eagle and Ben Olding ( 2001) "The watermill battery charger" Boiling Point No 46 Spring 2001, P.35-36
OECD ( 2007) " OECD Contribution to the United Nations Commission on
Activity Guide 2012-13
Page 98
“Our Ecological Footprint” Environmental Education Manual for School Teachers, Center for Science andEnvironment,
Planet Earth- Activity Guide : our home, explore, share, and care. 16th NCSC 2008, prepared and publishedby NCSTC Network, New Delhi. Supported by RVPSP- DST, GoI.
Rao Narasimha D. ( 2012) “Kerosene subsidies in India: When energy policy fails as social policy” Energyfor Sustainable Development 16 (2012) 35-43
Sahai R.V. ( 2006) “ENERGY MARKETS AND TECHNOLOGIES IN INDIA” Keynote Address in GlobalEnergy Dialogue at Hanover (Germany) on April 25, 2006
Seth Dunn, “Carbon Emissions Reach New High”, in Worldwatch Institute, Vital Signs 2002 (New York:W.W. Norton & Company, 2002), pp. 52-53.
Smil V and Knowland WE (eds), “Energy in the Developing world The Real Energy Crisis”, Oxford UniversityPress
South Asia Energy Unit -Sustainable Development Department - The World Bank ( 2010) “Unleashing thePotential of Renewable Energy in India”
Sukhatme, S.P. 2011.Energy alternatives for meeting India's future needs of electricity. Physics News, Bulletinof Indian Physics Association. 41(3): pp. 25 - 36
Sustainable Development 15: “ENERGY FOR SUSTAINABLE DEVELOPMENT”
Tiwary G. N. (2005) “Renewable Energy Resources” Narosa Pbulishing House
Twidell John and Tony Weir “Renewable energy resources” E & FN SPON, London, 1997 , page 258
UN Energy ( 2007) “Sustainable Bio-energy a framework for decision makers”
Unruth G . ( 2010) “Earth, INC. using nature's rules to build sustainable profits” Harvard Business Press
Wilson J.J.B. ( 1979) “Solar Energy” Wykeham, London
World Energy Council " World Energy - Insight -2011”
Wright R.T. and Nebel B.J. (2004) “Environmental Science”, Prentice Hall of India , New Delhi, P.317-385
Websiteshttp://arewetoast.com/development-energy-and-carbon.html
http://www.skwirk.com.au/p-c_s-11_u-55_t-85_c-301/energy-for-transport-the-old-and-young-of-it/nsw/science-technology/on-the-move/the-machines-we-use-to-transport-things
http://www.teindia.nic.in/Files/NCF-2005.pdf
http://www.bp.com/statisticalreview
http://www.powermin.nic.in/JSP_SERVLETS/internal.jsp
http://www.undp.org/content/undp/en/home/ourwork/environmentandenergy/focus_areas/sustainable-energy.html
http://www.indiaenergyportal.org/overview_detail.php
http://petroleum.nic.in/petstat.pdf
http://books.google.co.in/books?id=pM4r4k3CgIAC&pg=PA225&lpg=PA225&dq=mnes+nic+frame&source=bl&ots=O1U0dRLEXq&sig=Gmfd0QTzkRO6hbBvJfBSuiYd0kw&hl=en&sa=X&ei=Rm-bT-CJKsrtrQfBtYhL&ved=0CDUQ6AEwAw#v=onepage&q=mnes%20nic%20frame&f=false

Activity Guide 2012-13
Page 99
http://petroleum.nic.in/conserv.htm
http://www.fi.edu/learn/case-files/energy.html
http://www.cmdc.net/publications.php
http://telstar.ote.cmu.edu/environ/m3/s3/07stability.shtml
http://telstar.ote.cmu.edu/environ/m3/s3/06forces.shtml
http://telstar.ote.cmu.edu/environ/m3/s3/05account.shtml
http://telstar.ote.cmu.edu/environ/m3/s3/04measure.shtml
http://telstar.ote.cmu.edu/environ/m3/s3/03transformation.shtml
http://telstar.ote.cmu.edu/environ/m3/s3/02needs.shtml
http://telstar.ote.cmu.edu/environ/m3/s3/01history.shtml
http://www.ianswer4u.com/2012/02/tidal-energy-advantages-and.html#ixzz1wQNVQfs
http://wp.me/p2b46g-bq
http://mail.google.com/mail/?shva=1#inbox/136773a8aab302b9
http://www.adelaide.edu.au/biogas/fair/
http://www.builditsolar.com/Projects/Educational/educational.htm
http://www.builditsolar.com/Projects/Educational/NCKidsSolarAct-1.pdf
http://www.builditsolar.com/SiteSurvey/site_survey.htm
http://www.sciencebuddies.org/science-fair- projects/recommender_interest_area.php?ia=Energy&dl=9
http://www.schoolgen.co.nz/tr/teacher_resource_table.aspx
http://www.tn.gov.in/spc/eleventhplan_approach_paper/steering_working_committee.pdf
http://nrdms.gov.in/energy_planning.asp
http://www.maintenanceworld.com/Articles/impo/Energy-Optimization.html
http://en.wikipedia.org/wiki/Planning
http://en.wikipedia.org/wiki/Scientific_modelling
http://en.wikipedia.org/wiki/Simulation
http://en.wikipedia.org/wiki/Forecasting
http://en.wikipedia.org/wiki/Technology_forecasting
http://www.tn.gov.in/spc/eleventhplan_approach_paper/steering_working_committee.pdf
http://nrdms.gov.in/energy_planning.asp
http://www.maintenanceworld.com/Articles/impo/Energy-Optimization.html
http://www.indiaclimateportal.org/component/option,com_policybrief/view,policybriefdetail/id,14
http://www.forecastingprinciples.com/index.php?option=com_content&task=view&id=3&Itemid=3
http://qbox.wharton.upenn.edu/documents/mktg/research/INTFOR3581%20%20Publicatio%
http://www.nrel.gov/docs/legosti/old/6436.pdf
http://www.iiasa.ac.at/Admin/PUB/Documents/RP-05-002.pdf

Activity Guide 2012-13
Page 100
Glossary
Anaerobic digestionThe breakdown of organic materials by microorganism in the absence of oxygen.
AtmosphereThe atmosphere of Earth is a layer of gases surrounding the planet Earth that is retained by Earth's gravity.The atmosphere protects life on Earth by absorbing ultraviolet solar radiation, warming the surface throughheat retention (greenhouse effect), and reducing temperature extremes between day and night (the diurnaltemperature variation).
Base-load-power plantA power plant, usually large and fuelled by coal or nuclear energy, that is kept operating continuously tosupply electricity.
BioconversionThe use of biomass as fuel. Burning materials like wood, plant waste, agricultural waste directly to produceenergy.
BiodieselBiodiesel refers to a vegetable oil- or animal fat-based diesel fuel consisting of long-chain alkyl (methyl,propyl or ethyl) esters. Biodiesel is typically made by chemically reacting lipids (e.g., vegetable oil, animalfat with an alcohol producing fatty acid esters.
BiogasBiogas typically refers to a gas produced by the biological breakdown of organic matter in the absence ofoxygen. Biogas originates from biogenic material and is a type of bio-fuel. One type of biogas is produced byanaerobic digestion or fermentation of biodegradable materials such as biomass, manure or sewage, municipalwaste, green waste and carbon dioxide. The other principal type of biogas is wood gas which is created bygasification of wood or other biomass. This type of biogas is comprised primarily of nitrogen, hydrogen andcarbon monoxide, with trace amounts of methane.
BiomassIt refers to material of biological origin like timber, fuel wood, agricultural waste, animal waste, leaf litteretc. It is a renewable energy source. As an energy source, biomass can either be used directly or converted intoother energy product like bio-gas, bricked etc.
Carbon sequestrationIt refers to the process of capturing carbon dioxide (CO2). It is process of removing carbon from the atmosphereand depositing it in a reservoir. It is considered as one of the ideal approach of climate change mitigation.Carbon dioxide is naturally captured from the atmosphere through biological, chemical or physical processes.Forestation is considered as one of the best way of Carbon sequestration
Activity Guide 2012-13
Page 101
Calorie A fundamental unit of energy. The amount of heat required to raise the temperature of 1 gram of water 1degree Celsius. All forms of energy can be converted to heat and measured in calorie.
CFLA Compact Fluorescent Lamp (CFL) is energy saving light which is designed to replace an incandescentlamp, here compact electronic ballast used in the base of the lamp. CFL use 1/5 to 1/3 electric powers andlast longer too.
Chemical EnergyThe potential energy that is contained in certain chemicals; most important, the energy contained in organiccompounds such as food and fuels and that may be released through respiration or burning.
CogenerationThe joint production of useful heat and electricity.
CombustionCombustion or burning is the sequence of exothermic chemical reactions between a fuel and an oxidantaccompanied by the production of heat and conversion of chemical elements. The release of heat can resultin light in the form of glowing or flame.
ConsumptionIt refers to goods and services utilized by individual to full-fill their needs. Usually it is the goods and servicespurchased by individual as well as provided by government as a welfare measures.
Demand Side ManagementDemand side management (DSM) is basically energy demand management. It is targeted to modify consumersdemand through various means, like, financial incentives, education, etc. Usually, the goal of demand sidemanagement is to encourage the consumers to use less energy during peak hours or to shift the time ofenergy use to off-peak hours. Such management practices do not reduce total energy consumption but couldable to reduce need of more investment for more power generation or for networks.
EnergyThe capability of doing work; different forms of energy can be converted to other forms, but the total amountof energy remains the same.
Energy AuditEnergy audit is an inspection, survey and analysis of energy flows for energy conservation in an operatingsystem, it may be building, industry, public utilities etc. It is process to reduce the amount of energy inputinto system without compromising its output.
Energy ConservationEnergy Conservation refers to an effort made to reduce energy consumption. It can achieve throughstrengthening and enhancing energy efficiency, either through the use of appropriate technology or throughbetter management practices or both.
Energy EfficiencyIt is an effort to reduce energy requirement to provide particular product or services. It can be achieve by betterprovisioning in the system of operation, use of efficient technology, management practices to minimize wastage.
Activity Guide 2012-13
Page 102
Energy flowThe movement of energy through ecosystem, starting from the capturing solar energy by primary producersand ending with loss of heat energy.
Energy ManagementIt refers to managing the uses of energy in a production or services system. Such management incorporatescientific planning along with operational plan to get maximum output from minimum input of energy. Inprinciple there are two important approaches of energy management, viz. Supply side management andDemand side management.
Energy PlanningIt is a process for developing long term strategies to fulfill energy needs based present energy use assessmentand prediction of future needs. Such strategies incorporate use of technology, uses of utilities and servicesand operational management. Usually such practices are holistic in nature through a structured decisionmaking processes. It can be carried through i. setting current and future needs, ii. Target for particular or setof problem, iii. Creating range of model and options (energy mix etc) , iv. Focuses on quality, quantity andreliability, v. setting operational modalities, vi. Developing continuous processes of monitoring, evaluationand feedback for corrective measures.
ElectromagnetismElectromagnetism is the physics of the electromagnetic field: a field, encompassing all of space, which exertsa force on those particles that possess the property of electric charge, and is in turn affected by the presenceand motion of such particles..
Electromagnetic radiationElectromagnetic radiation is a propagating wave in space with electric and magnetic components.
Electromagnetic spectrumThe electromagnetic spectrum is the range of all possible electromagnetic radiation.
Energy TransmissionThe processes of moving electrical energy, a gas or a liquid energy sources from its source of generation orextraction to its point of distribution and consumption. Electrical energy is transmitted through transmissionline, while liquids and gases are transmitted through pipelines.
Environmental ImpactIt is a system of analysis and assessment of the possible positive or negative impact of a proposed project onenvironment or analysis and assessment of impact on environment (positive or negative) from a ongoingproject / activities.
ForecastingForecasting or prediction is a statement about the way things will happen in the future, often but not alwaysbased on experience or knowledge. While there is much overlap between prediction and forecast, a predictionmay be a statement that some outcome is expected, while a forecast may cover a range of possible outcomes.
Fossil FuelFossil fuels are formed by natural processes, such as anaerobic decomposition of buried organisms. Fossilfuels are non-renewable resources because they take millions of years to form and reserves are being depletedmuch faster than new ones are being made. Coal, petroleum and natural gas are widely used fossil fuels.
Activity Guide 2012-13
Page 103
Fuel cellIt is a device that converts the chemical energy from a fuel into electricity through a chemical reaction withoxygen or another oxidizing agent.[1] Hydrogen is the most common fuel, but hydrocarbons such as naturalgas and alcohols like methanol are sometimes used. Fuel cells are different from batteries in that they requirea constant source of fuel and oxygen to run, but they can produce electricity continually for as long as theseinputs are supplied.
GenderGender refers to the general differences between male and female entities, without any overt assumptionsregarding biology or sociology.
Gender issueGender Issues are issues evolving with relationships between men and women; on similarities and differencesin socialization, personality, and behavior; and on the changing aspirations, roles, and status of women inagricultural, rural or industrial, urban societies as well as in developing nations.
Geo-thermal EnergyThe word geothermal comes from the Greek words 'geo' (earth) and 'therme' (heat). So, geothermal energy isheat from the interior of the earth. Geothermal energy, in the broad sense, is the heat in the earth and releasedby conduction at an average heat flux of 60 MW/m. The four prerequisites are necessary to exploit geothermalenergy are (Economides and Ungemach, 1987): a) A heat source which could be a magma body, or a simplehot rock at depth, b) Heat carrier fluid, c) Permeable or fractured rock acting as a reservoir and d) Cap rocksproviding an impermeable and insulating cover.
Green buildingIt is also known as green construction or sustainable building, which refers to a structure and using processthat is environmentally responsible and resource-efficient throughout a building's life-cycle: from site selectionto design, construction, operation, maintenance, renovation, and demolition.
Greenhouse gasesGases in the atmosphere that absorb infrared energy and contribute to the air temperature. Carbon dioxide,methane, nitrous oxide, chlroflrocarbon are some of the green house gases.
Green house effectAn increase in the atmospheric temperature caused by increasing amount of carbon dioxide and other certaingases that absorb and trap heat, which normally radiates away from Earth.
Global climate ChangeChange of climatic cycle and weather regime through human induced factors effecting through green houseeffects and global warming.
Global warmingIt refers to the rising average temperature of Earth's atmosphere and oceans since the late 19th century, aswell as its projected continuation. An increase in global temperature will cause sea levels to rise and willchange the amount and pattern of precipitation, as well as cause a probable expansion of subtropical deserts.The greenhouse effect is the process by which absorption and emission of infrared radiation by gases in theatmosphere warm a planet's lower atmosphere and surface. Human activity since the Industrial Revolutionhas increased the amount of greenhouse gases in the atmosphere, leading to increased radioactive forcingfrom CO2, methane, tropospheric ozone, CFCs and nitrous oxide.
Activity Guide 2012-13
Page 104
HydroelectricElectricity produced from moving water.
Kinetic EnergyKinetic energy is the energy of motion. An object that has motion - whether it is vertical or horizontal motion- has kinetic energy. There are many forms of kinetic energy - vibrational (the energy due to vibrationalmotion), rotational (the energy due to rotational motion), and translational (the energy due to motion fromone location to another). The following equation is used to represent the kinetic energy (KE) of an object.
KE = ½( mxv2)
Where, m = mass and v = speed of the object
LEDA light-emitting diode (LED) is a semiconductor light source. LEDs are used as indicator lamps in manydevices and are increasingly used for other lighting.
LivelihoodLivelihood refers to “means of securing the necessities of life”.
Micro hydroIt is a type of hydroelectric power that typically produce up to 100 kW of electricity using the natural flow ofwater. These installations can provide power to an isolated home or small community, or are sometimesconnected to electric power networks.
Millennium Development Goals (MDGs)The Millennium Development Goals (MDGs) are eight international development goals that all 193 UnitedNations member states and at least 23 international organizations have agreed to achieve by the year 2015.The goals are:i. eradicating extreme poverty and hunger,ii. achieving universal primary education,iii. promoting gender equality and empowering womeniv. reducing child mortality rates,v. improving maternal health,vi. Combating HIV/AIDS, malaria, and other diseases,vii. ensuring environmental sustainability, andviii. developing a global partnership for development.
MethaneIt is a chemical compound with the chemical formula CH4. It is the simplest alkane, the main component ofnatural gas, and probably the most abundant organic compound on earth. The relative abundance of methanemakes it an attractive fuel.
Muscle powerMuscle is tissue composed of bundles of elongated cells, it has the capability of contraction and relaxation toproduce movement in an organ or part of an organ, which produces a force and it is called as muscle power.Human and animal muscle power is used by human being from the don of its civilization to perform differentworks.
Activity Guide 2012-13
Page 105
ModelingScientific modeling is the process of generating conceptual, graphical or mathematical models in abstract form.
ModelA model is an object (in physical form), usually built to scale, that represents in detail another or often largerobject, for display or exhibit.
Nuclear energyNuclear energy usually means the part of the energy of an atomic nucleus, which can be released by fusion orfission or radioactive decay.
PetroleumPetroleum is a naturally occurring flammable liquid found in rock consisting of a complex mixture ofhydrocarbons of various molecular weights along with other organic compounds. When it is extracted frominterior reserves it is called as crude oil. The hydrocarbons in crude oil are mostly alkanes, cycloalkanes andvarious aromatic hydrocarbons while the other organic compounds contain nitrogen, oxygen and sulfur, andtrace amounts of metals such as iron, nickel, copper and vanadium. Four different types of hydrocarbonmolecules appear in crude oil, viz. Paraffins, Naphthenes, Aromatics and Asphaltics.
PhotosynthesisThe chemical process carried out by green plants through which light energy is used to produce glucose fromcarbon dioxide and water and Oxygen is released as by product.
PlanningA planning is a process adopted to define goal and objectives to fulfill present and future needs (on the basisof future need depicting through review of the present needs). It also defines ways and means with operationalguideline to achieve already defined goal and objectives.
PollutantA substance that contaminates air. Water or soil.
PollutionContamination of air, water or soil with undesirable amounts of material or heat.
PhotosynthesisThe chemical process carried out by green plants through which light energy is used to produce glucose fromcarbon dioxide and water and Oxygen is released as by product.
Pico hydroIt is a term used for hydroelectric power generation of under 5 kW. It is useful in small, remote communitiesthat require only a small amount of electricity.
Potential EnergyPotential energy, or stored energy, is the ability of a system to do work due to its position or internal structure.
Radiant energyIt is the energy of electromagnetic waves.[1] The quantity of radiant energy may be calculated by integratingradiant flux (or power) with respect to time and, like all forms of energy. The term is used particularly whenradiation is emitted by a source into the surrounding environment. Radiant energy may be visible or invisibleto the human eye.
Activity Guide 2012-13
Page 106
Renewable energyIt is relating to a natural resource, such as solar energy, water, or wood, that is never used up or that can bereplaced by new growth.
SimulationA simulation is the implementation of a model or working on a model.
Solar EnergySolar energy is the most readily available source of energy. Solar energy has been used since prehistoric times,but in a most primitive manner. Solar Energy - Electromagnetic energy transmitted from the sun (solar radiation).The amount that reaches the earth is equal to one billionth of total solar energy generated, or the equivalent ofabout 420 trillion kilowatt-hours. When this energy are tapped and used through the help of different technologythis is considered as Solar Energy in field of Renewable Energy. Due to its nuclear fusion reaction, the sun iscontinuously pouring huge amount of energy in several forms, including light, heat, radio waves and even x-rays. The Earth, in orbit around the sun, intercepts a very small part of the sun's immense output. On Earth,direct sunlight is available from sunrise until sunset. Solar collectors and modules are designed to capture someof the sun's energy and change it from radiation into more usable forms such as heat or electricity. Infect,sunlight is an excellent source of heat and electricity, the two most important forms of energy we consume.Solar is increasingly popular in remote area electrification in tropical countries like India such astelecommunication, rural electrification, irrigation, solar vaccine refrigeration etc.
Solar Passive ArchitectureIt is an approach of architectural design of building with focus to use solar passive energy efficiently forlighting, seasonal air conditioning, water and space heating, etc. Thereby the energy cost in the building canbe reduced. Orientation of the building with direction, utilization of surrounding environment, landscapecondition, proper placement and provisions of windows, doors and ventilation, use of appropriate buildingmaterial are some of the important aspects of consideration of such practices.
Solar PhotovoltaicPertaining to the direct conversion of sun's light into electricity.
Solar radiationSolar radiation is radiant energy emitted by the sun, particularly electromagnetic energy. About half of theradiation is in the visible short-wave part of the electromagnetic spectrum. The other half is mostly in thenear-infrared part, with some in the ultraviolet part of the spectrum.
Solar ThermalThermal energy of sun is used for heating.
Supply Sided ManagementSupply sided management refers to how one purchase energy resources. It incorporates- i. Reduce cost forenergy and manages risk in purchasing, ii. Optimize delivery system, iii. Go for energy mix, iv. Select energysources and switch to fuels in real time to reduce cost and negative impact, v. incorporate continuousmonitoring and evaluation system and vi. Focuses on integrated operation.
SustainabilityProperty whereby a process can be continued indefinitely without depleting the energy or material resourceson which it depends.
Activity Guide 2012-13
Page 107
Sustainable developmentDevelopment that provides people with better life without sacrificing or depleting resources or causingenvironmental impacts that will undercut the ability of future generations to meet their needs.
Sustainable energyIt is the sustainable provision of energy that meets the needs of the present without compromising the abilityof future generations to meet their needs.
Sustainable useSustainable use means " manner of human use of resources in optimum way so that it may yield the greatestcontinuous benefit to present generations while maintaining its potential to meet the needs and aspirationsof future generations".
SystemA system is a set of elements (often called 'components' ) and relationships which are different fromrelationships of the set or its elements to other elements or sets. Some important characteristics of systemsare:i. Systems have structure, defined by components/elements and their composition;ii. Systems have behavior, which involves inputs, processing and outputs of material, energy, information,
or data;iii. Systems have interconnectivity: the various parts of a system have functional as well as structural
relationships to each other.iv. Systems may have some functions or groups of functions
Thermal energyThermal energy is the part of the total internal energy of a thermodynamic system or sample of matter thatresults in the system temperature. Microscopically, the thermal energy is partly the kinetic energy of a system'sconstituent particles, which may be atoms, molecules, electrons, or particles in plasmas. It originates fromthe individually random, or disordered, motion of particles in a large ensemble. Macroscopically, the thermalenergy of a system at a given temperature is related proportionally to its heat capacity. But, thermal energy isdistinct from heat. Thermal energy is a state function, a property of a system, while heat, in the strict use inphysics, is characteristic only of a process, i.e. it is absorbed or produced as an energy exchange, always as aresult of a temperature difference. It is not a static property of matter. Matter does not contain heat, butrather thermal energy. Heat is thermal energy in the process of transfer or conversion across a boundary ofone region of matter to another, as a result of a temperature difference.
Thermal insulationIt is the approach of reduction of heat transfer between objects in thermal contact or in range of radiativeinfluence. Heat transfer is the transfer of thermal energy between objects of differing temperature. Themeans to stem heat flow may be especially engineered methods or processes, as well as suitable static objectsand materials.
Tidal EnergyTidal energy is a form of hydropower that converts the energy of tides into useful forms of power - mainlyelectricity.

Activity Guide 2012-13
Page 108
Traditional KnowledgeTraditional knowledge (TK), indigenous knowledge (IK), traditional environmental knowledge (TEK) andlocal knowledge generally refer to the long-standing traditions and practices of certain regional, indigenous,or local communities.
Wind EnergyWind energy is the kinetic energy associated with the movement of atmospheric air. It has been used forhundreds of years for sailing, grinding grain, and for irrigation. Wind energy systems convert this kineticenergy to more useful forms of power. Wind energy systems for irrigation and milling have been in use sinceancient times and since the beginning of the 20th century it is being used to generate electric power. Windmillsfor water pumping have been installed in many countries particularly in the rural areas.
Wise useWise use means the "sustainable use for the benefit of mankind in a way that is compatible with maintainingthe natural properties of the ecosystem".
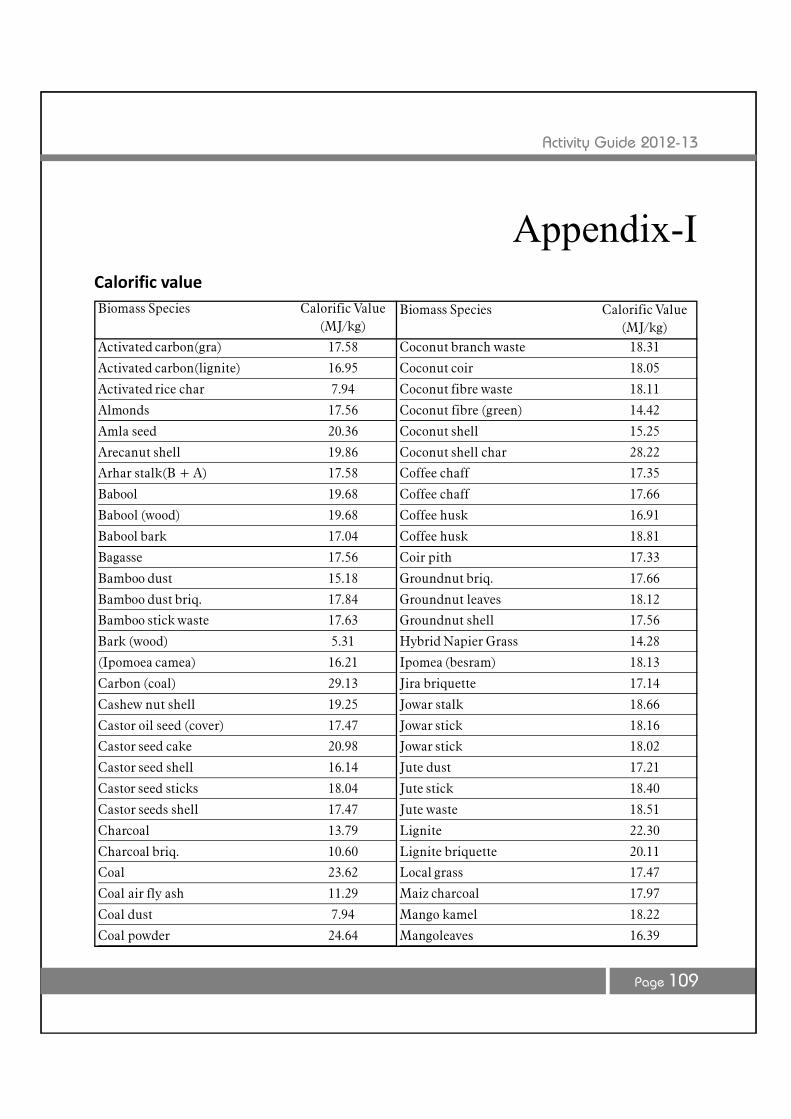
Activity Guide 2012-13
Page 109
Appendix-I
Activated carbon(gra) 17.58
Activated carbon(lignite) 16.95
Activated rice char 7.94
Almonds 17.56
Amla seed 20.36
Arecanut shell 19.86
Arhar stalk(B + A) 17.58
Babool 19.68
Babool (wood) 19.68
Babool bark 17.04
Bagasse 17.56
Bamboo dust 15.18
Bamboo dust briq. 17.84
Bamboo stick waste 17.63
Bark (wood) 5.31
(Ipomoea camea) 16.21
Carbon (coal) 29.13
Cashew nut shell 19.25
Castor oil seed (cover) 17.47
Castor seed cake 20.98
Castor seed shell 16.14
Castor seed sticks 18.04
Castor seeds shell 17.47
Charcoal 13.79
Charcoal briq. 10.60
Coal 23.62
Coal air fly ash 11.29
Coal dust 7.94
Coal powder 24.64
Calorific value
Coconut branch waste 18.31
Coconut coir 18.05
Coconut fibre waste 18.11
Coconut fibre (green) 14.42
Coconut shell 15.25
Coconut shell char 28.22
Coffee chaff 17.35
Coffee chaff 17.66
Coffee husk 16.91
Coffee husk 18.81
Coir pith 17.33
Groundnut briq. 17.66
Groundnut leaves 18.12
Groundnut shell 17.56
Hybrid Napier Grass 14.28
Ipomea (besram) 18.13
Jira briquette 17.14
Jowar stalk 18.66
Jowar stick 18.16
Jowar stick 18.02
Jute dust 17.21
Jute stick 18.40
Jute waste 18.51
Lignite 22.30
Lignite briquette 20.11
Local grass 17.47
Maiz charcoal 17.97
Mango kamel 18.22
Mangoleaves 16.39
Biomass Species Calorific Value(MJ/kg)
Biomass Species Calorific Value(MJ/kg)
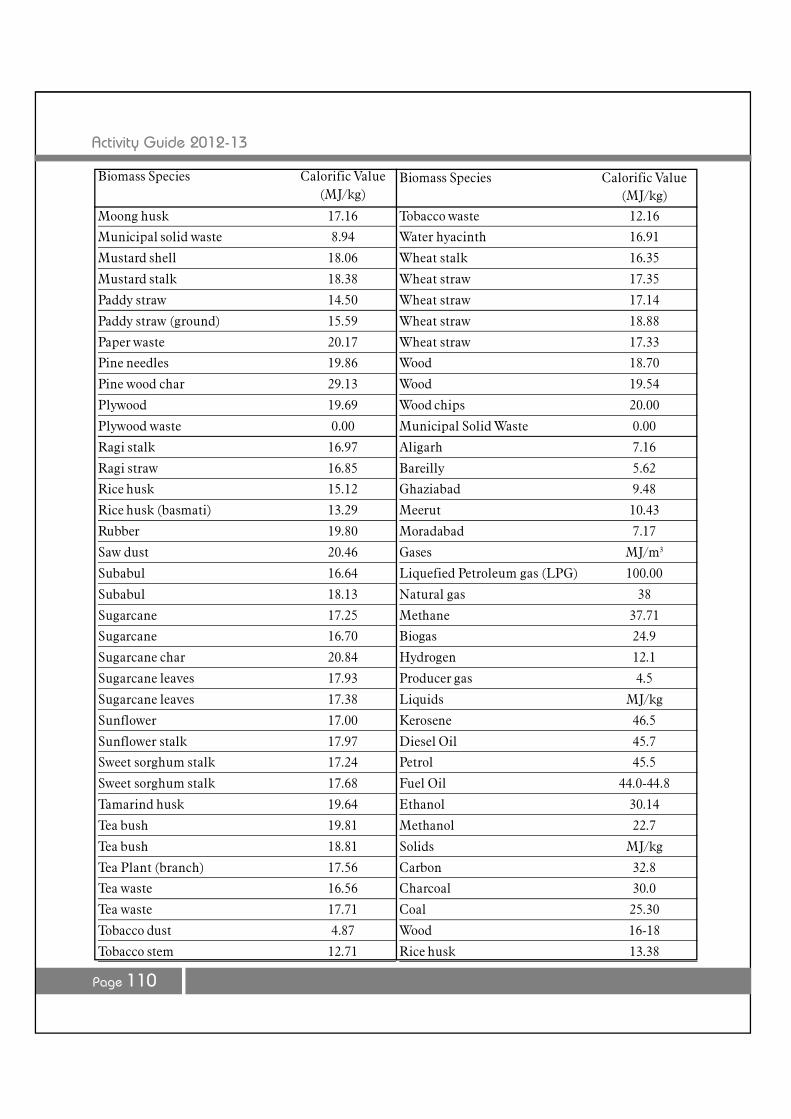
Activity Guide 2012-13
Page 110
Moong husk 17.16
Municipal solid waste 8.94
Mustard shell 18.06
Mustard stalk 18.38
Paddy straw 14.50
Paddy straw (ground) 15.59
Paper waste 20.17
Pine needles 19.86
Pine wood char 29.13
Plywood 19.69
Plywood waste 0.00
Ragi stalk 16.97
Ragi straw 16.85
Rice husk 15.12
Rice husk (basmati) 13.29
Rubber 19.80
Saw dust 20.46
Subabul 16.64
Subabul 18.13
Sugarcane 17.25
Sugarcane 16.70
Sugarcane char 20.84
Sugarcane leaves 17.93
Sugarcane leaves 17.38
Sunflower 17.00
Sunflower stalk 17.97
Sweet sorghum stalk 17.24
Sweet sorghum stalk 17.68
Tamarind husk 19.64
Tea bush 19.81
Tea bush 18.81
Tea Plant (branch) 17.56
Tea waste 16.56
Tea waste 17.71
Tobacco dust 4.87
Tobacco stem 12.71
Tobacco waste 12.16
Water hyacinth 16.91
Wheat stalk 16.35
Wheat straw 17.35
Wheat straw 17.14
Wheat straw 18.88
Wheat straw 17.33
Wood 18.70
Wood 19.54
Wood chips 20.00
Municipal Solid Waste 0.00
Aligarh 7.16
Bareilly 5.62
Ghaziabad 9.48
Meerut 10.43
Moradabad 7.17
Gases MJ/m3
Liquefied Petroleum gas (LPG) 100.00
Natural gas 38
Methane 37.71
Biogas 24.9
Hydrogen 12.1
Producer gas 4.5
Liquids MJ/kg
Kerosene 46.5
Diesel Oil 45.7
Petrol 45.5
Fuel Oil 44.0-44.8
Ethanol 30.14
Methanol 22.7
Solids MJ/kg
Carbon 32.8
Charcoal 30.0
Coal 25.30
Wood 16-18
Rice husk 13.38
Biomass Species Calorific Value(MJ/kg)
Biomass Species Calorific Value(MJ/kg)
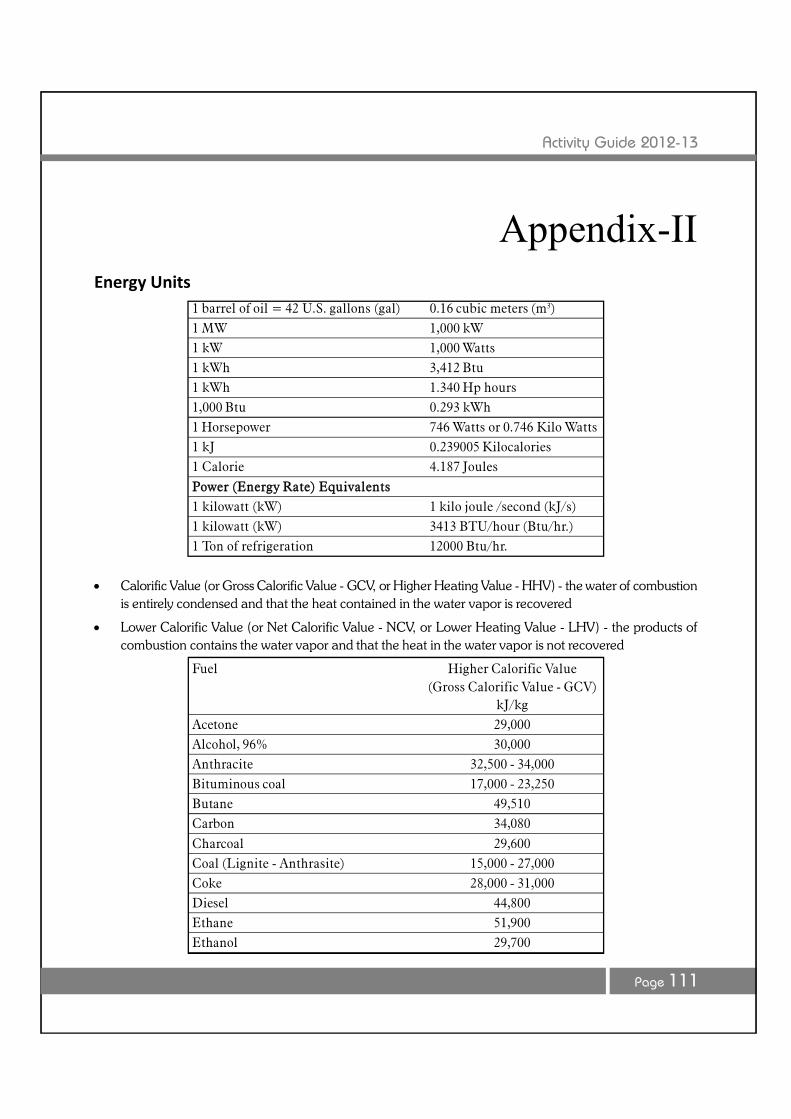
Activity Guide 2012-13
Page 111
Appendix-IIEnergy Units
1 barrel of oil = 42 U.S. gallons (gal) 0.16 cubic meters (m3)1 MW 1,000 kW1 kW 1,000 Watts1 kWh 3,412 Btu1 kWh 1.340 Hp hours1,000 Btu 0.293 kWh1 Horsepower 746 Watts or 0.746 Kilo Watts1 kJ 0.239005 Kilocalories1 Calorie 4.187 Joules
Power (Energy Rate) Equivalents1 kilowatt (kW) 1 kilo joule /second (kJ/s)1 kilowatt (kW) 3413 BTU/hour (Btu/hr.)1 Ton of refrigeration 12000 Btu/hr.
Calorific Value (or Gross Calorific Value - GCV, or Higher Heating Value - HHV) - the water of combustionis entirely condensed and that the heat contained in the water vapor is recovered
Lower Calorific Value (or Net Calorific Value - NCV, or Lower Heating Value - LHV) - the products ofcombustion contains the water vapor and that the heat in the water vapor is not recovered
Fuel Higher Calorific Value(Gross Calorific Value - GCV)
kJ/kgAcetone 29,000Alcohol, 96% 30,000Anthracite 32,500 - 34,000Bituminous coal 17,000 - 23,250Butane 49,510Carbon 34,080
Charcoal 29,600Coal (Lignite - Anthrasite) 15,000 - 27,000Coke 28,000 - 31,000Diesel 44,800Ethane 51,900Ethanol 29,700
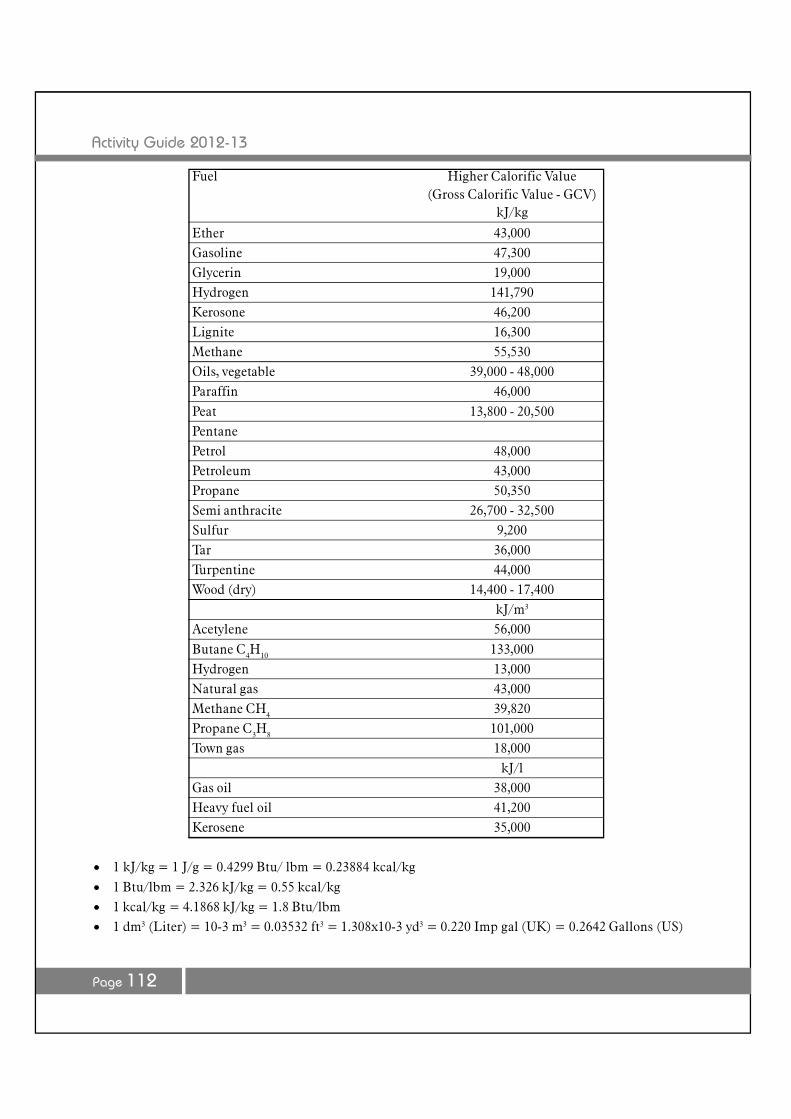
Activity Guide 2012-13
Page 112
Ether 43,000Gasoline 47,300Glycerin 19,000Hydrogen 141,790Kerosone 46,200Lignite 16,300Methane 55,530Oils, vegetable 39,000 - 48,000Paraffin 46,000
Peat 13,800 - 20,500PentanePetrol 48,000Petroleum 43,000Propane 50,350Semi anthracite 26,700 - 32,500Sulfur 9,200Tar 36,000Turpentine 44,000Wood (dry) 14,400 - 17,400
kJ/m3
Acetylene 56,000
Butane C4H10 133,000Hydrogen 13,000Natural gas 43,000Methane CH4 39,820Propane C3H8 101,000Town gas 18,000
kJ/lGas oil 38,000Heavy fuel oil 41,200Kerosene 35,000
1 kJ/kg = 1 J/g = 0.4299 Btu/ lbm = 0.23884 kcal/kg
1 Btu/lbm = 2.326 kJ/kg = 0.55 kcal/kg 1 kcal/kg = 4.1868 kJ/kg = 1.8 Btu/lbm 1 dm3 (Liter) = 10-3 m3 = 0.03532 ft3 = 1.308x10⁻³ yd3 = 0.220 Imp gal (UK) = 0.2642 Gallons (US)
Fuel Higher Calorific Value(Gross Calorific Value - GCV)
kJ/kg
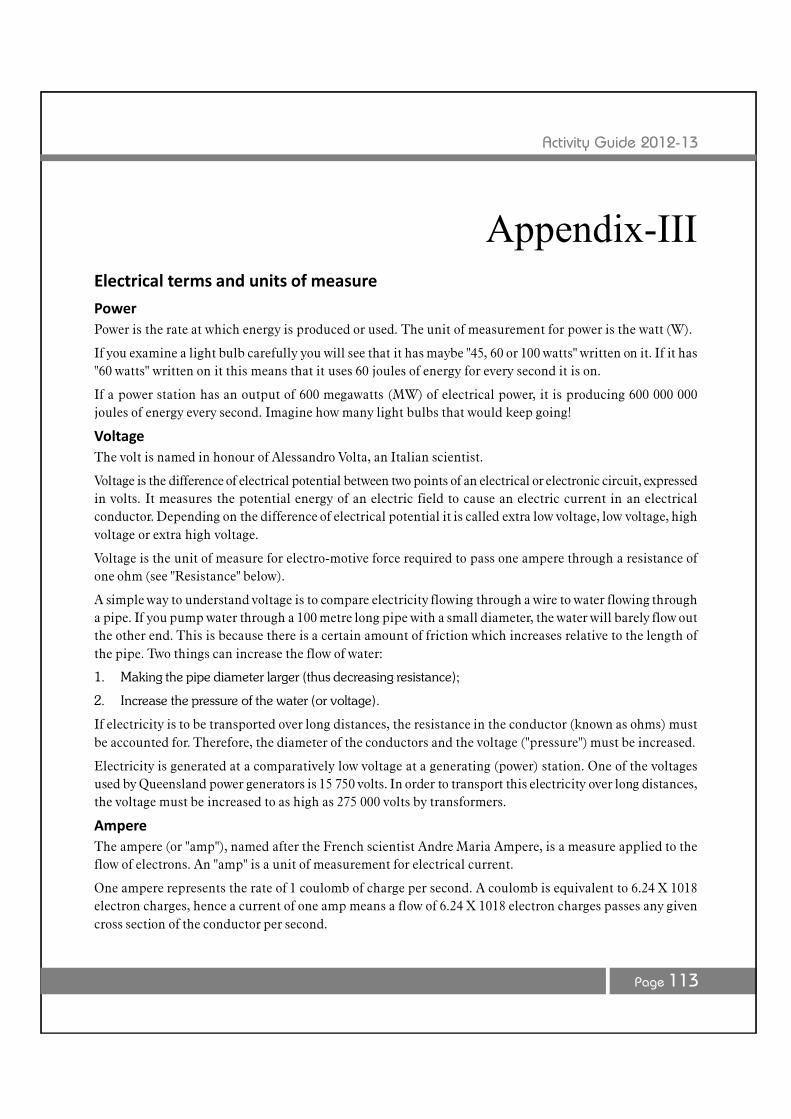
Activity Guide 2012-13
Page 113
Appendix-III
PowerPower is the rate at which energy is produced or used. The unit of measurement for power is the watt (W).
If you examine a light bulb carefully you will see that it has maybe "45, 60 or 100 watts" written on it. If it has"60 watts" written on it this means that it uses 60 joules of energy for every second it is on.
If a power station has an output of 600 megawatts (MW) of electrical power, it is producing 600 000 000joules of energy every second. Imagine how many light bulbs that would keep going!
VoltageThe volt is named in honour of Alessandro Volta, an Italian scientist.
Voltage is the difference of electrical potential between two points of an electrical or electronic circuit, expressedin volts. It measures the potential energy of an electric field to cause an electric current in an electricalconductor. Depending on the difference of electrical potential it is called extra low voltage, low voltage, highvoltage or extra high voltage.
Voltage is the unit of measure for electro-motive force required to pass one ampere through a resistance ofone ohm (see "Resistance" below).
A simple way to understand voltage is to compare electricity flowing through a wire to water flowing througha pipe. If you pump water through a 100 metre long pipe with a small diameter, the water will barely flow outthe other end. This is because there is a certain amount of friction which increases relative to the length ofthe pipe. Two things can increase the flow of water:
1. Making the pipe diameter larger (thus decreasing resistance);
2. Increase the pressure of the water (or voltage).
If electricity is to be transported over long distances, the resistance in the conductor (known as ohms) mustbe accounted for. Therefore, the diameter of the conductors and the voltage ("pressure") must be increased.
Electricity is generated at a comparatively low voltage at a generating (power) station. One of the voltagesused by Queensland power generators is 15 750 volts. In order to transport this electricity over long distances,the voltage must be increased to as high as 275 000 volts by transformers.
AmpereThe ampere (or "amp"), named after the French scientist Andre Maria Ampere, is a measure applied to theflow of electrons. An "amp" is a unit of measurement for electrical current.
One ampere represents the rate of 1 coulomb of charge per second. A coulomb is equivalent to 6.24 X 10¹⁸electron charges, hence a current of one amp means a flow of 6.24 X 10¹⁸ electron charges passes any givencross section of the conductor per second.
Electrical terms and units of measure
Activity Guide 2012-13
Page 114
Resistance ohmThe German scientist Georg Simon Ohm discovered that in any conductor, electrons encounter a resistancewhilst flowing through a circuit. He proved experimentally that the current in a metallic conductor is directlyproportional to the voltage between its ends.
Therefore,
Resistance = Volts / Amperes
The unit of resistance is the volt per ampere. A resistance of one volt per ampere is called one ohm. That is,the resistance of a conductor is one ohm if the voltage between the ends of the conductor is one volt when thecurrent in the conductor is one ampere.
PowerA watt is the unit of electric power. One watt is a measure of the power consumed when a current of one“ampere” flows under a pressure of one “volt”.
Electrical arithmeticOn all electrical appliances you will find the "rating" marked in watts (for example, iron - 600 watts, heater -1 000 watts, lamps - 100 watts. The power taken by any appliance (such as a toaster, heater, kettle etc.) isfound by multiplying the voltage by the current:watts = volts X amperes (Amps)and1000 watts = 1 Kilowatt (kW)1,000,000 watts = 1 Megawatt (MW)
A watt-hour is the amount of energy consumed by an appliance in one hour if it operates at a power of onewatt. A watt-hour is too small a unit for most purposes, so we use the "kilowatt-hour" (kWh), which is equalto 1000 watt-hours. Kilowatt-hours are the units measured by the electricity meter in your home.1 kilowatt hour (kWh) = 1000 watt hours
To find the number of kilowatt-hours used by an appliance in any period, multiply the rating in watts by thenumber of hours in operation and divide by 1000:KWh used = Watts x hours in operation / 1000
The number of hours required for an appliance to use one kilowatt-hour is found by dividing 1000 by therating in watts.Number of hours to use 1KWh = 1000/ Watts rating
Thus, a 1000 watt radiator would take one hour to consume 1 kWh, but a 100 watt lamp would take 10 hours.
When working out how much electricity is used by each appliance in your home, remember that some thingslike electric irons are only using power intermittently, as they are switched on and off either automatically orby hand.
Source : http://www.energex.com.au/switched_on/electric_energy/electric_terms_units.html
Measuring Electricity'Electricity' is not a quantity, so has no unit of measurement. So, what you are probably referring to is 'energy'.The SI unit of energy is the joule (J). An alternative unit, used by electricity utility companies for the purposeof billing its consumers, is the kilowatt hour (kW.h).

Activity Guide 2012-13
Page 115
However, the questioner might be referring to an alternative unit of measurement for energy, the 'unit',which is short for 'Board of Trade Unit' which, in the UK, is the equivalent of a kilowatt hour, and used forbilling consumers (e.g. an electricity bill might be based on a price of '15 pence per unit').
So, 1 unit = 1 kW.h
Other ‘electrical’ units include:
the unit of electrical current (I) is the ampere
the unit of electrical charge (Q) is the coulomb
the unit of potential difference (V) is the volt
the unit of resistance (R) is the ohm
Another unit is a joule, it's the determination of the mechanical equivalent of heat and the joule-thompsoneffect. This effect is the conversion of mechanical, electrical or magnetic energy into heat.
Source : http://wiki.answers.com/Q/What_is_the_unit_used_to_measure_electricityhttp://www.mib.nic.in/writereaddata%5Chtml_en_files%5Cactsrules/act_cas/Digital%20Set%20To%20Box.pdfhttp://www.beeindia.in/schemes/documents/ecbc/eco3/DSM/Energy%20Efficient%20Street%20Lighting%20Guidelines.pdfhttp://www.consumeradvice.in/Download/Instant_WaterHeater.pdfhttp://www.scatmag.com/technical/bis%20specs%20for%20dth%20set%20top%20boxes.pdf
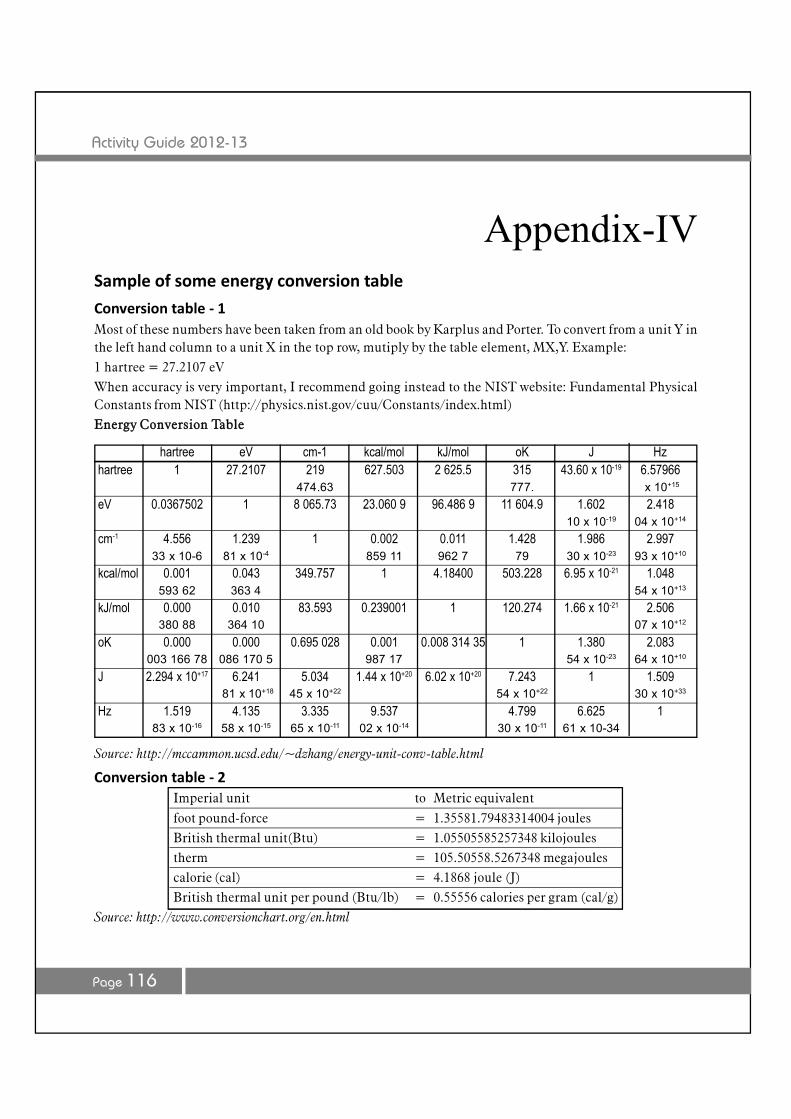
Activity Guide 2012-13
Page 116
Appendix-IV
Conversion table - 1Most of these numbers have been taken from an old book by Karplus and Porter. To convert from a unit Y inthe left hand column to a unit X in the top row, mutiply by the table element, MX,Y. Example:1 hartree = 27.2107 eVWhen accuracy is very important, I recommend going instead to the NIST website: Fundamental PhysicalConstants from NIST (http://physics.nist.gov/cuu/Constants/index.html)Energy Conversion Table
Source: http://mccammon.ucsd.edu/~dzhang/energy-unit-conv-table.html
Conversion table - 2Imperial unit to Metric equivalent
foot pound-force = 1.35581.79483314004 joulesBritish thermal unit(Btu) = 1.05505585257348 kilojoulestherm = 105.50558.5267348 megajoulescalorie (cal) = 4.1868 joule (J)British thermal unit per pound (Btu/lb) = 0.55556 calories per gram (cal/g)
Source: http://www.conversionchart.org/en.html
Sample of some energy conversion table
hartree eV cm-1 kcal/mol kJ/mol oK J Hzhartree 1 27.2107 219 627.503 2 625.5 315 43.60 x 10⁻¹⁹ 6.57966
474.63 777. x 10+15
eV 0.0367502 1 8 065.73 23.060 9 96.486 9 11 604.9 1.602 2.41810 x 10⁻¹⁹ 04 x 10+14
cm-1 4.556 1.239 1 0.002 0.011 1.428 1.986 2.99733 x 10⁻⁶ 81 x 10-4 859 11 962 7 79 30 x 10-23 93 x 10+10
kcal/mol 0.001 0.043 349.757 1 4.18400 503.228 6.95 x 10⁻²¹ 1.048593 62 363 4 54 x 10+13
kJ/mol 0.000 0.010 83.593 0.239001 1 120.274 1.66 x 10⁻²¹ 2.506380 88 364 10 07 x 10+12
oK 0.000 0.000 0.695 028 0.001 0.008 314 35 1 1.380 2.083003 166 78 086 170 5 987 17 54 x 10-23 64 x 10+10
J 2.294 x 10+17 6.241 5.034 1.44 x 10+20 6.02 x 10+20 7.243 1 1.509 81 x 10+18 45 x 10+22 54 x 10+22 30 x 10+33
Hz 1.519 4.135 3.335 9.537 4.799 6.625 183 x 10-16 58 x 10-15 65 x 10-11 02 x 10-14 30 x 10-11 61 x 10-34
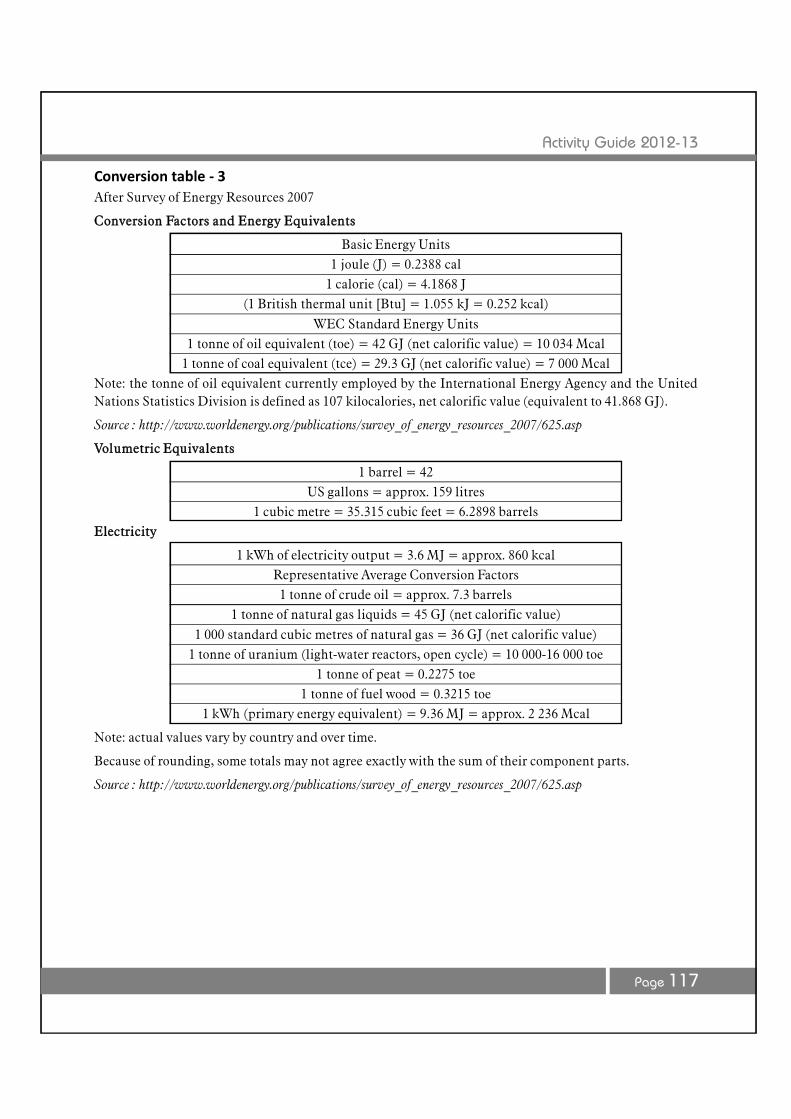
Activity Guide 2012-13
Page 117
Conversion table - 3After Survey of Energy Resources 2007
Conversion Factors and Energy Equivalents
Basic Energy Units1 joule (J) = 0.2388 cal
1 calorie (cal) = 4.1868 J(1 British thermal unit [Btu] = 1.055 kJ = 0.252 kcal)
WEC Standard Energy Units1 tonne of oil equivalent (toe) = 42 GJ (net calorific value) = 10 034 Mcal
1 tonne of coal equivalent (tce) = 29.3 GJ (net calorific value) = 7 000 McalNote: the tonne of oil equivalent currently employed by the International Energy Agency and the UnitedNations Statistics Division is defined as 107 kilocalories, net calorific value (equivalent to 41.868 GJ).
Source : http://www.worldenergy.org/publications/survey_of_energy_resources_2007/625.asp
Volumetric Equivalents
1 barrel = 42US gallons = approx. 159 litres
1 cubic metre = 35.315 cubic feet = 6.2898 barrelsElectricity
1 kWh of electricity output = 3.6 MJ = approx. 860 kcalRepresentative Average Conversion Factors1 tonne of crude oil = approx. 7.3 barrels
1 tonne of natural gas liquids = 45 GJ (net calorific value)
1 000 standard cubic metres of natural gas = 36 GJ (net calorific value)1 tonne of uranium (light-water reactors, open cycle) = 10 000-16 000 toe
1 tonne of peat = 0.2275 toe1 tonne of fuel wood = 0.3215 toe
1 kWh (primary energy equivalent) = 9.36 MJ = approx. 2 236 Mcal
Note: actual values vary by country and over time.
Because of rounding, some totals may not agree exactly with the sum of their component parts.
Source : http://www.worldenergy.org/publications/survey_of_energy_resources_2007/625.asp
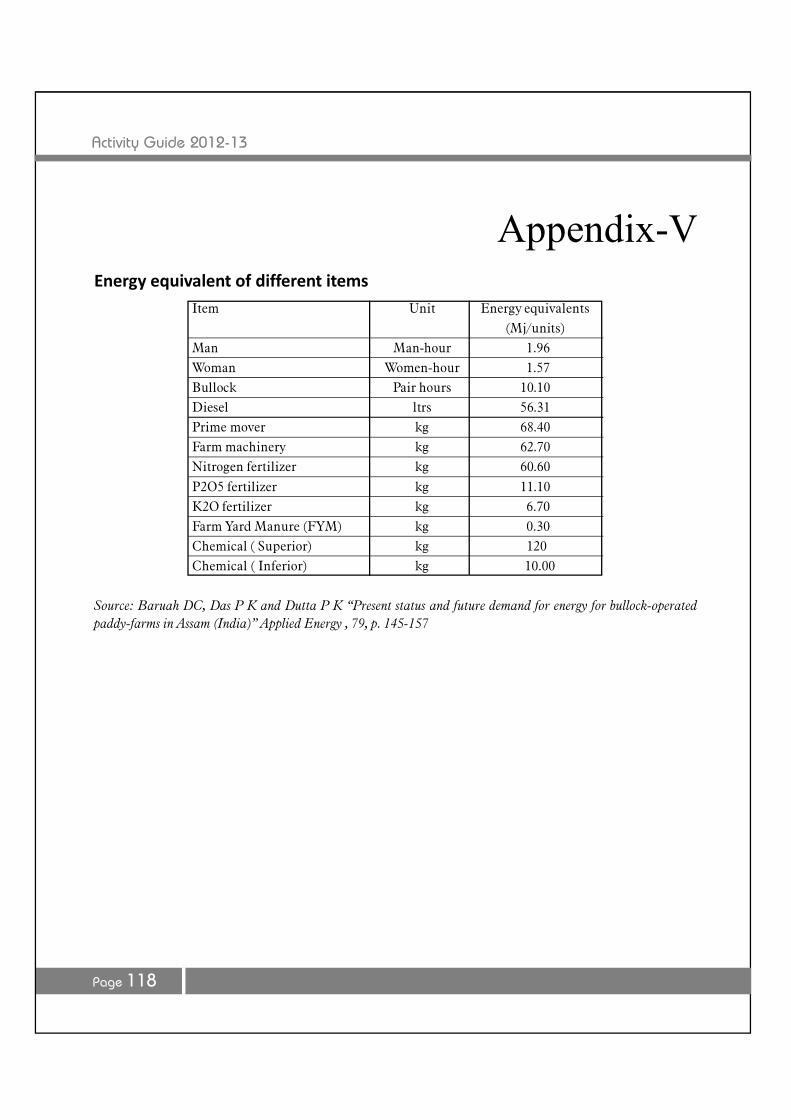
Activity Guide 2012-13
Page 118
Appendix-V
Item Unit Energy equivalents(Mj/units)
Man Man-hour 1.96Woman Women-hour 1.57Bullock Pair hours 10.10Diesel ltrs 56.31Prime mover kg 68.40Farm machinery kg 62.70Nitrogen fertilizer kg 60.60
P2O5 fertilizer kg 11.10K2O fertilizer kg 6.70Farm Yard Manure (FYM) kg 0.30Chemical ( Superior) kg 120Chemical ( Inferior) kg 10.00
Source: Baruah DC, Das P K and Dutta P K “Present status and future demand for energy for bullock-operatedpaddy-farms in Assam (India)” Applied Energy , 79, p. 145-157
Energy equivalent of different items
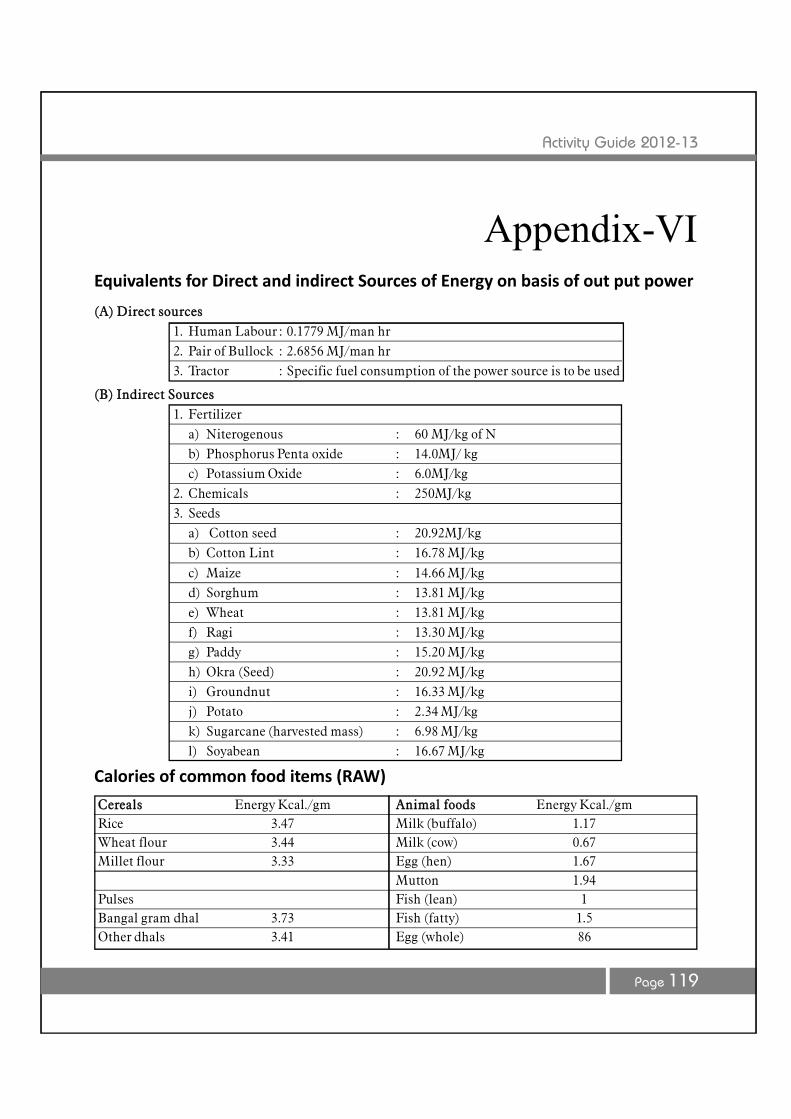
Activity Guide 2012-13
Page 119
Appendix-VIEquivalents for Direct and indirect Sources of Energy on basis of out put power
(A) Direct sources1. Human Labour : 0.1779 MJ/man hr2. Pair of Bullock : 2.6856 MJ/man hr3. Tractor : Specific fuel consumption of the power source is to be used
(B) Indirect Sources1. Fertilizer
a) Niterogenous : 60 MJ/kg of Nb) Phosphorus Penta oxide : 14.0MJ/ kgc) Potassium Oxide : 6.0MJ/kg
2. Chemicals : 250MJ/kg3. Seeds
a) Cotton seed : 20.92MJ/kgb) Cotton Lint : 16.78 MJ/kg
c) Maize : 14.66 MJ/kgd) Sorghum : 13.81 MJ/kge) Wheat : 13.81 MJ/kgf) Ragi : 13.30 MJ/kgg) Paddy : 15.20 MJ/kgh) Okra (Seed) : 20.92 MJ/kgi) Groundnut : 16.33 MJ/kgj) Potato : 2.34 MJ/kgk) Sugarcane (harvested mass) : 6.98 MJ/kgl) Soyabean : 16.67 MJ/kg
Calories of common food items (RAW)
Cereals Energy Kcal./gm Animal foods Energy Kcal./gmRice 3.47 Milk (buffalo) 1.17Wheat flour 3.44 Milk (cow) 0.67Millet flour 3.33 Egg (hen) 1.67
Mutton 1.94Pulses Fish (lean) 1Bangal gram dhal 3.73 Fish (fatty) 1.5Other dhals 3.41 Egg (whole) 86
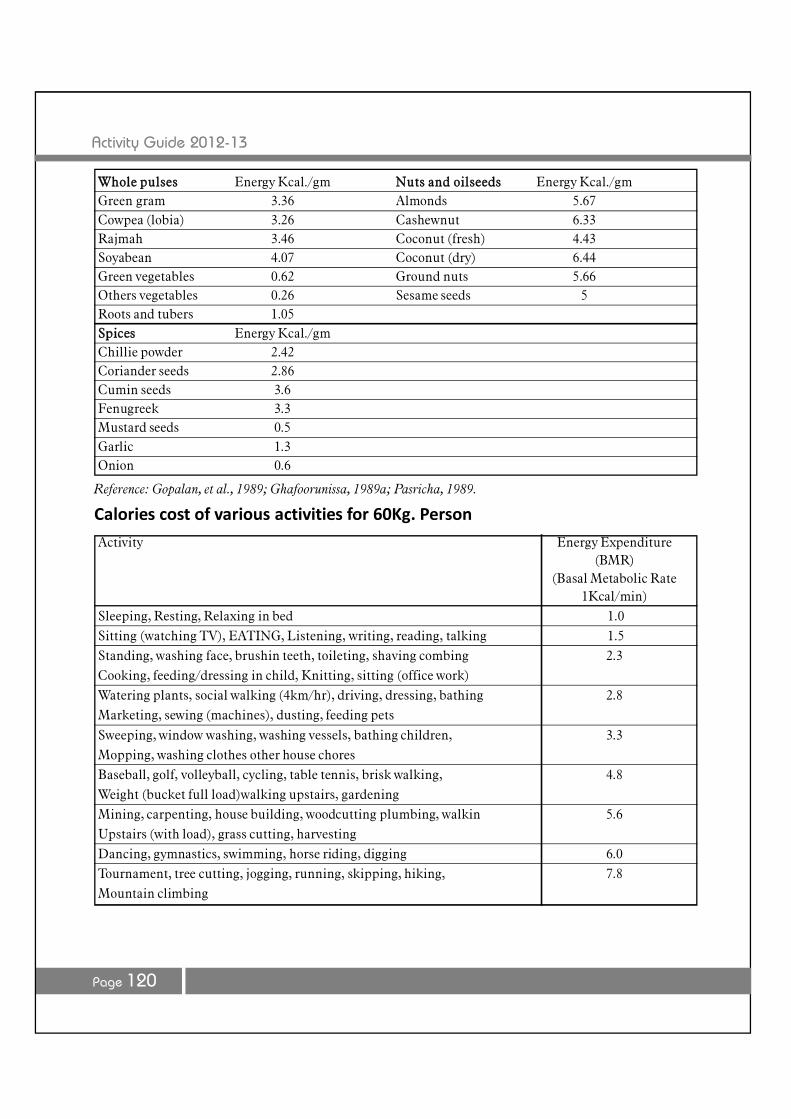
Activity Guide 2012-13
Page 120
Whole pulses Energy Kcal./gm Nuts and oilseeds Energy Kcal./gmGreen gram 3.36 Almonds 5.67Cowpea (lobia) 3.26 Cashewnut 6.33Rajmah 3.46 Coconut (fresh) 4.43Soyabean 4.07 Coconut (dry) 6.44Green vegetables 0.62 Ground nuts 5.66Others vegetables 0.26 Sesame seeds 5Roots and tubers 1.05Spices Energy Kcal./gmChillie powder 2.42Coriander seeds 2.86Cumin seeds 3.6Fenugreek 3.3Mustard seeds 0.5Garlic 1.3Onion 0.6
Reference: Gopalan, et al., 1989; Ghafoorunissa, 1989a; Pasricha, 1989.
Calories cost of various activities for 60Kg. Person
Activity Energy Expenditure(BMR)
(Basal Metabolic Rate1Kcal/min)
Sleeping, Resting, Relaxing in bed 1.0Sitting (watching TV), EATING, Listening, writing, reading, talking 1.5Standing, washing face, brushin teeth, toileting, shaving combing 2.3Cooking, feeding/dressing in child, Knitting, sitting (office work)Watering plants, social walking (4km/hr), driving, dressing, bathing 2.8Marketing, sewing (machines), dusting, feeding pets
Sweeping, window washing, washing vessels, bathing children, 3.3Mopping, washing clothes other house choresBaseball, golf, volleyball, cycling, table tennis, brisk walking, 4.8Weight (bucket full load)walking upstairs, gardeningMining, carpenting, house building, woodcutting plumbing, walkin 5.6Upstairs (with load), grass cutting, harvestingDancing, gymnastics, swimming, horse riding, digging 6.0Tournament, tree cutting, jogging, running, skipping, hiking, 7.8Mountain climbing
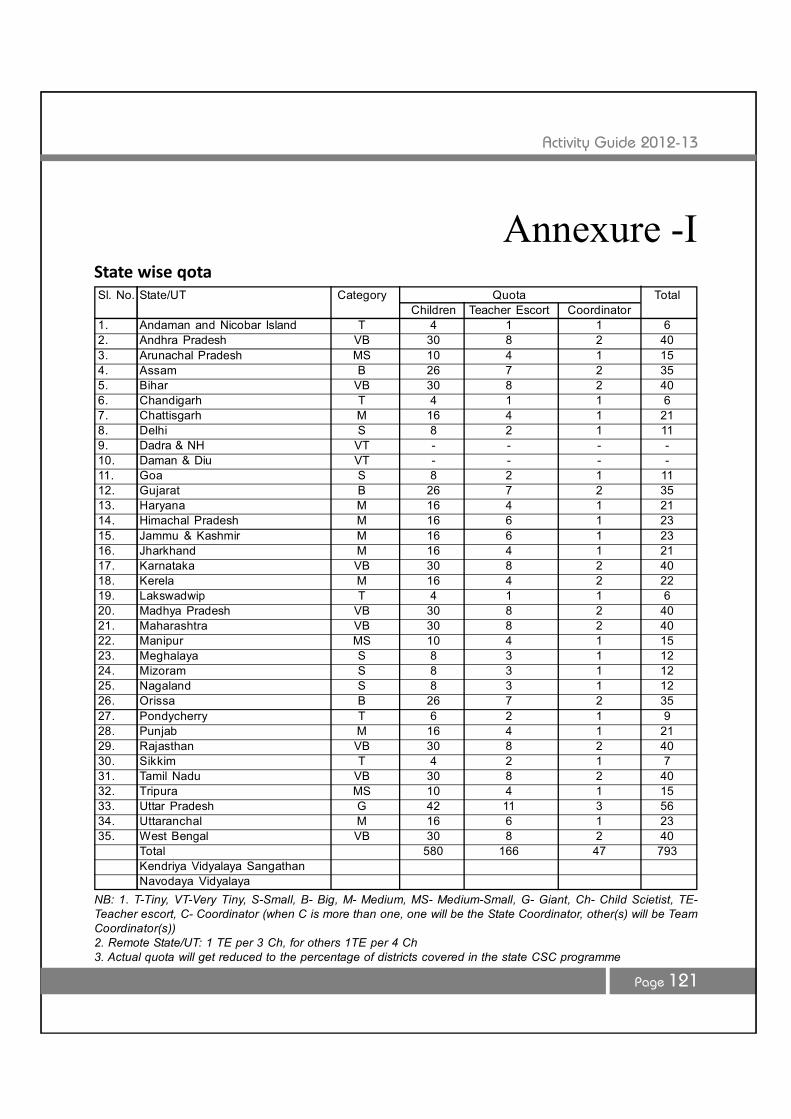
Activity Guide 2012-13
Page 121
Sl. No. State/UT Category Quota TotalChildren Teacher Escort Coordinator
1. Andaman and Nicobar Island T 4 1 1 62. Andhra Pradesh VB 30 8 2 403. Arunachal Pradesh MS 10 4 1 154. Assam B 26 7 2 355. Bihar VB 30 8 2 406. Chandigarh T 4 1 1 67. Chattisgarh M 16 4 1 218. Delhi S 8 2 1 119. Dadra & NH VT - - - -10. Daman & Diu VT - - - -11. Goa S 8 2 1 1112. Gujarat B 26 7 2 3513. Haryana M 16 4 1 2114. Himachal Pradesh M 16 6 1 2315. Jammu & Kashmir M 16 6 1 2316. Jharkhand M 16 4 1 2117. Karnataka VB 30 8 2 4018. Kerela M 16 4 2 2219. Lakswadwip T 4 1 1 620. Madhya Pradesh VB 30 8 2 4021. Maharashtra VB 30 8 2 4022. Manipur MS 10 4 1 1523. Meghalaya S 8 3 1 1224. Mizoram S 8 3 1 1225. Nagaland S 8 3 1 1226. Orissa B 26 7 2 3527. Pondycherry T 6 2 1 928. Punjab M 16 4 1 2129. Rajasthan VB 30 8 2 4030. Sikkim T 4 2 1 731. Tamil Nadu VB 30 8 2 4032. Tripura MS 10 4 1 1533. Uttar Pradesh G 42 11 3 5634. Uttaranchal M 16 6 1 2335. West Bengal VB 30 8 2 40
Total 580 166 47 793Kendriya Vidyalaya SangathanNavodaya Vidyalaya
NB: 1. T-Tiny, VT-Very Tiny, S-Small, B- Big, M- Medium, MS- Medium-Small, G- Giant, Ch- Child Scietist, TE-Teacher escort, C- Coordinator (when C is more than one, one will be the State Coordinator, other(s) will be TeamCoordinator(s))2. Remote State/UT: 1 TE per 3 Ch, for others 1TE per 4 Ch3. Actual quota will get reduced to the percentage of districts covered in the state CSC programme
Annexure -IState wise qota

Activity Guide 2012-13
Page 122
Annexure -IIState Co-ordinators1. Andaman & Nicobar Islands 2. Andhra Pradesh
Shri S.K. Sinha Prof. Y. Nagesh KumarAndaman Nature Club, C/O DEO (Science), Member SecretaryShiksha Sadan, Link Road, Port Blair, A.P. Council of Science & Technology, 12thA & N Islands 744101 Floor, Eastern Wing, Gaganvihar, M.J. Road,
Nampally, Hyderabad, Andhra Pradesh 500001Phone: 03192 (O) 250794; (M) 9332408522 Phone: 040 (O) 24619675, 24600590;
(M) 9849908663E-mail: [email protected] E-mail: [email protected],
3. Arunachal Pradesh 4. AssamShri Debajit Mahanta Er. Romen GogoiSr. Scientific Officer C/o Assam Science Technology & EnvironmentArunachal Pradesh State Council for S&T, Council, Bigyan Bhawan, Near IDBI Building,Vivek Vihar, Itanagar, 791113 GS Road, Guwahati 781 005Phone: 0360 (O) 2290833; (M) 9436059843 Phone: 0361 (O) 2450147/646; (M) 9435052123E-mail: [email protected] E-mail: [email protected]; romengogoi.jorhat@
gmail.com, [email protected]
5. Bihar 6. ChandigarhShri Sri Ram Pandey Mr. N.K. JhinganHM PresidentScience For Society, C/O Deptt. of Chemistry, Environment Society of India, Karuna Sadan,Science College, Patna University, Patna 800005 Sector - 11, Chandigarh 160017Phone: 0612 (O) 2683343; (M) 9835245590 Phone: 0172 (O) 2746832; (M) 9417004937E-mail: [email protected], E-mail: [email protected]
7. Chattisgarh 8. Daman & Diu DamanProf. M.M. Hambarde Shri B.S. ShrimaliDirector General Directorate of Education, U.T. AdministrationChattisgarh Council for S&T, Raipur, of Daman & Diu, Nani, Daman - 396210Chattisgarh 492001Phone: 0771 (O) 2434569; (M) 9893497889 Phone: 0260 (O) 2230550; (M) 9824767226E-mail: [email protected]; E-mail: [email protected]
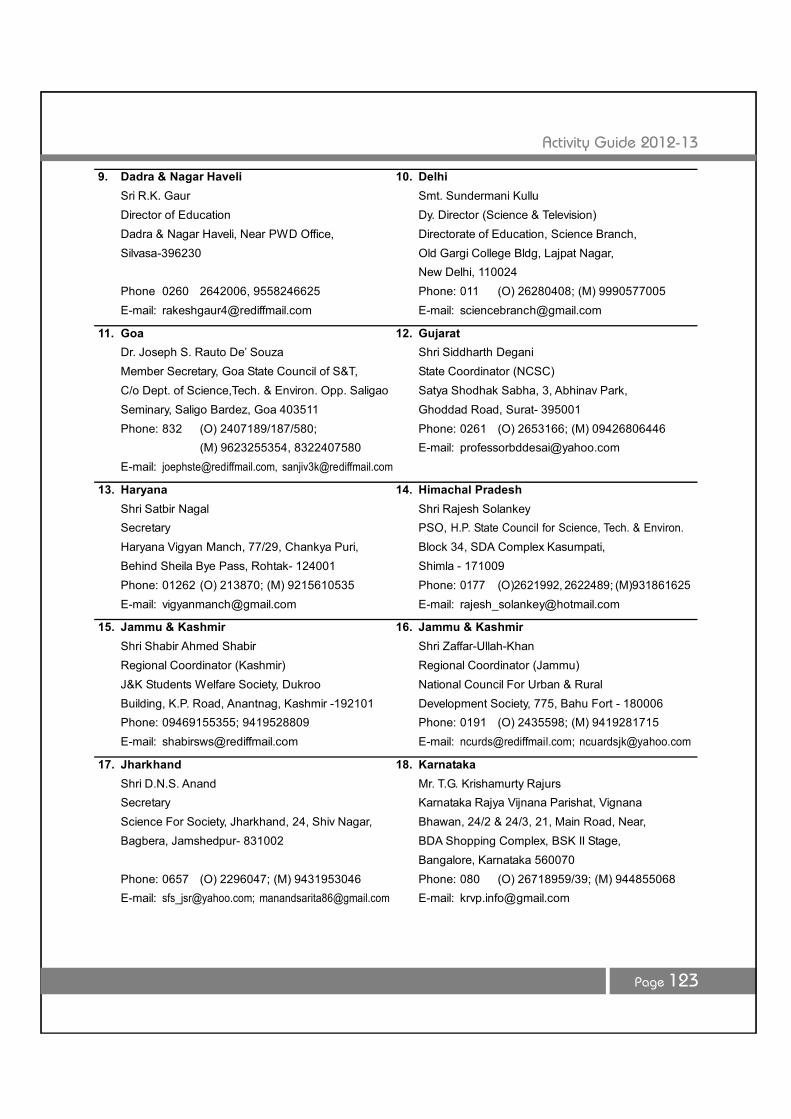
Activity Guide 2012-13
Page 123
9. Dadra & Nagar Haveli 10. DelhiSri R.K. Gaur Smt. Sundermani KulluDirector of Education Dy. Director (Science & Television)Dadra & Nagar Haveli, Near PWD Office, Directorate of Education, Science Branch,Silvasa-396230 Old Gargi College Bldg, Lajpat Nagar,
New Delhi, 110024Phone 0260 2642006, 9558246625 Phone: 011 (O) 26280408; (M) 9990577005E-mail: [email protected] E-mail: [email protected]
11. Goa 12. GujaratDr. Joseph S. Rauto De’ Souza Shri Siddharth DeganiMember Secretary, Goa State Council of S&T, State Coordinator (NCSC)C/o Dept. of Science,Tech. & Environ. Opp. Saligao Satya Shodhak Sabha, 3, Abhinav Park,Seminary, Saligo Bardez, Goa 403511 Ghoddad Road, Surat- 395001Phone: 832 (O) 2407189/187/580; Phone: 0261 (O) 2653166; (M) 09426806446
(M) 9623255354, 8322407580 E-mail: [email protected]: [email protected], [email protected]
13. Haryana 14. Himachal PradeshShri Satbir Nagal Shri Rajesh SolankeySecretary PSO, H.P. State Council for Science, Tech. & Environ.Haryana Vigyan Manch, 77/29, Chankya Puri, Block 34, SDA Complex Kasumpati,Behind Sheila Bye Pass, Rohtak- 124001 Shimla - 171009Phone: 01262 (O) 213870; (M) 9215610535 Phone: 0177 (O)2621992, 2622489; (M)931861625E-mail: [email protected] E-mail: [email protected]
15. Jammu & Kashmir 16. Jammu & KashmirShri Shabir Ahmed Shabir Shri Zaffar-Ullah-KhanRegional Coordinator (Kashmir) Regional Coordinator (Jammu)J&K Students Welfare Society, Dukroo National Council For Urban & RuralBuilding, K.P. Road, Anantnag, Kashmir -192101 Development Society, 775, Bahu Fort - 180006Phone: 09469155355; 9419528809 Phone: 0191 (O) 2435598; (M) 9419281715E-mail: [email protected] E-mail: [email protected]; [email protected]
17. Jharkhand 18. KarnatakaShri D.N.S. Anand Mr. T.G. Krishamurty RajursSecretary Karnataka Rajya Vijnana Parishat, VignanaScience For Society, Jharkhand, 24, Shiv Nagar, Bhawan, 24/2 & 24/3, 21, Main Road, Near,Bagbera, Jamshedpur- 831002 BDA Shopping Complex, BSK II Stage,
Bangalore, Karnataka 560070Phone: 0657 (O) 2296047; (M) 9431953046 Phone: 080 (O) 26718959/39; (M) 944855068E-mail: [email protected]; [email protected] E-mail: [email protected]

Activity Guide 2012-13
Page 124
19. Kerela 20. LakshadweepShri K. Thankappan Shri L.P. PookoyaHon. Exe. Director Technical OfficerThe Jawahar Bal Bhawan, Shastri Junction, Department of Science & Technology, U.T. ofKollan, Kerala 691001 Lakshadweep, Kavaratti-682555Phone: 0474 (O) 2744365; (M) 9495474915 Phone: 04896 (O) 262005; (M) 9446370881E-mail: [email protected], [email protected] E-mail: [email protected]
21. Madhya Pradesh 22. MaharashtraMs. Sandhya Verma Shri Kishore RajeScience Centre (Gwalior), 1A DK2. Danish Jidnyasa Trust, Thane, 14, Suyash Society,Kunj, Kolar Road, Bhopal,Madhya Pradesh Mahatma Gandhi Road, Naupada, Thane-400602Phone: 0755 (O) 2495327; (M) 9425049756 Phone: 022 (O) 25403857; (M) 9423638940E-mail: [email protected] E-mail: [email protected]
23. Manipur 24. MeghalayaDr. H Manoranjan Shri C.P. SiyemState Coordinator, NCSC State Coordinator, NCSCScience Teachers' Forum, Manipur, B.T. Road, Meghalaya State Council Science, Tech. andPost Box No.61, Manipur Public Library Environment, Dhankheti, Shillong, 793001Complex, Imphal, Manipur 795001 Phone: 364 (O) 2505511,2223795;Phone: 385 (O) 2458317; (M) 862908232 (M) 9436117517, 9436307170E-mail: [email protected] E-mail: [email protected],
25. Mizoram 26. NagalandShri V. L. Malsawma Shri Santu ThapaState Coordinator, NCSC State Coordinator, NCSCScience Teachers' Association, Dr. Vanlalzhara Nagaland Institute of Health Environment andBuilding (Top Floor) Peter Street, Khatla, Social Welfare, Moses Complex, S-2/NSFAizawl-796001 Martyr's Park, Upper PWDKohima, 797001Phone: 0389 (O) 2334897, 2334902; (M) 9436366868 Phone: 0370 (O) 2245619; (M) 9436003192,E-mail: [email protected], 974415175
[email protected] E-mail: [email protected]
27. Odisha 28. PuducherryDr. R.N. Ray Dr. T.P. RaghunathHony. Secretary State Coordinator, NCSCBharat Jan Gyan Vigyan Samiti, N-3/309, Pondicherry Science Forum, No. 10, II Street,IRC Village, Bhubaneshwar, Orissa 751015 Reddiarpalayam, Pondicherry 605010Phone: 0674 (O) 6532523; (M) 9437631557 Phone: 0413 (O) 2290733; (M) 9443225288E-mail: [email protected] E-mail: [email protected]
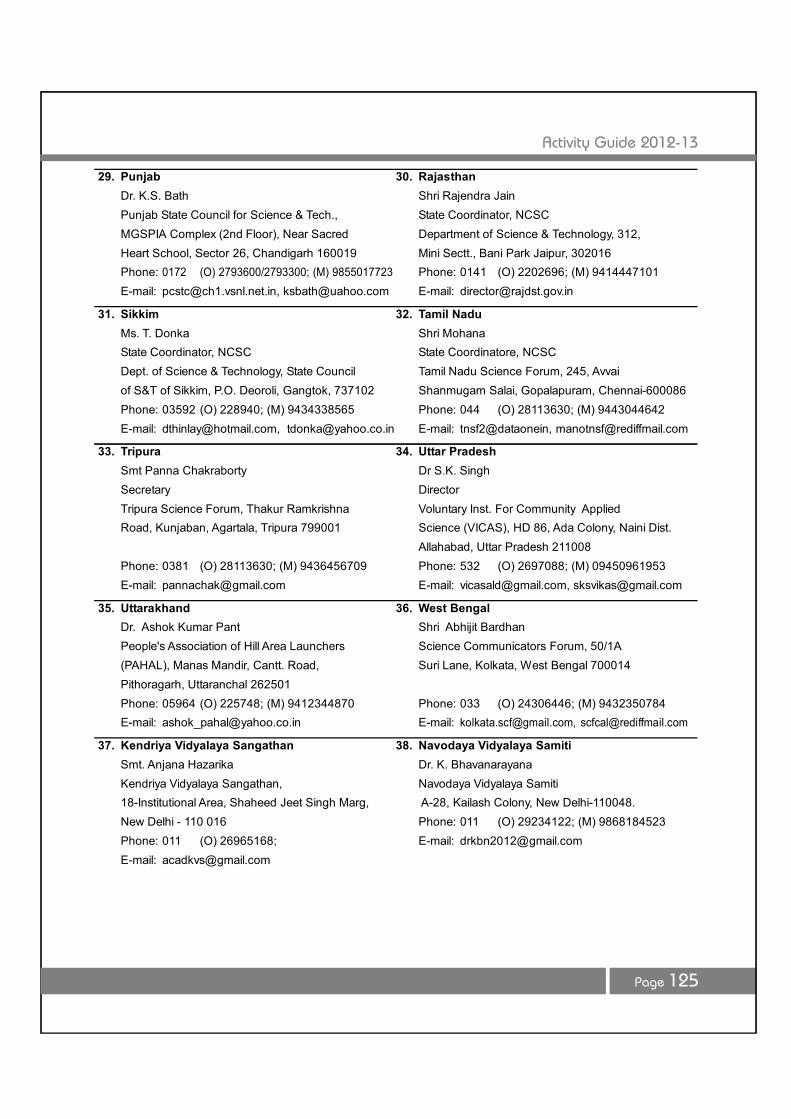
Activity Guide 2012-13
Page 125
29. Punjab 30. RajasthanDr. K.S. Bath Shri Rajendra JainPunjab State Council for Science & Tech., State Coordinator, NCSCMGSPIA Complex (2nd Floor), Near Sacred Department of Science & Technology, 312,Heart School, Sector 26, Chandigarh 160019 Mini Sectt., Bani Park Jaipur, 302016Phone: 0172 (O) 2793600/2793300; (M) 9855017723 Phone: 0141 (O) 2202696; (M) 9414447101E-mail: [email protected], [email protected] E-mail: [email protected]
31. Sikkim 32. Tamil NaduMs. T. Donka Shri MohanaState Coordinator, NCSC State Coordinatore, NCSCDept. of Science & Technology, State Council Tamil Nadu Science Forum, 245, Avvaiof S&T of Sikkim, P.O. Deoroli, Gangtok, 737102 Shanmugam Salai, Gopalapuram, Chennai-600086Phone: 03592 (O) 228940; (M) 9434338565 Phone: 044 (O) 28113630; (M) 9443044642E-mail: [email protected], [email protected] E-mail: tnsf2@dataonein, [email protected]
33. Tripura 34. Uttar PradeshSmt Panna Chakraborty Dr S.K. SinghSecretary DirectorTripura Science Forum, Thakur Ramkrishna Voluntary Inst. For Community AppliedRoad, Kunjaban, Agartala, Tripura 799001 Science (VICAS), HD 86, Ada Colony, Naini Dist.
Allahabad, Uttar Pradesh 211008Phone: 0381 (O) 28113630; (M) 9436456709 Phone: 532 (O) 2697088; (M) 09450961953E-mail: [email protected] E-mail: [email protected], [email protected]
35. Uttarakhand 36. West BengalDr. Ashok Kumar Pant Shri Abhijit BardhanPeople's Association of Hill Area Launchers Science Communicators Forum, 50/1A(PAHAL), Manas Mandir, Cantt. Road, Suri Lane, Kolkata, West Bengal 700014Pithoragarh, Uttaranchal 262501Phone: 05964 (O) 225748; (M) 9412344870 Phone: 033 (O) 24306446; (M) 9432350784E-mail: [email protected] E-mail: [email protected], [email protected]
37. Kendriya Vidyalaya Sangathan 38. Navodaya Vidyalaya SamitiSmt. Anjana Hazarika Dr. K. BhavanarayanaKendriya Vidyalaya Sangathan, Navodaya Vidyalaya Samiti18-Institutional Area, Shaheed Jeet Singh Marg, A-28, Kailash Colony, New Delhi-110048.New Delhi - 110 016 Phone: 011 (O) 29234122; (M) 9868184523Phone: 011 (O) 26965168; E-mail: [email protected]: [email protected]
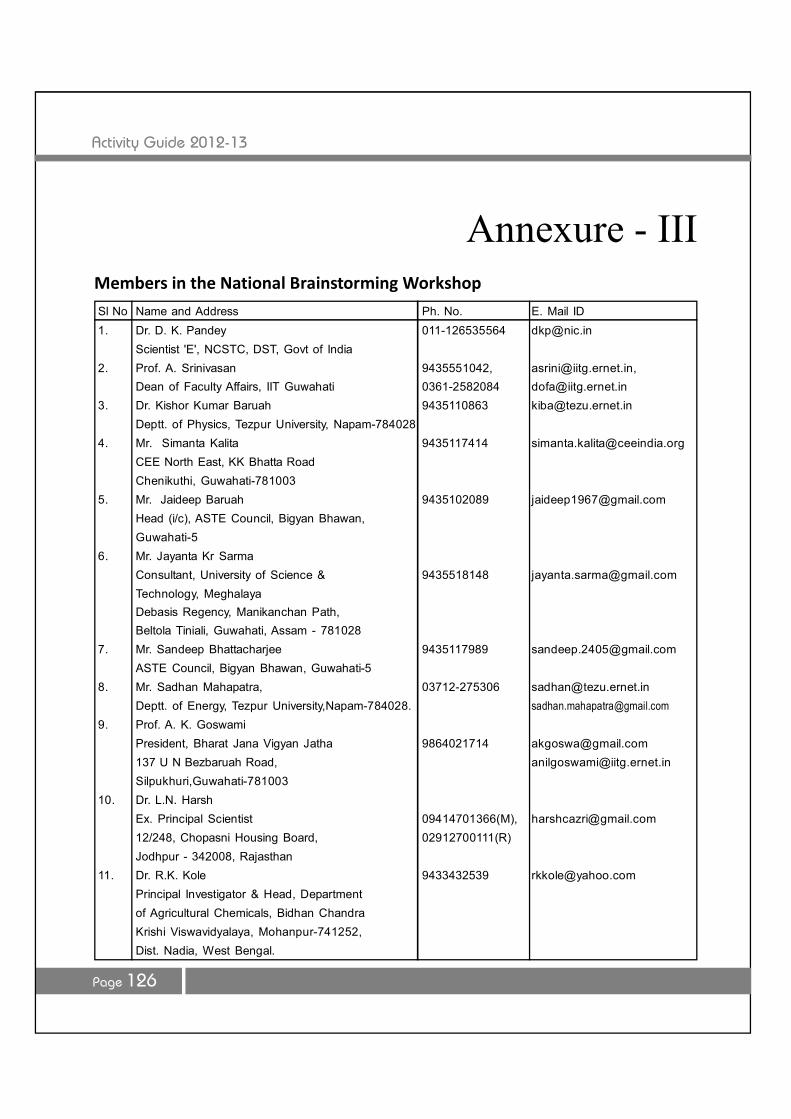
Activity Guide 2012-13
Page 126
Annexure - IIIMembers in the National Brainstorming WorkshopSl No Name and Address Ph. No. E. Mail ID1. Dr. D. K. Pandey 011-126535564 [email protected]
Scientist 'E', NCSTC, DST, Govt of India2. Prof. A. Srinivasan 9435551042, [email protected],
Dean of Faculty Affairs, IIT Guwahati 0361-2582084 [email protected]. Dr. Kishor Kumar Baruah 9435110863 [email protected]
Deptt. of Physics, Tezpur University, Napam-7840284. Mr. Simanta Kalita 9435117414 [email protected]
CEE North East, KK Bhatta RoadChenikuthi, Guwahati-781003
5. Mr. Jaideep Baruah 9435102089 [email protected] (i/c), ASTE Council, Bigyan Bhawan,Guwahati-5
6. Mr. Jayanta Kr SarmaConsultant, University of Science & 9435518148 [email protected], MeghalayaDebasis Regency, Manikanchan Path,Beltola Tiniali, Guwahati, Assam - 781028
7. Mr. Sandeep Bhattacharjee 9435117989 [email protected] Council, Bigyan Bhawan, Guwahati-5
8. Mr. Sadhan Mahapatra, 03712-275306 [email protected]. of Energy, Tezpur University,Napam-784028. [email protected]
9. Prof. A. K. GoswamiPresident, Bharat Jana Vigyan Jatha 9864021714 [email protected] U N Bezbaruah Road, [email protected],Guwahati-781003
10. Dr. L.N. HarshEx. Principal Scientist 09414701366(M), [email protected]/248, Chopasni Housing Board, 02912700111(R)Jodhpur - 342008, Rajasthan
11. Dr. R.K. Kole 9433432539 [email protected] Investigator & Head, Departmentof Agricultural Chemicals, Bidhan ChandraKrishi Viswavidyalaya, Mohanpur-741252,Dist. Nadia, West Bengal.

Activity Guide 2012-13
Page 127
12. Dr. P. Pramod 0422 2657103 [email protected]. Scientist, Salim Ali Centre for Ornithology andNatural History, Anaikatty, PO., Coimbatore-641108
13. Dr. Subhas Chandra Samanta 09474504308, [email protected], Bidhannagar, Midnapore-721101 08900359737
14. Shri U.N. Ravi Kumar 0821-2544014 [email protected] 37, III Main, Bogadhi II stg, Mysore,Karnataka-570026
15. Prof. S.P. Verma,Chairman, NCSTC-Network (O): 0612-2683343, [email protected] of Chemistry, Panta University, (R): 2661932Patna, Bihar-800005 9835245590
16. Dr. R.N. Ray 0674-6532523N/3-309, IRC Village, Bhubaneswar, Odisha-751015
17. Dr. Lalit Sharma 9322264173 [email protected]/1:1, Sector 3, Sampada, Navi Mumbai-400705
18. Dr. Pulin Bihari Chakraborty, 033-24220080 [email protected] of Soil & Water Conservation,BCKV, Mohanpur, Kolkata -741252
19. Dr. E. Kunhikrishnan 9447653786 [email protected] 1/2021, Jayamanju, KamarapuramTrivandrum-695011
20. Sheeraz Kirmani 011 26122222, sheeraz.kirmani@Lecturer, Dept of Energy & Environment, 26139110/011, teriuniversity.ac.inTeri University, Plot No.10, Institutional Fax:011 26122874,Area, Vasant Kunj, New Delhi-110070. (M): 09953707456
21. Dr. H.C. Pradhan, 9867050422 [email protected](formerly Centre Director and SeniorProfessor, Homi Bhabha Centre forScience Education, TIFR, Mumbai)Senior Scientist, UM-DAE Centre forExcellence in Basic Sciences,University of MumbaiVidyanagari Campus, Mumbai 400098
22. Dr. V.P. Singh 9818102115 [email protected] 36, Vishwa Appartments, Sector 9,(Near Gurudwara) Delhi-110085
23. Mr. Ranjan Kumar SwainProfessor, Indira Gandhi Institute of 9861441728 [email protected],Technology, Sarang [email protected] No.-DR-13, IGIT Campus, IGIT,Sarang, Dhenkanal Orissa-759146
Sl No Name and Address Ph. No. E. Mail ID
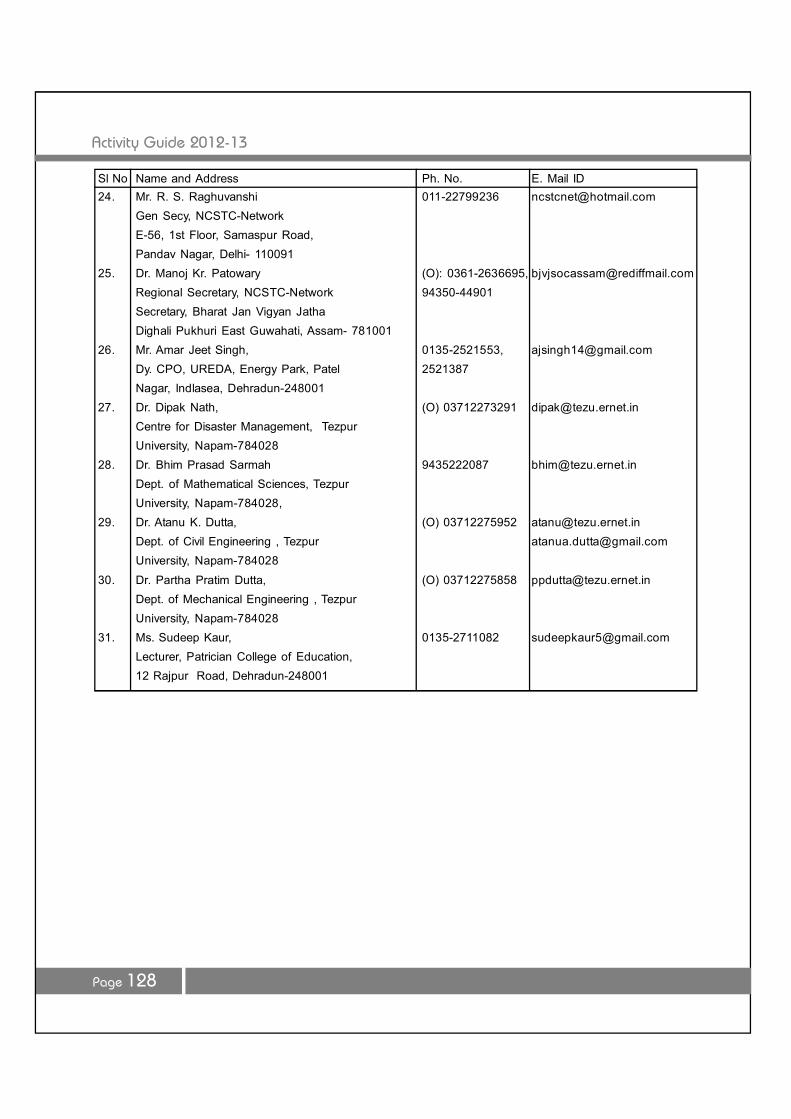
Activity Guide 2012-13
Page 128
24. Mr. R. S. Raghuvanshi 011-22799236 [email protected] Secy, NCSTC-NetworkE-56, 1st Floor, Samaspur Road,Pandav Nagar, Delhi- 110091
25. Dr. Manoj Kr. Patowary (O): 0361-2636695, [email protected] Secretary, NCSTC-Network 94350-44901Secretary, Bharat Jan Vigyan JathaDighali Pukhuri East Guwahati, Assam- 781001
26. Mr. Amar Jeet Singh, 0135-2521553, [email protected]. CPO, UREDA, Energy Park, Patel 2521387Nagar, Indlasea, Dehradun-248001
27. Dr. Dipak Nath, (O) 03712273291 [email protected] for Disaster Management, TezpurUniversity, Napam-784028
28. Dr. Bhim Prasad Sarmah 9435222087 [email protected]. of Mathematical Sciences, TezpurUniversity, Napam-784028,
29. Dr. Atanu K. Dutta, (O) 03712275952 [email protected]. of Civil Engineering , Tezpur [email protected], Napam-784028
30. Dr. Partha Pratim Dutta, (O) 03712275858 [email protected]. of Mechanical Engineering , TezpurUniversity, Napam-784028
31. Ms. Sudeep Kaur, 0135-2711082 [email protected], Patrician College of Education,12 Rajpur Road, Dehradun-248001
Sl No Name and Address Ph. No. E. Mail ID
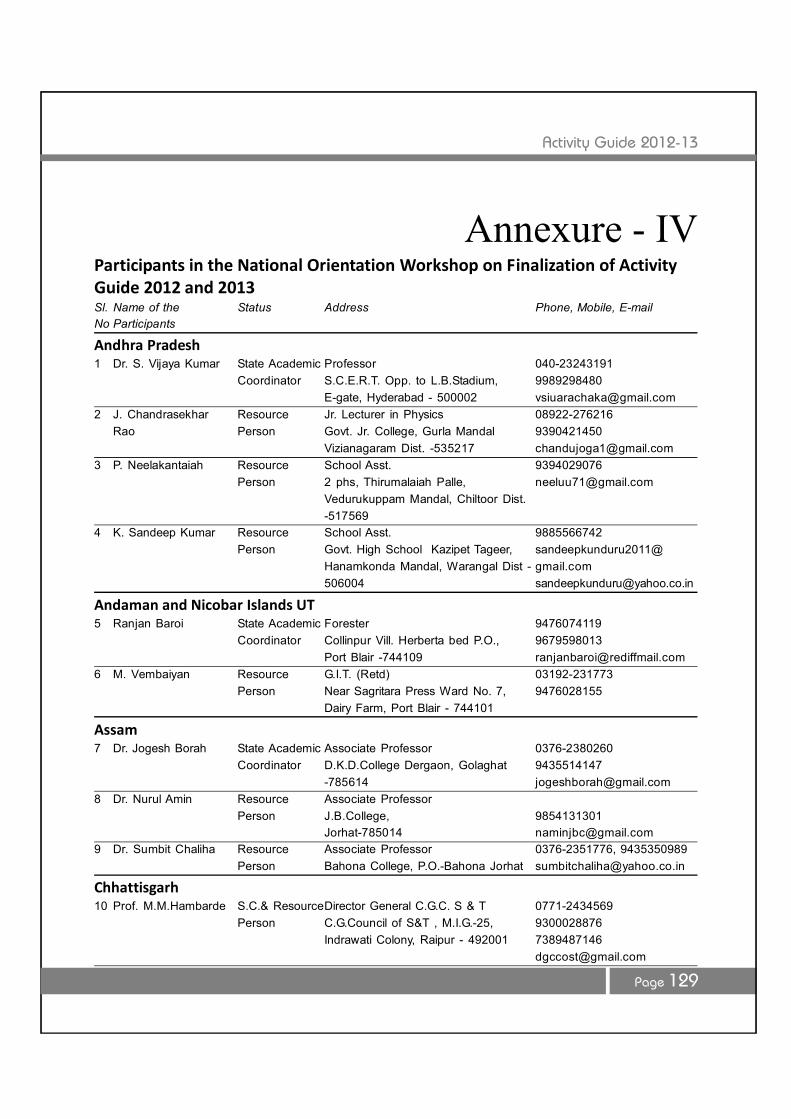
Activity Guide 2012-13
Page 129
Sl. Name of the Status Address Phone, Mobile, E-mailNo Participants
Andhra Pradesh1 Dr. S. Vijaya Kumar State Academic Professor 040-23243191
Coordinator S.C.E.R.T. Opp. to L.B.Stadium, 9989298480E-gate, Hyderabad - 500002 [email protected]
2 J. Chandrasekhar Resource Jr. Lecturer in Physics 08922-276216Rao Person Govt. Jr. College, Gurla Mandal 9390421450
Vizianagaram Dist. -535217 [email protected] P. Neelakantaiah Resource School Asst. 9394029076
Person 2 phs, Thirumalaiah Palle, [email protected] Mandal, Chiltoor Dist.-517569
4 K. Sandeep Kumar Resource School Asst. 9885566742Person Govt. High School Kazipet Tageer, sandeepkunduru2011@
Hanamkonda Mandal, Warangal Dist - gmail.com506004 [email protected]
Andaman and Nicobar Islands UT5 Ranjan Baroi State Academic Forester 9476074119
Coordinator Collinpur Vill. Herberta bed P.O., 9679598013Port Blair -744109 [email protected]
6 M. Vembaiyan Resource G.I.T. (Retd) 03192-231773Person Near Sagritara Press Ward No. 7, 9476028155
Dairy Farm, Port Blair - 744101
Assam7 Dr. Jogesh Borah State Academic Associate Professor 0376-2380260
Coordinator D.K.D.College Dergaon, Golaghat 9435514147-785614 [email protected]
8 Dr. Nurul Amin Resource Associate ProfessorPerson J.B.College, 9854131301
Jorhat-785014 [email protected] Dr. Sumbit Chaliha Resource Associate Professor 0376-2351776, 9435350989
Person Bahona College, P.O.-Bahona Jorhat [email protected]
Chhattisgarh10 Prof. M.M.Hambarde S.C.& ResourceDirector General C.G.C. S & T 0771-2434569
Person C.G.Council of S&T , M.I.G.-25, 9300028876Indrawati Colony, Raipur - 492001 7389487146
Annexure - IVParticipants in the National Orientation Workshop on Finalization of ActivityGuide 2012 and 2013
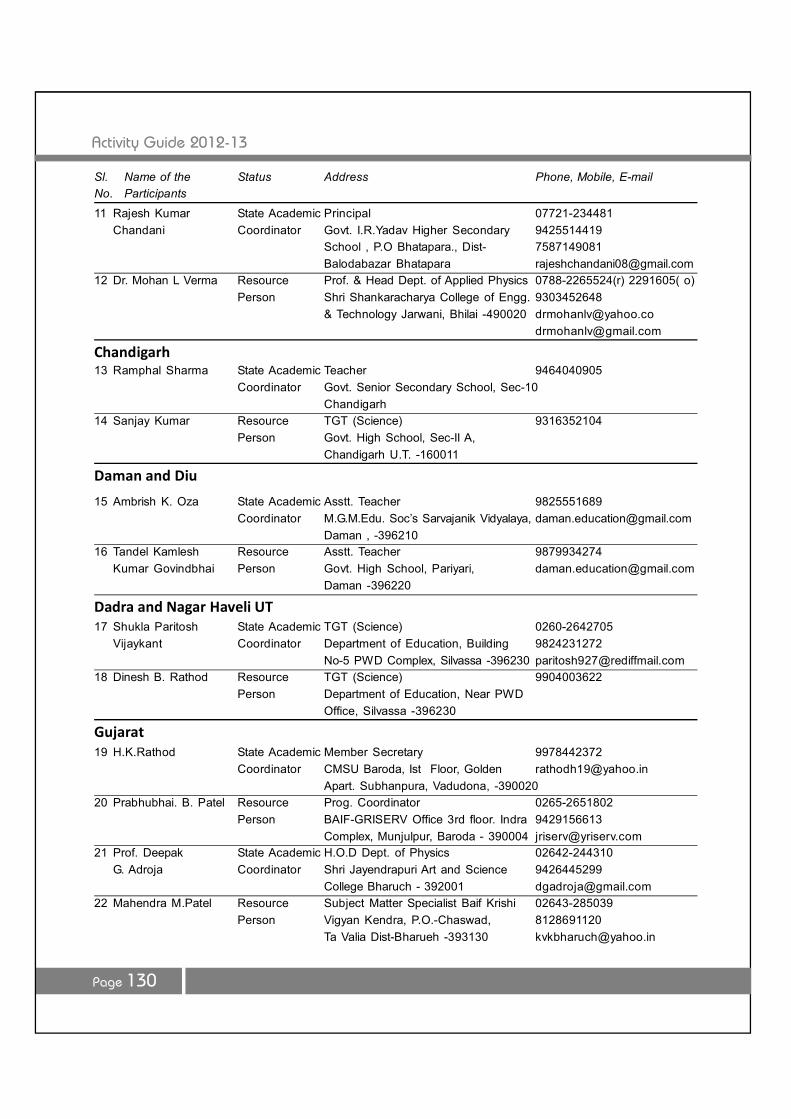
Activity Guide 2012-13
Page 130
11 Rajesh Kumar State Academic Principal 07721-234481Chandani Coordinator Govt. I.R.Yadav Higher Secondary 9425514419
School , P.O Bhatapara., Dist- 7587149081Balodabazar Bhatapara [email protected]
12 Dr. Mohan L Verma Resource Prof. & Head Dept. of Applied Physics 0788-2265524(r) 2291605( o)Person Shri Shankaracharya College of Engg. 9303452648
& Technology Jarwani, Bhilai -490020 [email protected]@gmail.com
Chandigarh13 Ramphal Sharma State Academic Teacher 9464040905
Coordinator Govt. Senior Secondary School, Sec-10Chandigarh
14 Sanjay Kumar Resource TGT (Science) 9316352104Person Govt. High School, Sec-II A,
Chandigarh U.T. -160011
Daman and Diu
15 Ambrish K. Oza State Academic Asstt. Teacher 9825551689Coordinator M.G.M.Edu. Soc’s Sarvajanik Vidyalaya, [email protected]
Daman , -39621016 Tandel Kamlesh Resource Asstt. Teacher 9879934274
Kumar Govindbhai Person Govt. High School, Pariyari, [email protected] -396220
Dadra and Nagar Haveli UT17 Shukla Paritosh State Academic TGT (Science) 0260-2642705
Vijaykant Coordinator Department of Education, Building 9824231272No-5 PWD Complex, Silvassa -396230 [email protected]
18 Dinesh B. Rathod Resource TGT (Science) 9904003622Person Department of Education, Near PWD
Office, Silvassa -396230
Gujarat19 H.K.Rathod State Academic Member Secretary 9978442372
Coordinator CMSU Baroda, Ist Floor, Golden [email protected]. Subhanpura, Vadudona, -390020
20 Prabhubhai. B. Patel Resource Prog. Coordinator 0265-2651802Person BAIF-GRISERV Office 3rd floor. Indra 9429156613
Complex, Munjulpur, Baroda - 390004 [email protected] Prof. Deepak State Academic H.O.D Dept. of Physics 02642-244310
G. Adroja Coordinator Shri Jayendrapuri Art and Science 9426445299College Bharuch - 392001 [email protected]
22 Mahendra M.Patel Resource Subject Matter Specialist Baif Krishi 02643-285039Person Vigyan Kendra, P.O.-Chaswad, 8128691120
Ta Valia Dist-Bharueh -393130 [email protected]
Sl. Name of the Status Address Phone, Mobile, E-mailNo. Participants

Activity Guide 2012-13
Page 131
Goa
23 Melvin D’costa Resource Teacher Grade-1 0832-2374262Person Govt. H.S.S. , Velpoi, Sattari 9326131609
- 403506 [email protected] Roger C.A.Ferrao Resource Teacher Grade-1 0832-2901408
Person St. Xavier’s Higher Secondary School, 9860323817Mapusa Bardez, -403507 [email protected]
Himachal Pradesh25 Manoj Mahajan Resource Lecturer 9418050785
Person GSSS, Jukhala, Dist-Bilaspur prabhukripa.mahajan@ -174033 gmail.com
Jammu and Kashmir26 Kuldeep Gupta State Academic Master 9906078038
Coordinator Govt. High School, Aghartitto, Reasi [email protected] Surjeet Singh Resource Lecturer 9796023564
Person Govt. H.S.School, Basantgarh, Udhri28 Zaffar Ullah Khan Resource Field Assistant. 0191-2435598
Person 775/30, Masjit Basti Bahufast Jambu 9419281715-180006 [email protected]
Jharkhand29 Dr.Kamal Kishore State Academic Scientist 0326-2381159
Sharma Coordinator Coal Preparation Division, 2388284CSIR-Central Institute of Mining and 9431558340Fuel Research, Digwadih Campus, [email protected], Dhanbad, -828108
30 Sumita Shee Resource Zonal Academic Head(East) 0651-2512151Person C/O-Bithika Shee, 20 Green Park, 9234621345
P.O.-Hehal, Ratu Road, Ranchi , [email protected]
Karnataka31 Mustoorappa M.N. State Academic Lecturer 9448857122
Coordinator Govt. P.U. College, Sarvehalli, HonnaliTaluc, Dist.-Daranagere -577224
32 Dr.B.J. Madhu Resource Assistant Professor 9986386233Person Dept. of P.G.Studies in Physics, Govt. [email protected]
Science College, Chitradvrca -57750133 Shiv Kumar.K.S. Resource Science Teacher, Govt. Junior College 9480117720
Person Mallenahally, Chilemagalore(TQ) &(D)34 T.G. Krishnamurty Resource Science Teacher 9448555068
Raj vrs Person Govt. High School, Anoor- [email protected]., Chikmagalore (TQ) & District,
Sl. Name of the Status Address Phone, Mobile, E-mailNo. Participants
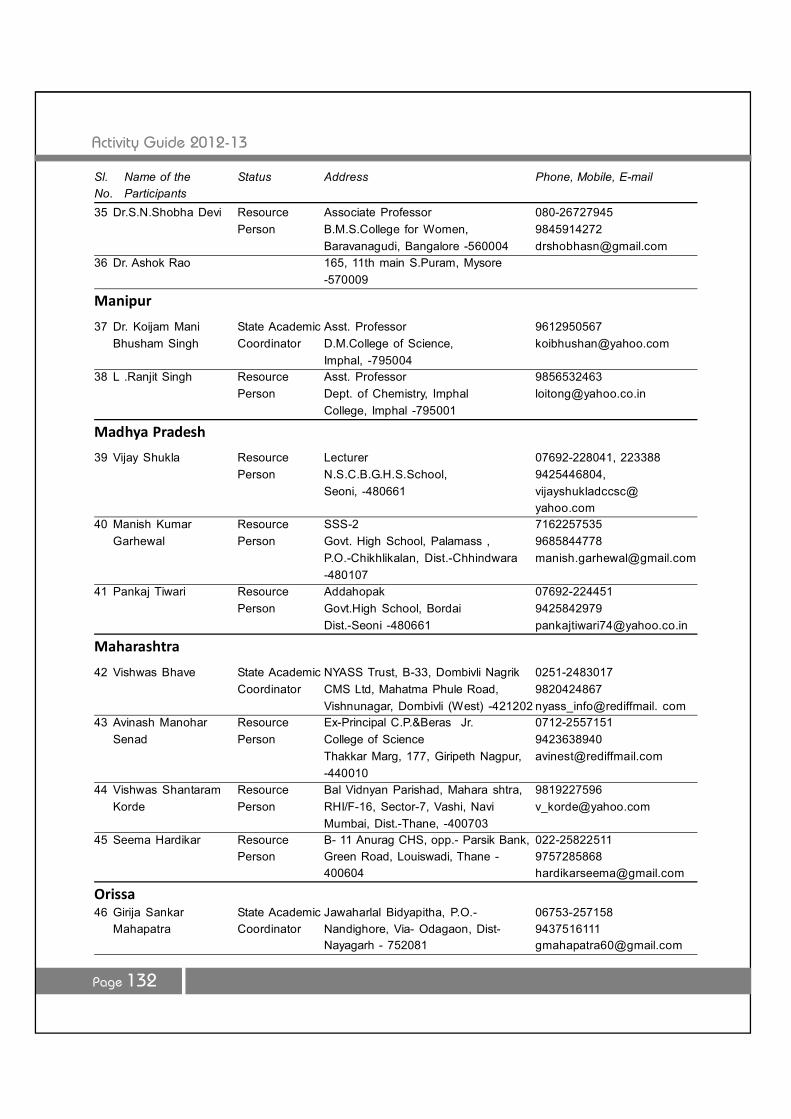
Activity Guide 2012-13
Page 132
35 Dr.S.N.Shobha Devi Resource Associate Professor 080-26727945Person B.M.S.College for Women, 9845914272
Baravanagudi, Bangalore -560004 [email protected] Dr. Ashok Rao 165, 11th main S.Puram, Mysore
-570009
Manipur
37 Dr. Koijam Mani State Academic Asst. Professor 9612950567Bhusham Singh Coordinator D.M.College of Science, [email protected]
Imphal, -79500438 L .Ranjit Singh Resource Asst. Professor 9856532463
Person Dept. of Chemistry, Imphal [email protected], Imphal -795001
Madhya Pradesh
39 Vijay Shukla Resource Lecturer 07692-228041, 223388Person N.S.C.B.G.H.S.School, 9425446804,
Seoni, -480661 [email protected]
40 Manish Kumar Resource SSS-2 7162257535Garhewal Person Govt. High School, Palamass , 9685844778
P.O.-Chikhlikalan, Dist.-Chhindwara [email protected]
41 Pankaj Tiwari Resource Addahopak 07692-224451Person Govt.High School, Bordai 9425842979
Dist.-Seoni -480661 [email protected]
Maharashtra
42 Vishwas Bhave State Academic NYASS Trust, B-33, Dombivli Nagrik 0251-2483017Coordinator CMS Ltd, Mahatma Phule Road, 9820424867
Vishnunagar, Dombivli (West) -421202 nyass_info@rediffmail. com43 Avinash Manohar Resource Ex-Principal C.P.&Beras Jr. 0712-2557151
Senad Person College of Science 9423638940Thakkar Marg, 177, Giripeth Nagpur, [email protected]
44 Vishwas Shantaram Resource Bal Vidnyan Parishad, Mahara shtra, 9819227596Korde Person RHI/F-16, Sector-7, Vashi, Navi [email protected]
Mumbai, Dist.-Thane, -40070345 Seema Hardikar Resource B- 11 Anurag CHS, opp.- Parsik Bank, 022-25822511
Person Green Road, Louiswadi, Thane - 9757285868400604 [email protected]
Orissa46 Girija Sankar State Academic Jawaharlal Bidyapitha, P.O.- 06753-257158
Mahapatra Coordinator Nandighore, Via- Odagaon, Dist- 9437516111Nayagarh - 752081 [email protected]
Sl. Name of the Status Address Phone, Mobile, E-mailNo. Participants

Activity Guide 2012-13
Page 133
47 Dr.Sankar Narayan Resource Teacher 9437660608Beja Person G.K.High School, Subalaya P.O.- sankarnarayanbeja@
H’Burudi Via- Humma Dist.- Ganjam gmail.com-761027
48 Gokul Krishna Panda Resource O/O District Education Officer , 0680—2233350Person Berhanpur, Dist- Gonjoan 9437521249
[email protected] Sudipta Kumar Resource Teacher 9437762086
Mohanty Person N.S.S.M.P.Siksha Niketan, P.O.- smohanty1968@gmail. comNabaghanpur Dist- Nayagarh -752070
Punjab50 Vijay Kumar Sharma State Academic Subject Expert Physics 0172-2780141
Coordinator State Institute of Science Education 9417185426Punjab SCO 66- 67 Sector 17- A, [email protected] - 160017
51 Surinder Singh Resource Lecturer in Physics 01881-227661Person D.I.E.T. Ropar, Punjab - 140001 9417027661
Puducherry52 M. Sudurshan State Academic Asst. Professor Biology 0413-2615588
Coordinator No.- 19, Water Tankst , Pillaiyan 9488074341Kuppam(V), Thondamanathan Post, [email protected], Puducherry -605502
53 S. Segar Resource Indira Gandhi 0413-2251796Person Govt.H.S.School , Indira 9489771796
Nagar - 605006 [email protected]
Tripura54 Prof. J.P.Roy Resource Retd. Professor 0381-2359794
Choudhury Person Tripura Science Forum Thakur 9436583382Ramkrishna Road, Shyamalibazar,P.O.- Kunjavan, Agartala - 799006
Tamil Nadu55 Dr. S. Dinakaran State Academic Associate Professor 0452-2694064
Coordinator The Madura College , TPK Road, 9994900064Madurai - 625011 [email protected]
56 P.K.Rajan Resource Department Manager elect. 044-26153635Person C1/W481, Pravin Vivata Flats, 2nd 9791099730
Avenue, Annanagar west extn., [email protected] - 600101
57 Prof. S.Mohana Resource Retd. Principal 9443044642Person 245 Avvai Shanmugam Salan [email protected]
Gopalapuram, Chennai
Sl. Name of the Status Address Phone, Mobile, E-mailNo. Participants

Activity Guide 2012-13
Page 134
Uttar Pradesh
58 Alok Chauhan State Academic Director ACET 0120-4151108Coordinator Aryabhatt College of Engg. & Tech. 9810523953
13km stone, Baghpat- Meerut Road, [email protected], Dist Baghpat.
59 Gauri Shankar Resource Lecturer 9897047259Gupta Person 25, Pili Kothi Khurja (Buland shah) - [email protected]
203131
West Bengal
60 Some Nath Roy Resource Principal 9476349082Person DIET, Nadia P.O.- [email protected]
Barajaguli, Dist- Nadia61 Khordokar Anowarus Resource DIET, Hooghly, 9433395757
Sadat Person Gandhigram, P.O.- 9434095757Rajhat, Dist- Hooghly - [email protected]
Kendriya Vidyalaya Sangathan
62 A Jose Herbert Raj Resource PGT 9449157362Person Kendriya Vidyalaya, Malleswaram, [email protected]
Bangalore - 560055 0821-247034563 K . Arumugam Resource PGT 9986647793
Person Zonal Institute of Education and Trining [email protected] Nagar, SiddarthnagarP.O., Gitb Press Campus, Mysore -570011
64 A .Narayana Swamy Resource PGT 080-25343234Person Kendriya Vidyalaya, NAL Campus, 9480261094
Bangalore - 560017 [email protected] D. Venkateswariu Resource Principal 0877-2232755
Person Kendriya Vidyalaya No- 1, Ramnagar 9550025755Aroo, Tirupati -517507 [email protected]
Navodaya Vidyalaya Samiti
66 A.Vinayathan Resource Principal 0413-2655133Person Jawahar Navodaya Vidyalaya, Peria 9443829983
Kalapet, Puducherry - 605014 [email protected] A.S.N. Murty Resource Jawahar Navodaya Vidyalaya, 08852-241354
Person Peddapuram, Dist- East Godavari - 9441487648533437 [email protected]
Sl. Name of the Status Address Phone, Mobile, E-mailNo. Participants
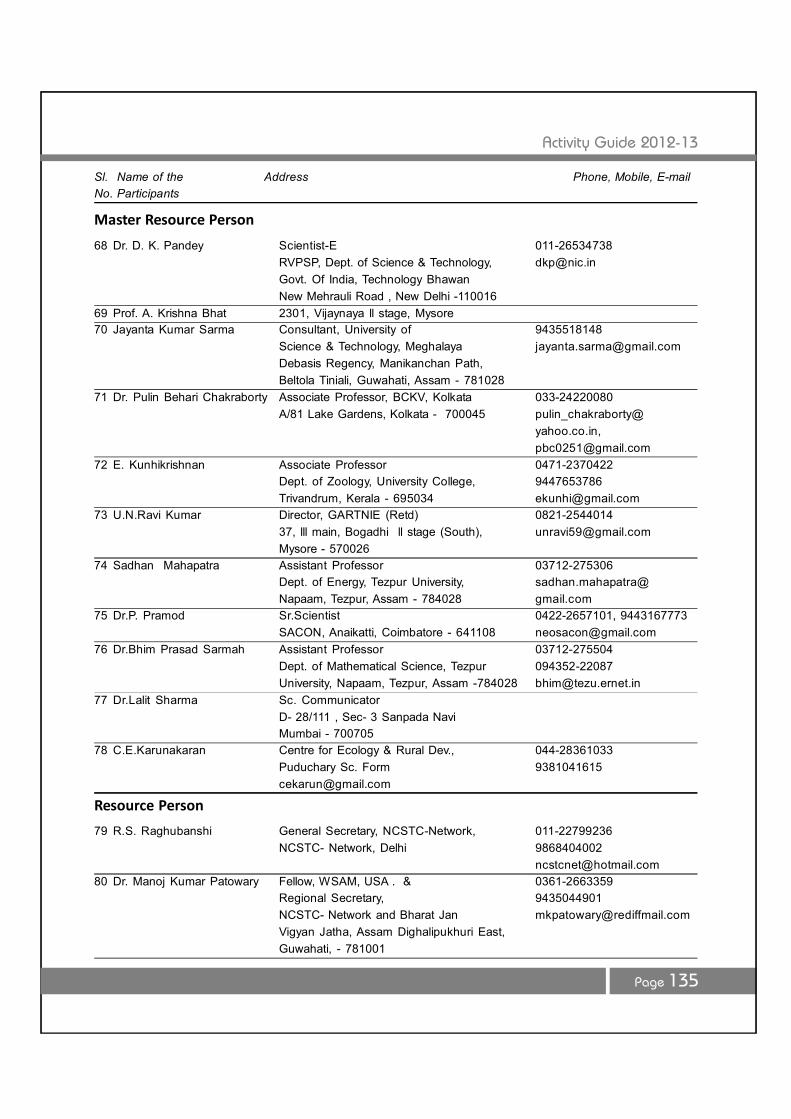
Activity Guide 2012-13
Page 135
Sl. Name of the Address Phone, Mobile, E-mailNo. Participants
Master Resource Person
68 Dr. D. K. Pandey Scientist-E 011-26534738RVPSP, Dept. of Science & Technology, [email protected]. Of India, Technology BhawanNew Mehrauli Road , New Delhi -110016
69 Prof. A. Krishna Bhat 2301, Vijaynaya ll stage, Mysore70 Jayanta Kumar Sarma Consultant, University of 9435518148
Science & Technology, Meghalaya [email protected] Regency, Manikanchan Path,Beltola Tiniali, Guwahati, Assam - 781028
71 Dr. Pulin Behari Chakraborty Associate Professor, BCKV, Kolkata 033-24220080A/81 Lake Gardens, Kolkata - 700045 pulin_chakraborty@
yahoo.co.in,[email protected]
72 E. Kunhikrishnan Associate Professor 0471-2370422Dept. of Zoology, University College, 9447653786Trivandrum, Kerala - 695034 [email protected]
73 U.N.Ravi Kumar Director, GARTNIE (Retd) 0821-254401437, lll main, Bogadhi ll stage (South), [email protected] - 570026
74 Sadhan Mahapatra Assistant Professor 03712-275306Dept. of Energy, Tezpur University, sadhan.mahapatra@Napaam, Tezpur, Assam - 784028 gmail.com
75 Dr.P. Pramod Sr.Scientist 0422-2657101, 9443167773SACON, Anaikatti, Coimbatore - 641108 [email protected]
76 Dr.Bhim Prasad Sarmah Assistant Professor 03712-275504Dept. of Mathematical Science, Tezpur 094352-22087University, Napaam, Tezpur, Assam -784028 [email protected]
77 Dr.Lalit Sharma Sc. CommunicatorD- 28/111 , Sec- 3 Sanpada NaviMumbai - 700705
78 C.E.Karunakaran Centre for Ecology & Rural Dev., 044-28361033Puduchary Sc. Form [email protected]
Resource Person
79 R.S. Raghubanshi General Secretary, NCSTC-Network, 011-22799236NCSTC- Network, Delhi 9868404002
[email protected] Dr. Manoj Kumar Patowary Fellow, WSAM, USA . & 0361-2663359
Regional Secretary, 9435044901NCSTC- Network and Bharat Jan [email protected] Jatha, Assam Dighalipukhuri East,Guwahati, - 781001
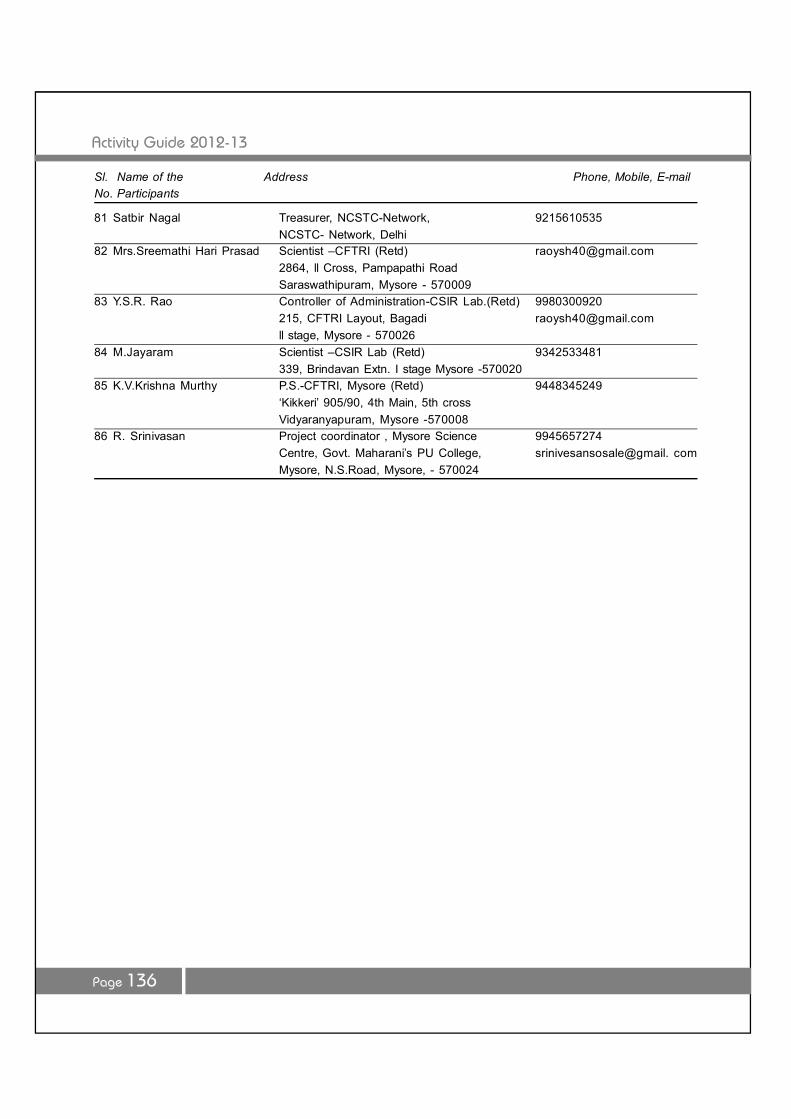
Activity Guide 2012-13
Page 136
81 Satbir Nagal Treasurer, NCSTC-Network, 9215610535NCSTC- Network, Delhi
82 Mrs.Sreemathi Hari Prasad Scientist –CFTRI (Retd) [email protected], ll Cross, Pampapathi RoadSaraswathipuram, Mysore - 570009
83 Y.S.R. Rao Controller of Administration-CSIR Lab.(Retd) 9980300920215, CFTRI Layout, Bagadi [email protected] stage, Mysore - 570026
84 M.Jayaram Scientist –CSIR Lab (Retd) 9342533481339, Brindavan Extn. I stage Mysore -570020
85 K.V.Krishna Murthy P.S.-CFTRI, Mysore (Retd) 9448345249‘Kikkeri’ 905/90, 4th Main, 5th crossVidyaranyapuram, Mysore -570008
86 R. Srinivasan Project coordinator , Mysore Science 9945657274Centre, Govt. Maharani’s PU College, srinivesansosale@gmail. comMysore, N.S.Road, Mysore, - 570024
Sl. Name of the Address Phone, Mobile, E-mailNo. Participants

Activity Guide 2012-13
Page 137
Ann
exur
e - V