a multiple case study of school district budget reductions in
252
The Pennsylvania State University The Graduate School EDUCATION BUDGETING DURING A CRISIS: A MULTIPLE CASE STUDY OF SCHOOL DISTRICT BUDGET REDUCTIONS IN CALIFORNIA AND TEXAS DURING THE GREAT RECESSION A Dissertation in Educational Theory and Policy by Jeremy Anderson Ó 2020 Jeremy Anderson Submitted in Partial Fulfillment of the Requirements for the Degree of Doctor of Philosophy December 2020
-
Upload
khangminh22 -
Category
Documents
-
view
1 -
download
0
Transcript of a multiple case study of school district budget reductions in

The Pennsylvania State University
The Graduate School
EDUCATION BUDGETING DURING A CRISIS: A MULTIPLE CASE STUDY OF
SCHOOL DISTRICT BUDGET REDUCTIONS IN CALIFORNIA AND TEXAS
DURING THE GREAT RECESSION
A Dissertation in
Educational Theory and Policy
by
Jeremy Anderson
Ó 2020 Jeremy Anderson
Submitted in Partial Fulfillment of the Requirements
for the Degree of
Doctor of Philosophy
December 2020

ii
The dissertation of Jeremy Anderson was reviewed and approved by the following:
David A. Gamson Associate Professor of Education Educational Theory & Policy Dissertation Advisor Committee Chair
Erica Frankenberg Professor of Education Educational Leadership
Mindy L. Kornhaber Associate Professor of Education Educational Theory & Policy
Kelly Rosinger Assistant Professor of Education Higher Education
Eric Plutzer Professor of Political Science Political Science Kevin Kinser Department Head, Education Policy Studies Professor of Education Higher Education
iii
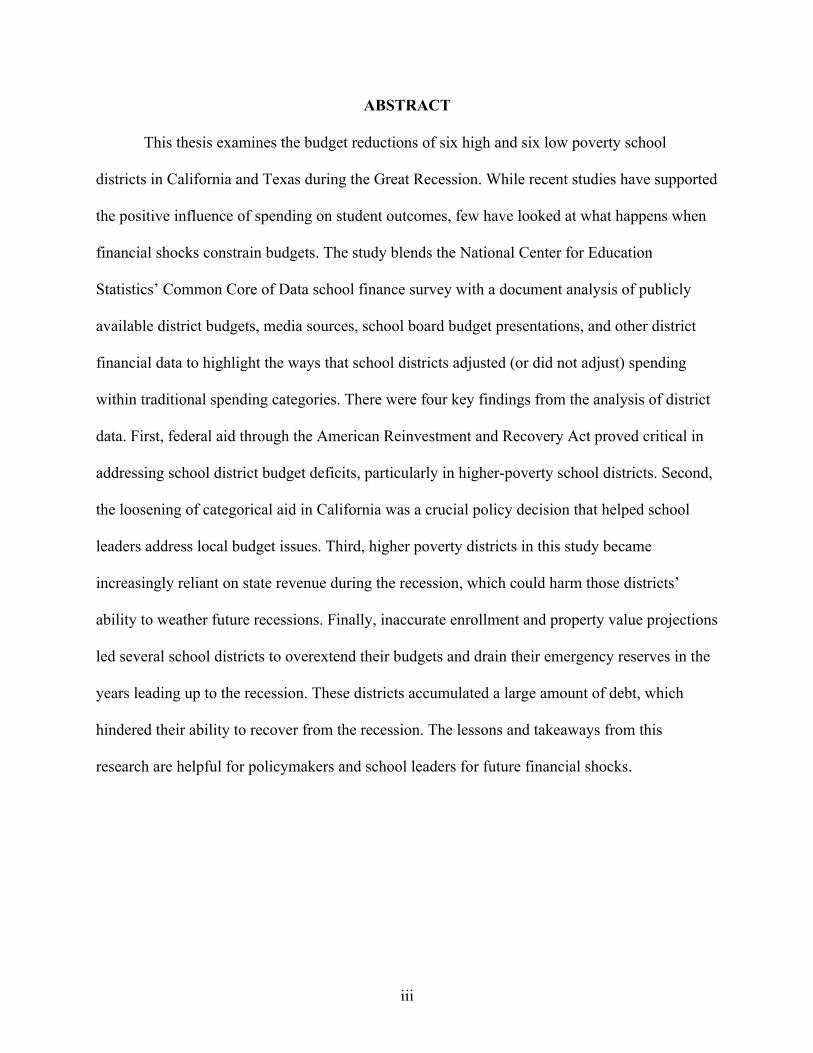
ABSTRACT
This thesis examines the budget reductions of six high and six low poverty school
districts in California and Texas during the Great Recession. While recent studies have supported
the positive influence of spending on student outcomes, few have looked at what happens when
financial shocks constrain budgets. The study blends the National Center for Education
Statistics’ Common Core of Data school finance survey with a document analysis of publicly
available district budgets, media sources, school board budget presentations, and other district
financial data to highlight the ways that school districts adjusted (or did not adjust) spending
within traditional spending categories. There were four key findings from the analysis of district
data. First, federal aid through the American Reinvestment and Recovery Act proved critical in
addressing school district budget deficits, particularly in higher-poverty school districts. Second,
the loosening of categorical aid in California was a crucial policy decision that helped school
leaders address local budget issues. Third, higher poverty districts in this study became
increasingly reliant on state revenue during the recession, which could harm those districts’
ability to weather future recessions. Finally, inaccurate enrollment and property value projections
led several school districts to overextend their budgets and drain their emergency reserves in the
years leading up to the recession. These districts accumulated a large amount of debt, which
hindered their ability to recover from the recession. The lessons and takeaways from this
research are helpful for policymakers and school leaders for future financial shocks.

iv
TABLE OF CONTENTS
LIST OF FIGURES ....................................................................................................................... vi
LIST OF TABLES ........................................................................................................................ vii ACKNOWLEDGEMENTS ......................................................................................................... viii
Chapter 1 – Introduction ................................................................................................................. 1 Statement of the Problem .......................................................................................................................... 3 Research Questions ................................................................................................................................... 3 Purpose and Significance of the Study ..................................................................................................... 4 Overview of the Dissertation .................................................................................................................... 4
Chapter 2- Literature Review .......................................................................................................... 6 A Brief History of School Finance Research ............................................................................................ 6 Effects of School Finance Reform on Educational Expenditures ............................................................. 9 Effects of School Finance Reform on Achievement (Equity Era) .......................................................... 13 Shifting the Focus: From Equity to Adequacy ....................................................................................... 16
Wave One: Federal Equal Protection Challenges (1954-1973) .......................................................................... 17 Wave Two: State Equal Protection Challenges (1973-1989) ............................................................................. 18 Wave Three: Adequacy and Challenges to State Education Constitution Clause Challenges (1989-Present) .. 19
Different Definitions of "Adequacy" ...................................................................................................... 21 Contemporary Studies in School Finance ............................................................................................... 23
The Types of Expenditures Most Associated with Student Outcomes ............................................................... 25 The Impacts of Additional Instructional Staffing ............................................................................................... 26 Investing More in Existing Instructional Staff ................................................................................................... 27
The 2008 Great Recession and School Funding ..................................................................................... 29 Background on the Great Recession ................................................................................................................... 29 Federal Aid: The American Recovery and Reinvestment Act and the Education Jobs Fund ............................ 30 The Great Recession's Effects on School District Spending .............................................................................. 32 The Great Recession and Student Achievement ................................................................................................. 34
Chapter 3 – School Budgeting and Conceptual Framework ......................................................... 38 The Anatomy of School District Budgets ............................................................................................... 39 Types of Budgets Used in this Study ...................................................................................................... 41 Visualizations of Budget Reductions ...................................................................................................... 46 Conceptual Framework ........................................................................................................................... 49
Chapter 4 – Research Design ........................................................................................................ 53 Introduction and Methodology ............................................................................................................... 53 Multiple-Site Case Study Methodology .................................................................................................. 56 Procedures ............................................................................................................................................... 56
Sample Selection ................................................................................................................................................ 56 Data Collection ................................................................................................................................................... 62 Quantitative Data Source .................................................................................................................................... 62

v
Qualitative Data Sources .................................................................................................................................... 63 Data Analysis .......................................................................................................................................... 64 Threats to Validity .................................................................................................................................. 69
External ............................................................................................................................................................... 69 Internal ................................................................................................................................................................ 70
Chapter 5 – Education Funding Deferred: California ................................................................... 72 Brief Overview of Enrollment in California ........................................................................................... 73 California Sample School Districts ......................................................................................................... 73 Brief History of School Finance in California ........................................................................................ 74 California School Finance Policy During the Great Recession and its Consequences ........................... 80 Analysis and Findings ............................................................................................................................. 86 Conclusion ............................................................................................................................................ 120
Chapter 6- Education Funding Slashed: Texas ........................................................................... 124 Brief Overview of Enrollment in Texas in 2009 .................................................................................. 125 A Brief History of School Finance in Texas ......................................................................................... 126 The Texas School Finance System ....................................................................................................... 127
The Foundation School Program ...................................................................................................................... 128 The Recapture of Local Property Taxes Provision, AKA the “Robin Hood” Provision .................................. 133
The Great Recession in Texas and the Legislative Reaction for School Funding ................................ 134 Texas School Funding Legal Battles 2011-2016 .................................................................................. 138 Analysis and Findings ........................................................................................................................... 144 Conclusion ............................................................................................................................................ 176
Chapter 7 – Conclusion ............................................................................................................... 182 Research Purpose .................................................................................................................................. 182 Summary of Findings ............................................................................................................................ 183
Main Thematic Findings ................................................................................................................................... 188 Implications for Policy and Practice ..................................................................................................... 200 Implications for Future Research .......................................................................................................... 203 Limitations ............................................................................................................................................ 204 Final Words ........................................................................................................................................... 205
References ................................................................................................................................... 210 Appendix A: Original 43 Sample School Districts from California and Texas ......................... 217
Appendix B: Log of Primary Source Documents from Sample School Districts ....................... 219 Appendix C: Changes in Expenditures and Revene in California and Texas Sample Districts: 2004-2012 ................................................................................................................................... 232

vi
LIST OF FIGURES Figure 2.1: Changes In Average State Expenditures Per Pupil 1977-1992 .................................. 11 Figure 2.2: Differences In Spending Changes And State Revenue Changes Across States 1977-1992............................................................................................................................................... 11 Figure 2.3: Percent Of Students Of Color In High Poverty Schools In The United States, 2010-2016............................................................................................................................................... 35 Figure 3.1: Oakland Unified School District Funding Levels ...................................................... 40 Figure 3.2: Section From Laredo ISD 2008-09 Budget ................................................................ 43 Figure 3.3: Required Components Of A District’s Annual Financial Report In Texas ................ 45 Figure 3.4: Concentric Circle Model Of Budget Reduction Priorities ......................................... 48 Figure 3.5: Budget Reduction Conceptual Framework ................................................................ 51 Figure 5.1: K-12 Expenditures Per Student (In Thousands) ......................................................... 79 Figure 5.2: California State Share Of Total Public K-12 Revenue ............................................... 81 Figure 5.3: Capistrano Unified School District Per Pupil Expenditures Percent Change 2004-2012............................................................................................................................................... 89 Figure 5.4: Percent Change In Instructional And Support Expenditures For Capistrano USD: 2004-2012 ..................................................................................................................................... 90 Figure 5:5 Percent Change In Instructional And Support Expenditures For El Segundo USD: 2004-2012 ..................................................................................................................................... 94 Figure 5.6: Percent Change In Fremont USD Instructional Expenditures And Support Services 2004-2012 ................................................................................................................................... 100 Figure 5.7: Fremont Unified School District Per Pupil Expenditure 2008-2013 ....................... 100 Figure 5.8: Percent Change In Fresno USD Instructional Expenditures And Support Services 2004-2012 ................................................................................................................................... 106 Figure 5.9: Percent Change In Fresno USD Overall Revenue And Revenue Sources: 2004-2012..................................................................................................................................................... 106 Figure 5.10: Percent Change In Stockton USD Revenue Sources: 2004-2012 .......................... 111 Figure 5.11: Percent Change In Instructional Expenditures, Support Services, And Per-Pupil Expenditures 2004-2012 ............................................................................................................. 111 Figure 5.12: Percent Change In Cutler-Orosi Joint USD Revenue Sources: 2003-2012 ........... 116 Figure 5.13: Percent Change In Cutler-Orosi Joint USD Expenditures: 2003-2012 .................. 117 Figure 5.14: Changes In Per Pupil Spending In Cutler-Orosi Joint Unified School District: 2003-2012............................................................................................................................................. 118 Figure 6.1: Sources Of K-12 Revenue In Texas, 2005-2013 ...................................................... 128 Figure 6.2 Texas Economic Stabilization Fund Reserves And Percent To Cap (In Billions) .... 135 Figure 6.3: Average Texas Funding Per Pupil: 2007-2015 ........................................................ 141 Figure 6.4: Percent Enrollment Growth In Hutto Independent School District 2003-2014 ....... 150 Figure 6.5: Changes In Revenue For Hutto ISD: 2004-2012 ..................................................... 154 Figure 6.6: Debt Service Fund Expenditures For Forney ISD 2001-2011 ................................. 160 Figure 6.7: Percent Change In Kingsville ISD Revenue Sources: 2004-2012 ........................... 172 Figure 6.8: Percent Change In Overall Debt For Kingsville ISD, San Antonio ISD, And Laredo ISD: 2007-2013 ........................................................................................................................... 173 Figure 6.9: Percent Change In Kingsville ISD Expenditures: 2003-2012 .................................. 174

vii
LIST OF TABLES
Table 3.1: Continuum for Budget Reduction Categories from Least to Most Impactful For Student Outcomes ......................................................................................................................... 48 Table 4.1: Document Types and Sources ...................................................................................... 55 Table 4.2: Sampling Poverty Quintiles ......................................................................................... 59 Table 5.1: California Sample Districts by Sample Group and CCD Locale Code ....................... 74 Table 5.2: Education Funding Deferrals by the California State Legislation 2008-2012 ............. 82 Table 5.3: List of California Tier 3 Categorical Programs 2009-2010 ......................................... 84 Table 5.4: Program Reductions during the Great Recession in California ................................. 122 Table 6.1: Texas Sample Districts by Sample Group and CCD Locale Code ............................ 126 Table 6.2: Texas School Finance System Maximum Tax Rates by Tier .................................... 130 Table 6.3: Example of Wealthy vs. Property Poor Texas Funding ............................................ 132 Table 6.4: 2011-2012 Texas School Finance Lawsuits and Claimed State Constitutional Infringements .............................................................................................................................. 140 Table 6.5: Program Reductions during the Great Recession in Texas ........................................ 179 Table 7.1: Program Reductions During the Great Recession in California and Texas ............... 186 Table 7.2: Percent Change in Local Revenue Contribution to Overall District Budgets ........... 196

viii
ACKNOWLEDGEMENTS
I want to thank all of my family and friends for supporting me through this process. The
amount of encouragement that you have all given me throughout writing my thesis was
invaluable. To my wife Ashlee, there are not enough words to express my gratitude for the
constant support, late night work sessions, and unrelenting encouragement that you provided
over the past three years. To my parents Ron and Nancy and my sister Renee, thank you for
always picking up the phone and giving me words of motivation to continue in this work. To my
colleagues at Penn State, thank you for always challenging my thinking and giving me moments
of respite from research. I would also like to thank the outstanding faculty and administrative
assistants in the Department of Education Policy Studies at Penn State that I have had the
pleasure to work with over the past five years.
A very special set of thank yous go to my academic advisors and mentors David Gamson
and Erica Frankenberg. They always pushed me and my research far past where I thought I could
go. They asked me the tough questions that always kept me honest and motivated. I want to
thank my other committee members, Mindy Kornhaber, Kelly Rossinger, and Eric Plutzer for
their valuable ideas and feedback. I would also like to thank Gerald LeTendre and Dana Mitra
for their mentorship in the American Journal of Education. Finally, this work was inspired years
ago when I had the privilege to teach at Cornell School District in Pittsburgh and Riverside
Beaver County School District in Ellwood City. I want to thank all of my former colleagues and
students at both of those school districts for lighting my passion for education policy.

Chapter 1 – Introduction
"The budget news is worse than we have been anticipating, with the ballooning of the deficit. But every district is different. They all have different reserves. They all have different revenue streams and different priorities. A couple of districts have given raises. Others are looking at
furloughs. Each district's financial picture is very individual." (Harrington, 2011) —Peggy Marshburn, Spokesperson for the Contra Costa County Office of Education
The Great Recession of 2008 was one of the most significant global economic downturns
in a century. The recession lasted 18 months and had powerful adverse effects on the economy
ranging from historical unemployment to a massive decline in household wealth (Rebell &
Wolff, 2011). School districts acutely felt the impact of this fiscal shock through significant
state and local revenue constraints. Nearly 300,000 teachers and other school staff lost their jobs.
The recession wiped out thirteen years of progress in class size reductions and teachers’ salaries
have still not reached pre-recession levels (Evans, Schwab, & Wagner, 2015; Sutcher, Carver-
Thomas, & Darling-Hammond, 2018). The quote that begins this chapter comes from a school
administrator in California. Her sentiment perfectly encapsulates the uncertainty and frustration
that school district leaders worked in during the Great Recession. The recession’s impacts on
school budgeting varied greatly across districts and increased the resource disparities between
high and low poverty school districts. The increase in resource disparity put the importance of
school spending on student outcomes in center stage as state legislatures and school leaders
grappled with how to address ballooning budget deficits.
For decades, the link between spending and student outcomes was contested by
academics, economists, and policymakers. Earlier studies (from the late 1960s through the mid-
1990s) found a weak-to-nonexistent relationship between school spending and academic
achievement (Coleman et al., 1966; Hanushek, 1991; Hanushek & Kimko, 2000). However,
contemporary studies have produced robust evidence to suggest that increases in education

2
spending are connected to improvements in student outcomes. These outcomes include higher
graduation rates, increased years of completed education and higher adult earnings (Card &
Payne, 2002; Jackson, Johson, & Persico, 2015, 2014; Lafortune, Rothstein, & Schanzenbach,
2016).
Today, the overall conversation in educational funding research has mainly moved past
whether spending money matters in education—however, questions of where money should be
spent remain. Recent studies on funding allocation have demonstrated that spending money on
human resources leads to the most significant increases in a range of student outcomes. Such
investments include raising teachers' salaries, investing in after school programs, and lowering
student-to-teacher ratios (Adamson & Darling-Hammond, 2015; B. D. Baker, 2017; Dietrichson,
Bøg, Filges, & Klint Jørgensen, 2017; Dynarski, Hyman, & Schanzenbach, 2011; Figlio, 1997b;
Jackson et al., 2015).
Since research shows that spending money on education matters and since there were
massive cuts to education spending during the Great Recession, what impact did these cuts have
on students? A growing body of research has highlighted early evidence on the Great Recession's
impact on school spending and academic achievement. The findings from these studies suggest
that the recession caused significant decreases in school spending (Bhalla, Chakrabarti, &
Livingston, 2015; Chakrabarti & Livingston, 2013; Evans, Schwab, & Wagner, 2019) and that
those cuts to spending harmed the academic achievement of students in ways that were not
evenly distributed by race and socioeconomic status (Jackson, Wigger, & Xiong, 2018; Shores &
Steinberg, 2017).

3
Statement of the Problem Many education policy researchers and economists have provided valuable findings
showing how state and school district budget reductions during the recession have adversely
affected student outcomes such as academic achievement, prospects for higher education, and
future job attainment. These adverse effects are particularly acute for students in lower-income
communities. However, it is still unclear exactly what types of reductions that school leaders
made at the district level and what role federal, state, and local education finance policies played
in choosing those particular reductions. The choices that policymakers and school leaders made
during the Great Recession are worth examining in more detail because research shows that these
choices exacerbated inequities in funding and student outcomes. The growth in inequity
disproportionately impacted a wide range of academic outcomes for students in higher poverty
school districts. In other words, there is room for additional research into the role of federal,
state, and local funding policy on budgeting decisions during the recession. The findings from
this study complement existing research by providing a more descriptive analysis of district
budget reductions. This thesis also explores how federal, state, and local school funding policies
influenced budgeting decision-making in high and low-poverty districts in two of the country's
largest states, California and Texas.
Research Questions The research questions for this study are:
1. What budget reductions did school leaders in some of California and Texas's highest and
lowest poverty school districts prioritize during the Great Recession?
2. How did budget reductions differ in the highest and lowest poverty school districts in
California and Texas during the Great Recession?

4
3. What state and federal education funding policies were the most influential in school
leaders' budget reduction decisions?
Purpose and Significance of the Study
This dissertation is a multiple case study of twelve school districts, six from California
and six from Texas. I use both primary and secondary data sources to analyze school leaders'
budget reduction decisions in each district. The data includes five years of district expenditures
and revenue from the Common Core’s F-33 school finance survey, school district budgets,
adopted school district budgets, financial audits conducted by third-party accounting firms, debt
transparency reports, local media reports, budget presentations, and other relevant financial
documentation. The goals of this study are to 1) identify what types of reductions school district
leaders such as superintendents, school budget officers, and school boards made during the
recession, 2) document how higher and lower poverty school district leaders made budget
reductions during the recession and to 3) analyze how federal, state, and local school funding
policies impacted the budgeting decisions of school leaders.
Overview of the Dissertation Chapter 2 of this dissertation is a literature review covering the history of school finance
reform in the United States beginning in the 1960s, the evolution of research in school finance,
and the current state of research in school finance. The final section of the chapter discusses
research on how money matters in schools, what types of expenditures matter in schools, and
how the recession impacted school spending and student outcomes. Because school district
budgets make up the bulk of the data analyzed for this study, Chapter 3 provides a concise
overview of a school district budget's anatomy. Chapter 3 continues with a definition of terms in

5
school district budgeting, a budget reduction continuum intended to help school districts make
reductions with the least impact on student learning and educational programming, and this
study's conceptual framework. Chapter 4 presents the methodology of this study, a detailed
description of the sample of school districts from California and Texas, types of data used for the
analysis, and the steps taken in the analysis of the data. Chapters 5 (California) and 6 (Texas)
contain the major findings and analysis from each state. The chapters also contain brief
explanations of each state's school finance system and how the state legislatures in each state
responded to the recession. Finally, Chapter 7 provides an overview of significant findings,
policy implications, and future research recommendations.
One of the main reasons for conducting this study is that there was not, and is not,
enough research on school funding during major fiscal shocks. Though some are more severe
than others, future economic downturns will inevitability occur. The decisions of policymakers
and school leaders from past economic downturns can provide valuable lessons so that we can
avoid negatively impacting students in future crises. As demonstrated in the academic literature,
education funding decisions made during a fiscal shock the size of the Great Recession can
change school spending patterns for decades after the event. The Great Recession was thought to
be a once in a generation economic crisis. However, the country is again in an extraordinary
economic downturn, demonstrating the need for this study and future research. This study
concludes with lessons learned from the districts included in the sample and policy
recommendations for school leaders and policymakers in our current crisis.

6
Chapter 2- Literature Review The fiscal impact of the Great Recession on school districts occurred within the context
of a long, contentious history of school finance policy, reform, inequity, inadequacy, and legal
challenges. This context is essential in that it helps to situate the landscape of school finance
before the recession and shows 1) why school district's had such inequitable levels of funding
before the recession 2) how the recession may have impacted school districts in different ways
and 3) why district leaders adjusted budgets in the ways that they did. These are all questions
central to this study. The following literature review incorporates academic and policy literature
from education policy, legal research, and economic literature.
This chapter begins with a history of school finance reform starting in the late-1960s. The
late 60s were a period where numerous influential school finance legal challenges were waged at
both the state and federal level. The decisions from these challenges the ability for states to fund
schools for decades to come and are particularly relevant to the states included in the current
study, California and Texas. Finally, more contemporary literature will be discussed, including
research on how money matters in schools, what types of spending are most consequential for
student outcomes, and school finance literature explicitly related to the Great Recession.
A Brief History of School Finance Research
State supreme courts have heard cases relating to the constitutionality of state education
financing systems in at least 43 different states. There are 16 cases of the state courts overturning
state school finance systems and 20 cases where the system was upheld (Murray, Evans, &
Schwab, 1998). Between 1971-2010, the Supreme Court of the United States heard nearly 70
court cases filed in 28 different states that dealt with the constitutionality of the states' school
financing legislation or formula (Jackson et al., 2015). What is so important about these cases

7
and their rulings, is that they define the boundaries for what school finance reform looked like in
states following the decisions. Importantly, the rulings helped to shape the vocabulary that
school finance reformers and researchers still use in exploring the effects of school finance
reform. The legal interest in financing equity increased substantially after two notable court cases
were heard in the early 1970s, Serrano v. Priest in 1971 and San Antonio Independent School
District v. Rodriguez in 1973 (Card & Payne, 2002; Jackson et al., 2015; Karst, 1973; Murray et
al., 1998; Sutton, 2008; Walter & Sweetland, 2003).
In 1968, a parent in the Los Angeles City School District brought a lawsuit against the
state of California for its method of school funding. The issue most pressing in the case was
"whether substantial inequality in school district capacities to tax and spend means inequality of
educational opportunity" (Karst, 1973). Serrano v. Priest was a series of three cases that
challenged the constitutionality of the system of using local property taxes to fund school
districts under the Equal Protection Clause of the Fourteenth Amendment (Karst, 1973; Kirabo et
al., 2015; Murray et al., 2016; Serrano v. Priest, 1971).
The state court was compelled by the vast disparities in property tax rates across the state.
Wealthy districts, as they still do, were able to gather higher revenue than poorer districts. Poorer
districts to stay afloat taxed their communities at a higher effective rate that did not help local
revenues match those in wealthier districts. The attorneys for Serrano stated that "Beverly Hills
spent more than twice as much per student as Baldwin Park, a low income and property-poor
community twenty-five miles east of Los Angeles. Because of Beverly Hills' far larger tax base,
however, it had a school property tax rate less than half of that of Baldwin Park" (Fischel, 1996).
More specifically, this series of cases raised the issue of "whether substantial inequality in school

8
district capacities to tax and spend means inequality of educational opportunity" (Karst, 1973).
The California Supreme Court ruled that,
We have determined that this funding scheme invidiously discriminates against the poor
because it makes the quality of a child's education a function of the wealth of his parents
and neighbors. Recognizing as we must that the right to an education in our public
schools is a fundamental interest which cannot be conditioned on wealth, we can discern
no compelling state purpose necessitating the present method of financing (Serrano v.
Priest, 1971).
In the years after Serrano, California developed a system of revenue limits and caps that sought
to decrease inequality by allowing lower spending districts to grow spending through state
foundation grants and limit growth in higher spending districts. The goal of the financing system
was to narrow the per-pupil funding gap between lower and higher spending school districts.
Since 1978, California has turned nearly all responsibility for financing schools over to the state
(Karst, 1973; Murray et al., 2016).
San Antonio Independent School District v. Rodriguez (1971) was a similar case to
Serrano in that its' plaintiffs challenged the constitutionality of Texas's school financing system
under the Equal Protection Clause of the Fourteenth Amendment. Texas, like California, relied
heavily on local property taxes to provide funding for schools. As such, more impoverished
Texas communities experienced substantial difficulties in collecting the tax dollars to fund their
schools adequately (Sutton, 2008). Partially due to several new conservative justices appointed
to the United States Supreme Court, the decision in this particular case was to uphold Texas's
school financing system. The court determined that Texas's school financing system did not
"impermissibly interfere with the exercise of a "fundamental" right or liberty…since (education)

9
is not within the limited category of rights recognized by this court as guaranteed by the
Constitution" (San Antonio Independent School District v. Rodriguez, 1973). Also, the court
held that the case as a whole was "an inappropriate case in which to invoke strict scrutiny" (San
Antonio Independent School District v. Rodriguez, 1973). Thus, the school finance system did
not violate the Equal Protection Clause of the Fourteenth Amendment.
The Rodriguez decision created a chilling effect through the school finance reform
movement and, as such, cases slowed. However, around 1989, another wave of state lawsuits
emerged that targeted a different aspect of school funding, statewide funding guarantees.
Claimants, in this second wave of cases, took a different strategy from their predecessors. Instead
of arguing against the constitutionality of the local property tax financing systems, they argued
that levels of statewide funding were too low and inadequate. Since the funding levels were
inadequate, they violated the guarantee that states have in their constitutions to provide an
adequate and "thorough and efficient" education to all students within their states (Sutton, 2008).
Adequacy based lawsuits have met greater court success than equity or equality-based school
financing cases from a decade earlier. Since 1989, two-thirds of the cases that challenged state
funding levels that focused on funding adequacy have won (Sutton, 2008). Courts,
disappointingly, seem more willing to address issues of "adequacy" versus "equity" or "equality,"
which has been instrumental in how school finance research has been framed since the early
1990s.
Effects of School Finance Reform on Educational Expenditures
The critical questions following these court decisions are, did they lead state leaders to
make equitable or adequate changes to their funding systems over time? Are states increasing
revenue per student, and is that translating to increased spending per student at the district level?

10
Finally, if there is an increase in spending, is it equitable across all socioeconomic levels of
school districts? David Card and A. Abigail Payne conducted a study that examined the effect of
school finance reform decisions during the first and second wave of court cases (1977-1992) on
the levels of school spending across wealthier and poorer districts in over 13,000 school districts
in the United States.
Card and Payne sought to answer whether or not states had reacted to the school finance
reform litigation by changing their funding formulas in a significant way. They separated the
states into three separate categories states with court decisions finding school finance systems
unconstitutional, states with court decisions finding school finance reform systems constitutional,
and states with no court cases by 1992 (Card & Payne, 2002). Between 1977 and 1992, when
many of the first and second waves of court cases took place, state revenue per student in states
with court decisions that found their school finance system unconstitutional increased
substantially more (86%) than in either of the other two groups (46%-49%) (Card & Payne,
2002) suggesting a positive reaction to the court's decision. Changes in expenditure per student
remained relatively constant between the three groups.
11
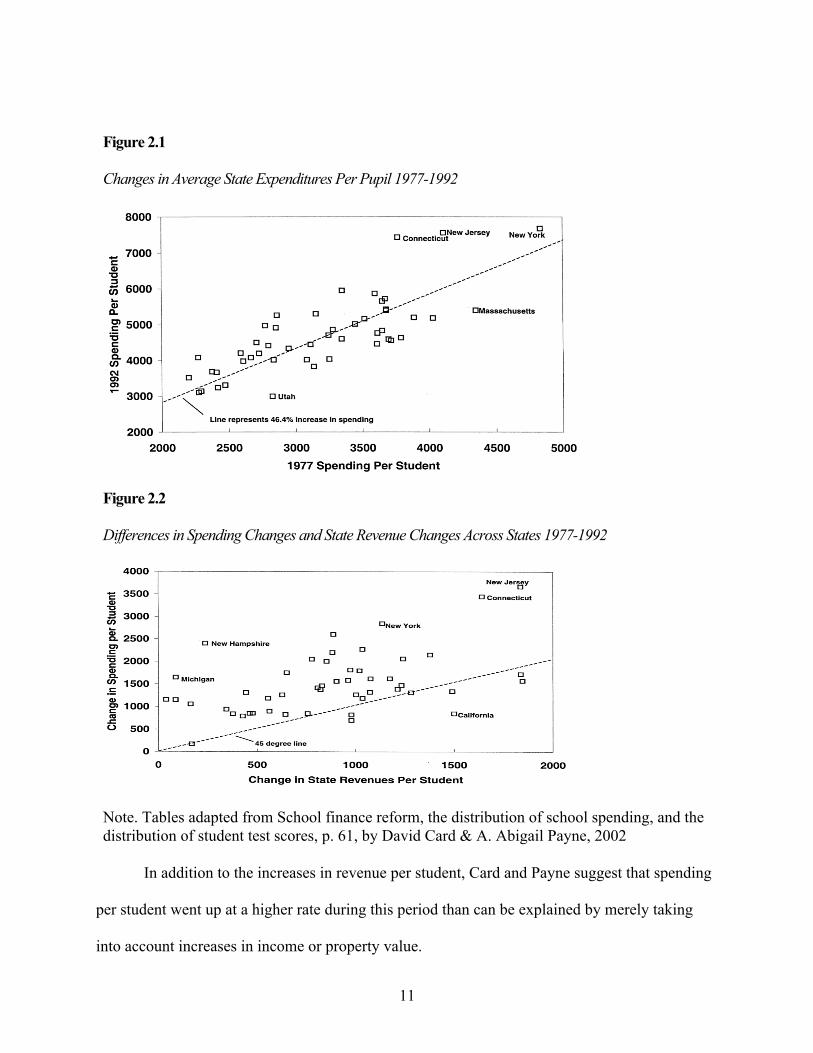
Figure 2.1 Changes in Average State Expenditures Per Pupil 1977-1992
Figure 2.2 Differences in Spending Changes and State Revenue Changes Across States 1977-1992
Note. Tables adapted from School finance reform, the distribution of school spending, and the distribution of student test scores, p. 61, by David Card & A. Abigail Payne, 2002
In addition to the increases in revenue per student, Card and Payne suggest that spending
per student went up at a higher rate during this period than can be explained by merely taking
into account increases in income or property value.
12
Figure 1 shows 1992 average expenditures for each state against 1977 average spending.
Several states demonstrated much larger or smaller increases in spending – "notably Connecticut
and New Jersey on the high side and Utah and Massachusetts on the low side" (Card & Payne,
2002). The bottom panel of Fig. 1 demonstrates a "strong correlation between the change in state
funding per student over the 1980s and the change in total spending per student" (Card & Payne,
2002). The scatter plot suggests that local revenues per student rose in most states during the
1980s. The magnitude of change in Figure 1 indicates that an increase in state aid for school
districts increased revenue more than an increase in local income.
The study found that states did alter their funding system to reorient funds towards more
significant equity and that the magnitude of those changes was "economically and statistically
significant" (Card & Payne, 2002). Court decisions that ruled state school finance systems
unconstitutional did seem to make a notable difference in influencing states to reform their
finance policies towards the goal of increasing local revenue per student over time.
In addition to providing additional revenue and boosting student spending, one might wonder
whether or not these court reforms helped to reduce inequality. While researching this topic in
1998, Sheila E. Murray, William N. Evans, and Robert M. Schwab used the Census of
Governments: School System Finance File (F-33) from the U.S. Bureau of the Census which
contains longitudinal data on district revenue and expenditures. They used the period between
1977-1992 to examine whether or not there was a narrowing in inequality. The authors found
that there was a decrease in the disparity of school resources, while income inequality rose. That
is important because it shows a weakening in the link between wealth and school resources. This
decrease was mainly within states as the Rodriguez decision affected the reduction between
states (Murray et al., 1998; Robinson, 2013). Low spending districts tended to raise expenditures

13
while already high spending districts remained unchanged following reforms, therefore
increasing state aggregate spending on primary and secondary education (Murray et al., 1998).
Effects of School Finance Reform on Achievement (Equity Era) In 1966 James Coleman released his influential report, Equality of Educational
Opportunity. This report influenced a new wave of arguments surrounding school finance reform
when it found little to no effect of resource-based education policy on the nation's schools
(Coleman et al., 1966). These arguments have centered around whether or not school finance
policy has/or can have an effect on student outcomes and closing gaps between richer and poorer
school districts. Education is in the position of having to compete with other public services such
as healthcare, retirement, corrections, etc. for public monies (Walter & Sweetland, 2003). As
such, it has to assert its significance in a politically resonant way to public officials. The way it is
most often argued is on the grounds of student performance. There is a significant body of work
within the field of education on school finance reform and student performance. The findings
from these works are equivocal, nuanced, and varied.
Finding a direct correlation between school funding and student performance has proven
difficult for researchers (Downes & Figlio, 1997; Robinson, 2013; Walter & Sweetland, 2003).
While education research has produced differing results on the effects of school finance reform
on student outcomes, there have been compelling studies in the field of economics. Economics
seems a natural fit for studying education finance reform as education is one of the more
significant components of government spending in the United States, accounting for 7.3% of
GDP across federal, state, and local expenditures (Jackson et al., 2015).
In the previous section, findings were presented that found that states react to school
finance reform cases by increasing revenue to students, which results in higher spending per

14
student. Another major question in school funding has been whether or not an increase in school
resources has had an impact on student performance. Eric Hanushek conducted a meta-analysis
of 377 studies that looked at the effects of different inputs (teacher-pupil ration, teacher salary,
expenditure per pupil, etc.) on student performance. Hanushek chose to use many kinds of
indicators representing student performance, such as standardized tests, dropout rates, college
performance, etc. In his meta-analysis, he found that while school resources had increased,
student achievement had remained either unchanged or decreased slightly (Hanushek, 1996).
"The vast majority of parameter estimates are statistically insignificant" (Hanushek, 1996).
Therefore, Hanushek asserted that it was not the amount of resources we put into schools, but
how those resources are used that effect student achievement. Hanushek found that "today the
existing knowledge base does not ensure that any added funds will, on average, be spent wisely.
That is true even if some schools may spend their funds wisely" (Hanushek, 1996).
There has been significant pushback on Hanushek’s findings that increased education
funding did not impact student achievement. Larry Hedges and Rob Greenwald offer criticisms
of the method and model that Eric Hanushek uses in his meta-analysis of the data. Hedges and
Greenwald point out that several prominent changes happened in education between the years of
1970-1995 (the years that Hanushek had concentrated on) including an expansion in the level
and comprehensiveness of education and a decline in the overall social capital (Bourdieu, 1986)
available for lower-income families (Hedges & Greenwald, 1996). When segments of the
population experience erosion in their social capital, they can be trapped in a cycle of inequality
that reproduces itself across generations (Bourdieu, 1986). As lower-income communities have
been demonstrated to have connections to lower spending school districts (Downes & Figlio,
1997; Jackson et al., 2015), the concern surrounding the loss of social capital has substantial

15
implications for the educational opportunity of students. Hedges and Greenwald argue that the
decline in social capital occurred due to the rising levels of poverty that disproportionately
impacted communities of color in the late 1980s and early 1990s. They also look at data from the
National Assessment of Educational Progress (NAEP) to assess how much student achievement
had decreased in relation to the expansion of level and comprehensiveness of education and
decline in social capital. After evaluating the data, they conclude that the relatively stable levels
of academic achievement, despite increased wealth disparity, was evidence for the positive effect
of increases in school expenditures.
Too often, the overarching discussion on the effects of school finance reform becomes
dichotomous. Either money matters for students or money does not matter. However, most of the
findings on these issues are much more complicated. Thomas Downes and David Figlio looked
at the imposition of expenditure limits on local governments and whether those limits affected
student performance on standardized test scores. Downes and Figlio argued that previous
research treated the effects of policy changes as purely exogenous events. Previous studies
treated finance reform as an entirely homogenous event. In reality, school finance reforms are
wide-ranging and affect different states in different ways. Some states have been forced to
assume finance reform under court-order while others do so in processes that originate from their
legislature. Downes and Figlio account for these variations by categorizing reform as court-
mandated or legislative. They then categorize on a separate level of pro-spending and anti-
spending. Downes and Figlio used individual-level data from two cohorts of high school seniors,
"one that attended school in an era before any recent substantial changes in school finance policy
occurred, and another that spent most (or all) of their academic careers in schools subject to tax

16
limits or school finance reforms" to study the effects of those reforms on academic achievement
(Downes & Figlio, 1997).
The findings from Downes & Figlio's study found, "economically and statistically
significant evidence" (Downes & Figlio, 1997) to suggest that tax limits decreased math scores,
but had virtually no impact on reading scores. More importantly, tax limits disproportionately
affect already low-spending school districts. These districts tended to be low income with higher
percentages of students of color. Therefore, tax limits were "increasing inequality in educational
opportunity and outcomes" (Downes & Figlio, 1997). When examining the effects of court-
mandated and legislatively induced school finance reform, these reforms have led on average to
increased student performance. The research presented so far has studied school finance reform
using datasets compiled during significant portions of what is known as the "equity era" of
school finance reform. Since 1989, the focus of school finance reform literature pivoted to the
"adequacy era." The next section presents a brief history of the adequacy era.
Shifting the Focus: From Equity to Adequacy Scholars who study the school finance reform movement have traditionally broken it into
three distinct "waves" (Card & Payne, 2002; Jackson et al., 2014; Koski & Reich, 2006;
Lafortune et al., 2016). The legal approach of plaintiffs’ court challenges (both at the federal and
state level) to states’ school financing systems define each of the three waves. Wave one and
wave two were both concentrated on the concept of "equity." The equity movement concentrated
on inputs to the school system. More specifically, it focused on equalizing per-pupil expenditures
across school districts (Heise, 1995; Mcmillan, 1998). Wave three of school finance reform
shifted the framing of court claims from "equity" to "adequacy." This shift proved to be more

17
legally successful and had significant implications for the types of policies states adopted to
address their educational attainment gaps (Card & Payne, 2002; Lafortune et al., 2016).
Wave One: Federal Equal Protection Challenges (1954-1973) Wave one of the school finance reform movement is tightly intertwined with the
desegregation movement initiated, in part, by the U.S. Supreme Court's Brown v. Board of
Education decision in 1954. Though the ruling fell short of declaring education as a fundamental
human right, the language of the decision emphasized the societal importance of education by
writing that "education is perhaps the most important function of state and local
governments…the great expenditures… demonstrate the importance of education to our
democratic society" (Heise, 1995). The fight to desegregate schools began to incorporate the
battle to equalize school spending across school districts. These new court cases based their
inequity claims in the Equal Protection Clause of the 14th amendment to the U.S. Constitution.
An example of this justification is present in the Serrano v. Priest cases. In 1968, a parent in the
Los Angeles City School District brought a lawsuit against California for its method of school
funding. The issue most pressing in the case was "whether substantial inequality in school
district capacities to tax and spend means inequality of educational opportunity" (Karst, 1973).
In 1971, with a 6-1 vote, the California Supreme Court ruled that California's funding scheme
did violate the equal protection clause of the state constitution.
The U.S. Supreme Court halted the early progress in the federal equity movement with
San Antonio v. Rodriguez in 1973. The court ruled that education was not a fundamental right as
it was not included in the Bill of Rights. Therefore, disparities in school funding could not be
held to be unconstitutional. This decision effectively halted school funding equity challenges at
the federal level. Despite this setback, Justice Marshall included wording in his dissent that left

18
the door open for state challenges to education funding, "nothing in the Court's decision today
should inhibit further review of state educational funding schemes under state constitutional
provisions" (Dayton & Dupre, 2006).
Wave Two: State Equal Protection Challenges (1973-1989)
Wave two of school finance reform began very shortly after the Rodriguez decision in
1973. This wave is similar to wave one in that it focuses on equity and closing gaps in per-pupil
expenditures. However, it departs from the first wave in that challenges from this wave
concentrate on equal protection clauses within individual state constitutions (Heise, 1995;
Mcmillan, 1998).
Robinson v. Cahill was a 1973 challenge to New Jersey's education funding system
decided by the New Jersey State Supreme Court. The court struck down the state's school
finance system, ruling that it did not meet the state's constitutional requirements. The foundation
for the court's decision was based upon New Jersey's state constitution's guarantee of a "thorough
and efficient" school system (Heise, 1995). This decision sparked a new groundswell of
education funding challenges based on state constitutional education clauses.
Every state in the United States contains a clause in its constitution that includes a form
of educational obligation (Parker, 2016). The wording of these clauses is often vague and open to
wide interpretation. Litigators during the second and third wave of school finance reform used
these clauses to make the case that states were falling short of their constitutional obligations to
educate their children. In wave two, legal challenges argued that states were falling short by
allowing significant gaps in per-pupil expenditures. This wave was useful in redirecting school
finance challenges from the federal to the state level. This redirection led to a majority of
victories early on but questions of local control and a rejection of the concept of equity as

19
"lacking the simplicity and unquestioned normativity that gave it its initial appeal" (Enrich,
1995) ended this wave. Equity could not stand as a concept, at the state level, because it
demanded equity or equalization in "other important variables that also influence educational
opportunity" (Heise, 1995). In short, equity, as a concept, was ruled to be too broad and
politically unpalatable in the late 1980s.
Wave Three: Adequacy and Challenges to State Education Constitution Clause Challenges (1989-Present)
In 1989, the Kentucky Supreme Court ushered in a third wave of school finance reform
with Rose v. Council for Better Education (Card & Payne, 2002; Jackson et al., 2015; Koski &
Reich, 2006; Lafortune et al., 2016). The argument, in this case brought by 66 Kentucky school
districts, concerned the states' clause to provide an "efficient system" of public schools. The
court wrote that the state's school finance system was "underfunded and inadequate; … fraught
with inequalities and inequities; … and … not uniform across the districts in educational
opportunities" (Rose v. Council for Better Education, Inc., 790 S.W.2d 186, Ky. 1989). The
court went on to say that, "each child, every child,…must be provided with an equal educational
opportunity to have an adequate education" (Lafortune et al., 2016). The wording in the court's
decision was highly consequential because it fundamentally shifted the emphasis of school
finance reform literature, legal and academic, from equity to adequacy. This change moved the
focus of school funding from purely school inputs (raw expenditure equalization) to outputs or
parity of outcomes for all students. The court’s ruling went so far as to outline seven areas in
which students should have an adequate education1.
1 These areas of adequacy included (1) oral and written communication skills; (2) knowledge of social, economic, and political systems; (3) knowledge of governmental processes; (4) knowledge of mental and physical wellness; (5) grounding in the arts; (6) adequate training for life work; and (7) sufficient academic and vocational training to compete with students in surrounding states (Heise, 1995).

20
Despite the court’s guidance, adequacy is still a difficult concept to define, but scholars
point to a few reasons why it has continued to be more legally successful than its equity
counterpart. First, equity often challenged the concept of local control that is so engrained in the
United States' idea of schooling. States would likely have to centralize school funding to achieve
equity. This is an unpopular concept amongst school districts who covet ground-level control of
their districts. Adequacy can attempt to avoid the issue of local control while holding states
accountable for their education obligations within their constitutions. Second, adequacy gained
momentum because it came on the heels of increasing accountability standards. Accountability
standards were popularized after the Reagan administration released A Nation at Risk in 1983
and continued through all presidential administrations that followed (Card & Payne, 2002; Heise,
1995; Lafortune et al., 2016; Mcmillan, 1998).
The result of Rose v. Council for Better Education was swift legislative reform of the
entire Kentucky school system in the form of the Kentucky Education Reform Act of 1990
(KERA). The act contained provisions for a new funding structure to help narrow the vast
financial disparities between school districts. A policy analysis of KERA in 2003 by Melissa
Clark found that that the act did, "substantially increase funding to lower-income districts…and
these increased revenues from the state were not offset by decreases in spending at the local
level" (Clark, 2003). Also, of importance, most of the redirected funding went towards
increasing teacher salaries. In regards to student achievement, Clark found mixed results. Clark
used ACT scores as her metric of academic performance, which admittedly could be somewhat
limiting in its scope. KERA moderately contributed to improvements in ACT scores for black
students relative to students in Tennessee.

21
Different Definitions of "Adequacy"
The definition of funding adequacy is not uniform from state to state. However, there are
common characteristics of adequacy, and it is operationalized in academic literature. How states
define what it means to provide an adequate education helps to guide how state legislatures and
state departments of education allocate resources to school districts.
In the 1989 Rose ruling, the Kentucky Supreme Court ruled that seven areas had to be
addressed to argue that children were receiving an adequate education. These seven areas were,
(1) oral and written communication skills; (2) knowledge of social, economic, and political
systems; (3) knowledge of governmental processes; (4) knowledge of mental and physical
wellness; (5) grounding in the arts; (6) adequate training for life work; and (7) sufficient
academic and vocational training to compete with students in surrounding states (Heise, 1995).
As a result, the Kentucky legislature, in KERA, intended to address these seven areas through
policy. This policy was a "sweeping overhaul of the Kentucky legislative system…that addressed
funding, curriculum, and governance" (Clark, 2003). KERA presented the earliest framework for
how policy could be designed to address the needs of adequacy.
William Clune attempted to define adequacy reform in 1992. He laid out a three-point
plan to address adequacy decisions in Kentucky, New Jersey, and Texas. His three-point plan
blended concepts from both adequacy and equity and included, (1) a base program of substantial
equality of spending for ninety-five percent of a state's students (maintained at that level of
equalization from year to year); (2) compensatory aid calculated to produce substantial
educational gains for children affected by poverty (for example, about $1000 per pupil); and (3)
a set of performance-oriented policies designed to improve the impact of educational resources
on student achievement (Koski & Reich, 2006).

22
William Koski and Rob Reich (2006) explore the concept of adequacy in a more holistic
manner. They break conceptions of adequacy into two groups: adequacy as a state constitutional
standard and adequacy as a remedy. Adequacy, as a state legal standard refers to how "state
education clause jurisprudence" has developed and influenced standards for adequacy. These
standards include
(1) those that articulate a vague and broad qualitative standard aimed at furthering the
state's interest in producing civic-minded and economically productive students but
provide little guidance to policymakers; (2) those that identify specific, though abstract,
capacities and skills that all children should receive from public education to serve both
the state's and the students' individual interests and then order the legislature to provide
the resources that would permit children to obtain those capacities and resources; and (3)
those that tie adequacy to state educational content standards, which define with a high
degree of specificity what all children should know and be able to do (Koski & Reich,
2006).
Adequacy as a remedy deals more with remedial court orders. These are both broader
definitions than those espoused by KERA. Koski and Reich define this conception of adequacy
in terms of the general remedies of courts:
(1) the mere declaration that the current system is unconstitutional and a directive to the
legislature to develop a new system in line with the court's constitutional standard, (2) the
directive that the state legislature determine the cost of an adequate education and an
order that such funding be provided (an inputs standard that may be tied to outcomes), (3)
the specific directive that the state provide a certain type of educational programming for
certain children and schools (an inputs standard), and (4) the order that the state shall

23
ensure that students achieve a certain outcome without dictating the specific inputs (an
outcomes standard) (Koski & Reich, 2006).
Both of these definitions demonstrate an expansion of the notion of adequacy. Phrases in the
above quotes such as "achieve a certain outcome," "educational content standards," and
"capacities and skills that children should receive" emphasize the output focus by states and help
to define adequacy-based school finance literature.
Contemporary Studies in School Finance
Over time, scholars in both education policy and economics have applied a more
comprehensive array of methodologies and approaches to study the central question of whether
school funding matters in ways that range from academic achievement to broader adult
outcomes. This new array of studies offers a much different picture than earlier studies in the
1970s, 80s, and 90s. They push back on the notion that was popularized by schools such as Eric
Hanushek as they find a positive relationship between school spending and student outcomes.
This section highlights a few of the more contemporary, critical studies to the school finance
literature on whether school finance policy makes a difference to students. Additionally,
literature will be discussed that address how money matters. Or to reframe that question, what
types of expenditures make a difference in students’ education?
David Card and Abigail Payne (2002) evaluated the effect of spending equalization
policy on SAT scores from 1980-2001. They found that "in the aftermath of negative court
decisions states tend to increase the relative funding available to lower-income districts" (Card &
Payne, 2002). For every additional dollar of state aid to a school district, there was a 30-65 cent
increase in spending in that district. For student achievement, the authors find a modest effect.
When comparing students from lower-income vs. higher-income districts, they find SAT scores

24
close by about five percent. This study of student outcomes from the adequacy era suggested
modest, but positive relationships between these policies and increases in per-pupil expenditures
and academic achievement.
C. Kirabo Jackson, Rucker C. Johnson, and Claudia Persico (2015) used the timing of the
passage of court-mandated reforms and their associated type of funding formula change, as an
exogenous factor on school spending. They then compare the adult outcomes of cohorts that
were differentially exposed to school finance reforms, depending on place and year of birth. The
authors then take this approach a step further by measuring the effects of financial on completed
years of education, future wages, and annual rates of poverty (Jackson et al., 2015). The authors
argue that past studies (such as Hanushek (1996) or Coleman (1966)) focused more narrowly on
test scores and may have missed the long-term effects of the reforms on students. This study
found only minor positive effects for children from affluent families. The authors found that a
10% increase in per-pupil spending each year for all 12 years of public school was associated
with 0.43 additional years of completed education, 9.5% higher earnings, and a 6.8 percentage-
point reduction in the annual incidence of adult poverty for children from low income
communities (Jackson et al., 2015). These findings point to the real impact of school finance
reform not only on student achievement but long-term outcomes concerning students. The effect
of the reforms are predominantly felt by students in need who reside in lower spending school
districts.
Julien Lafortune, Jesse Rothstein, and Diane Whitmore Schanzenbach further explored
the contribution of adequacy era reforms on student outcomes. They used representative samples
from the National Assessment of Educational Progress and the random timing of exogenous
events to evaluate changes in absolute and relative spending as well as achievement in low-

25
income school districts. For changes in relative expenditures the authors find "sharp, sustained
increases in both relative and absolute funding for low-income districts" (Lafortune et al., 2016).
A question might be raised to whether low-income districts were actually receiving increases in
revenue or if state policy had slowed the growth of higher-income districts, somewhat obscuring
the actual net gain to lower-income districts. Importantly, states were not accomplishing this by
"leveling down" spending for education; they adopted a more progressive financing policy that
increased funding to lower-income districts at a faster rate. Academic achievement was a more
mixed result. Finance reforms, "reduced achievement gaps between high- and low-income school
districts but did not have detectable effects on resource or achievement gaps between high- and
low-income (or white and black) students" (Lafortune et al., 2016). The results of studies such as
Card & Payne and Lafortune, Rothstein, and Schanzenbach indicate a relationship between
finance reform policy in the adequacy era and changes in the racial and socioeconomic gaps of
student outcomes.
The Types of Expenditures Most Associated with Student Outcomes Research demonstrates that money matters for improving not only the academic
achievement of all students (particularly students in lower-income school districts) but also for a
host of outcomes in the adult lives of students. Money is not a panacea to educational and social
ills. Still, funding is directly associated with the resources necessary to educate students and,
therefore, does impact nearly all aspects of student learning. Given this premise, where should
money be spent to provide the most significant impact on the quality of student outcomes,
particularly students of color and students from lower-income districts? Many educational
interventions that research has demonstrated positively impact student outcomes are in some way
tied into having greater access to funding and resources. This question has seen an increase in

26
attention in the past two decades with most research pointing to the importance of human
resources and expenditures connected to human resources (B. D. Baker, 2017; Dietrichson et al.,
2017; Jackson et al., 2015) through additional staffing and investing in existing staff.
The Impacts of Additional Instructional Staffing Investing more money into human resources is shown in school finance literature to be
one of the more effective spending choices a district can make, especially for students in lower-
income communities. One of the more comprehensive studies that explores this question is by
Jens Dietrichson et al. (2017). They conducted a meta-analysis on academic interventions for
elementary and middle school students from low-income communities. The researchers included
101 studies conducted between 2000 to 2014 from OECD and EU countries. All of the studies
used a treatment-control design and measured achievement by standardized tests in mathematics
and reading. The analysis found that the most significant effect sizes on achievement came from
interventions that included tutoring, small-group instruction, and coaching/mentoring of teachers
(Dietrichson et al., 2017). While the effect sizes were not large enough to completely close the
achievement gaps in math and reading between low and high-income students, the authors
contend that resources directed to more human resources could go a long way towards reducing
that gap (Dietrichson et al., 2017).
The findings of Dietrichson et al. are mainly consistent with Jackson, Johnson, and
Persico (2015) in that they demonstrate the significant impact of investing in human resources as
an effective way to improve student outcomes. Jackson, Johnson, and Persico's study reveals
additional types of human resources and instructional expenditures that were associated with
improved student outcomes beyond Dietrichson's meta-analysis. The author's findings on the
educational effects of increased spending were discussed previously in this literature review,

27
however, another crucial result had to do with how school leaders spent the money. Increased
spending was associated with reductions in student-to-teacher ratios, increases in teacher
salaries, and longer school years (Jackson et al., 2015). Dietrichson et al. 's and Jackson et al. 's
research find that spending that is directly focused on student instruction (i.e. hiring more
teachers, raising teachers’ salaries, tutoring, smaller class sizes, longer school years) lead to the
most significant gains in student outcomes.
A common result of additional staff is smaller class sizes. The positive impact of smaller
class sizes on student outcomes is demonstrated by a large body of research. Students who are
exposed to smaller class sizes at younger ages have long and lasting positive educational effects
(B. D. Baker, 2017; Finn, Gerber, Achilles, & Boyd-Zaharias, 2001; Konstantopoulos & Chung,
2009; Krueger & Whitmore, 2001). A 2011 study on the effects of class size by Susan Dynarski
et al. used data from the Project STAR experiment in Tennessee to examine college enrollment
and degree completion income and racial gaps. Project STAR (Student/Teacher Achievement
Ratio) was an experiment funded by the Tennessee legislature in 1986 that randomly assigned
different class sizes to children in kindergarten through third grade (Dynarski et al., 2011). The
authors find that assignment to a smaller class size increased the probability of attending college,
on average, by 2.7 percentage points. This number was double for African American students.
For students enrolled in the poorest third of schools in the study, there was a 7.3 percentage point
effect and shifted students toward higher-earning fields such as those in science, technology,
engineering, math (STEM), business, and economics.
Investing More in Existing Instructional Staff An alternate path school districts may choose to add additional staff is to invest more
funding in their existing staff. Competitive wages, especially concerning the economy in which a

28
school district operates, have proven to attract higher-quality teachers. Higher teacher salaries
have been found to attract more highly qualified teachers (Figlio, 1997b), that are more likely to
stay in the district in which they were employed (Ondrich, Pas, & Yinger, 2008). A teaching staff
this is highly qualified and stable is positively associated with student outcomes (Loeb & Page,
2000).
If wage competitiveness is associated with the attainment of higher-quality teachers and
better student outcomes, does the inverse hold? Does investing less in wage competitiveness and
teacher quality negatively impact student outcomes? Research suggests that this is the case.
Studies have found that restricting school personnel expenditures can lead to more inexperienced
teachers, which negatively affects student outcomes and that this effect is not evenly distributed
among school districts (Adamson & Darling-Hammond, 2015; Figlio, 1997a; Figlio & Rueben,
2001). This effect has important equity implications. In a wide-ranging study on the inequity in
the distribution of qualified teachers in California and New York, Adamson and Darling-
Hammond (2015) found that districts with lower salaries often served students with higher needs,
offered more unsatisfactory working conditions, hired teachers with lower qualifications, and
experienced higher turnover (Adamson & Darling-Hammond, 2015). They additionally found
that school districts in California and New York that had the highest proportion of students of
color and low-income students had twice as many uncredentialled and inexperienced teachers as
school districts that had the lowest proportions.
Adamson and Darling-Hammond went further to examine the inequitable distribution of
well-qualified teachers' effects on student achievement. If lower-income schools with students
with greater educational need don't have the funding necessary to attract the quality of teachers
that may benefit their students, the outcomes of those students are negatively impacted. While

29
these studies looked tax limits and tax revolts the central premise, that funding reduction
negatively impacts student outcomes, holds for other instances of budget reduction necessity
such as a fiscal crisis or recession.
Research on the impact of human resources on student outcomes is particularly salient for
this study. The Great Recession of 2008 caused state budget shortfalls that most often negatively
impacted education spending. In both states central to this study, California, and Texas, teacher
layoffs, salary cuts, and elimination of positions by attrition were central themes in school
district budget reduction. The following section will give a brief background of the recession
followed by a review of the literature on the effect of recessionary school finance policy (at the
state and local level) and school spending and student achievement.
The 2008 Great Recession and School Funding Background on the Great Recession Beginning in December of 2007, the world economy began to slow into a recession that
was the worst economic decline since the Great Depression in the 1930s. This recession has been
popularly labeled the Great Recession as a result of the extensive damage that it caused. In the
United States, the recession began with the collapse of the housing market in relation to a
subprime mortgage crisis. The recession was an 18-month economic downturn that had powerful
adverse effects on many segments of the economy, such as unemployment and household wealth
(Wolff et al., 2011). Unemployment rates rose to 10 percent by the end of 2009, doubling from
the same time in 2007 (Kalil, 2013). Over eight million jobs were lost between 2007 and 2012
(Evans et al., 2015). High unemployment, combined with a slow recovery, led to lost income,
lost wealth, food insecurity, and countless other negative economic factors particularly among

30
those that were already socioeconomically disadvantaged (Danziger, Chavez, & Cumberworth,
2012),
There are several significant studies on the impact of the Great Depression on education
(Tyack & Hansot, 1982, 1984). However, few studies have focused on economic recessions and
public education since. The severity of the Great Recession seems to have inspired a host of new
studies, from academics, economists, public policy, and research institutions. These studies
capture the effect of the 2008 recession on topics such as the federal response to the recession,
school spending (B. D. Baker, 2014; Bhalla et al., 2015; Evans et al., 2019; Freelon, Bertrand, &
Rogers, 2012; Leachman, Masterson, & Figueroa, 2017), student achievement among
recessionary budget cuts (Shores & Steinberg, 2017), and the effects of the recession on the well-
being of children (Ananat, Gassman-pines, Francis, & Gibson-davis, 2011; Danziger et al.,
2012). This section will begin with a brief discussion of the federal response to the recession. It
will then focus predominantly on research on the recession's effects on school spending and the
recession's impact on student achievement.
Federal Aid: The American Recovery and Reinvestment Act and the Education Jobs Fund During the Great Recession, the federal government passed a series of stopgap legislative
stimulus packages intended to boost school spending and investment. The first of these measures
was enacted when President Barack Obama signed into law the American Recovery and
Reinvestment Act of 2009 (ARRA). The goal of this legislation was to "to stimulate the
economy in the short term and invest in education and other essential public services to ensure
the long-term economic health of our nation" (American Recovery and Reinvestment Act of
2009, 2009). ARRA provided economic relief and stimulus in areas such as tax incentives,
healthcare investments, aid to low-income workers, infrastructure investments, energy

31
efficiency, and renewable energy investments, housing investment, and education. $100 billion
was given to K-12 and higher education in the areas of teacher salaries, childcare services,
educational technology, aid to homeless students, aid to working college students, an increase for
Pell Grants, and others (Ellerson, 2009; Evans et al., 2019). One of the most substantial portions
of education investment in ARRA was $53.6 billion for the State Fiscal Stabilization Fund
(SFSF).
ARRA stipulated that 61% of a state's allocations were based on a state's relative
population of individuals aged 5 to 24 years, and 39% was based on its relative share of the total
population. States were required to use 81.8 % of SFSF funds for the support of public
elementary, secondary, and higher education, and early childhood education programs and
services. The states had to use their allocations to help restore Fiscal Years (FY) 2009, 2010, and
2011 support for public elementary, secondary, and postsecondary education to the greater of the
FY 2008 or FY 2009 level (American Recovery and Reinvestment Act of 2009, 2009; Evans et
al., 2019). ARRA funds had to be distributed through the state's existing education funding
formulae to the receiving districts. States were to use the remaining 18.2% of their SFSF funds
for education, public safety, and other government services. This could include assistance for
early learning, K–12 education, and support of public colleges and universities. Also, states
could use these funds for modernization, renovation, or repair of public school and public or
private college facilities (American Recovery and Reinvestment Act of 2009, 2009).
The second federal legislative act that intended to address the massive amount of
educator layoffs more specifically was The Education Jobs Fund (colloquially knows as Ed
Jobs), passed in 2010. The Education Jobs Fund provided $10 billion in federal grant aid that
was distributed to states based on their school-age population and total population. Governors

32
were required to submit an application in which they committed to using the funds appropriately
and maintaining state education spending at certain levels. The U.S. Department of Education
provided states with guidance on the process for awarding funds to states, the ways that states
and local school districts could using the funding, and the accountability and reporting
mechanisms associated with accepting funding (U.S. Department of Education, 2011a).
Once a state had received its Education Jobs Funds2, it had to distribute the funds to its
school districts through either the state's primary education funding formula or based on each
district's share of Title I funds. EdJobs aid was only to be used for "compensation, benefits and
other expenses, such as support services, necessary to retain their existing employees, to recall or
rehire former employees, and to hire new employees, in order to provide early childhood,
elementary, or secondary educational and related services" (U.S. Department of Education,
2011a). Any state, even those that did not make cuts to education, were eligible to apply for Ed
Jobs funding. California was the first state to apply for and be approved for the aid (U.S.
Department of Education, 2010). By April of 2011, all states had applied for and received
funding through The Education Jobs Funds. Texas was the final state announced for approval
(U.S. Department of Education, 2011b).
The Great Recession's Effects on School District Spending The ways in which the Great Recession impacted public schools and how those schools
reacted to the recession have started to become more apparent in recent years due to research has
been done into its educational effects. Newer studies have highlighted early evidence that we
have on the impact of the recession on school spending and academic achievement. However, the
2 States that received Education Jobs Fund funding and the amount that they received can be found at this website: https://www.ed.gov/category/program/education-jobs-fund.

33
findings from these studies suggest that the economic downturn did adversely impact school
spending and perhaps the academic performance of students in ways that were not evenly
distributed across student populations in the United States.
The recession had an acute effect on the spending of school districts. Evans, Schwab, and
Wagner (2019) assessed K-12 school finance and public education employment during the
recession. Surprisingly, given the housing market collapse's contribution to the recession, the
authors found that during this period that property tax revenue increased, particularly in lower-
poverty school districts. Property tax revenue grew ten percent above pre-recession levels in the
fifteen quarters later (Evans et al., 2019). The authors gave two reasons for why this may have
occurred. The first deals with how property tax revenue is collected. Residential property taxes
make up roughly 60% of taxable assets (with commercial, industrial, and farm property making
up the rest). Evans, Schwab, & Wagner find that many local jurisdictions were able to raise
property tax rates to offset the decline property value. Therefore, while many districts experience
reductions in their property tax base, they counteracted that with raises in property tax rates.
Importantly, school districts that heavily relied on state aid before and during the
recession were harmed more than districts that relied more on local revenue (Evans et al., 2019).
More often than not higher poverty school districts rely more heavily on state funding than on
local or federal funding. This effect becomes even more pronounced given the trend in school
finance reform over the past 40 years to counteract inequality by increasingly moving away from
local revenue and towards more state revenue for school districts.
Bhalla, Chakrabarti, and Livingston (2015) conducted a comparative analysis of public-
school spending in New York and New Jersey during the 2008-2009 and 2010-2011 school
years. The authors’ goal was to highlight state level spending effects of the recession. New
34
Jersey experienced a far greater decline in funding per pupil during the recession than did New
York. School districts in New Jersey dealt with budget cuts mainly by targeting instructional
expenditures while school districts in New York focused on reductions to transportation, student
activities, and utilities (Bhalla et al., 2015). The findings from this analysis reveal the roles that
state budget laws and local decisions by school leaders play in large federal funding programs.
The Great Recession and Student Achievement Shores and Steinberg (2017) conducted a study that focuses on the recession's effect on
the academic achievement of students through the loss of school resources. The authors found
that the recession did have "severe and adverse" consequences on academic achievement that
were not distributed evenly across student populations (Shores & Steinberg, 2017). The Great
Recession worsened the inequality of student achievement outcomes across school districts that
varied by race, socioeconomic status, English Language Learners, and students with special
needs. School districts serving high concentrations of low income students experienced the worst
effects of the recession (Shores & Steinberg, 2017). Results were most pronounced in the
achievement of students in grades 5-7. The authors were not able to directly point to why this
might be, but they posit that the reason may have to do with teacher layoffs. They found that the
recessionary effects were most influential in school districts serving a higher concentration of
low-income students and school districts that experienced the most reductions in teachers.
Shores and Steinberg's finding that spending cuts during the Great Recession exacerbated
the inequality of student achievement outcomes across school districts of different populations is
an important one. Their finding that the adverse effects of the recession were mainly
concentrated in school districts serving higher concentrations of low-income students is
particularly important in the broader context of racial and socioeconomic segregation in the
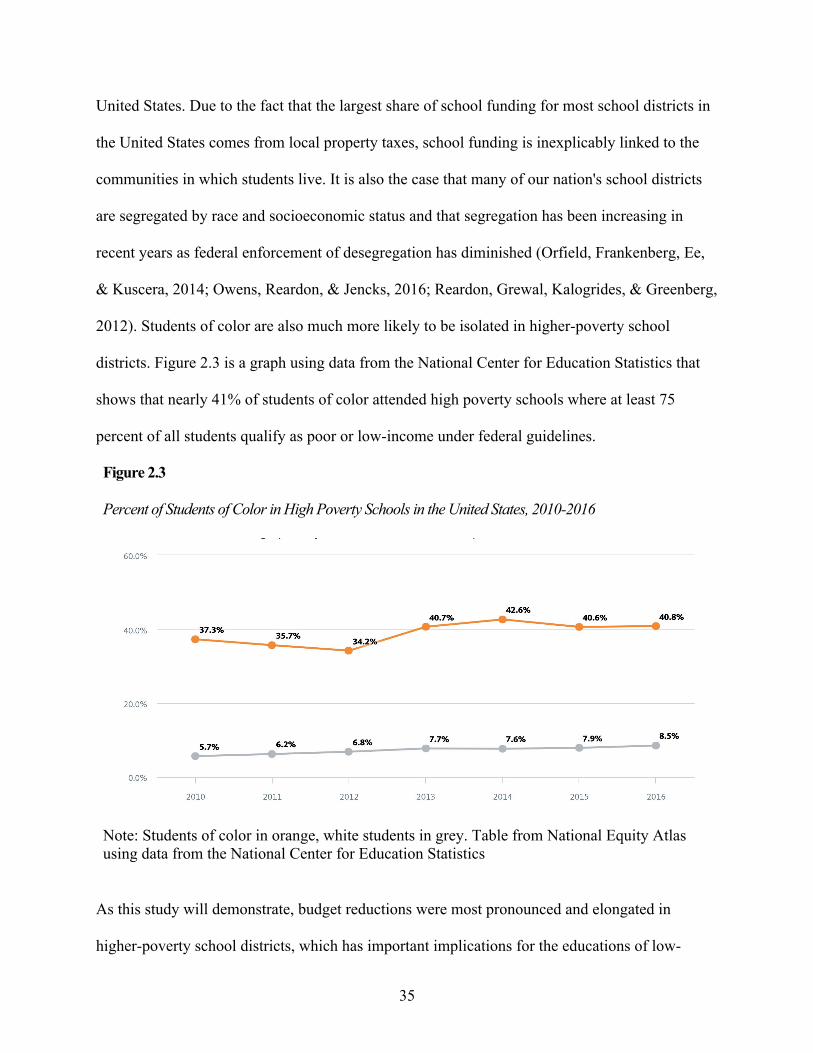
35
United States. Due to the fact that the largest share of school funding for most school districts in
the United States comes from local property taxes, school funding is inexplicably linked to the
communities in which students live. It is also the case that many of our nation's school districts
are segregated by race and socioeconomic status and that segregation has been increasing in
recent years as federal enforcement of desegregation has diminished (Orfield, Frankenberg, Ee,
& Kuscera, 2014; Owens, Reardon, & Jencks, 2016; Reardon, Grewal, Kalogrides, & Greenberg,
2012). Students of color are also much more likely to be isolated in higher-poverty school
districts. Figure 2.3 is a graph using data from the National Center for Education Statistics that
shows that nearly 41% of students of color attended high poverty schools where at least 75
percent of all students qualify as poor or low-income under federal guidelines.
Figure 2.3 Percent of Students of Color in High Poverty Schools in the United States, 2010-2016
Note: Students of color in orange, white students in grey. Table from National Equity Atlas using data from the National Center for Education Statistics
As this study will demonstrate, budget reductions were most pronounced and elongated in
higher-poverty school districts, which has important implications for the educations of low-

36
income students and students of color. Shores and Steinberg recommend that further research be
done on the length of exposure for students to resource shocks in school districts.
Other studies have found the same detrimental effects of school spending cuts on student
achievement as Shores and Steinberg. For instance, C. Kirabo Jackson, Cora Wigger, and Heyu
Xiong, found that a 10% cut to school spending during the Great Recession reduced test scores
by 7.8 percent of a standard deviation. Moreover, a 10% spending reduction during all four high-
school years was associated with 2.6 percentage points lower graduation rates (Jackson et al.,
2018). While school districts could offset spending cuts by pushing back planned construction
projects or large upcoming expenditures, those offsets were often too small to deal with the
massive reductions that came during the recession.
Evans, Schwab, and Wagner also looked at public school employment during the
recession. Using data from the U.S. Census Bureau, the authors found that 297,700 jobs were
lost during the recession. This represented 3.7% of the total public-school workforce. The large
elimination of positions had a direct effect on teacher-student ratios in schools. The recession
wiped out 13 years of the overall decline in that ratio (Evans et al., 2015). There is little evidence
to indicate how these layoffs were distributed across grade or subject (Shores & Steinberg,
2017). Evans, Schwab, and Wagner suggest that future research should explore more specifically
what kinds of teachers (math, science, art, physical education, etc.) were laid off during the
recession and how those layoffs were distributed across schools within school districts.
The studies above demonstrate the effect school finance has (both in a positive way and
negative) on student outcomes, not in school but also longer-term. The Great Recession
compounded these effects by restricting the amount of funding that students received and
disproportionately affected school districts with higher percentages of students of color and

37
students from lower-income communities. Given that the Great Recession was the worst
economic downturn in a generation, it is an opportunity to study further how this type of
economic condition affects the spending of school districts. This study builds on the work of
Shores and Steinberg, Evans, Wagner, and Schwab, and others. It will extend the current
literature by more specifically identifying budget reductions in an attempt to determine how
school district leaders prioritized budget reductions during the recession and how they made
those reductions across and within districts in California and Texas. The following chapter will
provide an overview of school district budgeting and will present a framework on budget
reduction that will be used in the analysis.

38
Chapter 3 – School Budgeting and Conceptual Framework
The California and Texas state legislatures made massive education spending cuts during
the recession. By 2015, California still was spending 11.8% less per pupil than they did in 2008.
Texas was spending 15.9% less per pupil (Leachman et al., 2017). State education funding
reductions left school district leaders in a difficult position. They either needed to cut spending or
raise additional revenue. Raising additional revenue was an untenable option for most districts
(though some were able to achieve this) in both states as they faced declining property values
and declining enrollments. School district leaders then decided where to make budget reductions
in response to declining revenues. Many of these decisions are captured in the school budgets,
financial audits, school board presentations, media reports, other financial information that
districts publish at least annually and often multiple times per year as revenue projections
change. This chapter is meant to give a basic overview of the components in a school district
budget. It then further describes other types of financial information, such as audits and state
budgets used as evidence in this study. The second part of the chapter discusses different ways of
conceptualizing how district leaders make budget reduction decisions. Finally, there is a brief
framework of how I thought through the entire budgeting process during the recession. The
purpose of this was to try and visualize where there were disconnects between typical district
budgeting and what happened during the recession.
Although not the only source of data for this study, school budgets make up a significant
portion of the data analyzed. There is more than one type of budget that school districts make
publicly available. Other types of budgets, such as interim and preliminary budgets, were also
used to analyze school district expenditure decisions during the recession. To better understand
the context behind school district budgeting, it helps explore what a school district budget is, the

39
standard components of a school district budget, and the different types of budgets used in this
study.
The Anatomy of School District Budgets
School district budgets reflect a school district's values and goals more than mission
statements or speeches because they outline where districts are allocating their resources. A
school district budget is not a static document presented to a school board and approved once a
year. It is more helpful to think of a budget as a continually evolving, working instrument that
demonstrates the goals of a district's overall educational programs for a fiscal year. There are,
very broadly, four main components of most school district budgets: 1) a description of the total
educational program that is provided by the district; 3) an overview of the federal, state, and
local revenue environment for the current year; 3) an estimate of the expenditures necessary to
fulfill the desired educational program, and 4) an estimate of the revenues available to pay for
the expenditures and predictions for future revenues and expenditures. Figure 3.1 shows an
example of a revenue projection for the average unified school district in California between the
years 2007 and 2011. The chart shows the funding per average daily attendance (ADA)
necessary for the average unified public-school district in California to maintain cost of living
adjustments. The chart also shows the funding per ADA necessary to maintain a flat spending
rate, the actual level of funding, the level of funding would be if the 2012 California tax raise
referendum failed, and Oakland Unified’s projection for their funding per ADA.
In their simplest form, expenditures are the costs of goods and services required to
operate a school district. The National Center for Education Statistics (NCES) annually collects
and publishes data on district expenditures and revenue. NCES’s accounting manual uses a

40
nested coding system that includes top codes or main expenditure categories and sub-codes that
further refine that main category.
Figure 3.1 Oakland Unified School District Funding Levels
Note: Image used from 2011-12 Oakland Unified School District Board of Education Meeting
The leading NCES codes are 1) instruction expenditures (defined as activities dealing with the
interaction between teachers and students such as teacher salaries or classroom aid salaries)
(1000); 2) support services (such as social work services, guidance counselors, psychologists,
speech pathologists) (2000); 3) operation of noninstructional services (such as food services or
community service programs) (3000), 4) facilities acquisition and construction services (such as
site acquisition, site improvement, building costs) (4000); and 5) other uses such as debt services
and fund transfers (National Center for Education Statistics, 2019).
Revenue is the income received by a school district to perform expenditures for
educational programming. NCES classifies revenue as 1) revenue from local sources such as
taxes levied, earnings on investments, transportation fees, and student activities (1000); 2)

41
revenue from intermediate sources such as unrestricted/restricted grants in aid, or revenue in lieu
of taxes (2000) 3) revenue from state sources such as unrestricted/restricted grants in aid from
state sources, and revenue in lieu of taxes (3000) 4) revenue from federal sources such as
unrestricted/restricted grants in aid from the federal government, and revenue in lieu of taxes
(4000); 5) revenue from other sources such as the sale of bonds or inter-fund transfers (5000)
(National Center for Education Statistics, 2019).
Education finance scholar William Hartman describes a school district budget as a
triangle in his seminal 2003 book on school budgeting. The budget triangle contains the three
main components of a typical budget; expenditures, revenues, and educational programming.
The base of the triangle represents the driving force behind the budgeting process in a given
year. The triangle's base can change depending on the year and economic conditions. It may be
the case that a budget deficit is driving the reduction of expenditures and, by extension, a cutting
of the district’s educational program. Alternatively, in a year where revenues are stable, school
district leaders may focus on maintaining or expanding the district's educational programming. In
reality, the process is not that basic, and each of the triangle's legs impacts the other two. As we
see in the recession, the driving force, or base, can also change depending on the economic
situations in which districts operate.
Types of Budgets Used in this Study
School District Budgets: School district budgets are financial plans produced annually by a
school district that describes the financial allocations provided to schools, salary and benefits,
supplies and materials, debt service, capital outlay, and other annual expenditures to maintain
daily operations. Budgets also specify their planned local, state, and federal revenue amounts for
that fiscal year. In addition to revenue and expenditure information, budgets can contain other

42
contextual pieces of information, including the school district’s academic and budgeting goals,
the local economic context of the district, the economic context of the district in relation to state
and federal school finance policy, the fiscal and academic challenges that the district has faced,
helpful infographics for better understanding how money is received and spent in the district, and
other highly useful pieces of information. As noted, the amount of information in a budget
(beyond the required accounting of revenues and expenditures) highly depends on the district.
Budgets can go through several iterations before final approval by a local school board. The next
section explains some of the more common types of budgets used in this study.
• Adopted Published Budgets: This is the most common type of financial document
available on school district websites and made up a large percentage of this study's data.
Adopted school district budgets are the final approved version passed by the school board
or Board of Trustees. Adopted budgets detail the revenues that the district expects to
receive for the year and the expenditures on which the district plans to spend that revenue
to support their educational programming. The budgets analyzed in this study very
broadly consist of several common parts and a similar structure. The first part contains a
message from the budget-producing authority (such as the superintendent, board of
education, and business officers) and a summary of the proposed expenditures and the
means of financing them. Since this is a public document, school districts often try and
find a way to convey financial information to the overall public easily. For instance,
Figure 3.2 shows a set of images from Laredo Independent School District’s (a school
district on in southern Texas on the border between the U.S. and Mexico) Division of
Finance used in 2008-2009. School leaders used the images to convey the cost of higher
property rates to community members by trying to relate it to everyday purchases.

43
The second part of an adopted budget are tables of the appropriations, revenue,
and borrowing measures necessary to put the budget into effect. The final part consists of
timetables and past information to support the summary. These schedules show the
proposed expenditures and sources of financing them together with information on past
years’ actual revenues and expenditures and other data used in making the budgetary
estimates.
Figure 3.2 Section from Laredo ISD 2008-09 Budget
Note: Wording and image are taken from 2008-09 Laredo ISD Budget produced by Laredo ISD Division of Finance
• Preliminary Budgets: School districts will occasionally publish preliminary budgets or
budgets that have not been approved by the school board or Board of Trustees. These are
mainly aspirational documents by a district’s superintendent or budgeting office that
outline the budgeting goals and desired amounts of expenditures for the upcoming fiscal
year. A preliminary budget represents an early draft before a budget goes through
iterations and is finally adopted. Standard budget processes included planning,
preparation and submission, review and coordination, adoption, implementation,

44
monitoring, and evaluation before viewed and voted on by a school board. A preliminary
budget preparation often begins with the initial student enrollment forecast, property
value projections, and the budget calendar's development and adoption. The enrollment
forecast and property value projections are critical because they lay the foundation for
how much money the district will receive and how the district plans to spend that money.
Inaccurate projections for enrollment and property value led to a few districts in the study
accumulating a significant amount of debt that more accurate projections would have
avoided.
• Interim Budgets: Interim budgets are budgets that a school district releases periodically
during a school year. The interim budget may present revised projections for revenues
and suggested adjustments in expenditures to meet the adopted budget's fiscal goals.
Some school districts make these available, and they provide a valuable look at how a
school district makes spending decisions in relation to changing financial conditions
throughout a fiscal year.
School District Budget Audits: Both California and Texas require annual financial and
compliance audits of school districts and other local educational agencies by independent
auditing agencies. Audits are systematic examinations of school district resource utilization. The
purpose of audits is to ascertain whether financial statements fairly represent the financial
position of a district. Independent auditing firms test whether transactions have been legally
performed, identify areas for possible improvements in accounting practices and procedures,
ascertain whether transactions are recorded accurately and consistently, and ascertain the
stewardship of officials responsible for governmental resources. California and Texas require
that school districts provide an audit of the books and accounts of the district. The audit includes
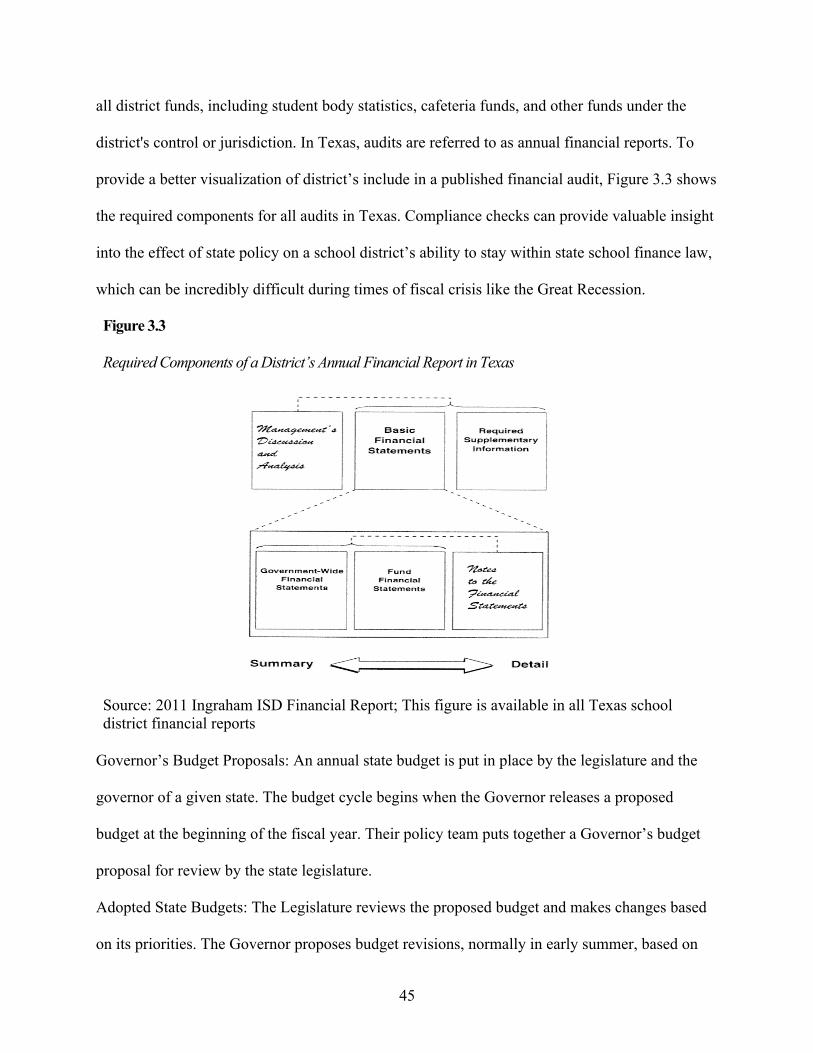
45
all district funds, including student body statistics, cafeteria funds, and other funds under the
district's control or jurisdiction. In Texas, audits are referred to as annual financial reports. To
provide a better visualization of district’s include in a published financial audit, Figure 3.3 shows
the required components for all audits in Texas. Compliance checks can provide valuable insight
into the effect of state policy on a school district’s ability to stay within state school finance law,
which can be incredibly difficult during times of fiscal crisis like the Great Recession.
Figure 3.3 Required Components of a District’s Annual Financial Report in Texas
Source: 2011 Ingraham ISD Financial Report; This figure is available in all Texas school district financial reports
Governor’s Budget Proposals: An annual state budget is put in place by the legislature and the
governor of a given state. The budget cycle begins when the Governor releases a proposed
budget at the beginning of the fiscal year. Their policy team puts together a Governor’s budget
proposal for review by the state legislature.
Adopted State Budgets: The Legislature reviews the proposed budget and makes changes based
on its priorities. The Governor proposes budget revisions, normally in early summer, based on

46
new information about state revenues. In mid-summer, the Legislature votes on the budget and
sends it to the Governor for signature. The Governor can often reduce spending items before
approving the final budget.
Visualizations of Budget Reductions Budget adjustments are common among nearly all school districts for any given fiscal
year. When expenditures are greater than revenue, the school district must take some action to
correct the deficit. The extent and prioritization of those adjustments vary significantly in the
context of a fiscal crisis. In this scenario, the most common reaction to state education budget
cuts and local property tax dips is for districts to engage in budget reductions. There is a popular
guide to budget reduction, which was proposed by education finance expert William Hartman.
Hartman refers to this guide as a budget reduction continuum. In this section, budget reductions
are defined, the budget reduction continuum is discussed, and popular budget reduction strategies
are presented.
There are two main types of budget reductions that a school district can undertake:
budget reductions by program reduction and/or budget reduction by efficiency savings. These
two options can be thought of as poles on Hartman’s budget reduction continuum. The budget
reduction continuum provides a structure for school district budget reduction decisions that
broadly aligns with the types of expenditures research has found that are most positively
associated with student outcomes (discussed in Chapter 2). Broadly, the goal of reductions is to
keep them as far away from educational programming that directly interfaces with students and
learning as possible. Typically, districts start budget cuts in areas for outside services like
contracting or external bidding for projects and work their way in to more severe instructional

47
cuts. An adapted version of this continuum can be found in Table 3.1. Budget reductions are less
desirable at the bottom of the figure.
Budget reductions by efficiency savings are generally preferred to program reductions
because they widely don’t affect the educational program or instructional expenditures of the
district and students. Efficiency savings generally aren’t considered to impact the learning of
students as it is normally a change to an operating procedure such as changed utility costs
(through weatherizing or purchasing energy efficient equipment), renegotiating existing
contracts, or taking more competitive bids for capital projects. Other types of efficiency savings
that are used by school districts include privatization of certain services used by a school district
(such as legal services, heavy maintenance, or technology management), deferring planned
expenditures, or lower noninstructional salary increases.
Budget reductions by program reduction are not as desirable as efficiency savings
because they most often impact the quality or quantity of educational services that a school
district offers. Program reductions can range from cuts to professional development funding for
district staff to more severe cuts such as reducing teaching staff, eliminating courses offered,
reducing support staff, and increasing class sizes. These are the types of reductions that school
finance literature indicates may be the most impactful to student learning and to supporting lower
income students. To further illustrate the order in which budget reductions should be considered
by district leaders, Hartman visualizes program reductions through a concentric circle model of
budget reduction priorities which is represented in Figure 3.4.

48
Table 3.1 Continuum for Budget Reduction Categories from Least to Most Impactful For Student Outcomes Reduction Category Example of Reduction Category 1. Seeking reduced prices for the same services
Competitive bidding for projects Salary adjustments for personnel
2. Increase district productivity
Energy conservation Reduction in quantity of supplies and materials Consolidating positions with similar responsibilities
3. Defer planned spending
Delays to maintenance Delays to purchases of new instructional materials
4. Making across the board cuts
Making smaller cuts to all educational programs
5. Eliminate “nonessential” services
Reducing services not required by state or federal mandate such as support services and/or elective courses
6. Reduce instructional positions and programs
Reducing in teaching staff Increase class sizes
Note: Adapted from School District Budgeting by William T. Hartman (2003) p. 185.
The outer circle represents where district leaders should consider making reductions first with
each subsequent circle representing expenditures that should be made before core instructional
expenditures. The core circle is instructional expenditures that are most directly associated with
student outcomes.
Figure 3.4 Concentric Circle Model of Budget Reduction Priorities

49
An alternative to budget reductions is for school district leaders to find a way to increase
revenues. Some of the more popular approaches to increasing revenue include raising property
taxes, increased cash flow management, charging for services provided to other school districts
(such as transportation, technology services, additional classes, etc.), charging for nonacademic
activities (such as athletic participation fees, extracurricular participation fees, etc.), obtaining
support from the private sector, or soliciting volunteers. Revenue increase techniques were most
often found in lower poverty school districts in this study, the implications of which will be
discussed in chapters 5, 6, and 7.
Conceptual Framework
This study researches school district budgeting during a period of intense financial
tension between state and local education funding and school district expenditures. The budget
reduction continuum is a helpful tool to conceptualize what budgeting priorities look like in
normal year to year budgeting. Figure 3.5 presents a conceptual framework that combines how
school district revenue was distributed during the recession and what types of reductions school
6. Other district programs 5. District level operations support 4. District level instructional support 3. School-based operations support 2. School-based instructional Support 1. Instructional expenditures

50
districts should prioritize based on literature on what types of spending matter most for student
outcomes (discussed in Chapter 2).
The top of the framework shows the three main revenue streams that fund education:
local, federal, and state. Since this study is concerned with budget reductions during the
recession in California and Texas and both state legislature’s cut education funding during the
recession, the model begins with state legislatures making budget reductions. Reduced state
funding is combined with local revenue (which was reduced in some districts during the
recession and increased in other districts) and federal revenue. School district leaders then
making budgeting decisions based on that revenue.
In this study, the link between the budgeting decisions of school leaders and what
research suggests that they should be is closely examine. The reductions that should be
prioritized are informed by both the literature on educational expenditures from Chapter 2 and
the budget continuum detailed earlier in this chapter. Through the analysis of the types of data
outlined at the beginning of this chapter it was found that that link was often broken.

51
Figure 3.5 Budget Reduction Conceptual Framework
It was broken in the sense that instructional cuts such as teaching layoffs, cuts to after school
programs, and increased class sizes often happened before cuts in capital outlay or other planned
expenditures. The study finds many instances (more often in higher poverty school districts)
where the presumption that initial budget reductions happen furthest away from instructional
expenditures did not hold during the recession. I go beyond this finding by examining the
influence that local, state, and federal policy played in those budgeting decisions. There were

52
policy breakdowns that led district leaders to cut crucial instructional categories and helped to
prolong those reductions, to the detriment of students.

53
Chapter 4 – Research Design
Introduction and Methodology
This study aims to uncover the types of budget reductions made by school district leaders
during the Great Recession. The analysis combines quantitative and qualitative data to
investigate trends in budget reductions and why school leaders made specific reductions. The
study also investigates how education funding policy at the federal, state, and local levels
influenced the types of reductions made by school leaders. I use a multiple case study analysis of
six high and six low poverty school districts in California and Texas to address the research
questions posed in Chapter 1. A multiple case study was chosen because it is a useful research
design when trying to understand the processes and contexts of a phenomenon. By using the
multiple case study method of analysis, I have been able to extend the current literature on the
Great Recession by providing further context into how school district leaders responded to state
and local revenue reductions and what types of cuts they prioritized. This chapter begins with an
overview of multiple site case study methodology. The overview is followed by a detailed
description of the study's procedures, which includes sample selection, data collection, and data
analysis. The chapter concludes by considering threats to validity and discussing the steps taken
to address those threats.
Over the past eight years, an emerging body of literature has demonstrated that the Great
Recession greatly influenced school spending decisions, particularly in high poverty school
districts. This research has primarily focused on using quantitative analyses to investigate the
impact of deep education spending cuts on student outcomes. Many of these studies (Evans et al.,
2015; Jackson et al., 2018; Shores & Steinberg, 2017) have stated that further research should
attempt to parse out nuances within the broader expenditure and revenue categories captured by

54
state and federal data. School districts report specific types of spending and revenue, as defined
by the state and federal government. The specific types of spending and revenue data that school
districts report are detailed in Chapter 2. This study builds off of broader spending and revenue
data. It extends the quantitative data by using school district budgets, financial audits, school
board budget presentations, media reports of school district budgeting, and other publicly
available financial information to develop a more detailed understanding of cuts made during the
recession. For instance, if a district made cuts within the broader NCES category of “TOTAL
CURRENT SPENDING ON INSTRUCTION,” what types of reductions were explicitly made at
the district level? Were those reductions equally distributed across the district, or did they impact
some students more than others?
When trying to understand the financial situations of school districts during the recession,
some of the most valuable data were captured through school district budgets, presentations,
memorandums that speak to the annual budget, and other school district documents. As
mentioned above, the documentary evidence often contains direct reports from district leaders
such as superintendents, school boards, and budget officers that offer insight into budgetary
decisions and spending prioritization. Table 4.1 lists some of the most important document types
used in this study. The information contained in those documents includes how state-level
budgetary decisions impacted school districts' spending and the education of students, how
school district leaders chose to deal with the resulting budget deficits, and what the spending
priorities were for the school district. Findings from school district budgets, financial audits, debt
transparency reports, and other financial documents (which are detailed further in this chapter)
provided a more fine-grained understanding of expenditures and revenue that are not captured in
existing quantitative datasets.

55
Table 4.1
Document Types and Sources
Source Type of Documents School District Level Documents
Initial Budget Proposals Preliminary Budgets Adopted Budgets Interim Budget Reports Budget Presentations to School Boards School Board Minutes School District Audits School District Improvement Plans Memoranda where available Reports by research institutions if they existed for the district
State Level Documents Governor’s budget proposals Adopted state budgets Media articles Academic papers
Federal Level Documents Reports on Federal Funding State Specific Reports on ARRA and EdJobs Funding
Other Local Media Articles Government or Independent Agency Reports
Currently, school finance data collection occurs at the state or school district level
(National Center for Education Statistics, 2019). State and district level reporting means that
budgetary decisions that affected individual schools within a school district (i.e., cutting teachers
or after school programs at an underprivileged school) are not available in the broader national
data. The qualitative data for this study sheds light on how budget reductions were distributed
not just between school districts, but also within school districts. Budget reductions were not
always evenly distributed within school districts and did not equally impact all schools within
some of the districts analyzed in California and Texas.

56
Multiple-Site Case Study Methodology
Methodologist John Creswell describes case study research as a methodology in which
“an investigator explores a real-life, contemporary bounded system (a case) or multiple bounded
systems (cases) over time, through detailed, in-depth data collection involving multiple sources
of information, and reports a case description and case themes” (Creswell, 2013). This study
explores the budgetary reductions made by school district leaders within the broader context of
historic state education funding cuts during the United States' worst financial crises since the
Great Depression. In the cases of this study, school districts are bounded by geography and time.
More specifically, this dissertation uses a multi-site case study methodology, as described
by Robert Stake (2006) and Robert Yin (2003), to capture higher and lower poverty school
districts' budgetary decisions during the Great Recession. The case study design is ideal for this
research because it is intended to address “a how or why the question… about a contemporary
set of events, over which the investigator has little or no control” (Yin, 2003). The full effects of
the recession and how it impacted students are still not well understood. By studying school
district budgeting decisions during the Great Recession, this study provide important takeaways
that can be useful to state policymakers and school district administrators in future fiscal crises
or the one in which we find ourselves currently.
Procedures
Sample Selection
The academic literature discussed in Chapter 2 helped identify states whose education
funding had been significantly impacted by the recession and that offered socioeconomic and
racial diversity in their student populations, variation in the geography of their school districts,

57
and variation in the enrollment size of the districts. California and Texas were chosen because
they met the criteria mentioned above. First, there are 1,970 school districts across both states
that offer a great deal of racial and socioeconomic diversity, wide variation in geographic
designations for school districts, and broad school enrollment differences. Second, California and
Texas offer contrast because they did not experience the recession in the same way. As will be
discussed in chapters 5 and 6, California’s housing market took a more significant overall hit
than Texas’s. California experienced recessionary effects (high unemployment, a crash in the
state housing market, and others) with the rest of the nation in 2008. Texas did not see a
significant decline in its economy until late 2009-2010. Texas also had a more stable real estate
market throughout the recession and was able to rely on its energy and manufacturing sector to
bounce back relatively quickly.
Choosing school districts to focus on from the 1,907 school districts in California and
Texas was a huge undertaking. To narrow down the school districts for this study, I first placed
all school districts in California and Texas into census poverty rate quintiles (for students age 5-
17) shown in Table 4.2. Poverty quintiles provide a standardized measure across states to
sample school districts by their respective poverty designation. 2007-2008 was used as a base
year for California and 2010-11 for Texas. There are different base years to account for the
lagged effect of the recession in Texas.
As described above, to begin sample selection, I first separated all school districts
California and Texas into census poverty quintiles (for students age 5-17). I did this using
STATA software. Next, I randomly chose three to five school districts out of each poverty group
to do a preliminary scan of the district’s publicly available financial documents. I was also trying
to choose school districts that offered socioeconomic and racial diversity in their student
58
population, geographic variation, and enrollment sizes. At the beginning of the study, it was not
entirely clear what documentary evidence that school districts made publicly available. That
evidence needed to go back to at least 2007 in California and 2008 in Texas to capture the years
leading up to the recession. I started by identifying each randomly chosen district’s website and
scanning their publicly available documents. Documents on district web pages were often
scattered and not easy to identify. Most often, financial documentation was either found in the
district’s “financial information” section or in their “school board” section. I used a browser
(Chrome) plug-in to identify and scan district websites for all documents and PDFs to address
the issue of document scatter. The plug-in aims to identify all available documents on a school
district’s web page and present it in a window that allows the user to download all available
documents (most often those documents were available in a docx or PDF format). I used this tool
to pull as many financial documents as were available. If a school district did not have any
financial documents available or if those documents provided no additional information beyond
what the Common Core’s F-33 survey provided then I moved on to another school district.
As I went through each school district, I kept a running set of memos that helped me to
record the types of the documents that I was finding, what type of evidence I could expect to find
in each of the documents, and my thoughts on inclusion and exclusion criteria. These memos
were kept in a couple of places. First, I used paper notebooks allocated specifically for this thesis
to keep memos on each of the sample districts that I chose from my initially pull of districts.
Second, as I chose districts to keep for this study, I kept running memos on each school district
in NVIVO that are linked to the specific district and document that I was writing about. The
memos contained the types of documents that I was finding in each district, the number of years
that those documents spanned, and any other thoughts I had while analyzing the district’s

59
website. In general, I found that school districts in California offered more years of
documentation and more evidence than those in Texas. I also found a substantial variation in the
availability of evidence between more urban and more rural schools which I discuss in greater
length below.
Once I collected evidence from a handful of districts, I found that most districts provided
annual budgets, annual audits, and school board minutes. Other than those three types of
evidence, the types of documents available diverged by district. Some districts provided several
iterations of their annual budgets and some provided only the final adopted version. Some school
districts detailed budget presentations to the local school board while others only had a brief note
that the budget was discussed in a school board meeting. There is a description of the kinds of
documentary evidence in Table 4.1. This initial scan of financial documents proved that far more
districts provide only a few years of the most recent publicly available documents than I initially
thought.
Table 4.2
Sampling Poverty Quintiles
Poverty Quintile
Poverty Designation
Mean Household Income of Quintile 2008
Mean Household Income of Quintile 2012
% Change
1 Lowest Poverty $ 195,231 $ 194,571 -0.3% 2 Low Poverty $ 91,032 $ 87,814 -3.5% 3 Middle Poverty $ 57,217 $ 54,743 -4.3% 4 High Poverty $ 33,688 $ 31,764 -5.7% 5 Highest
Poverty $ 13,303 $ 12,290 -7.6%
Source: Education Law Center Fairness Data System 2018, U.S. Census Bureau, Income, and Poverty in the United States: 2017, p. 35.
Smaller and often more rural school districts posed the biggest challenge in data
collection in that they often did not have many years of budgetary information available. Many

60
of the smaller districts that I initially looked at would have one or two of the most recent years of
budgets. Those districts may not have had the administrative infrastructure to maintain a decade
or more of budget reports, school board minutes, financial audits, and other relevant evidence for
this study. I did not want to exclude smaller, more rural districts from the study, so five were
chosen to keep.
As far as inclusion and exclusion criteria were concerned, I would need evidence that
provided some window into the decision making of school leaders during the recession. It was
also necessary to have evidence that provided a detailed description of the reductions that leaders
made. The financial documentation should indicate how federal, state, and local education
funding policy was impacting the budget reductions of district leaders. If a district’s website did
not provide enough documentation, or the documentation did not help answer the research
questions in this study, the district was not used and I chose another school district from the same
poverty quintile. Using the methods in this paragraph, I ended up with an early sample of 43
school districts, 24 in California and 19 in Texas in which to do a deeper dive into their
documentary evidence. I ended up with more California districts because, again, school districts
in California tended to provide much more robust documentary evidence than those in Texas.
These included two to five districts in each of the five poverty quintiles. Investigating the
original set of 433 districts was important because it helped to better understand the types of
evidence that I would need to address this study’s research questions adequately.
However, it became clear that it would be challenging to do a thorough analysis of that
many school districts to answer this study’s research questions adequately. There were simply
too many districts with too broad a range of evidence. The study was not focused because the
3 The full list of the original 43 original school districts can be found in Appendix A.

61
analysis of the data was not providing sufficient answers to the research questions. As a result, it
was impossible to develop any cohesive takeaways or lessons from the data. There was an ocean
of evidence, but it did not develop into anything resembling useful answers to the research
questions. To address the study's overly broad nature, the number of school districts was
drastically reduced from 43 to 12. The next section will discuss how that reduction occurred.
To narrow down the number of school districts, I evaluated each of the 43 districts using
a set of inclusion and exclusion criteria. To help develop the inclusion and exclusion criteria for
this study, I used Robert Stake’s case selection method for multiple case study research. Stake
posits three main criteria for selecting cases for inclusion used in this research: 1) Is the case
relevant to the phenomenon? 2) Do the cases provide diversity across contexts? And 3) Do the
cases offer opportunities to learn about complexity and contexts (Stake, 2005)? Stake’s questions
help to guide inclusion and exclusion criteria but are rewritten to address the research questions
in this study more specifically.
First, is the case relevant to the phenomenon? All school districts in the sample of 43
districts were impacted in some way from the budget cuts associated with the recession, although
to different extents. All cases were relevant to the phenomenon, but not all cases had enough
evidence to learn about the phenomenon. To narrow down the districts I looked at whether the
school district had documentary evidence (at the very least in the form of annual budgets) from
at least 2007 in California and 2009 in Texas. In most cases, if the answer was no, the school
district was removed. An exception was made for two school districts, Cutler Orosi Joint Unified
School District in California and Kingsville Independent School District in Texas. Neither of
these districts had enough documentary evidence to go back as far as the inclusion criteria stated.
None of the smaller, non-urban school districts originally chosen had enough documentary

62
evidence to remain. However, there is value in comparing quantitative trends from these smaller
districts to findings from other school districts that had abundant documentary evidence. It was
challenging to find small districts that had sufficient evidence, but it is crucial to see if the
budgetary decisions that they made were in line with other districts or if they varied. It is
essential because a critical finding from this study is that policy decisions that do not account for
school district variation often end up being less effective. Stake’s second criterion is if the cases
provide diversity across contexts. For each district, I asked does the school district provide racial
and socioeconomic diversity to the sample? Additionally, does the school district ensure
geographic variation and enrollment variation to the sample? I chose school districts that
provided racial, socioeconomic, and geographic diversity for the final sample.
Finally, Stake addresses complexity and contexts. To address this question, I looked at
whether a school district’s revenue and expenditure trends during the recession vary significantly
from the other districts in the quintile? For this study, if a district's revenue or expenditure trends
were significantly different than other districts in the quintile, I did not choose the district. There
is value in studying outliers during the recession and future research should examine those
districts. Still, the research questions in this study are oriented toward addressing more general
trends in school leaders' funding decisions during the recession. This study's final sample is a
convenience sample of six California school districts and six Texas school districts. The
complete lists of each California and Texas district in this study are included in chapters 5 and 6.
Data Collection
Quantitative Data Source
Descriptive data for all school districts comes from the NCES Common Core of Data F-
33 school finance survey (NPEFS). This survey contains school finance and demographic data

63
from 1990-2015. The NPEFS is an annual national collection of revenues and expenditures for
grades K-12 in the United States. The survey breaks down expenditures into 11 different groups
that include instructional staff support services, pupil support services, general administration,
school administration, operations and maintenance, student transportation, other support services
(such as central administration and business services), food services, and revenue sources into
federal, state, and local sources across all 50 states (National Center for Education Statistics,
2019). This study specifically uses expenditure, revenue, and demographic data for each school
district in the sample for the years 2004-2012.
Qualitative Data Sources
As discussed earlier, school districts vary in the types of financial documents that they
make publicly available and for what years that they are available. Some districts provide fiscal
reports only for a couple of years preceding the current fiscal year. Others offer financial
documents going back fifteen years. The composition of budgetary materials collected varies by
school district. For instance, some of the school districts in the sample present budgets for every
year with detailed, nuanced narratives that speak to the impact of the recession on school
revenue, how the school is spending the income that they have, and how they are planning for
future school budgets. However, some school districts present much more spartan budgets that
contain a few lines of text, followed by expenditure and revenue tables. Some school districts
accompany their budgets with PowerPoint presentations that were given to the community to
explain annual budget decisions. While the variety in the types and availability of documents can
present an obstacle, it also offers an opportunity. The variation helps to ensure that many
different kinds of records are collected. Often the various materials are designed to check one

64
another, such as a budget and an audit. Overall, the diversification of budgetary evidence
provides a more holistic picture of what budgetary decisions were being made and why they
were being made. The exact documents used in the analysis of each school district are available
in separate sources list in Appendix B. Chapter 3 includes a more in-depth discussion of the
school budgeting process and definitions of each of the types of documents that are used in this
study.
Data Analysis
Data analysis occurred in two main stages in this study. First, the NCES Common Core
school district expenditure and revenue data were analyzed to find critical time points of change.
For instance, it was clear, when looking at the data, the 2008 state budget cuts by the California
legislature led to concurrent dips in overall district revenue and spending in the sample school
districts from California. Second, those notable shifts were located within districts’ documentary
evidence and were qualitatively analyzed using open coding, categorizing, individual case
analysis, and finally, cross-case synthesis. This two-stage analysis process was not always linear.
The qualitative analysis of school districts’ budgetary materials helped to find critical trends that
required me to go back to the F-33 dataset to analyze additional expenditure categories. For
instance, Forney ISD in Texas had significant issues with overall debt going into the recession
that was discussed in both budget presentations and the school district’s annual budget report. A
change in debt as significant as Forney ISD’s constrained school leaders' options in addressing
budget deficits during the recession. I gathered overall debt data for Forney ISD from the F-33
dataset and compared it against other school districts in the study, which identified other school
districts that struggled with mounting debt. The following section will begin with a discussion of
data management and then focus in more depth on both data analysis stages.

65
Data Management
Demographic and budgetary data for each school district was downloaded from the
National Center for Education Statistic’s Common Core of Data website, where it was imported
into STATA to generate descriptive tables. Once the 12 school districts included in this study
were selected, a systematic scan of each school district’s website began. Each district website
was examined for all forms of budgets, audits, school board presentations, available budget-
related memorandum, budget-related school board minutes, and any other available financial
documents. The bulk of the data collected for the study was organized and analyzed in NVivo.
Data was held in NVivo using a file tree structure of “State,” “Socioeconomic subgroup,”
“School district,” “Data.”
After financial documents were collected from individual school districts, broader
keyword centered web searches were conducted using a wide range of search engines such as
HathiTrust, ERIC, Google Scholar, and newspaper archival databases. Keywords that were used
to search for data included “the name of the school district” & “recession,” “Great Recession,” or
“name of the state” & “school budgets” & “recession” “Great Recession.” The purpose of the
more extensive web search was to collect ancillary qualitative data such as local media articles,
reports done by research institutions, scholarly writing on the recession in California and Texas,
and other useful documents for analysis. These data were brought together and organized in the
same way as the primary source material in NVivo.
The web search was successful for many of the larger school districts (in terms of
enrollment) in the study. The larger school districts were written about more often by journalists
and academics. Local news sources in districts like San Antonio ISD and Fresno USD covered
budget negotiations annually and included interviews with important policymakers and

66
community members. However, the extensive web search was much less successful for smaller
school districts. As mentioned previously, there is less written about smaller school districts in
the media than larger districts. There is an important gap in the academic literature regarding
smaller school districts and school funding that should be filled by future research.
Stage 1: Descriptive Quantitative Analysis
This study primarily uses the F-33 financial survey data from Common Core to graph out
changes in expenditure and revenue changes over nine to ten years. This period is chosen to
show funding trends before and after the four years of the recession. Expenditure and revenue
graphs for all twelve school districts can be found in Appendix C. Expenditures that are graphed
include instructional expenditures, support services, and per-pupil expenditures. These categories
were chosen using prior academic literature on categories of spending that are most impactful to
student learning (B. D. Baker, 2017; Dietrichson et al., 2017; Jackson et al., 2015, 2018).
Although capital outlay is discussed in the case studies of the individual school districts, it is not
graphed due to the tremendous year over year variation that occurred if a school district
undertook a large building project. That considerable variation made it difficult to see changes in
any of the other spending categories. Annual state, local, federal, and overall revenue was
graphed for each of the twelve districts.
The initial analysis of NCES data was vital in finding changes in both funding and
spending. First, the analyses helped to identify the years that school districts saw the most
significant change in any of their three revenue streams. Identifying critical years of change is
essential primarily because it helps to find the leading state and local policies that impacted those
streams in those years. For instance, the descriptive analysis helped identify the Texas
legislature’s decision to make massive cuts to education funding in 2010, the California

67
legislature’s decision to defer payments, and many school districts' decisions to raise property
taxes. Second, the analyses were fundamental to find, broadly, where school leaders made
budget reductions during the recession and how those reductions were related to changes in per-
pupil expenditures. Finally, the analysis helped narrow down significant funding and spending
variations that could be explored in more depth in the district’s qualitative data. For instance,
five of the six school districts in Texas show a significant spike in federal funding in 2008. The
federal funding increase is more substantial than expected because the bulk of ARRA funding
was not seen until 2009. Eventually, several budget reports from three of the districts and four
financial audits made it clear that school districts received an increase in Title I funding in 2008
along with some first-round ARRA funds, which led to a jump in federal funding in that year. A
sharp spike in federal funding also occurred in three California school districts in 2007.
Stage 2: Qualitative Analysis
Open Coding and Categorizing
The collection of qualitative data and the analysis of the data for this study were done
concurrently. The sheer amount of evidence collected made collecting data and analyzing the
data at the same time essential to developing a clear investigative focus for distinguishing
between relevant and irrelevant sources. Initially, my analysis of the collected data used open
coding as it allowed for the development of categories for codes that fit together in evolving
patterns. Open codes were helpful early on because I did not know what I would find in the
budgetary documents. The codes were used to identify trends in the data. For instance, codes
such as deferred maintenance, deferred construction, new construction, and school facilities
funds were categorized as Capital Outlay. Memos were used after the analysis of every
document to keep those thoughts together and to identify the building blocks of larger findings or

68
takeaways A constant comparative analytical process was used to examine pieces of data in
comparison with one another. For example, findings on school budgetary reductions in a given
district were compared against different years in that same district, against other districts in the
designated sample group, within the school district’s state, and then across states. Constant
comparison helped to put more of the codes into broader categories that allowed for cross-state
comparison.
Codes such as cuts in after school support, teacher layoff, reduced instructional salaries
were categorized as Instructional Expenditures. Instructional expenditures from one district in a
given year were compared against other sample districts (both within the district’s state and
across California and Texas) in the same year to see if school districts were making similar
reductions in the same year. The constant comparison also highlighted discrepancies in the data,
such as when school district leaders painted a more optimistic picture of the district’s finances in
public statements than what the budget or audit was showing. For example, in one of the school
districts discussed in Chapter 5, a superintendent’s public message on the annual budget that was
published on the district website discussed the budget in optimistic terms that did not mention
any reductions. However, the district’s budget for that same year contained cuts to instructional
aides and increased class sizes.
The process of creating categories from the coded data was inductive. I began with data,
broke it into open codes, clustered similar codes together, and then named the category. Category
designations came from the researcher and traditional expenditure categories (as discussed in
Chapter 3 on school district budgeting and the budget reduction framework). Due to the research
questions of the study, most category designations came from expenditure categories and the
budget reduction framework, such as instructional expenditures, support services, capital outlay,

69
benefits, and revenue. Other codes relating to school district leaders' experiences when
budgeting, such as uncertainty, political turmoil, frustration, were categorized into the category
district budgeting experiences.
Cross case synthesis
Cross-cases synthesis is particularly useful in this study because it is designed to analyze
multiple cases. In this technique, each case is treated as a smaller separate study, and then
findings are aggregated across individual cases (Yin, 2003). In this study, each school district
was analyzed for its particular budgetary adjustments and reasoning for those adjustments during
the recession individually. After districts in each state were analyzed separately, findings from
those districts were compared within socioeconomic subgroups, across subgroups within states
and finally across states. Comparing results in this manner provided a more detailed description
of the similarities and differences of higher and lower poverty school districts compared both
within and across California and Texas. It also revealed similarities and differences across
districts and states that were unexpected.
Threats to Validity
External
External validity refers to the extent to which the findings of a study can be generalized.
It is not the goal of this study to be generalizable to all school districts in all economic contexts.
However, it is the hope that the findings from this study provide some policy lessons which
could be implemented during a future financial shock by state legislatures and school districts.
With that goal in mind, particular attention was paid to mitigating potential threats to this study's
external validity. An essential aspect of this study is the wide variety of sources, many designed

70
to check against the other and used to understand individual school districts' economic context.
Qualitative documentary evidence was always compared against other evidence (both qualitative
and quantitative) to find consistencies and discrepancies in how school leaders described their
budgetary condition. For instance, annual budgets were compared against available financial
audits to test if the financial projections made in the districts’ budgets played out in the end of
year audit.
Additionally, quantitative data was compared against qualitative data to find
discrepancies. For example, if a school district reported higher overall instructional expenditures
in their published budget than what was available in the CCD’s F-33 survey, it prompted a more
in-depth examination of where additional instructional funding was being spent. Another
example of discrepancies across data occurred when looking at the revenue of lower poverty
school districts. The framework for this study presented three main streams of revenue for
education funding (federal, state, and local). However, additional revenue streams, not easily
discerned in quantitative data, such as charitable donations from parents, corporate contributions,
and advertising revenue, were found in lower-poverty school districts. Texas and California do
not report this additional revenue so it was not present when examining NCES expenditure and
revenue data. Once this finding was made, higher-poverty school districts were reassessed to find
similar revenue sources. Reanalysis of school districts using unexpected results helped to
strengthen the findings of the study.
Internal
Internal validity refers to the believability or trustworthiness of a study’s findings. The
main threat to internal validity in this study was relying on school district financial documents'

71
inferences and conclusions to draw broader conclusions about school budget reduction during the
recession. It may be the case that school district leaders are not 1) entirely forthcoming about
their district’s financial situation in documents made publicly available or 2) entirely aware of all
the financial intricacies of the district. This was the case in one district where the budget was so
large one board member remarked that it would be impossible to understand what was included
within the report. This study made every effort to collect data from multiple sources, not only
those provided by the district, to mitigate that threat. Written budget reports were compared
against the NCES data set to search for any inconsistencies. Independent audits of school
districts by accounting firms were carefully analyzed and compared to the budgetary documents
that were created by school district personnel. Additionally, media sources that included
interviews with community members and independent reports done by research institutions and
external researchers were all analyzed and compared against the financial documents provided
by the district.

72
Chapter 5 – Education Funding Deferred: California
In the 1970s, California was consistently one of the top ten states in per-pupil spending.
In recent years, California has fallen to 41st and has frequently struggled to fund education in the
state (Kaplan, 2017). Those struggles were even more pronounced during the Great Recession
when state legislators chose to defer scheduled payments to school districts to help close annual
state budget deficits. Payment deferrals by the state legislature injected uncertainty into district
superintendents’, budget officers,’ and school boards' abilities to plan budgets. The deferrals also
added to the intense stress of higher poverty school districts dealing with local economic woes.
State legislators attempted to make up for these deferrals by providing flexibility in how school
districts could spend categorical funding, essentially turning the largest categorical fund in the
state into a block grant. While that decision did provide districts with some relief, higher poverty
districts still struggled with ever increasing budget deficits and, in one case, a potential state
takeover. Lower poverty districts in this study struggled with budget deficits, but were able to
use unconventional revenue sources and robust local tax bases to recover from recessionary cuts
faster than higher poverty districts. This chapter begins with a short overview of California's
overall enrollment during the recession and a description of the sample school districts analyzed
from California. This is followed by a brief history of school funding in California. California’s
school funding history is followed by discussing the state’s education funding policy landscape
during the recession and findings from this study. Finally, there is a discussion of the conclusions
of an analysis of three high and three low poverty school districts during the Great Recession.

73
Brief Overview of Enrollment in California
Chapter 3 discusses how enrollment is a critical factor in school budgeting. The number
of students a district has and specific key characteristics of those students dictates the vast
majority of how school funding is allocated. During the years of the Recession (2008-2012),
there were, on average, 1,026 school districts in California that served 6,220,413 students (the
number of school districts fluctuated during the recession). An average of 344 districts were
unified school districts (districts that include grades K-12), 524 elementary school districts, 76
high school districts, and 82 designated as “other” by the California Department of Education.
The demographic breakdown of students in the state was 54.3% Hispanic or Latino, 23.2%
White, nine percent Asian, five and a half percent African American, two percent Filipino, and
three and a half percent Two or more races, not Hispanic. The California Department of
Education reports that 61.5% of students are considered socioeconomically disadvantaged,
meaning students eligible for free or reduced-price meals and have parents or guardians who did
not receive a high school degree. 20.4% of the state's students were considered English
Language Learners by the California Department of Education (California Department of
Education, 2018).
California Sample School Districts
Table 5.1 contains all of the school districts' names in this study, the districts' respective
sample group, and the Common Core of Data (CCD) locale code. The locale code is included to
explain how the National Center for Education Statistics geographically designates each sample
school district.

74
Table 5.1 California Sample Districts by Sample Group and CCD Locale Code
California School District Name Poverty Group CCD Locale Code Capistrano Unified 1-Lowest Poverty 21-Suburban, Large El Segundo Unified 1-Lowest Poverty 21-Suburban, Large Fremont Unified 1-Lowest Poverty 12-City, Midsize Fresno Unified 5-Highest Poverty 11-City, Large Stockton Unified 5-Highest Poverty 11-City, Large Cutler-Orosi Joint Unified 5-Highest Poverty 31-Town, Fringe
Brief History of School Finance in California
California has a long and storied history of landmark school finance legal decisions. The
impact of these legal cases, based in California, have affected school finance in the rest of the
country. As discussed in Chapter 2, Serrano v. Priest played an essential role in how California
funds education to this day. Given its importance, the following section discusses this case in
greater detail and explores its importance.
In 1968, with the backdrop of massively growing property tax revenue in California, a
parent in the Los Angeles City School District brought a lawsuit against California for its school
funding method. The issue most pressing in the case was "whether substantial inequality in
school district capacities to tax and spend means inequality of educational opportunity" (Karst,
1973). In 1971, with a 6-1 vote, the California Supreme Court ruled that California's funding
scheme did violate the equal protection clause of the state constitution:
This system conditions the full entitlement to its recipients on the basis of their collective
affluence and makes the quality of a child's education depend upon the resources of his
school district and ultimately upon the pocketbook of his parents…Obviously, the richer
district is favored when it can provide the same educational quality for its children with

75
less tax effort. Furthermore, as a statistical matter, the poorer districts are financially
unable to raise their taxes high enough to match the educational offerings of wealthier
districts. (Henke, 1986; Karst, 1972).
As they are today, wealthier districts were able to gather higher local revenue than poorer
districts with lower effective tax rates. To stay financially afloat, higher poverty districts taxed
their communities at a higher effective rate that disproportionately hurt them. The attorneys for
Serrano stated that "Beverly Hills spent more than twice as much per student as Baldwin Park, a
low income and property-poor community twenty-five miles east of Los Angeles. Because of
Beverly Hills' far larger tax base, however, it had a school property tax rate less than half of that
of Baldwin Park" (Fischel, 1996). Serrano was the first successful challenge to a state education
funding system. It established the precedent in California that the quality of education that a
student receives cannot be mandated by local wealth. It must be a function of the wealth of the
entire State (Dayton & Dupre, 2006).
The outcome of Serrano v. Priest was significant. At the national level, the successful
challenge to California’s school funding system inspired families in other states to challenge
their state’s system. Lawsuits out of New Jersey, Kentucky, and Montana challenging their
school funding systems' constitutionality went on to be successful. As mentioned in Chapter 2, in
the 1989 school finance case out of Kentucky, Rose vs. Council for Better Education, the court
declared that "The result of our decision is that Kentucky's entire system of common schools is
unconstitutional" (Dayton & Dupre, 2006).
In the 1970s, California’s legislature found itself in a difficult education funding position.
It had to respond to the ruling of Serrano and attempt to make its system of school funding more
equitable across the state. However, at the same time, rising property tax rates and growing

76
discontent among taxpayers created a politically untenable situation for California legislators.
The California General Assembly passed Senate Bill 90 in 1972. This bill was a new school
funding formula that was a response to the Serrano ruling. The law's focus was primarily to
address the funding disparities that existed between higher and lower poverty districts. Property
tax revenues in 1970 were high enough that California ranked in the top 10 in the nation for
expenditures per pupil (Kirst, 2007). Senate Bill 90 began a process of "leveling up" poorer
districts. First, the state legislature increased overall education funding. Second, the state
legislature gave districts in lower-income communities more significant annual funding increases
than wealthier districts. Additional school funding equaled up to $332 million but was a far cry
from the one to two billion dollars suggested by Serrano (Kirst, 1978). On top of the increased
school funding, S.B. 90 set property tax revenue limits on wealthier districts (Fischel, 1996). The
bill was a good first step towards equalization but was challenged in 1976 as not going far
enough to address the funding gap between districts in a case known as Serrano II.
In Serano II, the California State Supreme Court found that S.B. 90 was inadequate to
address disparities across the state’s districts. The legislature responded with a more robust
solution in 1977 with Assembly Bill 65. A.B. 65's goal was to increase and redistribute funding
so that general-purpose education expenditures would not vary more than $100 per pupil across
districts (Fischel, 1996). Additionally, the bill once again adjusted limits on how fast wealthier
and poorer districts could change property tax rates to equalize revenues (Fischel, 1996; Kirst,
2007). A study by the California Department of Education found that A.B. 65 would bring 95%
of all California students within a $200 band by 1981-1982 (Fischel, 1996). While these
measures would have helped to equalize spending, historians and education policy researchers
have argued that the provisions of A.B. 65 caused citizens to wonder whether their property

77
taxes were going to help their schools (instead of helping the schools of other people’s children)
(Fischel, 1989). Many Californians, especially those in wealthier districts, no longer saw
property taxes as a tool that they could use to improve their local schools. As a result, property
taxes' support began to erode (Fischel, 1989; Sexton & Sheffrin, 1999). This loss of support
reached a fever pitch in 1978 when a citizen's group against taxation formed under businessman
Howard Jarvis's leadership. The group received enough support for a ballot initiative in the 1978
elections, named Proposition 13.
Proposition 13 was a broad, blunt property tax-cutting ballot initiative. Dissatisfied
taxpayers led the charge to pass the proposition in an attempt to lower their property taxes. The
proposition permanently limited property tax increases to no more than one percent of the
assessed value of individual properties, which effectively slashed average rates in half in 1978
(Fischel, 1996). Additionally, the act required all property tax rates to roll back to 1975 levels.
The annual increase in the market value of local property was restricted to two percent per
assessment. The rollback in property tax rates and increased market value restrictions equated to
a six billion dollar reduction in California's property tax revenues (Chapman, 1998). The ability
to change Proposition 13 in the future was made exceptionally difficult as it was added as an
amendment to the state constitution. The proposition required that two-thirds of voters must vote
on any special non-property local taxes, and it forbade the creation of a statewide property tax.
The statewide property tax had been suggested as a remedy for the Serrano ruling.
Proponents of Prop 13 argued that it would enhance the California economy over time.
They asserted that people would take the additional money they did not pay in taxes and use it in
the marketplace, which would grow the overall economy. Republican Governor Ronald Reagan
said, "The loss of revenue for any period of time will not happen unless the people bury that

78
money in a tin can in the back yard" (New York Times, 2016). Prop 13 can be viewed as an early
experiment in Reagan's idea of "trickle-down" economics that he would eventually bring to the
rest of the country as President in the 1980s. However, Governor Reagan’s assertion did not play
out in reality as lost revenue led to an overall reduction in California education funding over the
next 20 years. Proposition 13 passed on June 6, 1978, by a 2-1 state margin.
The successful passage of Prop 13 was broadcast to the nation through national television
and newspaper articles. California’s State Superintendent of Public Instruction Wilson Riles said
in a news conference that the proposition "will do nothing short of destroy education in
California as we know it" (New York Times, 2016). The passage of Prop 13 represented a
fundamental shift in the way the balance of state and local funding for school districts in
California. The California legislature passed Assembly Bill 8 in 1979. Under this bill, the state
took control of the majority of school district funding. During the decades following Proposition
13, California went through a long decline in expenditures per student. Figure 5.1, a chart created
by California non-profit EdSource, shows expenditures per student from 1970-2016. California
is represented in blue, the national average is in black, and every other state is grey. Over the
past 46 years, an increasing number of states surpassed California in expenditures per student. In
1970, California was 8th in the nation in spending per student, and by 2016 the state had fallen to
25th Willis, Fensterwald, Xie, Levin, & Osborn D'Agostino, 2018).
In 1988, partially in response to rapidly declining state education investment post-Prop
13, the California voters passed Proposition 98, which guarantees a minimum percentage of the
annual state budget must be spent on K-12 education. The purpose of Prop 98 (which amended
the California constitution) was to provide school districts with a dependable source of funding

79
that grew with the economy through a rather complicated formula. Broadly, there are three tests
created by the California state legislature described in Prop 98 that determined school funding.
Figure 5.1 K-12 Expenditures Per Student (in Thousands)
Note: Figure from EdSource, which used data from the National Center for Education Statistics, CCD (Willis et al., 2018). Test 1 (Share of General Fund) – this test stipulates that 39% of General Fund revenues shall go
to education funding. Test 1 was the baseline for Prop 98 and has not been satisfied since its first
year in 1988-89. Test 2 (Growth in Per Capita Personal Income) increases the prior-year funding
by growth in attendance and per capita personal income. Test 2 is the primary test used in years
with average to robust General Fund revenue growth. Test 3 (Growth in General Fund Revenues)
increases upon the prior-year funding by growth in attendance and per capita General Fund
revenues. This is the test that the state legislature uses when General Fund revenues fall or grow
slowly. Test 3 is crucial as it was what the California state legislature mainly relied upon during

80
the recession. This formula's funding makes up 70% of school district funding, with the rest
coming from federal and local sources (The California Legislative Analyst's Office, 2005).
California School Finance Policy During the Great Recession and its Consequences
The Great Recession greatly, negatively impacted the economy of California. The state
experienced high unemployment rates of just over 12%, and the governor's 2008 budget
projected a $42 billion deficit (Taylor, 2018). These deep cutbacks extended to severe cuts to
education funding. As mentioned above, California funds its schools primarily through state
revenue. The theoretical advantage of relying on state revenue for education funding is that a
more centralized authority can distribute money more equitably. In California’s case, the state
legislature distributes state education money through a funding formula that considers student
factors such as poverty, special needs, English language learners, and others. However, the
disadvantage of school districts primarily relying on state revenue is that fiscal shocks (such as
recessions) significantly impact states' ability to fund education. California relies heavily on
income and sales taxes for its annual budget, which took major hits during the recession. Figure
5.2 summarizes the average percentage of California state revenue vs. local and federal revenue
that school districts received from 2005-2013. Since school districts were so reliant on state
revenue to operate, decreases to education funding from the state had a considerable effect on
district budgets. Budget deficits were even more pronounced in higher-poverty school districts
because they relied more heavily on state funding than lover poverty school districts (Shores &
Steinberg, 2017).

81
Figure 5.2 California State Share of Total Public K-12 Revenue
Source: Chart adapted from Maciag (2015), Data from U.S. Census Bureau 2005-2013 Annual Surveys of School System Finances (Maciag, 2015).
California made deep budget cuts in the years during and after the Great Recession. Of all
of these cuts, California public schools were hit hardest. From 2007-2011 K-12 education
funding was cut by 14%. This is as compared to other budget items such as a nine percent health
and human services cut and a nine percent prison system cut. By August 2009, the California
Teachers' Association estimated that approximately 17,000 of its members (around five percent
of the state's teaching force) had been laid off that year (Shambaugh, Kitmitto, Parrish,
Arellanes, & Nakashim, 2011). In March 2010, California's State Superintendent of Public
Instruction announced that, in total, 22,000 teachers (nine percent of the state's teaching force)
received layoff notices (California Department of Education, 2010). These layoffs led to a rise in
the average student/teacher ratio from 19.4 in 2008 to 21.9 in 2012. California has a "last in,
first-out" (LIFO) tenure statute that states that school district administrators have to dismiss un-
tenured teachers (tenure is granted after two years in California) before dismissing tenured

82
teachers. The LIFO policy meant that many teachers who were laid off were newer teachers,
many of whom chose to pursue other careers, which led to a teaching shortage starting in 2013.
Between the years 2007 and 2012, several state-level policy changes were enacted to
counteract the effects of the fiscal crisis, including reduced incentives for smaller class sizes, a
reduction of the number of required school days, temporary waivers to delay the purchasing of
new instructional materials, deferral of payments of state funds to districts, changes in district
financial reserve requirements, and the removal of a requirement for districts to match funds on
maintenance projects. Table 5.2 shows the budget deferrals made by the California state
legislature from the years 2008-2012. As the frequency of deferrals increased, so did the length
of time that it took the State legislature to make late payments. The average time that payments
were late went from as little as a few weeks in 2008, up to nine months in 2012. Districts were
often forced to tap into their emergency reserve funds to fill budget holes left by state revenue.
Districts were also allowed to borrow from private lenders, their County Offices of Education, or
their County Treasurers. However, school districts were responsible for making all principal and
all interest payments to lenders. In light of the confusion, many district leaders chose to
conservatively budget, which led to decreases in per-pupil spending. The decreases in per-pupil
spending are evidenced in the sample districts that are discussed in greater depth below.
Table 5.2 Education Funding Deferrals by the California State Legislation 2008-2012
Year Deferral Amount 2008-2009 $3.2 billion 2009-2010 $1.8 billion 2010-2011 $1.8 billion 2011-2012 $2.2 billion
Note: Data from California Legislative Analyst Office (2012)

83
In 2009, the California state legislature enacted SBX3-4 to counteract declining state
revenue. This bill combined all of the state's categorical programs into one fund that equaled
approximately $19.1 billion. Within this larger grouping, the legislature designed three tiers of
funding with varying levels of flexibility. Districts were given complete flexibility over Tier III.
Tier III included 40 of the 60 previous categorical programs provided by the state department of
education. Table 5.3 lists all Tier III categorical programs.
Tier III programs most often support programs such as funding for school safety
programs, 9th-grade class size reduction, gifted and talented education, principal training, and
professional development. (Stecher, Fuller, Timar, & Marsh, 2012). Table 5.2 contains a full list
of all Tier III categorical programs for 2009-2010. Notably, the California state legislature did
not clearly articulate what they hoped to achieve with this funding flexibility. For instance, it is
not clear if they had expected that districts would prioritize specific Tier III categorical programs
and shift funding towards those programs. A 2012 study conducted by the RAND Corporation
found that, of the 223 school districts that responded to their survey, many of the Chief Financial
Officers (CFO) of the districts were confused over the purposes of the flexibility. Luckily for
students, many CFOs reported that the Tier III funds were "swept" into district general funds and
were prioritized for staff retention, fiscal solvency, and preserving instructional programs
(Stecher et al., 2012).

84
Table 5.3 List of California Tier 3 Categorical Programs 2009-2010
Targeted Instructional Improvement Block Grant Adult Education Regional Occupational Centers and Programs School and Library Improvement Block Grant Supplemental Instruction Instructional Materials Block Grant Deferred Maintenance Professional Development Block Grant Grade 7–12 Counseling Charter Schools Categorical Block Grant Teacher Credentialing Block Grant Arts and Music Block Grant School Safety Block Grant Ninth-Grade Class Size Reduction Pupil Retention Block Grant California High School Exit Exam Supplemental Instruction California School-Age Families Education Professional Development Institutes for Math and English Gifted and Talented Education Community Day Schools Community-Based English Tutoring Physical Education Block Grant Alternative Credentialing/Internship Programs Peer Assistance and Review School Safety Competitive Grants California Technology Assistance Projects Certificated Staff Mentoring County Offices of Education Williams Audits Specialized Secondary Programs Principal Training American Indian Education Centers Oral Health Assessments Advanced Placement Fee Waivers National Board Certification Incentive Grants Bilingual Teacher Training Assistance Program American Indian Early Education Program Reader Services for Blind Teachers Center for Civic Education Teacher Dismissal Apportionments California Association of Student Councils

85
Tier III flexibility proved to be the most critical policy decision that the state legislature made in
light of its continued deferrals. All of the school districts in this study reported using the funds to
maintain teaching positions, avoid reducing salaries, and keeping instructional programming
intact. Despite the flexibility in Tier III funds, the magnitude of California’s education funding
cuts still resulted in school district leaders making staffing cuts, increasing class sizes, shortening
the number of days in the districts' school year, and cutting after school educational
programming. In addition to instructional expenditures, schools were forced to cut other capital
outlay and support services that included transportation and maintenance and facilities
(Shambaugh et al., 2011).
In 2012, California Governor Jerry Brown introduced Proposition 30 or the Temporary
Taxes to Fund Education Act. This proposition contained a personal income tax increase over
seven years for Californians with annual incomes over $250,000 and increased the state sales tax
by a quarter of a percent over four years. Voters passed Prop 30, 55% to 45%. This act brought
in an additional $4 billion a year for education. It helped to alleviate the potential of even deeper
education funding reductions that many school leaders predicted would have occurred.
The broader education funding and policy trends in California during the recession are
essential to understanding the analysis of school districts to follow. The school leaders in each of
the six California districts in this study were making decisions in the context of all of the
information above. The following section is an analysis of three low and three high poverty
school districts in California during the Great Recession.

86
Analysis and Findings
Capistrano Unified School District
Capistrano Unified School District is a large, suburban school district in southern
California. It is the second-largest district in Orange County and the eighth largest in the state,
with an average daily membership of 52,000 in 2008. Capistrano USD had a predominantly
white student population from 2008-2012 (62%). The next largest student groups include
Hispanic students at 25%, Asian students at seven percent, and African American students at six
percent. The average percentage of students eligible for free and reduced lunch percentage was
18%. When looking at levels of expenditure in instruction and support services in Figure 5.4, it
does not look like significant reductions occurred year over year. This section argues that
changes in expenditures did not meet the pace of growing enrollment within the district. The
district's low level of emergency reserve funding left them unable to counter delayed payments
by the state, and Capistrano's leaders had to make some drastic cost-cutting decisions around
transportation, instructional days, and support positions. The consequence of the district not
keeping adequate reserve funding is that they were not able to address the needs of a growing
body of students from low-income backgrounds.
There is some quick background information that may help to frame what was happening
in the school district as it entered the recession. CUSD's Board of Trustees came into the Great
Recession in an atmosphere of political turmoil. In 2005, a citizen's committee called the
Committee to Reform CUSD waged a successful campaign to oust the full school board and
superintendent due to a decision to close three elementary schools and reallocate that money
towards a new high school. In early 2008, local community members once again pushed to recall
two district trustees amid accusations of financial mismanagement and corruption. Specifically,

87
the community was angry that the Board of Trustees paid out $653,350 to settle financial
lawsuits left behind by the districts' former superintendent. In June of 2008, 70% of Capistrano
voters voted in favor of the recall, and those two board members were replaced. The school
board's upheaval is potentially meaningful as it added an element of change along with state
funding deferrals and revenue reductions. The school district experienced its most significant
revenue drops in 2007 and 2008 right as the second recall occurred.
Capistrano USD entered the 2008 recession with reserve funding, sometimes referred to
as a "rainy day" fund, at around two percent of its overall budget. (CUSD, Annual Financial
Report, p. 13). California's reserve funding law is discussed more below, but two percent
represented a low reserve level in relation to other similarly sized school districts. In the 20 years
leading up to the recession, Capistrano Unified built 30 new district campuses to help with rising
enrollment numbers. The rapid pace of construction put Capistrano in a position where it
frequently engaged in deficit spending that ultimately harmed the ability of the district to
maintain a robust emergency reserve fund. Reserve funds are intended to help school districts
when revenue is volatile, when there are unexpected costs, to obtain higher credit ratings, or if
the district is saving for a sizeable future expenditure.
According to California's reserve funding law, a school district's required amount of
reserve funding was based on the average daily attendance of the district and is calculated as a
percent of the district's overall expenditures. Smaller school districts (enrollment-wise) were
legally required to keep a higher percentage of rainy-day funding than larger school districts.
School districts with average daily attendance the size of Capistrano had to set aside a minimum
of 2% of overall expenditures for reserve funding. Capistrano school leaders held their reserves
at the legally mandated minimum level in both 2007 and 2008 (Capistrano Unified School

88
District, Annual Financial Report 2007 and 2008). To compare that against other similarly sized
districts, the median percentage of reserve funding for a district of Capistrano's size in 2008 was
12% (Legislative Analyst Office, 2015). The critical point here is that district leaders had limited
cash on hand to address adverse funding such as the payment deferrals by the state legislature
and to handle growing enrollment. School district leaders were unable to mitigate the district’s
unforeseen revenue reductions because they kept reserve funds so dangerously low.
Capistrano Unified School District experienced steady growth in enrollment numbers
throughout the recession. In fact, from 2004 to 2012, the district gained 3,446 students. However,
increased revenue from increased enrollment did not offset local and state revenue reductions.
2008 was a particularly tough year in terms of revenue reductions for the district. Capistrano’s
state revenue fell 31%, federal revenue fell 30%, and local revenue fell by four percent. As
student enrollment rose year over year, per-pupil expenditures (PPE) fell. PPE fell three percent
from 2008 to 2009 and seven percent from 2008 to 2009. PPE raised slightly in 2010 and 2011
but again fell eight percent in 2012. By the end of 2012, the district was spending $1,163 less per
student than in 2008. While enrollment increased and per-pupil spending decreased, the
percentage of students eligible for free and reduced lunch rose eight percent from 2008-2012.
The district’s growing enrollment is essential because, as Capistrano Unified was experiencing
an increase in students, many with higher need (students with exceptionalities and students from
lower income communities), the district was spending less on all students on average. Figure 5.3
shows the percent change in per-pupil expenditures from 2004-2012. The following section will
discuss the spending reductions the board of trustees made that led to lower per-pupil
expenditures.

89
Figure 5.3 Capistrano Unified School District Per Pupil Expenditures Percent Change 2004-2012
Throughout the recession, Capistrano Unified’s superintendent and Board of Trustees
made moderate cuts to instructional spending, support services, and deep capital outlay cuts.
Figure 5.4 shows the percent change in different categories of expenditures from 2004-2012. The
percent change in capital outlay is not included as percent changes fluctuate wildly across the
eight years represented in the graph. Fluctuations typically correspond with the beginning or end
of a large building project or renovation. Capistrano USD reduced capital outlay costs by $9.3
million from 2008 to 2009. The two most prominent years of reductions in instructional
expenditures were 2008 with a $13 million reduction (a five percent decrease) and in 2011 with a
$21 million reduction (an eight percent decrease). In 2012, the district was spending $18 million
less than when the recession began in 2008. In 2008, district leaders made $28 million of cuts to
the district's $408 million budget (Capistrano Unified School District Annual Financial Report,
2008, p.10). Capistrano's 2012 budget included $18 million less for instructional expenditures
than 2008's budget (Capistrano Unified Annual Financial Report, 2012, p.12).

90
Figure 5.4 Percent Change in Instructional and Support Expenditures for Capistrano USD: 2004-2012
Over three months in 2008 (Capistrano Unified Board Meeting Minutes, January,
February, and March of 2008), the Capistrano school board deliberated over where to make
budget reductions given the sudden drop in federal and state revenue. According to the February
2008 meeting minutes, the Board of Trustees debated a potential layoff of nearly 220 to 250
teachers, mainly elementary teachers, who were newer to the district (Capistrano Unified Board
Meeting Minutes, February 2008). Newer teachers were more at risk of being laid off as a direct
consequence of California’s Last in First Out policy discussed above. To avoid mass teacher
layoffs, the Capistrano school board announced in July of 2008 that they had decided to make
drastic cuts to transportation and end the district's class size reduction program (Orange County
Register, July 28, 2008). $3.5 million was cut from the transportation budget, which reduced the
number of daily bus routes from 62 to 18. The radical reduction in bus routes eliminated
transportation service for 5,000 students across the district. Transportation reductions put
-10%
-8%
-6%
-4%
-2%
0%
2%
4%
6%
8%
10%
12%
2004 2005 2006 2007 2008 2009 2010 2011 2012
Instructional Expenditures Support Services Per Pupil Expenditures

91
immense pressure on families, disproportionately on families with lower incomes, to get their
students to school. In a 2008 Los Angeles Times article, a parent of a CUSD second-grade
student remarked, “All the parents, we’ve been scrambling to try to work out carpools…for
somebody that young, that’s a pretty long way to walk or ride a bike. All you need is one kid
getting hit to realize that maybe the savings wasn’t worth it” (Mehta, 2008).
Additionally, district leaders increased the maximum class size allowance to 30 students.
The decision to increase class sizes resulted from the California legislature’s decision to remove
restrictions on class sizes and remove financial incentives for lowering class sizes for school
districts. Classes even larger than 30 were considered but were averted due to a $1 million
donation from the district’s PTA (The Orange County Register, 2008).
In 2011, Capistrano USD had used all of its ARRA funding, and as a result, federal
funding fell 34%. Board leaders once again debated deep salary cuts. The discussion of further
salary reductions prompted the district's teacher's union to go on strike for three days. The
Capistrano Unified Education Association reached a settlement with the board of trustees and
superintendent to end the strike. The deal included a pay decrease of six percent, three non-
instructional furlough days (included in the pay decrease) and a corresponding pay cut (1.62 %),
five instructional furlough days, and corresponding pay cut (2.7 %) (Capistrano Unified School
District Board Meeting Minutes, June 27, 2012). The Capistrano board of trustees combined
teacher furlough days with a reduced the number of instructional days for students to fill the
budget gap for 2012 (Capistrano Unified School District Annual Budget, 2012, p. 10).
Additionally, Capistrano was able to pass a local property tax referendum that boosted local
funding by 26% between 2012 and 2013 (Capistrano Unified School District Annual Budget,

92
2012, p. 15). By 2013, state and local revenue nearly returned to 2006 levels, which helped
Capistrano rebuild spending levels.
Capistrano USD school leaders chose to cut support services over instructional
expenditures from 2004 to 2006. However, within those support reductions, there were decisions
made by the board that had direct effects on students. Cutting transportation puts stress on
families to find ways to get their students to school. Class size increases, as discussed in Chapter
2, can exacerbate racial and socioeconomic achievement gaps. The earlier students are exposed
to smaller class sizes at younger ages can have lasting positive education effects such as
increasing the probability to attend college and better scores on achievement tests (Baker, 2017;
Finn, Gerber, Achilles, & Boyd-Zaharias, 2001; Konstantopoulos & Chung, 2009; Krueger &
Whitmore, 2001).
In 2008 and 2011, there was a significant reduction in instructional expenditures that
mainly came from salary decreases, furloughed teachers, and reduced instructional days. In 2011,
the district's ARRA funding ended, resulting in federal funding being cut by a third. This federal
funding cut is vital because it demonstrates the problematic nature of budgeting on short term
revenue injections. School districts were able to boost expenditure levels temporarily, but many
in this study saw drops in spending after funding had run out. ARRA funding did not last long
enough to cover the amount of time it took states to restore pre-recessionary funding levels.
However, Capistrano school leaders were able to increase local funding and restore instructional
and support spending as early as 2012. The district was also able to solicit a sizeable donation
from parents who helped to keep teaching positions. Additional tax revenue and charitable
donations represent an advantage present in other low poverty school districts in this study that
were not in high poverty school districts.
93
There are three major takeaways from Capistrano USD that carry over to other districts in
this study. First, there is a trend in several other school districts where school leaders did not
keep robust emergency reserve funding. Emergency reserve funding is meant to offset budget
deficits in years of economic uncertainty. However, several school districts in this sample
borrowed from their reserves to fund capital projects or district expansion leading up to the
recession. This is a risky decision made by school leaders and bets that enrollment levels will
remain constant (which results in consistent local revenue levels) and that the overall economy
will remain stable. That bet did not pay off leading in to the recession. Second, Capistrano’s
school leaders decided to make major cuts to the district’s transportation service during the
recession. This is a highly consequential decision for students and parents for the reasons
discussed above. There is not a large body of academic literature on cuts to transportation and
their effects on students during the recession. Transportation budget reductions during financial
crises should pursued in future research. Last, though Capistrano suffered significant budget
reductions across the board, they were still afforded some unconventional revenue streams that
were not present in the higher poverty districts in this study. Specifically, a $1 million donation
from the local PTA. Extra streams of revenue, not easily seen in NCES data, appear again in the
following low poverty school districts in California and Texas.
El Segundo Unified School District
El Segundo Unified School District (ESUSD) is a medium-sized school district in
southern California (near Los Angeles) that had an average daily membership of 3,206 students
in 2008. An average of 12.1% of students were eligible for free or reduced-price lunch from the
years 2009-2012. El Segundo USD had a predominantly white student population in 2008 (71%).
The next largest student groups are Hispanic students at 17%, Asian students at eight percent,
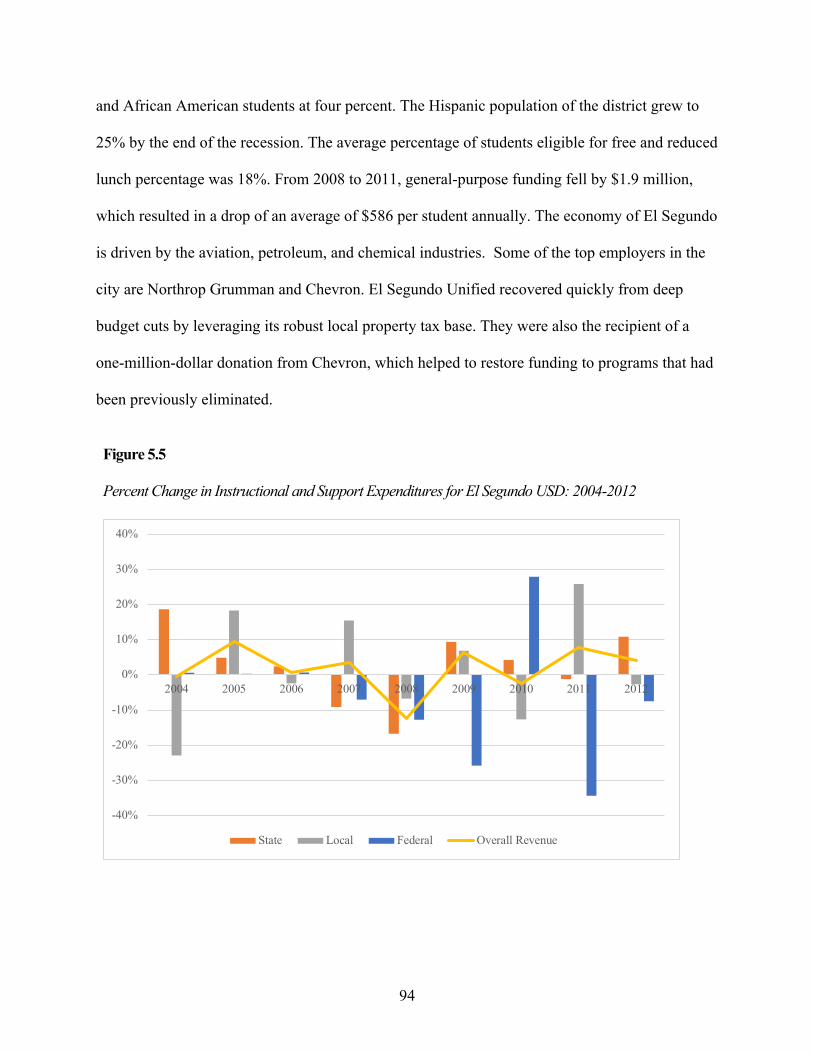
94
and African American students at four percent. The Hispanic population of the district grew to
25% by the end of the recession. The average percentage of students eligible for free and reduced
lunch percentage was 18%. From 2008 to 2011, general-purpose funding fell by $1.9 million,
which resulted in a drop of an average of $586 per student annually. The economy of El Segundo
is driven by the aviation, petroleum, and chemical industries. Some of the top employers in the
city are Northrop Grumman and Chevron. El Segundo Unified recovered quickly from deep
budget cuts by leveraging its robust local property tax base. They were also the recipient of a
one-million-dollar donation from Chevron, which helped to restore funding to programs that had
been previously eliminated.
Figure 5.5 Percent Change in Instructional and Support Expenditures for El Segundo USD: 2004-2012
-40%
-30%
-20%
-10%
0%
10%
20%
30%
40%
2004 2005 2006 2007 2008 2009 2010 2011 2012
State Local Federal Overall Revenue

95
ESUSD's superintendent and district budget officer gave annual budget presentations to the
school board and community. These presentations, available as slideshows on the district's
website, were compelling because district leaders highlighted the state budget cuts/difficulties
and translated them into what they meant for the district's ability to fund its educational program.
Figure 5.5 shows the percent change in instructional and support spending from 2004-2012. In
2009 the superintendent proposed no cost of living adjustments, cutting 30% of the districts
teaching assistant positions, and reducing other district activities such as teacher training to
account for budget shortfalls (2009 Governor's Proposed Budget Presentations, El Segundo
Unified School District, slide 23). Some of the highlights from these cuts and savings included:
• Reduction of the district advertising budget - $10,000
• Elimination of 4th/5th grade aide support - $51,000
• The removal of an annual conference budget for teacher training - $26,000
• Increase class size ratios in ESUSD High School - $141,000
These savings seem small, but given how the small enrollment size of the district, they helped to
address significant budget deficits. In addition to the budget reductions and savings, the board of
trustees approved the use of several one-time revenue sources, such as taking funding from the
district's emergency reserves and federal funding from ARRA (2008-2009 Annual Budget, El
Segundo Unified School District, p. 10).
In El Segundo's 2009-2010 adopted budget, the superintendent described the financial
course for the year as "tumultuous" and "unpredictable" when planning their annual revenue
limits (2009-2010 El Segundo Unified School District Adopted Budget, p. 5). The school budget
officer described trying to estimate the annual budget as a "roller coaster ride" because the state
legislature could not agree on how to balance the state budget and, as a result, missed vital

96
education funding deadlines. The payments that the district missed from the state had tangible
consequences because EUSD leaders found themselves unable to predict their annual revenue
stream from year to year even beyond average budgeting years. The inability to predict revenue
took away budget planning power from the district, which, as this study shows in multiple
district instances, often leads to more conservative budgets with more cuts in instruction such as
teachers, teachers' aides, and after school programs.
In 2009-10, ESUSD raised property taxes, which resulted in seven percent higher local
funding than in 2008. However, according to the first interim financial report for 2009, ESUSD
was still experiencing a negative cash flow; in other words, more money was spent than the
district was receiving (2009-10 First Interim Financial Statement, El Segundo School District, p.
4). Declining district enrollment contributed to the negative cash flow. ESUSD targeted
reductions in support staff positions to close the budget deficit (2009-10 Adopted Budget, El
Segundo Unified School District, p. 2). These cuts included a physical education teacher, a choir
accompanist, a high school counselor, a librarian, a custodian, and seven school administrators
(2009-10 Adopted Budget, El Segundo Unified School District, p. 3).
Fortunately for ESUSD, Chevron donated $1 million to 15 schools in the South Bay Area
of California as a part of their “Energy for Learning” grant program. The grant program was
intended to promote STEM-related programs in 2010. In an interview with the El Segundo
Herald, the district superintendent, Geoff Yantz, pointed to Chevron as a factor that helped the
district recover from the recession,
The state's actions in 2008 forced the El Segundo School Board to make some difficult
and painful decisions in order to maintain programs, staffing, and the quality of
education. Those decisions, along with the support from the City, Ed Foundation, PTAs

97
and local corporations like Chevron, have put us in a good position now. There are
districts still laying off people, using reserves, or having furlough days. Not us. We've
been fortunate to restore programs that have been eliminated or reduced, and our reserve
levels are adequate. We've got wonderful, engaging courses that are new at the Middle
School and High School and some initiatives going in place that will certainly make our
schools that much better (Simon, 2010).
The charitable donation from Exxon, in combination with an increase in property tax revenue led
to a 26% increase in local revenue from 2010 to 2011. This additional funding boosted overall
revenue and helped to slow district layoffs. El Segundo still cut three full-time equivalent
elementary school positions (FTE) and increased class sizes in their middle and high schools in
2011 (2010-11 Adopted Budget, El Segundo Unified School District, p. 5). Further cuts were
prevented by reallocating Tier III state funding back into the district's general fund. Funding for
programs in arts and music, gifted and talented education, school safety initiatives, and
maintenance were redirected towards retaining teachers and other instructional expenditures
(2010-2011 Adopted Budget, El Segundo Unified School District, p. 7). In the same year, El
Segundo also began a large capital project to renovate their athletic fields and auditoriums (2010-
2011 Adopted Budget, El Segundo Unified School District, p. 12).
El Segundo Unified School District is an example of a lower poverty district that did
conduct program reductions but was also able to limit those reductions by leveraging additional
revenue increases through private industry and local property taxes during the recession. ESUSD
was able to partner with the local private sector to get funding that mitigated many of the more
severe reductions seen in higher-poverty school districts. ESUSD's superintendent, budget
officer, and school board prioritized budget reductions further away from many core

98
instructional cuts until 2009, partially due to an adequate emergency reserve fund and the ability
to collect additional revenue from property taxes.
Like Capistrano USD, El Segundo's school leaders were able to leverage their local
property tax base to boost overall revenue. From a state policy perspective, the California state
legislature's decision to free up Tier III funding proved to be important in maintaining
instructional expenditures in El Segundo. The importance of adding local flexibility in spending
state categorical funding is an essential finding across all California districts included in this
study. It is also a crucial policy option for state legislatures to consider in future financial crises.
Simultaneously, this flexibility may have also allowed lower-poverty school districts to combine
more robust local tax bases with Tier III funding to enhance per-pupil funding disparities among
school districts in California.
Fremont Unified School District
Fremont Unified School District is located in Alameda County California. Fremont’s
economy contained a mix of manufacturing, major health service companies such as Kaiser
Permanente, and biotechnology companies. The district had 28 elementary schools, five junior
high schools, and five high school campuses in 2008. In the ten years leading to the recession,
Fremont USD's enrollment increased every year. Enrollment growth slowed but continued to
increase throughout the recession. Enrollment increased from 30,325 in 2008 to 32,767 in 2012.
The demographic makeup of Fremont students in 2008 was 50% Asian, 21% White, 14%
Hispanic, six percent Filipino, and five percent African American. The district's FRL percentage
was 18.8%, which was significantly lower than the state average of 55%. Fremont USD school
leaders faced many problems typical of California school districts during the recession that
included drastically reduced state revenues and state funding deferments. The leaders addressed

99
budget deficits primarily by using the State's Tier III flexibility program, temporarily furloughing
permanent teachers, and eliminating temporary teachers which will be discussed below.
Fremont USD's per-pupil expenditures steadily declined between 2008 and 2011.
Fremont USD also saw the most significant state, federal, and local revenue reductions between
2007 and 2009, which is in line with all other school districts in California. The Fremont school
board made the most significant reductions to instructional expenditures and support services
from 2009-2010. The district saw a 21% reduction in state education funding, a 19% reduction in
federal funding, and a 21% reduction in local funding in 2008. Revenue reductions combined
with increasing enrollment resulted in a drop in per-pupil expenditures throughout the
recession. These reductions were ultimately short-lived but did result in the loss of a significant
number of teaching positions (discussed in greater depth below).
By 2011, Fremont USD was spending more money on instruction, support services, and
capital outlay than before 2008 when the California state legislature began its drastic funding
reductions. According to a 2010 state budget update presentation created by the district's budget
and finance office, the increase in spending came from a variety of cost-saving measures. The
measures predominately centered around Fremont USD school leaders diverting funds away
from Tier III expenditures and towards core instructional expenditures such as retaining
contracted teachers (State Budget Update, Fremont USD Business Services Office, 2010). As
with other school districts in the state, the California state legislator's categorical flexibility
policy (that freed up Tier III funding to be used at school district leaders' discretion) proved to be
vital in allowing Fremont USD to avoid deep recessionary reductions.

100
Figure 5.6 Percent Change in Fremont USD Instructional Expenditures and Support Services 2004-2012
Figure 5.7: Fremont Unified School District Per Pupil Expenditure 2008-2013
-8%
-6%
-4%
-2%
0%
2%
4%
6%
8%
10%
12%
2004 2005 2006 2007 2008 2009 2010 2011 2012
Instructional Expenditures Support Services Per Pupil Expenditures

101
The most significant state policy that helped Fremont USD offset their annual revenue
losses was flexibility in Tier III funding. This is evident not only when looking at the district's
2009, 2010, and 2011 annual budgets, but the district's budget officers directly cite the
importance of reallocation of categorical funds in saving teaching positions in board
presentations during in 2010 and 2011 (2010, 2011, Budget Update Presentations, Fremont USD,
p. 5, p. 11). In 2010, Fremont USD's school board chose to reallocate $10,260,344 out of a
collection of programs that fell under Tier III funding from the State (State Budget Update,
Fremont USD Business Services Office, 2011). The $10.2 million primarily came from the
elimination of an art and music grant, elimination of an evening adult school program, and
deferred maintenance to the district's schools. The additional instructional funding was not
enough to fix the school district's budget gap for that year. In a February 2010 budget update
presentation, Fremont USD's budget office reported that additional budget cuts were to come
from class size increases across the district, operations, and ground maintenance reductions, and
laying off 11 school counselors (Fremont Unified School District, Budget Update Presentation,
2010). Class size increases in 2010 were varied by grade level, with grades 7-12 increasing to
28:1. The class size increases were particularly pronounced in Fremont's middle and elementary
schools. Grades 4-6 increasing from 25:1 in 2007 to 32:1 in 2010. Class size increases extended
to grades K-3, which grew from 28:1 in 2011 to 30:1 in 2012 (Fremont Unified School District,
Budget Update Presentation, 2011).
Fremont USD school leaders also chose to lay off and furlough teachers during the
recession. The Fremont USD school board chose not to keep 265 temporary teachers, 19% of the
district's total number of teachers, at the end of the 2009 school year (Asimov, 2009). The
elimination of the temporary teachers was in addition to the district eliminating 64 full-time

102
positions going into the 2010 school year and furloughed an additional 172 teachers in 2011.
While many permanent teachers were let go, the district primarily let go of temporary teachers.
In California, temporary teachers are those that school districts hire, generally on a one-year
contract, to fill positions left by permanent teachers on leave. Importantly, temporary teachers
can be let go at any time without cause, meaning that at any point during a given school year, a
temporary teacher's position can be eliminated. Steve Betando, the assistant superintendent of
Fremont USD in 2009, said in an online article that, "the district classifies as many teachers as
possible as 'temporary' employees so they can be laid off quickly and without the legal
notifications" (Asimov, 2009). The school district hired 121 teachers in 2012. It is difficult to tell
if these teachers were rehired at a later date as neither Fremont USD nor the California Teachers
Association kept records of the number of temporary teachers in the state. What is clear is that
the reduction in the number of teachers resulted in an increase in class sizes across the district.
Not all of the budget reduction plans that Fremont USD presented to the community
ended up being implemented. Many of the plans were created as worst-case scenarios in the case
that state tax increase proposals that need to be voted on by statewide referendum failed. School
leaders feared that a failed tax referendum would have left the state budget with a more
significant deficit and led to more severe reductions in state education funding. However, these
plans shed light on how school leaders prepared for worst-case scenarios. For instance, in a
February 2010 community budget meeting, the district's budget and finance office presented two
different budget proposals, one for if Governor Brown's tax proposal passed and one if the tax
proposal failed. In the case that the tax proposal failed, Fremont USD's school board presented a
plan that predicted an $11 million loss in state revenue (Fremont USD Business Services Office,
State Budget Update, 2011, slide 9). To address this loss in revenue, district leaders would have
103
eliminated 12 days from the school calendar. Teachers and staff were considered furloughed and
would not be paid during the eliminated days. The removed days would have included five
instructional days, two conference days, three staff development days, and the first and last days
of the school year. While this was a worst-case scenario plan for Fremont, all three of the high
poverty school districts in this study did end up removing instructional days in an attempt to
close budgets. Many school districts in California reduced their number of school days from 180
to 175 during the recession to save money. The Fremont school board's initial plan would have
eliminated even more instructional days from the calendar than five. The district did not enact
this plan, but their consideration shows the lengths that they were going to go to close their
budget deficits.
Fremont USD's school leaders made several budget reductions in spending categories that
have shown, through research, to greatly impact student learning. First, they made fairly drastic
reductions in the number of teachers in the district. Most of the teachers were temporary
teachers, but it still had the effect of increasing class sizes. The layoffs also meant that temporary
teachers were now jobless in one of the worst markets for teachers in a generation. As the district
was laying off teachers, they were also shifting Tier III funding away from the arts,
extracurricular programs, and programs meant to help the broader Fremont community. Though
Tier III funding flexibility helped to save instructional positions, it still came at a cost for other
spending categories. Programs that helped the Fremont community and enriched student learning
were lost due to severe state funding cuts. Fremont's instructional and support expenditures
began to recover around 2011-2012, like both El Segundo and Capistrano.

104
Fresno Unified School District
Fresno Unified School District (FUSD) is a large urban district in the San Joaquin Valley,
which is in the southern portion of California's Central Valley. FUSD is California's fourth-
largest school district and served an average of 66,179 students during the years 2009-2014. The
district averaged 82% of students who were eligible for free and reduced-price lunch. From 2008
to 2011, general-purpose funding fell $46.7 million, an average of $517 per student. FUSD's
student population is predominantly Hispanic (62%), followed by white students (13%), Asian
students (15%), and African American students (10%).
Even before the recession, the Fresno region suffered several economic setbacks. In the
mid-2000s, Fresno had a substantial population increase that was mainly positioned in center city
Fresno. From 2002-2005, Fresno issued 7,424 single-family building permits. This demographic
boom represented a 135% increase from 2002 to 2005 (Hollander, 2011). However, while single
and multi-family building permits were increasing, the student population declined due to falling
birth rates and younger families leaving the city. The Fresno K-12 population fell five percent
from 2002-2005 (Hollander, 2011). A sizeable agricultural sector primarily defines Fresno's
economy. By 2009, environmental issues related to a lack of water and proper irrigation resulted
in broader economic problems due to a stall in Fresno's agricultural industry. The lack of water
stalled Fresno's agricultural production, which resulted in a large number of job losses, which,
hand in hand with a falling housing market, put FUSD in economic trouble.
The first signs of education funding cuts came in the 2008-2009 FUSD budget. The
budget, which was put together by the FUSD Board of Education, shows a $1.4 million-dollar
loss in revenue from the state legislature, which was six and a half percent less per student than
the prior year. FUSD's Board of Education acknowledged the need to make cuts and prioritized

105
reductions in central office support departments. According to a 2009 school board budget
presentation, FUSD school leaders were intentionally making budget reductions as far away
from student learning as they could and stated that they were trying to minimize the impact of
budget reductions on teachers and students (Fresno USD Budget Forum, Fresno USD Division of
Business Services, 2009-2010). While the district’s budget cuts represented a relatively small
portion of the overall budget, it quickly became apparent that the budget reductions from the
state forced FUSD to make decisions on deeper cuts in a relatively quick fashion. In a May 2009,
school board meeting the Chief Financial Officer of the district stated that,
…due to the State of California's growing deficit of $24 million, Fresno Unified is faced
with reducing approximately $90 million from its total budget, which represents nearly
20% of its total budget. The state's dismal budget crisis is forcing Fresno Unified to make
substantial budget reductions even after reducing the budget by $15 million in the
2008/09 budget and another $46 million in February 2009. The district's healthy budget
reserve and federal stimulus dollars are buffering the sharp impact; however, the funds
are short-term, and the budget crisis is long-term (Fresno Unified School District, 2009).
Fresno's CFO's statement reflected similar trends that are found in other higher-poverty school
districts in this study. First, higher poverty districts were much more likely to point to drastic
budget reductions in their budgets and budget presentations earlier in the recession. Second,
more high poverty districts pointed to federal stimulus funding (ARRA and EdJobs) as fending
off the worst possible educational effects of the recession, mainly teacher layoffs. However, one-
time payments do not help to solve the problem of funding unpredictability and were often not
enough in higher-poverty school districts to fend off deep budget reductions.

106
Figure 5.8 Percent change in Fresno USD instructional expenditures and support services 2004-2012
-10%
-5%
0%
5%
10%
15%
20%
2004 2005 2006 2007 2008 2009 2010 2011 2012
Instructional Expenditures Support Services Per Pupil Expenditures
Figure 5.9 Percent change in Fresno USD Overall Revenue and Revenue Sources: 2004-2012
-20%
-10%
0%
10%
20%
30%
40%
2004 2005 2006 2007 2008 2009 2010 2011 2012
State Local Federal Overall Revenue

107
FUSD's school board presented a strategy in the 2009-10 budget to weather the upcoming
financial storm. The plan included 1) utilizing federal stimulus funds to mitigate additional cuts,
2) using Tier III categorical flexibility, 3) utilizing emergency reserves, and 4) implementing
ongoing office reductions in the central office of five percent. The FUSD budget shifted six
million from Tier III categorical programs into funding the purchase of instructional textbooks,
maintaining support for community-based tutoring, continuing professional development funds,
and maintaining funding to target instructional improvement for teachers. The Fresno board’s
strategy included program reductions, efficiency savings, and the identification of an additional
source of revenue, albeit a temporary one (federal stimulus funds). Fresno USD obtained
additional federal revenue, beyond ARRA funds, which helped the district address deficits in
special education programming. In Fresno’s 2009-2010 financial audit, the independent auditing
agency noted additional federal assistance funding in the form of IDEA Special Education
funding and additional Title I revenue (Fresno USD Financial Audit 2009-2010, p. 13).
In the 2010-2011 school year, FUSD began making budget reductions that were directly
associated with instructional expenditures and their overall educational programming. In Fresno's
2010-2011 adopted budget, FUSD identified several different areas of reduction, totaling $35
million, which included a reduction in professional development for teachers, a reduction in
elementary coaches, and further cuts to central office staffing. The budget also reported diverting
$20 million in Tier III funding towards instructional expenditures. The shift in funding out of
Tier III is another example of school district leaders using the freed up money to address
instructional budget holes. The 2010-11 annual audit showed that the district's net assets once
again decreased, this time by $94 million, mainly due to increased post-retirement benefits, an
additional retirement benefit incentive, and a reduction in state revenues.

108
Although neither the budget nor the annual audit mentioned teacher layoffs, the March
2011 school board meeting suggests a sizable loss of 461 teaching positions by attrition,
eliminated buyback days for teachers; implemented "furlough" days for all other employees; and
lowered district contributions to Health Fund and Workers" Compensation (March School Board
Meeting, Fresno Unified School District, 2011). Additionally, a 2013 report from EdSource, that
used data from the California Department of Education identified an additional 257 preliminary
layoff notices (7% of teachers in FUSD) issued to teachers in FUSD in the spring of 2011
(Freedburg, Frey, & Chavez, 2013). The elimination of teaching positions by attrition and
preliminary layoffs cut at the core of instructional expenditures that research has shown most
negatively impact student outcomes. FUSD eliminated an estimated 718 teaching jobs in one
year. Many of the teachers who received preliminary layoff notices were eventually hired back
when state revenue stabilized following Prop 30. Teaching layoffs impacted Fresno Unified far
past the end of the Great Recession. As of 2018, the district continued to struggle to fill the
teaching positions eliminated by attrition during the recession. FUSD has an acute teacher
shortage, particularly those certified in science, technology, engineering, and math (Jones, 2017;
Sutcher, Carver-Thomas, & Darling-Hammond, 2018).
From 2008 to 2012, FUSD experienced $120 million in state revenue cuts, which they
coped with by choosing to conduct teacher layoffs, reduce instructional days, defer maintenance,
and cut support services. By FUSD's second interim report of the 2013-14 fiscal year, district
administrators began adding back some of the programs and staff positions that had been lost
during the budget reductions of the previous six years. This was in part due to the passage of
Proposition 30, which helped the California state legislature bring in enough revenue to begin to
restore education funding to school districts. District leaders chose to prioritize and restore

109
funding in instructional positions and programming. They used the additional revenue to reduce
class sizes, increase career readiness programs, pay for 150 teachers to earn additional
credentials, and substantially increase their preschool program (Mongeau, 2013). The
experiences of FUSD stress the depth and speed that school districts that serve lower
socioeconomic areas were forced to make painful budget reductions in core instructional
expenditures that have been shown to impact the outcomes of students from lower-income
families positively. While lower-poverty school districts were able to decide to defer capital
outlay projects and benefited from stable local property revenue, higher poverty districts made
instructional cuts faster and that were more sustained.
Stockton Unified School District
Stockton Unified School District (SUSD) is an urban school district in central California
east of San Francisco and San Jose. The district operated 52 schools in 2008; 38 elementary
schools, six high schools, and eight specialty and technical schools. Stockton USD averaged an
enrollment of 38,292 students from 2008-2012. By 2012, enrollment had fallen to 32,767. The
demographic makeup of Stockton students in 2008 was 57% Hispanic, 18% Asian 12% African
American, and nine percent White. The district's FRL percentage was 72%, which was higher
than the state average of 55%.
Much like the city of Fresno, the city of Stockton was hit particularly hard by the Great
Recession. In the decade leading up to 2008, Stockton experienced a rapid increase in population
thanks to an influx of middle-class Bay Area residents looking for more affordable
housing. When housing market prices plummeted in 2008, Stockton got hit particularly hard
both in foreclosures and unemployment. In 2011, Stockton had the second-highest foreclosure
rate in the country. The city’s unemployment rate was 17%, which was six percent higher than

110
the state average and 11% higher than the national average. Stockton also suffered from a series
of budgeting mistakes. These mistakes which included double-counting $500,000 in parking
ticket revenue, equaled up to nearly $15 million in budget errors, including double-counting
$500,000 in parking ticket revenue.
The City of Stockton's economic challenges foreshadowed the financial difficulties of the
local school district. In 2008, the same year that the city of Stockton began to see the local
housing market fall, local revenue to Stockton USD fell 14%. The local revenue reductions came
in conjunction with a 10% state revenue reduction. Overall, there was a 13% drop in overall
revenue for Stockton USD in 2013. Figure 5.10 shows the percent change in revenue from 2004
to 2012.
The 2008 and 2009 state and local revenue reductions resulted in severe declines in
support services and instructional expenditures. Figure 5.11 shows the percent change in
instructional expenditures, support services, and per-pupil expenditures from 2004 to 2012.
Stockton USD school leaders reduced support services in 2008-2009 by 10%. Support service
reductions included laying off 55 of the district's 62 guidance counselors, four of the district's six
librarians, and 177 of the district's 377 instructional aides. In 2010-2011 the Stockton USD
school board approved a budget that included a 10% reduction in instructional expenditures.
Budget deficits and future projections grew so worrisome for district leaders that they
commissioned California's Fiscal Crisis and Management Team (FCMAT) to evaluate Stockton's
2010-2011 budget plans and offer recommendations for the district.

111
Figure 5.10 Percent Change in Stockton USD Revenue Sources: 2004-2012
Figure 5.11 Percent Change in Instructional Expenditures, Support Services, and Per-Pupil Expenditures 2004-2012
-40%
-20%
0%
20%
40%
60%
80%
100%
2004 2005 2006 2007 2008 2009 2010 2011 2012
State Local Federal Overall Revenue
-8%
-6%
-4%
-2%
0%
2%
4%
6%
8%
10%
12%
2004 2005 2006 2007 2008 2009 2010 2011 2012
Instructional Expenditures Support Services Per Pupil Expenditures

112
FCMAT's final report presentation painted a bleak picture for Stockton Unified. In their
report, FCMAT reported that "the 2010-11 budget and multiyear financial projection as adopted
by the district contained budget reduction measures that are not realistically achievable without
significantly impairing the district's ability to deliver a sound educational program." The fiscal
crisis management team also reported that reliance on one-time revenue sources and short-term
funding options had created the need for significant new reduction measures.
FCMAT, in their final report to SUSD, projected a $29.3 million-dollar shortfall by 2012-
13 and expected that Stockton Unified needed $15 million in budget reductions to maintain a 2%
emergency reserve. FCMAT presented their findings to the SUSD school board in June of 2011.
In the presentation to the board, the team stated that California's overall economic circumstances
would likely continue to deteriorate, which increased the likelihood that districts would continue
to experience additional cash deferrals in the future. FCMAT concluded their presentation on
Stockton USD's budget deficits warning that in the case that the district ran out of funds, they
would be taken over by the state legislature (Fiscal Crisis and Management Assistance Team,
2010).
Generally, what occurs when a school district is taken over by the state, is that the
California state legislature grants the school district a loan to continue operation, but puts control
of the district in the hands of the county superintendent of schools. The county superintendent
then appoints an administrator that does not have to consult with the school district
superintendent or school board when making budgeting decisions. The administrator's goal is to
make budgeting decisions that will allow the district to repay the state loan and bring the district
back to solvency. Once those two goals were achieved, the district would receive a degree of
autonomy back, but the district would still consult with a county appointed trustee when making

113
budgeting decisions for three years (Moleski, 2018). To further illustrate the process by which
the state could take over the district, FCMAT then went on to include a "What happens next?"
section where they stated,
The recovery process can take up to 20 years. The governing board will lose control, and
the District Superintendent position is eliminated. The district will be responsible to pay
the state loan with interest and the cost of a State Administrator. The FCMAT team will
make periodic assessments of the District's progress – an additional cost to the district.
(Fiscal Crisis and Management Assistance Team, 2010).
SUSD was nine months away from running out of money in August of 2011. The school
board planned to issue 498 layoff notices to teachers across the district. The district underwent a
major restructuring plan which moved $12 million of unrestricted funding to restricted funding.
That transfer of funding helped to stabilize the district’s budget and maintain the state minimum
two percent reserve level. Stockton also redirected $16.4 million of Tier 3 categorical funding to
support core instructional expenditures, which included retaining teachers, keeping the average
student to teacher ratio to 32:1, and maintaining salary levels. Examples of the categorical
programs that were either redirecting or eliminated for 2011 included gifted and talented
education ($309,791), art and music block grants ($509,417), a community-based English
tutoring program ($267,964), math and reading professional development for staff ($322,765),
and deferred maintenance ($1,321,861).
Tier III flexibility, once again, proved to be vital in boosting instructional spending. It is
essential because the flexibility to reallocate Tier III categorical funding allowed school districts
to redirect funds back towards instructional expenditures and support services. In figure 3, we
see that both of these spending categories begin to trend upward in 2010 and 2011 due to the

114
redirected funding from Tier III programs. In a December 2009 summary financial report for the
2010-2011 budget, the Stockton USD financial office reported an increase in spending in salary
benefits, books, classroom supplies, and summer school expenditures (2009-2010 1st Interim
Summary Financial Report, p. 5-8).
Stockton USD is one of the more extreme examples in this study. No other district came
as close to a total takeover by the state of California. The school district reflected the larger
economic conditions of the city. One of the more illuminating pieces of evidence for Stockton
was the report issued by California’s fiscal crisis and management assistance team. That report
got to the core causes of Stockton USD’s financial difficulties with a level of specificity that is
difficult to find in other school districts in this study. The report cited a handful of central causes
for the district’s financial distress which included declining enrollment, state education funding
deferrals, and the legislature’s revised apportionment schedule (Fiscal Crisis and Management
Assistance Team, p. 3, 2010).
The causes listed by the FCMAT report were not unique to Stockton USD. They
appeared in every other district in this sample. What was different about Stockton USD was the
financial distress that they were already going through before the recession hit. Stockton USD’s
experience speaks to the value that more targeted financial assistance by the state and the federal
government would have provided. Clearly, not all districts entered the recession on a similar
fiscal footing. Some districts needed substantially more assistance than others. However, the
state legislature’s policy which provided flexibility in categorical funding and the U.S.
Department of Education’s implementation of ARRA were overly blunt. Districts like Stockton
needed direct, targeted relief that was more tailored towards their dire situation.

115
Does the Trend Hold? Cutler-Orosi Joint Unified
Stockton USD and Fresno USD are both large urban school districts in California. Both
school districts show similar trends in revenue and expenditure reductions from 2008-2012. Did
these trends look comparable for smaller, non-urban, high-poverty districts in California during
the recession? In both California and Texas, a barrier that I have run into is that smaller districts
often do not have historical public financial documents (annual budgets, budget presentations,
financial audits) as readily available as larger school districts. This is the case with Cutler-Orosi
Joint Unified, a school district whose publicly available financial records go back to 2017. In this
section, the quantitative data and trends from Cutler-Orosi Joint Unified will be compared to
Fresno Unified and Stockton Unified to see if the main findings from those two districts are
present in a smaller, rural district.
Cutler-Orosi Joint Unified School District (COJU) is a small, rural school district located
in mid-eastern California. The district covers the cities of Cutler and Orosi, which are positioned
at the base of the Sierra Nevada Mountain Foothills. The economies of both cities predominantly
rely on agriculture and manufacturing. Forty eight percent of city residents work in the
agriculture, forestry, fishing, and hunting industry (U.S. Census, 2019). The school district is
comprised of three elementary schools, one middle school, and one high school. In 2008 the
average daily enrollment of the district was 4,062 students. Enrollment grew throughout the
recession, and Cutler-Orosi had an enrollment of 4,178 students by 2012. The district's student
population is predominantly Hispanic at 94%, followed by students of Asian descent at two
percent, and white students at two percent. The average percent of students eligible for free or
reduced-price lunch was 96% from 2008-2012. In this section, I will begin by discussing Cutler-

116
Orosi's revenue streams during the recession and compare them to Stockton USD and Fresno
USD. A discussion of expenditures will follow.
Figure 5.12 Percent Change in Cutler-Orosi Joint USD Revenue Sources: 2003-2012
Overall revenue fluctuated in a way similar to Stockton USD and Fresno USD. There was
a significant revenue reduction in 2008. Again, this is the same year that the California state
legislature made its deepest education funding cuts. The data did show a substantial boost in state
funding in 2006. The California state legislature did increase overall education spending by $5.2
billion in its 2006 state budget (California Legislative Analyst Office, 2006). However, state
revenue saw a sharp decrease in 2007 and 2008. Also similar to Stockton USD and Fresno USD,
federal revenue increased in 2008. Cutler-Orosi Joint USD's percent of the increase was higher
than either Stockton or Fresno. The dramatic increase may be because COJU was getting
relatively little federal funding before the recession. Like other school districts in this study,
-20%
-10%
0%
10%
20%
30%
40%
2004 2005 2006 2007 2008 2009 2010 2011 2012
State Local Federal Overall Revenue

117
federal funding was essential for COJU to offset state revenue reductions and appears to be
important in maintaining instructional expenditures. A primary difference between the revenue
changes in COJU and those in Stockton/Fresno is that post-2010, there is not the same revenue
recovery. State and federal funding continue to diminish, which has a direct impact on both
instructional and support expenditures in 2011 and 2012.
Figure 5.13 Percent Change in Cutler-Orosi Joint USD Expenditures: 2003-2012
Unlike the district's revenue changes, COJU's expenditures look quite different from both
Stockton and Fresno USD. School district leaders maintained and increased instructional
spending throughout the first three years of the recession. Beyond just increased federal revenue,
it appears that school leaders were able to increase instructional expenditures in 2008 by making
a seven percent reduction in support services and operations. District leaders slashed the district's
-10%
-5%
0%
5%
10%
15%
2003 2004 2005 2006 2007 2008 2009 2010 2011 2012
Instructional Expenditures Support Services Per Pupil Expenditures

118
transportation budget by 61%. Additional cuts came from eliminating a district administrator, 14
administrative support staff, and one secondary guidance counselor. However, as federal
funding dried up and state funding never recovered, they eventually did make significant cuts in
2011. Another significant difference between COJU and all of the other districts from California
in this study is that COJU continued to see a decrease in expenditures in 2011 and 2012. By that
time, all five of the other districts were seeing at least moderate increases in either instructional
or support pending. In 2011, COJU eliminated 10% of their instructional positions. Those cuts
included eliminating 33 elementary teaching positions, five secondary teaching positions, and 19
instructional aides. The removed positions brought the district's student to teacher ratio from 18
to 1 in 2010 to 20 to 1 in 2011. The ratio increase may seem small, but for such a small student
population, this can be meaningful to students' education. The decline in revenues also had a
direct impact on per-pupil spending in the district. As Figure 5.14 shows, per-pupil spending fell
10% between 2010 and 2012.
There are two main takeaways from the analysis of Cutler-Orosi Joint Unified's revenue
and expenditure data. First, the district's overall revenue trend is similar to both Stockton USD
and Fresno USD from 2008-2010. Federal revenue played a critical role in allowing total
revenue to bounce back after the state's 2008 education funding cuts. In 2008, COJU school
leaders decreased support spending and operations before instructional expenditures in 2009. The
cuts to transportation and guidance counselors were meaningful cuts to students, particularly in a
rural community that may not have access to public transportation. Second, federal funding may
have been even more significant in COJU than in other districts.
Figure 5.14 Changes in Per Pupil Spending in Cutler-Orosi Joint Unified School District: 2003-2012

119
What is different from other high poverty school districts in this study is that instructional and
support expenditures fell in 2010 and 2011, along with per-pupil spending. On the other hand,
Stockton and Fresno saw expenditure and per-pupil spending increases in 2010 and 2011. The
timing suggests a lagged effect in expenditure reduction in COJU. What is noteworthy about that
lagged effect is that all three districts experienced their most significant budget deficits in the
same year, 2008. While federal funding was at its highest levels, in 2008 and 2009, COJU
increased instructional expenditures. As soon as federal revenue fell, spending in the district fell
as well. COJU'S reliance on federal funding reinforces the argument that a robust federal
stimulus injection was necessary to help school districts over the period that the California state
legislator was reducing education funding and deferring payments to districts. In higher poverty
areas, local revenue was not able to support school districts through the recession. Federal
support would have been even more helpful for COJU had it been extended to match state
revenue reductions. State revenue continued to fall in California through 2012, while ARRA
funding dropped away in 2011.

120
Conclusion
All of the California school districts in this study went through painful years of revenue
and expenditure reductions. Table 5.4 contains a synopsis of the major program reductions made
by school district leaders in this study and how they made those reductions. The drastic budget
reductions greatly impacted the lives of students, teachers, and community members. The
difference between the high and low poverty districts is in the length and severity of their
expenditure reductions, particularly in per-pupil expenditures. Stockton USD, Fresno USD, and
Cutler Orosi JUSD all had year over year decreases in per-pupil expenditures through
2012. Fremont USD and El Segundo USD had increased per-pupil spending as early as 2010.
This means that for two additional years, school districts that already had student populations
that required additional resources, continued to spend less on students than lower poverty school
districts. This is important because research has shown lower test scores and lower graduation
rates for students exposed to large spending cuts for more extended periods during the recession
(Jackson et al., 2018). Table 5.3 lists examples of the program reductions and strategies that
school district leaders used to achieve those reductions. The reductions are separated by the
traditional F-33 spending category in which school leaders would report them to state and federal
authorities.
The extended length of the core budget reductions in higher-poverty school districts also
speaks to the need for either an extension of ARRA or another round of stimulus funding from
the federal government. ARRA’s three to four-year disbursement saved many teaching positions
and other critical instructional expenditures, but it is clear that those school districts were once
again forced to make painful staffing cuts in the years after that. The federal government’s
stimulus funding was somewhat blunt and not tailored to individual states or school districts'

121
unique budgetary needs. Also, the federal government had no reassessment of funding needs
following the end of emergency education funding. The lack of a reassessment or second round
of funding ignored the reality that most state governments, by 2012, still could not adequately or
equitably fund education in their states. The mismatch in the timing of distributing aid was even
more pronounced in Texas, where the worst economic effects of the Great Recession did not
present themselves until two years after ARRA funding had been distributed.
This chapter demonstrates that one of the most significant policy decisions the California
state legislature made was to free up categorical funding and allow school leaders to decide the
best use of that money. All six of the school districts studied cited Tier III flexibility as a major
contributor to maintaining instructional expenditures. School leaders did spend categorical
money on critical instructional expenses such as keeping teachers, lowering class sizes, and
maintaining summer and after school programs. While freeing up categorical funding was
necessary; there are some questions related to funding equity raised by the policy's uniform
nature. Tier III flexibility was granted to all school districts in California at the same time,
without regard for individual districts' financial condition. That means that school districts that
did not significantly cut spending had the same ability to reallocate Tier III funds as struggling
school districts. This study has found that lower poverty school districts already had a greater
capacity to grow local funding through increased property tax revenue or alternative sources.
Some of the alternative sources found include the $1 million PTA donation in Capistrano USD
and the Chevron donation in El Segundo USD.

122
Table 5.4 Program Reductions during the Great Recession in California NCES Defined Expenditure Categories
Examples of Local Program Reductions Found in My Analysis
How District Leaders Made Reductions
Instruction expenditures
Teacher layoffs Frozen teacher salaries Cuts to special education services Loss of instructional days Loss of pay during eliminated instructional days No cost of living adjustments Elimination of summer school Elimination of art and music grants Elimination of gifted and talented programs
Tier III funding redirected Positions eliminated by attrition Eliminating newer teachers in higher poverty schools Increased class sizes Reduced professional development days Restricted conference and travel for teachers
Support services Instructional staff
support Teacher aid layoffs
Student support services
Elimination of after school programs Counselor layoffs Psychologist layoffs
Operations and non-instructional expenditures
Energy saving strategies Custodial layoffs Deferment of purchase of instructional material
Installation of solar panels Strict energy guidelines for HVAC
General administration Central office layoffs Facilities and construction
Closing schools within districts Elimination of maintenance expenditures Elimination of construction expenditures
Deferment of planned maintenance Deferment of planned construction
Debt services Deferment of debt payments, accrual of interest Deficit spending
Increased debt issued

123
Additional local revenue sources and freed up categorical funding combined to give
lower poverty districts an advantage over lower poverty districts recovering from the recession.
That advantage came from the ability of lower poverty districts to recover from budget deficits
faster than higher poverty districts. While higher poverty districts were using the categorical
funds to catch up with their budget deficits, lower poverty districts were able to close budget
gaps faster and get ahead. Research has shown that education funding decisions made during the
Great Recession made the gap in per pupil spending between high and low poverty school
districts worse (Evans et al., 2015; Shores & Steinberg, 2017). The growth in per pupil spending
disparities may have been reduced had the state legislature allowed only higher-poverty school
districts or school districts with significant spending cuts to use their Tier III funding to address
instructional cuts.

124
Chapter 6- Education Funding Slashed: Texas
The state of Texas did not go through the Great Recession in the same way as California.
The recession lagged in Texas which resulted in the state not experiencing widespread housing
foreclosures or severe unemployment until two to three years after the rest of the nation. The
state legislature (which is in session once every two years) did not plan for the severity of budget
cuts that they would need to make to address state revenue shortfalls because in 2009 it looked as
if Texas would come out of the recession fairly unscathed. By the 2011 legislative session the
recession had already hit Texas. Due to the two years between sessions, the legislature had to
make jarring, severe education funding cuts. The legislature (in conjunction with the governor)
chose not to use the state’s emergency reserve fund (discussed at length below) which would
have helped to alleviate some of the more severe impacts of the recession particularly for higher
poverty school districts.
The first research question of this study aims to address specific budget reduction
decisions of school leaders This chapter’s analysis shows that the Texas legislature’s 2011
education funding cuts influenced school leaders to make reductions in instructional faculty far
sooner than in the majority of districts from California included in this study. Another question
looks to examine the budget reduction decisions of high and low poverty districts in California
and Texas. The budget reductions of high poverty districts in Texas were often not as severe due
to healthier local economies like in San Antonio ISD or Laredo ISD. Several key state industries
such as oil and manufacturing maintained their strength during the recession and as a result local
revenue did not drop in the same way that it did in Texas. This is not to say that districts did not
make painful reductions, but that the cuts looked different than in California. Like California,
lower poverty school districts were able to compensate for budget deficits through leveraging

125
healthier local tax bases and through additional revenue streams not easily found in NCES, or
any other, school financial data.
Chapter 6 begins with a brief overview of enrollment in Texas in 2009 and a description
of the sample. As mentioned previously enrollment in a central component in the school funding
formula of both states. Therefore, it is helpful to have a broad understanding of the enrollment
landscape at the time of the recession. Next, there is a very brief history of the significant
changes that occurred to the Texas school finance system from 1984 to 2008, highlighting some
of the more famous court cases and policy changes. Finally, there is a detailed presentation of the
central findings (discussed briefly above) from the analysis of Texas school districts.
Brief Overview of Enrollment in Texas in 2009
In the 2009-10 school year, there were 1,200 school districts in Texas containing
4,847,844 students. The NCES demographic breakdown of students in the state was 48.6%
Hispanic or Latino, 33.3% White, 14% African American, and 3.7% Asian/Pacific Islander. The
Texas Department of Education reported that 58.9% of students are considered
socioeconomically disadvantaged, meaning students who are eligible for free or reduced-priced
meals. Hispanic students made up the largest percentage of students who were designated
economically disadvantaged at about 75%, followed by African American students at 62%,
Native American students at around 41%, Asian/Pacific Islanders at 30%, and White students at
approximately 25%. 14.2% of students are English Language Learners (Texas Education Agency
Division of Accountability Research, 2010).
Table 6.1 contains the names of all of the school districts examined in this chapter, the
districts’ respective sample group, and the Common Core of Data (CCD) locale code. The locale

126
code is included to give an idea of how the National Center for Education Statistics
geographically designates each sample school district.
Table 6.1 Texas Sample Districts by Sample Group and CCD Locale Code Texas School District Sample Group CCD Locale Code Danbury ISD 1-Low Poverty 41-Rural, Fringe Forney ISD 1-Low Poverty 41-Rural, Fringe Hutto ISD 1-Low Poverty 41-Rural, Fringe Kingsville ISD 5-High Poverty 32-Town, Distant Laredo ISD 5-High Poverty 12-City, Midsize San Antonio ISD 5-High Poverty 11-City, Large
A Brief History of School Finance in Texas
In 1984, the Edgewood Independent School District sued the Texas commissioner of
education, William Kirby, arguing that the state’s school finance system was inequitable and that
it violated the state’s constitutional education clause. In 1989, the Texas Supreme Court ruled
that the state’s system did violate the Texas state constitution citing glaring disparities between
wealthier and poorer school districts. As a result, in 1990, the Texas state legislature devised a
new funding system meant to equalize school funding across districts. However, the new scheme
included a “hold harmless” clause, which excluded wealthier districts so that they did not lose
their current levels of funding. As a result, the Texas Supreme Court found this new system still
violated the Texas state constitution forcing the legislature to revise the state’s funding system
once again. In 1991, the legislature approved a plan for 188 school districts to consolidate their
property tax bases with wealthier school districts to equalize school funding better. In 1993, the
state legislature forced districts in areas with high property values to share tax money with
lower-income districts through what is known as Chapter 41 recapture or more colloquially

127
known as the state’s “Robin Hood” plan (discussed in greater depth below). The Texas Supreme
Court upheld this plan in 1995 (The Associated Press, 2015).
In 2001, property wealthy school districts sued the state, arguing that state funding had
been so inadequate that school districts were forced to tax at the maximum local rate to keep up
with educational costs. By maximizing the local tax rate, the 70 property wealthy districts
contended that Texas’s school finance system essentially created an illegal property tax. Three
hundred additional school districts, including property-poor school districts, joined the 2001 case
expanding it to argue further that the state school finance system was both inadequate and
inequitable. In 2005, the Texas Supreme Court ruled in the plaintiff’s favor agreeing that local
property taxes, when consistently pushed to the legal limit, amounted to an unconstitutional
statewide tax. In response to the ruling, the Texas state legislature cut local school property taxes
by one-third and allocated more state funding to public education, which still did not fully
compensate for the gap in per-pupil funding across the state. In 2006, Texas legislators passed
minimum funding requirements for districts based on a temporary per-pupil spending freeze in
the amount that districts spent that year. Notably, that freeze was never lifted, which had
negative ramifications for many districts when the Texas legislature made education funding cuts
in 2011 which will be discussed in greater depth in the analysis of individual districts.
The Texas School Finance System
The Texas school finance system is a very complicated mix of state and local tax
revenue. The school finance system is designed as a “layered” or “tiered” system — the first tier
is based on the leveling calculations of the Foundation School Program (FSP) (Texas Taxpayers
and Research Association, 2012). The average mix of state vs. local vs. federal revenue that went

128
to schools is represented in Figure 6.1. School districts are primarily funded by local revenue in
Texas though that percentage has gone down since 2005.
Figure 6.1 Sources of K-12 revenue in Texas, 2005-2013
Source: Chart from Maciag (2015), Data from U.S. Census Bureau 2005-2013 Annual Surveys of School System Finances (Maciag, 2015).
The Foundation School Program
The Texas state legislature sets a biannual base per-pupil amount that the state will
provide, which in 2008 was just around $4,800 per student per year. This base amount is
adjusted, or weighted, per-student per-district depending on the needs of the students in that
district. The bulk of education funding in Texas comes from local property taxes with the state
making up for what school districts are not able to collect (often due a low taxable base).
Texas’s Foundation School Program (FSP) is the primary mechanism by which state revenue is
allocated to local school districts to help them achieve their base funding. On average 83% of
state funding to school districts that comes from the FSP comes from Tier 1 (see below); 7 %
comes from Tier 2 (supplemental funding) of the formula. The remainder comes from a semi-

129
tier, Tier 3, which is funding directly for facilities and debt service expenditures (Barba, Ginn,
Grusendorf, & Heflin, 2016; The Texas Legislative Budget Board, 2016).
Tier 1, or Basic Program Funding, is calculated using the enrollment size of a school
district and the types of educational needs of the students. Additional weights are for students
who receive special education services (based on full-time enrollment in special education
programs), students in career and technology programs, English language learners, compensatory
education aid (aid which is given for students performing below grade level or are in danger of
dropping out of school), programs that benefit students designated as gifted or talented, an
additional $275 for students in ADA in grades 9-12, an additional $250 for students in new
instructional facilities, and an additional $650 for students whose parents are in the military
(Texas Taxpayers and Research Association, 2012). The base allocation is assigned depending
on the average daily attendance (ADA) of the district that is then adjusted based on student needs
to create each district’s adjusted basic allotment. The state uses a cost of education (COE) index
to determine school districts adjusted basic allotment. The COE provides school districts with
multipliers, or weights, that are based on the beginning salaries of teachers in contiguous
districts, the percent of economically disadvantaged students in the district, the size of the
district, and whether or not the district is located in a rural county. The district size adjustment is
made to adjust for small (1600 or fewer students in ADA) or midsize (1600 ADA but fewer than
5000 ADA) school districts. When weights are added to the ADA, it is known as a weighted
average daily attendance or WADA.
Tier 2 of the FSP is known as an “enrichment” or supplementary fund, which is intended
to give school district leaders the flexibility to supplement their funding allotment from Tier 1
through additional local taxes if necessary (as determined by district leaders). The state will add

130
to whatever property taxes are raised to a certain level per student. The amount the state will
contribute is determined using the total projected revenue of Austin Independent School
District4. Since Tier 2 is also meant to help support a school district’s basic education program, it
has an overlapping purpose with Tier 1. This funding can go up to an additional $0.17 of tax
effort when maxed out with Tier 1 funding of $1.00, totals $1.17 per $100 of property valuation.
Table 6.2 provides a breakdown of each tier, the tier’s maximum rate allowed by state law, and
how districts can go about raising additional local taxes.
Table 6.2 Texas School Finance System Maximum Tax Rates by Tier Tier Maximum rate allowed Tier 1 $1.00 per $100 of property valuation
guaranteed by the state legislature Tier 2 Tier 2.1 “Golden Pennies” Maximum of $.06 per $100 of property
valuation $.04 allowed with only school district
approval $.02 requires voter approval
Tier 2.2 “Copper Pennies” Maximum of $.09 that requires voter approval
Tier 1 + Tier 2 maximum $1.17 per $100 of property valuation Source: Texas school finance: Basics and reform (Barba et al., 2016)
However, most districts find that they cannot offer that education on Tier 1 funding alone. In FY
2014, 94% of districts in Texas were taxing at $1.04 or above (the highest rate possible without
going through a tax election), and 28% of districts had reached the tax cap of $1.17 (Knight,
2017).
4 Austin IS was chosen as the benchmark district because it is equal to the 95th percentile of wealth. The state legislature was trying to tie the guaranteed yield to one of the wealthiest districts in the state.

131
“Tier 3” is not so much an official funding tier as it is a combination of two state
assistance programs intended to help with facilities construction and debt. The Instructional
Facilities Allotment (IFA) program was created in 1997 to help school districts with debt
payments on new facilities. The state gives the district $35 per ADA for each penny levied to pay
for new facilities. School districts must apply for this funding to the Texas Education Agency
(TEA). The Existing Debt Allotment (EDA) program was created in 1999 to help school districts
with debt payments on bonds.
Many property-poor districts in Texas are taxing at a higher tax effort, but often bringing
in much less per pupil than a property wealthy school district. Table 6.3 is reproduced from a
school funding guide by Chandra Villanueva. The table shows how despite a poor property
district taxing itself at a higher rate per $100 of property valuation, it ends up with lower revenue
per pupil than a property wealthy school district.

132
Table 6.3 Example of Wealthy vs. Property Poor Texas Funding
Property Wealthy Property Poor
Wealth Level (per WADA 2011) $953,659 $63,278
Weighted Average Daily Attendance 5,211 13,978
Compressed Tax Rate $1.00 $1.00
Adopted Tax Rate $1.04 $1.17
M&O Tax Collections per Penny per WADA
$95.76 $6.18
Tier 1 Funding (adjusted) $5,343 $5,064
Target Revenue per WADA $6,253 $4,914
Tier 2 Funding
Yield per Golden Penny $95.37 $59.97
Yield per Copper Penny $0.00 $31.95
State & Local M&0 Revenue per WADA
Tier 1 $5,343 $5,064
Tier 2 $383 $695
Hold Harmless added to Tier 1 $910 $0
TOTAL Revenue per WADA $6,636 $5,759
Table reproduced from School Finance Made Easy: Educational Instruction and Operation by Chandra Villanueva, 2015

133
The Recapture of Local Property Taxes Provision, AKA the “Robin Hood” Provision The Texas school funding system contains a recapture provision, Chapter 41, that ensures
a district’s property wealth per student does not exceed a certain level, known as an equalized
wealth level (EWL). For instance, if a district’s local revenue grows at a disproportionate rate to
the district’s growth in students, the difference is subject to recapture. The goal of the law was to
create a more equitable field for school funding in Texas (Texas Education Agency, 2014; Texas
Taxpayers and Research Association, 2012; Villanueva, 2018). The provision redistributes
excess money from property wealthy school districts (more specifically from districts that raised
more than required for their full student allotments from local taxes) to property-poor districts.
Each tier of funding has different levels of recapture. Recapture makes up about 4.5% of the
revenue the state receives to distribute to school districts through the Foundation School
Program.
The “Robin Hood” provision gives school districts five options to reduce its’ property
wealth per WADA in order to avoid recapture if it so chooses: 1) consolidate with another
district 2) detach district property from a district’s tax base which will be added to another lower
wealth district’s property 3) purchase attendance credits from the state 4) contract to educate
nonresident students from a partner district or 5) consolidate tax bases with another district
(Texas Education Agency, 2014). The Texas Education Agency reports that most districts
subject to recapture have chosen options three and four (or a combination of the two) to avoid
recapture by the state. The third choice requires a school district to reduce its wealth to the
equalized wealth level by sending money to the state to help finance FSP payments to other
property-poor districts.

134
The Great Recession in Texas and the Legislative Reaction for School Funding
Texas experienced the Great Recession in a very different way, and in a different time
than California. The state began to experience substantial budget shortfalls around 2009 with the
worst state budget effects in 2011. That is three years after most states in the country experienced
their fiscal shocks. The Texas Legislature meets in regular session only in odd-numbered years.
During these sessions, the Legislature approves the state budget, which includes funding for
local school districts. The 81st Legislative Session, which convened in January 2009, passed
House Bill 3646 (HB 3646) for school finance valid for the school years 2009-2010 and 2010-
2011. In HB 3646, the legislature increased academic achievement standards. This legislation,
combined with severe education funding cuts discussed below, put enormous pressure on school
districts. School district leaders frequently mentioned the state legislature’s increase in academic
standards as putting enhanced pressure on their ability to deal with balancing their budgets. This
is critical because school district leaders and students were being pressured from both an
academic and financial perspective. Other mandates in HB 3646 that caused financial stress for
school districts included: 1) a mandatory wage increase of at least $800 per year for employees
subject to the minimum salary schedule, including teachers, librarians, nurses, speech
pathologists, and counselors; 2) the use of State Fiscal Stabilization Funds (SFSF) in State
Foundation Program (SFP) revenues, and 3) a return to formula-based funding from the previous
target revenues that were based on 2006-07 revenues. SFSF revenue came from the American
Recovery and Reinvestment Act (ARRA), which helped to cover shortfalls in the Foundation
School Program.
While the state experienced some signs of an economic downturn in 2009, by the next
meeting of the legislature in 2011, the recession was in full swing. In 2011 the Texas legislature

135
had such drastic budgetary shortfalls that they chose to cut $5.4 billion from K-12 education.
Texas had, and still has, a “rainy day” fund, which is called the Economic Stabilization Fund.
The Fund was created in 1988 as a state constitutional amendment in response to a slump in the
oil industry that drastically reduced the state’s revenue. Figure 6.2 is a historical overview of the
fund. The figure shows the amount that the fund contained from 1990 to 2018 as well as the
percentage of the balance to the ESF cap.
Figure 6.2 Texas Economic Stabilization Fund Reserves and Percent to Cap (in Billions)
The ESF fund was created to guard against times of future revenue uncertainty. In a statement
from a May 1987 summary of the proposed constitutional amendment, the Texas House
Research Organization stated,
Should the state ever face another fiscal crisis like the current one, there would be money
put aside for the state to fall back on. If the Economic Stabilization Fund existed now, the
Legislature might not be facing the difficult choice between falling short of maintaining

136
current state services and raising taxes in difficult economic times. Money could be
appropriated from the fund to support existing programs (Gardner Selby, 2011).
From 1988 to 2011, $11 billion was deposited in the Economic Stabilization Fund from shares of
oil and gas production taxes, with nearly $4 billion spent on “emergencies” along the way
(Gardner Selby, 2011). The definition of an emergency was not well defined in the bill, which
left room for Texas state leaders to ultimately choose not to tap into these funds to abate
education funding cuts during the recession. When asked why the state would not use its
emergency fund to relieve school districts, then-Republican Governor Rick Perry stated that “It’s
one of the reasons, as we talk about this budget situation, a debate that rages on about our
budget, one of the things that I remind people and why it’s so important to protect that Rainy
Day Fund is that it is our insurance policy against a major natural disaster” (Burka, 2011). Again,
this interpretation of the ESF was not supported by the text of the law. Governor Perry’s
reluctance to use any money from the fund was a gross dereliction of the duty of the state to
provide an adequate education for nearly 4 million students. The Texas state legislature avoided
more significant cuts to education in 2009-2010 and 2010-2011 by heavily relying on federal
stimulus funding such as ARRA and the Education Jobs Act. While Texas’s leaders were more
than enthusiastic about using federal assistance to fund education, they chose not to use their
ESF. Though the fund was specifically created for a situation like the recession, the Republican
controlled legislature and Republican governor chose to interpret the law as to only apply to
natural disasters. It seems likely that countless teaching positions, after school programs for high
need students, support staff, and other essential education resources could have been saved had
the governor and legislature used the ESF for its intended purpose.

137
The budget reductions made by the Texas state legislature in 2011 were conducted across
the board to all school districts with an additional smaller, targeted reduction to the “hold-
harmless” benefit of wealthier school districts (Knight, 2017). Educational finance scholar David
Knight conducted a study to assess the impact of the Texas austerity measures on education in
Texas. He found that high-poverty districts in Texas received 5.5% less funding than similar
high-poverty districts in the rest of the country. Using the results from Jackson et al. (2015) on
school funding’s impact on adult outcomes, where Jackson et al. argued that additional school
funding was positively associated with improved adult outcomes for poorer students, Knight
estimates that a student from a lower-income family who is exposed to a 5.5% decline in funding
for all 12 years of public schooling would experience a 6.3 percentage point decline in the
likelihood of graduating high school, a decrease in adult earnings of about 14.5%, and an
increase in the probability of living in poverty of about 5.4 percentage points (Knight, 2017).
Importantly, Knight found that the funding gap between high poverty districts and low
poverty districts in Texas increased during the recession by more than 43 other states. He
specifically looked at the ability of low-income school districts to adjust local funding to
compensate for lower state revenues as compared to higher-income districts. Knight found that
lower poverty districts received a substantial bump in local financing during the recession by
using an increase in bonds and experiencing more significant improvements in local per-pupil
property revenue.
Meanwhile, high poverty school districts increased their maintenance and operations
taxes at a faster rate than low poverty school districts (0.24% increase for high poverty vs.
0.015% for low poverty), hitting the legal tax raise cap quicker (Knight, 2017). However, due to
declining property values, coupled with declining equalization funding from the state, these tax

138
raises had minimal effects in high poverty districts. At the same time, lower poverty districts
increased local tax rates, which were not subject to the “Robin Hood” or recapture provision
(Knight, 2017), thereby avoiding distributing additional funding to higher poverty school
districts. This study’s findings match those of Knight. Lower poverty school districts in the
sample were able to leverage stronger local property tax bases to reduce the exposure of
recessionary budget cuts on students. On the other side of the coin higher poverty school
districts took longer to recover due their inability to raise more local property taxes. This study
adds to Knight’s findings by highlighting other policy maneuvers that lower poverty school
districts were able to use to fill budgets. These maneuvers include one district using the state’s
lax interdistrict transfer laws to increase enrollment for increased funding, one leveraged the
popularity of their brand to pursue ad revenue, and one district was able to leverage a substantial
amount of debt in a way that improved the academic performance of its’ students.
By 2011, the Texas school finance system had created a situation where neighboring
school districts could have as much as a $7,000 difference in state spending per student (M.
Smith, 2012). The Texas state legislatures’ substantial school funding reductions, along with
their refusal to tap into emergency stabilization funds and increased unfunded state educational
mandates, prompted school districts to initiate a new round of school finance lawsuits in 2011.
Texas School Funding Legal Battles 2011-2016
In response to the 2011 $5.4 billion school funding cut, over 600 school districts, about
half of the school districts in the state (through a variety of organizations such as the Texas
School Coalition, the Mexican American Legal Defense and Educational Fund, the Taxpayer and
Student Fairness Coalition and more) filed lawsuits against the state claiming that the cuts
139
violated the Texas state constitution. This section will begin with a discussion of Texas’s
education funding clause to set the background for these lawsuits.
All states have education clauses embedded within their state constitutions. The phrasing
of those clauses is essential when deciding whether or not the state government has breached the
guarantees that the constitution has made for education. As discussed at length in Chapter 2,
when it comes to school funding, most often state education clauses include phrasing or goals
that the state will provide an “adequate,” “equitable,” “efficient,” education, or other similar
wording. Not all states include clauses that specifically connect these goals with school funding,
but many do. Texas’s state constitution contains a lengthy education clause that explicitly
expresses the state’s educational responsibility and includes 19 subsections (added throughout
the state’s history) addressing school funding. Specifically, the Texas Constitution requires that
the state must fund its public schools both efficiently and adequately. A portion of Texas’s
education clause reads as follows:
A general diffusion of knowledge being essential to the preservation of the liberties and
rights of the people, it shall be the duty of the Legislature of the State to establish and
make suitable provision for the support and maintenance of an efficient system of public
free schools (Texas Const. Article VII. Sec. I, 2020).
The lawsuits filed against the state in 2011 broadly followed the arguments of previous state
finance lawsuits, including Rodriguez above. “Meaningful discretion” is the assertion that school
districts have the discretion to choose how they spend money brought in from property taxes.
The Texas Constitution does not specify that the state fund schools equitably, though some
lawsuits have sued by arguing inequity in the school finance system. Table 6.4 below shows a

140
few of the significant organizations that sued the state and the constitutional basis by which they
filed.
Table 6.4 2011-2012 Texas School Finance Lawsuits and Claimed State Constitutional Infringements Plaintiff Organizations
Texas School Coalition
Taxpayer and Student Fairness Coalition
David Thompson
Mexican American Legal Defense and Educational Fund
Texans for Real Equity and Equity in Education
Participating actors in the lawsuit
60 property wealthy school districts
400 low to mid property wealth school districts
School districts of a variety of property wealth including Houston ISD
District’s with sizable percentages of low-income and English language learning students
Six parents along with the TREE organization
State Constitutional Infringement Claimed: Property Tax Adequacy Equity Efficiency
X
X
X
X
X
X
X
X
X
X
X
X
Source: (M. Smith, 2012)
The cases brought by a few of these organizations combined to form the main lawsuit against the
state that included 675 lower and higher-income school districts from all across the state of
Texas. The following section will very briefly discuss the arguments against the state in terms of
adequacy, equity, and property taxes.
The Texas state legislature raised academic standards for all school districts in 2010
through House Bill 2646. In the same year, the state department of education launched a new
academic performance assessment tool that made graduation requirements more rigorous

141
(Villanueva, 2016). According to Villanueva (2016), by 2015, 76% of eighth-graders were
unable to pass the State of Texas Assessments of Academic Readiness (STAAR) reading exam.
Only 1 in 5 students who began eighth grade in 2003 had completed a postsecondary
certification or degree, and the rate dropped to 10% for economically disadvantaged students and
13.2% for Hispanic students (Villanueva, 2016). School districts that were participating in the
lawsuits against the state argued that the state legislature had not provided the resources
necessary to implement a curriculum that would aid students in passing the assessments that the
new law required, thereby making the state’s funding “inadequate.”
Figure 6.3 demonstrates that per-pupil spending remained relatively flat in Texas for
nearly a decade, with a noticeable decrease from 2011 to 2015. 2011 to 2015 are the years that
the Texas legislature slashed funding for education. The reduction in education funding was
occurring while the percentage of economically disadvantaged students in the state continued to
increase, reaching 60% of all Texas students (as measured by percent of students eligible for
FRL) in 2015.
Figure 6.3 Average Texas Funding Per Pupil: 2007-2015
Source: Data from “The Texas School Finance Challenge and What to Do About it” by Chandra Villanueva (Villanueva, 2016)
$8,500
$9,000
$9,500
$10,000
$10,500
$11,000
$11,500
$12,000
2007 2008 2009 2010 2011 2012 2013 2014 2015

142
In addition to rising poverty, the state’s distribution of funding still highly relied on local
property taxes, which put additional pressures on lower-income districts to tax at a higher rate
than lower-poverty districts, while bringing in less revenue than higher-income districts
(Villanueva, 2016, 2017, 2018). Most of the school districts in Texas were forced to raise
property taxes to make up for the school funding cuts of 2011. Over half of the school districts in
the state were forced to raise their taxes to the maximum levy that was allowed under Texas law
to meet the minimum educational standards, which were changed in HB 2646.
In 2013, a state district court judge ruled that the Texas school finance system violated
the Texas state Constitution. The judge stated that the Texas finance system both did not provide
a sufficient amount of money and that money was not distributed in a fair manner (T. Smith,
2013). While some were celebrating the district court’s ruling for the portion that called for more
significant funding, others were pleased with the part of the decision that called for funding
efficiency. A representative for an anti-tax lobbying group in Texas accurately remarked that,
We see school districts building a multimillion-dollar football stadium; we've got math
teachers being fired while superintendents are taking home record salaries. We have a
superintendent with a press secretary making more than the White House press secretary.
You know, you have to scratch your head and say, 'Wait and minute — there are screwy
priorities.’ (T. Smith, 2013).
Following the district court ruling in 2015, the Texas state legislature raised the basic allotment
for all school districts. The new basic allotment authorized $100 million in funding for school
facilities that had not received state aid since 2010. However, in the same legislative session the
legislature also passed a $3.8 billion property tax and business tax cut, which further hurt the
state’s ability to invest in public education (Villanueva, 2016).

143
The ruling by the district court was appealed to the Supreme Court of Texas by the Texas
state legislature. In 2016, the Supreme Court of Texas unanimously overturned the decision of
the District Court of Travis County and ruled that although deeply flawed, the state school
finance system did not violate the Texas state constitution. Justice Don Willett expressed
apparent disdain for the system, but held that the system did meet minimum constitution
requirements,
For the seventh time since the late-1980s, we are called upon to assess the
constitutionality of the Texas school finance system, a recondite scheme for which the
word “Byzantine” seems generous… But our judicial responsibility is not to second-
guess or micromanage Texas education policy or to issue edicts from on high increasing
financial inputs in hopes of increasing educational outputs. There doubtless exist
innovative reform measures to make Texas schools more accountable and efficient, both
quantitatively and qualitatively. Judicial review, however, does not license second-
guessing the political branches’ policy choices, or substituting the wisdom of nine judges
for that of 181 lawmakers. Our role is much more limited, as is our holding: Despite the
imperfections of the current school funding regime, it meets minimum constitutional
requirements (Collier, 2016).
Justice Willett’s ruling represents some of the most fundamental issues in the school finance in
the United States such as how adequate funding is defined. “Minimum constitutional
requirements” in Texas are only to provide students with the funding necessary to provide an
efficient education. The decision by Justice Willett demonstrates the tension of balancing
efficiency and adequacy (Justice Willett did not even mention equity) in school finance. The
Texas state legislature was assessing school districts on the academic results of their students

144
while not considering what an adequate amount of funding might be to achieve those results.
Since the Texas state constitution does not mention adequacy, Justice Willett argued that the
state’s school finance policy was not unconstitutional. While he acknowledges that the Texas
school finance system is excessively complicated, he didn’t believe the role of the court was to
remedy the shortcomings of the school finance system. Justice Eva Guzman, in a concurring
opinion, echoed Justice Willett’s ruling that the system did violate the Texas state constitution
and also echoed his dissatisfaction with the state school finance system,
Good enough now ... does not mean that the system is good or that it will continue to be
enough. Shortfalls in both resources and performance persist in innumerable respects, and
a perilously large number of students is in danger of falling further behind (Collier,
2016).
The ruling by the Supreme Court of Texas ensured that the existing school finance system in
Texas remained in place. It also meant that the system was still arguably inefficient, inadequate
to meet state academic requirements, and inequitable in its distribution of funding.
The broader education funding and policy trends in Texas during the recession are
essential to understanding the decisions made by school district leaders in higher and lower
poverty school districts. The following section presents the main findings from the analysis of
three low and three high poverty school districts in Texas during the Great Recession.
Analysis and Findings Danbury Independent School District
Danbury ISD is a small, rural school district in Brazoria County, which is in southeastern
Texas. Danbury ISD is in the lowest poverty group in this study, with an average 30% of their
students on free and reduced-price lunch from 2008-2013. The district had an average enrollment

145
of 764 students from 2008-2013. The demographic makeup of Danbury students in 2008 was
80% white, 19% Hispanic, and point one percent African American. The city of Danbury's
economy relies heavily on agriculture, fishing, and the oil industry.
Danbury ISD’s state revenue dropped nine percent in 2011, and its local revenue fell by
three percent. The district’s state and local revenue reductions lasted only one year. State revenue
jumped 10% from 2011 to 2012, and local revenue increased by two percent from 2011 to 2012.
DISD's Board of Trustees used two main approaches for dealing with revenue reductions in
2011. First, the district board of trustees made significant reductions to capital outlay projects
during the recession. The trustees cut capital outlay projects by 65% from 2008 to 2013. The
district’s budget officer explained that the reduction in the capital budget meant that over the
course of those five years, building renovations were delayed and general facilities upkeep was
kept to a minimum (Danbury Annual Financial Report, 2011, p. 6). Instructional expenditures
were reduced by approximately one percent, which kept the district from laying off teachers,
teachers' aides, and other instructional positions. From 2008-2012 the school district eliminated
only three teaching positions out of 58. In 2011, per-pupil expenditures fell three percent,
remained level in 2012, and then fell another six percent in 2013.
Budgets produced by the Danbury Board of Trustees stated that DISD ran budget deficits
in 2011, 2012, 2013, and 2014. The deficits averaged $100,000 in 2011 and 2012 and fell to
around $50,000 in 2013 and 2014 due to increased enrollment. DISD, in both their 2012-2013
and 2013-2014 budget, cited two main reasons for their year over year deficits. First, the district
pointed to their decreasing enrollments as a source of concern. Second, the board of trustees
expressed frustration with the inability of the district to raise additional revenue above the "target
revenue" levels that the state legislature froze in 2006 (2013 Danbury ISD Budget Summary,

146
p.1). The district's trustees identified two main ways (indeed not the only ways) to raise
additional revenue for their school district: raise taxes and to increase enrollment. Since Danbury
ISD's trustees were unable to raise taxes, they focused on increasing enrollment.
As evidenced by the 2010, 2011, and 2012 annual budgets and financial reports
increasing enrollment levels throughout the recession was a primary goal for the district. There
are two main reasons why average daily attendance is so important for school districts. First,
enrollment levels constitute a significant component of how the Texas state department of
education decides annual funding. The state department of education allocates more funding for
districts with higher projected enrollment. Second, increased enrollment can also bring in more
local revenue when students transfer from other school districts. It is imperative to understand
that when the district accepts a student, that student brings with them their local tax valuation. In
a January 2014 school board meeting, the Danbury ISD school board emphasized: "making
DISD the district of choice in Brazoria County" (Danbury ISD School Board, 2014). District
leaders were committed to using increased levels of enrollment to boost annual revenue through
interdistrict transfers. Interdistrict transfers in Texas are relatively simple when compared to
other states. Students are allowed to transfer out a resident district if the receiving district and
parents agree. School districts may also enter into transfer agreements (Tex. Educ. Code Ann. §
25.031 through § 25.040, § 25.042, § 29.201 through § 29.203).
The efficacy of Danbury's plan to expand enrollment, through interdistrict transfers, is
not entirely clear when looking at average daily attendance. Enrollment fluctuated throughout the
recession, but local revenue did increase. In 2008, the district had 752 students. Enrollment fell
to 732 in 2011 but rebounded to a high of 774 by the end of the recession in 2013. As neither
Danbury nor the Texas Education Agency reported interdistrict transfer numbers, it is difficult to

147
tell whether or not the increase in enrollment in 2013 came as a result of the district's increased
focus on transfers. However, what is clear is that enrollment changes in the district resulted in a
13% increase in local revenue from 2010 to 2013. This may seem like a large increase, but
Danbury is a relatively small district so small changes lead to larger percentage changes. From
2009 to 2013, Danbury ISD became more reliant on local revenue and less reliant on state
revenue. In 2009, 32% of Danbury’s overall revenue came from local revenue. That increased to
41% in 2013. This is important because when a school district is less reliant on state revenue,
they are less susceptible to funding fluctuations during times of state budget upheaval or
economic crises. Higher poverty districts were already more reliant on state revenue before the
recession and that only increased afterwards. Research has shown that school districts are more
reliant on state funding are more susceptible to severe revenue reductions during times of
recession and that increases in local revenue are not enough to fill in the gaps (Knight, 2017;
Lafortune et al., 2016).
Two important questions related to education equity are: what was the process of
applying for a transfer into Danbury ISD during the recession? What were the barriers when a
student wanted to transfer into the district? DISD's open enrollment policy was already enacted
before the recession hit and included no weights or priorities for low socioeconomic status
students or students of color. Again, students who transfer into a district bring with them their
property tax valuation from their home district. This means that the enrollment policy provides
higher revenues when they enroll students from areas with higher property values. the
application process was onerous to non-English speaking families and poor families. In fact, to
apply for transfer to the district, families had to pay a $50 nonrefundable fee, provide a
completed and notarized declaration of discipline, copy of a student's birth certificate, a copy of a

148
student's social security card, a final report card from the departing school district, in addition to
other student documentation. The notarized declaration of discipline included questions such as
"Has the student been suspended from school?", "Has the student been assigned from alternative
school?" and "Has the student had to appear in court for any reason?" These application
questions and requirements reveal significant equity questions surrounding the type of student
that Danbury ISD wanted to attract and those that they were placing barriers for entry.
Another reason that Danbury ISD leaders were so focused on enrollment was that
Danbury's board of trustees could not raise taxes due to the frozen local target revenue levels that
were discussed above. The Texas state legislature’s policy that froze local target revenue levels
was intended to slow the growth of the per-pupil funding gap in Texas. However, that policy did
not address other ways that a school district could increase local revenue. This is an example of
how a particular state policy (in this case frozen state revenue levels) had consequences for the
way district leaders made educational budget decisions during the recession. In a 2011 financial
audit of Danbury ISD, independent auditors addressed the dilemma that this policy put school
leaders in,
The only way to increase the amount of money the district receives from the state
is to enroll more students or raise the tax rate. The state doesn't allow a district to
raise the M&O tax rate over $1.04 without voter approval. Danbury ISD trustees
chose not to exercise this option for 2012-2013. The District chose to allow
enrollment of students living outside the school district boundaries to help offset
the budget deficit (Pechacek, 2011).
Danbury ISD’s leaders avoided deep reductions in instructional expenditures by cutting
capital outlay projects. Additionally, the district was able to use its open enrollment policy to

149
boost enrollment, which in turn increased local revenue. There was a lot of focus put on this
policy decision in this case study because it has important implications for policies that might
have unintended consequences that are exacerbated during times of financial crisis. The frozen
local revenue policy was designed to create more significant funding equity. However, during a
fiscal crisis, when even lower-poverty school districts are experiencing abnormal budget deficits,
school districts with the capacity to find revenue alternatives did find those alternatives.
Additional alternatives will be discussed in the case of Hutto ISD. In this case Texas's lax
interdistrict enrollment policy allowed Danbury ISD to use its transfer process to focus on
attracting new students. The families that entered the district helped to increase their local
revenue overall and as a percentage of their overall budgets. While still relying primarily on state
funding, local revenue went from constituting 30% of overall district revenue in 2008 to nearly
40% in 2013. This allowed Danbury ISD to restore instructional expenditures to pre-recessionary
levels by as early as 2013 while districts more reliant on state funding were still making those
reductions into 2015.
Hutto Independent School District
Hutto Independent School District is a midsize, rural school district located near Austin,
Texas. The demographic makeup of Hutto students in 2008 was 50% white, 34% Hispanic, and
15% African American, and two percent Asian. Hutto ISD is in the low poverty group in Texas
with an average of 41% of their students qualifying for free and reduced priced lunch from 2008-
2013. The district had an average enrollment of 5,460 students from 2008-2013. The city of
Hutto is a small town of around 30,000 people who mainly work in the Austin technology
industry. Hutto was the second-fastest growing city in Texas from 2000-2010. From 2005-2009,
both city population and student enrollment in Hutto ISD grew by nearly 20% per year.

150
However, this rapid growth fell in 2009. Figure 6.4 shows the percent of enrollment growth year
over.
Figure 6.4 Percent Enrollment Growth in Hutto Independent School District 2003-2014
As a result of drastically slowed enrollment growth and state revenue reductions, Hutto
ISD had a budget deficit of $1.4 million in 2010 and projected deficits of anywhere between $4
and $7.5 million in 2011. The trustees reacted to this projection in two main ways. First, they
made significant reductions across the board to district jobs, instructional expenditures, capital
outlay and support positions. Second, Hutto closed Veterans’ Hill elementary school to ward off
projected budget deficits. Veterans’ Hill Elementary was built in 2008, only two years before
district trustees decided to close it down. Danbury’s Board of Trustees projected that the
elementary school closure and a district realignment would save the district $3.2 million (Hutto
ISD Budget 2010, p. 10).
0%
5%
10%
15%
20%
25%
30%
2003 2004 2005 2006 2007 2008 2009 2010 2011 2012 2013 2014

151
The $3.2 million in savings came from the elementary school’s cost of operation (saving
$1 million), moving fifth grade to their middle school (eliminating $660,000 in costs), and
eliminating 25% of the district’s administrative staff. Elementary students at Veterans’ Hill were
transferred to the district’s other four elementary schools. Fifth grade students were sent to the
district’s two middle schools. In 2011, the board of trustees eliminated 70 more positions
throughout the district, which represented about 10% of its workforce. This reduction was
projected to save the district two million dollars (Hutto ISD 2011 Budget, p. 10). Among the 70
positions that were eliminated, there was one principal, two assistant principals, four librarians,
and 38 teachers. Among the 38 teaching positions that were removed, 28 were elementary
school teachers, and 10 were secondary teachers. This is significant because the majority of
eliminated teaching positions were elementary teachers in schools that had just taken in students
from Veterans’ Hill Elementary. The district’s average student to teacher ratio rose from 14:1 in
2010 to 17:1 in 2011 as a result of the eliminated teaching positions.
Hutto ISD trustees contemplated and implemented a number of solutions for raising
additional revenue. In an August 28th, 2012 board of trustees meeting, the board approved the
quadrupling of the student extracurricular activity fee to $100. They removed any discount for
the fee for students eligible for free or reduced-price lunch. This means that students from lower-
income families, that had previously paid $12.50 or $2.50 to participate in extracurricular
activities, now had to find 40 times that amount. The board also replaced two licensed nurses
with aides and cut two elementary counselors (Hutto ISD Board of Trustees Meeting, August
2012). There was also a discussion in that meeting of charging students a $100 per semester bus
fee for transportation, though there is no evidence that they implemented the fee. Texas and

152
California both do not report transportation fees charged to parents in their responses to the
Common Core of Data’s F-33 survey.
In 2011, the superintendent of Hutto ISD said in an interview with the New York Times,
"I'm doing some weird stuff in the district because we are low on money" (McKinley, 2011).
The "weird stuff" that the superintendent was referring to was the decision to leverage their
school's mascot by trademarking it and selling advertising space on the district's 43 school buses.
Hutto ISD’s school leaders hired an advertising agency to leverage the reputation and brand of
their district to find additional revenue with the goal of reducing the district’s substantial budget
deficits. On the Hutto city website, there is a section explaining the history of the hippo mascot
which states, "Hutto is perhaps most widely known for its high school mascot-the hippo…
Residents and businesses proudly tout their hippo spirit with concrete hippos that are displayed
throughout the community. At last count, there were over 3000 concrete hippos in the
community. " (Hutto Area Chamber of Commerce, 2017).
The district’s marketing efforts were covered by local, state, and national newspapers. It
is difficult to find an exact dollar amount for how much the Hutto trademarking strategy brought
in for the district. The revenue brought in is not delineated in district budgets or financial audits,
which may be because it is either included in another broader revenue category or not reported at
all. By one account, the district was to receive a royalty check every 90 days where they would
keep 75%, and an advertising agency was going to keep 25%. The district's bus advertising deal
was to generate at least $40,000 in the first year and increase by $10,000 each year, maxing out
at $80,000 annually (Taboada, 2012).
Even though the Hutto Hippo marketing campaign may have had a marginal on the
district’s budget problems, there are important takeaways from the campaign and the funding

153
that it may have added to the district budget. First, the district had enough overhead funding to
pay a marketing agency to help them strategize and pinpoint the most effective way to bring in
advertising dollars (this payment was in addition to the agency’s 25% cut). It is no small feat for
a school district to have the administrative capacity to create contracts to work with private
companies. Second, it is exceptionally difficult to find the exact dollar amount that the marketing
campaign brought into the district. This is an example of a critical, much broader point about
forms of revenue that exist outside the traditional local, state, and federal streams in Texas and
California. As discussed in Chapter 5, neither state reports revenue in their F-33 documentation
from sources such as private contributions, student fees, or transportation fees paid by parents.
Since the F-33 survey already provides those categories, districts should be reporting these more
non-traditional revenue streams. It would be immensely useful in understanding how those non-
traditional streams contributed to lower-poverty districts’ per-pupil spending outpacing that of
higher poverty school districts after the recession.
Hutto ISD, unlike Danbury ISD, experienced significant budget reductions as it was
preparing for deep state revenue reductions. During the decade leading up to the recession, Hutto
ISD was rapidly growing, and they were hiring more teachers, more administrative staff, and
they built a new elementary school. Federal revenue in Hutto proliferated in that decade, leading
up to the recession. This was primarily associated with a massive growth in Title I funding
across the state of Texas in 2007 and 2008. As Hutto adjusted their enrollment growth
projections downward growth in federal funding took a sharp drop in 2009.

154
Figure 6.5 Changes in Revenue for Hutto ISD: 2004-2012
Hutto ISD’s rapid enrollment growth quickly slowed by nearly 11% from 2007 to 2009.
This halt in growth came just before the Texas state legislature made major reductions in
education funding. Over projection of property value and student, enrollment was a significant
issue for other school districts in both Texas and California. School districts like Hutto ISD or
Forney ISD (below) projected growth in both enrollment and revenue for at least ten years into
the future. Expectations of growth caused district leaders to make vital decisions on where to
spend to prepare for that growth. When growth did not occur, due in large part to the
recessionary economy, districts were left with more overhead expenditures than they had
revenue.
Hutto ISD trustees addressed state revenue reductions by using both traditional
instructional and support cuts as well as leveraging their reputation through licensing their school
-50%
0%
50%
100%
150%
200%
2004 2005 2006 2007 2008 2009 2010 2011 2012
Federal State Local Overall Revenue

155
mascot. While licensing royalties partially helped Hutto address reductions, increases in local
property revenue was the primary method that Hutto used to offset revenue reductions unlike
Danbury ISD. In 2011, Hutto gathered two percent more in property taxes than in 2010. In 2013,
that amount jumped another 12%. The increase was a result of higher property taxes and higher
property valuations which were approved by a local referendum in 2013. Increases in property
values, licensing, and strategic budget reductions helped Hutto ISD regain pre-recessionary
levels of revenue and stable levels of overall expenditures by 2013.
Forney Independent School District
Forney Independent School District is located in north-central Texas near the city of
Lubbock. In the years 2008 through 2011, the district had nine elementary schools, two middle
schools, and two high school campuses. Forney's average daily attendance in 2008 was 7,413,
which increased to 8,288 in 2012. The student population in 2008 was 67% White, 19%
Hispanic, 18% African American, and 2% Asian. The district's FRL percentage was 25% which
was significantly lower than the state average of 59%. Before the recession, Forney was the
fourth fastest-growing school district in the state of Texas. The rapid growth of the school district
proved to be an issue as state over projections of enrollment, alongside simultaneous cuts in state
education funding, led to a sharp reduction in per-pupil expenditures in 2011. Forney ISD was
overpaid by the state for rapid enrollment projections that never materialized. As a result, Forney
ISD found itself with rapid debt growth during the recession. Ironically, Forney ISD also
provides an example of what might happen to student achievement if a school district received
extra state funding as student test scores rose across the board.
Kaufman County was one of about a dozen counties in Texas that experienced population
and economic growth during the Great Recession (Richards, 2015). The population growth

156
happened predominantly among “super-commuters” or people taking long treks to work in
Texas’s rapidly growing oil industry. This resulted in a rapidly emergent student population in
Forney ISD. In 1999, the district recorded an ADA of about 2000 students. By 2008 that number
had quadrupled to over 8000. According to Forney ISD's 2011 financial audit, the rapid growth
forced the district to add six additional elementary school campuses (for a total of 7), one
additional middle school (2), and an additional high school (2) from 1999-2015 as it struggled to
keep up with providing the number of facilities necessary for students. The rapid expansion of
construction was made possible by a sharp increase in local property values and a series of bond
approvals from district voters. At the same time, Forney ISD was able to minimize debt from the
construction projects through increased local tax revenue from the ever-expanding population.
However, in 2010, the city of Forney began to experience some of the effects of the recession as
property value growth became relatively flat. As district leaders had planned for annual property
value growth through 2027 which did not occur, they were forced to refinance the district's debt
and change the repayment structure.
In 2011-2012, after the district began repaying district debt, the instructional budget was
cut again by another six percent. According to a staffing history located in Forney's 2015-2016
budget, in 2012 the board of trustees eliminated 25 teaching positions out of the district’s 554
teachers, nine professional support positions (counselors, librarians, instructional specialists,
therapists), three out of the district’s 31 central administration positions, and six of the district’s
90 educational aides (2015-2016 Forney ISD Annual Budget, p. 13). It is difficult to tell whether
the jobs mentioned above were either cut through layoffs or attrition. I cross-checked all school
district budgets with available school board meeting minutes and media reports for the
corresponding years, and it was still unclear as to how the board of trustees eliminated the

157
positions. Support services saw more considerable expenditure reductions with an eight percent
cut in 2010-2011 and a 10% cut in 2011-2012. The eight percent cut included three instructional
aides, one guidance counselor, and four administrative assistants. In 2011 (the year the Texas
state legislature made the $4 billion education funding cut), the school district's state funding was
cut by seven percent. This is important because Forney ISD’s primary source for revenue was
from the state (57% of the overall district budget).
Forney ISD maintained a more significant capital outlay budget in the years preceding
the recession than both Hutto ISD and Danbury ISD. In fact, in 2008, Forney spent $10 million
more on capital outlay than it did on instructional expenditures. The difference between the two
spending categories highlights the emphasis that school district leaders put on building,
renovation, and maintenance and was not typical of other school districts in this study. For
example, Forney ISD spent $5.1 million to renovate their administrative building in 2008 (WRA
Architects, 2008). The administrative building, which is a designated historical landmark, had a
new wing constructed, windows replaced for more energy efficient units, and a new courtyard
built. In light of impending debt issues that will be discussed below, Forney ISD’s school leaders
may have better served their students with a more conservative approach to capital expenditures.
Other school districts in this study approached the great budgeting uncertainty that occurred
during the recession by slowing down building costs. Forney ISD’s leaders took the opposite
approach and as such increased costs in a non-core spending category while enrollment (and
state revenue) fell. This is consequential for the district’s ability to maintain spending in core
categories such as instructional expenditures as they vastly over projected their enrollment
growth.
158
Forney ISD's average daily attendance in 2001 was 2,908, and in 2011 that number had
increased to 8,088 (Forney ISD Annual Budget 2012-2013, p. 24). The average rate of growth
every year from 2001 to 2008 was 15.7%. The Texas Education Agency predicted that this rate
of growth would continue when it issued its recommendations for state funding to the Texas state
legislature for the 2007-2009 and 2009-2011 biennium (The Dallas Morning News, 2011).
Conversely, the actual percentage of enrollment growth plummeted to 6% in 2008, 5.2% in 2009,
and then fell to 3% in 2010 (2010-2011 Forney ISD Annual Budget, p. 34). School leaders did
not catch or did not correct the state's enrollment discrepancy and instead continued to spend
state funding as they had when enrollment growth was much higher.
The Texas Education Agency's overestimation of enrollment growth led to Forney ISD
receiving considerably more money from the state than they otherwise would have gotten with
the more accurate enrollment projections. In 2011, the Texas Education Agency identified the
discrepancies and found that Forney ISD received funding for a projected 3,000 more students
than were actually enrolled (The Dallas Morning News, 2011). The Texas Education Agency
ordered that the excess funds were to be repaid. In the end, Forney ISD owed the state $17.7
million. This is important for a number of reasons.
First, it raises questions as to why no administrator or leader addressed an increase in
funding while enrollment was leveling off. It is consequential that Forney school leaders chose to
immediately spend state funding. They instead may have put it in reserve until attendance was
verified for the school year if they were aware that enrollment growth was slowing. That
precaution would have ensured that if actual enrollment was much lower than what was
projected (which is what occurred) that the school district would be able to repay the state
without having to go into debt.

159
Second, the decision to spend state funding immediately put Forney ISD into a sizable
amount of debt. Debt service increased 167% from $6 million in the 2008-2009 school year to
nearly $16 million in the 2009-2010 school year (Figure 6.6). Increased debt service, particularly
when it is unplanned, presents a real challenge to school districts' ability to spend in vital
categories such as instruction and support. It can also impact the district's long-term ability to
borrow in the future and can potentially lower the district's credit score. Luckily, this did not
happen to Forney ISD, as additional state funding in 2013 and a slight increase in local property
taxes helped to ensure that the district did not need to make significant spending cuts (2012-2013
Forney ISD Annual Budget, p. 12). In fact, by 2015, Forney ISD had more teachers, professional
support personnel, campus administrators, and educational aides than it did in 2012 (2015-2016
Forney ISD Annual Budget, p.13).
Forney ISD’s experience with over projected enrollment raises the question of how an
overcalculation of this magnitude might have impacted a school district that did not have the
strong local property tax base or growing enrollment that was present in Forney ISD. All of the
higher poverty school district leaders in this study made more significant position eliminations,
more reductions to after school programs, and more reductions to support services. These
reductions were all without a 167% increase in debt service in the middle of a recession. While
the debt situation of Forney was not ideal for any school district, it also did not result in massive
layoffs or mass reductions in services for students. The mistake by the Texas Education Agency
and the choices of Forney ISD leaders to immediately spend funding did not have substantial
consequences for students. It is fair to say that a similar situation would likely prove to have a
significant impact on students in a district with higher poverty. In fact, the miscalculation by the
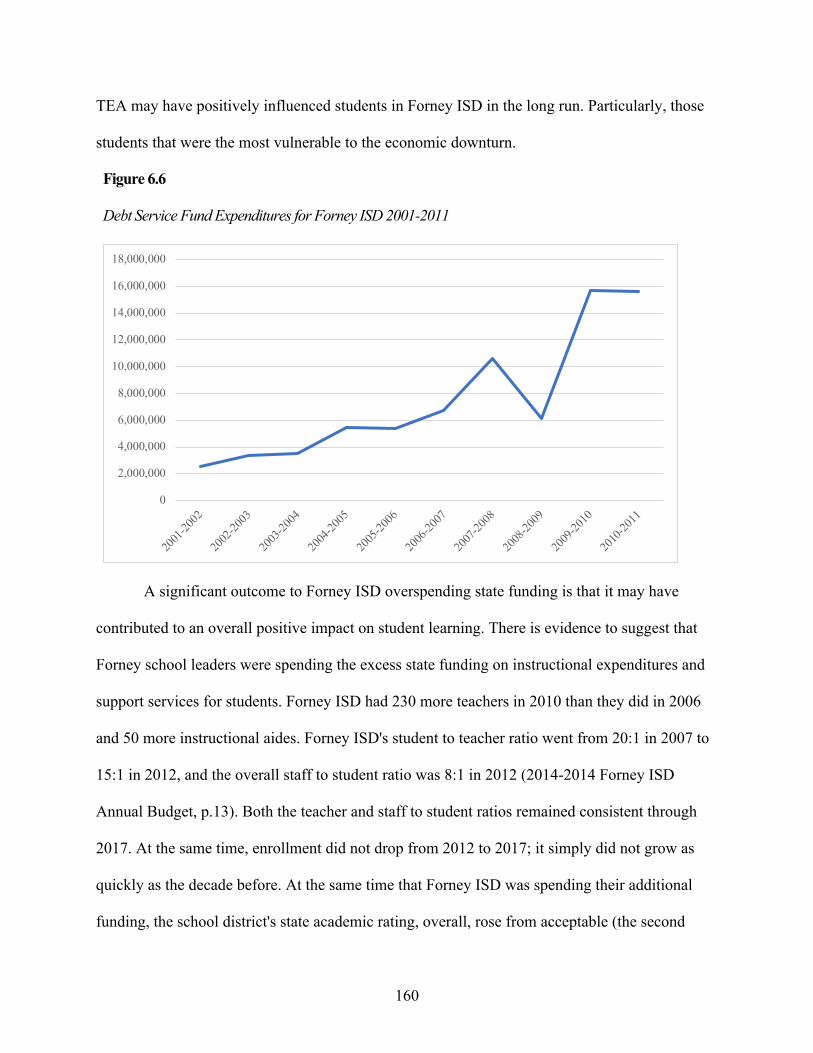
160
TEA may have positively influenced students in Forney ISD in the long run. Particularly, those
students that were the most vulnerable to the economic downturn.
Figure 6.6 Debt Service Fund Expenditures for Forney ISD 2001-2011
A significant outcome to Forney ISD overspending state funding is that it may have
contributed to an overall positive impact on student learning. There is evidence to suggest that
Forney school leaders were spending the excess state funding on instructional expenditures and
support services for students. Forney ISD had 230 more teachers in 2010 than they did in 2006
and 50 more instructional aides. Forney ISD's student to teacher ratio went from 20:1 in 2007 to
15:1 in 2012, and the overall staff to student ratio was 8:1 in 2012 (2014-2014 Forney ISD
Annual Budget, p.13). Both the teacher and staff to student ratios remained consistent through
2017. At the same time, enrollment did not drop from 2012 to 2017; it simply did not grow as
quickly as the decade before. At the same time that Forney ISD was spending their additional
funding, the school district's state academic rating, overall, rose from acceptable (the second
0
2,000,000
4,000,000
6,000,000
8,000,000
10,000,000
12,000,000
14,000,000
16,000,000
18,000,000
2001
-2002
2002
-2003
2003
-2004
2004
-2005
2005
-2006
2006
-2007
2007
-2008
2008
-2009
2009
-2010
2010
-2011
161
lowest of four possible ratings) in 2008 to exemplary (the highest possible state rating) in 2010.
The exemplary rating applied across all student groups5.
In addition to the overall district rating, scores in reading, social studies, and math began
to improve in 2005 and continued to improve through 2015 (2014-2015 Forney ISD Annual
Budget, p. 30-79). Some of the most noteworthy gains were with African American students,
economically disadvantaged students, and Hispanic students. For instance, in 2005, the percent
of students that met the state standards for reading were 83% for African American students,
85% for Hispanic students, and 80% for economically disadvantaged students. By 2010, the
percent of students that met state standards for reading had increased to 95% for African
American students, 94% for Hispanic students, and 92% for economically disadvantaged
students (2012-2013 Forney ISD Annual Budget, p. 34). In 2005 the percent of students that met
the state standards for math was 62% for African American students, 74% for Hispanic students,
and 71% for economically disadvantaged students. By 2010, the percent of students that met
state standards for math had increased to 85% for African American students, 90% for Hispanic
students, and 87% for economically disadvantaged students (2012-2013 Forney ISD Annual
Budget, p. 37).
Highlighting the increased state test performance of students in Forney ISD is not to say
that there is a causal relationship between the increased test scores and the additional funding.
Still, the sharp increase occurs in the years where school district leaders were spending the extra
funds on teachers and other support staff. Spending more money on teachers and seeing
increases in academic performance scores supports previous studies which found that increased
5 Student groups were reported by the Texas Education Agency as White, African American, Hispanic, and Economically Disadvantaged.

162
spending in human resources (teachers, salaries, support staff) are the most effective way to
increase student achievement (Adamson & Darling-Hammond, 2015; B. D. Baker, 2017;
Dietrichson et al., 2017; Jackson et al., 2015). The growth in score begin to level off in 2011
once school district leaders settled on and initiated a repayment plan with the TEA. 2011 was
also the same year that the state legislature cut education funding across the state.
Forney ISD highlights a few important lessons not only from the recession, but for school
funding in general. The district is unique because it was overpaid by the state to such a high
degree that it was an unlikely experiment in what happens for students if we increase school
district funding. Again, this is not to suggest that there is a causal relationship between the
increased funding and the increase in Forney’s state test scores. At the same time the growth in
performance during the years of increased state funding does match research that found that
additional funding spent on instructional expenditures does lead to improved student outcomes
so it may have played a part.
San Antonio Independent School District San Antonio Independent School District (SAISD) is a large, urban school district located
in San Antonio, Texas. The district had an average daily attendance of 54,696 students in 2008.
That number fell to 53,857 by the end of the recession in 2013. The student composition of the
district is predominantly Hispanic (89%). An average of 90% of students were eligible for free or
reduced-price lunch in 20136.
6 Before 2012, FRL is markedly lower in SAISD. It was unclear why this was the case so I broke down the FRL percentage of SAISD between students who were eligible for reduced lunch vs. students who were eligible for free lunch. The percentage of students eligible for reduced lunch between the years 2008 and 2013 stayed reasonably consistent, ranging from 12% in 2008 to 8% in 2013. However, between 2012 and 2013, the percent of students eligible for free lunch jumped from 26% to 85%, showing that the increase in FRL was mainly coming from the identification of students eligible for free lunch. One of the possible explanations for this substantial increase

163
The story of the broader San Antonio economy and of SAISD presents an interesting case
study in the overall economic landscape of Texas during the recession. The city of San Antonio
experienced economic growth during the financial crisis while SAISD dealt with significant
annual budget shortfalls. The city of San Antonio’s economic growth is attributed to a South
Texas energy boom that was created by the area’s Eagle Ford Shale deposit around 2006
(Hendricks, 2017; Thompson, 2010). San Antonio was one of only a handful of cities in the
United States that experienced economic growth from 2007-2010. The city was frequently at the
top of lists of U.S. cities with the lowest unemployment rates and the smallest decline in housing
prices during the recession (Thompson, 2010). Though the economy led to an increase in higher-
paying oil and gas jobs, the growth of the San Antonio economy did not extend to the creation of
lower-paying jobs or wage growth for lower-income residents. In 2009, 2010, and 2011 the
SAISD Financial Transparency Reports the district Board of Trustees cited declining property
tax revenue as a chief reason for annual budget deficits. Growth in the local job market, but not
in local tax revenue, meant that the city’s economic growth did not translate into local education
funding. Therefore, even though the economy of the city of San Antonio fared well during the
recession, the school district still had massive budget deficits.
Before the recession in 2008, SAISD experienced eight consecutive years of declining
enrollment, which led to district leaders adopting a substantial restructuring process. A school
restructuring committee, composed of community members and district leaders, was put together
to hold community meetings and propose a restructuring solution to the board of trustees. San
could be SAISD’s decision to adopt the Community Eligibility Provision of the 2010 Healthy, Hunger Free Kids Act in 2014, which may have altered how SAISD reported their FRL percentage. The irregularities in district reporting of FRL is one example of why this study did not use the percent of FRL eligible students to initially sample districts in this study.

164
Antonio ISD and the broader San Antonio community held eight long-range restructuring plan
meetings throughout 2009. In a school board meeting on October 26th, 2009, the restructuring
committee announced that the district had approved the closure of 13 separate schools (mainly
elementary schools) over the decade. Ten other schools, primarily middle schools, would
restructure their grade levels to take in the students from the closed schools. A member of the
restructuring committee cited the “difficult economic times” as a reason for the restructuring and
emphasized that the district would need to rethink the curriculum to suit the new grade structures
(Minutes of the Special Called Board Meeting, October 26th, 2019, p. 3-5). San Antonio ISD had
74 district campuses, and 18% of those were closing.
District leaders in SAISD took some positive steps to support students, but also made
financial decisions that undercut the development of a new curriculum. In 2010, the district, in
conjunction with the city of San Antonio, launched a Head Start program that provided free
educational services to children six weeks to five years (2008-09 Planning & Budget, San
Antonio Independent School District, p. 3). As a result of the Head Start program, SAISD
repurposed five previously closed elementary schools and experienced its first year of increased
enrollment in 2010 (2010-11 Planning & Budget, San Antonio Independent School District, p.
6).
In 2011, as a result of the drastic state education spending cuts and a 16% reduction in
federal funds, SAISD faced a budget shortfall of $28.1 million. The combination of state and
federal revenue reductions led the district board of trustees to eliminate 272 staff positions along
with the elimination of teacher incentive pay (2011 Comprehensive Financial Report, San
Antonio Independent School District, p. 10). The district used remaining federal funding from
the Department of Education’s EdJobs program to save many of the eliminated positions,

165
prioritizing K-12 classroom teachers. However, the SAISD board of trustees still cut 51 teaching
positions (mainly at the secondary level), 79 instructional aides, and 125 curriculum and
instruction personnel (Kastner, 2011). Fifty-one teaching positions represented about one percent
of the total teaching positions in the district. By the end of 2011, SAISD ended up with a final
budget deficit of $12 million.
Eliminations to the curriculum and instruction department posed a problem due to the
overall restructuring plan of the district trustees. Curriculum and instruction personnel were
responsible for providing support to each school to help those schools revise their curriculum.
These personnel largely provided support to teachers and principals in curriculum development.
This is important because one of the chief concerns of those on the district restructuring team
was that curriculum and instruction be rethought and supported as students were moved to other
campuses. These curriculum and instruction personnel were meant to support San Antonio ISD’s
curriculum redevelopment, and eliminating those positions undercut that goal. Other support
positions that were cut included instructional coaches and other support staff. This left students
in the district, particularly those with more individualized needs, with lower levels of crucial
support.
In the 2013 SAISD budget, the district board of trustees emphasized the importance of
the Texas legislature’s $3.2 billion Foundation School Program increase which helped to fill the
large reduction that they made the previous biennium (2013 District Budget, San Antonio
Independent School District, p. 3). However, in the same year federal funding was reduced by
seven percent in SAISD. The school district once again had a budget shortfall. The Board of
Trustees dealt with this shortfall by “restructuring and reallocating” (2013 District Budget, San
Antonio Independent School District, p. 5). Further in the 2013 budget the Board of Trustees

166
clarified that restructuring and reallocated translated into eliminated positions. SAISD eliminated
62 full-time positions, which included 55 teachers and 17 paraprofessionals (2013 District
Budget, San Antonio Independent School District, p. 8). Overall, this saved San Antonio ISD
$3.2 million.
San Antonio ISD dealt with declining enrollments, declining property tax revenue, and a
decrease in state educational funding. These factors combined to create persistent annual budget
deficits. District leaders chose to deal with the deficits by closing schools, laying off teachers,
and eliminating support positions crucial to the district restructuring. San Antonio ISD’s
experience with federal funding highlights a crucial drawback to the way that ARRA’s education
stimulus money was distributed. Most of the country was impacted by the Great Recession
around 2008 with the worst effects waning around 2011. ARRA was passed in 2009 and that
money was immediately distributed. In Texas, the recession was at its worst in 2011, which
lagged the rest of the country. School districts applied for received and began spending ARRA
funds before they had their worst budget deficits. San Antonio ISD spent 77% of their overall
ARRA funding before 2011, the year the Texas state legislature made the most significant
reductions to education funding. This is not to say that federal funding was not useful. Federal
funding through ARRA and the EdJobs program filled holes in the district’s Foundation School
Program that reduced the elimination of instructional and support positions. San Antonio ISD’s
experiences during the recession underscore the importance of federal education funding support
during times of economic crisis. A meaningful injection of federal stimulus funds to San Antonio
ISD helped to save teaching positions, and throughout the recession, the student to teacher ratio
hovered around 16:1. Budget deficits were so large that without federal support, district trustees
indicated they would have eliminated even more teaching positions. However, had the ARRA

167
funds been distributed when SAISD was experiencing their worst deficits (2010 and 2011), more
positions may have been saved.
Laredo Independent School District
In general, high poverty school districts in Texas and California suffered sudden severe
cuts in instructional spending which, research has found harmed student outcomes (Jackson et
al., 2018; Lafortune et al., 2016). However, Laredo Independent School District leaders made a
series of decisions during the recession that enabled the school district to experience budget
surpluses from 2009-2011. 97% of Laredo ISD’s students were eligible for free or reduced-price
lunch in 2008. That number remained stable through 2013. The majority of students at Laredo
ISD speak English as their second language. In 2008 that percentage was 66%, and it fell to 57%
by 2013. Laredo ISD is located on the north bank of the Rio Grande River in southwestern Webb
County in southern Texas. Laredo shares its metropolitan center, the city of Los Dos Laredos,
with Mexico. The combined population of both cities is around 733,000. Laredo ISD is an
integral part of the local economy. In fact, the school district is the largest public sector employer
in the region and employs more than ten times the amount of Laredo residents than the largest
private-sector employer (Laredo Comprehensive Annual Report, Laredo Department of Financial
Management, 2009, p. 5). The city of Laredo’s economy, like San Antonio’s, did not experience
a significant downturn during the recession.
The Laredo Department of Financial Management works with the Laredo ISD Board of
Trustees and other district leaders to create annual budgets that are voted on by the Board of
Trustees and published on the district’s website. Laredo ISD’s leaders took a conservative
approach to educational budgeting during the recession. The district saved over eight million
dollars (three percent of the overall budget) in 2010 and 2011 by not filling teacher and teacher

168
aide vacancies (Comprehensive Annual Financial Report, Laredo Department of Financial
Management, 2011, p. 6). Laredo received ARRA funding from the federal government in 2010
that constituted four percent of the overall district budget and partially used that funding to give
each teacher a $300 salary increase (Comprehensive Annual Financial Report, Laredo
Department of Financial Management, 2010, p. 5). District leaders also revised their step
schedule to be more competitive with surrounding districts. The school district made the choice
not to hire new teachers, but to instead use those savings to increase existing teacher salaries.
Laredo ISD’s ability to weather the recession with minimal impact on their educational
programming was a direct result of a positive local economy, conservative district budgeting,
and federal assistance funding. Laredo’s Department of Financial Management, in conjunction
with the Laredo ISD school board, made a series of decisions that helped shield students from
the worst effects of the Great Recession. First, district leaders maintained a high revenue to
expenditure balance during the worst years of the recession. From 2007-2010 Laredo ISD
annually spent at least 10 million dollars less than the revenue that they took in. The district did
this while freezing open teaching vacancies at a level that still kept student-teacher ratios around
15:1. The revenue surpluses Laredo ISD amassed gave the district a revenue cushion coming out
of recession while also avoiding accumulating more debt (Annual Budget, Laredo Department of
Financial Management, 2012, p.72). Laredo ISD demonstrates the importance of managing
“rainy day” funds during a financial crisis, if at all possible. This is not to say that one could
reasonably expect annual revenue surpluses for most high poverty districts. Still, in Laredo, those
surpluses allowed the district to bounce back from recessionary years with minimal impact on
their educational programming. Again, Laredo ISD was in unique position given the robust local

169
economy. That economy afforded district leader the ability to make decisions that other district
leaders may not have had the options to make.
Importantly, district leaders also benefited from a healthy local economy, which was
much better off than many other high poverty school districts during the recession. They did not
deal with volatility in the local property market and substantial cuts in local property tax revenue.
The stability of the local economy meant that property tax revenue stayed consistent throughout
all years of the recession. Additionally, Laredo ISD received a substantial infusion of ARRA
funding from the federal government in 2010. Due to the budgeting of district leaders and the
resilience of the local economy, these students did not have educational services cut, and their
class sizes remained stable at 15:1. One of the more consequential budgeting decisions that
Laredo ISD’s school leaders made was to maintain a healthy emergency reserve fund. That
decision, regardless of the health of the local economy, is one that other district leaders did not
make which hurt their recovery efforts during the recession. Fiscal shocks, like the Great
Recession or the COVID-19 crisis, are not easy to predict which makes preparing for them ahead
of time all the more important.
Kingsville Independent School District
San Antonio ISD and Laredo ISD are both larger, urban school districts in Texas. Both
school districts show similar trends in revenue and expenditure reductions from 2009-2013. This
leads to the question, did these trends look comparable for smaller, non-urban, high-poverty
districts in Texas during the recession? As with Cutler-Orosi USD in California, smaller districts
in Texas often did not have the breadth of historical public financial documents (annual budgets,
budget presentations, financial audits) available to do the same analysis that was done on the
other five districts in Texas. There are a number of reasons why documentary evidence is not as

170
readily available in many of the smaller school districts. Smaller, more rural school districts are
often working with more budget constraints and fewer technical personnel (budget officers,
teams of financial officers, demographic teams) than districts with larger bureaucracies and
administration (Vincent, 2018). However, this does not mean that there are not important lessons
to be learned from non-urban school districts. As was done with Cutler-Orosi USD in Chapter 5,
this section will descriptively analyze the quantitative data of a smaller non-urban school district
in Texas.
Kingsville Independent School District’s publicly available financial records go back to
2018. In this section, the quantitative data trends from Kingsville Independent School District
will be compared to those from San Antonio ISD and Laredo ISD. The purpose of this is to see if
the main findings from those two districts are similar or different in a smaller, rural district. Due
to the factors discussed above, there is not the same amount of evidence present in Kingsville
ISD that there was in San Antonio and Laredo. However, there are still important policy and
budgeting lessons to be learned. Federal, state, and local spending decisions were highly
consequential for smaller, more rural school districts.
Kingsville Independent School District is a medium sized school district in southern
Texas near Corpus Christi. The school district serves the city of Kingsville which is the county
seat of Kleberg County. Historically, the city of Kingsville was defined by a rich oil and gas
industry primarily driven by the district office of Humble Oil and Refining Company, now
known as the Exxon Company. The population of Kingsville grew throughout the 1980s due to
Exxon and the city’s Texas A&M campus. However, in the mid-1980s Exxon closed their
Kingsville district office, and the city’s population fell from 29,949 in 1990 to 25,845 in 2015,
leaving mining, chemical and oil production, and the military as the most significant driver of the

171
region’s economy. The Naval Air Auxiliary Station Kingsville employs one in seven people in
Kleberg County, whether directly or through contracting (Ramirez, 2017). The local
unemployment rate during the Great Recession was 8.8%, which was only slightly higher than
the state unemployment rate of 8.6%.
Kingsville ISD has one 9-12 high school, one 7-8 middle school, one 5-6 intermediate
school, and four elementary schools. In 2008, the average daily enrollment of the district was
4,344 students. Enrollment fell throughout the recession averaging a three percent decline year
over year from 2008 to 2012. By 2012, the school district’s enrollment was 3,423. The district’s
student population is predominantly Hispanic at 80%, followed by white students at 14%, and
African American students at 5%. The percent of students eligible for free or reduced-price lunch
grew throughout the recession from 67% in 2008 to 80% in 2012. This section begins with a
discussion of changes in Kingsville’s revenue streams during the recession and compares them to
San Antonio ISD and Laredo ISD. A discussion of expenditures will follow.
Overall revenue changes in Kingsville ISD, resembles those in both San Antonio ISD and
Laredo ISD. There was a 27% spike in federal revenue in 2008 due to an influx in Title I funding
which brought overall revenue growth up to nearly 10%. The state revenue reduction in 2010 and
2011 was in line with both other high poverty school districts in Texas, but not as severe as in
any of the lower poverty school districts in Texas. State revenue declined in every year between
2009 and 2012. The worst year was a six percent drop in 2011, which was when the Texas
legislature made their deepest cuts to education funding.

172
Figure 6.7 Percent Change in Kingsville ISD Revenue Sources: 2004-2012
However, as a result of more robust local revenue, the three low poverty school districts
experienced more substantial increases in overall revenue after 2010 than higher-poverty school
districts that were still experiencing revenue declines. Similar to San Antonio and Laredo is a
pronounced federal revenue drop in 2012. Kingsville’s federal revenue fall is far more distinct
with a 42% drop the year after the district finished spending their ARRA funding. A large drop
in federal revenue the year after a major program may not be surprising, but it is essential to
understanding potential flaws in ARRA funding. The reduction speaks to two issues with the
ARRA program. ARRA funding did not always align with the overall education funding cuts of
individual states. This timing mismatch means that districts were receiving funding outside of the
years when they needed it most. The federal funding was a short-term fix to deficits that never
entirely went away because states continued to spend less on education even as the overall
recession ended. Students in school district like Kingsville ISD would have significantly
-50%
-40%
-30%
-20%
-10%
0%
10%
20%
30%
40%
2004 2005 2006 2007 2008 2009 2010 2011 2012
State Local Federal Overall Revenue

173
benefited from a second round of federal stimulus funding. A second-round would have helped
districts with crucial expenditures such as teachers, aides, and transportation while easing the
impact of deficits and accumulated debt.
Figure 6.8 Percent Change in Overall Debt for Kingsville ISD, San Antonio ISD, and Laredo ISD: 2007-2013
Kingsville ISD had considerable budget deficits four out of five years from 2008 to 2013.
Simultaneously, the school district’s total outstanding debt grew. The district’s total debt
increased by 62% from 2008 to 2012. Debt increased 72% in 2010 alone when the school district
faced a $12 million budget deficit. In 2012, Kingsville ISD had an $11 million budget deficit,
and district debt jumped another 13%. This growth in debt is far more significant than either San
Antonio ISD or Laredo ISD. Kingsville ISD’s average debt growth from 2008 to 2012 was
double that of San Antonio ISD and five times larger than in Laredo. The recovery efforts of
several school districts in this study were hindered by accumulated debt during the recession,
-20%
-10%
0%
10%
20%
30%
40%
50%
60%
70%
80%
2007 2008 2009 2010 2011 2012 2013
Kingsville ISD San Antonio ISD Laredo ISD

174
including Forney ISD, Capistrano USD, and now Kingsville ISD. The rapid accumulation of
large amounts of district debt are problematic for several reasons that were discussed in the
Forney ISD case study. Funding has to be diverted to address school district repayment plans,
and large amounts of increased debt can impact a school district’s credit rating. A lowered credit
rating can make borrowing during future crises much harder. It is no coincidence that the worst
years of Kingsville ISD’s debt growth also correspond to the worst years of expenditure
reductions.
Figure 6.9 Percent Change in Kingsville ISD Expenditures: 2003-2012
Kingsville ISD’s changes to expenditures look relatively similar to both San Antonio and
Laredo ISD. School leaders made reductions to support services in 2008 and 2009 before making
more significant cuts to instructional expenditures in 2010. The most substantial reductions to the
district’s staff came at the administrative level. Between 2010 and 2013, Kingsville ISD
eliminated 50% of their administrators and 27% of their administrative support staff. District
leaders eliminated eight percent of their overall teaching staff in 2010 which included 2% of
-10%
-5%
0%
5%
10%
15%
2004 2005 2006 2007 2008 2009 2010 2011 2012
Instructional Expenditures Support Services Per Pupil Expenditures

175
their elementary positions and 12% of their secondary positions. In 2015, Kingsville ISD still
had 22 fewer teaching positions than it did in 2010. Fortunately for the district, enrollment also
fell over that period. The decrease in enrollment meant that Kingsville’s student to teacher ratio
did not substantially change. It went from 14 students per teacher in 2010 to 15 in 2014. The
district also eliminated 17% of their instructional aid positions and 14% of their guidance
counselors between 2010 and 2013. Kingsville ISD’s per-pupil spending made modest gains
during the recession. The only year that growth of per pupil spending fell was in 2010 by 3%.
The potential problem with only small increases in per-pupil spending is that the demographic
makeup of the student body was changing over this period. As discussed above, the number of
students eligible for free and reduced lunch grew 13% during the recession. A jump in students
eligible for FRL of this amount might indicate the need for additional funding to support students
fully. This funding could come in the form of federal assistance or state aid programs for
students from high poverty, neither of which happened.
The most salient takeaway from Kingsville ISD is that, once again, a school district in
this study had a substantial increase in overall debt as a result of ballooning budget deficits.
School district debt, particularly as a result of major financial shocks, is an underexplored area of
research. We need a better understanding of the disparities of the accumulation of debt among
school districts of different wealth. That debt can hamstring the efforts of school districts to
recover from fiscal shocks which impacts the access to resources for students. As discussed in
Chapter 2, Chapter 5, and Chapter 7 resource deprivation negatively impacts a range of student
resources and prolonged exposure to resource deprivation greatly increases those effects.
Kingsville’s debt growth far exceeded either San Antonio ISD or Laredo ISD. Rajashri
Chakrabarti and Elizabeth Setren conducted a similar study to this one on school district finances

176
in New York during the recession. Chakrabarti and Setren found that many school districts in
New York resorted to increased debt after the recession to restore instructional expenditures. The
authors found that higher poverty districts turned to debt far more often lower-poverty districts
(Chakrabarti & Setren, 2015). While this may not be a surprising finding, it is an important one.
This is crucial because it compounds the effects of fiscal shocks on high poverty school districts
for a longer period of the recession is over, exacerbating spending inequities across districts.
Debt played an essential role in keeping school districts afloat during the recession, but it also
had significant consequences. The longer school districts had to issue debt the more interest they
had to pay and the higher the chance the district’s credit rating would be impacted. Like many
other states, neither California nor Texas offered debt payback assistance after the recession,
which meant that school districts were on the hook for anything that they had to borrow. Since
higher poverty districts were more likely to borrow money, they were also stuck repaying that
debt for more extended periods than lower-poverty school districts. Lower poverty districts could
allocate more funds to instructional expenditures sooner partially because they were not diverting
that money towards paying off debt.
Conclusion
Texas is mainly renowned by economists, journalists, and policymakers to have
weathered the recession better than other states in the United States (Knight, 2017; Thompson,
2010; Villanueva, 2016). However, the Texas legislature still made deep education funding cuts.
The education funding cuts led to more substantial disparities between higher and lower poverty
school districts coming out of the recession. At the same time, the Texas legislature made policy
decisions that put additional pressures on school districts before the economic downturn. These
policy decisions include the 2006 per-pupil spending freeze and raising academic standards amid
177
education funding reductions. Table 6.5 contains a list of examples of the local district program
reductions and the methods that school district leaders used to achieve those reductions. School
leaders in both high and low poverty districts turned to the elimination of teaching and
instructional aid positions in the first year of state education budget reductions. School districts
almost immediately went to the last layer of cuts outlined by the budget reduction continuum, the
reduction of instructional positions and programs. As instructional costs (particularly salaries)
make up the majority of school district expenditures, they provide the most significant and most
immediate source for closing budget shortfalls.
The persistence of instructional and support reductions (such as eliminating teaching
positions, cutting transportation programs, and reducing administrators) in the highest poverty
school districts can partially be explained when looking at statewide changes in state and local
revenue during the recession in Texas (2011-2013). The reductions in state funding made by the
Texas legislature in 2011 were not as drastic in higher-poverty districts as they were in lower-
poverty districts. Low poverty districts lost 1.2% of their state funding in the first year of cuts
and 12.5% of their funding in the second year of cuts while high poverty district lost 0.3% of
their state funding in the first year and 0.5% in the second year (Knight, 2017; Texas Education
Agency, 2014; Villanueva, 2017).
While it may not appear that state funding cuts were as consequential for high poverty
school districts, during the same period, low poverty school districts increased local funding by
31.6%, while high poverty districts only increased local funding by 11.6%. Throughout the
recessionary period in Texas, the lowest poverty districts saw an increase in per-pupil funding by
8.3%. The growth in per pupil funding in lower poverty school districts resulted in a $1,352 per
pupil funding gap between high and low poverty school districts by the end of the recession
178
(Knight, 2017; Mudrazija, Blagg, Lee, Lou, & Rosenboom, 2019). These statewide trends
support this study’s findings in that the three lower-poverty school districts were able to restore
spending faster than higher poverty districts due to boosted local revenue.
Lower poverty school districts were able to close budget deficits faster by maximizing
local tax revenue, which widened the per-pupil funding gap between higher and lower poverty
districts coming out of the recession. Importantly, students in higher-poverty school districts
were exposed to cuts in instructional personnel and programs longer than those in lower-poverty
school districts. This is crucial because students in high poverty districts were deprived of
essential human resources7 such as smaller class sizes, more highly qualified teachers, robust
transportation programs, and longer school years. Research on human resources such as those
previously listed has emphasized their importance on student outcomes particularly for students
from lower-income backgrounds (Adamson & Darling-Hammond, 2015; Dietrichson et al.,
2017; Jackson et al., 2015). As discussed in Chapter 2 (p. 31), the length of funding reductions is
essential when considering its impact on students, particularly students of color and students
from lower-income backgrounds. A critical study on recessionary budget reductions by C.
Kirabo Jackson, Cora Wigger, and Heyu Xiong, found that a 10% cut to school spending during
the Great Recession reduced test scores by 7.8 percent of a standard deviation and a 10%
spending reduction during all four high-school years was associated with 2.6 percentage points
lower graduation rates (Jackson et al., 2018), though my study is not longitudinal enough to
capture these effects.
7 A broader discussion of human resources occurs in Chapter 2 on page 21.

179
Table 6.5 Program Reductions during the Great Recession in Texas NCES Defined Expenditure Categories
Examples of Local Program Reductions Found in My Analysis
Strategies for How Districts Made Reductions
Instruction expenditures Teacher layoffs Frozen teacher salaries Cuts to special education services Loss of pay during eliminated instructional days Elimination of summer school Elimination of financial stipends for teachers to tutor math and science
Positions eliminated by attrition Increased class sizes Reduced professional development days Teachers made to teach outside of their certification area Restructuring grade levels for schools Restricted conference and travel for teachers
Support services Instructional staff
support Teacher aid layoffs Instructional coach layoffs
Student support services
Elimination of after school programs Counselor layoffs Psychologist layoffs
Operations and non-instructional expenditures
Energy-saving strategies Custodial layoffs Deferment of purchase of instructional material
Strict energy guidelines for HVAC
General administration Central office layoffs Facilities and construction
Closing schools within districts Elimination of maintenance expenditures Elimination of construction expenditures
Outsourcing custodial services Deferment of planned maintenance Deferment of planned construction
Debt services Deferment of debt payments, accrual of interest Deficit spending
Increased debt issued

180
Like California, emergency education aid through the American Recovery and
Reinvestment Act was an important component of the overall solution to help school district’s
close budget deficits. However, school district leaders in California emphasized the importance
of ARRA in annual budgets far more often than those in Texas. The reason for that increase in
emphasis may have been that there was a policy timing mismatch between when ARRA funds
were distributed to school districts and when they were needed most. As mentioned previously,
the worst effects of the recession, namely high unemployment and falling property values,
lagged in Texas by a couple of years as compared to the rest of the country. The Texas
legislature distributed ARRA funds to school districts beginning in 2008 before those
recessionary effects started in the state. That is two years before the state legislature made their
most significant education funding cuts. That also means that most school districts used at least
half of their ARRA funds before they saw the worst local and state funding cuts, which occurred
from 2010-2013. Had these funds been distributed in time with the state’s economic downturn
school districts would have had the opportunity to use them to address more immediate needs
like funding instructional expenditures. It is unlikely that school districts leaders knew the most
important budgetary concerns that they faced three years before they faced them. ARRA funds
could have made a greater impact in areas that mattered (retaining teachers, maintaining after
school programming, funding transportation) had the U.S. Department of Education distributed
those funds in a more targeted manner.
As of 2020, Texas has still not fully restored education funding to pre-recessionary
levels. The state still spends 20% less per pupil than it did in 2008 (Picchi, 2019). In 2019, the
state legislature took some corrective action when it allocated $11.5 billion in funding to
increase teacher pay, expand access to full-day pre-K, and slow the growth of property taxes

181
(Zelinski, 2019). That $11.5 billion is distributed over two years and is scheduled to expire in
2021.While the additional funding is certainly welcome by school leaders, some school district
leaders have already expressed concern that the aid represents a short term cash injection which,
like the federal government’s ARRA funding, is causing uncertainty in forecasting future school
district budgets (Zelinski, 2019). Again, the state legislature is attempting to use a short-term
solution for a long-term problem. A central lesson of this thesis is that while short term aid can
be crucial in the moment, they cannot be final resolution to the problem of budget deficits. State
legislatures should develop prolonged, targeted financial assistance for the districts that need it
most. That policy may target the main issues found in the districts in this study. Those issues
include teaching layoffs, transportation protection, and debt relief.

182
Chapter 7 – Conclusion
The Great Recession was the most significant fiscal shock to education funding since the
Great Depression. The economic crisis, compounded by state legislators' short-sighted decision-
making, led to waves of teacher unemployment, cuts to essential educational services, and the
growth of both funding and achievement inequity. State legislators in California and Texas
exacerbated funding issues at the district level by withholding scheduled payments and refusing
to tap into available emergency reserves. Previous studies have highlighted increases in resource
inequity between higher and lower poverty school districts, the growth in the achievement gap
between students of color and white students following the recession, and the damage done to
students in other important outcomes. This study extends the current literature in two key ways.
First, it identifies some fine-grained budget reductions within broader, quantitative budget
reporting categories. The analysis of school district budgetary documents gives more detail on
how district leaders made these reductions and how state and federal education funding policies
impacted school district leaders' budgeting decisions. Second, the study identifies sources of
inequity in state and local education funding policies. This chapter will begin with an overview
of the research questions and the purpose of this study. The summary is followed by a discussion
of significant themes and findings from the analysis of the 12 California and Texas school
districts. Finally, there will be a brief discussion of policy implications and how this study's
conclusions relate to the COVID-19 pandemic and education funding.
Research Purpose
Research has demonstrated that increased spending, particularly on human resources,
positively impacts student outcomes (B. Baker, Sciarra, & Farrie, 2010; Knight, 2017; Shores &
Steinberg, 2017; Strunk, Goldhaber, Knight, & Brown, 2018). The academic literature on how

183
money matters for students has begun to answer questions about what types of expenditures are
most consequential for students who are historically underserved such as students of color and
students from high poverty school districts. Researching school spending and student outcomes
is essential in steadier economic conditions where school budgeting can be somewhat
predictable. However, questions on what types of expenditures to prioritize for students become
even more consequential in times of financial shock where local, state, and federal revenue
streams are unpredictable. As demonstrated in this study, all three revenue streams can be
severely reduced from one year to another without warning.
This study extends the findings of prior research on budgeting during the Great Recession by
using a qualitative methodology. The analysis of district budgetary documents helped to shed
light on the types of budget reductions school leaders prioritized during the Great Recession,
what budgeting decisions were used to make reductions, and how state and federal school
finance policy influenced those decisions. This study addresses the following research questions:
1. What budget reductions did school leaders in some of the highest and lowest poverty
school districts of California and Texas prioritize during the Great Recession?
2. How did budget reductions differ in the highest and lowest poverty school districts in
California and Texas during the Great Recession?
3. What state and federal education funding policies were the most influential in school
leaders’ budget reduction decisions?
Summary of Findings
The first research question for this study addresses school leaders' specific budgetary
decisions during the Great Recession. One of this study's main goals was to try and uncover

184
more granular budget reduction decisions than traditional quantitative reporting categories can
deliver. Table 7.1 highlights where my analysis accomplished that goal. Unfortunately, I was not
able to find the precise budgeting details that I had hoped to find. While this study was able to
find some detailed budgeting results, it was also remarkable how difficult it was to find precise
budgeting decisions, and the reasons behind those decisions, despite a detailed analysis of
publicly available financial documents. Some of the variance in the quality of budgetary data
was discussed in Chapter 4. Still, it is worth emphasizing the lack of specificity in the majority of
analyzed documents. In some ways, it is not a surprise that literature on school finance has found
it so challenging to pinpoint strong, definitive connections between what types of spending
matter most and student outcomes. This difficulty highlights the importance of more detailed
district and site level finance data collection. There needs to be more transparency in both district
and school-level spending data. This responsibility does not fall entirely on schools. Data
collecting agencies such as state departments of education and the U.S. Department of Education
need to create more straightforward methods by which school leaders can collect and report
financial data. The study also suggests that there is a need for additional qualitative inquiries into
the effects of spending on students, teachers, and school leaders.
A central trend that came out of this analysis was the influence that so many educational
policies created before and during the recession, had on the decisions that school leaders made
when reducing district budgets. Some of these policies are not thought of as traditional school
finance policy, but they had an essential influence on recessionary budget reductions
nonetheless. For example, California had a law that directed a “last in first out” approach to
laying off teachers. While in normal economic conditions, this policy's impact may have been
less pronounced, during the massive teacher layoffs in the recession, the California law had a

185
meaningful impact. Newer teachers, like those in Capistrano USD, were often placed in schools
in higher poverty areas. Eliminating these teachers or replacing them with instructional aids
disproportionately impacted students in higher poverty areas in some of the districts in this study.
The Texas legislature’s decision to increase academic standards two years after significantly
cutting education funding is another example of a state policy impacting the way that districts
made budgeting decisions.
The examples above illustrate that even though a particular education policy is not
designed to deal with school finance, during a financial shock, an increasing amount of education
policies may have unexpected, downstream consequences on the budget-making decisions of
school leaders. Policymakers should be increasingly mindful of monitoring those policies.
This study’s second research question addresses the differences in budget reductions
between high and low poverty school districts. When the California and Texas state legislatures
made their education funding cuts, higher poverty districts almost immediately made reductions
to instructional positions. Cutting teaching positions before other areas of educational
programming (such as deferring planned maintenance or delaying purchases of instructional
materials) does not align with how school budget reductions are typically conducted in times of
stable revenue (Hartman, 2003). The deviation from traditional budgeting suggests that severe
financial shocks will lead higher-poverty school districts to make more immediately
consequential educational budgeting decisions. While this finding may not be particularly novel,
it is still important to highlight because there was an apparent policy mismatch between state
education funding policy and the budgeting decisions of school leaders on the ground.

186
Table 7.1
Program Reductions During the Great Recession in California and Texas
NCES Defined Expenditure Categories
Examples of Local Program Reductions Found in My Analysis
Strategies for How Districts Made Reductions
Instruction expenditures Teacher layoffs Frozen teacher salaries Cuts to special education services Loss of instructional days (CA) Loss of pay during eliminated instructional days No cost of living adjustments (CA) Elimination of summer school Elimination of financial stipends for teachers to tutor
Positions eliminated by attrition Using a “last in first out” approach to teacher layoffs following state law (CA) Increase of class sizes Reduced professional development days Teachers made to teach outside of their certification area (TX) Restructuring grade levels for schools Restricted conference and travel for teachers
Support services Instructional staff support Teacher aid layoffs
Instructional coach layoffs
Student support services
Elimination of after school programs Counselor layoffs Psychologist layoffs
Operations and non-instructional expenditures
Energy-saving strategies Custodial layoffs Deferment of purchase of instructional material
Installation of solar panels Strict energy guidelines for HVAC
General administration Central office layoffs Facilities and construction
Closing schools within districts Elimination of maintenance expenditures Elimination of construction expenditures
Outsourcing custodial services Deferment of planned maintenance Deferment of planned construction
Debt services Deferment of debt payments, accrual of interest Deficit spending
Increased debt issued

187
This study’s findings related to immediate and lasting budget cuts in six high poverty
districts aligns with prior literature on the recession. Shores and Steinberg (2017) found adverse
educational effects in student achievement were most felt among districts serving high
concentrations of low-income students (Shores & Steinberg, 2017) nationally during the
recession. C. Kirabo Jackson, Cora Wigger, and Heyu Xiong found that a 10 percent school
spending cut during the Great Recession reduced test scores by about 7.8 percent of a standard
deviation. Additionally, a 10 percent spending reduction during all four high-school years was
associated with 2.6 percentage points lower graduation rates (Jackson et al., 2018). Students in
higher-poverty school districts in California and Texas were exposed to higher class sizes, fewer
after school programs, fewer tutoring options, fewer qualified teachers, and fewer instructional
resources for a more extended period than students in lower-poverty school districts. This
research highlights the reality that the time of exposure to resource deprivation matters, and it
matters for a host of student outcomes. Students of color and students in lower-income districts
bore the brunt of this deprivation.
The following section continues to address research questions two and three. The section
explores the critical differences in reductions between high and low poverty school districts and
the influence of essential policies on school leaders’ decision-making process. The section
discusses four main takeaways from the analysis of the twelve school districts in both Texas and
California. These takeaways contain broad themes and central lessons that cross school districts
and states. The first finding addresses the role of federal aid through the American Reinvestment
and Recovery Act. The act was critical in helping to fill budget deficits, particularly in higher
poverty school districts. However, there were some major drawbacks that prevented the aid from
being as effective as it could have been. Second, there is a discussion of the loosening of
188
categorical aid in California and how important that was for school leaders to be able to address
local budget issues. At the same time, those funds could have been freed up in a more equitable
way that would have helped to prevent the growth in the per pupil funding gap. State funding
policy that pinpointed retaining teaching positions or that incentivized new teachers to work in
highly impacted school districts may have been more fruitful than simply slashing education
funding or freeing up already allocated categorical funds. Third, there is a section examining
how the higher poverty districts in this study became increasingly reliant on state revenue during
the recession. Lower poverty districts became increasingly reliant on local revenue. There are
key equity implications for this shift in revenue reliance that could harm high poverty districts’
ability to weather future recessions. The final takeaways highlight the importance of accurate
enrollment projections and property value projections. Inaccurate enrollment and property value
projections led several school districts in this study to overextend their budgets and drain their
emergency reserves in the years leading up to the recession. These districts accumulated a large
amount of debt which hindered their ability to recover from the recession.
Main Thematic Findings
Federal education funding aid was vital in helping school districts to retain
education personnel and address budget deficits.
The importance of federal funding in education is often underexplored in school finance
literature due to its relatively small contribution to overall district budgets. However, federal
funding took on a critical role during the Great Recession in both California and Texas. Both
states’ legislatures chose to close budget deficits by making massive cuts to education funding.
Local property tax revenue fell, predominantly in higher poverty communities, because of the
collapse of property markets. When both state and local revenue fell during the recession, a vital

189
source of relief was federal funding. The American Recovery and Reinvestment Act of 2009
provided $100 billion in aid to education in the United States during the Great Recession. $53.6
billion of that $100 billion was allocated to school districts to prevent mass layoffs and cuts to
instructional spending. ARRA funding was provided to states in three portions from 2008-2011.
As shown through the evidence in district budgets, school board minutes, and memos of
school districts gathered for this study, federal aid was cited by school leaders as having
prevented more drastic layoffs of teachers and moderating cuts to teaching salaries. For instance,
in Laredo ISD, TX, school leaders chose to use ARRA funds to increase teaching salaries, which
they hoped would attract higher-quality teachers. In 2008, Capistrano USD, CA school leaders
considered eliminating 250 teaching positions. ARRA funding (combined with cuts to the
district’s transportation program) saved half of those positions. These cuts are still severe, but
they could have been much worse absent federal support. Certified district salaries (the majority
of which were teachers) comprised 63-81% of school district budgets in this study. In eight of
the twelve school districts, school board members, superintendents, and school budget officers
directly cited ARRA funding as essential to avoiding additional teaching layoffs.
There were two main problems with the ARRA program that are evident in this study.
First, federal assistance funding was distributed uniformly to states over three years. The
problem with that method of distribution is that the recession impacted California and Texas in
different years. While starting in 2008 made sense for California, because the state’s housing
market and unemployment rates plummeted in line with most of the country, that same time
period did not make as much sense for Texas. Texas did not see the worst recessionary effects
until 2011, which is reflected in the state’s massive budget deficit. All six of the school districts
in this study from Texas received and spent their ARRA funds from 2008 to 2011. 2008 was

190
three years before the Texas legislature made its deepest education cuts. The additional federal
funding may have been more useful in retaining teaching positions had it been distributed when
it was most needed.
Second, ARRA did not do enough to define the mechanisms that state legislatures needed
to use to distribute the additional funds to school districts. There was a significant variation in
how California and Texas chose to allocate ARRA funding to individual school districts.
California added the federal funds to its general funding formula. What this means is that the
additional federal funds acted as if the state itself had received more revenue from 2008 to 2011.
That extra revenue was then distributed through the general funding formula, which took into
account student factors such as poverty, English language learners, and students with special
education needs. By passing the funds through the statewide formula it was distributed to school
districts in a more equitable manner that took into account the differences in students in those
districts.
Meanwhile, Texas distributed half of its ARRA allocation through the state’s general
fund and put half of its ARRA funds into the state's Permanent School Fund. The Permanent
School Fund is a public investment fund that invests money made off the sale of state-owned oil,
gas and land and then sends a portion of the earnings to Texas public schools every year. This
fund distinguishes Texas in a way because most other states do not have the large amount of
natural resources that are so valuable. The Permanent School Fund distributes a small flat
funding amount to each district in Texas annually. The flat payment to districts is a crucial
distinction from the state’s general fund. Since the amount the fund pays out is flat across all
districts, that means that the payment does not take into account district poverty or the unique
needs of students like Texas’ general funding formula. High poverty school districts receive the

191
same amount low poverty districts received. That means that half of Texas’ federal stimulus
funding was distributed inequitably.
Despite the drawbacks mentioned above, a robust federal response to an economic crisis
prevented a much worse budgetary emergency for local school districts in California and Texas.
ARRA and EdJobs saved teaching positions across both states. However, the federal government
could have done much more to help school districts by distributing the funds in a more targeted
manner and providing a second round of aid. The analysis of school budgeting materials in this
study also found that emergency federal funding helped to renovate school districts, buy
technology for students, and support instructional programs for students with special needs that
were at risk of being shut down under state budget cuts.
The California state legislature’s decision to free up Tier III categorical funding
helped school districts to spend more on instructional expenditures.
Nine of the school districts in this study saw a substantial loss in local revenue for part of
or the entirety of the recession. This loss in local revenue was primarily due to the collapse of
local housing markets and high unemployment. California state legislators decided to defer
school district payments to address the state’s growing budget deficit. The decision to defer
payments put particularly excessive pressure on higher-poverty school districts. District leaders
were forced to budget without a clear sense of what their annual state revenue would look like,
which led many leaders to take out loans. The California legislature’s missed education
payments drove one of the districts analyzed in this study to the brink of a state takeover. This
means that school districts were wholly reliant on any remaining state revenue that they had left
over from the previous year and emergency reserve funding. The California state legislature
eventually addressed their funding deferrals by allowing school districts to use categorical

192
funding as they needed through the state’s Tier III categorical program. The decision to free up
categorical funding and essentially transforms the funds into block grants was the most crucial
education funding policy decision by the California state legislature for both high and low
poverty districts.
Before the state legislature freed the funds up, Tier III funds were categorical and meant
for specific programs that are listed in Table 5.3. Providing more flexibility to categorical
financing, during times of state revenue reduction, was critical for both higher and lower poverty
school districts in California. Reallocated funding helped school leaders in all six California
districts in this study address their most immediate local expenditure needs, which included
saving many, but not all, teaching positions and keeping student-teacher ratios relatively stable.
Fresno USD moved $30 million out of 23 different programs and reallocated it all towards
keeping teachers and hiring additional instructional coaches, counselors, intervention teachers,
and other instructional staff. Fremont USD moved $10 million out of ten different Tier III
programs and used it to save all teaching positions in 2010. Allowing categorical funding to be
used at a district’s discretion enables school leaders to address the district’s most pressing needs.
The purpose of the flexibility program was successful, as evidenced by spikes in instructional
expenditures in all districts in this study. This is not to say that the program was an overall
success. The evidence from this study cannot show that all districts in California used the funds
for their most immediate needs.
The relative success of the loosening of Tier III funds in California led me to the question
of why Texas’ state legislature did not loosen restrictions on their categorical funding during the
recession? The answer is that Texas did not free up categorical funding because it was a
relatively inconsequential percentage of the entire state education budget. During the recession,

193
Texas operated five categorical programs. These five categorical programs paid out $300,00 to
school districts across the state. That $300,000 is less than one percent of Texas’s overall
education budget. California was more reliant on categorical programs. 60 categorical programs
made up 14% of California’s education budget. Tier III was made up of 40 of those programs.
The Republican-led Texas legislature and governor’s major blunder was not using economic
stabilization aid that was meant for times of crisis like the Great Recession.
A policy alternative to the California legislature’s decision would have been for state
legislatures to turn Tier III funds into categorical funding specifically for instructional
expenditures. Proponents of categorical funding argue that money allocated for specific
programs helps to ensure that policy goals, in this case, maintaining teaching positions and
educational programming, are met (J. Smith, Gasparian, Perry, & Capinpin, 2013). The federal
government, in part, created a relatively successful categorical program through the Department
of Education’s EdJobs initiative to ensure that federal funding was used to save teaching
positions. At the same time, research has also shown that categorical funding can produce
unintended consequences that counteract the purpose of the funding. Thomas Timar and
Marguerite Roza conducted a study in 2010 that found that California’s heavy use of categorical
funding led school districts to supplant funds instead of supplement them. School leaders were
using categorical funds from the state (that were intended to supplement local funding for high-
need students) by allocating a larger portion of unrestricted funds for students with lower needs,
which ran counter to the purpose of the categorical funding (Timar & Roza, 2010). In other
words, school districts were moving funds away from students with special needs and replacing
them with categorical aid from the state, thus resulting in a net-zero gain effect. The purpose of
the categorical assistance was to add to the money that districts were already using and to

194
increase funding for students with special needs. Fortunately, this study has found that when
school districts used the Tier III funds, they did use it to instructional expenditures, such as
keeping teachers, rehiring furloughed teachers, and maintaining educational programming.
Lower poverty districts increasingly relied on local revenue and had the resources to
leverage policy opportunities.
The most critical advantage that lower-poverty school districts had during the recession
was their local revenue base. In general, this finding has been demonstrated by prior research and
is not entirely surprising. However, this study adds to that literature in two main ways. First, this
study showed the shift in local property tax reliance by low poverty districts throughout the
recession. This will be discussed more below, but that shift has meaningful implications for the
growth in per pupil funding inequity in future crises. Second, this research highlighted the
rapidity of recovery in low poverty school districts as compared to slower recovery in high
poverty school districts. The impact of a student’s time of exposure to a lack of education
resources will also be discussed in this section.
While local revenue did not increase uniformly across all low poverty school districts in
this study, reliance on local revenue did. Table 7.2 shows the change in local revenue’s
contribution to overall district budgets. Five of the six low poverty school districts in this study,
in both California and Texas, saw an increase in local revenue reliance during the recession.
Three of the higher poverty districts saw decreases in local revenue reliance while the remaining
three remained relatively steady. High poverty school districts in this study grew more reliant on
state and federal funding from 2008-2012 than the low poverty districts. The growth in state and
federal reliance is crucial for two main reasons. First, research has shown budget deficits were
most acutely felt in districts more reliant on state funding, which were most often those districts

195
that raised fewer local funds due to lower property values (Chakrabarti & Setren, 2015; Shores,
2019; Shores & Steinberg, 2017). While local jurisdictions raised millage rates to offset
declining property values and state support, high-poverty areas were less able to do so to an
adequate level.
Second, increased reliance on local property taxes proved to be consequential for the
speed at which school districts recovered after the recession. While higher-poverty school
districts had to wait for state education funding to return to pre-recessionary levels (in some
places, this has still not happened), lower-poverty districts were able to continue to leverage their
local property tax bases to increase spending quicker (Evans et al., 2019). This phenomenon
manifests itself in this study when looking at expenditures across high and low poverty districts.
Increased reliance on federal revenue during the four years of the recession was also
consequential as that funding was temporary, and all districts see federal funding fall
immediately after ARRA funding ended.
Both of the findings related to local property taxes in this study have troubling
implications for the higher poverty districts in future financial crises. Federal aid during a
financial crisis, like in the Great Recession, is fleeting. District leaders in this study, while
thankful for the assistance, often remarked on how it did not help them plan for the future. State
revenue during a financial crisis is volatile. Changes in state tax revenue can have a significant
impact on the state’s education budget. Extreme volatility in state tax revenue occurred in both
California and Texas during the recession, and it had a substantial effect on students across both
states.
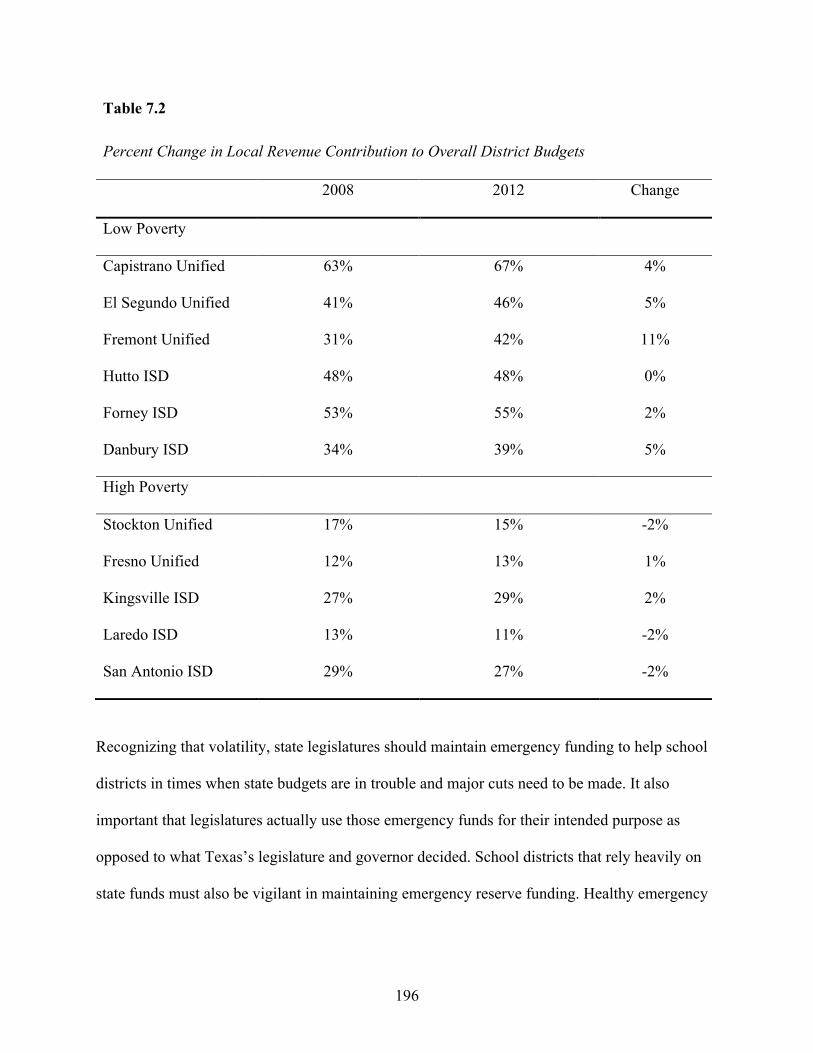
196
Table 7.2 Percent Change in Local Revenue Contribution to Overall District Budgets 2008 2012 Change
Low Poverty
Capistrano Unified 63% 67% 4%
El Segundo Unified 41% 46% 5%
Fremont Unified 31% 42% 11%
Hutto ISD 48% 48% 0%
Forney ISD 53% 55% 2%
Danbury ISD 34% 39% 5%
High Poverty
Stockton Unified 17% 15% -2%
Fresno Unified 12% 13% 1%
Kingsville ISD 27% 29% 2%
Laredo ISD 13% 11% -2%
San Antonio ISD 29% 27% -2%
Recognizing that volatility, state legislatures should maintain emergency funding to help school
districts in times when state budgets are in trouble and major cuts need to be made. It also
important that legislatures actually use those emergency funds for their intended purpose as
opposed to what Texas’s legislature and governor decided. School districts that rely heavily on
state funds must also be vigilant in maintaining emergency reserve funding. Healthy emergency

197
funds can help to weather periods when the state government is not providing the level of
education funding as they do during normal times.
One other important observation in this research was that, typically, lower poverty school
districts were able to use revenue opportunities that higher poverty districts may not have had the
infrastructure or administration to access. These districts have floating resources that can
leverage additional revenue opportunities--whereas higher poverty district’s resources were
already sunk. (i.e., seeking corporate donations, leveraging inter-district transfers). For example,
Danbury ISD’s school leaders had a focused mission to use Texas’s lax interdistrict transfer
policy to gain more students to boost local revenue. Hutto ISD’s board of trustees worked with a
Texas advertising agency to license out their school mascot. The Board then sold advertising
space on district property, including busses, the Hutto stadium, and throughout the Hutto
community. El Segundo Unified School District in California received corporate donations to
help address the district’s budget deficit.
Another predominant example of a low poverty district leveraging their communities’
resources was Capistrano USD’s PTA’s $1 million in donations to the school district in 2010.
The ability to find methods to increase revenue beyond raising property taxes was not found in
higher-poverty school districts suggesting that alternative forms of income were not as readily
available for those districts. Per pupil spending gaps between higher and lower poverty school
districts grew during the Great Recession (Knight, 2017; Lafortune et al., 2016; Leachman,
Albares, Masterson, & Wallace, 2015). Prior resource has not focused on the additional revenue
opportunities that lower poverty school districts had to close budget deficits. One reason for the
lack of coverage is that it is hard to find reliable data to quantify these opportunities. However,
there must be better tracking of alternative sources of revenue for lower poverty districts if we
198
are ever to address equity in per pupil spending. Given the opportunity school leaders will use
the resources at their disposal to accumulate additional funding.
Inaccurate projections of average daily attendance growth led school districts to
engage in overbuilding and over hiring
Enrollment projections are always a central concern for school leaders because those
projections guide both state and district funding decisions. School leaders make enrollment
projections based on current enrollment, historical enrollment trends, local birth trends, and
current grade progression. These projections dictate important revenue streams such as overall
state revenue, revenue for specific grant programs, and additional aid to districts. This study has
found that timely and accurate enrollment projections were even more consequential during the
Great Recession. As evidenced in this study, inaccurate predictions led to drops in per-pupil
spending, inadequate emergency reserve funding, and sharp increases in a school district’s debt.
All of those situations occurred in the backdrop of declining state revenues.
Both state departments of education and local school district leaders were not vigilant
enough about assessing year over year changes in enrollment as the national economy began to
take a turn for the worst. At the local level, school administrators in districts such as Forney ISD
and Hutto ISD planned for enrollment growth to continue to increase significantly even though
that growth had begun to curtail several years before the recession. Increased enrollment
projections led school leaders to prepare massive district expansion projects such as new schools,
sports facilities, and sizable administrative renovation projections. The spending decisions of
school leaders leading up to the recession, based on enrollment projections, are all critical
because they ripple into nearly every aspect of how a school district responded once revenue
dried up.

199
For instance, the state Department of Education in Texas and Forney ISD vastly over
projected enrollment growth for 2008 through 2013. While the state and district planned for 16%
growth year over year for four years, the actual rate was closer to 5%. The dramatic slowdown in
growth led the state department of education to allocate $17.7 million in additional state revenue
that Forney ISD quickly spent and ultimately had to pay back. This increased Forney’s debt
service by 167% in one year. Hutto ISD enrollment growth dropped from 23% in 2007 to 6% in
2009. The rapid drop in enrollment growth corresponded with substantial drops in federal and
state revenue. As a result, the district closed down an elementary school that had only been open
one year. Students were directly impacted with increase class sizes.
Capistrano USD in California under projected the growth of students from high poverty
backgrounds from 2008 to 2012. In the 20 years leading up to the Great Recession, the district
engaged in rapid spending. It kept its emergency reserve funding at the minimum legal level,
which left the district unprepared to deal with state revenue reductions during the recession. As a
result of more significant budget deficits, per-pupil funding fell while the percentage of students
for lower socioeconomic backgrounds grew. Persistent budget deficits also led to massive
transportation cuts, which put pressure on families across the district.
It is difficult for any state government or local school district to predict a historically
catastrophic economic collapse. The collapse of the U.S. housing market caused enrollment
growth in many communities to slow and led to increases in poverty for children, particularly for
children of color (Danziger et al., 2012). However, there are steps that school district leaders
could have taken to mitigate the budget deficits that resulted from inaccurate enrollment
projections. During the recession, school leaders could have worked in conjunction with their
state department of education to adjust projections with more regularity, especially when the

200
economy began to show signs of faltering. Housing foreclosures, unemployment rates, and
populations rates can be powerful local indicators for school leaders when making projections.
The lapse in projection accuracy may speak to the need for school leaders and state educational
leaders to be more vigilant about monitoring national, state, and local economic conditions. Due
to school district dependency on state revenue, the economic conditions of the state in a volatile
economy can have devastating consequences on students. As demonstrated by this study, these
consequences can be more severe for higher poverty districts, school districts with inadequate
emergency reserves, or districts carrying large amounts of debt.
Implications for Policy and Practice
The budgeting decisions of state legislators in California and Texas created immense
financial pressure and budgeting uncertainty for all school districts in this study. The anxiety and
uncertainty were amplified for high poverty districts. The use of continued deferrals in California
put excessive pressure on higher-poverty school districts to come up with education funding that
was initially promised by the state legislature. These districts were then forced to budget without
a clear sense of their annual state revenue. The environment of uncertainty led some districts to
take out loans that the state did not help districts pay back. Stockton USD was at the brink of a
potentially long and agonizing state takeover. In Texas, Governor Perry and the state’s
legislators refused to tap into the state’s economic stability fund, which is intended for situations
like the recession. The state legislature and governor’s decision to not use their emergency fund
led to an immediate, severe education funding reduction across all school districts. Both Texas
and California have balanced budget rules which make the state legislatures cautious about over
spending. However, during a fiscal shock the size of the recession those rules should be
suspended so that the state can adequately address pressing budgetary needs. State legislatures

201
leave school districts in a near-frozen fiscal state while school leaders wait for promised
payments and education funding relief from their state’s governments.
There was a well-documented widening of the funding gap between higher and lower
poverty school districts during the recession. One finding from this study that helps to shed light
on the growth of the gap was that low poverty school districts were able to find ways to reduce
expenditures or increase revenues using methods that high poverty districts did not have the
bureaucratic bandwidth to pursue. Additionally, these outside sources of revenue are not easy to
find in publicly available data such as the CCD F-33 survey. State legislatures should pay even
closer attention to the per-pupil funding growth of higher income or lower poverty school
districts during a fiscal shock than they do in regular budgetary times. Texas’s “Robin Hood”
provision was designed to redistribute funding to higher poverty districts to avoid a widening of
the per-pupil funding gap. Still, it was not enough during the recession to make up for local
budget deficits. Though they are not always politically popular with people in lower-poverty
school districts, more robust redistributive school finance policies would help mitigate the
growth of funding gaps between districts and assist in future financial crises to put a cap on the
amount of revenue that higher-income districts receive.
In times of financial crisis, state legislatures might also consider creating incentives or
categorical funding relief programs similar to ARRA and EdJobs that specifically target
instructional positions and programming. Research demonstrates that instructional expenditures
such as hiring more highly qualified teachers, providing more direct tutoring, and lowering class
sizes are especially beneficial for students (especially for students in poverty). During a financial
crisis, when state education funding is tight, those are the expenditures that policymakers should
protect. The federal government, in part, did that through ARRA and EdJobs, and research has
202
shown that those federal programs helped to shield higher-poverty school districts from some of
the worst effects of the recession. In this study, many of the school districts directly pointed to
ARRA and EdJobs as programs that allowed the district to avoid cutting more teachers. Similar
state-level policies using emergency reserve funds or freed up categorical funding might achieve
a similar goal.
As mentioned early in this chapter, this study's findings emphasize the need for more
information and more transparency about how money is spent in school districts. Researchers
will benefit from more publicly available school expenditure and revenue data from within
school districts to see if spending is equitable across schools. For example, San Francisco
Unified School District’s 2010 budget revealed that the superintendent and the school board was
removing newer teachers from higher poverty schools due to California’s “last in, first out”
tenure policy. While SFUSD was following state law, it would help future research if data could
identify the schools in which newer teachers (who are let go) are teaching. This policy may
disproportionately impact students from higher poverty backgrounds. Research on the
importance of lower-class size ratios and stability in the form of lower teacher turnovers for
students in higher-poverty schools warns against the types of budget reductions that a “last in,
first-out” policy encourages. In districts that were cutting instructional positions and not
reporting what school sites those positions were cut from, it was difficult to gauge the impact of
those budget reductions on higher poverty schools within the district. Again, the need for school
level financial data could be crucial in ensuring that financial crises do not disproportionately
impact students with higher needs. In the case of a “last in, first-out” policy, unions may consider
negotiating a policy suspension in times of fiscal shock. Suspending the “last in, first-out” policy
could help ensure that newer teachers who are assigned to higher poverty schools are not at risk

203
of losing their jobs which would also help maintain classroom sizes. Beyond researchers and
policymakers, parents and community members would benefit from having better visibility into
how money is spent in their districts. That type of information might make difficult tax increases
or budget cuts easier to understand for the community.
Implications for Future Research
This research comes at a time when school finance literature is starting to come to grips
with how state and local education funding cuts during the Great Recession impacted both school
spending and student outcomes. However, more research needs to be done on school district
budgeting experiences during times of financial crises so that school leaders and policymakers
can make better budgeting decisions in future recessions. Many of the school districts included in
this study could provide robust individual case studies. Future research into budget reductions
during the recession should consist of interviews with school leaders. Interviews with school
leaders would help to get at why school leaders made the decisions that they did better than this
study was able to. It would also be useful to know how school leaders specifically think through
budgeting priorities during a fiscal shock so that policymakers can design funding packages to
address the areas that leaders are most concerned about. That research should also interview the
teachers, support staff, and even more importantly, the students that lived in school districts that
had to endure the brutal budget cuts during the recession. The lived experiences of those that
suffered through reductions would be a powerful addition to the existing school finance literature
on budget reductions. Their stories could give more information into how policymakers and
school leaders should be targeting funding in future economic crises.

204
Limitations
This study went through several iterations that each used different numbers of school
districts in its sample. More cases meant that the likelihood of uncovering the full context of any
one school district might become diminished by the study's scale. Given how little is known
about how federal, state, and local policy during the recession impacted school district
budgeting, the decision was made to include a wider variety of contexts.
The types of data collected for this study could contain weaknesses in their analytical
ability. School districts decide on how long they make budgets and audits publicly available. The
lack of uniformity in document availability made sample selection difficult. Some school
districts that were ultimately not used for this study did not have budgets, audits, school board
minutes, or other documents necessary for analysis. State legislatures or school boards should
pass policies lengthening the amount of time that publicly available financial data remain
available. Lengthening the time that documents are available would give more transparency in
how budgeting has changed throughout the years and how it has dealt with times of economic
trouble. That information can help researchers, community members, and future school leaders
in a district learn from the successes and mistakes of past budgeting decisions. There was also a
selectivity bias in the school districts covered in popular media in terms of their budgeting
experiences to the recession. Some school districts (most often larger, urban districts) were
covered by newspapers and local press much more closely than smaller districts, which indicates
a particular bias in the availability of evidence for smaller districts. Given the decision to include
a larger sample in the form of forty individual school district cases, and the breadth of
documentary evidence analyzed, the decision was made not to conduct interviews.

205
If I were to do this research again, I would focus on even fewer school districts and
emphasize interviews with school leaders, teachers, and local community groups. I had not
anticipated the level of complexity and the lack of clarity in school district budgeting that I
encountered. There was so much intricacy to each district that some of it got washed out in larger
sample. That is important because there are certainly lessons that could strengthen the findings
from each district even more by talking to school leaders or teachers about their experiences
during the recession. I may have been able to clarify some of the vaguer budget documents that I
analyzed or uncovered additional financial stresses at the school level that annual budgets or
audits do not specify. Individual district case studies would allow for a greater amount of depth
than this study was able to undertake. There is a profound lack of studies focused on school
finance and individual school districts which presents an exciting opportunity for future research.
Final Words
I began writing this dissertation in 2018, well before the world found itself in a historic
pandemic. In the middle of writing about school budgets in the Great Recession, I had no idea
that the next great generational financial shock, combined with a global pandemic, would begin.
As mentioned previously, most school districts have still not recovered from the Great
Recession. Most school districts are not ready for another financial shock coupled with a health
crisis. There are some significant similarities between the current economic/health crisis and the
Great Recession. State revenue threatens to be severely reduced, teaching jobs are at risk, and
unemployment is high. However, there are also essential differences between the recession and
the pandemic. These differences, which will be discussed below, may exacerbate some of the
fundamental inequities that this study found.

206
The current economic crisis is, in some ways, much more daunting for education than the
Great Recession. In the current economic crisis, school districts face spending emergencies that
were not present during the 2008 recession. Schools have to purchase medical supplies such as
masks and, in some cases, COVID-19 tests. School districts have to create more space in
classrooms to comply with social distancing requirements, which means fewer students can be in
a classroom. Lowering the number of students that can be in a classroom can create capital costs
in the forms of extra classroom space or new technology for distance learning. New technology
costs are not just hardware, but they also involve extra professional development, software
subscriptions, and the unknown personal costs that distance learning may have on teachers,
students, and other staff. The increased expenses also spill over into transportation costs since
additional busses may be needed to space out students. In this study, high poverty school districts
already struggled with transportation costs, and some even cut bus routes during the recession.
Districts may need to invest in additional counselors to help students cope with the trauma of
losing loved ones to COVID-19. High poverty school districts and school districts in
communities of color like the recession are the most likely to experience resource shortages and
trauma. One of the most troubling trends in the nation’s fight against COVID-19 is the virus's
pervasiveness in communities of color. Data from the COVID Tracking Project has shown that
Black and Latino Americans are dying at 2.5x the rate of white Americans (The Atlantic, 2020).
Decades of policies that under-resourced these communities have led to a reckoning in education
and health that federal aid must address. However, the most important source of emergency aid
for school districts, the federal government, has been unwilling and unable to pass a
comprehensive emergency funding package for school districts when they need it most.

207
Federal funding is regularly thought of as the third wheel of school funding. It is often
overlooked because it does not constitute a large share of funding for most school districts.
However, as this study has demonstrated, during a time of crisis federal aid is invaluable for
school districts that are experiencing severe funding cuts at both state and local governments. In
many states, education funding has already been severely cut or postponed. Local government
budgets, especially in communities of color and lower-income communities, have been stretched
thin by the pandemic. Therefore, the most critical component of addressing education funding
shortfalls will be a robust federal aid package. Without emergency relief from the United States
Congress, schools will not close budget deficits left by sudden reductions in state revenue. Since,
on average, 60-80% of school district budgets are spent on salaries, there may once again be a
wave of teaching layoffs. School districts will struggle with providing the additional
transportation necessary to maintain healthy distancing. The additional technological demands of
distance learning will be challenging to meet. There is the prospect that federal aid can address
all of these needs, but Congress’s reluctance to move forward with a comprehensive aid package
paints a somewhat bleak picture for that prospect.
State budgets are stretched thin due to the health crisis created by COVID-19 and an
inadequate federal response to the virus. State education funding has already begun to fall as
schools have started to reopen. Where they can, state legislatures and state departments of
education could take steps towards freeing up funding for school districts through non-traditional
means like during the Great Recession. They could identify categorical programs, much like the
California legislature did, that would reallocate funds towards the areas of highest need for
districts. Greater freedom in categorical funds will allow school districts to redirect funding
towards instructional and health expenditures. That new funding would hopefully help to prevent

208
the mass teaching layoffs seen during the Great Recession. Additionally, if a state like Texas has
money set aside for emergencies, a global pandemic and an education funding crisis certainly
seem to meet the criteria. Alternatively, state legislatures might choose to turn categorical
funding for extracurricular or support programs into categorical funding specifically for
instructional or emergency health spending.
Local funding is going to look a lot different during this crisis than it did during the
recession. Unlike the Great Recession, local property tax revenue will likely be more unwavering
than state revenue in many states. The country is not facing a foreclosure crisis as it did in 2008,
and the housing market has mostly remained stable. This means that school districts that can do
so may be leverage local property taxes to fill budget deficits in ways that they could not during
the recession. This has important equity implications. Higher poverty school districts may not be
able to draw on community wealth to address budget holes left by the state. Those districts may
also not have the institutional advantages, such as a wealthy PTA or the capacity to advertise that
lower-poverty school districts may draw on to fill budget gaps. We may see even more
significant growth in the per-pupil funding gap between property wealthy and property-poor
school districts than we did in the Great Recession. Where, in most instances, state legislatures
may help address that gap, they may not be in a position to do so. Again, this points to the
importance of a bold infusion of federal stabilization funds.
The Great Recession had a profound impact on my professional career and research
agenda. More importantly, the recession had a profound impact on the students that I taught. As
a teacher, I saw the effect that state and local budget reductions had on students, both inside and
outside of the classroom. The schools that I worked in went through painful budget cuts, class
size increases, the elimination of essential after school programs, and their instructional materials

209
were not updated far past when they should have been. The current pandemic and accompanying
economic crisis may create a similar, if not worse, situation to 2008. This study has surfaced
some of the more consequential policy decisions made during the Great Recession and how some
helped and some hindered school district budgeting. Other studies have highlighted the
consequences students have faced as a result of those policy decisions. However, students do not
need to suffer those same consequences if state legislators, state departments of education, and
the federal government learn the lessons of the Great Recession. If those institutions enact broad
budget cuts without targeted, meaningful aid to struggling school districts, students will once
again bear the brunt of an under-resourced education. Per pupil funding inequity between high
and low poverty school districts will balloon. If, on the other hand, those institutions commit to
supporting education funding in an unprecedented way, we can avoid some of the worst results
of the last financial shock. Money does matter in education; this study has displayed that it
matters even more so in a crisis.

210
References Adamson, F., & Darling-Hammond, L. (2015). Funding disparities and the inequitable
distribution of teachers: Evaluating sources and solutions. Education Policy Analysis Archives, 20, 37. https://doi.org/10.14507/epaa.v20n37.2012
American Recovery and Reinvestment Act of 2009 (2009). United States. Retrieved from
https://search.library.wisc.edu/catalog/9910071527602121 Ananat, E. O., Gassman-pines, A., Francis, D. V, & Gibson-davis, C. M. (2011). Children Left
Behind: The Effects of Statewide Job Loss on Student Achievement. Cambridge, MA. Baker, B. D. (2014). Evaluating the Recession’s impact on state school finance systems.
Education Policy Analysis Archives, 22(91). https://doi.org/10.14507/epaa.v22n91.2014 Baker, B. D. (2017). How money matters for schools. Palo Alto, CA. Retrieved from
https://learningpolicyinstitute.org/product/ how-money-matters-schools Baker, B., Sciarra, D. G., & Farrie, D. (2010). Is School Funding Fair? A National Report Card:
3rd Edition 2014, (January), 46 p. Retrieved from http://www.schoolfundingfairness.org/ Baker, K. (1991). Yes , Throw Money at Schools. The Phi Delta Kappan, 72(8), 628–631. Barba, M., Ginn, V., Grusendorf, K., & Heflin, T. (2016). Texas school finance: Basics and
reform. Texas Public Policy Foundation. Bhalla, R., Chakrabarti, R., & Livingston, M. (2015). A Tale of Two States: The Recession’s
Impact on N.Y. and N.J. School Finances, (February), 31–42. Burka, P. (2011). Perry takes “Rainy Day” literally. Texas Monthly. Card, D., & Payne, A. A. (2002). School finance reform, the distribution of school spending, and
the distribution of student test scores. Journal of Public Economics, 83(1), 49–82. https://doi.org/10.1016/S0047-2727(00)00177-8
Chakrabarti, R., & Livingston, M. (2013). The long road to recover: New York schools in the
aftermath of the great recession (No. 631). New York, NY. Chakrabarti, R., & Setren, E. (2015). The impact of the Great Recession on school district
finances: Evidence from New York. FRBNY Economic Policy Review, (October), 45–66. Clark, M. A. (2003). Education reform, redistribution, and student achievement: Evidence from
the Kentucky Education Reform Act. Unpublished Working Paper, Mathematica Policy Research, (October). Retrieved from http://www.mathematica-mpr.com/Publications/PDFs/education/edreform_wp.pdf

211
Coleman, J. S., Campbell, E. Q., Hobson, C. J., McPartland, J., Mood, A. M., Weinfeld, F. D., &
York, R. L. (1966). Equality of educational opportunity. U.S. Department of Health, Education, and Welfare. Retrieved from http://eric.ed.gov/?id=ED012275
Collier, K. (2016, May 13). Texas Supreme Court rules state school funding system is awful- but
constitutional. The Texas Tribune. Retrieved from https://www.washingtonpost.com/news/answer-sheet/wp/2016/05/13/texas-supreme-court-rules-state-school-funding-system-is-awful-but-constitutional/?utm_term=.9d4332fbec58
Danbury ISD School Board. (2014). Campus improvement plan. Danziger, S., Chavez, K., & Cumberworth, E. (2012). Poverty and the Great Recession. The
Russell Sage Foundation and The Stanford Center on Poverty and Inequality. Dayton, J., & Dupre, A. P. (2006). The spirit of Serrano past, present, and future. Journal of
Education Finance, 32(1), 22–35. Dietrichson, J., Bøg, M., Filges, T., & Klint Jørgensen, A.-M. (2017). Academic interventions
for elementary and middle school students with low socioeconomic status: A systematic review and meta-analysis. Review of Educational Research, 87(2), 243–282. https://doi.org/10.3102/0034654316687036
Downes, T. A., & Figlio, D. N. (1997). School Finance Reforms, Tax Limits, and Student
Performance. Institute for Research on Poverty, 02155(617), 1829–1841. Retrieved from http://onlinelibrary.wiley.com/doi/10.1002/cbdv.200490137/abstract
Dynarski, S. M., Hyman, J. M., & Schanzenbach, D. W. (2011). Experimental evidence on the
effect of childhood investments on postsecondary attainment and degree completion (No. 17533). Cambridge, MA.
Ellerson, N. M. (2009). Schools and the stimulus: How America’s public school districts are
using ARRA funds. Enrich, P. (1995). Leaving equality behind: New directions in school finance reform. Vanderbilt
Law Review, 48. Evans, W. N., Schwab, R. M., & Wagner, K. (2019). The great recession and public funding.
Education Finance and Policy, 1–29. Evans, W. N., Schwab, R. M., & Wagner, K. L. (2015). The Great Recession and public
education. Education Finance and Policy, 11(1), 31–40. https://doi.org/10.1162/EDFP Figlio, D. N. (1997a). Did the “tax revolt” reduce school performance? Journal of Public
Economics, 65(3), 245–269. https://doi.org/10.1016/S0047-2727(97)00015-7

212
Figlio, D. N. (1997b). Teacher salaries and teacher quality. Economics Letters, 55(2), 267–271. https://doi.org/10.1016/S0165-1765(97)00070-0
Figlio, D. N., & Rueben, K. S. (2001). Tax limits and the qualifications of new teachers. Journal
of Public Economics, 80(1), 49–71. https://doi.org/10.1016/S0047-2727(00)00116-X Finn, J. D., Gerber, S. B., Achilles, C. M., & Boyd-Zaharias, J. (2001). The enduring effects of
small classes. Teachers College Record, 103(2), 145–183. Retrieved from http://search.ebscohost.com/login.aspx?direct=true&db=psyh&AN=2001-07497-001&site=ehost-live
Fiscal Crisis and Management Assistance Team. (2010). Stockton Unified School District Fiscal
Review. Stockton, CA. Fischel, W. (1996). How Serrano caused Proposition 13. J.L. & Pol, 1.
https://doi.org/10.1525/sp.2007.54.1.23. Freelon, R., Bertrand, M., & Rogers, J. (2012). Overburdened and underfunded: California
public schools amidst the Great Recession. Multidisciplinary Journal of Educational Research, 2(2), 152–176. https://doi.org/10.4471/remie.2012.08
Gardner Selby, W. (2011). Rick Perry says rainy day fund is “our insurance policy against a
major natural disaster.” Retrieved from https://www.politifact.com/texas/statements/2011/mar/18/rick-perry/rick-perry-says-rainy-day-fund-insurance-policy-de/
Hanushek, E. A. (1991). When school finance reform may not be good policy. Harvard Journal
on Legislation, 1(1), 8–23. https://doi.org/10.3868/s050-004-015-0003-8 Hanushek, E. A., & Kimko, D. D. (2000). Schooling, labor-force quality, and the growth of
nations. American Economic Review, 90(5), 1184–1208. https://doi.org/10.1257/aer.90.5.1184
Harrington, T. (2011). Governor’s revised budget prompts concern from Mt. Diablo school
district officials. Hartman, W. T. (2003). School District Budgeting (2nd ed.). Lanham, Maryland: Scarecrow
Education. Heise, M. (1995). State constitutions, school finance litigation, and the third wave: from equity
to adequacy. Temple Law Review. https://doi.org/10.3868/s050-004-015-0003-8 Hendricks, D. (2017, March 2). San Antonio’s economic progress since the recession was broad-
based. San Antonio Express News.

213
Hutto Area Chamber of Commerce. (2017). History of the Hippo. Retrieved from http://www.huttotx.gov/visitors/visit_hutto/plan_a_trip/history_of_the_hippo.php
Jackson, C. K., Johson, R. C., & Persico, C. (2015). The effects of school spending on
educational and economic outcomes: Evidence from school finance reforms. Retrieved from http://www.nber.org/papers/w20847
Jackson, C. K., Johson, R., & Persico, C. (2014). The effect of school finance reforms on the
distribution of spending, academic achievement, and adult outcomes (No. 20118). Cambridge, MA.
Jackson, C. K., Wigger, C., & Xiong, H. (2018). Do school spending cuts matter? Evidence from
the Great Recession (No. 18–02). https://doi.org/10.3386/w24203 Kalil, A. (2013). Effects of the Great Recession on child development. The ANNALS of the
American Academy of Political and Social Science, 650(1), 232–249. https://doi.org/10.1177/0002716213500453
Karst, K. L. (1973). Serrano v. Priest’s inputs and outputs. Law and Contemporary Problems,
38(333). Kastner, L. (2011). SAISD cutting 125 positions. MySanAntonio. Knight, D. S. (2017). Are high-poverty school districts disproportionately impacted by state
funding cuts? School finance equity following the great recession. Journal of Education Finance, 43(2), 169–194.
Konstantopoulos, S., & Chung, V. (2009). What Are the Long‐Term Effects of Small Classes on
the Achievement Gap? Evidence from the Lasting Benefits Study. American Journal of Education, 116(1), 125–154. https://doi.org/10.1086/605103
Koski, W. S., & Reich, R. (2006). When adequate isn’t: The retreat from equity in educational
law and policy and why it matters. Emory Law Review, 56(3), 547–571. https://doi.org/10.3868/s050-004-015-0003-8
Krueger, A. B., & Whitmore, D. (2001). Would smaller classes help close the black-white
achievement gap? (No. 451). Industrial Relations. Princeton, NJ. Lafortune, J., Rothstein, J., & Schanzenbach, D. W. (2016). School finance reform and the
distribution of student achievement (No. 22011). Cambridge, MA. Leachman, M., Albares, N., Masterson, K., & Wallace, M. (2015). Most states have cut school
funding, and some continue cutting. Center on Budget and Policy Priorities, 1–16.

214
Leachman, M., Masterson, K., & Figueroa, E. (2017). A Punishing Decade for School Funding. Center on Budget and Policy Priorities, 1–17. Retrieved from https://www.cbpp.org/sites/default/files/atoms/files/11-29-17sfp.pdf
Loeb, S., & Page, M. E. (2000). Outcomes: The importance of alternative labor market
opportunities and non-pecuniary variation. Review of Economics and Statistics, 82(3), 393–408. https://doi.org/10.1162/003465300558894
Maciag, M. (2015, June). The recession’s over, but schools are feeling the recovery. Governing. McKinley, J. C. (2011, February 14). Aid cuts have Texas schools scrambling. The New York
Times. Mcmillan, K. R. (1998). The turning tide: The emerging fourth wave of school finance reform
litigation and the courts’ lingering institutional concerns. Ohio State Law Journal, 58. Mudrazija, S., Blagg, K., Lee, V., Lou, C., & Rosenboom, V. (2019). School district funding in
Texas: Computing the effects of changes to the Foundation School Program funding formula. Washington, D.C.: The Urban Institute.
Murray, S. E., Evans, W. N., & Schwab, R. M. (1998). Education-finance reform and the
distribution of education resources. The American Economic Review, 88(4), 789–812. National Center for Education Statistics. (2019). Local education agency (school district) finance
survey (F-33) data. Retrieved from https://nces.ed.gov/ccd/f33agency.asp Ondrich, J., Pas, E., & Yinger, J. (2008). The determinants of teacher attrition in upstate New
York. Public Finance Review (Vol. 36). https://doi.org/10.1177/1091142106294716 Orfield, G., Frankenberg, E., Ee, J., & Kuscera, J. (2014). Brown at 60: Great progress, a long
retreat and an uncertain future. Civil Rights Project, 1–42. Owens, A., Reardon, S. F., & Jencks, C. (2016). Income segregation between schools and school
districts. American Educational Research Journal, 53(4), 1159–1197. https://doi.org/10.3102/0002831216652722
Parker, E. (2016). Constitutional obligations for public education. Denver, CO. Pechacek, J. (2011). Danbury Independent School District: Annual financial report. Danbury,
TX. Picchi, A. (2019). 12 states spend less on schools now than before the recession. Moneywatch. Reardon, S. F., Grewal, E., Kalogrides, D., & Greenberg, E. (2012). Brown fades: The end of
court-ordered school desegregation and the resegregation of American public schools. Journal of Policy Analysis and Management, 31(4).

215
Rebell, M. A., & Wolff, J. R. (2011). A proposal for essential standards and resources: a report of the task force on comprehensive educational opportunity. October, (October), 1–25.
Richards, M. (2015, April 24). Fast growth a problem for Forney and districts alike. InForney. Robinson, K. J. (2013). The high cost of education federalism. Wake Forest Law Review, 48.
https://doi.org/10.1525/sp.2007.54.1.23. Shores, K. (2019). The geography of racial/ethnic test (No. 16–10). Retrieved from
https://cepa.stanford.edu/sites/default/files/wp16-10-v201803.pdf Shores, K., & Steinberg, M. (2017). The impact of the Great Recession on student achievement:
Evidence from population data. Ssrn. https://doi.org/10.2139/ssrn.3026151 Smith, J., Gasparian, H., Perry, N., & Capinpin, F. (2013). Categorical funds: The intersection of
school finance and governance. Smith, M. (2012, February 29). An updated guide to the school finance lawsuits. The Texas
Tribune. Smith, T. (2013). Judge rules Texas’ school-funding method unconstitutional. Retrieved from
http://www.npr.org/2013/02/04/171113168/judge-rules-texas-school-funding-method-unconstitutional
Strunk, K. O., Goldhaber, D., Knight, D. S., & Brown, N. (2018). Are there hidden costs
associated with conducting layoffs? The impact of RIFs and Layoffs on teacher effectiveness. Journal of Policy Analysis and Management, 37(4), 755–782. https://doi.org/10.1002/pam.22074
Sutcher, L., Carver-Thomas, D., & Darling-Hammond, L. (2018). Understaffed and
underprepared: California districts report ongoing teacher shortages. Palo Alto, CA: Learning Policy Institute.
Sutton, J. S. (2008). San Antonio Independent School District v. Rodriguez and its aftermath.
Virginia Law Review. Taboada, M. (2012, September 21). Hutto school district to trademark hippo mascot, sell ads on
buses. Statesman. Texas Education Agency. (2014). School finance 101: Funding of Texas public schools. Austin,
TX. Texas Education Agency Division of Accountability Research. (2010). Enrollment in Texas
Public Schools 2009-10. https://doi.org/10.2307/3440737

216
Texas Taxpayers and Research Association. (2012). An Introduction to to School Finance in Texas: Revised January 2012. Austin, TX. Retrieved from http://www.ttara.org/files/document/file-4f1732f763446.pdf
The Associated Press. (2015, August 30). A timeline of Texas’ 30 years of school finance legal
fights. The San Diego Tribune. The Texas Legislative Budget Board. (2016). Foundation school program overview. Austin, TX. Thompson, D. (2010, July 31). How Texas Is dominating the recession. The Atlantic. Timar, T. B., & Roza, M. (2010). “A False Dilemma”: Should decisions about education
resource use be made at the state or local level? American Journal of Education, 116(3), 397–422. https://doi.org/10.1086/651414
Tyack, D., & Hansot, E. (1982). Hard times, hard choices: The case for coherence in public
school leadership. The Phi Delta Kappan, 63(8), 511–515. Tyack, D., & Hansot, E. (1984). Hard times, then and now: Public schools in the 1930s and
1980s. Harvard Educational Review, 54(1), 33–67. U.S. Department of Education. (2010). California to receive $1.2 billion to support education
jobs. U.S. Department of Education. (2011a). Initial guidance for states on the education jobs fund
program. Washington, D.C. U.S. Department of Education. (2011b). Texas to receive $830.8 million to support education. Villanueva, C. (2016). The Texas School Finance Challenge and What to Do About It. Austin,
TX: Center for Public Policy Priorities. Villanueva, C. (2017). Where are we now: Special session school finance update. Austin, TX:
Center for Public Policy Priorities. Villanueva, C. (2018). What is recapture? Why is it a critical part of public education in Texas?
Austin, TX: Center for Public Policy Priorities. Walter, F., & Sweetland, S. (2003). School finance reform: an unresolved issue across the nation.
Education, 124(1). Zelinski, A. (2019). Texas teachers embrace $11.5B windfall for education. But will it last? The
Houston Chronicle.

217
Appendix A
Original 43 Sample School Districts from California and Texas
CALIFORNIA
California School District Name Poverty Group CCD Locale Code Conejo Valley Unified 1-Lowest Poverty 12-City, Midsize
Capistrano Unified 1-Lowest Poverty 21-Suburban, Large
El Segundo Unified 1-Lowest Poverty 21-Suburban, Large
Fremont Unified 1-Lowest Poverty 12-City, Midsize
Manhattan Beach Unified 1-Lowest Poverty 21-Suburban, Large
Mt. Diablo Unified 2-Low Poverty 21-Suburban, Large
New Haven Unified 2-Low Poverty 21-Suburban, Large
Santa Monica-Malibu Unified 2-Low Poverty 13-City, Small
Tustin Unified 2-Low Poverty 13-City, Small
Yucaipa-Calimesa Joint Unified 2-Low Poverty 13-City, Small
Newark Unified 3-Medium Poverty 21-Suburban, Large
San Francisco Unified 3-Medium Poverty 11-City, Large
Val Verde Unified 3-Medium Poverty 41-Rural, Fringe
San Lorenzo Unified 3-Medium Poverty 21-Suburban, Large
Oakland Unified 4-High Poverty 11-City, Large
Rialto Unified 4-High Poverty 21-Suburban, Large
Sacramento City Unified 4-High Poverty 11-City, Large
Anderson Valley Unified 4-High Poverty 43-Rural, Remote
Santa Ana Unified 4-High Poverty 11-City, Large
Fresno Unified 5-Highest Poverty 11-City, Large
Los Angeles Unified 5-Highest Poverty 11-City, Large
Stockton Unified 5-Highest Poverty 11-City, Large
Cutler-Orosi Joint Unified 5-Highest Poverty 31-Town, Fringe
Konocti Unified 5-Highest Poverty 32-Town, Distant

218
TEXAS
Texas School District Sample Group CCD Locale Code Canton ISD 1-Lowest Poverty 32-Town, Distant
Danbury ISD 1-Lowest Poverty 41-Rural, Fringe
Forney ISD 1-Lowest Poverty 41-Rural, Fringe
Hutto ISD 1-Lowest Poverty 41-Rural, Fringe
Idalou ISD 1-Lowest Poverty 42-Rural, Distant
Birdville ISD 2-Low Poverty 21-Suburban, Large
Carrollton-Farmers Branch ISD 2-Low Poverty 12-City, Midsize
Pflugerville ISD 2-Low Poverty 21-Suburban, Large
Bandera ISD 3-Medium Poverty 42-Rural, Distant
Grand Prairie ISD 3-Medium Poverty 21-Suburban, Large
Henderson ISD 3-Medium Poverty 32-Town, Distant
Lancaster ISD 3-Medium Poverty 21-Suburban, Large
Childress ISD 4-High Poverty 33-Town, Remote
Ingram ISD 4-High Poverty 33-Town, Remote
Harlandale ISD 5-Highest Poverty 11-City, Large
Kingsville ISD 5-Highest Poverty 32-Town, Distant
Laredo ISD 5-Highest Poverty 12-City, Midsize
Mercedes ISD 5-Highest Poverty 21-Suburban, Large
San Antonio ISD 5-Highest Poverty 11-City, Large

219
Appendix B
Primary Source References and Documents from Sample School Districts
School District Year Published
Author/Authoring Institution
Title of the Document/Source
Capistrano Unified School District
2009 Capistrano Unified School District Board of Trustees
Capistrano Unified School District Annual Financial Report
Capistrano Unified School District
2010 Capistrano Unified School District Board of Trustees
Capistrano Unified School District Annual Financial Report
Capistrano Unified School District
2011 Capistrano Unified School District Board of Trustees
Capistrano Unified School District Annual Financial Report
Capistrano Unified School District
2012 Capistrano Unified School District Board of Trustees
Capistrano Unified School District Annual Financial Report
Capistrano Unified School District
2013 Capistrano Unified School District Board of Trustees
Capistrano Unified School District Annual Financial Report
Capistrano Unified School District
2014 Capistrano Unified School District Board of Trustees
Capistrano Unified School District Annual Financial Report
Capistrano Unified School District
2012 Capistrano Unified School District
Education Protection Account: Expenditures by Function
Capistrano Unified School District
2013 Capistrano Unified School District
Education Protection Account: Expenditures by Function
Capistrano Unified School District
2014 Capistrano Unified School District
Education Protection Account: Expenditures by Function
Capistrano Unified School District
2015 Capistrano Unified School District
Education Protection Account: Expenditures by Function
Capistrano Unified School District
2015 California Department of Education
FINANCIAL REPORT: 2015-2016 Budget
Capistrano Unified School District
2012 California School Boards Association
Qualified and Negative Budget Certifications
Capistrano Unified School District
2016 Fiscal Crisis and Management Assistance Team
Capistrano Unified School District: Special Education Review
El Segundo Unified School District
2008 Nigro, Nigro, and White Professional Accounting Corporation
El Segundo Unified School: Audit report for the fiscal year ended June 30, 2009
El Segundo Unified School District
2009 Geoff Yantz Unaudited actual report

220
El Segundo Unified School District
2009 Geoff Yantz and the El Segundo Unified School District Board of Trustees
El Segundo Unified School District Adopted Budget
El Segundo Unified School District
2010 Geoff Yantz and the El Segundo Unified School District Board of Trustees
El Segundo Unified School District Adopted Budget
El Segundo Unified School District
2011 Geoff Yantz and the El Segundo Unified School District Board of Trustees
El Segundo Unified School District Adopted Budget
El Segundo Unified School District
2012 Geoff Yantz and the El Segundo Unified School District Board of Trustees
El Segundo Unified School District Adopted Budget
El Segundo Unified School District
2013 Geoff Yantz and the El Segundo Unified School District Board of Trustees
El Segundo Unified School District Adopted Budget
El Segundo Unified School District
2009 Geoff Yantz and the El Segundo Unified School District Board of Trustees
First interim financial statement
El Segundo Unified School District
2010 Geoff Yantz and the El Segundo Unified School District Board of Trustees
First interim financial statement
El Segundo Unified School District
2011 Geoff Yantz and the El Segundo Unified School District Board of Trustees
First interim financial statement
El Segundo Unified School District
2012 Geoff Yantz and the El Segundo Unified School District Board of Trustees
First interim financial statement
El Segundo Unified School District
2013 Geoff Yantz and the El Segundo Unified School District Board of Trustees
First interim financial statement
El Segundo Unified School District
2009 Geoff Yantz and the El Segundo Unified School District Board of Trustees
Second interim financial statement
El Segundo Unified School District
2010 Geoff Yantz and the El Segundo Unified School District Board of Trustees
Second interim financial statement

221
El Segundo Unified School District
2011 Geoff Yantz and the El Segundo Unified School District Board of Trustees
Second interim financial statement
El Segundo Unified School District
2012 Geoff Yantz and the El Segundo Unified School District Board of Trustees
Second interim financial statement
El Segundo Unified School District
2013 Geoff Yantz and the El Segundo Unified School District Board of Trustees
Second interim financial statement
El Segundo Unified School District
2011 School Services of California
Governor's Proposed Budget Presentation
El Segundo Unified School District
2012 School Services of California
Governor's Proposed Budget Presentation
El Segundo Unified School District
2013 School Services of California
Governor's Proposed Budget Presentation
El Segundo Unified School District
2013 School Services of California
El Segundo Special Budget Meeting: Parts 1 and 2
Fremont Unified School District
2009 Fremont Unified Board of Education
Public Hearing on Adopted Budget Minutes
Fremont Unified School District
2010 Fremont Unified Board of Education
Public Hearing on Adopted Budget Minutes
Fremont Unified School District
2011 Fremont Unified Board of Education
Public Hearing on Adopted Budget Minutes
Fremont Unified School District
2012 Fremont Unified Board of Education
Public Hearing on Adopted Budget Minutes
Fremont Unified School District
2009 Fremont Unified Board of Education
Fremont Unified School District Adopted Budget
Fremont Unified School District
2010 Fremont Unified Board of Education
Fremont Unified School District Adopted Budget
Fremont Unified School District
2011 Fremont Unified Board of Education
Fremont Unified School District Adopted Budget
Fremont Unified School District
2012 Fremont Unified Board of Education
Fremont Unified School District Adopted Budget
Fremont Unified School District
2013 Fremont Unified Board of Education
Fremont Unified School District Adopted Budget
Fremont Unified School District
2010 No Direct Attribution American Recovery and Reinvestment Act Planning Matrix

222
Fremont Unified School District
2010 Fremont Unified Board of Education
First Interim Financial Report
Fremont Unified School District
2011 Fremont Unified Board of Education
First Interim Financial Report
Fremont Unified School District
2012 Fremont Unified Board of Education
First Interim Financial Report
Fremont Unified School District
2011 Fremont Unified Board of Education
Second Interim Financial Report
Fremont Unified School District
2013 Fremont Unified School District Division of Business Services
Budget Forum Presentation
Fremont Unified School District
2011 Fremont Unified Board of Education
Community Budget Workshop
Fresno Unified School District
2008 Fresno Unified Board of Education
School Board Meeting to Adopt the 2008/2009 Proposed Budget
Fresno Unified School District
2009 Fresno Unified Board of Education
School Board Meeting to Adopt the 2009/2010 Proposed Budget
Fresno Unified School District
2010 Fresno Unified Board of Education
School Board Meeting to Adopt the 2010/2011 Proposed Budget
Fresno Unified School District
2011 Fresno Unified Board of Education
School Board Meeting to Adopt the 2011/2012 Proposed Budget
Fresno Unified School District
2012 Fresno Unified Board of Education
School Board Meeting to Adopt the 2012/2013 Proposed Budget
Fresno Unified School District
2013 Fresno Unified Board of Education
School Board Meeting to Adopt the 2013/2014 Proposed Budget
Fresno Unified School District
2006 Fresno Unified School District and Perry Smith LLP Accountants
Financial Statements with Supplementary Information for the Year Ended June 30, 2006 and Auditor's Report
Fresno Unified School District
2007 Fresno Unified School District and Perry Smith LLP Accountants
Financial Statements with Supplementary Information for the Year Ended June 30, 2007 and Auditor's Report
Fresno Unified School District
2008 Fresno Unified School District and Perry Smith LLP Accountants
Financial Statements with Supplementary Information for the Year Ended June 30, 2008 and Auditor's Report
Fresno Unified School District
2009 Fresno Unified School District and Perry Smith LLP Accountants
Financial Statements with Supplementary Information for the Year Ended June 30, 2009 and Auditor's Report

223
Fresno Unified School District
2010 Fresno Unified School District and Perry Smith LLP Accountants
Financial Statements with Supplementary Information for the Year Ended June 30, 2010 and Auditor's Report
Fresno Unified School District
2011 Fresno Unified School District and Crowe Horwath LLP Accountants
Financial Statements with Supplementary Information for the Year Ended June 30, 2011 and Auditor's Report
Fresno Unified School District
2012 Fresno Unified School District and Crowe Horwath LLP Accountants
Financial Statements with Supplementary Information for the Year Ended June 30, 2012 and Auditor's Report
Stockton Unified School District
2006 Wayne Martin, Director of Fiscal Services
Annual Budget Report for Stockton Unified School District
Stockton Unified School District
2007 Wayne Martin, Executive Director of Business Services
Annual Budget Report for Stockton Unified School District
Stockton Unified School District
2008 Wayne Martin, Executive Director of Business Services
Annual Budget Report for Stockton Unified School District
Stockton Unified School District
2009 Wayne Martin, Executive Director of Business Services
Annual Budget Report for Stockton Unified School District
Stockton Unified School District
2010 Wayne Martin, Executive Director of Business Services
Annual Budget Report for Stockton Unified School District
Stockton Unified School District
2011 Jason Willis, Chief Financial Officer
Annual Budget Report for Stockton Unified School District
Stockton Unified School District
2012 Jason Willis, Chief Financial Officer
Annual Budget Report for Stockton Unified School District
Stockton Unified School District
2006 Wayne Martin, Director of Fiscal Services
Unaudited Actual Financial Report
Stockton Unified School District
2007 Rick Wentworth, Superintendent and Wayne Martin, Executive Director of Business Services
Unaudited Actual Financial Report
Stockton Unified School District
2008 Rick Wentworth, Superintendent and Wayne Martin, Executive Director of Business Services
Unaudited Actual Financial Report
Stockton Unified School District
2009 Rick Wentworth, Superintendent and Wayne Martin, Executive Director of Business Services
Unaudited Actual Financial Report

224
Stockton Unified School District
2010 Rick Wentworth, Superintendent and Wayne Martin, Executive Director of Business Services
Unaudited Actual Financial Report
Stockton Unified School District
2006 Carl Toliver, Interim Superintendent and Jack McLaughlin, Superintendent Elect
Stockton Unified School District Proposed Budget: 2006-2007
Stockton Unified School District
2010 Marisa Ploog, Fiscal Intervention Specialist for the California Fiscal Crisis and Management Assistance Team
Stockton Unified School District Fiscal Review Presentation to the Stockton Unified Board of Education
Stockton Unified School District
2010 Marisa Ploog, Fiscal Intervention Specialist for the California Fiscal Crisis and Management Assistance Team
Fiscal Crisis and Management Assistance Team Report to Superintendent Carl Toliver
Stockton Unified School District
2009 Stockton Unified School District and Perry Smith LLP Accountants
Financial Statements with Supplementary Information for the Year Ended June 30, 2009 and Auditor's Report
Stockton Unified School District
2010 Stockton Unified School District and Perry Smith LLP Accountants
Financial Statements with Supplementary Information for the Year Ended June 30, 2010 and Auditor's Report
Stockton Unified School District
2011 Stockton Unified School District and Perry Smith LLP Accountants
Financial Statements with Supplementary Information for the Year Ended June 30, 2011 and Auditor's Report
Stockton Unified School District
2012 Stockton Unified School District and Perry Smith LLP Accountants
Financial Statements with Supplementary Information for the Year Ended June 30, 2012 and Auditor's Report
Cutler-Orosi Joint Unified School District
2008 Cutler-Orosi Joint Unified School District
Budget Summary Data
Cutler-Orosi Joint Unified School District
2009 Cutler-Orosi Joint Unified School District
Budget Summary Data
Cutler-Orosi Joint Unified School District
2010 Cutler-Orosi Joint Unified School District
Budget Summary Data

225
Cutler-Orosi Joint Unified School District
2011 Cutler-Orosi Joint Unified School District
Budget Summary Data
Cutler-Orosi Joint Unified School District
2012 Cutler-Orosi Joint Unified School District
Budget Summary Data
Danbury Independent School District
2008 Danbury ISD Board of Trustees
DISD Proposed Budget for 2008-2009
Danbury Independent School District
2009 Danbury ISD Board of Trustees
DISD Proposed Budget for 2009-2010
Danbury Independent School District
2010 Danbury ISD Board of Trustees
DISD Proposed Budget for 2010-2011
Danbury Independent School District
2011 Danbury ISD Board of Trustees
DISD Proposed Budget for 2011-2012
Danbury Independent School District
2012 Danbury ISD Board of Trustees
DISD Proposed Budget for 2012-2013
Danbury Independent School District
2009 Danbury ISD Board of Trustees and Belt, Harris, and Pechacek LLP
DISD Annual Financial Report for the Year Ended August 31, 2009
Danbury Independent School District
2010 Danbury ISD Board of Trustees and Belt, Harris, and Pechacek LLP
DISD Annual Financial Report for the Year Ended August 31, 2010
Danbury Independent School District
2011 Danbury ISD Board of Trustees and Belt, Harris, and Pechacek LLP
DISD Annual Financial Report for the Year Ended August 31, 2011
Danbury Independent School District
2013 Danbury Independent School District
Budget Summary Report
Danbury Independent School District
2009 Danbury Independent School District
Budget Comparison Chart 2009 Compared to 2010
Danbury Independent School District
2010 Danbury Independent School District
Budget Comparison Chart 2010 Compared to 2011
Danbury Independent School District
2011 Danbury Independent School District
Budget Comparison Chart 2011 Compared to 2012
Hutto Independent School District
2008 Hutto Independent School District and Pattillo, Brown, and Hill LLP Accountants
Annual Financial Report for the Year Ended August 31, 2008

226
Hutto Independent School District
2009 Hutto Independent School District and Pattillo, Brown, and Hill LLP Accountants
Annual Financial Report for the Year Ended August 31, 2009
Hutto Independent School District
2010 Hutto Independent School District and Pattillo, Brown, and Hill LLP Accountants
Annual Financial Report for the Year Ended August 31, 2010
Hutto Independent School District
2011 Hutto Independent School District and Pattillo, Brown, and Hill LLP Accountants
Annual Financial Report for the Year Ended August 31, 2011
Hutto Independent School District
2012 Hutto Independent School District and Pattillo, Brown, and Hill LLP Accountants
Annual Financial Report for the Year Ended August 31, 2012
Hutto Independent School District
2013 Hutto Independent School District and Pattillo, Brown, and Hill LLP Accountants
Annual Financial Report for the Year Ended August 31, 2013
Hutto Independent School District
2014 Hutto Independent School District and Pattillo, Brown, and Hill LLP Accountants
Annual Financial Report for the Year Ended August 31, 2014
Hutto Independent School District
2010 Douglas Killian, Superintendent of Hutto Independent School District
Executive Summary of the Administrative Recommendations for Reductions, Revenue Generation, and Savings
Forney Independent School District
2010 Lucas Janda, Chief Financial Officer
Forney Independent School District Official Budget
Forney Independent School District
2011 Lucas Janda, Chief Financial Officer
Forney Independent School District Official Budget
Forney Independent School District
2012 Lucas Janda, Chief Financial Officer
Forney Independent School District Official Budget
Forney Independent School District
2013 Lucas Janda, Chief Financial Officer
Forney Independent School District Official Budget
Forney Independent School District
2014 Lucas Janda, Chief Financial Officer
Forney Independent School District Official Budget
Forney Independent School District
2009 Forney Independent School District and Rutherford, Taylor, and Company, P.C. Certified Public Accountants
Forney Independent School District Annual Financial Report Ten Months Ended June 30, 2009
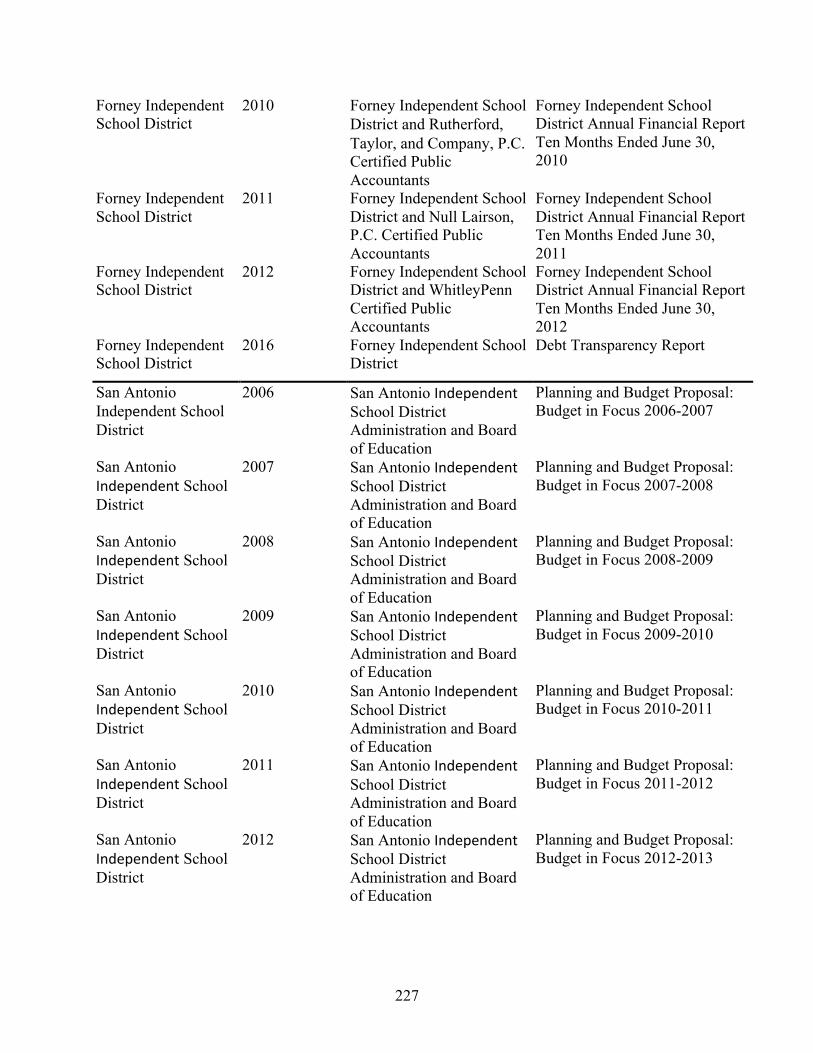
227
Forney Independent School District
2010 Forney Independent School District and Rutherford, Taylor, and Company, P.C. Certified Public Accountants
Forney Independent School District Annual Financial Report Ten Months Ended June 30, 2010
Forney Independent School District
2011 Forney Independent School District and Null Lairson, P.C. Certified Public Accountants
Forney Independent School District Annual Financial Report Ten Months Ended June 30, 2011
Forney Independent School District
2012 Forney Independent School District and WhitleyPenn Certified Public Accountants
Forney Independent School District Annual Financial Report Ten Months Ended June 30, 2012
Forney Independent School District
2016 Forney Independent School District
Debt Transparency Report
San Antonio Independent School District
2006 San Antonio Independent School District Administration and Board of Education
Planning and Budget Proposal: Budget in Focus 2006-2007
San Antonio Independent School District
2007 San Antonio Independent School District Administration and Board of Education
Planning and Budget Proposal: Budget in Focus 2007-2008
San Antonio Independent School District
2008 San Antonio Independent School District Administration and Board of Education
Planning and Budget Proposal: Budget in Focus 2008-2009
San Antonio Independent School District
2009 San Antonio Independent School District Administration and Board of Education
Planning and Budget Proposal: Budget in Focus 2009-2010
San Antonio Independent School District
2010 San Antonio Independent School District Administration and Board of Education
Planning and Budget Proposal: Budget in Focus 2010-2011
San Antonio Independent School District
2011 San Antonio Independent School District Administration and Board of Education
Planning and Budget Proposal: Budget in Focus 2011-2012
San Antonio Independent School District
2012 San Antonio Independent School District Administration and Board of Education
Planning and Budget Proposal: Budget in Focus 2012-2013

228
San Antonio Independent School District
2013 San Antonio Independent School District Administration and Board of Education
Planning and Budget Proposal: Budget in Focus 2013-2014
San Antonio Independent School District
2009 San Antonio Independent School District Administration and Board of Education
San Antonio Independent School District Adopted District Budget
San Antonio Independent School District
2010 San Antonio Independent School District Administration and Board of Education
San Antonio Independent School District Adopted District Budget
San Antonio Independent School District
2011 San Antonio Independent School District Administration and Board of Education
San Antonio Independent School District Adopted District Budget
San Antonio Independent School District
2012 San Antonio Independent School District Administration and Board of Education
San Antonio Independent School District Adopted District Budget
San Antonio Independent School District
2013 San Antonio Independent School District Administration and Board of Education
San Antonio Independent School District Adopted District Budget
San Antonio Independent School District
2009 San Antonio Independent School District Board of Education
Minutes of Regular Board Business Meeting for October 19, 2009
Laredo Independent School District
2008 Division of Finance for Laredo Independent School District
2008-2009 Annual Budget for Laredo Independent School District
Laredo Independent School District
2009 Division of Finance for Laredo Independent School District
2009-2010 Annual Budget for Laredo Independent School District
Laredo Independent School District
2010 Division of Finance for Laredo Independent School District
2010-2011 Annual Budget for Laredo Independent School District
Laredo Independent School District
2011 Division of Finance for Laredo Independent School District
2011-2012 Annual Budget for Laredo Independent School District
Laredo Independent School District
2012 Division of Finance for Laredo Independent School District
2012-2013 Annual Budget for Laredo Independent School District
Laredo Independent School District
2013 Division of Finance for Laredo Independent School District
2013-2014 Annual Budget for Laredo Independent School District

229
Laredo Independent School District
2014 Division of Finance for Laredo Independent School District
2014-2015 Annual Budget for Laredo Independent School District
Laredo Independent School District
2008 Laredo Independent School District Board of Trustees
Annual Financial Accountability Management Report
Laredo Independent School District
2009 Laredo Independent School District Board of Trustees
Annual Financial Accountability Management Report
Laredo Independent School District
2010 Laredo Independent School District Board of Trustees
Annual Financial Accountability Management Report
Laredo Independent School District
2011 Laredo Independent School District Board of Trustees
Annual Financial Accountability Management Report
Laredo Independent School District
2012 Laredo Independent School District Board of Trustees
Annual Financial Accountability Management Report
Laredo Independent School District
2013 Laredo Independent School District Board of Trustees
Annual Financial Accountability Management Report
Laredo Independent School District
2009 The Laredo Independent School District Division of Finance and Garz/Gonzalez & Associates Accounting
Laredo Independent School District Comprehensive Annual Financial Report for the Year Ended August 31, 2009
Laredo Independent School District
2010 The Laredo Independent School District Division of Finance and Weaver and Tidwell LLP Accounting
Laredo Independent School District Comprehensive Annual Financial Report for the Year Ended August 31, 2010
Laredo Independent School District
2011 The Laredo Independent School District Division of Finance and Weaver and Tidwell LLP Accounting
Laredo Independent School District Comprehensive Annual Financial Report for the Year Ended August 31, 2011
Laredo Independent School District
2012 The Laredo Independent School District Division of Finance and Weaver and Tidwell LLP Accounting
Laredo Independent School District Comprehensive Annual Financial Report for the Year Ended August 31, 2012
Laredo Independent School District
2013 The Laredo Independent School District Division of Finance and Weaver and Tidwell LLP Accounting
Laredo Independent School District Comprehensive Annual Financial Report for the Year Ended August 31, 2013
Kingsville Independent School District
2010 Kingsville Independent School District and Gowland, Strealy, Morales, and Company LLC
Kingsville Independent School District Annual Financial Report for the Year Ended August 31, 2010

230
Kingsville Independent School District
2011 Kingsville Independent School District and Gowland, Strealy, Morales, and Company LLC
Kingsville Independent School District Annual Financial Report for the Year Ended August 31, 2011
Kingsville Independent School District
2012 Kingsville Independent School District and Gowland, Strealy, Morales, and Company LLC
Kingsville Independent School District Annual Financial Report for the Year Ended August 31, 2012
Kingsville Independent School District
2013 Kingsville Independent School District and Gowland, Strealy, Morales, and Company LLC
Kingsville Independent School District Annual Financial Report for the Year Ended August 31, 2013
Kingsville Independent School District
2014 Kingsville Independent School District and Gowland, Strealy, Morales, and Company LLC
Kingsville Independent School District Annual Financial Report for the Year Ended August 31, 2014
Kingsville Independent School District
2009 Kingsville Independent School District
Kingsville Independent School District Fiscal Year 2009-2010 Adopted Budget Summary
Kingsville Independent School District
2010 Kingsville Independent School District
Kingsville Independent School District Fiscal Year 2010-2011 Adopted Budget Summary
Kingsville Independent School District
2011 Kingsville Independent School District
Kingsville Independent School District Fiscal Year 2011-2012 Adopted Budget Summary
Kingsville Independent School District
2012 Kingsville Independent School District
Kingsville Independent School District Fiscal Year 2012-2013 Adopted Budget Summary
Kingsville Independent School District
2013 Kingsville Independent School District
Kingsville Independent School District Fiscal Year 2013-2014 Adopted Budget Summary
Kingsville Independent School District
2010 Kingsville Independent School District
Proposed Budget Summary Report for Kingsville Independent School District
Kingsville Independent School District
2011 Kingsville Independent School District
Proposed Budget Summary Report for Kingsville Independent School District
Kingsville Independent School
2012 Kingsville Independent School District
Proposed Budget Summary Report for Kingsville

231
District
Independent School District
Kingsville Independent School District
2013 Kingsville Independent School District
Proposed Budget Summary Report for Kingsville Independent School District
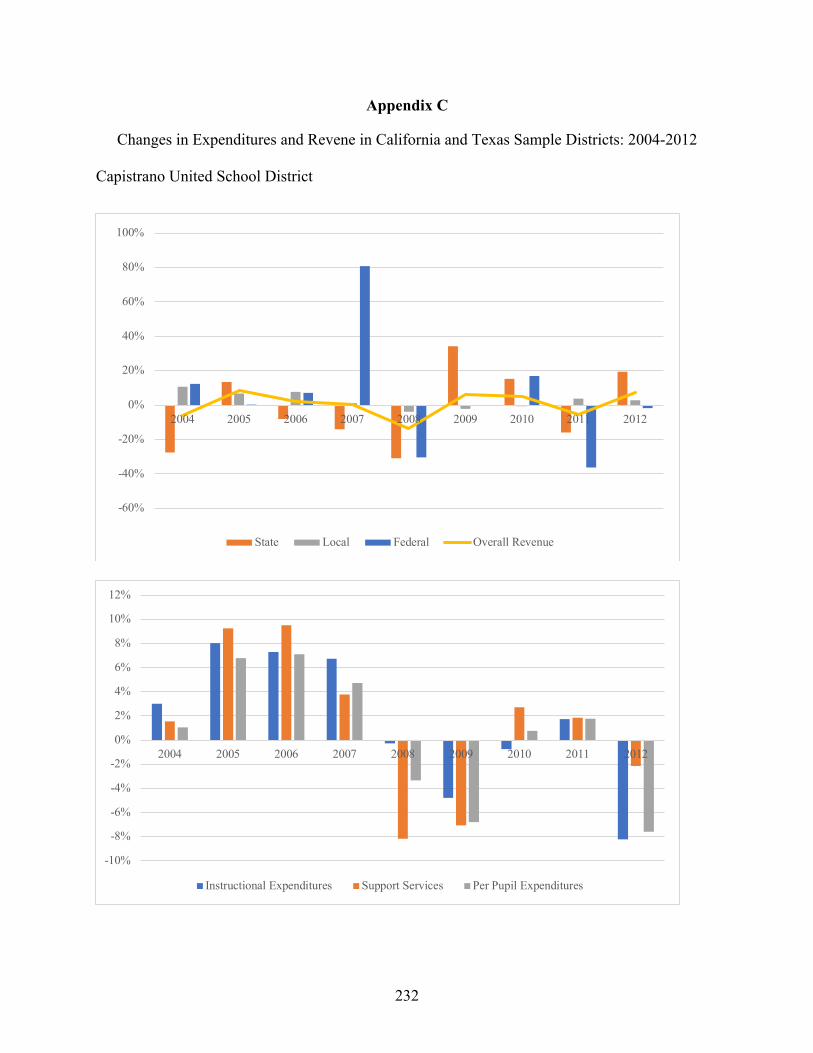
232
Appendix C
Changes in Expenditures and Revene in California and Texas Sample Districts: 2004-2012 Capistrano United School District
-60%
-40%
-20%
0%
20%
40%
60%
80%
100%
2004 2005 2006 2007 2008 2009 2010 2011 2012
State Local Federal Overall Revenue
-10%
-8%
-6%
-4%
-2%
0%
2%
4%
6%
8%
10%
12%
2004 2005 2006 2007 2008 2009 2010 2011 2012
Instructional Expenditures Support Services Per Pupil Expenditures

233
El Segundo Unified School District
-40%
-30%
-20%
-10%
0%
10%
20%
30%
40%
2004 2005 2006 2007 2008 2009 2010 2011 2012
State Local Federal Overall Revenue
-15%
-10%
-5%
0%
5%
10%
15%
2004 2005 2006 2007 2008 2009 2010 2011 2012
Instructional Expenditures Support Services Per Pupil Expenditures

234
Fremont United School District
-40%
-20%
0%
20%
40%
60%
80%
100%
2004 2005 2006 2007 2008 2009 2010 2011 2012
State Local Federal Overall Revenue
-8%
-6%
-4%
-2%
0%
2%
4%
6%
8%
10%
12%
2004 2005 2006 2007 2008 2009 2010 2011 2012
Instructional Expenditures Support Services Per Pupil Expenditures

235
Stockton Unified School District
-20%
-10%
0%
10%
20%
30%
40%
2004 2005 2006 2007 2008 2009 2010 2011 2012
State Local Federal Overall Revenue
-15%
-10%
-5%
0%
5%
10%
15%
2004 2005 2006 2007 2008 2009 2010 2011 2012
Instructional Expenditures Support Services Per Pupil Expenditures

236
Fresno Unified School District
-20%
-10%
0%
10%
20%
30%
40%
2004 2005 2006 2007 2008 2009 2010 2011 2012
State Local Federal Overall Revenue
-10%
-5%
0%
5%
10%
15%
20%
2004 2005 2006 2007 2008 2009 2010 2011 2012
Instructional Expenditures Support Services Per Pupil Expenditures

237
Cutler Orosi Unified School District
-20%
-10%
0%
10%
20%
30%
40%
2004 2005 2006 2007 2008 2009 2010 2011 2012
State Local Federal Overall Revenue
-10%
-5%
0%
5%
10%
15%
2003 2004 2005 2006 2007 2008 2009 2010 2011 2012
Instructional Expenditures Support Services Per Pupil Expenditures

238
Hutto Independent School District
-50%
0%
50%
100%
150%
200%
2004 2005 2006 2007 2008 2009 2010 2011 2012
State Local Federal Overall Revenue
-10%
-5%
0%
5%
10%
15%
20%
25%
30%
35%
40%
2004 2005 2006 2007 2008 2009 2010 2011 2012
Instructional Expenditures Support Services Per Pupil Expenditures

239
Forney Independent School District
-50%
0%
50%
100%
150%
200%
2004 2005 2006 2007 2008 2009 2010 2011 2012
State Local Federal Overall Revenue
-15%
-10%
-5%
0%
5%
10%
15%
20%
25%
2004 2005 2006 2007 2008 2009 2010 2011 2012
Instructional Expenditures Support Services Per Pupil Expenditures

240
Danbury Independent School District
-100%
-50%
0%
50%
100%
150%
200%
2004 2005 2006 2007 2008 2009 2010 2011 2012
State Local Federal Overall Revenue
-10%
-5%
0%
5%
10%
15%
20%
2004 2005 2006 2007 2008 2009 2010 2011 2012
Instructional Expenditures Support Services Per Pupil Expenditures

241
Kingsville Independent School District
-50%
-40%
-30%
-20%
-10%
0%
10%
20%
30%
40%
2004 2005 2006 2007 2008 2009 2010 2011 2012
State Local Federal Overall Revenue
-10%
-5%
0%
5%
10%
15%
2004 2005 2006 2007 2008 2009 2010 2011 2012
Instructional Expenditures Support Services Per Pupil Expenditures

242
Laredo ISD
-25%
-20%
-15%
-10%
-5%
0%
5%
10%
15%
20%
25%
2004 2005 2006 2007 2008 2009 2010 2011 2012
State Local Federal Overall Revenue
-8%
-6%
-4%
-2%
0%
2%
4%
6%
8%
10%
12%
14%
2004 2005 2006 2007 2008 2009 2010 2011 2012
Instructional Expenditures Support Services Per Pupil Expenditures

243
San Antonio ISD
-20%
-10%
0%
10%
20%
30%
40%
50%
60%
2004 2005 2006 2007 2008 2009 2010 2011 2012
State Local Federal Overall Revenue
-10%
-8%
-6%
-4%
-2%
0%
2%
4%
6%
8%
2004 2005 2006 2007 2008 2009 2010 2011 2012
Instructional Expenditures Support Services Per Pupil Expenditures
Vita
Jeremy Anderson
[email protected] Education Dec. 2020 Ph.D., Educational Theory and Policy, The Pennsylvania State University June 2011 M.A.T., Secondary Social Studies Education June 2010 B.A., Political Science B.A., History Professional Experience 2018-2019 Managing Editor, American Journal of Education, State College, PA 2016-2019 Voluntary Integration Research Assistant, Penn State Department of Educational
Policy Studies, State College, PA 2015-2019 Graduate Research Assistant, Penn State Department of Educational Policy
Studies, State College, PA 2013-2015 Secondary Teacher, Riverside Beaver County School District, Ellwood City, PA 2011-2012 Instructional Aide, Cornell School District, Coraopolis, PA Publications Anderson, J. & Frankenberg, E. (2019). Voluntary integration in uncertain times. Phi
Delta Kappan, 100 (5), 14-18. Taylor, K., Anderson, J., & Frankenberg, E. (2019). School and residential segregation in school
districts with voluntary integration policies. Peabody Journal of Education, 94(4), 371-387.
Gamson, D.A., Eckert, S.A., & Anderson, J. (2019). Standards, instructional objectives, and curriculum design: A complex relationship. Phi Delta Kappan, 100 (6), 8-12.
Anderson, J., Taylor, K., Frankenberg, E. (2018). Voluntary integration policies in U.S. school districts. UCEA Review (59) 2: 28-29.
Frankenberg, E., Anderson, J., and Taylor, K. (October 2017) Voluntary integration in U.S. school districts 2000-2015. The Center for Education and Civil Rights
Presentations Pendola, A., Anderson, J. (2020). “In Lean Times: Rural School Finance and the Great
Recession in Texas.” National Education Finance Academy, Birmingham, AL, April. Anderson, J., Gamson, D., and Eckert, S. A. (2019) “The Origins of Accountability in Education
Policy: Early Understandings and Federal Influences.” American Educational Research Association, Toronto, ON, April.
Taylor, K., Anderson, J., and Frankenberg, E. (2018) “School and Residential Segregation in Districts with Voluntary Integration Policies.” American Educational Research Association, New York, NY, April.
Anderson, J. and Ayata, F. (2018) “State of the States.” National Education Finance Academy, Tulsa, OK, April.