Looking for a precursor of spontaneous Sleep Slow Oscillations in human sleep: The role of the sigma...
9
UNCORRECTED PROOF Q1 Looking for a precursor of spontaneous Sleep Slow Oscillations in human 2 sleep: The role of the sigma activity Q2 Danilo Menicucci a,1 , Andrea Piarulli b,1 , Paolo Allegrini c , Remo Bedini c,d , Massimo Bergamasco b , 4 Marco Laurino c , Laura Sebastiani a , Angelo Gemignani c,d,e, ⁎ 5 a Department of Translational Research on New Technologies in Medicine and Surgery, University of Pisa, via Savi 10, 56126, Pisa, Italy 6 b Perceptual Robotics Laboratory, Scuola Superiore Sant'Anna, Pisa, via Alamanni 13b, 56010, Pisa, Italy 7 c EXTREME Centre, Institute of Life Sciences, Scuola Superiore Sant'Anna, Piazza Martiri della Libertà 33, 56127, Pisa, Italy 8 d Institute of Clinical Physiology, National Research Council (CNR), via Moruzzi 1, 56124, Pisa, Italy 9 e Department of Surgical, Medical, Molecular and Critical Area Pathology, University of Pisa, via Savi 10, 56126, Pisa, Italy abstract 10 article info 11 Article history: 12 Received 27 January 2015 13 Received in revised form 12 May 2015 14 Accepted 13 May 2015 15 Available online xxxx 16 Keywords: 17 Bistability 18 NREM sleep 19 Sleep slow oscillation 20 Spindle 21 Sigma band 22 Sleep Slow Oscillations (SSOs), paradigmatic EEG markers of cortical bistability (alternation between cellular 23 downstates and upstates), and sleep spindles, paradigmatic EEG markers of thalamic pacing, are two hallmarks 24 of sleeping brain. Selective thalamic lesions are reportedly associated to reductions of spindle activity and its 25 spectrum ~14 Hz (sigma), and to alterations of SSO features. This apparent, parallel behavior suggests that 26 thalamo-cortical entrainment favors cortical bistability. Here we investigate temporally-causal associations be- 27 tween thalamic sigma activity and shape, topology, and dynamics of SSOs. We recorded sleep EEG and studied 28 whether spatio-temporal variability of SSO amplitude, negative slope (synchronization in downstate falling) 29 and detection rate are driven by cortical-sigma-activity expression (12–18 Hz), in 3 consecutive 1 s-EEG-epochs 30 preceding each SSO event (Baselines). We analyzed: (i) spatial variability, comparing maps of baseline sigma 31 power and of SSO features, averaged over the first sleep cycle; (ii) event-by-event shape variability, computing 32 for each electrode correlations between baseline sigma power and amplitude/slope of related SSOs; (iii) event- 33 by-event spreading variability, comparing baseline sigma power in electrodes showing an SSO event with the ho- 34 mologous ones, spared by the event. The scalp distribution of baseline sigma power mirrored those of SSO ampli- 35 tude and slope; event-by-event variability in baseline sigma power was associated with that in SSO amplitude in 36 fronto-central areas; within each SSO event, electrodes involved in cortical bistability presented higher baseline 37 sigma activity than those free of SSO. In conclusion, spatio-temporal variability of thalamocortical entrainment, 38 measured by background sigma activity, is a reliable estimate of the cortical proneness to bistability. 39 © 2015 Published by Elsevier B.V. 40 41 42 43 44 1. Introduction 45 Electrophysiological studies in animal models have revealed that 46 during Slow Wave Sleep cortical neurons exhibit slow membrane- 47 potential dynamical oscillations. This neuronal behavior is characterized 48 by the coordinated switching of the membrane potential between a 49 state of hyperpolarization (down state) and a state of firing activity 50 with a rate similar to that of wakefulness (up state) (Steriade et al., 51 1993a; Vyazovskiy et al., 2009). This behavior, called neural bistability, 52 typically lasts slightly more than 1 s and, when it involves a large 53 amount of neurons in a coordinate way, represents the fundamental 54 network phenomenon underlying different slow EEG patterns of Slow 55 Wave Sleep, such as the K-complexes and the Sleep Slow Oscillations 56 (SSO) (Amzica and Steriade, 1998; Massimini et al., 2004; Menicucci 57 et al., 2009). These waves consist of an early positive deflection followed 58 by a sharp negative peak (related to the cellular down state) and by 59 a shallow positive half wave (related to the cellular up state) 60 (Massimini et al., 2004; Menicucci et al., 2013; Laurino et al., 2014). 61 The early positive deflection, spectrally characterized by the concurrent 62 presence of high frequency activities, acts as a wake-like excitation, 63 whose hypothesized role is that of triggering the down state on large 64 scale (Menicucci et al., 2013; Laurino et al., 2014). 65 The concept that an early excitation favors the transition into the 66 down state has been corroborated both theoretically and experimental- 67 ly. In general, a perturbation acting on a system with two metastable 68 states can force the transition to the lowest-energy one and this holds 69 true also for the sleeping neurons (Wilson et al., 2006; Frohlich et al., 70 2006). At a computational level, depolarization-activated K+ channels 71 have been used to model bistability in the thalamo-cortical system: International Journal of Psychophysiology xxx (2015) xxx–xxx Abbreviations: SSO, Sleep Slow Oscillation; NREM sleep, Non-Rapid-Eyes- Movement sleep. ⁎ Corresponding author at: Department of Surgery, Medical, Molecular and Critical Area Pathology, University of Pisa, via Paradisa 2, 56124, Pisa, Italy. Tel.: +39 050 315 2686; fax: +39 050 580018. E-mail address: [email protected] (A. Gemignani). 1 These authors contributed equally to this work. INTPSY-10987; No of Pages 9 http://dx.doi.org/10.1016/j.ijpsycho.2015.05.006 0167-8760/© 2015 Published by Elsevier B.V. Contents lists available at ScienceDirect International Journal of Psychophysiology journal homepage: www.elsevier.com/locate/ijpsycho Please cite this article as: Menicucci, D., et al., Looking for a precursor of spontaneous Sleep Slow Oscillations in human sleep: The role of the sigma activity, Int. J. Psychophysiol. (2015), http://dx.doi.org/10.1016/j.ijpsycho.2015.05.006
Transcript of Looking for a precursor of spontaneous Sleep Slow Oscillations in human sleep: The role of the sigma...
1Q1
2
3Q2
4
56789
1 0
1112131415
161718192021
39
4041
42
43
44
45
46
47
48
49
50
51
52
53
International Journal of Psychophysiology xxx (2015) xxx–xxx
INTPSY-10987; No of Pages 9
Contents lists available at ScienceDirect
International Journal of Psychophysiology
j ourna l homepage: www.e lsev ie r .com/ locate / i jpsycho
Looking for a precursor of spontaneous Sleep Slow Oscillations in humansleep: The role of the sigma activity
OO
FDanilo Menicucci a,1, Andrea Piarulli b,1, Paolo Allegrini c, Remo Bedini c,d, Massimo Bergamasco b,Marco Laurino c, Laura Sebastiani a, Angelo Gemignani c,d,e,⁎a Department of Translational Research on New Technologies in Medicine and Surgery, University of Pisa, via Savi 10, 56126, Pisa, Italyb Perceptual Robotics Laboratory, Scuola Superiore Sant'Anna, Pisa, via Alamanni 13b, 56010, Pisa, Italyc EXTREME Centre, Institute of Life Sciences, Scuola Superiore Sant'Anna, Piazza Martiri della Libertà 33, 56127, Pisa, Italyd Institute of Clinical Physiology, National Research Council (CNR), via Moruzzi 1, 56124, Pisa, Italye Department of Surgical, Medical, Molecular and Critical Area Pathology, University of Pisa, via Savi 10, 56126, Pisa, Italy
Abbreviations: SSO, Sleep Slow Oscillation; NRMovement sleep.⁎ Corresponding author at: Department of Surgery,Med
Pathology, University of Pisa, via Paradisa 2, 56124, Pisa,fax: +39 050 580018.
E-mail address: [email protected] (A. Gemignani1 These authors contributed equally to this work.
http://dx.doi.org/10.1016/j.ijpsycho.2015.05.0060167-8760/© 2015 Published by Elsevier B.V.
Please cite this article as:Menicucci, D., et al.,activity, Int. J. Psychophysiol. (2015), http://
R
a b s t r a c t
a r t i c l e i n f o22
23
24
25
26
27
28
29
30
31
32
Article history:Received 27 January 2015Received in revised form 12 May 2015Accepted 13 May 2015Available online xxxx
Keywords:BistabilityNREM sleepSleep slow oscillationSpindleSigma band
33
34
35
36
37
38
RECTED PSleep Slow Oscillations (SSOs), paradigmatic EEG markers of cortical bistability (alternation between cellulardownstates and upstates), and sleep spindles, paradigmatic EEG markers of thalamic pacing, are two hallmarksof sleeping brain. Selective thalamic lesions are reportedly associated to reductions of spindle activity and itsspectrum ~14 Hz (sigma), and to alterations of SSO features. This apparent, parallel behavior suggests thatthalamo-cortical entrainment favors cortical bistability. Here we investigate temporally-causal associations be-tween thalamic sigma activity and shape, topology, and dynamics of SSOs. We recorded sleep EEG and studiedwhether spatio-temporal variability of SSO amplitude, negative slope (synchronization in downstate falling)and detection rate are driven by cortical-sigma-activity expression (12–18 Hz), in 3 consecutive 1 s-EEG-epochspreceding each SSO event (Baselines). We analyzed: (i) spatial variability, comparing maps of baseline sigmapower and of SSO features, averaged over the first sleep cycle; (ii) event-by-event shape variability, computingfor each electrode correlations between baseline sigma power and amplitude/slope of related SSOs; (iii) event-by-event spreading variability, comparing baseline sigma power in electrodes showing an SSO eventwith the ho-mologous ones, spared by the event. The scalp distribution of baseline sigma powermirrored those of SSO ampli-tude and slope; event-by-event variability in baseline sigma power was associatedwith that in SSO amplitude infronto-central areas; within each SSO event, electrodes involved in cortical bistability presented higher baselinesigma activity than those free of SSO. In conclusion, spatio-temporal variability of thalamocortical entrainment,measured by background sigma activity, is a reliable estimate of the cortical proneness to bistability.
© 2015 Published by Elsevier B.V.
R
54
55
56
57
58
59
60
61
62
63
64
UNCO1. Introduction
Electrophysiological studies in animal models have revealed thatduring Slow Wave Sleep cortical neurons exhibit slow membrane-potential dynamical oscillations. This neuronal behavior is characterizedby the coordinated switching of the membrane potential between astate of hyperpolarization (down state) and a state of firing activitywith a rate similar to that of wakefulness (up state) (Steriade et al.,1993a; Vyazovskiy et al., 2009). This behavior, called neural bistability,typically lasts slightly more than 1 s and, when it involves a largeamount of neurons in a coordinate way, represents the fundamental
65
66
67
68
69
70
71
EM sleep, Non-Rapid-Eyes-
ical, Molecular and Critical AreaItaly. Tel.: +39 050 315 2686;
).
Looking for a precursor of spodx.doi.org/10.1016/j.ijpsycho.
network phenomenon underlying different slow EEG patterns of SlowWave Sleep, such as the K-complexes and the Sleep Slow Oscillations(SSO) (Amzica and Steriade, 1998; Massimini et al., 2004; Menicucciet al., 2009). Thesewaves consist of an early positive deflection followedby a sharp negative peak (related to the cellular down state) and bya shallow positive half wave (related to the cellular up state)(Massimini et al., 2004; Menicucci et al., 2013; Laurino et al., 2014).The early positive deflection, spectrally characterized by the concurrentpresence of high frequency activities, acts as a wake-like excitation,whose hypothesized role is that of triggering the down state on largescale (Menicucci et al., 2013; Laurino et al., 2014).
The concept that an early excitation favors the transition into thedown state has been corroborated both theoretically and experimental-ly. In general, a perturbation acting on a system with two metastablestates can force the transition to the lowest-energy one and this holdstrue also for the sleeping neurons (Wilson et al., 2006; Frohlich et al.,2006). At a computational level, depolarization-activated K+ channelshave been used to model bistability in the thalamo-cortical system:
ntaneous Sleep SlowOscillations in human sleep: The role of the sigma2015.05.006
T
72
73
74
75
76
77
78
79
80
81
82
83
84
85
86
87
88
89
90
91
92
93
94
95
96
97
98
99
100
101
102
103
104
105
106
107
108
109Q3
110
111
112
113
114
115
116Q4
117
118
119
120
121
122
123
124
125
126
127
128
129
130
131
132
133
134
135
136
137
138
139
140
141
142
143
2 D. Menicucci et al. / International Journal of Psychophysiology xxx (2015) xxx–xxx
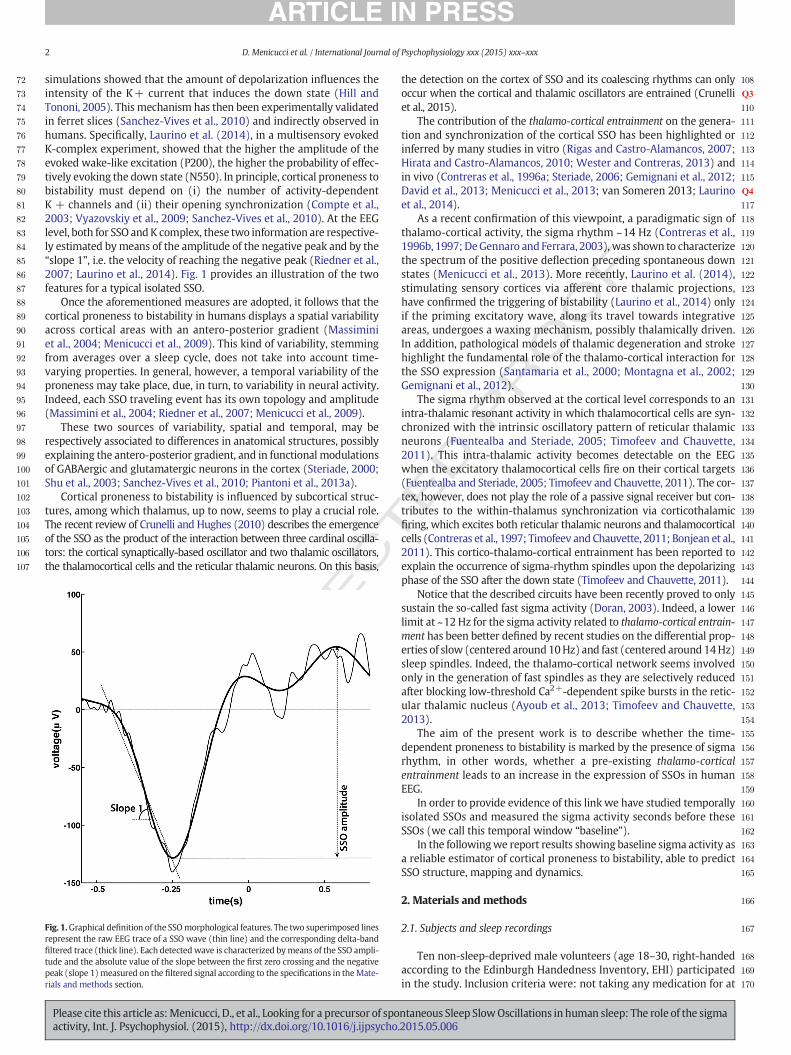
simulations showed that the amount of depolarization influences theintensity of the K+ current that induces the down state (Hill andTononi, 2005). This mechanism has then been experimentally validatedin ferret slices (Sanchez-Vives et al., 2010) and indirectly observed inhumans. Specifically, Laurino et al. (2014), in a multisensory evokedK-complex experiment, showed that the higher the amplitude of theevoked wake-like excitation (P200), the higher the probability of effec-tively evoking the down state (N550). In principle, cortical proneness tobistability must depend on (i) the number of activity-dependentK + channels and (ii) their opening synchronization (Compte et al.,2003; Vyazovskiy et al., 2009; Sanchez-Vives et al., 2010). At the EEGlevel, both for SSO andK complex, these two information are respective-ly estimated bymeans of the amplitude of the negative peak and by the“slope 1”, i.e. the velocity of reaching the negative peak (Riedner et al.,2007; Laurino et al., 2014). Fig. 1 provides an illustration of the twofeatures for a typical isolated SSO.
Once the aforementioned measures are adopted, it follows that thecortical proneness to bistability in humans displays a spatial variabilityacross cortical areas with an antero-posterior gradient (Massiminiet al., 2004; Menicucci et al., 2009). This kind of variability, stemmingfrom averages over a sleep cycle, does not take into account time-varying properties. In general, however, a temporal variability of theproneness may take place, due, in turn, to variability in neural activity.Indeed, each SSO traveling event has its own topology and amplitude(Massimini et al., 2004; Riedner et al., 2007; Menicucci et al., 2009).
These two sources of variability, spatial and temporal, may berespectively associated to differences in anatomical structures, possiblyexplaining the antero-posterior gradient, and in functional modulationsof GABAergic and glutamatergic neurons in the cortex (Steriade, 2000;Shu et al., 2003; Sanchez-Vives et al., 2010; Piantoni et al., 2013a).
Cortical proneness to bistability is influenced by subcortical struc-tures, among which thalamus, up to now, seems to play a crucial role.The recent review of Crunelli and Hughes (2010) describes the emergenceof the SSO as the product of the interaction between three cardinal oscilla-tors: the cortical synaptically-based oscillator and two thalamic oscillators,the thalamocortical cells and the reticular thalamic neurons. On this basis,
UNCO
RREC 144
145
146
147
148
149
150
151
152
153
154
155
156
157
158
159
160
161
162
163
164
165
166
167
168
169
170
Fig. 1.Graphical definition of the SSOmorphological features. The two superimposed linesrepresent the raw EEG trace of a SSO wave (thin line) and the corresponding delta-bandfiltered trace (thick line). Each detectedwave is characterized bymeans of the SSO ampli-tude and the absolute value of the slope between the first zero crossing and the negativepeak (slope 1) measured on the filtered signal according to the specifications in theMate-rials and methods section.
Please cite this article as:Menicucci, D., et al., Looking for a precursor of spoactivity, Int. J. Psychophysiol. (2015), http://dx.doi.org/10.1016/j.ijpsycho.
ED P
RO
OF
the detection on the cortex of SSO and its coalescing rhythms can onlyoccur when the cortical and thalamic oscillators are entrained (Crunelliet al., 2015).
The contribution of the thalamo-cortical entrainment on the genera-tion and synchronization of the cortical SSO has been highlighted orinferred by many studies in vitro (Rigas and Castro-Alamancos, 2007;Hirata and Castro-Alamancos, 2010; Wester and Contreras, 2013) andin vivo (Contreras et al., 1996a; Steriade, 2006; Gemignani et al., 2012;David et al., 2013; Menicucci et al., 2013; van Someren 2013; Laurinoet al., 2014).
As a recent confirmation of this viewpoint, a paradigmatic sign ofthalamo-cortical activity, the sigma rhythm ~14 Hz (Contreras et al.,1996b, 1997; DeGennaro and Ferrara, 2003), was shown to characterizethe spectrum of the positive deflection preceding spontaneous downstates (Menicucci et al., 2013). More recently, Laurino et al. (2014),stimulating sensory cortices via afferent core thalamic projections,have confirmed the triggering of bistability (Laurino et al., 2014) onlyif the priming excitatory wave, along its travel towards integrativeareas, undergoes a waxing mechanism, possibly thalamically driven.In addition, pathological models of thalamic degeneration and strokehighlight the fundamental role of the thalamo-cortical interaction forthe SSO expression (Santamaria et al., 2000; Montagna et al., 2002;Gemignani et al., 2012).
The sigma rhythm observed at the cortical level corresponds to anintra-thalamic resonant activity in which thalamocortical cells are syn-chronized with the intrinsic oscillatory pattern of reticular thalamicneurons (Fuentealba and Steriade, 2005; Timofeev and Chauvette,2011). This intra-thalamic activity becomes detectable on the EEGwhen the excitatory thalamocortical cells fire on their cortical targets(Fuentealba and Steriade, 2005; Timofeev and Chauvette, 2011). The cor-tex, however, does not play the role of a passive signal receiver but con-tributes to the within-thalamus synchronization via corticothalamicfiring, which excites both reticular thalamic neurons and thalamocorticalcells (Contreras et al., 1997; Timofeev and Chauvette, 2011; Bonjean et al.,2011). This cortico-thalamo-cortical entrainment has been reported toexplain the occurrence of sigma-rhythm spindles upon the depolarizingphase of the SSO after the down state (Timofeev and Chauvette, 2011).
Notice that the described circuits have been recently proved to onlysustain the so-called fast sigma activity (Doran, 2003). Indeed, a lowerlimit at ~12 Hz for the sigma activity related to thalamo-cortical entrain-ment has been better defined by recent studies on the differential prop-erties of slow (centered around10Hz) and fast (centered around 14Hz)sleep spindles. Indeed, the thalamo-cortical network seems involvedonly in the generation of fast spindles as they are selectively reducedafter blocking low-threshold Ca2+-dependent spike bursts in the retic-ular thalamic nucleus (Ayoub et al., 2013; Timofeev and Chauvette,2013).
The aim of the present work is to describe whether the time-dependent proneness to bistability is marked by the presence of sigmarhythm, in other words, whether a pre-existing thalamo-corticalentrainment leads to an increase in the expression of SSOs in humanEEG.
In order to provide evidence of this link we have studied temporallyisolated SSOs and measured the sigma activity seconds before theseSSOs (we call this temporal window “baseline”).
In the followingwe report results showing baseline sigma activity asa reliable estimator of cortical proneness to bistability, able to predictSSO structure, mapping and dynamics.
2. Materials and methods
2.1. Subjects and sleep recordings
Ten non-sleep-deprived male volunteers (age 18–30, right-handedaccording to the Edinburgh Handedness Inventory, EHI) participatedin the study. Inclusion criteria were: not taking any medication for at
ntaneous Sleep SlowOscillations in human sleep: The role of the sigma2015.05.006
T
171
172
173
174
175
176
177
178
179
180
181
182
183
184
185
186
187
188
189
190
191
192
193
194
195
196
197
198
199
200
201
202
203
204
205
206
207
208
209
210
211
212
213
214
215
216
217
218
219
220
221
222
223
224
225
226
227
228
229
230
231
232
233
234
235
236
237
238
239
240
241
242
243
244
245
246
247
248
249
250
251
252
253
254
255
256
257
258
259
260
261
262
263
264
265
266
267
268
269
270
271
272
273
274
275
276
277
278
279
280
281
282
283
284
285
286
287
288
289
290
291
292
293
294
3D. Menicucci et al. / International Journal of Psychophysiology xxx (2015) xxx–xxx
UNCO
RREC
least 1 year, no personal or family history of sleep disorders, and nomedical, neurological or psychiatric disorders, as assessed by semi-structured interviews. In order to avoid variability related to the differ-ent phases of themenstrual cyclewe chose to restrict our study tomalessince fast sigma activity has been shown to be influenced by reproduc-tive hormones (Carrier et al., 2001). Note that these EEG recordings havebeen previously used in order to demonstrate the existence of a bump ofwake-like excitation triggering the down state (Menicucci et al, 2013).The experimental procedures conformedwith theWorldMedical Associ-ation Declaration of Helsinki and all participants signed an informed con-sent approved by the Azienda Ospedaliero-Universitaria Pisana EthicalCommittee.
After an adaptation night, all volunteers were allowed to sleep attheir usual bedtime and EEG recordings were carried out during thefirst sleep cycle of the night. During sleep, a 32-EEG channelsmonopolaramplifier (Nuamps, Neuroscan, Compumedics, El Paso, TX) was used toacquire signals with a sampling rate of 1 kHz and electrode impedancebelow 5 kΩ. During the recordings, scalp EEG signals were referencedto the FCz potential and then offline re-referenced to the average mas-toids potential.
EEG epochs with artifacts were detected on the basis of an automat-ed threshold-crossing detection algorithm (Piarulli et al., 2010) andverified by visual inspection.We discarded all those time segments con-taining artifacts in at least one channel. On average, 90% of recordingtimewas free from artifacts. The artifact-free EEG segmentswere scoredaccording to the AASM criteria (Iber et al., 2007) and analyzed using apreviously published and validated SSO detection algorithm from ourgroup (Menicucci et al., 2009; Piarulli et al., 2010).
2.2. Identification and analysis of temporally isolated SSO
SSOs were detected in the epochs belonging to N2 and N3 stages ofthe first sleep cycle using the Likeness Method proposed by our groupin previous works (Menicucci et al., 2009; Piarulli et al., 2010). Hereinwe choose to focalize on the first sleep cycle because the SSO arehomeostatically regulated and thus maximally expressed during thefirst sleep cycle (Riedner et al., 2007). Focusing on the first sleep cyclehas also allowed to avoid any bias due to progressive electrode dryingoccurring from the second cycle on.
In summary, we classify as a SSO eachwave consisting of (a) two zerocrossings separated by 0.3–1.0 s, the first one having a negative slope;(b) a negative peak between the two zero crossings with a voltage lessthan 80 μV; (c) a negative-to-positive peak amplitude of at least 140 μV.Then, detected SSO events are completed by clustering full-fledged SSOswith concurrent similar waves, even if sub-threshold. These detectioncriteria naturally include all K-complexes (Massimini et al., 2004).
Moreover, in order to allow the assessment of unambiguous baselineepochs, specific of each SSO, without possible confounding effects ofadjacent SSOs, we selected temporally isolated SSOs (Menicucci et al.,2013), herein defined as the events more distant than 7 s both fromthe previous and the following SSO event (time distances betweenevents measured using negative peaks locations).
In the following, for the sake of simplicitywewill refer to the tempo-rally isolated spontaneous SSO using the acronym SSO.
2.3. Measures of cortical proneness to bistability
A straightforward a posteriori measure of the proneness is given bythe detection rate of SSOs (Menicucci et al., 2009; Piarulli et al., 2010).Herein we use the average detection rate over the first sleep cycle.Other a posteriori estimates of proneness to bistability have the advan-tage of being computable event by event: These are the twomorpholog-ical features of the SSO shown in Fig. 1 (see also Menicucci et al., 2009),namely the SSO amplitude and the slope of the EEG signal before thenegative peak (slope 1). SSO amplitude is defined as the peak-to-peakvoltage range and reflects howmany pyramidal neurons synchronously
Please cite this article as:Menicucci, D., et al., Looking for a precursor of spoactivity, Int. J. Psychophysiol. (2015), http://dx.doi.org/10.1016/j.ijpsycho.
ED P
RO
OF
undergo bistability (cellular down and up state); slope 1 is defined asthe steepness of the wave between the first zero crossing and thenegative peak and corresponds to the neuronal pool synchronizationin falling into the down state (Esser et al., 2007; Vyazovskiy et al.,2007; Chauvette et al., 2010). These SSO parameters were measuredon the signal filtered in the delta (0.5–4.0 Hz) band (for the filter imple-mentation details see Menicucci et al., 2009 or Piarulli et al., 2010).
2.4. Measures of thalamo-cortical entrainment
Wehave adopted the EEG activity in the sigma band (12–18Hz) as ameasure of the thalamo-cortical entrainment. As earlier stated, we take12 Hz as a lower boundary because of the demonstrated specificity ofthis band in involving thalamocortical circuits (Ayoub et al., 2013;Timofeev and Chauvette, 2013). The extension up to 18 Hz for thesigma band is in line with the both the works of Mölle et al. (2002)and of Menicucci et al. (2013): these works have demonstrated thatdespite sigma activity is centered around 12–15 Hz, its effect spreadsover higher frequencies. As a beneficial side effect this choice also allowsfor a better time resolution.
We computed the time–frequency power spectrum (spectrogram)of all EEG epochs preceding an SSO event, starting from 4 s before thenegative peak and ending 1 s before the peak itself. This ending pointoccurs before the early positive deflection (Menicucci et al., 2013) andthus the three-seconds epoch is appropriate for estimating the baselineactivity before the SSO. The spectrogram has a time–frequency step of66 ms and 6 Hz and is calculated by the Fast Fourier Transform appliedon Hamming-weighted sliding-window on each three-seconds epoch.Each window has a time-width of 166 ms with a 60% overlap betweencontiguous windows.
In line with the approach of Menicucci et al. (2013), we split thethree-seconds epoch in three one-second-baseline windows (B3, B2,B1, with B1 corresponding to the interval nearest to the negativepeak). This was done to verify whether sigma activity either (i) acts astrigger for SSO (a specific association with a narrow time interval wasexpected in this case), or (ii) modulates SSO as an expression of aslow-varying background activity (a similar association for all thethree 1 s baselines was expected, only slowly reinforcing when passingto the closer interval).
For each of the three baselines, sigma activity was measured by av-eraging the sigma band of the spectrogram in the corresponding 1 swindow. All statistical analyses were replicated for B1, B2 and B3 andsignificance levels were then adjusted taking into account the multipletesting issue on the basis of False Discovery Ratio (FDR) approach(Benjamini and Yekutieli, 2001).
2.5. Measuring thalamic influence on cortical proneness to bistability
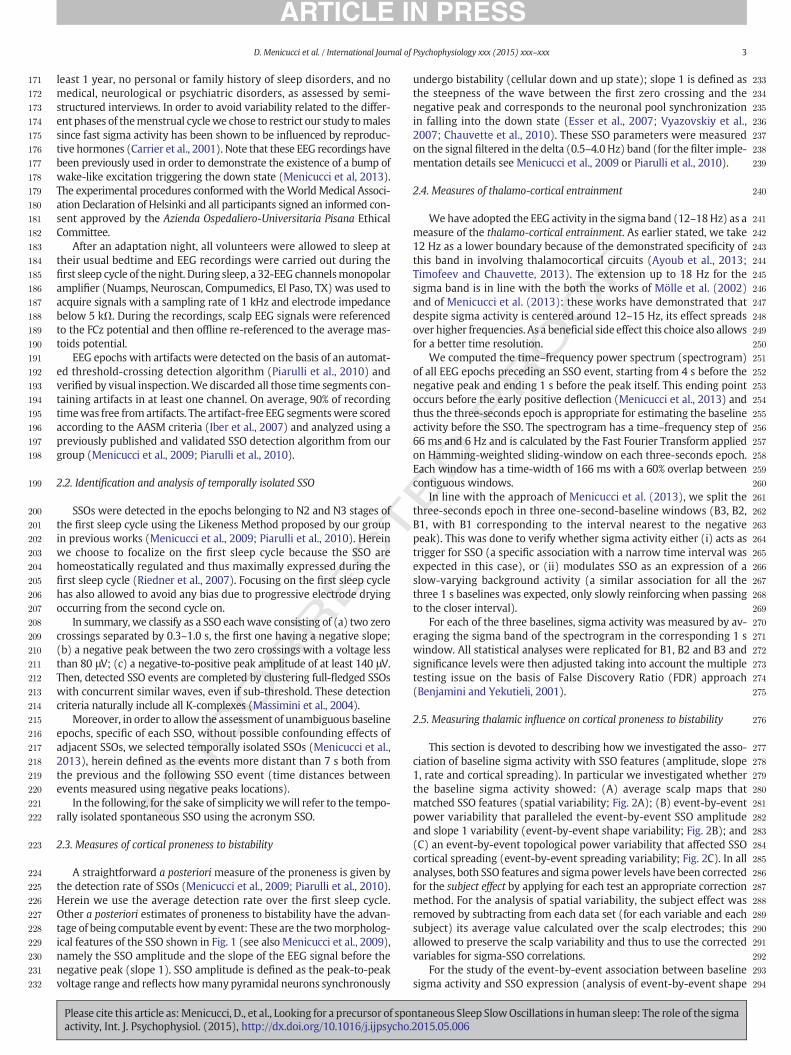
This section is devoted to describing how we investigated the asso-ciation of baseline sigma activity with SSO features (amplitude, slope1, rate and cortical spreading). In particular we investigated whetherthe baseline sigma activity showed: (A) average scalp maps thatmatched SSO features (spatial variability; Fig. 2A); (B) event-by-eventpower variability that paralleled the event-by-event SSO amplitudeand slope 1 variability (event-by-event shape variability; Fig. 2B); and(C) an event-by-event topological power variability that affected SSOcortical spreading (event-by-event spreading variability; Fig. 2C). In allanalyses, both SSO features and sigma power levels have been correctedfor the subject effect by applying for each test an appropriate correctionmethod. For the analysis of spatial variability, the subject effect wasremoved by subtracting from each data set (for each variable and eachsubject) its average value calculated over the scalp electrodes; thisallowed to preserve the scalp variability and thus to use the correctedvariables for sigma-SSO correlations.
For the study of the event-by-event association between baselinesigma activity and SSO expression (analysis of event-by-event shape
ntaneous Sleep SlowOscillations in human sleep: The role of the sigma2015.05.006
T
295
296
297
298
299
300
301
302
303
304
305
306
307
308
309
310
311
312
313
314
315
316
317
318
319
320
321
322
323
324
325
326
327
328
329
330
331
332
333
334
335
336
337
338
339
340
341
342
343
344
345
346
347
348
349
350
351
352
353
354
355
356
357
358
359
360
361
362
363
364
365
366
367
368
369
370
371
4 D. Menicucci et al. / International Journal of Psychophysiology xxx (2015) xxx–xxx
EC
variability and analysis of event-by-event spreading variability),the subject effect was removed by subtracting from the eventdata series related to each electrode and subject, the averagevalue calculated over the subject and the electrode; this correctionremoved also the different between-subjects fronto-posterior gra-dient and thus it allowed focusing solely on the event-by-eventvariability.
(A) Analysis of spatial variabilityMaps of SSO amplitude, slope 1 and detection rate were com-pared to those of baseline sigma activity (measures in dB). Mapsimilarities for the three SSO features with respect to sigmawere measured by means of the Pearson correlation (thresholdof significance p b 0.01) calculated on scatterplots, where eachpoint corresponds to one of the 29 retained electrodes(Fig. 2A). All values in the scatterplots correspond to the averageover all events belonging to N2 and N3 stages. The statistical sig-nificance of correlations was established by using as thresholdrt = 0.45 that is the highest coefficient obtained between thefrequencies around the 50 Hz power line (45 Hz–55 Hz) andthe SSO features (in line withMenicucci et al., 2013). This coeffi-cient does not correspond to a real association because thepowerline is clearly independent from the brain activity; thus it can beconsidered an appropriate threshold to discriminate meaningfulfrom fortuitous (by chance) correlations. This criterion wasmore stringent than the classical rule based on the Fisher z-transformation, even at p-value threshold b0.001.Besides, possible spurious, i.e. non-functional correlations, possiblyrelated to non-sleep networks and volume conduction, have beenchecked; in other words, since independent processes originatingaround the same brain area have a similar activity distributionover the cortex, results of spatial variability analysis may sufferfromgeometricalfixed factors that could falsely associate function-al phenomena, which are actually independent. In order to amendthis possible pitfall we used the upper alpha EEG power (10–12Hz) (Klimesch, 1999) of the relaxedwake as a control conditionfor sleep sigma activity. Invariant correlations (i.e., independent ofthe sleep/wake state) would indicate false functional associations.The appropriateness of this control procedure stems from
UNCO
RR
Fig. 2. Summary of themethods for studying the associations between baseline sigma (σ) activiat associating the average scalp distributions of a SSO feature (SSO amplitude, in thepictorial exabetween scalp maps is measured by means of Pearson correlation calculated between the serevents (second row). Panel B (second column). Event-by-event shape variability. The analysisSSO shape. The first row shows two cases of baseline sigma activity (black epochs in the upperepresentative electrode. Correlation between baseline sigma power and each morphologicacorrelation performedover the events. The analysis yields a correlationmap as shown on the secillustrates an example of the intra-event comparison analysis that considers a SSO event spreadsolid path with the concurrent sigma activity over the homologous path, indicated by the dashevaluated by comparing the average powers over each pathway. The box plot of Δsigma powe
Please cite this article as:Menicucci, D., et al., Looking for a precursor of spoactivity, Int. J. Psychophysiol. (2015), http://dx.doi.org/10.1016/j.ijpsycho.
ED P
RO
OF
similarities of alpha and sigma rhythms in both frequencyrange and waxing and waning (spindle) behavior. Actually,both activities derive from the loop involving thalamic reticu-lar, thalamocortical and pyramidal cortical neurons. For thesake of completeness, we recall that thalamo-cortical neuronswith high-threshold Ca2+ channels sustain alpha rhythmwhile thalamo-cortical neurons with low-threshold Ca2+
channels sustain sigma activity (Hughes and Crunelli, 2005,2007; Vijayan and Kopell, 2012).EEG of relaxed wake epochs were derived from ten-minutesresting-state EEG recordings performed before sleep. Thesame EEG montage and referencing was used for wakefulnessand sleep recordings and this allowed a precise electrodematch between the two conditions. In order to record the re-laxed wakefulness EEG epochs, subjects were asked to keeptheir eyes closed, to relax, to refrain from moving, and toavoid any structuredmental activity. The wake-EEGwas visu-ally inspected and head-movement-corrupted epochs werediscarded (a total of 10–20 s epochs present in 2 out of 10 sub-jects). Eye-movement artifacts were corrected by means ofthe application of the temporal-constrained ICA (James andGibson, 2003).
(B) Analysis of event-by-event shape variabilityThis analysis, performed electrode by electrode, consisted intaking into account all SSO events in which the electrodewas involved. For each electrode, we calculated the Pearsoncorrelations between baseline sigma power and the morpho-logical feature (be it amplitude, or slope 1) of the followingSSO wave (Fig. 2B). According to the different number ofSSO detected under each electrode (that ranged from 70 to350 in our dataset), the Pearson correlations were calculatedbetween series of variable length. The threshold for statisticalsignificance was selected as p b 0.01 at the lower number ofevents that corresponds to r = 0.31.
(C) Analysis of event-by-event spreading variabilityWe verified whether the presence of a temporary increase ofbaseline sigma activity in a cortical region marked a preferen-tial area of spreading for the following SSO. Here and in thefollowing we will use the term “event spreading” to indicate
ty and SSO expression. Panel A (first column). Spatial variability analysis. The analysis aimsmple on thefirst row, left) and of the baseline sigma power (first row, right). The similarityies of sigma power and SSO features derived from each electrode and averaged over SSOaims at associating the event-by-event variability of baseline sigma activity with that ofr trace of the first row) with the following SSOs (lower trace of the first row) related to al feature of the corresponding SSO is performed for each electrode by means of Pearsonond row. Panel C (third column). Event-by-event spreading variability. Thefirst-row figureing on the solid path at time t. Themethod compares the baseline sigma activity along theed line, symmetrical with respect to the midline. Differences between sigma activities arer (Δσ) is shown in the second row.
ntaneous Sleep SlowOscillations in human sleep: The role of the sigma2015.05.006
T
372
373
374
375
376
377
378
379
380
381
382
383
384
385
386
387
388
389
390
391
392
393
394
395
396
397
398
399
400
401
402
403
404
405
406
407
408
409
410
411
412
413
414
415
416
417
418
419
420
421
422
423
424
425
426
427
428
429
430
431
432
433
434
435
436
437
438
439
440
441
442
443
444
445
446
447
448
449
450
451
452
453
454
455
456
457
458
459
460
461
462
463
464
465
466
467
468
469
470
471
472
473
474
475
476
477
478
479Q5
480
481
482
483
484
485
486
487
488
489
490
491
492
5D. Menicucci et al. / International Journal of Psychophysiology xxx (2015) xxx–xxx
UNCO
RREC
the set of electrodes involved in a SSO event. This term intui-tively denotes the variable and irregular composition of theset. As depicted in Fig. 2C, we compared the baseline sigmaactivity detected on the electrodes belonging to a SSO eventto the activity of homologous electrodes spared by the sameSSO event. Such an intra-event comparison avoids confound-ing effects caused by slowly varying biochemical processessuch as those associated to sleep deepening. Moreover, thisintra-event approach was specifically designed to avoid spatialconfounding effects as it is based on comparison between homol-ogous electrode pairs (symmetric electrodes with respect tomidline, e.g. F3–F4, C3–C4, O1–O2).In detail, we selected all SSO events whose propagation did notcontain anyhomologous pair.We compared thebaseline sigmaac-tivity over the event spreading (solid line in Fig. 2C)with the base-line sigma activity over the ensemble of the homologouselectrodes (symmetrical dashed line in Fig. 2C), disregarding mid-line electrodes. For each pair of homologous electrodes we calcu-lated the Normalized Difference of Power − NDP = (pe − ph) /(pe + ph), where pe is the power of the electrode belonging tothe event and ph that corresponding to its homologous — eachevent was characterized by the NDP averaged over the eventspreading.The normalization 1 / (pe + ph) was introduced in order to havesimilar contributions of the different electrodes to the averagedifference over the event spreading. A Wilcoxon signed rank testperformed on all spreading events verified the null hypothesisthat NDP data come from a distribution with zero median andindicated the statistical significance of the sigma power differencebetween events spreading and the ensemble of their homologouselectrodes. The threshold for statistical significance was set atp b 0.01.
3. Results
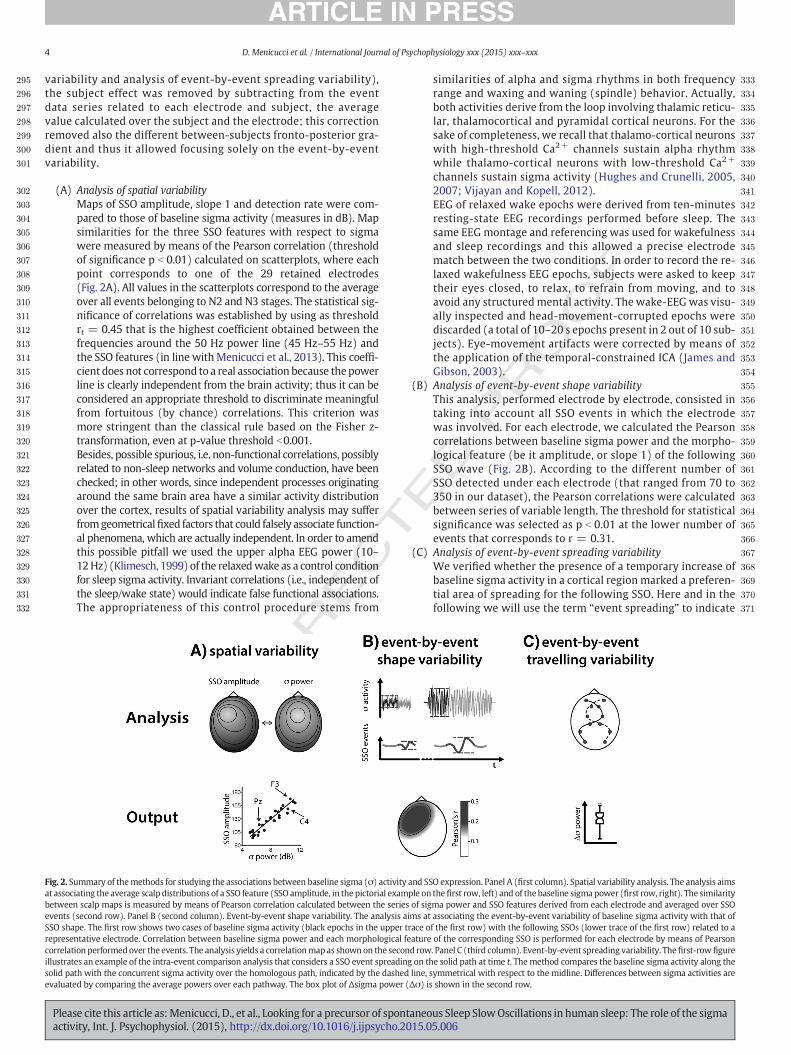
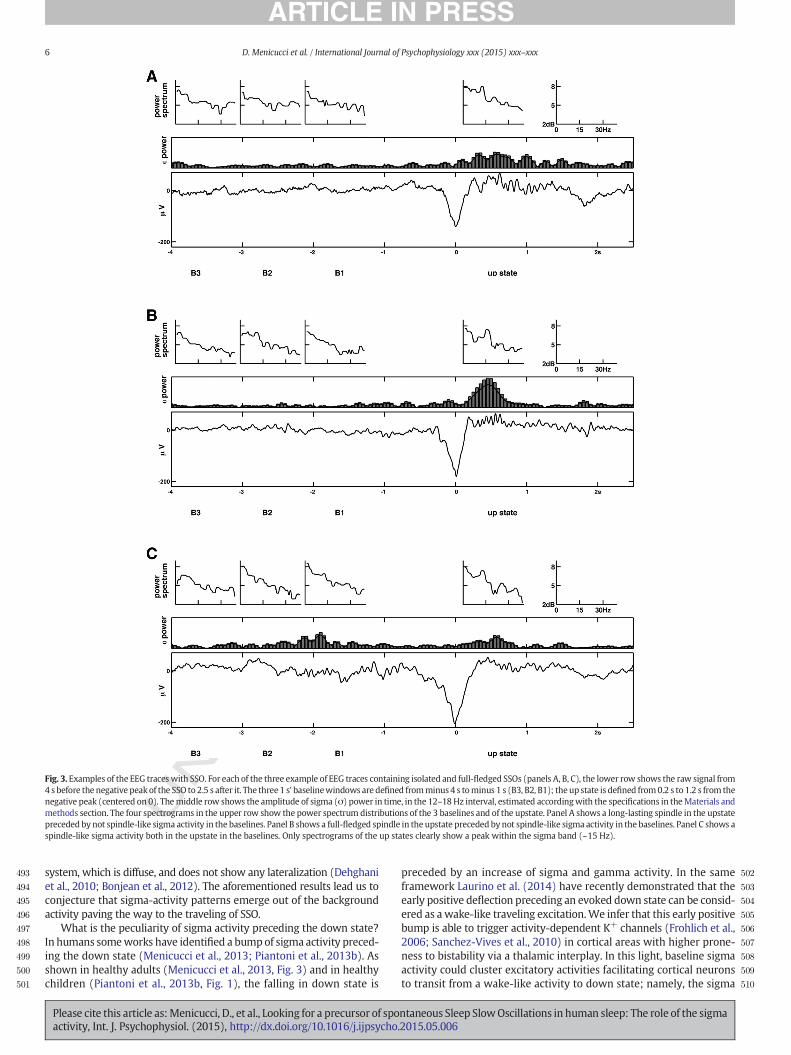
Isolated SSOs were identified according to the selection criteriadescribed in the Methods section. Fig. 3 shows the raw EEG signalsimmediately before and during typical SSOs. It is worth noting thatsigmaactivity, usually present as a spindle (like the activity in the exam-ples) in the up state following the down state, is also present in thebaseline epochs before the SSO.
3.1. Baseline sigma activity maps cortical proneness to bistability
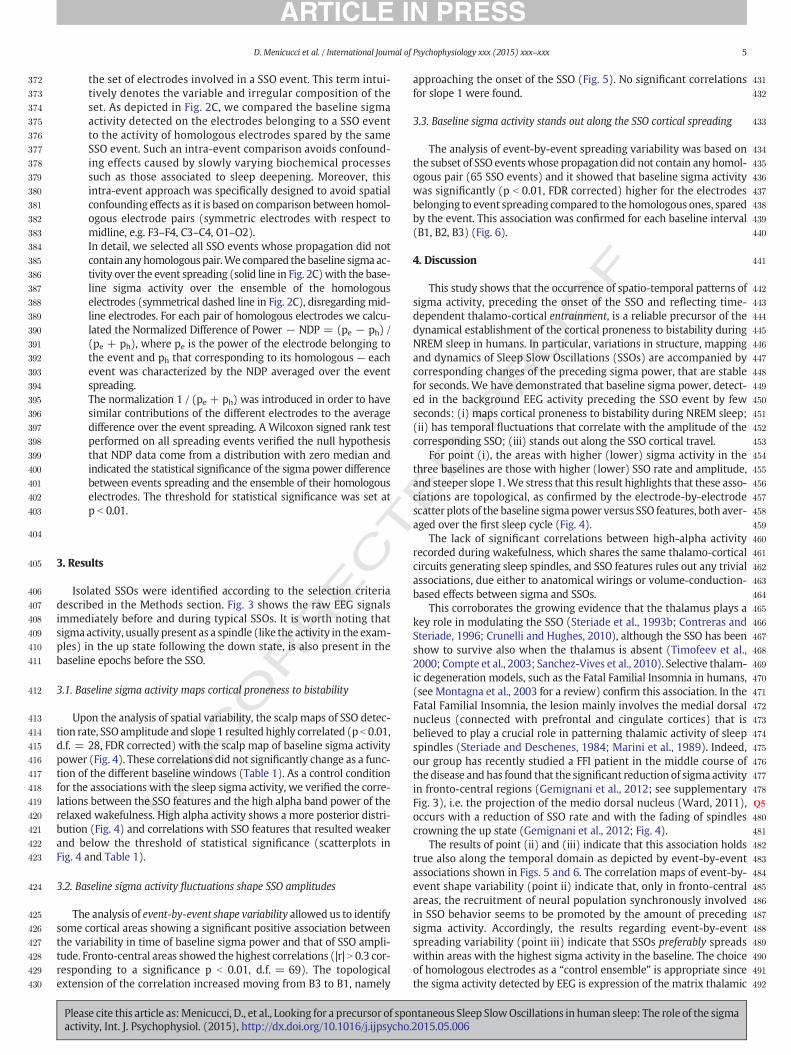
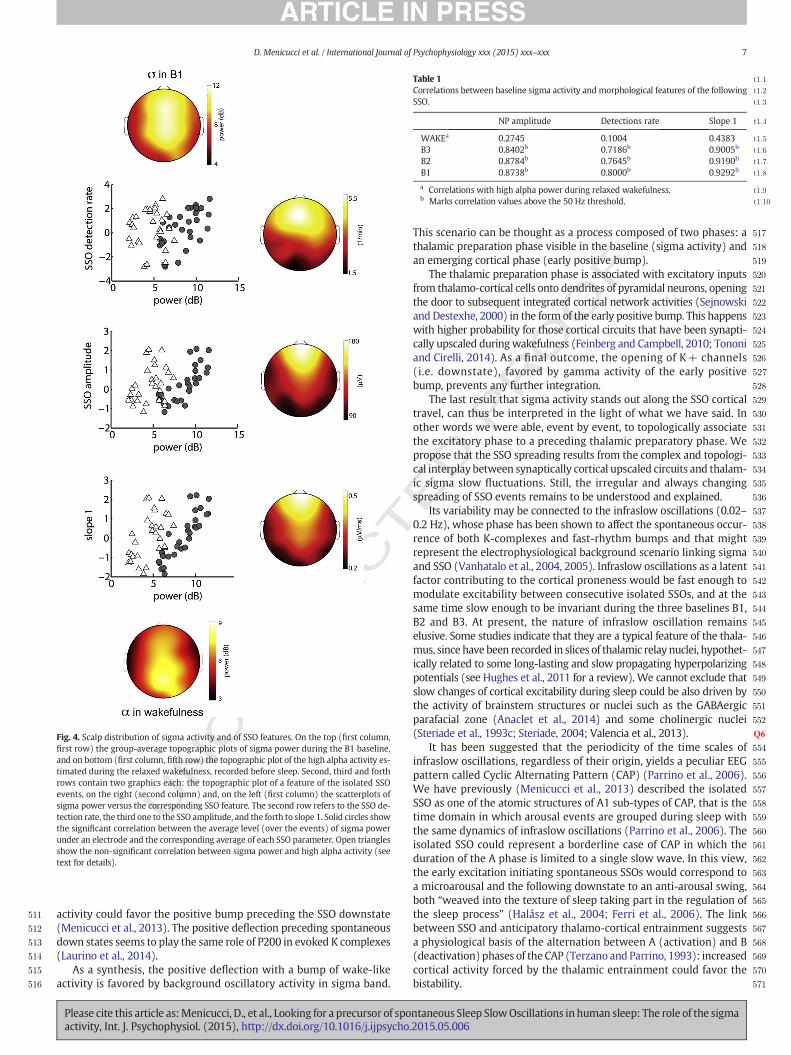
Upon the analysis of spatial variability, the scalp maps of SSO detec-tion rate, SSO amplitude and slope 1 resulted highly correlated (p b 0.01,d.f. = 28, FDR corrected) with the scalp map of baseline sigma activitypower (Fig. 4). These correlations did not significantly change as a func-tion of the different baseline windows (Table 1). As a control conditionfor the associations with the sleep sigma activity, we verified the corre-lations between the SSO features and the high alpha band power of therelaxed wakefulness. High alpha activity shows a more posterior distri-bution (Fig. 4) and correlations with SSO features that resulted weakerand below the threshold of statistical significance (scatterplots inFig. 4 and Table 1).
3.2. Baseline sigma activity fluctuations shape SSO amplitudes
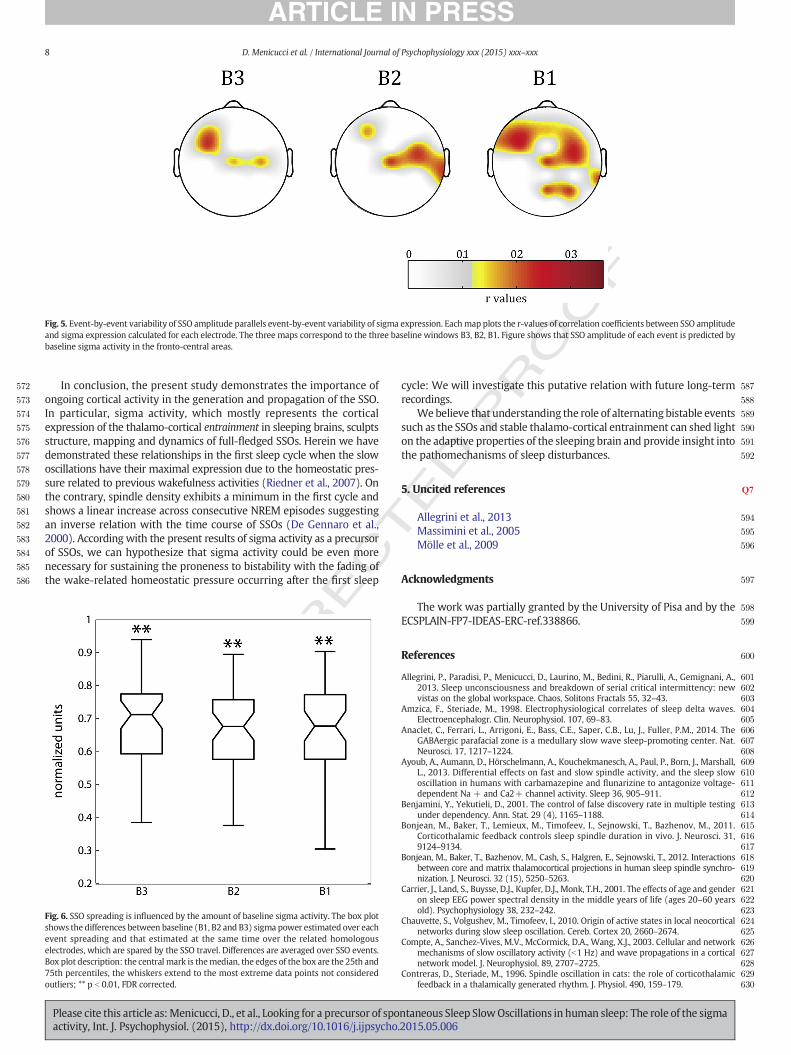
The analysis of event-by-event shape variability allowed us to identifysome cortical areas showing a significant positive association betweenthe variability in time of baseline sigma power and that of SSO ampli-tude. Fronto-central areas showed the highest correlations (|r| N 0.3 cor-responding to a significance p b 0.01, d.f. = 69). The topologicalextension of the correlation increased moving from B3 to B1, namely
Please cite this article as:Menicucci, D., et al., Looking for a precursor of spoactivity, Int. J. Psychophysiol. (2015), http://dx.doi.org/10.1016/j.ijpsycho.
ED P
RO
OF
approaching the onset of the SSO (Fig. 5). No significant correlationsfor slope 1 were found.
3.3. Baseline sigma activity stands out along the SSO cortical spreading
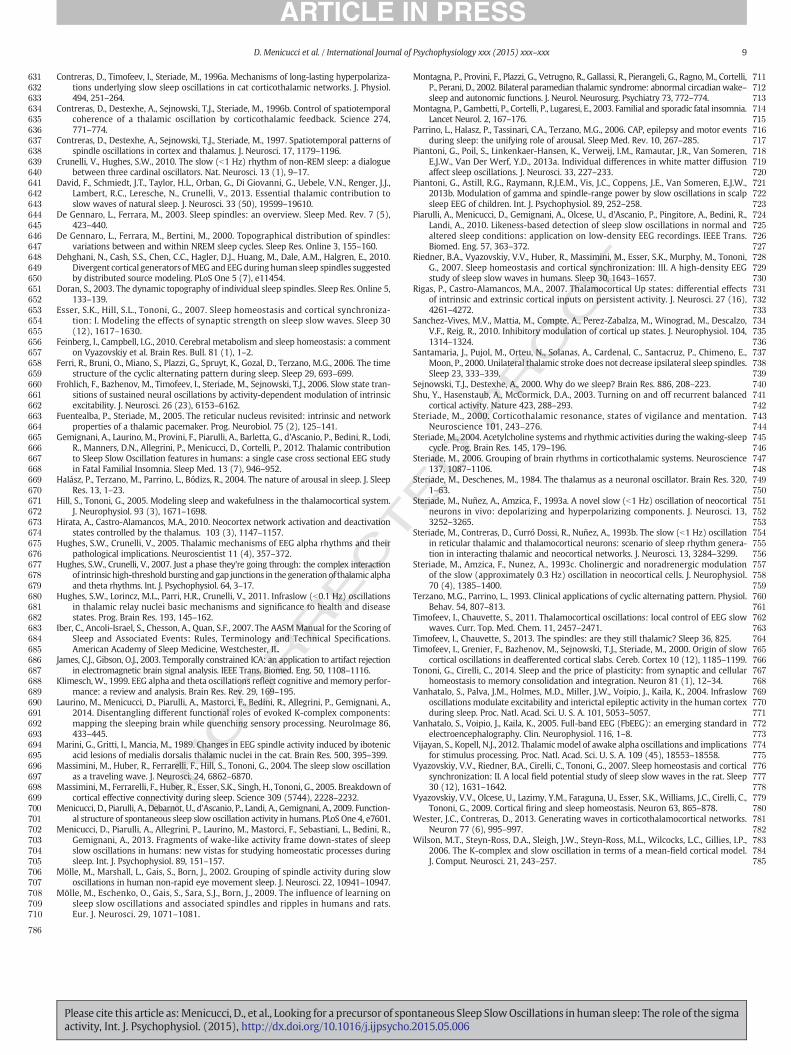
The analysis of event-by-event spreading variability was based onthe subset of SSO events whose propagation did not contain any homol-ogous pair (65 SSO events) and it showed that baseline sigma activitywas significantly (p b 0.01, FDR corrected) higher for the electrodesbelonging to event spreading compared to the homologous ones, sparedby the event. This association was confirmed for each baseline interval(B1, B2, B3) (Fig. 6).
4. Discussion
This study shows that the occurrence of spatio-temporal patterns ofsigma activity, preceding the onset of the SSO and reflecting time-dependent thalamo-cortical entrainment, is a reliable precursor of thedynamical establishment of the cortical proneness to bistability duringNREM sleep in humans. In particular, variations in structure, mappingand dynamics of Sleep Slow Oscillations (SSOs) are accompanied bycorresponding changes of the preceding sigma power, that are stablefor seconds. We have demonstrated that baseline sigma power, detect-ed in the background EEG activity preceding the SSO event by fewseconds: (i) maps cortical proneness to bistability during NREM sleep;(ii) has temporal fluctuations that correlate with the amplitude of thecorresponding SSO; (iii) stands out along the SSO cortical travel.
For point (i), the areas with higher (lower) sigma activity in thethree baselines are those with higher (lower) SSO rate and amplitude,and steeper slope 1.We stress that this result highlights that these asso-ciations are topological, as confirmed by the electrode-by-electrodescatter plots of the baseline sigmapower versus SSO features, both aver-aged over the first sleep cycle (Fig. 4).
The lack of significant correlations between high-alpha activityrecorded during wakefulness, which shares the same thalamo-corticalcircuits generating sleep spindles, and SSO features rules out any trivialassociations, due either to anatomical wirings or volume-conduction-based effects between sigma and SSOs.
This corroborates the growing evidence that the thalamus plays akey role in modulating the SSO (Steriade et al., 1993b; Contreras andSteriade, 1996; Crunelli and Hughes, 2010), although the SSO has beenshow to survive also when the thalamus is absent (Timofeev et al.,2000; Compte et al., 2003; Sanchez-Vives et al., 2010). Selective thalam-ic degeneration models, such as the Fatal Familial Insomnia in humans,(see Montagna et al., 2003 for a review) confirm this association. In theFatal Familial Insomnia, the lesion mainly involves the medial dorsalnucleus (connected with prefrontal and cingulate cortices) that isbelieved to play a crucial role in patterning thalamic activity of sleepspindles (Steriade and Deschenes, 1984; Marini et al., 1989). Indeed,our group has recently studied a FFI patient in the middle course ofthe disease and has found that the significant reduction of sigma activityin fronto-central regions (Gemignani et al., 2012; see supplementaryFig. 3), i.e. the projection of the medio dorsal nucleus (Ward, 2011),occurs with a reduction of SSO rate and with the fading of spindlescrowning the up state (Gemignani et al., 2012; Fig. 4).
The results of point (ii) and (iii) indicate that this association holdstrue also along the temporal domain as depicted by event-by-eventassociations shown in Figs. 5 and 6. The correlation maps of event-by-event shape variability (point ii) indicate that, only in fronto-centralareas, the recruitment of neural population synchronously involvedin SSO behavior seems to be promoted by the amount of precedingsigma activity. Accordingly, the results regarding event-by-eventspreading variability (point iii) indicate that SSOs preferably spreadswithin areas with the highest sigma activity in the baseline. The choiceof homologous electrodes as a “control ensemble” is appropriate sincethe sigma activity detected by EEG is expression of the matrix thalamic
ntaneous Sleep SlowOscillations in human sleep: The role of the sigma2015.05.006
UNCO
RRECTED P
RO
OF
493
494
495
496
497
498
499
500
501
502
503
504
505
506
507
508
509
510
Fig. 3. Examples of the EEG traceswith SSO. For each of the three example of EEG traces containing isolated and full-fledged SSOs (panels A, B, C), the lower row shows the raw signal from4 s before the negative peak of the SSO to 2.5 s after it. The three1 s' baselinewindows are defined fromminus4 s tominus 1 s (B3, B2, B1); the up state is defined from0.2 s to 1.2 s from thenegative peak (centered on 0). Themiddle row shows the amplitude of sigma (σ) power in time, in the 12–18 Hz interval, estimated accordingwith the specifications in theMaterials andmethods section. The four spectrograms in the upper row show the power spectrum distributions of the 3 baselines and of the upstate. Panel A shows a long-lasting spindle in the upstatepreceded by not spindle-like sigma activity in the baselines. Panel B shows a full-fledged spindle in the upstate preceded by not spindle-like sigma activity in the baselines. Panel C shows aspindle-like sigma activity both in the upstate in the baselines. Only spectrograms of the up states clearly show a peak within the sigma band (~15 Hz).
6 D. Menicucci et al. / International Journal of Psychophysiology xxx (2015) xxx–xxx
system, which is diffuse, and does not show any lateralization (Dehghaniet al., 2010; Bonjean et al., 2012). The aforementioned results lead us toconjecture that sigma-activity patterns emerge out of the backgroundactivity paving the way to the traveling of SSO.
What is the peculiarity of sigma activity preceding the down state?In humans someworks have identified a bumpof sigma activity preced-ing the down state (Menicucci et al., 2013; Piantoni et al., 2013b). Asshown in healthy adults (Menicucci et al., 2013, Fig. 3) and in healthychildren (Piantoni et al., 2013b, Fig. 1), the falling in down state is
Please cite this article as:Menicucci, D., et al., Looking for a precursor of spoactivity, Int. J. Psychophysiol. (2015), http://dx.doi.org/10.1016/j.ijpsycho.
preceded by an increase of sigma and gamma activity. In the sameframework Laurino et al. (2014) have recently demonstrated that theearly positive deflection preceding an evoked down state can be consid-ered as a wake-like traveling excitation.We infer that this early positivebump is able to trigger activity-dependent K+ channels (Frohlich et al.,2006; Sanchez-Vives et al., 2010) in cortical areas with higher prone-ness to bistability via a thalamic interplay. In this light, baseline sigmaactivity could cluster excitatory activities facilitating cortical neuronsto transit from a wake-like activity to down state; namely, the sigma
ntaneous Sleep SlowOscillations in human sleep: The role of the sigma2015.05.006
UNCO
RRECT
511
512
513
514
515
516
517
518
519
520
521
522
523
524
525
526
527
528
529
530
531
532
533
534
535
536
537
538
539
540
541
542
543
544
545
546
547
548
549
550
551
552
553Q6
554
555
556
557
558
559
560
561
562
563
564
565
566
567
568
569
570
571
Fig. 4. Scalp distribution of sigma activity and of SSO features. On the top (first column,first row) the group-average topographic plots of sigma power during the B1 baseline,and on bottom (first column, fifth row) the topographic plot of the high alpha activity es-timated during the relaxed wakefulness, recorded before sleep. Second, third and forthrows contain two graphics each: the topographic plot of a feature of the isolated SSOevents, on the right (second column) and, on the left (first column) the scatterplots ofsigma power versus the corresponding SSO feature. The second row refers to the SSO de-tection rate, the third one to the SSO amplitude, and the forth to slope 1. Solid circles showthe significant correlation between the average level (over the events) of sigma powerunder an electrode and the corresponding average of each SSO parameter. Open trianglesshow the non-significant correlation between sigma power and high alpha activity (seetext for details).
t1:1Table 1t1:2Correlations between baseline sigma activity and morphological features of the followingt1:3SSO.
t1:4NP amplitude Detections rate Slope 1
t1:5WAKEa 0.2745 0.1004 0.4383t1:6B3 0.8402b 0.7186b 0.9005b
t1:7B2 0.8784b 0.7645b 0.9190b
t1:8B1 0.8738b 0.8000b 0.9292b
t1:9a Correlations with high alpha power during relaxed wakefulness.t1:10b Marks correlation values above the 50 Hz threshold.
7D. Menicucci et al. / International Journal of Psychophysiology xxx (2015) xxx–xxx
activity could favor the positive bump preceding the SSO downstate(Menicucci et al., 2013). The positive deflection preceding spontaneousdown states seems to play the same role of P200 in evoked K complexes(Laurino et al., 2014).
As a synthesis, the positive deflection with a bump of wake-likeactivity is favored by background oscillatory activity in sigma band.
Please cite this article as:Menicucci, D., et al., Looking for a precursor of spoactivity, Int. J. Psychophysiol. (2015), http://dx.doi.org/10.1016/j.ijpsycho.
ED P
RO
OF
This scenario can be thought as a process composed of two phases: athalamic preparation phase visible in the baseline (sigma activity) andan emerging cortical phase (early positive bump).
The thalamic preparation phase is associated with excitatory inputsfrom thalamo-cortical cells onto dendrites of pyramidal neurons, openingthe door to subsequent integrated cortical network activities (Sejnowskiand Destexhe, 2000) in the form of the early positive bump. This happenswith higher probability for those cortical circuits that have been synapti-cally upscaled duringwakefulness (Feinberg and Campbell, 2010; Tononiand Cirelli, 2014). As a final outcome, the opening of K+ channels(i.e. downstate), favored by gamma activity of the early positivebump, prevents any further integration.
The last result that sigma activity stands out along the SSO corticaltravel, can thus be interpreted in the light of what we have said. Inother words we were able, event by event, to topologically associatethe excitatory phase to a preceding thalamic preparatory phase. Wepropose that the SSO spreading results from the complex and topologi-cal interplay between synaptically cortical upscaled circuits and thalam-ic sigma slow fluctuations. Still, the irregular and always changingspreading of SSO events remains to be understood and explained.
Its variability may be connected to the infraslow oscillations (0.02–0.2 Hz), whose phase has been shown to affect the spontaneous occur-rence of both K-complexes and fast-rhythm bumps and that mightrepresent the electrophysiological background scenario linking sigmaand SSO (Vanhatalo et al., 2004, 2005). Infraslow oscillations as a latentfactor contributing to the cortical proneness would be fast enough tomodulate excitability between consecutive isolated SSOs, and at thesame time slow enough to be invariant during the three baselines B1,B2 and B3. At present, the nature of infraslow oscillation remainselusive. Some studies indicate that they are a typical feature of the thala-mus, since have been recorded in slices of thalamic relay nuclei, hypothet-ically related to some long-lasting and slow propagating hyperpolarizingpotentials (see Hughes et al., 2011 for a review). We cannot exclude thatslow changes of cortical excitability during sleep could be also driven bythe activity of brainstem structures or nuclei such as the GABAergicparafacial zone (Anaclet et al., 2014) and some cholinergic nuclei(Steriade et al., 1993c; Steriade, 2004; Valencia et al., 2013).
It has been suggested that the periodicity of the time scales ofinfraslow oscillations, regardless of their origin, yields a peculiar EEGpattern called Cyclic Alternating Pattern (CAP) (Parrino et al., 2006).We have previously (Menicucci et al., 2013) described the isolatedSSO as one of the atomic structures of A1 sub-types of CAP, that is thetime domain in which arousal events are grouped during sleep withthe same dynamics of infraslow oscillations (Parrino et al., 2006). Theisolated SSO could represent a borderline case of CAP in which theduration of the A phase is limited to a single slow wave. In this view,the early excitation initiating spontaneous SSOs would correspond toa microarousal and the following downstate to an anti-arousal swing,both “weaved into the texture of sleep taking part in the regulation ofthe sleep process” (Halász et al., 2004; Ferri et al., 2006). The linkbetween SSO and anticipatory thalamo-cortical entrainment suggestsa physiological basis of the alternation between A (activation) and B(deactivation) phases of the CAP (Terzano and Parrino, 1993): increasedcortical activity forced by the thalamic entrainment could favor thebistability.
ntaneous Sleep SlowOscillations in human sleep: The role of the sigma2015.05.006
T
OO
F
572
573
574
575
576
577
578
579
580
581
582
583
584
585
586
587
588
589
590
591
592
593Q7
594
595
596
597
Fig. 5. Event-by-event variability of SSO amplitude parallels event-by-event variability of sigma expression. Eachmap plots the r-values of correlation coefficients between SSO amplitudeand sigma expression calculated for each electrode. The three maps correspond to the three baseline windows B3, B2, B1. Figure shows that SSO amplitude of each event is predicted bybaseline sigma activity in the fronto-central areas.
8 D. Menicucci et al. / International Journal of Psychophysiology xxx (2015) xxx–xxx
CIn conclusion, the present study demonstrates the importance of
ongoing cortical activity in the generation and propagation of the SSO.In particular, sigma activity, which mostly represents the corticalexpression of the thalamo-cortical entrainment in sleeping brains, sculptsstructure, mapping and dynamics of full-fledged SSOs. Herein we havedemonstrated these relationships in the first sleep cycle when the slowoscillations have their maximal expression due to the homeostatic pres-sure related to previous wakefulness activities (Riedner et al., 2007). Onthe contrary, spindle density exhibits a minimum in the first cycle andshows a linear increase across consecutive NREM episodes suggestingan inverse relation with the time course of SSOs (De Gennaro et al.,2000). According with the present results of sigma activity as a precursorof SSOs, we can hypothesize that sigma activity could be even morenecessary for sustaining the proneness to bistability with the fading ofthe wake-related homeostatic pressure occurring after the first sleep
UNCO
RRE 598
599
600
601602603604605606607608609610611612613614615616617618619620621622623624625626627628629630
Fig. 6. SSO spreading is influenced by the amount of baseline sigma activity. The box plotshows the differences between baseline (B1, B2 and B3) sigma power estimated over eachevent spreading and that estimated at the same time over the related homologouselectrodes, which are spared by the SSO travel. Differences are averaged over SSO events.Box plot description: the central mark is themedian, the edges of the box are the 25th and75th percentiles, the whiskers extend to the most extreme data points not consideredoutliers; ** p b 0.01, FDR corrected.
Please cite this article as:Menicucci, D., et al., Looking for a precursor of spoactivity, Int. J. Psychophysiol. (2015), http://dx.doi.org/10.1016/j.ijpsycho.
ED P
Rcycle: We will investigate this putative relation with future long-termrecordings.
We believe that understanding the role of alternating bistable eventssuch as the SSOs and stable thalamo-cortical entrainment can shed lighton the adaptive properties of the sleeping brain and provide insight intothe pathomechanisms of sleep disturbances.
5. Uncited references
Allegrini et al., 2013Massimini et al., 2005Mölle et al., 2009
Acknowledgments
The work was partially granted by the University of Pisa and by theECSPLAIN-FP7-IDEAS-ERC-ref.338866.
References
Allegrini, P., Paradisi, P., Menicucci, D., Laurino, M., Bedini, R., Piarulli, A., Gemignani, A.,2013. Sleep unconsciousness and breakdown of serial critical intermittency: newvistas on the global workspace. Chaos, Solitons Fractals 55, 32–43.
Amzica, F., Steriade, M., 1998. Electrophysiological correlates of sleep delta waves.Electroencephalogr. Clin. Neurophysiol. 107, 69–83.
Anaclet, C., Ferrari, L., Arrigoni, E., Bass, C.E., Saper, C.B., Lu, J., Fuller, P.M., 2014. TheGABAergic parafacial zone is a medullary slow wave sleep-promoting center. Nat.Neurosci. 17, 1217–1224.
Ayoub, A., Aumann, D., Hörschelmann, A., Kouchekmanesch, A., Paul, P., Born, J., Marshall,L., 2013. Differential effects on fast and slow spindle activity, and the sleep slowoscillation in humans with carbamazepine and flunarizine to antagonize voltage-dependent Na + and Ca2+ channel activity. Sleep 36, 905–911.
Benjamini, Y., Yekutieli, D., 2001. The control of false discovery rate in multiple testingunder dependency. Ann. Stat. 29 (4), 1165–1188.
Bonjean, M., Baker, T., Lemieux, M., Timofeev, I., Sejnowski, T., Bazhenov, M., 2011.Corticothalamic feedback controls sleep spindle duration in vivo. J. Neurosci. 31,9124–9134.
Bonjean, M., Baker, T., Bazhenov, M., Cash, S., Halgren, E., Sejnowski, T., 2012. Interactionsbetween core and matrix thalamocortical projections in human sleep spindle synchro-nization. J. Neurosci. 32 (15), 5250–5263.
Carrier, J., Land, S., Buysse, D.J., Kupfer, D.J., Monk, T.H., 2001. The effects of age and genderon sleep EEG power spectral density in the middle years of life (ages 20–60 yearsold). Psychophysiology 38, 232–242.
Chauvette, S., Volgushev, M., Timofeev, I., 2010. Origin of active states in local neocorticalnetworks during slow sleep oscillation. Cereb. Cortex 20, 2660–2674.
Compte, A., Sanchez-Vives, M.V., McCormick, D.A., Wang, X.J., 2003. Cellular and networkmechanisms of slow oscillatory activity (b1 Hz) and wave propagations in a corticalnetwork model. J. Neurophysiol. 89, 2707–2725.
Contreras, D., Steriade, M., 1996. Spindle oscillation in cats: the role of corticothalamicfeedback in a thalamically generated rhythm. J. Physiol. 490, 159–179.
ntaneous Sleep SlowOscillations in human sleep: The role of the sigma2015.05.006
T
631632633634635636637638639640641642643644645646647648649650651652653654655656657658659660661662663664665666667668669670671672673674675676677678679680681682683684685686687688689690691692693694695696697698699700701702703704705706707708709710
711712713714715716717718719720721722723724725726727728729730731732733734735736737738739740741742743744745746747748749750751752753754755756757758759760761762763764765766767768769770771772773774775776777778779780781782783784785
786
9D. Menicucci et al. / International Journal of Psychophysiology xxx (2015) xxx–xxx
UNCO
RREC
Contreras, D., Timofeev, I., Steriade, M., 1996a. Mechanisms of long-lasting hyperpolariza-tions underlying slow sleep oscillations in cat corticothalamic networks. J. Physiol.494, 251–264.
Contreras, D., Destexhe, A., Sejnowski, T.J., Steriade, M., 1996b. Control of spatiotemporalcoherence of a thalamic oscillation by corticothalamic feedback. Science 274,771–774.
Contreras, D., Destexhe, A., Sejnowski, T.J., Steriade, M., 1997. Spatiotemporal patterns ofspindle oscillations in cortex and thalamus. J. Neurosci. 17, 1179–1196.
Crunelli, V., Hughes, S.W., 2010. The slow (b1 Hz) rhythm of non-REM sleep: a dialoguebetween three cardinal oscillators. Nat. Neurosci. 13 (1), 9–17.
David, F., Schmiedt, J.T., Taylor, H.L., Orban, G., Di Giovanni, G., Uebele, V.N., Renger, J.J.,Lambert, R.C., Leresche, N., Crunelli, V., 2013. Essential thalamic contribution toslow waves of natural sleep. J. Neurosci. 33 (50), 19599–19610.
De Gennaro, L., Ferrara, M., 2003. Sleep spindles: an overview. Sleep Med. Rev. 7 (5),423–440.
De Gennaro, L., Ferrara, M., Bertini, M., 2000. Topographical distribution of spindles:variations between and within NREM sleep cycles. Sleep Res. Online 3, 155–160.
Dehghani, N., Cash, S.S., Chen, C.C., Hagler, D.J., Huang, M., Dale, A.M., Halgren, E., 2010.Divergent cortical generators ofMEG andEEGduring human sleep spindles suggestedby distributed source modeling. PLoS One 5 (7), e11454.
Doran, S., 2003. The dynamic topography of individual sleep spindles. Sleep Res. Online 5,133–139.
Esser, S.K., Hill, S.L., Tononi, G., 2007. Sleep homeostasis and cortical synchroniza-tion: I. Modeling the effects of synaptic strength on sleep slow waves. Sleep 30(12), 1617–1630.
Feinberg, I., Campbell, I.G., 2010. Cerebral metabolism and sleep homeostasis: a commenton Vyazovskiy et al. Brain Res. Bull. 81 (1), 1–2.
Ferri, R., Bruni, O., Miano, S., Plazzi, G., Spruyt, K., Gozal, D., Terzano, M.G., 2006. The timestructure of the cyclic alternating pattern during sleep. Sleep 29, 693–699.
Frohlich, F., Bazhenov, M., Timofeev, I., Steriade, M., Sejnowski, T.J., 2006. Slow state tran-sitions of sustained neural oscillations by activity-dependent modulation of intrinsicexcitability. J. Neurosci. 26 (23), 6153–6162.
Fuentealba, P., Steriade, M., 2005. The reticular nucleus revisited: intrinsic and networkproperties of a thalamic pacemaker. Prog. Neurobiol. 75 (2), 125–141.
Gemignani, A., Laurino, M., Provini, F., Piarulli, A., Barletta, G., d'Ascanio, P., Bedini, R., Lodi,R., Manners, D.N., Allegrini, P., Menicucci, D., Cortelli, P., 2012. Thalamic contributionto Sleep Slow Oscillation features in humans: a single case cross sectional EEG studyin Fatal Familial Insomnia. Sleep Med. 13 (7), 946–952.
Halász, P., Terzano, M., Parrino, L., Bódizs, R., 2004. The nature of arousal in sleep. J. SleepRes. 13, 1–23.
Hill, S., Tononi, G., 2005. Modeling sleep and wakefulness in the thalamocortical system.J. Neurophysiol. 93 (3), 1671–1698.
Hirata, A., Castro-Alamancos, M.A., 2010. Neocortex network activation and deactivationstates controlled by the thalamus. 103 (3), 1147–1157.
Hughes, S.W., Crunelli, V., 2005. Thalamic mechanisms of EEG alpha rhythms and theirpathological implications. Neuroscientist 11 (4), 357–372.
Hughes, S.W., Crunelli, V., 2007. Just a phase they're going through: the complex interactionof intrinsic high-threshold bursting andgap junctions in the generation of thalamic alphaand theta rhythms. Int. J. Psychophysiol. 64, 3–17.
Hughes, S.W., Lorincz, M.L., Parri, H.R., Crunelli, V., 2011. Infraslow (b0.1 Hz) oscillationsin thalamic relay nuclei basic mechanisms and significance to health and diseasestates. Prog. Brain Res. 193, 145–162.
Iber, C., Ancoli-Israel, S., Chesson, A., Quan, S.F., 2007. The AASMManual for the Scoring ofSleep and Associated Events: Rules, Terminology and Technical Specifications.American Academy of Sleep Medicine, Westchester, IL.
James, C.J., Gibson, O.J., 2003. Temporally constrained ICA: an application to artifact rejectionin electromagnetic brain signal analysis. IEEE Trans. Biomed. Eng. 50, 1108–1116.
Klimesch,W., 1999. EEG alpha and theta oscillations reflect cognitive andmemory perfor-mance: a review and analysis. Brain Res. Rev. 29, 169–195.
Laurino, M., Menicucci, D., Piarulli, A., Mastorci, F., Bedini, R., Allegrini, P., Gemignani, A.,2014. Disentangling different functional roles of evoked K-complex components:mapping the sleeping brain while quenching sensory processing. NeuroImage 86,433–445.
Marini, G., Gritti, I., Mancia, M., 1989. Changes in EEG spindle activity induced by ibotenicacid lesions of medialis dorsalis thalamic nuclei in the cat. Brain Res. 500, 395–399.
Massimini, M., Huber, R., Ferrarelli, F., Hill, S., Tononi, G., 2004. The sleep slow oscillationas a traveling wave. J. Neurosci. 24, 6862–6870.
Massimini, M., Ferrarelli, F., Huber, R., Esser, S.K., Singh, H., Tononi, G., 2005. Breakdown ofcortical effective connectivity during sleep. Science 309 (5744), 2228–2232.
Menicucci, D., Piarulli, A., Debarnot, U., d'Ascanio, P., Landi, A., Gemignani, A., 2009. Function-al structure of spontaneous sleep slow oscillation activity in humans. PLoS One 4, e7601.
Menicucci, D., Piarulli, A., Allegrini, P., Laurino, M., Mastorci, F., Sebastiani, L., Bedini, R.,Gemignani, A., 2013. Fragments of wake-like activity frame down-states of sleepslow oscillations in humans: new vistas for studying homeostatic processes duringsleep. Int. J. Psychophysiol. 89, 151–157.
Mölle, M., Marshall, L., Gais, S., Born, J., 2002. Grouping of spindle activity during slowoscillations in human non-rapid eye movement sleep. J. Neurosci. 22, 10941–10947.
Mölle, M., Eschenko, O., Gais, S., Sara, S.J., Born, J., 2009. The influence of learning onsleep slow oscillations and associated spindles and ripples in humans and rats.Eur. J. Neurosci. 29, 1071–1081.
Please cite this article as:Menicucci, D., et al., Looking for a precursor of spoactivity, Int. J. Psychophysiol. (2015), http://dx.doi.org/10.1016/j.ijpsycho.
ED P
RO
OF
Montagna, P., Provini, F., Plazzi, G., Vetrugno, R., Gallassi, R., Pierangeli, G., Ragno, M., Cortelli,P., Perani, D., 2002. Bilateral paramedian thalamic syndrome: abnormal circadianwake–sleep and autonomic functions. J. Neurol. Neurosurg. Psychiatry 73, 772–774.
Montagna, P., Gambetti, P., Cortelli, P., Lugaresi, E., 2003. Familial and sporadic fatal insomnia.Lancet Neurol. 2, 167–176.
Parrino, L., Halasz, P., Tassinari, C.A., Terzano, M.G., 2006. CAP, epilepsy and motor eventsduring sleep: the unifying role of arousal. Sleep Med. Rev. 10, 267–285.
Piantoni, G., Poil, S., Linkenkaer-Hansen, K., Verweij, I.M., Ramautar, J.R., Van Someren,E.J.W., Van Der Werf, Y.D., 2013a. Individual differences in white matter diffusionaffect sleep oscillations. J. Neurosci. 33, 227–233.
Piantoni, G., Astill, R.G., Raymann, R.J.E.M., Vis, J.C., Coppens, J.E., Van Someren, E.J.W.,2013b. Modulation of gamma and spindle-range power by slow oscillations in scalpsleep EEG of children. Int. J. Psychophysiol. 89, 252–258.
Piarulli, A., Menicucci, D., Gemignani, A., Olcese, U., d'Ascanio, P., Pingitore, A., Bedini, R.,Landi, A., 2010. Likeness-based detection of sleep slow oscillations in normal andaltered sleep conditions: application on low-density EEG recordings. IEEE Trans.Biomed. Eng. 57, 363–372.
Riedner, B.A., Vyazovskiy, V.V., Huber, R., Massimini, M., Esser, S.K., Murphy, M., Tononi,G., 2007. Sleep homeostasis and cortical synchronization: III. A high-density EEGstudy of sleep slow waves in humans. Sleep 30, 1643–1657.
Rigas, P., Castro-Alamancos, M.A., 2007. Thalamocortical Up states: differential effectsof intrinsic and extrinsic cortical inputs on persistent activity. J. Neurosci. 27 (16),4261–4272.
Sanchez-Vives, M.V., Mattia, M., Compte, A., Perez-Zabalza, M., Winograd, M., Descalzo,V.F., Reig, R., 2010. Inhibitory modulation of cortical up states. J. Neurophysiol. 104,1314–1324.
Santamaria, J., Pujol, M., Orteu, N., Solanas, A., Cardenal, C., Santacruz, P., Chimeno, E.,Moon, P., 2000. Unilateral thalamic stroke does not decrease ipsilateral sleep spindles.Sleep 23, 333–339.
Sejnowski, T.J., Destexhe, A., 2000. Why do we sleep? Brain Res. 886, 208–223.Shu, Y., Hasenstaub, A., McCormick, D.A., 2003. Turning on and off recurrent balanced
cortical activity. Nature 423, 288–293.Steriade, M., 2000. Corticothalamic resonance, states of vigilance and mentation.
Neuroscience 101, 243–276.Steriade, M., 2004. Acetylcholine systems and rhythmic activities during thewaking-sleep
cycle. Prog. Brain Res. 145, 179–196.Steriade, M., 2006. Grouping of brain rhythms in corticothalamic systems. Neuroscience
137, 1087–1106.Steriade, M., Deschenes, M., 1984. The thalamus as a neuronal oscillator. Brain Res. 320,
1–63.Steriade, M., Nuñez, A., Amzica, F., 1993a. A novel slow (b1 Hz) oscillation of neocortical
neurons in vivo: depolarizing and hyperpolarizing components. J. Neurosci. 13,3252–3265.
Steriade, M., Contreras, D., Curró Dossi, R., Nuñez, A., 1993b. The slow (b1 Hz) oscillationin reticular thalamic and thalamocortical neurons: scenario of sleep rhythm genera-tion in interacting thalamic and neocortical networks. J. Neurosci. 13, 3284–3299.
Steriade, M., Amzica, F., Nunez, A., 1993c. Cholinergic and noradrenergic modulationof the slow (approximately 0.3 Hz) oscillation in neocortical cells. J. Neurophysiol.70 (4), 1385–1400.
Terzano, M.G., Parrino, L., 1993. Clinical applications of cyclic alternating pattern. Physiol.Behav. 54, 807–813.
Timofeev, I., Chauvette, S., 2011. Thalamocortical oscillations: local control of EEG slowwaves. Curr. Top. Med. Chem. 11, 2457–2471.
Timofeev, I., Chauvette, S., 2013. The spindles: are they still thalamic? Sleep 36, 825.Timofeev, I., Grenier, F., Bazhenov, M., Sejnowski, T.J., Steriade, M., 2000. Origin of slow
cortical oscillations in deafferented cortical slabs. Cereb. Cortex 10 (12), 1185–1199.Tononi, G., Cirelli, C., 2014. Sleep and the price of plasticity: from synaptic and cellular
homeostasis to memory consolidation and integration. Neuron 81 (1), 12–34.Vanhatalo, S., Palva, J.M., Holmes, M.D., Miller, J.W., Voipio, J., Kaila, K., 2004. Infraslow
oscillations modulate excitability and interictal epileptic activity in the human cortexduring sleep. Proc. Natl. Acad. Sci. U. S. A. 101, 5053–5057.
Vanhatalo, S., Voipio, J., Kaila, K., 2005. Full-band EEG (FbEEG): an emerging standard inelectroencephalography. Clin. Neurophysiol. 116, 1–8.
Vijayan, S., Kopell, N.J., 2012. Thalamicmodel of awake alpha oscillations and implicationsfor stimulus processing. Proc. Natl. Acad. Sci. U. S. A. 109 (45), 18553–18558.
Vyazovskiy, V.V., Riedner, B.A., Cirelli, C., Tononi, G., 2007. Sleep homeostasis and corticalsynchronization: II. A local field potential study of sleep slow waves in the rat. Sleep30 (12), 1631–1642.
Vyazovskiy, V.V., Olcese, U., Lazimy, Y.M., Faraguna, U., Esser, S.K., Williams, J.C., Cirelli, C.,Tononi, G., 2009. Cortical firing and sleep homeostasis. Neuron 63, 865–878.
Wester, J.C., Contreras, D., 2013. Generating waves in corticothalamocortical networks.Neuron 77 (6), 995–997.
Wilson, M.T., Steyn-Ross, D.A., Sleigh, J.W., Steyn-Ross, M.L., Wilcocks, L.C., Gillies, I.P.,2006. The K-complex and slow oscillation in terms of a mean-field cortical model.J. Comput. Neurosci. 21, 243–257.
ntaneous Sleep SlowOscillations in human sleep: The role of the sigma2015.05.006