Long-time low-impact ball milling of multi-wall carbon nanotubes
7
Long-time low-impact ball milling of multi-wall carbon nanotubes A ´ kos Kukovecz, Tı ´mea Kanyo ´, Zolta ´n Ko ´nya * , Imre Kiricsi Department of Applied and Environmental Chemistry, University of Szeged, H-6720 Szeged, Rerrich Be ´la te ´r 1, Hungary Received 5 July 2004; accepted 18 November 2004 Available online 6 January 2005 Abstract A systematic study on the morphological changes experienced by multi-wall carbon nanotubes during long-time ball milling in a vibrating mill was performed. Samples were collected in the time interval 0–200 h and analyzed with TEM and N 2 adsorption. The change of the mean nanotube length with time could be approximated with a second-order exponential decay function. The length distribution function changed from the original log-normal to normal after 140 h of milling. Specific surface area, surface fractal dimension, the dimension of the capillary condensation and the pore size distribution (PSD) curve were calculated from the N 2 adsorption isotherms. These morphological descriptors all experienced characteristic changes after 40 h of milling: the specific sur- face area decreased, the fractal dimension increased and the maximum of the PSD curve shifted downwards by 0.5 nm. Results indicate that ball milling of carbon nanotubes is a rather complex process and that it can cause several morphological changes to samples besides the well-known cutting effect. Ó 2004 Elsevier Ltd. All rights reserved. Keywords: Carbon nanotubes; Grinding; Adsorption, electron microscopy; Fracture 1. Introduction Multi-wall carbon nanotubes (MWCNTs) can be produced economically using the catalytic chemical vapor deposition (CCVD) method in quantities exceed- ing the capabilities of contemporary state-of-the-art sin- gle-wall carbon nanotube (SWCNT) synthesis techniques [1,2] by at least one order of magnitude. Therefore, many material-demanding applications of carbon nano- tubes (e.g. polymer reinforcement) use MWCNTs [3] and information concerning the tailoring [4] of nano- tube properties is highly sought after by the community [5,6]. Variants of the ball milling process have been previ- ously applied to modify the length [7,8], particle size dis- tribution [9], hydrogen adsorption properties [10] and lithium intercalation capacity [11] of carbon nanotubes as well as to perform carbon nanoparticle synthesis [12]. We have recently analyzed potential MWCNT ball milling cleavage mechanisms on the basis of HRTEM (High Resolution Transmission Electron Microscopy) tube end morphology observations [13]. Most of these studies utilized high impact mills and witnessed important changes in nanotube morphology within 24 h, even when the milling experiment itself was contin- ued longer. In the present study we take a different ap- proach and survey the possibilities of using a low impact vibrating mill for a longer time. In addition to TEM analysis we also carried out N 2 adsorption mea- surements and analyzed the obtained isotherms with respect to morphological descriptors like surface frac- tal dimension and the dimension of the capillary con- densation. To our best knowledge this is the first report in the literature establishing a relationship be- tween nanotube ball milling times and detailed N 2 adsorption characteristics. Carbon 43 (2005) 994–1000 www.elsevier.com/locate/carbon 0008-6223/$ - see front matter Ó 2004 Elsevier Ltd. All rights reserved. doi:10.1016/j.carbon.2004.11.030 * Corresponding author. Tel.: +36 62 544 620; fax: +36 62 544 619. E-mail address: [email protected] (Z. Ko ´ nya).
Transcript of Long-time low-impact ball milling of multi-wall carbon nanotubes
Carbon 43 (2005) 994–1000
www.elsevier.com/locate/carbon
Long-time low-impact ball milling of multi-wall carbon nanotubes
Akos Kukovecz, Tımea Kanyo, Zoltan Konya *, Imre Kiricsi
Department of Applied and Environmental Chemistry, University of Szeged, H-6720 Szeged, Rerrich Bela ter 1, Hungary
Received 5 July 2004; accepted 18 November 2004
Available online 6 January 2005
Abstract
A systematic study on the morphological changes experienced by multi-wall carbon nanotubes during long-time ball milling in a
vibrating mill was performed. Samples were collected in the time interval 0–200 h and analyzed with TEM and N2 adsorption. The
change of the mean nanotube length with time could be approximated with a second-order exponential decay function. The length
distribution function changed from the original log-normal to normal after 140 h of milling. Specific surface area, surface fractal
dimension, the dimension of the capillary condensation and the pore size distribution (PSD) curve were calculated from the N2
adsorption isotherms. These morphological descriptors all experienced characteristic changes after �40 h of milling: the specific sur-
face area decreased, the fractal dimension increased and the maximum of the PSD curve shifted downwards by �0.5 nm. Results
indicate that ball milling of carbon nanotubes is a rather complex process and that it can cause several morphological changes
to samples besides the well-known cutting effect.
� 2004 Elsevier Ltd. All rights reserved.
Keywords: Carbon nanotubes; Grinding; Adsorption, electron microscopy; Fracture
1. Introduction
Multi-wall carbon nanotubes (MWCNTs) can beproduced economically using the catalytic chemical
vapor deposition (CCVD) method in quantities exceed-
ing the capabilities of contemporary state-of-the-art sin-
gle-wall carbon nanotube (SWCNT) synthesis techniques
[1,2] by at least one order of magnitude. Therefore,
many material-demanding applications of carbon nano-
tubes (e.g. polymer reinforcement) use MWCNTs [3]
and information concerning the tailoring [4] of nano-tube properties is highly sought after by the community
[5,6].
Variants of the ball milling process have been previ-
ously applied to modify the length [7,8], particle size dis-
tribution [9], hydrogen adsorption properties [10] and
0008-6223/$ - see front matter � 2004 Elsevier Ltd. All rights reserved.
doi:10.1016/j.carbon.2004.11.030
* Corresponding author. Tel.: +36 62 544 620; fax: +36 62 544 619.
E-mail address: [email protected] (Z. Konya).
lithium intercalation capacity [11] of carbon nanotubes
as well as to perform carbon nanoparticle synthesis
[12]. We have recently analyzed potential MWCNT ballmilling cleavage mechanisms on the basis of HRTEM
(High Resolution Transmission Electron Microscopy)
tube end morphology observations [13]. Most of these
studies utilized high impact mills and witnessed
important changes in nanotube morphology within
24 h, even when the milling experiment itself was contin-
ued longer. In the present study we take a different ap-
proach and survey the possibilities of using a lowimpact vibrating mill for a longer time. In addition to
TEM analysis we also carried out N2 adsorption mea-
surements and analyzed the obtained isotherms with
respect to morphological descriptors like surface frac-
tal dimension and the dimension of the capillary con-
densation. To our best knowledge this is the first
report in the literature establishing a relationship be-
tween nanotube ball milling times and detailed N2
adsorption characteristics.
�A. Kukovecz et al. / Carbon 43 (2005) 994–1000 995
2. Experimental
2.1. Carbon nanotube synthesis
Multi-wall carbon nanotubes were synthesized by
CCVD utilizing a method reported previously [14].Briefly, we used a Co-Fe/Al(OH)3 (2.5–2.5 wt.% metal
loading) catalyst prepared by the impregnation of alu-
minum-hydroxide (Aldrich) with aqueous metal-acetate
solution. 5 g catalyst was spread as a 2 mm thin layer on
a quartz boat and placed into a preheated horizontal
tube furnace, then the system was purged with N2
(120 ml/min) for 1 h and finally, the decomposition of
acetylene (20 ml/min in N2) was performed for 1 h at973 K. After the reaction the catalyst support was re-
moved in cc. NaOH, metal particles were dissolved in
cc. HCl and the sample was purified of amorphous car-
bon in 0.1 M H2SO4 containing 0.1 M equivalent (rela-
tive to the amount of carbon) KMnO4.
2.2. Ball milling
Two cylindrical stainless steel drums measuring
9.5 cm · 11 cm (height · diameter) and containing 110–
110 small stainless steel balls were filled with 25 g
MWCNT powder each. The diameter and mass distri-
bution of the balls could be approximated as normal
with parameters mdia = 0.707 cm, rdia = 0.005 cm and
mmass = 1.429 g, rmass = 0.027 g, respectively. Prior to
the milling procedure the drums were heated in flowingN2 at 423 K for 1 h to remove water and adsorbed con-
taminants. The drums were placed into a vibrational
mill horizontally and driven with an eccentric shaft at
50 Hz. Samples were taken from the two drums in an
alternating pattern, 0.5 g at a time, at milling times
0.1, 0.2, 0.5, 1, 2, 5, 10, 20, 40, 60, 80, 100, 120, 140,
170 and 200 h.
2.3. Sample characterization
Transmission Electron Microscope (TEM) images
were recorded on a Phillips CM10 instrument. Diluted
suspensions of the samples in methanol were prepared
and drop-dried on holey carbon coated copper TEM
grids. Several TEM micrographs were recorded for each
sample and analyzed for length and diameter distribu-tion using the ImageJ image analysis software. 100 mea-
surements were taken for each milling time. Nitrogen
adsorption isotherms were measured at 77 K with a
QuantaChrome Nova 2000 surface area analyzer. Sam-
ples were outgassed at 423 K for 1 h to remove adsorbed
contaminants prior to the measurement. The correctness
of using N2 adsorption for the study of porous carbona-
ceous systems was validated by the theoretical work ofCascarini de Torre and Bottani [15]. The specific surface
area (ASBET) was calculated using the multipoint BET
method [16] on six points of the adsorption isotherm
near monolayer coverage. Pore size distribution (PSD)
curves were calculated from the adsorption branch of
the isotherms using the Barrett–Joyner–Halenda (BJH)
method [17]. The adsorption branch was favored over
the desorption branch in order to avoid the tensilestrength effect (TSE) artifact which very often compli-
cates the PSD determination in mesoporous systems
[18]. Surface fractal dimension (DS) was calculated using
the Frenkel–Halsey–Hill (FHH) method [19] from
adsorption data near monolayer coverage [20]. Addi-
tionally, the Neimark–Kiselev method [21] was also uti-
lized to calculate a fractal dimension value from the
capillary condensation region of the adsorption iso-therm (DCC). For a more detailed theoretical treatment
of the interpretation of N2 adsorption isotherms we refer
to the recent works of Ehrburger-Dolle [22] and Terzyk
et al. [23]. It is enough to note here that the main differ-
ence between the conventional BET model of multilayer
adsorption and the fractal FHH model is that the latter
assumes that substrate–adsorbate interactions dominate
over the adsorbate–adsorbate interactions, and are,therefore, non-negligible all the way out to the outer-
most layer of the film.
3. Results and discussion
The most evident macroscopic effect of ball milling
was the fast increase of the apparent sample density.The originally fluffy and thin (qapparent = 0.07 g/cm3)
starting material transformed into a dense black powder
(qapparent = 0.38 g/cm3) after �1 h of milling and kept
this form until the end of the experiment. It is generally
agreed [8] that this thickening is due to the loss of air
trapped within the intertube space of the nanotube
aggregates.
TEM images of the purified MWCNT material be-fore milling as well as after 1, 40, 80, 140 and 200 h
are presented in Fig. 1. It is evident that the nanotube
length decreases with increasing milling time. Moreover,
the entanglement of the tubes is also reduced as the
nanotubes spend more time in the mill. This finding is
in agreement with previous literature observations
[8,10] and is explained by the reduction of the character-
istic nanotube length. The amount of amorphous car-bon and non-nanotube nanoparticles increased steadily
with the grinding time. However, even after 200 h in
the mill (Fig. 1F) the nanotube walls appear to be very
similar to those observed in the beginning of the grind-
ing. Even though previous high-impact milling studies
[10] witnessed a different behavior, the nanotubes milled
for 200 h in the present report appear to be clean-cut
and well separated from the nanoparticles. We attri-bute this beneficial feature to the use of the low-impact
mill.
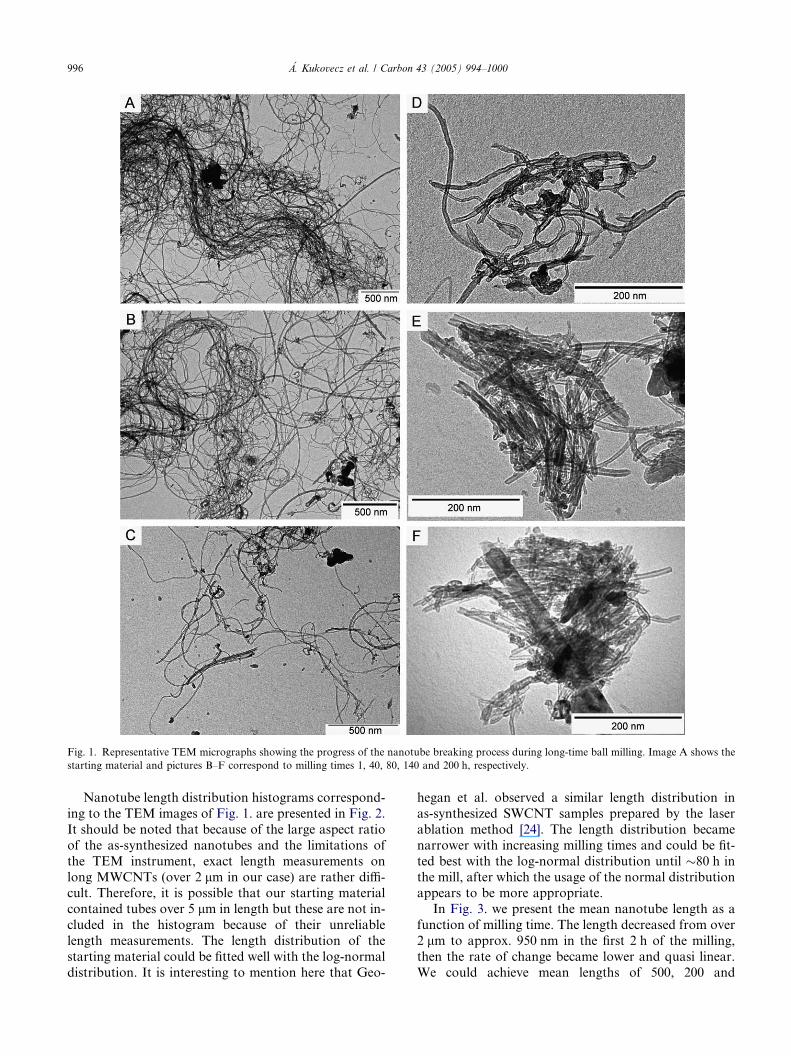
Fig. 1. Representative TEM micrographs showing the progress of the nanotube breaking process during long-time ball milling. Image A shows the
starting material and pictures B–F correspond to milling times 1, 40, 80, 140 and 200 h, respectively.
996 �A. Kukovecz et al. / Carbon 43 (2005) 994–1000
Nanotube length distribution histograms correspond-
ing to the TEM images of Fig. 1. are presented in Fig. 2.
It should be noted that because of the large aspect ratio
of the as-synthesized nanotubes and the limitations of
the TEM instrument, exact length measurements on
long MWCNTs (over 2 lm in our case) are rather diffi-cult. Therefore, it is possible that our starting material
contained tubes over 5 lm in length but these are not in-
cluded in the histogram because of their unreliable
length measurements. The length distribution of the
starting material could be fitted well with the log-normal
distribution. It is interesting to mention here that Geo-
hegan et al. observed a similar length distribution in
as-synthesized SWCNT samples prepared by the laser
ablation method [24]. The length distribution became
narrower with increasing milling times and could be fit-
ted best with the log-normal distribution until �80 h in
the mill, after which the usage of the normal distributionappears to be more appropriate.
In Fig. 3. we present the mean nanotube length as a
function of milling time. The length decreased from over
2 lm to approx. 950 nm in the first 2 h of the milling,
then the rate of change became lower and quasi linear.
We could achieve mean lengths of 500, 200 and
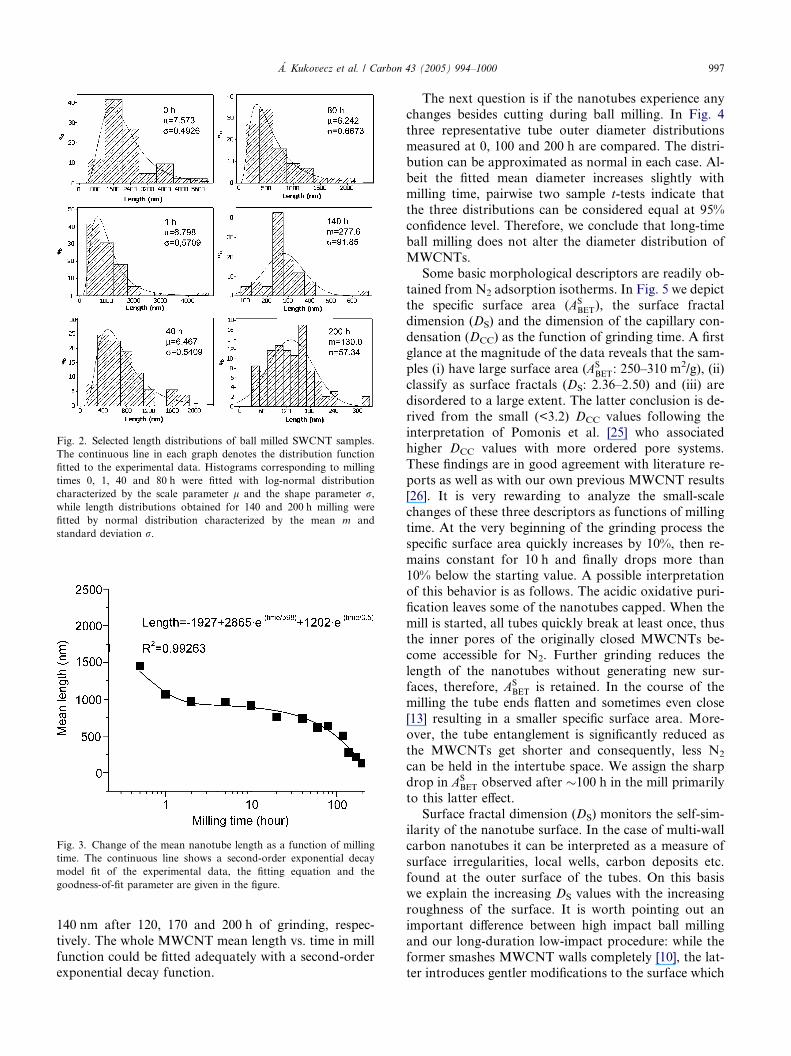
Fig. 2. Selected length distributions of ball milled SWCNT samples.
The continuous line in each graph denotes the distribution function
fitted to the experimental data. Histograms corresponding to milling
times 0, 1, 40 and 80 h were fitted with log-normal distribution
characterized by the scale parameter l and the shape parameter r,while length distributions obtained for 140 and 200 h milling were
fitted by normal distribution characterized by the mean m and
standard deviation r.
Fig. 3. Change of the mean nanotube length as a function of milling
time. The continuous line shows a second-order exponential decay
model fit of the experimental data, the fitting equation and the
goodness-of-fit parameter are given in the figure.
�A. Kukovecz et al. / Carbon 43 (2005) 994–1000 997
140 nm after 120, 170 and 200 h of grinding, respec-
tively. The whole MWCNT mean length vs. time in mill
function could be fitted adequately with a second-orderexponential decay function.
The next question is if the nanotubes experience any
changes besides cutting during ball milling. In Fig. 4
three representative tube outer diameter distributions
measured at 0, 100 and 200 h are compared. The distri-
bution can be approximated as normal in each case. Al-
beit the fitted mean diameter increases slightly withmilling time, pairwise two sample t-tests indicate that
the three distributions can be considered equal at 95%
confidence level. Therefore, we conclude that long-time
ball milling does not alter the diameter distribution of
MWCNTs.
Some basic morphological descriptors are readily ob-
tained from N2 adsorption isotherms. In Fig. 5 we depict
the specific surface area (ASBET), the surface fractal
dimension (DS) and the dimension of the capillary con-
densation (DCC) as the function of grinding time. A first
glance at the magnitude of the data reveals that the sam-
ples (i) have large surface area (ASBET: 250–310 m2/g), (ii)
classify as surface fractals (DS: 2.36–2.50) and (iii) are
disordered to a large extent. The latter conclusion is de-
rived from the small (<3.2) DCC values following the
interpretation of Pomonis et al. [25] who associatedhigher DCC values with more ordered pore systems.
These findings are in good agreement with literature re-
ports as well as with our own previous MWCNT results
[26]. It is very rewarding to analyze the small-scale
changes of these three descriptors as functions of milling
time. At the very beginning of the grinding process the
specific surface area quickly increases by 10%, then re-
mains constant for 10 h and finally drops more than10% below the starting value. A possible interpretation
of this behavior is as follows. The acidic oxidative puri-
fication leaves some of the nanotubes capped. When the
mill is started, all tubes quickly break at least once, thus
the inner pores of the originally closed MWCNTs be-
come accessible for N2. Further grinding reduces the
length of the nanotubes without generating new sur-
faces, therefore, ASBET is retained. In the course of the
milling the tube ends flatten and sometimes even close
[13] resulting in a smaller specific surface area. More-
over, the tube entanglement is significantly reduced as
the MWCNTs get shorter and consequently, less N2
can be held in the intertube space. We assign the sharp
drop in ASBET observed after �100 h in the mill primarily
to this latter effect.
Surface fractal dimension (DS) monitors the self-sim-ilarity of the nanotube surface. In the case of multi-wall
carbon nanotubes it can be interpreted as a measure of
surface irregularities, local wells, carbon deposits etc.
found at the outer surface of the tubes. On this basis
we explain the increasing DS values with the increasing
roughness of the surface. It is worth pointing out an
important difference between high impact ball milling
and our long-duration low-impact procedure: while theformer smashes MWCNT walls completely [10], the lat-
ter introduces gentler modifications to the surface which
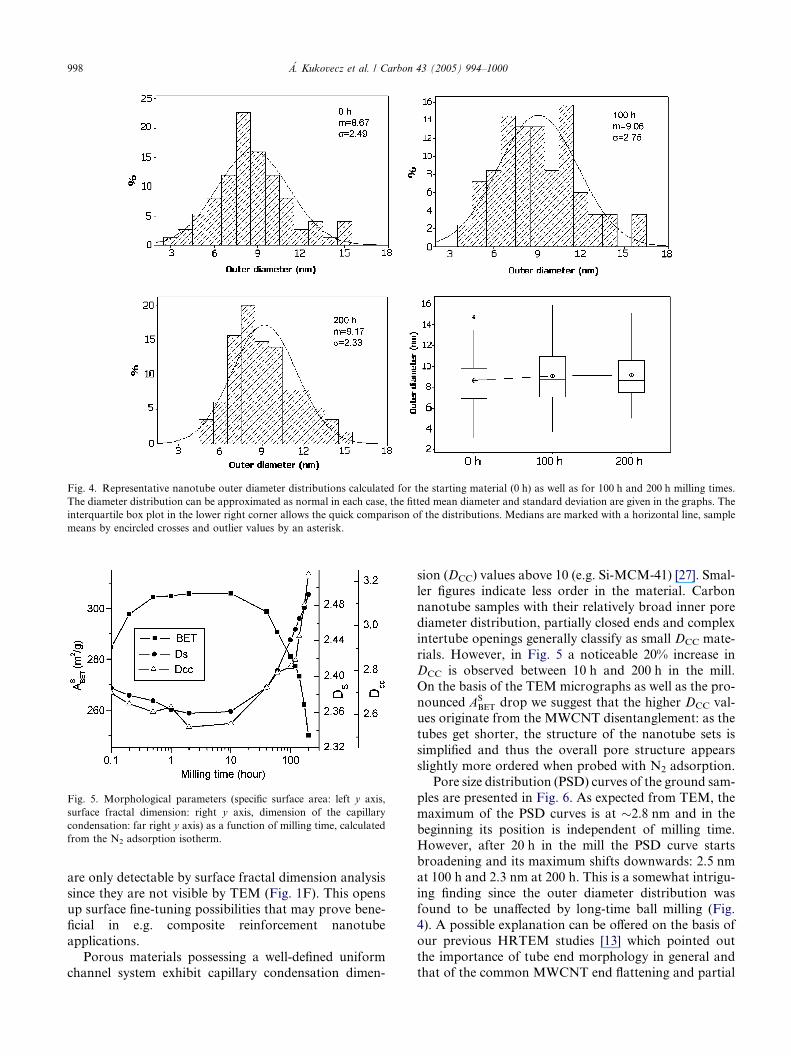
Fig. 4. Representative nanotube outer diameter distributions calculated for the starting material (0 h) as well as for 100 h and 200 h milling times.
The diameter distribution can be approximated as normal in each case, the fitted mean diameter and standard deviation are given in the graphs. The
interquartile box plot in the lower right corner allows the quick comparison of the distributions. Medians are marked with a horizontal line, sample
means by encircled crosses and outlier values by an asterisk.
Fig. 5. Morphological parameters (specific surface area: left y axis,
surface fractal dimension: right y axis, dimension of the capillary
condensation: far right y axis) as a function of milling time, calculated
from the N2 adsorption isotherm.
998 �A. Kukovecz et al. / Carbon 43 (2005) 994–1000
are only detectable by surface fractal dimension analysis
since they are not visible by TEM (Fig. 1F). This opensup surface fine-tuning possibilities that may prove bene-
ficial in e.g. composite reinforcement nanotube
applications.
Porous materials possessing a well-defined uniform
channel system exhibit capillary condensation dimen-
sion (DCC) values above 10 (e.g. Si-MCM-41) [27]. Smal-ler figures indicate less order in the material. Carbon
nanotube samples with their relatively broad inner pore
diameter distribution, partially closed ends and complex
intertube openings generally classify as small DCC mate-
rials. However, in Fig. 5 a noticeable 20% increase in
DCC is observed between 10 h and 200 h in the mill.
On the basis of the TEM micrographs as well as the pro-
nounced ASBET drop we suggest that the higher DCC val-
ues originate from the MWCNT disentanglement: as the
tubes get shorter, the structure of the nanotube sets is
simplified and thus the overall pore structure appears
slightly more ordered when probed with N2 adsorption.
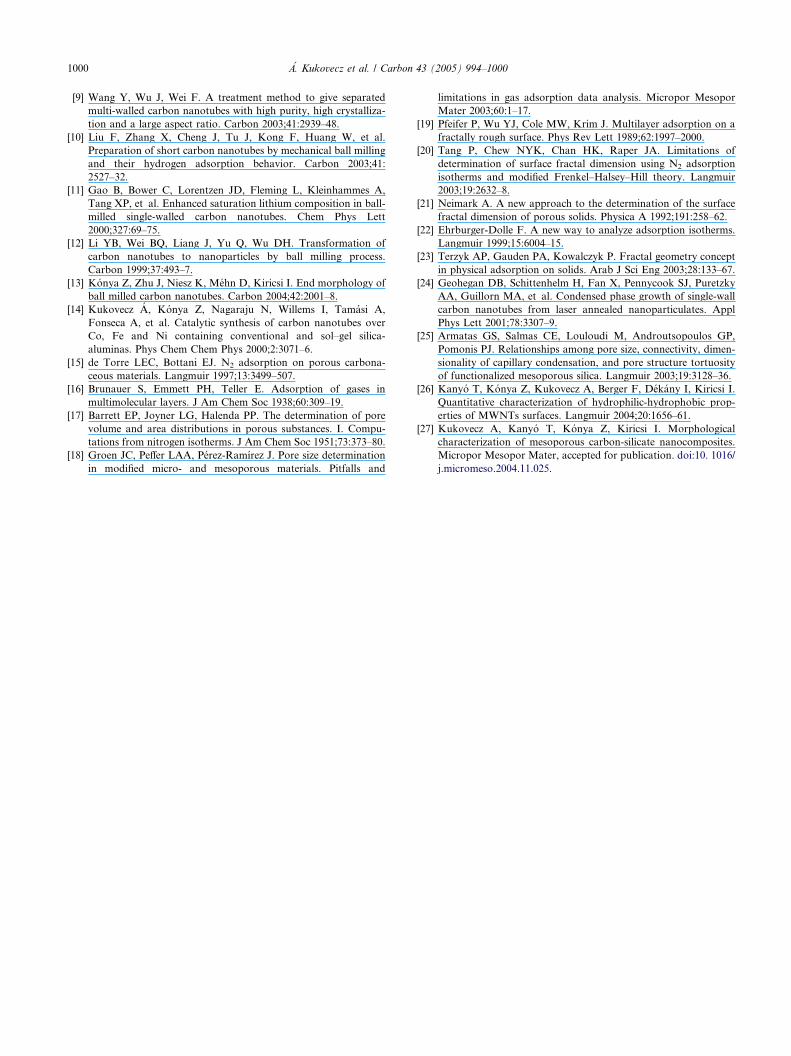
Pore size distribution (PSD) curves of the ground sam-
ples are presented in Fig. 6. As expected from TEM, the
maximum of the PSD curves is at �2.8 nm and in the
beginning its position is independent of milling time.However, after 20 h in the mill the PSD curve starts
broadening and its maximum shifts downwards: 2.5 nm
at 100 h and 2.3 nm at 200 h. This is a somewhat intrigu-
ing finding since the outer diameter distribution was
found to be unaffected by long-time ball milling (Fig.
4). A possible explanation can be offered on the basis of
our previous HRTEM studies [13] which pointed out
the importance of tube end morphology in general andthat of the common MWCNT end flattening and partial
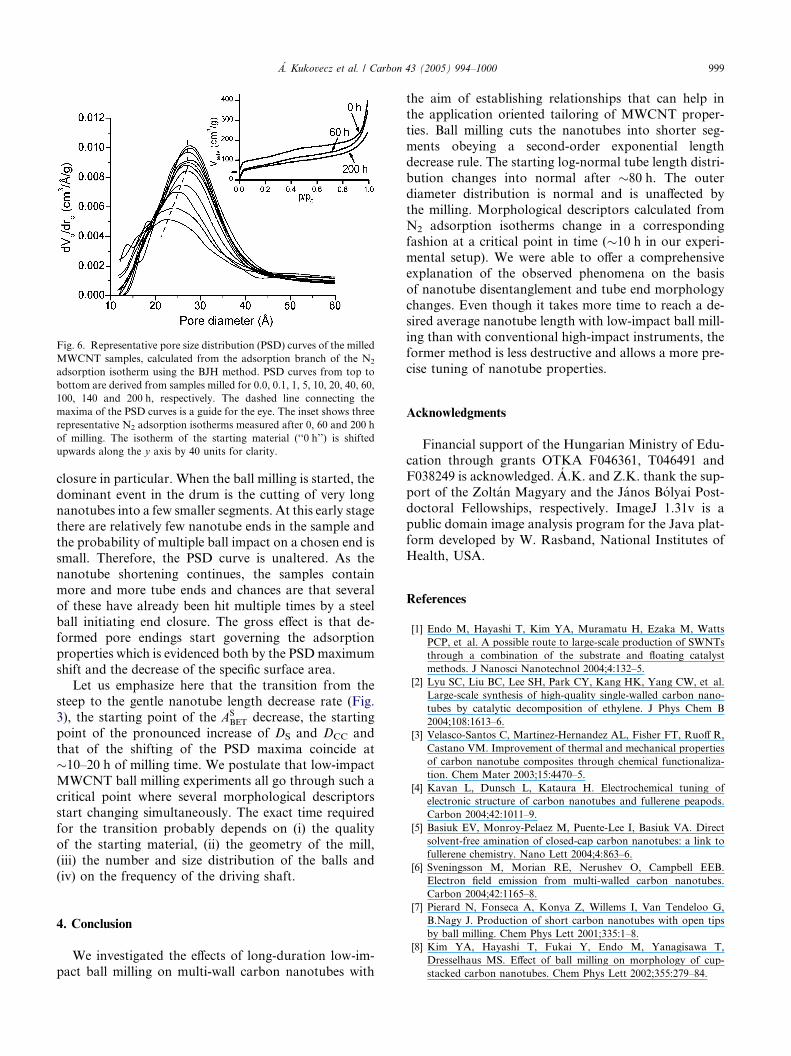
Fig. 6. Representative pore size distribution (PSD) curves of the milled
MWCNT samples, calculated from the adsorption branch of the N2
adsorption isotherm using the BJH method. PSD curves from top to
bottom are derived from samples milled for 0.0, 0.1, 1, 5, 10, 20, 40, 60,
100, 140 and 200 h, respectively. The dashed line connecting the
maxima of the PSD curves is a guide for the eye. The inset shows three
representative N2 adsorption isotherms measured after 0, 60 and 200 h
of milling. The isotherm of the starting material (‘‘0 h’’) is shifted
upwards along the y axis by 40 units for clarity.
�A. Kukovecz et al. / Carbon 43 (2005) 994–1000 999
closure in particular. When the ball milling is started, the
dominant event in the drum is the cutting of very longnanotubes into a few smaller segments. At this early stage
there are relatively few nanotube ends in the sample and
the probability of multiple ball impact on a chosen end is
small. Therefore, the PSD curve is unaltered. As the
nanotube shortening continues, the samples contain
more and more tube ends and chances are that several
of these have already been hit multiple times by a steel
ball initiating end closure. The gross effect is that de-formed pore endings start governing the adsorption
properties which is evidenced both by the PSDmaximum
shift and the decrease of the specific surface area.
Let us emphasize here that the transition from the
steep to the gentle nanotube length decrease rate (Fig.
3), the starting point of the ASBET decrease, the starting
point of the pronounced increase of DS and DCC and
that of the shifting of the PSD maxima coincide at�10–20 h of milling time. We postulate that low-impact
MWCNT ball milling experiments all go through such a
critical point where several morphological descriptors
start changing simultaneously. The exact time required
for the transition probably depends on (i) the quality
of the starting material, (ii) the geometry of the mill,
(iii) the number and size distribution of the balls and
(iv) on the frequency of the driving shaft.
4. Conclusion
We investigated the effects of long-duration low-im-
pact ball milling on multi-wall carbon nanotubes with
the aim of establishing relationships that can help in
the application oriented tailoring of MWCNT proper-
ties. Ball milling cuts the nanotubes into shorter seg-
ments obeying a second-order exponential length
decrease rule. The starting log-normal tube length distri-
bution changes into normal after �80 h. The outerdiameter distribution is normal and is unaffected by
the milling. Morphological descriptors calculated from
N2 adsorption isotherms change in a corresponding
fashion at a critical point in time (�10 h in our experi-
mental setup). We were able to offer a comprehensive
explanation of the observed phenomena on the basis
of nanotube disentanglement and tube end morphology
changes. Even though it takes more time to reach a de-sired average nanotube length with low-impact ball mill-
ing than with conventional high-impact instruments, the
former method is less destructive and allows a more pre-
cise tuning of nanotube properties.
Acknowledgments
Financial support of the Hungarian Ministry of Edu-
cation through grants OTKA F046361, T046491 and
F038249 is acknowledged. A.K. and Z.K. thank the sup-
port of the Zoltan Magyary and the Janos Bolyai Post-
doctoral Fellowships, respectively. ImageJ 1.31v is a
public domain image analysis program for the Java plat-
form developed by W. Rasband, National Institutes of
Health, USA.
References
[1] Endo M, Hayashi T, Kim YA, Muramatu H, Ezaka M, Watts
PCP, et al. A possible route to large-scale production of SWNTs
through a combination of the substrate and floating catalyst
methods. J Nanosci Nanotechnol 2004;4:132–5.
[2] Lyu SC, Liu BC, Lee SH, Park CY, Kang HK, Yang CW, et al.
Large-scale synthesis of high-quality single-walled carbon nano-
tubes by catalytic decomposition of ethylene. J Phys Chem B
2004;108:1613–6.
[3] Velasco-Santos C, Martinez-Hernandez AL, Fisher FT, Ruoff R,
Castano VM. Improvement of thermal and mechanical properties
of carbon nanotube composites through chemical functionaliza-
tion. Chem Mater 2003;15:4470–5.
[4] Kavan L, Dunsch L, Kataura H. Electrochemical tuning of
electronic structure of carbon nanotubes and fullerene peapods.
Carbon 2004;42:1011–9.
[5] Basiuk EV, Monroy-Pelaez M, Puente-Lee I, Basiuk VA. Direct
solvent-free amination of closed-cap carbon nanotubes: a link to
fullerene chemistry. Nano Lett 2004;4:863–6.
[6] Sveningsson M, Morian RE, Nerushev O, Campbell EEB.
Electron field emission from multi-walled carbon nanotubes.
Carbon 2004;42:1165–8.
[7] Pierard N, Fonseca A, Konya Z, Willems I, Van Tendeloo G,
B.Nagy J. Production of short carbon nanotubes with open tips
by ball milling. Chem Phys Lett 2001;335:1–8.
[8] Kim YA, Hayashi T, Fukai Y, Endo M, Yanagisawa T,
Dresselhaus MS. Effect of ball milling on morphology of cup-
stacked carbon nanotubes. Chem Phys Lett 2002;355:279–84.
1000 �A. Kukovecz et al. / Carbon 43 (2005) 994–1000
[9] Wang Y, Wu J, Wei F. A treatment method to give separated
multi-walled carbon nanotubes with high purity, high crystalliza-
tion and a large aspect ratio. Carbon 2003;41:2939–48.
[10] Liu F, Zhang X, Cheng J, Tu J, Kong F, Huang W, et al.
Preparation of short carbon nanotubes by mechanical ball milling
and their hydrogen adsorption behavior. Carbon 2003;41:
2527–32.
[11] Gao B, Bower C, Lorentzen JD, Fleming L, Kleinhammes A,
Tang XP, et al. Enhanced saturation lithium composition in ball-
milled single-walled carbon nanotubes. Chem Phys Lett
2000;327:69–75.
[12] Li YB, Wei BQ, Liang J, Yu Q, Wu DH. Transformation of
carbon nanotubes to nanoparticles by ball milling process.
Carbon 1999;37:493–7.
[13] Konya Z, Zhu J, Niesz K, Mehn D, Kiricsi I. End morphology of
ball milled carbon nanotubes. Carbon 2004;42:2001–8.
[14] Kukovecz A, Konya Z, Nagaraju N, Willems I, Tamasi A,
Fonseca A, et al. Catalytic synthesis of carbon nanotubes over
Co, Fe and Ni containing conventional and sol–gel silica-
aluminas. Phys Chem Chem Phys 2000;2:3071–6.
[15] de Torre LEC, Bottani EJ. N2 adsorption on porous carbona-
ceous materials. Langmuir 1997;13:3499–507.
[16] Brunauer S, Emmett PH, Teller E. Adsorption of gases in
multimolecular layers. J Am Chem Soc 1938;60:309–19.
[17] Barrett EP, Joyner LG, Halenda PP. The determination of pore
volume and area distributions in porous substances. I. Compu-
tations from nitrogen isotherms. J Am Chem Soc 1951;73:373–80.
[18] Groen JC, Peffer LAA, Perez-Ramırez J. Pore size determination
in modified micro- and mesoporous materials. Pitfalls and
limitations in gas adsorption data analysis. Micropor Mesopor
Mater 2003;60:1–17.
[19] Pfeifer P, Wu YJ, Cole MW, Krim J. Multilayer adsorption on a
fractally rough surface. Phys Rev Lett 1989;62:1997–2000.
[20] Tang P, Chew NYK, Chan HK, Raper JA. Limitations of
determination of surface fractal dimension using N2 adsorption
isotherms and modified Frenkel–Halsey–Hill theory. Langmuir
2003;19:2632–8.
[21] Neimark A. A new approach to the determination of the surface
fractal dimension of porous solids. Physica A 1992;191:258–62.
[22] Ehrburger-Dolle F. A new way to analyze adsorption isotherms.
Langmuir 1999;15:6004–15.
[23] Terzyk AP, Gauden PA, Kowalczyk P. Fractal geometry concept
in physical adsorption on solids. Arab J Sci Eng 2003;28:133–67.
[24] Geohegan DB, Schittenhelm H, Fan X, Pennycook SJ, Puretzky
AA, Guillorn MA, et al. Condensed phase growth of single-wall
carbon nanotubes from laser annealed nanoparticulates. Appl
Phys Lett 2001;78:3307–9.
[25] Armatas GS, Salmas CE, Louloudi M, Androutsopoulos GP,
Pomonis PJ. Relationships among pore size, connectivity, dimen-
sionality of capillary condensation, and pore structure tortuosity
of functionalized mesoporous silica. Langmuir 2003;19:3128–36.
[26] Kanyo T, Konya Z, Kukovecz A, Berger F, Dekany I, Kiricsi I.
Quantitative characterization of hydrophilic-hydrophobic prop-
erties of MWNTs surfaces. Langmuir 2004;20:1656–61.
[27] Kukovecz A, Kanyo T, Konya Z, Kiricsi I. Morphological
characterization of mesoporous carbon-silicate nanocomposites.
Micropor Mesopor Mater, accepted for publication. doi:10. 1016/
j.micromeso.2004.11.025.