Long-term ERS/ENVISAT deformation time-series generation at full spatial resolution via the extended...
30
This article was downloaded by: [michele manunta] On: 21 February 2012, At: 10:47 Publisher: Taylor & Francis Informa Ltd Registered in England and Wales Registered Number: 1072954 Registered office: Mortimer House, 37-41 Mortimer Street, London W1T 3JH, UK International Journal of Remote Sensing Publication details, including instructions for authors and subscription information: http://www.tandfonline.com/loi/tres20 Long-term ERS/ENVISAT deformation time-series generation at full spatial resolution via the extended SBAS technique Manuela Bonano a b , Michele Manunta a , Maria Marsella b & Riccardo Lanari a a Istituto per il Rilevamento Elettromagnetico dell'Ambiente (IREA), Consiglio Nazionale delle Ricerche (CNR), Napoli, Italy b Dipartimento di Ingegneria Civile, Edile ed Ambientale (DICEA), Sapienza, Università di Roma, Roma, Italy Available online: 13 Feb 2012 To cite this article: Manuela Bonano, Michele Manunta, Maria Marsella & Riccardo Lanari (2012): Long-term ERS/ENVISAT deformation time-series generation at full spatial resolution via the extended SBAS technique, International Journal of Remote Sensing, 33:15, 4756-4783 To link to this article: http://dx.doi.org/10.1080/01431161.2011.638340 PLEASE SCROLL DOWN FOR ARTICLE Full terms and conditions of use: http://www.tandfonline.com/page/terms-and- conditions This article may be used for research, teaching, and private study purposes. Any substantial or systematic reproduction, redistribution, reselling, loan, sub-licensing, systematic supply, or distribution in any form to anyone is expressly forbidden. The publisher does not give any warranty express or implied or make any representation that the contents will be complete or accurate or up to date. The accuracy of any instructions, formulae, and drug doses should be independently verified with primary sources. The publisher shall not be liable for any loss, actions, claims, proceedings,
Transcript of Long-term ERS/ENVISAT deformation time-series generation at full spatial resolution via the extended...

This article was downloaded by: [michele manunta]On: 21 February 2012, At: 10:47Publisher: Taylor & FrancisInforma Ltd Registered in England and Wales Registered Number: 1072954 Registeredoffice: Mortimer House, 37-41 Mortimer Street, London W1T 3JH, UK
International Journal of RemoteSensingPublication details, including instructions for authors andsubscription information:http://www.tandfonline.com/loi/tres20
Long-term ERS/ENVISAT deformationtime-series generation at full spatialresolution via the extended SBAStechniqueManuela Bonano a b , Michele Manunta a , Maria Marsella b &Riccardo Lanari aa Istituto per il Rilevamento Elettromagnetico dell'Ambiente(IREA), Consiglio Nazionale delle Ricerche (CNR), Napoli, Italyb Dipartimento di Ingegneria Civile, Edile ed Ambientale (DICEA),Sapienza, Università di Roma, Roma, Italy
Available online: 13 Feb 2012
To cite this article: Manuela Bonano, Michele Manunta, Maria Marsella & Riccardo Lanari (2012):Long-term ERS/ENVISAT deformation time-series generation at full spatial resolution via theextended SBAS technique, International Journal of Remote Sensing, 33:15, 4756-4783
To link to this article: http://dx.doi.org/10.1080/01431161.2011.638340
PLEASE SCROLL DOWN FOR ARTICLE
Full terms and conditions of use: http://www.tandfonline.com/page/terms-and-conditions
This article may be used for research, teaching, and private study purposes. Anysubstantial or systematic reproduction, redistribution, reselling, loan, sub-licensing,systematic supply, or distribution in any form to anyone is expressly forbidden.
The publisher does not give any warranty express or implied or make any representationthat the contents will be complete or accurate or up to date. The accuracy of anyinstructions, formulae, and drug doses should be independently verified with primarysources. The publisher shall not be liable for any loss, actions, claims, proceedings,

demand, or costs or damages whatsoever or howsoever caused arising directly orindirectly in connection with or arising out of the use of this material.
Dow
nloa
ded
by [
mic
hele
man
unta
] at
10:
47 2
1 Fe
brua
ry 2
012

International Journal of Remote SensingVol. 33, No. 15, 10 August 2012, 4756–4783
Long-term ERS/ENVISAT deformation time-series generation at fullspatial resolution via the extended SBAS technique
MANUELA BONANO†‡, MICHELE MANUNTA†, MARIA MARSELLA‡ andRICCARDO LANARI∗†
†Istituto per il Rilevamento Elettromagnetico dell’Ambiente (IREA), Consiglio Nazionaledelle Ricerche (CNR), Napoli, Italy
‡Dipartimento di Ingegneria Civile, Edile ed Ambientale (DICEA), Sapienza, Università diRoma, Roma, Italy
We extend the small baseline subset (SBAS) differential synthetic aperture radar(SAR) interferometry (DInSAR) approach to allow the generation of deforma-tion time-series by processing, at the full spatial resolution scale, long sequencesof European Remote Sensing (ERS-1 and ERS-2) and Environmental Satellite(ENVISAT) SAR data acquired with the same illumination geometry. In par-ticular, we avoid the generation of ERS/ENVISAT cross-interferograms, whichare severely affected by noise phenomena due to the carrier frequency separa-tion of the two SAR systems, and we focus on single-platform interferograms only(i.e. ERS/ERS and ENVISAT/ENVISAT interferograms) that are properly com-bined by applying the singular value decomposition (SVD)-based SBAS approach.Moreover, we exploit the Doppler centroid variations of the post-2000 acquisitionsof the ERS-2 sensor and the carrier frequency difference between the ERS-1/2 andthe ENVISAT systems, in order to maximize the number of investigated SAR pix-els and to improve their geocoding. The presented results, achieved on two data setsrelevant to the Napoli Bay area and to the Murge region, both located in southernItaly, confirm the effectiveness of the extended SBAS technique and demonstratethe relevance of deformation analysis carried out at the scale of single build-ings or human-made structures with more than 15 years of ERS and ENVISATacquisitions.
1. Introduction
Differential synthetic aperture radar (SAR) interferometry (DInSAR) is a remote-sensing technique that allows us to produce spatially dense deformation maps withcentimetre to millimetre accuracy by exploiting the phase difference (interferogram)of temporally separated SAR images relevant to the same area (Gabriel et al. 1989).
The DInSAR technology was originally applied to investigate surface displace-ments caused by single events, such as earthquakes and volcanic eruptions (Massonnetet al. 1993, 1995, Peltzer and Rosen 1995). More recently, several advanced DInSARapproaches have been exploited to analyse the temporal evolution of a detecteddisplacement phenomenon via the generation of deformation time-series. This infor-mation can be obtained through the inversion of an appropriate sequence of DInSAR
*Corresponding author. Email: [email protected]
International Journal of Remote SensingISSN 0143-1161 print/ISSN 1366-5901 online © 2012 Taylor & Francis
http://www.tandf.co.uk/journalshttp://dx.doi.org/10.1080/01431161.2011.638340
Dow
nloa
ded
by [
mic
hele
man
unta
] at
10:
47 2
1 Fe
brua
ry 2
012

Long-term full-resolution ERS/ENVISAT SBAS-InSAR time-series 4757
interferograms computed from a large set of SAR acquisitions relevant to theinvestigated area (Ferretti et al. 2000, Berardino et al. 2002, Mora et al. 2003, Usai2003, Werner et al. 2003, Hooper et al. 2004, Lanari et al. 2004c, Crosetto et al. 2005).
In this work, we focus on the technique referred to as the small baseline subset(SBAS) approach (Berardino et al. 2002, Lanari et al. 2004c), which allows us toinvestigate ground deformation at two distinct spatial scales, referred to hereafter asregional and local scales, respectively. At the regional scale, the technique exploits aver-age (multi-look) interferograms (Coltelli et al. 1996, Franceschetti and Lanari 1999)and permits us to generate mean deformation velocity maps and the correspondingtime-series relevant to very large areas (typically 100 × 100 km), with a ground res-olution that is of about 100 × 100 m. At the local scale, the technique exploits thesingle-look interferograms, generated at full spatial resolution (5–10 m), in order todetect and analyse local deformations that may affect single buildings or human-made structures. At both scales, the key point of the SBAS technique is representedby the selection of the data pairs involved in the generation of the interferograms;in particular, only data pairs characterized by small spatial and temporal separation(baseline) between the acquisition orbits are selected, thus allowing us to mitigate thenoise (decorrelation phenomena) affecting the computed interferograms. On the otherhand, this selection may lead to the distribution of the generated small baseline inter-ferograms in subsets separated by large baselines (Berardino et al. 2002). Accordingly,the deformation time-series are computed by considering the selected interferogramsand searching for a least squares solution with a minimum norm energy constraint;this result is achieved by applying the singular value decomposition (SVD) technique,which allows us to easily merge the information retrieved from the different subsetsseparated by large baselines (Berardino et al. 2002).
The SBAS technique was first applied to SAR data collected by the EuropeanRemote Sensing (ERS)-1 and ERS-2 radar systems of the European Space Agency(ESA) (Lanari et al. 2004a,b,d, 2007a, Lundgren et al. 2004, Borgia et al. 2005, Trasattiet al. 2008). However, since March 2002, ESA has been collecting SAR data withthe Advanced SAR (ASAR) sensor, which is a rather complex SAR system on-boardthe ENVISAT satellite, which allows the aquisition of radar data in multiple opera-tion modes. One of these modes, characterized by a side looking angle of about 23◦(Image Swath (IS) 2), is geometrically compatible with the ERS-1/2 sensor illumi-nation geometry and, therefore, it can be effectively exploited within a multi-sensorERS/ENVISAT interferometric SAR processing. Nevertheless, the data combinationis not easy to accomplish because the two radar sensors operate at the C-band butwith slightly different carrier frequencies: 5.331 GHz for the ENVISAT-ASAR sen-sor and 5.3 GHz for the ERS one. This 31 MHz frequency difference leads to a largerange spectral shift (Gatelli et al. 1994) that strongly reduces the superimposition ofthe relative range frequency bands, thus inducing relevant decorrelation effects in theERS/ENVISAT cross-interferograms (Pepe et al. 2005).
An effective way to overcome the limitations introduced by this frequency dif-ference is based on the ERS/ENVISAT SBAS approach proposed by Pepe et al.(2005), originally developed for multi-look differential interferograms. The key ideaof this approach is to consider the images acquired by the ERS and ENVISAT radarsystems as belonging to independent subsets: accordingly, no ERS/ENVISAT cross-interferograms are produced and the combination of the conventional ERS/ERS andENVISAT/ENVISAT (IS2) multi-look interferograms can be easily carried out by
Dow
nloa
ded
by [
mic
hele
man
unta
] at
10:
47 2
1 Fe
brua
ry 2
012

4758 M. Bonano et al.
applying the SBAS strategy without major changes. Of course, a temporal overlapbetween the time-series of the acquisitions of the two sensors is needed.
In this work, we extend the SBAS approach in order to generate deformation time-series at full spatial resolution from long sequences of ERS and ENVISAT SAR data,the latter relevant to the IS2. This result is achieved by adapting the two-scale SBASapproach (Lanari et al. 2004c) to account for the ERS/ENVISAT processing strategyproposed by Pepe et al. (2005). We remark that since we require a temporal over-lap between the data of the two sensors, we also exploit ERS-2 acquisitions carriedout after 2000,† i.e. following the ERS-2 system gyroscope failure events (Mirandaet al. 2003); this leads us to analyse ERS images that in some cases are character-ized by large Doppler centroid (Franceschetti et al. 1996, Franceschetti and Lanari1999) values, requesting rather sophisticated SAR data processing schemes (Lanari1995). These Doppler centroid variations are profitably exploited in order to retrieveinformation about the sub-pixel azimuth location of the coherent SAR pixels (Perissinand Rocca 2006). Moreover, we properly exploit the carrier frequency difference ofthe ERS-1/2 and ENVISAT systems in order to maximize the number of investigatedSAR pixels, also identifying those exhibiting a response significantly deviating from asingle scatterer backscattering behaviour.
The proposed approach has been validated by processing two ERS/ENVISAT datasets relevant to the Napoli Bay area (Italy) and to the Murge region (Italy), acquiredon ascending and descending orbits, respectively, in the 1992–2007 time period. Thepresented results demonstrate the effectiveness of the proposed technique to detectand analyse the temporal evolution of deformation phenomena at the scale of singlebuildings or human-made structures (such as bridges, dams) during an interval ofmore than 15 years.
2. Rationale of the proposed technique
This section focuses on presenting the key aspects of the proposed full-resolutionERS/ENVISAT DInSAR time-series technique. In particular, we start by summa-rizing the basic rationale of the approach presented by Pepe et al. (2005), focused onthe processing of sequences of ERS/ENVISAT multi-look interferograms for investi-gating displacements at the regional scale. Subsequently, we discuss the extension ofthe SBAS technique to the generation of the ERS/ENVISAT deformation time-seriesat the full spatial resolution scale.
2.1 ERS/ENVISAT low-resolution analysis
We start our brief synthesis of the ERS/ENVISAT low-resolution SBAS approach(Pepe et al. 2005) by considering a set of N + 1 SAR images of the ERS andENVISAT (IS2) systems acquired at the ordered times (t0, . . . , tN) , relative to thesame area and co-registered with respect to a master image. Moreover, we spec-ify for each SAR image the corresponding transmitted signal central wavelengthλi = (λERS or λENV) , i = 0, . . . , N, λERS and λENV being associated to the ERS andENVISAT systems, respectively.
The first step of the procedure is represented by the computation of a set ofmulti-look (also referred to, in the following, as low-pass (LP) filtered) differential
†No ERS-1 acquisitions are available after 1999 because the system was finally turned off.
Dow
nloa
ded
by [
mic
hele
man
unta
] at
10:
47 2
1 Fe
brua
ry 2
012

Long-term full-resolution ERS/ENVISAT SBAS-InSAR time-series 4759
interferograms characterized by constraints on the maximum temporal and perpen-dicular baseline. Moreover, since we consider ERS-2 post-2000 acquisitions thatare potentially characterized by large Doppler centroid values, we also avoid thegeneration of interferograms involving data pairs with Doppler centroid differencesexceeding the SAR image Doppler bandwidth.
As already stated before, the selected interferograms, say M, are relevant onlyto ERS/ERS and ENVISAT/ENVISAT data pairs. Accordingly, if we consider[λ1, . . . , λj, . . . , λM ] , j = 1, . . . , M to be the vector of the transmitted signal cen-tral wavelengths associated with each single interferogram, there is no ambiguity inthe identification of the factor λj for each interferogram, since the ERS/ENVISATcross-interferograms are avoided.
We assume that the generated sequence of multi-look interferograms is correctlyunwrapped (Pepe and Lanari 2006), i.e. the original interferometric phase is retrievedfrom its modulo-2π restriction measured from each DInSAR data pair. Thisunwrapping operation is carried out without any model assumption on the temporalevolution of the analysed phase signal components.
By considering a generic pixel of azimuth and range coordinates (x, r) , the expres-sion of the LP component of the jth unwrapped interferogram computed from theSAR acquisitions at times tB and tA has the following expression (Lanari et al. 2004c):
δφ(LP)j (x, r) = φ(LP) (tB, x, r) − φ(LP) (tA, x, r) ≈ −4π
λj
(r(LP)
B − r(LP)A
)+ �n(LP)
j , (1)
wherein φ(LP) ( · ) represents the LP phase component of the two images involved inthe interferogram generation while r(LP)
B and r(LP)
A are the range measurements at timestB and tA with respect to the instant t0, assumed as a reference, and �n(LP)
j representsthe noise component. In view of equation (1), if we consider coherent pixels only, wemay neglect the �n(LP)
j term, obtaining that the ERS and ENVISAT (single-platform)interferogram expressions only differ for the sensor wavelength values. To homogenizethe data set and to end up with a stack of unwrapped interferograms depending on asingle wavelength (the ERS one, for instance), we may easily rescale the overall dataset as follows:
δφ̃(LP)j (x, r) = δφ
(LP)j (x, r)
λj
λERS, ∀j = 1, ..., M. (2)
Equations (1) and (2) define a system of M equations in the N unknowns (we assumeφ (t0, x, r) = 0):
φ̃(LP)i (ti, x, r) = φ
(LP)i (ti, x, r)
λi
λERS, ∀i = 1, ..., N, (3)
which can be reorganized by using the following matrix formalism:
Aφ̃(LP) = δφ̃
(LP), (4)
wherein A is an incidence-like matrix, directly related to the set of interferogramsgenerated from the available SAR data set (Berardino et al. 2002).
Dow
nloa
ded
by [
mic
hele
man
unta
] at
10:
47 2
1 Fe
brua
ry 2
012

4760 M. Bonano et al.
Since equation (4) is formally identical, except for the wavelength scaling step inequation (2), to the one computed in the original SBAS approach (Berardino et al.2002), the inversion scheme applied within the SBAS procedure for single-platforminterferograms can be straightforwardly applied also for processing sequences of(rescaled) ERS and ENVISAT multi-look interferograms.
This leads to the computation of the single-phase contributions (once again withrespect to the reference time t0) having the following expression for the generic time tn
(Lanari et al. 2007b):
φ(LP) (tn, x, r) ≈ 4π
λERSd(LP) (tn, x, r) + φ(atm) (tn, x, r) , (5)
wherein d(LP) ( ·) represents the LP component of the deformation signal and thefactor φ(atm) ( ·) accounts for possible atmospheric inhomogeneities between theacquisitions. It is worth noting that the φ(atm) ( ·) phase component also takes intoaccount possible orbital errors due to the uncertainties in the orbital information.
Based on equation (5), the SBAS approach can be finally applied to single out,for each coherent pixel, the signal components d(LP) ( ·) and φ(atm) ( ·); details of thisinversion operation are omitted here for brevity but can be found in Berardino et al.(2002); moreover, the correction of orbital phase errors is carried out following thelines of the approach discussed by Lanari et al. (2004b).
2.2 ERS/ENVISAT full-resolution analysis
The starting point of the full-resolution ERS/ENVISAT technique is represented bythe generation of a sequence of multi- and single-look differential interferograms, allcharacterized by constraints on the maximum temporal and perpendicular baseline aswell as on the Doppler centroid difference of each DInSAR data pair. Moreover, weassume that the LP signal analysis has already been performed following the approachoutlined in Section 2.1.
Accordingly, as for the single-sensor full-resolution SBAS technique (Lanari et al.2004c), the analysis starts with the modulo-2π subtraction of the retrieved LP phaseinformation (see equation (5)) from the single-look interferograms. Therefore, weget an estimate, on a single pixel basis, of the high-pass (HP) interferometric phasecomponent (also referred to as residual phase) whose expression, for the generic jthinterferogram, can be formalized as follows (Lanari et al. 2004c):
δφ(HP)j (x, r) = φ
(HP)j (tB, x, r) − φ
(HP)j (tA, x, r)
≈4π
λj
[d(HP) (tB, x, r) − d(HP) (tA, x, r)
]+ 4π
λj
bj�z(HP)(x, r)r sin ϑ
+ 2π�fj
vs�x(HP)(x, r) + �n(HP)
j (x, r)
=4π
λj
[(tB − tA) v(HP)(x, r) + β(HP) (tB, x, r) − β(HP) (tA, x, r)
]
+ 4π
λj
bj�z(HP)(x, r)r sin ϑ
+ 2π�fj
vs�x(HP)(x, r) + �n(HP)
j (x, r), (6)
Dow
nloa
ded
by [
mic
hele
man
unta
] at
10:
47 2
1 Fe
brua
ry 2
012

Long-term full-resolution ERS/ENVISAT SBAS-InSAR time-series 4761
wherein d(HP) ( · ) represents the residual displacement contribution that we decoupleinto the mean velocity and the non-linear components v(HP) ( . ) and β(HP) ( · ) , respec-tively; furthermore, �z(HP) ( . ) accounts for the local topography of the full-resolutionpixels,‡ bj is the baseline component perpendicular to the sensor line of sight (LOS), ϑ
is the look angle (about 23◦ for both the ERS and ENVISAT data sets) and �n(HP)j ( · )
is the HP noise contribution. We further remark that, at variance of the single-sensorfull-resolution SBAS approach (Lanari et al. 2004c), we also consider in equation(6) the factor 2π
�fj
vs�x(HP) (x, r) (Mora et al. 2003, Perissin and Rocca 2006), which
accounts for the azimuth location of the target with respect to the centre of the pixel; itdepends on the sensor velocity vs and on the difference between the data pair Dopplercentroids, represented by the factor �fj. We remark that this factor �fj is particularlyrelevant in our approach because we also exploit post-2000 ERS-2 acquisitions that, asalready stated before, are often characterized by large Doppler centroid values. Thesedata are strategic in our approach since the ENVISAT satellite started acquiring from2002 and, in order to perform an effective integration between ERS and ENVISATacquisitions, a significant temporal overlapping of the two SAR data sets is needed(Berardino et al. 2002, Lanari et al. 2004c).
Some additional considerations on equation (6) are worth mentioning; first of all,we remark that the atmospheric phase component does not contribute to the spatialHP signal component (Ferretti et al. 2000). Moreover, a deformation signal decou-pling into linear and non-linear components, v(HP) ( . ) and β(HP) ( · ) , respectively, hasbeen considered in equation (6); this signal representation is related to the implemen-tation of the phase-unwrapping operation that is carried out on the residual phasecomponent δφ
(HP)j ( . ) of the signal. In particular, we consider the following phase
unwrapping strategy: for each pixel, we first estimate the terms v(HP) ( . ) , �z(HP) ( . )and �x(HP) ( . ) in equation (6) via the maximization of the temporal coherence factor:
γ (x, r) = 1M
∣∣∣∣∣∣M∑
j=1
exp[j(δφ
(HP)j (x, r) − δφ
(model)j (x, r)
)]∣∣∣∣∣∣ , (7)
wherein δφ(model)j (x, r) represents the phase model assumed as
δφ(model)j (x, r) = 4π
λj(tB − tA)v(HP) (x, r) + 4π
λj
bj�z(HP) (x, r)rsinϑ
+ 2π�fj
vs�x(HP) (x, r) .
(8)
Following the maximization of γ (x, r) in equation (7), typically carried out viaa standard grid search relevant to the unknown factors v(HP) ( · ) , �z(HP) ( · ) and�x(HP) ( · ) , we identify the coherent pixels at the full spatial resolution scale repre-sented by those exhibiting a value of γ (·) greater than a selected threshold. On thesepixels, the estimated phase model contribution (see equation (8)) is subtracted fromthe HP phase component. Therefore, the generic jth residual interferometric phasehas the following expression:
‡Note that it may also include possible errors in the DEM used for the interferogramgeneration.
Dow
nloa
ded
by [
mic
hele
man
unta
] at
10:
47 2
1 Fe
brua
ry 2
012

4762 M. Bonano et al.
⟨δφ
(HP)j (x, r) − δφ
(model)j (x, r)
⟩2π
= 4π
λj
[β(HP) (tB, x, r) − β(HP) (tA, x, r)
]+ �n(HP)
j (x, r)
≈ 4π
λj
[β(HP) (tB, x, r) − β(HP) (tA, x, r)
], (9)
wherein 〈 · 〉2π represents the modulo-2π operator and where we neglect the�n(HP)
j ( x, r ) noise term since we concentrate on coherent pixels only. By consideringequation (9), it is evident that in this case also the ERS and ENVISAT residualinterferogram expressions only differ for the sensor wavelength values. Accordingly,in order to homogenize the data set and to end up with a stack of unwrapped interfer-ograms depending on a single wavelength (the ERS one, for instance), we may easilyrescale equation (9) as follows:
λj
λERS
⟨φ
(HP)j − φ
(model)j
⟩2π
= 4π
λERS
[β(HP) (tB, x, r) − β(HP) (tA, x, r)
]. (10)
Consequently, the non-linear component of the deformation can be easily estimatedfrom equation (10) by applying the SVD method equivalently to (Lanari et al. 2004c).Note that, following the LP phase removal and after subtracting the HP model signal,we assume that the residual phase component is within the (−π , π ) interval; thus,no additional unwrapping operation is needed. We remark that the model shown inequation (8) is used only for the phase-unwrapping step carried out on the HP phasecomponent via the maximization of the temporal coherence γ (·) in equation (7).
The overall deformation signal can be computed by combining the large spatialscale displacements estimated from the multi-look signals (see equation (5)) and thelinear and non-linear HP displacements computed from the residual DInSAR phasecombination (see equation (6)). Accordingly, the overall deformation signal expressionis represented by
d (tn, x, r) = d(LP) (tn, x, r) + (tn − t0) v(HP) (x, r) + β(HP) (tn, x, r) , n = 0, . . . , N, (11)
with d (t0, x, r) = 0, t0 being the assumed reference time.We further highlight that in addition to the computed deformation time-series, we
also retrieve an estimate about the �z(HP) ( · ) and �x(HP) ( · ) factors from the maxi-mization of the temporal coherence factor γ (·) in equation (7). These two terms arevery important for an accurate geolocalization of the SAR pixels. In particular, sincethe ERS and ENVISAT satellite orbits are nearly polar ones, the residual topogra-phy information �z(HP) ( · ) is essential to get an estimate about the pixel location inthe east–west direction while �x(HP) ( · ) is essential along the north–south direction(Schreier 1993).
As an additional remark, we want to point out that, based on equation (6), we areimplicitly assuming for each SAR pixel of the overall multi-sensor data set the presenceof a single (dominant) scatterer, which is often referred to as the persistent scatterer orpermanent scatterer (Raucoules et al. 2009). However, since in our approach we haveavailable an ERS and an ENVISAT data set characterized by the previously men-tioned 31 MHz carrier frequency difference, we may try to benefit from this frequency
Dow
nloa
ded
by [
mic
hele
man
unta
] at
10:
47 2
1 Fe
brua
ry 2
012

Long-term full-resolution ERS/ENVISAT SBAS-InSAR time-series 4763
diversity in order to identify SAR pixels that, following our previous ERS–ENVISATanalysis, are characterized by a more ‘complex’ behaviour with respect to the singlescatterer we considered in equation (6). To extend our approach to investigate thesemore complex targets also, without complicating too much the implemented process-ing scheme, we adopt the following strategy: for pixels whose coherence value (seeequation (7)) is smaller than the selected threshold, we carry out a second analysisbased on splitting the residual topography estimation depending on the ERS andENVISAT subsets. In this case, we consider an extended phase model having thefollowing expression:
δφ̂(model)j (x, r) = 4π
λj(tB − tA) v(HP) (x, r) + 4π
λj
bj�z(HP)j (x, r)
r sin ϑ+ 2π
�fj
vs�x(HP) (x, r) ,
(12)
where �z(HP)j (·) =
(�z(HP)
ERS or �z(HP)
ENV
)and ∀j = 1, . . . , M, �z(HP)
ERS and �z(HP)
ENV being
the retrieved local topography information relevant to the ERS and ENVISAT datasets, respectively, also referred to as frequency-dependent topographic terms. Notealso that we are assuming in equation (12) no frequency dependence of the deforma-tion signal v(HP)( · ) and of the azimuth location factor �x(HP) ( · ) . At this stage, wemaximize the temporal coherence factor by accounting for the new phase model basedon equation (12):
γ (x, r) = 1M
∣∣∣∣∣∣M∑
j=1
exp[j(δφ
(HP)j (x, r) − δφ̂
(model)j (x, r)
)]∣∣∣∣∣∣ , (13)
and identify those pixels exhibiting coherence values greater than the selected thresh-old. This allows us to increase the number of investigated SAR pixels. Indeed, theincreased complexity of the exploited model shown in equation (12) allows us to detectthose points whose characteristic deviates from the single scatterer accounted by equa-tions (6) and (8). Moreover, since we expect that the differences between �z(HP)
ERS and�z(HP)
ENV are very small (ideally 0) for pixels exhibiting a single scatterer behaviour, thesetopography differences can be considered an indicator of the frequency dependenceof the pixels, thus of their divergence with respect to a single scatterer backscatteringbehaviour, as shown in figure 1. In other words, we are identifying and analysing pix-els with a frequency-dependent backscattering response by resolving the differences inthe phase centre locations depending on the considered carrier frequencies.
We underline that our solution can be considered complementary to tomographictechniques (Fornaro and Serafino 2006) or to higher order permanent scattereralgorithms (Ferretti et al. 2005), although with respect to those it is clearly less sophis-ticated and needs further investigations in order to relate the retrieved difference oftopographies to the backscattering mechanism of the pixel. On the other hand, ourERS/ENVISAT-based solution is very straightforward because it only exploits phasecomponents, with no need of accounting for the amplitude of the exploited SAR data.Of course, a good balance between the number of ERS and ENVISAT acquisitions isneeded to guarantee the effectiveness of our approach. In this context, the continuousaccumulation of high-quality new ENVISAT acquisitions represents a key issue sincelarge archives of ERS images are already available.
Dow
nloa
ded
by [
mic
hele
man
unta
] at
10:
47 2
1 Fe
brua
ry 2
012

4764 M. Bonano et al.
Figure 1. SAR geometry in the plane perpendicular to the ERS and ENVISAT orbit direc-tions that are represented by black and red dots, respectively. (a) Sketch of a pixel characterizedby a single dominant scatterer whose phase centre location remains the same for the ERS andthe ENVISAT imaging; the reported factor �z(HP)accounts for the pixel residual topography.(b) Sketch of a pixel characterized by two different phase centre locations depending on the ERSor ENVISAT imaging; in this case, we report the corresponding two local topography compo-nents represented by �z(HP)
ERS ( · ) and �z(HP)
ENV( · ) , respectively. Note that the black and red coloursused for the imaged scatterers are exploited to pictorially show the frequency dependence of thetarget backscattering response.
We finally remark that, once a network of coherent pixels is estimated at the full spa-tial resolution scale, we may try to expand it by properly ‘propagating’ the retrievedtime-series to the neighbouring points. This may be relevant for increasing the coher-ent pixel density in critical cases as, for instance, in the presence of isolated structuresor at the edge of low-resolution coherent areas where no LP reliable phase informa-tion is available. Additional efforts are required in order to detect and analyse these‘propagated’ targets. In this case, the data processing is identical to the one carried out
Dow
nloa
ded
by [
mic
hele
man
unta
] at
10:
47 2
1 Fe
brua
ry 2
012

Long-term full-resolution ERS/ENVISAT SBAS-InSAR time-series 4765
in the previous HP data-processing step, with the only difference being that the resid-ual phase of the investigated pixels is computed by subtracting the signal componentsrelative to the adjacent coherent targets detected in the surrounding areas.
3. Experimental results
To demonstrate the effectiveness of the proposed ERS/ENVISAT DInSAR approach,we have applied the extended SBAS technique to two distinct SAR data sets.
The first case study is relevant to the Napoli Bay area (southern Italy) and it hasbeen carried out by using a data set composed of 71 ERS-1/2 and 39 ENVISATacquisitions (IS2), relevant to ascending orbits (frame 809, track 129), acquired from1993 to 2007 (see table 1). From this data set, 312 DInSAR interferograms havebeen generated: 197 involving the ERS images, whereas the remaining 115 have beencomputed from the ENVISAT acquisitions (see figure 2). For the DInSAR interfer-ogram generation, we have imposed, for both the ERS and ENVISAT data pairs,
Table 1. ERS and ENVISAT SAR acquisitions (Napoli Bay area).
Mission Orbit Day Month YearPerpendicularbaseline (m)
Dopplercentroid (Hz)
ERS1 7789 10 1 1993 −490 −386ERS1 8290 14 2 1993 −168 −347ERS1 8791 21 3 1993 633 −375ERS1 9292 25 4 1993 688 −296ERS1 9793 30 5 1993 −381 −143ERS1 10294 4 7 1993 −109 −270ERS1 10795 8 8 1993 −551 −241ERS1 11296 12 9 1993 −591 −343ERS1 11797 17 10 1993 199 −333ERS1 12298 21 11 1993 511 −400ERS1 19656 18 4 1995 −453 −348ERS1 20658 27 6 1995 547 −273ERS1 21159 1 8 1995 −166 −308ERS2 1486 2 8 1995 −107 −544ERS1 21660 5 9 1995 574 −341ERS2 1987 6 9 1995 679 −574ERS1 22161 10 10 1995 −478 −357ERS2 2488 11 10 1995 −839 −564ERS1 22662 14 11 1995 676 −356ERS2 2989 15 11 1995 780 −572ERS2 3490 20 12 1995 −326 −609ERS1 23664 23 1 1996 −324 −349ERS1 24165 27 2 1996 −219 −319ERS2 4492 28 2 1996 −29 −568ERS1 24666 2 4 1996 −242 −334ERS2 4993 3 4 1996 −121 −578ERS1 25167 7 5 1996 −605 −294ERS2 5494 8 5 1996 −481 −568ERS2 5995 12 6 1996 600 −529ERS2 6997 21 8 1996 411 −544ERS2 7498 25 9 1996 −26 −570ERS2 7999 30 10 1996 −452 −562ERS2 12508 10 9 1997 477 −600ERS2 14512 28 1 1998 389 −428ERS2 15514 8 4 1998 788 −578
(Continued)
Dow
nloa
ded
by [
mic
hele
man
unta
] at
10:
47 2
1 Fe
brua
ry 2
012

4766 M. Bonano et al.
Table 1. (Continued.)
Mission Orbit Day Month YearPerpendicularbaseline (m)
Dopplercentroid (Hz)
ERS2 16516 17 6 1998 218 −544ERS2 17017 22 7 1998 −238 −571ERS2 17518 26 8 1998 −131 −566ERS2 19021 9 12 1998 102 −508ERS2 20524 24 3 1999 −63 −555ERS2 21025 28 4 1999 583 −606ERS2 21526 2 6 1999 −364 −514ERS2 22027 7 7 1999 1136 −695ERS2 22528 11 8 1999 −382 −656ERS2 23029 15 9 1999 0 −555ERS1 43203 19 10 1999 163 −341ERS2 23530 20 10 1999 376 −570ERS2 24031 24 11 1999 523 −505ERS2 24532 29 12 1999 −898 −618ERS1 44706 1 2 2000 −193 −273ERS2 25033 2 2 2000 −497 −530ERS2 25534 8 3 2000 9 −176ERS2 26035 12 4 2000 419 −368ERS2 26536 17 5 2000 429 −640ERS2 27037 21 6 2000 −310 −542ERS2 27538 26 7 2000 −461 −527ERS2 28039 30 8 2000 −979 −422ERS2 28540 4 10 2000 415 −743ERS2 29041 8 11 2000 282 −1189ERS2 29542 13 12 2000 −1044 −483ERS2 37558 26 6 2002 −1048 193ERS2 38059 31 7 2002 221 −1206ERS2 39061 9 10 2002 278 −1524ENV 3690 13 11 2002 −231 −654ENV 5193 26 2 2003 −189 −544ERS2 41065 26 2 2003 381 −1884ENV 6195 7 5 2003 104 −551ENV 6696 11 6 2003 −323 −558ENV 7698 20 8 2003 170 −656ENV 8199 24 9 2003 399 −540ENV 8700 29 10 2003 −43 −711ENV 9702 7 1 2004 −87 −603ENV 10203 11 2 2004 −382 −672ENV 10704 17 3 2004 −328 −634ENV 11205 21 4 2004 −640 −663ENV 12708 4 8 2004 330 −640ENV 13209 8 9 2004 68 −660ENV 13710 13 10 2004 −971 −666ENV 14211 17 11 2004 420 −646ENV 14712 22 12 2004 739 −652ENV 15213 26 1 2005 −302 −648ENV 15714 2 3 2005 632 −623ENV 16215 6 4 2005 −291 −656ENV 16716 11 5 2005 −459 −656ENV 17217 15 6 2005 157 −679ENV 17718 20 7 2005 −257 −442ENV 18219 24 8 2005 528 −670
(Continued)
Dow
nloa
ded
by [
mic
hele
man
unta
] at
10:
47 2
1 Fe
brua
ry 2
012

Long-term full-resolution ERS/ENVISAT SBAS-InSAR time-series 4767
Table 1. (Continued.)
Mission Orbit Day Month YearPerpendicularbaseline (m)
Dopplercentroid (Hz)
ENV 18720 28 9 2005 −510 −645ENV 19221 2 11 2005 −367 −635ENV 19722 7 12 2005 798 −649ENV 20223 11 1 2006 −146 −637ENV 20724 15 2 2006 497 −658ENV 21726 26 4 2006 −601 −627ERS2 57598 26 4 2006 −544 −526ERS2 58099 31 5 2006 115 −438ENV 22728 5 7 2006 −821 −622ERS2 58600 5 7 2006 −62 −1254ERS2 59101 9 8 2006 −303 339ENV 23730 13 9 2006 −240 −672ENV 24231 18 10 2006 −187 −616ENV 24732 22 11 2006 608 −661ERS2 60604 22 11 2006 −431 −766ERS2 61105 27 12 2006 286 −1990ENV 25734 31 1 2007 −284 −521ENV 26736 11 4 2007 −228 −612ENV 27738 20 6 2007 167 −642ERS2 63610 20 6 2007 591 −512ENV 28239 25 7 2007 89 −619ENV 28740 29 8 2007 479 −613ENV 29241 3 10 2007 −81 −626
a perpendicular baseline constraint of 400 m and a maximum temporal separation(temporal baseline) of 1500 days, while we have assumed a Doppler centroid variationnot larger than 1000 Hz. Precise satellite orbital information and the Shuttle RadarTopography Mission (SRTM) digital elevation model (DEM) of the study area havebeen used for removing the topographic phase contribution (Gabriel et al. 1989).
To provide an overall view of the detected deformation, we present in figure 3 thefull-resolution deformation velocity map, relevant to the coherent pixels (we assumedγ > 0.5, see equations (7) and (13)), superimposed on an orthophoto of the investi-gated area. Note that this representation is visually effective and allows us to provideaverage information (with respect to time) of the detected deformation.
Figure 3 clearly shows that significant deformation patterns are present in sev-eral areas, which can be easily identified: on the left-hand side, the deformationphenomenon affecting the Campi Flegrei caldera is evident; almost in the centre ofthe image, we reveal the subsidence effect located within the highly urbanized Vomeroquarter in the city of Napoli; concerning the Mt Vesuvio area, on the right-hand sideof the picture, displacements are present on its summit as well as around its base.The above-discussed deformation phenomena have already been investigated throughseveral DInSAR analyses (Lanari et al. 2004a,d, Borgia et al. 2005, Trasatti et al.2008). Accordingly, in this study, we are not focusing on the interpretation of therevealed deformation but on demonstrating the capability of our approach to gener-ate ERS/ENVISAT deformation time-series spanning more than 15 years of time andto provide spatially detailed information about the retrieved displacements. To bet-ter clarify this issue, we present in figure 4(a) a zoom of the deformation velocity
Dow
nloa
ded
by [
mic
hele
man
unta
] at
10:
47 2
1 Fe
brua
ry 2
012

4768 M. Bonano et al.
Figure 2. SAR data representation in the temporal/perpendicular baseline plane for theERS/ENVISAT data set relevant to the Napoli Bay area. The black and red diamonds rep-resent the ERS and ENVISAT acquisitions, respectively, and each arc of the graph correspondsto a generated interferogram.
Figure 3. Full-resolution mean deformation velocity map computed by using the ERS andENVISAT data set of figure 2 (acquired on ascending orbits) relevant to the Napoli Bay area(southern Italy), superimposed on an optical image of the investigated zone. The Campi Flegreicaldera, the Vesuvius volcano and the Vomero quarter, within the city of Napoli, have beenhighlighted.
map relevant to the centre of the Pozzuoli harbour within the Campi Flegrei caldera.The capability of our approach to analyse long-term deformation at the scale ofthe single buildings is evident. Moreover, in this case, we may also benefit from theavailable geodetic information acquired by the Campi Flegrei surveillance network
Dow
nloa
ded
by [
mic
hele
man
unta
] at
10:
47 2
1 Fe
brua
ry 2
012

Long-term full-resolution ERS/ENVISAT SBAS-InSAR time-series 4769
of Istituto Nazionale di Geofisica e Vulcanologia (INGV). This network includesnine continuous Global Positioning System (GPS) stations (De Martino et al. 2007)and 320 levelling benchmarks (Lanari et al. 2004a), the latter being typically measuredeach year, although this may depend on the volcanic activity.
In the two plots shown in figures 4(b) and (c), we present the comparison betweenthe generated ERS/ENVISAT DInSAR deformation time-series of two pixels locatedin the central area of the Pozzuoli harbour and the corresponding ones relevant tothe continuous GPS (upper plot) and levelling (lower plot) measurements provided tous by the INGV; clearly, both geodetic data sets were projected in the radar line ofsight in order to make these data comparable with the DInSAR results. In particular,for what concerns the GPS data, weekly measurements were available. Accordingly,we have compared each DInSAR result with the average of the nearest (in time) fiveGPS measurements, by considering that 35 days correspond to the revisit time of theERS and ENVISAT sensors. Moreover, for what concerns the comparison with thelevelling data, we have readjusted the DInSAR results to the reference point of thegeodetic network, which is assumed to be stable and is located near the Mergellina har-bour of Napoli. In this case, we have compared each levelling measurement with thenearest (in time) DInSAR observation. Of course, we only considered in our analysisthe levelling measurements temporally close (<70 days) to the homologous DInSARacquisition times.
The agreement between the geodetic and the DInSAR data is evident; more quanti-tatively, we highlight that the standard deviation (σ ) of the difference between the twotime-series is 0.4 and 0.6 cm for the GPS and levelling cases, respectively, which is con-sistent with that expected from the previous results relevant to single-sensor DInSARdata validation analyses (Casu et al. 2006, Trasatti et al. 2008).
To perform a more extended assessment of our DInSAR results, we also consideredother GPS measurements relevant to the Campi Flegrei network. This analysis hasinvolved seven GPS stations located in coherent areas, whose measurements extendedfrom 2004 to 2008; in this case, we obtained an average standard deviation (σ ) of thedifference between the GPS and DInSAR time-series of about 0.5 cm, which is againconsistent with that already shown in figure 4(b).
A second example is presented in figure 5(a) showing a zoom of the full-resolutiondeformation velocity map relevant to the Vomero quarter. Again, the very goodcoverage provided by the DInSAR results is evident. Moreover, also in this case,high-precision levelling data were available; thus, we carried out a further compar-ison between our time-series and the geodetic measurements. The achieved result,presented in the plot of figure 5(b), confirms again the very good agreement betweenthe two data sets with a standard deviation of their difference that, in this case, is about0.5 cm.
Let us now investigate the capability of our approach to properly geocode the iden-tified coherent pixels. In this case, we focus on an area located in the northern part ofthe city of Napoli (see figure 6). In particular, in figure 6(a), the location of the detectedcoherent pixels geocoded by using only the topographic information of the availableSRTM DEM is presented. Moreover, we present in figure 6(b) the results obtained byconsidering, within the geocoding process, the retrieved residual topography infor-mation, while in figures 6(c) and (d) we additionally exploit the azimuth locationinformation of the pixel with respect to its centre. The capability of the approach toaccurately geocode the detected coherent pixels is evident, as well as the importanceof both the residual topography and the azimuth location corrections.
Dow
nloa
ded
by [
mic
hele
man
unta
] at
10:
47 2
1 Fe
brua
ry 2
012

4770 M. Bonano et al.
Figure 4. SBAS-DInSAR results relevant to the Pozzuoli harbour within the Campi Flegreicaldera. (a) Full-resolution ERS/ENVISAT mean deformation velocity map superimposed onan optical image of the investigated area. The location of the GPS site labelled as GPS/ACAEhas been highlighted as well as the analysed levelling benchmark LCF/25A. (b) Comparisonbetween the DInSAR deformation time-series (black triangles) and the GPS measurements pro-jected on the radar LOS (red stars), for the pixel labelled as GPS/ACAE; the standard deviation(σ ) value of the difference between the SAR and the LOS-projected GPS measurements hasbeen reported. (c) Comparison between the DInSAR deformation time-series (black triangles)and the corresponding levelling measurements (LEV) projected on the radar LOS (red stars),for the pixel labelled as LCF/25A: the standard deviation value (σ ) of the differences betweenthe SAR and the LOS-projected levelling measurements has been reported.
Dow
nloa
ded
by [
mic
hele
man
unta
] at
10:
47 2
1 Fe
brua
ry 2
012
Long-term full-resolution ERS/ENVISAT SBAS-InSAR time-series 4771
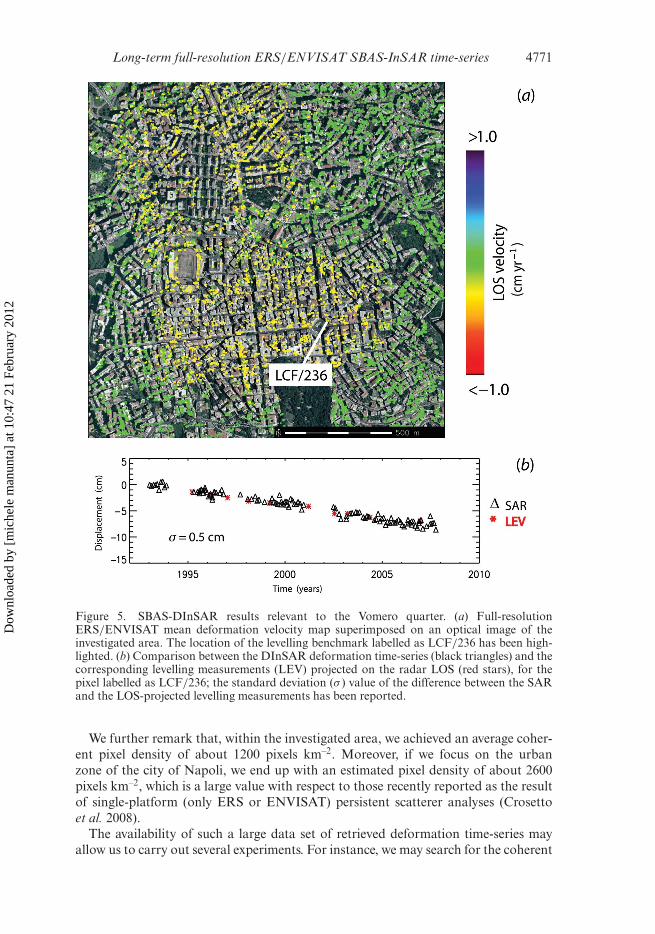
Figure 5. SBAS-DInSAR results relevant to the Vomero quarter. (a) Full-resolutionERS/ENVISAT mean deformation velocity map superimposed on an optical image of theinvestigated area. The location of the levelling benchmark labelled as LCF/236 has been high-lighted. (b) Comparison between the DInSAR deformation time-series (black triangles) and thecorresponding levelling measurements (LEV) projected on the radar LOS (red stars), for thepixel labelled as LCF/236; the standard deviation (σ ) value of the difference between the SARand the LOS-projected levelling measurements has been reported.
We further remark that, within the investigated area, we achieved an average coher-ent pixel density of about 1200 pixels km–2. Moreover, if we focus on the urbanzone of the city of Napoli, we end up with an estimated pixel density of about 2600pixels km–2, which is a large value with respect to those recently reported as the resultof single-platform (only ERS or ENVISAT) persistent scatterer analyses (Crosettoet al. 2008).
The availability of such a large data set of retrieved deformation time-series mayallow us to carry out several experiments. For instance, we may search for the coherent
Dow
nloa
ded
by [
mic
hele
man
unta
] at
10:
47 2
1 Fe
brua
ry 2
012

4772 M. Bonano et al.
Figure 6. Location of the detected coherent pixels relevant to an area in the northern partof the city of Napoli. (a) Coherent pixels geocoded by using only the topographic informationof the available SRTM DEM. (b) Same as (a) but considering also the residual topographyinformation estimated from the DInSAR data. (c) Same as (b) but considering also the azimuthlocation of the pixels with respect to their centres. The geocoded coherent pixels relevant to themain road only have been highlighted in (d). Note that the colour associated to the SAR pixelsis only for visualization purposes.
pixels exhibiting high correlation with respect to a sinusoid signal that can mimicthe temperature variations during the analysed 15 years of ERS and ENVISATacquisitions. In this case, several pixels show large correlation values (see figure 7)and, unsurprisingly, all these pixels correspond to metallic structures, as shown infigures 7(b)–(d), leading us to interpret the corresponding DInSAR time-series asthe result of thermally induced deformation effects. It is worth noting that, althoughour deformation time-series variations are within the ±0.5 cm range, consistent withthe accuracy of the single DInSAR measurements, these DInSAR signals cannotbe confused with noise. Indeed, we are analysing the time-series as a whole in orderto identify temporally correlated displacements (sinusoidal, in this case), whoseprobability of being represented by noise is extremely low, due to the poor temporalcorrelation of noise. Moreover, we finally remark that in spite of the quasi-linearmodel exploited in the unwrapping step on the HP DInSAR phase component (seeequation (7)), non-linear (sinusoidal) displacements may be retrieved.
As additional analysis, we concentrated on the capability of our approach toincrease the number of investigated SAR pixels by exploiting the ERS/ENVISAT
Dow
nloa
ded
by [
mic
hele
man
unta
] at
10:
47 2
1 Fe
brua
ry 2
012

Long-term full-resolution ERS/ENVISAT SBAS-InSAR time-series 4773
1995
14.27° E
40.83° N
40.86° N
(a)
(b)
(c)
(d)
14.3
5° E
1.5
b
d
c
1.00.5
0.0–0.5–1.0–1.5
1.51.0
0.5
0.0–0.5
–1.0–1.5
1.51.00.50.0
–0.5
–1.0–1.5
Dis
plac
emen
t (cm
)D
ispl
acem
ent (
cm)
Dis
plac
emen
t (cm
)
2000 2005 2010
Time (years)
1995 2000 2005 2010
Time (years)
1995 2000 2005 2010
Time (years)
Figure 7. Results of the correlation analysis between DInSAR time-series and a sinusoidal sig-nal. (a) Pixels showing a correlation value greater than 0.6 with respect to a sinusoidal signal arehighlighted in red. (b, c and d) Comparisons between the DInSAR deformation time-series (redtriangles) and the sinusoidal signal (continuous black line) for three metallic structures (shownin the left-hand-side pictures) exhibiting a temporal coherence of about 0.6 and a correlationvalue greater than 0.75.
Dow
nloa
ded
by [
mic
hele
man
unta
] at
10:
47 2
1 Fe
brua
ry 2
012
4774 M. Bonano et al.
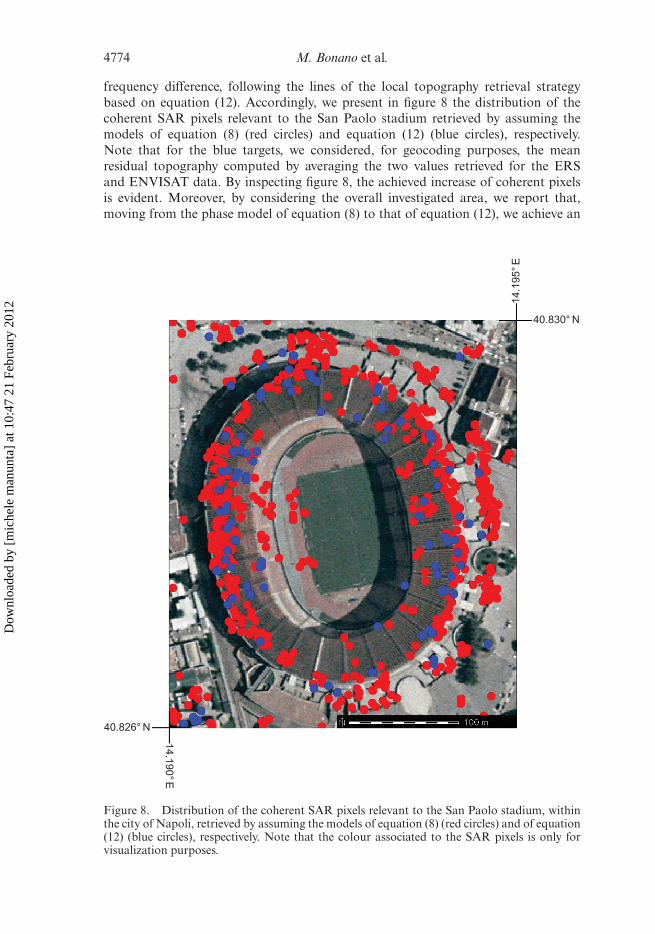
frequency difference, following the lines of the local topography retrieval strategybased on equation (12). Accordingly, we present in figure 8 the distribution of thecoherent SAR pixels relevant to the San Paolo stadium retrieved by assuming themodels of equation (8) (red circles) and equation (12) (blue circles), respectively.Note that for the blue targets, we considered, for geocoding purposes, the meanresidual topography computed by averaging the two values retrieved for the ERSand ENVISAT data. By inspecting figure 8, the achieved increase of coherent pixelsis evident. Moreover, by considering the overall investigated area, we report that,moving from the phase model of equation (8) to that of equation (12), we achieve an
40.830° N
40.826° N
14.190° E
14.1
95° E
Figure 8. Distribution of the coherent SAR pixels relevant to the San Paolo stadium, withinthe city of Napoli, retrieved by assuming the models of equation (8) (red circles) and of equation(12) (blue circles), respectively. Note that the colour associated to the SAR pixels is only forvisualization purposes.
Dow
nloa
ded
by [
mic
hele
man
unta
] at
10:
47 2
1 Fe
brua
ry 2
012
Long-term full-resolution ERS/ENVISAT SBAS-InSAR time-series 4775
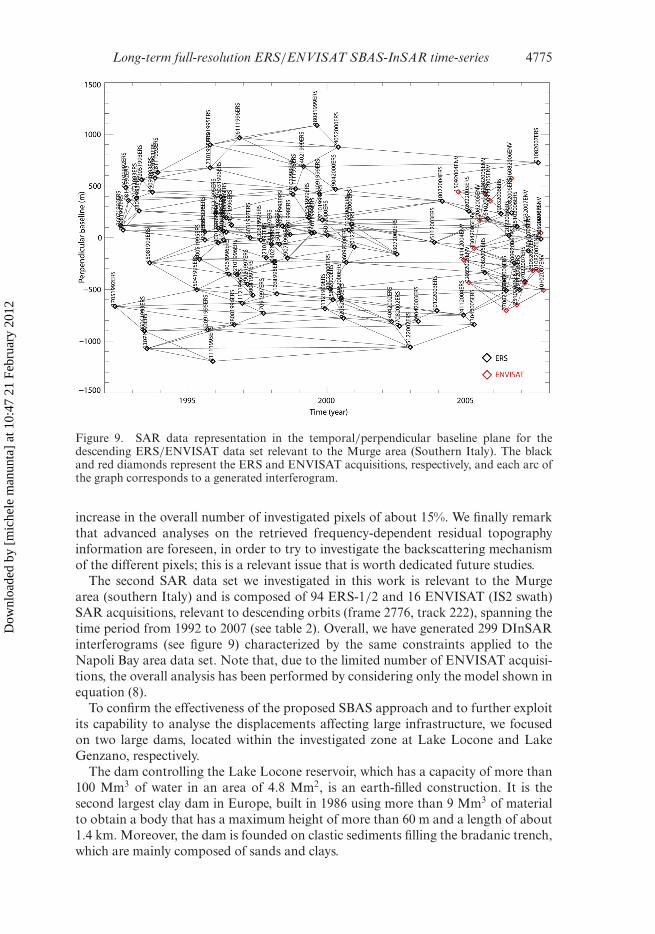
Figure 9. SAR data representation in the temporal/perpendicular baseline plane for thedescending ERS/ENVISAT data set relevant to the Murge area (Southern Italy). The blackand red diamonds represent the ERS and ENVISAT acquisitions, respectively, and each arc ofthe graph corresponds to a generated interferogram.
increase in the overall number of investigated pixels of about 15%. We finally remarkthat advanced analyses on the retrieved frequency-dependent residual topographyinformation are foreseen, in order to try to investigate the backscattering mechanismof the different pixels; this is a relevant issue that is worth dedicated future studies.
The second SAR data set we investigated in this work is relevant to the Murgearea (southern Italy) and is composed of 94 ERS-1/2 and 16 ENVISAT (IS2 swath)SAR acquisitions, relevant to descending orbits (frame 2776, track 222), spanning thetime period from 1992 to 2007 (see table 2). Overall, we have generated 299 DInSARinterferograms (see figure 9) characterized by the same constraints applied to theNapoli Bay area data set. Note that, due to the limited number of ENVISAT acquisi-tions, the overall analysis has been performed by considering only the model shown inequation (8).
To confirm the effectiveness of the proposed SBAS approach and to further exploitits capability to analyse the displacements affecting large infrastructure, we focusedon two large dams, located within the investigated zone at Lake Locone and LakeGenzano, respectively.
The dam controlling the Lake Locone reservoir, which has a capacity of more than100 Mm3 of water in an area of 4.8 Mm2, is an earth-filled construction. It is thesecond largest clay dam in Europe, built in 1986 using more than 9 Mm3 of materialto obtain a body that has a maximum height of more than 60 m and a length of about1.4 km. Moreover, the dam is founded on clastic sediments filling the bradanic trench,which are mainly composed of sands and clays.
Dow
nloa
ded
by [
mic
hele
man
unta
] at
10:
47 2
1 Fe
brua
ry 2
012

4776 M. Bonano et al.
Lake Genzano dam is also an earth-filled structure, with a central confining sectorconstrained at the lateral, frontal and back sides by reinforcements in alluvional mate-rials at different permeabilities. The reservoir has a capacity of about 60 Mm3 of waterin an area of 3.7 Mm2. It was completed in 1990 and the dam body crown has a heightof about 60 m and a length of about 1 km.
The full-resolution mean deformation velocity maps superimposed on an opticalimage of the areas are presented for the Lake Locone and Lake Genzano dams infigures 10 and 11, respectively, revealing a deformation pattern associated with thelong-term dam settlements. As expected, larger deformation velocities are observed inthe central area of both dams, though some differences linked to the different geome-try of the structure are also noticeable. It is worth underlining that the lateral sectorsappear stable because of the constraining/confining effects of the banks/abutments.The capability of measuring pixel velocities also in the areas surrounding the damsprovides a very useful reference for discriminating the effect of local structural settle-ments with respect to that induced by other ongoing phenomena such as phreatic levelvariations and deformation due to land instabilities.
Table 2. ERS and ENVISAT SAR acquisitions (Murge area).
Mission Orbit Day Month YearPerpendicularbaseline (m)
Dopplercentroid (Hz)
ERS1 4375 17 5 1992 −663 488ERS1 5377 26 7 1992 117 395ERS1 5878 30 8 1992 74 404ERS1 6379 4 10 1992 486 430ERS1 6888 8 11 1992 360 401ERS1 8383 21 2 1993 383 380ERS1 8884 28 3 1993 259 450ERS1 9385 2 5 1993 560 444ERS1 9886 6 6 1993 −902 494ERS1 10387 11 7 1993 −1071 462ERS1 10888 15 8 1993 −242 483ERS1 11389 19 9 1993 441 444ERS1 11890 24 10 1993 577 378ERS1 12391 28 11 1993 631 417ERS1 19749 25 4 1995 −503 435ERS1 20250 30 5 1995 −207 465ERS1 21252 8 8 1995 58 450ERS2 1579 9 8 1995 −21 132ERS1 21753 12 9 1995 −888 400ERS1 22254 17 10 1995 676 433ERS2 2581 18 10 1995 898 161ERS1 22755 21 11 1995 −1194 402ERS2 3583 27 12 1995 235 201ERS1 23757 30 1 1996 −48 284ERS2 4084 31 1 1996 91 186ERS1 24258 5 3 1996 395 418ERS1 24759 9 4 1996 65 417ERS2 5086 10 4 1996 −20 162ERS1 25260 14 5 1996 194 451ERS2 5587 15 5 1996 56 154ERS2 6088 19 6 1996 −351 191ERS2 6589 24 7 1996 123 99ERS2 7090 28 8 1996 −840 113
(Continued)
Dow
nloa
ded
by [
mic
hele
man
unta
] at
10:
47 2
1 Fe
brua
ry 2
012

Long-term full-resolution ERS/ENVISAT SBAS-InSAR time-series 4777
Table 2. (Continued.)
Mission Orbit Day Month YearPerpendicularbaseline (m)
Dopplercentroid (Hz)
ERS2 7591 2 10 1996 −355 124ERS2 8092 6 11 1996 967 151ERS2 8593 11 12 1996 −633 206ERS2 9595 19 2 1997 −449 267ERS2 10096 26 3 1997 0 223ERS2 10597 30 4 1997 −555 151ERS2 12100 13 8 1997 −22 134ERS2 12601 17 9 1997 −730 127ERS2 13102 22 10 1997 −193 95ERS2 14104 31 12 1997 −64 153ERS2 14605 4 2 1998 −231 152ERS2 15106 11 3 1998 −542 146ERS2 12607 15 4 1998 −63 175ERS2 16108 20 5 1998 113 210ERS2 17110 29 7 1998 −196 191ERS2 17611 2 9 1998 30 216ERS2 18112 7 10 1998 420 73ERS2 18613 11 11 1998 473 140ERS2 20116 24 2 1999 688 196ERS2 21118 5 5 1999 191 223ERS2 21619 9 6 1999 45 229ERS2 22120 14 7 1999 50 204ERS2 22621 18 8 1999 1086 165ERS1 42795 21 9 1999 425 501ERS2 23623 27 10 1999 171 156ERS2 24124 1 12 1999 −686 121ERS2 24625 5 1 2000 23 225ERS1 44799 8 2 2000 −495 363ERS2 25627 15 3 2000 −599 −535ERS2 26128 19 4 2000 468 −165ERS2 26629 24 5 2000 876 −252ERS2 27130 28 6 2000 −586 −415ERS2 27631 2 8 2000 −777 −525ERS2 28132 6 9 2000 −238 −279ERS2 28633 11 10 2000 74 −60ERS2 29134 15 11 2000 133 −39ERS2 29635 20 12 2000 −89 −239ERS2 36649 24 4 2002 −810 −886ERS2 37651 3 7 2002 −158 −634ERS2 38152 7 8 2002 −853 1049ERS2 40156 25 12 2002 −1057 −141ERS2 41659 9 4 2003 −808 1752ERS2 44665 5 11 2003 −44 828ERS2 45166 10 12 2003 −705 1641ERS2 46168 18 2 2004 352 445ENV 13302 15 9 2004 443 176ENV 14304 24 11 2004 −213 186ERS2 50176 24 11 2004 −748 26ENV 15306 2 2 2005 −434 171ERS2 51178 2 2 2005 256 1096ENV 16308 13 4 2005 −102 184ERS2 52180 13 4 2005 −839 391
(Continued)
Dow
nloa
ded
by [
mic
hele
man
unta
] at
10:
47 2
1 Fe
brua
ry 2
012

4778 M. Bonano et al.
Table 2. (Continued.)
Mission Orbit Day Month YearPerpendicularbaseline (m)
Dopplercentroid (Hz)
ENV 17310 22 6 2005 167 176ENV 18312 31 8 2005 425 211ERS2 54184 31 8 2005 −338 −492ERS2 54685 5 10 2005 185 −366ENV 19314 9 11 2005 356 235ERS2 57190 29 3 2006 232 1384ENV 22320 7 6 2006 −703 219ERS2 58192 7 6 2006 −511 282ERS2 58693 12 7 2006 21 −359ENV 23322 16 8 2006 573 231ERS2 59194 16 8 2006 241 1657ERS2 59695 20 9 2006 −245 20ENV 24324 25 10 2006 −649 218ERS2 60196 25 10 2006 108 −409ERS2 60697 29 11 2006 −502 −136ENV 25827 7 2 2007 −438 180ERS2 61699 7 2 2007 −422 301ENV 26328 14 3 2007 114 207ERS2 62701 18 4 2007 −125 1450ENV 27330 23 5 2007 −319 181ENV 28332 1 8 2007 −313 218ERS2 64204 1 8 2007 725 343ENV 28833 5 9 2007 46 234ERS2 64705 5 9 2007 −12 −268ENV 29334 10 10 2007 −507 214
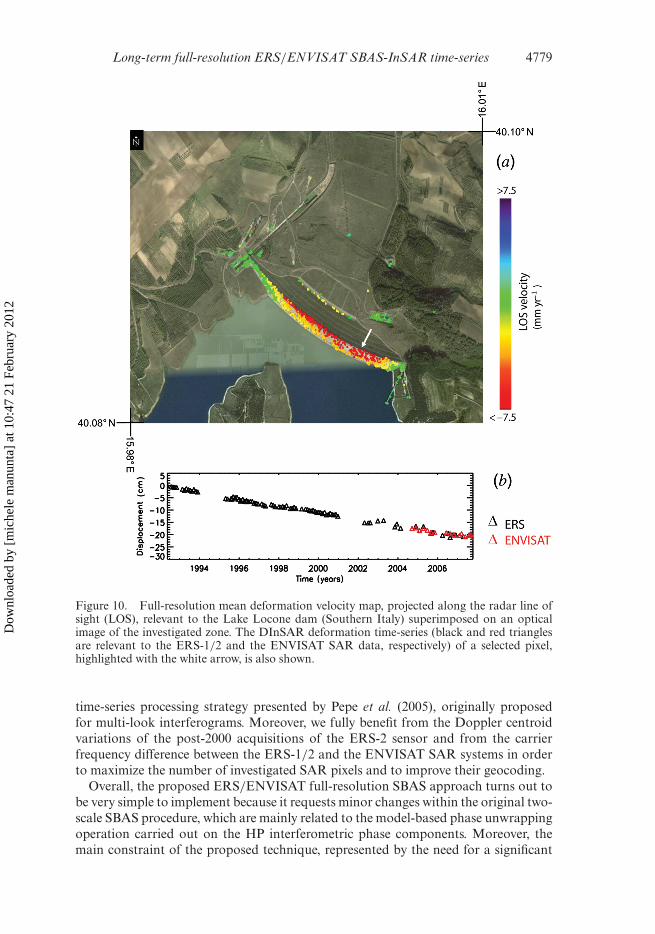
Two examples of the deformation time-series relevant to two selected pixels areshown in separate graphs in figures 10 and 11, showing a rather regular trend of LOSdisplacements that unsurprisingly reach 20 cm in 16 years of observation.
Unfortunately, a comparison with geodetic data relevant to the analysed infrastruc-tures was not possible due to the unavailability of these measurements. However, basedon the overall results shown in figures 10 and 11, the capability of our approach toprovide information on the spatial and temporal characteristics of the retrieved defor-mation affecting the investigated large infrastructures is evident. This is an importantissue, particularly for dams that require long-term monitoring programs typicallyinvolving a variety of in situ sensors such as piezometers and extensometers, as wellas periodic topographic measurements. Therefore, DInSAR methods such as the pre-sented extended SBAS approach may play a key role in understanding the long-termdisplacements of a dam, providing useful insight to optimize its maintenance and,possibly, contributing to the definition of damage assessment scenarios.
4. Conclusions
We have extended the original SBAS algorithm to produce ERS/ENVISAT defor-mation time-series at the full spatial resolution scale and spanning time intervals ofmore than 15 years. The proposed approach adapts the single-sensor two-scale SBASalgorithm presented by Lanari et al. (2004c) to account for the ERS/ENVISAT
Dow
nloa
ded
by [
mic
hele
man
unta
] at
10:
47 2
1 Fe
brua
ry 2
012
Long-term full-resolution ERS/ENVISAT SBAS-InSAR time-series 4779
Figure 10. Full-resolution mean deformation velocity map, projected along the radar line ofsight (LOS), relevant to the Lake Locone dam (Southern Italy) superimposed on an opticalimage of the investigated zone. The DInSAR deformation time-series (black and red trianglesare relevant to the ERS-1/2 and the ENVISAT SAR data, respectively) of a selected pixel,highlighted with the white arrow, is also shown.
time-series processing strategy presented by Pepe et al. (2005), originally proposedfor multi-look interferograms. Moreover, we fully benefit from the Doppler centroidvariations of the post-2000 acquisitions of the ERS-2 sensor and from the carrierfrequency difference between the ERS-1/2 and the ENVISAT SAR systems in orderto maximize the number of investigated SAR pixels and to improve their geocoding.
Overall, the proposed ERS/ENVISAT full-resolution SBAS approach turns out tobe very simple to implement because it requests minor changes within the original two-scale SBAS procedure, which are mainly related to the model-based phase unwrappingoperation carried out on the HP interferometric phase components. Moreover, themain constraint of the proposed technique, represented by the need for a significant
Dow
nloa
ded
by [
mic
hele
man
unta
] at
10:
47 2
1 Fe
brua
ry 2
012

4780 M. Bonano et al.
Figure 11. Full-resolution mean deformation velocity map, projected along the radar line ofsight (LOS), relevant to the Lake Genzano dam (Southern Italy) superimposed on an opticalimage of the investigated zone. The DInSAR deformation time-series (black and red trianglesare relevant to the ERS-1/2 and the ENVISAT SAR data, respectively) of a selected pixel,highlighted with the white arrow, is also shown.
overlap between the ERS and the ENVISAT (IS2 swath) data sets, can be consid-ered overcome, nowadays, due to the already available large archive of temporallyoverlapping ERS and ENVISAT sequences.
The presented results demonstrate the capability of our approach to perform defor-mation analyses at the scale of single human-made structures with sub-centimetricaccuracy, validated via a comparison of the DInSAR results with independent geode-tic measurements. Moreover, the computed long-term deformation time-series demon-strate the capability of the technique to easily perform back analysis on extended areaswith a very high coherent pixel density, reaching 2600 pixels km–2 for what concernsthe Napoli Bay experiments. The presented capability of the technique to providedisplacement measurements on many observation points, with no need of referencetargets, is very relevant in several scenarios as in the case of environmental studies
Dow
nloa
ded
by [
mic
hele
man
unta
] at
10:
47 2
1 Fe
brua
ry 2
012

Long-term full-resolution ERS/ENVISAT SBAS-InSAR time-series 4781
relevant to new infrastructure developments, such as the forthcoming new Metro-Cline in Rome (Italy). In the mentioned context of large infrastructure monitoring,we also underline the relevance of the results achieved for the Lake Locone andLake Genzano dam analyses. They clearly show the capability of the extended SBASapproach to provide detailed information about the spatial and temporal character-istics of the ongoing displacements affecting these structures. In this case, we remarkthat the joint analyses of the ERS and ENVISAT data permitted us to successfullyexploit the overall data set while, for standard single-sensor analyses, the limitedamount of ENVISAT acquisitions (only 16, in this study) would certainly representa key limitation because advanced DInSAR investigations typically request no lessthan 20–25 SAR images.
We finally remark that the presently satisfactory operating performance of theERS-2 sensor, together with the expected interferometric capability of the ENVISATsensor until 2010 and the forthcoming new C-band Sentinel-1 system, allows us todesign scenarios involving multi-sensor deformation time-series extending for morethan 20 years. In this framework, the proposed multi-sensor SBAS approach may playa key role because it could allow us to retrieve a unique set of spatially detailed andtemporarily extended information on the ongoing deformations affecting an area ofinterest.
AcknowledgementsThis work was partially sponsored by the Italian Civil Protection Department (DPC),ESA and the Italian Space Agency (ASI). The precise ERS-1/2 satellite orbit statevectors have been provided by the Technical University of Delft, The Netherlands.The digital elevation model of the investigated area was acquired through the SRTMarchive. We also thank Carlo Del Gaudio and Prospero De Martino of INGV-OV,who provided the levelling and GPS measurements, respectively, and Simone Guarino,Ferdinando Parisi and Maria Consiglia Rasulo for their technical support.
ReferencesBERARDINO, P., FORNARO, G., LANARI, R. and SANSOSTI, E., 2002, A new algorithm for surface
deformation monitoring based on small baseline differential SAR interferograms. IEEETransactions on Geoscience and Remote Sensing, 40, pp. 2375–2383.
BORGIA, A., TIZZANI, P., SOLARO, G., MANZO, M., CASU, F., LUONGO, G., PEPE, A.,BERARDINO, P., FORNARO, G., SANSOSTI, E., RICCIARDI, G.P., FUSI, N., DI DONNA,G. and LANARI, R., 2005, Volcanic spreading of Vesuvius, a new paradigm for inter-preting its volcanic activity. Geophysical Research Letters, 32, L03303, doi:10.1029/2004GL022155.
CASU, F., MANZO, M. and LANARI, R., 2006, A quantitative assessment of the SBAS algorithmperformance for surface deformation retrieval from DInSAR data. Remote Sensing ofEnvironment, 102, pp. 195–210.
COLTELLI, M., FORNARO, G., FRANCESCHETTI, G., LANARI, R., MIGLIACCIO, M., MOREIRA,J.R., PAPATHANASSIOU, K.P., PUGLISI, G., RICCIO, D. and SCHWŠBISCH, M., 1996,SIR-C/X-SAR multifrequency multipass interferometry: a new tool for geologicalinterpretation. Journal of Geophysical Research, 101, pp. 23127–23148.
CROSETTO, M., CRIPPA, B. and BIESCAS, E., 2005, Early detection and in-depth analysis ofdeformation phenomena by radar interferometry. Engineering Geology, 79, pp. 81–91.
CROSETTO, M., MONSERRAT, O. and AGUDO, M., 2008, Validation of existing process-ing chains in Terrafirma Stage 2. In Process Analysis Report, IG Inter-comparison,
Dow
nloa
ded
by [
mic
hele
man
unta
] at
10:
47 2
1 Fe
brua
ry 2
012

4782 M. Bonano et al.
GMES TERRAFIRMA Project, ESRIN/Contract No. 19366/05/I-E (Institute ofGeomatica). Available online at: http://www.terrafirma.eu.com/validation/ValProj/Final%20Reports/IG_Intercomparison_final.pdf (accessed 14 November 2011).
DE MARTINO, P., TAMMARO, U., BRANDI, G., D’ALESSANDRO, A., DOLCE, M., ESPOSITO,T., MALASPINA, S., OBRIZZO, F., PINGUE, F. and SERIO, C., 2007, Area vulcanicanapoletana: 10 anni di osservazioni GPS. In Atti XI Conferenza Nazionale ASITA,6–9 November 2007, Torino, Italy, pp. 925–930 [in Italian].
FERRETTI, A., BIANCHI, M., PRATI, C. and ROCCA, F., 2005, Higher-order permanent scatterersanalysis. Journal on Applied Signal Processing, 20, pp. 3231–3242.
FERRETTI, A., PRATI, C. and ROCCA, F., 2000, Non-linear subsidence rate estimation using per-manent scatterers in differential SAR interferometry. IEEE Transaction on Geoscienceand Remote Sensing, 38, pp. 2202–2212.
FORNARO, G. and SERAFINO, F., 2006, Imaging of single and double scatterers in urbanareas via SAR tomography. IEEE Transaction on Geoscience and Remote Sensing, 44,pp. 3497–3505.
FRANCESCHETTI, G. and LANARI, R. (Ed.), 1999, Synthetic Aperture Radar Processing (BocaRaton, FL: CRC Press).
FRANCESCHETTI, G., LANARI, R. and MARZOUK, E.S., 1996, A new two-dimensional squintmode SAR processor. IEEE Transactions on Aerospace and Electronic Systems, 32,pp. 854–863.
GABRIEL, K., GOLDSTEIN, R.M. and ZEBKER, H.A., 1989, Mapping small elevation changesover large areas: differential interferometry. Journal of Geophysical Research, 94,pp. 9183–9191.
GATELLI, F., MONTIGUARNIERI, A., PARIZZI, F., PASQUALI, P., PRATI, C. and ROCCA, F., 1994,The wave-number shift in SAR interferometry. IEEE Transaction on Geoscience andRemote Sensing, 32, pp. 855–865.
HOOPER, A., ZEBKER, H., SEGALL, P. and KAMPES, B., 2004, A new method for measuringdeformation on volcanoes and other natural terrains using InSAR persistent scatterers.Geophysical Research Letters, 31, L23611, doi:10.1029/2004GL021737.
LANARI, R., 1995, New method for the compensation of the SAR range cell-migration basedon the Chirp Z-transform. IEEE Transactions on Geoscience and Remote Sensing, 33,pp. 1296–1299.
LANARI, R., BERARDINO, P., BORGSTROM, S., DEL GAUDIO, C., DE MARTINO, P., FORNARO,G., GUARINO, S., RICCIARDI, G.P., SANSOSTI, E. and LUNDGREN, P., 2004a, The use ofIFSAR and classical geodetic techniques for caldera unrest episodes: application to theCampi Flegrei uplift event of 2000. Journal of Volcanology and Geothermal Research,133, pp. 247–260.
LANARI, R., CASU, F., MANZO, M. and LUNDGREN, P., 2007a, Application of the SBAS-DInSAR technique to fault creep: a case study of the Hayward fault, California. RemoteSensing of Environment, 109, pp. 20–28.
LANARI, R., CASU, F., MANZO, M., ZENI, G., BERARDINO, P., MANUNTA, M. and PEPE, A.,2007b, An overview of the small baseline subset algorithm: a DInSAR technique forsurface deformation analysis. Pure and Applied Geophysics, 164, pp. 637–661.
LANARI, R., LUNDGREN, P., MANZO, M. and CASU, F., 2004b, Satellite radar interferometrytime series analysis of surface deformation for Los Angeles, California. GeophysicalResearch Letters, 31, L23613, doi:10.1029/2004GL021294.
LANARI, R., MORA, O., MANUNTA, M., MALLORQUÌ, J.J., BERARDINO, P. and SANSOSTI, E.,2004c, A small baseline approach for investigating deformations on full resolution dif-ferential SAR interferograms. IEEE Transactions on Geoscience and Remote Sensing,42, pp. 1377–1386.
LANARI, R., ZENI, G., MANUNTA, M., GUARINO, S., BERARDINO, P. and SANSOSTI, E., 2004d,An integrated SAR/GIS approach for investigating urban deformation phenomena:
Dow
nloa
ded
by [
mic
hele
man
unta
] at
10:
47 2
1 Fe
brua
ry 2
012

Long-term full-resolution ERS/ENVISAT SBAS-InSAR time-series 4783
the city of Napoli (Italy) case study. International Journal of Remote Sensing, 25,pp. 2855–2862.
LUNDGREN, P., CASU, F., MANZO, M., PEPE, A., BERARDINO, P., SANSOSTI, E. andLANARI, R., 2004, Gravity and magma induced spreading of Mount Etna volcanorevealed by satellite radar interferometry. Geophysical Research Letters, 31, L04602,doi:10.1029/2003GL018736.
MASSONNET, D., BRIOLE, P. and ARNAUD, A., 1995, Deflation of Mount Etna monitored byspaceborne radar interferometry. Nature, 375, pp. 567–570.
MASSONNET, D., ROSSI, M., CARMONA, C., ARDAGNA, F., PELTZER, G., FEIGL, K. andRABAUTE, T., 1993, The displacement field on the Landers earthquake mapped by radarinterferometry. Nature, 364, pp. 138–142.
MIRANDA, N., ROSICH, B., SANTELLA, C. and GRION, M., 2003, Review of the impactof ERS-2 piloting modes on the SAR Doppler stability. In Proceedings Fringe ’03,1–5 December 2003, Frascati, Italy. Available online at: http://earth.esa.int/fringe03/proceedings/papers/26_miranda.pdf (accessed 18 December 2009).
MORA, O., MALLORQUÌ, J.J. and BROQUETAS, A., 2003, Linear and nonlinear terrain deforma-tion maps from a reduced set of interferometric SAR images. IEEE Transactions onGeoscience and Remote Sensing, 41, pp. 2243–2253.
PELTZER, G. and ROSEN, P.A., 1995, Surface displacement of the 17 May 1993 Eureka Valley,California, earthquake observed by SAR interferometry. Science, 268, pp. 1333–1336.
PEPE, A. and LANARI, R., 2006, On the extension of the minimum cost flow algorithm for phaseunwrapping of multi-temporal differential SAR interferograms. IEEE Transactions onGeoscience and Remote Sensing, 44, pp. 2374–2383.
PEPE, A., SANSOSTI, E., BERARDINO, P. and LANARI, R., 2005, On the generation ofERS/ENVISAT DInSAR time-series via the SBAS technique. IEEE Geoscience andRemote Sensing Letters, 2, pp. 265–269.
PERISSIN, D. and ROCCA, F., 2006, High-accuracy urban DEM using permanent scatterers.IEEE Transactions on Geoscience and Remote Sensing, 44, pp. 3338–3347.
RAUCOULES, D., BOURGINE, B., DE MICHELE, M., LE COZANNET, G., CLOSSET, L., BREMMER,C., VELDKAMP, H., TRAGHEIM, D., BATESON, L., CROSETTO, M., AGUDO, M. andENGDAHL, M., 2009, Validation and intercomparison of persistent scatterers interfer-ometry: PSIC4 project results. Journal of Applied Geophysics, 68, pp. 335–347.
SCHREIER, G. (Ed.),1993, SAR Geocoding: Data and Systems (Karlsruhe: Wichmann).TRASATTI, E., CASU, F., GIUNCHI, C., PEPE, S., SOLARO, G., TAGLIAVENTI, S., BERARDINO,
P., MANZO, M., PEPE, A., RICCIARDI, G.P., SANSOSTI, E., TIZZANI, P., ZENI, G. andLANARI, R., 2008, The 2004–2006 uplift episode at Campi Flegrei caldera (Italy):constraints from SBAS-DInSAR ENVISAT data and Bayesian source inference.Geophysical Research Letters, 35, L07308, doi: 10.1029/2007GL033091.
USAI, S., 2003, A least squares database approach for SAR interferometric data. IEEETransactions on Geoscience and Remote Sensing, 41, pp. 753–760.
WERNER, C., WEGMULLER, U., STROZZI, T. and WIESMANN, A., 2003, Interferometricpoint target analysis for deformation mapping. In Proceedings of IEEE Geoscienceand Remote Sensing Symposium (IGARSS’03), 21–25 July 2003, Toulouse, France(Piscataway, NJ: IEEE), Vol. 7, pp. 4362–4364.
Dow
nloa
ded
by [
mic
hele
man
unta
] at
10:
47 2
1 Fe
brua
ry 2
012


![$! T`c`_R TRdVd ]Z_\VU e` ERS]ZXYZd - Daily Pioneer](https://static.fdokumen.com/doc/165x107/6332618c5696ca4473033209/-tcr-trdvd-zvu-e-erszxyzd-daily-pioneer.jpg)