Cross-Commodity Analysis of China's Grain Sector - USDA ERS
24
Cross-Commodity Analysis of China’s Grain Sector: Sources of Growth and Supply Response. By Hunter Colby, Xinshen Diao, and Agapi Somwaru, U.S. Department of Agriculture, Economic Research Service, Market and Trade Economics Division. Technical Bulletin No. 1884. Abstract We investigate sources of output growth and supply response in rice, wheat, corn, and soybeans, the four most important crops in China’s grain sector, during 1978-97. Using a growth accounting methodology, we found large total factor productivity (TFP) contri- butions to growth in grain production immediately following China’s rural economic reform (1978-85). In 1995-97, the TFP contribution dropped to only 16 percent of growth in grain production, as greater use of inputs increasingly drove growth. In the supply response analysis, the results of the econometrically estimated restricted profit function confirm a joint and nonseparable multiproduct technology for China’s grain sector. Complementarity prevails in the grain sector among different outputs and inputs, meaning that an increase in the price of intermediate inputs/capital or wages would result not only in an absolute reduction in all outputs but also in a change in the compo- sition of these outputs. The expansion (or scale) effects subsided during 1986-97, implying a relatively slow outward shift of the production frontier during this period. If the current government policy environment remains unchanged, China’s grain produc- tion will become more costly, constraining its future growth and competitiveness in world markets. Keywords: China agriculture, growth accounting, total factor productivity (TFP), multi- product supply response. Acknowledgments The authors have benefited from discussions with Terry Roe and Eldon Ball. The authors are also grateful to M. Gopinath, Shenggen Fan, Terry Roe, Praveen Dixit, Joy Harwood, John Dyck, Steven Zahniser, Bill Kost, Scott Rozelle, and Francis Tuan for their critical comments and suggestions. An early version of the paper was presented at the International Agricultural Trade Research Consortium, "China's Agricultural Trade and Policy," San Francisco, CA, June 26, 1999. The authors are solely responsible for any remaining errors. Washington, DC 20005-4788 May 2000
-
Upload
khangminh22 -
Category
Documents
-
view
3 -
download
0
Transcript of Cross-Commodity Analysis of China's Grain Sector - USDA ERS
Cross-Commodity Analysis of China’s Grain Sector: Sources of Growth andSupply Response. By Hunter Colby, Xinshen Diao, and Agapi Somwaru, U.S.Department of Agriculture, Economic Research Service, Market and Trade EconomicsDivision. Technical Bulletin No. 1884.
AbstractWe investigate sources of output growth and supply response in rice, wheat, corn, andsoybeans, the four most important crops in China’s grain sector, during 1978-97. Usinga growth accounting methodology, we found large total factor productivity (TFP) contri-butions to growth in grain production immediately following China’s rural economicreform (1978-85). In 1995-97, the TFP contribution dropped to only 16 percent ofgrowth in grain production, as greater use of inputs increasingly drove growth. In thesupply response analysis, the results of the econometrically estimated restricted profitfunction confirm a joint and nonseparable multiproduct technology for China’s grainsector. Complementarity prevails in the grain sector among different outputs and inputs,meaning that an increase in the price of intermediate inputs/capital or wages wouldresult not only in an absolute reduction in all outputs but also in a change in the compo-sition of these outputs. The expansion (or scale) effects subsided during 1986-97,implying a relatively slow outward shift of the production frontier during this period. Ifthe current government policy environment remains unchanged, China’s grain produc-tion will become more costly, constraining its future growth and competitiveness inworld markets.
Keywords: China agriculture, growth accounting, total factor productivity (TFP), multi-product supply response.
AcknowledgmentsThe authors have benefited from discussions with Terry Roe and Eldon Ball. Theauthors are also grateful to M. Gopinath, Shenggen Fan, Terry Roe, Praveen Dixit, JoyHarwood, John Dyck, Steven Zahniser, Bill Kost, Scott Rozelle, and Francis Tuan fortheir critical comments and suggestions. An early version of the paper was presented atthe International Agricultural Trade Research Consortium, "China's Agricultural Tradeand Policy," San Francisco, CA, June 26, 1999. The authors are solely responsible forany remaining errors.
Washington, DC 20005-4788 May 2000

ii • China’s Grain Sector Economic Research Service/USDA • TB-1884
Contents
Executive Summary . . . . . . . . . . . . . . . . . . . . . . . . . . . . . . . . . . . . . . . . . . . . . . . . .iii
Introduction . . . . . . . . . . . . . . . . . . . . . . . . . . . . . . . . . . . . . . . . . . . . . . . . . . . . . . . .1
Growth Accounting Analysis—Sources of Output Growth . . . . . . . . . . . . . . . . . . . . .1
Previous Studies and Background . . . . . . . . . . . . . . . . . . . . . . . . . . . . . . . . . . . . .1Method . . . . . . . . . . . . . . . . . . . . . . . . . . . . . . . . . . . . . . . . . . . . . . . . . . . . . . . . .2
Data . . . . . . . . . . . . . . . . . . . . . . . . . . . . . . . . . . . . . . . . . . . . . . . . . . . . . . . . . . .3
Growth Accounting Analysis—Contribution of TFP . . . . . . . . . . . . . . . . . . . . . . .4Growth Accounting Analysis—Contribution of Intermediate Inputs and Capital . . . . . . . . . . . . . . . . . . . . . . . . . . . . . . . . . . . . . .7
Structural Change in Input Use—Rise in Capital/Land Ratio and Fall in Labor/Land Ratio . . . . . . . . . . . . . . . . . . . . . . . . . . . . . . . . . . . . . . . .8
Analyzing Supply Response in the Grain Sector . . . . . . . . . . . . . . . . . . . . . . . . . . . . .9
Product Supply and Input Demand . . . . . . . . . . . . . . . . . . . . . . . . . . . . . . . . . . . .11Estimates of Supply and Demand Elasticities . . . . . . . . . . . . . . . . . . . . . . . . . . . .12
Technological Change . . . . . . . . . . . . . . . . . . . . . . . . . . . . . . . . . . . . . . . . . . . . .14
Summary and Conclusions . . . . . . . . . . . . . . . . . . . . . . . . . . . . . . . . . . . . . . . . . . . .14
References . . . . . . . . . . . . . . . . . . . . . . . . . . . . . . . . . . . . . . . . . . . . . . . . . . . . . . . .15
Appendix . . . . . . . . . . . . . . . . . . . . . . . . . . . . . . . . . . . . . . . . . . . . . . . . . . . . . . . . .16
TB-1884 • Economic Research Service/USDA China’s Grain Sector • iii
Executive SummaryThis report analyzes the sources of output growth and supply response in rice, wheat,corn, and soybeans, the four most important crops in China’s grain sector, during 1978-97. The study, using a growth accounting methodology, finds large total factor produc-tivity contributions to growth in grain production immediately following China’s ruraleconomic reform (1978-85). These findings are reinforced by additional analysis usinga multiproduct supply response approach.
Most of the growth in total factor productivity during 1978-85 was from efficiencygains due to institutional reforms. After 1985, when the efficiency gains had dimin-ished, the growth rate of productivity fell sharply and contributed less than 20 percent ofgrowth in grain production. In recent years (1995-97), increased use of inputs, especial-ly intermediates/capital, became major sources of growth in China’s grain sector.
Historically, there has been a decline in the ratio of labor relative to land used in China’sgrain production, though in recent years this decline has slowed significantly. The cur-rent land tenure system, which blocks scale economies by preventing land transfers, is amajor factor constraining the development and expansion of labor-saving technology inChina’s grain sector. Given that increased input use, including labor, drove growth inChina’s grain sector in recent years, grain production will become more costly as wagesand prices for intermediate/capital inputs rise. This could constrain growth in China’sgrain production and weaken its competitiveness in world grain markets. However, thegap between productivity growth in China’s grain sector and overall productivity growthin developed countries such as the United States suggests that China can improve itsgrain production technology if the economic and policy environment encourages invest-ment in agricultural research and development, water control systems, and land infra-structure.
This report also examines output and input adjustments in China’s grain sector due tochanges in prices following adoption of the Household Responsibility System andexpansion of the system of rural free markets. The econometric analysis captures therelationships among outputs supplied and inputs demanded in a non-separable and jointproduction system characteristic of China’s multiproduct grain farms. Multiple produc-tion activities are the dominant structure of technology in China. Grain outputs arejointly produced and inputs are jointly employed, an important factor underlying thisstudy’s finding of a strong complementarity among outputs and among inputs. Studyresults also find that grain output is highly responsive to changes in input prices. Anincrease in the price for intermediate inputs/capital or wages would result in absolutereductions in all grain production as well as changes in the composition of grain produc-tion.
Each grain’s output is highly responsive to changes in that particular grain’s price, butthere is also a strong complementary supply/price relationship with other grains. Thatis, an increase in the output price for a particular grain would result in increased produc-tion of all grains. This result indirectly supports the finding from the growth accountinganalysis that the current heavy dependence on intermediate input use for productiongrowth could constrain growth in China’s grain production should wages or the prices ofinputs rise.
iv • China’s Grain Sector Economic Research Service/USDA • TB-1884
Future work in identifying and measuring the sources of growth in China’s agricultureshould focus on disaggregating to regions (or even provinces). National analysis mayobscure some important regional differences in productivity because of differences ineconomic development and agricultural practices across regions.
IntroductionChina’s agricultural output grew at an astonishing rateover the last 20 years following the introduction ofeconomic reforms in 1978. Grain output more thandoubled, rising to 490 million tons in 1998. Duringthat same period, China’s agricultural trade also grewvery rapidly (especially in the 1990’s), but more errati-cally than agricultural output. Only in the 1990’s didboth output and trade move upward. China’s agricul-tural imports rose from US $5.5 billion in 1990 to $10billion in 1996. Exports also rose substantially, butmostly in the early 1990’s as government policies dis-couraged grain exports after the mid-1990’s.
China’s changing role in world trade, both as animporter and exporter, has heightened the need tounderstand its production potential. AnticipatingChina’s production growth and adoption of productiontechnologies calls for an understanding of China’s pastproduction growth and output and input utilizationchoices. Especially important, for a whole host ofpolitical, social, and economic reasons, is to identifythe sources of growth in China’s grain sector andexamine the structure of its grain production.Moreover, in an era of stronger market orientation, itis also important to understand the role of output andfactor prices in generating supply or productionresponse.
Growth Accounting Analysis—Sources of Output Growth
Previous Studies and Background
The existing literature on China’s agricultural growthis insufficient to predict its potential. Most of thesestudies were conducted in the late 1980’s and early
1990’s, focusing on the period immediately followingthe introduction of rural reform. Moreover, with onlya handful of very recent exceptions, these studies werebased on the gross value of agricultural output(GVAO), with little information on joint production byChina’s household farms.
Most studies examining the early reform period (1978-85) are strongly influenced by the unusually highgrowth rate of China’s agricultural production in thatperiod. Even though many researchers recognized theimportance of institutional changes in the early growthof China’s agricultural production (see McMillan etal., 1989; Fan, 1991; Wen, 1993), they were unable topinpoint contributions of these changes versus techno-logical changes.
Lin (1992) attempted to identify the sources of totalfactor productivity (TFP) growth. TFP captures thegrowth in outputs not accounted for by the growth inproduction inputs (e.g., labor, capital, and fertilizer).In Lin’s study, TFP was analyzed by breaking out theindividual contributions of the introduction of thehousehold responsibility system (HRS) during 1978-84, changes in government purchase prices, and theexpansion in the system of rural free markets.However, because the study used aggregated agricul-tural data and covered only a few post-HRS years, it isdifficult to accurately gauge the potential of China’sfuture growth based on Lin’s analysis.
Huang and Rozelle (1996) successfully separated thecontribution of technological change in the growth ofproduction from other factors (including institutionalchange). However, the study covered only rice pro-duction.
In this study, we apply a growth accounting method todisaggregated national data for rice, wheat, corn, and
TB-1884 • Economic Research Service/USDA Cross-Commodity Analysis of China’s Grain Sector • 1
Cross-Commodity Analysis of China’s Grain Sector
Sources of Growth and Supply Response
soybeans from 1978 to 1997, measuring the differentsources of growth for these four grains. Data werecompiled from provincial data and aggregated to anational level to indicate China’s potential growth ingrain production. Carter, Chen, and Chu (1999) pro-vide a similarly disaggregated analysis of six cropsand two livestock products, but for only one province(Jiangsu). Agricultural production structure and pro-ductivity growth vary greatly across regions (Fan,1991), so it is hard to extrapolate national growthpotential from their study.
Our growth accounting analysis is divided into threeperiods that correspond to major shifts in China’s agri-cultural policy. The first period (1978-85) covers thetransformation of the old commune system to the family-based HRS. In the second period (1986-94),the reforms shift from the rural to the urban economy.The provincial governor’s grain responsibility system,which promotes grain production and self-sufficiency,marks the third period (1995-97). The growth rates ofthe four grains are observed to be quite different inthese three periods, implying strong institutional andpolicy impacts.
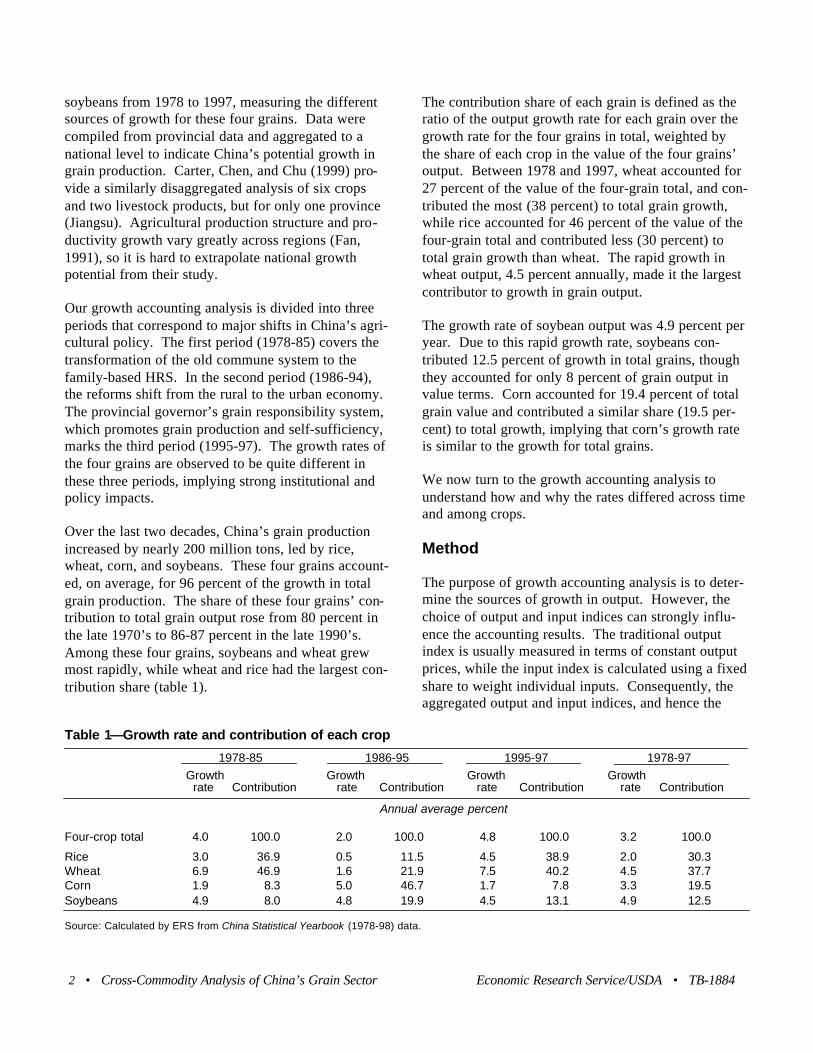
Over the last two decades, China’s grain productionincreased by nearly 200 million tons, led by rice,wheat, corn, and soybeans. These four grains account-ed, on average, for 96 percent of the growth in totalgrain production. The share of these four grains’ con-tribution to total grain output rose from 80 percent inthe late 1970’s to 86-87 percent in the late 1990’s.Among these four grains, soybeans and wheat grewmost rapidly, while wheat and rice had the largest con-tribution share (table 1).
The contribution share of each grain is defined as theratio of the output growth rate for each grain over thegrowth rate for the four grains in total, weighted bythe share of each crop in the value of the four grains’output. Between 1978 and 1997, wheat accounted for27 percent of the value of the four-grain total, and con-tributed the most (38 percent) to total grain growth,while rice accounted for 46 percent of the value of thefour-grain total and contributed less (30 percent) tototal grain growth than wheat. The rapid growth inwheat output, 4.5 percent annually, made it the largestcontributor to growth in grain output.
The growth rate of soybean output was 4.9 percent peryear. Due to this rapid growth rate, soybeans con-tributed 12.5 percent of growth in total grains, thoughthey accounted for only 8 percent of grain output invalue terms. Corn accounted for 19.4 percent of totalgrain value and contributed a similar share (19.5 per-cent) to total growth, implying that corn’s growth rateis similar to the growth for total grains.
We now turn to the growth accounting analysis tounderstand how and why the rates differed across timeand among crops.
Method
The purpose of growth accounting analysis is to deter-mine the sources of growth in output. However, thechoice of output and input indices can strongly influ-ence the accounting results. The traditional outputindex is usually measured in terms of constant outputprices, while the input index is calculated using a fixedshare to weight individual inputs. Consequently, theaggregated output and input indices, and hence the
2 • Cross-Commodity Analysis of China’s Grain Sector Economic Research Service/USDA • TB-1884
Table 1—Growth rate and contribution of each crop
1978-85 1986-95 1995-97 1978-97
Growth Growth Growth Growth rate Contribution rate Contribution rate Contribution rate Contribution
Annual average percent
Four-crop total 4.0 100.0 2.0 100.0 4.8 100.0 3.2 100.0
Rice 3.0 36.9 0.5 11.5 4.5 38.9 2.0 30.3Wheat 6.9 46.9 1.6 21.9 7.5 40.2 4.5 37.7Corn 1.9 8.3 5.0 46.7 1.7 7.8 3.3 19.5Soybeans 4.9 8.0 4.8 19.9 4.5 13.1 4.9 12.5
Source: Calculated by ERS from China Statistical Yearbook (1978-98) data.
estimated TFP, are likely to be biased if such tradition-al measures are used (Fan, 1997). This method wouldbe particularly problematic for the period we studybecause of China’s institutional reforms and subse-quent changes in production and input use structures.
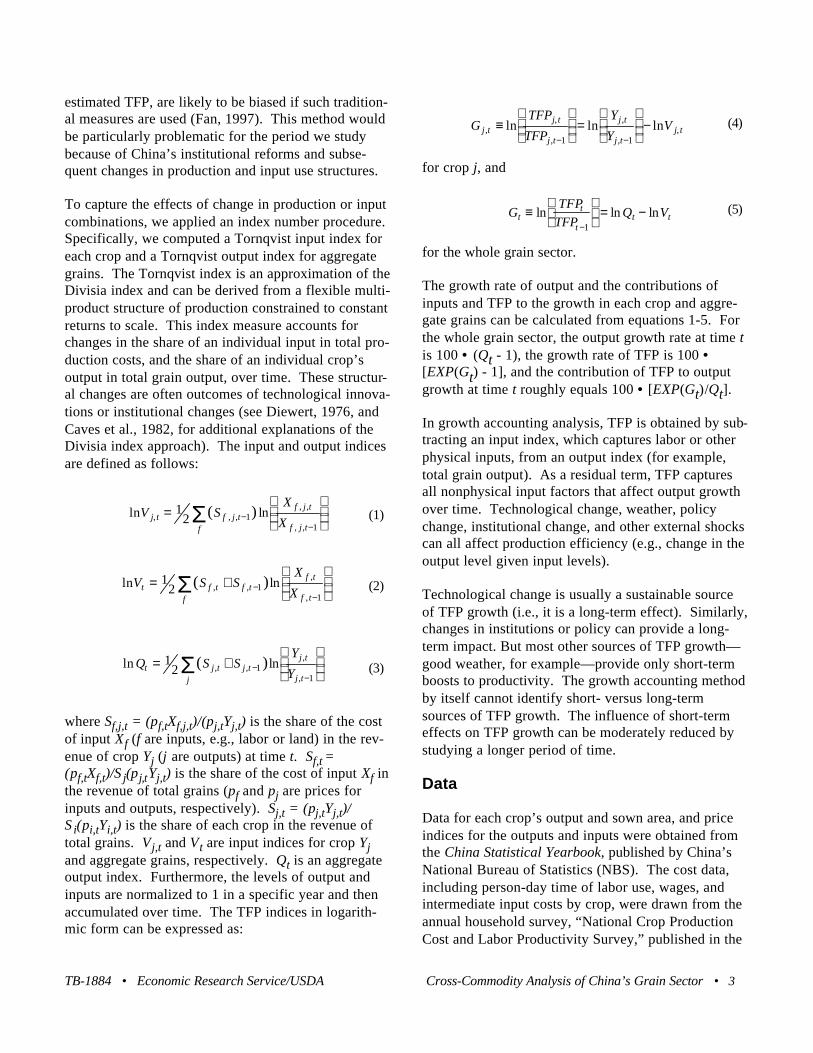
To capture the effects of change in production or inputcombinations, we applied an index number procedure.Specifically, we computed a Tornqvist input index foreach crop and a Tornqvist output index for aggregategrains. The Tornqvist index is an approximation of theDivisia index and can be derived from a flexible multi-product structure of production constrained to constantreturns to scale. This index measure accounts forchanges in the share of an individual input in total pro-duction costs, and the share of an individual crop’soutput in total grain output, over time. These structur-al changes are often outcomes of technological innova-tions or institutional changes (see Diewert, 1976, andCaves et al., 1982, for additional explanations of theDivisia index approach). The input and output indicesare defined as follows:
where Sf,j,t = (pf,tXf,j,t)/(pj,tYj,t) is the share of the costof input Xf (f are inputs, e.g., labor or land) in the rev-enue of crop Yj (j are outputs) at time t. Sf,t =(pf,tXf,t)/Σj(pj,tYj,t) is the share of the cost of input Xf inthe revenue of total grains (pf and pj are prices forinputs and outputs, respectively). Sj,t = (pj,tYj,t)/Σi(pi,tYi,t) is the share of each crop in the revenue oftotal grains. Vj,t and Vt are input indices for crop Yjand aggregate grains, respectively. Qt is an aggregateoutput index. Furthermore, the levels of output andinputs are normalized to 1 in a specific year and thenaccumulated over time. The TFP indices in logarith-mic form can be expressed as:
for crop j, and
for the whole grain sector.
The growth rate of output and the contributions ofinputs and TFP to the growth in each crop and aggre-gate grains can be calculated from equations 1-5. Forthe whole grain sector, the output growth rate at time tis 100 •(Qt - 1), the growth rate of TFP is 100 •[EXP(Gt) - 1], and the contribution of TFP to outputgrowth at time t roughly equals 100 •[EXP(Gt)/Qt].
In growth accounting analysis, TFP is obtained by sub-tracting an input index, which captures labor or otherphysical inputs, from an output index (for example,total grain output). As a residual term, TFP capturesall nonphysical input factors that affect output growthover time. Technological change, weather, policychange, institutional change, and other external shockscan all affect production efficiency (e.g., change in theoutput level given input levels).
Technological change is usually a sustainable sourceof TFP growth (i.e., it is a long-term effect). Similarly,changes in institutions or policy can provide a long-term impact. But most other sources of TFP growth—good weather, for example—provide only short-termboosts to productivity. The growth accounting methodby itself cannot identify short- versus long-termsources of TFP growth. The influence of short-termeffects on TFP growth can be moderately reduced bystudying a longer period of time.
Data
Data for each crop’s output and sown area, and priceindices for the outputs and inputs were obtained fromthe China Statistical Yearbook, published by China’sNational Bureau of Statistics (NBS). The cost data,including person-day time of labor use, wages, andintermediate input costs by crop, were drawn from theannual household survey, “National Crop ProductionCost and Labor Productivity Survey,” published in the
TB-1884 • Economic Research Service/USDA Cross-Commodity Analysis of China’s Grain Sector • 3
GTFP
TFP
Y
YVj t
j t
j t
j t
j tj t,
,
,
,
,,ln ln ln≡
=
−
− −1 1
ln ln, , ,, ,
, ,( )V S
X
Xj tf
f j tf j t
f j t=
−
−
12 1
1Σ
ln ln( ), ,,
,V S S
X
Xtf
f t f tf t
f t= +
−
−
12 1
1Σ
ln ln( ), ,,
,Q S S
Y
Ytj
j t j tj t
j t= +
−
−
12 1
1Σ
GTFP
TFPQ Vt
t
tt t≡
= −
−ln ln ln
1
(1)
(3)
(2)
(5)
(4)
China Rural Statistical Yearbook. The survey coversthe costs of intermediate inputs (fertilizers, pesticides,seeds, plastic sheeting, irrigation, energy, draft ani-mals, and capital depreciation, including small farmingtools, agricultural machinery, and other capital). Theintermediate input price index was obtained from theChina Statistical Yearbook and the China CommerceYearbook.
We aggregated inputs into three categories: land, labor,and intermediates/capital. Because only aggregatedata for variable expenses (costs of intermediateinputs) and fixed expenses (capital depreciation) werepublished, we defined intermediate and capital inputsas a single input. The implicit quantity associatedwith this input category is calculated by dividing itsexpenditure by the price index.
For land, we used area sown to each grain instead ofcultivated area because of the extensive multiple-crop-ping of grain in China. There were no data for landprices or returns to land. Thus, we assumed that netrevenue from each grain’s production—that is, grossrevenue minus the cost of labor and intermediates/cap-ital as well as tax payments—was the return to land.
China’s official statistics under-report actual cultivatedarea (Crook, 1993). This problem may spill over tosown area statistics, since sown area is the number oftimes a piece of land is planted multiplied by theamount of cultivated area. The majority of the report-ing error is believed to have occurred during the1960’s and early 1970’s as a result of collectivization,the formation of communes, and the CulturalRevolution. Even though the under-reporting of landartificially inflates the level of yields, the yield growthrates analyzed in this study are largely unaffectedbecause they reflect a more recent time period.
We measure labor as time spent (person-days) on eachcrop rather than the number of laborers in agriculturefor two reasons. First, most households raise manydifferent crops. Second, farmers generally spend onlypart of their time in agriculture because the small scaleof household plots provides for opportunities in non-farming sectors. The wage data from the survey weretoo low to accurately reflect the opportunity costs ofrural nonfarm labor. Since land is farmed mainly byindividual households rather than hired or nonfamilylabor, the underestimated returns to labor would be
captured in the returns to land. The indices for allthese data are reported in tables A1-A2 (see appendix).
Growth Accounting Analysis—Contribution of TFP
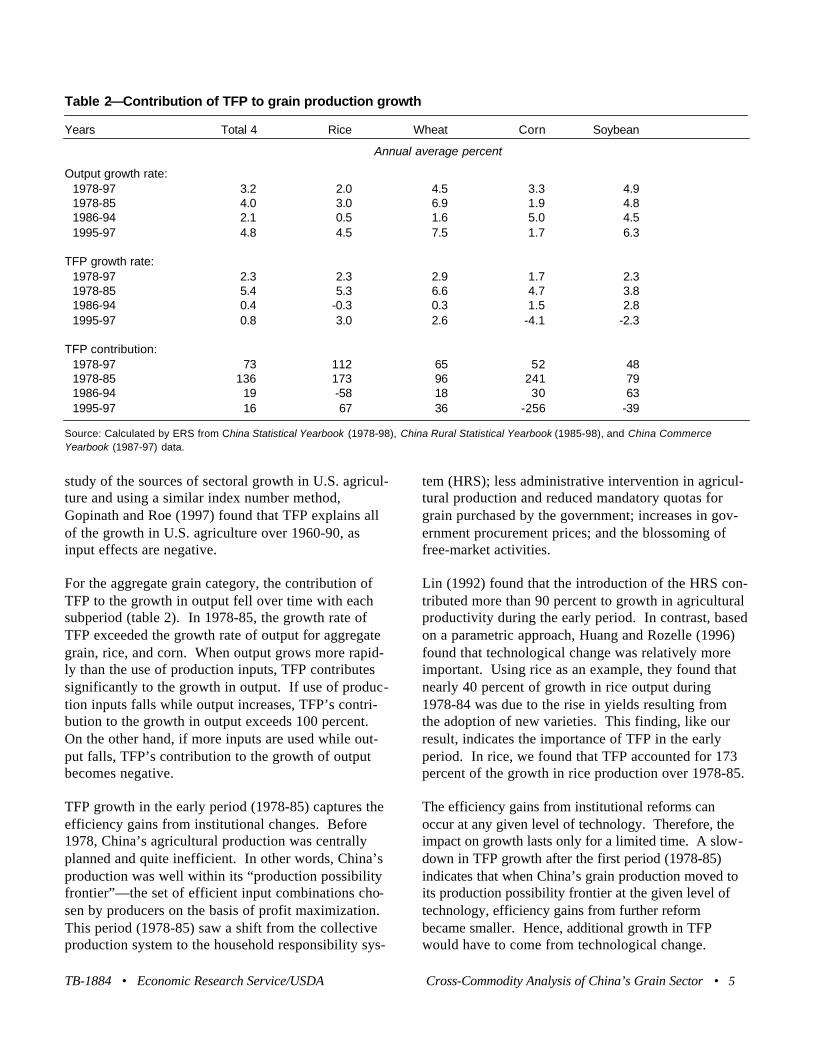
On average, growth in TFP contributed more than 70percent of the increase in total output of China’s fourmajor grains over the last two decades (table 2). TheTFP contribution is defined as the ratio of the TFPgrowth rate over the growth rate of grain output.Growth in rice production can be explained by TFPgrowth alone, while TFP contributed 48-65 percent ofoutput growth for soybeans, corn, and wheat.
Our study covers more of the post-reform contribu-tions of TFP to the growth of China’s grain sector thanmost. One recent exception, Carter et al. (1999), cov-ers a similar time period (1978-96) and compares agri-cultural productivity growth in China at national andprovincial (Jiangsu) levels. The study calculated TFPfor six crops in Jiangsu province, while the nationalanalysis is based on gross value of agricultural output.When the inputs were weighted, the TFP growth ratescalculated for the four grains in Jiangsu (1.9, 2.6, 3.3,and 2.7 percent for rice, wheat, corn, and soybeans)are comparable with our rates except for corn, whichis rarely produced in south China.
Many studies examine China’s agricultural productivi-ty during the 1980’s. For example, using a parametricapproach, Lin (1992) found that growth in TFP con-tributed about 50 percent of growth in total grain out-put in the periods 1978-84 and 1985-87. Based onFan’s (1997) growth accounting analysis, which alsoused Divisia input and output indices, TFP growth wasfound to contribute 77 and 70 percent of the growth inaggregate agricultural output (including livestock andother commodities) over the periods 1979-84 and1985-95, respectively. These results are comparablewith our 1978-97 estimates (table 2). However, ourresults show a much larger TFP contribution in theearly period and a much smaller TFP contribution inmore recent periods.
We also compared our results with studies of othercountries’ agricultural TFP. For example, using a sim-ilar index number method, Evenson et al. (1999) foundthat TFP growth contributed 55 percent of the growthin India’s total crop production during 1956-87. In a
4 • Cross-Commodity Analysis of China’s Grain Sector Economic Research Service/USDA • TB-1884
study of the sources of sectoral growth in U.S. agricul-ture and using a similar index number method,Gopinath and Roe (1997) found that TFP explains allof the growth in U.S. agriculture over 1960-90, asinput effects are negative.
For the aggregate grain category, the contribution ofTFP to the growth in output fell over time with eachsubperiod (table 2). In 1978-85, the growth rate ofTFP exceeded the growth rate of output for aggregategrain, rice, and corn. When output grows more rapid-ly than the use of production inputs, TFP contributessignificantly to the growth in output. If use of produc-tion inputs falls while output increases, TFP’s contri-bution to the growth in output exceeds 100 percent.On the other hand, if more inputs are used while out-put falls, TFP’s contribution to the growth of outputbecomes negative.
TFP growth in the early period (1978-85) captures theefficiency gains from institutional changes. Before1978, China’s agricultural production was centrallyplanned and quite inefficient. In other words, China’sproduction was well within its “production possibilityfrontier”—the set of efficient input combinations cho-sen by producers on the basis of profit maximization.This period (1978-85) saw a shift from the collectiveproduction system to the household responsibility sys-
tem (HRS); less administrative intervention in agricul-tural production and reduced mandatory quotas forgrain purchased by the government; increases in gov-ernment procurement prices; and the blossoming offree-market activities.
Lin (1992) found that the introduction of the HRS con-tributed more than 90 percent to growth in agriculturalproductivity during the early period. In contrast, basedon a parametric approach, Huang and Rozelle (1996)found that technological change was relatively moreimportant. Using rice as an example, they found thatnearly 40 percent of growth in rice output during1978-84 was due to the rise in yields resulting fromthe adoption of new varieties. This finding, like ourresult, indicates the importance of TFP in the earlyperiod. In rice, we found that TFP accounted for 173percent of the growth in rice production over 1978-85.
The efficiency gains from institutional reforms canoccur at any given level of technology. Therefore, theimpact on growth lasts only for a limited time. A slow-down in TFP growth after the first period (1978-85)indicates that when China’s grain production moved toits production possibility frontier at the given level oftechnology, efficiency gains from further reformbecame smaller. Hence, additional growth in TFPwould have to come from technological change.
TB-1884 • Economic Research Service/USDA Cross-Commodity Analysis of China’s Grain Sector • 5
Table 2—Contribution of TFP to grain production growth
Years Total 4 Rice Wheat Corn Soybean
Annual average percent
Output growth rate:1978-97 3.2 2.0 4.5 3.3 4.91978-85 4.0 3.0 6.9 1.9 4.81986-94 2.1 0.5 1.6 5.0 4.51995-97 4.8 4.5 7.5 1.7 6.3
TFP growth rate:1978-97 2.3 2.3 2.9 1.7 2.31978-85 5.4 5.3 6.6 4.7 3.81986-94 0.4 -0.3 0.3 1.5 2.81995-97 0.8 3.0 2.6 -4.1 -2.3
TFP contribution:1978-97 73 112 65 52 481978-85 136 173 96 241 791986-94 19 -58 18 30 631995-97 16 67 36 -256 -39
Source: Calculated by ERS from China Statistical Yearbook (1978-98), China Rural Statistical Yearbook (1985-98), and China CommerceYearbook (1987-97) data.
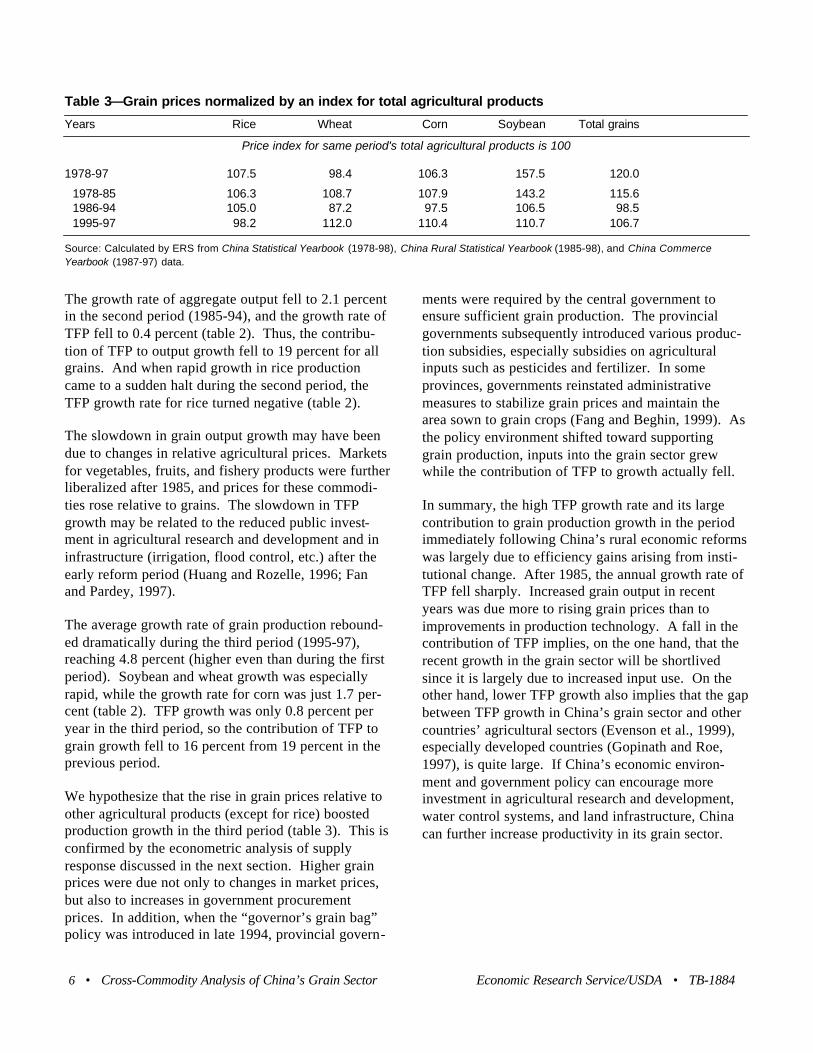
The growth rate of aggregate output fell to 2.1 percentin the second period (1985-94), and the growth rate ofTFP fell to 0.4 percent (table 2). Thus, the contribu-tion of TFP to output growth fell to 19 percent for allgrains. And when rapid growth in rice productioncame to a sudden halt during the second period, theTFP growth rate for rice turned negative (table 2).
The slowdown in grain output growth may have beendue to changes in relative agricultural prices. Marketsfor vegetables, fruits, and fishery products were furtherliberalized after 1985, and prices for these commodi-ties rose relative to grains. The slowdown in TFPgrowth may be related to the reduced public invest-ment in agricultural research and development and ininfrastructure (irrigation, flood control, etc.) after theearly reform period (Huang and Rozelle, 1996; Fanand Pardey, 1997).
The average growth rate of grain production rebound-ed dramatically during the third period (1995-97),reaching 4.8 percent (higher even than during the firstperiod). Soybean and wheat growth was especiallyrapid, while the growth rate for corn was just 1.7 per-cent (table 2). TFP growth was only 0.8 percent peryear in the third period, so the contribution of TFP tograin growth fell to 16 percent from 19 percent in theprevious period.
We hypothesize that the rise in grain prices relative toother agricultural products (except for rice) boostedproduction growth in the third period (table 3). This isconfirmed by the econometric analysis of supplyresponse discussed in the next section. Higher grainprices were due not only to changes in market prices,but also to increases in government procurementprices. In addition, when the “governor’s grain bag”policy was introduced in late 1994, provincial govern-
ments were required by the central government toensure sufficient grain production. The provincialgovernments subsequently introduced various produc-tion subsidies, especially subsidies on agriculturalinputs such as pesticides and fertilizer. In someprovinces, governments reinstated administrativemeasures to stabilize grain prices and maintain thearea sown to grain crops (Fang and Beghin, 1999). Asthe policy environment shifted toward supportinggrain production, inputs into the grain sector grewwhile the contribution of TFP to growth actually fell.
In summary, the high TFP growth rate and its largecontribution to grain production growth in the periodimmediately following China’s rural economic reformswas largely due to efficiency gains arising from insti-tutional change. After 1985, the annual growth rate ofTFP fell sharply. Increased grain output in recentyears was due more to rising grain prices than toimprovements in production technology. A fall in thecontribution of TFP implies, on the one hand, that therecent growth in the grain sector will be shortlivedsince it is largely due to increased input use. On theother hand, lower TFP growth also implies that the gapbetween TFP growth in China’s grain sector and othercountries’ agricultural sectors (Evenson et al., 1999),especially developed countries (Gopinath and Roe,1997), is quite large. If China’s economic environ-ment and government policy can encourage moreinvestment in agricultural research and development,water control systems, and land infrastructure, Chinacan further increase productivity in its grain sector.
6 • Cross-Commodity Analysis of China’s Grain Sector Economic Research Service/USDA • TB-1884
Table 3—Grain prices normalized by an index for total agricultural products
Years Rice Wheat Corn Soybean Total grains
Price index for same period's total agricultural products is 100
1978-97 107.5 98.4 106.3 157.5 120.0
1978-85 106.3 108.7 107.9 143.2 115.61986-94 105.0 87.2 97.5 106.5 98.51995-97 98.2 112.0 110.4 110.7 106.7
Source: Calculated by ERS from China Statistical Yearbook (1978-98), China Rural Statistical Yearbook (1985-98), and China CommerceYearbook (1987-97) data.
Growth Accounting Analysis—Contribution of Intermediate Inputs and Capital
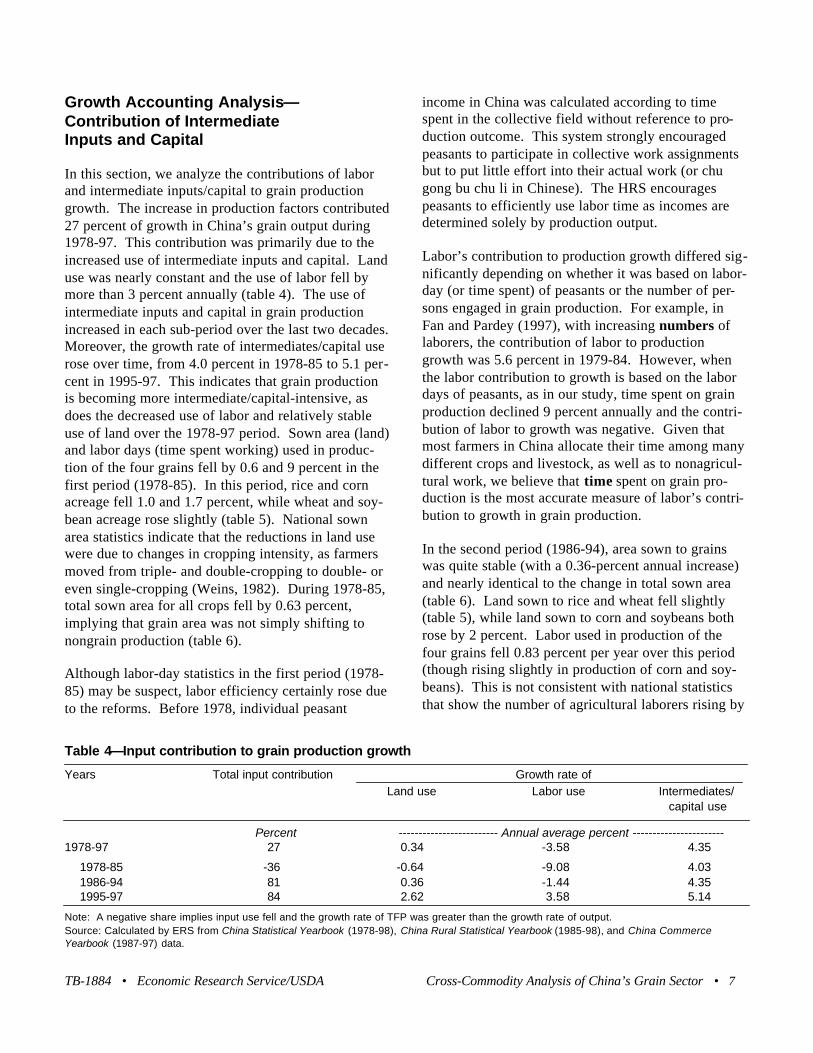
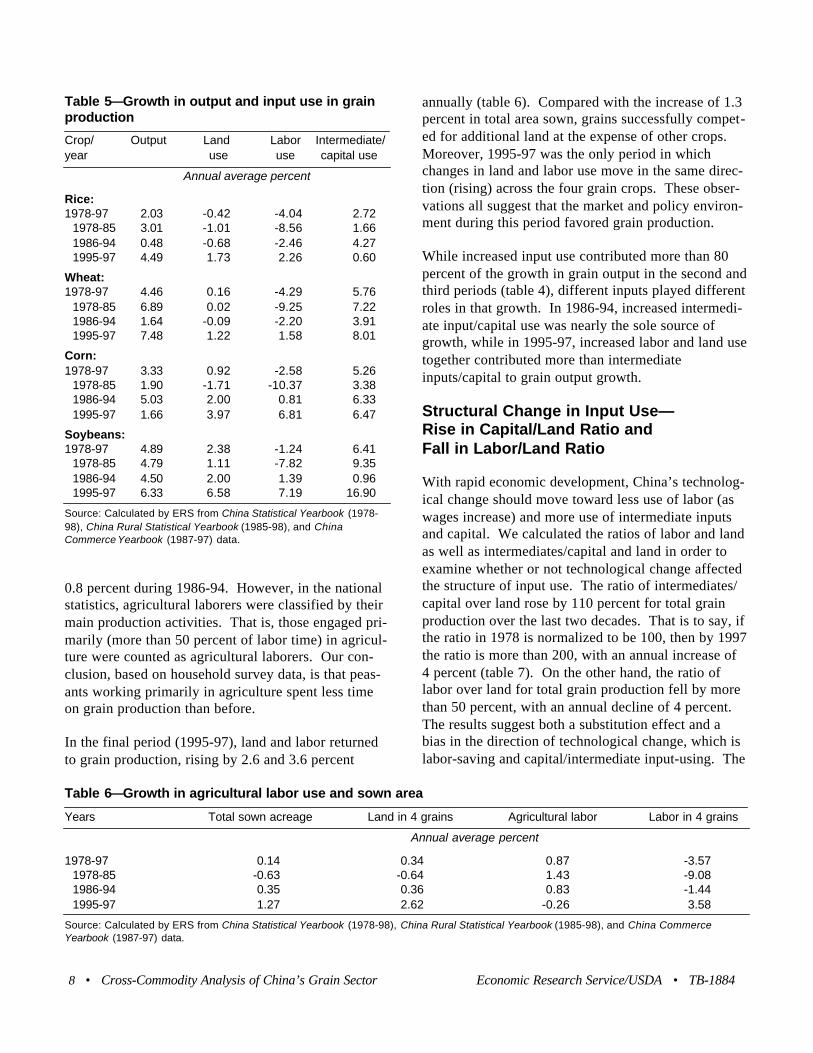
In this section, we analyze the contributions of laborand intermediate inputs/capital to grain productiongrowth. The increase in production factors contributed27 percent of growth in China’s grain output during1978-97. This contribution was primarily due to theincreased use of intermediate inputs and capital. Landuse was nearly constant and the use of labor fell bymore than 3 percent annually (table 4). The use ofintermediate inputs and capital in grain productionincreased in each sub-period over the last two decades.Moreover, the growth rate of intermediates/capital userose over time, from 4.0 percent in 1978-85 to 5.1 per-cent in 1995-97. This indicates that grain productionis becoming more intermediate/capital-intensive, asdoes the decreased use of labor and relatively stableuse of land over the 1978-97 period. Sown area (land)and labor days (time spent working) used in produc-tion of the four grains fell by 0.6 and 9 percent in thefirst period (1978-85). In this period, rice and cornacreage fell 1.0 and 1.7 percent, while wheat and soy-bean acreage rose slightly (table 5). National sownarea statistics indicate that the reductions in land usewere due to changes in cropping intensity, as farmersmoved from triple- and double-cropping to double- oreven single-cropping (Weins, 1982). During 1978-85,total sown area for all crops fell by 0.63 percent,implying that grain area was not simply shifting tonongrain production (table 6).
Although labor-day statistics in the first period (1978-85) may be suspect, labor efficiency certainly rose dueto the reforms. Before 1978, individual peasant
income in China was calculated according to timespent in the collective field without reference to pro-duction outcome. This system strongly encouragedpeasants to participate in collective work assignmentsbut to put little effort into their actual work (or chugong bu chu li in Chinese). The HRS encouragespeasants to efficiently use labor time as incomes aredetermined solely by production output.
Labor’s contribution to production growth differed sig-nificantly depending on whether it was based on labor-day (or time spent) of peasants or the number of per-sons engaged in grain production. For example, inFan and Pardey (1997), with increasing numbers oflaborers, the contribution of labor to productiongrowth was 5.6 percent in 1979-84. However, whenthe labor contribution to growth is based on the labordays of peasants, as in our study, time spent on grainproduction declined 9 percent annually and the contri-bution of labor to growth was negative. Given thatmost farmers in China allocate their time among manydifferent crops and livestock, as well as to nonagricul-tural work, we believe that time spent on grain pro-duction is the most accurate measure of labor’s contri-bution to growth in grain production.
In the second period (1986-94), area sown to grainswas quite stable (with a 0.36-percent annual increase)and nearly identical to the change in total sown area(table 6). Land sown to rice and wheat fell slightly(table 5), while land sown to corn and soybeans bothrose by 2 percent. Labor used in production of thefour grains fell 0.83 percent per year over this period(though rising slightly in production of corn and soy-beans). This is not consistent with national statisticsthat show the number of agricultural laborers rising by
TB-1884 • Economic Research Service/USDA Cross-Commodity Analysis of China’s Grain Sector • 7
Table 4—Input contribution to grain production growth
Years Total input contribution Growth rate ofLand use Labor use Intermediates/
capital use
Percent ------------------------- Annual average percent -----------------------1978-97 27 0.34 -3.58 4.35
1978-85 -36 -0.64 -9.08 4.031986-94 81 0.36 -1.44 4.351995-97 84 2.62 3.58 5.14
Note: A negative share implies input use fell and the growth rate of TFP was greater than the growth rate of output.Source: Calculated by ERS from China Statistical Yearbook (1978-98), China Rural Statistical Yearbook (1985-98), and China CommerceYearbook (1987-97) data.
0.8 percent during 1986-94. However, in the nationalstatistics, agricultural laborers were classified by theirmain production activities. That is, those engaged pri-marily (more than 50 percent of labor time) in agricul-ture were counted as agricultural laborers. Our con-clusion, based on household survey data, is that peas-ants working primarily in agriculture spent less timeon grain production than before.
In the final period (1995-97), land and labor returnedto grain production, rising by 2.6 and 3.6 percent
annually (table 6). Compared with the increase of 1.3percent in total area sown, grains successfully compet-ed for additional land at the expense of other crops.Moreover, 1995-97 was the only period in whichchanges in land and labor use move in the same direc-tion (rising) across the four grain crops. These obser-vations all suggest that the market and policy environ-ment during this period favored grain production.
While increased input use contributed more than 80percent of the growth in grain output in the second andthird periods (table 4), different inputs played differentroles in that growth. In 1986-94, increased intermedi-ate input/capital use was nearly the sole source ofgrowth, while in 1995-97, increased labor and land usetogether contributed more than intermediateinputs/capital to grain output growth.
Structural Change in Input Use—Rise in Capital/Land Ratio and Fall in Labor/Land Ratio
With rapid economic development, China’s technolog-ical change should move toward less use of labor (aswages increase) and more use of intermediate inputsand capital. We calculated the ratios of labor and landas well as intermediates/capital and land in order toexamine whether or not technological change affectedthe structure of input use. The ratio of intermediates/capital over land rose by 110 percent for total grainproduction over the last two decades. That is to say, ifthe ratio in 1978 is normalized to be 100, then by 1997the ratio is more than 200, with an annual increase of4 percent (table 7). On the other hand, the ratio oflabor over land for total grain production fell by morethan 50 percent, with an annual decline of 4 percent.The results suggest both a substitution effect and abias in the direction of technological change, which islabor-saving and capital/intermediate input-using. The
8 • Cross-Commodity Analysis of China’s Grain Sector Economic Research Service/USDA • TB-1884
Table 5—Growth in output and input use in grainproduction
Crop/ Output Land Labor Intermediate/year use use capital use
Annual average percent
Rice:1978-97 2.03 -0.42 -4.04 2.72
1978-85 3.01 -1.01 -8.56 1.661986-94 0.48 -0.68 -2.46 4.271995-97 4.49 1.73 2.26 0.60
Wheat:1978-97 4.46 0.16 -4.29 5.76
1978-85 6.89 0.02 -9.25 7.221986-94 1.64 -0.09 -2.20 3.911995-97 7.48 1.22 1.58 8.01
Corn:1978-97 3.33 0.92 -2.58 5.26
1978-85 1.90 -1.71 -10.37 3.381986-94 5.03 2.00 0.81 6.331995-97 1.66 3.97 6.81 6.47
Soybeans:1978-97 4.89 2.38 -1.24 6.41
1978-85 4.79 1.11 -7.82 9.351986-94 4.50 2.00 1.39 0.961995-97 6.33 6.58 7.19 16.90
Source: Calculated by ERS from China Statistical Yearbook (1978-98), China Rural Statistical Yearbook (1985-98), and ChinaCommerce Yearbook (1987-97) data.
Table 6—Growth in agricultural labor use and sown area
Years Total sown acreage Land in 4 grains Agricultural labor Labor in 4 grains
Annual average percent
1978-97 0.14 0.34 0.87 -3.571978-85 -0.63 -0.64 1.43 -9.081986-94 0.35 0.36 0.83 -1.441995-97 1.27 2.62 -0.26 3.58
Source: Calculated by ERS from China Statistical Yearbook (1978-98), China Rural Statistical Yearbook (1985-98), and China CommerceYearbook (1987-97) data.
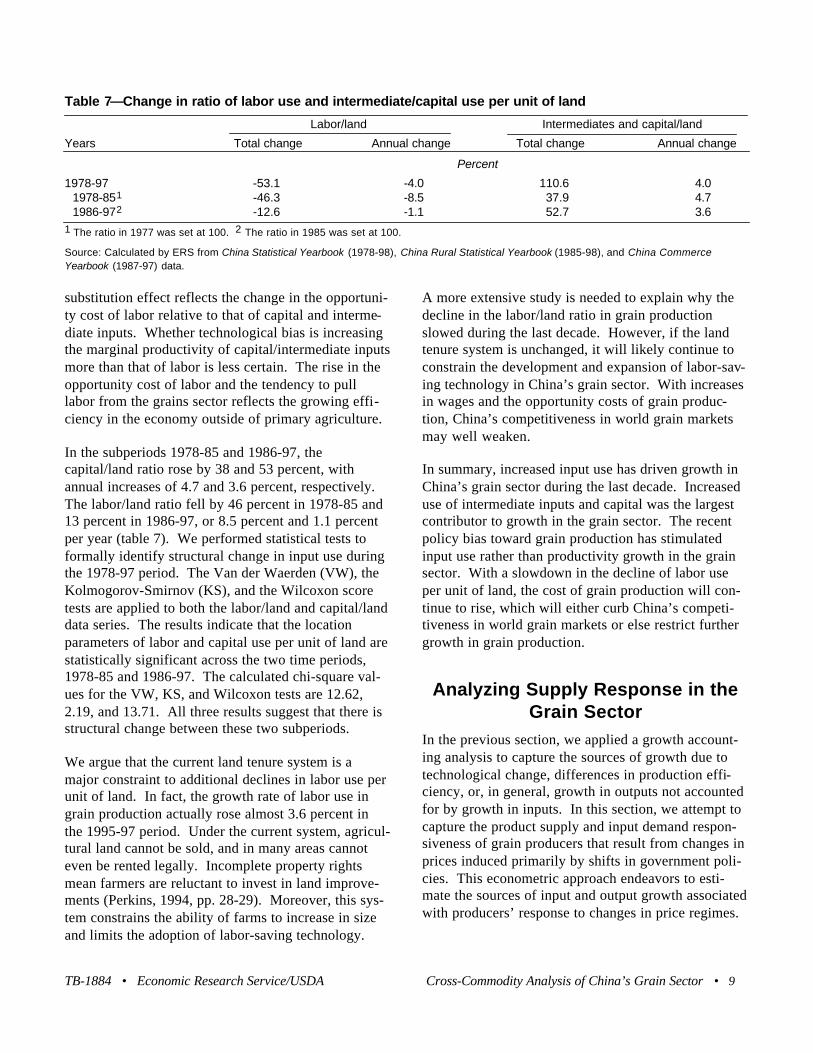
substitution effect reflects the change in the opportuni-ty cost of labor relative to that of capital and interme-diate inputs. Whether technological bias is increasingthe marginal productivity of capital/intermediate inputsmore than that of labor is less certain. The rise in theopportunity cost of labor and the tendency to pulllabor from the grains sector reflects the growing effi-ciency in the economy outside of primary agriculture.
In the subperiods 1978-85 and 1986-97, thecapital/land ratio rose by 38 and 53 percent, withannual increases of 4.7 and 3.6 percent, respectively.The labor/land ratio fell by 46 percent in 1978-85 and13 percent in 1986-97, or 8.5 percent and 1.1 percentper year (table 7). We performed statistical tests toformally identify structural change in input use duringthe 1978-97 period. The Van der Waerden (VW), theKolmogorov-Smirnov (KS), and the Wilcoxon scoretests are applied to both the labor/land and capital/landdata series. The results indicate that the locationparameters of labor and capital use per unit of land arestatistically significant across the two time periods,1978-85 and 1986-97. The calculated chi-square val-ues for the VW, KS, and Wilcoxon tests are 12.62,2.19, and 13.71. All three results suggest that there isstructural change between these two subperiods.
We argue that the current land tenure system is amajor constraint to additional declines in labor use perunit of land. In fact, the growth rate of labor use ingrain production actually rose almost 3.6 percent inthe 1995-97 period. Under the current system, agricul-tural land cannot be sold, and in many areas cannoteven be rented legally. Incomplete property rightsmean farmers are reluctant to invest in land improve-ments (Perkins, 1994, pp. 28-29). Moreover, this sys-tem constrains the ability of farms to increase in sizeand limits the adoption of labor-saving technology.
A more extensive study is needed to explain why thedecline in the labor/land ratio in grain productionslowed during the last decade. However, if the landtenure system is unchanged, it will likely continue toconstrain the development and expansion of labor-sav-ing technology in China’s grain sector. With increasesin wages and the opportunity costs of grain produc-tion, China’s competitiveness in world grain marketsmay well weaken.
In summary, increased input use has driven growth inChina’s grain sector during the last decade. Increaseduse of intermediate inputs and capital was the largestcontributor to growth in the grain sector. The recentpolicy bias toward grain production has stimulatedinput use rather than productivity growth in the grainsector. With a slowdown in the decline of labor useper unit of land, the cost of grain production will con-tinue to rise, which will either curb China’s competi-tiveness in world grain markets or else restrict furthergrowth in grain production.
Analyzing Supply Response in theGrain Sector
In the previous section, we applied a growth account-ing analysis to capture the sources of growth due totechnological change, differences in production effi-ciency, or, in general, growth in outputs not accountedfor by growth in inputs. In this section, we attempt tocapture the product supply and input demand respon-siveness of grain producers that result from changes inprices induced primarily by shifts in government poli-cies. This econometric approach endeavors to esti-mate the sources of input and output growth associatedwith producers’ response to changes in price regimes.
TB-1884 • Economic Research Service/USDA Cross-Commodity Analysis of China’s Grain Sector • 9
Table 7—Change in ratio of labor use and intermediate/capital use per unit of land
Labor/land Intermediates and capital/land
Years Total change Annual change Total change Annual change
Percent
1978-97 -53.1 -4.0 110.6 4.01978-851 -46.3 -8.5 37.9 4.71986-972 -12.6 -1.1 52.7 3.6
1 The ratio in 1977 was set at 100. 2 The ratio in 1985 was set at 100.
Source: Calculated by ERS from China Statistical Yearbook (1978-98), China Rural Statistical Yearbook (1985-98), and China CommerceYearbook (1987-97) data.
In the growth accounting analysis, we did not need toaddress functional representation of the underlyingtechnology or structural assumptions—such as separa-bility in output prices and nonjointness in inputs—thatare associated with multiproduct technology in agri-cultural supply response studies. In this section, wecapture all information relevant to China’s grain pro-duction structure using a restricted profit function, andempirically estimate grain production technology. Wealso measure the substitution and expansion (scale)effects for both inputs and outputs and conduct tests todetermine whether the data are consistent with separa-ble and nonjoint technology.
The parametrical approach attempts to capture theadjustments of output and input utilization choices inChina’s grain sector due to changes in prices mainlyinduced by adoption of the HRS and the expansion ofthe rural free market system. We estimate a coherentset of interrelated supply functions and input demandfunctions for the four grains, approximate the technol-ogy within a multiproduct framework by a restrictedprofit function, and test various production decisions.The input indexes constructed for each grain subsectorand for the aggregate sector are consistent with theeconomic principles linking aggregate and individualsector accounts without compromising the economicintegrity of the accounts. The data used for the para-metric analysis are the same as used in the previoussection (see appendix tables 1-2). The supplyresponse analysis helps to identify the economicbehavior of farmers and their responsiveness withinthe properties of the multiproduct production specifi-cation. Together, the growth accounting and supplyresponse approaches provide complementary perspec-tives on China’s agricultural growth potential.
Separability of technology assumes that prices withina group satisfy the requirements for consistent aggre-gation, in our case, into a total grain sector (Berndtand Wood, 1975; Lau, 1978). That is, with separabili-ty, the prices of each individual grain subsector do notdepend on prices of other production activities outsidethe grain sector as a whole. The grain subsectors canbe combined into an aggregate grain sector, the priceof which is then a function of output and input produc-tion activities (outside the grain sector) that alwaysmove in fixed proportions. On the other hand, therejection of separability in output prices implies thatthe individual grain subsectors cannot consistently be
aggregated across the system into one aggregate grainsector and the production of grains in this case can becharacterized by a nonseparable technology.1
Nonjointness in inputs means that when a commodityis produced by a nonjoint technology, decisions aboutits production are independent of decisions about theother products in the group (Lau, 1978). Nonjointnessin inputs implies that the supply of a grain subsectorcan be examined without regard to other productprices and that the level of each output is independentof the prices of competing outputs. This is a necessaryimplicit assumption made for single-commodity pro-duction studies. A single-output approach does notallow measurement of the interdependencies amongoutputs and the differential effects of various outputson factor demand. The rejection of nonjointness ininputs of the grain subsectors, which is explored laterin the study, implies that important interactions arepresent in the production of all grains in China.
Because of the potential interactions among grainsinduced by China’s rural economic reforms, and thepotential for nonjointness in particular, we estimatedoutput supply and input demand elasticities by a sys-tem of equations derived from a restricted profit-maxi-mization specification. In China, a season of winterwheat is often followed by a season of late rice in thesouth, while winter wheat is followed by a season ofsummer corn in the north. Soybeans are often inter-cropped with other crops in both the south and thenorth. These multiproduct farming systems withinhouseholds strongly suggest that the production supplyresponse of each grain cannot be estimated independ-ently and, thus, that the system is likely to be charac-terized by joint production. This means that the pro-duction level of each grain can be affected by theprices of other competing grains.
The grain sector’s technology is assumed to relate twovariable inputs (labor and intermediates/ capital), afixed input (land), and four outputs (the four grains).Let Y = (Y1,…,Y6 ) be the vector of output and vari-able inputs. When Yi > 0, i=1,…,4, it represents anoutput, when Yi < 0, i=5,6, it represents a variableinput, and X is a fixed input (land). In addition, tech-
10 • Cross-Commodity Analysis of China’s Grain Sector Economic Research Service/USDA • TB-1884
1 In the growth accounting analysis, we constructed individualindexes for total outputs and inputs and for each grain subsector.The estimates of productivity growth do not require that outputsand inputs be separable (see Ball, 1985).
nology is assumed to exhibit constant returns to scale.Let P = (P1,…,P6) denote a vector of prices for out-puts and inputs. Then the restricted profit, π(P;X), isapproximated by the translog function with arguments,P and t, where t indexes the time:
with the following restrictions:
Using Hotelling’s lemma,
on equation 6 yields the share equations (Si) that arelinear in normalized prices:
Equation 7, representing the maintained or uncon-strained model, is used to estimate product supply andinput demand relations and to test the hypotheses ofnonjoint and separable technology. The input dataused to estimate equation 7 can be found in appendixtable A3. In estimating equation 7, we used a maxi-mum-likelihood approach, taking into account convex-ity restrictions, meaning that the Hessian matrix of therestricted-profit function is positive semidefinite (Lau,1978; Ball, 1988). The imposition of the constraintsdoes not affect the Cramer-Rao lower bound for thevariance of the estimator (Rothenberg, 1974). Thesystem is estimated using the General AlgebraicModeling System.
Product Supply and Input Demand
Estimates of the parameters of the six supply-demandequations are reported in appendix table A4. The esti-mated parameters provide new evidence about thestructure of production on China’s grain farms during1978-97. All own-price coefficients have the expected
sign, which is consistent with expectations, and all aresignificantly different from zero at the 5-percent level.In other words, the output supply and factor demandequations possess properties that are consistent withunderlying profit maximation theory. The parameterestimates satisfy the homogeneity and symmetry con-ditions and the estimated model was constrained togive a positive semidefinite Hessian matrix in prices.This implies that the output-supply equations have theexpected own-price elasticity signs.
Consistent with the disaggregated estimates, rice andwheat are product substitutes with each other, and withcorn and soybeans, since the estimated parameters arenegative (see appendix table A4). On the other hand,the estimated positive parameters for corn and soy-beans indicate a complementary or joint productiontechnology.
After we incorporated into the maintained model theappropriate restrictions that are associated with weakseparability in output prices, we estimated this restrict-ed model. Then, we performed a maximum likelihoodtest for the restricted and the maintained model basedon the hypothesis that the production technologyexhibits weak separability in output prices. Our testrejected the null hypothesis at the 1-percent level ofstatistical significance (see appendix table A5), mean-ing that the system is nonseparable. This implies thatwe cannot aggregate the grain subsectors into one grainsector. Also, a third model was specified and estimatedto account for nonjointness in inputs by incorporatingthe appropriate restrictions into the maintained model.When we performed the maximum-likelihood test com-paring the nonjointed technology model with the main-tained model, we rejected the hypothesis that the tech-nology of grains exhibits nonjointness in inputs at the1-percent level of statistical significance (see appendixtable A5). Thus, we conclude that China’s grain sys-tem follows a joint technology.
The results of these tests on the structure of grain tech-nology are consistent with the observation that multi-ple production activities are the dominant croppingstyle in China, where the production or input require-ments relate multiple outputs and multiple inputs.This also implies that the supply response of eachgrain should not be estimated independently as theproduction of grains is interrelated and depends uponthe decisions regarding other grains. In short, aggre-
TB-1884 • Economic Research Service/USDA Cross-Commodity Analysis of China’s Grain Sector • 11
ln ln ln ln
ln ln ln
π α α β
ρ γ ϑ
= + + ⋅
+ + ⋅+ +
= = =
= =
01
612
1
6
1
6
1
6
1
612
2
ti i
i jij i j
ii i
ii i
P P P
P X P t t t
Σ ΣΣ
Σ Σ Θ
β β α β ρ γij jii
ii
iji
ii
i= = = = == = = =
; ;1
6
1
6
1
6
1
6
1 0Σ Σ Σ Σ
∂ π∂ π
lnln P
PYS
i
i ii= =
S P X t ii ij
ij j i i= + + + ==
α β ρ γ1
6
1 6Σ ln ln , ,...,
(6)
(7)
gation across grain subsectors is not consistent withthe structure of grain technology in China.
Estimates of Supply and Demand Elasticities
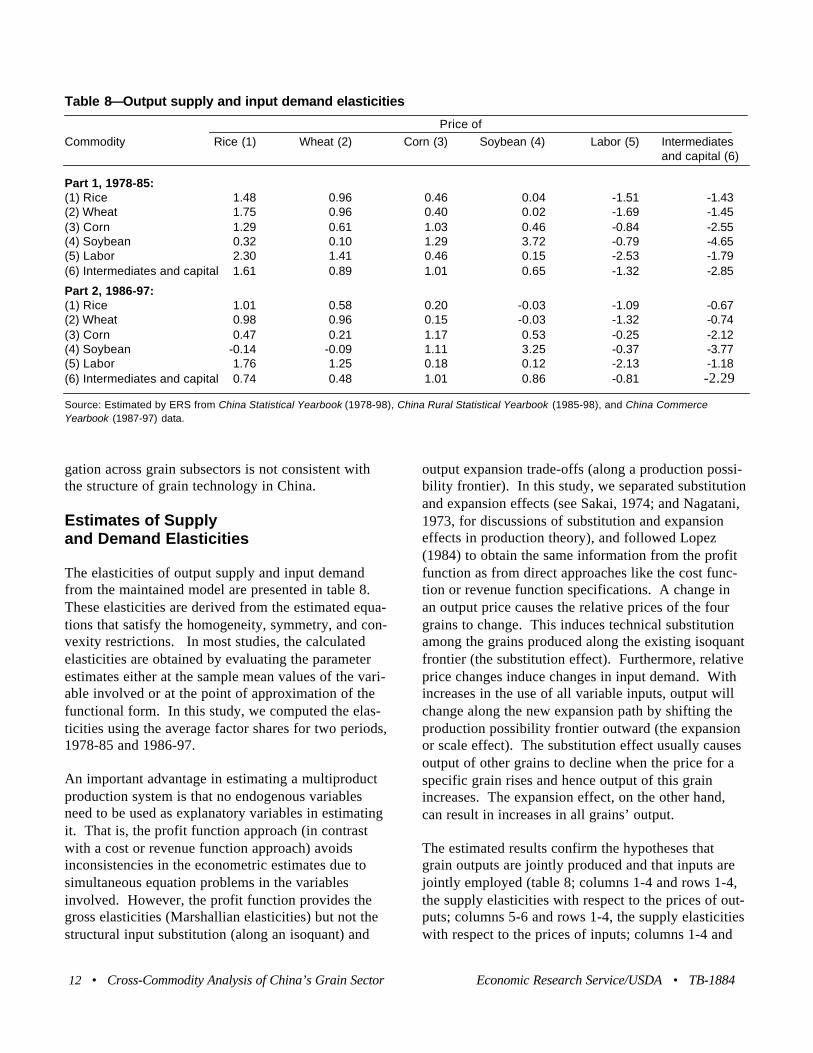
The elasticities of output supply and input demandfrom the maintained model are presented in table 8.These elasticities are derived from the estimated equa-tions that satisfy the homogeneity, symmetry, and con-vexity restrictions. In most studies, the calculatedelasticities are obtained by evaluating the parameterestimates either at the sample mean values of the vari-able involved or at the point of approximation of thefunctional form. In this study, we computed the elas-ticities using the average factor shares for two periods,1978-85 and 1986-97.
An important advantage in estimating a multiproductproduction system is that no endogenous variablesneed to be used as explanatory variables in estimatingit. That is, the profit function approach (in contrastwith a cost or revenue function approach) avoidsinconsistencies in the econometric estimates due tosimultaneous equation problems in the variablesinvolved. However, the profit function provides thegross elasticities (Marshallian elasticities) but not thestructural input substitution (along an isoquant) and
output expansion trade-offs (along a production possi-bility frontier). In this study, we separated substitutionand expansion effects (see Sakai, 1974; and Nagatani,1973, for discussions of substitution and expansioneffects in production theory), and followed Lopez(1984) to obtain the same information from the profitfunction as from direct approaches like the cost func-tion or revenue function specifications. A change inan output price causes the relative prices of the fourgrains to change. This induces technical substitutionamong the grains produced along the existing isoquantfrontier (the substitution effect). Furthermore, relativeprice changes induce changes in input demand. Withincreases in the use of all variable inputs, output willchange along the new expansion path by shifting theproduction possibility frontier outward (the expansionor scale effect). The substitution effect usually causesoutput of other grains to decline when the price for aspecific grain rises and hence output of this grainincreases. The expansion effect, on the other hand,can result in increases in all grains’ output.
The estimated results confirm the hypotheses thatgrain outputs are jointly produced and that inputs arejointly employed (table 8; columns 1-4 and rows 1-4,the supply elasticities with respect to the prices of out-puts; columns 5-6 and rows 1-4, the supply elasticitieswith respect to the prices of inputs; columns 1-4 and
12 • Cross-Commodity Analysis of China’s Grain Sector Economic Research Service/USDA • TB-1884
Table 8—Output supply and input demand elasticities
Price of
Commodity Rice (1) Wheat (2) Corn (3) Soybean (4) Labor (5) Intermediatesand capital (6)
Part 1, 1978-85:(1) Rice 1.48 0.96 0.46 0.04 -1.51 -1.43(2) Wheat 1.75 0.96 0.40 0.02 -1.69 -1.45(3) Corn 1.29 0.61 1.03 0.46 -0.84 -2.55(4) Soybean 0.32 0.10 1.29 3.72 -0.79 -4.65(5) Labor 2.30 1.41 0.46 0.15 -2.53 -1.79(6) Intermediates and capital 1.61 0.89 1.01 0.65 -1.32 -2.85
Part 2, 1986-97:(1) Rice 1.01 0.58 0.20 -0.03 -1.09 -0.67(2) Wheat 0.98 0.96 0.15 -0.03 -1.32 -0.74(3) Corn 0.47 0.21 1.17 0.53 -0.25 -2.12(4) Soybean -0.14 -0.09 1.11 3.25 -0.37 -3.77(5) Labor 1.76 1.25 0.18 0.12 -2.13 -1.18(6) Intermediates and capital 0.74 0.48 1.01 0.86 -0.81 -2.29
Source: Estimated by ERS from China Statistical Yearbook (1978-98), China Rural Statistical Yearbook (1985-98), and China CommerceYearbook (1987-97) data.

rows 5-6, the demand elasticities with respect to theprices of outputs; and columns 5-6 and rows 5-6, thedemand elasticities with respect to the prices ofinputs). Input usage varies across grain subsectors.The labor and capital elasticities (table 8, columns 1-4and rows 5-6) capture the effects of output prices onthe marginal cost of each grain subsector’s production.As the elasticities for rice and wheat are very elastic,any increase in labor or capital cost would affect theproduction of these crops much more than the produc-tion of the other grains. The supply elasticity of eachgrain’s production to its own price is generally greaterthan unity and more elastic than to prices for the othergrains, which implies the dominance of own effectsover cross effects (Sakai, 1974). Own-price elastici-ties range from 0.96 for wheat to 3.72 for soybeans inthe period 1978-85 (table 8, part 1, columns 1-4 androws 1-4). Since the own-price elasticities of soy-beans, corn, and rice are greater than unity, while thatof wheat is less than unity, the supply response andconsequently planting options for soybeans, corn, andrice producers are greater than for wheat producers.The cross-elasticities are positive, suggesting that anincrease in the output price for a particular grainwould result in increased production of all grains’ out-puts (the scale effect). However, the cross-elasticitiesfor all grains are not price elastic.
When the 1986-97 period is compared with 1978-85,the own-price elasticity of rice and soybeans decreasedby 32 and 13 percent respectively, the own price elas-ticity of corn increased by 3 percent, and the ownprice elasticity for wheat remained the same. Alsoduring the latter period, a competitive relationship isobserved for soybeans and rice as well as soybeansand wheat (the substitution effect). In general, themagnitude of all elasticities, own and cross, decreasedin this period, implying both smaller substitution andscale effects. This might have been the consequenceof changes in relative agricultural prices as prices fornon-grain crops started to increase relative to that ofgrains. This finding complements the conclusions ofthe growth accounting analysis, which indicated thatgrowth rate of aggregate output slowed significantlyduring 1986-97, especially for rice and wheat.
The large magnitude of the labor and intermediates/capital elasticities in the 1978-85 period indicates thatthe increase in input usage for rice and wheat produc-tion might have resulted in the shift of the product
transformation frontier outwards (the expansion effect,see table 8, part 1, columns 1-4 and rows 5-6). Thisshift consequently allowed increased production in alloutputs (gross complementarity of outputs) in thisperiod. During the 1986-97 period, however, the laborand intermediates/capital elasticities declined com-pared with that of the early period (table 8, part 2,columns 1-4 and rows 5-6). The results in table 8indicate that the rice and wheat subsectors are moresensitive to increases in labor costs than the corn andsoybean subsectors, since their responses to change inwages are very elastic (1.76 and 1.25 respectively).This also implies that as the opportunities for farmlabor employment in the non-agricultural sectorincrease, due to the overall economic development ofChina, the cost of rice and wheat production mightalso increase considerably. On the other hand, theelasticity of capital in soybean production increasedcompared with that in the early period by 32 percent,implying that the soybean subsector became more sen-sitive to the cost of intermediate inputs and capital.
The supply response elasticities to factor prices arenegative and elastic during the first period (table 8,columns 5-6 and rows 1-4), as are the own-price elas-ticities of the input demand functions (table 8,columns 5-6 and rows 5-6). This is consistent witheconomic theory, which indicates that the marginalrevenue of an input increases when quantities of otherinputs increase or when output prices increase (Sakai,1974). During the 1986-97 period, however, the ownelasticities of labor and intermediate inputs slightlydeclined. At the same time, labor demand becamemore inelastic to changes in corn and soybean priceswhile it remained elastic to changes in rice and wheatprices. Regarding intermediate inputs/capital, thechanges are more drastic as the demand becameinelastic with respect to rice and wheat productionwhile remaining elastic to corn and soybean prices.This result might shed some light regarding the struc-tural changes in input usage and input intensity, asindicated by the growth accounting method. However,further indepth analysis is needed on this issue in orderto make concrete inferences.
The estimates of the factor demand elasticities suggestthat returns to labor and intermediates/capital maydecrease quite drastically as a consequence of increas-ing wages or intermediate/capital costs. Moreover, anincrease in the price of intermediates/capital or wages
TB-1884 • Economic Research Service/USDA Cross-Commodity Analysis of China’s Grain Sector • 13
would not only constrain the expansion of outputs, itwould also change the composition of outputs becausethe elasticities are different across commodities. Forexample, an increase in wages would affect rice andwheat production more than corn and soybeans. Onthe other hand, changes in intermediate/capital costswould affect mostly corn and soybean production.This reinforces the findings of the role of intermediateinputs and capital in the growth accounting analysis—that increased input use has been the driving forcebehind China’s growth in grain production.
In sum, complementarity prevails among the inputsused and the outputs produced and an increase in theprice of intermediates/capital or wages would result inabsolute reductions in all outputs as well as changes inthe composition of outputs as the elasticities are differ-ent across commodities. In other words, higher laborcosts would affect rice and wheat costs of productionsignificantly, with a smaller effect on corn and soy-bean production. On the other hand, higher intermedi-ate inputs/capital costs would affect corn and soybeanproduction significantly, with a smaller effect on riceand wheat production. This indicates the dependencyof grain production on labor and intermediateinputs/capital costs.
Technological Change
The estimated coefficient of time trend, τ, captures thesystematic bias in technological change (also calledthe constant rate of bias) for the estimation period(appendix table A4). The negative τ for rice, corn, andsoybeans implies that the growth rate of technologicalchange for these three grains is below the averagegrowth rate in the grain sector, while the opposite istrue for wheat with a positive τ. This is consistentwith the finding from the growth accounting analysisthat wheat, on average, had a higher annual TFPgrowth rate than the other grains (table 2).
The sign of τ for inputs (labor and capital) is positive,and the value for capital is greater than that for labor(table A4). This implies the presence of a positivetechnological change and that such change is morecapital biased. This result supports the finding thattechnological change resulted in higherintermediates/capital use per unit of land.
Summary and ConclusionsWe used a growth accounting method to analyze thesources of output growth in rice, wheat, corn and soy-beans, the four most important crops in China’s grainsector, during 1978-97. We found TFP contributedgreatly to growth in grain production in the periodimmediately after China’s rural economic reform(1978-85). Most of this growth was from efficiencygains due to institutional reforms. After 1985, whenefficiency gains had diminished, the growth rate ofTFP fell sharply and contributed less than 20 percentto growth in grain production. In recent years (1995-97), increased use of inputs, especially intermediates/capital, became major sources of growth in China’sgrain sector. These results imply that recent growth ingrain output may fall as wages and prices for interme-diate inputs increase. The gap between TFP growth inChina’s grain sector and TFP growth in developedcountries suggests that China can improve its grainproduction technology if the economic and policyenvironment encourages investment in agriculturalresearch and development, water control systems, andland infrastructure.
The changes in the labor-land ratio and the intermedi-ates/capital-land ratio over the last two decades inChina are consistent with economic theory. That is,with economic growth, technological change inducesless use of labor and more use of capital. However,the decline in China’s labor-land ratio slowed signifi-cantly in recent years. The current land tenure systemis a major factor constraining the development andexpansion of labor-saving technology in China’s grainsector. Given that increased input use, including labor,drove growth in China’s grain sector in recent years,grain production will become more and more costly aswages and opportunity costs rise. This will likely con-strain growth in China’s grain production and weakenits competitiveness in world grain markets.
We also estimated the supply response for the fourgrains using a multiproduct framework. The paramet-ric approach confirms the hypothesis of a nonseparableand joint production system in China’s grain sector.
We separated substitution and expansion effects toobtain the same information from the restricted profitfunction as from direct approaches. We accounted forboth the substitution and the expansion effects. The
14 • Cross-Commodity Analysis of China’s Grain Sector Economic Research Service/USDA • TB-1884
expansion effects subsided in the more recent period,implying a relatively slow outward shift in the produc-tion frontier. This result indirectly supports our find-ing from the growth accounting analysis that TFP grewmuch more slowly in recent years than immediatelyfollowing rural economic reform.
Own-price elasticities of soybeans, corn, and rice aregreater than unity while wheat’s elasticity is less thanunity. Hence, the supply response and consequentlyplanting options for soybean, corn, and rice producersare greater than for wheat producers. Since the inputuse elasticities for rice and wheat are very elastic, anyincrease in labor or capital costs will affect the supplyof these crops much more than the production of othergrains.
The own- and cross-supply elasticities decreased in the1986-97 period. This finding supports the conclusionsof the growth accounting analysis, which indicates thatgrowth in TFP slowed significantly during 1986-97,especially for rice and wheat. As labor and intermedi-ates/capital elasticities declined in this period com-pared with the early period, changes in input usewould not affect the composition of grain productionas much as in the first period. Rice and wheat produc-tion would be affected more by increases in wagesthan corn and soybean production, while soybean pro-duction is overall most sensitive to the costs of inter-mediate inputs and capital. In general, complementari-ty prevails among the inputs used and the outputs pro-duced. In addition, an increase in the price of interme-diates/capital or wages would result in absolute reduc-tions in all outputs as well as changes in the composi-tion of outputs.
The input demand functions are price elastic, whichhas important implications for grain production. Theestimates suggest that returns to labor and intermedi-ates/capital may decrease quite drastically as a conse-quence of increasing wages or intermediate/capitalcosts. Changes in intermediate/capital costs wouldaffect mostly corn and soybean production whilechanges in wages would affect mostly rice and wheatproduction. This reinforces the findings of the role ofintermediate inputs and capital in the growth account-ing analysis and implies that the cost of intermediateinputs and capital as well as wages might become veryimportant in determining the grain sector’s productiondynamics.
Future work in identifying and measuring the sourcesof growth in China’s agriculture should focus on dis-aggregating to regions (or even provinces). Nationalanalysis may obscure some important regional differ-ences in productivity because of differences in eco-nomic development and agricultural practices acrossregions. In addition, future work should quantify thesources of TFP growth in China’s grain sector.Sustainable TFP growth is a key factor in maintaininggrowth in China’s agriculture. Although we point outthat TFP growth slowed after 1985 due to the dimin-ishing effect of institutional changes, a parametricapproach is needed to quantitatively analyze the differ-ent sources of TFP growth.
References
Ball, V.E. (1985) “Output, Input, and ProductivityMeasurement in U.S. Agriculture, 1948-79,” AmericanJournal of Agricultural Economics, 67(3): 475-486.
Ball, V.E. (1988) “Modeling Supply Response in aMultiproduct Framework,” American Journal ofAgricultural Economics, 70(4): 813-825.
Berndt, E.R., and D. O. Wood (1975) “Technology, Pricesand the Derived Demand For Energy,” Review ofEconomic and Statistics, 57(1): 259-268.
Carter, C.A., J. Chen, and B. Chu (1999) “AgriculturalProductivity Growth in China: Farm Level versus NationalMeasurement.” Paper presented at the 1999 Trade PolicyResearch and Analysis Symposium of the IATRC, SanFrancisco, CA.
Caves, D.W., L.R. Christensen, and W.E. Diewert (1982)“The Economic Theory of Index Numbers and theMeasurement of Input, Output, and Productivity,”Econometrica, 50(6): 1393-1414.
China’s Ministry of Internal Trade (1988-1997) ChinaCommerce Yearbook, Beijing, China: China CommerceYearbook Publishing House.
China’s National Statistical Bureau (1978-98) China RuralStatistical Yearbook, Beijing, China: China StatisticalPublishing House.
China’s National Statistical Bureau (1978-98) ChinaStatistical Yearbook, Beijing, China: China StatisticalPublishing House.
TB-1884 • Economic Research Service/USDA Cross-Commodity Analysis of China’s Grain Sector • 15
Crook, Frederick (1993) “Underreporting of China’sCultivated Land Area: Implications for WorldAgricultural Trade,” China Agriculture and Trade Report,USDA, Economic Research Service: 33-39.
Diewert, W.E. (1976) “Exact and Superlative IndexNumbers,” Journal of Econometrics, 4: 115-145.
Evenson, R., C.E. Pray, and M.W. Rosegrant (1999)Agricultural Research and Productivity Growth in India,Research Report 109, International Food Policy ResearchInstitute (IFPRI), Washington, DC.
Fan, S. (1997) “Production and Productivity Growth inChinese Agriculture: New Measurement and Evidence,”Food Policy, 22(3): 213-228.
Fan, S. (1991) “Effects of Technological Change andInstitutional Reform on Production Growth in ChineseAgriculture,” American Journal of AgriculturalEconomics, 73(2): 266-275.
Fan, S., and P.G. Pardey (1997) “Research, Productivity, andOutput Growth in Chinese Agriculture,” Journal ofDevelopment Economics, 53: 115-137.
Fang, C., and J. Beghin (1999) “Self-Sufficiency,Comparative Advantage, and Agricultural Trade: A PolicyAnalysis Matrix for Chinese Agriculture.” Paper present-ed at the 1999 Trade Policy Research and AnalysisSymposium of the IATRC, San Francisco, CA.
Gopinath, M., and T.L. Roe (1997) “Sources of SectoralGrowth in an Economy Wide Context: the Case of U.S.Agriculture,” Journal of Productivity Analysis, 8: 293-310.
Hayami, Y., and V.W. Ruttan (1971/1985) AgriculturalDevelopment: An International Perspective, Baltimore:The Johns Hopkins University Press.
Huang, J., and S. Rozelle (1996) “Technological Change:Rediscovering the Engine of Productivity Growth inChina’s Rural Economy,” Journal of DevelopmentEconomics, 49: 337-369.
Lau, L.J. (1978) “Testing and Imposing Monotonicity,Convexity, and Quasi-Convexity Constraints,” in D.McFadden and M. Fuss (eds.) Production Economics: ADual Approach to Theory and Applications, Amsterdam,North Holland Publishing Co.
Lin, J.Y. (1992) “Rural Reforms and Agricultural Growth inChina,” The American Economic Review, 82(1): 34-51.
Lopez, R. (1984) “Estimating Substitution and ExpansionEffects Using a Profit Function Framework,” AmericanJournal of Agricultural Economics, 66(3): 358-67.
McMillan, J., J. Whalley, and L. Zhu (1989) “The Impact ofChina’s Economic Reforms on Agricultural ProductivityGrowth,” Journal of Political Economy, 97: 781-807.
Nagatani, K. (1978) “Substitution and Scale Effects inFactor Demand,” Canadian Journal of Economics, 11(3):521-27.
Perkins, D. (1994) “Completing China’s Move to theMarket,” Journal of Economic Perspectives, 8(2): 23-46.
Rothenberg, T.J. (1974) Efficient Estimation With A PrioriInformation, New Haven, CT, Yale University Press.
Sakai, Y. (1974) “Substitution and Expansion Effects onProduction Theory: The Case of Joint Production,”Journal of Economic Theory, 9: 255-274.
Weins, T. (1982) “The Limits to Agricultural Intensification:the Suzhou Experience,” in China Under the FourModernizations, Part I, U.S. Government Printing Office,462-474.
Wen, G.J. (1993) “Total Factor Productivity Change inChina’s Farming Sector: 1952-1989,” EconomicDevelopment and Cultural Change 42: 1-41.
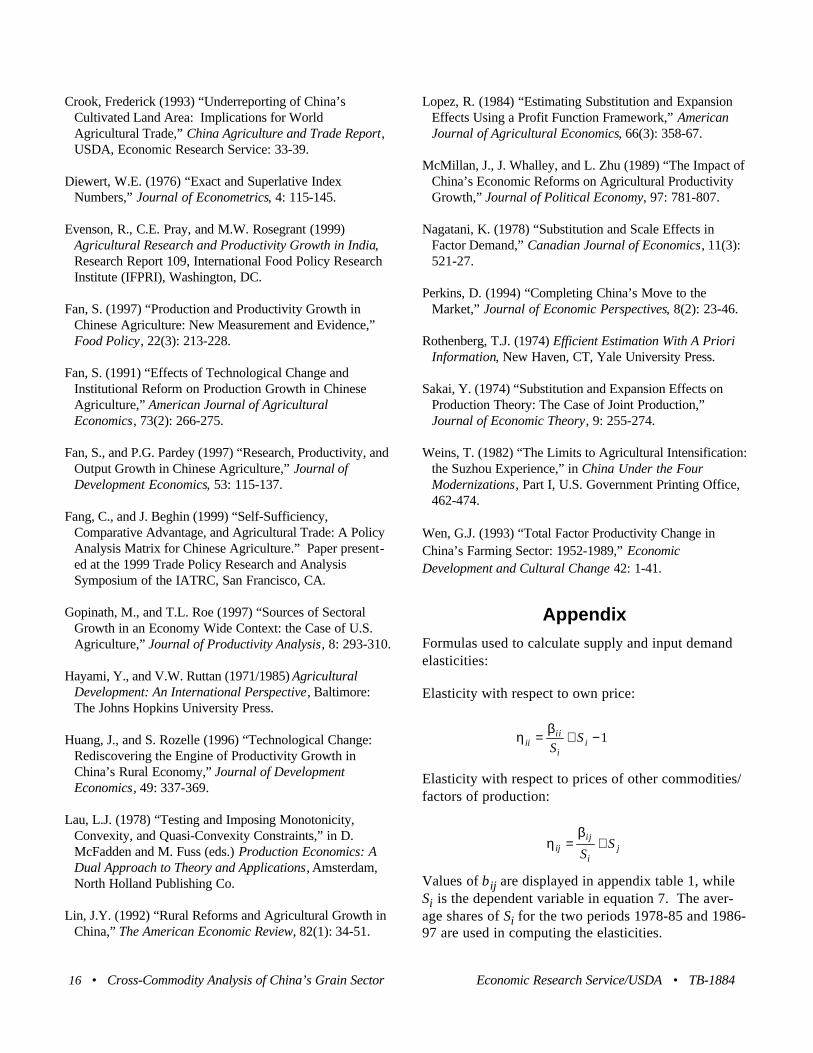
AppendixFormulas used to calculate supply and input demandelasticities:
Elasticity with respect to own price:
Elasticity with respect to prices of other commodities/factors of production:
Values of βij are displayed in appendix table 1, whileSi is the dependent variable in equation 7. The aver-age shares of Si for the two periods 1978-85 and 1986-97 are used in computing the elasticities.
16 • Cross-Commodity Analysis of China’s Grain Sector Economic Research Service/USDA • TB-1884
ηβ
iiii
iiS
S= + −1
ηβ
ijij
ijS
S= +
TB-1884 • Economic Research Service/USDA Cross-Commodity Analysis of China’s Grain Sector • 17
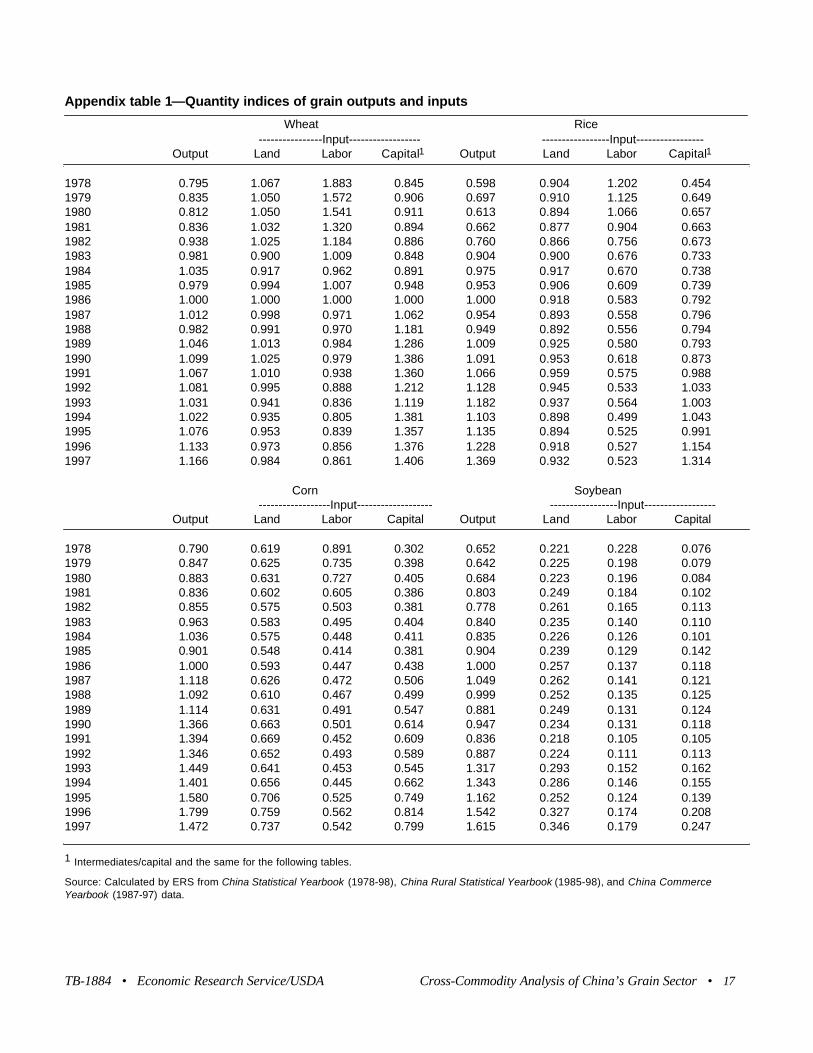
Appendix table 1—Quantity indices of grain outputs and inputs
Wheat Rice ----------------Input------------------ -----------------Input-----------------
Output Land Labor Capital1 Output Land Labor Capital1
1978 0.795 1.067 1.883 0.845 0.598 0.904 1.202 0.4541979 0.835 1.050 1.572 0.906 0.697 0.910 1.125 0.6491980 0.812 1.050 1.541 0.911 0.613 0.894 1.066 0.6571981 0.836 1.032 1.320 0.894 0.662 0.877 0.904 0.6631982 0.938 1.025 1.184 0.886 0.760 0.866 0.756 0.6731983 0.981 0.900 1.009 0.848 0.904 0.900 0.676 0.7331984 1.035 0.917 0.962 0.891 0.975 0.917 0.670 0.7381985 0.979 0.994 1.007 0.948 0.953 0.906 0.609 0.7391986 1.000 1.000 1.000 1.000 1.000 0.918 0.583 0.7921987 1.012 0.998 0.971 1.062 0.954 0.893 0.558 0.7961988 0.982 0.991 0.970 1.181 0.949 0.892 0.556 0.7941989 1.046 1.013 0.984 1.286 1.009 0.925 0.580 0.7931990 1.099 1.025 0.979 1.386 1.091 0.953 0.618 0.8731991 1.067 1.010 0.938 1.360 1.066 0.959 0.575 0.9881992 1.081 0.995 0.888 1.212 1.128 0.945 0.533 1.0331993 1.031 0.941 0.836 1.119 1.182 0.937 0.564 1.0031994 1.022 0.935 0.805 1.381 1.103 0.898 0.499 1.0431995 1.076 0.953 0.839 1.357 1.135 0.894 0.525 0.9911996 1.133 0.973 0.856 1.376 1.228 0.918 0.527 1.1541997 1.166 0.984 0.861 1.406 1.369 0.932 0.523 1.314
Corn Soybean------------------Input------------------- -----------------Input------------------
Output Land Labor Capital Output Land Labor Capital
1978 0.790 0.619 0.891 0.302 0.652 0.221 0.228 0.0761979 0.847 0.625 0.735 0.398 0.642 0.225 0.198 0.0791980 0.883 0.631 0.727 0.405 0.684 0.223 0.196 0.0841981 0.836 0.602 0.605 0.386 0.803 0.249 0.184 0.1021982 0.855 0.575 0.503 0.381 0.778 0.261 0.165 0.1131983 0.963 0.583 0.495 0.404 0.840 0.235 0.140 0.1101984 1.036 0.575 0.448 0.411 0.835 0.226 0.126 0.1011985 0.901 0.548 0.414 0.381 0.904 0.239 0.129 0.1421986 1.000 0.593 0.447 0.438 1.000 0.257 0.137 0.1181987 1.118 0.626 0.472 0.506 1.049 0.262 0.141 0.1211988 1.092 0.610 0.467 0.499 0.999 0.252 0.135 0.1251989 1.114 0.631 0.491 0.547 0.881 0.249 0.131 0.1241990 1.366 0.663 0.501 0.614 0.947 0.234 0.131 0.1181991 1.394 0.669 0.452 0.609 0.836 0.218 0.105 0.1051992 1.346 0.652 0.493 0.589 0.887 0.224 0.111 0.1131993 1.449 0.641 0.453 0.545 1.317 0.293 0.152 0.1621994 1.401 0.656 0.445 0.662 1.343 0.286 0.146 0.1551995 1.580 0.706 0.525 0.749 1.162 0.252 0.124 0.1391996 1.799 0.759 0.562 0.814 1.542 0.327 0.174 0.2081997 1.472 0.737 0.542 0.799 1.615 0.346 0.179 0.247
1 Intermediates/capital and the same for the following tables.
Source: Calculated by ERS from China Statistical Yearbook (1978-98), China Rural Statistical Yearbook (1985-98), and China CommerceYearbook (1987-97) data.
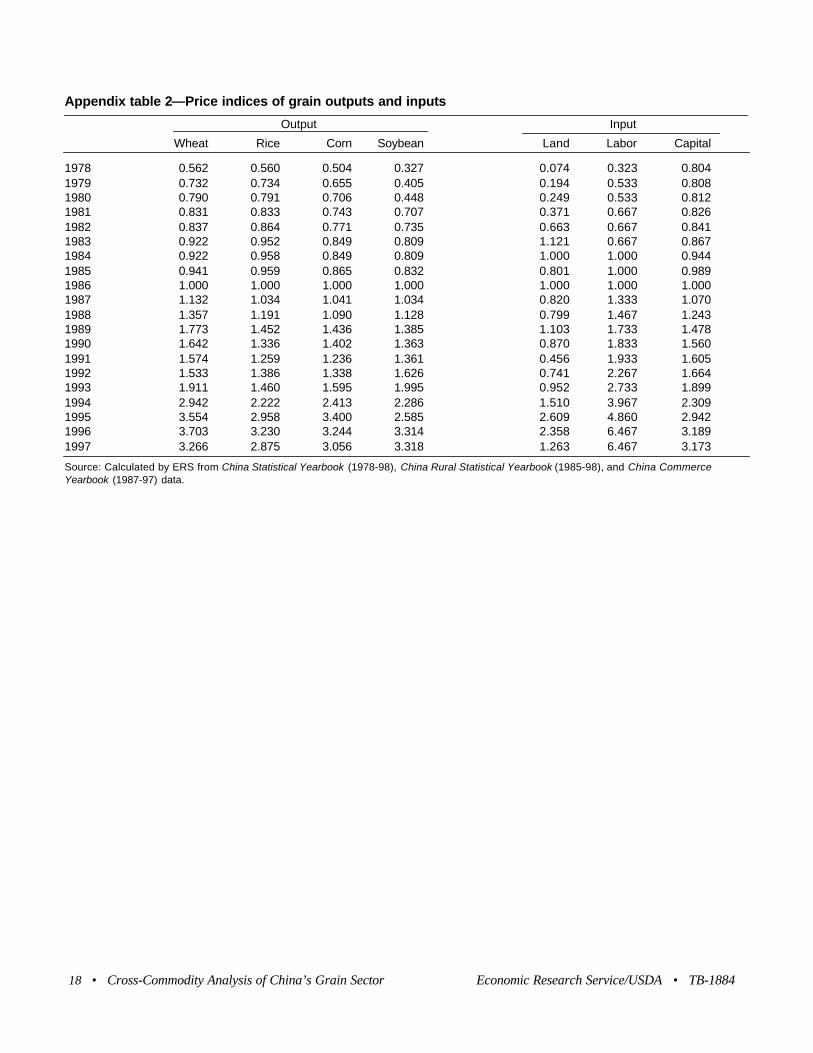
18 • Cross-Commodity Analysis of China’s Grain Sector Economic Research Service/USDA • TB-1884
Appendix table 2—Price indices of grain outputs and inputs
Output Input
Wheat Rice Corn Soybean Land Labor Capital
1978 0.562 0.560 0.504 0.327 0.074 0.323 0.8041979 0.732 0.734 0.655 0.405 0.194 0.533 0.8081980 0.790 0.791 0.706 0.448 0.249 0.533 0.8121981 0.831 0.833 0.743 0.707 0.371 0.667 0.8261982 0.837 0.864 0.771 0.735 0.663 0.667 0.8411983 0.922 0.952 0.849 0.809 1.121 0.667 0.8671984 0.922 0.958 0.849 0.809 1.000 1.000 0.9441985 0.941 0.959 0.865 0.832 0.801 1.000 0.9891986 1.000 1.000 1.000 1.000 1.000 1.000 1.0001987 1.132 1.034 1.041 1.034 0.820 1.333 1.0701988 1.357 1.191 1.090 1.128 0.799 1.467 1.2431989 1.773 1.452 1.436 1.385 1.103 1.733 1.4781990 1.642 1.336 1.402 1.363 0.870 1.833 1.5601991 1.574 1.259 1.236 1.361 0.456 1.933 1.6051992 1.533 1.386 1.338 1.626 0.741 2.267 1.6641993 1.911 1.460 1.595 1.995 0.952 2.733 1.8991994 2.942 2.222 2.413 2.286 1.510 3.967 2.3091995 3.554 2.958 3.400 2.585 2.609 4.860 2.9421996 3.703 3.230 3.244 3.314 2.358 6.467 3.1891997 3.266 2.875 3.056 3.318 1.263 6.467 3.173
Source: Calculated by ERS from China Statistical Yearbook (1978-98), China Rural Statistical Yearbook (1985-98), and China CommerceYearbook (1987-97) data.
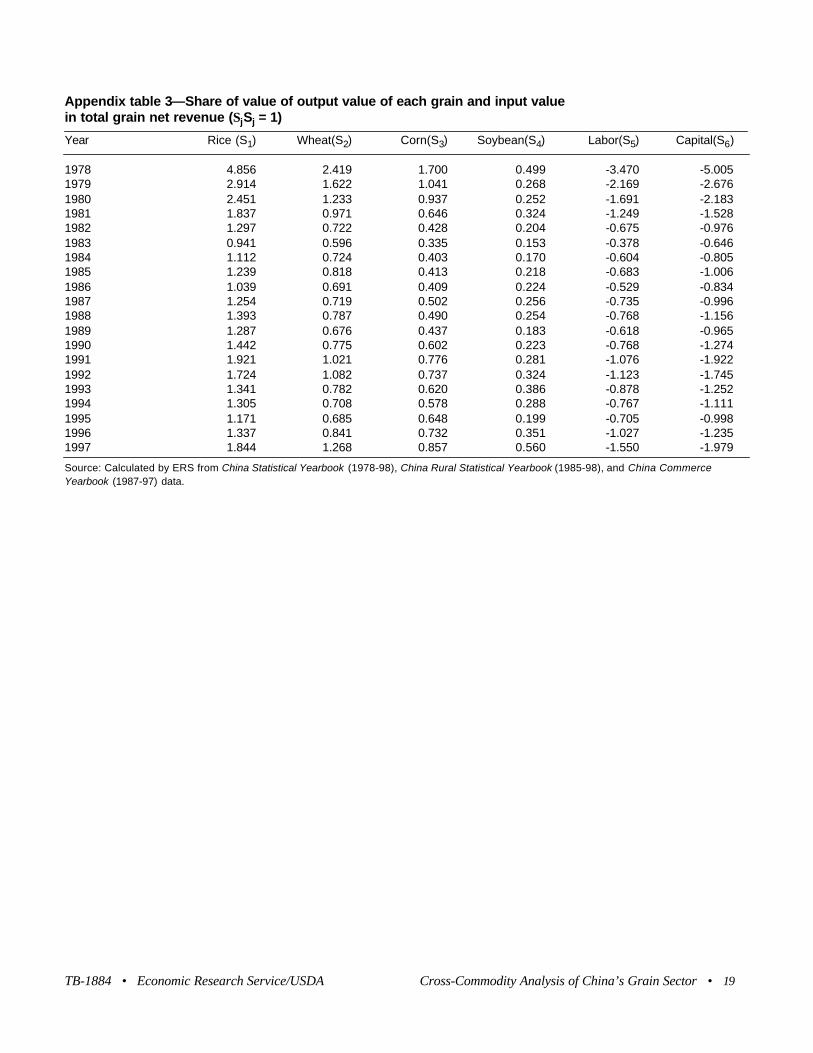
TB-1884 • Economic Research Service/USDA Cross-Commodity Analysis of China’s Grain Sector • 19
Appendix table 3—Share of value of output value of each grain and input value in total grain net revenue (ΣjSj = 1)
Year Rice (S1) Wheat(S2) Corn(S3) Soybean(S4) Labor(S5) Capital(S6)
1978 4.856 2.419 1.700 0.499 -3.470 -5.0051979 2.914 1.622 1.041 0.268 -2.169 -2.6761980 2.451 1.233 0.937 0.252 -1.691 -2.1831981 1.837 0.971 0.646 0.324 -1.249 -1.5281982 1.297 0.722 0.428 0.204 -0.675 -0.9761983 0.941 0.596 0.335 0.153 -0.378 -0.6461984 1.112 0.724 0.403 0.170 -0.604 -0.8051985 1.239 0.818 0.413 0.218 -0.683 -1.0061986 1.039 0.691 0.409 0.224 -0.529 -0.8341987 1.254 0.719 0.502 0.256 -0.735 -0.9961988 1.393 0.787 0.490 0.254 -0.768 -1.1561989 1.287 0.676 0.437 0.183 -0.618 -0.9651990 1.442 0.775 0.602 0.223 -0.768 -1.2741991 1.921 1.021 0.776 0.281 -1.076 -1.9221992 1.724 1.082 0.737 0.324 -1.123 -1.7451993 1.341 0.782 0.620 0.386 -0.878 -1.2521994 1.305 0.708 0.578 0.288 -0.767 -1.1111995 1.171 0.685 0.648 0.199 -0.705 -0.9981996 1.337 0.841 0.732 0.351 -1.027 -1.2351997 1.844 1.268 0.857 0.560 -1.550 -1.979
Source: Calculated by ERS from China Statistical Yearbook (1978-98), China Rural Statistical Yearbook (1985-98), and China CommerceYearbook (1987-97) data.
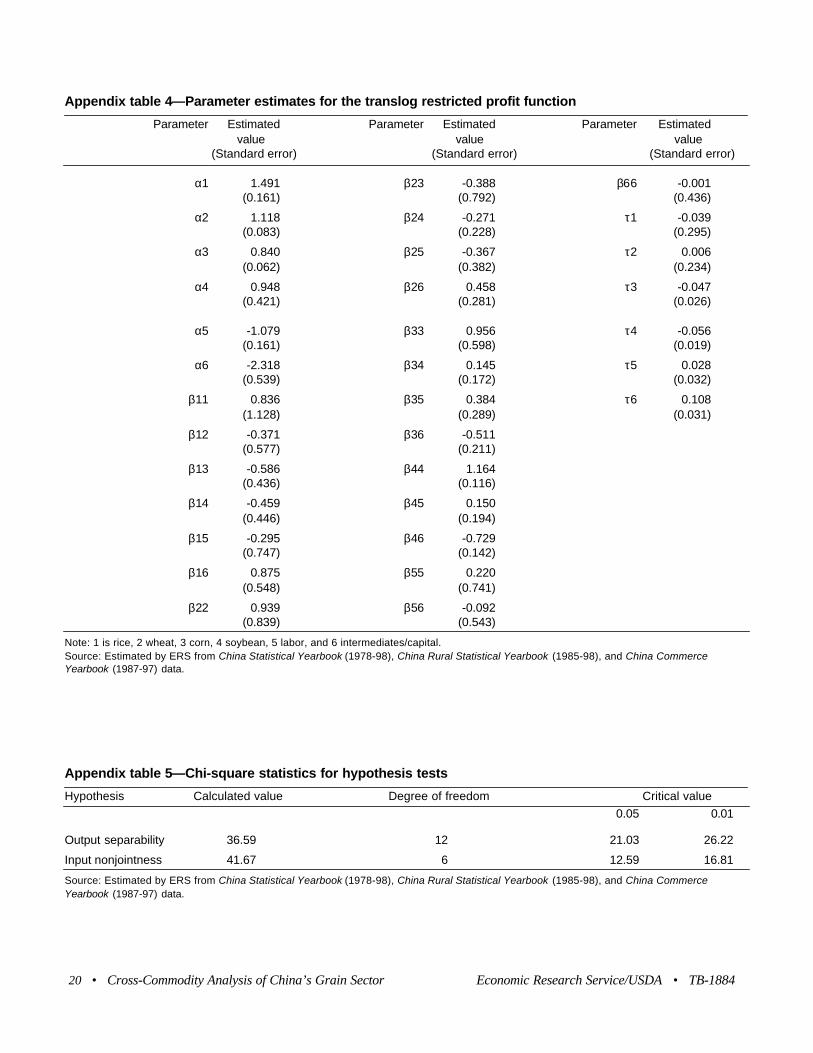
20 • Cross-Commodity Analysis of China’s Grain Sector Economic Research Service/USDA • TB-1884
Appendix table 4—Parameter estimates for the translog restricted profit function
Parameter Estimated Parameter Estimated Parameter Estimatedvalue value value
(Standard error) (Standard error) (Standard error)
α1 1.491 β23 -0.388 β66 -0.001(0.161) (0.792) (0.436)
α2 1.118 β24 -0.271 τ1 -0.039(0.083) (0.228) (0.295)
α3 0.840 β25 -0.367 τ2 0.006(0.062) (0.382) (0.234)
α4 0.948 β26 0.458 τ3 -0.047(0.421) (0.281) (0.026)
α5 -1.079 β33 0.956 τ4 -0.056(0.161) (0.598) (0.019)
α6 -2.318 β34 0.145 τ5 0.028(0.539) (0.172) (0.032)
β11 0.836 β35 0.384 τ6 0.108(1.128) (0.289) (0.031)
β12 -0.371 β36 -0.511(0.577) (0.211)
β13 -0.586 β44 1.164(0.436) (0.116)
β14 -0.459 β45 0.150(0.446) (0.194)
β15 -0.295 β46 -0.729(0.747) (0.142)
β16 0.875 β55 0.220(0.548) (0.741)
β22 0.939 β56 -0.092(0.839) (0.543)
Note: 1 is rice, 2 wheat, 3 corn, 4 soybean, 5 labor, and 6 intermediates/capital.Source: Estimated by ERS from China Statistical Yearbook (1978-98), China Rural Statistical Yearbook (1985-98), and China CommerceYearbook (1987-97) data.
Appendix table 5—Chi-square statistics for hypothesis tests
Hypothesis Calculated value Degree of freedom Critical value
0.05 0.01
Output separability 36.59 12 21.03 26.22
Input nonjointness 41.67 6 12.59 16.81
Source: Estimated by ERS from China Statistical Yearbook (1978-98), China Rural Statistical Yearbook (1985-98), and China CommerceYearbook (1987-97) data.