long-term dynamics of tropical rainforests,climate,fire
222
LONG-TERM DYNAMICS OF TROPICAL RAINFORESTS, CLIMATE, FIRE, HUMAN IMPACT AND LAND-USE IN INDONESIA A FOCUS ON THE MONTANE RAINFORESTS IN CENTRAL SULAWESI AND PEAT-SWAMP RAINFORESTS IN SUMATRA Dissertation for the award of the degree “Doctor of Philosophy” (Ph.D. Division of Mathematics and Natural Sciences) of the Georg-August-Universität Göttingen within the doctoral program Biodiversity and Ecology submitted by M.Sc. Siria Biagioni from Rome (Italy) Göttingen, 2015
-
Upload
khangminh22 -
Category
Documents
-
view
0 -
download
0
Transcript of long-term dynamics of tropical rainforests,climate,fire

LONG-TERM DYNAMICS OF TROPICAL RAINFORESTS, CLIMATE, FIRE,
HUMAN IMPACT AND LAND-USE IN INDONESIA
A FOCUS ON THE MONTANE RAINFORESTS IN CENTRAL SULAWESI AND PEAT-SWAMP
RAINFORESTS IN SUMATRA
Dissertation
for the award of the degree
“Doctor of Philosophy” (Ph.D. Division of Mathematics and Natural Sciences)
of the Georg-August-Universität Göttingen
within the doctoral program Biodiversity and Ecology
submitted by
M.Sc. Siria Biagioni
from Rome (Italy)
Göttingen, 2015
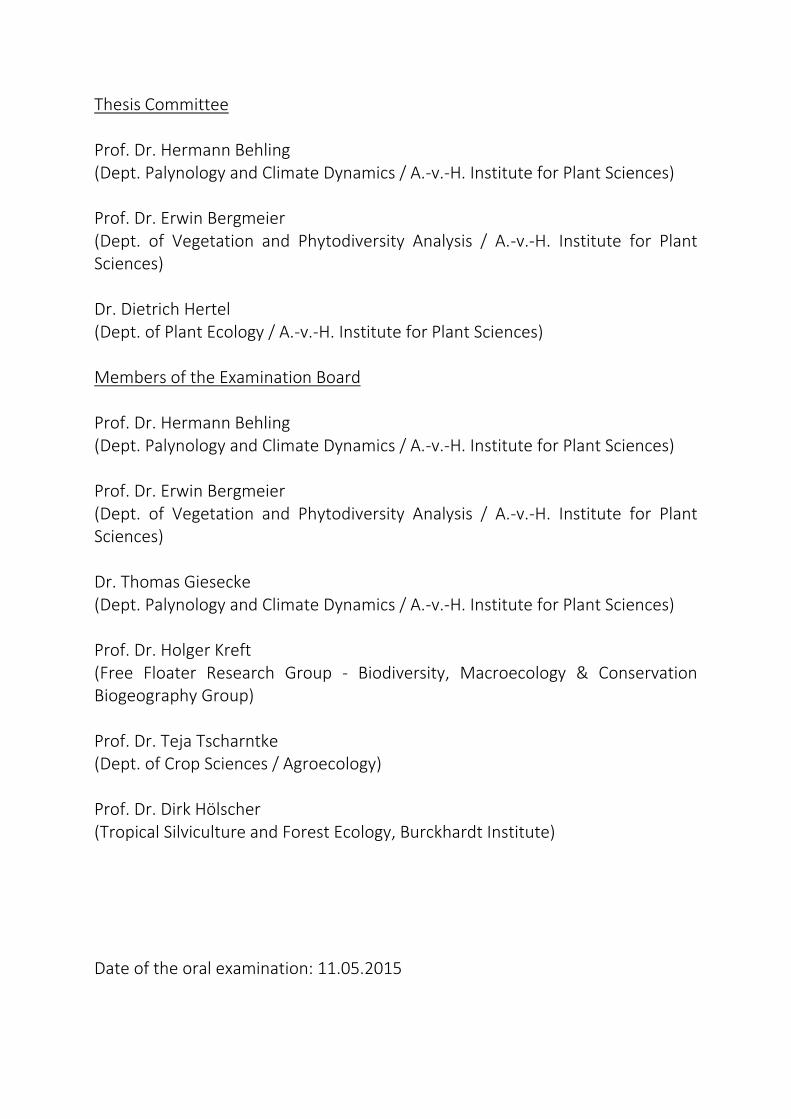
Thesis Committee Prof. Dr. Hermann Behling (Dept. Palynology and Climate Dynamics / A.-v.-H. Institute for Plant Sciences) Prof. Dr. Erwin Bergmeier (Dept. of Vegetation and Phytodiversity Analysis / A.-v.-H. Institute for Plant Sciences) Dr. Dietrich Hertel (Dept. of Plant Ecology / A.-v.-H. Institute for Plant Sciences) Members of the Examination Board Prof. Dr. Hermann Behling (Dept. Palynology and Climate Dynamics / A.-v.-H. Institute for Plant Sciences) Prof. Dr. Erwin Bergmeier (Dept. of Vegetation and Phytodiversity Analysis / A.-v.-H. Institute for Plant Sciences) Dr. Thomas Giesecke (Dept. Palynology and Climate Dynamics / A.-v.-H. Institute for Plant Sciences) Prof. Dr. Holger Kreft (Free Floater Research Group - Biodiversity, Macroecology & Conservation Biogeography Group) Prof. Dr. Teja Tscharntke (Dept. of Crop Sciences / Agroecology) Prof. Dr. Dirk Hölscher (Tropical Silviculture and Forest Ecology, Burckhardt Institute) Date of the oral examination: 11.05.2015
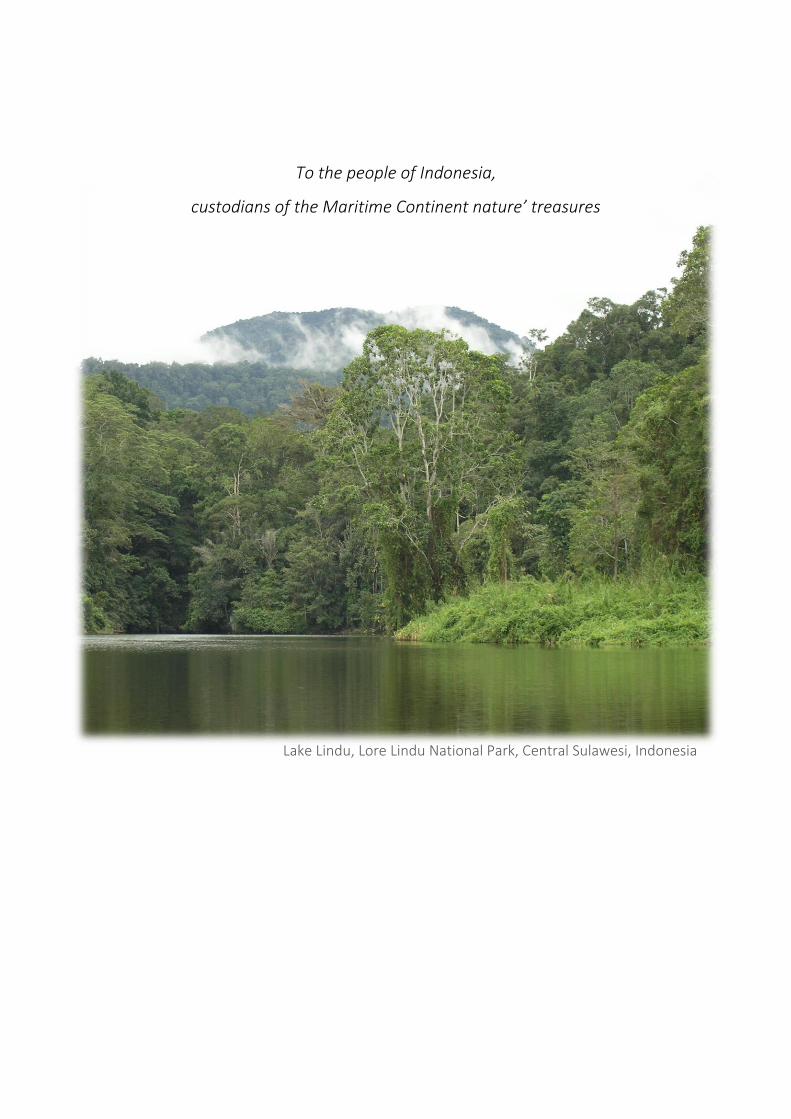
To the people of Indonesia,
custodians of the Maritime Continent nature’ treasures
Lake Lindu, Lore Lindu National Park, Central Sulawesi, Indonesia

Table of contents
ABSTRACT ................................................................................................................................................................. I
ACKNOWLEDGEMENTS ............................................................................................................................................ V
LIST OF FIGURES, TABLES AND APPENDICES ........................................................................................................... VII
ACRONYMS ............................................................................................................................................................ XIII
PREFACE .................................................................................................................................................................. 1
THESIS AIMS ........................................................................................................................................................... 1 THESIS OUTLINE ....................................................................................................................................................... 1
CHAPTER 1 - INTRODUCTION ................................................................................................................................... 5
TROPICAL RAINFORESTS OF INDONESIA ......................................................................................................................... 5 RECENT DRIVERS OF INDONESIAN RAINFOREST CHANGES .................................................................................................. 8 SCIENTIFIC INVESTIGATIONS IN INDONESIA: THE PROJECTS AND REGIONS UNDER STUDY .......................................................... 9
CHAPTER 2 - PALAEOECOLOGY ............................................................................................................................... 11
THE CONTRIBUTION OF PALAEOECOLOGICAL INVESTIGATIONS ......................................................................................... 11 THE MULTI-PROXY APPROACH IN PALAEOECOLOGY ....................................................................................................... 12
CHAPTER 3 - SULAWESI .......................................................................................................................................... 19
THE LORE LINDU NATIONAL PARK ............................................................................................................................. 20
CHAPTER 4 - SUMATRA .......................................................................................................................................... 27
PEATLANDS OF SOUTHEAST ASIA: AN OVERVIEW .......................................................................................................... 27 PEATLAND CONVERSION AND FIRE IN SUMATRA ........................................................................................................... 28 PEAT FORMATION .................................................................................................................................................. 30 TYPE OF PEATLAND IN SOUTHEAST ASIA ..................................................................................................................... 31 THE IMPORTANCE OF VEGETATION COMMUNITIES ........................................................................................................ 33 TEMPORAL AND SPATIAL DEVELOPMENT OF SOUTHEAST ASIAN PEATLANDS: STATE OF KNOWLEDGE ....................................... 34
CHAPTER 5 - PAPER 1: ENSO AND MONSOON VARIABILITY DURING THE PAST 1500 YEARS AS REFLECTED IN
SEDIMENTS FROM LAKE KALIMPAA, CENTRAL SULAWESI (INDONESIA) .................................................................. 37
ABSTRACT ............................................................................................................................................................ 38 INTRODUCTION ..................................................................................................................................................... 38 SITE DESCRIPTION .................................................................................................................................................. 40 MATERIALS AND METHODS ...................................................................................................................................... 41 PROXY DETERMINATION FOR PALAEOENVIRONMENTAL PROCESSES................................................................................... 43 RESULTS............................................................................................................................................................... 46 DISCUSSION .......................................................................................................................................................... 51 CONCLUSIONS ....................................................................................................................................................... 56 ACKNOWLEDGEMENTS ............................................................................................................................................ 56
CHAPTER 6 - PAPER 2: ASSESSING RESILIENCE/SENSITIVITY OF TROPICAL MOUNTAIN RAINFORESTS TOWARDS
CLIMATE VARIABILITY OF THE LAST 1500 YEARS: THE LONG-TERM PERSPECTIVE AT LAKE KALIMPAA (SULAWESI,
INDONESIA) ............................................................................................................................................................ 59
ABSTRACT ............................................................................................................................................................ 60 INTRODUCTION ..................................................................................................................................................... 61 STUDY AREA ......................................................................................................................................................... 62 MATERIAL AND METHODS ....................................................................................................................................... 65 RESULTS............................................................................................................................................................... 67 INTERPRETATION AND DISCUSSION ............................................................................................................................ 72
CONCLUSIONS ....................................................................................................................................................... 77 ACKNOWLEDGMENTS ............................................................................................................................................. 78
CHAPTER 7 - PAPER 3: UNRAVELLING THE PAST 1000 YEARS OF HISTORY OF HUMAN–CLIMATE–LANDSCAPE
INTERACTIONS AT THE LINDU PLAIN, SULAWESI, INDONESIA ................................................................................. 79
ABSTRACT ............................................................................................................................................................ 80 INTRODUCTION ..................................................................................................................................................... 80 STUDY AREA ......................................................................................................................................................... 82 MATERIAL AND METHODS ....................................................................................................................................... 85 RESULTS............................................................................................................................................................... 88 DISCUSSION AND INTERPRETATION ............................................................................................................................ 95 CONCLUSIONS ..................................................................................................................................................... 101 ACKNOWLEDGMENTS ........................................................................................................................................... 102
CHAPTER 8 - PAPER 4: 8000 YEARS OF VEGETATION DYNAMICS AND ENVIRONMENTAL CHANGES OF A UNIQUE
INLAND PEAT ECOSYSTEM OF THE JAMBI PROVINCE IN CENTRAL SUMATRA, INDONESIA .....................................103
ABSTRACT .......................................................................................................................................................... 104 INTRODUCTION ................................................................................................................................................... 104 ENVIRONMENTAL SETTINGS OF THE STUDY SITE .......................................................................................................... 106 MATERIALS AND METHODS .................................................................................................................................... 108 RESULTS............................................................................................................................................................. 113 INTERPRETATION AND DISCUSSION .......................................................................................................................... 117 CONCLUSIONS ..................................................................................................................................................... 131 ACKNOWLEDGMENTS ........................................................................................................................................... 132
CHAPTER 9 - PAPER 5: EFFECTS OF LONG-TERM CLIMATE AND ENVIRONMENTAL VARIABILITY ON THE
DEVELOPMENT OF INLAND TROPICAL PEAT SWAMP ECOSYSTEMS IN JAMBI PROVINCE, SUMATRA, INDONESIA ..133
ABSTRACT .......................................................................................................................................................... 134 INTRODUCTION ................................................................................................................................................... 134 MODERN SETTINGS AND PALAEO-ENVIRONMENTAL DYNAMICS ..................................................................................... 135 METHODS .......................................................................................................................................................... 136 RESULTS AND DISCUSSION ..................................................................................................................................... 138 CONCLUSIONS ..................................................................................................................................................... 147 ACKNOWLEDGMENTS ........................................................................................................................................... 148
CHAPTER 10 - SYNTHESIS AND IMPLICATIONS .......................................................................................................149
SYNTHESIS OF THE MAIN RESULTS ON VEGETATION, CLIMATE, FIRE DYNAMICS AND HUMAN-LANDSCAPE INTERACTIONS ............ 149 A HISTORICAL PERSPECTIVE OF CURRENT AND FUTURE CHANGES .................................................................................... 152 CONCLUDING REMARKS, UNCERTAINTIES AND PERSPECTIVES ........................................................................................ 153
BIBLIOGRAPHY ......................................................................................................................................................155
APPENDIX A: IDENTIFIED POLLEN, SPORES AND NON-POLLEN PALYNOMORPHS (NPP) OF THE RECORDS –
COMPLETE LIST AND PHOTOS OF SELECTED TAXA.................................................................................................173
APPENDIX A1: TABLE OF IDENTIFIED POLLEN, SPORES AND NPP TAXA ............................................................................ 174 APPENDIX A2: PLATES OF SELECTED POLLEN, SPORES AND NPP TAXA ............................................................................ 181
APPENDIX B: COMPLETE POLLEN, SPORES, NPP AND CHARCOAL RECORDS ...........................................................187
LAKE KALIMPAA ................................................................................................................................................... 188 LAKE LINDU ........................................................................................................................................................ 192 JAW SPT, AIR HITAM ........................................................................................................................................... 197
DECLARATION OF ACADEMIC INTEGRITY ...............................................................................................................202

i
Abstract
The research conducted and compiled in this thesis contributes to the knowledge of the long-term
vegetation, climate and fire dynamics as well as human impact on montane and peat-swamp rainforests
of Indonesia. We applied multi-proxy palaeoecological methods to three sediment/peat cores taken
from Lake Kalimpaa and Lake Lindu in Central Sulawesi and from Air Hitam peatland in Jambi Province,
Sumatra.
The Lake Kalimpaa record is the first archive from Central Sulawesi providing information on
palaeovegetation dynamics under the background of reconstructed palaeoenvironmental and
palaeorainfall conditions throughout the past ca. 1500 years. The palaeovegetation as reconstructed
from the palynological analysis reveals that around Lake Kalimpaa the Fagaceae family dominates the
entire recorded period, as it still does today. Two disturbance events (ca. AD 1090-1190 and ca. AD
1450-1620) occurred in the catchment area of Lake Kalimpaa as reconstructed from sediment grain size
and geochemical analyses. Comparison with fire frequency derived from macro-charcoal analysis
indicates that these events were caused by forest fires. The regional correlation of these events with
periods of drought registered elsewhere in Sulawesi and in Java suggests that centennial-scale increases
in fire frequencies at Lake Kalimpaa were consequences of the vegetation being more prone to fire,
probably due to more frequent and/or longer El Niño events. Despite that, Fagaceae did not decrease,
indicating resilience towards droughts of at least one species of the family. However, palynological
diversity values indicate that within-landscape diversity (Whittaker’s gamma diversity) decreased when
fires increased. Palynological rate of change and compositional turnover indicate that vegetation
communities were more resilient to fire disturbance during periods of average high rainfall.
Palynological, charcoal and diatom reconstructions of the Lake Lindu core reveal that humans have
modified the landscape at the Lindu plain for at least 1000 years. Evidence of frequent burning and
possible shifting cultivation from an earlier phase from ca. AD 1000 to 1200 might be related to the
metal age population which erected the megaliths in the province of Central Sulawesi. From ca. AD
1200-1700 decreases of macro-charcoal concentrations and pioneer vegetation indicators show that
the use of the landscape of the Lindu plain had become more permanent. Due to the little research
conducted so far on the megalithic culture of Central Sulawesi, it remains uncertain whether the
architects of such a cultural change were the megalith people or a different ethnic group. A phase of
forest recovery from ca. AD 1730 to 1910 correlated with a decrease in human activities in the valley,
which historical reports describe as mostly limited to fishing and cattle grazing. These results suggest,
that when human pressure on the landscape decreases as a consequence of different strategies of
subsistence, the montane ecosystems possess a great capacity of recovery and fagaceous forest
communities can expand within a relatively rapid time scale.

ii
The multi-proxy palaeoenvironmental and palynological results from the Jaw SPT core in the Air Hitam
inland peat in central Sumatra show a picture of a highly dynamic system. Since the beginning of peat
accumulation around 7800 years ago net balance accumulation exceeded degradation, and the system
remained a carbon sink. At first the peatland in Air Hitam was fed by fluvial run-off and the vegetation
gradually changed from mixed Dipterocarpaceae swamp to marshy swamp communities dominated by
Durio trees around 5300 years ago. A marked change in the vegetation community’s composition
occurred at the beginning of the late Holocene about 4500 years ago. A pole forest established, with
Pandanus thickets colonizing the area as the dome developed into a rainfall-fed ombrogenous system.
At the same time, macro-charcoal peak detection analysis reveals that fire frequency increased, possibly
a consequence of the ENSO-onset.
Peat accumulation rates and hence carbon storage in the dome of the Air Hitam was considerable in
the past. Higher rates of peat/carbon accumulation were found to correlate with Pandanus expansion
under ombrotrophic settings. The testate amoebae assemblage indicates that the phases of
ombrogenous Pandanus-pole forest were characterized by lower water table fluctuations. Despite the
lower biomass input the peat accumulation rate was in average higher than during the mixed-swamp
community phases. The correlation between high peat accumulation and relatively drier phases linked
to ENSO makes the area of Air Hitam potentially one of the most effective carbon sequestering
ombrotrophic peatlands in the view of future climate scenarios.
The results of charcoal analysis in montane (Lake Kalimpaa) and peat-swamp (Air Hitam) ecosystems
show that although rare, wildfires did occur in the past in Central Sulawesi and Sumatra. The regime of
fire, in particular the frequency, was found to correlate with regional scale drought episodes in Central
Sulawesi. Both, fire frequency and magnitude of events, increased at Air Hitam in correlation with the
increase in the number of El Niño events in the late Holocene. These results indicate that fire regime of
montane ecosystems in Central Sulawesi and peat-swamp forests in Jambi can change in the long-term
following changes in rainfall patterns and ENSO variability. However, our results indicate that the effects
of fire and droughts on the carbon storage functions of the two systems under study might not have
been marked. In particular, Fagaceae representation around Lake Kalimpaa was not affected by
increases of fires caused by drought and carbon accumulation capacity of the ombrotrophic-Pandanus
dominated ecosystems in Air Hitam did not change (but rather increased) when frequency and
magnitude of fires increased. These results suggest that under natural conditions, fires occur in these
ecosystems, but the effects on their carbon storage functions in time can be relatively low.
A strong acceleration of disturbance driven by human activities is underlined by the results in both the
regions under study for the past decades. The overall results of this research highlight that the pressure
exerted over millennia on montane and peat-swamp rainforests in Indonesia has been of a different
magnitude than the modern anthropogenically driven changes.

iii
The results from the research compiled in this thesis highlight the value of using a multi-proxy approach
in order to better understand dynamics and functions of tropical ecosystems and to identify the most
important drivers of long-term changes.

iv

v
Acknowledgements
One of the most important lessons I have learnt in the past 4 years working on my PhD research, is how
extremely important is to be part of a team in order to be successful (and happy!) while producing
science. I, therefore feel I have to start my thanks with an acknowledgement to all the people that have
made my working (and private) life rich of passionate discussions over the most variable topics. I came
to realize how lucky I’m to be part of the small, but extremely active, palynological group of Göttingen.
A special thank to my supervisor and mentor, Hermann Behling. His way of suggesting while never
imposing his own ideas over my research, is one of the reasons I have matured (at least scientifically!)
in the past years and I’m proud of what I have accomplished so far. Many thanks to my palynologists’
colleagues and friends Nele Jantz, Lyudmila Shumilovskikh, Thomas Giesecke, Sonia Fontana and Jörg
Christiansen for sharing their experience, knowledge and passion with me. Thanks to my co-supervisor’s
Erwin Bergmeier and Dietrich Hertel for their support. Beyond the field of palynology, I was able to
enrich my knowledge thanks to numerous people from different scientific backgrounds. A special thanks
to Fabian Brambach for the invaluable discussions on the montane ecosystems of Central Sulawesi, to
Torsten Haberzettl and Michael Wündsch for revealing to me how much can be gain from geochemical
and sediment analyses, to Petra Lembcke for always challenging me with the most frightening question
of all: the “why?”.
Far away from your home, in my case Europe, being on the other side of the world, one can feel lonely
and lost. In my case it was never like that. Since the very first minute I step into the territory of Indonesia,
I have been overwhelmed by the excitement and kindness of all the Indonesian friends and colleagues
who have been part of my life ever since. Terima kasih banyak! I’m particularly grateful to Supiandi
Sabiham, Yudhi Achnopha and Asmadi Saad. Thanks to their insight into the study areas and their lessons
on peatlands of Sumatra, I was able to understand and came to love all about these special ecosystems.
Finally, a huge thank to all the student, researchers and assistants working in the ELUC and EFForTS
projects. I’m incredibly glad I was given the opportunity to work with all of you. To this regards my
acknowledgement goes to the German Research Foundation (DFG) which provided financial support for
my work as well as the work of my colleagues and collaborators within these two research projects in
Indonesia.
A special thanks to all the members of the coordination teams in Göttingen, Jambi and Bogor (Barbara
Wick, Wolfram Lorenz, Ivonne Hein, Mira Fahreza, Megawati Syafni, Yuking Linatra and Rizky Febrianty).
I’m well aware that without your work nothing of what I have accomplished would have been possible.
Least but not last, I would like to thank my partner, Michele De Zanet. Without your constant support,
I would have never made it so far.

vi
vii
List of Figures, Tables and Appendices
Figures
Figure 1.1 Conservation International map showing biodiversity hotspots of the world. These are areas with high
biodiversity yet most threatened by loss. In the blue square approximate position of Indonesia (http://www.conservation.org/How/Pages/Hotspots.aspx)
Figure 1.2 Benchmark map of carbon stored in Earth’s tropical forests, covering about 2.5 million hectares of
forests over more than 75 countries (source: NASA)
Figure 1.3 Map of Southeast Asia showing the main biogeographic lines. The grey areas represent Sunda and
Sahul shelves (modified from Moss and Wilson 1998)
Figure 1.4 Reconstruction of sea-level history since the LGM (21000 cal yr BP) for the Sunda shelf (from Hanebuth
et al. 2011)
Figure 1.5 Contour maps of NCEP/NCAR reanalysis datasets showing the composite means of surface precipitable
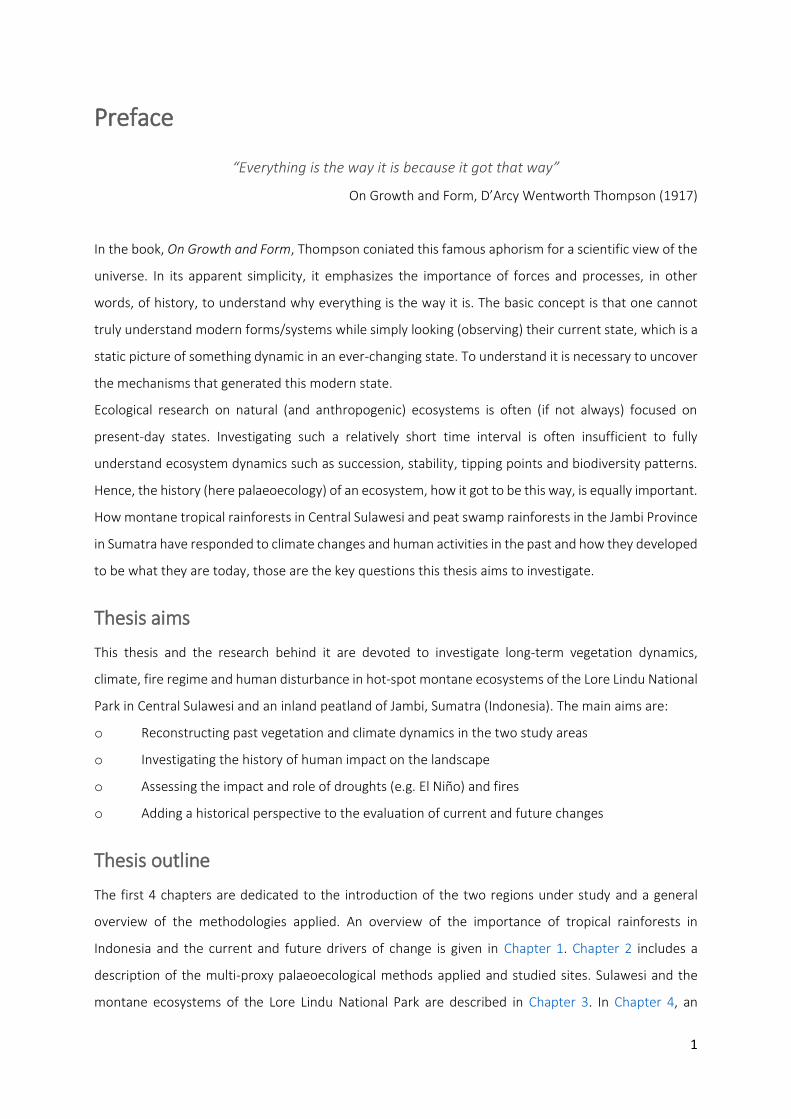
water in kg/m2 with arrows denoting wind directions for the period 1981–2010. Left: wet season (Dec–Jan–Feb, left) corresponding to the Asian summer monsoon. Right: dry season (Jul–Aug–Sep, right) corresponding to the Australian monsoon (Biagioni et al. 2015a)
Figure 1.6 Maps of precipitation changes for Indonesia in 2081-2100 with respect to 1986-2005. Top: dry season
from June to September. Bottom: wet season from December to March. Model scenario: RCP4.5 scenario with CMIP5 model. The grey lines represent areas where the signal is smaller than one standard deviation of natural variability (generated from KNMI Climate Change Atlas: http://climexp.knmi.nl/)
Figure 2.1 Worldwide distribution of pollen studies (red circles) as compiled from the NOAA palaeoclimate
database (http://www.ncdc.noaa.gov/data-access/paleoclimatology-data/datasets). Although the figure includes only the datasets available in the database, it is a good overview of sampling efforts in the different regions of the world
Figure 2.2 NEOTOMA and Latin American Pollen Database pollen records. Red dots: NEOTOMA database; blue
dots: African Pollen Database; yellow dots: inventoried sites for inclusion from Latin America and Japan. (Figure from Grimm et al. 2013)
Figure 2.3 workflow of palynological method applied in the research (modified from Faegri et al. 1989)
Figure 2.4 Controls on fire and the make-up of fire regime at different space and time scales (from Moritz et al.
2005)
Figure 3.1 Map showing sea level changes of Sunda, Sahul and Wallacea biogeographic regions (at -60 m and -
120 m and modern). In green the island of Sulawesi (modified from O’Connell et al. 2010)
Figure 3.2 Map of Sulawesi showing Central Sulawesi (grey), the boundaries of the Lore Lindu National Park (LLNP,
red) and primary rainforests (green, data source: Land Cover 2011, the Ministry of Forestry, the Republic of Indonesia)
Figure 3.3 Simplified geological map of Sulawesi with approximated location of the LLNP in the red square
(modified from Villeneuve et al. 2002)
Figure 3.4 left: view of the mid-montane rainforest dominated by Fagaceae; right: view of the mossy upper
montane rainforest dominated by Podocarpaceae (photos of P. Lembcke)
Figure 3.5 Comparison of estimated aboveground tree biomass (Mg ha-1) in relation to elevation (m asl.) in
Southeast Asian and Neotropical forests (from Culmsee et al. 2010)
Figure 3.6 Cup-marked stones named Kalambas and one decorated disc-shaped lid close to Kalambas from
Pokekea archaeological site in Besoa valley
Figure 4.1 Distribution of peatlands in SE Asia (modified from Wüst et al. 2007)
Figure 4.2 Schematic illustration of drainage effects on peatland dome (from Page et al. 2011)
Figure 4.3 Extent of oil palm and Acacia plantations on peatland in 2010 (modified from Miettinen et al. 2012)
Figure 4.4 Diagrammatic cross sections of the stages of peat development (modified from Cameron et al. 1989)
Figure 4.5 Kerapah (A) and basinal (B) peat catena compared. Ph.c. stands for Phasic communities (modified from
Morley 2013)
Figure 4.6 Areas of coastal (top) and inland (bottom) peatlands in time with sea-level curve of Sunda shelf
(modified from Dommain et al. 2014)
viii
Figure 5.1 a) Map of the research area showing the location of Lake Kalimpaa on the island of Sulawesi. Also
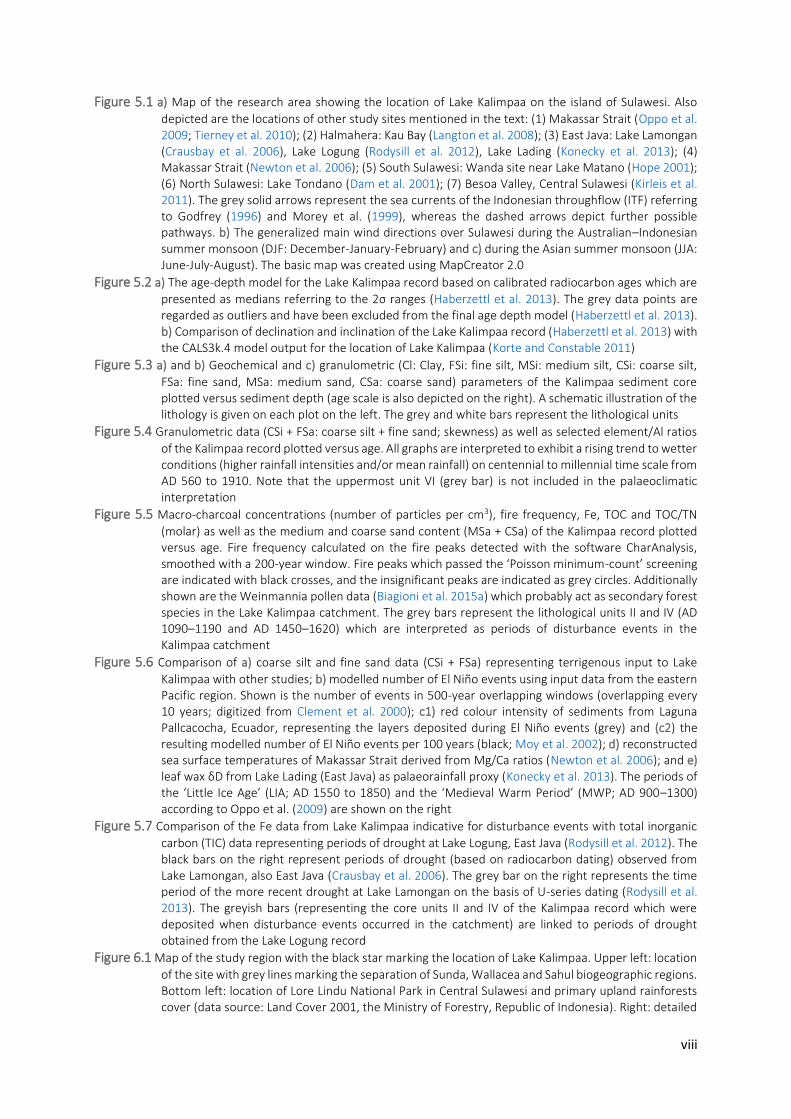
depicted are the locations of other study sites mentioned in the text: (1) Makassar Strait (Oppo et al. 2009; Tierney et al. 2010); (2) Halmahera: Kau Bay (Langton et al. 2008); (3) East Java: Lake Lamongan (Crausbay et al. 2006), Lake Logung (Rodysill et al. 2012), Lake Lading (Konecky et al. 2013); (4) Makassar Strait (Newton et al. 2006); (5) South Sulawesi: Wanda site near Lake Matano (Hope 2001); (6) North Sulawesi: Lake Tondano (Dam et al. 2001); (7) Besoa Valley, Central Sulawesi (Kirleis et al. 2011). The grey solid arrows represent the sea currents of the Indonesian throughflow (ITF) referring to Godfrey (1996) and Morey et al. (1999), whereas the dashed arrows depict further possible pathways. b) The generalized main wind directions over Sulawesi during the Australian–Indonesian summer monsoon (DJF: December-January-February) and c) during the Asian summer monsoon (JJA: June-July-August). The basic map was created using MapCreator 2.0
Figure 5.2 a) The age-depth model for the Lake Kalimpaa record based on calibrated radiocarbon ages which are
presented as medians referring to the 2σ ranges (Haberzettl et al. 2013). The grey data points are regarded as outliers and have been excluded from the final age depth model (Haberzettl et al. 2013). b) Comparison of declination and inclination of the Lake Kalimpaa record (Haberzettl et al. 2013) with the CALS3k.4 model output for the location of Lake Kalimpaa (Korte and Constable 2011)
Figure 5.3 a) and b) Geochemical and c) granulometric (Cl: Clay, FSi: fine silt, MSi: medium silt, CSi: coarse silt,
FSa: fine sand, MSa: medium sand, CSa: coarse sand) parameters of the Kalimpaa sediment core plotted versus sediment depth (age scale is also depicted on the right). A schematic illustration of the lithology is given on each plot on the left. The grey and white bars represent the lithological units
Figure 5.4 Granulometric data (CSi + FSa: coarse silt + fine sand; skewness) as well as selected element/Al ratios
of the Kalimpaa record plotted versus age. All graphs are interpreted to exhibit a rising trend to wetter conditions (higher rainfall intensities and/or mean rainfall) on centennial to millennial time scale from AD 560 to 1910. Note that the uppermost unit VI (grey bar) is not included in the palaeoclimatic interpretation
Figure 5.5 Macro-charcoal concentrations (number of particles per cm3), fire frequency, Fe, TOC and TOC/TN
(molar) as well as the medium and coarse sand content (MSa + CSa) of the Kalimpaa record plotted versus age. Fire frequency calculated on the fire peaks detected with the software CharAnalysis, smoothed with a 200-year window. Fire peaks which passed the ‘Poisson minimum-count’ screening are indicated with black crosses, and the insignificant peaks are indicated as grey circles. Additionally shown are the Weinmannia pollen data (Biagioni et al. 2015a) which probably act as secondary forest species in the Lake Kalimpaa catchment. The grey bars represent the lithological units II and IV (AD 1090–1190 and AD 1450–1620) which are interpreted as periods of disturbance events in the Kalimpaa catchment
Figure 5.6 Comparison of a) coarse silt and fine sand data (CSi + FSa) representing terrigenous input to Lake
Kalimpaa with other studies; b) modelled number of El Niño events using input data from the eastern Pacific region. Shown is the number of events in 500-year overlapping windows (overlapping every 10 years; digitized from Clement et al. 2000); c1) red colour intensity of sediments from Laguna Pallcacocha, Ecuador, representing the layers deposited during El Niño events (grey) and (c2) the resulting modelled number of El Niño events per 100 years (black; Moy et al. 2002); d) reconstructed sea surface temperatures of Makassar Strait derived from Mg/Ca ratios (Newton et al. 2006); and e) leaf wax δD from Lake Lading (East Java) as palaeorainfall proxy (Konecky et al. 2013). The periods of the ‘Little Ice Age’ (LIA; AD 1550 to 1850) and the ‘Medieval Warm Period’ (MWP; AD 900–1300) according to Oppo et al. (2009) are shown on the right
Figure 5.7 Comparison of the Fe data from Lake Kalimpaa indicative for disturbance events with total inorganic
carbon (TIC) data representing periods of drought at Lake Logung, East Java (Rodysill et al. 2012). The black bars on the right represent periods of drought (based on radiocarbon dating) observed from Lake Lamongan, also East Java (Crausbay et al. 2006). The grey bar on the right represents the time period of the more recent drought at Lake Lamongan on the basis of U-series dating (Rodysill et al. 2013). The greyish bars (representing the core units II and IV of the Kalimpaa record which were deposited when disturbance events occurred in the catchment) are linked to periods of drought obtained from the Lake Logung record
Figure 6.1 Map of the study region with the black star marking the location of Lake Kalimpaa. Upper left: location
of the site with grey lines marking the separation of Sunda, Wallacea and Sahul biogeographic regions. Bottom left: location of Lore Lindu National Park in Central Sulawesi and primary upland rainforests cover (data source: Land Cover 2001, the Ministry of Forestry, Republic of Indonesia). Right: detailed
ix
altitudinal map of the location of Lake Kalimpaa showing the border of Lore Lindu National Park (black line) and the road which passes near the lake
Figure 6.2 Contour maps of NCEP/NCAR reanalysis datasets. a) Composite means of surface precipitable water in
kg/m2 with arrows denoting wind directions for the period 1981–2010 for wet season (Dec–Jan–Feb, left) and dry season (Jul–Aug–Sep, right); b) composite means of precipitation anomalies in mm/day during the strong El Niño of 1997–1998
Figure 6.3 Summary diagram from Lake Kalimpaa showing the lithological table and: a) more common and
significant pollen taxa (expressed in percentages of total pollen sum); b) more common spore taxa (percentages of total sum), total pollen and Pteridophyta concentrations (pollen-spore cm−3), micro charcoal concentrations. Macro-charcoal concentrations (particles cm−3), fire peaks which passed the “Poisson minimum-count” screening represented with + symbols and the grey circles representing the peaks which did not pass the screening and fire frequencies (per 200 yr) (from: Wündsch et al. 2014), palynological diversity index (PDI based on sum of 300), palynological compositional change or turnover (PCC in standard deviation units) and rate of change per 10 years (ROC, in black: 0.3 lowess smooth, in grey: raw data). Grey bars on micro-charcoal and PDI values represent 0.95 confidence intervals. Outline curves showing an exaggeration of 3× to highlight variations of the taxa
Figure 6.4 a) Locations of the sites mentioned in the text; b) comparison of palynological diversity index (PDI),
palynological compositional change or turnover (PCC), rate of change (ROC), selected % pollen taxa (Fagaceae, Weinmannia and Macaranga/Mallotus)with % of clay grain size, % of Fe, number of fire episodes per 200 years of Lake Kalimpaa sediment core (Wündsch et al. 2014) and total inorganic carbon (%, TIC) from Lake Logung, Java, as drought indicator (Rodysill et al. 2012), δD value of leaf waxes from the Makassar Strait cores 31MC and 34GGC (3 point moving average of raw data) interpreted to represent rainfall amount changes as a consequence of the ITCZ mean position changes (Tierney et al. 2010). In black: 0.3 lowess smooth, in grey: raw data. Grey areas underline the correlation of disturbance events and regional droughts as discussed in the text and interpreted by Wündsch et al. (2014)
Figure 7.1 a) Map of the study region showing the location of the Lake Lindu sediment core (star). Upper left
location of the Lore Lindu National Park (LLNP, dark grey) in Central Sulawesi (light grey); upper right location of the Lindu plain, Bada, Besoa and Napu valleys, borders of the LLNP and other places mentioned in the text; bottom locations of the villages of the Lindu plain and the coring site. Data source, Land Cover 2011, the Ministry of Forestry, the Republic of Indonesia (http://appgis.dephut.go.id/appgis/download.aspx); b) upper photo view of the Langko village and grassland on the southwestern shore of the Lindu lake in 1902 (from Sarasin and Sarasin 1905). Bottom photo; view of the alang-alang (Imperata cylindrica) grassland from the village of Puroo in 2012, photo by S. Biagioni; c) example of charred leaf remain from grass found at 120 cm (ca. AD 1100) and details of dumb-bell silica body
Figure 7.2 a) Chronology of the Lake Lindu sediment record as well as inclination (inc), the natural remanent
magnetization (NRM) and maximum angular deviation values (MAD); b) comparison of the Lake Lindu inclination record to that from Lake Kalimpaa (Haberzettl et al. 2013) and the CALS3 K.4e (Korte and Constable 2011) model output calculated for the location of the sediment core from Lake Lindu
Figure 7.3 Summary diagram from the Lake Lindu sediment core divided into temporal zones and sub-zones. The
black lines are the locally weighted scatter plot smoothings (LOWESS) fitted to the sample values (light grey bars) to highlight trends. X-axes are rescaled for a better visualization of the least abundant taxa. a) Upper diagram Moraceae-Urticaceae (expressed in percentages of the total pollen sum); sum of lower montane rainforest, swamp, pioneer, secondary forest, anthropogenic, palms and long-distance transported pollen taxa (expressed as percentages of total pollen sum excluding Moraceae-Urticaceae); total Pteridophyta spores (expressed as percentages of sum of pollen and Pteridophyta spores); pollen, Pteridophyta and diatom concentrations (counts/cm3). Lower diagram: macro- and micro-charcoal concentrations (counts/cm3); swamp pollen taxa sum (percentages of the total pollen sum excluding Moraceae-Urticaceae); selected non-pollen palynomorph (NPP) concentrations (counts/cm3); selected diatoms (counts/cm3); CONISS dendrogram of the square root transformed proportions of all taxa (dissimilarity coefficient Edwards and Cavalli-Sforza’s chord distance); b) most significant pollen taxa within the groups (percentages of the total pollen sum excluding Moraceae-Urticaceae); selected Pteridophyta taxa (expressed as percentages of sum of pollen and Pteridophyta spores)
Figure 7.4 Principal component analysis (PCA) of all percentage data of identified pollen and spore taxa.
Percentages calculated on the total sum of all taxa square root transformed. First, second and third

x
axes are shown (cumulative explained variation 29%). Scatterplots represent the sample scores. Results are centered by taxa. Group of adjacent samples are marked differently to highlight the different groups corresponding to different prehistoric and historic phases. Palynological sub-zones are given in light grey; a) first and second axes scatterplots; b) second and third axes scatterplots
Figure 8.1 Map of the Sunda shelfwith the red star representing the location of the Air Hitam inland peat. The
light shaded area delineates the Sunda Shelf as it was exposed at the time of the Last Glacial Maximum (based on Sathuamurthy and Voris 2006). Line markers show the extension of peat deposits (data source: FAO Harmonized Soil Map of the World, Histosols and Gleysols layers only). Square symbols correspond to the approximate position of the available studies on peatlands in the area modified from Dommain et al. (2011): 1) Muara Telang (Furukawa 1994); 2) Sugihan (Brady 1997); 3) Batang
Hari Delta (Cameron et al. 1989; Esterle and Ferm 1994; Sabiham 1988; Sabiham and Furukawa 1986; Silvius et al. 1984); 4) Pulau Kijang (Furukawa 1994; Shibata et al. 1997); 5) Siak Kanan (Diemont and
Supardi 1987a; Neuzil 1997; Ruppert et al. 1993; Supardi et al. 1993); 6) Palau Padang (Brady 1997);
7) Pulau Bengkalis (Neuzil 1997; Supardi et al. 1993); 8) Siak Kecil (Gunawan et al. 2012); 9) Pekan
Nanas (Haseldonckx 1977); 10) Tasek Bera (Morley 1982; Phillips and Bustin 1998; Wüst et al. 2002; Wüst and Bustin 2004); 11) Rajang River Delta (Staub and Esterle 1993; Staub and Esterle 1994; Staub
and Gastaldo 2003); 12) Batu Niah (Cole 2012; Cole et al. 2015); 13) Sungai Dua Forest Reserve and
Senadin (Cole 2012; Cole et al. 2015); 14) Baram River area (Anderson 1964; Anderson and Muller
1975; Brünig 1974; Dommain et al. 2015; Esterle and Ferm 1994; Morley 2013; Muller 1963; Sabiham
1990; Tie and Esterle 1992; Wilford 1960; Woodroffe 2000); 15) Lawas River area (Anderson 1963; Morley et al. 2011; Muller 1963; Wilford 1960); 16) Teluk Keramat (Neuzil 1997); 17) Rasau Jaya
(Anshari et al. 2010; Diemont and Supardi 1987b; Notohadiprawiro 1981); 18) Pemerak (Anshari et
al. 2001; Anshari et al. 2004); 19) Sebangau (Kershaw et al. 2000; Morley 1981; Morley 2013; Neuzil
1997; Page et al. 1999; Page et al. 2004; Page et al. 2006; Rieley and Page 1997; Sieffermann et al.
1988; Sieffermann et al. 1992; Sieffermann et al. 1996; Yulianto and Hirakawa 2006; Yulianto et al.
2004; Wüst 2009; Wüst et al. 2008); 20) Pulau Petak Delta (Notohadiprawiro 1981; Sabiham 1988; Sumawinata 1998); 21) Kutai lake area (Hope et al. 2005). Different colors of the squares denote different ages for the initiation of the peat and the pollen symbol (blue) indicates the sites where palynological analysis was conducted
Figure 8.2 Monthly mean precipitation, temperature values and annual means for the Air Hitam area (2.047685°S
102.665362°E) based on the interpolations of observed data representative of the period 1950–2000. Data source: WorldClim — Global Climate Data, http://www.worldclim.org/
Figure 8.3 Maps of the study areawith black star symbolsmarking the locations of the coring. Left: altitudinal map
of the Air Hitam watershed (Digital Elevation Model: ASTER GDEM Version 2, METI and NASA). Right: current land-use of the study area. Data source: Land Cover 2011: the Ministry of Forestry, the Republic of Indonesia (http://appgis.dephut.go.id/appgis/download.aspx); river data: digitalized from Bakosurtanal, Peta Rupa Bumi Indonesia scale 1:50.000, 2013
Figure 8.4 Stratigraphy, color and characteristic of the three peat/sediment cores and AMS radiocarbon dates
(star symbol)
Figure 8.5 Age-depth profile of Jaw SPT core. Smoothing spline proved the best fitting model, with extrapolated
basal points and surface (3 cm) age set at −62 years (AD 2012). Red symbols depict outliers. Dotted line indicates peat initiation depth (664 cm) and estimated age
Figure 8.6 Summary diagram of the Jaw SPT core analyses with zonation based on constrained cluster analysis
and palynological data. The black lines are the locally weighted scatterplot smoothing (LOWESS) fitted to the sample values (light green and gray lines) to highlight trends. a) Sea-level relative changes of the Malacca Strait (Geyh et al. 1979); peat thickness (cm); peat accumulation rate (mm/yr); pollen groups (expressed as percentage of total pollen and spores); macro-charcoal concentrations (counts/cm3), peak magnitude (particles/cm2 per peak) and fire frequency (number of fires per 800 years). The gray symbol “//” indicates a scale break used on large values on the x-axis to highlight smaller peaks; palynological diversity index (DI, ET(10)) and palynological compositional change or turnover (PCC, standard deviation units). b) Most important and common pollen and spore taxa expressed as percentage of total pollen and spore sum. Dashed black lines are the exaggerated LOWESS lines (5x) for less abundant taxa. c) Testate amoeba environmental groups and size classes (expressed as percentage of the total sumof testate amoebae); testate amoebae diversity index (DI,
xi
ET(28)). d) Most important and common testate amoebae taxa (expressed as percentage of the total sum of testate amoebae)
Figure 8.7 Samples scatterplot of the principal component analysis (PCA) of all percentage data of identified pollen
and spore taxa. Percentages calculated on the total sum (Pandanus excluded) of all taxa square root transformed. First and second axes cumulative explained 34% of the variation in pollen and spore taxa data. Differently marked palynological zones correspond to different vegetation phases. Gray arrows correspond to the variation of testate amoeba environmental groups (water, peat moss, green moss, soil and indicators of drier conditions) and size classes (large, medium and small) used as supplementary variables. Only most important taxa are shown
Figure 9.1 a) Map of Sundaland, showing the study area (yellow square) in the Province of Jambi (red line) in
Sumatra. Grey areas represent the Sunda shelf. Black areas represent peatlands (data source for peat FAO Harmonized Soil Map of the World, Histosols and Gleysols layers only); b) location of the Jaw SPT core (yellow circle) in the Air Hitam peat dome (dark grey area)
Figure 9.2 Selected results of the Jaw SPT core analyses. The diagrams are dived in the two phases: minerotrophic
(light blue) and ombrotrophic (light red). From the top: dipterocarp-mixed swamp and peat swamp pollen and spore taxa (%). In light gray the % values of Pandanus pollen. Testate amoebae water and dry indicators (%); sediment/peat characteristics; long-term apparent carbon accumulation rate (LORCA, C g/m2 yr) and peat accumulation rates (mm/yr); fire frequency and magnitude calculated on the fire peaks (asterisks) detected with the software CharAnalysis. Cut symbol denote fire peaks which were cut to highlight trend in minor peaks
Figure 9.3 a) Comparison of LORCA (expressed as C g/m2 per yr) during the Holocene of Sebangau, Palangka Raya
(Central Kalimantan; Page et al. 2004; Neuzil 1997), Teluk-Kemarat (West Kalimantan; Neuzil 1997) and Siak Kanan (Riau, Sumatra; Diemont and Supardi 1987a) with the Air Hitam peat dome as calculated from the Jaw SPT core analysis. Average (dots) and min, max values (whiskers) are shown. Data source for all other sites other than Air Hitam: Dommain et al. 2011; b) Boxplots of the Jaw SPT LORCA (average, first and third quartiles, min and max values) divided in the minerotrophic (ca. 7800-4500 cal yr BP) and ombrotrophic phase (4500 cal yr BP-present)
Figure 9.4 a) Schematic overview of the network of interactions as the system changed from the minerotrophic
to ombrotrophic settings. Large blue arrows represent changes (increase/decrease) of the most important parameters reconstructed from the proxy results from minerotrophic to ombrotrophic phase. Graphs show the minerotrophic (white) and ombrotrophic (light green) phases. Black lines where present represent the locally weighted scatter plot smoothings (LOWESS) fitted to the sample values (grey bars) of: a) dry and b) water testate amoeba groups (%), c) Pandanus pollen (%), d) macro-charcoal peaks frequency per 800 yr and e) LORCA (C g/m2 per yr)
Figure 9.5 Comparison of Jaw SPT core results with other proxies of environmental and climatic variability for the
last 8000 years. a) sea-level changes (median, min and max values in m) in the Strait of Malacca (Geyth et al. 1979); b) Borneo stalagmite δ18O record from Gunung Buda National Park (Partin et al. 2007); c) δD records of n-C30 and n-C2 alkanoic acids from marine sediment cores in northwest Sumatra (Niedermeyer et al. 2014); d) modelled number of El Niño events per 100 years based on red colour intensity of sediments from Laguna Pallcacocha, Ecuador (Moy et al. 2002); selected results of the Jaw SPT core analyses (Biagioni et al. 2015b; Chapter 8): e) fire peak magnitude and fire frequency (asterisks indicate correspondence of high in magnitude fire peaks as reconstructed from macro-charcoal analysis of Jaw SPT core and high numbers of El Niño events modelled from Laguna Pallcacocha. Cut symbol denote fire peaks which were cut to highlight trend in minor peaks); f) testate amoeba dry indicators as % of total sum; g) LORCA
Figure 9.6 Diagram comparing 15N natural abundance, % of total open pioneer pollen and spore group and % of
the pioneer pollen taxa Macaranga/ Mallotus as compared to reconstructed fire frequency. The diagram is dived in minerotrophic and ombrotrophic phases. Pink bars highlight phases in which increase in 15N natural abundance corresponds to increases of the open pioneer group and/or Macaranga/Mallotus, while grey bars highlight phases where there was no correspondence
xii
Tables Table 2.1 Detailed information on the sites and sediment cores studied
Table 5.1 Correlation matrix including the Pearson product–moment correlation coefficient and the related p-
value of the grain size fractions from all measured samples of the Lake Kalimpaa record. The limits of grain size fractions are according to Ad-hoc AG Boden (2005) as follows: clay (Cl), fine silt (FSi), medium silt (MSi), coarse silt (CSi), fine sand (FSa), medium sand (MSa) and coarse sand (CSa). Highly significant correlations (p < 0.001) are highlighted (bold: highly positively correlated, bold italic: highly negatively correlated)
Table 6.1 Zone characteristics, pollen and spores percentages, PDI, PCC, ROC, charcoal and fire frequencies of the
Lake Kalimpaa core (* macro-charcoal data from Wündsch et al. 2014)
Table 7.1 Overview of prehistory and history of Central Sulawesi and Lindu plain, as discussed in the text
Table 7.2 Accelerator mass spectrometry radiocarbon dates from Lake Lindu, calibrated age ranges at 95%
confidence intervals (a Ages used for chronology are in bold; calibration done with R script CLAM, calibration curves SHCal13.14C and postbomb_SH1-2.14C for postbomb dates)
Table 8.1 Accelerator mass spectrometry radiocarbon dates from Air Hitam cores, calibrated age ranges at 95%
confidence intervals. Calibration done with R script CLAM 2.2, calibration curve SHCal13.14C. Outliers are in light gray
Table 8.2 Ecological groupings of plant taxa identified (pollen and spores)
Table 8.3 Zone characteristics and results of the Jaw SPT core analyses
Table 9.1 Environmental grouping of testate amoebae
Appendices
Appendix A1 Complete list of identified pollen, spores and non-pollen palynomorphs (NPP) of the records
Appendix A2 Photos of selected taxa
Appendix B Complete pollen, spores, NPP and charcoal records

xiii
Acronyms
AD: Anno Domini AF: stepwise Alternating Field demagnetization
AGB: Above Ground Biomass AMS: Accelerator Mass Spectrometry
BC: Before Christ BP: Before Present (1950)
cal: calibrated CHAR: Charcoal Accumulation Rate
ChRM: Characteristic Remanent Magnetization Cl: Clay
CSa: Coarse sand CSi: Coarse silt
DCCA: Detrended Canonical Correspondence Analysis
DI: Diversity Index (calculated with rarefaction analysis)
EFForTS: “Ecological and Socioeconomic Functions of Tropical Lowland Rainforest Transformation Systems” project
ELUC: “Environmental and Land-Use Change in Sulawesi, Indonesia” project
ENSO: El Niño-Southern Oscillation FRI: Fire Return Interval
FSa: Fine sand FSi: Fine silt
GAD: Geocentric Axial Dipole model IOD: Indian Ocean Dipole
IPWP: Indo-Pacific Warm Pool ITCZ: Intertropical Convergence Zone
ITF: Indonesian throughflow LGM: Last Glacial Maximum
LIA: Little Ice Age LLNP: Lore Lindu National Park
LORCA: Long-term apparent carbon accumulation rate
MAB: UNESCO Man and Biosphere Programme
LOWESS: Locally weighted scatter plot smoothings
MSa: Medium sand
MAD: Maximum Angular Deviation MWP: Medieval Warm Period
MSi: Medium Silt NRM: Natural Remanent Magnetization
NPP: Non-Pollen Palynomorph PCA: Principal Component analysis
OP: Oil Palm PSV: palaeomagnetic Secular Variations
PCC: Palynological Compositional Change SD: Standard Deviation
ROC: Rate Of Change Sk: skewness
SE: Southeast (Asia) STORMA: “Stability of Rainforest Margins in Indonesia” project
SST: Sea-Surface Temperatures TN: Total Nitrogen
TIC: Total Inorganic Carbon WPWP: West Pacific Warm Pool
TOC: Total Organic Carbon

1
Preface
“Everything is the way it is because it got that way”
On Growth and Form, D’Arcy Wentworth Thompson (1917)
In the book, On Growth and Form, Thompson coniated this famous aphorism for a scientific view of the
universe. In its apparent simplicity, it emphasizes the importance of forces and processes, in other
words, of history, to understand why everything is the way it is. The basic concept is that one cannot
truly understand modern forms/systems while simply looking (observing) their current state, which is a
static picture of something dynamic in an ever-changing state. To understand it is necessary to uncover
the mechanisms that generated this modern state.
Ecological research on natural (and anthropogenic) ecosystems is often (if not always) focused on
present-day states. Investigating such a relatively short time interval is often insufficient to fully
understand ecosystem dynamics such as succession, stability, tipping points and biodiversity patterns.
Hence, the history (here palaeoecology) of an ecosystem, how it got to be this way, is equally important.
How montane tropical rainforests in Central Sulawesi and peat swamp rainforests in the Jambi Province
in Sumatra have responded to climate changes and human activities in the past and how they developed
to be what they are today, those are the key questions this thesis aims to investigate.
Thesis aims
This thesis and the research behind it are devoted to investigate long-term vegetation dynamics,
climate, fire regime and human disturbance in hot-spot montane ecosystems of the Lore Lindu National
Park in Central Sulawesi and an inland peatland of Jambi, Sumatra (Indonesia). The main aims are:
o Reconstructing past vegetation and climate dynamics in the two study areas
o Investigating the history of human impact on the landscape
o Assessing the impact and role of droughts (e.g. El Niño) and fires
o Adding a historical perspective to the evaluation of current and future changes
Thesis outline
The first 4 chapters are dedicated to the introduction of the two regions under study and a general
overview of the methodologies applied. An overview of the importance of tropical rainforests in
Indonesia and the current and future drivers of change is given in Chapter 1. Chapter 2 includes a
description of the multi-proxy palaeoecological methods applied and studied sites. Sulawesi and the
montane ecosystems of the Lore Lindu National Park are described in Chapter 3. In Chapter 4, an

2
overview of the state of knowledge of peatlands of Southeast (SE) Asia is given with particular attention
to the peat-swamp rainforests in Sumatra.
The following chapters are organized according to the manuscripts which are currently published
(Chapters 5 to 8) or prepared for submission (Chapter 9) and include the results of the research:
Chapter 5
ENSO and monsoon variability during the past 1500 years as reflected in sediments from Lake Kalimpaa,
Central Sulawesi (Indonesia)
Reconstructions of local climate variability as reflected in sediment are indispensable when the final aim
is to investigate climate sensibility-resilience of natural tropical rainforests. The multi-proxy
investigation included palaeorainfall proxies and fire/disturbance indicators which are used to highlight
general trends in climate and periods of disturbance in the catchment area of Lake Kalimpaa for the last
ca. 1500 years.
Chapter 6
Assessing resilience/sensitivity of tropical mountain rainforests towards climate variability of the last
1500 years: The long-term perspective at Lake Kalimpaa (Sulawesi, Indonesia)
Following the climate reconstruction from Chapter 5, the vegetation dynamics are reconstructed using
palynological analysis and they are used to investigate the long-term effects of climate variability and
disturbance on the tropical montane rainforests.
Chapter 7
Unravelling the past 1000 years of history of human-climate-landscape interactions at the Lindu plain
(Sulawesi, Indonesia)
Human-landscape interactions in the past are reconstructed in the Lindu plain, an important cultural
lake valley and known fish reserve in Central Sulawesi. The effects of pre-colonial and post-colonial
cultural changes are discussed in the light of climate variability for the last ca. 1000 years.
Chapter 8
8000 years of vegetation dynamics and environmental changes of a unique inland peat ecosystem of the
Jambi Province in Central Sumatra, Indonesia
Despite their importance as global carbon sink, peatlands of SE Asia have rarely been studied and our
current knowledge of dynamics and ecology of these ecosystems remains incomplete. Palaeoecological
and palynological multi-proxy analyses were carried out on a core taken from the thick Air Hitam inland
peat in the Jambi Province of Central Sumatra. The long-term development of the peatland is discussed,
highlighting dynamics of vegetation community phases in relation to local hydrology and climate over
time.

3
Chapter 9
Effects of long-term climate and environmental variability on the development of inland tropical peat
swamp ecosystems in Jambi Province, Sumatra, Indonesia
The long-term development of the peat-swamp ecosystems are compared to regional climatic and
environmental records to investigate the relative importance of each factor in shaping todays system.
Chapter 10
The main findings of the research are summarized and synthesized to give comprehensive conclusions.
Further, possible uncertainties are mentioned and recommendations for future research aspects to be
covered are given.

4

5
CHAPTER 1 - Introduction
Tropical rainforests of Indonesia
At the beginning of the second half of the 20th century the tropical rainforests of Indonesia covered
about 160 million hectares. Despite their limited geographic extension compared to the African and
South American tropics, these ecosystems are widely acknowledged as biodiversity hotspots
(Mittermeier et al. 1999; Myers et al. 2000; Figure 1.1) and are regarded as particularly important due
to the numerous ecological and socio-economic services that they provide at the local, regional and
global scale. Through photosynthesis and respiration, tropical rainforests absorb carbon dioxide and
store the carbon (Figure 1.2) significantly affecting the global carbon flux with consequent impact on
climate (Malhi and Grace 2000). Most of the carbon is stored as living biomass (aboveground and
belowground) and dead organic matter (i.e. dead trees, leaf litter and soil organic matter).
Additionally, to their global function as carbon sink, tropical rainforests are highly diverse ecosystems
and provide essential services for the local human populations. For instance, rainforest ecosystems
provide ecological services such as erosion and flood prevention, water filtration, pollination-functions
and have resources like timber and medicinal plants.
Figure 1.1 Conservation International map showing biodiversity hotspots of the world. These are biogeographical units of quite unequal size featuring exceptional concentrations of endemic plant and vertebrate species and experiencing exceptional loss of habitat. In the blue square approximate position of Indonesia (http://www.conservation.org/How/Pages/Hotspots.aspx)

6
Phytogeography of Indonesia
With ca. 41,000 species of
vascular plants, the Malesian
archipelago, where Indonesia is
located, is one of the most
species-rich areas of the world
(Roos 1993). Alfred Russel
Wallace already recognized in
1863 that this area presented
islands which were
biogeographically markedly
different. Following his pioneer
work, more “lines” or
biogeographic borders were drawn ever since (Figure 1.3). The area cutted centrally by these lines is
refered to as Wallacea (Philippines, Sulawesi, the Lesser Sunda Islands and the Moluccas; from
Dickerson 1928). Located on the western side of Wallacea is the Sunda shelf or Sundaland (Malay
Peninsula, Sumatra, Java and Borneo) and to the eastern side (New Guinea) is the Sahul shelf (Figure
1.3; van Welzen et al. 2011). Despite the fact that
these boundaries were based on faunal data, Van
Welzen et al. (2011) found in their assessment of
phytogeographic regions that, with the exception of
Java, the separations apply to plants as well. Their
analysis, so far the only study including a complete
data set of vegetation distribution, shows that
phytogeographically, the Malesian area can be
divided in three sections corresponding to the Sunda
Shelf, the Wallacea (including parts of Java), and the
Sahul Shelf. Therefore, plant species dispersion is
also affected by the boundaries marked by the
faunal lines. Traditiolally, these distribution patterns
have been explained as caused by present day
climatic regional differences and past sea-level
changes (van Welzen et al. 2011). For instance, when
sea-levels were up to 120 m lower during the Last
Glacial Maximum (LGM: ca. 21,000 cal yr BP; Figure
Figure 1.3 Map of Southeast Asia showing the main biogeographic lines.
The grey areas represent Sunda and Sahul shelves (modified from Moss
and Wilson 1998)
Figure 1.4 Reconstruction of sea-level history since the LGM (21,000 cal yr BP) for the Sunda shelf (from Hanebuth et al. 2011)
7
1.4), large areas currently submerged were exposed (Emmel and Curray 1982; Hanebuth et al. 2000),
resulting in dry Sunda and Sahul Shelves (Voris 2000; Bird et al. 2005; Sathiamurthy and Voris 2006).
The removal of the marine barriers, would have enhanced terrestrial migration and rainforests probably
expanded during glacial periods (Cannon et al. 2009). Opposite to that, dispersal barriers were
reinforced durint periods of high sea-levels such it is the current interglacial (Tjia 1996; Woodroffe 2000;
Figure 1.4).
Modern climate of Indonesia
The position of Indonesia between two continents (Asia and Australia) and two oceans (Indian and
Pacific) makes it climatically one of the most interesting parts in the world (Gunawan 2006). The heat
source of Indonesia and the Pacific is a major driver of the global circulation (McBride and Frank 1999).
Particularly important is the role of the Indonesian region in providing energy for the operation of the
north-south tropical Hadley cell and the east-west Walker circulation (Yan et al. 1992). The on-land main
variable of Indonesia's climate is rainfall (Aldrian et al. 2004). In general, monthly rainfall is between 170
and 330 mm, as convective activity is very high in the archipelago (Aldrian and Susanto 2003).
At the intra-annual scale rainfall pattern are mostly driven by the changes in the seasonal insolation
which affects the monsoon circulation and the position of the Intertropical Convergence Zone (ITCZ;
Dommain et al. 2014). Roughly every six months, the onset of the Asian monsoon brings heavy
precipitation from the northwest followed by the dry south easterlies of the Australian monsoon (Figure
1.5). Therefore, a wetter season in most part of Indonesia occurs from October to March during the
Asian monsoon and a drier season coincides with the Australian monsoon from April to September
(Gunawan 2006). Inter-annual variations in rainfall are influenced by the strengths of the monsoons,
the phase of El Niño-Southern Oscillation (ENSO) and, particularly in Sumatra, by the Indian Ocean
Dipole (IOD; Saji et al. 1999;
Dommain et al. 2014). ENSO is a
hemispheric or global
phenomenon currently occurring
every 2 to 7 years and
characterized by two different
phases (Torrence and Compo
1998). During El Niño (La Niña)
warm (cold) phases, Indonesia
experiences lower (higher) rainfall
than in other years (Philander
1990; Cane 2005). The IOD is an
Figure 1.5 Contour maps of NCEP/NCAR reanalysis datasets showing the composite means of surface precipitable water in kg/m2 with arrows denoting wind directions for the period 1981–2010. Left: wet season (Dec–Jan–Feb, left) corresponding to the Asian summer monsoon. Right: dry season (Jul–Aug–Sep, right) corresponding to the Australian monsoon (Biagioni et al. 2015a)
8
aperiodic oscillation of the Indian Ocean SST’s. A positive (negative) IOD phase corresponds to the
cooling (warming) of waters in the eastern Indian Ocean, which is accompanied by droughts (higher
precipitations) in Sumatra (Webster et al. 1999).
Recent drivers of Indonesian rainforest changes
Starting in the 1950s, the commercial exploitation of rainforests and their conversion to plantations in
Indonesia have grown rapidly and in less than 50 years more than 50% of the rainforests were converted
(Forest Watch Indonesia/Global Forest Watch 2002). Miettinen et al. (2011) have shown that in
Indonesia deforestation did not stop with the start of the new millennium, but is continuing at a high
rate. The consequences of such a transformation are not restricted to the tropical regions directly
affected, but expand beyond to inderectely affect the whole world (Miettinen et al. 2011). One major
global concern regards the amount of carbon released into the atmosphere through deforestation of
tropical rainforests and its potential contribution to global anthropogenic climate change (Houghton et
al. 2000; Defries et al. 2002; Achard et al. 2004; Defries et al. 2007; Skutsch et al. 2007; van der Werf et
al. 2009). Beside the indirect negative climatic feedback, the ongoing massive deforestation and forest
degradation is causing habitat loss and forest fragmentation, which have a vast impact on biodiversity
loss and species extinction in Indonesia.
Besides direct human pressure an additional potential driver of change for tropical rainforests is
represented by anthropogenic climate change. The IPCC Fifth Assessment Report (Stocker 2014)
provides climate change predictions for the SE
Asian region and predicts a warming in the range
of 0.8oC to 3.2oC by the end of 21st century.
Although mean precipitation predictions sees a
moderate increase in rainfall for the whole SE
Asia, the scale varies at the regional level and
there is an explicit pattern of increasing rainfall
during the wet season and decreasing during the
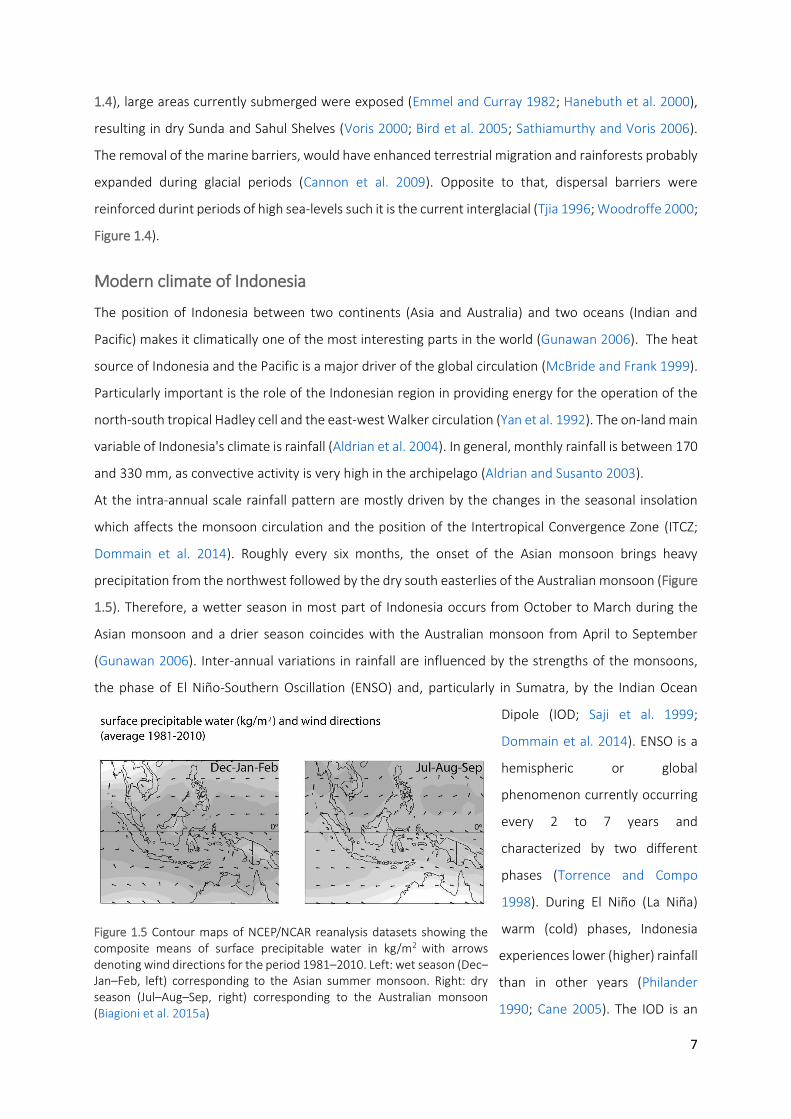
dry season (Figure 1.6). Adding to this pattern of
increased seasonality, ENSO-related precipitation
variability at the inter-annual scale will likely be
intensified due to the increase in moisture
availability (Li et al. 2007; Stocker 2014).
How the tropical ecosystems will respond to
regional climate changes and how vegetation
changes and climate will interact in the tropical
Figure 1.6 Maps of precipitation changes for Indonesia in 2081-2100 with respect to 1986-2005. Top: dry season from June to September. Bottom: wet season from December to March. Model scenario: RCP4.5 scenario with CMIP5 model. The grey lines represent areas where the signal is smaller than one standard deviation of natural variability (generated from KNMI Climate Change Atlas: http://climexp.knmi.nl/)
9
regions of SE Asia is still a matter of speculation. The testing of how forests respond to increasing carbon
dioxide, temperature and rainfall variability needs large and difficult manipulation experiments which
ecologists have only just started to conduct in the tropics. The complexity of the matter is further
underlined by the often contradicting results of vegetation models and field experiments which show
remarkable variability in forest sensitivity to climate change (e.g. Allen et al. 2010; Schuldt et al. 2011;
Schippers et al. 2015; Van der Sleen et al. 2015).
Undoubtedly, we need to improve our understanding of how tropical forests respond to climate
variability and disturbance on the long-term.
Scientific investigations in Indonesia: the projects and regions under study
In order to investigate the ecological and socio-economic consequences of transformation of tropical
rainforests in Indonesia, the Georg-August-University of Göttingen has started to work in Indonesia in
collaboration with Indonesian Universities in Sulawesi, Java and Sumatra already in 2000.
The project “Environmental and land-use change in Sulawesi, Indonesia (ELUC)” has been conducted
between October 2010 and December 2012 in the Lore Lindu National Park (LLNP), Central Sulawesi
(https://www.uni-goettingen.de/de/189495.html). The Collaborative Research Centre CRC 990
“Ecological and Socioeconomic Functions of Tropical Lowland Rainforest Transformation Systems
(EFForTS)” started in the Jambi Province, Sumatra in 2012 (http://www.uni-
goettingen.de/en/310995.html). Within those two interdisciplinary research projects, palaeoecological
and palaeoenvironmental investigations were carried out in the studied regions in order to provide a
valuable contribution by showing how the natural vegetation has responded to climate variability and
human activities in the long-term.

10

11
CHAPTER 2 - Palaeoecology
“I shall collect plants and fossils, and with the best of instruments make astronomic observations. Yet this
is not the main purpose of my journey. I shall endeavor to find out how nature's forces act upon one
another, and in what manner the geographic environment exerts its influence on animals and plants.
In short, I must find out about the harmony in nature”
Alexander von Humboldt, Letter to Karl Freiesleben (June 1799)
The contribution of palaeoecological investigations
Modern ecosystems are the result of the combined action of ecological and historical factors. The
relative importance of each of these agents in shaping the present-day world can be evaluated using
both ecological and palaeoecological investigations (Rull 2010). Within the tropical ecology there are
still many knowledge gaps concerning the dynamic processes that govern the functioning of Indonesian
rainforests. One of the main uncertainties regards the long-term impact of climate variability and
disturbance on these ecosystems (Cole et al. 2012).
The investigations and reconstructions of long-term vegetation dynamics unravel the ecosystem
responses to climate change and disturbance in the long-term and add to the understanding of the state
and functioning of today’s ecosystems (Schüler 2012). Indirectly, this knowledge increases our
understanding on how these ecosystems might respond to current and future change scenarios (Willis
et al. 2010). Palaeoecological investigations on natural sediment archives represent a powerful tool
which can be used to quantitatively unravel past vegetation dynamics and their response to long-term
perturbance. These “palaeo” approaches have extensively been used in temperate ecosystems since
the pioneer works of Von Post (1916) and Erdtman (1921) revealed the potential of microscopic fossils
to provide insights into past vegetation and climate change. However, the employments of
palaeoecological analysis in tropical regions have only recently gained attention. As a consequence,
despite their importance, the tropical regions of Indonesia are one of the least studied regions in the
world (Figure 2.1).
Montane rainforests and peat-swamp rainforests are amongst the least known and most threatened
ecosystems in Indonesia in the view of current and future scenarios of change (Chapter 3 and Chapter
4). With this research we aimed at filling this gap of knowledge for these important ecosystems in the
regions under study.

12
Figure 2.1 NEOTOMA and Latin American Pollen Database pollen records. Red dots: NEOTOMA database; blue dots: African Pollen Database; yellow dots: inventoried sites for inclusion from Latin America and Japan. (Figure from Grimm et al. 2013)
The multi-proxy approach in palaeoecology
In order to extend modern ecological observations on the dynamics of tropical ecosystems, we can look
back into the past using sedimentary records with preserved fossil organisms or palaeoecological
proxies (Birks and Birks 2006). Palaeoecological proxies include a wide variety of biological and non-
biological remains. The basic idea is that, as statistical proxy, a palaeoecological proxy preserves physical
characteristics of the past for direct measurements and enables scientists to reconstruct the
environmental conditions that prevailed in the past. In other words, they are indirect evidences of
certain climatic and environmental conditions in the past, which are no longer present for direct
measurement. When more than one independent proxy is included in a palaeoecological study, such an
investigation is called multi-proxy (Birks and Birks 2006). The main advantage of applying a multi-proxy
approach is that misinterpretations of single proxy-data are reduced when several others are combined
in the reconstruction. Additionally, the use of different proxies allows hypothesis on causalities of
changes to be tested (Birks and Birks 2006). Coring of natural sediment archives was done in Sulawesi
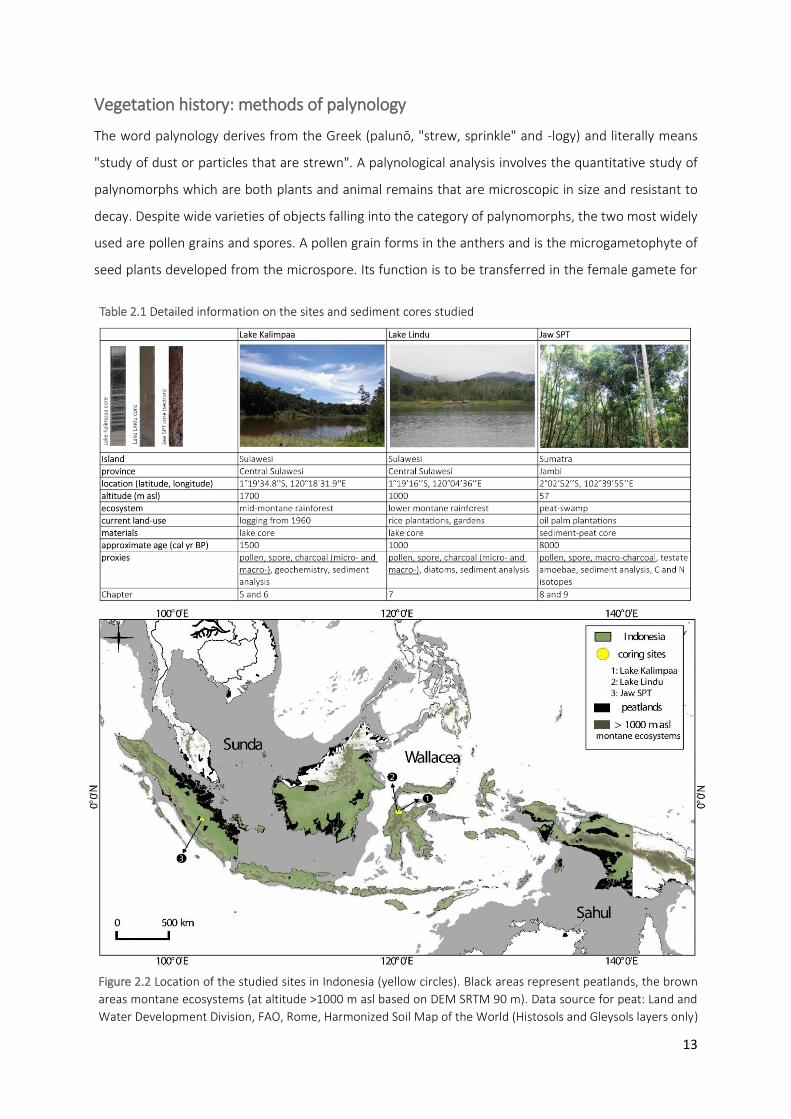
(Chapter 3) at Lake Kalimpaa and Lake Lindu and in an inland peat dome in Sumatra (Chapter 4; Figure
2.2 and Table 2.1). The investigations follow a multi-proxy approach and different palaeoecological and
palaeoenvironmental proxies are used in collaboration with other researchers. The main body of the
palaeoecological research, however, is made of pollen, spores and charcoal analyses. As a consequence,
further details will be given in the following paragraphs on the applications and methods of such proxies.
13
Vegetation history: methods of palynology
The word palynology derives from the Greek (palunō, "strew, sprinkle" and -logy) and literally means
"study of dust or particles that are strewn". A palynological analysis involves the quantitative study of
palynomorphs which are both plants and animal remains that are microscopic in size and resistant to
decay. Despite wide varieties of objects falling into the category of palynomorphs, the two most widely
used are pollen grains and spores. A pollen grain forms in the anthers and is the microgametophyte of
seed plants developed from the microspore. Its function is to be transferred in the female gamete for
Figure 2.2 Location of the studied sites in Indonesia (yellow circles). Black areas represent peatlands, the brown
areas montane ecosystems (at altitude >1000 m asl based on DEM SRTM 90 m). Data source for peat: Land and
Water Development Division, FAO, Rome, Harmonized Soil Map of the World (Histosols and Gleysols layers only)
Table 2.1 Detailed information on the sites and sediment cores studied

14
fertilization. Spore is the general term used for microscopically, unicellular asexual or asexual
reproductive units of cryptogams (such as algae, bryophytes, ferns and fungi).
A series of circumstances have contributed to make the use of pollen and spores so popular, which Birks
and Birks (1980) summarized in the following principles:
o “Pollen grains and spores are produced in large quantities during the natural reproductive
cycles of plants. Vegetation composition can therefore be inferred from the pollen grains
released into the environment (pollen rain), as these are assumed to be a function of the
number of parent plants”
o “The majority of pollen grains and spores produced by plants never fulfil their reproductive
function, and are deposited within sediments. They preserved as fossils being made of
compounds that are highly resistant to most forms of decay other than oxidation”
o “Fossil pollen grains and spores can be extracted from sediments deposited in anoxic conditions
and thanks to their morphological taxonomic features they can be identified down to
family/genus/species level under the microscope”
o “The stratigraphic level at which they are extracted corresponds with particular periods in the
past and the timeline can be reconstructed using methods such as radiocarbon dating”
These principles allow palynologists to reconstruct the vegetation dynamics of the past by counting
fossil pollen grains and spores preserved under anoxic conditions in sediment deposits.
Laboratory methods for sediment pollen and spores analyses have been defined and standardized by
Faegri et al. (1989). The methods employed the use of chemical reactors and sieving in order to remove
the large quantities of organic and inorganic materials contained in sediments and “clean” the sample
to facilitate the analysis under the light microscope (Figure 2.3).
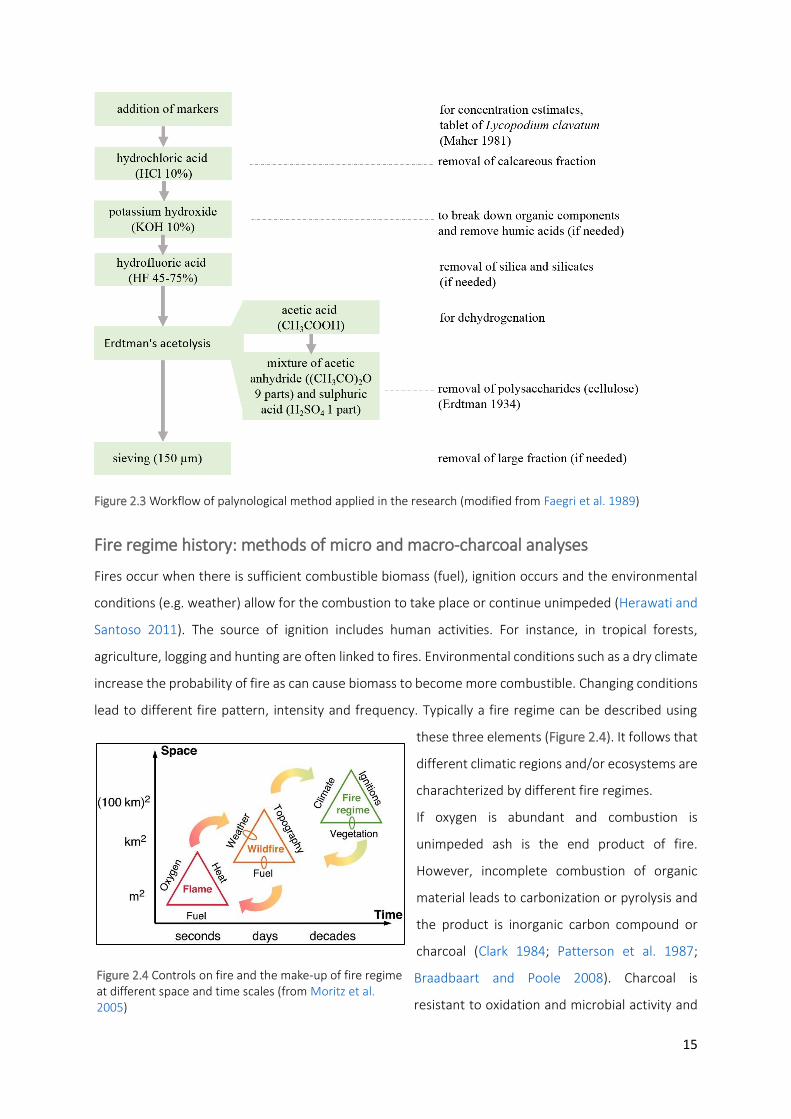
15
Figure 2.3 Workflow of palynological method applied in the research (modified from Faegri et al. 1989)
Fire regime history: methods of micro and macro-charcoal analyses
Fires occur when there is sufficient combustible biomass (fuel), ignition occurs and the environmental
conditions (e.g. weather) allow for the combustion to take place or continue unimpeded (Herawati and
Santoso 2011). The source of ignition includes human activities. For instance, in tropical forests,
agriculture, logging and hunting are often linked to fires. Environmental conditions such as a dry climate
increase the probability of fire as can cause biomass to become more combustible. Changing conditions
lead to different fire pattern, intensity and frequency. Typically a fire regime can be described using
these three elements (Figure 2.4). It follows that
different climatic regions and/or ecosystems are
charachterized by different fire regimes.
If oxygen is abundant and combustion is
unimpeded ash is the end product of fire.
However, incomplete combustion of organic
material leads to carbonization or pyrolysis and
the product is inorganic carbon compound or
charcoal (Clark 1984; Patterson et al. 1987;
Braadbaart and Poole 2008). Charcoal is
resistant to oxidation and microbial activity and
Figure 2.4 Controls on fire and the make-up of fire regime at different space and time scales (from Moritz et al. 2005)

16
thus during and following a fire event, charred particles are deposited and preserved in natural palaeo-
archives (lakes, swamps, peats). Along the stratigrafic of a sediment core, layers with abundant charcoal
particles or charcoal peaks are then used to reconstract fire history around the site of deposition.
Palaeoecologists have used charcoal as a proxy for palaeofire and the applications are many, including:
analysis of climate-fire-vegetation linkages (e.g. Clark and Royall 1995; Gavin et al. 2006), investigation
on the prehistoric use of fire (e.g. Pitkänen and Huttunen 1999; Wick and Möhl 2006) and the analysis
of regional and global biomass burning in connection with carbon cycle and the effects on the global
atmospheric CO2 concentration (e.g. Carcaillet et al. 2002).
Generally, charcoal derived from plant material is black, opaque, brittle and angular, with an elongate-
prismatic appearance possibly displaying some cellular structure (Swain 1973; Clark 1982; Griffin and
Goldberg 1983; Patterson et al. 1987; Enache and Cumming 2006). Despite these generalizations,
charcoal morphology is often surprisingly variable and irregular. This is due to the fact that different
kind of fires (e.g. temperature) and source of combustion can produce fragments with different
structure and size. Morphologically the charcoal remains differ depending on temperature of formation
and the fuel (bark, trunk, branches and leaves). Additionally, the initial morphology is often modified
through taphonomic processes (Enache and Cumming 2006), as charcoal fragments can be transported
for kilometers before to burial (Garstang et al. 1997; Clark et al. 1998; Pisaric 2002). The source of
charcoal in a natural archive can be regional (distant) or local (close or within the deposit area; Whitlock
et al. 2001). Mathematical models and empirical studies following modern fires indicate that charcoal
abundance of particles >100-125 μm in diameter decreases when the distance from the deposition
environment and the fire increases (e.g. Whitlock and Millspaugh 1996; Clark and Patterson 1997;
Gardner and Whitlock 2001). These results confirm that charcoal particles larger than >100-125 μm are
not transported far from the fire margin. Following that, size classes can be defined based on the
distance from fire source and the signal they bare as:
o microscopic (micro) charcoal, <125 μm -> regional or long distance-transported signal of fire
o macroscopic (macro) charcoal >125 μm -> local signal of fire
Micro-charcoals have mostly been examined on the same slides used for pollen analysis. The sample
preparation procedure was therefore standard pollen laboratory preparations (Sadori and Giardini
2007). While it is possible to distinguish and separate larger size of charcoal particles with the pollen-
slide method, the standard chemical procedure results in fragmentation of the particles and loss of the
local fire signal.
A more appropriate method to quantify local signal of fire, is by quantifying macro-charcoal particles
using with the sieving-method. By gently washing and sieving continuously spaced subsamples, only the
larger particles are retained (>125 μm), the fragmentation is greatly reduced and the macro-charcoal
so quantified embodies the local signal of fire. Since 2004, a diagnostic and analytical tool called
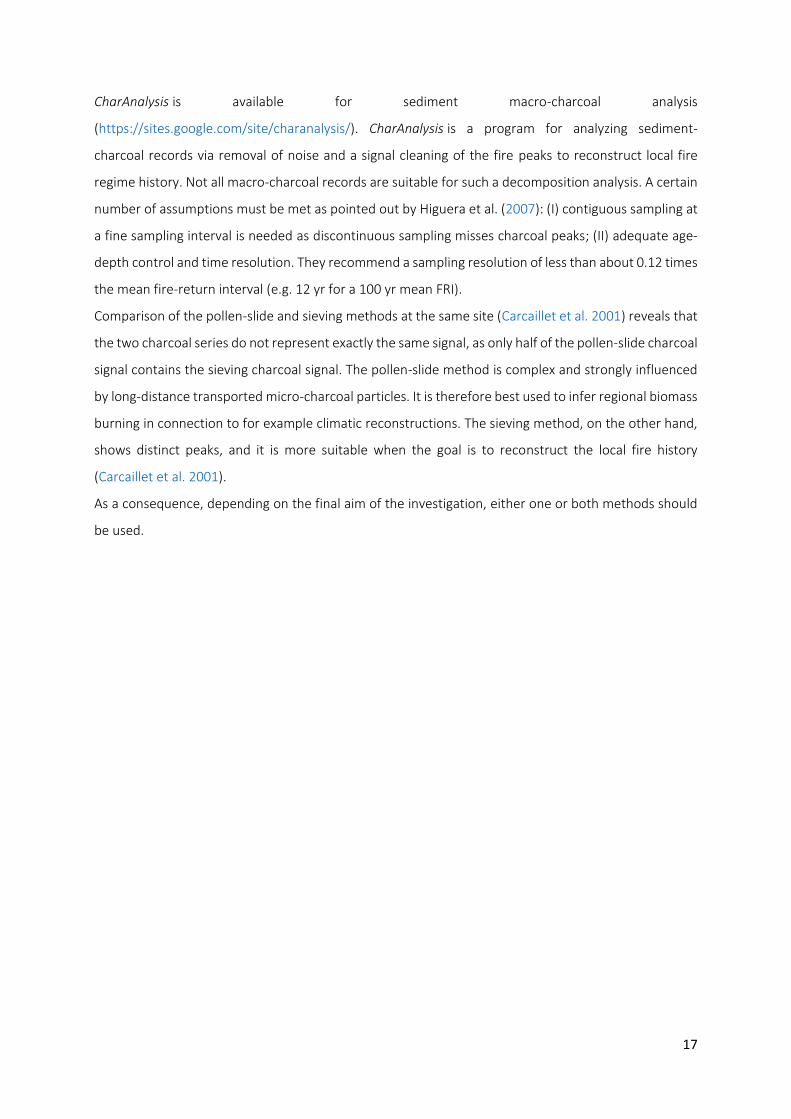
17
CharAnalysis is available for sediment macro-charcoal analysis
(https://sites.google.com/site/charanalysis/). CharAnalysis is a program for analyzing sediment-
charcoal records via removal of noise and a signal cleaning of the fire peaks to reconstruct local fire
regime history. Not all macro-charcoal records are suitable for such a decomposition analysis. A certain
number of assumptions must be met as pointed out by Higuera et al. (2007): (I) contiguous sampling at
a fine sampling interval is needed as discontinuous sampling misses charcoal peaks; (II) adequate age-
depth control and time resolution. They recommend a sampling resolution of less than about 0.12 times
the mean fire-return interval (e.g. 12 yr for a 100 yr mean FRI).
Comparison of the pollen-slide and sieving methods at the same site (Carcaillet et al. 2001) reveals that
the two charcoal series do not represent exactly the same signal, as only half of the pollen-slide charcoal
signal contains the sieving charcoal signal. The pollen-slide method is complex and strongly influenced
by long-distance transported micro-charcoal particles. It is therefore best used to infer regional biomass
burning in connection to for example climatic reconstructions. The sieving method, on the other hand,
shows distinct peaks, and it is more suitable when the goal is to reconstruct the local fire history
(Carcaillet et al. 2001).
As a consequence, depending on the final aim of the investigation, either one or both methods should
be used.

18
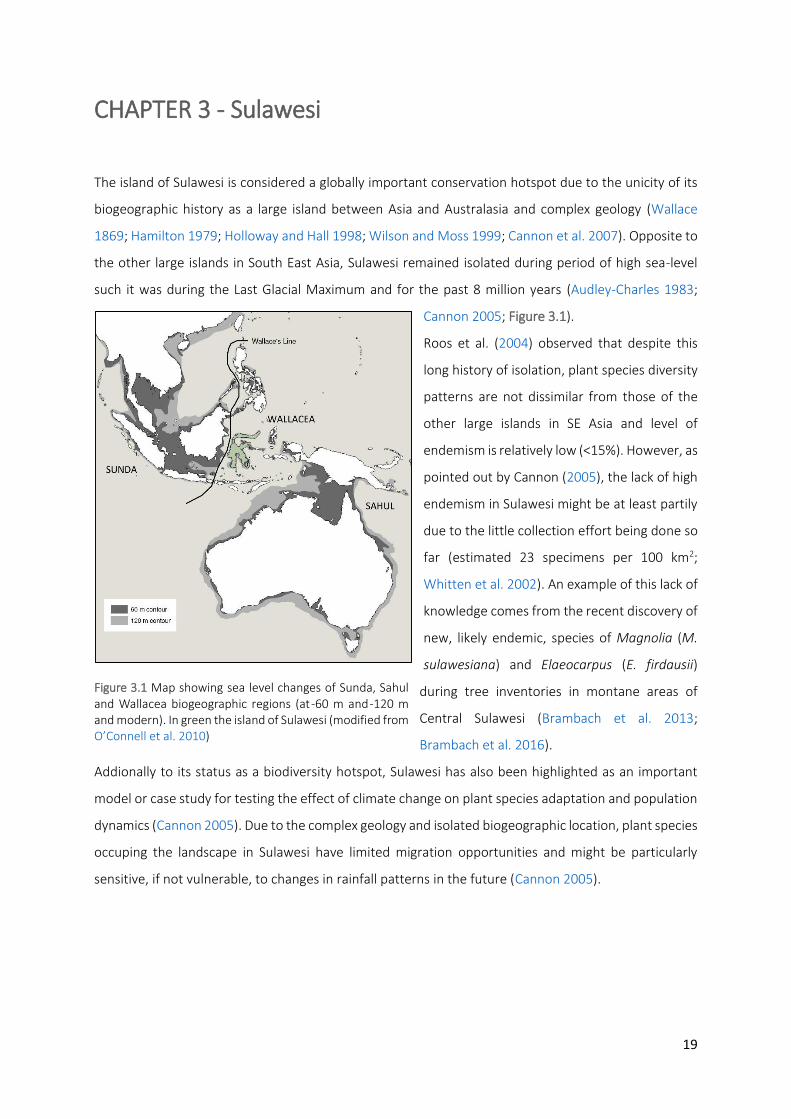
19
CHAPTER 3 - Sulawesi
The island of Sulawesi is considered a globally important conservation hotspot due to the unicity of its
biogeographic history as a large island between Asia and Australasia and complex geology (Wallace
1869; Hamilton 1979; Holloway and Hall 1998; Wilson and Moss 1999; Cannon et al. 2007). Opposite to
the other large islands in South East Asia, Sulawesi remained isolated during period of high sea-level
such it was during the Last Glacial Maximum and for the past 8 million years (Audley-Charles 1983;
Cannon 2005; Figure 3.1).
Roos et al. (2004) observed that despite this
long history of isolation, plant species diversity
patterns are not dissimilar from those of the
other large islands in SE Asia and level of
endemism is relatively low (<15%). However, as
pointed out by Cannon (2005), the lack of high
endemism in Sulawesi might be at least partily
due to the little collection effort being done so
far (estimated 23 specimens per 100 km2;
Whitten et al. 2002). An example of this lack of
knowledge comes from the recent discovery of
new, likely endemic, species of Magnolia (M.
sulawesiana) and Elaeocarpus (E. firdausii)
during tree inventories in montane areas of
Central Sulawesi (Brambach et al. 2013;
Brambach et al. 2016).
Addionally to its status as a biodiversity hotspot, Sulawesi has also been highlighted as an important
model or case study for testing the effect of climate change on plant species adaptation and population
dynamics (Cannon 2005). Due to the complex geology and isolated biogeographic location, plant species
occuping the landscape in Sulawesi have limited migration opportunities and might be particularly
sensitive, if not vulnerable, to changes in rainfall patterns in the future (Cannon 2005).
Figure 3.1 Map showing sea level changes of Sunda, Sahul and Wallacea biogeographic regions (at -60 m and -120 m and modern). In green the island of Sulawesi (modified from O’Connell et al. 2010)

20
The Lore Lindu National Park
With an area of about 2,300 km2, the Lore Lindu National Park (LLNP) is one of the few remaining
contiguous areas of montane rainforest in Sulawesi (Culmsee et al. 2010; Figure 3.2). Most parts of the
protected area are covered by upland and montane
rainforests ranging from 800 m to 2700 m in
elevation, on intermediate soils. The forests are
classified to be in good to old growth conditions
(Cannon et al. 2007). The majority of Sulawesi’s
unique fauna (over 50% of the mammals and 68%
of the birds) are present within the Park making the
LLNP one of the most biologically important areas
in the Indonesia.
The current area covered by the LLNP resulted from
the integration of two natural sanctuaries and a
natural preservation area, which were formerly
separated (Adiwibowo 2005). The two natural
reserves were the Lore Kalamanta Wildlife Reserve
(131000 ha) located in Poso District and the Lore
Lindu Wildlife Reserve (67000 ha) located in the
Donggala and Poso Districts. The nature preserve
areas included The Danau Lindu Tourism/Protected
Forest (31000 ha) located in Donggala District
(Helmi 2001; The Nature Conservancy 2001). In
1977, UNESCO declared Lore Kalamanta and Danau
Lindu forests as Biosphere Reserved areas and in the following 20 years the area was slowly converted
into the LLNP. During the Third World National Park Congress held in Bali on 1982, the Minister of
Agriculture declared the establishment of the LLNP, including 231,000 ha of conservation area (Decree
of the Minister of Agriculture No. 736/Menteri/X/1982). Eleven years later in 1993, eventually the
government altered the function of the Danau Lindu Tourism/Protected Forest (31,000 ha), the Lore
Kalamanta Wildlife Reserve (131,000 ha), and the Lore Lindu Wildlife Reserve (67,000 ha) to that of a
national park (Decree of the Minister of Forestry No. 593/Kpts-II/1993). However, the decree stated
that the boundary was temporary. The permanent boundary (229,000 ha) was determined after surveys
in 1999 (Minister of Forestry and Estate Crops Decree No. 464/Kpts-II/1999). The Lindu and Besoa
valleys were moved outside the National Park and the park had 11,000 ha less than previously stated
(Adiwibowo 2005).
Figure 3.2 Map of Sulawesi showing Central Sulawesi (grey), the boundaries of the Lore Lindu National Park (LLNP, red) and primary rainforests (green, data source: Land Cover 2011, the Ministry of Forestry, the Republic of Indonesia)

21
Geology of the Central Sulawesi
Sulawesi is geologically very complex, being located at the crossroad of three different plates, the Asian,
the Australian and the Pacific plates (Figure 3.3). The main orogenic belt of the island formed during the
Oligo-Miocene. The central part of Sulawesi contains two metamorphic units. The western unit belongs
to the substratum of the western arm and the eastern unit to an Oligo-Miocene suture (Villeneuve et
al. 2002). The mountains of the LLNP are part of the western unit at the boarder to the eastern suture
unit. They mostly consist of intrusive rocks such as crystalline and metamorphic granites, granodiorites,
schists, and phyllitic rocks.
Figure 3.3 Simplified geological map of Sulawesi with approximated location of the LLNP in the red square (modified from Villeneuve et al. 2002)
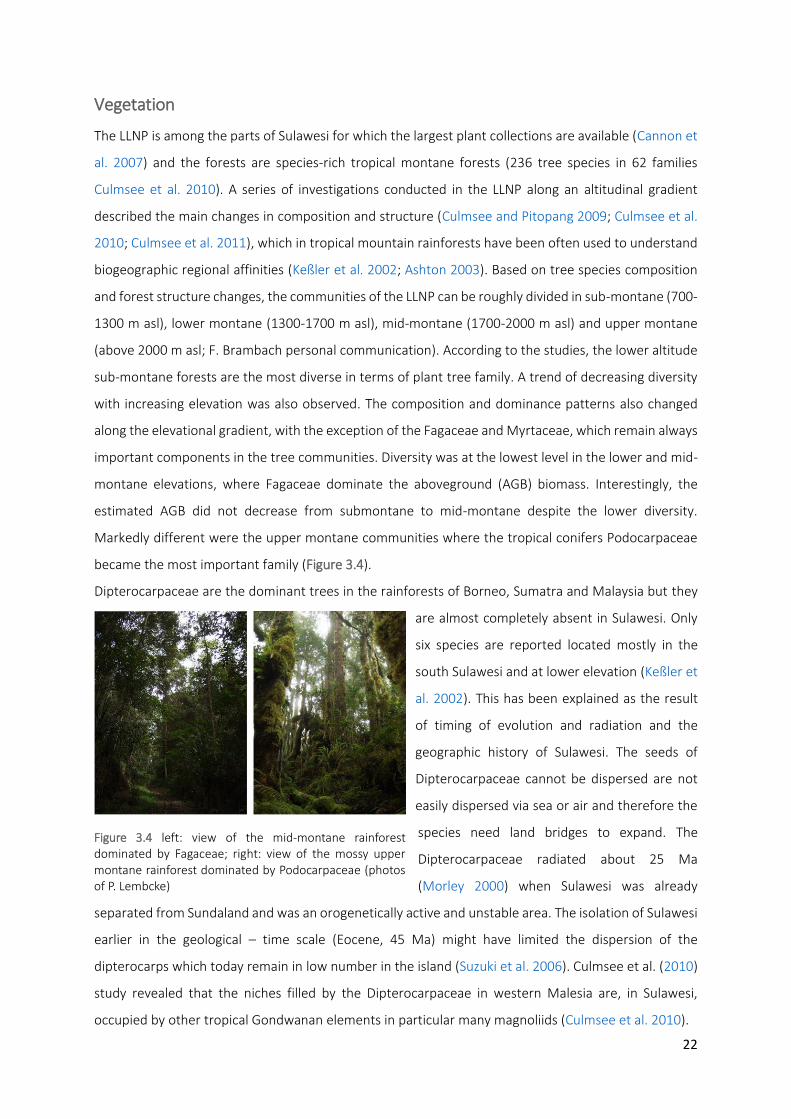
22
Vegetation
The LLNP is among the parts of Sulawesi for which the largest plant collections are available (Cannon et
al. 2007) and the forests are species-rich tropical montane forests (236 tree species in 62 families
Culmsee et al. 2010). A series of investigations conducted in the LLNP along an altitudinal gradient
described the main changes in composition and structure (Culmsee and Pitopang 2009; Culmsee et al.
2010; Culmsee et al. 2011), which in tropical mountain rainforests have been often used to understand
biogeographic regional affinities (Keßler et al. 2002; Ashton 2003). Based on tree species composition
and forest structure changes, the communities of the LLNP can be roughly divided in sub-montane (700-
1300 m asl), lower montane (1300-1700 m asl), mid-montane (1700-2000 m asl) and upper montane
(above 2000 m asl; F. Brambach personal communication). According to the studies, the lower altitude
sub-montane forests are the most diverse in terms of plant tree family. A trend of decreasing diversity
with increasing elevation was also observed. The composition and dominance patterns also changed
along the elevational gradient, with the exception of the Fagaceae and Myrtaceae, which remain always
important components in the tree communities. Diversity was at the lowest level in the lower and mid-
montane elevations, where Fagaceae dominate the aboveground (AGB) biomass. Interestingly, the
estimated AGB did not decrease from submontane to mid-montane despite the lower diversity.
Markedly different were the upper montane communities where the tropical conifers Podocarpaceae
became the most important family (Figure 3.4).
Dipterocarpaceae are the dominant trees in the rainforests of Borneo, Sumatra and Malaysia but they
are almost completely absent in Sulawesi. Only
six species are reported located mostly in the
south Sulawesi and at lower elevation (Keßler et
al. 2002). This has been explained as the result
of timing of evolution and radiation and the
geographic history of Sulawesi. The seeds of
Dipterocarpaceae cannot be dispersed are not
easily dispersed via sea or air and therefore the
species need land bridges to expand. The
Dipterocarpaceae radiated about 25 Ma
(Morley 2000) when Sulawesi was already
separated from Sundaland and was an orogenetically active and unstable area. The isolation of Sulawesi
earlier in the geological – time scale (Eocene, 45 Ma) might have limited the dispersion of the
dipterocarps which today remain in low number in the island (Suzuki et al. 2006). Culmsee et al. (2010)
study revealed that the niches filled by the Dipterocarpaceae in western Malesia are, in Sulawesi,
occupied by other tropical Gondwanan elements in particular many magnoliids (Culmsee et al. 2010).
Figure 3.4 left: view of the mid-montane rainforest dominated by Fagaceae; right: view of the mossy upper montane rainforest dominated by Podocarpaceae (photos of P. Lembcke)

23
Biogeographical patterns are significantly different with elevation (Culmsee and Leuschner 2013). Based
on the tree species and family compositions, the lower and mid-montane forests seem comparable to
the Bornean forest at 1700 m altitude (Western Wallacean distribution) in having their two most
important families in common, the Fagaceae and Myrtaceae. In contrast to that, the geographical
isolated mountaintops have a more distinct assemblage with unique phylogenetic diversity despite the
low diversity in terms of species number. Western Malesian taxa are found in these communities as
well. However, in addiction to that, also elements from Papuasian/eastern Malesian subregions and the
Philippines such as Trimeniaceae and Paracryphiaceae are found (Culmsee et al. 2011).
The importance of Fagaceae
Studies of tree families along altitudinal transects have highlighted the importance of Fagaceae mainly
with the genera Lithocarpus and Castanopsis (Culmsee et al. 2010; Culmsee and Leuschner 2013). They
were abundant at all elevations, particularly in the lower and mid-montane forests where they
contribute for the most part to the AGB.
The genera Castanopsis and Lithocarpus
evolved at least 40 Ma and they are
today found everywhere in Malesia
(Soepadmo 1971; Manos and Stanford
2001; Cannon and Manos 2003; Culmsee
and Leuschner 2013). While in western
Malesia, the Dipterocarpaceae became
dominant in everwet forests about 25
Ma, the Fagaceae became important in
the uplands of Malesia (Morley 2000;
Dam et al. 2001).
Culmsee et al. (2010) in their assessment
of aboveground biomass (AGB)
differences between different montane
communities, found that, opposite to
what was experienced in other tropical
montane rainforests, in Sulawesi, AGB
does not decrease steadily with elevation (Figure 3.5). Further, they observed that almost all the
montane forests where no elevation AGB decrease was shown were dominated by Fagaceae at mid-
altitudinal levels. They conclude that the Fagaceae play an important role as carbon stores in the
Figure 3.5 Comparison of estimated aboveground tree biomass
(Mg ha-1) in relation to elevation (m asl.) in Southeast Asian and
Neotropical forests (from Culmsee et al. 2010)
24
montane forests of Sulawesi and conservation efforts aiming at preserving ecosystem functions should
focus on this family.
Ecologically, the relatively lower temperatures found in the uplands, do not seem to be disadvantageous
for tropical Fagaceae, which are today most diverse in the montane forests of SE Asia (Manos and
Stanford 2001; Manos et al. 2008). A more important limiting role might be played by rainfall, as the
current geographical distribution of Lithocarpus and Castanopsis suggests an intolerance to seasonal
climates (Soepadmo 1971; Cannon and Manos 2003).
Climate
In the LLNP, mean annual temperature decreases with elevation from 21˚C at 1000 m to 14˚C at 2400
m (Culmsee et al. 2010). Precipitation patterns are not easily described as they change markedly due to
the complex topography. However, mean annual precipitation is estimated to be between 1900 and
2100 mm (Hijmans et al. 2005; WorldClim 2006). Precipitation patterns in the mountainous regions of
the LLNP are controlled by the seasonal migration of the ITCZ across the equator and inter-annual
changes in ENSO. As the ITCZ migrates southward during the austral summer, the northwest monsoon
delivers humid air and heavy rainfall, whereas during austral winter the southeast monsoon brings
relatively cool, dry conditions while the ITCZ is positioned over mainland Asia (Gunawan 2006). In the
montane areas of Central Sulawesi the rainfall is strongly determined by the local topography. The air
masses reaching the area from the northwest and southeast are lifted orographically, leading to a
formation of clouds and rainfall throughout the year. However, the monthly amount of rainfall formed
during the southeast monsoon is slightly less than that of the northwest monsoon, as the former brings
humid air masses, while the latter brings dry air from the Australian continent and the rainfall is
therefore purely orographic. The modern intra-annual climate of the montane areas of the LLNP can be
described as perhumid with at most two months of slightly lower precipitation, corresponding to the
southeast monsoon peak in August (Gunawan 2006).
The inter-annual variability of rainfall is influenced by the coupled ocean-atmosphere phenomenon El
Niño-Southern Oscillation (ENSO). In particular, during El Niño warm phases, Central Sulawesi
experiences lower rainfall than in other years.
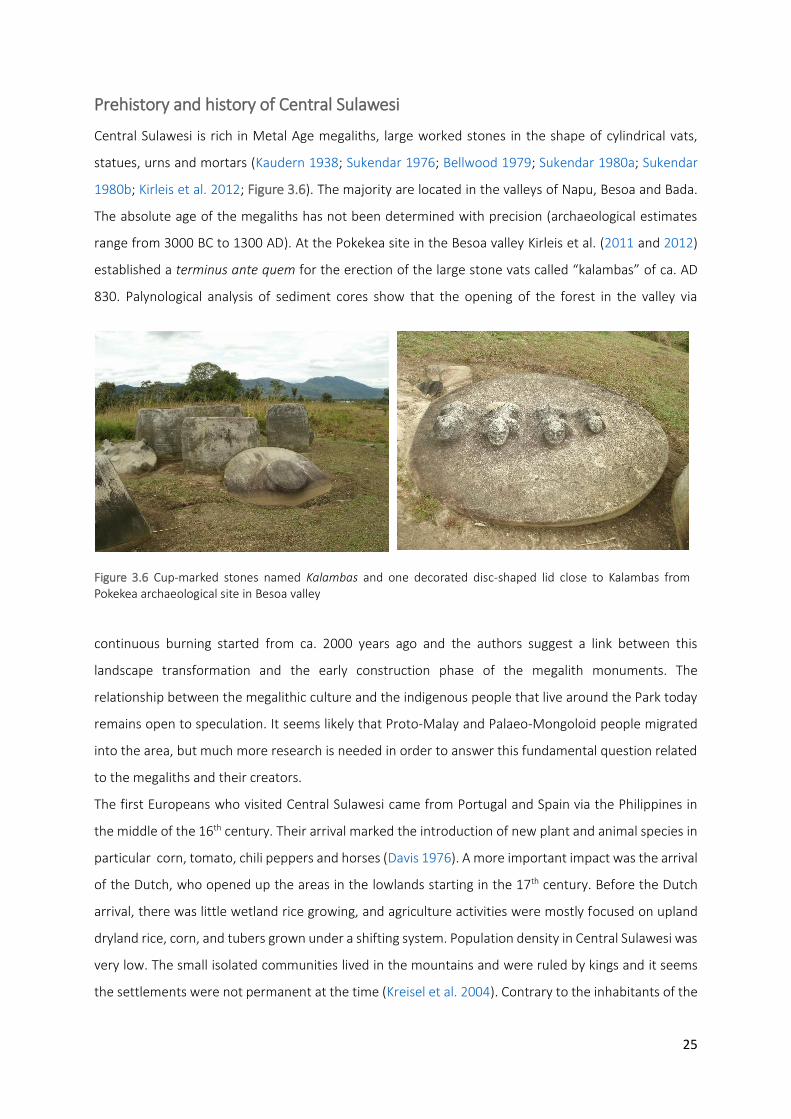
25
Prehistory and history of Central Sulawesi
Central Sulawesi is rich in Metal Age megaliths, large worked stones in the shape of cylindrical vats,
statues, urns and mortars (Kaudern 1938; Sukendar 1976; Bellwood 1979; Sukendar 1980a; Sukendar
1980b; Kirleis et al. 2012; Figure 3.6). The majority are located in the valleys of Napu, Besoa and Bada.
The absolute age of the megaliths has not been determined with precision (archaeological estimates
range from 3000 BC to 1300 AD). At the Pokekea site in the Besoa valley Kirleis et al. (2011 and 2012)
established a terminus ante quem for the erection of the large stone vats called “kalambas” of ca. AD
830. Palynological analysis of sediment cores show that the opening of the forest in the valley via
continuous burning started from ca. 2000 years ago and the authors suggest a link between this
landscape transformation and the early construction phase of the megalith monuments. The
relationship between the megalithic culture and the indigenous people that live around the Park today
remains open to speculation. It seems likely that Proto-Malay and Palaeo-Mongoloid people migrated
into the area, but much more research is needed in order to answer this fundamental question related
to the megaliths and their creators.
The first Europeans who visited Central Sulawesi came from Portugal and Spain via the Philippines in
the middle of the 16th century. Their arrival marked the introduction of new plant and animal species in
particular corn, tomato, chili peppers and horses (Davis 1976). A more important impact was the arrival
of the Dutch, who opened up the areas in the lowlands starting in the 17th century. Before the Dutch
arrival, there was little wetland rice growing, and agriculture activities were mostly focused on upland
dryland rice, corn, and tubers grown under a shifting system. Population density in Central Sulawesi was
very low. The small isolated communities lived in the mountains and were ruled by kings and it seems
the settlements were not permanent at the time (Kreisel et al. 2004). Contrary to the inhabitants of the
Figure 3.6 Cup-marked stones named Kalambas and one decorated disc-shaped lid close to Kalambas from Pokekea archaeological site in Besoa valley

26
Poso region, methods of wet-rice cultivation were already well known to inhabitants in western Central
Sulawesi before the arrival of the Dutch, as reported by Valentyn (1724).
Today, the Central Sulawesi region is ethnically and culturally heterogeneous and comprises 15
indigenous groups, speaking 24 distinct languages. However, most of the people living around the
National Park today are of recent arrivals, or descendants of recent arrivals. The majority moved into
the area as participants in the government’s transmigration programs (at a peak in the 1970-80s) and
as a result of conflicts elsewhere (Kreisel et al. 2004).

27
CHAPTER 4 - Sumatra
Peatlands of Southeast Asia: an overview
The peatlands of SE Asia are the largest peatland areas in the tropics (Dommain et al. 2011). Estimates
indicate they cover an area of about 236,000 km2, which corresponds to about 60% of tropical peat
area. The formation of such an extended area of peatland in SE Asia was favoured by a series of factors
including low topography, high rainfall throught the year and substrated which impeded water
permeation (Page et al. 2009). These conditions are found mostly in delta costastal areas and along
riparian depressions (Page et al. 2011; Figure 4.1). The vast majority of peatlands in SE Asia are found in
Indonesia (about 210,000 km2) and Malaysia (23,000 km2). These peatlands are major terrestrial carbon
reservoirs. Current estimates indicate they store about 65 Gt of carbon, corresponding to 9% of the
global peatland area and 11-14% of the global peat carbon stocks (Joosten 2009; Page et al. 2011).
Besides their function as carbon sinks, tropical peatlands are covered by forested ecosystems (peat
swamp rainforests) that are unique (Schrier-Uijl et al. 2013) and provide a large number of ecosystem
services. These ecosystems function as important climatic mitigating areas, they supply water and
prevent erosion (Yule 2010) during extreme climatic events such as the occurrence of El Niño and La
Niña episodes. Additionally, they are valuable as a form of biological heritage and genetic resources.
Furthermore, as shown by Kuniyasu (2002) in the lowland plain of the Kampar River in Sumatra, local
villages and the majority of capital-less people, greatly benefit from the collection of forest products
and fishing in peat-swamp areas.
Figure 4.1 Distribution of peatlands in SE Asia (modified from Wüst et al. 2007)
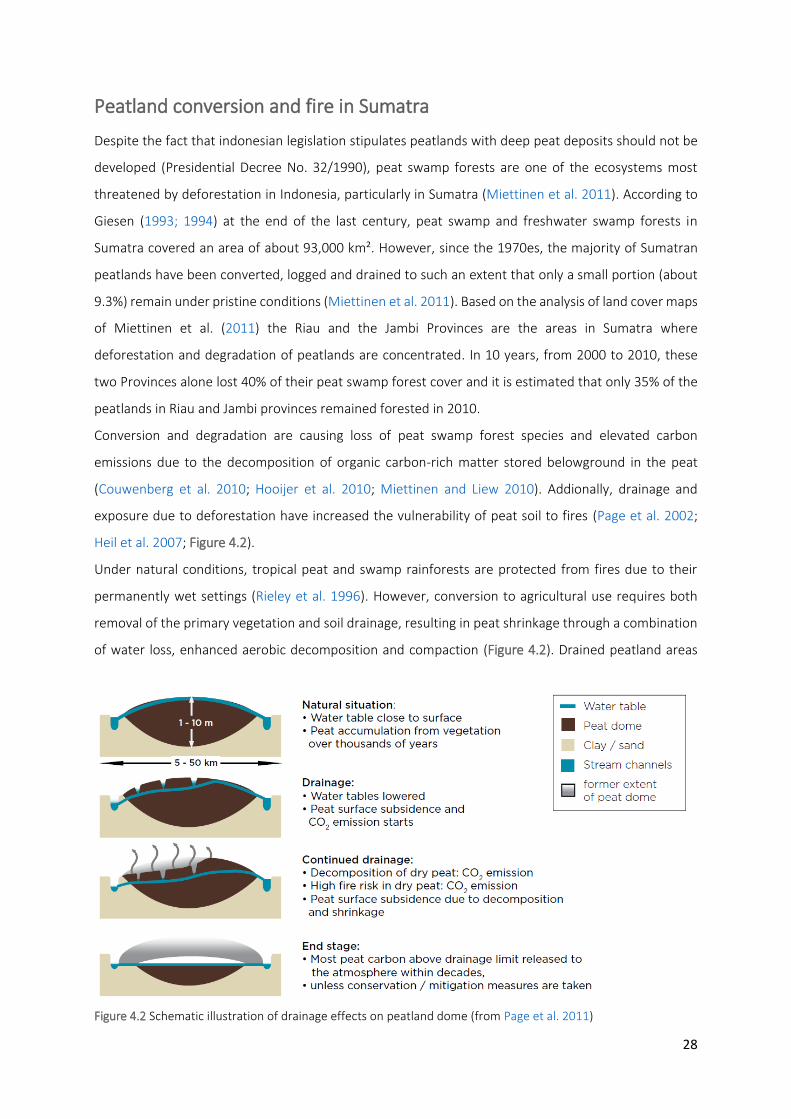
28
Peatland conversion and fire in Sumatra
Despite the fact that indonesian legislation stipulates peatlands with deep peat deposits should not be
developed (Presidential Decree No. 32/1990), peat swamp forests are one of the ecosystems most
threatened by deforestation in Indonesia, particularly in Sumatra (Miettinen et al. 2011). According to
Giesen (1993; 1994) at the end of the last century, peat swamp and freshwater swamp forests in
Sumatra covered an area of about 93,000 km². However, since the 1970es, the majority of Sumatran
peatlands have been converted, logged and drained to such an extent that only a small portion (about
9.3%) remain under pristine conditions (Miettinen et al. 2011). Based on the analysis of land cover maps
of Miettinen et al. (2011) the Riau and the Jambi Provinces are the areas in Sumatra where
deforestation and degradation of peatlands are concentrated. In 10 years, from 2000 to 2010, these
two Provinces alone lost 40% of their peat swamp forest cover and it is estimated that only 35% of the
peatlands in Riau and Jambi provinces remained forested in 2010.
Conversion and degradation are causing loss of peat swamp forest species and elevated carbon
emissions due to the decomposition of organic carbon-rich matter stored belowground in the peat
(Couwenberg et al. 2010; Hooijer et al. 2010; Miettinen and Liew 2010). Addionally, drainage and
exposure due to deforestation have increased the vulnerability of peat soil to fires (Page et al. 2002;
Heil et al. 2007; Figure 4.2).
Under natural conditions, tropical peat and swamp rainforests are protected from fires due to their
permanently wet settings (Rieley et al. 1996). However, conversion to agricultural use requires both
removal of the primary vegetation and soil drainage, resulting in peat shrinkage through a combination
of water loss, enhanced aerobic decomposition and compaction (Figure 4.2). Drained peatland areas
Figure 4.2 Schematic illustration of drainage effects on peatland dome (from Page et al. 2011)
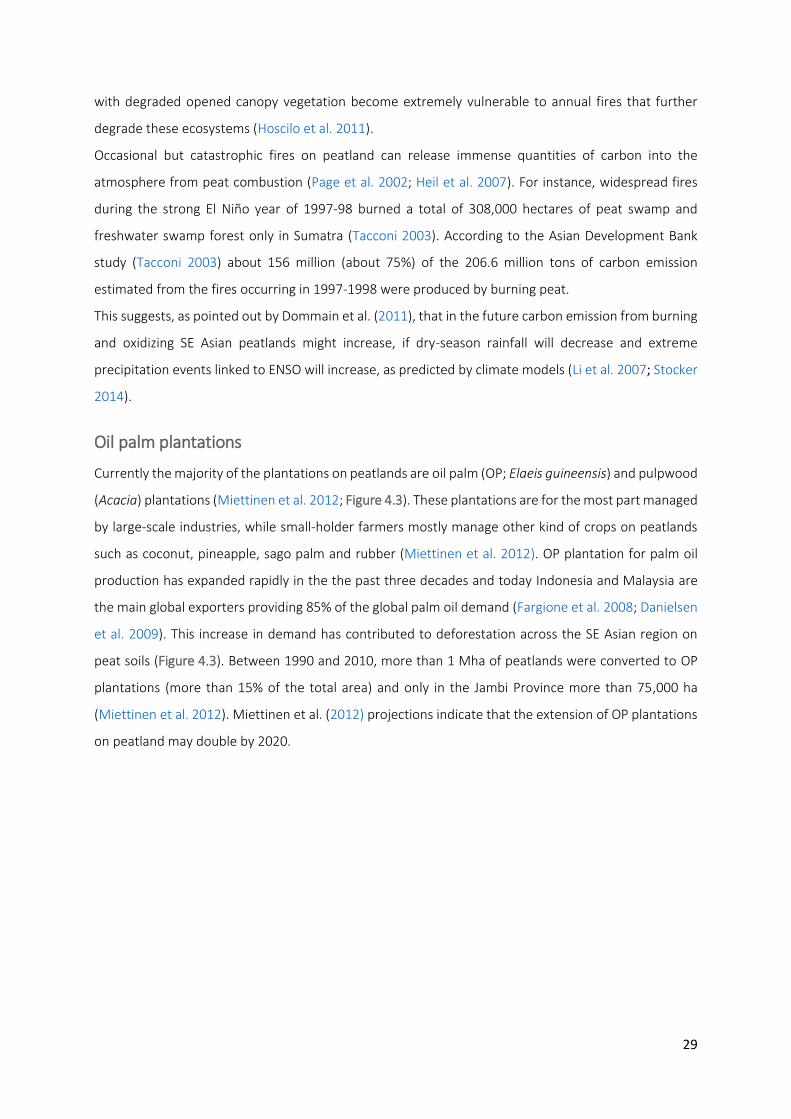
29
with degraded opened canopy vegetation become extremely vulnerable to annual fires that further
degrade these ecosystems (Hoscilo et al. 2011).
Occasional but catastrophic fires on peatland can release immense quantities of carbon into the
atmosphere from peat combustion (Page et al. 2002; Heil et al. 2007). For instance, widespread fires
during the strong El Niño year of 1997-98 burned a total of 308,000 hectares of peat swamp and
freshwater swamp forest only in Sumatra (Tacconi 2003). According to the Asian Development Bank
study (Tacconi 2003) about 156 million (about 75%) of the 206.6 million tons of carbon emission
estimated from the fires occurring in 1997-1998 were produced by burning peat.
This suggests, as pointed out by Dommain et al. (2011), that in the future carbon emission from burning
and oxidizing SE Asian peatlands might increase, if dry-season rainfall will decrease and extreme
precipitation events linked to ENSO will increase, as predicted by climate models (Li et al. 2007; Stocker
2014).
Oil palm plantations
Currently the majority of the plantations on peatlands are oil palm (OP; Elaeis guineensis) and pulpwood
(Acacia) plantations (Miettinen et al. 2012; Figure 4.3). These plantations are for the most part managed
by large-scale industries, while small-holder farmers mostly manage other kind of crops on peatlands
such as coconut, pineapple, sago palm and rubber (Miettinen et al. 2012). OP plantation for palm oil
production has expanded rapidly in the the past three decades and today Indonesia and Malaysia are
the main global exporters providing 85% of the global palm oil demand (Fargione et al. 2008; Danielsen
et al. 2009). This increase in demand has contributed to deforestation across the SE Asian region on
peat soils (Figure 4.3). Between 1990 and 2010, more than 1 Mha of peatlands were converted to OP
plantations (more than 15% of the total area) and only in the Jambi Province more than 75,000 ha
(Miettinen et al. 2012). Miettinen et al. (2012) projections indicate that the extension of OP plantations
on peatland may double by 2020.
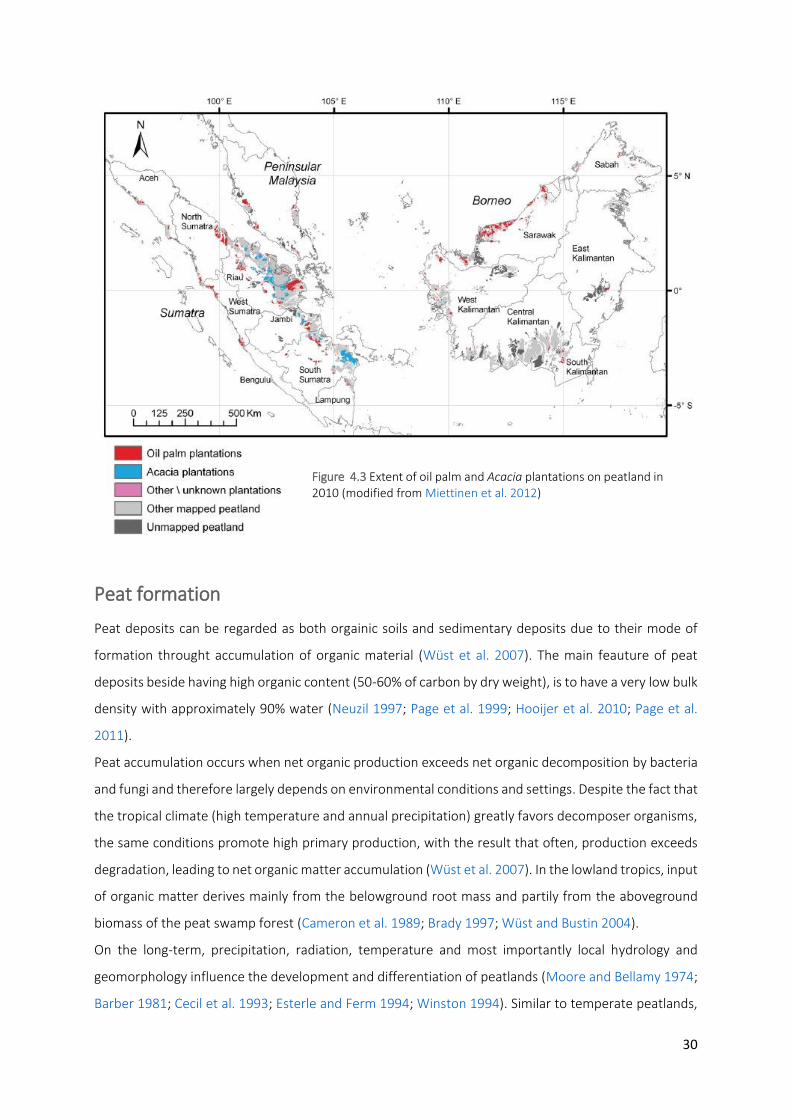
30
Peat formation
Peat deposits can be regarded as both orgainic soils and sedimentary deposits due to their mode of
formation throught accumulation of organic material (Wüst et al. 2007). The main feauture of peat
deposits beside having high organic content (50-60% of carbon by dry weight), is to have a very low bulk
density with approximately 90% water (Neuzil 1997; Page et al. 1999; Hooijer et al. 2010; Page et al.
2011).
Peat accumulation occurs when net organic production exceeds net organic decomposition by bacteria
and fungi and therefore largely depends on environmental conditions and settings. Despite the fact that
the tropical climate (high temperature and annual precipitation) greatly favors decomposer organisms,
the same conditions promote high primary production, with the result that often, production exceeds
degradation, leading to net organic matter accumulation (Wüst et al. 2007). In the lowland tropics, input
of organic matter derives mainly from the belowground root mass and partily from the aboveground
biomass of the peat swamp forest (Cameron et al. 1989; Brady 1997; Wüst and Bustin 2004).
On the long-term, precipitation, radiation, temperature and most importantly local hydrology and
geomorphology influence the development and differentiation of peatlands (Moore and Bellamy 1974;
Barber 1981; Cecil et al. 1993; Esterle and Ferm 1994; Winston 1994). Similar to temperate peatlands,
Figure 4.3 Extent of oil palm and Acacia plantations on peatland in 2010 (modified from Miettinen et al. 2012)
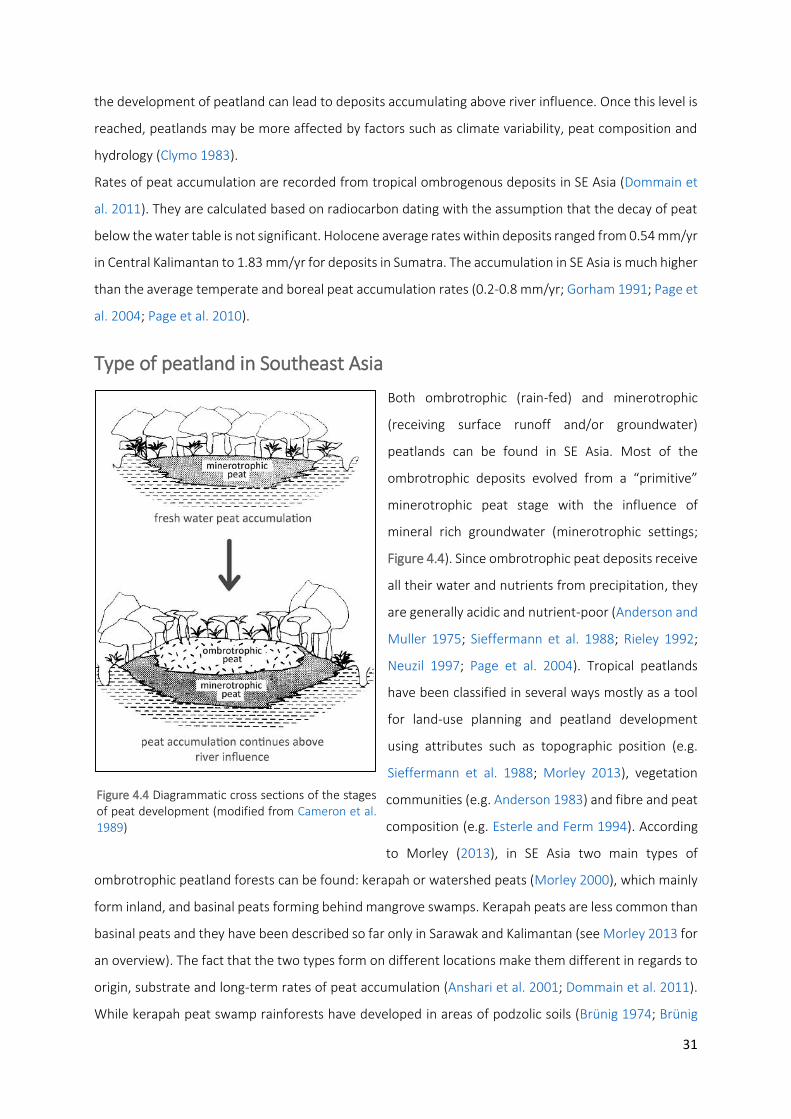
31
the development of peatland can lead to deposits accumulating above river influence. Once this level is
reached, peatlands may be more affected by factors such as climate variability, peat composition and
hydrology (Clymo 1983).
Rates of peat accumulation are recorded from tropical ombrogenous deposits in SE Asia (Dommain et
al. 2011). They are calculated based on radiocarbon dating with the assumption that the decay of peat
below the water table is not significant. Holocene average rates within deposits ranged from 0.54 mm/yr
in Central Kalimantan to 1.83 mm/yr for deposits in Sumatra. The accumulation in SE Asia is much higher
than the average temperate and boreal peat accumulation rates (0.2-0.8 mm/yr; Gorham 1991; Page et
al. 2004; Page et al. 2010).
Type of peatland in Southeast Asia
Both ombrotrophic (rain-fed) and minerotrophic
(receiving surface runoff and/or groundwater)
peatlands can be found in SE Asia. Most of the
ombrotrophic deposits evolved from a “primitive”
minerotrophic peat stage with the influence of
mineral rich groundwater (minerotrophic settings;
Figure 4.4). Since ombrotrophic peat deposits receive
all their water and nutrients from precipitation, they
are generally acidic and nutrient-poor (Anderson and
Muller 1975; Sieffermann et al. 1988; Rieley 1992;
Neuzil 1997; Page et al. 2004). Tropical peatlands
have been classified in several ways mostly as a tool
for land-use planning and peatland development
using attributes such as topographic position (e.g.
Sieffermann et al. 1988; Morley 2013), vegetation
communities (e.g. Anderson 1983) and fibre and peat
composition (e.g. Esterle and Ferm 1994). According
to Morley (2013), in SE Asia two main types of
ombrotrophic peatland forests can be found: kerapah or watershed peats (Morley 2000), which mainly
form inland, and basinal peats forming behind mangrove swamps. Kerapah peats are less common than
basinal peats and they have been described so far only in Sarawak and Kalimantan (see Morley 2013 for
an overview). The fact that the two types form on different locations make them different in regards to
origin, substrate and long-term rates of peat accumulation (Anshari et al. 2001; Dommain et al. 2011).
While kerapah peat swamp rainforests have developed in areas of podzolic soils (Brünig 1974; Brünig
Figure 4.4 Diagrammatic cross sections of the stages of peat development (modified from Cameron et al. 1989)

32
1990; Morley 2013; Figure 4.5), basinal peats are found in Sarawak, Sumatra and Kalimantan both in
inland and coastal locations. Close to the coastline, basinal peat swamp forests developed on
prograding deltas behind mangrove swamps (e.g. Caline and Huang 1992). More in the inland, they can
form along lowland river depressions in areas such as South Kalimantan (Sieffermann et al. 1992) and
Central and South Sumatra (Sabiham 1990). Coastal peatlands developed more recently compared to
the kerapah peatlands, usually following the stabilization of sea levels in the mid-Holocene and the
uncovering of coastal areas following the lowering level of the sea after 5000 years ago (Dommain et al.
2011).
Figure 4.5 Kerapah (A) and basinal (B) peat catena compared. Ph.c. stands for Phasic communities (modified from Morley 2013)

33
The importance of vegetation communities
Although in general the water table closely follows the peat doomed surface, when Brady (1997)
monitored the water table levels on peat with different thicknesses in Sumatra, he observed declining
water table levels with increasing peat depths. The smallest amplitude of water level movement also
occurred in thicker deposits. It follows that surface flooding seems to be less common in deeper peat
compared to shallow peat. Brady (1997) additionally noted that surface flooding was found to be
uncommon in the pole forests over deep peat in Kalimantan (Kostermans 1958) and Sarawak (Anderson
1961). Based on his results in Sumatra, Brady (1997) suggested that on thick peat deposits, peat
accumulates more because of the accumulation of root biomass and declining decomposition, rather
than from stagnant water logged conditions. The study of Grady et al. (1993) confirmed his hypothesis.
While analyzing the fungal degradation of the maceral content of peat from Siaksriindrapura, Riau, they
found that the root-dominated fibric peat found in deep deposits was more aerobic than that of the
wood-dominated sapric peat found in thinner deposits. They suggested that peat in thicker deposits
may be associated more with drier surface conditions compare to shallower deposits, where the
influence of river flooding plays an important role. Similar results were found in Sumatra (Esterle and
Ferm 1994) and Kalimantan (Moore and Hilbert 1992; Dehmer 1993). The accumulation of peat under
these conditions, is therefore more strongly associated with the material deposited and therefore, plant
species composition.
These studies highlight how crucially important the vegetation cover is for the internal development
and peat accumulation in space and time. The lowland peatlands of SE Asia are covered with peat
swamp forest that is arranged into concentric forest communities associated generally with increasing
peat depth on ombrotrophic peat domes (Anderson 1983; Brünig 1990). Anderson (1961) used the term
"catenary stages" or “catena” to refer to this sequential pattern of forest types in Sarawak. Botanically,
tropical peatlands are more diverse than temperate peatlands. Different tropical domed peat swamp
rainforests are similar in respect to the vegetation structure but they often markedly differ in their forest
species compositions. So far, one of the best classifications of peat forests composition and structure
is the one of Anderson (1961) based on peat swamp forests of Sarawak and Brunei. He distinguished six
forest types or phasic communities along a gradient of peat depth. Forests of thin layers of peat at the
edges of peat deposits showed high species richness and biomass. With increasing peat depth, tree
heights, diameters, and species numbers declined. In the deepest peat in the central peat deposits, the
forest types were characterized by a low canopy of pole-sized trees. These forest types have been
referred to as "Padang or pole forest" (Figure 4.5).
Similarly to what was found by Anderson in Sarawak and Brunei, an investigation of the peat swamp
forests in Sumatra revealed that vegetation communities on shallow and deep peat are markedly
different in their composition and structure (Brady 1997; Rieley and Ahmad-Shah 1996). The vegetation
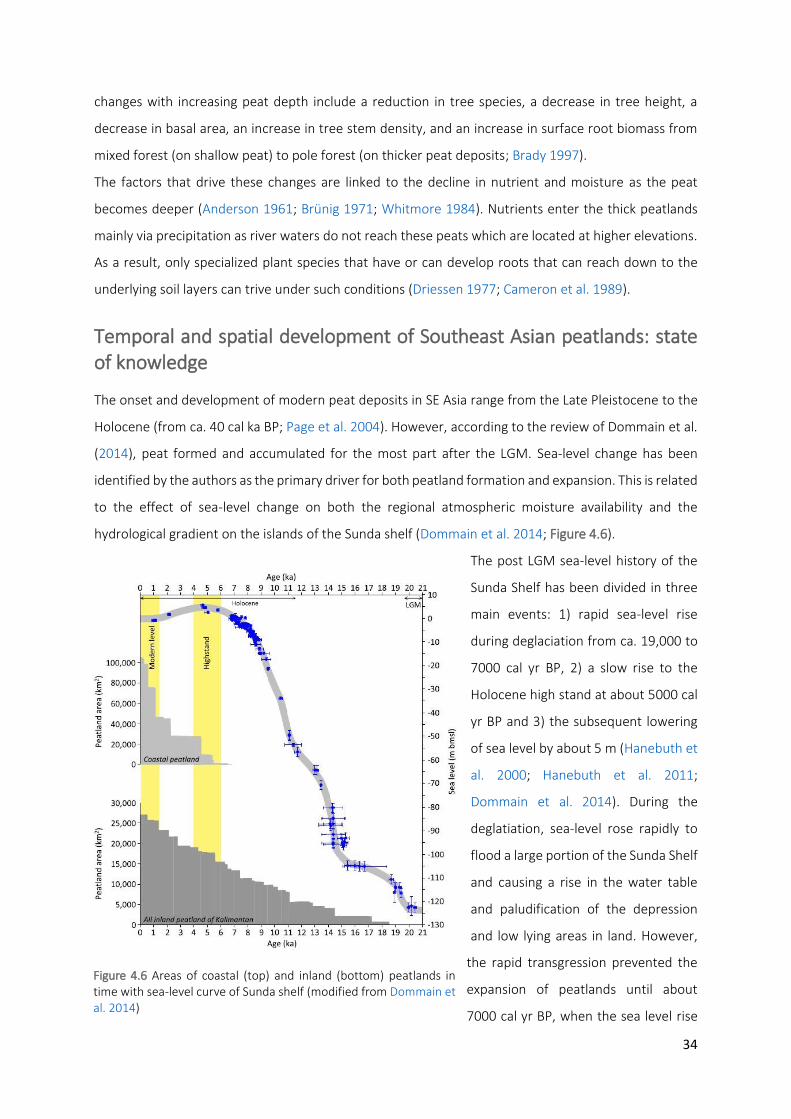
34
changes with increasing peat depth include a reduction in tree species, a decrease in tree height, a
decrease in basal area, an increase in tree stem density, and an increase in surface root biomass from
mixed forest (on shallow peat) to pole forest (on thicker peat deposits; Brady 1997).
The factors that drive these changes are linked to the decline in nutrient and moisture as the peat
becomes deeper (Anderson 1961; Brünig 1971; Whitmore 1984). Nutrients enter the thick peatlands
mainly via precipitation as river waters do not reach these peats which are located at higher elevations.
As a result, only specialized plant species that have or can develop roots that can reach down to the
underlying soil layers can trive under such conditions (Driessen 1977; Cameron et al. 1989).
Temporal and spatial development of Southeast Asian peatlands: state of knowledge
The onset and development of modern peat deposits in SE Asia range from the Late Pleistocene to the
Holocene (from ca. 40 cal ka BP; Page et al. 2004). However, according to the review of Dommain et al.
(2014), peat formed and accumulated for the most part after the LGM. Sea-level change has been
identified by the authors as the primary driver for both peatland formation and expansion. This is related
to the effect of sea-level change on both the regional atmospheric moisture availability and the
hydrological gradient on the islands of the Sunda shelf (Dommain et al. 2014; Figure 4.6).
The post LGM sea-level history of the
Sunda Shelf has been divided in three
main events: 1) rapid sea-level rise
during deglaciation from ca. 19,000 to
7000 cal yr BP, 2) a slow rise to the
Holocene high stand at about 5000 cal
yr BP and 3) the subsequent lowering
of sea level by about 5 m (Hanebuth et
al. 2000; Hanebuth et al. 2011;
Dommain et al. 2014). During the
deglatiation, sea-level rose rapidly to
flood a large portion of the Sunda Shelf
and causing a rise in the water table
and paludification of the depression
and low lying areas in land. However,
the rapid transgression prevented the
expansion of peatlands until about
7000 cal yr BP, when the sea level rise
Figure 4.6 Areas of coastal (top) and inland (bottom) peatlands in time with sea-level curve of Sunda shelf (modified from Dommain et al. 2014)
35
stabilization allowed for the first coastal peatlands in Sumatra to form (Sabiham 1988; Dommain et al.
2011). Dommain et al. (2011) noted a connection between higher seasonality and El Niño droughts
during the late Holocene and reduced accumulation and peat truncation in Borneo. However, in
Sumatra carbon accumulation was uninterrupted, possibly as a result of the large increase in land
availability in the coastland regions due to sea-level regression (Dommain et al. 2011). In contrast to
northern temperate peatlands, limited carbon-related field research has been conducted in tropical
peat-swamp rainforests, thus the influence of climate and land-use on the ecosystems and on the
carbon storage are not well understood (Farmer et al. 2011).
Palaeoecological studies represent a powerful tool, as they can be used to assess the impact of climate
and environmental variability in the past as comparison to modern transformation led by human
activities. However, little has been done in this direction so far in the peatlands of SE Asia, as only few
studies have included palaeoenvironmental investigations (see Chapter 8 for details).

36
37
CHAPTER 5 - paper 1
ENSO and monsoon variability during the past 1500 years as reflected in sediments from Lake Kalimpaa, Central Sulawesi (Indonesia)
Michael Wündscha, Siria Biagionib, Hermann Behlingb, Bastian Reinwartha, Sarah Franza, Peggy Bierbaßc,
Gerhard Dauta, Roland Mäusbachera and Torsten Haberzettla
a Department of Physical Geography, Institute of Geography, Friedrich-Schiller-University Jena, Löbdergraben 32,
07743 Jena, Germany
b Department of Palynology and Climate Dynamics, Albrecht-von-Haller-Institute for Plant Sciences, Georg-August-
University Göttingen, Untere Karspüle 2, 37073 Göttingen, Germany
c Chair of Silviculture, University of Freiburg, Tennenbacher straße 4, 79085 Freiburg, Germany
Keywords
El Niño-Southern Oscillation, Monsoon, Lake sediments, Fire history, Intertropical Convergence Zone,
Palaeorainfall
The Holocene 24 (2014) 1743-1756
doi: 10.1177/0959683614551217
38
Abstract
The climate of Sulawesi is driven by the monsoon system as well as the El Niño-Southern Oscillation
(ENSO). Until now, mechanisms and long-term variations of these complex interacting climate processes
have been poorly understood. This paper uses a sediment record from Lake Kalimpaa to investigate
long-term rainfall trends of the past ca. 1500 years. Granulometric and geochemical data provide
indications for an increasingly wetter climate (higher rainfall intensities and/or mean rainfall) on
centennial to millennial time scales from approximately AD 560 to the 20th century. Highest rainfall
intensities probably occurred at the end of the Little Ice Age (LIA). The trend towards wetter conditions
during this time could also be detected in other palaeoclimatic studies from the region. A plausible
explanation for these observations is the southward displacement of the Intertropical Convergence
Zone (ITCZ) associated with changes in monsoon dynamics. However, comparison of the results with
other proxy and model data indicates that the long-term rainfall variability in Central Sulawesi is also
determined by variations in ENSO. During the 20th century the climate signal in the Kalimpaa record is
superimposed by human impact. Moreover, the data suggest that two periods of disturbance occurred
within the lake catchment between about AD 1090-1190 and AD 1450-1620. Comparison with fire
frequency derived from macro-charcoal analysis indicates that these events were caused by forest fires
which likely took place during periods of drought. Broadly simultaneous drought periods have been
detected in records from East Java suggesting a regional drought occurrence affecting at least East Java
and Sulawesi.
Introduction
Sulawesi belongs to the Greater Sunda Islands located in the Indo-Pacific warm pool (IPWP), which is
the largest storage of warm surface ocean water globally (Gagan et al. 2004; Oppo et al. 2009).
Consequently, this area is a substantial source of latent heat and has a great importance for
understanding modern climate dynamics (Hope 2001).
Several rainfall regimes occur in Indonesia in response to, for example, variations in the monsoon system
and the El Niño-Southern Oscillation (ENSO; Aldrian and Susanto 2003). The seasonal rainfall in eastern
Indonesia is mainly driven by the intensity of the Australian-Indonesian summer monsoon (Griffiths et
al. 2010), whereas the ENSO cycle (Diaz and Kiladis 1992) is responsible for the complex inter-annual
climatic variability in this region. While ENSO cold events (La Niña) enhance the rainfall in Sulawesi,
ENSO warm events (El Niño) result in dry periods, which occasionally have led to extreme droughts in
the past (Salafsky 1994; D’Arrigo et al. 2006; Keil et al. 2008). These drought events facilitated the
occurrence of forest fires in tropical rainforests, as recorded in Borneo and Sulawesi during the strong
El Niño of 1997/98 (Rowell and Moore 2000; Siegert and Hoffmann 2000; Sastry 2002).

39
The annual influence of the monsoon is dominant in most parts of Sulawesi, where the wet season
coincides with the Australian-Indonesian summer monsoon from October to March and the dry season
with the Asian summer monsoon from April to September (Aldrian and Susanto 2003; Gunawan 2006;
Figure 5.1b-c). An 'anti-monsoonal' rainfall pattern has been observed in the northeast of Sulawesi. This
area representing only a vast minority of the island is characterized by inverse occurrences of wet
seasons from April to August and dry seasons from September to March as well as a more pronounced
impact of ENSO (Aldrian and Susanto 2003; Aldrian et al. 2004; Gunawan 2006). The mechanism
underlying this pattern is the strong influence of the ocean and its sea surface temperatures (SST) in
this region. Due to the Indonesian Through flow (ITF), marine currents from a Pacific warm pool
northeast of New Guinea can enter the Indian Ocean (Godfrey 1996; Morey et al. 1999). These currents
mainly pass the Makassar Strait, but also influence the SST in the Molucca Sea northeast of Sulawesi
(Figure 5.1a). During the boreal winter, the ITF brings cooler water from the warm pool to the Molucca
Sea inhibiting the formation of a convective zone in the northeastern part of Sulawesi (wet season in
the monsoonal regions of Indonesia). In contrast, during the boreal summer, warmer water supplied
from the warm pool promotes the formation of a convective zone in northeastern Sulawesi (dry season
in most parts of Sulawesi; Godfrey 1996; Gordon et al. 1999; Morey et al. 1999; Aldrian and Susanto
Figure 5.1 a) Map of the research area showing the location of Lake Kalimpaa on the island of Sulawesi. Also depicted are the locations of other study sites mentioned in the text: (1) Makassar Strait (Oppo et al. 2009; Tierney et al. 2010); (2) Halmahera: Kau Bay (Langton et al. 2008); (3) East Java: Lake Lamongan (Crausbay et al. 2006), Lake Logung (Rodysill et al. 2012), Lake Lading (Konecky et al. 2013); (4) Makassar Strait (Newton et al. 2006); (5) South Sulawesi: Wanda site near Lake Matano (Hope 2001); (6) North Sulawesi: Lake Tondano (Dam et al. 2001); (7) Besoa Valley, Central Sulawesi (Kirleis et al. 2011). The grey solid arrows represent the sea currents of the Indonesian throughflow (ITF) referring to Godfrey (1996) and Morey et al. (1999), whereas the dashed arrows depict further possible pathways. b) The generalized main wind directions over Sulawesi during the Australian–Indonesian summer monsoon (DJF: December-January-February) and c) during the Asian summer monsoon (JJA: June-July-August). The basic map was created using MapCreator 2.0

40
2003; Gunawan 2006). According to Gunawan (2006), Central Sulawesi is characterized by a mixture of
both monsoonal and 'anti-monsoonal' type of rainfall, and by the strong influence of ENSO.
Topography also influences rainfall and causes substantial variations over short distances. In the
mountainous regions of the LLNP rainfall is mainly generated orographically (Gunawan 2006). During
boreal winters, the Australian-Indonesian summer monsoon brings moist air masses to Central Sulawesi
reaching the island from the northwest. In the mountains around Palu Valley the ascending air leads to
orographic rainfall with a strong correlation between altitude and precipitation totals. In contrast, dry
air masses reach Sulawesi during austral winters, when precipitation is lower and solely generated
orographically (Gunawan 2006).
Thus far, neither the mechanisms nor the long-term variations of these complex interacting climate
processes have been completely understood. Palaeoenvironmental data are needed to achieve more
detailed knowledge of palaeoclimatic changes in Sulawesi; there are only a few palaeoclimatic studies
from this region covering the past millennia. Marine records are available from Makassar Strait (Newton
et al. 2006; Oppo et al. 2009; Tierney et al. 2010; Figure 5.1a) and Kau Bay (Halmahera; Langton et al.
2008); lacustrine sediments from East Java (Lake Lamongan: Crausbay et al. 2006; Lake Lading: Konecky
et al. 2013; Lake Logung: Rodysill et al. 2012) provide terrigenous archives with a suitable temporal
resolution. Palynological evidence are available from two sites in the Besoa Valley, Central Sulawesi, and
the pollen data of one of these exhibits a cooling trend during the Little Ice Age (LIA; Kirleis et al. 2011).
However, palaeoclimatic studies from Sulawesi are rare and cover longer time frames with lower
temporal resolutions (Lake Tondano: Dam et al. 2001; Wanda site near Lake Matano: Hope 2001; Figure
5.1a). Therefore, it is necessary to carry out further investigations on palaeoenvironmental archives
from Sulawesi to enhance the spatial and temporal resolution of proxy data.
This study aims to contribute to a better understanding of palaeoclimatic changes in Sulawesi during
the past 1500 years. The main objective is to investigate various sedimentological characteristics of a
core from Lake Kalimpaa (Central Sulawesi; Figure 5.1a) in order to provide indications for long-term
rainfall trends, palaeoenvironmental changes and fire history in the lake catchment.
Site description
Lake Kalimpaa (1°19'34.8''S, 120°18'31.9''E; Figure 5.1a), sometimes also referred to as Danau Tambing,
is located at 1660 m asl in the LLNP in Central Sulawesi, Indonesia. It occupies an area of 6.5 ha and has
a maximum water depth of 6.6 m. The lake is surrounded by small reed belts and a swamp area to the
north (Haberzettl et al. 2013); it has an inflow from the northeast and an outflow to the southwest.
Lake Kalimpaa is located in a mountain pass at the end of a side valley of the Palu Valley. Surrounding
mountaintops in the northeast and southwest exceed altitudes of 2000 m asl. The lake’s catchment area
of approximately 1.8 km² extends mainly to the north. The geological setting is characterized by the

41
Pliocene Kambuno Granite (Simandjuntak et al. 1991; Priadi et al. 1994; Leemhuis 2005) and its
weathering products. Regional vegetation is characterized by montane rainforest which in the LLNP, is
presently characterized by a 90 % intact canopy cover (Kirleis et al. 2011) and is dominated by Fagaceae,
mostly represented by the two genera Lithocarpus and Castanopsis (Culmsee et al. 2010).
There is no representative meteorological station in the vicinity of Lake Kalimpaa itself but there are
records for the mountains of western Central Sulawesi and these can be used as representative of the
catchment. Because of the close proximity to the equator temperatures are almost constant throughout
the year. Daytime temperatures at higher altitudes range from 16 to 22 °C; annual precipitation is
around 2000 to 3000 mm (Weber 2006).
Materials and methods
A 211 cm long composite sediment record consisting of three overlapping sections (KAL 1-1, KAL 1-2,
KAL 1-3) was recovered from Lake Kalimpaa using a Livingstone piston corer (Livingstone 1955).
Palaeomagnetic analyses showed that only KAL 1-1 and KAL 1-2 (153 cm composite length) were suited
for palaeoenvironmental reconstruction since no reliable chronology could be established for the oldest
part of the core (Haberzettl et al. 2013). Each section was split, photographed and described
lithologically. The composite profile was compiled based on macroscopic marker layers. The chronology
was adapted from Haberzettl et al. (2013; Figure 5.2a). Several sets of bulk samples which had been sent
for radiocarbon dating revealed inconsistencies, i.e., ages were not in stratigraphic order. Since hard-
water effects can be excluded for Lake Kalimpaa another kind of reservoir effect is assumed. Probably
Figure 5.2 a) The age-depth model for the Lake Kalimpaa record based on calibrated radiocarbon ages which are presented as medians referring to the 2σ ranges (Haberzettl et al. 2013). The grey data points are regarded as outliers and have been excluded from the final age depth model (Haberzettl et al. 2013). b) Comparison of declination and inclination of the Lake Kalimpaa record (Haberzettl et al. 2013) with the CALS3k.4 model output for the location of Lake Kalimpaa (Korte and Constable 2011)
42
the dated material of the bulk samples comprised both autochthonous and allochthonous organic
matter. Therefore, only the youngest ages were used for the age-depth model that is based on linear
interpolation (Haberzettl et al. 2013; Figure 5.2a). Despite these dating uncertainties the created age-
depth model seems to be a first order approximation which is corroborated by magnetostratigraphy.
The comparison of palaeosecular variation data of the Kalimpaa record with the output of the CALS3k.4
model (Korte and Constable 2011) shows many isochronic similarities for inclination as well as for
declination (Figure 5.2b). Therefore, the age-depth model can be used as basis for further multi-proxy
approaches on the Lake Kalimpaa record. A marked increase in sedimentation rate is obvious for the
most recent sediments. While the mean sedimentation rate between 151 and 44 cm is about
0.8 mm/yr, for the youngest sediments between 44 cm and the top of the core the age-depth model
provides a sedimentation rate of ca. 9.2 mm/yr on average.
After palaeomagnetic measurements u-channels of KAL 1-1 and KAL 1-2 were subsampled for
subsequent geochemical and granulometric analyses. Grain size distribution was measured at an
interval of 1 cm (N=153) with a Laser Diffraction Particle Size Analyser (Beckman Coulter LS 13320)
utilizing the Aqueous Liquid Module and 10 s ultrasonic for dispersion. The Fraunhofer diffraction theory
was used for optical modelling of light scattering (De Boer et al. 1987). Organic matter and carbonates
were removed with H2O2 (30 %) and HCl (10 %), respectively and sodium pyrophosphate solution
(Na4P2O7 · 10 H2O; 0.1 M) was used as a dispersion medium. The measurements were carried out in
several runs until a reproducible signal was obtained. The first reproducible run was taken for further
statistical treatment. The grain size fractions were calculated according to Ad-hoc AG Boden (2005). The
skewness (φ-scale) was determined by the logarithmic method of moments by means of a modified
version of Gradistat 4.2 (Blott and Pye 2001).
Element concentrations of Al, Ca, Fe, K, Mg, Mn, P, S and Ti were measured at intervals of 2 cm (N=77)
using ICP-OES (Varian 725-ES). For this purpose, oven-dried (50°C) aliquots were pestled (< 40 µm) and
homogenized. The samples were digested with a microwave based procedure using modified aqua
regia, which consists of 1 ml deionized water, 2 ml HCl (30 %) and 4 ml HNO3 (30 %).
With the use of syringes, sediment samples were obtained at ca. 4 cm intervals (N=41) from the core
and freeze-dried. Aliquots were ground and analysed for total organic carbon (TOC) and total nitrogen
(TN) contents with a CNS element analyser (Euro EA 3000). TOC was determined after the destruction
of carbonates with 2M H3PO4. Subsequently the molar TOC/TN ratio was calculated.
Additionally, mineralogical investigations on the pestled samples (N=10) were carried out using an X-ray
diffractometer (D8-Discover, Bruker AXS) equipped with a CuKα X-ray tube and a gas proportional
counter (HI-STAR area detector, Bruker AXS). The evaluation of the data was performed by means of
the software Match! 2.0.9 and MacDiff 4.2.6.
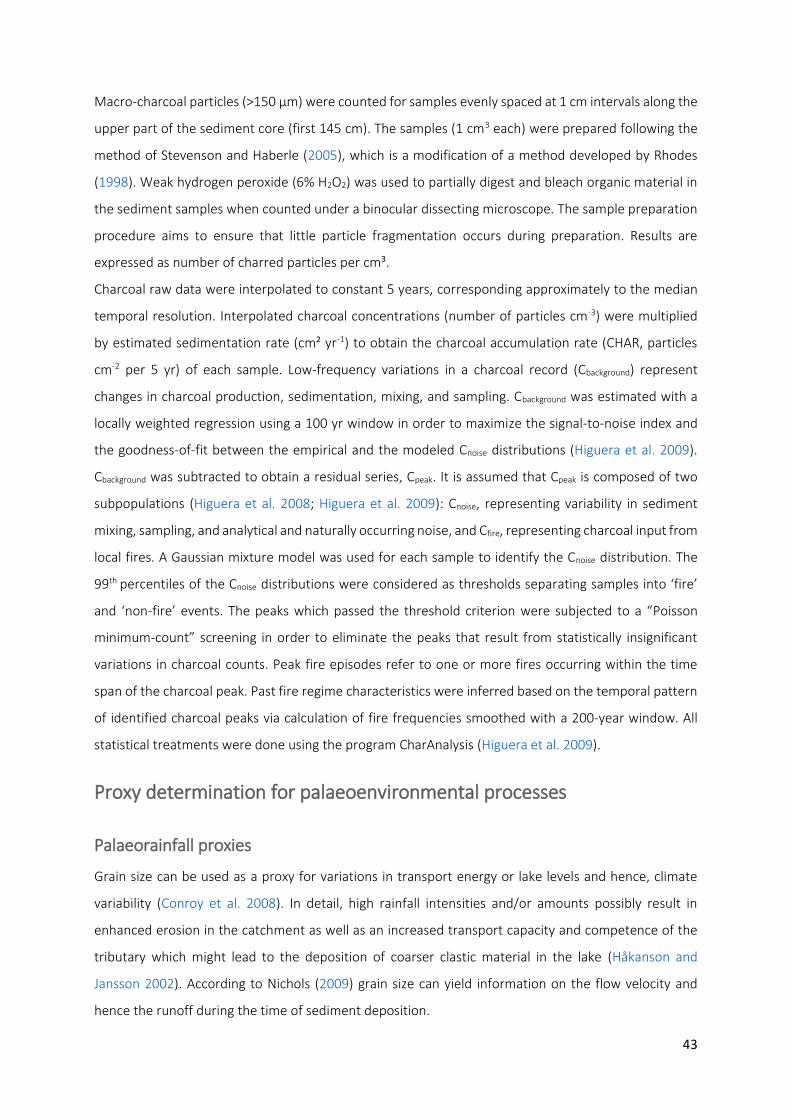
43
Macro-charcoal particles (>150 µm) were counted for samples evenly spaced at 1 cm intervals along the
upper part of the sediment core (first 145 cm). The samples (1 cm3 each) were prepared following the
method of Stevenson and Haberle (2005), which is a modification of a method developed by Rhodes
(1998). Weak hydrogen peroxide (6% H2O2) was used to partially digest and bleach organic material in
the sediment samples when counted under a binocular dissecting microscope. The sample preparation
procedure aims to ensure that little particle fragmentation occurs during preparation. Results are
expressed as number of charred particles per cm³.
Charcoal raw data were interpolated to constant 5 years, corresponding approximately to the median
temporal resolution. Interpolated charcoal concentrations (number of particles cm-3) were multiplied
by estimated sedimentation rate (cm² yr-1) to obtain the charcoal accumulation rate (CHAR, particles
cm-2 per 5 yr) of each sample. Low-frequency variations in a charcoal record (Cbackground) represent
changes in charcoal production, sedimentation, mixing, and sampling. Cbackground was estimated with a
locally weighted regression using a 100 yr window in order to maximize the signal-to-noise index and
the goodness-of-fit between the empirical and the modeled Cnoise distributions (Higuera et al. 2009).
Cbackground was subtracted to obtain a residual series, Cpeak. It is assumed that Cpeak is composed of two
subpopulations (Higuera et al. 2008; Higuera et al. 2009): Cnoise, representing variability in sediment
mixing, sampling, and analytical and naturally occurring noise, and Cfire, representing charcoal input from
local fires. A Gaussian mixture model was used for each sample to identify the Cnoise distribution. The
99th percentiles of the Cnoise distributions were considered as thresholds separating samples into ‘fire’
and ‘non-fire’ events. The peaks which passed the threshold criterion were subjected to a “Poisson
minimum-count” screening in order to eliminate the peaks that result from statistically insignificant
variations in charcoal counts. Peak fire episodes refer to one or more fires occurring within the time
span of the charcoal peak. Past fire regime characteristics were inferred based on the temporal pattern
of identified charcoal peaks via calculation of fire frequencies smoothed with a 200-year window. All
statistical treatments were done using the program CharAnalysis (Higuera et al. 2009).
Proxy determination for palaeoenvironmental processes
Palaeorainfall proxies
Grain size can be used as a proxy for variations in transport energy or lake levels and hence, climate
variability (Conroy et al. 2008). In detail, high rainfall intensities and/or amounts possibly result in
enhanced erosion in the catchment as well as an increased transport capacity and competence of the
tributary which might lead to the deposition of coarser clastic material in the lake (Håkanson and
Jansson 2002). According to Nichols (2009) grain size can yield information on the flow velocity and
hence the runoff during the time of sediment deposition.

44
In the Lake Kalimpaa catchment sediment erosion and transport is likely driven by runoff. Channel
erosion and denudation of soil material are probably the major causes for the transport of sediments,
although dense vegetation cover accompanied by high interception protects the soil surface.
It is assumed that the deposition of coarse grain sizes reflects periods or events characterized by high
runoff and hence, higher rainfall intensities. In contrast, the deposition of fine grain sizes is linked to
periods of lower average rainfall and thus, lower transport energy of the inflow. In such a small system
probably lower runoff facilitates the deposition of finer particles due to the absence of turbulences in
the lake water which are caused by the inflow during periods of greater rainfall and runoff.
The skewness (Sk) of grain size distributions of deposited sediments is a result of the composition of the
source material as well as the energy level of the transport process. If transport processes exhibit a high-
energy level, the deposited sediments become coarser and their grain size distributions are more
positively skewed (on φ-scale). If the energy level is low, the deposited sediments become finer and
more negatively skewed (McLaren and Bowles 1985).
It is supposed that the main source of Al, Ca, K, Mg and Ti are the minerals of the Kambuno Granite and
its weathering products. K is mainly associated with K-feldspars, biotite and muscovite as well as, to a
lower extent, with illite. Mg is related to biotite and clay minerals, such as montmorillonite; Ca occurs
for instance in plagioclase and illite. Ti is chemically immobile and occurs mainly in heavy accessory
minerals like rutile and ilmenite, which are extremely resistant against weathering (Goldich 1938; Shotyk
et al. 2001; Li et al. 2003). Therefore, Ti was used in many other studies on lake sediments as an indicator
for the input of clastic, terrigenous material (e.g. Haberzettl et al. 2005; Whitlock et al. 2008; Kasper et
al. 2012) a process that is often driven by precipitation and runoff in the lake catchment.
During the chemical weathering of feldspars and micas to clay minerals, K, Ca, and Mg get dissolved. In
contrast, Al which is part of feldspars and micas as well as clay minerals, is nearly insoluble and less
mobile than the alkali and alkaline earth elements (Nesbitt et al. 1980; Middelburg et al. 1988). Kaolinite
and gibbsite, which are common weathering products of granites under tropical conditions (West and
Dumbleton 1970), contain Al but no K, Ca and Mg. Therefore, Al is used as denominator in various
element/Al ratios in the following to compensate variable depletion effects which are primarily caused
by concentrations of the redox sensitive element Fe.
In many other studies element/Al ratios like K/Al and Ti/Al are related to weathering intensities in the
source area, input pathways or the strength of transport processes (Boyle 1983; Lückge et al. 2001;
Muller et al. 2001; Zabel et al. 2001). Engstrom and Wright (1984) and Mackereth (1966) found that
alkali and alkaline earth elements (e.g. Ca, K and Mg) accumulate in lake sediments during periods of
intense erosion, when mineral matter is transported into the lake. In contrast, low values of alkali and
alkaline earth elements in lake sediments occur when erosion is low and leaching of the catchment soils
is dominant. Granite is usually deeply weathered in tropical climates and thus, unweathered minerals
45
like feldspars are more prominent in areas with higher slope angles (Berry and Ruxton 1959). Therefore,
the source area of feldspars and micas is possibly the steeper slopes around the lake and their transport
into the sediment occurs via terrigenous runoff during periods of high erosion. Accordingly, K/Al, Ca/Al
and Mg/Al reflect the variability of the proportion of chemically less weathered feldspars and micas to
clay minerals, especially kaolinite. The Ti/Al ratio mainly reflects changes in grain size (Boyle 1983; Zabel
et al. 2001). Ti is associated with coarser material while Al rather represents the fine-grained fraction so
that the Ti/Al ratio is linked to the strength of fluvial transport which reflects hydrological variability.
Therefore, Ti/Al, K/Al, Mg/Al and Ca/Al ratios may be used as proxies for palaeorainfall similar to other
studies on tropical lake sediments (Felton et al. 2007; Warrier and Shankar 2009). High ratios are
interpreted as periods and/or events of high erosion and, accordingly, high rainfall intensities in the lake
catchment.
Proxies for catchment disturbances and changes in redox conditions
Fire frequency data derived from macro-charcoal analysis is used to reconstruct the fire history around
Lake Kalimpaa. Such forest fires may cause substantial disturbances within the lake catchment regarding
changes in vegetation and sedimentological processes. Enhanced erosion as well as an increased supply
of organic matter entering the lake can be consequences of these disturbances.
Fe, Mn, P, S, TOC and TN typically are part of a common reaction and transport cycle in sediments (Van
Cappellen and Wang 1996). The significantly higher presence of allogenic Fe and Mn is characteristic of
tropical lakes (Crowe et al. 2008). In soil samples from the upper horizons of nine sites in the catchment
area of Lake Kalimpaa, average contents of ca. 2.5 % of Fe and ca. 340 ppm of Mn were measured
(Markussen 2000). As it will be demonstrated later, Fe and Mn concentrations are significantly higher
in certain sections of the sediment core than those in the topsoil. This cannot be explained solely by an
increased input but rather by the accumulation of these elements due to another process(es), such as
redox reactions in the sediment and/or the water column. Since this is accompanied by relatively high
TOC/TN ratios which can indicate a shift to a more terrestrial origin of the organic matter (Mayr et al.
2005; Meyers 1994; Haberzettl et al. 2008), it is hypothesized that sharp increases in TOC, TN, S, Fe and
Mn concentrations result from the supply of organic material from the catchment. This promotes
reducing conditions in the sediment due to microbial decomposition. In contrast, low molar TOC/TN
ratios likely arise from a comparatively low input of terrestrial organic matter or a higher occurrence of
phytoplankton, which is typically characterized by TOC/TN ratios ranging from 4 to 10 (Meyers 1994;
Kasper et al. 2013).
The microbiological decomposition of organic material in lake water and sediment is an oxygen-
consuming process that produces anoxic environments (Davison 1993). In lakes, Fe and Mn occur in
various oxidation states (FeII, FeIII; MnII, MnIII, MnIV) dependent on the given redox conditions. Under
46
oxidizing conditions both elements exhibit low solubility, where Mn is soluble at higher redox potentials
than Fe (Sigg and Stumm 1991). Fe that enters lakes via rivers, occurs mainly in particulate form (> 99 %;
Salomons and Förstner 1984) as ferric (oxyhydr)oxide or bound in the lattice of micas and clay minerals.
Mn is also predominantly supplied by solids, such as MnO2, and to lower amounts as dissolved Mn2+
(Engstrom and Wright 1984; Davison 1993). There seems to be a succession of redox processes in the
sediment record from Lake Kalimpaa, during which particulate Fe(III)-(oxyhydr)oxides are dissolved to
Fe2+ which precipitates as amorphous Fe(II)-sulphide or for instance mackinawite, or it becomes mobile
and reprecipitates as Fe(III)-(oxyhydr)oxide at the oxic/anoxic boundary. The identification of Fe(II)-
sulphides is inferred from the black sediment colour and its association with high Fe and S bulk
concentrations (Emerson 1976; Engstrom and Wright 1984). The affinity of P to be adsorbed on the
surfaces of Fe-(oxyhydr)oxides is known from the literature (e.g. Lijklema 1980; Buffle et al. 1989).
According to López et al. (2006), high Fe and P values are indicative for the precipitation and
accumulation of authigenic Fe. Moreover, P is also associated with organic matter.
Results
Core lithology and mineralogy
The core sections KAL 1-1 and 1-2 consist mainly of finely laminated silts with a few homogeneous
sections and distinct sand layers. Based on obvious changes in sediment structure, colour and
macroscopic grain size, six lithological units can be distinguished (Figure 5.3). Unit I (153-128 cm; ca. AD
560-1090) exhibits finely laminated blackish grey and light grey silts. Unit II (128-118 cm; ca. AD 1090-
1190) is characterized by homogeneous black sediments composed of fine silts to fine sandy coarse
silts. Finely laminated, light greyish to grey layers consisting of medium to fine sandy coarse silts occur
in unit III (118-93 cm; ca. AD 1190-1450; Figure 5.3). Mica particles, probably muscovite, are
conspicuous between ca. 110 and 40 cm (ca. AD 1275-1965). Partially laminated, dark brown to black
fine sandy coarse silts occur in unit IV (93-77 cm; ca. AD 1450-1620). Unit V (77-48 cm; ca. AD 1620-
1910) exhibits a greyish colour and contains partially laminated, fine sandy coarse silts with an
intercalated sand layer. The uppermost unit VI (48-0 cm; ca. AD 1910-2006; Figure 5.3) consists of
brownish medium to fine sandy silts. It is assumed that human impact in the catchment area (e.g. by
road construction, camp site) superimposes any effects of climatically induced changes during the
20th century (Haberzettl et al. 2013). Nevertheless, it cannot be excluded that also climate could have
caused the marked increase in sedimentation rate for the most recent sediments. Since the distinction
between climatic and human-driven impacts seems not possible with certainty, no palaeoclimatic
interpretation has been done for unit VI in the following. X-ray diffractograms of all measured samples
show comparable spectra. The most common sediment minerals are quartz, alkali feldspars, plagioclase,
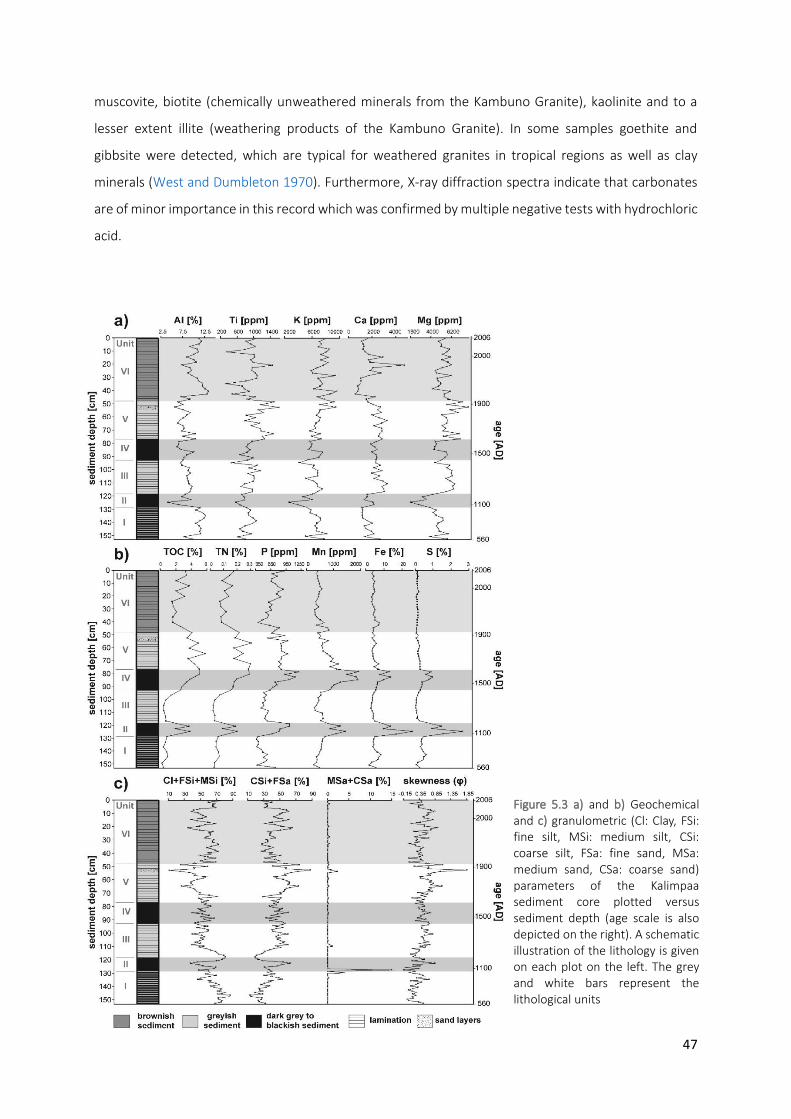
47
muscovite, biotite (chemically unweathered minerals from the Kambuno Granite), kaolinite and to a
lesser extent illite (weathering products of the Kambuno Granite). In some samples goethite and
gibbsite were detected, which are typical for weathered granites in tropical regions as well as clay
minerals (West and Dumbleton 1970). Furthermore, X-ray diffraction spectra indicate that carbonates
are of minor importance in this record which was confirmed by multiple negative tests with hydrochloric
acid.
Figure 5.3 a) and b) Geochemical and c) granulometric (Cl: Clay, FSi: fine silt, MSi: medium silt, CSi: coarse silt, FSa: fine sand, MSa: medium sand, CSa: coarse sand) parameters of the Kalimpaa sediment core plotted versus sediment depth (age scale is also depicted on the right). A schematic illustration of the lithology is given on each plot on the left. The grey and white bars represent the lithological units

48
Grain size analysis
The core sections KAL 1-1 and 1-2 are dominated by medium to coarse silt and accessorily contain some
fine sand layers. With a mean of ca. 78.3 % in all samples, silt is the most common fraction followed by
sand (ca. 13.5 %) and clay (ca. 8.2 %). A correlation matrix of the calculated grain size fractions (Table
5.1) exhibits positive correlations between clay (Cl), fine silt (FSi) and medium silt (MSi). Coarse silt (CSi)
and fine sand (FSa) are also positively correlated but negatively correlated to the aforementioned.
Moreover, there is a positive correlation between medium sand (MSa) and coarse sand (CSa) which are
only sporadically present in the record (Table 5.1). On this basis, the grain size fractions can be grouped
into classes, viz. one of Cl+FSi+MSi and one of CSi+FSa. They show an opposing trend (Figure 5.3c) but
depend on each other and thus, probably represent the same palaeoenvironmental signal. In contrast,
the third class consisting of MSa+CSa is interpreted as an additional signal.
Units I and II (153-118 cm; ca. AD 560-1190) are characterized by low but slightly increasing CSi+FSa and
Sk values as well as high but slightly decreasing Cl+FSi+MSi values (Figure 5.3c). The most prominent
peak in MSa+CSa occurs at the base of unit II (at 128 cm; ca. AD 1090). The lowermost section of unit III
(118-112 cm; ca. AD 1190-1250) exhibits low values for CSi+FSa and Sk as well as high values for
Cl+FSi+MSi again. For the remaining part of unit III, IV and V (112-48 cm; ca. AD 1250-1910), CSi+FSa
and Sk values first show a decreasing and then an increasing trend reaching their maxima within unit V
(at 53 cm; ca. AD 1860; Cl+FSi+MSi vice versa). Over the entire record (units I to V), an increasing trend
of CSi+FSa and Sk values as well as a decreasing trend of Cl+FSi+MSi values can be identified.
Table 5.1 Correlation matrix including the Pearson product–moment correlation coefficient and the related p-value of the grain size fractions from all measured samples of the Lake Kalimpaa record. The limits of grain size fractions
are according to Ad-hoc AG Boden (2005) as follows: clay (Cl), fine silt (FSi), medium silt (MSi), coarse silt (CSi), fine
sand (FSa), medium sand (MSa) and coarse sand (CSa). Highly significant correlations (p < 0.001) are highlighted (bold: highly positively correlated, bold italic: highly negatively correlated)
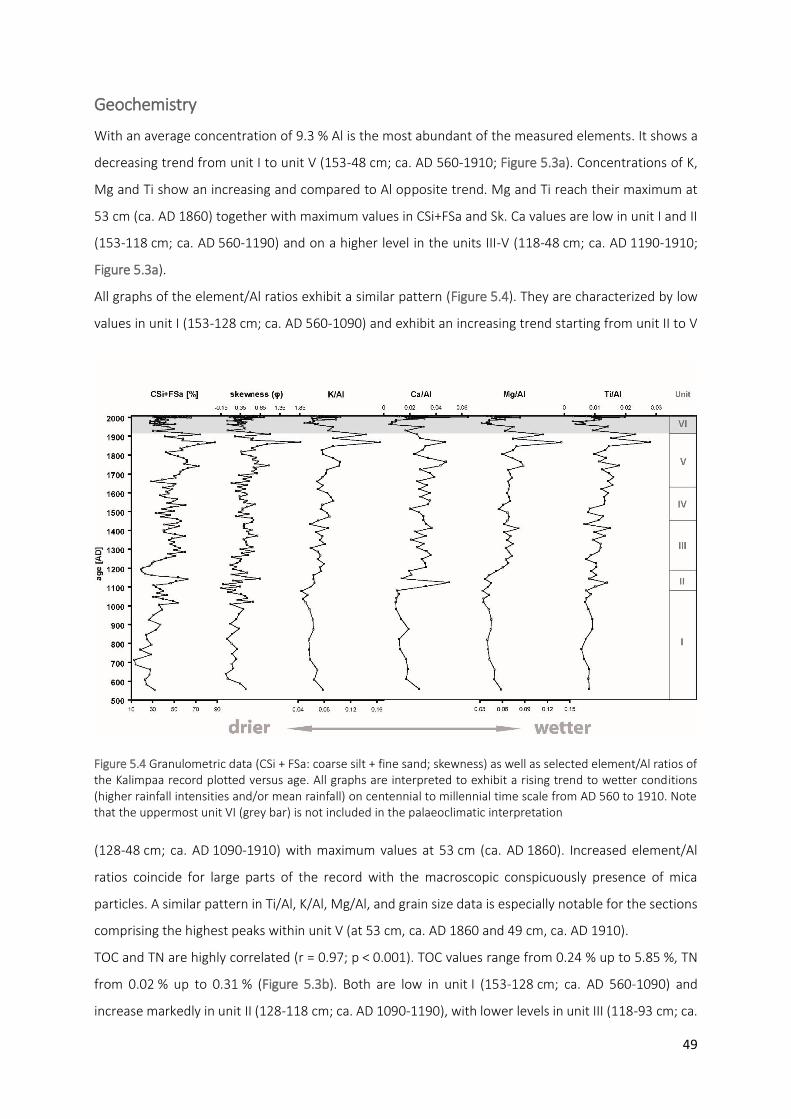
49
Geochemistry
With an average concentration of 9.3 % Al is the most abundant of the measured elements. It shows a
decreasing trend from unit I to unit V (153-48 cm; ca. AD 560-1910; Figure 5.3a). Concentrations of K,
Mg and Ti show an increasing and compared to Al opposite trend. Mg and Ti reach their maximum at
53 cm (ca. AD 1860) together with maximum values in CSi+FSa and Sk. Ca values are low in unit I and II
(153-118 cm; ca. AD 560-1190) and on a higher level in the units III-V (118-48 cm; ca. AD 1190-1910;
Figure 5.3a).
All graphs of the element/Al ratios exhibit a similar pattern (Figure 5.4). They are characterized by low
values in unit I (153-128 cm; ca. AD 560-1090) and exhibit an increasing trend starting from unit II to V
(128-48 cm; ca. AD 1090-1910) with maximum values at 53 cm (ca. AD 1860). Increased element/Al
ratios coincide for large parts of the record with the macroscopic conspicuously presence of mica
particles. A similar pattern in Ti/Al, K/Al, Mg/Al, and grain size data is especially notable for the sections
comprising the highest peaks within unit V (at 53 cm, ca. AD 1860 and 49 cm, ca. AD 1910).
TOC and TN are highly correlated (r = 0.97; p < 0.001). TOC values range from 0.24 % up to 5.85 %, TN
from 0.02 % up to 0.31 % (Figure 5.3b). Both are low in unit I (153-128 cm; ca. AD 560-1090) and
increase markedly in unit II (128-118 cm; ca. AD 1090-1190), with lower levels in unit III (118-93 cm; ca.
Figure 5.4 Granulometric data (CSi + FSa: coarse silt + fine sand; skewness) as well as selected element/Al ratios of the Kalimpaa record plotted versus age. All graphs are interpreted to exhibit a rising trend to wetter conditions (higher rainfall intensities and/or mean rainfall) on centennial to millennial time scale from AD 560 to 1910. Note that the uppermost unit VI (grey bar) is not included in the palaeoclimatic interpretation
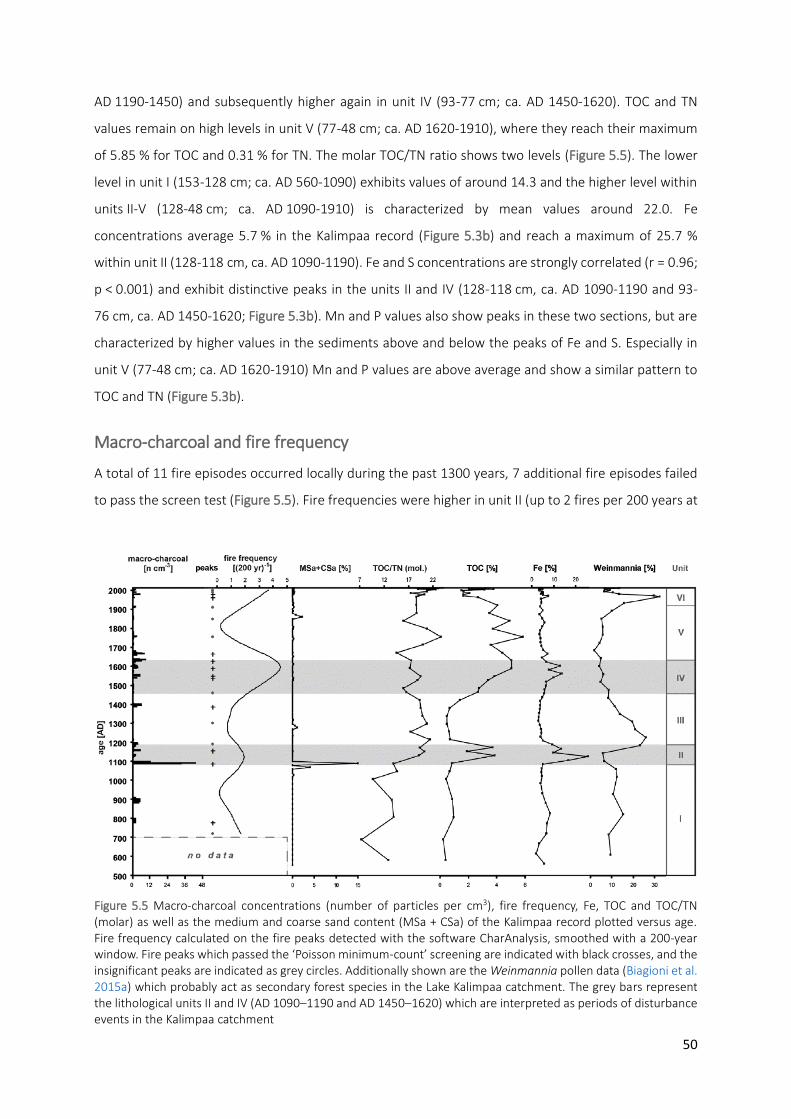
50
AD 1190-1450) and subsequently higher again in unit IV (93-77 cm; ca. AD 1450-1620). TOC and TN
values remain on high levels in unit V (77-48 cm; ca. AD 1620-1910), where they reach their maximum
of 5.85 % for TOC and 0.31 % for TN. The molar TOC/TN ratio shows two levels (Figure 5.5). The lower
level in unit I (153-128 cm; ca. AD 560-1090) exhibits values of around 14.3 and the higher level within
units II-V (128-48 cm; ca. AD 1090-1910) is characterized by mean values around 22.0. Fe
concentrations average 5.7 % in the Kalimpaa record (Figure 5.3b) and reach a maximum of 25.7 %
within unit II (128-118 cm, ca. AD 1090-1190). Fe and S concentrations are strongly correlated (r = 0.96;
p < 0.001) and exhibit distinctive peaks in the units II and IV (128-118 cm, ca. AD 1090-1190 and 93-
76 cm, ca. AD 1450-1620; Figure 5.3b). Mn and P values also show peaks in these two sections, but are
characterized by higher values in the sediments above and below the peaks of Fe and S. Especially in
unit V (77-48 cm; ca. AD 1620-1910) Mn and P values are above average and show a similar pattern to
TOC and TN (Figure 5.3b).
Macro-charcoal and fire frequency
A total of 11 fire episodes occurred locally during the past 1300 years, 7 additional fire episodes failed
to pass the screen test (Figure 5.5). Fire frequencies were higher in unit II (up to 2 fires per 200 years at
Figure 5.5 Macro-charcoal concentrations (number of particles per cm3), fire frequency, Fe, TOC and TOC/TN (molar) as well as the medium and coarse sand content (MSa + CSa) of the Kalimpaa record plotted versus age. Fire frequency calculated on the fire peaks detected with the software CharAnalysis, smoothed with a 200-year window. Fire peaks which passed the ‘Poisson minimum-count’ screening are indicated with black crosses, and the insignificant peaks are indicated as grey circles. Additionally shown are the Weinmannia pollen data (Biagioni et al. 2015a) which probably act as secondary forest species in the Lake Kalimpaa catchment. The grey bars represent the lithological units II and IV (AD 1090–1190 and AD 1450–1620) which are interpreted as periods of disturbance events in the Kalimpaa catchment

51
128-118 cm; ca. AD 1090-1190) and unit IV (up to 4 fires per 200 years at 93-76 cm; ca. AD 1450-1620).
In unit VI (48-0 cm; ca. AD 1910-2006) fire frequencies gradually increased until today.
Discussion
Palaeorainfall in Central Sulawesi
Based on variations in the established palaeorainfall proxies (K/Al, Ca/Al, Mg/Al, Ti/Al, CSi+FSa, Sk) the
Lake Kalimpaa record likely reveals a centennial to millennial-scaled trend towards wetter conditions
characterized by higher rainfall intensities and possibly higher mean rainfall from ca. AD 560 to the 20th
century. The period from ca. AD 560-1090 was characterized by drier conditions, while an increasingly
wetter climate can be inferred from ca. AD 1090 to 1910 (Figure 5.4).
A long-term trend towards wetter conditions is also observed in sediments from two other lakes in East
Java (Rodysill et al. 2012; Konecky et al. 2013; Figure 5.6e). Rodysill et al. (2012) explain the trend as a
consequence of migration of the ITCZ with increased precipitation during its southward displacement.
In comparison, Konecky et al. (2013) conclude that the migration of the ITCZ influences the climate
variability on multidecadal to centennial time scales while it is the strengthening of the Walker
circulation and its associated changes in ENSO variability that produces the increasingly wetter climate
during the last millennium. Yan et al. (2011) arrive at similar conclusions, namely, precipitation changes
in response to the combined influence of the migration of the ITCZ and the position and strength of the
Pacific Walker circulation in the western tropical Pacific.
The palaeorainfall proxies obtained from the Lake Kalimpaa record show long-term similarities with
ENSO variability from the eastern Pacific region as well as the South American continent (Figure 5.6a-c).
An ENSO record derived from the sediments of Laguna Pallcacocha, southern Ecuador, reveals that the
number of El Niño events per 100 years decreased since ca. AD 1150 until today (Moy et al. 2002)
consistent with increasing terrigenous input to Lake Kalimpaa (Figure 5.6a-c). Another lacustrine archive
from Galápagos exhibits a decreased ENSO frequency between AD 1300 and 1850 (Conroy et al. 2008).
From Kau Bay (Halmahera; Figure 5.1a), a region where rainfall is strongly dependent on ENSO, it is
known that the El Niño activity decreased steadily from ca. AD 1300 (Langton et al. 2008). A long-term
trend starting from ca. AD 560 onwards is visible in both the established palaeorainfall proxies for the
Kalimpaa record and the output of the coupled ocean atmosphere model from Clement et al. (2000;
Figure 5.6a-b) which reflects the number of El Niño events occurring over a 500 year interval. These
similarities of the ENSO and CSi+FSa data (Figure 5.6a-b, c) indicate that palaeorainfall in Central
Sulawesi is related to the variability of ENSO on centennial to millennial time scale and thus, changes in
the Pacific Walker circulation.
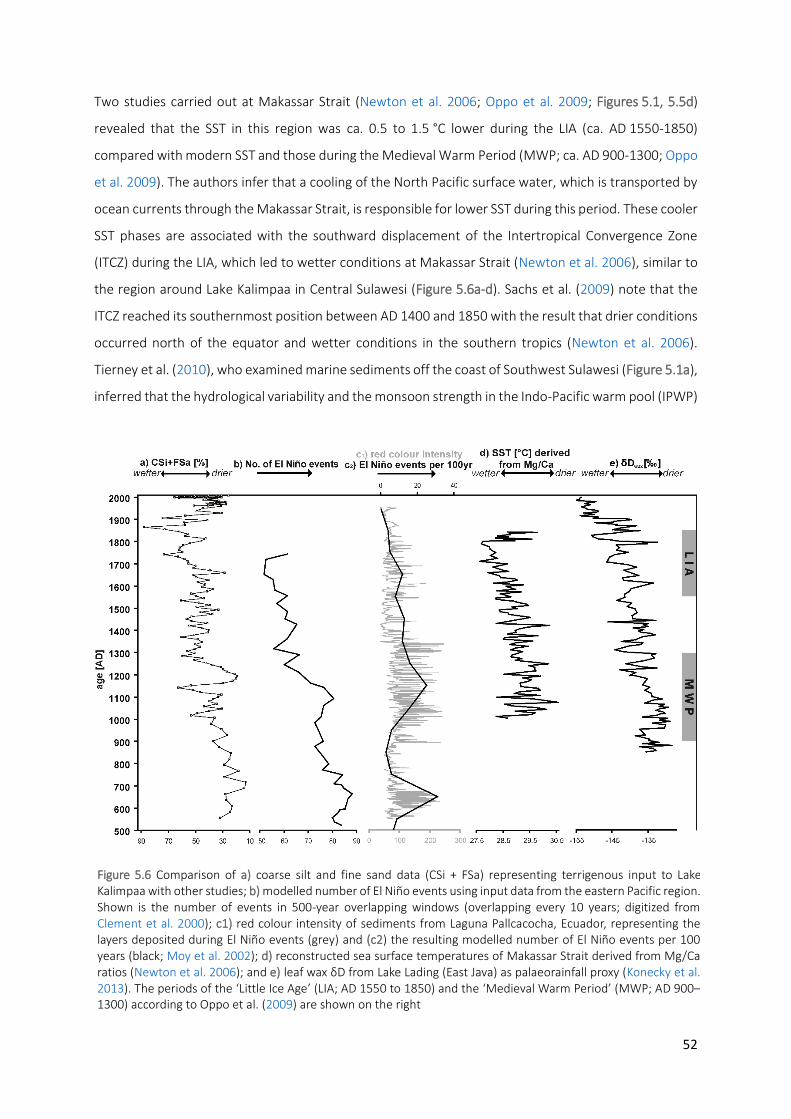
52
Two studies carried out at Makassar Strait (Newton et al. 2006; Oppo et al. 2009; Figures 5.1, 5.5d)
revealed that the SST in this region was ca. 0.5 to 1.5 °C lower during the LIA (ca. AD 1550-1850)
compared with modern SST and those during the Medieval Warm Period (MWP; ca. AD 900-1300; Oppo
et al. 2009). The authors infer that a cooling of the North Pacific surface water, which is transported by
ocean currents through the Makassar Strait, is responsible for lower SST during this period. These cooler
SST phases are associated with the southward displacement of the Intertropical Convergence Zone
(ITCZ) during the LIA, which led to wetter conditions at Makassar Strait (Newton et al. 2006), similar to
the region around Lake Kalimpaa in Central Sulawesi (Figure 5.6a-d). Sachs et al. (2009) note that the
ITCZ reached its southernmost position between AD 1400 and 1850 with the result that drier conditions
occurred north of the equator and wetter conditions in the southern tropics (Newton et al. 2006).
Tierney et al. (2010), who examined marine sediments off the coast of Southwest Sulawesi (Figure 5.1a),
inferred that the hydrological variability and the monsoon strength in the Indo-Pacific warm pool (IPWP)
Figure 5.6 Comparison of a) coarse silt and fine sand data (CSi + FSa) representing terrigenous input to Lake Kalimpaa with other studies; b) modelled number of El Niño events using input data from the eastern Pacific region. Shown is the number of events in 500-year overlapping windows (overlapping every 10 years; digitized from Clement et al. 2000); c1) red colour intensity of sediments from Laguna Pallcacocha, Ecuador, representing the layers deposited during El Niño events (grey) and (c2) the resulting modelled number of El Niño events per 100 years (black; Moy et al. 2002); d) reconstructed sea surface temperatures of Makassar Strait derived from Mg/Ca ratios (Newton et al. 2006); and e) leaf wax δD from Lake Lading (East Java) as palaeorainfall proxy (Konecky et al. 2013). The periods of the ‘Little Ice Age’ (LIA; AD 1550 to 1850) and the ‘Medieval Warm Period’ (MWP; AD 900–1300) according to Oppo et al. (2009) are shown on the right
53
are dependent on migrations of the ITCZ. These authors suggest teleconnections between ENSO and
the monsoon with a weak Indian monsoon and a more El Niño-like mean state during the MWP and a
strong Indian monsoon and a more La Niña-like mean state during the LIA (Tierney et al. 2010). It seems
therefore that the southward displacement of the ITCZ may have caused higher rainfall intensities and
possibly higher mean rainfall around Lake Kalimpaa during the LIA.
Both the monsoon and ENSO climate systems are interacting through teleconnections (Ju and Slingo
1995; Soman and Slingo 1997; Torrence and Webster 1999). Variations in the Pacific Walker circulation
and/or SST anomalies during El Niño events could influence the global scale divergence, which can result
in a shift of the ITCZ and thus, changes of the monsoon dynamics (Ju and Slingo 1995; Soman and Slingo
1997; Torrence and Webster 1999). The position of the ITCZ as well as the mean state of ENSO/Pacific
Walker circulation, therefore, may be considered interactive and co-responsible for the long-term
rainfall variability in Central Sulawesi on centennial to millennial time scale. The interpretation of the
Kalimpaa record suggests a general weakening of the Pacific Walker circulation and a more El Niño-like
mean state from ca. AD 560 to 1090. In contrast, the strengthened Pacific Walker circulation and the
southward displacement of the ITCZ probably are the causes for the wetter climate in Central Sulawesi
during the LIA, which is consistent with the interpretation of Yan et al. (2011).
Palaeoenvironmental disturbance events in the catchment of Lake Kalimpaa
In the Lake Kalimpaa record, peaks in Fe, Mn, P, S, TOC and TN occur almost simultaneously with
increased fire frequency in unit II (128-118 cm; ca. AD 1090-1190) and unit IV (93-76 cm; ca. AD 1450-
1620; Figure 5.5). The most prominent peaks of these elements coincide in unit II with macro-charcoal
and MSa+CSa (Figure 5.5). Increased fire frequency data indicate periods during which forest fires
occurred more frequently in the drainage basin of Lake Kalimpaa. Hence, it is assumed that these
disturbance events are a potential cause for the increased supply of organic material into the lake, which
in turn may lead to enhanced TOC, TN and TOC/TN values. A similar pattern showing increased TOC and
charcoal values was found in the sediments from Lago dell’Accesa (Tuscany, Italy; Vannière et al. 2008).
As a result of microbial decomposition of the organic matter, anoxic conditions prevailed at Lake
Kalimpaa and thus, enhanced the formation of black sediment layers which contain high Fe, Mn, P and
S amounts.
As noted, the deposition of MSa+CSa seems to reflect a different process compared to the other grain
size fractions (Table 5.1). Due to the simultaneous occurrence of the most prominent peaks in MSa+CSa
and macro-charcoal (Figure 5.5), the deposition of these coarse materials is interpreted as an input
signal after catchment disturbance (Cerdà and Lasanta 2005) which is likely associated with a forest fire
around ca. AD 1090 (Figure 5.5). Thus, the fire likely facilitated the erosion and deposition of MSa+CSa.

54
Following the first period of inferred increasing fire frequency (ca. AD 1090-1210) changes in the
vegetational composition occurred within the catchment. These alterations are reflected within the
units II and III (123-95 cm; ca. AD 1140-1430) and were characterized by an expansion of Weinmannia
which probably acts as secondary forest species in the Kalimpaa drainage basin (Biagioni et al. 2015a).
In contrast, Weinmannia pollen concentrations remained low after the second period of disturbance
(ca. AD 1460-1620). However, pollen data of fast-growing pioneer species like Macaranga and Mallotus
increased during this period indicating disturbance in the forest (Biagioni et al. 2015a). Weinmannia
increased again in unit VI (47 to 35 cm; ca. AD 1930-1975), when the vegetation cover in the catchment
area was likely disturbed due to the road construction (Figure 5.5).
Considering the macro-charcoal and sedimentological findings from KAL 1-1 and 1-2, at least two
disturbance events occurred in the catchment area that are reflected in units II and IV (ca. AD 1090-
1190; ca. AD 1450-1620). The changes in fire frequencies between ca. AD 1090-1190 and ca. AD 1450-
1620 have affected the geochemical composition of the lacustrine sediments. The alterations within the
catchment during the 20th century are possibly caused by human impact (Haberzettl et al. 2013).
From archaeological and palynological investigations in Central Sulawesi it has been concluded that
anthropogenic impact in the Besoa Valley, ca. 25 km south of Lake Kalimpaa, started ca. 2000 years ago
(Kirleis et al. 2011; Kirleis et al. 2012) when the montane rainforest was replaced by grassland. However,
considerable human modifications of the landscape in the catchment of Lake Kalimpaa are not assumed
before the 20th century.
Natural fires occurring during drought periods seem to be the most likely triggers of the assumed
disturbances in the Kalimpaa drainage basin. Probably drought stress accompanied by increased plant
mortality (McDowell et al. 2008; Zach et al. 2010) fostered the forest fires as it is known from eastern
Borneo during the strong El Niño event from 1997/98 (Siegert and Hoffmann 2000; Van Nieuwstadt and
Sheil 2005), when fires also occurred on Sulawesi (Rowell and Moore 2000; Sastry 2002). Droughts in
Indonesia result from the failure of the monsoon, which often coincides with ENSO warm events
(D’Arrigo et al. 2006). According to Quinn et al. (1978), over 90 % of droughts in Indonesia during the
period from AD 1861 to 1976 are associated with a warm phase of ENSO.
The ca. 800 year-record obtained from Lake Lamongan (Crausbay et al. 2006; Figure 5.1a) reveals two
periods of multidecadal drought from ca. AD 1275-1325 and ca. AD 1450-1650 (Figure 5.7), probably as
a result of ENSO variations. More recent investigations on the timing of droughts in East Java have been
carried out by Rodysill et al. (2013) who use U-series dating and suggest that the onset of the latter
drought at Lake Lamongan was more than 300 years later around ca. AD 1790.
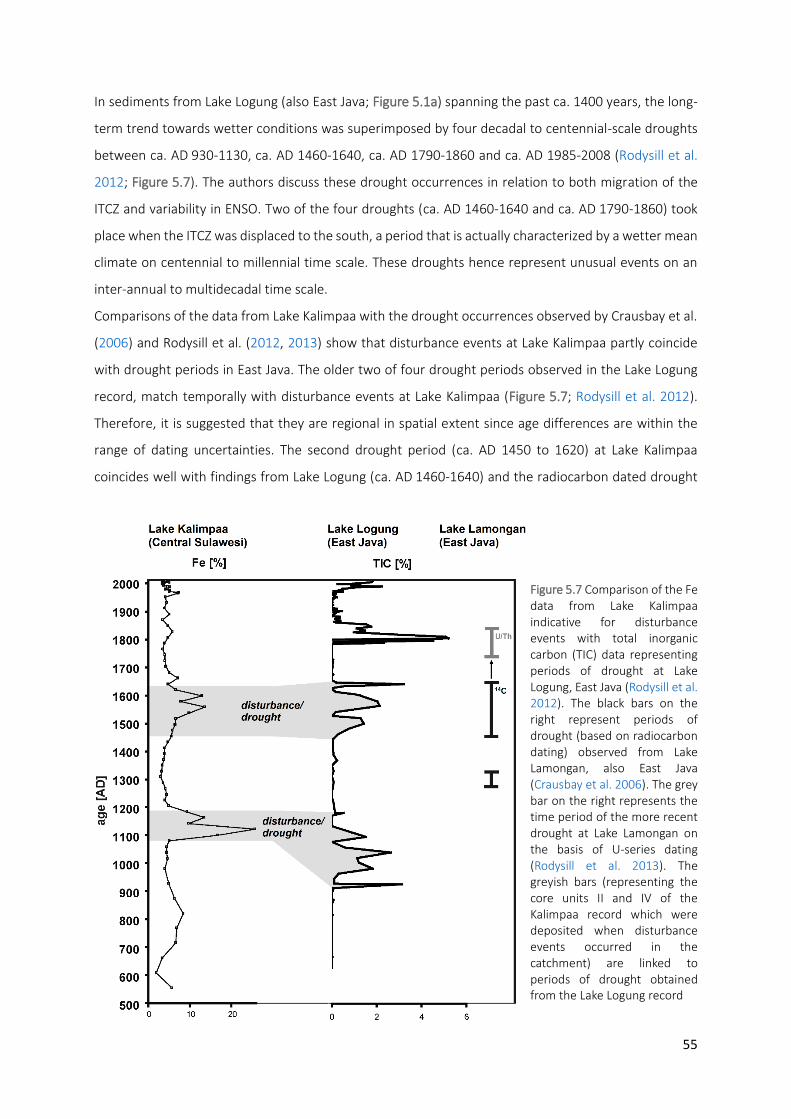
55
In sediments from Lake Logung (also East Java; Figure 5.1a) spanning the past ca. 1400 years, the long-
term trend towards wetter conditions was superimposed by four decadal to centennial-scale droughts
between ca. AD 930-1130, ca. AD 1460-1640, ca. AD 1790-1860 and ca. AD 1985-2008 (Rodysill et al.
2012; Figure 5.7). The authors discuss these drought occurrences in relation to both migration of the
ITCZ and variability in ENSO. Two of the four droughts (ca. AD 1460-1640 and ca. AD 1790-1860) took
place when the ITCZ was displaced to the south, a period that is actually characterized by a wetter mean
climate on centennial to millennial time scale. These droughts hence represent unusual events on an
inter-annual to multidecadal time scale.
Comparisons of the data from Lake Kalimpaa with the drought occurrences observed by Crausbay et al.
(2006) and Rodysill et al. (2012, 2013) show that disturbance events at Lake Kalimpaa partly coincide
with drought periods in East Java. The older two of four drought periods observed in the Lake Logung
record, match temporally with disturbance events at Lake Kalimpaa (Figure 5.7; Rodysill et al. 2012).
Therefore, it is suggested that they are regional in spatial extent since age differences are within the
range of dating uncertainties. The second drought period (ca. AD 1450 to 1620) at Lake Kalimpaa
coincides well with findings from Lake Logung (ca. AD 1460-1640) and the radiocarbon dated drought
Figure 5.7 Comparison of the Fe data from Lake Kalimpaa indicative for disturbance events with total inorganic carbon (TIC) data representing periods of drought at Lake Logung, East Java (Rodysill et al. 2012). The black bars on the right represent periods of drought (based on radiocarbon dating) observed from Lake Lamongan, also East Java (Crausbay et al. 2006). The grey bar on the right represents the time period of the more recent drought at Lake Lamongan on the basis of U-series dating (Rodysill et al. 2013). The greyish bars (representing the core units II and IV of the Kalimpaa record which were deposited when disturbance events occurred in the catchment) are linked to periods of drought obtained from the Lake Logung record

56
at Lake Lamongan (ca. AD 1450-1650; Crausbay et al. 2006), but not with the same drought period
applying U-series dating (Rodysill et al. 2013; Figure 5.7).
These similarities indicate the occurrence of two drought periods that found their expression at least in
Central Sulawesi and East Java during this time. Thus, it seems likely that the long-term trend towards
higher rainfall intensities and possibly higher mean rainfall was superimposed by individual, inter-annual
to multidecadal-scaled drought periods which were likely associated to intense ENSO warm events. The
drought indicated from ca. AD 1450 to 1620 occurred during a period when the ITCZ was displaced to
the south (Sachs et al. 2009) and wetter conditions were prevailing at Lake Kalimpaa on the centennial
to millennial time scale. This may indicate that the movement of the ITCZ is not the main trigger for
inter-annual to multidecadal drought occurrences in Central Sulawesi, but rather the variability of the
Pacific Walker circulation and hence, ENSO.
Conclusions
The Lake Kalimpaa record is one of only a few terrestrial archives from Sulawesi providing information
on palaeoenvironmental and palaeorainfall changes as well as fire history throughout the past ca. 1500
years. The two main conclusions of this study are: a) in Central Sulawesi a long-term trend towards
wetter conditions (higher rainfall intensities and/or mean rainfall) probably occurred on the centennial
to millennial time scale starting from ca. AD 560 to the 20th century with highest rainfall intensities
during the LIA; b) two disturbance events (ca. AD 1090-1190 and ca. AD 1450-1620) caused by forest
fires occurred in the catchment area of Lake Kalimpaa. A comparison with other records exhibits that
the long-term trend towards wetter conditions is associated with migrations of the ITCZ and the
millennial-scale variability of ENSO/Pacific Walker circulation. The disturbance events around Lake
Kalimpaa are probably related to regional droughts affecting at least East Java and Sulawesi. The
occurrence of droughts in Indonesia which can be accompanied by forest fires, are mostly caused by
the failure of the monsoon during ENSO warm events (El Niño years). While a major human impact in
the Kalimpaa catchment cannot be excluded completely before the 20th century, this seems rather
unlikely considering the regional correlation of drought periods at these times.
Acknowledgements
The coring campaign was carried out within the ELUC (Environmental and land-use change in Sulawesi,
Indonesia) subproject which was part of the Collaborative Research Centre SFB 552 “Stability of
Rainforest Margins in Indonesia” (STORMA) project and was funded by the DFG. We would like to thank
Wiebke Kirleis (University of Kiel) for help during field work and Michael Markussen for providing his
report. Particularly acknowledged are the helping hands of Brunhilde Dreßler for the implementation of
the ICP-OES analyses and Benjamin Gutknecht for carrying out the CNS analyses. We thank Carmen

57
Kirchner for supporting the grain size measurements and Jacques Labrie (Institut des Sciences de la Mer
de Rimouski, University of Quebec at Rimouski) for providing the modified version of the Gradistat 4.2
software. Moreover, we would like to acknowledge Tina Trautmann for supporting the XRD
measurements. Michael E. Meadows (University of Cape Town) is thanked for helpful comments on the
manuscript as well as for improving the English language. Finally, we would like to thank to the two
reviewers for their suggestions which helped to improve this contribution distinctively.

58

59
CHAPTER 6 - paper 2
Assessing resilience/sensitivity of tropical mountain rainforests towards climate variability of the last 1500 years: the long-term perspective at Lake Kalimpaa (Sulawesi, Indonesia)
Siria Biagionia, Michael Wündschb, Torsten Haberzettlb, Hermann Behlinga
a Department of Palynology and Climate Dynamics, Albrecht-von-Haller-Institute for Plant Sciences, Georg-August-
University Göttingen, Untere Karspüle 2, 37073 Göttingen, Germany
b Department of Physical Geography, Institute of Geography, Friedrich-Schiller-University Jena, Löbdergraben 32,
07743 Jena, Germany
Keywords
Palynology and palaeoecology, ENSO, ITCZ, Sulawesi, Fagaceae, Tropical mountain rainforest
Review of Palaeobotany and Palynology 213 (2015) 42–53
doi:10.1016/j.revpalbo.2014.11.005
60
Abstract
The tropical montane rainforests of the LLNP in Sulawesi, Indonesia provide many ecosystem services
for the population inhabiting the area and harbour unique biodiversity in a key area for phytogeography.
The mountain regions of Central Sulawesi experience perhumid climate conditions with few seasonal
changes in precipitation, making the vegetation a possible sensitive target for future changes of
precipitation patterns. The ecological consequences are hard to predict due to the lack of knowledge of
the dynamical processes that govern these tropical forests. This research aims to shed light on the long-
term response of the montane vegetation of LLNP to stress caused by climate variability and human
activities in the past. Palynological data are used to reconstruct forest vegetation dynamics and are
compared to centennial time scale data of fire frequencies, palaeorainfall proxies and regional climate
reconstructions to assess the drivers of these changes. Results reveal that the Fagaceae family
dominates the entire recorded period, as they still do today. Fire episodes occurred locally only ten
times in the last 1500 years but two periods were characterized by higher frequencies: between ca. AD
1070 and 1200 and between ca. AD 1450 and 1660. The regional correlation of these events with
periods of drought registered in Java suggests that centennial-scale increases in fire frequencies at Lake
Kalimpaa were consequences of the vegetation being more prone to fire, probably due to more frequent
or more intense El Niño events. In both cases Fagaceae did not decrease, indicating resilience towards
droughts and fires of at least one species of that family. Following the first period of increased fire
frequencies, the vegetation went through a long secondary forest phase lasting about two and a half
centuries (ca. AD 1200-1450). Weinmannia was co-dominant together with Lithocarpus/Castanopsis.
The second period of increased fire frequencies corresponds to a phase when records across the tropics
show that the Intertropical Convergence Zone (ITCZ) was displaced to the south. High effective rainfall
enhanced the growing of swamp taxa like Pandanus around the lake. Human-landscape interactions are
evident only starting from the 20th century (from ca. 1950 to present) with Weinmannia rising probably
due to the logging of emergent Agathis trees and/or landslides caused by the construction of the road
which today passes near the lake. In general, palynological diversity values indicate that within-
landscape diversity (Whittaker’s gamma diversity) decreased when fires increased. Palynological rate of
change and compositional turnover indicate the vegetation communities were more resilient to fire
disturbance during period of high rainfall. A different trend is apparent starting from the second half of
the 20th century, suggesting a change in the dynamical response of the vegetation communities to forest
fires, possibly as a consequence of increasing human activities around the lake. The emergent tree
Agathis, while being more responsive to long-term rainfall variability in the past, did not reestablish
itself following the years of intensive selective logging in the second part of the last century. These
findings improve our knowledge of the long-term ecology of Central Sulawesi, one of the world’s
hotspots of biodiversity.
61
Introduction
At the dawn of the 19th century Indonesia was one of the richest tropical countries in the world in terms
of forest cover and biodiversity (Baas et al. 1990). However, forest cover decreased from estimated 170
million ha around 1900 to 98 million ha by the end of the 20th century. The deforestation process is still
accelerating today, due to extensive logging and conversion of forest to agricultural land (Miettinen et
al. 2011). Aware of the consequences of these rapid changes, national and international efforts to
develop forestry conservation plans started from the 1980s (Wardojo and Masripatin 2002; e.g.
UNESCO Man and Biosphere Programme and Biodiversity Action Plan for Indonesia). These efforts
include strategies aimed at protecting biodiversity and restoring ecosystem services by monitoring
natural forest ecosystems in Indonesia. The Lore Lindu Biosphere Reserve and National Park (LLNP) in
Central Sulawesi is part of the UNESCO Man and Biosphere Programme (MAB) and represents one
example of these national and international management measures aimed to protect both natural
ecosystems and cultural heritage. The protected area of 217982 ha comprises one of the largest
continuous montane rainforests of Sulawesi and shows unique biodiversity (Cannon et al. 2007)
representative of Sulawesi’s key position for biogeographical questions in SE Asia and Malesia (e.g. van
Balgooy 1987; van Welzen et al. 2011). Studies of tree families along altitudinal transects have
highlighted the importance of Fagaceae mainly with the genera Lithocarpus and Castanopsis (Culmsee
et al. 2010). However, developing long-term forest ecosystem management plans is not an easy task.
Apart from encroachment on the forest by population pressure and largely uncontrolled extraction of
forest resources, an additional potential stress factor to consider is climate change.
The main variable of Indonesia's climate is not temperature, which is rather constant throughout the
year, but rainfall (Aldrian et al. 2004). The inter-annual variability of rainfall is influenced by the coupled
ocean-atmosphere phenomenon El Niño-Southern Oscillation (ENSO): during El Niño (La Niña) warm
(cold) phases, Indonesia experiences lower (higher) rainfall than in other years (Philander 1990; Cane
2005). Predictions of changes in ENSO variability are uncertain, as it is not clear how this phenomenon
is related to climate forcing factors and to what extent the increasing anthropogenic greenhouse gas
emission will influence ENSO variability. Climate models predict a wide range of responses of ENSO from
weaker to stronger, from more El Niño-like to more La Niña-like average conditions (e.g. Collins 2005;
van Oldenborgh et al. 2005; Guilyardi 2006; Merryfield 2006). The tropical regions of SE Asia could
experience a shift in precipitation patterns leading to more frequent and/or more severe droughts in
the future (Christensen et al. 2007; Sheffield and Wood 2008). The ecological consequences of these
scenarios for forests of the LLNP are hard to predict. Palaeoecological and palaeoenvironmental studies
in Sulawesi are still rare, but they are important as they show vegetation, fire and climate history and
add to the understanding of vegetation response to climate variability and human disturbance. In
conservation science, palaeoecological data are invaluable for making well-founded predictions on how
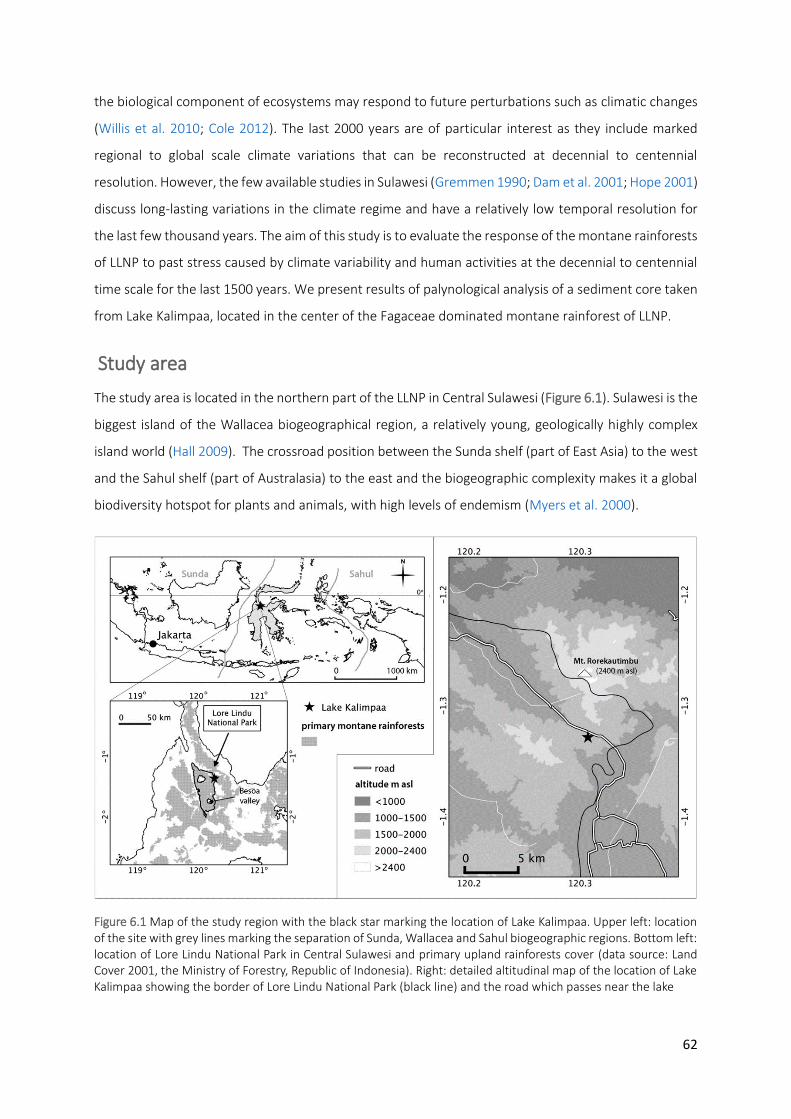
62
the biological component of ecosystems may respond to future perturbations such as climatic changes
(Willis et al. 2010; Cole 2012). The last 2000 years are of particular interest as they include marked
regional to global scale climate variations that can be reconstructed at decennial to centennial
resolution. However, the few available studies in Sulawesi (Gremmen 1990; Dam et al. 2001; Hope 2001)
discuss long-lasting variations in the climate regime and have a relatively low temporal resolution for
the last few thousand years. The aim of this study is to evaluate the response of the montane rainforests
of LLNP to past stress caused by climate variability and human activities at the decennial to centennial
time scale for the last 1500 years. We present results of palynological analysis of a sediment core taken
from Lake Kalimpaa, located in the center of the Fagaceae dominated montane rainforest of LLNP.
Study area
The study area is located in the northern part of the LLNP in Central Sulawesi (Figure 6.1). Sulawesi is the
biggest island of the Wallacea biogeographical region, a relatively young, geologically highly complex
island world (Hall 2009). The crossroad position between the Sunda shelf (part of East Asia) to the west
and the Sahul shelf (part of Australasia) to the east and the biogeographic complexity makes it a global
biodiversity hotspot for plants and animals, with high levels of endemism (Myers et al. 2000).
Figure 6.1 Map of the study region with the black star marking the location of Lake Kalimpaa. Upper left: location of the site with grey lines marking the separation of Sunda, Wallacea and Sahul biogeographic regions. Bottom left: location of Lore Lindu National Park in Central Sulawesi and primary upland rainforests cover (data source: Land Cover 2001, the Ministry of Forestry, Republic of Indonesia). Right: detailed altitudinal map of the location of Lake Kalimpaa showing the border of Lore Lindu National Park (black line) and the road which passes near the lake

63
Lake Kalimpaa (1°19’35’’S, 120°18’32’’E, also known as Lake Tambing) lies at 1660 m asl and was chosen
because of its small catchment and its remote position far from the valleys in the north and south of
LLNP which are more strongly impacted by human activities. The lake has an area of ca. 6.5 ha and a
maximum water depth of 6.6 m and is therefore likely to record local vegetation changes in the past.
About 200 m northeast of the shoreline the main asphalt road through the National Park passes and
separates the lake area from the steeper mountainous area leading up to the peak of Mt. Rorekautimbu
(ca. 2400 m asl). A small inflow reaches the lake mainly through a small swamp forest area in the
northeast, dominated by Pandanus and palm species, and a small outflow is located in the southwest.
Modern vegetation
The rainforests of the LLNP are species-rich tropical forests. Most of the forests are still in good or old-
growth condition and are situated in mountain areas (Cannon et al. 2007). The vegetation gradient
ranges from upper montane rainforest, above 2000 m asl, dominated by conifers and Myrtaceae to lower
montane rainforest between 1000 and 2000 m asl. Tree transect studies along an altitudinal gradient in
the LLNP revealed that Fagaceae, mainly represented by the genera Lithocarpus and Castanopsis, are
important at all elevations but are dominant in the lower montane rainforest between 1200 and 1800
m asl, followed by Myrtaceae, Theaceae, Symplocaceae, Magnoliaceae, Melastomataceae and
Juglandaceae (Culmsee et al. 2011).
Around Lake Kalimpaa, Castanopsis acuminatissima (Fagaceae) was found to be the dominant species,
followed by Bischofia javanica (Phyllanthaceae), Calophyllum soulattri (Clusiaceae), Castanopsis
argentea (Fagaceae), Prunus arborea (Rosaceae) and Ficus sp. (Moraceae) (Febriliani et al. 2013).
Fagaceae play a key role in these forests in terms of aboveground biomass, which maintains a steady
value despite altitudinal changes in forest structure and composition as opposed to the decline of
biomass with increasing elevation usual for non-Fagaceous montane forests. Therefore, the Fagaceae
dominated forest of LLNP is of particular interest in light of climate mitigation initiatives, which aim to
reduce CO2 emissions via forest preservation and restoration (Culmsee et al. 2010). The modern
distribution of Lithocarpus and Castanopsis (Soepadmo 1971) indicates that these two tropical genera
avoid seasonal climates. Their actual presence in Central Sulawesi seems to represent no exception.
Climate
The modern climate of Indonesia is controlled by the seasonal migration of the ITCZ across the equator
and inter-annual changes in ENSO (Figure 6.2). As the ITCZ migrates southward during the austral
summer, the northwest monsoon delivers humid air and heavy rainfall to Indonesia, whereas during
austral winter the southeast monsoon brings relatively cool, dry conditions while the ITCZ is positioned
over mainland Asia (Gunawan 2006). In the montane areas of Central Sulawesi the rainfall is strongly
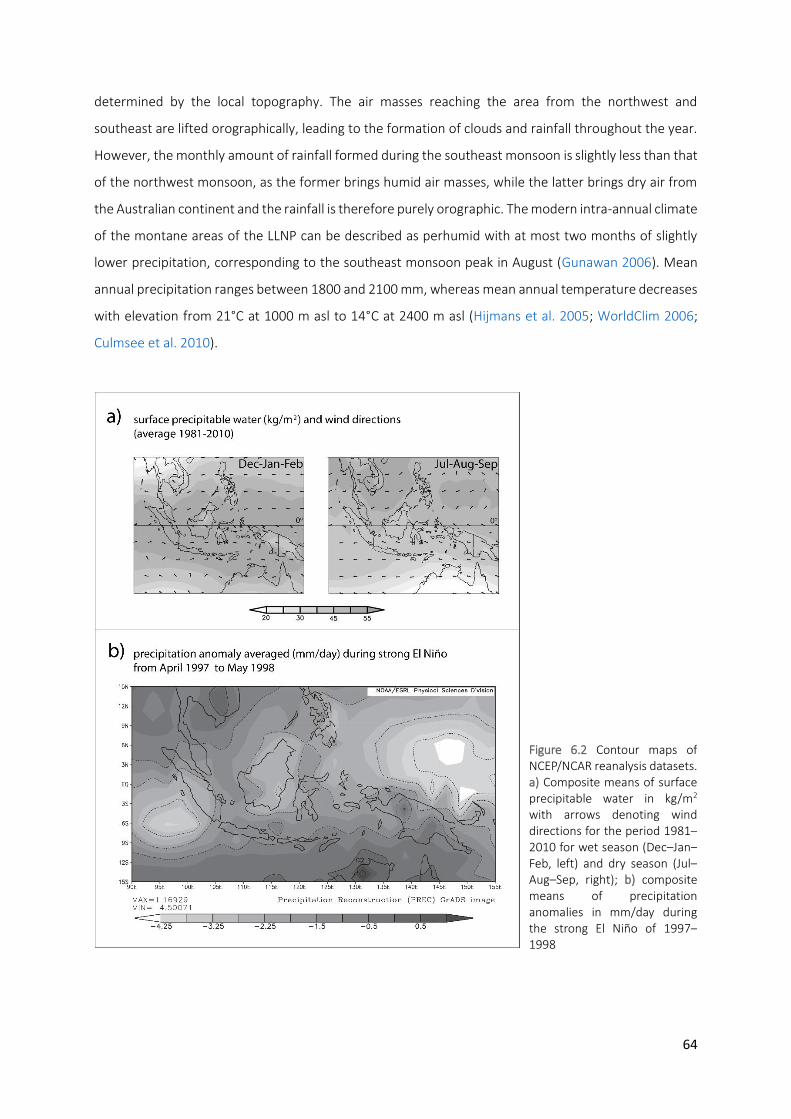
64
determined by the local topography. The air masses reaching the area from the northwest and
southeast are lifted orographically, leading to the formation of clouds and rainfall throughout the year.
However, the monthly amount of rainfall formed during the southeast monsoon is slightly less than that
of the northwest monsoon, as the former brings humid air masses, while the latter brings dry air from
the Australian continent and the rainfall is therefore purely orographic. The modern intra-annual climate
of the montane areas of the LLNP can be described as perhumid with at most two months of slightly
lower precipitation, corresponding to the southeast monsoon peak in August (Gunawan 2006). Mean
annual precipitation ranges between 1800 and 2100 mm, whereas mean annual temperature decreases
with elevation from 21°C at 1000 m asl to 14°C at 2400 m asl (Hijmans et al. 2005; WorldClim 2006;
Culmsee et al. 2010).
Figure 6.2 Contour maps of NCEP/NCAR reanalysis datasets. a) Composite means of surface precipitable water in kg/m2 with arrows denoting wind directions for the period 1981–2010 for wet season (Dec–Jan–Feb, left) and dry season (Jul–Aug–Sep, right); b) composite means of precipitation anomalies in mm/day during the strong El Niño of 1997–1998
65
Human-landscape interactions
Few human activities were attested in the area of Lake Kalimpaa before the nearby road was
constructed from 1970 to 1980. The following decades have seen the intensification of human
disturbance of the forest, which was subjected to logging of Agathis by the company Kebun Sari PT
(Adiwibowo 2005 p.113 and references therein).
Prehistoric evidence of human-landscape interactions in Central Sulawesi are provided by combined
palynological and archeological investigations in the Besoa valley around 40 km from the site of Lake
Kalimpaa. The oldest indication of human impact might derive from the pollen record from the
northeastern part of Besoa valley, which shows that an abrupt change of the vegetation composition
occurred around 2000 years ago. Fagaceae-dominated montane rainforests were replaced by grassland
vegetation and fires increased (Kirleis et al. 2011; Kirleis et al. 2012).
Material and methods
A 211 cm long sediment core was recovered from Lake Kalimpaa in 2006 using a Livingstone piston corer
(Livingstone 1955). At the Department of Palynology and Climate Dynamics, University of Göttingen,
Germany the core was split lengthwise, photographed and described lithologically and then stored in
darkness at 4°C. Due to the complexity of the age-depth modeling of Lake Kalimpaa sediment core, the
chronology here is adapted from Haberzettl et al. (2013, Figure 5.2a) where further details can be found.
Several sets of bulk samples which had been sent for radiocarbon dating were not in stratigraphic order.
A hard water-effect was excluded for Lake Kalimpaa due to the negligible sedimentary calcite contents
(Wündsch et al. 2014). A mixture of allochthonous and autochthonous organic matter was considered
as possible cause for the dating uncertainties. As a consequence, the older ages were considered as too
old and only the youngest ages were used for the age-depth model, which is based on linear
interpolation. The age-depth model was constructed for the first 155 cm, the lowermost reliable date
being at 151 cm sediment depth (Haberzettl et al. 2013). This age-depth model was then corroborated
by magnetostratigraphy. The palaeosecular variation of the Kalimpaa core was compared with the
output of the CALS3k.4 model (Korte and Constable 2011). Both inclination and declination show
isochronic similarities (Figure 5.2b), validating the age-depth model. Therefore, the upper 155 cm of the
core was used for multi-proxy palynological and palaeoenvironmental analyses. The reconstruction of
the palaeoclimatic conditions based on granulometric and geochemical analyses and the local fire
history using macro-charcoal analysis were done on the same sediment core by Wündsch et al. (2014),
see Chapter 5 for details.

66
Palynological analysis
In total 40 sediment subsamples (0.5 cm³) were taken at 4 cm intervals along the core for analyzing
pollen, spores and micro-charcoal particles. The samples were prepared using standard methods (Faegri
et al. 1989) including 70% HF treatment. Before sample processing, the marker Lycopodium clavatum
was added to the samples for the calculation of the concentration. Pollen and spore identification is
based on the reference collection of tropical pollen and spores at the Department of Palynology and
Climate Dynamics at the University of Göttingen, pollen keys and atlases for SE Asia (Flenley 1967;
Powell 1970; Huang 1972; Garrett-Jones 1979; Stevenson 2000) as well as the online Australasian Pollen
and Spore Atlas (APSA) hosted at Palaeoworks, Australian National University, Canberra
(http://apsa.anu.edu.au). Identified pollen grains were counted to a sum of 300, excluding aquatic
pollen. Percentages were calculated relative to the pollen sum. Castanopsis and Lithocarpus were
counted together because pollen grains from these two genera are not distinguishable morphologically.
The concentrations of the Pteridophyta spores were calculated as well in order to isolate the local
climatic signal of this group. Concentrations are expressed in the diagrams as counts per cm3 of
sediment. Pollen taxa are grouped in lower montane, upper montane and herbaceous taxa according
to their altitudinal distribution and ecology (Keßler et al. 2002; Culmsee et al. 2010; Flora Malesiana
collection: http://floramalesiana.org; Prosea collection: http://prosea.nl). For plotting and calculations
the software C2 was used (Juggins 2007).
Micro-charcoal analysis
Micro-charcoal particles were counted on the same 40 slides analyzed for pollen and spores. Only micro-
charcoal particles that were found under a normal light microscope as black and completely opaque
with sharp edges have been considered (10-150 µm). Following Finsinger and Tinner (2005), 200 items
(total of micro-charcoal particles and Lycopodium clavatum spores) were counted and the
concentration per unit of volume was calculated. The 95% confidence intervals of the micro-charcoal
concentrations were calculated using Mosimann’s equation (Maher 1981) to evaluate the errors derived
from the standard deviation of the number of markers in Lycopodium tablets and volumetric sampling,
and thus isolate samples with significant variation in the amount of micro-charcoal.
Numerical analysis
Clustering
Local pollen assemblage zones are defined numerically according to the dissimilarity matrix of Euclidian
distances of squared root transformed percentage data, via constrained cluster analysis using the
software CONISS (Grimm 1987; Grimm 1993). All pollen and spore taxa were included in the analysis.
67
Palynological diversity index (PDI)
From the palynological results palynological diversity indices were estimated via ‘rarefaction analysis’
(Siegel 1986) which is the calculation of the expected number of taxa E(Tn), in a random sample of n
individuals from a smaller population of N individuals containing T taxa (Birks and Line 1992). The small
size of Lake Kalimpaa indicates that it collects a large portion of pollen from the near surroundings and
the PDI is probably close to Whittaker’s gamma diversity/within-landscape diversity or at least within
pollen-source diversity (Whittaker 1977; Odgaard 2007). Rarefaction was calculated with the software
PAST (Hammer et al. 2001).
Palynological compositional change (PCC) or compositional turnover
Detrended canonical correspondence analysis (DCCA) was used to determine the amount of
palynological compositional change or compositional turnover using age as the external constraint (Birks
2007; Birks and Birks 2008). Results were scaled in standard deviation (SD) units of compositional
turnover (= beta diversity or diversity between habitats or communities within a landscape: Hill and
Gauch 1980). Changes in palynological composition were estimated by looking at the range of sample
scores on the first, time-constrained DCCA axis. Larger variation in the sample scores within the
sequence implies greater compositional turnover between time-constrained samples. All pollen and
spores were included in the analysis. Percentages were transformed to square roots to stabilize
variances, rare taxa were not down-weighted, detrending was by segments and non-linear scaling was
applied. The DCCA was implemented using CANOCO 5 (ter Braak and Smilauer 2002).
Rate of Change (ROC) or velocity
A linear interpolation of pollen and spore percentages was done to provide a time series of equal time
intervals of 10 years. Time steps were then computed by dividing the chord distance of adjacent
subsamples by the time interval in calibrated years (AD). The analysis used the distances computed from
square root transformed pollen and spore percentages data. A LOWESS smoother (span=0.3) has been
fitted to the plot to highlight the major trends in the estimates. The analysis was performed by MULTIV
software (http://ecoqua.ecologia.ufrgs.br/ecoqua/MULTIV.html).
Results
Stratigraphy of the Lake Kalimpaa core
The Lake Kalimpaa profile consists of laminated silt-clay sediments with organic matter. The laminae are
irregularly distributed and they are characterized by alternating darker and lighter bands. Between 153
cm and 128 cm (ca. AD 560–1090) the sediments are finely laminated blackish grey and light grey silts.
From 128 cm to 118 cm (ca. AD 1090–1190) sediments are homogeneous black composed of fine silts

68
to fine sandy coarse silts. From 118 cm to 93 cm (ca. AD 1190–1450) the sediments are finely laminated,
with light greyish to grey layers consisting of medium to fine sandy coarse silts. Partially laminated, dark
brown to black fine sandy coarse silts occur from 93 cm to 77 cm (ca. AD 1450-1620). The sediments
from 77 cm to 48 cm (ca. AD 1620–1910) exhibit a greyish color and contain partially laminated, fine
sandy coarse silts with an intercalated sand layer. The top of the core consists of partially laminated
brownish medium to fine sandy silts (Wündsch et al. 2014).
Chronology
According to the age-depth model (Haberzettl et al. 2013; Figure 5.2a), the first 155 cm of the Lake
Kalimpaa core represents the past 1500 years. A marked increase in sedimentation rate characterizes
the most recent sediments. While the mean sedimentation rate between 151 and 44 cm is about 0.8
mm year-1, for the youngest sediments from 44 cm to the top of the core, the age-depth model provides
a sedimentation rate of ca. 9.2 mm year-1 on average. A single pollen grain of Pinus was identified at 30
cm depth. Pinus was only recently introduced in Central Sulawesi during a restoring campaign which
started in 1960-70 in three different locations near the study site (Tamandue, east Napu valley;
Bolapapu-Boya and Nano, Kulawi valley). Therefore, the presence of Pinus confirms that the first 30 cm
of the Lake Kalimpaa core records the past 30-40 years.
Palynological and micro-charcoal results
The pollen diagram shows the most important pollen and spore taxa (Figure 6.3) out of the 121 different
types which were identified 122 rare types are still unknown. Based on the constrained cluster analysis
the diagram is divided into 7 pollen and spore assemblage zones from Kal-I to Kal-VII. Zone
characteristics are summarized in Table 6.1. Throughout the whole record the pollen assemblage
reflects the lower montane rainforest tree taxa, represented mainly by Lithocarpus/Castanopsis (21-
43%), Weinmannia (1-32%), Euphorbiaceae (1-14%), Clethra (up to 11%), Elaeocarpaceae (up to 4%)
and Myrtaceae (up to 4%). Swamp taxa are also well represented by Pandanus (up to 14%). Fern spores
are highly diverse (66 morphological types) and abundant (up to 18%). Only few taxa are restricted to
the upper montane vegetation: Phyllocladus, Ericaceae, Chlorantaceae and Myricaceae (Culmsee et al.
2011). Pollen concentration ranges between ca. 14x103 and 273x103 grains cm-3 (mean 97x103 grains
cm-3) with the exception of an unusual high value at 43 cm sediment depth (680x103 grains cm-3).
Micro-charcoal particles show constantly high values along the studied core but only one peak at 143
cm (ca. AD 820) is statistically significant.
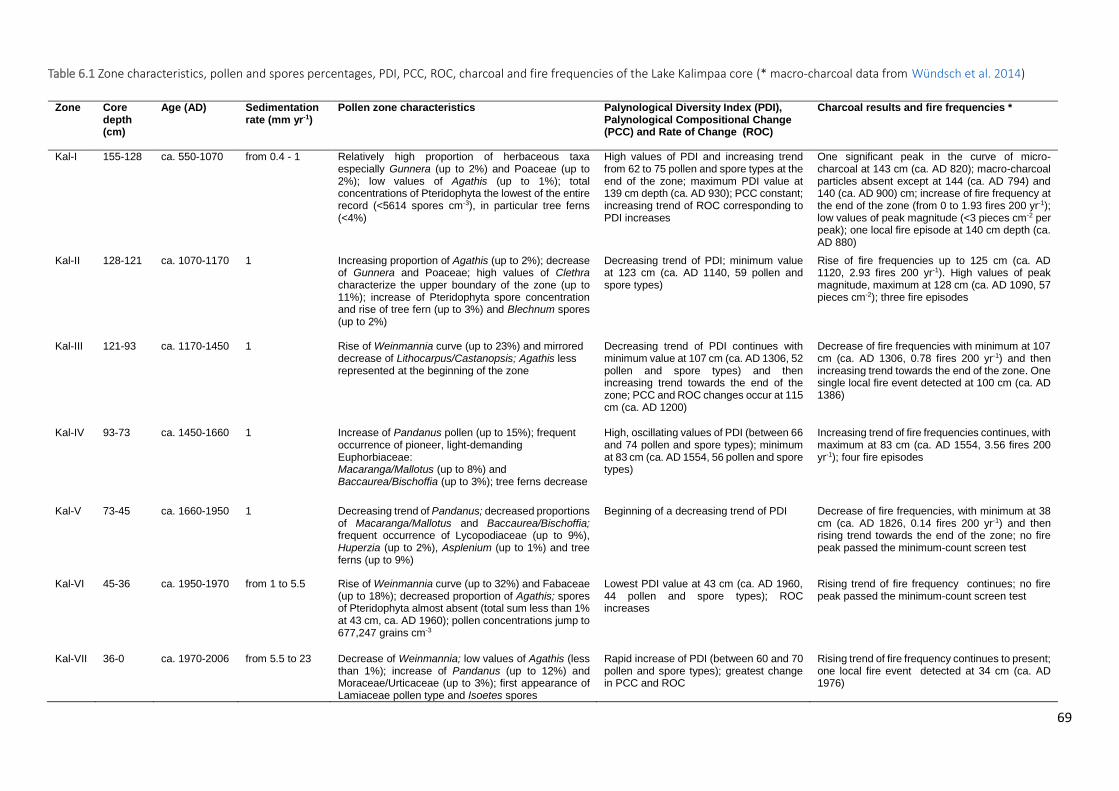
69
Zone Core depth (cm)
Age (AD) Sedimentation rate (mm yr-1)
Pollen zone characteristics Palynological Diversity Index (PDI), Palynological Compositional Change (PCC) and Rate of Change (ROC)
Charcoal results and fire frequencies *
Kal-I 155-128 ca. 550-1070 from 0.4 - 1 Relatively high proportion of herbaceous taxa especially Gunnera (up to 2%) and Poaceae (up to 2%); low values of Agathis (up to 1%); total concentrations of Pteridophyta the lowest of the entire record (<5614 spores cm-3), in particular tree ferns (<4%)
High values of PDI and increasing trend from 62 to 75 pollen and spore types at the end of the zone; maximum PDI value at 139 cm depth (ca. AD 930); PCC constant; increasing trend of ROC corresponding to PDI increases
One significant peak in the curve of micro-charcoal at 143 cm (ca. AD 820); macro-charcoal particles absent except at 144 (ca. AD 794) and 140 (ca. AD 900) cm; increase of fire frequency at the end of the zone (from 0 to 1.93 fires 200 yr-1); low values of peak magnitude (<3 pieces cm-2 per peak); one local fire episode at 140 cm depth (ca. AD 880)
Kal-II 128-121 ca. 1070-1170 1 Increasing proportion of Agathis (up to 2%); decrease of Gunnera and Poaceae; high values of Clethra characterize the upper boundary of the zone (up to 11%); increase of Pteridophyta spore concentration and rise of tree fern (up to 3%) and Blechnum spores (up to 2%)
Decreasing trend of PDI; minimum value at 123 cm (ca. AD 1140, 59 pollen and spore types)
Rise of fire frequencies up to 125 cm (ca. AD 1120, 2.93 fires 200 yr-1). High values of peak magnitude, maximum at 128 cm (ca. AD 1090, 57 pieces cm-2); three fire episodes
Kal-III 121-93 ca. 1170-1450 1 Rise of Weinmannia curve (up to 23%) and mirrored decrease of Lithocarpus/Castanopsis; Agathis less represented at the beginning of the zone
Decreasing trend of PDI continues with minimum value at 107 cm (ca. AD 1306, 52 pollen and spore types) and then increasing trend towards the end of the zone; PCC and ROC changes occur at 115 cm (ca. AD 1200)
Decrease of fire frequencies with minimum at 107 cm (ca. AD 1306, 0.78 fires 200 yr-1) and then increasing trend towards the end of the zone. One single local fire event detected at 100 cm (ca. AD 1386)
Kal-IV 93-73 ca. 1450-1660 1 Increase of Pandanus pollen (up to 15%); frequent occurrence of pioneer, light-demanding Euphorbiaceae: Macaranga/Mallotus (up to 8%) and Baccaurea/Bischoffia (up to 3%); tree ferns decrease
High, oscillating values of PDI (between 66 and 74 pollen and spore types); minimum at 83 cm (ca. AD 1554, 56 pollen and spore types)
Increasing trend of fire frequencies continues, with maximum at 83 cm (ca. AD 1554, 3.56 fires 200 yr-1); four fire episodes
Kal-V 73-45 ca. 1660-1950 1 Decreasing trend of Pandanus; decreased proportions of Macaranga/Mallotus and Baccaurea/Bischoffia; frequent occurrence of Lycopodiaceae (up to 9%), Huperzia (up to 2%), Asplenium (up to 1%) and tree ferns (up to 9%)
Beginning of a decreasing trend of PDI Decrease of fire frequencies, with minimum at 38 cm (ca. AD 1826, 0.14 fires 200 yr-1) and then rising trend towards the end of the zone; no fire peak passed the minimum-count screen test
Kal-VI 45-36 ca. 1950-1970 from 1 to 5.5 Rise of Weinmannia curve (up to 32%) and Fabaceae (up to 18%); decreased proportion of Agathis; spores of Pteridophyta almost absent (total sum less than 1% at 43 cm, ca. AD 1960); pollen concentrations jump to 677,247 grains cm-3
Lowest PDI value at 43 cm (ca. AD 1960, 44 pollen and spore types); ROC increases
Rising trend of fire frequency continues; no fire peak passed the minimum-count screen test
Kal-VII 36-0 ca. 1970-2006 from 5.5 to 23 Decrease of Weinmannia; low values of Agathis (less than 1%); increase of Pandanus (up to 12%) and Moraceae/Urticaceae (up to 3%); first appearance of Lamiaceae pollen type and Isoetes spores
Rapid increase of PDI (between 60 and 70 pollen and spore types); greatest change in PCC and ROC
Rising trend of fire frequency continues to present; one local fire event detected at 34 cm (ca. AD 1976)
Table 6.1 Zone characteristics, pollen and spores percentages, PDI, PCC, ROC, charcoal and fire frequencies of the Lake Kalimpaa core (* macro-charcoal data from Wündsch et al. 2014)
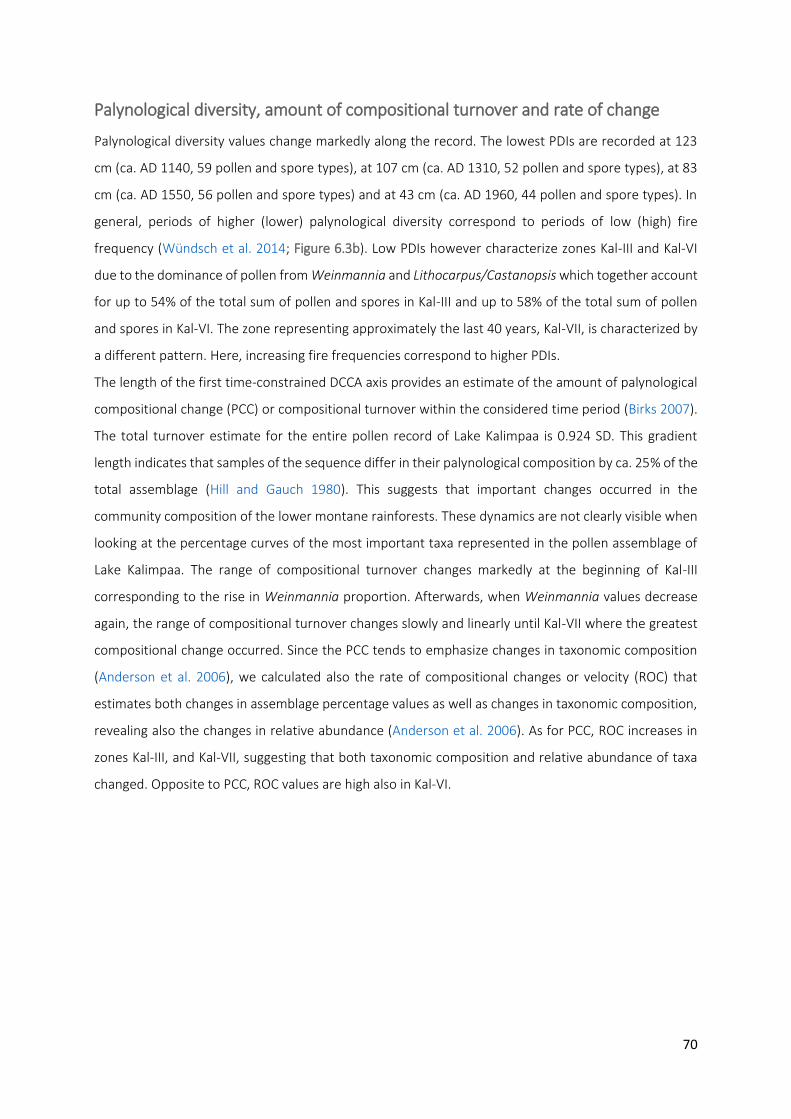
70
Palynological diversity, amount of compositional turnover and rate of change
Palynological diversity values change markedly along the record. The lowest PDIs are recorded at 123
cm (ca. AD 1140, 59 pollen and spore types), at 107 cm (ca. AD 1310, 52 pollen and spore types), at 83
cm (ca. AD 1550, 56 pollen and spore types) and at 43 cm (ca. AD 1960, 44 pollen and spore types). In
general, periods of higher (lower) palynological diversity correspond to periods of low (high) fire
frequency (Wündsch et al. 2014; Figure 6.3b). Low PDIs however characterize zones Kal-III and Kal-VI
due to the dominance of pollen from Weinmannia and Lithocarpus/Castanopsis which together account
for up to 54% of the total sum of pollen and spores in Kal-III and up to 58% of the total sum of pollen
and spores in Kal-VI. The zone representing approximately the last 40 years, Kal-VII, is characterized by
a different pattern. Here, increasing fire frequencies correspond to higher PDIs.
The length of the first time-constrained DCCA axis provides an estimate of the amount of palynological
compositional change (PCC) or compositional turnover within the considered time period (Birks 2007).
The total turnover estimate for the entire pollen record of Lake Kalimpaa is 0.924 SD. This gradient
length indicates that samples of the sequence differ in their palynological composition by ca. 25% of the
total assemblage (Hill and Gauch 1980). This suggests that important changes occurred in the
community composition of the lower montane rainforests. These dynamics are not clearly visible when
looking at the percentage curves of the most important taxa represented in the pollen assemblage of
Lake Kalimpaa. The range of compositional turnover changes markedly at the beginning of Kal-III
corresponding to the rise in Weinmannia proportion. Afterwards, when Weinmannia values decrease
again, the range of compositional turnover changes slowly and linearly until Kal-VII where the greatest
compositional change occurred. Since the PCC tends to emphasize changes in taxonomic composition
(Anderson et al. 2006), we calculated also the rate of compositional changes or velocity (ROC) that
estimates both changes in assemblage percentage values as well as changes in taxonomic composition,
revealing also the changes in relative abundance (Anderson et al. 2006). As for PCC, ROC increases in
zones Kal-III, and Kal-VII, suggesting that both taxonomic composition and relative abundance of taxa
changed. Opposite to PCC, ROC values are high also in Kal-VI.
71
Figure 6.3 Summary diagram from Lake Kalimpaa showing the lithological table and: a) more common and significant pollen taxa (expressed in percentages of total pollen sum); b) more common spore taxa (percentages of total sum), total pollen and Pteridophyta concentrations (pollen-spore cm−3), micro charcoal concentrations. Macro-charcoal concentrations (particles cm−3), fire peaks which passed the “Poisson minimum-count” screening represented with + symbols and the grey circles representing the peaks which did not pass the screening and fire frequencies (per 200 yr) (from: Wündsch et al. 2014), palynological diversity index (PDI based on sum of 300), palynological compositional change or turnover (PCC in standard deviation units) and rate of change per 10 years (ROC, in black: 0.3 lowess smooth, in grey: raw data). Grey bars on micro-charcoal and PDI values represent 0.95 confidence intervals. Outline curves showing an exaggeration of 3× to highlight variations of the taxa
72
Interpretation and discussion
For the interpretation of possible drivers, the change in pollen assemblage zones is compared with
palaeoclimatic and fire history reconstructions based on macro-charcoal, grain size and geochemical
investigations on sediment samples of the Lake Kalimpaa core as interpreted by Wündsch et al. (2014)
as well as other regional records of palaeoclimate (Figure 6.3 and Figure 6.4 and Chapter 5).
Palaeoclimatic evidence from continental Asia, Africa and the Americas (e.g. Haug et al. 2001; Tierney
and Russell 2007; Tierney et al. 2010) suggests that the ITCZ mean position has changed during the past
millennium, leading to a substantial rearrangement of rainfall patterns across the tropical and
subtropical regions of the world. Superimposed onto the latitudinal movements of the ITCZ is the
decade- to century-scale rainfall variability caused by changes in amplitude and frequency of the ENSO
phenomenon. El Niño phases are associated with cooler sea surface temperatures (SSTs) in the West
Pacific Warm Pool (WPWP) region and warmer SSTs in the central and eastern Pacific, which drive
anomalous easterly winds across the equatorial Pacific and Indonesia and weaken the Walker circulation
and vertical convection over the WPWP. The anomalous easterlies prevail into austral summer, delaying
the arrival of the northwest monsoon causing droughts in SE Asia (Cane 2005).
The analysis of palaeorainfall and fire proxies on the Lake Kalimpaa core, revealed a trend from ca. AD
560 to the 20th century of increasing rainfall intensities associated with a southern migration of the ITCZ.
Additionally, two disturbance events (ca. AD 1090-1190 and ca. AD 1450-1620) caused by forest fires
occurred in the catchment area of Lake Kalimpaa. The authors interpreted these events associated with
increased fire frequency around Lake Kalimpaa as probably related to regional droughts affecting at
least East Java and Sulawesi (Wündsch et al. 2014; Figure 6.4).
Vegetation composition and fires
Pollen and spore analyses of the sediment core from Lake Kalimpaa illustrate the dynamics of the lower
montane rainforest during the past 1500 years. If Phyllocladus pollen grains are excluded, the sum of
taxa restricted to the upper montane rainforest never reaches 3% (mean value 1%). Therefore, the Lake
Kalimpaa pollen record reflects local vegetation of the lower montane rainforest, with little influence
from long-distance transported pollen from upper montane vegetation. The pollen assemblage reveals
that Fagaceae (Lithocarpus/Castanopsis) dominated the vegetation surrounding the lake for the entire
period recorded, together with Cunoniaceae, Euphorbiaceae, Clethraceae, Elaeocarpaceae, Myrtaceae,
Pandanaceae and Pteridophyta. In the background of the Fagaceae-dominated pollen spectrum,
changes in certain local taxa indicate a dynamic response of the forest to climate variability. The lack of
correlation between micro-charcoal concentrations and local fire frequencies confirms that the former
were transported from long distances, probably from lower altitudes, as macro-charcoal analysis of a
73
sediment core taken at Mt. Rorekautimbu (ca. 2400 m asl) indicates that the upper montane mossy
forests were free of fires for at least the last 9000 years (Biagioni data unpublished).
Long-term palaeoecology and drivers of change
From ca. AD 550 to 1070 (zone Kal-I) values of tree ferns, represented by species of Cyatheaceae and
Dicksoniaceae were low. In the lower montane rainforest of the LLNP most tree fern species are slow
growth forest species occurring only in rather shady forest and do not tolerate strong seasonality (de
Winter and Amoroso 2003). Additionally, drier conditions might be inferred by the low presence of
Agathis, a very large emergent tree, which is confined to regions with rainfall well distributed over the
year (de Laubenfels 1986). Small openings in the forest might be indicated by the frequent occurrence
of herbaceous species, in particular Poaceae and Gunnera. Pollen-based vegetation reconstruction at
Lake Kalimpaa suggests that the climate was drier from ca. AD 550 to 1070. This is confirmed by run off
proxies which are related to palaeorainfall such as grain size and geochemical element ratios of the
sediment of the Kalimpaa core (Wündsch et al. 2014, Figure 6.4).
The rising trend in palynological diversity index (PDI) observed from ca. AD 900 to 1070 corresponds to
increasing mean average rainfall as indicated by run off proxies (Wündsch et al. 2014, Figure 6.4). This
suggests that rainfall was a limiting growth factor for certain taxa (for example Agathis and tree ferns),
reducing within-landscape diversity (gamma diversity). A gradual increase in the rate of change curve
(ROC) is also observed for this period, while the range of the palynological compositional change or
turnover (PCC) remained constant confirming that changes occurred within the vegetation communities
and no marked changes in taxonomic composition occurred.
Natural fires started by lightning or spontaneous combustion occur in SE Asian rainforests but usually
do not completely destroy the forest and merely cause the death of a few trees (Mueller-Dombois and
Goldammer 1990; Flenley and Butler 2001). However, if lightning occurs during a period of frequent or
longer than normal droughts the rainforests become more susceptible to fire and the frequency of fire
episodes increases. The low frequency of local fire episodes from AD 550 to 1070 might indicate that
the vegetation composition around Lake Kalimpaa was less prone to fire during this period and thus
long periods of drought were not common despite permanent drier than average conditions. An
exception is recorded at ca. AD 800-900 when regional and local fires were more common, as indicated
by both micro- and macro-charcoals.
From ca. AD 1070 to 1170 (zone Kal-II) a change in the frequency of fire episodes occurred towards more
frequent fires per 200 yr. Long-term disturbance can be inferred from the increase of pollen of Clethra,
a genus of light-demanding trees which tend to remain sterile in dense forest and only flower at forest
borders and in more open vegetation. The maximum of Blechnum might be the consequence of
frequent fires as some species of Blechnum are colonizers after fire disturbances and can re-sprout from

74
trunks after fire. Increasing fire frequencies in Lake Kalimpaa suggest that longer and or more frequent
droughts occurred during this century. Furthermore, grain size data of the Lake Kalimpaa sediment core
show high variability of sand and clay at 136-118 cm, ca. AD 1010 to 1190, suggesting that the rainfall
regime was characterized by alternating intensive rain and dry periods (Wündsch et al. 2014). The
geochemical composition of the lacustrine sediments also shows variation as a consequence of
disturbance around the lake. Fe and S markedly increased as a result of enhanced supply of organic
Figure 6.4 a) Locations of the sites mentioned in the text; b) comparison of palynological diversity index (PDI), palynological compositional change or turnover (PCC), rate of change (ROC), selected % pollen taxa (Fagaceae, Weinmannia and Macaranga/Mallotus)with % of clay grain size, % of Fe, number of fire episodes per 200 years of Lake Kalimpaa sediment core (Wündsch et al. 2014) and total inorganic carbon (%, TIC) from Lake Logung, Java, as drought indicator (Rodysill et al. 2012), δD value of leaf waxes from the Makassar Strait cores 31MC and 34GGC (3 point moving average of raw data) interpreted to represent rainfall amount changes as a consequence of the ITCZ mean position changes (Tierney et al. 2010). In black: 0.3 lowess smooth, in grey: raw data. Grey areas underline the correlation of disturbance events and regional droughts as discussed in the text and interpreted by Wündsch et al. (2014)
75
material into the lake which promotes reducing conditions in the sediment due to its microbial
decomposition (Wündsch et al. 2014).
Results from a sediment core from the megalithic Pokekea complex in the Besoa Valley (Kirleis et al.
2011; Kirleis et al. 2012), about 40 km south of Lake Kalimpaa, show that the sediment composition
changed from lacustrine to peaty between ca. AD 710 and 1280 and the pollen concentrations decrease
due to hydrological variations. This indicates an aridification of the floodplain area and may have been
caused by either human impact or drought (Kirleis et al. 2011). Similar to Lake Kalimpaa, leaf wax δD
data from Makassar Strait (Tierney et al. 2010) and geochemical data from East Java (Rodysill et al.
2012), record droughts during this period. The regional correlation suggests that the increased number
of fire episodes at Lake Kalimpaa were not caused by human activities but more likely were
consequences of natural fires resulting from more frequent and/or longer droughts. Droughts in
Indonesia result from the failure of the monsoon, which often coincides with El Niño warm events (Cane
2005).
The change in fire regime was accompanied by decreasing PDIs. However, Lithocarpus/Castanopsis did
not decrease during this period, indicating that at least one species of Fagaceae was not affected by the
increase in fire episodes.
During the following three centuries, from ca. AD 1170 to 1450 (Kal-III), the greatest change in
composition occurred as indicated by PCC. At the beginning of the zone (from ca. AD 1170 to 1300) fire
frequencies were very low. However, drier climate conditions can be inferred from the relatively low
abundance of Agathis and high (low) values of clay (sand) (Wündsch et al. 2014). This might be related
to a more northerly position of the ITCZ and the corresponding weakening of the northwest monsoon
over Indonesia (Tierney et al. 2010). This is consistent with records from SE Asia and mainland Asia which
suggest that the ITCZ reached its northernmost extent between AD 900 and 1100, shifted southward
and reached its southernmost extent between AD 1420 and 1640, and then began to shift northward
again between ca. AD 1700 and 1800 (Wang et al. 2005; Zhang et al. 2008; Sachs et al. 2009). A more
northerly position of the ITCZ would have shifted the tropical rain belt away from Indonesia on a mean
annual basis and could have resulted in a longer dry season in the montane areas of Central Sulawesi
compared to today’s annual conditions. In contrast, a southward migration of the ITCZ would have
strengthened the northwest monsoon, causing wetter conditions with rainfall more evenly distributed
over the year.
At the same time, PDIs decreased and ROC increased as a consequence of the rise of the Weinmannia
proportion. The co-dominance of Weinmannia trees in the lower montane rainforests surrounding Lake
Kalimpaa might represent a secondary forest phase following the previous hundred years of more
intense fire disturbance and the onset of drier/more seasonal conditions. Pioneer species like
Macaranga/Mallotus are little represented in this period, possibly due to their faster replacement in
76
the forest. Weinmannia species can act as pioneers but also grow into tall canopy trees (unlike
Macaranga and Mallotus). Therefore, they are more adapted in terms of competition for space with
other canopy trees and can be considered late succession secondary forest trees or ‘long-lived pioneer’
trees (Lusk 1999). Little information is available about this genus in the montane vegetation of the LLNP.
However, Febriliani et al. (2013) reported Weinmannia descombesiana as one of the common species
found as seedling in the understory around Lake Kalimpaa and Weinmannia descombesiana has been
observed growing along roads and disturbed patches of forest (Brambach, personal communication).
Starting from ca. AD 1300 Agathis increased, pointing to increasing average rainfall consistent with the
southward migration of the ITCZ, while Weinmannia slowly decreased.
From ca. AD 1450 to 1660 (Kal-IV) a major change in fire regime towards more frequent fire episodes
occurred. Increasing fire frequencies suggest longer or more frequent periods of drought. Similarly,
multidecadal- to centennial-scale droughts are recorded in Lake Logung (Rodysill et al. 2012, Figure 6.4)
and Lake Lamongan (Crausbay et al. 2006) in Java. In contrast, the increasing presence of Pandanus, a
small tree nowadays locally abundant in swamp depressions around the lake, indicates that, on average
and in normal conditions, rainfall was high during this period. The ITCZ reached its southernmost
position during this period, when archives across Indonesia record the wettest conditions for the last
2000 years. A confirmation that higher rainfall characterized the central Sulawesi area during this period
comes also from the sediment of the Pokeka site core where the growth of peat indicates a hydrological
change towards wetter conditions (Kirleis et al. 2011). Cooler SSTs are inferred from foraminifera from
Makassar Strait marine cores (Newton et al. 2006; Oppo et al. 2009). Modeling experiments show that
if there was a cooling over the entire tropics, the Pacific would change more strongly in the west than
in the east, where strong upwelling holds the temperature closer to pre-existing values. Hence, the east-
west temperature gradient would weaken, leading to a more El Niño-like state (Cane 2005). The
persistence of a high rainfall regime on the centennial to millennial time scale, superimposed onto
decadal scale periods of drought, might explain the apparently contradictory abundance of swamps and
more frequent fire episodes. Disturbance of the area around the lake is also underlined again by
increased Fe and S in the Lake Kalimpaa sediment core (Wündsch et al. 2014). Fast-growing, light-
demanding pioneer trees like Macaranga/Mallotus and Baccaurea/Bischoffia increased while
Lithocarpus/Castanopsis show no variation. Both PCC and ROC remained on the ranges of the previous
zone, suggesting that vegetation communities did not change markedly. Diversity was high, probably
due to the presence of pioneer and fire tolerant taxa. However, an exceptionally low PDI value
characterized the 16th century while, at the same time, fire frequencies were supposedly very high.
The following centuries from ca. AD 1660 to 1950 (Kal-V) were characterized by an unclear mixture of
climate and disturbance indicators. Initially, fire frequencies decreased and fast-growing pioneer species
like Macaranga/Mallotus decreased. The increased presence of Lycopodiaceae and Asplenium might
77
indicate either wetter conditions or fast colonization after disturbance. However, from the second half
of the 19th century a decreasing trend in PDI is apparent while at the same time fire frequencies
increased and Pandanus decreased.
Two decades of intense disturbance around Lake Kalimpaa are clearly recorded during the last century
(ca. AD 1950-1970, Kal-VI). The pollen concentration increased notably, while spores of Pteridophyta
almost disappeared during that period. Spores of ferns are relatively heavy and are usually transported
over short distances by water. The absence of fern spores point towards an interruption of water inflow
from rivers and/or small streams into the lake, while the increase of long-distance transported pollen
grains such as Phyllocladus indicates that the deposition of allochthonous materials increased. From the
1960s to the beginning of the 1980s the logging company Kebun Sari was active in the surrounding area.
The road, which today enables access to the mountain areas surrounding Lake Kalimpaa, was
constructed in this period. It is possible that the construction works changed the course of an influent
stream, temporarily blocking the inflow into the lake while sediment deposition increased as a
consequence of higher erosion caused by the activities of the company in the area. Kebun Sari’s main
target was the valuable wood of Agathis. The logging of these trees is reflected in the pollen diagram by
the decrease of Agathis percentages. A second phase of high frequencies of Weinmannia in this period
might confirm the role of at least one Weinmannia species as a secondary forest tree, as indicated by
the relative synchronicity between the disturbance event and the rise of Weinmannia during this period.
After the disturbance around the lake ended, the forest quickly recovered its former state, as indicated
by the decrease of Weinmannia. The exceptionally low PDI value and high ROC might be partly artifacts
due to the dominance of Weinmannia and the absence of most of the Pteridophyta spores from the
pollen assemblage.
During the last decades, from ca. 1970 to present (Kal-VII), the record indicates that a highly diverse
lower montane rainforest surrounded Lake Kalimpaa, as shown by the high values of PDI. The greatest
change in PCC and ROC occurred in this period. For the first time in 1500 years, increasing fire
frequencies correspond to higher diversity. This suggests a change in the dynamical response of the
vegetation communities after disturbance occurred, possibly as a consequence of increasing human
activities around the lake. However, changes in PDI, PCC and ROC values might be a consequence of the
high sediment accumulation rate that characterized the uppermost 30 cm of the Lake Kalimpaa core
(Haberzettl et al. 2013). The percentage of Agathis pollen did not return to the values shown before the
Kebun Sari logging activities started in the second half of the 20th century.
Conclusions
Pollen, spore, and charcoal records from Lake Kalimpaa reveal the long-term response of the Fagaceae-
dominated montane rainforest towards climate variability and human disturbance for the past 1500

78
years. The pollen results show the resilience of the Fagaceae towards the decennial to centennial scale
climate variability of the past 1500 years. However, the vegetation seems to be more prone to fires
during long periods of drought despite the annual ever-wet conditions and high rainfall regime. The
combination of decreasing average rainfall, long-term fire and human disturbances increased the
chance for at least one species of Weinmannia to become common in open patches of the lower
montane forest of the LLNP. However, the system was more resilient to fire disturbance when average
rainfall was higher.
Important human manipulation of the landscape is only visible starting from the 20th century with
changes in sedimentary processes as well as vegetation composition.
While the long-term results suggest that these ecosystems have shown resilience to natural climate
disturbances in the past, the more recent anthropogenic disturbances have changed the dynamical
response of the vegetation communities to climatic disturbance events.
Acknowledgments
Research was carried out as part of the project ELUC ‘‘Environmental and land-use change in Sulawesi,
Indonesia’’ at Göttingen University and was funded by the German Research Foundation (DFG) BE
2116/22-1. We gratefully acknowledge logistic support from the ELUC coordination team and the
Indonesian partner universities in Bogor and Palu, Institut Pertanian Bogor (IPB) and Universitas Tadulako
(UNTAD), the Ministry of Education in Jakarta (DIKTI), the Indonesian Institute of Sciences (LIPI) and the
authorities of LLNP. Wiebke Kirleis is thanked for the support in field work. We thank Fabian Brambach
for the invaluable discussions on ecology, biogeography and vegetation dynamics of the LLNP rainforests.
We would like to thank Petra Lembcke for improving the English text of the manuscript. Finally, the
authors would like to thank two anonymous reviewers for their valuable comments and suggestions to
improve the manuscript.

79
CHAPTER 7 - paper 3
Unravelling the past 1000 years of history of human–climate–landscape interactions at the Lindu plain, Sulawesi, Indonesia
Siria Biagionia, Torsten Haberzettlb, Liang-Chi Wangc, Guillaume St-Onged, Hermann Behlinga
a Department of Palynology and Climate Dynamics, Albrecht-von-Haller-Institute for Plant Sciences, Georg-August-
University Göttingen, Untere Karspüle 2, 37073 Göttingen, Germany
b Physical Geography, Institute of Geography, Friedrich-Schiller-University Jena, Löbdergraben 32, 07743 Jena,
Germany
c Collection Management Department, National Taiwan Museum, Taipei 100, Taiwan
d Institut des sciences de la mer de Rimouski (ISMER), Université du Québec à Rimouski and GEOTOP Research
Centre, 310, allée des Ursulines, Rimouski, Québec, G5L 3A1, Canada
Keywords
Palynology, Charcoal, Diatoms, Lore Lindu National Park, Megaliths, Magnetostratigraphy
Vegetation History and Archaobotany 25 (2016) 1–17
doi:10.1007/s00334-015-0523-1
80
Abstract
The Lindu plain, located in the northern mountainous region of the LLNP in Sulawesi, Indonesia, provides
many ecosystem services for the population inhabiting the area and harbours a unique biodiversity.
Palynological, charcoal and diatom analyses of a lake sediment core from Lake Lindu (Danau Lindu)
reveal that during the last 1000 years the Lindu plain has been modified by human activities. Evidence
of frequent burning and possible shifting cultivation from an earlier phase from ca. AD 1000 to 1200
might be related to the metal age population which erected the megaliths in the province of Central
Sulawesi. From ca. AD 1200–1700 there followed 500 years of wetter climate conditions, corresponding
to the southward movement of the Intertropical Convergence Zone. At the same time, decreases of
macro-charcoal concentrations and pioneer vegetation indicators show that the use of the landscape
of Lindu plain had become more permanent. Following a phase of forest recovery from ca. AD 1730 to
1910, the most recent part of the Lake Lindu record shows a trend towards deforestation that started
in the late 20th century, lasting until now. The lake level started to fall at the beginning of the 20th
century, as shown by the increase of sedimentation rate and supported by low pollen concentration
and palaeomagnetic data. Such a change was unprecedented for the last 1000 years covered by the
record, and it has no link to the climate variability as reconstructed for the last hundred years. If
deforestation increases and a larger amount of water is channeled away from the lake for irrigation
purposes, the lake level will continue to fall. This suggests that there is a need for better management
of the forests surrounding the plain and of the irrigation systems in the area open for cultivation.
Introduction
Present-day tropical montane rainforests in the area of the LLNP in the province of Central Sulawesi,
Indonesia, are rich in biodiversity and an important source of ecosystem services for the local population
inhabiting the area. The montane rainforests within the LLNP, a UNESCO Man and Biosphere reserve
since 1977, are mostly untouched old-growth forests (Cannon et al. 2007). However, during the last
three decades, a growing population and political and economic initiatives have increased the pressure
on previously relatively isolated communities, leading to conflicts for land and the opening up of further
forested areas for agriculture (Acciaioli 2001). Within the context of sustainable management of
conservation areas and agro-landscapes, palaeoecological and palaeoenvironmental studies provide a
valuable contribution by showing how the vegetation and the environment have changed as a
consequence of long-term climate variability and human-landscape interactions. In order to understand

81
the present and future landscape dynamics, it is important to have a historical perspective when
analyzing the effects of environmental changes caused by human activities. However, little is known
about the prehistory and history of the LLNP.
Megaliths found in the area of the park indicate that well-organized human societies have been present
there for at least the last 2000 years. Closer investigations have only been conducted in the Besoa valley
in the southern part of the park (Figure 7.1), where pollen analysis has revealed that the valley has been
deforested for 2000 years (Kirleis et al. 2011; Kirleis et al. 2012).
Figure 7.1 a) Map of the study region showing the location of the Lake Lindu sediment core (star). Upper left location of the Lore Lindu National Park (LLNP, dark grey) in Central Sulawesi (light grey); upper right location of the Lindu plain, Bada, Besoa and Napu valleys, borders of the LLNP and other places mentioned in the text; bottom locations of the villages of the Lindu plain and the coring site. Data source, Land Cover 2011, the Ministry of Forestry, the Republic of Indonesia (http://appgis.dephut.go.id/appgis/download.aspx); b) upper photo view of the Langko village and grassland on the southwestern shore of the Lindu lake in 1902 (from Sarasin and Sarasin 1905). Bottom photo; view of the alang-alang (Imperata cylindrica) grassland from the village of Puroo in 2012, photo by S. Biagioni; c) example of charred leaf remain from grass found at 120 cm (ca. AD 1100) and details of dumb-bell silica body
82
Isolated from the valley to the north and south, the present-day economy of the four villages on the
shore of Lake Lindu, Anca, Tomado, Langko and Puroo, is based on the trading of rice cultivated in the
plains surrounding the lake and fish caught in the lake itself. Little is known of the prehistory of the Lindu
plain where megaliths are also found.
We present the results of a multi-proxy palaeoenvironmental study of a 123 cm long sediment core
taken from Lake Lindu (1°19’16’’S, 120°04’36’’E at 960 m asl.), spanning the past ca. 1000 years.
Palynological, charcoal and diatom data are used to reconstruct the vegetation and fire history of the
Lindu plain, as well as the history of eutrophication of the lake. The aim is to characterize the timing and
intensity of human activities during prehistoric and historic times. Results from the Lindu sediment core
will shed light on the history of human-landscape interactions on the Lindu plain, a well-known fish
reserve, and contribute to the understanding of the complex but still poorly known history of Central
Sulawesi.
Study area
The Lindu valley is located in the highlands of Central Sulawesi and has an area of ca. 1000 km2 in the
Takoekadju mountain range. In the northwest portion of the valley lies Lake Lindu, an ancient
permanent freshwater lake, which is 10 km in length and 5-6 km in width (Figure 7.1a). Small streams
originating from the surrounding mountains drain into the lake. At the north-eastern corner, the river
Sungai Rawa is the only outlet and it flows northwards to join a tributary to the Palu valley (Sudomo et
al. 1990). High mountain peaks and steep topography within a short distance characterize the area, as
the result of the uplift that started in the Pliocene, following the juxtaposition of the east and north
arms of Sulawesi (Moss and Wilson 1998). At an altitude of ca. 960 m asl, the lake basin covers an area
of 32 km2. It is the eighth largest lake in Sulawesi and the largest water body within the area of the LLNP.
The Lindu plain is the only large wetland habitat in the National Park.
Climate and vegetation
Central Sulawesi is characterized by high humidity and temperatures. Mean annual precipitation ranges
between 1800 and 2100 mm, and mean annual temperature decreases with elevation from 21 °C at
1000 m to 14 °C at 2400 m (Hijmans et al. 2005; WorldClim 2006; Culmsee et al. 2010). The modern
climate of Indonesia is controlled by the seasonal movement of the Intertropical Convergence Zone
(ITCZ) across the equator and inter-annual changes in the phase of the El Niño Southern Oscillation
(ENSO) (Gunawan 2006). As the ITCZ moves southwards during the austral summer, the northwest
monsoon delivers humid air and heavy rainfall to Indonesia, while during the austral winter the
southeast monsoon brings relatively cool, dry conditions when the ITCZ is positioned over mainland
Asia. According to Gunawan (2006), in the montane areas of Central Sulawesi, the rainfall is strongly
83
determined by the local topography. The air masses reaching the area from the northwest and
southeast are lifted orographically, leading to the formation of clouds and rainfall throughout the year.
As a consequence, the monthly amount of rainfall during the dry southeast monsoon is only slightly less
than that of the wet northwest monsoon. The modern intra-annual climate of the montane areas of the
LLNP can be described as perhumid with at most two months of slightly lower precipitation,
corresponding to the southeast monsoon peak in August (Gunawan 2006). The inter-annual variability
of rainfall is influenced by the coupled ocean-atmosphere phenomenon ENSO: during El Niño (La Niña)
warm (cold) phases, Indonesia experiences lower (higher) rainfall than in other years (Philander 1990;
Cane 2005). When El Niño occurs, the Lake Lindu catchment has experienced yearly low water and mean
discharge despite the high retention capacity (Leemhuis and Gerold 2006), negatively affecting the fish
population and the fishing market established by the local villages (Acciaioli 2000).
The eastern, northern and northwest corners of the lake are covered with low-lying areas of marshy
grassland. These open swamps are used by the local population for cultivating rice and grazing cattle.
The mountain areas surrounding the lake are dominated by lower montane vegetation, in which the
dominant tree families are Lauraceae, Fagaceae, Sapotaceae, Moraceae and Euphorbiaceae (Culmsee
and Pitopang 2009). The higher peaks range from 2000 to 2400 m asl are covered with upper montane
vegetation, in which Podocarpaceae, Myrtaceae and Fagaceae are the dominant tree families (Culmsee
et al. 2011).
Prehistory and history of Central Sulawesi (Table 7.1)
Central Sulawesi is rich in metal age megaliths, large worked stones in the shape of cylindrical vats,
statues, urns and mortars (Kaudern 1938; Sukendar 1976; Bellwood 1979; Sukendar 1980a; Sukendar
1980b; Kirleis et al. 2012). The majority are located in the Napu, Besoa and Bada valleys, but megaliths
are also found on the Lindu plain. The absolute age of the megaliths has not been determined with
precision, but archaeological estimates range from 3000 BC to AD 1300. At the Pokekea site in the Besoa
valley Kirleis et al. established a terminus ante quem for the erection of the large stone vats called
kalambas of ca. AD 830 (Figure 7.1a; Kirleis et al. 2011; Kirleis et al. 2012). The authors further suggested
a link between the opening of the forest in the valley when continuing burning started from ca. 2000
years ago and the early construction phase of the monuments. The relationship between the megalithic
culture and the indigenous people who live around the park today remains open to speculation. It seems
likely that Proto-Malay and Palaeo-Mongoloid people migrated into the area, but much more research
is needed in order to answer this fundamental question about the megaliths and their creators.
The first Europeans who visited Central Sulawesi were the Portuguese in the middle of the 16th century,
followed by the Spanish, who arrived via the Philippines. They never settled in large numbers, but their
influence is still visible. They introduced maize, tomato, chili peppers and horses (Davis 1976).

84
Phases Time Central Sulawesi Lindu plain
Pre
-co
lon
ial
per
iod
5000 to 700 years ago (?)
Metal age population inhabits Central Sulawesi and builds a large number of megaliths
Megaliths also found on the plain
16th century Portuguese and Spanish visit Central Sulawesi, introduction of maize, tomato, chili pepper and horses
Du
tch
co
lon
ial p
erio
d
1605 Dutch East Indian company (DEI) in Palu
1648 Central Sulawesi comes under the rule of the Dutch East India company, but stays as a liege under the sultanate of Ternate (Moluku)
1668 The Dutch conquer Makassar, Bugis flee from Makassar to Central Sulawesi
17th cent. Palu becomes an important sea trade harbour, the interior of the island remains isolated
Lindu plain inhabited by an ethnic group named after Lindu
1710 Central Sulawesi comes under the rule of Makassar (South Sulawesi)
1891 Christianization of the Poso region (Central Sulawesi) Remote mountain populations of western Central Sulawesi including the Lindu plain, remained relatively isolated
End of 19th cent. First Europeans in the area, south of Palu
1905 Start of direct impact on the cultural landscape Sarasin brothers visit Lindu plain and report of fishing traps, horses and lowering lake level
1930 Discovery of schistosomiasis, the Dutch colonial administration maintained a policy of isolating the lake
Jap
anes
e ru
le a
nd
ind
epen
den
ce
1942 End of the Dutch rule and start of the Japanese colonial rule
1945 Independence of Indonesia, Dutch wars of re-conquest
1949 Final admission of independence
1950s Bugis start fish market and clove gardens and open new areas for wet rice plantations
1970s-80s Lore Lindu National Park Declaration of Lore Lindu National Park led to increased migration to the Lindu plain
A more important impact was the arrival of the Dutch, who opened up the areas in the lowlands starting
from the 17th century. Before the Dutch arrival, there was little wetland rice growing, and agriculture
activities were mostly focused on upland dryland rice, maize, and tubers grown under a shifting system.
Population density in Central Sulawesi was very low. The small communities were ruled by kings and
were relatively isolated from each other, and they were mainly located in the surrounding mountains,
with no permanent settlements existing at that time (Kreisel et al. 2004). In contrast to the inhabitants
of the Poso region, methods of wet rice cultivation were already well known to the inhabitants of
western Central Sulawesi before the arrival of the Dutch, as reported by Valentyn (1724).
Today, the Central Sulawesi region is ethnically and culturally heterogeneous and comprises 15
indigenous groups, speaking 24 distinct languages. However, most of the people living today around the
National Park are recent arrivals, or their descendants. The majority moved into the area as participants
Table 7.1 Overview of prehistory and history of Central Sulawesi and Lindu plain, as discussed in the text
85
in the government’s transmigration programs which were at a peak in the 1970-80s, and as a result of
conflicts elsewhere (Kreisel et al. 2004).
History of the Lindu plain
According to Kaudern (1925), the Lindu plain has been inhabited since at least the 17th century by an
ethnic group known by the same name. Accounts of the land-use strategies of the indigenous groups
which lived in the area are derived mostly from reports by Dutch missionaries, in particular Albert
Christian Kruyt and Nicolaus Adriani. They explored the mountainous regions in the first half of the 20th
century following the Dutch Christianization mission, which began in 1891. The activities of the
missionaries were centered in the eastern part of Central Sulawesi and particularly in the region around
the river Poso, while the remote mountain populations of Central Sulawesi, including the Lindu plain,
remained relatively isolated. This is probably due to the discovery on the Lindu plain in the 1930s of
infestations of the snails that harbour the blood flukes causing schistosomiasis (Clarke et al. 1974).
Indeed, according to Acciaoli (1989), the Dutch colonial administration maintained a policy of isolating
the region after the initial attempts in the 1910s and 1920s to improve wet rice cultivation. After Kruyt
and Adriani, the next Europeans to visit the Lindu plain were the Sarasin brothers, two natural scientists,
who mapped the watercourses from Palu to Palopo (Sarasin and Sarasin 1905).
The first people who started the exploitation of the resources of the Lindu plain were of Bugis origin
from South Sulawesi, in the late 1960s. They first migrated into the area after the Kahar Muzakkar
regional rebellion in the 1950s. They expanded the local economy by selling fresh and salted fish and
starting the transport of fish from the lake by horse cart. Their arrival marked the opening up of new
areas for wet rice cultivation, and clove gardens were established near the shore line (Weber et al.
2003). Soon after the establishment of the Lore Lindu protected area in the late 1970s, the government
granted a special status for the Lindu plain. A buffer zone was established in the surrounding forest to
allow the Lindu villagers to maintain their fields and to have access to forest products. As a consequence,
migration to the Lindu plain increased in the 1980s when arable land in Central Sulawesi became scarce
following the establishment of the LLNP (Kreisel et al. 2004).
Material and methods
A 123 cm long sediment core (LINDU_3) was recovered from Lake Lindu in 2006 using a Kajak corer
(Renberg 1991) at a water depth of 46.5 m. The core was split into two halves and transported to the
Department of Palynology and Climate Dynamics, University of Göttingen, Germany, where it was
photographed and described lithologically and then stored in darkness at 4°C.
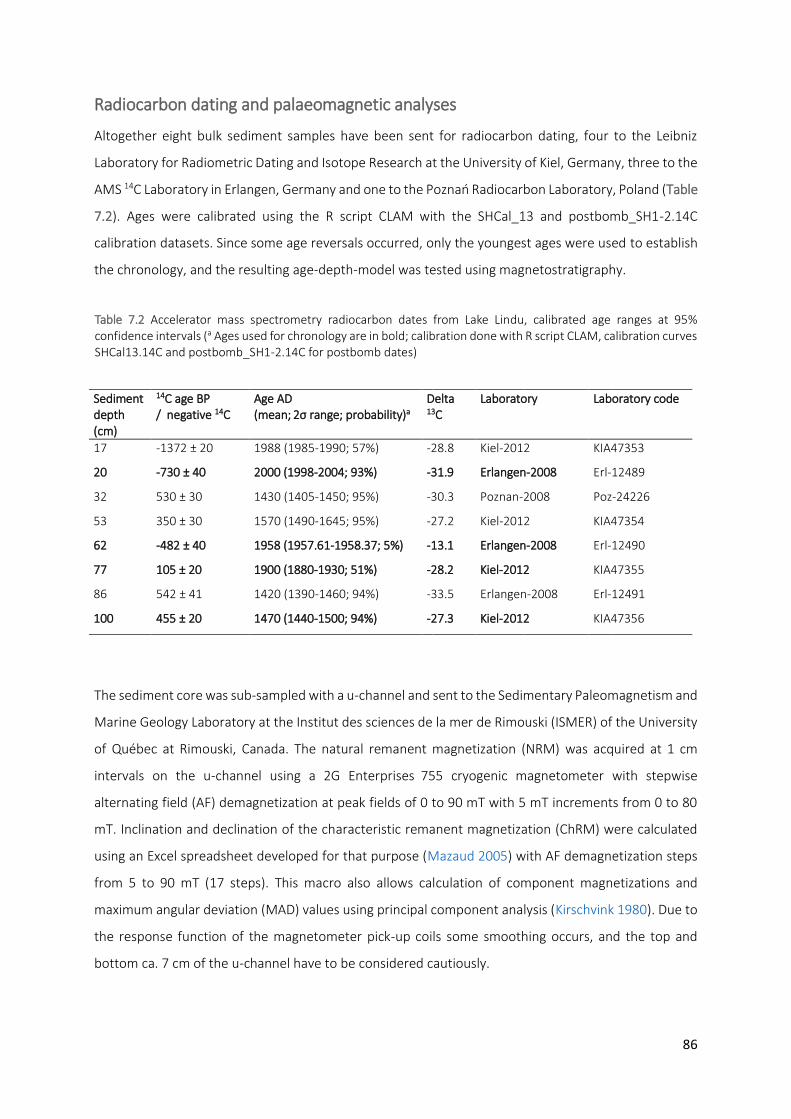
86
Radiocarbon dating and palaeomagnetic analyses
Altogether eight bulk sediment samples have been sent for radiocarbon dating, four to the Leibniz
Laboratory for Radiometric Dating and Isotope Research at the University of Kiel, Germany, three to the
AMS 14C Laboratory in Erlangen, Germany and one to the Poznań Radiocarbon Laboratory, Poland (Table
7.2). Ages were calibrated using the R script CLAM with the SHCal_13 and postbomb_SH1-2.14C
calibration datasets. Since some age reversals occurred, only the youngest ages were used to establish
the chronology, and the resulting age-depth-model was tested using magnetostratigraphy.
Sediment depth (cm)
14C age BP / negative 14C
Age AD
(mean; 2σ range; probability)a Delta 13C
Laboratory Laboratory code
17 -1372 ± 20 1988 (1985-1990; 57%) -28.8 Kiel-2012 KIA47353
20 -730 ± 40 2000 (1998-2004; 93%) -31.9 Erlangen-2008 Erl-12489
32 530 ± 30 1430 (1405-1450; 95%) -30.3 Poznan-2008 Poz-24226
53 350 ± 30 1570 (1490-1645; 95%) -27.2 Kiel-2012 KIA47354
62 -482 ± 40 1958 (1957.61-1958.37; 5%) -13.1 Erlangen-2008 Erl-12490
77 105 ± 20 1900 (1880-1930; 51%) -28.2 Kiel-2012 KIA47355
86 542 ± 41 1420 (1390-1460; 94%) -33.5 Erlangen-2008 Erl-12491
100 455 ± 20 1470 (1440-1500; 94%) -27.3 Kiel-2012 KIA47356
The sediment core was sub-sampled with a u-channel and sent to the Sedimentary Paleomagnetism and
Marine Geology Laboratory at the Institut des sciences de la mer de Rimouski (ISMER) of the University
of Québec at Rimouski, Canada. The natural remanent magnetization (NRM) was acquired at 1 cm
intervals on the u-channel using a 2G Enterprises 755 cryogenic magnetometer with stepwise
alternating field (AF) demagnetization at peak fields of 0 to 90 mT with 5 mT increments from 0 to 80
mT. Inclination and declination of the characteristic remanent magnetization (ChRM) were calculated
using an Excel spreadsheet developed for that purpose (Mazaud 2005) with AF demagnetization steps
from 5 to 90 mT (17 steps). This macro also allows calculation of component magnetizations and
maximum angular deviation (MAD) values using principal component analysis (Kirschvink 1980). Due to
the response function of the magnetometer pick-up coils some smoothing occurs, and the top and
bottom ca. 7 cm of the u-channel have to be considered cautiously.
Table 7.2 Accelerator mass spectrometry radiocarbon dates from Lake Lindu, calibrated age ranges at 95% confidence intervals (a Ages used for chronology are in bold; calibration done with R script CLAM, calibration curves SHCal13.14C and postbomb_SH1-2.14C for postbomb dates)
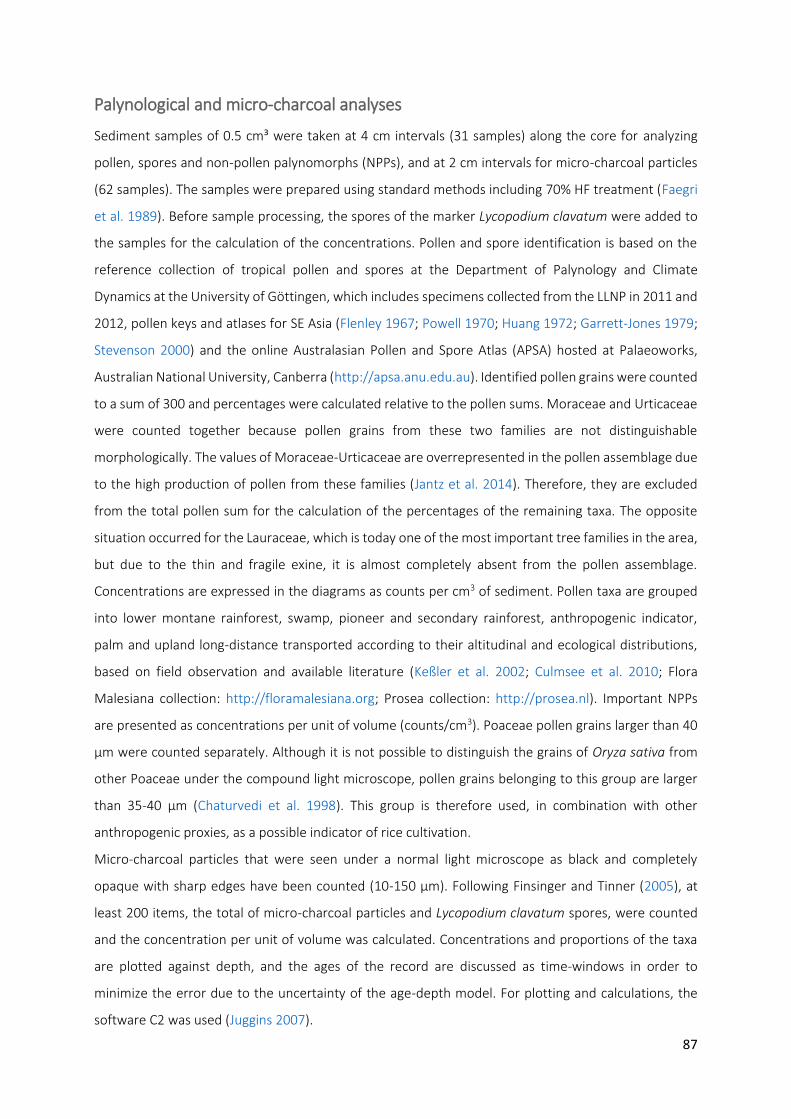
87
Palynological and micro-charcoal analyses
Sediment samples of 0.5 cm³ were taken at 4 cm intervals (31 samples) along the core for analyzing
pollen, spores and non-pollen palynomorphs (NPPs), and at 2 cm intervals for micro-charcoal particles
(62 samples). The samples were prepared using standard methods including 70% HF treatment (Faegri
et al. 1989). Before sample processing, the spores of the marker Lycopodium clavatum were added to
the samples for the calculation of the concentrations. Pollen and spore identification is based on the
reference collection of tropical pollen and spores at the Department of Palynology and Climate
Dynamics at the University of Göttingen, which includes specimens collected from the LLNP in 2011 and
2012, pollen keys and atlases for SE Asia (Flenley 1967; Powell 1970; Huang 1972; Garrett-Jones 1979;
Stevenson 2000) and the online Australasian Pollen and Spore Atlas (APSA) hosted at Palaeoworks,
Australian National University, Canberra (http://apsa.anu.edu.au). Identified pollen grains were counted
to a sum of 300 and percentages were calculated relative to the pollen sums. Moraceae and Urticaceae
were counted together because pollen grains from these two families are not distinguishable
morphologically. The values of Moraceae-Urticaceae are overrepresented in the pollen assemblage due
to the high production of pollen from these families (Jantz et al. 2014). Therefore, they are excluded
from the total pollen sum for the calculation of the percentages of the remaining taxa. The opposite
situation occurred for the Lauraceae, which is today one of the most important tree families in the area,
but due to the thin and fragile exine, it is almost completely absent from the pollen assemblage.
Concentrations are expressed in the diagrams as counts per cm3 of sediment. Pollen taxa are grouped
into lower montane rainforest, swamp, pioneer and secondary rainforest, anthropogenic indicator,
palm and upland long-distance transported according to their altitudinal and ecological distributions,
based on field observation and available literature (Keßler et al. 2002; Culmsee et al. 2010; Flora
Malesiana collection: http://floramalesiana.org; Prosea collection: http://prosea.nl). Important NPPs
are presented as concentrations per unit of volume (counts/cm3). Poaceae pollen grains larger than 40
µm were counted separately. Although it is not possible to distinguish the grains of Oryza sativa from
other Poaceae under the compound light microscope, pollen grains belonging to this group are larger
than 35-40 µm (Chaturvedi et al. 1998). This group is therefore used, in combination with other
anthropogenic proxies, as a possible indicator of rice cultivation.
Micro-charcoal particles that were seen under a normal light microscope as black and completely
opaque with sharp edges have been counted (10-150 µm). Following Finsinger and Tinner (2005), at
least 200 items, the total of micro-charcoal particles and Lycopodium clavatum spores, were counted
and the concentration per unit of volume was calculated. Concentrations and proportions of the taxa
are plotted against depth, and the ages of the record are discussed as time-windows in order to
minimize the error due to the uncertainty of the age-depth model. For plotting and calculations, the
software C2 was used (Juggins 2007).
88
Macro-charcoal analysis
Macro-charcoal particles (>150 µm) were counted in samples which were evenly spaced at 1 cm
intervals along the sediment core (123 samples). The samples, of 2 cm3 each, were prepared following
the methods of Stevenson and Haberle (2005) and Rhodes (1998). Weak hydrogen peroxide (6 % H2O2)
was used to partially digest and bleach organic material in the sediment samples when counted under
a binocular dissecting microscope. The sample preparation procedure aimed to ensure that little particle
fragmentation occurred during preparation. Results are expressed as the number of charred particles
per cm³.
Diatom analysis
Sediment samples for diatom analysis were prepared according to standard methods at 2 cm intervals
(62 samples) (Wang et al. 2013). 0.5 cm3 sediment samples were treated with 30 % H2O2 and mounted
using mounting media with a high refractive index (Mountmedia, Wako). At least 300 diatom valves
were counted for each sample using an optical microscope with 1000× magnification. The diatom taxa
were identified on the basis of reference collections and literature (Krammer and Lange-Bertalot 1986;
Wang et al. 2010).
Numerical analysis
Local pollen assemblage zones were defined numerically by constrained cluster analysis using the
software CONISS (Grimm 1987; Grimm 1993). The dissimilarity matrix was calculated as Cavalli-Sforza’s
chord distances of squared root transformed percentage data. All pollen and spore taxa were included
in the analysis. Unconstrained multivariate statistical analysis was done to characterize the changes in
vegetation composition of the past 1000 years using the software CANOCO 5 (ter Braak and Šmilauer
2002). The length of the compositional taxa gradient had a value of only 1.2 standard deviation (SD)
units, so a linear model was chosen and a principal component analysis (PCA) was carried out with all
identified pollen and spore percentage data. Data were centered and square root transformed to
downscale the weight of a few dominant taxa.
Results
Lithology and chronology
Sediment core LINDU_3 consisted entirely of sediments with laminations that measured in millimeters.
From 123-78, 62-36 and 6-0 cm sediment depths dark blackish colors predominated. Intercalated were
light brown to whitish colors between 78-62 cm and whitish colors between 36-6 cm.
89
As the sediment-water interface was intact, the top of the record represents the year of coring, 2006.
According to a linear extrapolation of the lowermost accepted ages, the base of the Lake Lindu record
has an age of AD 1030. Since the radiocarbon dating results were rather heterogeneous and had a
number of age reversals, only the youngest ages were linearly interpolated (Table 7.2; Figure 7.2a). Such
results for radiocarbon dating seem to be rather common on the island of Sulawesi, where dating has
turned out to be a challenge in many sediment archives (Haberzettl et al. 2013).
Palynological results
In total, 209 different pollen taxa were encountered, of which 77 rare taxa remain unidentified. The
most representative lower montane forest taxa in the pollen assemblage belong to the Moraceae and
Urticaceae families (average 38 %; min 10 %, max 50 %) (Figure 7.3). The next most representative taxa
of lower montane rainforest are Fagaceae, mostly represented by Lithocarpus-Castanopsis (average
20%; min 9%, max 36%, percentages based on a total pollen sum excluding Moraceae-Urticaceae),
Acalypha (average 6%, up to 17%), Peperomia (average 6%; min 2%, max 13%), Myrtaceae (average 3%,
up to 9%), Engelhardtia (average3 %, up to 9%), Elaeocarpaceae (average 2%, up to 5%), Ilex (average
Figure 7.2 a) Chronology of the Lake Lindu sediment record as well as inclination (inc), the natural remanent magnetization (NRM) and maximum angular deviation values (MAD); b) comparison of the Lake Lindu inclination record to that from Lake Kalimpaa (Haberzettl et al. 2013) and the CALS3 K.4e (Korte and Constable 2011) model output calculated for the location of the sediment core from Lake Lindu
90
2%, up to 5%), Celtis (average 2%, up to 6%), Myrica (average 1%, up to 5%) and Freycinetia (average
1%, up to 4%). All these taxa together account for 53% of the pollen sum on average. The group of
swamp plants is represented mostly by Typha (up to 4%) and Callitriche (average 2%, up to 8%). Pioneer
and secondary forest taxa are represented mostly by Macaranga (average 4%, up to 11%), Trema
(average 2%, up to 8%) and Neonauclea pollen (average 2%, up to 5%). Anthropogenic indicators are
represented mostly by Poaceae (average 13%, up to 20%), Mimosoideae (up to 4%) and Plantago (up
to 0.8%). Palms are little represented (average 1%, up to 6%). Upper montane pollen taxa are rare and
mostly represented by Phyllocladus (average 1%, up to 4%). Pteridophyta spores are abundant and
diverse (average of the total sum of pollen plus spores 29%, min 12%, max 45%, total number of taxa
81), although most of the taxa remain unidentified.
Pollen concentration values are high at the bottom of the sediment core between 123 and 115 cm
(average 120x103 grains/cm3), but they decrease from 115 to 75 cm (average 60x103 grains/cm3) and
have even lower values in the top part of the core from 75 to 0 cm (average 40x103 grains/cm3).
The record is divided into two large clusters by the CONISS analysis. The first zone is lin-1 from 123 to
76 cm, and the second is lin-2 from 76 to the top of the core. Based on important changes and
composition of the palynological, charcoal and NPP data, the two zones are additionally divided into six
sub-zones: lin-1a (123-116 cm), lin-1b (116-84 cm), lin-1c (84-76 cm), lin-2a (76-64 cm), lin-2b (64-52
cm) and lin-2c (52-0 cm).

91

92

93
Description of the palynological sub-zones
Lin-1a (123-116 cm; ca. AD 1030-1200)
The basal sub-zone of the record is characterized by low values of Lithocarpus-Castanopsis pollen
(average 11 %), while other montane rainforest genera like Freycinetia and Acalypha have the highest
values of the record (averages 2% and 16%). Poaceae pollen grains are well represented and they
increase towards the top of the sub-zone (from 13% to 16%). Within this group, grains larger than 40
µm are found. Swamp pollen taxa have low values (average 2%) mirrored by high micro-charcoal
particles (average 120x103 part/cm3). Pioneer pollen taxa have high values, represented by Macaranga
(average 7%) and Trema (average 5%).
Lin-1b (116-84 cm; ca. AD 1200-1730)
Lithocarpus-Castanopsis pollen values slightly increase (average 18%) while Acalypha decreases. Swamp
pollen taxa values increase notably, represented mostly by Typha (up to 4%). Micro-charcoal
concentrations decrease while Glomus spores increase. Tilletia and Plantago occur for the first time in
this sub-zone. On average, the pollen concentrations decrease.
Lin-1c (84-76 cm; ca. AD 1730-1910)
In this sub-zone Lithocarpus-Castanopsis pollen values continue to increase (average 25%). Poaceae
values decrease slightly (average 10%) and grains larger than 40 µm are no longer found. Swamp pollen
taxa decrease (average 1%), mirrored again by high micro-charcoal values (average 80x103
particles/cm3) and low Glomus concentrations (average 470 spores/cm3).
Lin-2a (76-64 cm; early 20th century)
In this sub-zone pollen preservation is poor, and grains show corrosion and are often folded. The pollen
grains of Moraceae-Urticaceae are particularly badly preserved.
Primary lower montane pollen taxa continue to rise, especially Lithocarpus-Castanopsis (average 29%).
However, Freycinetia and Acalypha values markedly decrease (averages 0.5 and 3%), while Celtis
increase (up to 6%). Pioneer and secondary pollen taxa are mostly represented by Macaranga (average
Figure 7.3 (previous 2 pages) Summary diagram from the Lake Lindu sediment core divided into temporal zones and sub-zones. The black lines are the locally weighted scatter plot smoothings (LOWESS) fitted to the sample values (light grey bars) to highlight trends. X-axes are rescaled for a better visualization of the least abundant taxa. a) Upper diagram Moraceae-Urticaceae (expressed in percentages of the total pollen sum); sum of lower montane rainforest, swamp, pioneer, secondary forest, anthropogenic, palms and long-distance transported pollen taxa (expressed as percentages of total pollen sum excluding Moraceae-Urticaceae); total Pteridophyta spores (expressed as percentages of sum of pollen and Pteridophyta spores); pollen, Pteridophyta and diatom concentrations (counts/cm3). Lower diagram: macro- and micro-charcoal concentrations (counts/cm3); swamp pollen taxa sum (percentages of the total pollen sum excluding Moraceae-Urticaceae); selected non-pollen palynomorph (NPP) concentrations (counts/cm3); selected diatoms (counts/cm3); CONISS dendrogram of the square root transformed proportions of all taxa (dissimilarity coefficient Edwards and Cavalli-Sforza’s chord distance); b) most significant pollen taxa within the groups (percentages of the total pollen sum excluding Moraceae-Urticaceae); selected Pteridophyta taxa (expressed as percentages of sum of pollen and Pteridophyta spores)
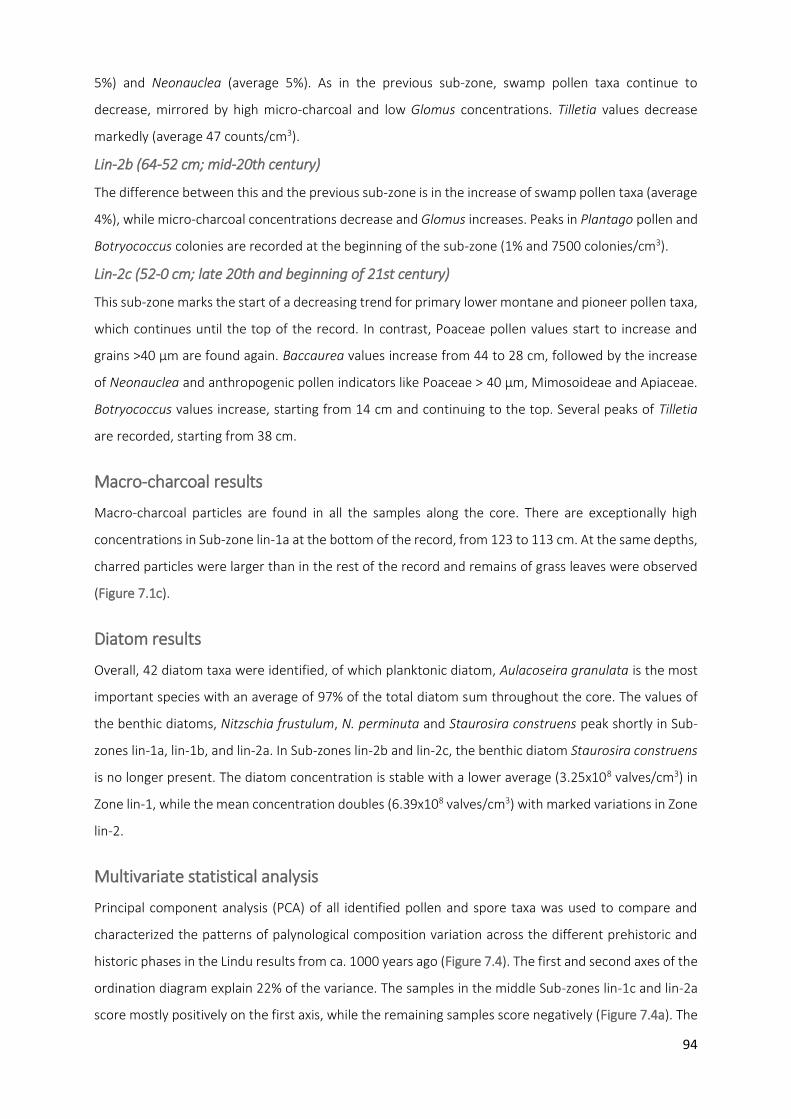
94
5%) and Neonauclea (average 5%). As in the previous sub-zone, swamp pollen taxa continue to
decrease, mirrored by high micro-charcoal and low Glomus concentrations. Tilletia values decrease
markedly (average 47 counts/cm3).
Lin-2b (64-52 cm; mid-20th century)
The difference between this and the previous sub-zone is in the increase of swamp pollen taxa (average
4%), while micro-charcoal concentrations decrease and Glomus increases. Peaks in Plantago pollen and
Botryococcus colonies are recorded at the beginning of the sub-zone (1% and 7500 colonies/cm3).
Lin-2c (52-0 cm; late 20th and beginning of 21st century)
This sub-zone marks the start of a decreasing trend for primary lower montane and pioneer pollen taxa,
which continues until the top of the record. In contrast, Poaceae pollen values start to increase and
grains >40 µm are found again. Baccaurea values increase from 44 to 28 cm, followed by the increase
of Neonauclea and anthropogenic pollen indicators like Poaceae > 40 µm, Mimosoideae and Apiaceae.
Botryococcus values increase, starting from 14 cm and continuing to the top. Several peaks of Tilletia
are recorded, starting from 38 cm.
Macro-charcoal results
Macro-charcoal particles are found in all the samples along the core. There are exceptionally high
concentrations in Sub-zone lin-1a at the bottom of the record, from 123 to 113 cm. At the same depths,
charred particles were larger than in the rest of the record and remains of grass leaves were observed
(Figure 7.1c).
Diatom results
Overall, 42 diatom taxa were identified, of which planktonic diatom, Aulacoseira granulata is the most
important species with an average of 97% of the total diatom sum throughout the core. The values of
the benthic diatoms, Nitzschia frustulum, N. perminuta and Staurosira construens peak shortly in Sub-
zones lin-1a, lin-1b, and lin-2a. In Sub-zones lin-2b and lin-2c, the benthic diatom Staurosira construens
is no longer present. The diatom concentration is stable with a lower average (3.25x10⁸ valves/cm3) in
Zone lin-1, while the mean concentration doubles (6.39x10⁸ valves/cm3) with marked variations in Zone
lin-2.
Multivariate statistical analysis
Principal component analysis (PCA) of all identified pollen and spore taxa was used to compare and
characterized the patterns of palynological composition variation across the different prehistoric and
historic phases in the Lindu results from ca. 1000 years ago (Figure 7.4). The first and second axes of the
ordination diagram explain 22% of the variance. The samples in the middle Sub-zones lin-1c and lin-2a
score mostly positively on the first axis, while the remaining samples score negatively (Figure 7.4a). The

95
scores of the second axis separate the assemblages into two groups (Figure 7.4b). Samples in Zone lin-
1 score negatively (pre-colonial period), while those in Zone lin-2 (post-colonial period) score positively.
Discussion and interpretation
According to the age-depth model, a clear increase in the sedimentation rate from 0.52 to 40 mm/yr
can be observed from the base to the top of the Lake Lindu record (Figure 7.2). This is an even more
distinct change than what was observed at the much smaller lacustrine system of Lake Kalimpaa, where
the sedimentation rate increased from 0.8 to 9.2 mm/yr due to human disturbances in its surroundings
(Haberzettl et al. 2013; Wündsch et al. 2014; Biagioni et al. 2015a). At Lake Tondano, a modern age was
obtained at 100-90 cm (Dam et al. 2001). This date was explained as the probable result of the admixture
of recent soil organic matter into the sediment, since its properties did not suggest a radical change in
depositional activity (Dam et al. 2001). However, if this age is assumed to be correct, a similar change
in sediment accumulation occurred as at Lake Lindu. This is in accordance with the observation that
Lake Tondano is seriously threatened by increasing silting up, which according to references dating back
to 1979 has been reaching values of 200 mm/yr (Lehmusluoto 1997; Dam et al. 2001). These
comparisons make such a drastic change in sediment accumulation conceivable. However, since such a
change without the occurrence of mass wasting events is unusually high, the chronology has been
tested using magnetostratigraphy and comparison to geomagnetic field model output, since
palaeomagnetic secular variations (PSV) can be used as a significant tool to correlate Holocene regional
records (Yang et al. 2009; Barletta et al. 2010; St-Onge and Stoner 2011; Ólafsdóttir et al. 2013).
A strong and stable ChRM (characteristic remanent magnetization) was isolated between 5 and 90 mT
(Figure 7.2a). A viscous remanent magnetization was hardly observed and, when present, was easily
removed at 5 mT. Maximum Angular Deviation (MAD) values of the ChRM of the Lake Lindu
palaeomagnetic record are entirely below 3.5°, indicating a very well preserved magnetization (Stoner
and St-Onge 2007). Unfortunately, declination seems to suffer from core twisting, which has often been
observed with soft sediments (Ali et al. 1999; Haberzettl et al. 2013) and hence is not plotted. The
inclination shows a trend from 15.4° to -38.2° from 123 to 78 cm, intersected by two high amplitude
maxima in between. Values close to the ones expected, based on a geocentric axial dipole model (GAD
= 2.64°S for Lake Lindu) for the site latitude, are only reached at the base of the core. After the
decreasing trend, a change to -10.4° at 69 cm is observed. Thereafter, the amplitude of the variations is
much lower, although distinct differences ranging between -7.4 and -16.4° (=9° difference) can be
observed. From 32 cm to the top of the record, the amplitude further decreases to values between -17
and -23.7° (=6.7° difference) (Figure 7.2a). This change in amplitude is consistent with the observed
increase in the sedimentation rate. The lower the sedimentation rate, the higher the amplitude in
inclination variations, because a longer period of time is recorded during intervals of lower
96
sedimentation rate. During this longer period, larger variations in the inclination can occur. In contrast,
high sedimentation rates only record short time intervals with minor variations in the inclination.
Therefore the synchronous occurrence of higher amplitudes during phases with lower sedimentation
rates, and lower amplitudes when there are higher sedimentation rates, is in agreement with the
chronology. Further support for the chronology comes from the comparison of the inclination record
from Lake Lindu with the data obtained from Lake Kalimpaa (Haberzettl et al. 2013) and the CALS3K.4e
spherical harmonic geomagnetic model output for the coring site (Figure 7.2b; Korte and Constable
2011). While individual swings in the inclination curve of Lake Lindu are also found in the Lake Kalimpaa
record, a similar general trend is found in the CALS3K.4e model. If one takes into account the error of
the radiocarbon dating method itself of ±70 years for the accepted ages (Table 7.2) and the error in the
chronology determined by age-modelling artefacts owing to linear interpolation, as well as the
uncertainties contained in the CALS3K.4e model, an even better fit might be conceivable.
Although the radiocarbon-based chronology is conservative, the palaeomagnetic analyses support this
approach and indicate that the age-depth model is a good first order approximation as a basis for
palaeoenvironmental reconstruction. In addition, the inclination data extend palaeomagnetic
knowledge into an area where such information is very scarce.
According to the age-depth model, the palaeoecological analyses of the Lindu core illustrate the
vegetation, climate and fire history of the Lindu plain for the past ca. 1000 years. The following
discussion divides the record into a pre-colonial period corresponding to Zone lin-1 starting from ca. AD
1030 and a post-colonial period, lin-2 after ca. AD 1910, which also includes the post-independence
period from 1949 and more recent history.
The change in the sedimentation rate from lin-1 to lin-2 matches the change in pollen concentrations.
The first zone is characterized by a low sedimentation rate and fits the higher than average pollen
concentrations. The opposite is observed in Zone lin-2, where a high sedimentation rate corresponds to
an average lower concentration of pollen. The increase in sedimentation rate can be linked to the fall in
lake level at the beginning of the 20th century as observed by the Sarasin brothers in 1902 during their
visit to the Lindu plain (Sarasin and Sarasin 1905).
The stable high percentage values of Aulacoseira granulata, a widespread planktonic diatom, common
in carbonate-rich, eutrophic lakes (van Dam et al. 1994; Gómez et al. 1995), indicates that Lake Lindu
continued to have a high nutrient content. However, an increase in human activities in Zone lin-2 can
be inferred from the unstable and higher diatom concentrations, corresponding to cultural
eutrophication and increasing amounts of nutrients being washed into the lake (Horner et al. 1990;
Kirilova et al. 2010).

97
Pre-colonial period (lin-1, 123-76 cm, ca. AD 1030-1910)
At the beginning of the record (lin-1a, ca. AD 1030-1200), a well-developed montane rainforest
surrounded the lake, as suggested by high values of Freycinetia, a climber found in old-growth montane
rainforests. The grassland plain which today surrounds the lake shore was already developed, as
indicated by high values of Poaceae. Also, indicators of human activities suggest a long history of
landscape exploitation on the Lindu plain. Large Poaceae grains (>40 µm) which might include pollen of
Oryza sativa type were already encountered. Local fires were very frequent or intense in this period, as
shown by the high concentration of macro-charcoal. Large charred particles of grass were found,
suggesting that fires burned the grassland on the lake shore. If humans caused the fires, it is possible
that the opening of the forest was following a shifting system of cultivation, as a more permanent
occupation would not have allowed pioneer fast growing taxa like Macaranga and Trema to proliferate
around the lake. High values of micro-charcoal indicate high regional biomass burning, suggesting that
the climate then was drier and/or periods of droughts were frequent. This is further confirmed by the
low values of swamp taxa, indicating that the river discharge was low. The same period of drought and
disturbance of the vegetation was recorded at Lake Kalimpaa, 15 km southeast (Wündsch et al. 2014;
Biagioni et al. 2015a) and in the Besoa valley, 30 km south of the lake (Kirleis et al. 2011; Kirleis et al.
2012).
The increase in fungal spores of Glomus, starting from ca. AD 1200 to AD 1730 (lin-1b), is a good
indicator of soil erosion in the lake catchment (Scott Anderson et al. 1984). Increasing soil erosion and
the development of larger swamp areas around the lake point toward an increase in run-off and
precipitation in this period and/or less frequent periods of drought, as also indicated by low micro-
charcoal values. The reconstruction at Lake Lindu matches with the reconstructions of the average
position of the ITCZ. Palaeorecords from the Southern Hemisphere, anticorrelated with palaeorecords
from the Northern Hemisphere (Haug et al. 2001; Tierney and Russell 2007; Tierney et al. 2010), show
that the ITCZ moved southwards, reaching its southernmost position of the past 2,000 years during the
period commonly known as the Little Ice Age (LIA), ca. 15th-17th century. Such a changed position of the
ITCZ to being more centered on the LLNP area would have caused seasonality to decrease and average
annual precipitation to increase. Similar results were also found at Kalimpaa and Besoa (Kirleis et al.
2011; Kirleis et al. 2012; Wündsch et al. 2014; Biagioni et al. 2015a). Characteristic swamp taxa were
Typha and Callitriche, indicating that stagnant swampy depressions spread around the lake.
Tilletia is a genus of smut fungi in the Tilletiaceae family, species of which are plant pathogens that affect
various grasses including rice (Duran and Fischer 1961; Carris et al. 2006). Their occurrence for the first
time in Sub-zone lin-1b and the decrease of pioneer taxa and macro-charcoal particles might indicate
that a change occurred towards a more permanent and organized use of the plain, starting from around
AD 1200. It is possible that increased precipitation had allowed wet rice cultivation to start on the shores

98
around the lake. The high values of Freycinetia indicate well-developed montane rainforests
surrounding the lake, however Euphorbiaceae decreased, especially Acalypha, suggesting that
disturbance of the forest also occurred.
Starting from ca. AD 1730 (lin-1c), average precipitation decreased and/or periods of drought increased,
as indicated by low values of swamp taxa and Glomus spores and high micro-charcoal values.
Lithocarpus-Castanopsis increased, Poaceae decreased with no more evidence of large grains from this
family, suggesting abandonment or decrease of human activities around the lake. When the Sarasin
brothers visited the Lindu plain in 1902, they found that a small group of people were living on the shore
line of the lake (Sarasin and Sarasin 1905). The grassland plain which is visible today was already present,
but no wet rice cultivation was encountered, the plain being grazed by horses (Figure 7.1b). The
inhabitants lived off garden products and fishing. In fact, Lake Lindu has been well known for a long time
for the abundance of its fish. When Adriani and Kruyt first visited the lake in 1897, they reported that
the indigenous people used fish traps to provide for local consumption in the village of Langko near the
southwestern shore (Adriani and Kruyt 1898). The cultural difference observed from ca. AD 1730 might
have been caused by decreased precipitation and/or occurrences of long periods of drought. The people
living around the lake might have been forced to limit their activities to fishing and cattle grazing in
consequence of the no-longer favorable climatic conditions. However, additional causes of cultural
changes might have played a role. For instance, conflicts and/or spread of diseases can severely affect
both human populations and cultivated plants, but such events are not detectable with pollen and
palaeoecological analyses.
Post-colonial period (lin-2, 76-0 cm, from ca. AD 1910)
Taxa from montane rainforest continued to increase at the beginning of the 20th century (lin-2a), in
particular Lithocarpus-Castanopsis. Moraceae-Urticaceae decreased, but this was possibly an artefact
of the bad preservation of the pollen grains in this sub-zone. At the same time, secondary forest taxa
increased, indicating recovery of the forest, while macro-charcoal values remained low and
anthropogenic indicators like Tilletia concentrations decreased. Dutch missionaries arrived in this area
following the submission of the Kulawi raja in 1905. According to Acciaioli (1989), the area around Lake
Lindu remained relatively isolated, despite the substantial modifications to the surrounding lowlands,
introduced by the Dutch.
A clear increase in the sedimentation rate started at the beginning of the 20th century as indicated by
the age-depth model, the change in amplitude of palaeomagnetic inclination and decreased pollen
concentrations. Such a change in the sedimentation rate can be linked to the falling lake level observed
by the Sarasin brothers in 1902 during their visit to the Lindu plain (Sarasin and Sarasin 1905).

99
Low values of Glomus and swamp taxa as well as high micro-charcoal values were also recorded in the
previous sub-zone, lin-1c, suggesting that rainfall decreased and/or droughts increased before the
increase in sedimentation rate observed from the early 20th century onwards. However, a link between
human activities and the initial lowering in lake level could not be established, as this sub-zone records
the recovery of the forest.
The Botryococcus colonies in lake sediments are related to periods with a high delivery of nutrients, and
their presence is often used as a palaeoenvironmental proxy (Guy-Ohlson 1992). The arrival of Bugis
communities in the area during the second part of the 20th century marked the beginning of new
landscape opening around the shore of wet rice fields (Acciaioli 2001).The peak in colonies in Sub-zone
lin-2b in the mid-20th century might be a consequence of increasing nutrients washed into the lake, as
human activities increased around it. At the same time, Glomus and swamp taxa increased and micro-
charcoal decreased, suggesting increased rainfall. However, the sedimentation rate remained high and
the silting of the lake continued despite the changes in the rainfall regime. In this period, there is a clear
lack of correlation between the change in the lake level and rainfall variability as reconstructed from the
palynological assemblage. It seems likely that the trend towards a falling lake level continued from the
mid-20th century until now, as a consequence of the diversion of larger amounts of water away from
the lake for irrigation purposes (Acciaioli 2001) and erosion/sedimentation increased due to
intensification of land-use practices.
Clear palynological evidence for increasing human activities are recorded, starting from the late 20th
century (lin-2c) with the re-occurrence of Poaceae pollen >40 µm and the gradual decrease in primary
lower montane rainforest taxa up to the present time. Secondary forest taxa like Neonauclea and
anthropogenic indicators like Mimosoideae, Apiaceae, Tilletia and Botryococcus increase markedly,
starting from very recent time. The palynological evidence for an increase in human activities matches
the increase in people migrating to the Lindu plain in search of available land to cultivate after the 1970s,
following the establishment of the LLNP (Acciaioli 2001; Weber et al. 2003).
Phases of prehistoric and historic human-landscape interactions on Lindu plain and the link to climate variability in Central Sulawesi
Various phases of cultural use of the Lindu plain are evident from the Lake Lindu record (Figure 7.3;
Figure 7.4). In particular, changes occurred from ca. AD 1200 to ca. AD 1730 showing a more permanent
use of the landscape. At the same time, the reconstructed rainfall regime indicates wetter conditions.
Such a cultural change can be explained in two different ways. The first hypothesis is that the builders
of the megaliths changed their strategies on the Lindu plain by establishing more permanent
settlements, taking advantage of the wetter climatic conditions for wet rice cultivation. Accordingly, the
disappearance of the metal age culture that produced the megaliths would be recent, ending on the
100
Lindu plain only in the 16th-17th century. These populations might have persisted in isolation from South
Sulawesi and Palu, with which the contacts with other populations from South Sulawesi, Europe and
mainland Asia were established long before. Alternatively, the changes recorded at ca. AD 1200 might
represent the end of the activities of the megalith builders on the Lindu plain. A different ethnic group
with knowledge of wet rice cultivation techniques might have replaced the people of the megalith
culture.
There is not yet a clear chronology for the megalithic culture in Central Sulawesi. At the megalithic
Pokekea site, the dating of the bottom sediments of one of the large stone vats called kalambas
established that the site was at least 900 years old (Kirleis et al. 2011; Kirleis et al. 2012). However, in
contrast to the Lake Lindu record where there was a phase of forest recovery, the pollen analysis of the
Besoa valley shows that open grassland persisted uninterrupted from 2000 years ago when
deforestation started. It is not known when the megalithic culture in Central Sulawesi ended, therefore
in order to confirm the validity of these hypotheses, more research is needed on these megalith sites.
The forest recovery phase recorded from ca. AD 1730 to the early 20th century matches with historical
reports of a different use of the plain by the so-called Lindu people, whose activities there were mostly
limited to fishing and cattle grazing (Sarasin and Sarasin 1905). Although different causes might explain
such a radical cultural change, climate might have been one important factor. Indeed, drier conditions
Figure 7.4 Principal component analysis (PCA) of all percentage data of identified pollen and spore taxa. Percentages calculated on the total sum of all taxa square root transformed. First, second and third axes are shown (cumulative explained variation 29%). Scatterplots represent the sample scores. Results are centered by taxa. Group of adjacent samples are marked differently to highlight the different groups corresponding to different prehistoric and historic phases. Palynological sub-zones are given in light grey; a) first and second axes scatterplots; b) second and third axes scatterplots

101
characterized this period as indicated by the low values of swamp taxa and high micro-charcoal
concentrations.
Starting from the mid-20th century, the arrival of Bugis communities and the more recent population
encroachment onto the Lindu plain following the establishment of the LLNP caused major changes
(Acciaioli 2000; Kreisel et al. 2004), as also shown by the change in palynological composition of the
Lake Lindu record (Figure 7.4). The lake level fall began already in the early 20th century, possibly a
consequence of long-term drier conditions. However, such a trend has continued until now, although
the increase in swamp taxa and decrease in micro-charcoal indicate wetter conditions characterizing
the mid-20th century. This suggests that the silting of the lake is not being caused by natural climatic
conditions, but rather by increasing human activities. Indeed, local inhabitants of the Lindu plain
recently declared that migrants to the area, who cut down forests for coffee and cocoa plantations,
were responsible for the increasing shallowness of the lake and the streams feeding into it (Acciaioli
2001). It is possible that, as deforestation increases, and larger amounts of water are used to irrigate
new gardens and fields, river discharge will further decrease, damaging the cultivation and fishing
activities on the Lindu plain and aggravating the effect of droughts caused by the occurrence of El Niño.
A better management of the forested areas around the plain and the water resources of the basin would
decrease the erosion and the sedimentation that have been decreasing the depth of Lake Lindu, as
shown by its receding shoreline.
Conclusions
Palaeoecological analyses of a sediment core from Lake Lindu reveal a long history of human-landscape
interaction on the Lindu plain, which has been modified by human activities during the past 1000 years.
Although further investigations are needed, evidence of intense burning and possible shifting cultivation
from an earlier phase from ca. AD 1030 to 1200 might be related to the metal age population which
built megaliths in Central Sulawesi. From ca. AD 1200 to 1730, the climate became wetter as a
consequence of the southward movement of the ITCZ. At the same time, fires decreased, and a more
permanent effect on the landscape began. It remains open to speculation whether the architects of
such a cultural change were the megalith people, or a different ethnic group. A phase of abandonment
or less intense activities characterized the period from ca. AD 1730 to 1910. Following this phase of
forest advancement, the more recent part of the Lake Lindu record shows a trend towards deforestation
which started in the late 20th century until the present. The increase in sedimentation rate and lowering
of lake level started at the beginning of the 20th century and these have continued until now, despite
changes in the rainfall regime which occurred in the last hundred years, as reconstructed from the
palynological record.

102
In conclusion, the Lindu record represents one further step in the increase of the knowledge of human
and landscape history in Central Sulawesi and it highlights the potential for further palaeoecological and
archaeological investigations in the area.
Acknowledgments
This research was carried out as part of the project “Environmental and land-use change in Sulawesi,
Indonesia (ELUC)” at Göttingen University, Germany, and was funded by the German Research
Foundation (DFG) BE 2116/22-1. We appreciate the financial support provided by a grant from the
National Science Council (NSC 102-2917-I-564-058) and the Open Fund of Key Laboratory of the Chinese
Academy of Geological Sciences (KERDC201301). Torsten Haberzettl was supported by a postdoctoral
fellowship scholarship from Fonds de recherche du Québec - Nature et technologies (FQRNT). We
gratefully acknowledge Wiebke Kirleis for support in field work and thank for the logistic support the
ELUC coordination team and the Indonesian partner universities in Bogor and Palu, Institut Pertanian
Bogor (IPB) and Universitas Tadulako (UNTAD), the Ministry of Education in Jakarta (DIKTI), the
Indonesian Institute of Sciences (LIPI) and the authorities of LLNP. Finally, the authors would like to
thank the anonymous reviewers for their valuable comments and suggestions to improve the
manuscript.
103
CHAPTER 8 - paper 4
8000 years of vegetation dynamics and environmental changes of a unique inland peat ecosystem of the Jambi Province in Central Sumatra, Indonesia
Siria Biagionia, Valentyna Krashevskab, Yudhi Achnophac, Asmadi Saadc, Supiandi Sabihamd and Hermann
Behlinga
a Department of Palynology and Climate Dynamics, Albrecht-von-Haller-Institute for Plant Sciences, Georg-August-
University of Göttingen, Untere Karspüle 2, 37073 Göttingen, Germany
b J.F. Blumenbach Institute of Zoology and Anthropology, Georg-August-University of Göttingen, Berliner Straße
28, 37073, Göttingen, Germany
c Department of Soil Science, University of Jambi, Jalan Raya Jambi Muara Bulian KM 15 Mandalo Darat, 36361,
Jambi, Sumatra, Indonesia
d Department of Soil Science and Land Resource, Bogor Agriculture University (IPB), Jalan Meranti, IPB Campus,
Darmaga, Bogor, Java, Indonesia
Keywords
Palynology; Testate amoebae; Inland peat; Vegetation dynamics; Fire history; Sumatra
Palaeogeography Palaeoclimatology Palaeoecology 440 (2015) 813-829
doi:10.1016/j.palaeo.2015.09.048

104
Abstract
Despite their importance as global carbon sinks, peatlands of Southeast Asia have been rarely studied
and our current knowledge of the dynamics and ecology of these ecosystems remains incomplete.
Paleoecological and palynological multi-proxy analyses including analysis of pollen, spores, charcoal,
testate amoebae and sediments were carried out on a 733 cm-long core taken from the Air Hitam
peatland in the Jambi Province, Central Sumatra, Indonesia. The radiocarbon chronology reveals that
peat formation started ca. 7800 years ago. The site was covered by dipterocarp-swamp mixed rainforest
during the first 2000 years, after which freshwater swamp taxa became more important, in particular
Durio trees. This lasted until ca. 4500 years ago, when the swamp vegetation shifted to a pole forest
with abundant Pandanus thickets in response to a system change from minerotrophic to ombrotrophic
conditions. For this period, macro-charcoal analysis reveals that fire frequency increased, possibly as a
consequence of climate change linked to the onset of the modern El Niño Southern Oscillation (ENSO)
in the late Holocene. The ombrogenous Pandanus-pole forest phases were characterized by lower water
table fluctuations and higher peat accumulation rates. The area of Air Hitam has been for thousands of
years a highly effective carbon sequestering peatland. Natural climate variability in the past did not
affect the carbon storage function as suggested by the general increase in peat accumulation during
relatively drier phases and increasing ENSO variability in the late Holocene. However, the recent changes
caused by selective logging, drainage and conversion to oil palm plantations, have caused a decline in
the peat swamp forest communities changing the ecological functions of the peatland. It is likely that
the accumulated carbon will be released in the atmosphere due to exposure to aerobic conditions and
its function will be lost unless a better management of the watershed is applied.
Introduction
The largest peatland areas in the tropics are currently found in Southeast (SE) Asia, where thick deposits
of peat have accumulated as a consequence of conditions such as low topographic relief, high biomass
production and high rainfall (Page et al. 2009; Page et al. 2010; Dommain et al. 2011). The majority of
these peatlands formed in delta areas and along river valleys in low-altitude, watershed positions (Page
et al. 2011). Estimates indicate that they cover an area of about 240,000 km2, of which the vast majority
is in Indonesia (82%), Papua New Guinea (8.8%) and Malaysia (8.3%; Page et al. 2011). Their global
importance as carbon reservoirs is well acknowledged, as they store an estimated 17–19% (65 Gt) of
the global peat carbon pool (Page et al. 2011). In addition to their carbon storage function, the peat
swamp ecosystems growing on tropical peatlands are regarded as unique (Schrier-Uijl et al. 2013) and
provide a large number of eco-system services. For instance, tropical peat swamp rainforests are im-
portant climatic mitigating areas as they supply water and prevent erosion (Yule 2010) during extreme
climatic events such as the occurrence of El Niño and La Niña episodes. Furthermore, as shown by
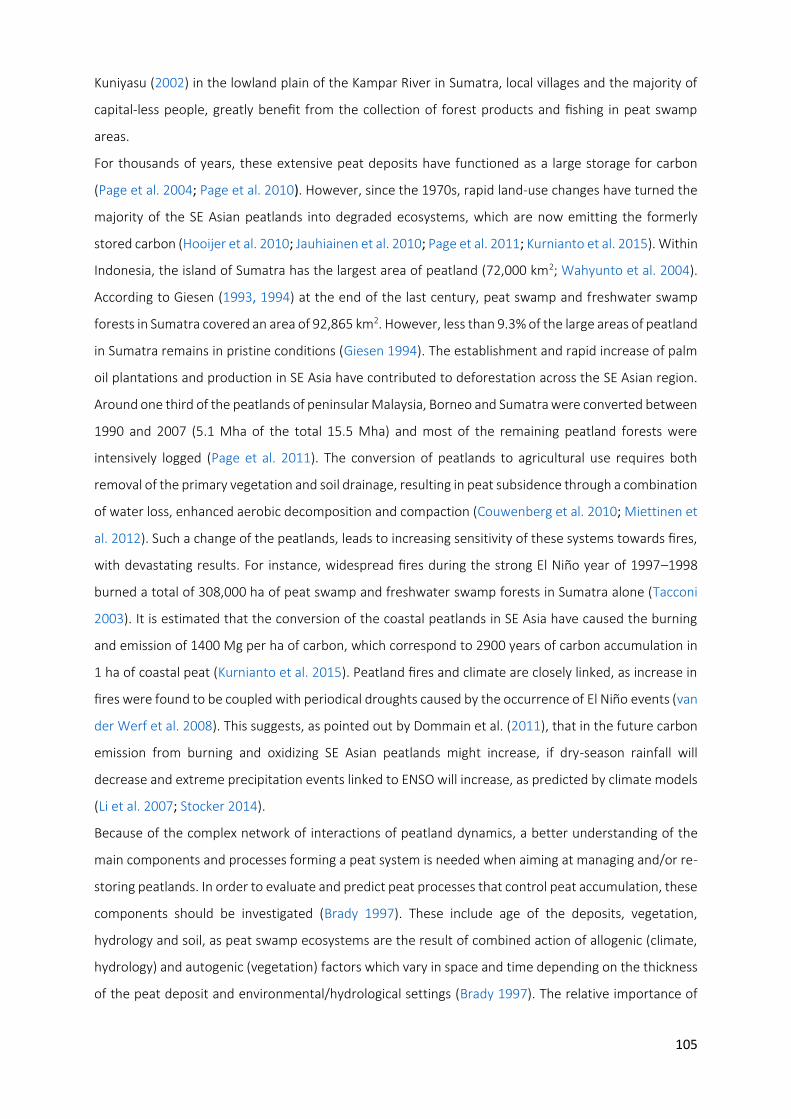
105
Kuniyasu (2002) in the lowland plain of the Kampar River in Sumatra, local villages and the majority of
capital-less people, greatly benefit from the collection of forest products and fishing in peat swamp
areas.
For thousands of years, these extensive peat deposits have functioned as a large storage for carbon
(Page et al. 2004; Page et al. 2010). However, since the 1970s, rapid land-use changes have turned the
majority of the SE Asian peatlands into degraded ecosystems, which are now emitting the formerly
stored carbon (Hooijer et al. 2010; Jauhiainen et al. 2010; Page et al. 2011; Kurnianto et al. 2015). Within
Indonesia, the island of Sumatra has the largest area of peatland (72,000 km2; Wahyunto et al. 2004).
According to Giesen (1993, 1994) at the end of the last century, peat swamp and freshwater swamp
forests in Sumatra covered an area of 92,865 km2. However, less than 9.3% of the large areas of peatland
in Sumatra remains in pristine conditions (Giesen 1994). The establishment and rapid increase of palm
oil plantations and production in SE Asia have contributed to deforestation across the SE Asian region.
Around one third of the peatlands of peninsular Malaysia, Borneo and Sumatra were converted between
1990 and 2007 (5.1 Mha of the total 15.5 Mha) and most of the remaining peatland forests were
intensively logged (Page et al. 2011). The conversion of peatlands to agricultural use requires both
removal of the primary vegetation and soil drainage, resulting in peat subsidence through a combination
of water loss, enhanced aerobic decomposition and compaction (Couwenberg et al. 2010; Miettinen et
al. 2012). Such a change of the peatlands, leads to increasing sensitivity of these systems towards fires,
with devastating results. For instance, widespread fires during the strong El Niño year of 1997–1998
burned a total of 308,000 ha of peat swamp and freshwater swamp forests in Sumatra alone (Tacconi
2003). It is estimated that the conversion of the coastal peatlands in SE Asia have caused the burning
and emission of 1400 Mg per ha of carbon, which correspond to 2900 years of carbon accumulation in
1 ha of coastal peat (Kurnianto et al. 2015). Peatland fires and climate are closely linked, as increase in
fires were found to be coupled with periodical droughts caused by the occurrence of El Niño events (van
der Werf et al. 2008). This suggests, as pointed out by Dommain et al. (2011), that in the future carbon
emission from burning and oxidizing SE Asian peatlands might increase, if dry-season rainfall will
decrease and extreme precipitation events linked to ENSO will increase, as predicted by climate models
(Li et al. 2007; Stocker 2014).
Because of the complex network of interactions of peatland dynamics, a better understanding of the
main components and processes forming a peat system is needed when aiming at managing and/or re-
storing peatlands. In order to evaluate and predict peat processes that control peat accumulation, these
components should be investigated (Brady 1997). These include age of the deposits, vegetation,
hydrology and soil, as peat swamp ecosystems are the result of combined action of allogenic (climate,
hydrology) and autogenic (vegetation) factors which vary in space and time depending on the thickness
of the peat deposit and environmental/hydrological settings (Brady 1997). The relative importance of
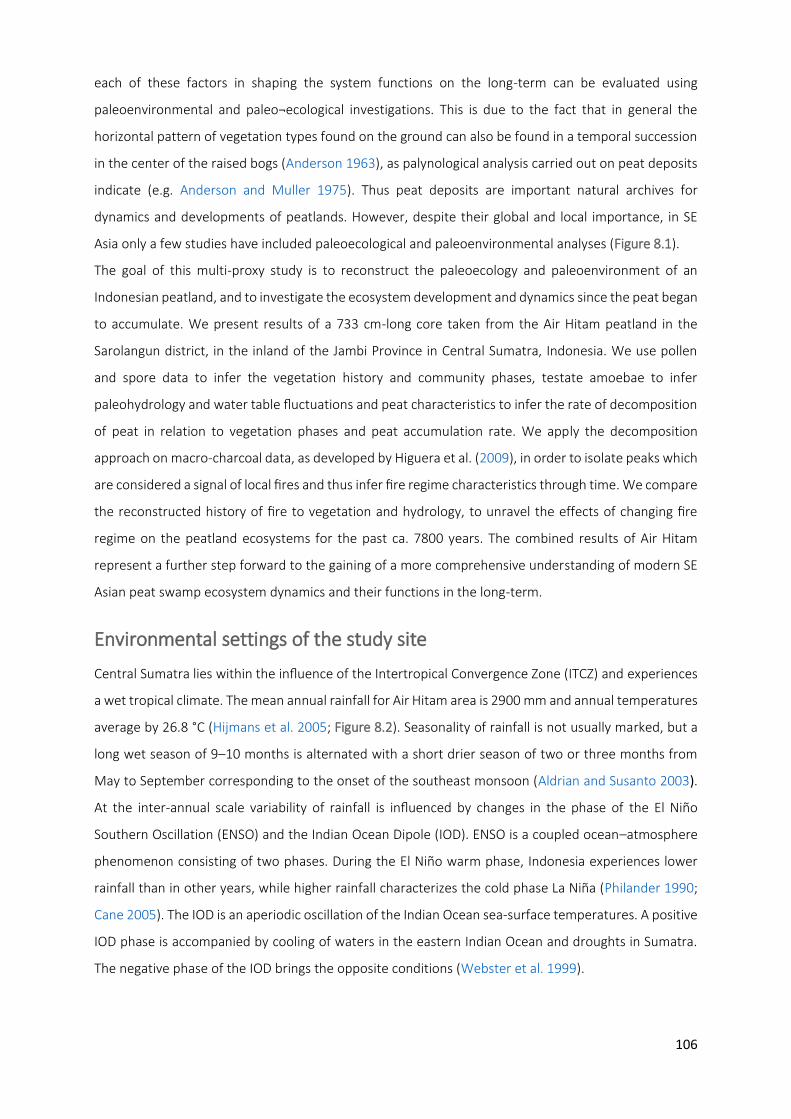
106
each of these factors in shaping the system functions on the long-term can be evaluated using
paleoenvironmental and paleo¬ecological investigations. This is due to the fact that in general the
horizontal pattern of vegetation types found on the ground can also be found in a temporal succession
in the center of the raised bogs (Anderson 1963), as palynological analysis carried out on peat deposits
indicate (e.g. Anderson and Muller 1975). Thus peat deposits are important natural archives for
dynamics and developments of peatlands. However, despite their global and local importance, in SE
Asia only a few studies have included paleoecological and paleoenvironmental analyses (Figure 8.1).
The goal of this multi-proxy study is to reconstruct the paleoecology and paleoenvironment of an
Indonesian peatland, and to investigate the ecosystem development and dynamics since the peat began
to accumulate. We present results of a 733 cm-long core taken from the Air Hitam peatland in the
Sarolangun district, in the inland of the Jambi Province in Central Sumatra, Indonesia. We use pollen
and spore data to infer the vegetation history and community phases, testate amoebae to infer
paleohydrology and water table fluctuations and peat characteristics to infer the rate of decomposition
of peat in relation to vegetation phases and peat accumulation rate. We apply the decomposition
approach on macro-charcoal data, as developed by Higuera et al. (2009), in order to isolate peaks which
are considered a signal of local fires and thus infer fire regime characteristics through time. We compare
the reconstructed history of fire to vegetation and hydrology, to unravel the effects of changing fire
regime on the peatland ecosystems for the past ca. 7800 years. The combined results of Air Hitam
represent a further step forward to the gaining of a more comprehensive understanding of modern SE
Asian peat swamp ecosystem dynamics and their functions in the long-term.
Environmental settings of the study site
Central Sumatra lies within the influence of the Intertropical Convergence Zone (ITCZ) and experiences
a wet tropical climate. The mean annual rainfall for Air Hitam area is 2900 mm and annual temperatures
average by 26.8 °C (Hijmans et al. 2005; Figure 8.2). Seasonality of rainfall is not usually marked, but a
long wet season of 9–10 months is alternated with a short drier season of two or three months from
May to September corresponding to the onset of the southeast monsoon (Aldrian and Susanto 2003).
At the inter-annual scale variability of rainfall is influenced by changes in the phase of the El Niño
Southern Oscillation (ENSO) and the Indian Ocean Dipole (IOD). ENSO is a coupled ocean–atmosphere
phenomenon consisting of two phases. During the El Niño warm phase, Indonesia experiences lower
rainfall than in other years, while higher rainfall characterizes the cold phase La Niña (Philander 1990;
Cane 2005). The IOD is an aperiodic oscillation of the Indian Ocean sea-surface temperatures. A positive
IOD phase is accompanied by cooling of waters in the eastern Indian Ocean and droughts in Sumatra.
The negative phase of the IOD brings the opposite conditions (Webster et al. 1999).
107
The eastern side of Sumatra is dominated by alluvial soils while the swampy areas of Riau and Jambi
Province as well as South Sumatra are dominated by organosols (Whitten 2000).
The Air Hitam area in the Sarolangun Regency is a topographic depression constricted to the north,
south and west by higher elevation areas (>70 m asl, Figure 8.3). The watershed is characterized by three
different watercourses as part of the Batang Asai and Air Hitam rivers which join to the east in the
proximity of Pauh village. Behind the interfluvial terraces of the watercourses that crossed the area, two
Figure 8.1 Map of the Sunda shelfwith the red star representing the location of the Air Hitam inland peat. The light shaded area delineates the Sunda Shelf as it was exposed at the time of the Last Glacial Maximum (based on Sathuamurthy and Voris 2006). Line markers show the extension of peat deposits (data source: FAO Harmonized Soil Map of the World, Histosols and Gleysols layers only). Square symbols correspond to the approximate position of the available studies on peatlands in the area modified from Dommain et al. (2011): 1) Muara Telang (Furukawa 1994); 2)
Sugihan (Brady 1997); 3) Batang Hari Delta (Cameron et al. 1989; Esterle and Ferm 1994; Sabiham 1988; Sabiham and
Furukawa 1986; Silvius et al. 1984); 4) Pulau Kijang (Furukawa 1994; Shibata et al. 1997); 5) Siak Kanan (Diemont and
Supardi 1987a; Neuzil 1997; Ruppert et al. 1993; Supardi et al. 1993); 6) Palau Padang (Brady 1997); 7) Pulau Bengkalis
(Neuzil 1997; Supardi et al. 1993); 8) Siak Kecil (Gunawan et al. 2012); 9) Pekan Nanas (Haseldonckx 1977); 10) Tasek
Bera (Morley 1982; Phillips and Bustin 1998; Wüst et al. 2002; Wüst and Bustin 2004); 11) Rajang River Delta (Staub
and Esterle 1993; Staub and Esterle 1994; Staub and Gastaldo 2003); 12) Batu Niah (Cole 2012; Cole et al. 2015); 13)
Sungai Dua Forest Reserve and Senadin (Cole 2012; Cole et al. 2015); 14) Baram River area (Anderson 1964; Anderson
and Muller 1975; Brünig 1974; Dommain et al. 2015; Esterle and Ferm 1994; Morley 2013; Muller 1963; Sabiham
1990; Tie and Esterle 1992; Wilford 1960; Woodroffe 2000); 15) Lawas River area (Anderson 1963; Morley et al. 2011; Muller 1963; Wilford 1960); 16) Teluk Keramat (Neuzil 1997); 17) Rasau Jaya (Anshari et al. 2010; Diemont and Supardi
1987b; Notohadiprawiro 1981); 18) Pemerak (Anshari et al. 2001; Anshari et al. 2004); 19) Sebangau (Kershaw et al.
2000; Morley 1981; Morley 2013; Neuzil 1997; Page et al. 1999; Page et al. 2004; Page et al. 2006; Rieley and Page
1997; Sieffermann et al. 1988; Sieffermann et al. 1992; Sieffermann et al. 1996; Yulianto and Hirakawa 2006; Yulianto
et al. 2004; Wüst 2009; Wüst et al. 2008); 20) Pulau Petak Delta (Notohadiprawiro 1981; Sabiham 1988; Sumawinata
1998); 21) Kutai lake area (Hope et al. 2005). Different colors of the squares denote different ages for the initiation of the peat and the pollen symbol (blue) indicates the sites where palynological analysis was conducted
108
peat domes are found and cut by the
central course to a characteristic bilobate
shape covering an area of about 400 km2
(Figure 8.3). Wetlands International
mapped the area of peatland in Sumatra
in 2003. According to the report, the Air
Hitam domes are characterized by thick
peat deposit with average depths of more
than 4 m above the mineral substrate
(Wahyunto et al. 2003). Inland peatlands,
such as the Air Hitam peat domes, form
along river valleys and their initiation
seems to have been the result of rising
ground water levels and paludification due to changes in sea level (Dommain et al. 2011). The mineral
substrate restricted water discharge leading to permanent waterlogged conditions and, under high
rainfall conditions, accumulation of peat. The Air Hitam peat domes represent the largest contiguous
area of thick peat outside the coastal environment in the Jambi Province. Cross-sections of the peatland
reveal a series of hummocks and hollows rather than a perfect dome due to the complex
geomorphology of the mineral and alluvial substrate.
Most of the forest cover on the northern side of the peat dome was burned between 1990 and 2000
(WWF Indonesia 2010) when the palm oil companies PT Era Mitra Agro Lestari (PT Emal) and PT Jambi
Agro Wijaya (Jaw SPT) started to drain the Air Hitam peat domes to convert the area to palm oil
plantations. Canals and ditches were built to facilitate the removal of water, necessary for starting palm
oil plantations. There is no information on the vegetation communities covering the peat domes before
the conversion started and currently the land is covered with palm oil plantations, degraded bare lands
and a small forest remnant on the southeastern part of the northern dome (Figure 8.3).
Materials and methods
In 2012 three sediment/peat cores were taken on the northern section of the Air Hitam peat dome
using a Russian Corer. The cores were named according to the two oil companies active in the area; PT
Era Mitra Agro Lestari (PT Emal) and PT Jambi Agro Wijaya (PT Jaw). The first two cores B21 (2.053377°S
102.694207°E; 53 m asl; 750 cm-long) and D21 (2.053321°S 102.721165°E; 47 m asl; 330 cm-long) were
taken on young oil palm plantations (4–6 years) at the time under concession of PT Emal. The third core
Jaw SPT was taken in the forest remnant under PT Jaw concession (2.047685°S 102.665362°E; 57 m asl;
733 cm-long; Figure 8.3). The three cores were photographed and described at the University of Jambi
Figure 8.2 Monthly mean precipitation, temperature values and annual means for the Air Hitam area (2.047685°S 102.665362°E) based on the interpolations of observed data representative of the period 1950–2000. Data source: WorldClim — Global Climate Data, http://www.worldclim.org/
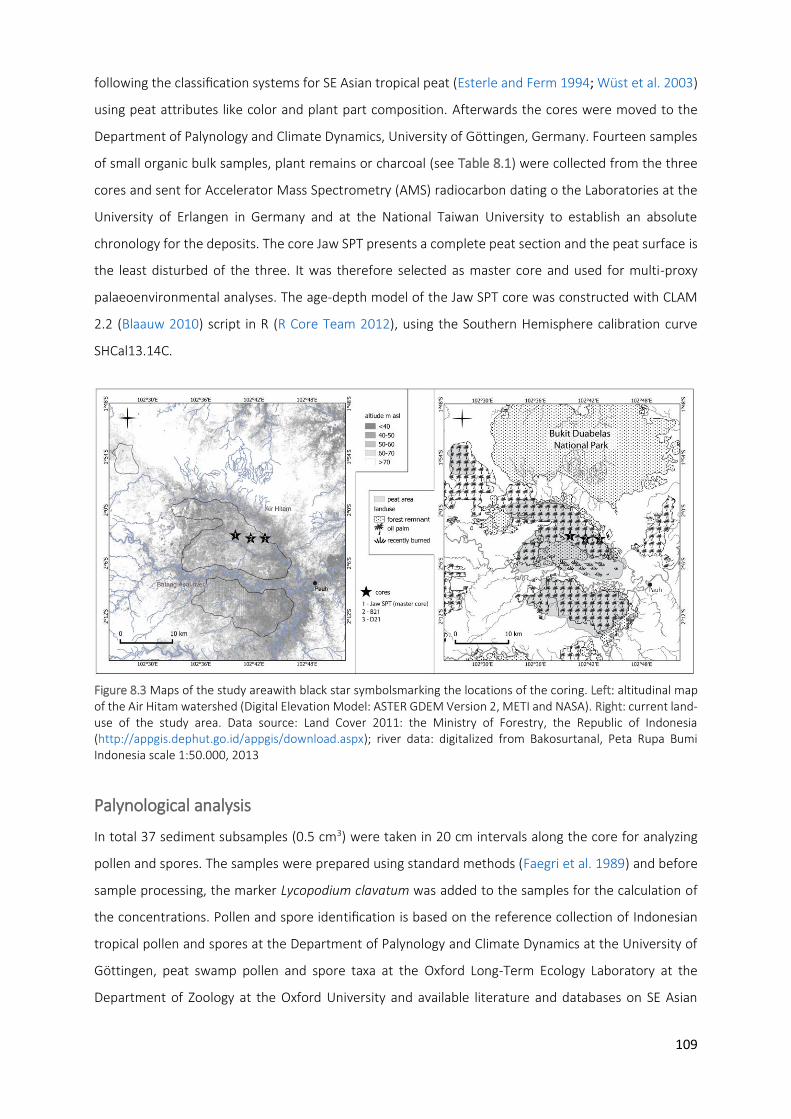
109
following the classification systems for SE Asian tropical peat (Esterle and Ferm 1994; Wüst et al. 2003)
using peat attributes like color and plant part composition. Afterwards the cores were moved to the
Department of Palynology and Climate Dynamics, University of Göttingen, Germany. Fourteen samples
of small organic bulk samples, plant remains or charcoal (see Table 8.1) were collected from the three
cores and sent for Accelerator Mass Spectrometry (AMS) radiocarbon dating o the Laboratories at the
University of Erlangen in Germany and at the National Taiwan University to establish an absolute
chronology for the deposits. The core Jaw SPT presents a complete peat section and the peat surface is
the least disturbed of the three. It was therefore selected as master core and used for multi-proxy
palaeoenvironmental analyses. The age-depth model of the Jaw SPT core was constructed with CLAM
2.2 (Blaauw 2010) script in R (R Core Team 2012), using the Southern Hemisphere calibration curve
SHCal13.14C.
Palynological analysis
In total 37 sediment subsamples (0.5 cm3) were taken in 20 cm intervals along the core for analyzing
pollen and spores. The samples were prepared using standard methods (Faegri et al. 1989) and before
sample processing, the marker Lycopodium clavatum was added to the samples for the calculation of
the concentrations. Pollen and spore identification is based on the reference collection of Indonesian
tropical pollen and spores at the Department of Palynology and Climate Dynamics at the University of
Göttingen, peat swamp pollen and spore taxa at the Oxford Long-Term Ecology Laboratory at the
Department of Zoology at the Oxford University and available literature and databases on SE Asian
Figure 8.3 Maps of the study areawith black star symbolsmarking the locations of the coring. Left: altitudinal map of the Air Hitam watershed (Digital Elevation Model: ASTER GDEM Version 2, METI and NASA). Right: current land-use of the study area. Data source: Land Cover 2011: the Ministry of Forestry, the Republic of Indonesia (http://appgis.dephut.go.id/appgis/download.aspx); river data: digitalized from Bakosurtanal, Peta Rupa Bumi Indonesia scale 1:50.000, 2013

110
tropical pollen and spore taxa (e.g. Flenley 1967; Powell 1970; Huang 1972; Anderson and Muller 1975;
Garrett-Jones 1979; Sabiham and Furukawa 1986; Tissot et al. 1994; Stevenson 2000; Premathilake and
Nilsson 2001; Kodela 2006; Cole et al. 2015; Jones and Pearce 2015; The Australasian Pollen and Spore
Atlas http://apsa.anu.edu.au). Identified pollen and spore grains were counted until a sum of more than
300 pollen grains was reached. Pollen and spore percentages were calculated relative to the pollen and
spore total sum. Pollen taxa are grouped in dipterocarp-swamp mixed rainforest, freshwater swamp,
peat swamp and open/pioneer taxa according to their distribution and ecology (Anderson 1963;
Anderson and Muller 1975; Esterle and Ferm 1994; Brady 1997; Haseldonckx 1977; Cameron et al. 1989;
Phillips and Bustin 1998; Page et al. 1999; Wüst and Bustin 2004; Hope et al. 2005; Yulianto and
Hirakawa 2006; Gunawan et al. 2012; Morley 2013; Cole et al. 2015; Flora Malesiana collection:
http://floramalesiana.org; Prosea collection: http://prosea.nl). A complete list of pollen and spore taxa
included in the groups can be found in the Table 8.2. For calculations the software C2 was used (Juggins
2007).
Testate amoebae analysis
Peat samples for testate amoebae analysis were taken from the same depth as those for pollen analysis.
For extraction of testate amoebae 4 cm3 of sediments and two Lycopodium clavatum tablets were boiled
in distilled water for 10 min and sieved over a filter of 500-μm mesh, with the filtrate then back-sieved
over 10-μm mesh. Microscope slides were prepared and the tests (shells) of testate amoebae were
identified and counted at 200x and 400x magnification. Due to the variable concentrations of tests, a
count of 100 was not always achievable. However, it has been demonstrated elsewhere that a
meaningful paleoenvironmental signal may still predominate over random noise and major changes for
counts of less than 100 but more than 50 (Payne and Mitchell 2009). To downscale the effect of different
counts, the percentages were calculated based on the initial calculation of concentrations per unit of
volume. Determination of testate amoebae was based on Charman et al. (2000), Mazei and Tsyganov
(2006), for details on taxonomic references see also Krashevska et al. (2007). Testate amoebae with
similar habitat preferences were classified into four environmental groups: “water” group, includes
testate amoebae predominantly occurring in water bodies and/or in the regularly flooded areas; “peat
moss” group, includes testate amoebae predominantly occurring in submerged and/or dry peat
bryophytes; “green moss” group, includes testate amoebae predominantly occurring in non-peat
bryophytes, a habitat with high water table fluctuations; “soil” group, includes testate amoebae
predominantly occurring in different soil horizons, a habitat with higher water table fluctuations.
Additionally, based on the established literature dry indicators were distinguished and separately
grouped (e.g. Chardez 1965; Bobrov et al. 1999; Charman et al. 2000; Bobrov et al. 2004; Mazei and
Tsyganov 2006). The test size variation between and within the species can be indirectly related to
111
hydrology and or temperature (Bobrov et al. 1999; Mitchell et al. 2008). In order to highlight the
relationship between microhabitat changes and testate amoebae size, the tests were also clustered to
the three different size classes based on the average longer axes measurements (small: <75 μm,
medium: 75–105 μm and large: >105 μm).
Macro-charcoal analysis
Macro-charcoal particles (>150 μm) were counted for samples evenly spaced at 1 cm intervals on the
first 661 cm (peat-organic layers). The samples (1 cm3 each) were prepared following the method of
Stevenson and Haberle (2005) adapted from Rhodes (1998), which is a procedure that greatly limit
particle fragmentation. Weak hydrogen peroxide (6% H2O2) was used to partially digest and bleach
organic material in the sediment and samples were wet-sieved using a 125 μm filter. All charcoal
particles were counted under a binocular dissecting microscope. Concentrations are expressed as
number of charred particles per cm3.
Numerical analysis
Clustering
Palynological zones are defined numerically according to the dissimilarity matrix of Euclidian distances
of squared root transformed percentage data, via constrained cluster analysis using the software
CONISS (Grimm 1987; Grimm 1993). All pollen and spore taxa were included in the analysis.
Diversity index and palynological compositional change
From the palynological and testate amoebae data, diversity indices (DIs) were estimated via ‘rarefaction
analysis’ (Siegel 1986) which is the calculation of the expected number of taxa E(Tn), of a smaller
population (n) as compared to the original (N) in a random sample of n individuals from a smaller
population of N individuals (Birks and Line 1992).
Empirical data suggests that the use of a pollen type diversity index based on the rarefaction analysis
calculated on a small sample of pollen taxa (i.e. 10), well correlate to the landscape diversity around the
deposit (Matthias et al. 2015). Additionally, tropical peat deposits are covered by forest, and flowers or
inflorescences drop and become part of the peat. As a consequence, the pollen signature in the peat is
dominated by this local surface vegetation, with little influence from the long-distance wind transported
pollen component (Anderson and Muller 1975). For tropical peat swamp deposits, palynological DI is
therefore probably close to Whittaker's gamma diversity/within-landscape (Whittaker 1977; Odgaard
2007) which correspond to plant diversity of the peatland community over the site. Rarefaction was
calculated with the software PAST (Hammer et al. 2001).
112
The amount of palynological compositional change or turnover (PCC) was estimated by detrended
canonical correspondence analysis (DCCA) using as external constraint the sample age following the
method described by Birks (2007). The gradient length, measured in standard deviation units, of the
first time constrained axis is used as indicator of compositional turnover (Birks 2007). First, all pollen
and spore percentages were transformed to square-roots to stabilize variances and rare taxa were not
down-weighted. Detrending was done by segments with non-linear scaling. With the application of
detrending and scaling options, the sample scores are scaled in standard deviation (SD) units of
compositional change or turnover with time (Hill and Gauch 1980). The DCCA was implemented using
CANOCO 5 (ter Braak and Smilauer 2002).
Principal component analysis
The relationships between vegetation communities in the different palynological zones were analyzed
using principal component analysis (PCA) as implemented in CANOCO 5 (ter Braak and Smilauer 2002).
PCA was carried out with all identified pollen and spore percentage data. Environmental groups and size
classes of testate amoebae were included as supplementary environmental variables. Data were
centered and square root transformed to downscale the weight of a few dominant taxa.
From macro-charcoal to local fire history
Charcoal raw data were treated using the peak detection analysis developed in the software
Charanalysis (Higuera et al. 2009). The data were first interpolated to the median temporal resolution
(11 years). The interpolated charcoal concentrations were multiplied by the estimated sedimentation
rate (cm/yr) to obtain the charcoal accumulation rate (CHAR, particles/cm2 per yr) of each sample. The
low-frequency variations in the charcoal record (Cbackground) are assumed to represent changes in
secondary charcoal caused for instance by sediment remixing. To remove Cbackground a locally weighted
regression was applied. A 400-year window which maximized the signal-to-noise index and the
goodness-of-fit between the empirical and the modeled Cnoise distributions was used (Higuera et al.
2009). The subtracted residual series, Cpeak is assumed to be composed of two subpopulations (Higuera
et al. 2008; Higuera et al. 2009): Cnoise, representing variability in sampling and analytical and naturally
occurring noise, and Cfire, representing charcoal input from local fires. A Gaussian mixture model was
used to identify the Cnoise distribution. To separate these two populations, the 99th percentiles of the
Cnoise distributions were considered as thresholds. An additional test, ‘Poisson minimum-count’ was
done to eliminate the peaks from statistically insignificant counts. Finally, we inferred aspects of the
local past fire regime based on the frequency of peaks and their magnitude. Peak magnitude, the
number of charcoal pieces from all samples defining a given peak (i.e. all samples above the threshold
value; number of pieces per cm2 per peak), is an estimation of total charcoal deposition per fire event
(Higuera et al. 2009). Therefore, changes in peak magnitude at millennial time scales were used as a

113
proxy for fire size and/or fuel consumption for a given area burned. We used the distribution of fire
frequencies (number of fire episodes per 800 years) to characterize the temporal characteristics of fire
regimes at Air Hitam for the past ca. 7800 cal yr BP.
Results
Core descriptions and stratigraphy
In general, the three cores mainly consist of dark brown hemic peat layers. Several layers with charred
particles are observed in the core (Figure 8.4).
Figure 8.4 Stratigraphy, color and characteristic of the three peat/sediment cores and AMS radiocarbon dates (star symbol)

114
The bottom part of the eastern, more marginal, core D21 from 333 to 237 cm depth represents the
mineral substrate consisting of gray clay with red mottles of oxidizing material upon exposure to air,
suggesting permanent anaerobic conditions at the time of deposition (Figure 8.4). Between 237 to 227
cm core depth a layer of organic mud is found. Hemic peat with fibers and large wood remains
characterizes the depth interval from 227 to 82 cm. A second organic mud layer is deposited from 140
to 118 cm depth. The top 82 cm of the core consists of fine and coarse hemic peat with fibers, wood
fragments and roots.
The mineral substrate of the central core B21 could not be reached after 750 cm coring and deeper
deposits could not be cored due to the difficulties in the field. The core mainly consists of coarse hemic
peat and several layers of fine hemic peat. Macro-remains of wood fragments and fibers are observed
from 424 to 68 cm depth. A layer of organic mud characterizes the core from 637 to 614 cm.
The bottom mineral substrate of the master core Jaw SPT consists of olive clay from 733 to 727 cm.
From 727 to 713 the sediments change to grayish-brown clay with silt and from 713 to 664 cm the
deposits consist of olive-brown silty clay. A transitional peaty-clay zone is found from 664 to 658 cm and
marks the beginning of peat accumulation. Fine to coarse hemic peat with wood fragments and fibers
characterizes the depths from 658 to 496 cm. From 496 to 219 cm depth the deposits consist mainly of
coarse hemic peat with fibers and wood fragments. From 219 up to 30 cm depth the sediment are
mainly fine hemic to coarse hemic peat with fibers and large wood remains. The top 30 cm of the master
core Jaw SPT consists of sapric (highly decomposed) peat with roots. Layers of organic mud are found
at 252–244, 545–532 and 565–550 cm core depth.
Chronology and peat accumulation rate of the master core Jaw SPT
Of fourteen samples dated with the AMS radiocarbon method, the three derived from woody material
are stratigraphically inconsistent (Table 8.1). The most likely explanation is that the wood samples were
in fact root material. As a consequence, two of the dates from the core Jaw SPT are treated as outliers
in the age-depth model (Figure 8.5). The best age-depth model fitted to the dates is a smoothing spline,
and reveals that the Jaw SPT record spans the last ca. 8600 cal yr BP. The peat accumulation starts at
664 cm core depth, ca. 7800 years ago. Peat accumulation rates per sample (mm/yr) are calculated
based on the sample ages estimated from the age-depth model. Based on this estimate, the average
peat accumulation rate from 664 cm to the top of the core is 0.9 mm/yr (min 0.5; max 1.6 mm/yr).
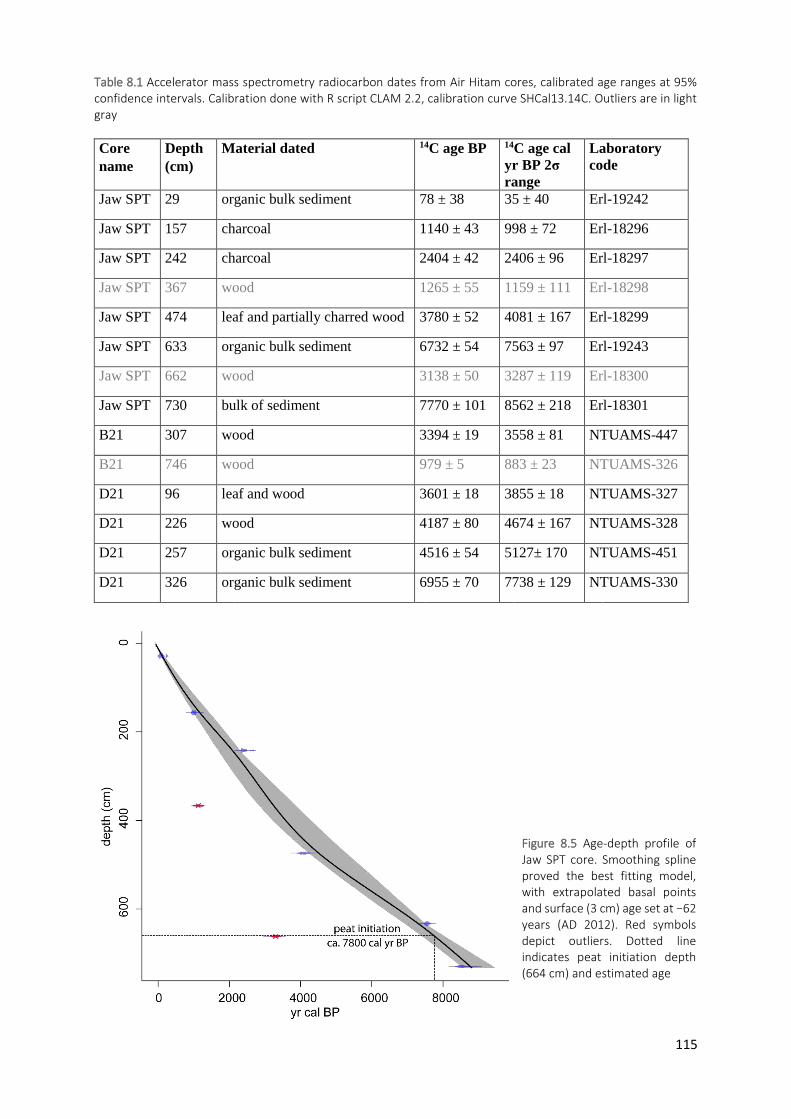
115
Table 8.1 Accelerator mass spectrometry radiocarbon dates from Air Hitam cores, calibrated age ranges at 95% confidence intervals. Calibration done with R script CLAM 2.2, calibration curve SHCal13.14C. Outliers are in light gray
Core
name
Depth
(cm)
Material dated 14C age BP
14C age cal
yr BP 2σ
range
Laboratory
code
Jaw SPT 29 organic bulk sediment 78 ± 38 35 ± 40 Erl-19242
Jaw SPT 157 charcoal 1140 ± 43 998 ± 72 Erl-18296
Jaw SPT 242 charcoal 2404 ± 42 2406 ± 96 Erl-18297
Jaw SPT 367 wood 1265 ± 55 1159 ± 111 Erl-18298
Jaw SPT 474 leaf and partially charred wood 3780 ± 52 4081 ± 167 Erl-18299
Jaw SPT 633 organic bulk sediment 6732 ± 54 7563 ± 97 Erl-19243
Jaw SPT 662 wood 3138 ± 50 3287 ± 119 Erl-18300
Jaw SPT 730 bulk of sediment 7770 ± 101 8562 ± 218 Erl-18301
B21 307 wood 3394 ± 19 3558 ± 81 NTUAMS-447
B21 746 wood 979 ± 5 883 ± 23 NTUAMS-326
D21 96 leaf and wood 3601 ± 18 3855 ± 18 NTUAMS-327
D21 226 wood 4187 ± 80 4674 ± 167 NTUAMS-328
D21 257 organic bulk sediment 4516 ± 54 5127± 170 NTUAMS-451
D21 326 organic bulk sediment 6955 ± 70 7738 ± 129 NTUAMS-330
Figure 8.5 Age-depth profile of Jaw SPT core. Smoothing spline proved the best fitting model, with extrapolated basal points and surface (3 cm) age set at −62 years (AD 2012). Red symbols depict outliers. Dotted line indicates peat initiation depth (664 cm) and estimated age

116
Palynological results
The pollen diagram shows the paleovegetation groups and the most important pollen and spore taxa
(Figure 8.6a and b). A total of 242 different pollen and spore types were identified including 87 rare still
unknown types. The complete list of taxa groups can be found in the Table 8.2. Based on the constrained
cluster analysis, 7 pollen and spore assemblage zones, Jaw-I to Jaw-VII are separated (Table 8.3). The
most abundant group is represented by peat swamp taxa which oscillate between percentages of 3 and
86%. Within this group, particularly from zone Jaw-III to Jaw-VI, pollen grains of Pandanus dominate
(average for these zones 35%). After Pandanus, the most abundant pollen taxa of peat swamp are
Parastemon (average 7%), Campnosperma (average 5%), Ilex (average 4%), Garcinia cuneifolia type
(average 3%) and Austrobuxus (average 2%). The group of dipterocarp-swamp mixed rainforest shows
mostly high values in zones Jaw-I and Jaw-II (average for the zones 21%; up to 43%). The
Dipterocarpaceae are represented in order of importance by Hopea, Shorea, Dryobalanops and
Dipterocarpus. Beside dipterocarps, important taxa of the group are Stemonurus type (average 2%),
Cephalomappa (average 2%) and Stenochlaena palustris (up to 2%). Durio (average 6%; up to 44%),
Blumeodendron (average 2%; up to 23%) and Calamus (average 1%; up to 5%) are the most common of
the freshwater swamp group, particularly in zone Jaw-II. Open and pioneer taxa are mostly represented
by Nephrolepis biserrata (average 4%), Ficus type (average 3%), Elaeocarpaceae (average 3%), and
Macaranga/Mallotus (average 2%; Table 8.3).
Testate amoebae results
A total of 78 testate amoebae taxa were recorded. The most common taxa are Hyalosphenia subflava
(average 56% of the total sum; 21 size-based morphotypes), Hyalosphenia minuta (6.4%), Cyclopyxis
eurystoma parvula (4.9%) and Pyxidicula invisitata (2.9%). For details on most important environmental
groups and taxa see Figure 8.6c, d and Table 8.3.
Diversity indices and palynological compositional change or turnover
The palynological diversity indices (DIs) remain rather uniform along the core (average 6 ET(10)).
However, lower values are found in zone Jaw-IV when Pandanus pollen dominates the palynological
assemblage (average 4 ET(10); Figure 8.6a). The testate amoeba DI varied more (Figure 8.6c) with ET(28)
averaging by 6.
The first time-constrained DCCA axis shows that total turnover or PCC at Air Hitam for the past ca. 7800
cal yr BP is 2.1 SD (Figure 8.6a). Such a value is indicative of large differences between samples in the
dataset (Hill and Gauch 1980), thus it indicates that important changes occurred in the community
composition.

117
The range of compositional turnover changes strongly from zone Jaw-II to III and Jaw-VI to VII. A lesser-
marked change is recorded at the passage from Jaw-V to VI.
Ordination results (PCA)
The PCA clearly separates the vegetation compositions of the zones Jaw-I and II from the remaining
zones Jaw-IV to VI (axis 1; Figure 8.7), while vegetation compositions of the last anthropogenic zone Jaw-
VII markedly separates from all other zones (Figure 8.7). The testate amoebae environmental groups
and size classes, used as supplementary variables, explain 32% of the total variation. Water group and
the larger size tests score negative on the second axis and are driven towards the first two zones Jaw-I
and II. The opposite trend is observed for the smaller tests, green moss and soil groups, which score
positive. The peat moss group and the medium size tests score negative on both axes.
Macro-charcoal and fire history
The macro-charcoal analysis of the Jaw SPT record, characterize the fire history at the site for the past
7800 years (Figure 8.6a). The local signal-to-noise index always exceeded 3, indicating a good separation
between peak and non-peak values. The most recent peak-fire event is detected at ca. AD 2001 (−51 yr
cal BP; 5 cm depth). The approximated synchronicity between the period of forest conversion (WWF
Indonesia 2010) and the recent charcoal peak support the assumption that identified charcoal peaks
detectmajor local fire episodes. The mean fire return interval (95% confident interval) for the whole
record is 133 yr (106–160 yr) indicating that large fire episodes have been rare on the peat dome for
the past 7800 years. However, changes in fire regime are visible from the fire frequencies at the
centennial time scale (Figure 8.6a). A total of 60 fire episodes occurred locally during the past 7800
years, 1 fire episode failed to pass the ‘Poisson minimum-count' screening test. Fire frequencies are low
in the zones Jaw-I, II, V and VI. Higher fire frequencies are recorded in the zones Jaw-III, IV and VII. High
magnitude peaks are found in the zones Jaw-II, V and VI (Table 8.3; Figure 8.6a).
Interpretation and discussion
Opposite to most temperate and boreal peatlands, the vegetation of natural lowland tropical freshwater
swamp and peat swamp forests is dominated by trees (Page et al. 1999). The majority of the tree families
of lowland dipterocarp forests of SE Asia can live and proliferate in freshwater swamp and peat swamp
forests. However, increasing peat thickness leads to markedly different nutrient and oxygen availability
and as a consequence vegetation composition (Anderson 1983). One important parameter is
represented by flooding and riverine influence on the system. In general, the margin of the domes,
where flooding occurs are richer in nutrients, while the more central thick peat deposits are poorer in
nutrients, are acidic and have low dissolved oxygen (Anderson 1961; Esterle and Ferm 1994).
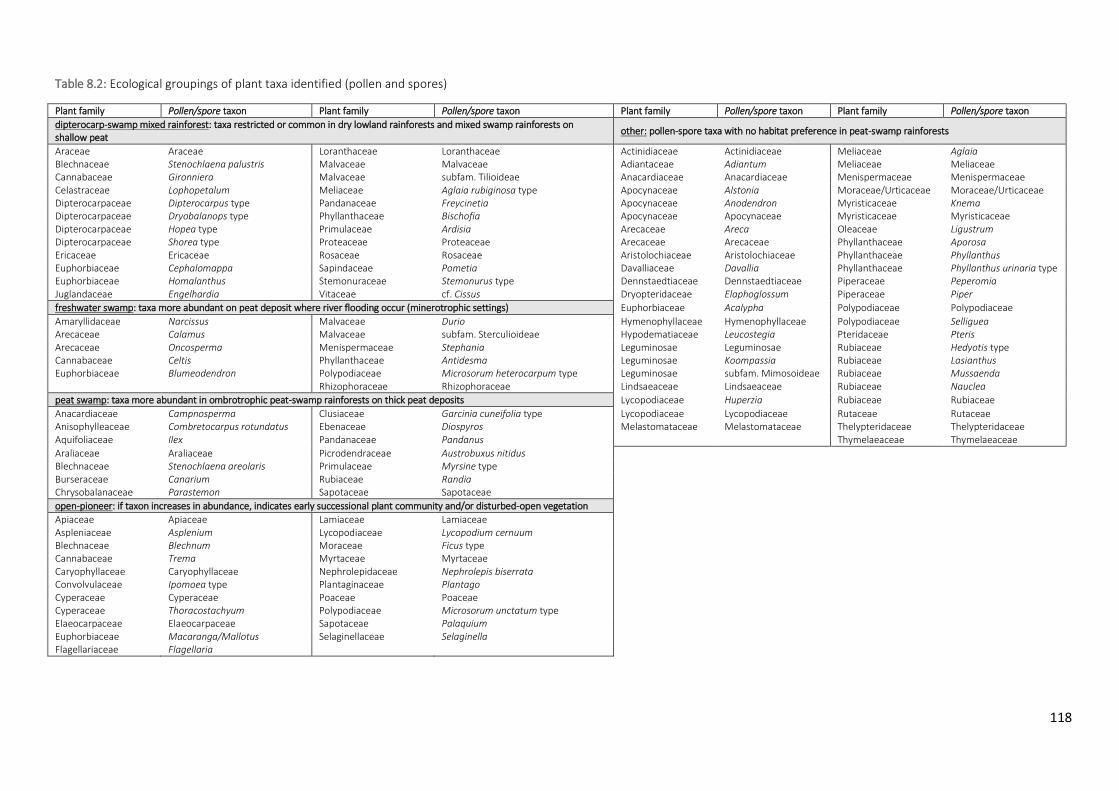
118
Table 8.2: Ecological groupings of plant taxa identified (pollen and spores)
Plant family Pollen/spore taxon Plant family Pollen/spore taxon Plant family Pollen/spore taxon Plant family Pollen/spore taxon
dipterocarp-swamp mixed rainforest: taxa restricted or common in dry lowland rainforests and mixed swamp rainforests on shallow peat
other: pollen-spore taxa with no habitat preference in peat-swamp rainforests
Araceae Araceae Loranthaceae Loranthaceae Actinidiaceae Actinidiaceae Meliaceae Aglaia Blechnaceae Stenochlaena palustris Malvaceae Malvaceae Adiantaceae Adiantum Meliaceae Meliaceae Cannabaceae Gironniera Malvaceae subfam. Tilioideae Anacardiaceae Anacardiaceae Menispermaceae Menispermaceae Celastraceae Lophopetalum Meliaceae Aglaia rubiginosa type Apocynaceae Alstonia Moraceae/Urticaceae Moraceae/Urticaceae Dipterocarpaceae Dipterocarpus type Pandanaceae Freycinetia Apocynaceae Anodendron Myristicaceae Knema Dipterocarpaceae Dryobalanops type Phyllanthaceae Bischofia Apocynaceae Apocynaceae Myristicaceae Myristicaceae Dipterocarpaceae Hopea type Primulaceae Ardisia Arecaceae Areca Oleaceae Ligustrum Dipterocarpaceae Shorea type Proteaceae Proteaceae Arecaceae Arecaceae Phyllanthaceae Aporosa Ericaceae Ericaceae Rosaceae Rosaceae Aristolochiaceae Aristolochiaceae Phyllanthaceae Phyllanthus Euphorbiaceae Cephalomappa Sapindaceae Pometia Davalliaceae Davallia Phyllanthaceae Phyllanthus urinaria type Euphorbiaceae Homalanthus Stemonuraceae Stemonurus type Dennstaedtiaceae Dennstaedtiaceae Piperaceae Peperomia Juglandaceae Engelhardia Vitaceae cf. Cissus Dryopteridaceae Elaphoglossum Piperaceae Piper
freshwater swamp: taxa more abundant on peat deposit where river flooding occur (minerotrophic settings) Euphorbiaceae Acalypha Polypodiaceae Polypodiaceae
Amaryllidaceae Narcissus Malvaceae Durio Hymenophyllaceae Hymenophyllaceae Polypodiaceae Selliguea Arecaceae Calamus Malvaceae subfam. Sterculioideae Hypodematiaceae Leucostegia Pteridaceae Pteris Arecaceae Oncosperma Menispermaceae Stephania Leguminosae Leguminosae Rubiaceae Hedyotis type Cannabaceae Celtis Phyllanthaceae Antidesma Leguminosae Koompassia Rubiaceae Lasianthus Euphorbiaceae Blumeodendron Polypodiaceae Microsorum heterocarpum type Leguminosae subfam. Mimosoideae Rubiaceae Mussaenda Rhizophoraceae Rhizophoraceae Lindsaeaceae Lindsaeaceae Rubiaceae Nauclea
peat swamp: taxa more abundant in ombrotrophic peat-swamp rainforests on thick peat deposits Lycopodiaceae Huperzia Rubiaceae Rubiaceae
Anacardiaceae Campnosperma Clusiaceae Garcinia cuneifolia type Lycopodiaceae Lycopodiaceae Rutaceae Rutaceae Anisophylleaceae Combretocarpus rotundatus Ebenaceae Diospyros Melastomataceae Melastomataceae Thelypteridaceae Thelypteridaceae Aquifoliaceae Ilex Pandanaceae Pandanus Thymelaeaceae Thymelaeaceae
Araliaceae Araliaceae Picrodendraceae Austrobuxus nitidus Blechnaceae Stenochlaena areolaris Primulaceae Myrsine type Burseraceae Canarium Rubiaceae Randia Chrysobalanaceae Parastemon Sapotaceae Sapotaceae
open-pioneer: if taxon increases in abundance, indicates early successional plant community and/or disturbed-open vegetation
Apiaceae Apiaceae Lamiaceae Lamiaceae Aspleniaceae Asplenium Lycopodiaceae Lycopodium cernuum Blechnaceae Blechnum Moraceae Ficus type Cannabaceae Trema Myrtaceae Myrtaceae Caryophyllaceae Caryophyllaceae Nephrolepidaceae Nephrolepis biserrata Convolvulaceae Ipomoea type Plantaginaceae Plantago Cyperaceae Cyperaceae Poaceae Poaceae Cyperaceae Thoracostachyum Polypodiaceae Microsorum unctatum type Elaeocarpaceae Elaeocarpaceae Sapotaceae Palaquium Euphorbiaceae Macaranga/Mallotus Selaginellaceae Selaginella Flagellariaceae Flagellaria
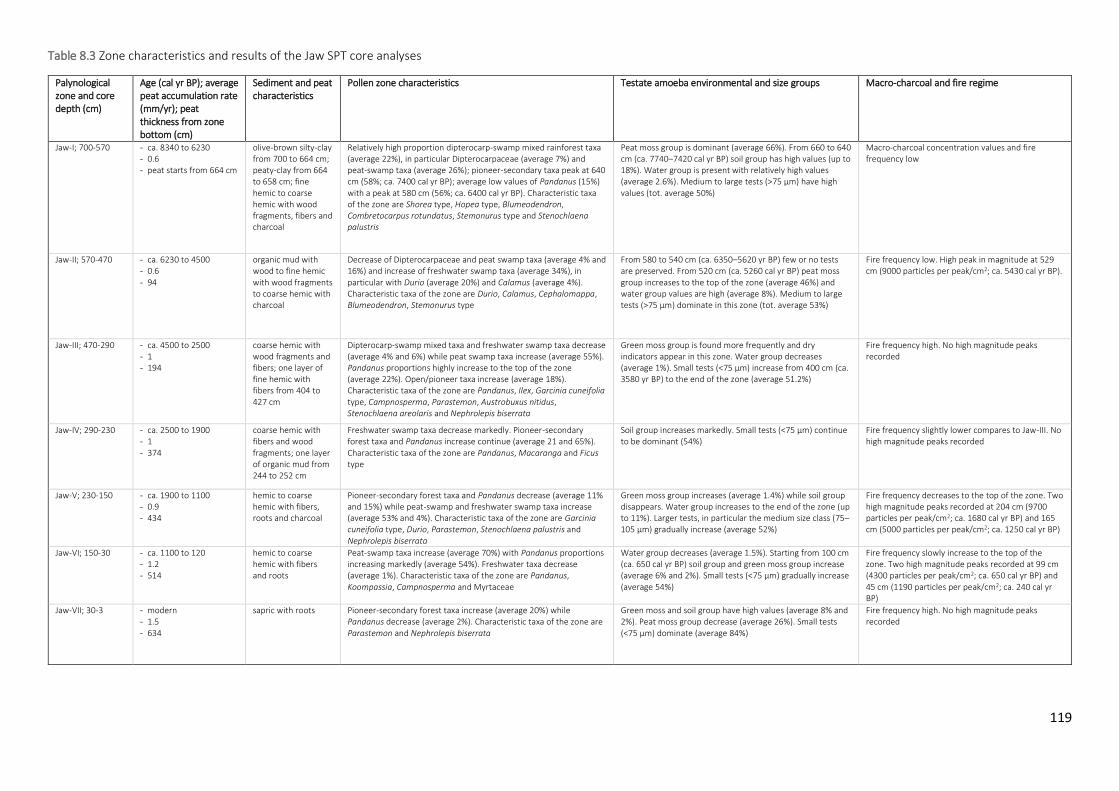
119
Table 8.3 Zone characteristics and results of the Jaw SPT core analyses
Palynological zone and core depth (cm)
Age (cal yr BP); average peat accumulation rate (mm/yr); peat thickness from zone bottom (cm)
Sediment and peat characteristics
Pollen zone characteristics Testate amoeba environmental and size groups
Macro-charcoal and fire regime
Jaw-I; 700-570
- ca. 8340 to 6230 - 0.6 - peat starts from 664 cm
olive-brown silty-clay from 700 to 664 cm; peaty-clay from 664 to 658 cm; fine hemic to coarse hemic with wood fragments, fibers and charcoal
Relatively high proportion dipterocarp-swamp mixed rainforest taxa (average 22%), in particular Dipterocarpaceae (average 7%) and peat-swamp taxa (average 26%); pioneer-secondary taxa peak at 640 cm (58%; ca. 7400 cal yr BP); average low values of Pandanus (15%) with a peak at 580 cm (56%; ca. 6400 cal yr BP). Characteristic taxa of the zone are Shorea type, Hopea type, Blumeodendron, Combretocarpus rotundatus, Stemonurus type and Stenochlaena palustris
Peat moss group is dominant (average 66%). From 660 to 640 cm (ca. 7740–7420 cal yr BP) soil group has high values (up to 18%). Water group is present with relatively high values (average 2.6%). Medium to large tests (>75 μm) have high values (tot. average 50%)
Macro-charcoal concentration values and fire frequency low
Jaw-II; 570-470 - ca. 6230 to 4500 - 0.6 - 94
organic mud with wood to fine hemic with wood fragments to coarse hemic with charcoal
Decrease of Dipterocarpaceae and peat swamp taxa (average 4% and 16%) and increase of freshwater swamp taxa (average 34%), in particular with Durio (average 20%) and Calamus (average 4%). Characteristic taxa of the zone are Durio, Calamus, Cephalomappa, Blumeodendron, Stemonurus type
From 580 to 540 cm (ca. 6350–5620 yr BP) few or no tests are preserved. From 520 cm (ca. 5260 cal yr BP) peat moss group increases to the top of the zone (average 46%) and water group values are high (average 8%). Medium to large tests (>75 μm) dominate in this zone (tot. average 53%)
Fire frequency low. High peak in magnitude at 529 cm (9000 particles per peak/cm2; ca. 5430 cal yr BP).
Jaw-III; 470-290
- ca. 4500 to 2500 - 1 - 194
coarse hemic with wood fragments and fibers; one layer of fine hemic with fibers from 404 to 427 cm
Dipterocarp-swamp mixed taxa and freshwater swamp taxa decrease (average 4% and 6%) while peat swamp taxa increase (average 55%). Pandanus proportions highly increase to the top of the zone (average 22%). Open/pioneer taxa increase (average 18%). Characteristic taxa of the zone are Pandanus, Ilex, Garcinia cuneifolia type, Campnosperma, Parastemon, Austrobuxus nitidus, Stenochlaena areolaris and Nephrolepis biserrata
Green moss group is found more frequently and dry indicators appear in this zone. Water group decreases (average 1%). Small tests (<75 μm) increase from 400 cm (ca. 3580 yr BP) to the end of the zone (average 51.2%)
Fire frequency high. No high magnitude peaks recorded
Jaw-IV; 290-230
- ca. 2500 to 1900 - 1 - 374
coarse hemic with fibers and wood fragments; one layer of organic mud from 244 to 252 cm
Freshwater swamp taxa decrease markedly. Pioneer-secondary forest taxa and Pandanus increase continue (average 21 and 65%). Characteristic taxa of the zone are Pandanus, Macaranga and Ficus type
Soil group increases markedly. Small tests (<75 μm) continue to be dominant (54%)
Fire frequency slightly lower compares to Jaw-III. No high magnitude peaks recorded
Jaw-V; 230-150
- ca. 1900 to 1100 - 0.9 - 434
hemic to coarse hemic with fibers, roots and charcoal
Pioneer-secondary forest taxa and Pandanus decrease (average 11% and 15%) while peat-swamp and freshwater swamp taxa increase (average 53% and 4%). Characteristic taxa of the zone are Garcinia cuneifolia type, Durio, Parastemon, Stenochlaena palustris and Nephrolepis biserrata
Green moss group increases (average 1.4%) while soil group disappears. Water group increases to the end of the zone (up to 11%). Larger tests, in particular the medium size class (75–105 μm) gradually increase (average 52%)
Fire frequency decreases to the top of the zone. Two high magnitude peaks recorded at 204 cm (9700 particles per peak/cm2; ca. 1680 cal yr BP) and 165 cm (5000 particles per peak/cm2; ca. 1250 cal yr BP)
Jaw-VI; 150-30
- ca. 1100 to 120 - 1.2 - 514
hemic to coarse hemic with fibers and roots
Peat-swamp taxa increase (average 70%) with Pandanus proportions increasing markedly (average 54%). Freshwater taxa decrease (average 1%). Characteristic taxa of the zone are Pandanus, Koompassia, Campnosperma and Myrtaceae
Water group decreases (average 1.5%). Starting from 100 cm (ca. 650 cal yr BP) soil group and green moss group increase (average 6% and 2%). Small tests (<75 μm) gradually increase (average 54%)
Fire frequency slowly increase to the top of the zone. Two high magnitude peaks recorded at 99 cm (4300 particles per peak/cm2; ca. 650 cal yr BP) and 45 cm (1190 particles per peak/cm2; ca. 240 cal yr BP)
Jaw-VII; 30-3
- modern - 1.5 - 634
sapric with roots Pioneer-secondary forest taxa increase (average 20%) while Pandanus decrease (average 2%). Characteristic taxa of the zone are Parastemon and Nephrolepis biserrata
Green moss and soil group have high values (average 8% and 2%). Peat moss group decrease (average 26%). Small tests (<75 μm) dominate (average 84%)
Fire frequency high. No high magnitude peaks recorded
120
Vegetation composition changes depending on the adaptation of different taxa to these boundary
conditions. Marginal and more central-high communities were classified accordingly to Anderson into
species associations or “Phasic Communities” (Anderson 1961; Anderson 1964; Anderson 1983).
Available studies on peat domes in SE Asia (Figure 8.1) reveal that highly diverse swamp forests, where
trees are large (>45 m height, 2–4 m girth) and understory plants are dense, are found on the margins
of the deposits, where peat is shallow and flooding by rivers common. In response to flooding and
standing water, trees develop buttressed roots and pneumatophores. These marginal forest
communities have been described by Esterle and Ferm (1994) as freshwater swamp or well flooded
swamps. In the central more topographically elevated areas, river flooding does not occur and most of
the nutrients available to plants come from rainfall (Esterle and Ferm 1994). As a consequence,
vegetation is less diverse and the trees that can cope with the limited nutrients are reduced in their size.
To these forests is given the descriptive name of ‘pole forest’ (Brady 1997) or Phasic Community IV after
Anderson (1963). Understory and subcanopy plants are sparse and adapted to poor in nutrient-acidic
conditions such as Pandanus. Anderson described a ‘climax’ phase in the Baram River area in Borneo
which was named ‘savanna like’ due to the characteristic open appearance. This forest was dominated
by Combretocarpus rotundatus and small shrubs with the ground covered with moss and pitcher plants
(Phasic Community VI after Anderson 1963).
The following interpretation of the paleoenvironment and vegetation phases at the Air Hitampeat dome
take into account the vegetation phasic community descriptions currently available from SE Asian
peatlands (Figure 8.1).
Studies on pollen dispersal in peat and swamp rainforests are rare (e.g. Anderson and Muller 1975;
Morley 1981) and cannot be applied outside the specific site studied due to the uniqueness of each
deposition environment and vegetation structure. However, in general, the pollen signal is strongly
localized due to the closed canopy of tropical peat swamp rainforests, which limits regional deposition
by wind and the strategy of tropical rainforests plants which are mostly animal pollinated as noted by
Anderson and Muller (1975). However, on the more marginal or shallower peat deposits, where river
flooding occurs, pollen can be transported by water from a longer distance and incorporated into the
peat deposit (Morley 1981). Additionally, gap-phases within the peat swamp rainforest caused by wind
disturbance or even fires could lead to a misinterpretation of a disturbance/secondary vegetation phase
as true vegetation succession phase. Although these effects on the pollen deposition cannot be ruled
out for the Jaw SPT palynological reconstruction, the high presence of peat swamp taxa through the
record, suggests the main component of the palynological assemblage was made of the plants growing
on the Air Hitam peatland. In order to downscale the effects of short-lived gap phases and local
overrepresentation, the results are interpreted according to average trends via locally weighted
scatterplot smoothing (LOWESS) fitted to the sample values (black lines on Figure 8.6a and b).

121
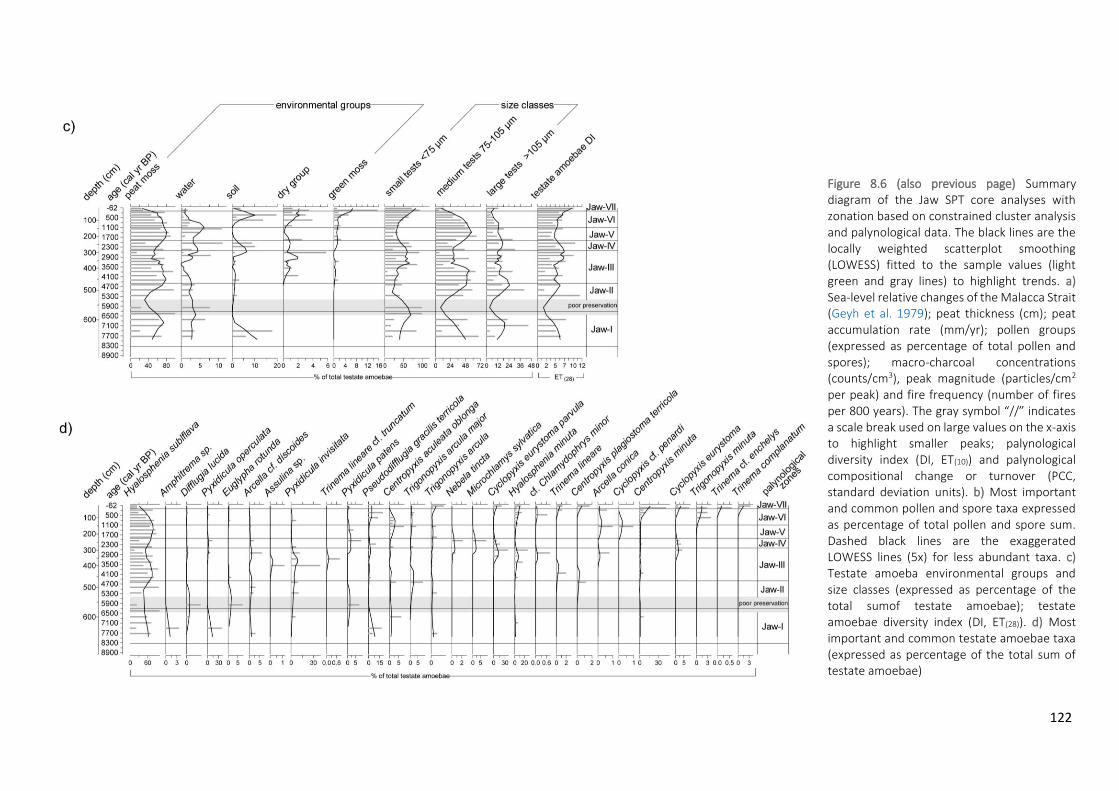
122
Figure 8.6 (also previous page) Summary diagram of the Jaw SPT core analyses with zonation based on constrained cluster analysis and palynological data. The black lines are the locally weighted scatterplot smoothing (LOWESS) fitted to the sample values (light green and gray lines) to highlight trends. a) Sea-level relative changes of the Malacca Strait (Geyh et al. 1979); peat thickness (cm); peat accumulation rate (mm/yr); pollen groups (expressed as percentage of total pollen and spores); macro-charcoal concentrations (counts/cm3), peak magnitude (particles/cm2 per peak) and fire frequency (number of fires per 800 years). The gray symbol “//” indicates a scale break used on large values on the x-axis to highlight smaller peaks; palynological diversity index (DI, ET(10)) and palynological compositional change or turnover (PCC, standard deviation units). b) Most important and common pollen and spore taxa expressed as percentage of total pollen and spore sum. Dashed black lines are the exaggerated LOWESS lines (5x) for less abundant taxa. c) Testate amoeba environmental groups and size classes (expressed as percentage of the total sumof testate amoebae); testate amoebae diversity index (DI, ET(28)). d) Most important and common testate amoebae taxa (expressed as percentage of the total sum of testate amoebae)
123
Environmental changes and palaeovegetation community phases
Peat forming vegetation phase Jaw-I (ca. 8340-6230 cal yr BP, 700-570 cm)
According to the basal radiocarbon age of the Jaw SPT core, peat started to accumulate on the northern
section since at least 7800 years ago (640 cm core depth; Figure 8.5).
Testate amoebae were not preserved in the basal mineral deposits. As the peat started to accumulate,
medium to large tests dominated the assemblages suggesting that thewater table was high. However,
indicators of wet (for e.g. Amphitrema sp. and Pyxidicula operculata) and drier (for e.g. Hyalosphenia
minuta) conditions were alternatively abundant, suggesting that large fluctuations also occurred in this
phase. Stenochlaena palustris is a scrambling high-climbing epiphyte common in periodically inundated
areas, where the lower parts of the rhizome are frequently submerged. The high frequency of spores of
Stenochlaena palustris in this phase confirms that the site was periodically subject to flooding.
In this initial phase fine hemic peat indicates that the decomposition of the organic matter and
humification were relatively high, while the presence of abundant wood fragments confirms that dense
arborescent vegetation covered the area, possibly maintained by flooding, which can promote high
biomass production but also high degree of decay. The vegetation as reconstructed from palynological
analysis indicates a well-developed lowland rainforest covered the area with the high canopy
constituted by Dipterocarpaceae and Koompassia trees. The sub-canopy was a mixed-swamp rainforest,
with species such as Blumeodendron, Combretocarpus rotundatus and Campnosperma trees.
Freshwater swamp rainforest phase Jaw-II (ca. 6230-4500 cal yr BP, 570-470 cm)
During this period the palynological analysis reveals that the lowland Dipterocarpaceae-mixed rainforest
taxa were slowly replaced by freshwater swamp taxa. The rattan Calamus is common in freshwater
swamp forest and it has also been found in peat swamp forest and on alluvial flats (Anderson and Muller
1975). Currently 8 species (1 endemic) of Durio are found in Sumatra (Lemmens et al. 1995). These are
small to large trees (up to 50–60 m) with buttresses and pneumatophores (knee roots) present in trees
growing in marshy places. Durio carinatus was found to be the dominant tree in the mixed swamp
rainforest in Riau in Sumatra (Anderson 1976). The increasing trend of, first Calamus (from 560 to 520
cm; from 6000 to 5300 cal yr BP) and then Durio pollen (from 520 to 480 cm; from 5300 to 4600 cal yr
BP) suggests that a gradual change from freshwater to waterlogged-marshy conditions occurred in this
phase. The poor preservation of testate amoebae in the lower part of this zone until ca. 5620 cal yr BP
(540 cm) corresponds to a phase in which organic mud was deposited. Therefore, the reduced presence
of testate amoebae might be a consequence of increasing river flooding and anoxic conditions, as also
indicated by the peak of very small cosmopolitan less-sensitive (eurybiotic) and water demanding
(hydrobiotic) testate amoebae taxa like Eughlypha rotunda, Difflugia lucida and Pyxidicula patens.

124
Following this initial phase, the testate amoebae assemblage is dominated by medium-large tests
confirming that the water table was high, suggesting waterlogged conditions (Figure 8.6c). Parallel to
the establishment of a swampy Durio-dominated vegetation, the reappearance of testate amoebae such
as Trigonopyxis arcula and the peaks in Trigonopyxis arcula major and Centropyxis plagiostoma terricola
indicate a gradual change from a system where most of water is coming from water flowing through
mineral soil (minerotrophic settings) and waterlogged anoxic conditions to relatively drier rainfall-fed
ombrotrophic acidic conditions.
Pole forest phase Jaw-III (ca. 4500-2500 cal yr BP, 470-290 cm)
A strong change in vegetation composition occurred around 4500 years ago as indicated by the marked
shift in PCC. Freshwater swamp pollen taxa decreased abruptly indicating that the effects of river
flooding became negligible in this phase. The strong increase of Pandanus pollen indicates thickets
formed in the area as also confirmed by the occurrences of spores of Stenochlaena areolaris, a common
epiphyte on Pandanus (Anderson and Muller 1975), so far reported only in the Philippines and Papua
New Guinea (Chambers 2013) and found extinct in Borneo (Anderson and Muller 1975). The water
group of testate amoebae decreased in this zone and the larger tests indicative of free standing water
were gradually replaced by smaller sized taxa such as Centropyxis minuta, Pseudodifflugia gracilis
terricola and Hyalosphenia minuta toward the top of the zone, confirming decreased water availability.
Testate amoebae indicating drier conditions such as Assulina sp. and Trinema lineare cf. truncatum also
occurred in this zone for the first time, suggesting that the water table was more regularly below the
ground surface. A wet phase characterized the period from ca. 2900 to 2700 cal yr BP (330–310 cm
depth) with the increase of testate amoebae taxa such as Arcella cf. discoides and Arcella conica,
Pyxidicula operculata, P. invisitata and cf. Chlamydophrys minor.
The increase of Campnosperma pollen started at the end of the previous phase and the presence
remained strong in this period. Of the two species of Campnosperma found in Sumatra, Campnosperma
coriaceum possess pneumatophorous roots and occurs gregariously in peat swamp with oligotrophic
water while Campnosperma auriculatum can be codominant in freshwater swamps in places regularly
inundated by euthropic water (Endert 1920; Wyatt-Smith 1959). It is not possible to distinguish
palynologically species of the genus Campnosperma. However, the decrease of freshwater swamp taxa
in this phase suggests that the major contributor of the Campnosperma pollen was Campnosperma
coriaceum. Dense thickets of the terrestrial fern Nephrolepis biserrata are often formed in completely
open secondary forest especially after fires (Anderson 1963). The fire frequency increased markedly in
this zone as a greater number of fire episodes are detected from the macro-charcoal peak detection
analysis. The increase of spores from Nephrolepis biserrata also indicate that the structure of the forest
changed to a more open as the spread of Nephrolepis biserrata is enhanced by open light conditions.
The more open structure of the vegetation is further highlighted by the increasing presence of
125
Autrobuxus and Ilex which are common trees in more open stands of peat swamp rainforests (Phasic
community IV after Anderson).
To the genus Parastemon belong tall trees which are common in peat swamp forests. Parastemon
urophyllus is the only species reported in Sumatra and it is common in open scrub forest and in the
Padang forest from Riau (notophyllous pole forest or Phasic community IV after Anderson). The increase
of Parastemon pollen in this phase suggests that trees belonging to this genus were adapted to more
open disturbed conditions. The relative high abundance of pollen of the giant trees of the genus
Koompassia indicates that high canopy trees grew around the site.
The environmental conditions reconstructed in this phase resemble the “Padang forest” after Anderson
(Phasic communities IV–VI, Anderson 1983) or pole forest of Brady (1997). However, dominant species
composition differs from that found elsewhere with the most abundant taxa being Pandanus, Ilex,
Campnosperma, Garcinia cuneifolia type, Parastemon and Austrobuxus.
In this phase the peat accumulation rate increased from an average 0.6 mm/yr to 1 mm/yr suggesting
that the decomposition decreased and/or the accumulation of biomass increased (Figure 8.6a and Table
8.3). A decrease in decomposition rate is suggested from the characteristics of the peat which changes
to less decomposed-coarser hemic material. The increase in peat accumulation rate closely followed
Pandanus expansion while testate amoeba results suggest that the water table was on average lower
and fluctuations smaller compared to the previous dipterocarp-mixed and freshwater swamp phases.
Pandanus thickets have massive interlocking root system which are quite resistant to decay (Phillips and
Bustin 1998) thus their expansion might have act as an important driver for increasing peat
accumulation rate at Air Hitam. Additionally, since the river influence decreased as indicated by the
reduced importance of freshwater swamp taxa, all water and nutrients were received from precipitation
leading to a nutrient-poor environment (ombrotrophic settings). Such conditions might have reduced
the efficiency of decomposer organisms leading to decrease in humification as also indicated by peat
composition.
“Savanna” phase Jaw-IV (ca. 2500-1900 cal yr BP, 290-230 cm)
In this phase Pandanus thickets dominated and the lower palynological diversity (DI) suggests fewer
species were present at the site. High values of Ficus type and pioneer taxa such as Macaranga, suggest
a strongly opened vegetation. Opposite to the model of peat development in the Batang Hari coastal
peat dome (Esterle and Ferm 1994), this phase of Pandanus thickets are not accompanied by ponds on
the surface as indicated by the dominance of small tests. Fire episodes continue to be common as
indicated by high fire frequency. The relatively dry and open connotation of this phase resembles the
“savanna” phase observed in the Baram area, on thick peat in central areas and disturbed patches
(Anderson 1963). However, the vegetation composition reconstructed from Air Hitam is markedly
different in respect to species composition. While in Baram, Combretocarpus rotundatus dominates the
126
communities, palynological results from this phase, suggest that Pandanus, Ficus and Macaranga were
the most important taxa at Air Hitam. The increase of green moss group and dry indicator taxa like
Nebela tincta in the testate amoeba assemblage further confirm this reconstruction. Cyclopyxis
eurystoma and C. eurystoma parvula started to increase in the previous zone and are characteristic of
the assemblage in this phase. They are small eurybiotic taxa and their presence in this zone suggests
conditions were less suitable for other taxa more sensitive to environmental disturbance.
Peat-swamp rainforest phase Jaw-V (ca. 1900-1100 cal yr BP, 230-150 cm)
From ca. 1900 cal yr BP, Pandanus and pioneers started to decrease while freshwater swamp and peat
swamp taxa increased, suggesting the recovery of peat swamp vegetation at the study site. The peat
accumulation slightly decreased, likely as a consequence of increasing decomposition as suggested by
the occurrence of finer hemic peat layers in this phase. The increase in the medium to large-size tests
and hydrobiotic taxa (e.g. Centropyxis aculeata oblonga, Arcella conica, Cyclopyxis cf. penardi) indicate
increase in water availability. It is possible that the water channel, which today passes close to the Jaw
SPT, formed in this phase. The flooding of the area occurred as is also indicated by the increased
frequency of Stenochlaena palustris. The fire frequency decreased markedly. However, several fire
peaks of high magnitude were recorded in this phase, suggesting that fire episodes were accompanied
by a local increase in biomass burning. This could either indicate that the vegetation which characterized
this phase was more sensitive to fire and/or fires affected larger areas. However, the increase in fire
magnitude might also be linked to paleoclimatic conditions. Numerous paleorecords recording ENSO
amplitude and frequency in the Holocene, indicate that the period between 2000 and 1200 cal yr BP
might have been characterized by particularly severe El Niño episodes (Dommain et al. 2011 and
reference therein). These strong paleo-El Niños and drought associated, would have increased fire
susceptibility of the moisture sensitive peat swamp taxa, thus enhancing and magnifying the effects on
the vegetation when fires occurred.
Pole forest phase Jaw-VI (ca. 1100-120 cal yr BP, 150-30 cm)
A marked increase in Pandanus characterizes this phase. Small-size tests and indicators of drier
condition such as Hyalosphenia minuta and Trigonopyxis minuta, increased to the top of the zone. The
reconstruction suggests that water table fluctuations were low and the ecological conditions were
similar to those reconstructed from the zones Jaw-III and IV. As in these zones, again peat accumulation
rates increase from average 0.9 mm/yr to 1.2 mm/yr, parallel to the expansion of Pandanus. However,
despite that Pandanus dominated this phase, diversity remained relatively high (average 5 Et(10)),
suggesting that a well-developed peat swamp rainforest surrounded the site with Koompassia, Shorea
and Hopea as emergent trees and Campnosperma, Ilex and Garcinia cuneifolia as understory trees. Fire
frequencies increased to the top of the zone and several peaks of high magnitude were recorded.
127
Modern anthropogenic disturbance Jaw-VII (modern, 30-3 cm)
The top 30 cm of the Jaw SPT core are markedly different from the remaining deposit (Figs. 6 and 7).
Highly decomposed sapric peat with root remains characterize this layer and the peat accumulation rate
is high. However, as pointed out by Dommain et al. (2011) the rates of peat accumulation on the surface
peat layer (acrotelm) are biased by the greater presence of decomposing organic material and living
biomass and might not represent a realistic estimate of the recent rates of peat accumulation. The
presence of this top layer of sapric peat might conform to the model of Esterle and Ferm (1994) in which
they assume intense degradation of surface material and preservation of root biomass beneath the
surface of the peat. As peat accumulate, the stratigraphic sequence is a function of vegetation
(particularly roots) and humification at the time of the burial of peat underneath the water table (Esterle
and Ferm 1994).
The greatest vegetation turnover as reconstructed from the palynological analysis occurred in this
phase. Pandanus and emergent trees such as Hopea, Shorea and Koompassia disappear and Parastemon
and thickets of Nephrolepis biserrata dominates at the site, also observed in the field during the coring.
The strong human impact in this modern phase is further highlighted by the increase in fire frequency.
It remains uncertain why Parastemon was not subjected to logging while virtually all other large trees
were removed. It might be related to the fact that the wood from this species is hard to use because of
the silica content. The testate amoebae assemblage shows a marked change from peat moss to green
moss and soil dominating communities and small-size tests dominate in this phase. The high presence
of eurybiotic species such as Trinema spp., Cyclopyxis eurystoma and Cyclopyxis eurystoma parvula,
indicates that environmental conditions were less favorable for testate amoeba species compare to the
previous phases. While most of the Air Hitam peat dome was converted to oil palm plantations following
intense logging in the 1990s, this small portion of land was not converted. However, the logging and the
creation of a net of drainage channels on the dome to reduce water table height strongly changed the
structure and composition of the vegetation and therefore conditions of the peat at the site.
Similarities/dissimilarities of the vegetation phases
With the exception of the last modern phase, the results from the PCA including all taxa, generally
confirm a clear separation between the vegetation composition in the first two phases when
minerotrophic conditions persisted and the following ombrotrophic phases (Figure 8.7). As indicated by
the large shift in PCC from Jaw-II to Jaw-III, species composition changed overall. General observations
on tropical SE Asian peatlands, indicate that freshwater swamp and peat swamp forests on shallow peat
are generally more diverse, compare to the most advanced peat swamp communities on thick peat
deposits. Opposite to that, the DI index estimated from the Jaw SPT core, suggests diversity did not
change from minerotrophic to the ombrotrophic settings. The PCA results show that zones Jaw-III/pole

128
forest and Jaw-V/peat swamp phases were highly variable or dynamic and were more closely connected
with the peat forming phase Jaw-I. The greatest distance, suggesting more marked differences in
vegetation composition, is observed between the Jaw-VI/pole forest and Jaw-IV/“savanna” phases
where Pandanus dominated with the freshwater swamp composition which characterized Jaw-II.
Water table and peat accumulation rate changes
Initially, from ca. 7800 to 4500 cal yr BP, minerotrophic conditions characterized the watershed in the
Air Hitam area. Water table fluctuations were high and flooding of the area occurred frequently as
indicated by the dominance of medium to large size tests and the alternative domination of wet and
drier taxa. A well developed Dipterocarpaceae mixed-swamp rainforest covered the area and biomass
input must have been very high. However, this was outbalanced by a high decomposition rate and peat
accumulation remained low for the first 4500 years of the record (average 0.6 mm/yr). The change to
ombrogenous conditions became apparent from ca. 4500 cal yr BP onwards, when a marked change in
vegetation occurred and Pandanus thickets colonized the site, leading to an increase in peat
accumulation rate (average 1 mm/yr) likely as a consequence of increasing root biomass associated with
the formation of Pandanus thickets and decrease in decomposition under oligotrophic conditions.
Figure 8.7 Samples scatterplot of the principal component analysis (PCA) of all percentage data of identified pollen and spore taxa. Percentages calculated on the total sum (Pandanus excluded) of all taxa square root transformed. First and second axes cumulative explained 34% of the variation in pollen and spore taxa data. Differently marked palynological zones correspond to different vegetation phases. Gray arrows correspond to the variation of testate amoeba environmental groups (water, peat moss, green moss, soil and indicators of drier conditions) and size classes (large, medium and small) used as supplementary variables. Only most important taxa are shown
129
Testate amoebae taxa tolerant of drier conditions appeared and the small size tests slowly replaced
larger tests confirming decreased permanent water availability. The peat accumulation rate remained
high to the top of the core although it slightly decreased from ca. 1900 to 1100 yr cal BP (Jaw-V), when
Pandanus decreased sharply and a mixed-swamp rainforest, resembling the initial minerotrophic phases
became established. As observed in Jaw-I and II, the increase in water table fluctuations and possibly
river flooding, as indicated by the increase in the testate amoebae water group and freshwater swamp
pollen taxa, were accompanied by higher decomposition and hence lower peat accumulation rate.
Although in general the water table closely follows the peat dome surface, Brady (1997) found that the
water table levels monitored on different peat thickness in Sumatra exhibited patterns of declining aver-
age level and fluctuations with increasing peat depth, with the lowest average water table depth
occurring in the thickest peat site. The study of Brady (1997) suggests that on thick peat deposits, peat
accumulates more because of the larger amount of fresh roots and declining rates of litter decay rather
than from rising water levels and permanent stagnant conditions. This hypothesis was supported by the
study of Grady et al. (1993). They analyzed the maceral content of peat from different layers of a deep
deposit near Siak Sri Indrapura, Riau (Sumatra), and used the increase in fungal degradation of plant
cells in peat as an evidence of higher oxygen levels in peat during degradation. The fungal degradation
results suggest that the peat found in deep deposits is more aerobic than that found in thinner deposits.
Thus it is thought peat accumulation in the thicker peat deposits of Riau are associated with drier surface
conditions and changes in species composition rather than with a higher water table. In this model, the
declining influence of river flooding along the gradient plays an important role. Vertical sequences of
peat analyzed from deposits in Sumatra (Esterle and Ferm 1994) and in Kalimantan (Dehmer 1993;
Moore and Hilbert 1992) suggest that increasing peat accumulation with thickness of the deposits was
associated with reduced flooding in addition to a lower mean water table level, declining resource
quality of plant inputs, and an increase in the root biomass.
The results from the Jaw SPT core fits the model of Brady (1997) and Grady et al. (1993) as the increase
in accumulation rate was likely a consequence of belowground biomass increase (in particular Pandanus
roots) and decreasing decomposition characteristic of the oligotrophic conditions on ombrotrophic
peatlands. This suggests a strong link between vegetation communities and peat accumulation rate
changes over time at Air Hitam, as increase in peat accumulation rate closely followed increasing
representation of Pandanus at the site.
Drivers of change: sea-level, climate, fire and human impact
Peat accumulation started at the Air Hitam watershed after 7800 years ago corresponding to the mid-
Holocene maximum in regional rainfall and the lowering and stabilization of the rate of sea-level rise
(Geyh et al. 1979; Figure 8.6a). As a consequence of these changing conditions, the regional water table
130
in the islands of Sunda rose, causing flooding and paludification of the more depressed areas (Dommain
et al. 2014). Initially, the peatland was influenced by the river flooding, which caused a high rate of
decomposition. As a consequence, opposite to what observed in Central Kalimantan (Brünig 1996), the
presence of a highly biomass productive dipterocarp-mixed swamp rainforest did not induce high peat
accumulation rate in this initial phase. Starting from ca. 5000 cal yr BP, sea level started to decrease
slightly due to hydro-isostatic adjustment of the Sunda shelf (Horton et al. 2005; Steinke et al. 2003;
Dommain et al. 2011) causing the decrease of the regional water table in the inland, likely affecting the
interfluvial peat domes. Additionally, peat thickness at Air Hitam likely reached a level above the
influence of rivers discharge, causing a change towards a purely rainfall fed oligotrophic system. From
ca. 4500 year ago, a more open pole forest colonized the area, with Pandanus thickets covering the site.
Parallel to this, local fire episodes became more frequent, corresponding to the increase in ENSO
variability in Indonesia as indicated by several paleoclimatic records (Haberle et al. 2001; Donders et al.
2008). The burned open patched areas were colonized by the terrestrial fern Nephrolepis bisserrata and
Parastemon trees. A stronger disturbance signal was found from ca. 2500 to 1900 cal yr BP. The diversity
decreased markedly and pioneer taxa like Macaranga codominated the site together with Pandanus
and Ficus. It remained uncertain if this phase represented an advanced phase of the catena as found by
Anderson (Phasic Community VI; Anderson 1963) or a long-lived disturbance phase following fire
burning of the canopy. Despite those major changes in the vegetation cover, peat accumulation rates
remained high and decreased only slightly from ca. 1900 cal yr BP when the paleoenvironmental
reconstructions indicate that a renewed mixed-swamp rainforest expanded on the site. According to
Dommain et al. (2011), the occurrencesof strong paleo-El Niños starting from ca. 2000 cal yr BP, caused
peat accumulation in many Central Kalimantan peat domes to cease. While fire frequency decreased
overall in this phase, major fire peaks were recorded possibly in connection with the occurrences of
strong El Niño episodes.
Following this temporary mix-swamp rainforest phase dominated by Garcinia cuneifolia type and Durio,
a low pole forest reestablished with abundant Pandanus thickets and the peat accumulation rate
increased again from ca. 1100 cal yr BP onwards. The general increase in peat accumulation during the
relatively drier phases and of increasing ENSO variability indicate that the peatland of Air Hitam has
been potentially an effective carbon sequestering ombrotrophic peatland against the millennial scale
climatic and environmental variability.
Despite the resolution for the top modern 30 cm of the core being low (2 samples analyzed for
paleoenvironmental reconstructions), major transformation of the landscape could be detected.
Pandanus species and the majority of the trees were removed from the site and Parastemon and
Nephrolepis biserrata dominate the assemblages. The general net greenhouse gases balance of tropical
peatlands is affected by the conversion to oil palm plantations as the carbon stored is lost during the
131
conversion and subsequently for management processes when water table is kept artificially
belowground (Verwer et al. 2008; Hooijer et al. 2010; Murdiyarso et al. 2010; Page et al. 2011; Kurnianto
et al. 2015). The consequences of clearance and drainage of the Air Hitam peat dome are not predictable
without long-term monitoring of the peat deposit. However, it is likely that the accumulated carbon will
be transferred to the atmosphere due to exposure to aerobic conditions. The potential value as carbon
sink of this area might soon be lost unless a better management of the watershed is applied.
Conclusions
In general, the domed shape of a peatland is derived from the combination of differential rates of
biomass production, decomposition and preservation (Tie and Esterle 1992) and the long term function
of a peatland as a carbon sink depends largely on the regional and local environmental settings for much
of its history. The multi-proxy paleoecological and paleoenvironmental results from the core Jaw SPT of
the Air Hitam peatland increase our knowledge on what were the most important factors driving the
development of these ecosystems on a time scale of thousands of years, thus contributing to the
understanding of how ecosystem dynamics and fire are linked to peat development through time.
As for several other modern peatlands in SE Asia (Figure 8.1), peat initiated at the Air Hitam peat dome
during the mid-Holocene rainfall maxima in combination with a slowing of the pace of sea level rise,
which likely raised the water table in these inland settings leading to paludification (Griffiths et al. 2009;
Partin et al. 2007; Dommain et al. 2011). Between the fluvial levees, in the depression that characterizes
the Air Hitam area, peat started to accumulate. The peatland at Air Hitam was initially fed by fluvial run-
off and the vegetation gradually changed from mixed Dipterocarpaceae swamp to marshy freshwater
swamp communities dominated by Durio trees at around 5300 years ago. The change from a
minerotrophic to ombrotrophic setting occurred during the late Holocene about 4500 years ago, when
peat growth reached a level above river influence leading to a marked change in vegetation community
composition. A pole forest established with Pandanus thickets colonizing the area and freshwater
swamp taxa decreased.
The occurrence of fire in humid SE Asian peat swamp forests is often reported as an anomaly, due to
the fact that pristine tropical peat swamps are permanently wet (Rieley and Ahmad-Shah 1996). Both
historical records and charcoal reconstructed from paleo archives have demonstrated that fires do
occur in the humid tropical forests but they are rare with return intervals of hundreds to thousands of
years (Cochrane 2003). The results of the Jaw SPT core confirm for Air Hitam, fire return interval has
been in the range of a hundred years. However, the correspondence between the increase in fire
magnitude and frequency and ENSO onset in the late Holocene, suggests that the fire regime changed
at the centennial time scale following regional climatic variability. Interestingly, the drier ombrotrophic
Pandanus-dominated phases in the late Holocene were not accompanied by a decrease in peat

132
accumulation rates but rather increase. Pandanus thickets might be one of the most important drivers
of peat accumulation at Air Hitam, downscaling the effects of the occurrence of more frequent regional
droughts and less-suitable for peat development drier surface conditions. This might suggest that, under
natural conditions, long-term climatic variability does not affect peatland development in the inland of
Central Sumatra. However, recent changes in vegetation cover and hydrological settings following
agricultural conversion might make the Air Hitam peatland more sensitive to drought, and fires might
increase as observed elsewhere already in SE Asia peatlands (van der Werf et al. 2008). If extreme
climatic events should increase in the future, longer or more severe drought might cause the loss of
7800 years of carbon stored at Air Hitam. A better management of the watershed and, in particular,
restoring measurements act at reestablishing the natural vegetation cover, might be fundamental in
order for the Air Hitam peatland to maintain its state as carbon sink in time.
In conclusion, the paleoenvironmental and palynological results from the Jaw SPT core further confirm
the value of the inland peat system in Air Hitam and highlight the importance of conducting
paleoenvironmental and charcoal analyses in order better reconstruct ecosystem-climate interactions
in the tropical peatlands of SE Asia.
Acknowledgments
This study was financed by the Deutsche Forschungsgemeinschaft (DFG) in the framework of the
collaborative German–Indonesian re-search project CRC990 (EFForTS). We thank the following
organizations for granting us access to and use of their properties: PT Era Mitra Agro Lestari (PT Emal)
and PT Jambi Agro Wijaya (Jaw SPT). This study was conducted using samples collected based on
Collection Permit No. 209/SIP/FRP/SM/XI/2012 recommended by the Indonesian Institute of Sciences
(LIPI) and issued by the Ministry of Forestry (PHKA). We thank Lydia Cole for her suggestions and
availability in the process of pollen and spore identification and Muhammad Zuhdi for sharing GIS data
of the study site. Finally, we greatly acknowledge two anonymous reviewers for their constructive
comments.
133
CHAPTER 9 - paper 5
Effects of long-term climate and environmental variability on the development of inland tropical peat swamp ecosystems in Jambi Province, Sumatra, Indonesia
Siria Biagionia, Marife D. Correb, Edzo Veldkampb, Asmadi Saadc, Valentyna Krashevskad, Yudhi
Achnophac, Supiandi Sabihame and Hermann Behlinga
a Department of Palynology and Climate Dynamics, Albrecht-von-Haller-Institute for Plant Sciences, Georg-August-
University of Göttingen, Untere Karspüle 2, 37073 Göttingen, Germany
b Soil Science of Tropical and Subtropical Ecosystems, Büsgen-Institute, Georg-August-University of Göttingen,
Büsgenweg 2, 37077 Göttingen, Germany
c Department of Soil Science, University of Jambi, Jalan Raya Jambi Muara Bulian KM 15 Mandalo Darat, 36361,
Jambi, Sumatra, Indonesia
d J.F. Blumenbach Institute of Zoology and Anthropology, Georg-August-University of Göttingen, Berliner Straße
28, 37073, Göttingen, Germany
e Department of Soil Science and Land Resource, Bogor Agriculture University (IPB), Jalan Meranti, IPB Campus,
Darmaga, Bogor, Java, Indonesia
Keywords
palaeoenvironment and palaeoecology, tropical peat development, long-term carbon accumulation
rate, ENSO, Sumatra
134
Abstract
We studied the area of Air Hitam, a tropical peatland in the Jambi province (Sumatra) in order to
investigate the long-term effects of environmental and climate variability on the development of the
peatland and on its carbon accumulation capacity. We used multi-proxy palaeoenvironmental and
palaeoecological analyses on a 733 cm-long and ca. 7800 cal yr BP old peat core. The combined results
of pollen, spores, testate amoebae, peat characteristics, 15N natural abundance and macro-charcoal
analyses reveal that changes in peat and long-term carbon accumulation rates were mostly a function
of vegetation phases and sea-level changes. Higher rates of peat and long-term carbon accumulation
were found to correlate with Pandanus expansion under ombrotrophic settings. The occurrences of
several centennial-scale period of vegetation disturbance were reconstructed from pioneer and open
pollen taxa and peat 15N natural abundance signatures. Increase in number of disturbance phases of
forest community was paralleled with increase in fire frequency, as reconstructed from the macro-
charcoal analysis, which in turn followed the onset of modern ENSO amplitude during the late Holocene.
Although the increase in fire occurrences caused disturbance of the vegetation communities for ca.
7800 years, these ecosystems showed resilience to these relatively short-lived disturbance events.
Introduction
Large areas of tropical peatlands are found in the lowlands of SE Asia where they provide important
ecosystem functions (Dommain et al. 2011; Page et al. 2011; Figure 9.1a). Despite their importance as
major carbon sinks, peat swamp forests are one of the ecosystems most threatened by deforestation in
Indonesia (Miettinen et al. 2011). Beside land-use change, it has been hypothesized that climate change
and particularly, the increase in extremes rainfall anomalies and drought episodes, might disrupt the
delicate equilibrium of these ecosystems in the future (Dommain et al. 2011). Palaeoecological multi-
proxy analysis of peat cores provides a longer temporal view of the dynamics of these ecosystems and
can help understanding what are the most important drivers affecting their develop and functionality
in time. In this study we use vegetation phases as reconstructed from pollen and spore data,
palaeohydrology and water table fluctuations inferred from testate amoebae and local fire regime
history as reconstructed from the macro-charcoal peak detection analysis from the peat core of Jaw SPT
(Figure 9.1b), in the province of Jambi, Sumatra, Indonesia (Biagioni et al. 2015b; Chapter 8).
Additionally, the long-term carbon accumulation rate (LORCA) are reconstructed using isotope analysis
from the same core and peat characteristics are used to infer the rate of decomposition of peat in
relation to vegetation phases and LORCA. 15N natural abundance and pollen and spore pioneer relative
abundance are used as proxies for ecosystem disturbance. We use these results and we plot them
against external potential drivers which include climate and sea-level change with the final aim of

135
assessing the relationship between peatland development, palaeoclimate and palaeoenvironment at
the centennial to millennial time scale.
Modern settings and palaeo-environmental dynamics
Climatically, the eastern part of the Jambi province in Sumatra, Indonesia, experiences a wet tropical
climate with mean annual precipitation ranging between 2400 and 2900 mm and annual temperatures
average of 27˚C (WorldClim - Global Climate Data, http://www.worldclim.org/). Seasonality of rainfall is
not marked, although the months from May to September are characteristically drier due to the
southeast monsoon (Aldrian and Susanto 2003). The inter-annual scale rainfall patterns change when
the El Niño Southern Oscillation (ENSO) and the Indian Ocean Dipole (IOD) occur. The El Niño warm
phase of ENSO and the positive IOD cause decreasing rainfall, while the opposite trend with increasing
rainfall characterizes the cold phase La Niña of ENSO and the negative IOD phase (Philander 1990;
Webster et al. 1999; Cane 2005).
The results from the palaeoecological reconstruction of the Jaw SPT core (2.047685°S 102.665362°E;
Biagioni et al. 2015b; Chapter 8) indicates that peat started to accumulate in the Air Hitam depression
at least 7800 years ago, and the vegetation reconstruction from pollen and spores suggests that until
ca. 4500 years ago the vegetation was dominated by dipterocarp-mixed swamp rainforest taxa.
Following, a change occurred towards more specialized vegetation adapted to live under oligotrophic
conditions (Biagioni et al. 2015b; Chapter 8).
Figure 9.1 a) Map of Sundaland, showing the study area (yellow square) in the Province of Jambi (red line) in Sumatra. Grey areas represent the Sunda shelf. Black areas represent peatlands (data source for peat FAO Harmonized Soil Map of the World, Histosols and Gleysols layers only); b) location of the Jaw SPT core (yellow circle) in the Air Hitam peat dome (dark grey area)
136
Methods
In this study we use the palaeoenvironmental and palaeoecological proxies including pollen and spores,
testate amoebae and macro-charcoal results from the Jaw SPT core. Methods applied and data analyses
for these proxies are described in details by Biagioni et al. (2015b) and in Chapter 8.
Using the classification systems for SE Asian tropical peat (Esterle and Ferm 1994; Wüst et al. 2003), we
infer level of decomposition and humification from the peat attributes and plant composition (Cameron
et al. 1989). According to the morphology of the botanical components, the peat is classified in fibric,
hemic and sapric. The hemic peat is further divided in to coarse and fine (Esterle and Ferm 1994; Wüst
et al. 2003). The degree of decomposition or humification increase from fibric to sapric and it is a
function of the biomass characteristics of the vegetation communities and the hydrological settings.
Pollen and spore taxa percentage results are grouped into two main groups based on the available
accounts for the vegetation communities and the ecological descriptions of taxa currently available from
SE Asian and Sumatran peat-swamp rainforests (e.g. Anderson 1963; Sabiham and Furukawa 1986;
Cameron et al. 1989; Brady 1997; Page et al. 1999; Cole 2012; Gunawan et al. 2012; Cole et al. 2015).
These groups are Dipterocarp-mixed swamp, which includes taxa commonly found in shallow marginal
peat deposits and on fresh swamp rainforests in SE Asia and peat swamp taxa which includes taxa more
representative of the communities growing on thick peat deposits (Table 8.2).
Similarly, to infer average water table level and fluctuations, testate amoebae with similar habitat
preferences were classified into environmental groups. Testate amoebae are unicellular protists, which
can be found commonly in wet environments such as lakes, rivers, mosses, soils and estuaries all around
the world (Mitchell et al. 2008). Their responses to the major ecological gradients in peatlands have
been established (e.g. Chardez 1965; Bobrov et al. 1999; Charman et al. 2000; Bobrov et al. 2004; Mazei
and Tsyganov 2006; Swindles et al. 2014), where the response is mostly related to moisture. For
instance, seasonal changes in soil moisture in peatlands due to water table level fluctuations can affect
testate amoebae to such an extent to cause shifts in abundance and community composition (Quinn
2003; Warner et al. 2007; Mitchell et al. 2008). Two environmental groups are used as particularly
significant: the water group, which includes taxa indicating high water availability and standing water,
and the dry group, which includes taxa which can tolerate and live under drier conditions, increasing
surface light and aerobic conditions (Chardez 1965; Bobrov et al. 1999; Charman et al. 2000; Bobrov et
al. 2004; Mazei and Tsyganov 2006; Table 9.1).
For the local fire regime reconstructions, we used the fire frequency and magnitude of macro-charcoal
peaks as described in details in Biagioni et al. (2015b) and in Chapter 8.
Additionally, dried and ground samples were analyzed every 10 cm along the core (total of samples 68)
for total C and N by a CNS Elemental Analyzer (CN Elementar Analyzer Vario EL, Hanau, Germany) and
15N natural abundance using isotope ratio mass spectrometry (IRMS; Delta Plus, Finigan MAT, Bremen,
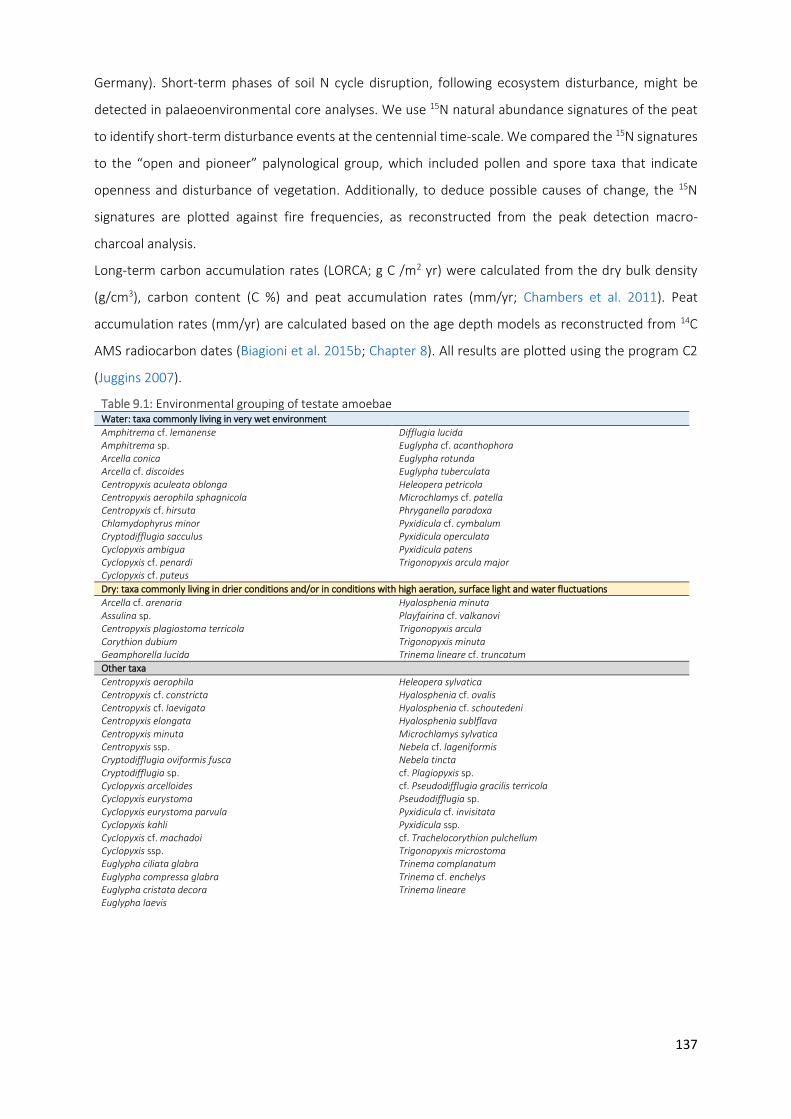
137
Germany). Short-term phases of soil N cycle disruption, following ecosystem disturbance, might be
detected in palaeoenvironmental core analyses. We use 15N natural abundance signatures of the peat
to identify short-term disturbance events at the centennial time-scale. We compared the 15N signatures
to the “open and pioneer” palynological group, which included pollen and spore taxa that indicate
openness and disturbance of vegetation. Additionally, to deduce possible causes of change, the 15N
signatures are plotted against fire frequencies, as reconstructed from the peak detection macro-
charcoal analysis.
Long-term carbon accumulation rates (LORCA; g C /m2 yr) were calculated from the dry bulk density
(g/cm3), carbon content (C %) and peat accumulation rates (mm/yr; Chambers et al. 2011). Peat
accumulation rates (mm/yr) are calculated based on the age depth models as reconstructed from 14C
AMS radiocarbon dates (Biagioni et al. 2015b; Chapter 8). All results are plotted using the program C2
(Juggins 2007).
Table 9.1: Environmental grouping of testate amoebae Water: taxa commonly living in very wet environment
Amphitrema cf. lemanense Difflugia lucida Amphitrema sp. Euglypha cf. acanthophora Arcella conica Euglypha rotunda Arcella cf. discoides Euglypha tuberculata Centropyxis aculeata oblonga Heleopera petricola Centropyxis aerophila sphagnicola Microchlamys cf. patella Centropyxis cf. hirsuta Phryganella paradoxa Chlamydophyrus minor Pyxidicula cf. cymbalum Cryptodifflugia sacculus Pyxidicula operculata Cyclopyxis ambigua Pyxidicula patens Cyclopyxis cf. penardi Trigonopyxis arcula major Cyclopyxis cf. puteus
Dry: taxa commonly living in drier conditions and/or in conditions with high aeration, surface light and water fluctuations
Arcella cf. arenaria Hyalosphenia minuta Assulina sp. Playfairina cf. valkanovi Centropyxis plagiostoma terricola Trigonopyxis arcula Corythion dubium Trigonopyxis minuta Geamphorella lucida Trinema lineare cf. truncatum
Other taxa
Centropyxis aerophila Heleopera sylvatica Centropyxis cf. constricta Hyalosphenia cf. ovalis Centropyxis cf. laevigata Hyalosphenia cf. schoutedeni Centropyxis elongata Hyalosphenia sublflava Centropyxis minuta Microchlamys sylvatica Centropyxis ssp. Nebela cf. lageniformis Cryptodifflugia oviformis fusca Nebela tincta Cryptodifflugia sp. cf. Plagiopyxis sp. Cyclopyxis arcelloides cf. Pseudodifflugia gracilis terricola Cyclopyxis eurystoma Pseudodifflugia sp. Cyclopyxis eurystoma parvula Pyxidicula cf. invisitata Cyclopyxis kahli Pyxidicula ssp. Cyclopyxis cf. machadoi cf. Trachelocorythion pulchellum Cyclopyxis ssp. Trigonopyxis microstoma Euglypha ciliata glabra Trinema complanatum Euglypha compressa glabra Trinema cf. enchelys Euglypha cristata decora Trinema lineare Euglypha laevis
138
Results and discussion
Vegetation community changes and phases of peat development
The vegetation of natural lowland tropical peat swamp forests is dominated by trees (Page et al. 1999).
Despite that most of the tree families of lowland dipterocarp forests of SE Asia are found in lowland
peat swamp forests, the tree species composition of peat swamp forest varies considerably in response
to peat thickness, acidity, nutrient and oxygen availability (Anderson 1961; Anderson 1964; Anderson
1983). The spatial distribution of the different communities depends largely on the peat thickness and
thus it can also be seen as a temporal succession as peat develop and accumulate over time (Anderson
and Muller 1975; Morley 2013). The results from the pollen and spore analysis of the Jaw SPT highlight
two distinct vegetation phases (Figure 9.2). The period from ca. 8400 to ca. 4500 cal yr BP (700-470 cm)
was dominated by taxa commonly growing on shallow marginal peat that is representative of
dipterocarp-swamp mixed rainforests. Peat swamp rainforest established from 4500 cal yr BP up to the
present (470-3 cm).
Minerotrophic settings (ca. 7800-4500 cal yr BP)
According to the age-depth model, peat started to accumulate at least 7800 years ago (664 cm core
depth). Until ca. 4500 cal yr BP, minerotrophic fresh-water setting characterized the area as indicated
by the alternation of high and low values of water testate amoebae group, suggesting occurrence of
large fluctuations of the water table (Figure 9.2). Additionally, the limited occurrence of dry indicators,
suggests that the water table was commonly above ground and stagnant conditions might have
persisted. In this initial phase. the peat was fine to coarse hemic, indicating that the decomposition of
the organic matter and humification were relatively high. The vegetation, reconstructed by pollen and
spore analyses, indicates that well-developed dipterocarp-swamp mixed rainforests covered the area.
Characteristic taxa in this phase were Dipterocarpaceae, Durio, Blumeodendron, Pandanus and
Stenochlaena palustris (Biagioni et al. 2015b; Chapter 8). The presence of abundant wood fragments in
this core section supported the interpretation that dense arborescent vegetation covered the area,
maintained by flooding, which promotes high biomass production and high degree of decay (Biagioni et
al. 2015b; Chapter 8). As a consequence, LORCA values were relatively low in this initial phase. Fire
episodes were not frequent during the whole phase, indicating that fires were not a common
occurrence. However, one large magnitude peak (at ca. 5400 cal yr BP) suggests that a large fire episode
occurred.
Ombrotrophic settings (ca. 4500 cal yr BP to present)
A change in the environmental conditions occurred at around 4500 cal yr BP. The testate amoebae dry
indicators are consistently more present with higher values, indicating that surface wetness decreased

139
compared to the previous phase (Figure 9.3). However, the degree of humification decreased as
indicated by the coarser hemic peat. Together, these proxies suggest that river flooding ceased to
influence the network of interactions of the peat system. The decrease in fresh, oxygen- and nutrient-
rich, river water caused a change toward a system that was mostly influenced by nutrient poor rainfall,
establishing ombrotrophic conditions. Starting from ca. 4500 cal yr BP, Pandanus increased and began
to dominate together with Campnosperma, Ilex, Austrobuxus and Nephrolepis biserrata, to form a peat
swamp rainforest (Biagioni et al. 2015b; Chapter 8). Interestingly, this reconstruction suggests that a
positive correspondence between Pandanus and fire frequency existed on the long-term. Higher
occurrence of Pandanus corresponds to periods of increased occurrences of fire episodes. Despite that
the resolution of the palynological data did not allow us to deduce causalities, it is likely that the increase
in fires and the formation of dense Pandanus thickets were interlinked (Figure 9.2).

140
Figure 9.2 Selected results of the Jaw
SPT core analyses. The diagrams are
dived in the two phases:
minerotrophic (light blue) and
ombrotrophic (light red). From the
top: dipterocarp-mixed swamp and
peat swamp pollen and spore taxa
(%). In light gray the % values of
Pandanus pollen. Testate amoebae
water and dry indicators (%);
sediment/peat characteristics; long-
term apparent carbon accumulation
rate (LORCA, C g/m2 yr) and peat
accumulation rates (mm/yr); fire
frequency and magnitude calculated
on the fire peaks (asterisks) detected
with the software CharAnalysis. Cut
symbol denote fire peaks which were
cut to highlight trend in minor peaks

141
LORCA changes over time
Lacks of evidence for hiatuses in the records indicate that peat accumulated continuously since peat
initiation ca. 7800 years ago (Biagioni et al. 2015b; Chapter 8). Average peat accumulation rate
calculated based on the age depth model from 664 cm to the top of the core is 0.9 mm/yr (min 0.5; max
1.6 mm/yr), average LORCA is 51 C g/m2 yr (min 25; max 133).
Conditions that favor peat preservation are found where primary production exceeds degradation by
bacteria and fungi. Tropical climate favors decomposition but at the same time also highly productive
rainforests and thus often production exceeds degradation leading to net organic matter accumulation
(Wüst et al. 2007). Estimates of LORCA are available from few tropical ombrogenous deposits in SE Asia
(Dommain et al. 2011; Dommain et al. 2014). When compared to other sites in SE Asia, the Jaw SPT
average LORCA is within recorded ranges (Figure 9.3a). The larger difference is found within the record
between the minerotrophic and the ombrotrophic phases (Figure 9.3b). Additionally, LORCA seems to
increase markedly in correspondence to the expansion of the peat swamp forests and Pandanus thickets
(Figure 9.4). This suggests that a strong link existed between ecosystem settings and LORCA at Air Hitam,
as a peat swamp rainforest became established, LORCA increased. Such increase occurred despite that
the establishment of a Pandanus-dominated vegetation possibly caused a decrease of aboveground
biomass, compared to the woody and more diverse dipterocarp-mixed swamp communities of the
minerotrophic phase. However, Pandanus thickets develop a massive interlocking root system and have
a large belowground biomass quite resistant to degradation (Phillips and Bustin 1998). These results
from the Air Hitam core highlight how crucially important are the vegetation communities covering
ombrotrophic peat in relation to peat and carbon accumulation in space and time.
Figure 9.3 a) Comparison of LORCA (expressed as C g/m2 per yr) during the Holocene of Sebangau, Palangka Raya (Central Kalimantan; Page et al. 2004; Neuzil 1997), Teluk-Kemarat (West Kalimantan; Neuzil 1997) and Siak Kanan (Riau, Sumatra; Diemont and Supardi 1987a) with the Air Hitam peat dome as calculated from the Jaw SPT core analysis. Average (dots) and min, max values (whiskers) are shown. Data source for all other sites other than Air Hitam: Dommain et al. 2011; b) Boxplots of the Jaw SPT LORCA (average, first and third quartiles, min and max values) divided in the minerotrophic (ca. 7800-4500 cal yr BP) and ombrotrophic phase (4500 cal yr BP-present)
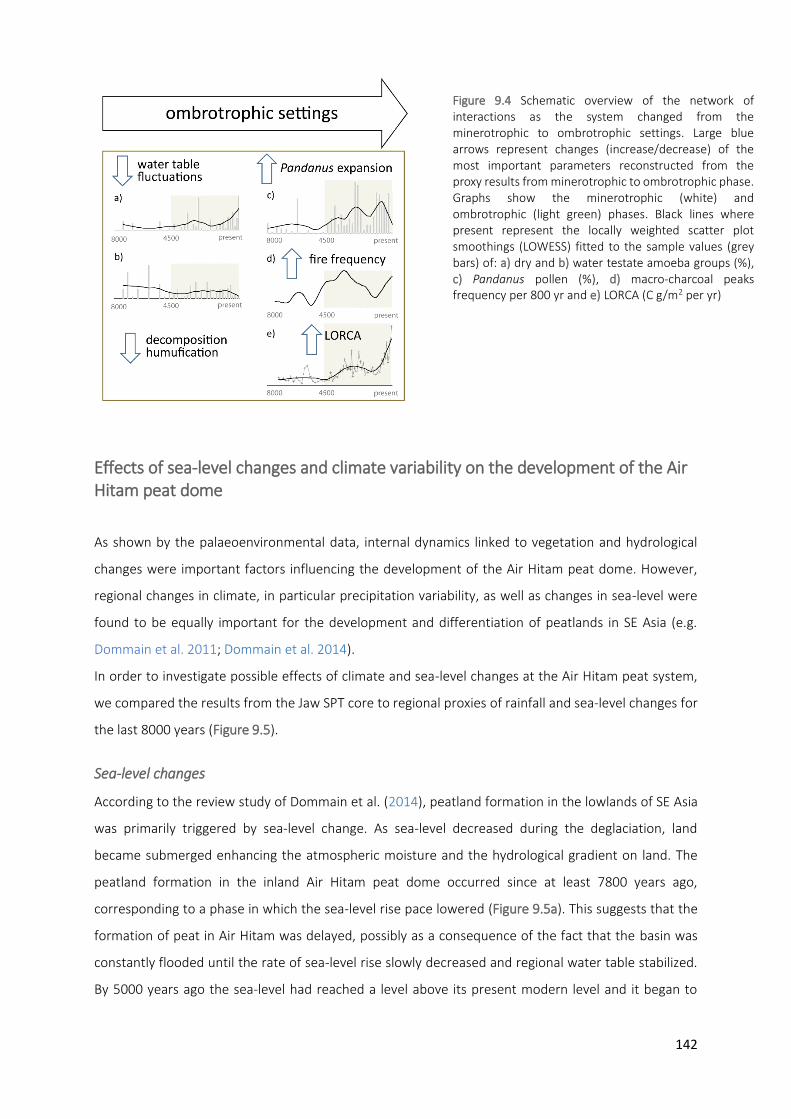
142
Effects of sea-level changes and climate variability on the development of the Air Hitam peat dome
As shown by the palaeoenvironmental data, internal dynamics linked to vegetation and hydrological
changes were important factors influencing the development of the Air Hitam peat dome. However,
regional changes in climate, in particular precipitation variability, as well as changes in sea-level were
found to be equally important for the development and differentiation of peatlands in SE Asia (e.g.
Dommain et al. 2011; Dommain et al. 2014).
In order to investigate possible effects of climate and sea-level changes at the Air Hitam peat system,
we compared the results from the Jaw SPT core to regional proxies of rainfall and sea-level changes for
the last 8000 years (Figure 9.5).
Sea-level changes
According to the review study of Dommain et al. (2014), peatland formation in the lowlands of SE Asia
was primarily triggered by sea-level change. As sea-level decreased during the deglaciation, land
became submerged enhancing the atmospheric moisture and the hydrological gradient on land. The
peatland formation in the inland Air Hitam peat dome occurred since at least 7800 years ago,
corresponding to a phase in which the sea-level rise pace lowered (Figure 9.5a). This suggests that the
formation of peat in Air Hitam was delayed, possibly as a consequence of the fact that the basin was
constantly flooded until the rate of sea-level rise slowly decreased and regional water table stabilized.
By 5000 years ago the sea-level had reached a level above its present modern level and it began to
Figure 9.4 Schematic overview of the network of interactions as the system changed from the minerotrophic to ombrotrophic settings. Large blue arrows represent changes (increase/decrease) of the most important parameters reconstructed from the proxy results from minerotrophic to ombrotrophic phase. Graphs show the minerotrophic (white) and ombrotrophic (light green) phases. Black lines where present represent the locally weighted scatter plot smoothings (LOWESS) fitted to the sample values (grey bars) of: a) dry and b) water testate amoeba groups (%), c) Pandanus pollen (%), d) macro-charcoal peaks frequency per 800 yr and e) LORCA (C g/m2 per yr)
143
slowly retrocede. In the inland the marine regression would have caused the regional water table to
decrease. This phase of sea-level decrease corresponds to the lowering of the water table fluctuations
and the establishment of drier surface conditions at the Air Hitam peat as indicated by the testate
amoebae dry indicators increase (Figure 9.5f). This suggests that the hydrological changes reconstructed
for the ombrotrophic phase since 5000 years ago followed the sea-level decrease.
Rainfall variability
At the centennial- to millennial-time scale, the rainfall variability in the lowlands of Jambi is mainly a
function of strength of the monsoons, amplitude and frequency of ENSO and IOD. The major climatic
change from the late glacial to the Holocene in the Indo-Pacific Warm Pool was the increase in moisture
due to both rising sea-level and the southward migration of the mean position of the ITCZ (e.g. Haug et
al. 2001; Wang et al. 2005). Stalagmite analysis of δ18O from Borneo (Partin et al. 2007; Figure 9.5b)
record a smooth trend of increasing rainfall following the deglaciation up to ca. 5000 years ago. When
compared to records north (Haug et al. 2001) and south (Wang et al. 2005) of the equatorial line, this
Holocene trend has been explained with a southward migration of the ITCZ in response to precessional
forcing. While sea-level changes seem to have greatly influenced the development of the peat
accumulation at the Air Hitam peat dome, increasing rainfall (associated with the migration of the ITCZ
through the mid- to late Holocene) seems to have not had a major impact (Figure 9.5g). In fact, opposite
to what Dommain et al. (2014) found in the coastal peatlands of Kalimantan and Sumatra, the maxima
in LORCA at Air Hitam did not correspond with the Holocene rainfall maxima associated with the
southernmost position of the ITCZ (Figure 9.5g) at around 5000 cal yr BP. This is likely related to the
position of the site in the center of the ranging shift of the ITCZ. The migration north or south of its
average position, likely did not have a marked effect on the rainfall patterns in Jambi.
During the late Holocene, ombrotrophic settings, vegetation communities and lowering sea-level/water
table fluctuations, corresponded to the increase in LORCA at the Air Hitam peat dome. At the same time,
higher seasonality and El Niño droughts led to reduced accumulation and in some cases peat stopped
to accumulate in Borneo (Dommain et al. 2011; Dommain et al. 2014). Since in the humid tropical
rainforests, recurrent and large wildfires are mostly associated with drought periods, palaeo-fire regime
reconstructions in SE Asia have been used to infer ENSO variability at the centennial to millennial time
scale. Similar to what were found in several other records across SE Asia (e.g. Haberle et al. 2001; Gagan
et al. 2004), fire frequency increased at the Air Hitam site starting from ca. 4500 cal yr BP, likely as a
consequence of modern ENSO onset in the late Holocene (Figure 9.5e). Phases of more frequent El Niño
events were attested in particular during the last 3000-2000 years (e.g. Moy et al. 2002; Woodroffe et
al. 2003; Conroy et al. 2008). Within the age uncertainties due to radiocarbon dating and age-depth
modeling, periods of frequent El Niño episodes as reconstructed from the red color intensity at the lake
Laguna Pallcacocha in the southern Ecuadorian Andes, correlated to peaks of high fire magnitude of the

144
Jaw SPT core (Figure 9.5d-e). This suggests that increasing periods of drought led to increasing chances
for the Air Hitam forests to burn. Despite the legacy left by ENSO and related fires, peat accumulation
did not cease as in the peatlands of Borneo. This suggests that the effects of water table lowering and
enhanced periods of droughts did not reach a threshold beyond which enhanced aerobic decay would
have markedly affected the carbon balance of the Air Hitam peat dome. One explanation might be that
natural wildfires were most likely affecting the aboveground vegetation, but not the below-water table
peat deposits via smoldering fires, as no evidence are found of decrease in LORCA during phases of
increased fire frequency and magnitude.
The concomitant occurrences of a strong El Niño event and IOD positive anomaly in 1997/1998 have
proven that when these two events occur simultaneously, the effects on negative rainfall anomaly
(droughts) over western Indonesia is magnified. In order to test if the centennial scale IOD mean state
and ENSO variability increased the chances of fires, we compare our record to the available IOD
reconstruction from northwestern Sumatra stable hydrogen compositions of terrestrial plant waxes
(Niedermeyer et al. 2014; Figure 9.5c). The pink band indicate phases of increasing δD plant wax
interpreted as IOD positive mean state in the Indian ocean from 6500 to 4500 yr BP and from 2500 to
2000 yr BP (Niedermeyer et al. 2014; Figure 9.5c). The first IOD positive mean state phase correspond
to a period in which ENSO variability decreased as a consequence of reduced number of Eastern Pacific
(EP) flavors events (Karamperidou et al. 2015). The second phase, on the other hand, lack evidences of
changes in fire regimes as compared to previous or later periods. Altogether, this suggests that IOD
mean state was not an important driver of change for fire regime changes in the Air Hitam peatland.
One possible explanation might be related to the geographic location of Air Hitam on the eastern side
of the Barisan mountain range. The location behind this topographic barrier might explain the little
influence played by the Indian Ocean dipole mode at the site. However, more records recording rainfall
anomalies linked to the Indian warm pool state are necessary in order to better constrain these results.
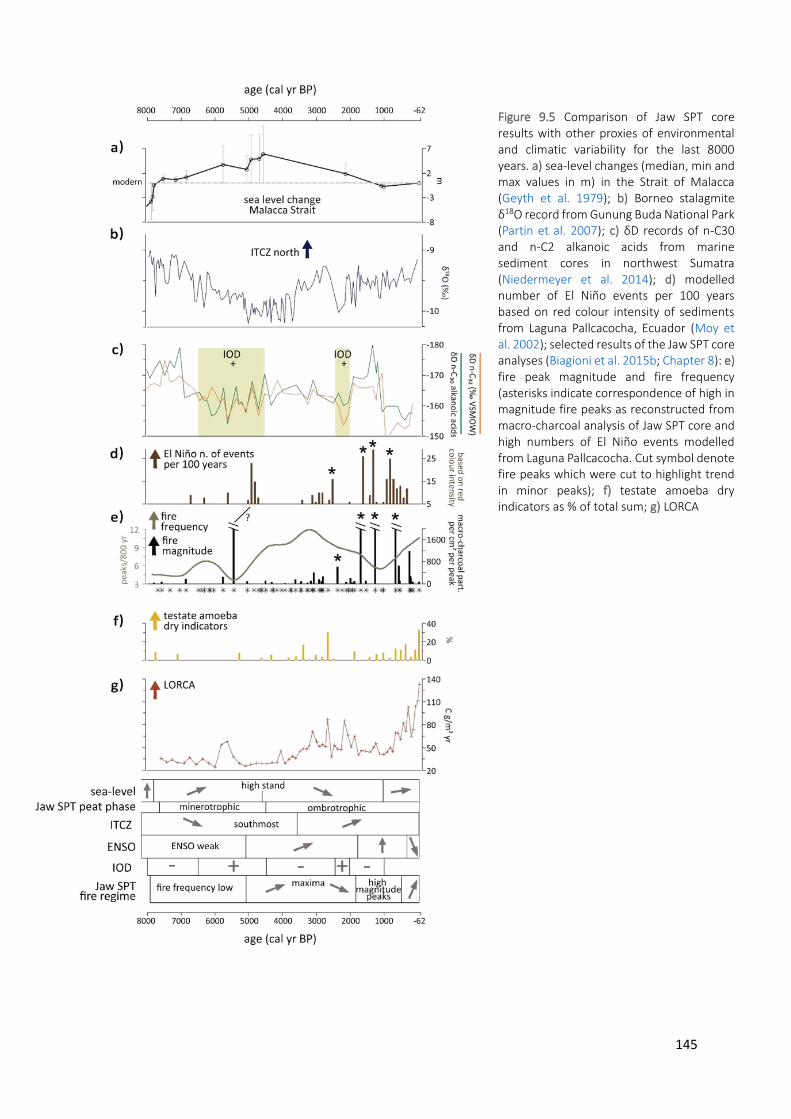
145
Figure 9.5 Comparison of Jaw SPT core results with other proxies of environmental and climatic variability for the last 8000 years. a) sea-level changes (median, min and max values in m) in the Strait of Malacca (Geyth et al. 1979); b) Borneo stalagmite δ18O record from Gunung Buda National Park (Partin et al. 2007); c) δD records of n-C30 and n-C2 alkanoic acids from marine sediment cores in northwest Sumatra (Niedermeyer et al. 2014); d) modelled number of El Niño events per 100 years based on red colour intensity of sediments from Laguna Pallcacocha, Ecuador (Moy et al. 2002); selected results of the Jaw SPT core analyses (Biagioni et al. 2015b; Chapter 8): e) fire peak magnitude and fire frequency (asterisks indicate correspondence of high in magnitude fire peaks as reconstructed from macro-charcoal analysis of Jaw SPT core and high numbers of El Niño events modelled from Laguna Pallcacocha. Cut symbol denote fire peaks which were cut to highlight trend in minor peaks); f) testate amoeba dry indicators as % of total sum; g) LORCA

146
Centennial scale fire disturbance and ecosystems recovery
The 15N natural abundance signatures of peat may reveal environmental changes caused by the
disturbance of the forest since 15N signature is essentially a function of N input and soil-N cycling
processes over time (Nadelhoffer and Fry 1994). The soil 15N natural abundance signatures have been
linked with soil N availability (e.g. gross rates of N mineralization and nitrification) of forests in Brazil,
northwestern Ecuador and Panama (Sotta et al. 2008; Arnold et al. 2009; Corre et al. 2010), where high
rates of mineral N production reflected high 15N signatures in soils and high soil N2O fluxes
(Purbopuspito et al. 2006; Koehler et al. 2009; Wolf et al. 2011). This is linked to the fact that soil N
availability controls losses of N from an ecosystem, and N losses are isotopically depleted, owing to
fractionation during nitrification (aerobic condition) and denitrification (anaerobic condition). Thus, the
higher the soil N availability and consequently the N losses, the more isotopically-enriched is the soil N
(Amundson et al. 2003). Disturbance like fire can loss large fraction of biomass N, depleting the pool of
actively cycling ecosystem N and provoking a N limitation during the earlier years after fire (e.g.
Kauffman et al. 1995; McGrath et al. 2001). Decades to a century after fire, soil N cycle recuperates as
biomass N pool buildup, and actively cycling ecosystem N and 15N signature increase. This was shown
from a study of forest-age chronosequence (covering 3-200 years old successional forests after
abandonment from slash-and-burn agriculture) in the Brazilian Amazon, where soil N availability,
gaseous N losses and foliar 15N signatures of trees increase with chronosequence age (Davidson et al.
2007). As a consequence, changes in the organic geochemical properties of peat may reveal
environmental changes caused by the disturbance of the forest. Opposite to the C/N ratio, the results
of Zaccone et al. (2011) on a peat core in Switzerland, suggest a lack of correlation between 13C and 15N
with the humification proxies, suggesting their trends are conservative and preserved along the depth
profile. yr BP. Several positive peaks in 15N natural abundance were recorded in the Jaw SPT core for
the last ca. 7800 cal yr BP (Figure 9.6). The majority of the peaks (66%) occurred in correspondence of
phases in which open and pioneer pollen and spores taxa increased, indicating disturbance of the
primary vegetation communities occurred. The 15N natural abundance signatures of the Jaw SPT core
suggest forest changes, caused possibly by fire disturbance at the site. The pattern of increase in fire
frequency followed by the increase in 15N signatures (Figure 9.6) suggests that the repeated occurrence
of fires was the major cause of ecosystems disturbance for the past ca. 7800 years. The majority of the
peaks were recorded in the ombrotrophic phase from ca. 4500 cal yr BP to present, while only two
phases of 15N enrichment were detected in the initial minerotrophic phase. The vegetation after
disturbance seemed to recover relatively quick, and phases of more open or pioneer vegetation lasted
less than a hundred years. This suggests that while the peat-swamp communities at the Air Hitam peat

147
dome were sensitive towards short-term fire disturbance, the rate of recovery remained stable through
time despite the large changes in the environmental settings.
Conclusions
Peat started to form in the Air Hitam area at least 7800 years ago corresponding to a phase of lowering
rate of sea-level rise in the Sunda region. As peat accumulated over time, the hydrological and
environmental conditions gradually changed. Initially, vegetation communities representative of
productive and diverse dipterocarp-mixed swamp rainforests dominated the area. The hydrological
gradient changed when sea-level started to decrease following the high stand in sea-level around 5000
years ago. The combined effects of a decreasing regional water table level and the increased in peat
depth above river influence caused a decrease water table fluctuations of the peat domed areas in Air
Hitam. The decrease of fresh, oxygen- and nutrient-rich river water caused a change toward oligotrophic
conditions, a system which was mostly fed by nutrient poor rainfall. The vegetation communities were
replaced by peat swamp taxa and Pandanus thickets expanded in the area. Interestingly, LORCA
increased in this later phase, following the expansion of Pandanus. The lack of correlation with regional
rainfall maxima as reconstructed from monsoon and ITCZ records suggests that the most important
factor influencing the increase in LORCA at Air Hitam was the expansion of Pandanus and their extensive
roots system. Additionally, the millennial scale changes in ENSO played an important role. The
Figure 9.6 Diagram comparing 15N natural abundance, % of total open pioneer pollen and spore group and % of the pioneer pollen taxa Macaranga/Mallotus as compared to reconstructed fire frequency. The diagram is dived in minerotrophic and ombrotrophic phases. Pink bars highlight phases in which increase in 15N natural abundance corresponds to increases of the open pioneer group and/or Macaranga/Mallotus, while grey bars highlight phases where there was no correspondence

148
occurrence of more frequent period of droughts correlated with the increase in fire frequency and fire
magnitude in Air Hitam area. The link between phases of forest disturbance and fire suggests fires
caused by El Niño occurrences affected the forest communities. However, the decrease of pioneer taxa
was relatively rapid, lasting less than a hundred years. Thus the vegetation communities have shown a
resilience capacity towards the centennial scale disturbance caused by natural fires.
Acknowledgments
This study was financed by the Deutsche Forschungsgemeinschaft (DFG) in the framework of the
collaborative German - Indonesian research project CRC990 (EFForTS). We thank the following
organizations for granting us access to and use of their properties: PT Era Mitra Agro Lestari (PT Emal)
and PT Jambi Agro Wijaya (PT Jaw). This study was conducted using samples collected based on
Collection Permit No. 209/SIP/FRP/SM/XI/2012 recommended by the Indonesian Institute of Sciences
(LIPI) and issued by the Ministry of Forestry (PHKA).
149
CHAPTER 10 - Synthesis and implications
The research conducted and compiled in this thesis contributes to the knowledge of the long-term
vegetation, climate and fire dynamics as well as human impact on montane and peat-swamp rainforests
of Indonesia. The use of a multi-proxy palaeoecological approach increased our understanding of how
these ecosystems have responded to natural and anthropogenic driven changes in the past. Altogether,
these results represent a further step forward to the gaining of a more comprehensive understanding
of modern tropical ecosystem dynamics and their functions in the long-term.
Synthesis of the main results on vegetation, climate, fire dynamics and human-landscape interactions
Montane ecosystems of Central Sulawesi
The Lake Kalimpaa record is the first archive from Central Sulawesi providing information on
palaeovegetation dynamics under the background of reconstructed palaeoenvironmental and
palaeorainfall conditions throughout the past ca. 1500 years. Today’s climate of Sulawesi is driven by
the monsoon system as well as by ENSO. The mountain regions of Central Sulawesi experience perhumid
climate conditions with few seasonal changes in precipitation, making the vegetation a possible
sensitive target for future changes of precipitation patterns (Wündsch et al. 2014; Biagioni et al. 2015a).
The palaeovegetation, as reconstructed from the palynological analysis, reveals that around Lake
Kalimpaa, the Fagaceae family dominates the entire recorded period, as they still do today.
Granulometric and geochemical data from the Lake Kalimpaa record provide indications for an
increasingly wetter climate (higher rainfall intensities and/or mean rainfall) on centennial to millennial
time scales from approximately AD 560 to the 20th century. Since this trend towards wetter conditions
was also detected in other palaeoclimatic studies from the region, a likely explanation for this is that the
ITCZ migrated southward in this period of time (Wündsch et al. 2014).
Two disturbance events (ca. AD 1090-1190 and ca. AD 1450-1620) occurred in the catchment area of
Lake Kalimpaa. The comparison with the fire frequency record derived from macro-charcoal analysis
indicates that these events were caused by forest fires. The regional correlation of these events with
periods of drought registered elsewhere in Sulawesi and in Java suggests that centennial-scale increases
in fire frequencies at Lake Kalimpaa were consequences of the vegetation being more prone to fire,
probably due to more frequent and/or longer El Niño events.
Despite that, Fagaceae did not decrease in their representation, indicating resilience towards droughts
of at least one species of the family. However, palynological diversity values indicate that within-
landscape diversity (Whittaker’s gamma diversity) decreased when fires increased. Palynological rate of
150
change and compositional turnover indicate that the vegetation communities were more resilient to
fire disturbance during periods of average high rainfall.
At Lake Kalimpaa, human-landscape interactions are evident only starting from the 20th century (from
ca. 1950 to present), with Weinmannia rising probably due to the logging of emergent Agathis trees
and/or landslides caused by the construction of the road which today passes near the lake (Biagioni et
al. 2015a; Chapter 6).
The Lindu valley is located only 30 km west from Lake Kalimpaa but, opposite to what was found at Lake
Kalimpaa, a longer history of human-landscape interactions was found from the palynological, charcoal
and diatom reconstructions of the Lake Lindu core for the past ca. 1000 years (Biagioni et al. 2016;
Chapter 7). Evidence of frequent burning and possible shifting cultivation from an earlier phase from ca.
AD 1000 to 1200 might be related to the metal age population which erected the megaliths in the
province of Central Sulawesi. From ca. AD 1200-1700, decreases of macro-charcoal concentrations and
pioneer vegetation indicators show that the use of the landscape of the Lindu plain had become more
permanent. Due to the little research conducted so far on the megalithic culture of Central Sulawesi, it
remains uncertain whether the architects of such a cultural change were the megalith people or
different ethnic groups. A phase of forest recovery from ca. AD 1730 to 1910 correlated with a decrease
in human activities in the valley, which historical reports describe as mostly limited to fishing and cattle
grazing (Sarasin and Sarasin 1905). These results indicate that when human pressure on the landscape
decreases as a consequence of different strategies of subsistence, the montane ecosystems possess a
great capacity of recovery and fagaceous forest communities can expand on a relatively rapid time scale.
The most recent part of the Lake Lindu record shows a trend towards deforestation that started in the
late 20th century, lasting until now, following the increase of human population encroachment on the
margins of the LLNP.
Inland peat-swamp ecosystems in Jambi, Sumatra
The extended tropical peatlands of SE Asia have retained a large amount of carbon, functioning as a
large sink for thousands of years (Page et al. 2004; Page et al. 2010). Currently, however, these peatlands
are facing large scale degradation and conversion, turning from carbon sink to source (Hooijer et al.
2010; Jauhiainen et al. 2010; Page et al. 2011).
The need to manage peatlands requires a better understanding of the main components and processes
of peat-forming systems. The study conducted in the peat dome of Air Hitam demonstrates that
indicators used to evaluate and predict peat processes should be based on an understanding of the
factors (in addition to age) that control peat accumulation. These include vegetation, hydrology and soil,
as peat-swamp ecosystems are the result of combined action of allogenic (climate, hydrology) and
autogenic (vegetation) factors which vary in space and time depending on the thickness of the peat

151
deposit and environmental/hydrological settings. Multi-proxy results depict a picture of a highly
dynamic system (Chapter 8). Since the beginning of peat accumulation around 7800 years ago net
balance accumulation exceeded degradation, and the system remained a carbon sink for ca. 7800 years.
At first the peatland in Air Hitam was fed by fluvial run-off and the vegetation gradually changed from
mixed Dipterocarpaceae swamp to marshy swamp communities dominated by Durio trees at around
5300 years ago. A marked change in the vegetation community’s composition occurred at the beginning
of the late Holocene about 4500 years ago. A pole forest established with Pandanus thickets colonizing
the area as the dome developed into a rainfall-fed ombrogenous system. At the same time, macro-
charcoal peak detection analysis reveals that fire frequency increased, possibly as a consequence of the
ENSO-onset.
Peat accumulation rates and carbon storage in the dome of Air Hitam have been considerable in the
past. Higher rates of peat/carbon accumulation were found to correlate with Pandanus expansion under
ombrotrophic settings. The testate amoebae assemblage indicates that the ombrogenous Pandanus-
pole forest phases were characterized by lower water table fluctuations. Despite the lower biomass
input peat accumulation rate was in average higher than during the mixed-swamp community phases.
The correlation between high peat accumulation and relatively drier phases linked to ENSO makes the
area of Air Hitam potentially one of the most effective carbon sequestering ombrotrophic peatlands in
the view of future climate scenarios (Chapter 9).
Impact of El Niño (droughts) and fires on the carbon storage function of the natural forest ecosystems
Evidence from both historical records and charcoal particles embedded in stratigraphic records indicate
that fires occurred in the everwet tropical forests although rarely (Cochrane 2003). Similarly, the results
of charcoal analysis in montane (Lake Kalimpaa, Chapter 5 and Chapter 6) and peat-swamp (Air Hitam,
Chapter 8 and Chapter 9) ecosystems show that although rare, wildfires did occur in the past in Central
Sulawesi and Sumatra. The regime of fire, in particular the frequency, was found to correlate with
regional scale drought episodes in Central Sulawesi. Both fire frequency and magnitude of events
increased at Air Hitam in correlation with the increase in El Niño number of events. These results
indicate that the fire regime of montane ecosystems in Central Sulawesi and peat-swamp forests in
Jambi can change in the long-term following changes in patterns of rainfall and ENSO variability.
However, our results indicate that the effects of fire and droughts on the carbon storage functions of
the two systems under study might not have been marked. In particular, Fagaceae species
representation around Lake Kalimpaa was not affected by increases of fires caused by drought, and the
carbon accumulation capacity of the ombrotrophic-Pandanus dominated ecosystems in Air Hitam did
not change (but rather increase) when frequency and magnitude of fires increased. These results
152
suggest that under natural conditions, fire occurs in these ecosystems, but the effect on their carbon
storage function in time can be relatively low.
A historical perspective of current and future changes
Investigations on the long-term dynamics of vegetation communities using a multi-proxy
palaeoecological approach extend our knowledge on how tropical ecosystems have responded to past
climate variability and human activities and help putting the current and future scenarios of change into
a more comprehensive historical perspective.
The results from the investigation on the fagaceous montane rainforests surrounding Lake Kalimpaa in
Central Sulawesi (Biagioni et al. 2015a; Chapter 6) suggest that the main driver of change for the past
ca. 1500 years was rainfall variability. In particular, the occurrences of regional centennial scale long
periods of drought and changes in the amount of rainfall following the migration of the ITCZ across the
tropics were affecting the composition and diversity of the ecosystems. Interestingly, species turnover
was less marked when drought episodes occurred in combination with millennial scale enhanced rainfall
at the intra-annual scale. This suggests that the natural forest ecosystems are more resilient to the
occurrences of episodes of droughts when the overall seasonality is less marked and perhumid
conditions are established. Predictions of climate change in the area are still uncertain. However, if
seasonality will increase and drought episodes will occur more frequently, the response of vegetation
communities in the future might closely resemble the conditions reconstructed between ca. AD 1070
and AD 1450. The occurrences of wildfire will likely increase in frequency, while communities’ diversity
may decrease and long-living pioneers such as Weinmannia could become more common in disturbed
patches of the forest. The growth of the valuable Agathis tree might be greatly reduced, as results
indicate that species of this genus were sensitive towards patterns of decreasing rainfall and rates of
recovery following selective logging have been slow. However, the overall function as biomass storage
of the Fagaceae forests might persist even under changing rainfall conditions, as our results indicate
that species from this family have been resilient towards rainfall variability and droughts. However, if
changes in temperature caused by anthropogenic climate change should occur (Stocker 2014),
competition and pressure from species currently growing at lower altitudes might increase and the
overall composition of the forest could change. As no comparable conditions were found for the past
ca. 1500 years, the consequences of temperature change over these ecosystems are currently hard to
predict.
A rapid acceleration of disturbance driven by human activities is underlined by the results in both
regions under study for the past decades. The overall results of this research highlight that the pressure
exerted over millennia on montane and peat-swamp rainforests in Indonesia has been of a different
magnitude as compared to the modern anthropogenic driven changes. In particular, increased in
153
siltation, as a consequence of forest conversion, is causing lake level decreases in both small basins,
such as Lake Kalimpaa, and larger water basins, such as Lake Lindu in the montane regions of Central
Sulawesi. The consequences of these rapid changes are likely to affect the ecosystem functions thought
a loss of the ecosystems capacity to prevent flooding and landslides, affecting human welfare of the
isolated communities living in the valleys. Natural forest cover on the upper slopes of the valleys has
been underlined to be a particular important factor in relation to flood protection, erosion and siltation
(Whiteman and Fraser 1997). Given the rapid rate of forest recovery experienced at the Lindu valley in
the phase from ca. AD 1730 to 1910, a better management of irrigation channels and restoration of the
degraded forest on the slopes of the valley might reverse this observed trend if actions are taken in the
immediate future.
The results from the multi-proxy reconstruction of the peat-swamp ecosystems of Air Hitam in Sumatra
suggest that the most important factor influencing the increased carbon storage at Air Hitam was the
expansion of Pandanus and its extensive roots system, while water table change, above ground biomass
and rainfall variability overall played a less important role.
However, the recent degradation of the area and the conversion to oil palm plantations greatly changed
the vegetation communities on the peatland. Intensive logging activities virtually removed all of the
large trees in the area and the constructions of channels and ditches have artificially lowered the water
table. If peat accumulation is largely controlled by the quantity of belowground organic matter inputs
(i.e. roots of Pandanus), as evidence in the study suggests, then the peat forests where root mats have
declined or disappeared by natural or artificial causes will remain in equilibrium or subside, but will not
expand. Net accumulations of peat will likely occur where high water levels and thick root mats still
exist, and possibly in altered areas where these conditions are re-established. Under these conditions,
climate-induced changes in precipitation will probably not alter factors to an extent in which peat
accumulation ceases in the long-term, even under scenarios of fire regime changes. However, in order
to preserve the potential value of this area as a carbon sink, a better management of the water table
level should be applied and restoring measurements, act at re-establishing the natural vegetation cover,
should be taken.
Concluding remarks, uncertainties and perspectives
The results from the research compiled in this thesis highlight the value of using a palaeo multi-proxy
approach in order to better understand dynamics and functions of tropical ecosystems and the
identification of the most important drivers of change.
Despite their potential, so far the number of such investigations in Indonesia is still very limited. As a
consequence, several uncertainties currently remain. For instance, a large question mark remains on
the role of prehistoric communities in shaping present-day tropical ecosystems. The example of Central

154
Sulawesi is an emblematic one. Virtually nothing is known about the megalithic culture despite few
studies (Kirleis et al. 2011; Kirleis et al. 2012), and the research conducted at the Lindu valley (Chapter
7), suggests that this population might have played an important role, and it might have acted as a
strong driver of change already thousands of years ago.
Trying to predict the fate of montane tropical rainforests under future climate change scenarios requires
an understanding of the long-term effect of climate variability on the different communities occupying
different altitudinal niches. So far, no such study exists and one large uncertainty remains on how these
ecosystems might respond to increases in temperature.
The need to manage peatlands has recently gained large attention due to the fast rate of degradation
and conversion these important ecosystems are experiencing in SE Asia. However, when a management
of the systems is required in order to restore and/or preserve the ecosystem functions, a better
understanding of the main components and processes of peat-forming systems is essential. Few
restoration programs have taken this into consideration and so far the planning and approaches are
limited to short-term studies on recovery and rate of survival of pioneer vegetation cover during early
stage succession. Due to the fact that peat-swamp ecosystems in SE Asia are spread over large areas
(and on different islands), environmental conditions are greatly different from one system to the other
and generalizations are difficult to make. There is a need for more integrative investigations in key sites,
in order to act in the most efficient way.
Although there is still much to do before we can gain a deep understanding of the stability, resilience
and recovery of tropical ecosystems in Indonesia, with our investigations in Central Sulawesi and
Sumatra we have found that the use of a palaeoecological integrative approach can be a powerful tool
and much can be learnt from the past.
Slowly, we can move forward to our goal to unravel the processes and factors that brought tropical
ecosystems to be the way they are today.
155
Bibliography
Acciaioli, G., 1989. Searching for good fortune: the making of a Bugis shore community at Lake Lindu, Central Sulawesi. Australian National University, Canberra.
Acciaioli, G., 2000. Kinship and debt: the social organization of Bugis migration and fish marketing at Lake Lindu, Central Sulawesi. In Bijdragen tot de Taal-, Land- en Volkenkunde, Authority and enterprise among the peoples of South Sulawesi 156(3), 589-617.
Acciaioli, G., 2001. Grounds of conflict, idioms of harmony: custom, religion, and nationalism in violence avoidance at the Lindu Plain, Central Sulawesi. Indonesia 72, 81–114 (Cornell Southeast Asia Program).
Achard, F., Eva, H.D., Mayaux, P., Stibig, H.-J., Belward, A., 2004. Improved estimates of net carbon emissions from land cover change in the tropics for the 1990s. Global Biogeochem. Cycles 18, GB2008.
Ad-hoc AG Boden (Ad-hoc-Arbeitsgruppe der Staatlichen Geologischen Dienste und der Bundesanstalt für Geowissenschaften und Rohstoffe), 2005. Bodenkundliche Kartieranleitung. Stuttgart: Schweizerbart.
Adiwibowo, S., 2005. Dongi-dongi - culmination of a multi-dimensional ecological crisis: a political ecology perspective. PhD thesis, University of Kassel, Germany.
Adriani, N., Kruyt, A.C., 1898. Van Posso naar Parigi, Sigi en Lindoe Mededeelingen van vege het Nederlandsch Zendelinggenootschap 42, 369-535.
Aldrian, E., Dümenil-Gates, L., Jacob, D., Podzun, R., Gunawan, D., 2004. Long-term simulation of Indonesian rainfall with the MPI regional model. Climate Dynamics 22, 795–814.
Aldrian, E., Susanto, R., 2003. Identification of three dominant rainfall regions within Indonesia and their relationship to sea surface temperature. International Journal of Climatology 23, 1435–1452.
Ali, M., Oda, H., Hayashida, A., Takemura, K., Torii, M., 1999. Holocene palaeomagnetic secular variation at Lake Biwa, central Japan. Geophysical Journal International 136, 218–228.
Allen, C.D., Macalady, A.K., Chenchouni, H., Bachelet, D., McDowell, N., Vennetier, M., Kitzberger, T., Rigling, A., Breshears, D.D., Hogg, E.H. (Ted), Gonzalez, P., Fensham, R., Zhang, Z., Castro, J., Demidova, N., Lim, J.-H., Allard, G., Running, S.W., Semerci, A., Cobb, N., 2010. A global overview of drought and heat-induced tree mortality reveals emerging climate change risks for forests. Forest Ecology and Management, Adaptation of Forests and Forest Management to Changing Climate Selected papers from the conference on “Adaptation of Forests and Forest Management to Changing Climate with Emphasis on Forest Health: A Review of Science, Policies and Practices”, Umeå, Sweden, August 25-28, 2008. 259, 660–684.
Amundson, R., Austin, A.T., Schuur, E.A.G., Yoo, K., Matzek, V., Kendall, C., Uebersax, A., Brenner, D., Baisden, W.T., 2003. Global patterns of the isotopic composition of soil and plant nitrogen. Global biogeochemical cycles 17(1).
Anderson, J.A.R., 1961. The ecology and forest types of the peat swamp forests of Sarawak and Brunei in relation to their silviculture. PhD thesis, University of Edinburgh, UK.
Anderson, J.A.R., 1963. The flora of the peat swamp forests of Sarawak and Brunei, including a catalogue of all recorded species of flowering plants, ferns and fern allies. Gardens Bulletin, Singapore 20, 131–228.
Anderson, J.A.R., 1964. The structure and development of the peat swamps of Sarawak and Brunei. Journal of Tropical Geography 18, 7-16.
Anderson, J.A.R., 1976. Observations on the ecology of five peat swamp forests in Sumatra and Kalimantan. In: Proc. ATA 106 Midterm Seminar, Peat and Podzolic Soils and their Potential for Agriculture in Indonesia. Peat and podzolic soils in Indonesia, 45-55.
Anderson, J.A.R., 1983. The tropical peat swamps of western Malesia. In: Gore, A.J.P., (Eds.), Ecosystems of the World 4B: Mires: Swamp, Bog, Fen and Moor. Elsevier, Amsterdam, New York, 181-199.
Anderson, J.A.R., Muller, J., 1975. Palynological study of a Holocene peat and a Miocene coal deposit from NW Borneo. Review of Palaeobotany and Palynology 19, 291–351.
Anderson, M.J., Ellingsen, K.E., McArdle, B.H., 2006. Multivariate dispersion as a measure of beta diversity. Ecology Letters 9, 683-93.
Anshari, G., Kershaw, A.P., Van Der Kaars, S., 2001. A late Pleistocene and Holocene pollen and charcoal record from peat swamp forest, Lake Sentarum Wildlife Reserve, West Kalimantan, Indonesia. Palaeogeography, Palaeoclimatology, Palaeoecology 171, 213–228.
Anshari, G., Kershaw, A.P., Van Der Kaars, S., Jacobsen, G., 2004. Environmental change and peatland forest dynamics in the Lake Sentarum area, West Kalimantan Indonesia. Journal of Quaternary Science 19, 637–655.
156
Anshari, G.Z., Afifudin, M., Nuriman, M., Gusmayanti, E., Arianie, L., Susana, R., Nusantara, R.W., Sugardjito, J., Rafiastanto, A., 2010. Drainage and land-use impacts on changes in selected peat properties and peat degradation in West Kalimantan Province, Indonesia. Biogeosciences 7, 3403-3419.
Arnold, J., Corre, M.D., Veldkamp, E., 2009. Soil N cycling in old-growth forests across an Andosol toposequence in Ecuador. Forest ecology and management 257, 2079–2087.
Ashton, P.S., 2003. Floristic zonation of tree communities on wet tropical mountains revisited. Perspectives in Plant Ecology, Evolution and Systematics 6, 87–104.
Audley-Charles, M.G., 1983. Reconstruction of eastern Gondwanaland. Nature 306, 48–50. Baas, P., Kalkman, K., Geesink, R., 1990. The Plant Diversity of Malesia. Kluwer Academic Publishers, Dordrecht,
The Netherlands. Barber, K.E., 1981. Peat Stratigraphy and Climatic Change: A Palaeoecological Test of the Theory of Cyclic Peat Bog
Regeneration. A.A. Balkema Publishers, The Netherlands. Barletta, F., St-Onge, G., Channell, J.E.T., Rochon, A., 2010. Dating of Holocene western Canadian Arctic sediments
by matching paleomagnetic secular variation to a geomagnetic field model. Quaternary Science Reviews 29, 2315–2324.
Bellwood, P., 1979. Man’s conquest of the pacific. The prehistory of Southeast Asia and Oceania New York. Oxford University Press, UK.
Berry, L., Ruxton, B.P., 1959. Notes on weathering zones and soils on granitic rocks in two tropical regions. Journal of Soil Science 10, 54–63.
Biagioni, S., Wündsch, M., Haberzettl, T., Behling, H., 2015a. Assessing resilience/sensitivity of tropical mountain rainforests towards climate variability of the last 1500 years: The long-term perspective at Lake Kalimpaa (Sulawesi, Indonesia). Review of Palaeobotany and Palynology 213, 42–53.
Biagioni, S., Krashevska, V., Achnopha, Y., Saad, A., Sabiham, S., Behling, H., 2015b. 8000 years of vegetation dynamics and environmental changes of a unique inland peat ecosystem of the Jambi Province in Central Sumatra, Indonesia. Palaeogeography, Palaeoclimatology, Palaeoecology 440, 813–829.
Biagioni, S., Haberzettl, T., Wang, L.-C., St-Onge, G., Behling, H., 2016. Unravelling the past 1,000 years of history of human–climate–landscape interactions at the Lindu plain, Sulawesi, Indonesia. Vegetation History and Archaeobotany 25, 1–17.
Bird, M.I., Taylor, D., Hunt, C., 2005. Palaeoenvironments of insular Southeast Asia during the Last Glacial Period: a savanna corridor in Sundaland? Quaternary Science Reviews 24, 2228–2242.
Birks, H., Line, J., 1992. The use of rarefaction analysis for estimating palynological richness from Quaternary pollen-analytical data. The Holocene 2 (1), 1-10.
Birks, H.H., Birks, H.J.B., 2006. Multi-proxy studies in palaeolimnology. Vegetation History and Archaeobotany 15, 235–251.
Birks, H.J.B., 2007. Estimating the amount of compositional change in late-Quaternary pollen-stratigraphical data. Vegetation History and Archaeobotany 16 (2-3), 197-202.
Birks, H.J.B., Birks, H.H., 1980. Quaternary Palaeoecology. Edward Arnold, London. Birks, H.J.B., Birks, H.H., 2008. Biological responses to rapid climate change at the Younger Dryas-Holocene
transition at Kråkenes, western Norway. The Holocene 18 (1), 19-30. Blaauw, M., 2010. Methods and code for “classical”age-modelling of radiocarbon sequences. Quaternary
Geochronology 5, 512–518. Blott, S.J., Pye, K., 2001. GRADISTAT: a grain size distribution and statistics package for the analysis of
unconsolidated sediments. Earth surface processes and Landforms 26, 1237–1248. Bobrov, A.A., Andreev, A.A., Schirrmeister, L., Siegert, C., 2004. Testate Amoebae (Protozoa: Testacealobosea and
Testaceafilosea) as Bioindicators in the Late Quaternary Deposits of the Bykovsky Peninsula, Laptev Sea, Russia. Palaeogeography, Palaeoclimatology, Palaeoecology 209 (1-4), 165-81.
Bobrov, A.A., Charman, D.J., Warner, B.G., 1999. Ecology of testate amoebae (Protozoa: Rhizopoda) on peatlands in western Russia with special attention to niche separation in closely related taxa. Protist 150 (2), 125-136.
Boyle, E.A., 1983. Chemical accumulation variations under the Peru Current during the past 130,000 years. Journal of Geophysical Research: Oceans (1978–2012) 88, 7667–7680.
Braadbaart, F., Poole, I., 2008. Morphological, chemical and physical changes during charcoalification of wood and its relevance to archaeological contexts. Journal of archaeological science 35, 2434–2445.
Brady, M.A., 1997. Organic matter dynamics of coastal peat deposits in Sumatra, Indonesia. Phd thesis, University of British Colombia, Canada.
Brambach, F., Nooteboom, H.P., Culmsee, H., 2013. Magnolia sulawesiana described, and a key to the species of Magnolia (Magnoliaceae) occurring in Sulawesi. Blumea - Biodiversity, Evolution and Biogeography of Plants 58, 271–276.

157
Brambach, F., Coode, M., Biagioni, S., Culmsee, H., 2016. Elaeocarpus firdausii (Elaeocarpaceae), a new species from tropical mountain forests of Sulawesi. PhytoKeys 62, 1–14.
Brünig, E.F., 1971. On the ecological significance of drought in the equatorial wet evergreen (rain) forest of Sarawak, Borneo. In: The water relations of Malesian forests - Transactions of the first Aberdeen-Hull symposium 192 on Malesian ecology, held in Hull, 1970, Flenley, J.R., (Eds.), 66-96.
Brünig, E.F., 1974. Ecological studies in the kerangas forests of Sarawak and Brunei. Kuching: Borneo Literature Bureau for Sarawak Forest Department, Kuching, pp. 250.
Brünig, E.F., 1990. Oligotrophic forested wetlands in Borneo. Chapter 13. In: Forested Wetlands, Lugo, A.E., Brinson, M., Brown, S., (Eds.), 299-333.
Brünig, E.F., 1996. Conservation and Management of Tropical Rainforest. An Integrated Approach to Sustainability. CABI Publishing Series, pp. 339.
Buffle, J., De Vitre, R.R., Perret, D., Leppard, G.G., 1989. Physico-chemical characteristics of a colloidal iron phosphate species formed at the oxic-anoxic interface of a eutrophic lake. Geochimica et Cosmochimica Acta 53, 399–408.
Caline, B., Huang, J., 1992. New insights into the recent evolution of the Baram delta from satellite imagery. Bull. Geol. Soc. Malaysia 32:1-13.
Cameron, C.C., Esterle, J.S., Palmer, C.A., 1989. The geology, botany and chemistry of selected peat-forming environments from temperate and tropical latitudes. International Journal of Coal Geology 12, 105–156.
Cane, M.A., 2005. The evolution of El Niño, past and future. Earth and Planetary Science Letters 230, 227–240. Cannon, C.H., 2005. Vegetation of Sulawesi: fine filter analysis. Report of the Ecoregional Conservation
Assessment, The Nature Conservancy. Cannon, C.H., Manos, P.S., 2003. Phylogeography of the Southeast Asian stone oaks (Lithocarpus). Journal of
Biogeography 30, 211–226. Cannon, C.H., Morley, R.J., Bush, A.B., 2009. The current refugial rainforests of Sundaland are unrepresentative of
their biogeographic past and highly vulnerable to disturbance. Proceedings of the National Academy of Sciences 106, 11188–11193.
Cannon, C.H., Summers, M., Harting, J.R., Kessler, P.J.A., 2007. Developing Conservation Priorities Based on Forest Type, Condition, and Threats in a Poorly Known Ecoregion: Sulawesi, Indonesia. Biotropica 39, 747–759.
Carcaillet, C., Almquist, H., Asnong, H., Bradshaw, R.H.W., Carrion, J.S., Gaillard, M.-J., Gajewski, K., Haas, J.N., Haberle, S.G., Hadorn, P., others, 2002. Holocene biomass burning and global dynamics of the carbon cycle. Chemosphere 49, 845–863.
Carcaillet, C., Bouvier, M., Fréchette, B., Larouche, A.C., Richard, P.J.H., 2001. Comparison of pollen-slide and sieving methods in lacustrine charcoal analyses for local and regional fire history. The Holocene 11, 467–476.
Carris, L.M., Castlebury, L.A., Goates, B.J., 2006. Nonsystemic Bunt Fungi-Tilletia indica and T. horrida: A Review of History, Systematics, and Biology*. Annu. Rev. Phytopathol. 44, 113–133.
Cecil, C.B., Dulong, F.T., Cobb, J.C., others, 1993. Allogenic and autogenic controls on sedimentation in the Central Sumatra Basin as an analogue for Pennsylvanian coal-bearing strata in the Appalachian Basin. Geological Society of America Special Papers 286, 3–22.
Cerdà, A., Lasanta, T., 2005. Long-term erosional responses after fire in the Central Spanish Pyrenees: 1. Water and sediment yield. Catena 60, 59–80.
Chambers, C.T., 2013. A review of the genus Stenochlaena (Blechnaceae, subfamily Stenochlaenoideae. Telopea Journal of Plant Systematics 15, 13–36.
Chambers, F.M., Beilman, D.W., Yu, Z., 2011. Methods for determining peat humification and for quantifying peat bulk density, organic matter and carbon content for palaeostudies of climate and peatland carbon dynamics. Mires Peat 7, 1–10.
Chardez, D., 1965. Ecologie générale des Thécamoebiens. Bulletin de l’Institut Agronomique et des Stations de Recherche de Gembloux 33, 307–341.
Charman, D.J., Hendon, D., Woodland, W.A., 2000. The identification of testate amoebae (Protozoa: Rhizopoda) in peats. QRA Technical Guide No. 9. London: Quaternary Research Association, London, pp. 147.
Chaturvedi, M., Datta, K., Nair, P.K.K., 1998. Pollen morphology of Oryza (Poaceae). Grana 37, 79–86. Christensen, J.H., Hewitson, B., Busuioc, A., Chen, A., Gao, X., Held, I., et al., 2007. Regional climate projections,
chap. 11. In: Solomon, S., Qin, D., Manning, M., Chen, Z., Marquis, M., Averyt, K., et al., (Eds.), Climate change 2007: The physical science basis. Contribution of working group I to the fourth assessment report of the intergovernmental panel on climate change. Cambridge University Press, Cambridge, UK, pp. 847-940.
Clark R.L., 1982. Point count estimation of charcoal in pollen preparations and thin sections of sediment. Pollen et Spores XXIV, 523–535.
Clark, J.S., Lynch, J., Stocks, B.J., Goldammer, J.G., 1998. Relationships between charcoal particles in air and sediments inWest-Central Siberia. The Holocene 8, 19–30.

158
Clark, J.S., Patterson III, W.A., 1997. Background and local charcoal in sediments: scales of fire evidence in the paleorecord, in: Sediment Records of Biomass Burning and Global Change. Springer, pp. 23–48.
Clark, J.S., Royall, P.D., 1995. Particle-size evidence for source areas of charcoal accumulation in late Holocene sediments of eastern North American lakes. Quaternary Research 43, 80–89.
Clark, R.L., 1984. Effects on charcoal of pollen preparation procedures. Pollen et spores 26, 559–576. Clarke, M.D., Carney, W.P., Cross, J.H., Hadidjaja, P., Oemijati, S., Joesoef, A., 1974. Schistosomiasis and other
human parasitoses of Lake Lindu in central Sulawesi (Celebes), Indonesia. The American journal of tropical medicine and hygiene 23, 385–392.
Clement, A.C., Seager, R., Cane, M.A., 2000. Suppression of El Niño during the Mid-Holocene by changes in the Earth’s orbit. Paleoceanography 15, 731–737.
Clymo, R.S., 1983. Peat. Ecosystems of the World: Bog, Swamp, Moor and Fen, vol 4A. Gore, A.J.P., (Eds.). Amsterdam, Elsevier: 159-224.
Cochrane, M.A., 2003. Fire science for rainforests. Nature 421, 913–919. Cole, L., 2012. Disturbance, recovery and resilience in tropical forests: a focus on the coastal peat swamp forests
of Malaysian Borneo. PhD thesis, University of Oxford, UK. Cole, L.E.S., Bhagwat, S.A., Willis, K.J., 2015. Long-term disturbance dynamics and resilience of tropical peat swamp
forests. Journal of Ecology 103, 16-30. Collins, M., 2005. The CMIP modelling groups. El Niño- or La Niña-like climate change. Climate Dynamics 24, 89-
104. Conroy, J.L., Overpeck, J.T., Cole, J.E., Shanahan, T.M., Steinitz-Kannan, M., 2008. Holocene changes in eastern
tropical Pacific climate inferred from a Galápagos lake sediment record. Quaternary Science Reviews 27, 1166–1180.
Corre, M.D., Veldkamp, E., Arnold, J., Wright, S.J., 2010. Impact of elevated N input on soil N cycling and losses in old-growth lowland and montane forests in Panama. Ecology 91, 1715–1729.
Couwenberg, J., Dommain, R., Joosten, H., 2010. Greenhouse gas fluxes from tropical peatlands in south-east Asia. Global Change Biology 16, 1715–1732.
Crausbay, S.D., Russell, J.M., Schnurrenberger, D.W., 2006. A c. 800-year lithologic record of drought from sub-annually laminated lake sediment, East Java. Journal of Paleolimnology 35 (3), 641-659.
Crowe, S.A., O’Neill, A.H., Katsev, S., Hehanussa, P., Haffner, G.D., Sundby, B., Mucci, A., Fowle, D.A., 2008. The biogeochemistry of tropical lakes: A case study from Lake Matano, Indonesia. Limnology and Oceanography 53, 319–331.
Culmsee, H., Leuschner, C., 2013. Consistent patterns of elevational change in tree taxonomic and phylogenetic diversity across Malesian mountain forests. Journal of Biogeography, DOI: 10.1111/jbi.12138.
Culmsee, H., Leuschner, C., Moser, G., Pitopang, R., 2010. Forest aboveground biomass along an elevational transect in Sulawesi, Indonesia, and the role of Fagaceae in tropical montane rain forests. Journal of biogeography 37, 960–974.
Culmsee, H., Pitopang, R., 2009. Tree diversity in sub-montane and lower montane primary rain forests in Central Sulawesi. Blumea - Biodiversity, Evolution and Biogeography of Plants 54, 119–123.
Culmsee, H., Pitopang, R., Mangopo, H., Sabir, S., 2011. Tree diversity and phytogeographical patterns of tropical high mountain rain forests in Central Sulawesi, Indonesia. Biodiversity and Conservation 20 (5), 1103-1123.
D’Arrigo, R., Wilson, R., Palmer, J., Krusic, P., Curtis, A., Sakulich, J., Bijaksana, S., Zulaikah, S., Ngkoimani, L.O., 2006. Monsoon drought over Java, Indonesia, during the past two centuries. Geophysical Research Letters 33.
Dam, R.A., Fluin, J., Suparan, P., van der Kaars, S., 2001. Palaeoenvironmental developments in the Lake Tondano area (N. Sulawesi, Indonesia) since 33,000 yr BP. Palaeogeography, Palaeoclimatology, Palaeoecology 171, 147–183.
Danielsen, F., Beukema, H., Burgess, N. D., Parish, F., Bruhl, C. A., Donald, P. F., Fitzherbert, E.B., 2009. Biofuel Plantations on Forested Lands: Double Jeopardy for Biodiversity and Climate. Conservation Biology 23 (2), 348-358.
Davidson, E.A., de Carvalho, C.J.R., Figueira, A.M., Ishida, F.Y., Ometto, J.P.H.B., Nardoto, G.B., Sabá, R.T., Hayashi, S.N., Leal, E.C., Vieira, I.C.G., Martinelli, L.A., 2007. Recuperation of nitrogen cycling in Amazonian forests following agricultural abandonment. Nature 447, 995–998.
Davis, G., 1976. Parigi: A social history of the Balinese movement to Central Sulawesi, 1907-1974. PhD thesis, Stanford University, California, USA.
Davison, W., 1993. Iron and manganese in lakes. Earth-Science Reviews 34, 119–163. De Boer, G.B., de Weerd, C., Thoenes, D., Goossens, H.W., 1987. Laser diffraction spectrometry: Fraunhofer
diffraction versus Mie scattering. Particle & Particle Systems Characterization 4, 14–19. de Laubenfels, D.J., 1986. Coniferales. Flora Malesiana, series I (10). Wolters/Noordhoff and Kluwer Publishers,
The Netherlands, pp. 429-442.

159
de Winter, W.P., Amoroso, V.B., 2003. Plant resources of South-East Asia No 15 (2). Cryptogams: Ferns and fern allies. Backhuys Publishers Leiden, The Netherlands, pp. 268.
DeFries, R., Achard, F., Brown, S., Herold, M., Murdiyarso, D., Schlamadinger, B., de Souza Jr., C., 2007. Earth observations for estimating greenhouse gas emissions from deforestation in developing countries. Environmental Science & Policy, Options for including agriculture and forestry activities in a post-2012 international climate agreement 10, 385–394.
DeFries, R.S., Houghton, R.A., Hansen, M.C., Field, C.B., Skole, D., Townshend, J., 2002. Carbon emissions from tropical deforestation and regrowth based on satellite observations for the 1980s and 1990s. PNAS 99, 14256–14261.
Dehmer, J., 1993. Petrology and organic geochemistry of peat samples from a raised bog in Kalimantan (Borneo). Organic geochemistry 20, 349–362.
Diaz, H.F., Kiladis, G.N., 1992. Atmospheric teleconnections associated with the extreme phases of the Southern Oscillation. In: El Niño: historical and paleoclimatic aspects of the southern oscillation, Diaz, H.F., Markgraf V., (Eds.). Cambridge University Press, UK, pp. 7–28.
Dickerson, R. E., 1928. Distribution of Life in the Philippines. Bureau of Printing, Manila, The Philippines. Diemont, W.H., Supardi, 1987a. Accumulation of organic matter and inorganic constituents in a peat dome in
Sumatra, Indonesia. In: International Peat Society Symposium on Tropical Peat and Peatlands for Development, Yogyakarta, Indonesia, February 9-14, 1987, 698-708.
Diemont, W.H., Supardi, 1987b. Forest peat in Indonesia on former sea beds. In: International Peat Society Symposium on Tropical Peat and Peatlands for Development, Yogyakarta, Indonesia, February 9-14, 1987, 709-717.
Dommain, R., Cobb, A.R., Joosten, H., Glaser, P.H., Chua, A.F.L., Gandois, L., Kai, F.-M., Noren, A., Salim, K.A., Su'ut, N.S.H., Harvey, C.F., 2015. Forest dynamics and tip-up pools drive pulses of high carbon accumulation rates in a tropical peat dome in Borneo (Southeast Asia): carbon accumulation in tip-up pools. Journal of Geophysical Research: Biogeosciences 120, 617–640.
Dommain, R., Couwenberg, J., Glaser, P.H., Joosten, H., Suryadiputra, I.N.N., 2014. Carbon storage and release in Indonesian peatlands since the last deglaciation. Quaternary Science Reviews 97, 1–32.
Dommain, R., Couwenberg, J., Joosten, H., 2011. Development and carbon sequestration of tropical peat domes in south-east Asia: links to post-glacial sea-level changes and Holocene climate variability. Quaternary Science Reviews 30, 999–1010.
Donders, T.H., Wagner-Cremer, F., Visscher, H., 2008. Integration of proxy data and model scenarios for the mid-Holocene onset of modern ENSO variability. Quaternary Science Reviews 27, 571-579.
Driessen, P.M., 1977. Peat Soils, their formation, properties, reclamation and suitability for rice cultivation. In Soils and Rice, 763-779. Los Banos (Philippines): International Rice Research Institute.
Duran, R., Fischer, G.W., 1961. The genus Tilletia. Published by Washington State University, Pullman, Washington. Emerson, S., 1976. Early diagenesis in anaerobic lake sediments: chemical equilibria in interstitial waters.
Geochimica et Cosmochimica Acta 40, 925–934. Emmel, F.J., Curray, J.R., 1982. A submerged late Pleistocene delta and other features related to sea level changes
in the Malacca Strait. Marine Geology 47, 197–216. Enache, M.D., Cumming, B.F., 2006. Tracking recorded fires using charcoal morphology from the sedimentary
sequence of Prosser Lake, British Columbia (Canada). Quaternary Research 65, 282–292. Endert, F. H., 1920. De woud boom flora van Palembang. Tectona 13, 113-159. Engstrom, D.R., Wright Jr, H.E., 1984. Chemical stratigraphy of lake sediments as a record of environmental
change. In: Lake sediments and environmental history: studies in palaeolimnology and palaeoecology in honour of Winifred Tutin. Haworth, E.Y., Lund, J.W.G., (Eds.). University of Minnesota, US.
Erdtman, O., 1921. Pollenanalytische Untersuchungen von Torfmooren und marinen Sedimenten in Sudwest-Schweden (Dissertation, StockholmsHodgskola). (Arkiv for botanik vol. 17: 10). Uppsala: Almqvist & Wiksell, p. 173.
Esterle, J.S., Ferm, J.C., 1994. Spatial variability in modern tropical peat deposits from Sarawak, Malaysia and Sumatra, Indonesia: analogues for coal. International Journal of Coal Geology 26, 1–41.
Faegri, K., Kaland, P., Krzywinski, K., (Eds.) 1989. Textbook of pollen analysis. 4th edn Wiley, Chichester. Fargione, J., Hill, J., Tilman D., Polasky, S., Hawthorne, P., 2008. Land Clearing and the Biofuel Carbon Debt. Science
319, 1235-1238. Farmer, J., Matthews, R., Smith, J.U., Smith, P., Singh, B.K., 2011. Assessing existing peatland models for their
applicability for modelling greenhouse gas emissions from tropical peat soils. Current Opinion in Environmental Sustainability 3, 339–349.
Febriliani, Sri Ningsih, M., Muslimin, 2013. Analisis vegetasi habitat anggrek di sekitar Danau Tambing kawasan Taman Nasional Lore Lindu. Warta Rimba 1 (1), 1-9.
160
Felton, A.A., Russell, J.M., Cohen, A.S., Baker, M.E., Chesley, J.T., Lezzar, K.E., McGlue, M.M., Pigati, J.S., Quade, J., Stager, J.C., others, 2007. Paleolimnological evidence for the onset and termination of glacial aridity from Lake Tanganyika, Tropical East Africa. Palaeogeography, Palaeoclimatology, Palaeoecology 252, 405–423.
Finsinger, W., Tinner, W., 2005. Minimum count sums for charcoal concentration estimates in pollen slides: accuracy and potential errors. The Holocene 15 (2), 293-297.
Flenley, J.R., 1967. Highland Papua New Guinea pollen flora I. In: Flenley, J.R., (Eds.), The present and former vegetation of the Wabag region of New Guinea. Dissertation, Australian National University Canberra (extract at http://www.palaeoworks.anu.edu.au/databases.html).
Flenley, J.R., Butler, K., 2001. Evidence for continued disturbance of upland rain forest in Sumatra for the last 7,000 years of an 11,000 year record. Palaeogeography, Palaeoclimatology, Palaeoecology 171 (3), 289-305.
Forest Watch Indonesia/Global Forest Watch, 2002. The State of the Forest: Indonesia. Bogor, Indonesia: Forest Watch Indonesia, and Washington DC: Global Forest Watch.
Furukawa, H., 1994. Coastal Wetlands of Indonesia: Environment, Subsistence and Exploitation. Kyoto University Press, Kyoto, pp. 219.
Gagan, M.K., Hendy, E.J., Haberle, S.G., Hantoro, W.S., 2004. Post-glacial evolution of the Indo-Pacific warm pool and El Nino-Southern Oscillation. Quaternary International 118, 127–143.
Gardner, J.J., Whitlock, C., 2001. Charcoal accumulation following a recent fire in the Cascade Range, northwestern USA, and its relevance for fire-history studies. The Holocene 11, 541–549.
Garrett-Jones, S.E., 1979. Pollen flora: lowland Papua New Guinea. In: Garrett-Jones, S.E., (Eds.), Evidence for changes in Holocene vegetation and lake sedimentation in the Markham Valley, Papua New Guinea. Dissertation, Australian National University Canberra (extract at http://www.palaeoworks.anu.edu.au/databases.html).
Garstang, M., Tyson, P.D., Cachier, H., Radke, L., 1997. Atmospheric transport of particulate and gaseous products by fires. In: Clark, J.S., Cachier, H., Goldammer, J.G., Stocks, B., (Eds.), Sediment Records of Biomass Burning and Global Change. Proceedings of the NATO Advanced Study Institute 'Biomass Burning Emissions and Global Change', Held in Praia de Alvor Algarve, Portugal, October 1994. pp. 207– 250.
Gavin, D.G., Hu, F.S., Lertzman, K., Corbett, P., 2006. Weak climatic control of stand-scale fire history during the late Holocene. Ecology 87, 1722–1732.
Geyh, M.A., Streif, H., Kudrass, H.R., 1979. Sea-level changes during the late Pleistocene and Holocene in the Strait of Malacca. Nature 278, 441-443.
Giesen, W., 1993. The State of Natural Wetlands in Sumatra. Implications for conservation, and the general trend in Indonesia. Paper presented at the Workshop on Tropical Environmental Management: Biodiversity for Sustainable Development in SE Asia. Wallace Research University, Dumoga Bone NP, North Sulawesi, 8-18 February 1993, pp. 39.
Giesen, W., 1994. Habitat changes in wetlands of the Greater Sunda’s and implications for biodiversity. Presented at “Symposium pertama mengenai Berang-berang di Indonesia, dengan tema: Berang-berang bagi Manusia”, held at PHPA, Bogor, 7 April 1994, 45-55.
Godfrey, J.S., 1996. The effect of the Indonesian throughflow on ocean circulation and heat exchange with the atmosphere: A review. Journal of Geophysical Research: Oceans (1978–2012) 101, 12217–12237.
Goldich, S.S., 1938. A study in rock-weathering. The Journal of Geology 17–58. Gómez, N., Riera, J.L., Sabater, S., 1995. Ecology and morphological variability of Aulacoseira granulata
(Bacillariophyceae) in Spanish reservoirs. Journal of Plankton Research 17, 1–16. Gordon, A.L., Susanto, R.D., Field, A., 1999. Throughflow within Makassar Strait. Geophysical Research Letters 26,
3325–3328. Gorham, E., 1991. Northern peatlands: role in the carbon cycle and probable responses to climatic warming.
Ecological applications 1, 182–195. Grady, W.C., Eble C.F., Neuzil S.G., 1993. Brown coal maceral distributions in a modern domed tropical Indonesian
peat and a comparison with maceral distributions. In: Middle Pennsylvanian-age Applachian bituminous coal beds. Cobb, J.C., Cecil, C.B., (Eds.). Modern and Ancient Coal-Forming Environments. Geological Society of America Special Paper 286. Boulder, Colorado, US.
Gremmen, W.H.E., 1990. Palynological investigations in the Danau Tempe depression, southwest Sulawesi (Celebes), Indonesia. Modern quaternary research in Southeast Asia 11, 123-134.
Griffin, J.J., Goldberg, E.D., 1983. Notes. Impact of fossil fuel combustion on sediments of Lake Michigan: a reprise. Environmental science & technology 17, 244–245.
Griffiths, M.L., Drysdale, R.N., Gagan, M.K., Frisia, S., Zhao, J., Ayliffe, L.K., Hantoro, W.S., Hellstrom, J.C., Fischer, M.J., Feng, Y.-X., others, 2010. Evidence for Holocene changes in Australian–Indonesian monsoon rainfall from stalagmite trace element and stable isotope ratios. Earth and Planetary Science Letters 292, 27–38.
161
Grimm, E.C., 1987. CONISS: a FORTRAN 77 program for stratigraphically constrained cluster analysis by the method of incremental sum of squares. Computers and Geosciences 13, 13-35.
Grimm, E.C., 1993. TILIA v2.0 (computer software) Illinois State Museum, Research and Collections Centre, Springfield, IL, USA.
Grimm, E.C., Bradshaw, R.H.W., Brewer, S., Flantua, S., Giesecke, T., Lèzine, A.M., Takahara, H., Williams, J.W., 2013. Pollen Methods and Studies. Databases and their application. In: Elias SA Mock CJ (Eds) Encyclopedia of Quaternary Science 2, Elsevier, 831-838.
Guilyardi, E., 2006. El Niño–mean state–seasonal cycle interactions in a multi-model ensemble. Climate Dynamics 26, 329-348.
Gunawan, D., 2006. Atmospheric variability in Sulawesi, Indonesia: regional atmospheric model results and observations. PhD thesis, University of Goettingen, Germany.
Gunawan, H., Kobayashi, S., Mizuno, K., Kono, Y., 2012. Peat swamp forest types and their regeneration in Giam Siak Kecil-Bukit Batu Biosphere Reserve, Riau, East Sumatra, Indonesia. Mires and Peat 10, 1-17.
Guy-Ohlson, D., 1992. Botryococcus as an aid in the interpretation of palaeoenvironment and depositional processes. Review of Palaeobotany and Palynology 71, 1–15.
Haberle, S.G., Hope, G.S., van der Kaars, S., 2001. Biomass burning in Indonesia and Papua New Guinea: natural and human induced fire events in the fossil record. Palaeogeography, Palaeoclimatology, Palaeoecology 171, 259-268.
Haberzettl, T., Fey, M., Lücke, A., Maidana, N., Mayr, C., Ohlendorf, C., Schäbitz, F., Schleser, G.H., Wille, M., Zolitschka, B., 2005. Climatically induced lake level changes during the last two millennia as reflected in sediments of Laguna Potrok Aike, southern Patagonia (Santa Cruz, Argentina). Journal of Paleolimnology 33, 283–302.
Haberzettl, T., Kück, B., Wulf, S., Anselmetti, F., Ariztegui, D., Corbella, H., Fey, M., Janssen, S., Lücke, A., Mayr, C., others, 2008. Hydrological variability in southeastern Patagonia and explosive volcanic activity in the southern Andean Cordillera during Oxygen Isotope Stage 3 and the Holocene inferred from lake sediments of Laguna Potrok Aike, Argentina. Palaeogeography, Palaeoclimatology, Palaeoecology 259, 213–229.
Haberzettl, T., St-Onge, G., Behling, H., Kirleis W., 2013. Evaluating Late Holocene radiocarbon-based chronologies by matching palaeomagnetic secular variations to geomagnetic field models: an example from Lake Kalimpaa (Sulawesi, Indonesia). In: Jovane, L., Herrero-Bervera, E. Hinnov, L.A., Housen, B.A., (Eds.), Magnetic Methods and the Timing of Geological Processes. Geological Society, London, Special Publications 373, 245-259.
Håkanson, L., Jansson, M., 2002. Principles of Lake Sedimentology. Springer. Berlin, Germany. Hall, R., 2009. Southeast Asia's changing palaeogeography. Blumea - Biodiversity, Evolution and Biogeography of
Plants 54 (1-3), 148-161. Hamilton, W.B., 1979. Tectonics of the Indonesian region. USGS Prof. Paper 1078, 345 pp. and map. Hammer, Ø., Harper, D.A.T., Ryan, P.D., 2001. PAST: Paleontological statistics software package for education
and data analysis. Palaeontologia Electronica, 4(1) (http://www.palaeoelectronica.org/2001_1/past/issue1_01.htm).
Hanebuth, T., Stattegger, K., Grootes, P.M., 2000. Rapid Flooding of the Sunda Shelf: A Late-Glacial Sea-Level Record. Science 288, 1033–1035.
Hanebuth, T.J., Voris, H.K., Yokoyama, Y., Saito, Y., Okuno, J.I., 2011. Formation and fate of sedimentary depocentres on Southeast Asia’s Sunda Shelf over the past sea-level cycle and biogeographic implications. Earth-Sci. Rev. 104, 92-110.
Haseldonckx, P., 1977. The palynology of a Holocene marginal peat swamp environment in Johore, Malaysia. Review of Palaeobotany and Palynology 24, 227-238.
Haug, G.H., Hughen, K.A., Sigman, D.M., Peterson, L.C., Röhl, U., 2001. Southward migration of the Intertropical Convergence Zone through the Holocene. Science 293 (5533), 1304-1308.
Heil, A., Langmann, B., Aldrian, E., 2007. Indonesian peat and vegetation fire emissions: Study on factors influencing large-scale smoke haze pollution using a regional atmospheric chemistry model. Mitigation and adaptation strategies for global change 12, 113–133.
Helmi, 2001. Sejarah Kawasan Taman Nasional Lore Lindu. Paper presented at the Workshop on the Lore Lindu National Park Management Plan, Bogor, July 30th - August 2nd 2001, Jakarta, Indonesia.
Herawati, H., Santoso, H., 2011. Tropical forest susceptibility to and risk of fire under changing climate: A review of fire nature, policy and institutions in Indonesia. Forest Policy and Economics 13, 227-233.
Higuera, P.E., Brubaker L.B., Anderson P.M., Brown, T.A., Kennedy, A.T., Hu, F.S., 2008. Frequent fires in ancient shrub tundra: Implications of paleorecords for arctic environmental change. PLoS One 3 (3).
Higuera, P.E., Brubaker, L.B., Anderson, P.M., Hu, F.S., Brown, T.A., 2009. Vegetation mediated the impacts of postglacial climate change on fire regimes in the south-central Brooks Range, Alaska. Ecological Monographs 79, 201–219.
162
Higuera, P.E., Peters, M., Brubaker, L., Gavin, D., 2007. Understanding the origin and analysis of sediment-charcoal records with a simulation model. Quaternary Science Reviews 26, 1790–1809.
Hijmans, R.J., Cameron, S.E., Parra, J.L., Jones, P.G., Jarvis, A., 2005. Very high resolution interpolated climate surfaces for global land areas International. Journal of Climatology 25, 1965-1978.
Hill, M.O., Gauch, H.G., 1980. Detrended correspondence analysis, an improved ordination technique. Vegetation 42, 47-58.
Holloway, J.D., Hall, R., 1998. SE Asian geology and biogeography: an introduction. Biogeography and geological evolution of SE Asia 1–23.
Hooijer, A., Page, S., Canadell, J. G., Silvius, M., Kwadijk, J., Wösten, H., Jauhiainen, J., 2010. Current and future CO2 emissions from drained peatlands in Southeast Asia. Biogeosciences 7, 1505-1514.
Hope, G., 2001. Environmental change in the late Pleistocene and later Holocene at Wanda site, Soroako, South Sulawesi, Indonesia. Palaeogeography, Palaeoclimatology, Palaeoecology 171, 129–145.
Hope, G., Chokkalingam, U., Anwar, S., 2005. The stratigraphy and fire history of the Kutai peatlands, Kalimantan, Indonesia. Quaternary Research 64, 407-417.
Horner, R.R., Welch, E.B., Seeley, M.R., Jacoby, J.M., 1990. Responses of periphyton to changes in current velocity, suspended sediment and phosphorus concentration. Freshwater biology 24, 215–232.
Horton, B.P., Gibbard, P.L., Milne, G.M., Morley, R.J., Purintavaragul, C., Stargardt, J.M., 2005. Holocene sea levels and palaeoenvironments, Malay-Thai Peninsula, Southeast Asia. The Holocene 15, 1199-1213.
Hoscilo, A., Page, S.E., Tansey, K.J., Rieley, J.O., 2011. Effect of repeated fires on land-cover change on peatland in southern Central Kalimantan, Indonesia, from 1973 to 2005. International Journal of Wildland Fire 20, 578–588.
Houghton, R.A., Skole, D.L., Nobre, C.A., Hackler, J.L., Lawrence, K.T., Chomentowski, W.H., 2000. Annual fluxes of carbon from deforestation and regrowth in the Brazilian Amazon. Nature 403, 301–304.
Huang, T.C., 1972. Pollen flora of Taiwan. Ching-Hwa Press, Taipei, Taiwan. Jantz, N., Homeier, J., Behling, H., 2014. Representativeness of tree diversity in the modern pollen rain of Andean
montane forests. Journal of Vegetation Science 25, 481–490. Jauhiainen, J., Vasander, H., Rieley, J., Page, S. E., 2010. Tropical Peat Carbon Gas Interaction: Technical report 2.
Leicester, United Kingdom: University of Leicester, UK. Jones, S.E., Pearce, K.G., 2015. A pollen morphology study from the Kelabit Highlands of Sarawak, Malaysian
Borneo. Palynology 39, 150–204. Joosten, H., 2009. The Global Peatland CO2 Picture. Wetlands International (Eds.), pp. 33. Ju, J., Slingo, J., 1995. The Asian summer monsoon and ENSO. Quarterly Journal of the Royal Meteorological Society
121, 1133–1168. Juggins, S., 2007. C2 Version 1.5 User guide. Software for ecological and palaeoecological data analysis and
visualisation. Newcastle University, Newcastle upon Tyne, UK. Karamperidou, C., Di Nezio, P.N., Timmermann, A., Jin, F.-F., Cobb, K.M., 2015. The response of ENSO flavors to
mid-Holocene climate: Implications for proxy interpretation. Paleoceanography 30, 527–547. Kasper, T., Frenzel, P., Haberzettl, T., Schwarz, A., Daut, G., Meschner, S., Wang, J., Zhu, L., Mäusbacher, R., 2013.
Interplay between redox conditions and hydrological changes in sediments from Lake Nam Co (Tibetan Plateau) during the past 4000cal BP inferred from geochemical and micropaleontological analyses. Palaeogeography, Palaeoclimatology, Palaeoecology 392, 261–271.
Kasper, T., Haberzettl, T., Doberschütz, S., Daut, G., Wang, J., Zhu, L., Nowaczyk, N., Mäusbacher, R., 2012. Indian Ocean Summer Monsoon (IOSM)-dynamics within the past 4 ka recorded in the sediments of Lake Nam Co, central Tibetan Plateau (China). Quaternary Science Reviews 39, 73–85.
Kaudern, W., 1925. Migrations of the Toradja in Central Celebes (Ethnographical Studies in Celebes: Results of the Author's Expedition to Celebes 1917-1920. Goeteborg: Elanders Boktryckeri Aktiebolag II. Göteborg. Sweden.
Kaudern, W., 1938. Megalithic finds in Central Celebes. Ethnographical Studies in Celebes 5: Results of the author's expedition to Celebes 1917-1920. Elanders Boktryckeri Aktiebolag V, Göteborg. Sweden.
Kauffman, J. B., Cummings, D. L., Ward, D. E. & Babbitt, R., 1995. Fire in the Brazilian Amazon: biomass, nutrient pools, and losses in slashed primary forests. Oecologia 104, 397–409.
Keil, A., Zeller, M., Wida, A., Sanim, B., Birner, R., 2008. What determines farmers’ resilience towards ENSO-related drought? An empirical assessment in Central Sulawesi, Indonesia. Climatic Change 86, 291–307.
Kershaw, A.P., Penny, D., van der Kaars, S., Anshuri, G., Thamotherampillai, A., 2000. Palaeoecological evidence for vegetation and climate in lowland Southeast Asia at the last glacial maximum. In: Metcalfe, I., Smith, J.M.B., Morwood, M., Davidson, I., Hewison, K. (Eds.), Floral and Faunal Migrations and Evolution in Australia–Southeast Asia. Balkema.
Keßler, P.J., Bos, M.M., Sierra Daza, S.E.C., Kop, A., Willemse, L.P.M., Pitopang, R., Gradstein, S.R., 2002. Checklist of woody plants of Sulawesi, Indonesia. Blumea suppl 14.

163
Kirilova, E.P., van Hardenbroek, M., Heiri, O., Cremer, H., Lotter, A.F., 2010. 500 years of trophic-state history of a hypertrophic Dutch dike-breach lake. Journal of Paleolimnology 43, 829–842.
Kirleis, W., Muller, J., Kortemeier, C., Behling, H., Soegondho, S., 2012. Chapter 16: The megalithic landscape of central Sulawesi, Indonesia. Combining archaeological and palynological investigations. In: Bonatz, D., Reinecke, A., Tjoa-Bonatz, M.L., (Eds.), Crossing Borders in Southeast Asian Archaeology. Selected papers from the 13th International Conference of the European Association of Southeast Asian Archaeologists, Berlin, 2010. 2 vol., NUS Press, Singapore, pp. 199-220.
Kirleis, W., Pillar, V.D., Behling, H., 2011. Human–environment interactions in mountain rainforests: archaeobotanical evidence from central Sulawesi, Indonesia. Vegetation History and Archaeobotany 20 (3):165-179.
Kirschvink, J.L., 1980. The least-squares line and plane and the analysis of palaeomagnetic data. Geophysical Journal International 62, 699–718.
Kodela, P.G., 2006. Pollen morphology of some rainforest taxa occurring in the Illawarra region of New South Wales, Australia. Telopea Journal of Plant Systematics 11, 346–389.
Koehler, B., Corre, M.D., Veldkamp, E., Wullaert, H., Wright, S.J., 2009. Immediate and long-term nitrogen oxide emissions from tropical forest soils exposed to elevated nitrogen input. Global Change Biology 15, 2049–2066.
Konecky, B.L., Russell, J.M., Rodysill, J.R., Vuille, M., Bijaksana, S., Huang, Y., 2013. Intensification of southwestern Indonesian rainfall over the past millennium. Geophysical Research Letters 40, 386–391.
Korte, M., Constable, C., 2011. Improving geomagnetic field reconstructions for 0–3ka. Physics of the Earth and Planetary Interiors 188, 247–259.
Kostermans, A., 1958. Secondary growth on areas of former peat swamp forest, in: Proceedings of the Symposium on Humid Tropics Vegetation, Held in Tjiawi, Indonesia. pp. 155–169.
Krammer, K., Lange-Bertalot, H., 1986. Süswasserflora von Mitteleuropa: Bacillariophyceae. 1-4 Stuttgart, Gustav Fisher.
Krashevska, V., Bonkowski M., Maraun M., Scheu S., 2007. Testate amoebae (protista) of an elevational gradient in the tropical mountain rain forest of Ecuador. Pedobiologia 51, 319-331.
Kreisel, W., Weber, R., Faust, H., 2004. Historical Impacts on Use and Management of Natural Resources in the Rainforest Margins of Central Sulawesi. Book section in Land-use, Nature Conservation and the Stability of Rainforest Margins in Southeast Asia Environmental Science, 39-65.
Kuniyasu, M., 2002. Environments and People of Sumatran Peat Swamp Forests II: Distribution of Villages and Interactions between People and Forests. Southeast Asian Studies 40.
Kurnianto, S., Warren, M., Talbot, J., Kauffman, B., Murdiyarso, D., Frolking, S., 2015. Carbon accumulation of tropical peatlands over millennia: a modeling approach. Global Change Biology 21, 431–444.
Langton, S.J., Linsley, B.K., Robinson, R.S., Rosenthal, Y., Oppo, D.W., Eglinton, T.I., Howe, S.S., Djajadihardja, Y.S., Syamsudin, F., 2008. 3500 yr record of centennial-scale climate variability from the Western Pacific Warm Pool. Geology 36, 795–798.
Leemhuis, C., 2005. The Impact of El Niño Southern Oscillation Events on Water Resource Availability in Central Sulawesi, Indonesia. A hydrological modelling approach. PhD thesis, University of Göttingen, Germany.
Leemhuis, C., Gerold, G., 2006. The impact of the warm phase of ENSO (El Nino Southern Oscillation) events on water resource availability of tropical catchments in Central Sulawesi, Indonesia. Advances in Geosciences 6, 217-220.
Lehmusluoto, P., Machbub, B., Terangna, N., Rusmiputro, S., Achmad, F., Boer, L., Brahmana, S.S., Priadi, B., Setiadji, B., Sayuman, O., others, 1997. National inventory of the major lakes and reservoirs in Indonesia. Expedition Indodanau Technical Report, Oy publisher.
Lemmens, R.H.M.J., Soerianegara, I., Wong, W.C., 1995. Timber trees: minor commercial timbers (Prosea 5.2). Prosea — Plant Resources of South East Asia. Backhuys Publishers, The Netherlands, pp. 655.
Li, W., Dickinson, R.E., Fu, R., Niu, G.-Y., Yang, Z.-L., Canadell, J.G., 2007. Future precipitation changes and their implications for tropical peatlands. Geophysical Research Letters 34.
Li, X., Wei, G., Shao, L., Liu, Y., Liang, X., Jian, Z., Sun, M., Wang, P., 2003. Geochemical and Nd isotopic variations in sediments of the South China Sea: a response to Cenozoic tectonism in SE Asia. Earth and Planetary Science Letters 211, 207–220.
Lijklema, L., 1980. Interaction of orthophosphate with iron (III) and aluminum hydroxides. Environmental Science & Technology 14, 537–541.
Livingstone, D.A., 1955. A lightweight piston sampler for lake deposits. Ecology 36 (1), 137-139. López, P., Navarro, E., Marce, R., Ordoñez, J., Caputo, L., Armengol, J., 2006. Elemental ratios in sediments as
indicators of ecological processes in Spanish reservoirs. Limnetica 25, 499–512.

164
Lückge, A., Doose-Rolinski, H., Khan, A.A., Schulz, H., Von Rad, U., 2001. Monsoonal variability in the northeastern Arabian Sea during the past 5000years: geochemical evidence from laminated sediments. Palaeogeography, Palaeoclimatology, Palaeoecology 167, 273–286.
Lusk, C.H., 1999. Long-lived Light-demanding Emergents in Southern Temperate Forests: The Case of Weinmannia trichosperma (Cunoniaceae) in Chile. Plant Ecology 140 (1), 111-115.
Mackereth, F.J.H., 1966. Some chemical observations on post-glacial lake sediments. Philosophical Transactions of the Royal Society B: Biological Sciences 250, 165–213.
Maher L.J.J., 1981. Statistics for microfossil concentration measurements employing samples spiked with marker grains. Review of Palaeobotany and Palynology 32, 153–191.
Malhi, Y., Grace, J., 2000. Tropical forests and atmospheric carbon dioxide. TREE 15, 332-337. Manos, P.S., Cannon, C.H., Oh, S.H., 2008. Phylogenetic relationships and taxonomic status of the paleoendemic
Fagaceae of western North America: recognition of a new genus, Notholithocarpus. Madrono 55, 181–190. Manos, P.S., Stanford, A.M., 2001. The historical biogeography of Fagaceae: tracking the tertiary history of
temperate and subtropical forests of the Northern Hemisphere. International Journal of Plant Sciences 162, S77–S93.
Markussen, M., 2000. Zusammenfassender Endbericht des Aufenthaltes in Palu/Indonesien vom 20. Mai bis 10. August 2000 mit den Ergebnissen der bodenkundlichen Untersuchungen. Report, University of Göttingen, Germany.
Matthias, I., Semmler,M.S.S., Giesecke, T., 2015. Pollen diversity captures landscape structure and diversity. Journal of Ecology 103, 880–890.
Mayr, C., Fey, M., Haberzettl, T., Janssen, S., Lücke, A., Maidana, N.I., Ohlendorf, C., Schäbitz, F., Schleser, G.H., Struck, U., others, 2005. Palaeoenvironmental changes in southern Patagonia during the last millennium recorded in lake sediments from Laguna Azul (Argentina). Palaeogeography, Palaeoclimatology, Palaeoecology 228, 203–227.
Mazaud, A., 2005. User-friendly software for vector analysis of the magnetization of long sediment cores. Geochem. Geophys. Geosyst. 6 (12), 1525-2027.
Mazei, Y., Tsyganov, A., 2006. Freshwater Testate Amoebae. KMK Moscow (in Russian). McBride, J.L., Frank, W.M., 1999. Relationships between Stability and Monsoon Convection. J. Atmos. Sci. 56, 24–
36. McDowell, N., Pockman, W.T., Allen, C.D., Breshears, D.D., Cobb, N., Kolb, T., Plaut, J., Sperry, J., West, A., Williams,
D.G., others, 2008. Mechanisms of plant survival and mortality during drought: why do some plants survive while others succumb to drought? New phytologist 178, 719–739.
McGrath, D. A., Smith, C. K., Gholz, H. L. & de Assis Oliveira, F., 2001. Effects of land-use change on soil nutrient dynamics in Amazonia. Ecosystems 4, 625–645.
McLaren, P., Bowles, D., 1985. The effects of sediment transport on grain-size distributions. Journal of Sedimentary Research 55.
Merryfield, W.J., 2006. Changes to ENSO under CO2 doubling in a multi-model ensemble. Journal of Climate 19, 4009-4027.
Meyers, P.A., 1994. Preservation of elemental and isotopic source identification of sedimentary organic matter. Chemical Geology 114, 289–302.
Middelburg, J.J., van der Weijden, C.H., Woittiez, J.R., 1988. Chemical processes affecting the mobility of major, minor and trace elements during weathering of granitic rocks. Chemical Geology 68, 253–273.
Miettinen, J., Hooijer, A., Tollenaar, D., Page, S., Malins, C., Vernimmen, R., Shi, C., Liew, S.C., 2012. Historical analysis and projection of oil palm plantation expansion on peatland in Southeast Asia. International Council on Clean Transportation 22.
Miettinen, J., Liew, S.C., 2010. Degradation and development of peatlands in Peninsular Malaysia and in the islands of Sumatra and Borneo since 1990. Land degradation & development 21, 285–296.
Miettinen, J., Shi, C., Liew, S.C., 2011. Deforestation rates in insular Southeast Asia between 2000 and 2010. Global Change Biology 17, 2261–2270.
Mitchell, E., Charman, D., Warner, B., 2008. Testate amoebae analysis in ecological and paleoecological studies of wetlands: past, present and future. Biodiversity and Conservation 17, 2115-2137.
Mittermeier R.A., Myers, N., Mittermeier, C.G. & Gil, P.R., 1999. Hotspots: earth’s biologically richest and most endangered terrestrial ecoregions. CEMEX CI.
Moore, P.D., Bellamy, D.J., 1974. Peatlands. Elek science London, UK. Moore, T.A., Hilbert, R.E., 1992. Petrographic and anatomical characteristics of plant material from two peat
deposits of Holocene and Miocene age, Kalimantan, Indonesia. Review of palaeobotany and palynology 72, 199–227.

165
Morey, S.L., Shriver, J.F., O’Brien, J.J., 1999. The effects of Halmahera on the Indonesian throughflow. Journal of Geophysical Research: Oceans (1978–2012) 104, 23281–23296.
Moritz, M.A., Morais, M.E., Summerell, L.A., Carlson, J.M., Doyle, J., 2005. Wildfires, complexity, and highly optimized tolerance. Proceedings of the National Academy of Sciences of the United States of America 102, 17912–17917.
Morley, R.J., 1981. Development and vegetation dynamics of a lowland ombrogenous peat swamp in Kalimantan Tengah, Indonesia. Journal of Biogeography 8, 383-404.
Morley, R.J., 1982. Origin and history of Tasek Bera. In: Furtado, J.I., Mori, S. (Eds.), Tasik Bera: The Ecology of a Freshwater SwampMonographiae Biologicae. Dr.W. Junk Publishers, The Hague, NL, pp. 12–45.
Morley, R.J., 2000. Origin and evolution of tropical rain forests. John Wiley & Sons publisher, US. Morley, R.J., 2013. Cenozoic ecological history of South East Asian peat mires based on the comparison of coals
with present day and Late Quaternary peats. Journal of Limnology 72. Morley, R.J., Swiecicki, T., Thuy Thi Pham, D., Morley, R.J., Swiecicki, T., Thuy Thi Pham, D., 2011. A sequence
stratigraphic framework for the Sunda region, based on integration of biostratigraphic, lithological and seismic data from Nam Con Son basin, Vietnam. Proceedings of the 35th Annual Convention Indonesian Petroleum Association 1, pp. 1175–1196.
Moss, S.J., Wilson, M.E., 1998. Biogeographic implications of the Tertiary palaeogeographic evolution of Sulawesi and Borneo. Biogeography and geological evolution of SE Asia, 133–163.
Moy, C.M., Seltzer, G.O., Rodbell, D.T., Anderson, D.M., 2002. Variability of El Niño/Southern Oscillation activity at millennial timescales during the Holocene epoch. Nature 420, 162-165.
Muller, J., 1963. Palynological study of Holocene peat in Sarawak. Symp. Ecol. Res. In Humid Tropics Vegetation, Kuching, Malaysia, pp. 147–156.
Muller, J., Oberhänsli, H., Melles, M., Schwab, M., Rachold, V., Hubberten, H.-W., 2001. Late Pliocene sedimentation in Lake Baikal: implications for climatic and tectonic change in SE Siberia. Palaeogeography, Palaeoclimatology, Palaeoecology 174, 305–326.
Murdiyarso, D., Hergoualc’h, K.,Verchot, L.V., 2010. Opportunities for reducing greenhouse gas emissions in tropical peatlands, PNAS 107, 19655-19660.
Myers, N., Mittermeier, R.A., Mittermeier, C.G., da Fonseca, G.A.B. & Kent, J., 2000. Biodiversity hotspots for conservation priorities. Nature 403, 853–858.
Nadelhoffer, K.J., Fry, B., 1994. Nitrogen isotope studies in forest ecosystems. Stable isotopes in ecology and environmental science. Blackwell publisher, Oxford, UK.
Nesbitt, H.W., Markovics, G., Price, R.C., 1980. Chemical processes affecting alkalis and alkaline earths during continental weathering. Geochimica et Cosmochimica Acta 44(11), 1659–1666.
Neuzil, S.G., 1997. Onset and rate of peat and carbon accumulation in four domed ombrogenous peat deposits, Indonesia. In: Rieley, J.O., Page, S.E. (Eds.), Biodiversity and Sustainability of Tropical Peatlands. Samara Publishing, pp. 55–72.
Newton, A., Thunell, R., Stott, L., 2006. Climate and hydrographic variability in the Indo-Pacific Warm Pool during the last millennium. Geophysical Research Letters 33.
Nichols, G., 2009. Sedimentology and stratigraphy. John Wiley & Sons publisher, US. Niedermeyer, E.M., Sessions, A.L., Feakins, S.J., Mohtadi, M., 2014. Hydroclimate of the western Indo-Pacific Warm
Pool during the past 24,000 years. PNAS 111, 9402–9406. Notohadiprawiro, T., 1981. Peat Deposition, an Idle Stage in the Natural Cycling of Nitrogen, and Its Possible
Activation for Agriculture. In: Wetselaar, R., Simpson, J.R., Rosswall, T. (Eds.), Nitrogen Cycling in South-East Asian Wet Monsoonal Ecosystems. The Australian Academy of Science, Canberra, 139-147.
O’Connell, J.F., Allen, J., Hawkes, K., 2010. Pleistocene Sahul and the origins of seafaring. The global origins and development of seafaring, 57–68.
Odgaard, B.V., 2007. Biodiversity of past plant cover. In: Elias, S.A., (Eds.), Encyclopedia of Quaternary Science. Elsevier, 2511-2514.
Ólafsdóttir, S. edís, Geirsdóttir, Á., Miller, G.H., Stoner, J.S., Channell, J.E., 2013. Synchronizing Holocene lacustrine and marine sediment records using paleomagnetic secular variation. Geology 41, 535–538.
Oppo, D.W., Rosenthal, Y., Linsley, B.K., 2009. 2,000-year-long temperature and hydrology reconstructions from the Indo-Pacific warm pool. Nature 460, 1113–1116.
Page, S., Hoscito, A., Wösten, H., Jauhiainen, J., Silvius, M., Rieley, J., Vasander, H., 2009. Ecological Restoration of Tropical Peatlands - Current Knowledge and Future Research Directions. Ecosystems 12, 888-905.
Page, S., Wüst, R., Banks, C., 2010. Past and present carbon accumulation and loss in Southeast Asian peatlands. PAGES News 18, 25–26.

166
Page, S.E., Morrison, R., Malins, C., Hooijer, A., Rieley, J.O., Jauhiainen, J., 2011. Review of peat surface greenhouse gas emissions from oil palm plantations in Southeast Asia. In: The International Council on Clean Transportation (ICCT), White Paper 15.
Page, S.E., Rieley, J.O., Shotyk, Ø., Weiss, D., 1999. Interdependence of peat and vegetation in a tropical peat swamp forest. Philosophical Transactions of the Royal Society of London. Series B: Biological Sciences 354, 1885–1897.
Page, S.E., Rieley, J.O., Wüst, R., 2006. Lowland tropical peatlands of Southeast Asia. In: Martini, I.P.,Martínez Cortizas, A., Chesworth,W. (Eds.), Peatlands: Evolution and Records of Environmental and Climate Changes. Elsevier, pp. 145–172.
Page, S.E., Siegert, F., Rieley, J.O., Boehm, H.-D.V., Jaya, A., Limin, S., 2002. The amount of carbon released from peat and forest fires in Indonesia during 1997. Nature 420, 61–65.
Page, S.E., Wüst, R.A.J., Weiss, D., Rieley, J.O., Shotyk, W., Limin, S.H., 2004. A record of Late Pleistocene and Holocene carbon accumulation and climate change from an equatorial peat bog (Kalimantan, Indonesia): implications for past, present and future carbon dynamics. Journal of Quaternary Science 19, 625-635.
Partin, J.W., Cobb, K.M., Adkins, J.F., Clark, B., Fernandez, D.P., 2007. Millennial-scale trends in west Pacific warm pool hydrology since the Last Glacial Maximum. Nature 449, 452-455.
Patterson, W.A. III, Edwards, K.J., MacGuire, D.J., 1987. Microscopic charcoal as a fossil indicator of fire. Quaternary Science Reviews 6, 3–23.
Payne, R.J., Mitchell, E.A., 2009. How many is enough? Determining optimal count totals for ecological and palaeoecological studies of testate amoebae. Journal of Paleolimnology 42, 483-495.
Philander, S.G.H., 1990. El Niño, La Niña, and the Southern Oscillation. In: International Geophysics Series, R. Dmowska, R., Holton, J.R., (Eds.). Academic Press, New York, pp. 289.
Phillips, S., Bustin, R.M., 1998. Accumulation of organic rich sediments in a dendritic fluvial/lacustrine mire system at Tasik Bera, Malaysia: implications for coal formation. International Journal of Coal Geology 36, 31–61.
Pisaric, M.F., 2002. Long-distance transport of terrestrial plant material by convection resulting from forest fires. Journal of Paleolimnology 28, 349–354.
Pitkänen, A., Huttunen, P., 1999. A 1300-year forest-fire history at a site in eastern Finland based on charcoal and pollen records in laminated lake sediment. The Holocene 9, 311–320.
Powell, J.M., 1970. Highland Papua New Guinea Pollen Flora II. In: Powell, J.M., (Eds.), The impact of man on the vegetation of the Mt. Hagen region, New Guinea. Dissertation, Australian National University Canberra (extract at http://www.palaeoworks.anu.edu.au/databases.html).
Premathilake, R., Nilsson, S., 2001. Pollen morphology of endemic species of the Horton Plains National Park, Sri Lanka. Grana 40, 256–279.
Priadi, B., Polvé, M., Maury, R.C., Bellon, H., Soeria-Atmadja, R., Joron, J.L., Cotten, J., 1994. Tertiary and Quaternary magmatism in Central Sulawesi: chronological and petrological constraints. Journal of Southeast Asian Earth Sciences 9, 81–93.
Purbopuspito, J., Veldkamp, E., Brumme, R., Murdiyarso, D., 2006. Trace gas fluxes and nitrogen cycling along an elevation sequence of tropical montane forests in Central Sulawesi, Indonesia. Global Biogeochemical Cycles 20.
Quinn, N.P., 2003. Testate Amoebae (Protozoa: Rhizopoda) Assemblages as Environmental Indicators of Water Tables and Soil Moisture in a Kettle-hole Peatland in Southern Ontario (M.Sc. Thesis). University of Waterloo, Canada.
Quinn, W.H., Zopf, D.O., Short, K.S., Kuo Yang, R.T.W., 1978. Historical trends and statistics of the Southern Oscillation, El Niño and Indonesian droughts. Fish. Bull 76, 663–678.
R Core Team, 2012. R: A language and environment for statistical computing. R Foundation for Statistical Computing, Vienna, Austria. ISBN 3-900051-07-0, http://www.R-project.org
Rein, B., Lückge, A., Reinhardt, L., Sirocko, F., Wolf, A., Dullo, W.-C., 2005. El Niño variability off Peru during the last 20,000 years. Paleoceanography 20.
Renberg, I., 1991. The HON-Kajak sediment corer. Journal of Paleolimnology 6, 167–170. Rhodes, A.N., 1998. A method for the preparation and quantification of microscopic charcoal from terrestrial and
lacustrine sediment cores. The Holocene 8, 113–117. Rieley, J.O., 1992. The ecology of tropical peat swamp forest: a Southeast Asian perspective, in: Proceedings of a
Workshop on Integrated Planning and Management of Tropical Lowland Peatlands. Cisarua, Indonesia, 3–8. Rieley, J.O., Ahmad-Shah, A.A., 1996. The vegetation of tropical peat swamp forests. In: Maltgy, E., Immirzi, C.P.,
Safford, R.J., (Eds.), Tropical Lowland Peatlands of Southeast Asia. Proceedings of a Workshop on Integrated Planning and Management of Tropical Lowland Peatlands. IUCN Wetlands Programme/IUCN, The World Conservation Union, Gland, Switzerland, 55-73.
Rieley, J.O., Page, S.E., 1997. Biodiversity and Sustainability of Tropical Peatlands. Samara Publ., Cardigan, pp. 369.
167
Rieley, J.O., Page, S.E., Setiadi, B., 1996. Distribution of peatlands in Indonesia. Global Peat Resources. International Peat Society, Jyväskylä, Finnland 196–178.
Rodysill, J.R., Russell, J.M., Bijaksana, S., Brown, E.T., Eggermont, H., 2012. A paleolimnological record of rainfall and drought from East Java, Indonesia during the last 1,400 years. Journal of Paleolimnology 47, 125–139.
Rodysill, J.R., Russell, J.M., Crausbay, S.D., Bijaksana, S., Vuille, M., Edwards, R.L., Cheng, H., 2013. A severe drought during the last millennium in East Java, Indonesia. Quaternary Science Reviews 80, 102–111.
Roos, M.C., 1993. State of affairs regarding Flora Malesiana: progress in revision work and publication schedule. Flora Malesiana Bulletin 11, 133–142.
Roos, M.C., Keßler, P.J., Robbert Gradstein, S., Baas, P., 2004. Species diversity and endemism of five major Malesian islands: diversity–area relationships. Journal of Biogeography 31, 1893–1908.
Rowell, A., Moore, P.F., 2000. Global review of forest fires. Forests for Life Programme Unit, WWF International. Rull, V., 2010. Ecology and palaeoecology: two approaches, one objective. Open Ecology Journal 3, 1–5. Ruppert, L.F., Neuzil, S.G., Cecil, C.B., Kane, J.S., 1993. Inorganic constituents from samples of a domed and
lacustrine peat, Sumatra, Indonesia. Geological Society of America Special Papers. Geological Society of America, pp. 83–96.
Sabiham, S., 1988. Studies on peat in the coastal plains of Sumatra and Borneo: part I: physiography and
geomorphology of the coastal plains.東南アジア研究26, 308–335. Sabiham, S., 1990. Studies on peat in the coastal pains of Sumatra and Borneo: part IV: a study of the floral
composition of peat in coastal plain of Brunei, Borneo. 東南アジア 研究27, 461–484. Sabiham, S., Furukawa, H., 1986. A study of floral composition of peat soil in the Lower Batang Hari River Basin of
Jambi, Sumatra. Special issue: problem soils in Southeast Asia. 東南アジア研究24, 113–132. Sachs, J.P., Sachse, D., Smittenberg, R.H., Zhang, Z., Battisti, D.S., Golubic, S., 2009. Southward movement of the
Pacific intertropical convergence zone AD 1400–1850. Nature Geoscience 2, 519–525. Sadori, L., Giardini, M., 2007. Charcoal analysis, a method to study vegetation and climate of the Holocene: The
case of Lago di Pergusa (Sicily, Italy). Geobios 40, 173–180. Saji, N.H., Goswami, B.N., Vinayachandran, P.N., Yamagata, T., 1999. A dipole mode in the tropical Indian Ocean.
Nature 401, 360–363. Salafsky, N., 1994. Drought in the rain forest: effects of the 1991 El Niño-Southern Oscillation event on a rural
economy in West Kalimantan, Indonesia. Climatic Change 27, 373–396. Salomons, W., Förstner, U., 1984. Metals in the Hydrocycle. Springer-Verlag. Sarasin, P., Sarasin, F., 1905. Reisen in Celebes: ausgefuhrt in den Jahren 1893-1896 und 1902-1903. CW Kreidel
publisher (open library). Sastry, N., 2002. Forest fires, air pollution, and mortality in Southeast Asia. Demography 39, 1–23. Sathiamurthy, E., Voris, H.K., 2006. Maps of Holocene sea level transgression and submerged lakes on the Sunda
Shelf. The Natural History Journal of Chulalongkorn University, Supplement 2, 1–43. Schippers, P., Sterck, F., Vlam, M., Zuidema, P.A., 2015. Tree growth variation in the tropical forest: understanding
effects of temperature, rainfall and CO2. Global Change Biololy. Published online. doi:10.1111/gcb.12877. Schrier-Uijl, A.P., Silvius, M., Parish, F., Lim, K.H., Rosediana, S., Anshari, G., 2013. Environmental and social impacts
of oil palm cultivation on tropical peat. Reports from the Technical Panels of the 2nd Greenhouse Gas Working Group of the Roundtable on Sustainable Palm Oil (RSPO) 131–168.
Schuldt, B., Leuschner, C., Horna, V., Moser, G., Köhler, M., van Straaten, O., Barus, H., 2011. Change in hydraulic properties and leaf traits in a tall rainforest tree species subjected to long-term throughfall exclusion in the perhumid tropics. Biogeosciences 8, 2179–2194.
Schüler, L., 2012. Studies on late Quaternary environmental dynamics (vegetation, biodiversity, climate, soils, fire and human impact) on Mt Kilimanjaro. PhD thesis, University of Göttingen, Germany.
Scott Anderson, R., Homola, R.L., Davis, R.B., Jacobson, G.L. Jr., 1984. Fossil remains of the mycorrhizal fungal Glomus fasciculatum complex in postglacial lake sediments from Maine Canadian. Can J Bot 62, 325–2328.
Sheffield, J., Wood, E.F., 2008. Projected changes in drought occurrence under future global warming from multi-model, multi-scenario, IPCC AR4 simulations. Climate Dynamics 31, 79-105.
Shibata, S., Kawano, E., Nakabayashi, T., 1997. Research center for radioisotopes at University of Osaka Prefecture radiocarbon dates I. Radiocarbon 39, 79-87.
Shotyk, W., Weiss, D., Kramers, J.D., Frei, R., Cheburkin, A.K., Gloor, M., Reese, S., 2001. Geochemistry of the peat bog at Etang de la Gruère, Jura Mountains, Switzerland, and its record of atmospheric Pb and lithogenic trace metals (Sc, Ti, Y, Zr, and REE) since 12,370 14 C yr BP. Geochimica et Cosmochimica Acta 65, 2337–2360.
Sieffermann, G., Fournier, M., Triutomo, S., Sadelman, M.T., Semah, A.M., 1988. Velocity of tropical forest peat accumulation in Central Kalimantan province, Indonesia (Borneo). In: Proceedings VIII International Peat Congress, Leningrad 88, Section I. International Peat Society, Leningrad, 90-98.

168
Sieffermann, G., Rieley, J.O., Fournier, M., 1992. The low-land peat swamps of Central Kalimantan (Borneo): a complex and vulnerable ecosystem, Proceedings of the International Conference of Geography in the Asian Region, Yogyakarta, Indonesia, pp. 1–22.
Sieffermann, R.G., Fournier, M., Rieley, J.O., Page, S.E., 1996. Évidence de deux phases de formations dans les “mega” tourbières dérivées de forêts pluviales de Bornéo. Dynamique à Long Terme des Écosystèmes Forestiers Intertropicaux. Paris, France 20-21-22 Mars 1996. Symposium – Résumés. CNRS, ORSTOM, Paris, pp. 253–256.
Siegel, A.F., 1986. Rarefaction curves. In: Kotz, S., Johnson, N.L. (Eds.), Encyclopedia of Statistical Science. 7. Wiley and Sons, New York, 623-626.
Siegert, F., Hoffmann, A.A., 2000. The 1998 forest fires in East Kalimantan (Indonesia): A quantitative evaluation using high resolution, multitemporal ERS-2 SAR images and NOAA-AVHRR hotspot data. Remote Sensing of Environment 72, 64–77.
Sigg, L., Stumm, W., 1991. Aquatische Chemie: eine Einführung in die Chemie wässriger Lösungen und in die Chemie natürlicher Gewässer. Verlag der Fachvereine.
Silvius, M.J., Simons, H.W., Verheugt, W.J.M., 1984. Soils, Vegetation, Fauna and Nature Conservation of the Berbak Game Reserve, Sumatra, Indonesia. RIN Contributions to Research on Management of Natural Resources 1984e3. Research Institute for Nature Management, Arnhem, pp. 146.
Simandjuntak, T.O., Rusmana, E., Surono, et al., 1991. Geologic map and report of the Poso quadrangle, South Sulawesi. Scale 1:250,000. Bandung: Geological Research and Development Centre.
Skutsch, M., Bird, N., Trines, E., Dutschke, M., Frumhoff, P., de Jong, B.H.J., van Laake, P., Masera, O., Murdiyarso, D., 2007. Clearing the way for reducing emissions from tropical deforestation. Environmental Science & Policy, Options for including agriculture and forestry activities in a post-2012 international climate agreement 10, 322–334.
Sodhi, N.S., Koh, L.P., Brook, B.W., Ng, P.K.L., 2004. Southeast Asian biodiversity: an impending disaster. Trends in Ecology & Evolution 19, 654–660.
Soepadmo, E., 1971. Fagaceae. Flora Malesiana Series I (7), pp. 265. Soman, M.K., Slingo, J., 1997. Sensitivity of the asian summer monsoon to aspects of sea-surface-temperature
anomalies in the tropical pacific ocean. Quarterly Journal of the Royal Meteorological Society 123, 309–336. Sotta, E.D., Corre, M.D., Veldkamp, E., 2008. Differing N status and N retention processes of soils under old-growth
lowland forest in Eastern Amazonia, Caxiuanã, Brazil. Soil Biology and Biochemistry 40, 740–750. Staub, J.R., Esterle, J.S., 1993. Provenance and sediment dispersal in the Rajang River delta/coastal plain system,
Sarawak, East Malaysia. Sedimentary geology 85, 191-201. Staub, J.R., Esterle, J.S., 1994. Peat-accumulating depositional systems of Sarawak, east Malaysia. Sediment. Geol.
89, 91–106. Staub, J.R., Gastaldo, R.A., 2003. Late Quaternary incised-valley fill and deltaic sediments in the Rajang river Delta.
In: Sidi, H.F., Nummedal, D., Imbert, P., Darman, H., Posamentier, H.W. (Eds.), Tropical Deltas of Southeast Asia - Sedimentology, Stratigraphy, and Petroleum Geology, Special Publication No. 76. SEPM, Tulsa, 71-87.
Steinke, S., Kienast, M., Hanebuth, T., 2003. On the significance of sea-level variations and shelf paleo-morphology in governing sedimentation in the southern South China Sea during the last deglaciation. Marine Geology 201, 179-206.
Stevenson, J., Haberle S., 2005. Macro Charcoal Analysis: A modified technique used by the Department of Archaeology and Natural History, Palaeoworks technical papers. Department of Archaeology & Natural History, Research School of Pacific & Asian Studies, Coombs Building, Australian National University, ACT 0200, Australia.
Stevenson, J., 2000. New Caledonia Pollen Flora In: Stevenson, J., (Eds.), Late Quaternary environmental change and the impact of Melanesian colonization in New Caledonia. Dissertation, University of New South Wales, Kensington (extract at http://www.palaeoworksanueduau/databaseshtml).
Stocker, T. (Eds.), 2014. Climate change 2013: the physical science basis: Working Group I contribution to the Fifth assessment report of the Intergovernmental Panel on Climate Change. Cambridge University Press, New York, US.
Stoner, J.S., St-Onge, G., 2007. Chapter Three: Magnetic Stratigraphy in Paleoceanography: Reversals, Excursions, Paleointensity, and Secular Variation. Developments in Marine Geology, Elsevier 1, 99-138.
St-Onge, G., Stoner, J.S., 2011. Paleomagnetism near the North Magnetic Pole: A unique vantage point for understanding the dynamics of the geomagnetic field and its secular variations. Oceanography-Oceanography Society 24, 42-50.
Sudomo, M., Patrick Carney, W., Kurniawan, L., 1990. 20 years of progress in schistosomiasis research. Bul Penelit Keschat 18 (3-4), 18-23.
Sukendar, H., 1976. Obyek kepurbakalaan di Palu Sulawesi Tengah. Kalpataru 3:61-104.
169
Sukendar, H., 1980a. Mencari peninggalan nenek moyang, pendukung tradisi megatitik di Tanah Bada (Sulteng). Kalpataru 5:1-63.
Sukendar, H., 1980b. Tinjauan tentang peninggalan tradisi megalitik di daerah Sulawesi Tengah Pertemuan Ilmiah. Arkeologi 1977.
Sumawinata, B., 1998. Sediments of the lower Barito Basin in South Kalimantan: fossil pollen composition. 東南ア
ジア研究36 (3), 293–316.
Supardi, Subekty, A.D., Neuzil, S.G., 1993. General geology and peat resources of the Siak Kanan and Bengkalis island peat deposits, Sumatra, Indonesia. In: Cobb, J.C., Cecil, C.B., (Eds.), Modern and Ancient Coal-Forming Environments. Geological Society of America Special Paper 286, Boulder, 45-62.
Suzuki, K., Ishii, k., Sakurai, S., Sasaki S., 2006. Plantation Technology in Tropical Forest Science. Springer Science & Business Media, 301 pp.
Swain, A.M., 1973: A history of fire and vegetation in northeastern Minnesota as recorded in lake sediments. Quaternary Research 3, 383–96.
Swindles, G.T., Reczuga, M., Lamentowicz, M., Raby, C.L., Turner, T.E., Charman, D.J., Gallego-Sala, A., Valderrama, E., Williams, C., Draper, F., Honorio Coronado, E.N., Roucoux, K.H., Baker, T., Mullan, D.J., 2014. Ecology of Testate Amoebae in an Amazonian Peatland and Development of a Transfer Function for Palaeohydrological Reconstruction. Microbial Ecology 68, 284–298.
Tacconi, L., 2003. Fires in Indonesia. Causes, Costs and Policy Implications. CIFOR Occasional Paper 38, Bogor, Indonesia, pp. 24.
ter Braak, C.J.F., Smilauer, P., 2002. CANOCO Reference Manual and CanoDraw for Windows User’s Guide: Software for Canonical Community Ordination (version 4.5). Microcomputer Power, Ithaca, NY, USA.
The Nature Conservancy, Directorate General of Forest Protection and Nature Conservation, and Lore Lindu National Park Authority, 2001. Draft Management Plan 2002-2027: Lore Lindu National Park, Jakarta, Indonesia.
Tie, Y.L., Esterle, J.S., 1992. Formation of lowland peat domes in Sarawak, Malaysia. In: Aminuddin, B.Y., Tan, S.L., Aziz, B., Samy, J., Salmah, Z., Siti Petimah, H., Choo, S.T., (Eds.), Proceedings of the International Symposium on Tropical Peatland, 6-10 May 1991, Kuching, Sarawak, Malaysia. Malaysian Agricultural Research and Development Institute, Kuala Lumpur, 81-89.
Tierney, J.E., Oppo, D.W., Rosenthal, Y., Russell, J.M., Linsley, B.K., 2010. Coordinated hydrological regimes in the Indo-Pacific region during the past two millennia. Paleoceanography 25.
Tierney, J.E., Russell, J.M., 2007. Abrupt climate change in southeast tropical Africa influenced by Indian monsoon variability and ITCZ migration. Geophysical Research Letters 34 (15).
Tissot, C., Chikhi, H., Nayar, T.S., 1994. Pollen of wet evergreen forests of the Western Ghats, India. Publications du département d'écologie 35. Institut Français de Pondichéry.
Tjia, H.D., 1996. Sea-level changes in the tectonically stable Malay-Thai Peninsula. Quaternary International 31, 95–101.
Torrence, C., Compo, G.P., 1998. A Practical Guide to Wavelet Analysis. Bull. Amer. Meteor. Soc. 79, 61–78. Torrence, C., Webster, P.J., 1999. Interdecadal changes in the ENSO-monsoon system. Journal of Climate 12, 2679–
2690. Valentyn, F., 1724. Oud en Nieuwe Oost-Indiën, Vervattende een Naaukerige en uitvoerige Verhandelinge van
Nederlands Mogentheyd in die Gewesten, benevens eene wydlustige Beschryvinge der Moluccos, Ambonia, Banda, Timor, en Solor, Java, en alle de Eylanden onder de zelve Landbestieringen behoorende; het Comptoir op Suratte, en de Levens der Groote Mogols. Dordrecht, Amsterdam 5 vols, The Netherland.
van Balgooy, M.M.J., 1987. A plant geographical analysis of Sulawesi. Biogeographical evolution of the Malay Archipelago 4, 94-102.
van Cappellen, P., Wang, Y., 1996. Cycling of iron and manganese in surface sediments; a general theory for the coupled transport and reaction of carbon, oxygen, nitrogen, sulfur, iron, and manganese. American Journal of Science 296, 197–243.
van Dam, H., Mertens, A., Sinkeldam, J., 1994. A coded checklist and ecological indicator values of freshwater diatoms from the Netherlands. Netherland Journal of Aquatic Ecology 28, 117–133.
van der Sleen, P., Groenendijk, P., Vlam, M., Anten, N.P.R., Boom, A., Bongers, F., Pons, T.L., Terburg, G., Zuidema, P.A., 2015. No growth stimulation of tropical trees by 150 years of CO2 fertilization but water-use efficiency increased. Nature Geosci 8, 24–28.
van der Werf, G.R., Morton, D.C., DeFries, R.S., Olivier, J.G.J., Kasibhatla, P.S., Jackson, R.B., Collatz, G.J., Randerson, J.T., 2009. CO2 emissions from forest loss. Nature Geoscience 2, 737–738.
van der Werf, G.R., Randerson, J.T., Giglio, L., Gobron, N., Dolman, A.J., 2008. Climate controls on the variability of fires in the tropics and subtropics. Global Biogeochemical Cycles 22.
170
van Nieuwstadt, M.G., Sheil, D., 2005. Drought, fire and tree survival in a Borneo rain forest, East Kalimantan, Indonesia. Journal of Ecology 93, 191–201.
van Oldenborgh, G.J., Philip, S., Collins, M., 2005. El Nino in a changing climate: a multi-model study. Ocean Science 2, 267-298.
van Welzen, P.C., Parnell, J.A.N., Slik, J.W.F., 2011. Wallace’s Line and plant distributions: two or three phytogeographical areas and where to group Java? Biological Journal of the Linnean Society 103 (3), 531-545.
Vannière, B., Colombaroli, D., Chapron, E., Leroux, A., Tinner, W., Magny, M., 2008. Climate versus human-driven fire regimes in Mediterranean landscapes: the Holocene record of Lago dell’Accesa (Tuscany, Italy). Quaternary Science Reviews 27, 1181–1196.
Verwer, C., van der Meer, P., Nabuurs, G., 2008. Review of carbon flux estimates and other greenhouse gas emissions from oil palm cultivation on tropical peatlands - Identifying the gaps in knowledge. Wageningen, Alterrra, The Netherlands.
Villeneuve, M., Gunawan, W., Cornee, J.-J., Vidal, O., 2002. Geology of the central Sulawesi belt (eastern Indonesia): constraints for geodynamic models. International Journal of Earth Sciences 91, 524–537.
Von Post, L., 1916. Forest tree pollen in south Sweden peatbog strata sequences. Pollen et Spores 9, 375–401. Voris, H.K., 2000. Maps of Pleistocene sea levels in Southeast Asia: shorelines, river systems and time durations.
Journal of Biogeography 27, 1153–1167. Wahyunto, Ritung, S., Subagjo, H., 2003. Peta Luas Sebaran Lahan Gambut dan Kandungan Karbon di Pulau
Sumatera (Maps of Area of Peatland Distribution and Carbon Content in Sumatera, 1990–2002, First Edition). Edisi Pertama. Wetlands International / Indonesia Programme & Wildlife Habitat Canada (WHC), Edisi Pertama, Bogor, Indonesia.
Wahyunto, Ritung, S., Subagjo, H., 2004. Peta Sebaran Lahan Gambut, Luas dan Kandungan Karbon di Kalimantan / Map of Peatland Distribution Area and Carbon Content in Kalimantan, 2000-2002. Wetlands International – Indonesia Programme & Wildlife Habitat Canada (WHC). Edisi Pertama, Bogor, Indonesia.
Wallace, A.R., 1869. The Malay Archipelago: the land of the orang-utan and the bird of paradise; a narrative of travel, with studies of man and nature. Courier Corporation.
Wang, L.-C., Behling, H., Lee, T.-Q., Li, H.-C., Huh, C.-A., Shiau, L.-J., Chen, S.-H., Wu, J.-T., 2013. Increased precipitation during the Little Ice Age in northern Taiwan inferred from diatoms and geochemistry in a sediment core from a subalpine lake. Journal of Paleolimnology 49, 619–631.
Wang, L.-C., Lee, T.-Q., Chen, S.-H., Wu, J.-T., 2010. Diatoms in Liyu Lake, eastern Taiwan. Taiwania 55, 228–242. Wang, Y., Cheng, H., Edwards, R.L., He, Y., Kong, X., An, Z., Wu, J., Kelly, M.J., Dykoski, C.A., Li, X., 2005. The
Holocene Asian monsoon: links to solar changes and North Atlantic climate. Science 308, 854-857. Wardojo, W., Masripatin, N., 2002. Trends in Indonesian forest policy. Policy Trend Report, 77–87. Warner, B.G., Asada, T., Quinn, N.P., 2007. Seasonal influences on the ecology of testate amoebae (Protozoa) in a
small Sphagnum peatland in Southern Ontario, Canada. Microbial ecology 54, 91–100. Warrier, A.K., Shankar, R., 2009. Geochemical evidence for the use of magnetic susceptibility as a paleorainfall
proxy in the tropics. Chemical Geology 265, 553–562. Weber, R., 2006. Kulturlandschaftswandel in Zentralsulawesi: historisch-geographische Analyse einer
indonesischen Bergregenwaldregion. Universitätsverlag Göttingen. Weber, R., Kreisel, W., Faust, H., 2003. Colonial Interventions on the Cultural Landscape of Central Sulawesi by“
Ethical Policy”: The Impact of the Dutch Rule in Palu and Kulawi Valley, 1905–1942. Asian Journal of Social Science 31, 398–434.
Webster, P.J., Moore, A.M., Loschnigg, J.P., Leben, R.R., 1999. Coupled ocean–atmosphere dynamics in the Indian Ocean during 1997–98. Nature 401, 356–360.
Weiss, D., Shotyk, W., Rieley, J., Page, S., Gloor, M., Reese, S., Martinez-Cortizas, A., 2002. The geochemistry of major and selected trace elements in a forested peat bog, Kalimantan, SE Asia, and its implications for past atmospheric dust deposition. Geochimica et Cosmochimica Acta 66, 2307-2323.
West, G., Dumbleton, M.J., 1970. The mineralogy of tropical weathering illustrated by some west Malaysian soils. Quarterly Journal of Engineering Geology and Hydrogeology 3, 25–40.
Whiteman, A., Fraser, A., 1997. The Value of Forestry in Indonesia. Indonesia-UK Tropical Forest Management Programme Report No. SMAT/EC/97/1. DFID. Jakarta, Indonesia.
Whitlock, C., Dean, W., Rosenbaum, J., Stevens, L., Fritz, S., Bracht, B., Power, M., 2008. A 2650-year-long record of environmental change from northern Yellowstone National Park based on a comparison of multiple proxy data. Quaternary International 188, 126–138.
Whitlock, C., Larsen, C., Smol, J., Birks, H., Last, W., 2001. Charcoal as a fire proxy, in: Tracking Environmental Change Using Lake Sediments: Terrestrial, Algal, and Siliceous Indicators. Kluwer Academic Publisher, The Netherlands.

171
Whitlock, C., Millspaugh, S.H., 1996. Testing the assumptions of fire-history studies: an examination of modern charcoal accumulation in Yellowstone National Park, USA. The Holocene 6, 7–15.
Whitmore, T.C., 1984. A vegetation map of Malesia at scale 1: 5 million. Journal of Biogeography 461–471. Whittaker, R.H., 1977. Evolution of species diversity in land communities (Birds and vascular plants). Evol. Biol. 10,
1-67. Whitten, T., 2000. The ecology of Sumatra. Periplus Distributors, Tuttle Pub., (Singapore); North Clarendon, VT. Whitten, T., Mustafa, M., Henderson, G.S., 2002. Ecology of Sulawesi. Tuttle Publisher, Singapore. Wick, L., Möhl, A., 2006. The mid-Holocene extinction of silver fir (Abies alba) in the Southern Alps: a consequence
of forest fires? Palaeobotanical records and forest simulations. Vegetation History and Archaeobotany 15, 435–444.
Wilford, G.E., 1960. Radiocarbon age determinations of quaternary sediments in Brunei and northeast Sarawak. British Borneo Geological Survey. Annual Report 1959, 16-20.
Willis, K.J., Bailey, R.M., Bhagwat, S.A., Birks, H.J.B., 2010. Biodiversity baselines, thresholds and resilience: testing predictions and assumptions using palaeoecological data. Trends in Ecology & Evolution 25, 583–591.
Wilson, M.E., Moss, S.J., 1999. Cenozoic palaeogeographic evolution of Sulawesi and Borneo. Palaeogeography, Palaeoclimatology, Palaeoecology 145, 303–337.
Winston, R.B., 1994. Models of the geomorphology, hydrology, and development of domed peat bodies. Geological Society of America Bulletin 106, 1594–1604.
Wolf, K., Veldkamp, E., Homeier, J., Martinson, G.O., 2011. Nitrogen availability links forest productivity, soil nitrous oxide and nitric oxide fluxes of a tropical montane forest in southern Ecuador: N2O + NO flux of tropical montane forests. Global Biogeochemical Cycles 25.
Woodroffe, C.D., 2000. Deltaic and estuarine environments and their Late Quaternary dynamics on the Sunda and Sahul shelves. Journal of Asian Earth Sciences 18, 393–413.
Woodroffe, C.D., Beech, M.R., Gagan, M.K., 2003. Mid-late Holocene El Niño variability in the equatorial Pacific from coral microatolls. Geophysical Research Letters 30.
WorldClim, 2006. WorldClim version 14, Bioclim ESRI grids 30 arc-seconds (1 km) resolution. Available at: http://www.worldclimorg.
Wündsch, M., Biagioni, S., Behling, H., Reinwarth, B., Franz, S., Bierbaß, P., Daut, G., Mäusbacher, R., Haberzettl,
T., 2014. ENSO and monsoon variability during the past 1.5 kyr as reflected in sediments from Lake Kalimpaa, Central Sulawesi (Indonesia). The Holocene 24, 1743–1756.
Wüst, R., 2009. Quantification of Soil Carbon Loss during the 1997/8 and 2002 Peatland Fires in the Mega-Rice Project Area, Indonesia. Progress Report for AINGRA08072.
Wüst, R., Rieley, J., Page, S., van der Kaars, S., Wei-Ming, W., Jacobsen, G., Smith, A., 2007. Peatland evolution in Southeast Asia during the last 35,000 cal years: implications for evaluating their carbon storage potential, in: Proceedings of the International Symposium and Workshop on Tropical Peatland (27–29 August, Yogyakarta), 25–40.
Wüst, R.A., Bustin, R.M., 2004. Late Pleistocene and Holocene development of the interior peat-accumulating basin of tropical Tasek Bera, Peninsular Malaysia. Palaeogeography, Palaeoclimatology, Palaeoecology 211, 241–270.
Wüst, R.A., Jacobsen, G.E., van der Gaast, H., Smith, A.M., 2008. Comparison of radiocarbon ages from different organic fractions in tropical peat cores: insights from Kalimantan, Indonesia. Radiocarbon 50, 359-372.
Wüst, R.A., Ward, C.R., Bustin, R.M., Hawke, M.I., 2002. Characterization and quantification of inorganic constituents of tropical peats and organic-rich deposits from Tasek Bera (Peninsular Malaysia): implications for coals. International journal of coal geology 49, 215–249.
Wüst, R.A.., Bustin, R.M., Lavkulich, L.M., 2003. New classification systems for tropical organic-rich deposits based on studies of the Tasek Bera Basin, Malaysia. Catena 53, 133-163.
WWF Indonesia 2010: Sumatra’s Forests, their Wildlife and the Climate. Windows in Time: 1985, 1990, 2000 and 2009.
Wyatt-Smith, J., 1959. Peat swamp forests in Malaya. Malayan For. 22, 5-32. Yan, H., Sun, L., Oppo, D.W., Wang, Y., Liu, Z., Xie, Z., Liu, X., Cheng, W., 2011. South China Sea hydrological changes
and Pacific Walker Circulation variations over the last millennium. Nature communications 2, 293. Yan, X.H., Ho, C.R., Zheng, Q., Klemas, V., 1992. Temperature and Size Variabilities of the Western Pacific Warm
Pool. Science 258, 1643–1645. Yang, X., Heller, F., Yang, J., Su, Z., 2009. Paleosecular variations since∼ 9000 yr BP as recorded by sediments from
maar lake Shuangchiling, Hainan, South China. Earth and Planetary Science Letters 288, 1–9. Yu, Z.C., Beilman, D.W., Jones, M.C., 2009. Sensitivity of Northern Peatlands to Holocene Climate Change. In: Baird,
A., Belyea, L., Comas, X., Reeve, A., Slater, L., (Eds.), Carbon Cycling in Northern Peatlands, Geophysical Monograph Series, volume 184. American Geophysical Union, Washington, 55-69.
172
Yule, C.M., 2010. Loss of biodiversity and ecosystem functioning in Indo-Malayan peat swamp forests. Biodiversity and Conservation 19, 393–409.
Yulianto, E., Hirakawa, K., 2006. Vegetation and environmental change in the early-Middle holocene at a tropical peat swamp forest, Central Kalimantan, Indonesia. Tropics 15, 65–73.
Yulianto, E., Hirakawa, K., Tsuji, H., 2004. Charcoal and organic geochemical properties as an evidence of Holocene fires in tropical peatland, Central Kalimantan, Indonesia. Tropics 14, 55-63.
Zabel, M., Schneider, R.R., Wagner, T., Adegbie, A.T., de Vries, U., Kolonic, S., 2001. Late Quaternary climate changes in central Africa as inferred from terrigenous input to the Niger Fan. Quaternary Research 56, 207–217.
Zaccone, C., Casiello, G., Longobardi, F., Bragazza, L., Sacco, A., Miano, T.M., 2011. Evaluating the “conservative”behavior of stable isotopic ratios (δ13C, δ15N, and δ18O) in humic acids and their reliability as paleoenvironmental proxies along a peat sequence. Chemical Geology 285, 124–132.
Zach, A., Schuldt, B., Horna, V., Tjitrosemito, S., Leuschner, C., 2010. The hydraulic performance of tropical rainforest trees in their perhumid environment-is there evidence for drought vulnerability? in: Tropical Rainforests and Agroforests under Global Change. Springer, 391–410.
Zhang, P., Cheng, H., Edwards, R.L., Chen, F., Wang, Y., Yang, X., Liu, J., Tan, M., Wang, X., Liu, J., An, C., Dai, Z., Zhou, J., Zhang, D., Jia, J., Jin, L., Johnson, K.R., 2008. A test of climate, sun, and culture relationships from an 1810-yr Chinese cave record. Science 322, 940-942.

173
Appendix A
Identified pollen, spores and non-pollen palynomorphs (NPP) of the
records – complete list and photos of selected taxa
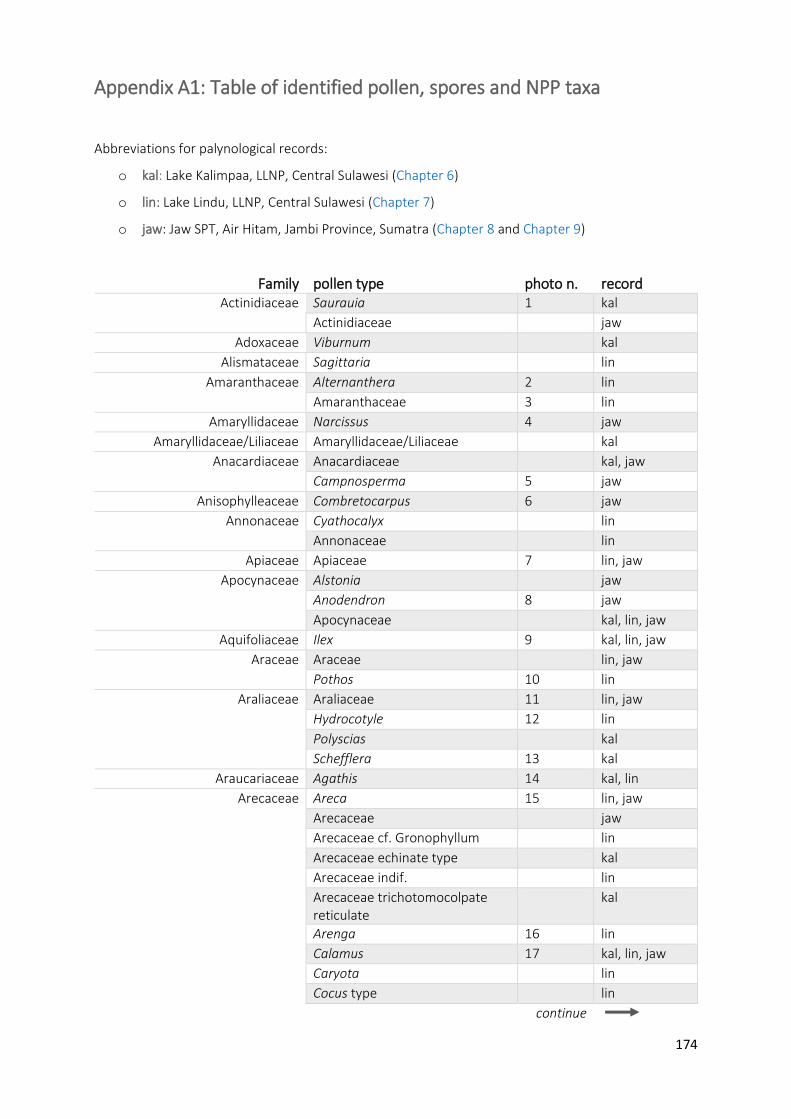
174
Appendix A1: Table of identified pollen, spores and NPP taxa
Abbreviations for palynological records:
o kal: Lake Kalimpaa, LLNP, Central Sulawesi (Chapter 6)
o lin: Lake Lindu, LLNP, Central Sulawesi (Chapter 7)
o jaw: Jaw SPT, Air Hitam, Jambi Province, Sumatra (Chapter 8 and Chapter 9)
Family pollen type photo n. record Actinidiaceae Saurauia 1 kal
Actinidiaceae jaw
Adoxaceae Viburnum kal
Alismataceae Sagittaria lin
Amaranthaceae Alternanthera 2 lin
Amaranthaceae 3 lin
Amaryllidaceae Narcissus 4 jaw
Amaryllidaceae/Liliaceae Amaryllidaceae/Liliaceae kal
Anacardiaceae Anacardiaceae kal, jaw
Campnosperma 5 jaw
Anisophylleaceae Combretocarpus 6 jaw
Annonaceae Cyathocalyx lin
Annonaceae lin
Apiaceae Apiaceae 7 lin, jaw
Apocynaceae Alstonia jaw
Anodendron 8 jaw
Apocynaceae kal, lin, jaw
Aquifoliaceae Ilex 9 kal, lin, jaw
Araceae Araceae lin, jaw
Pothos 10 lin
Araliaceae Araliaceae 11 lin, jaw
Hydrocotyle 12 lin
Polyscias kal
Schefflera 13 kal
Araucariaceae Agathis 14 kal, lin
Arecaceae Areca 15 lin, jaw
Arecaceae jaw
Arecaceae cf. Gronophyllum lin
Arecaceae echinate type kal
Arecaceae indif. lin
Arecaceae trichotomocolpate reticulate
kal
Arenga 16 lin
Calamus 17 kal, lin, jaw
Caryota lin
Cocus type lin
continue

175
Family pollen type photo n. record Arecaceae Oncosperma 18 jaw
Pinanga annulocolpate lin
Aristolochiaceae Aristolochiaceae lin, jaw
Asparagaceae Dracaena lin
Asteraceae Asteraceae 19, 20 kal, lin
Senecio type lin
Begoniaceae Begoniaceae kal, lin
Brassicaceae Brassicaceae lin, jaw
Burseraceae Canarium 21 lin, jaw
Burseraceae kal
Cannabaceae Celtis 22 kal, lin, jaw
Gironniera lin, jaw
Trema 23 kal, lin, jaw
Caryophyllaceae Caryophyllaceae 24 jaw
Celastraceae Celastraceae 25 lin
Euonymus 26 kal
Lophopetalum 27 jaw
Chlorantaceae Chlorantaceae 28 kal
Chrysobalanaceae Parastemon 29 jaw
Clethraceae Clethra 30 kal
Clusiaceae Clusiaceae kal
Garcinia 31 jaw
Combretaceae/Melastomataceae Combretaceae/Melastomataceae 32 kal, lin, jaw
Convolvulaceae Ipomoea type jaw
cf. Erycibe lin
Cornaceae Alangium kal
Mastixia lin
Costaceae Costus 33 lin
Cucurbitaceae Cucurbitaceae kal, lin
Cunoniaceae Cunoniaceae dicolporate type kal
Weinmannia 34 kal, lin
Cyperaceae Cyperaceae 35 kal, lin, jaw
Cyperus 36 lin
Scirpus lin
Thoracostachyum/Mapania jaw
Daphniphyllaceae Daphniphyllum kal, lin
Dilleniaceae Dilleniaceae lin
Dipterocarpaceae Dipterocarpus 37 jaw
Dryobalanops 38 jaw
Hopea 39 jaw
Shorea 40 jaw
Droseraceae Drosera 41 kal
Ebenaceae Diospyros 42 lin, jaw
Elaeocarpaceae Elaeocarpaceae 43 kal, lin, jaw
Ericaceae Ericaceae 44 kal, lin, jaw
continue

176
Family pollen type photo n. record Euphorbiaceae Acalypha 45 kal, lin, jaw
Blumeodendron 46 jaw
Cephalomappa 47 jaw
Homalanthus kal, lin, jaw
Homonoia lin
Macaranga/Mallotus 48 kal, lin, jaw
Neoscortechinia cf. nicobarica lin
Euphorbiaceae kal
Fabaceae Caesalpinioideae indif. lin
Caesalpinoideae - Cassia type lin
Koompassia 49 jaw
Mimosoideae lin, jaw
Mucuna 50 lin
Pterocarpus type kal
Fabaceae indif. kal, lin, jaw
Fagaceae Fagaceae indif. kal
Lithocarpus/Castanopsis 51 kal, lin
Flacourtiaceae Flacourtiaceae kal, lin
Flagellariaceae Flagellaria jaw
Gentianaceae Fagraea 52 lin
Gnetaceae Gnetum lin
Gunneraceae Gunnera 53 kal
Haloragaceae Myriophyllum lin
Hamamelidaceae Hamamelidaceae kal
Hydrangeaceae Dichroa febrifuga lin
Hydrocharitaceae Hydrocharitaceae kal
Icacinaceae Icacinaceae lin
Platea 54 lin
Iridaceae Iridaceae kal
Juglandaceae Engelhardtia 55 kal, lin, jaw
Juglandaceae indif. kal
Lamiaceae Lamiaceae kal, lin, jaw
Lauraceae Lauraceae kal
Lecythidaceae Barringtonia 56 kal
Liliaceae Liliaceae lin
Loganiaceae Geniostoma 57 lin
Loranthaceae Loranthaceae 58 kal, lin, jaw
Lythraceae Lythraceae 59 kal, lin
Malvaceae Helicteres lin
Hibiscus jaw
Malvaceae kal
Sterculioideae jaw
Tilioideae lin
Malvaceae (Brownlowioideae) Brownlowia 60 jaw
Malvaceae (Bombacoideae) Durio 61 jaw
continue

177
Family pollen type photo n. record Melastomataceae Astronia lin
Meliaceae Aglaia 62 kal, lin, jaw
Aglaia rubiginosa type jaw
Dysoxylum 63 kal
Meliaceae kal, lin, jaw
Menispermaceae Fibraurea kal
Fibraurea tinctoria jaw
Menispermiaceae 64 jaw
Stephania 65 kal, lin, jaw
Menyanthaceae Menyanthaceae kal
Moraceae/Urticaceae Moraceae/Urticaceae 66 kal, lin, jaw
Moraceae Ficus 67 lin, jaw
Myricaceae Myrica 68 kal, lin
Myristicaceae Knema jaw
Myristicaceae kal, lin, jaw
Myrtaceae Myrtaceae 69 kal, lin, jaw
Oleaceae Chionanthus lin
Ligustrum jaw
Oleaceae kal
Pandanaceae Freycinetia 70 kal, lin, jaw
Pandanus 71 kal, lin, jaw
Paracryphiaceae Quintinia 72 kal, lin
Pentaphylacaceae Ternstroemia kal, lin
Phyllanthaceae Antidesma 73 jaw
Aporosa 74 jaw
Baccaurea/Bischofia 75 kal, lin, jaw
Breynia 76 lin
Glochidion 77 lin
Phyllanthus lin, jaw
Phyllanthus urinaria type jaw
Picrodendraceae Austrobuxus 78 jaw
Pinaceae Pinus kal
Piperaceae Peperomia 79 kal, lin, jaw
Piper lin, jaw
Plantaginaceae Callitriche 80 lin
Plantago 81 kal, lin, jaw
Poaceae Poaceae 82, 83 kal, lin, jaw
Podocarpaceae Dacrycarpus 84 kal, lin
Phyllocladus 85 kal, lin
Podocarpaceae indiff. jaw
Podocarpus 86 kal, lin
Sundacarpus kal
Pontederiaceae Pontederiaceae 87 lin
Potamogetonaceae Potamogeton kal
Primulaceae Ardisia jaw
continue

178
Family pollen type photo n. record Primulaceae Discocalyx lin
Maesa lin
Myrsine 88 kal, lin, jaw
Proteaceae Proteaceae kal, jaw
Rhizophoraceae Rhizophoraceae 89 jaw
Rosaceae Rosaceae jaw
Rubiaceae Gardenia lin
Hedyotis 90 jaw
Lasianthus jaw
Mussaenda jaw
Nauclea 91 jaw, lin
Neonauclea 92 lin
Randia 93 kal, lin, jaw
Timonius lin
Rubiaceae indif. kal, jaw
Rutaceae Acronychia lin
Rutaceae indif. kal, lin, jaw
cf. Melicope hookeri lin
Zanthoxylum 94 kal
Sapindaceae Acer kal
Allophylus 95 lin
Dodonaea lin
Pometia 96 jaw
Sapindaceae kal
Sapotaceae Palaquium type 97 jaw
Sapotaceae 98 kal, lin, jaw
Scrophulariaceae Buddleja kal
Smilacaceae Smilax lin
Solanaceae Solanaceae kal, lin
Staphyleaceae Turpinia lin
Stemonuraceae Stemonuraceae 99 lin, jaw
Styracaceae Styrax 100 kal
Symplocaceae Symplocos 101 kal, lin
Theaceae Gordonia 102 lin
Theaceae Theaceae indif. lin
Thymelaeaceae Thymelaeaceae jaw
Thymelaeaceae Wikstroemia kal
Trimeniaceae Trimenia lin
Typhaceae Typha 103 kal, lin
Violaceae Violaceae 104 lin
Vitaceae cf. Cissus jaw
Winteraceae Winteraceae Lin
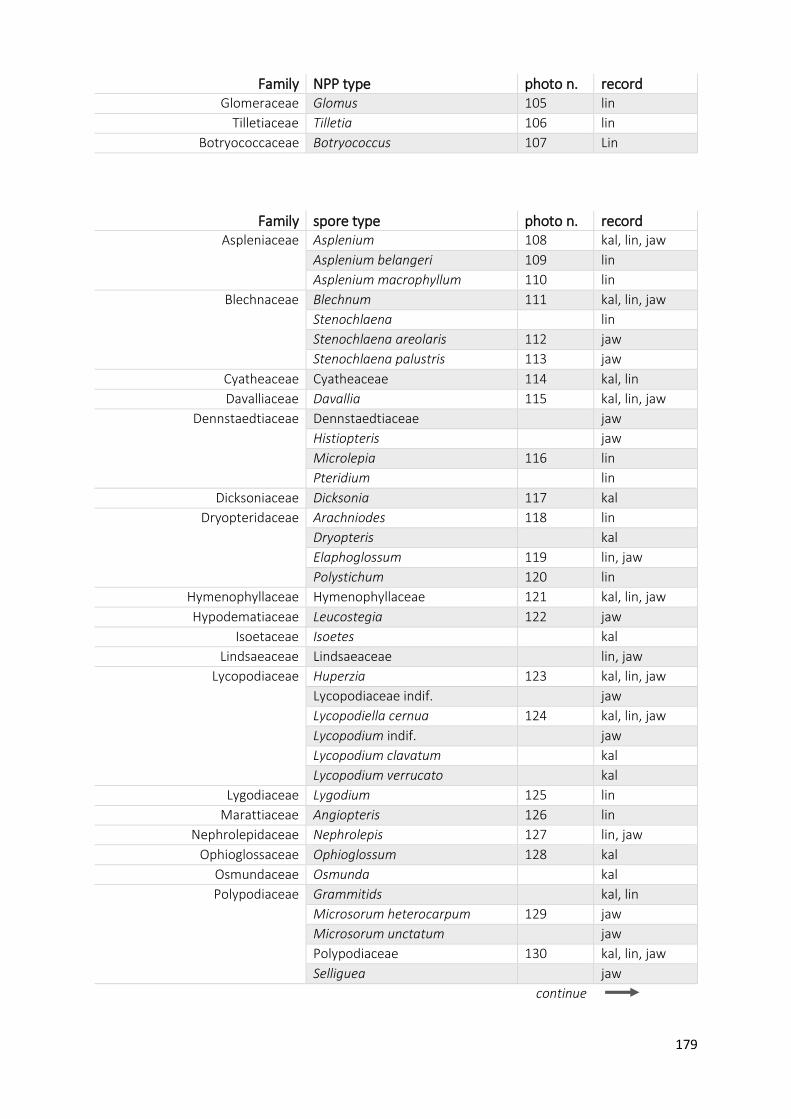
179
Family NPP type photo n. record Glomeraceae Glomus 105 lin
Tilletiaceae Tilletia 106 lin
Botryococcaceae Botryococcus 107 Lin
Family spore type photo n. record Aspleniaceae Asplenium 108 kal, lin, jaw
Asplenium belangeri 109 lin
Asplenium macrophyllum 110 lin
Blechnaceae Blechnum 111 kal, lin, jaw
Stenochlaena lin
Stenochlaena areolaris 112 jaw
Stenochlaena palustris 113 jaw
Cyatheaceae Cyatheaceae 114 kal, lin
Davalliaceae Davallia 115 kal, lin, jaw
Dennstaedtiaceae Dennstaedtiaceae jaw
Histiopteris jaw
Microlepia 116 lin
Pteridium lin
Dicksoniaceae Dicksonia 117 kal
Dryopteridaceae Arachniodes 118 lin
Dryopteris kal
Elaphoglossum 119 lin, jaw
Polystichum 120 lin
Hymenophyllaceae Hymenophyllaceae 121 kal, lin, jaw
Hypodematiaceae Leucostegia 122 jaw
Isoetaceae Isoetes kal
Lindsaeaceae Lindsaeaceae lin, jaw
Lycopodiaceae Huperzia 123 kal, lin, jaw
Lycopodiaceae indif. jaw
Lycopodiella cernua 124 kal, lin, jaw
Lycopodium indif. jaw
Lycopodium clavatum kal
Lycopodium verrucato kal
Lygodiaceae Lygodium 125 lin
Marattiaceae Angiopteris 126 lin
Nephrolepidaceae Nephrolepis 127 lin, jaw
Ophioglossaceae Ophioglossum 128 kal
Osmundaceae Osmunda kal
Polypodiaceae Grammitids kal, lin
Microsorum heterocarpum 129 jaw
Microsorum unctatum jaw
Polypodiaceae 130 kal, lin, jaw
Selliguea jaw
continue

180
Family spore type photo n. record Pteridaceae Adiantum 131 kal, lin, jaw
Anogramma jaw
Pteris 132 kal, jaw
Selaginellaceae Selaginella 133 kal, lin, jaw
Thelypteridaceae Amauropelta 134 lin
Thelypteridaceae kal, jaw
Woodsiaceae Woodsiaceae 135 lin

181
Appendix A2: Plates of selected pollen, spores and NPP taxa
Black line on photos represents the scale bar = 10 µm
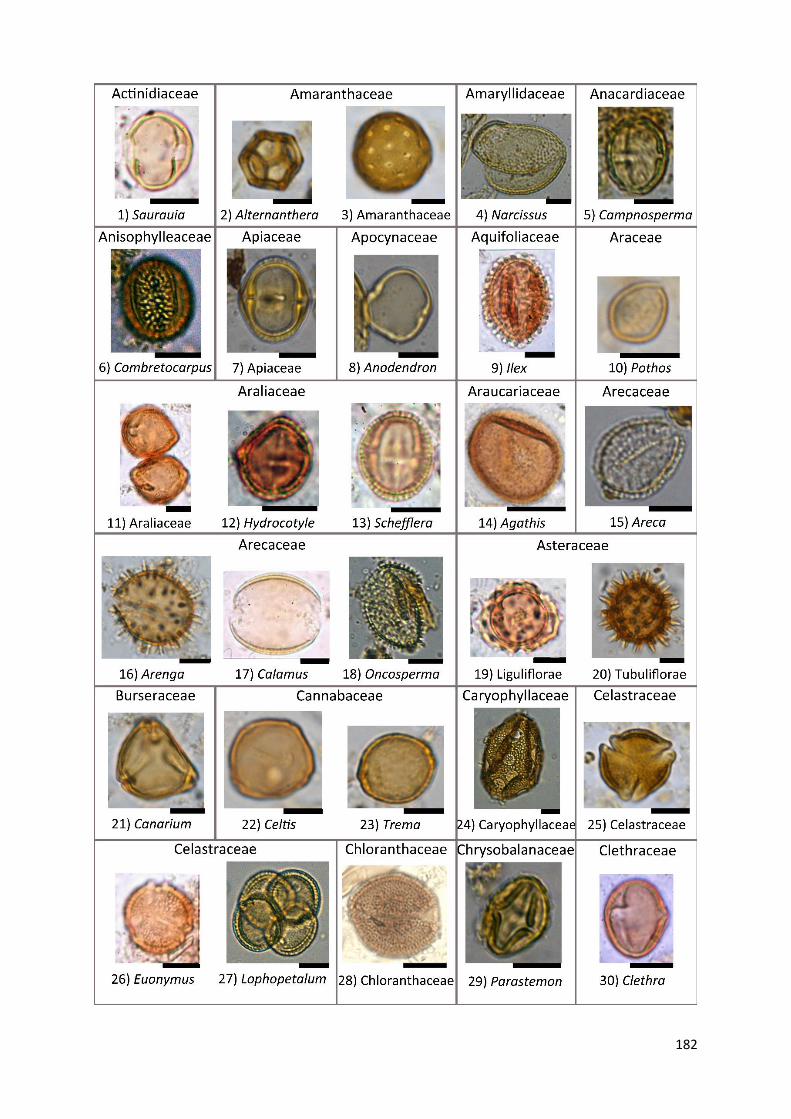
182
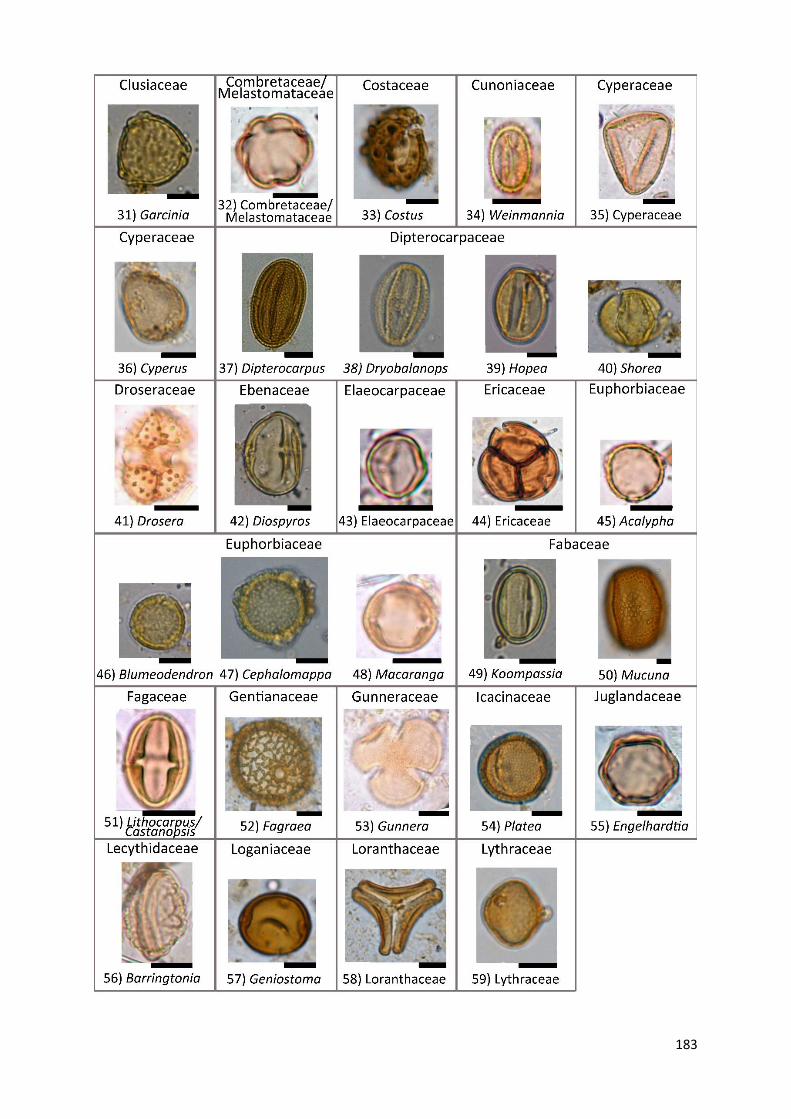
183
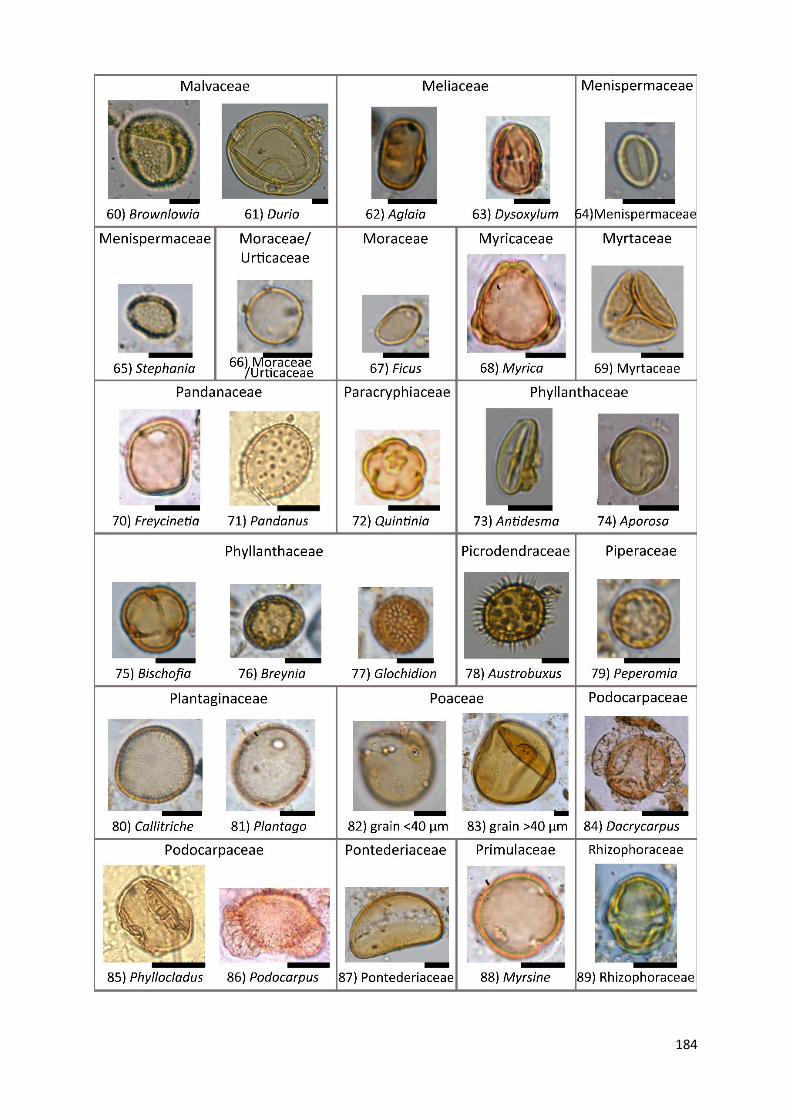
184
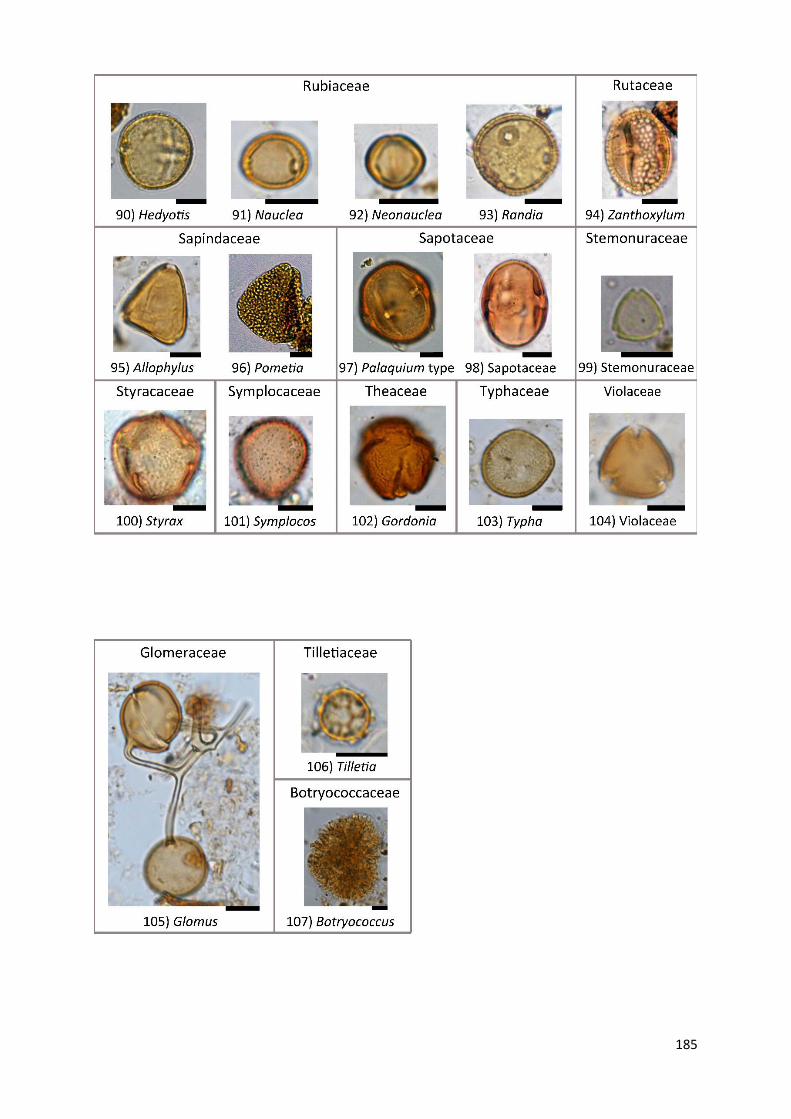
185
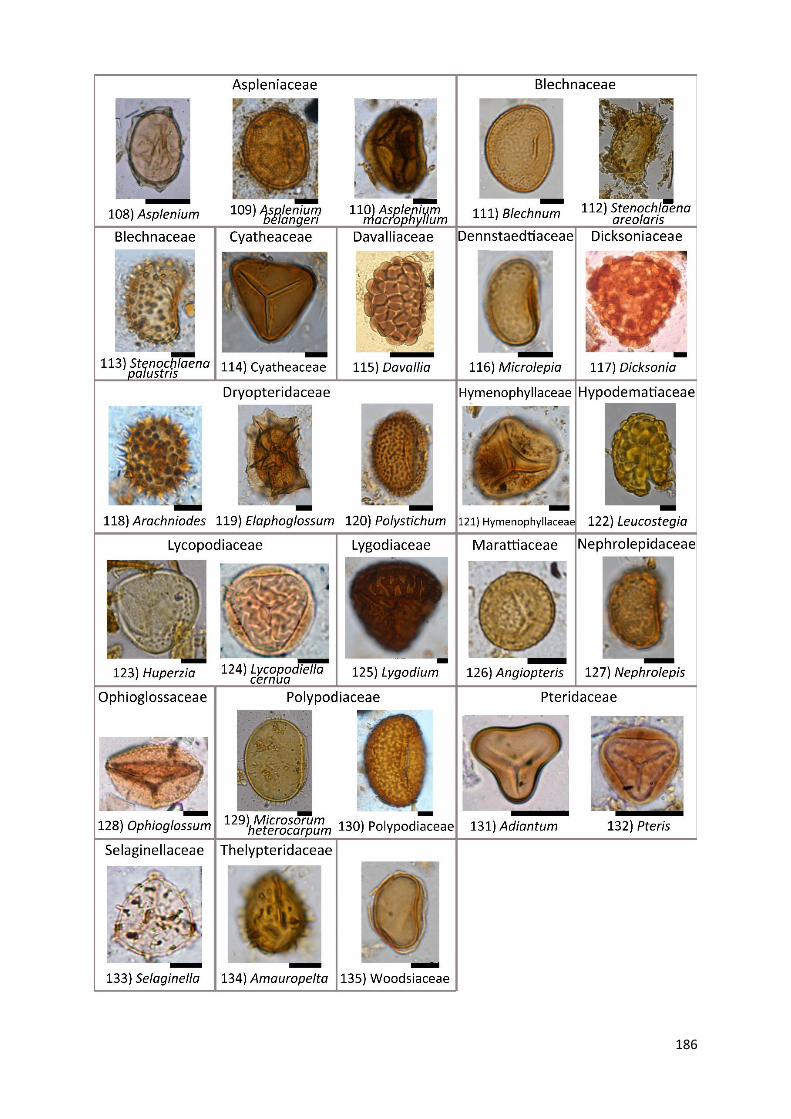
186

187
Appendix B
Complete pollen, spores, NPP and charcoal records
Outline curves showing an exaggeration of 5x to highlight variations of the taxa
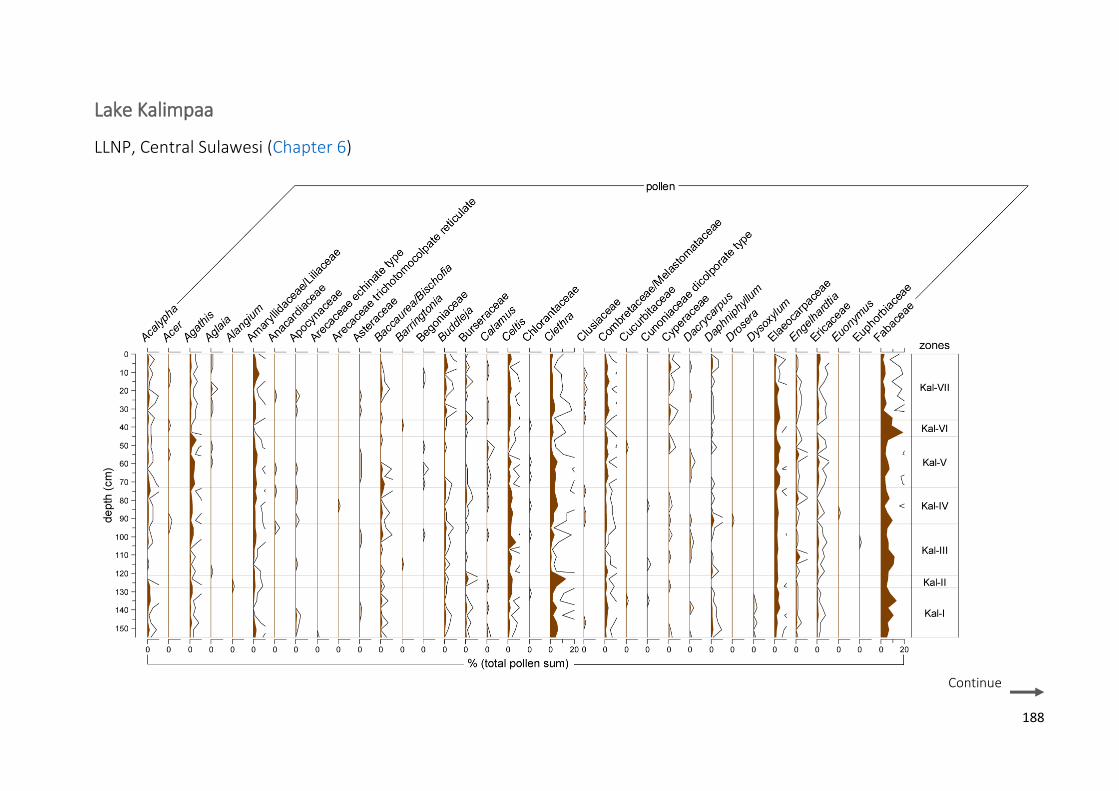
188
Lake Kalimpaa
LLNP, Central Sulawesi (Chapter 6)
Continue
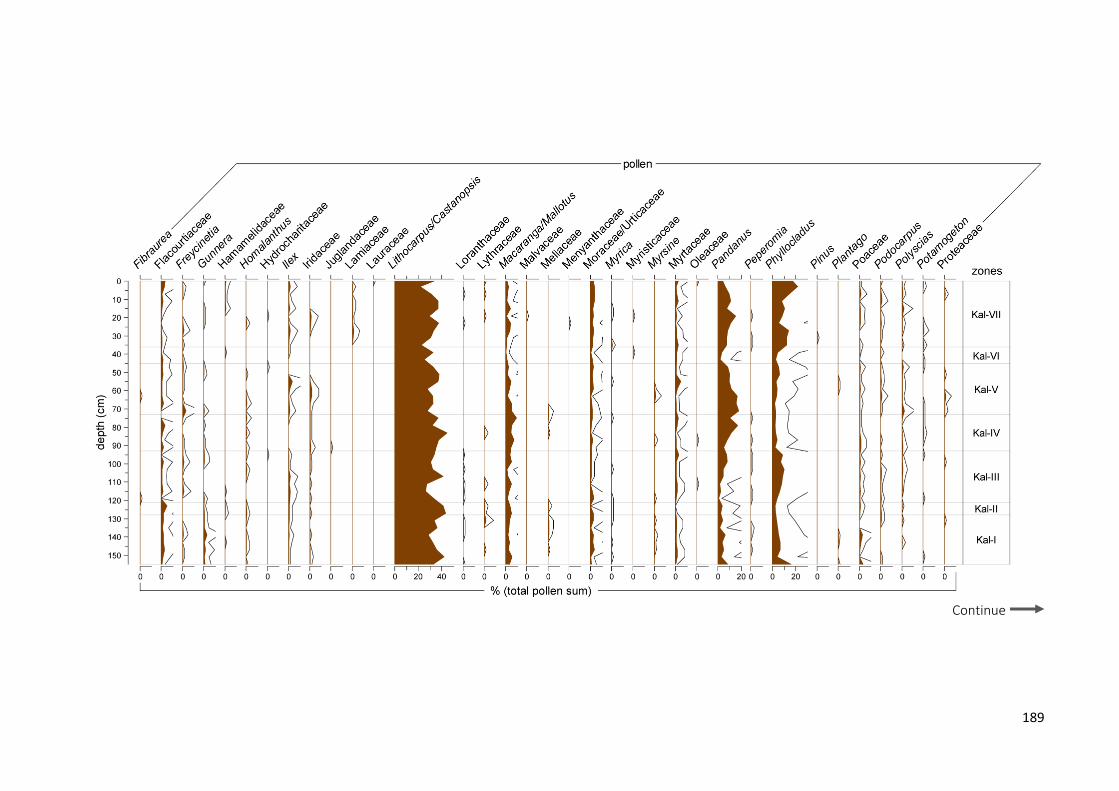
189
Continue
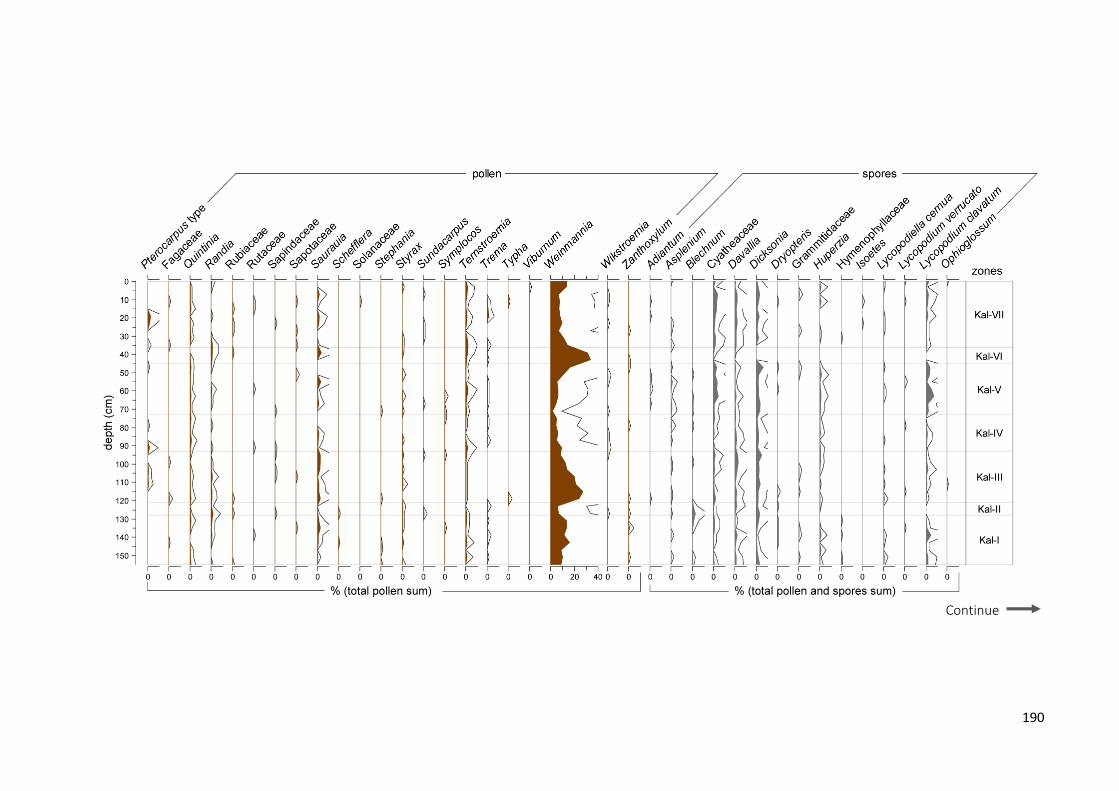
190
Continue
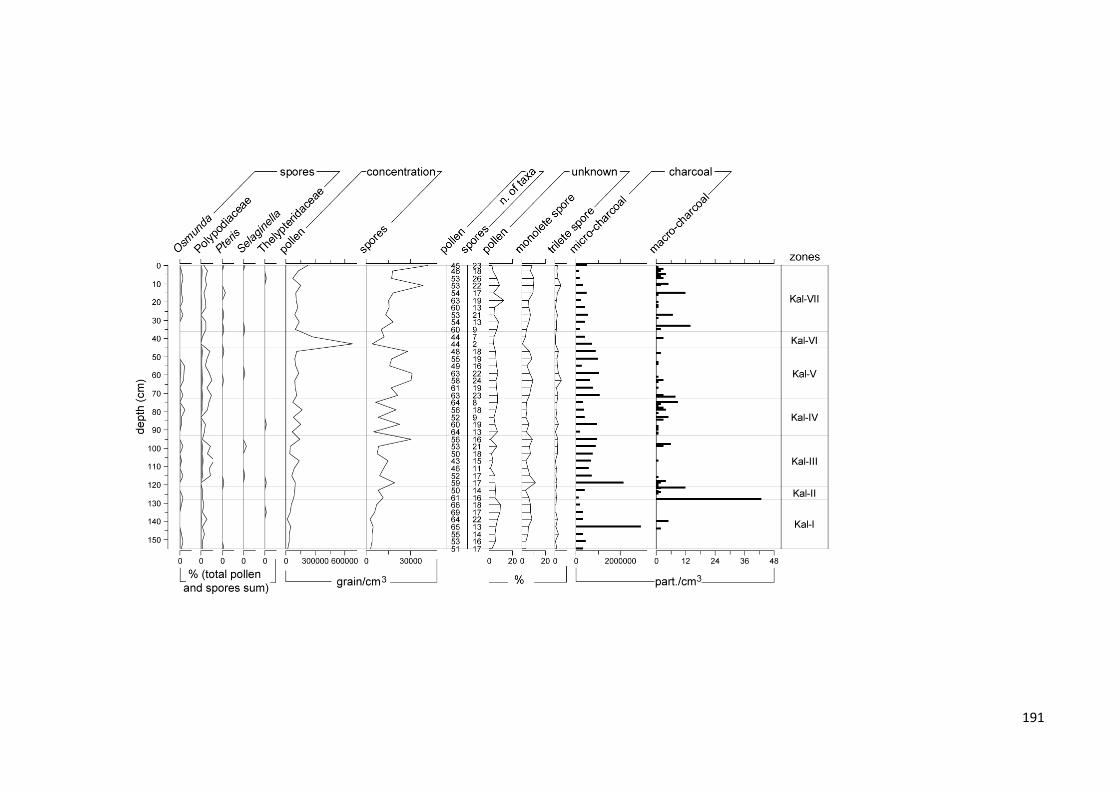
191

192
Lake Lindu
LLNP, Central Sulawesi (Chapter 7)
Continue
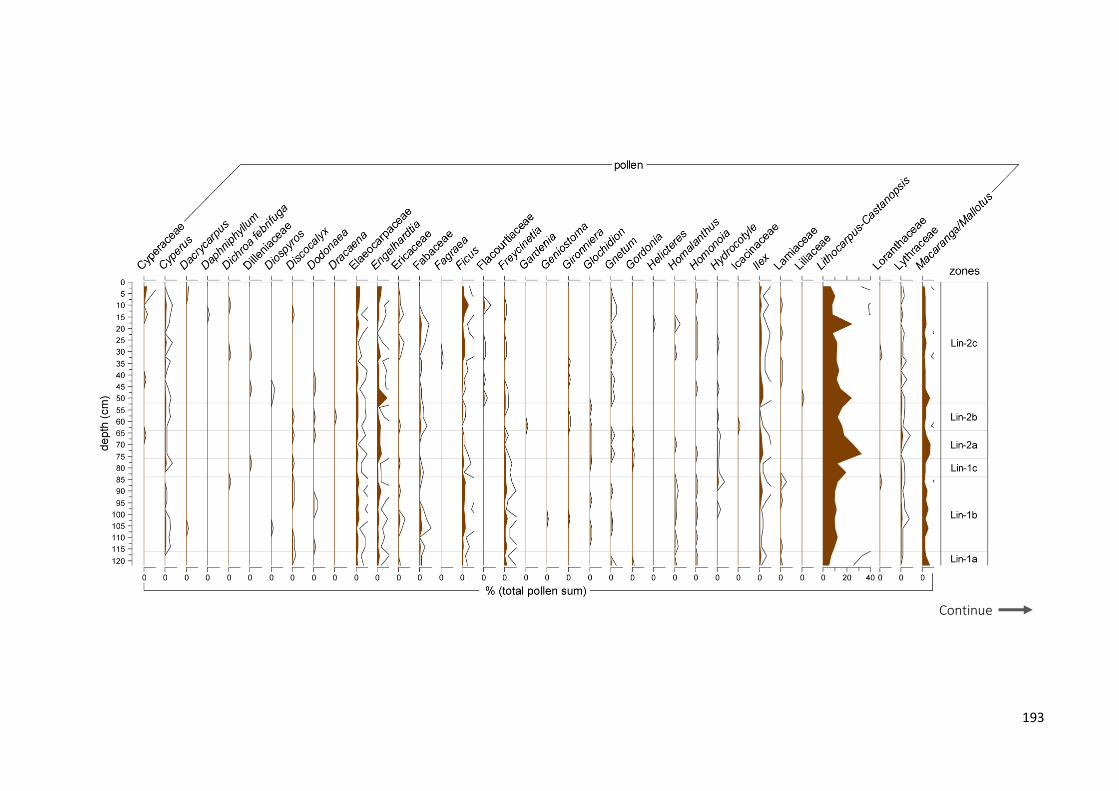
193
Continue

194
Continue

195
Continue
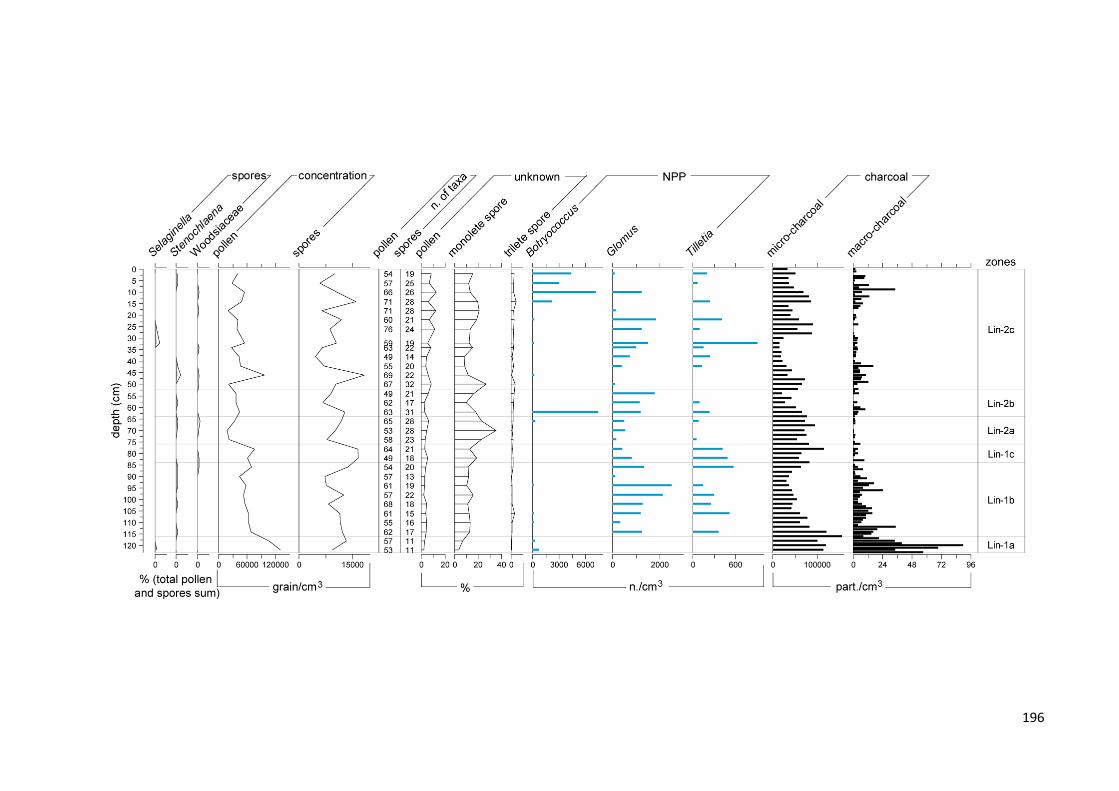
196

197
Jaw SPT, Air Hitam
Jambi Province, Sumatra (Chapter 8 and Chapter 9)
Continue

198
Continue
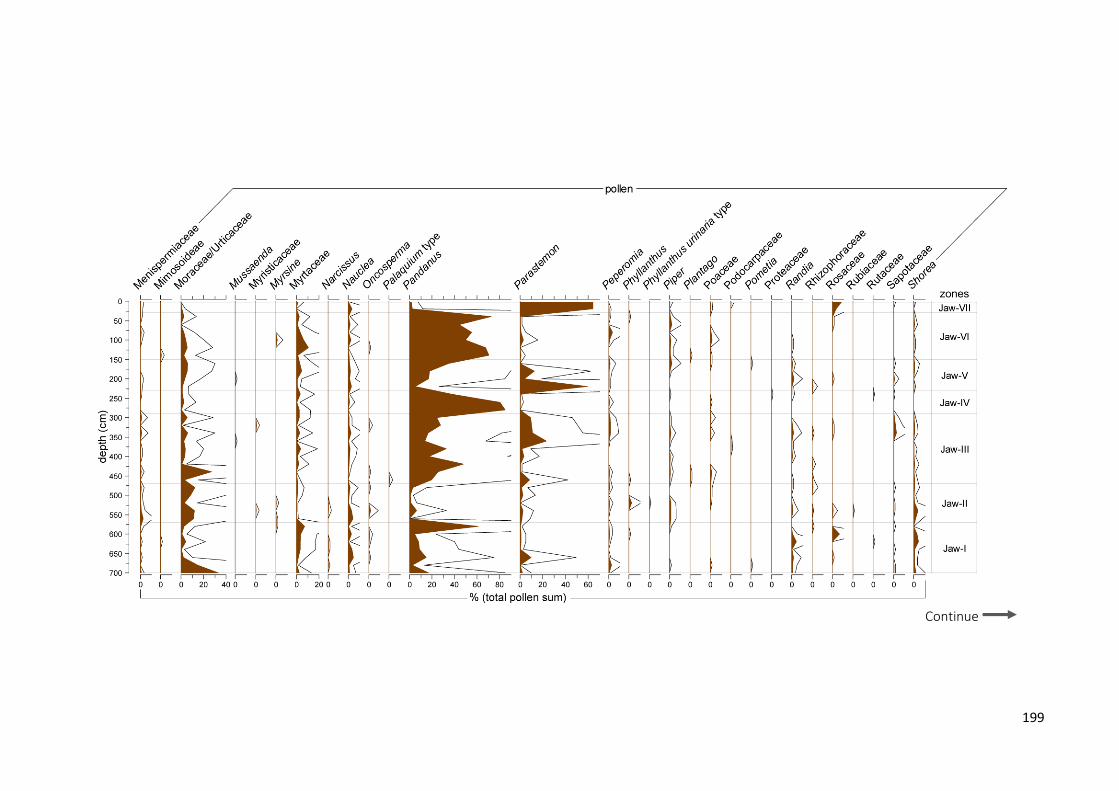
199
Continue
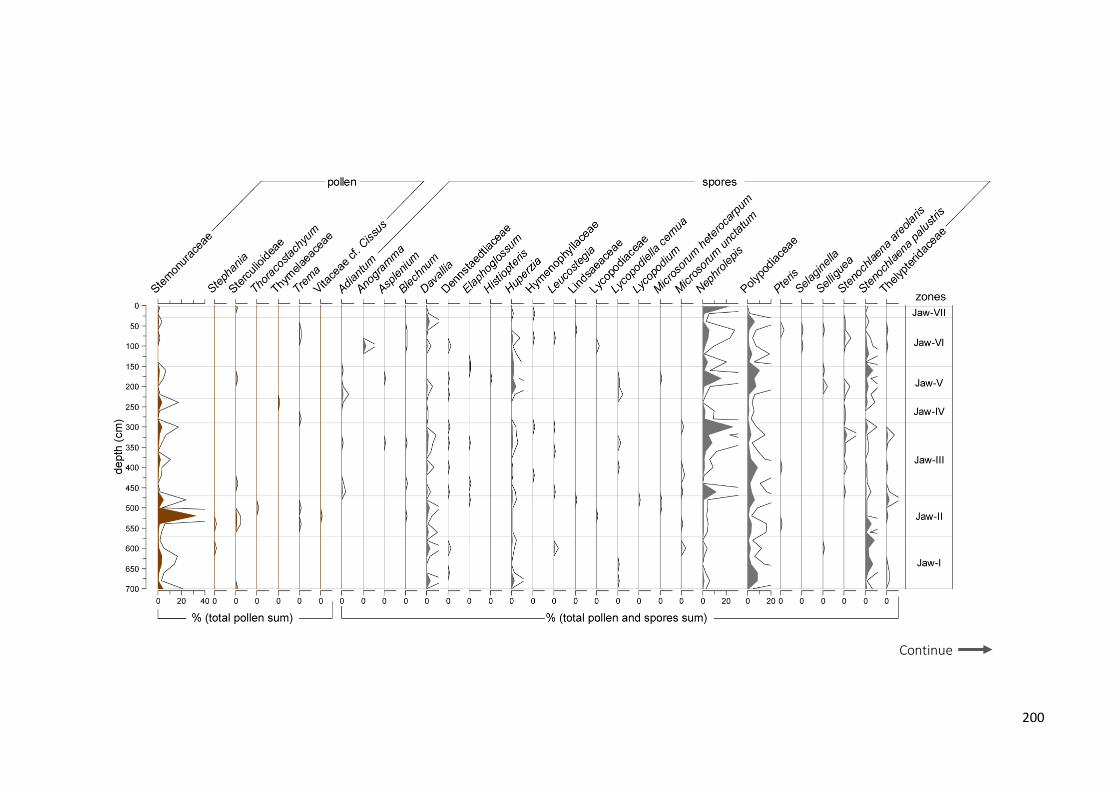
200
Continue
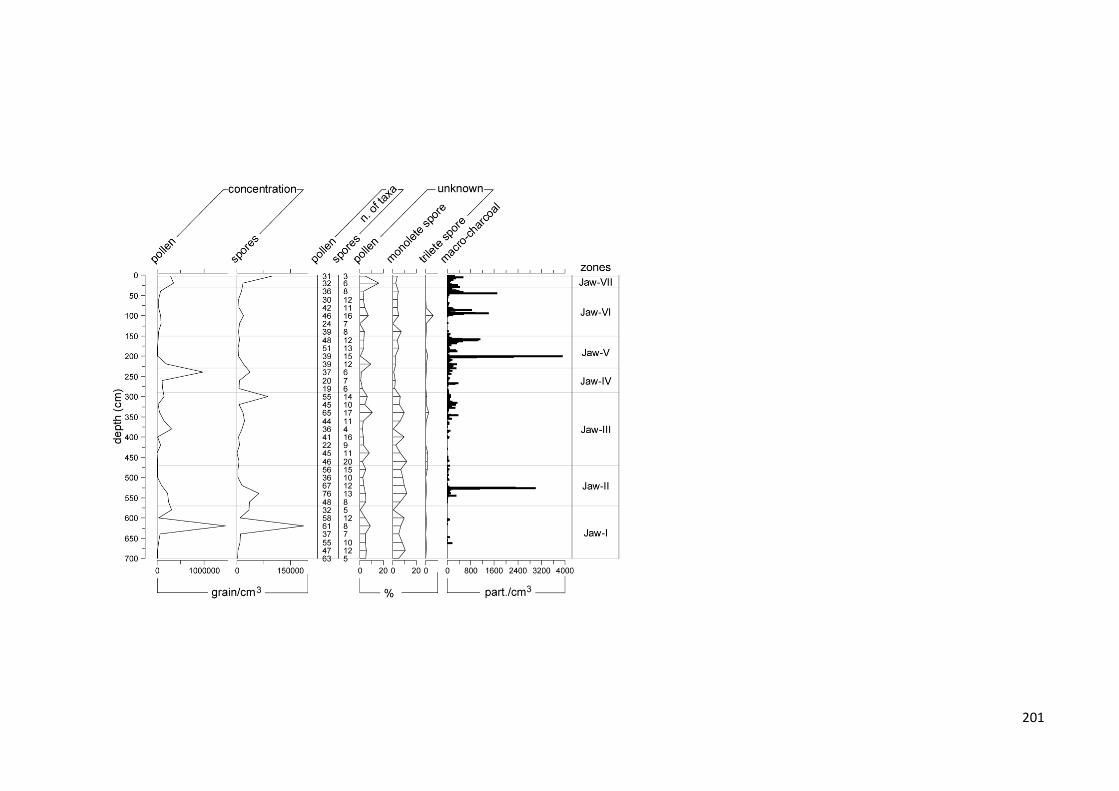
201

202
Declaration of Academic Integrity
I hereby confirm that the present dissertation is solely the work of myself. All scientific collaborators
appear as co-authors of the manuscripts. If any passages or figures/diagrams from books, papers, the
Web or other sources have been copied or in any other way used, all references, including those found
in electronic media, have been acknowledged and fully cited.
______________________
Siria Biagioni
Göttingen, May 5th, 2016