Exploring Archetypes of Tropical Fire-Related Forest ... - MDPI
21
Article Exploring Archetypes of Tropical Fire-Related Forest Disturbances Based on Dense Optical and Radar Satellite Data and Active Fire Alerts Johannes Balling *, Jan Verbesselt , Veronique De Sy , Martin Herold and Johannes Reiche Citation: Balling, J.; Verbesselt, J.; De Sy, V.; Herold, M.; Reiche, J. Exploring Archetypes of Tropical Fire-Related Forest Disturbances Based on Dense Optical and Radar Satellite Data and Active Fire Alerts. Forests 2021, 12, 456. https://doi.org/10.3390/ f12040456 Academic Editor: William W. Hargrove Received: 25 February 2021 Accepted: 7 April 2021 Published: 9 April 2021 Publisher’s Note: MDPI stays neutral with regard to jurisdictional claims in published maps and institutional affil- iations. Copyright: © 2021 by the authors. Licensee MDPI, Basel, Switzerland. This article is an open access article distributed under the terms and conditions of the Creative Commons Attribution (CC BY) license (https:// creativecommons.org/licenses/by/ 4.0/). Laboratory of Geo-Information Science and Remote Sensing, Wageningen University & Research, Droevendaalsesteeg 3, 6708 PB Wageningen, The Netherlands; [email protected] (J.V.); [email protected] (V.D.S.); [email protected] (M.H.); [email protected] (J.R.) * Correspondence: [email protected] Abstract: Tropical forest disturbances linked to fire usage cause large amounts of greenhouse gas (GHG) emissions and environmental damages. Supporting precise GHG estimations and counteract- ing illegal fire usages in the tropics require timely and thematically detailed large-scale information on fire-related forest disturbances. Multi-sensor optical and radar detection and ranging (radar) remote sensing data combined with active fire alerts shows the potential for a more in-depth characterization of fire-related forest disturbances. We utilized dense optical (Landsat-7, Landsat-8 and Sentinel-2) and radar (Sentinel-1) time series to individually map forest disturbances in the province of Riau (Indonesia) for 2018–2019. We combined the sensor-specific optical and radar forest disturbance maps with daily active fire alerts and classified their temporal relationship (predating, coinciding, postdating) into seven so-called archetypes of fire-related forest disturbances. The archetypes reflect sensor-specific sensitives of optical (e.g., changes in tree foliage) and radar (e.g., changes in tree structure) data to detect varying types of forest disturbances, ranging from either a loss of tree foliage and/or structure predating, coinciding or postdating fires. These can be related to different magni- tudes of fire-related forest disturbances and burn severities and can be associated with specific land management practices, such as slash-and-burn agriculture and salvage logging. This can support policy development, local and regional forest management and law enforcement to reduce illegal fire usage in the tropics. Results suggest that a delayed or opposing forest disturbance detection in the optical and radar signal is not only caused by environmental influences or different observation densities but, in some cases, such as fire-related forest disturbances, can be related to their different sensitives to detect changes in tree foliage and structure. Multi-sensor-based forest monitoring approaches should, therefore, not simply combine optical and radar time series on a data level, as it bears the risk of introducing artefacts. Keywords: Sentinel-1; Sentinel-2; Landsat; VIIRS active fire; forest disturbances; fire-related; tropical forest; multi-sensor; dense time series 1. Introduction Indonesia is globally one of the main contributors of forest carbon emissions in the 21st century as a result of large-scale forest disturbances including deforestation and forest degradation [1,2]. Forest disturbances in Indonesia are caused primarily by smallholder or commercial agriculture crop expansion and timber production, of which many are illegal or unsustainable [3,4]. Furthermore, these disturbances are strongly linked to fire use [5]. While fire use for land management is forbidden by Indonesian law, a wide range of fire-related practices are still used today [6]. These practices traditionally include limited and controlled burning of forests to, for example, clear understory providing access prior to logging operations, burn forest directly or burn remaining material at previously logged Forests 2021, 12, 456. https://doi.org/10.3390/f12040456 https://www.mdpi.com/journal/forests
-
Upload
khangminh22 -
Category
Documents
-
view
1 -
download
0
Transcript of Exploring Archetypes of Tropical Fire-Related Forest ... - MDPI
Article
Exploring Archetypes of Tropical Fire-Related ForestDisturbances Based on Dense Optical and Radar Satellite Dataand Active Fire Alerts
Johannes Balling *, Jan Verbesselt , Veronique De Sy , Martin Herold and Johannes Reiche
�����������������
Citation: Balling, J.; Verbesselt, J.; De
Sy, V.; Herold, M.; Reiche, J. Exploring
Archetypes of Tropical Fire-Related
Forest Disturbances Based on Dense
Optical and Radar Satellite Data and
Active Fire Alerts. Forests 2021, 12,
456. https://doi.org/10.3390/
f12040456
Academic Editor: William
W. Hargrove
Received: 25 February 2021
Accepted: 7 April 2021
Published: 9 April 2021
Publisher’s Note: MDPI stays neutral
with regard to jurisdictional claims in
published maps and institutional affil-
iations.
Copyright: © 2021 by the authors.
Licensee MDPI, Basel, Switzerland.
This article is an open access article
distributed under the terms and
conditions of the Creative Commons
Attribution (CC BY) license (https://
creativecommons.org/licenses/by/
4.0/).
Laboratory of Geo-Information Science and Remote Sensing, Wageningen University & Research,Droevendaalsesteeg 3, 6708 PB Wageningen, The Netherlands; [email protected] (J.V.);[email protected] (V.D.S.); [email protected] (M.H.); [email protected] (J.R.)* Correspondence: [email protected]
Abstract: Tropical forest disturbances linked to fire usage cause large amounts of greenhouse gas(GHG) emissions and environmental damages. Supporting precise GHG estimations and counteract-ing illegal fire usages in the tropics require timely and thematically detailed large-scale information onfire-related forest disturbances. Multi-sensor optical and radar detection and ranging (radar) remotesensing data combined with active fire alerts shows the potential for a more in-depth characterizationof fire-related forest disturbances. We utilized dense optical (Landsat-7, Landsat-8 and Sentinel-2)and radar (Sentinel-1) time series to individually map forest disturbances in the province of Riau(Indonesia) for 2018–2019. We combined the sensor-specific optical and radar forest disturbancemaps with daily active fire alerts and classified their temporal relationship (predating, coinciding,postdating) into seven so-called archetypes of fire-related forest disturbances. The archetypes reflectsensor-specific sensitives of optical (e.g., changes in tree foliage) and radar (e.g., changes in treestructure) data to detect varying types of forest disturbances, ranging from either a loss of tree foliageand/or structure predating, coinciding or postdating fires. These can be related to different magni-tudes of fire-related forest disturbances and burn severities and can be associated with specific landmanagement practices, such as slash-and-burn agriculture and salvage logging. This can supportpolicy development, local and regional forest management and law enforcement to reduce illegalfire usage in the tropics. Results suggest that a delayed or opposing forest disturbance detection inthe optical and radar signal is not only caused by environmental influences or different observationdensities but, in some cases, such as fire-related forest disturbances, can be related to their differentsensitives to detect changes in tree foliage and structure. Multi-sensor-based forest monitoringapproaches should, therefore, not simply combine optical and radar time series on a data level, as itbears the risk of introducing artefacts.
Keywords: Sentinel-1; Sentinel-2; Landsat; VIIRS active fire; forest disturbances; fire-related; tropicalforest; multi-sensor; dense time series
1. Introduction
Indonesia is globally one of the main contributors of forest carbon emissions in the21st century as a result of large-scale forest disturbances including deforestation and forestdegradation [1,2]. Forest disturbances in Indonesia are caused primarily by smallholderor commercial agriculture crop expansion and timber production, of which many areillegal or unsustainable [3,4]. Furthermore, these disturbances are strongly linked to fireuse [5]. While fire use for land management is forbidden by Indonesian law, a wide rangeof fire-related practices are still used today [6]. These practices traditionally include limitedand controlled burning of forests to, for example, clear understory providing access priorto logging operations, burn forest directly or burn remaining material at previously logged
Forests 2021, 12, 456. https://doi.org/10.3390/f12040456 https://www.mdpi.com/journal/forests
Forests 2021, 12, 456 2 of 21
patches in preparation of agricultural use [7,8]. Moreover, escaped land use fires causelarge-area forest fires in dry El Nino years (e.g., 2015) [9].
While some fires burn the entire tree structure, others only burn the tree foliage result-ing in varying magnitudes of released GHG emissions [10]. The lack of detailed informationon fire-related forest disturbances cause high uncertainties in current GHG emission esti-mates [11,12]. The Paris Agreement and initiatives such as REDD+ have the goal to reduceGHG emissions by implementing sustainable land use management [13,14]. Sustainableland use and forest management needs detailed fire inventory data and information beyondsimple net and gross deforestation on monthly or yearly basis [15,16].
Remote sensing has proven to be a valuable tool for monitoring large-scale forestdisturbances and fires in tropical ecosystems [17]. Optical satellite time series are used todetect forest disturbances by relating spectral information, commonly, spectral vegetationindices, to photosynthetic capacity, shifts in phenology and temporal vegetation dynam-ics [18–26]. By combining optical time series with active fire alerts from Visible InfraredImaging Radiometer Suite (VIIRS) or Moderate Resolution Imaging Spectroradiometer(MODIS) sensors, it is possible to detect and analyze fire-related forest disturbances [27–32].However, limited availability of cloud-free observations in the tropics often restricts charac-terizations of fire-related forest disturbances to a simple co-location of active fire alerts andgap-free annual optical forest change products [5,33–35]. Hereby, the detailed informationon how fires are temporally related to forest disturbances is often lacking [36].
Radar satellite sensors are capable of penetrating clouds, thus potentially providingdenser time series, and are sensitive to changes in forest structure [37,38]. Combining denseradar backscatter time series with active fire alerts enables the possibility to monitor fireseverity and to explore the temporal relationship of fires and forest disturbances [36,39–41].Reiche et al. [36] combined VIIRS active fire alerts and radar-based forest losses derivedfrom Sentinel-1 time series to classify whether fires predated, coincided or postdateddetected forest disturbances.
Combining optical and radar remote sensing time series shows great potential inincreasing the observation frequency and overcoming sensor-specific misclassificationsdue to environmental influences (e.g., cloud coverage, rainfall, etc.) when monitoringforest disturbances [37,42–45]. Studies also show benefits of a combined usage for burnedarea and fire severity mapping [46,47]. The sensitivities of both sensors towards forestdisturbances vary. Optical sensors are capable of detecting subtle changes in the tree foliagebut show limitations when separating those from higher magnitude changes such as treeremoval, while radar sensors are capable of detecting larger structural changes in forestcover but are not able to identify changes in tree foliage that do not result in structuralforest changes [36,48–50]. However, their synergistic potential for a more detailed temporalcharacterization of fire-related forest disturbances has yet to be studied [36].
The aim of this study was to combine multi-sensor optical and radar remote sensingdata with active fire alerts for an improved characterization of fire-related forest distur-bances for the province of Riau (Indonesia). We mapped forest disturbances independentlybased on dense optical (Landsat-7, Landsat-8 and Sentinel-2) and radar (Sentinel-1) timeseries (i). Then, we derived archetypes of fire-related forest disturbances based on thetemporal relationship of mapped optical and radar forest disturbances with VIIRS activefire alerts (ii). Lastly, the implications for multi-sensor forest monitoring were discussedbased on the findings of this study (iii).
2. Materials and Methods2.1. Study Area
The province of Riau, Indonesia (100–104 E and 2.5 N–1 S) is located at the east coastof central Sumatra covering around 89,000 km2. Its topography consists of a low elevationcoastline in the east and mountainous areas of up to 1200 m in the west. Riau experiences atropical equatorial climate with regular cloud coverage. The annual precipitation variesbetween 2000 and 3000 mm. By the 1970s, 95% of the land was covered by natural forest [51].
Forests 2021, 12, 456 3 of 21
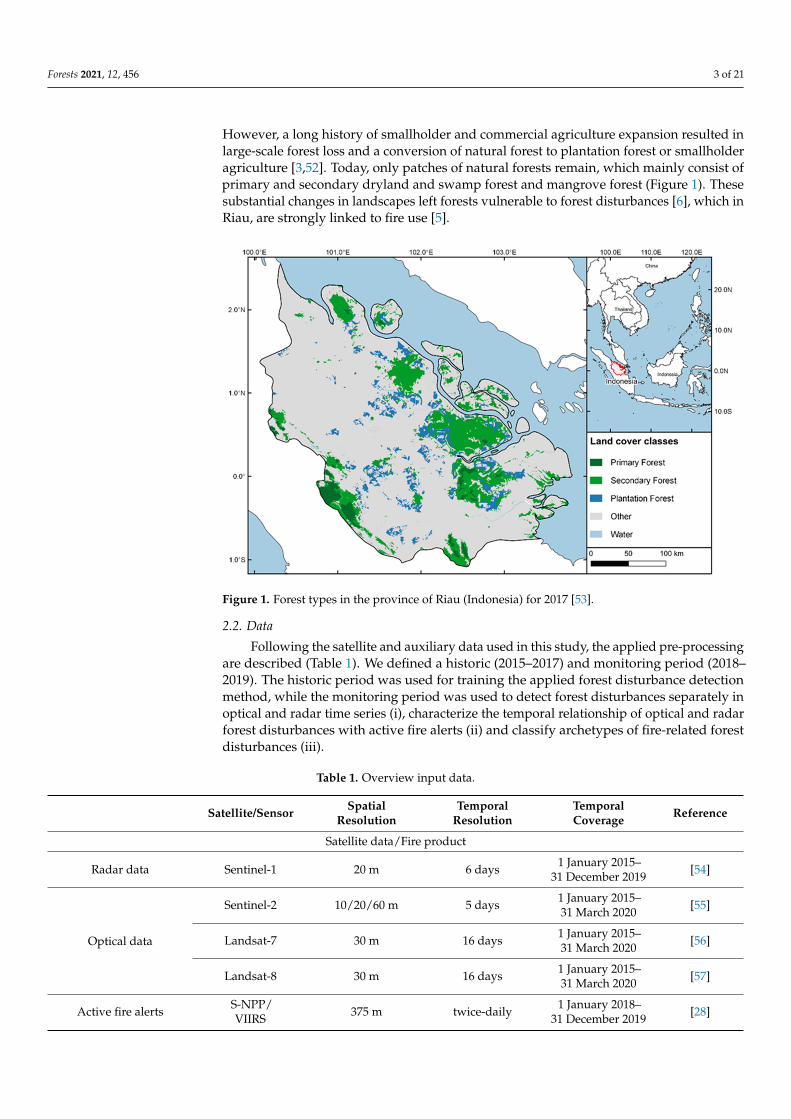
However, a long history of smallholder and commercial agriculture expansion resulted inlarge-scale forest loss and a conversion of natural forest to plantation forest or smallholderagriculture [3,52]. Today, only patches of natural forests remain, which mainly consist ofprimary and secondary dryland and swamp forest and mangrove forest (Figure 1). Thesesubstantial changes in landscapes left forests vulnerable to forest disturbances [6], which inRiau, are strongly linked to fire use [5].
Figure 1. Forest types in the province of Riau (Indonesia) for 2017 [53].
2.2. Data
Following the satellite and auxiliary data used in this study, the applied pre-processingare described (Table 1). We defined a historic (2015–2017) and monitoring period (2018–2019). The historic period was used for training the applied forest disturbance detectionmethod, while the monitoring period was used to detect forest disturbances separately inoptical and radar time series (i), characterize the temporal relationship of optical and radarforest disturbances with active fire alerts (ii) and classify archetypes of fire-related forestdisturbances (iii).
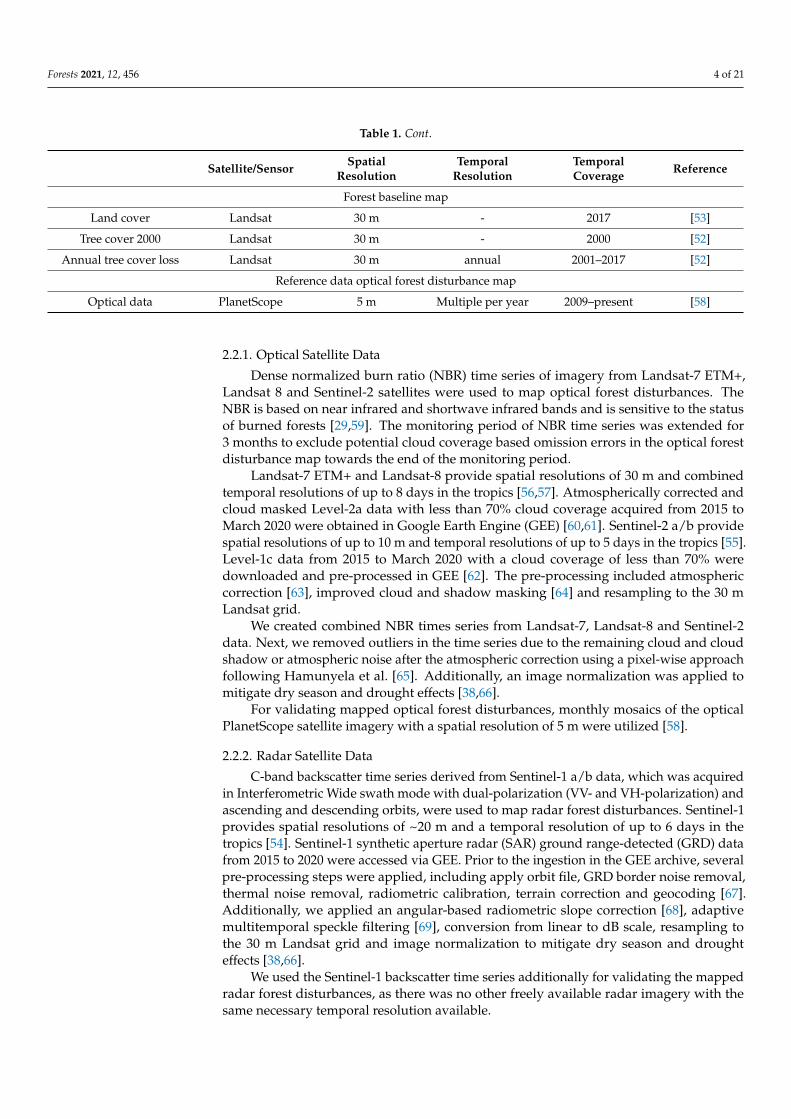
Table 1. Overview input data.
Satellite/Sensor SpatialResolution
TemporalResolution
TemporalCoverage Reference
Satellite data/Fire product
Radar data Sentinel-1 20 m 6 days 1 January 2015–31 December 2019 [54]
Optical data
Sentinel-2 10/20/60 m 5 days 1 January 2015–31 March 2020 [55]
Landsat-7 30 m 16 days 1 January 2015–31 March 2020 [56]
Landsat-8 30 m 16 days 1 January 2015–31 March 2020 [57]
Active fire alerts S-NPP/VIIRS 375 m twice-daily 1 January 2018–
31 December 2019 [28]
Forests 2021, 12, 456 4 of 21
Table 1. Cont.
Satellite/Sensor SpatialResolution
TemporalResolution
TemporalCoverage Reference
Forest baseline map
Land cover Landsat 30 m - 2017 [53]
Tree cover 2000 Landsat 30 m - 2000 [52]
Annual tree cover loss Landsat 30 m annual 2001–2017 [52]
Reference data optical forest disturbance map
Optical data PlanetScope 5 m Multiple per year 2009–present [58]
2.2.1. Optical Satellite Data
Dense normalized burn ratio (NBR) time series of imagery from Landsat-7 ETM+,Landsat 8 and Sentinel-2 satellites were used to map optical forest disturbances. TheNBR is based on near infrared and shortwave infrared bands and is sensitive to the statusof burned forests [29,59]. The monitoring period of NBR time series was extended for3 months to exclude potential cloud coverage based omission errors in the optical forestdisturbance map towards the end of the monitoring period.
Landsat-7 ETM+ and Landsat-8 provide spatial resolutions of 30 m and combinedtemporal resolutions of up to 8 days in the tropics [56,57]. Atmospherically corrected andcloud masked Level-2a data with less than 70% cloud coverage acquired from 2015 toMarch 2020 were obtained in Google Earth Engine (GEE) [60,61]. Sentinel-2 a/b providespatial resolutions of up to 10 m and temporal resolutions of up to 5 days in the tropics [55].Level-1c data from 2015 to March 2020 with a cloud coverage of less than 70% weredownloaded and pre-processed in GEE [62]. The pre-processing included atmosphericcorrection [63], improved cloud and shadow masking [64] and resampling to the 30 mLandsat grid.
We created combined NBR times series from Landsat-7, Landsat-8 and Sentinel-2data. Next, we removed outliers in the time series due to the remaining cloud and cloudshadow or atmospheric noise after the atmospheric correction using a pixel-wise approachfollowing Hamunyela et al. [65]. Additionally, an image normalization was applied tomitigate dry season and drought effects [38,66].
For validating mapped optical forest disturbances, monthly mosaics of the opticalPlanetScope satellite imagery with a spatial resolution of 5 m were utilized [58].
2.2.2. Radar Satellite Data
C-band backscatter time series derived from Sentinel-1 a/b data, which was acquiredin Interferometric Wide swath mode with dual-polarization (VV- and VH-polarization) andascending and descending orbits, were used to map radar forest disturbances. Sentinel-1provides spatial resolutions of ~20 m and a temporal resolution of up to 6 days in thetropics [54]. Sentinel-1 synthetic aperture radar (SAR) ground range-detected (GRD) datafrom 2015 to 2020 were accessed via GEE. Prior to the ingestion in the GEE archive, severalpre-processing steps were applied, including apply orbit file, GRD border noise removal,thermal noise removal, radiometric calibration, terrain correction and geocoding [67].Additionally, we applied an angular-based radiometric slope correction [68], adaptivemultitemporal speckle filtering [69], conversion from linear to dB scale, resampling tothe 30 m Landsat grid and image normalization to mitigate dry season and droughteffects [38,66].
We used the Sentinel-1 backscatter time series additionally for validating the mappedradar forest disturbances, as there was no other freely available radar imagery with thesame necessary temporal resolution available.
Forests 2021, 12, 456 5 of 21
2.2.3. Active Fire Alerts
Daily active fire alerts from the VIIRS sensor onboard of Suomi National Polar-OrbitingPartnership (S-NPP) were obtained from NASA’s Fire Information for Resource Manage-ment System archive for the monitoring period [70]. The VIIRS S-NPP-V14IMGTDL_NRTproduct has a spatial resolution of 375 m and provides images twice a day. The well-established MODIS Fire and Thermal Anomalies product algorithm is used and adoptedfor the VIIRS active fire alerts generation [71]. Hereby, two thermal multispectral bandsof VIIRS are utilized to detect day and night time biomass burning [28]. The data weredownloaded and resampled to the 30 m Landsat grid.
2.2.4. Forest Baseline Map
We generated a forest baseline map for the beginning of the monitoring period follow-ing the Indonesian forest ministry’s definition of forest with at least 30% forest coverageand a minimum patch size of 0.25 ha. We used the Indonesian land cover map of 2017 [53]and updated areas classified as primary, secondary and plantation forest (excluding man-grove forest) by removing pixels indicating tree cover below 30% for 2000 and tree coverlosses between 2001–2017 in the Hansen products [52] to reduce inconsistencies in theland cover map. Additionally, forest pixels indicating slopes greater than 15 degrees inthe SRTM DEM were rejected to exclude potential geometrical artefacts in the radar forestdisturbance map.
2.3. Methods
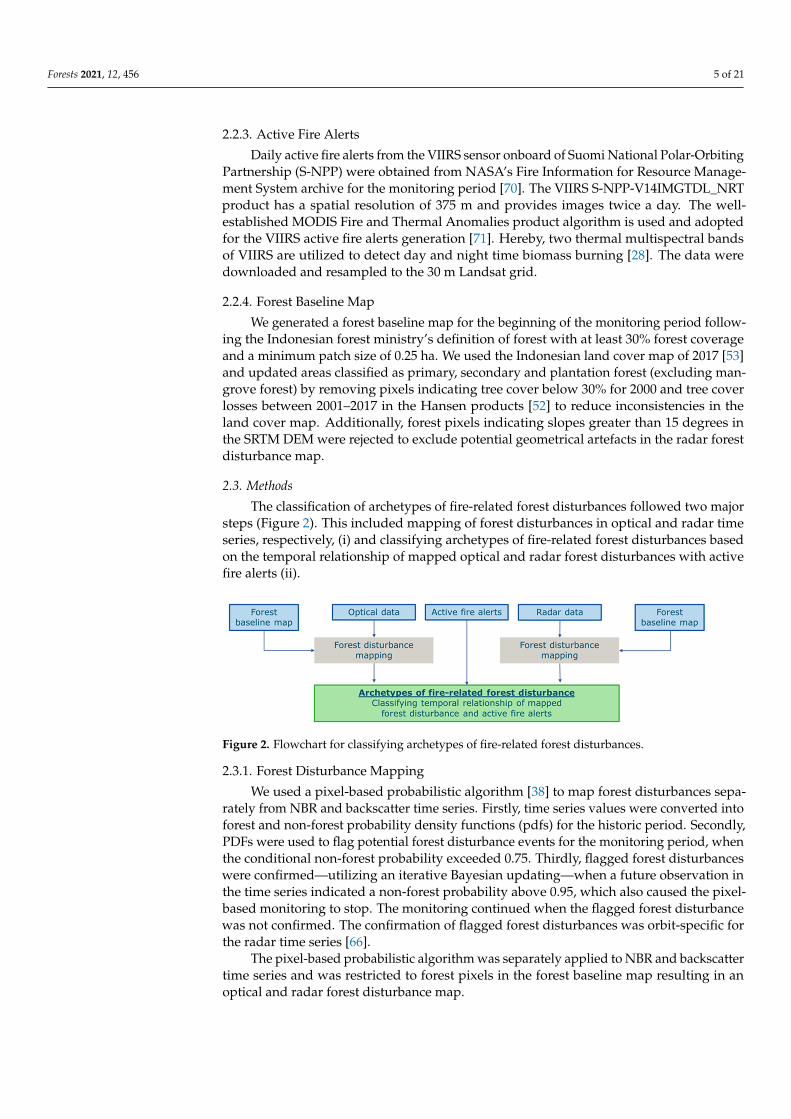
The classification of archetypes of fire-related forest disturbances followed two majorsteps (Figure 2). This included mapping of forest disturbances in optical and radar timeseries, respectively, (i) and classifying archetypes of fire-related forest disturbances basedon the temporal relationship of mapped optical and radar forest disturbances with activefire alerts (ii).
Figure 2. Flowchart for classifying archetypes of fire-related forest disturbances.
2.3.1. Forest Disturbance Mapping
We used a pixel-based probabilistic algorithm [38] to map forest disturbances sepa-rately from NBR and backscatter time series. Firstly, time series values were converted intoforest and non-forest probability density functions (pdfs) for the historic period. Secondly,PDFs were used to flag potential forest disturbance events for the monitoring period, whenthe conditional non-forest probability exceeded 0.75. Thirdly, flagged forest disturbanceswere confirmed—utilizing an iterative Bayesian updating—when a future observation inthe time series indicated a non-forest probability above 0.95, which also caused the pixel-based monitoring to stop. The monitoring continued when the flagged forest disturbancewas not confirmed. The confirmation of flagged forest disturbances was orbit-specific forthe radar time series [66].
The pixel-based probabilistic algorithm was separately applied to NBR and backscattertime series and was restricted to forest pixels in the forest baseline map resulting in anoptical and radar forest disturbance map.
Forests 2021, 12, 456 6 of 21
2.3.2. Validation of Forest Disturbance Maps
The validation of the forest disturbance maps was restricted to pixels co-located withactive fire alerts to focus on fire-related forest disturbances and was carried out separatelyfor the optical and radar forest disturbance maps. We additionally included forest pixels ofthe forest baseline map within a buffer zone of 375 m around fire affected pixels to targetomission errors [72]. A probability sampling [73] was carried out resulting in a total of1059 sample points [74] over four sample strata classes. The four strata sample classeswere: stable forest (i), optical and radar forest disturbance (ii), optical forest disturbance (iii) andradar forest disturbance (iv). Stable forest was defined as absent forest disturbances in bothoptical and radar forest disturbance maps. Optical and radar forest disturbance was defined asforest disturbances detected in both maps. Optical forest disturbance/radar forest disturbancewere defined as forest disturbances mapped in either only optical or radar time series,respectively. The samples were allocated proportionally to the strata areas of the classes.The selected samples were used for validating both optical and radar forest disturbancemaps. Samples of the strata class optical forest disturbance or radar forest disturbance weretreated as stable forest if not mapped in either time series. A visual interpretation ofmonthly PlanetScope image mosaics was utilized to validate the optical forest disturbances,while the initial Sentinel-1 backscatter time series was used for the radar forest disturbances.The separate validation of optical and radar forest disturbance maps was carried out toaccount for sensor-specific capabilities and sensitivities to map forest disturbances.
The forest baseline map was based on a land cover map, a tree cover product andannual tree cover loss products all utilizing Landsat data and showing typical error sourcesof optical data due to environmental influences (e.g., cloud coverage, etc.). Forest distur-bances missed due to an error of the forest baseline map were labelled as “error forestbaseline map”, but not reported as false detections (commission error). Boundary pixelscan similarly be ambiguous and cause problems when validating higher spatial resolutionforest disturbances [75]. We labelled these cases as “boundary pixels” but did not reportthem as false detections.
The validated samples were used to create a confusion matrix and to calculate user’s(commission error) and producer’s accuracies (omission error) for areas of the optical andradar disturbance maps co-located with active fire alerts, respectively.
2.3.3. Classification of Archetypes of Fire-Related Forest Disturbances
We used the temporal relationship of mapped optical and radar disturbances and co-located active fire alerts to classify archetypes of fire-related forest disturbances. Active firealerts were used to label both optical and radar mapped disturbances predating, coincidingor postdating detected fires. The labeling was based on a pixel-wise time span defined bytwo observations in either the optical or radar time series before the mapped optical orradar disturbance dates. The time span was orbit-specific for the radar time series. If adate of an active fire alert fell within the time span of a forest disturbance, it was markedas coinciding, regardless of active fire alerts occurring before or after the disturbancedate. In case of multiple active fire alerts being present before and after the time span, thetemporally closest active fire alert was used.
Next, the temporal relationships of optical and radar disturbances with active firealerts were used to identify so-called archetypes of fire-related forest disturbances (Table 2).Fire-related forest disturbances can be understood as mapped forest disturbances andactive fire alerts co-located and temporally coinciding within the monitoring period. Ourarchetypes contain information on the temporal relationship between detected forestdisturbances and active fire alerts, as well as different magnitudes of fire-related forestdisturbances resulting from the different sensitivities of optical and radar data towardschanges in tree cover. Mapped forest disturbances absent of active fire alerts were seenas non-fire-related forest disturbances and, hence, were not included in the archetypeclassification. Similarly, optical and radar disturbances exclusively postdating active firealerts were not included and rejected as non-fire-related forest disturbances. Hereby, the
Forests 2021, 12, 456 7 of 21
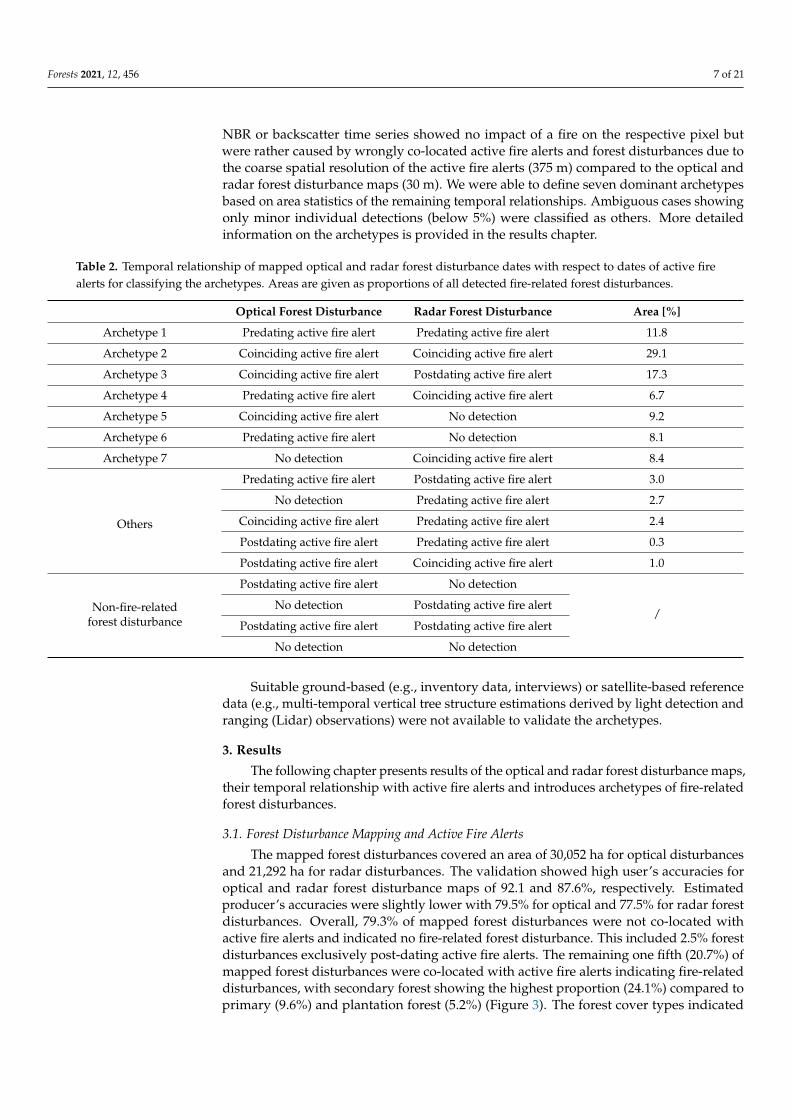
NBR or backscatter time series showed no impact of a fire on the respective pixel butwere rather caused by wrongly co-located active fire alerts and forest disturbances due tothe coarse spatial resolution of the active fire alerts (375 m) compared to the optical andradar forest disturbance maps (30 m). We were able to define seven dominant archetypesbased on area statistics of the remaining temporal relationships. Ambiguous cases showingonly minor individual detections (below 5%) were classified as others. More detailedinformation on the archetypes is provided in the results chapter.
Table 2. Temporal relationship of mapped optical and radar forest disturbance dates with respect to dates of active firealerts for classifying the archetypes. Areas are given as proportions of all detected fire-related forest disturbances.
Optical Forest Disturbance Radar Forest Disturbance Area [%]
Archetype 1 Predating active fire alert Predating active fire alert 11.8
Archetype 2 Coinciding active fire alert Coinciding active fire alert 29.1
Archetype 3 Coinciding active fire alert Postdating active fire alert 17.3
Archetype 4 Predating active fire alert Coinciding active fire alert 6.7
Archetype 5 Coinciding active fire alert No detection 9.2
Archetype 6 Predating active fire alert No detection 8.1
Archetype 7 No detection Coinciding active fire alert 8.4
Others
Predating active fire alert Postdating active fire alert 3.0
No detection Predating active fire alert 2.7
Coinciding active fire alert Predating active fire alert 2.4
Postdating active fire alert Predating active fire alert 0.3
Postdating active fire alert Coinciding active fire alert 1.0
Non-fire-relatedforest disturbance
Postdating active fire alert No detection
/No detection Postdating active fire alert
Postdating active fire alert Postdating active fire alert
No detection No detection
Suitable ground-based (e.g., inventory data, interviews) or satellite-based referencedata (e.g., multi-temporal vertical tree structure estimations derived by light detection andranging (Lidar) observations) were not available to validate the archetypes.
3. Results
The following chapter presents results of the optical and radar forest disturbance maps,their temporal relationship with active fire alerts and introduces archetypes of fire-relatedforest disturbances.
3.1. Forest Disturbance Mapping and Active Fire Alerts
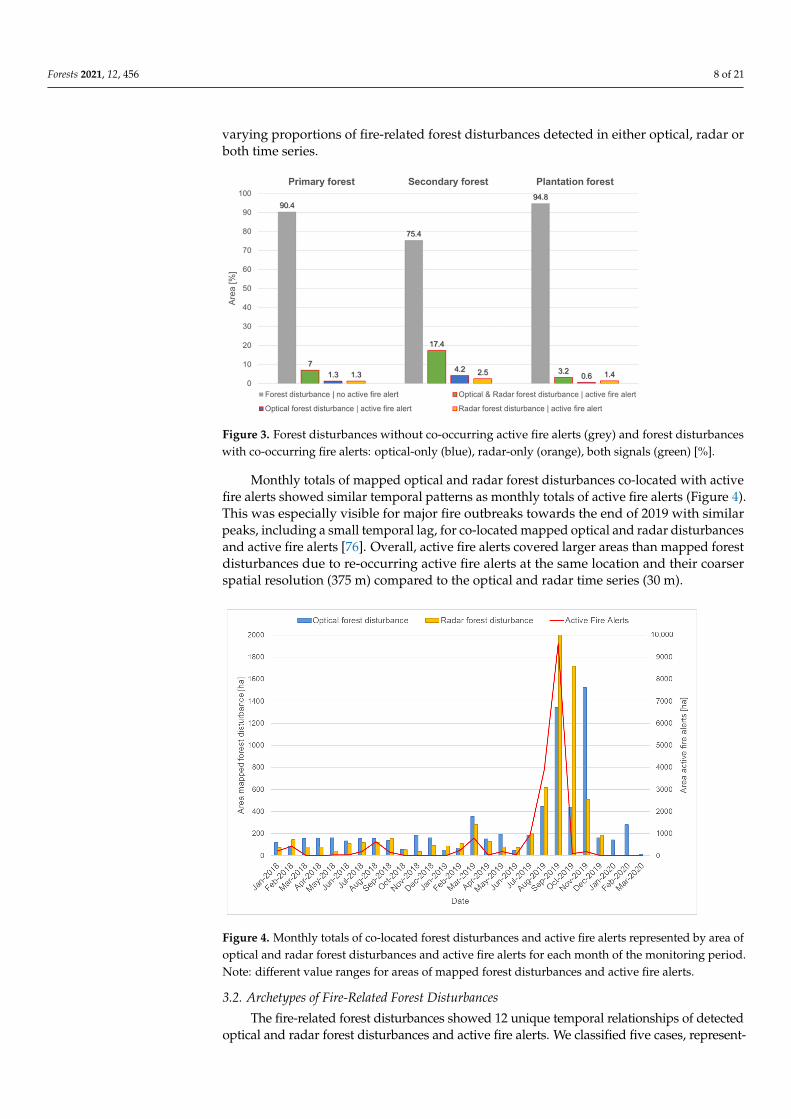
The mapped forest disturbances covered an area of 30,052 ha for optical disturbancesand 21,292 ha for radar disturbances. The validation showed high user’s accuracies foroptical and radar forest disturbance maps of 92.1 and 87.6%, respectively. Estimatedproducer’s accuracies were slightly lower with 79.5% for optical and 77.5% for radar forestdisturbances. Overall, 79.3% of mapped forest disturbances were not co-located withactive fire alerts and indicated no fire-related forest disturbance. This included 2.5% forestdisturbances exclusively post-dating active fire alerts. The remaining one fifth (20.7%) ofmapped forest disturbances were co-located with active fire alerts indicating fire-relateddisturbances, with secondary forest showing the highest proportion (24.1%) compared toprimary (9.6%) and plantation forest (5.2%) (Figure 3). The forest cover types indicated
Forests 2021, 12, 456 8 of 21
varying proportions of fire-related forest disturbances detected in either optical, radar orboth time series.
Figure 3. Forest disturbances without co-occurring active fire alerts (grey) and forest disturbanceswith co-occurring fire alerts: optical-only (blue), radar-only (orange), both signals (green) [%].
Monthly totals of mapped optical and radar forest disturbances co-located with activefire alerts showed similar temporal patterns as monthly totals of active fire alerts (Figure 4).This was especially visible for major fire outbreaks towards the end of 2019 with similarpeaks, including a small temporal lag, for co-located mapped optical and radar disturbancesand active fire alerts [76]. Overall, active fire alerts covered larger areas than mapped forestdisturbances due to re-occurring active fire alerts at the same location and their coarserspatial resolution (375 m) compared to the optical and radar time series (30 m).
1
Figure 4
Figure 4. Monthly totals of co-located forest disturbances and active fire alerts represented by area ofoptical and radar forest disturbances and active fire alerts for each month of the monitoring period.Note: different value ranges for areas of mapped forest disturbances and active fire alerts.
3.2. Archetypes of Fire-Related Forest Disturbances
The fire-related forest disturbances showed 12 unique temporal relationships of detectedoptical and radar forest disturbances and active fire alerts. We classified five cases, represent-
Forests 2021, 12, 456 9 of 21
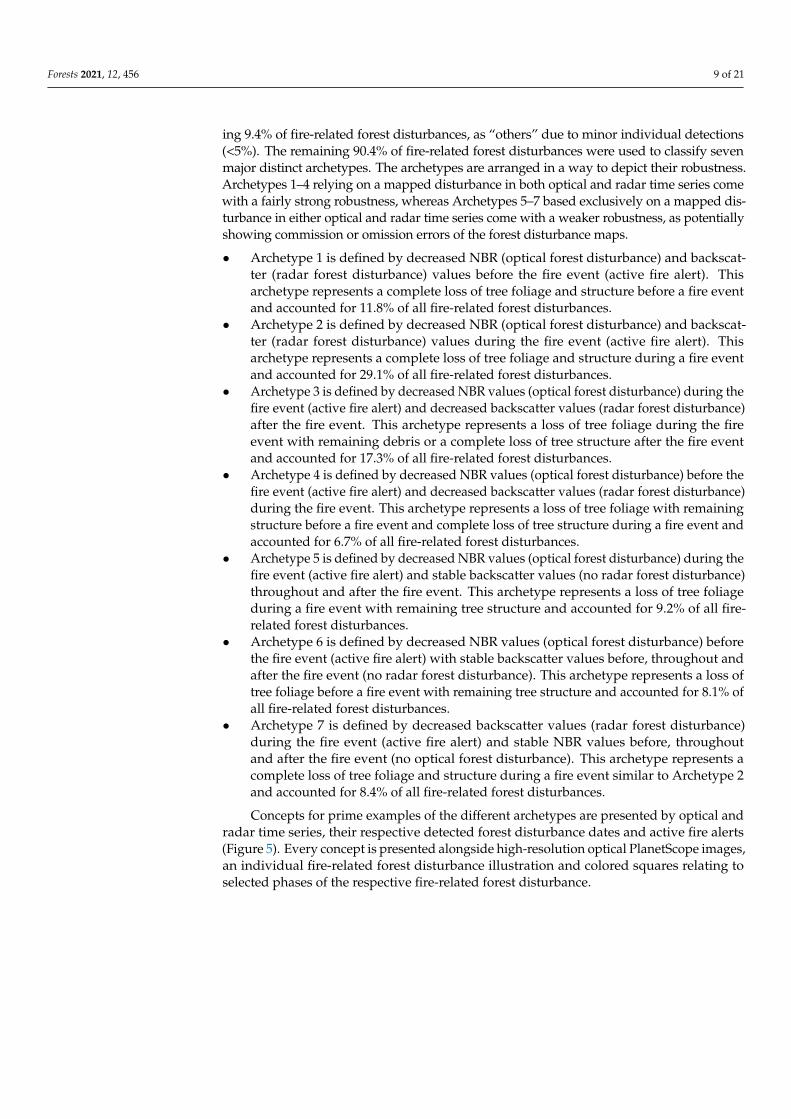
ing 9.4% of fire-related forest disturbances, as “others” due to minor individual detections(<5%). The remaining 90.4% of fire-related forest disturbances were used to classify sevenmajor distinct archetypes. The archetypes are arranged in a way to depict their robustness.Archetypes 1–4 relying on a mapped disturbance in both optical and radar time series comewith a fairly strong robustness, whereas Archetypes 5–7 based exclusively on a mapped dis-turbance in either optical and radar time series come with a weaker robustness, as potentiallyshowing commission or omission errors of the forest disturbance maps.
• Archetype 1 is defined by decreased NBR (optical forest disturbance) and backscat-ter (radar forest disturbance) values before the fire event (active fire alert). Thisarchetype represents a complete loss of tree foliage and structure before a fire eventand accounted for 11.8% of all fire-related forest disturbances.
• Archetype 2 is defined by decreased NBR (optical forest disturbance) and backscat-ter (radar forest disturbance) values during the fire event (active fire alert). Thisarchetype represents a complete loss of tree foliage and structure during a fire eventand accounted for 29.1% of all fire-related forest disturbances.
• Archetype 3 is defined by decreased NBR values (optical forest disturbance) during thefire event (active fire alert) and decreased backscatter values (radar forest disturbance)after the fire event. This archetype represents a loss of tree foliage during the fireevent with remaining debris or a complete loss of tree structure after the fire eventand accounted for 17.3% of all fire-related forest disturbances.
• Archetype 4 is defined by decreased NBR values (optical forest disturbance) before thefire event (active fire alert) and decreased backscatter values (radar forest disturbance)during the fire event. This archetype represents a loss of tree foliage with remainingstructure before a fire event and complete loss of tree structure during a fire event andaccounted for 6.7% of all fire-related forest disturbances.
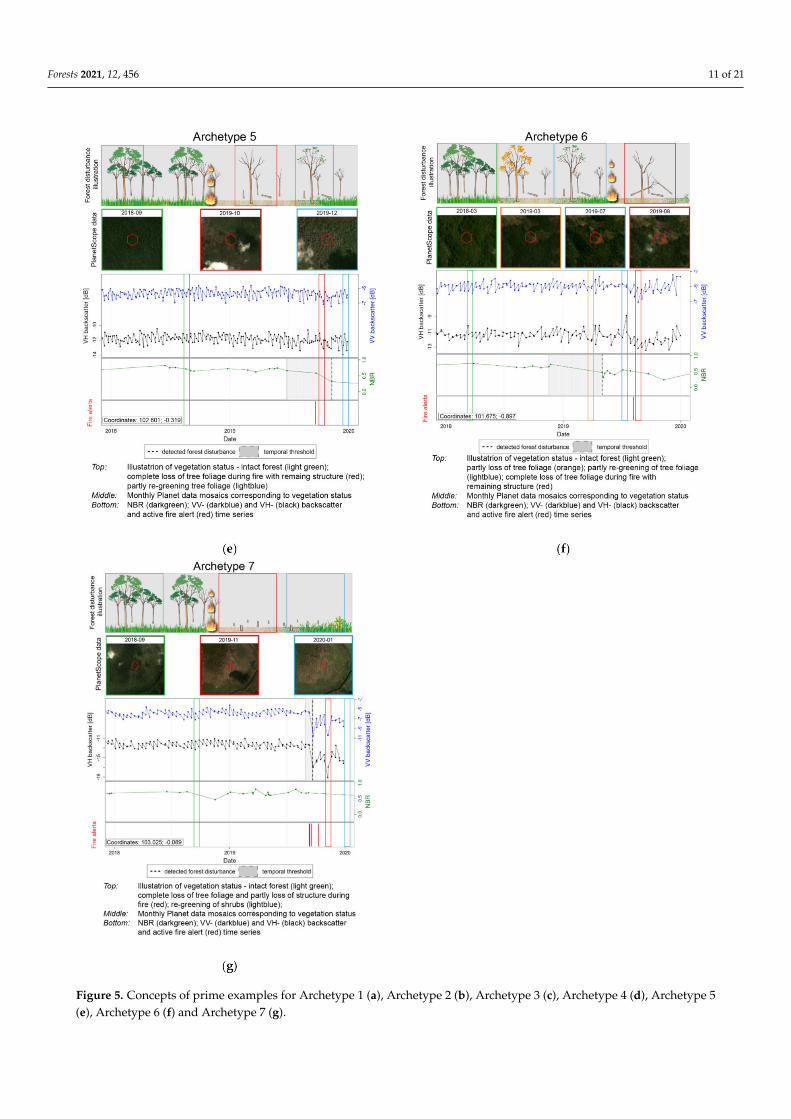
• Archetype 5 is defined by decreased NBR values (optical forest disturbance) during thefire event (active fire alert) and stable backscatter values (no radar forest disturbance)throughout and after the fire event. This archetype represents a loss of tree foliageduring a fire event with remaining tree structure and accounted for 9.2% of all fire-related forest disturbances.
• Archetype 6 is defined by decreased NBR values (optical forest disturbance) beforethe fire event (active fire alert) with stable backscatter values before, throughout andafter the fire event (no radar forest disturbance). This archetype represents a loss oftree foliage before a fire event with remaining tree structure and accounted for 8.1% ofall fire-related forest disturbances.
• Archetype 7 is defined by decreased backscatter values (radar forest disturbance)during the fire event (active fire alert) and stable NBR values before, throughoutand after the fire event (no optical forest disturbance). This archetype represents acomplete loss of tree foliage and structure during a fire event similar to Archetype 2and accounted for 8.4% of all fire-related forest disturbances.
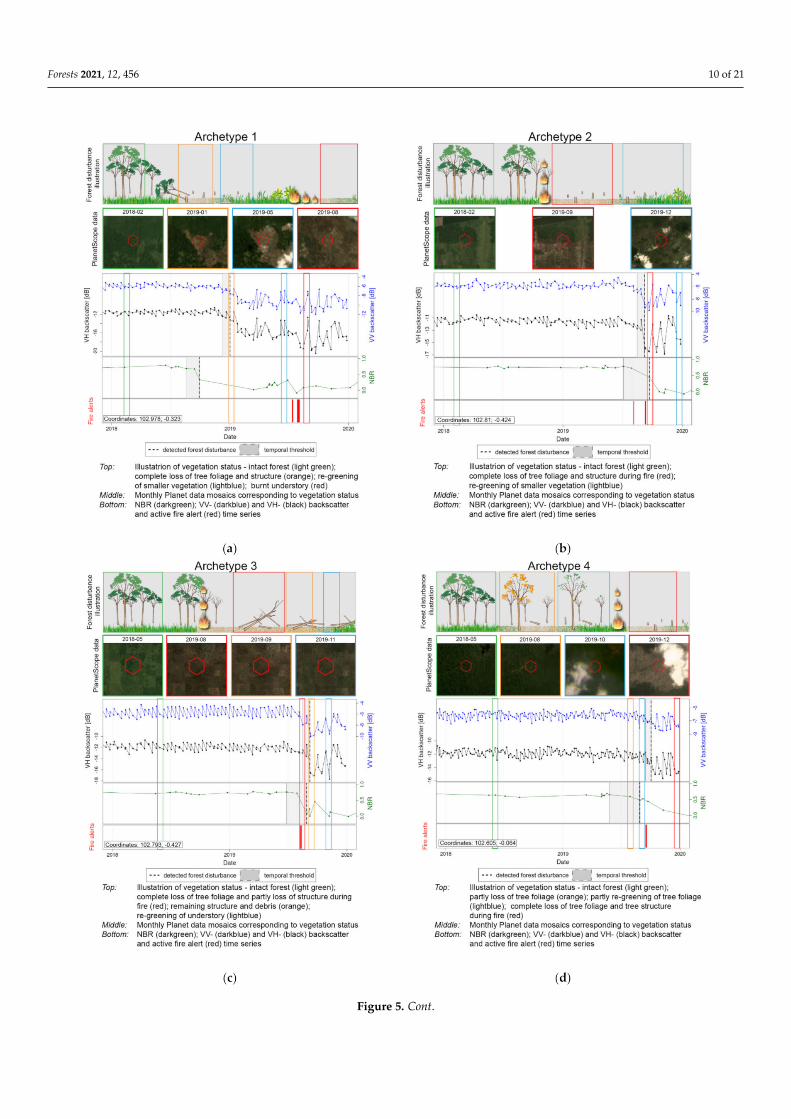
Concepts for prime examples of the different archetypes are presented by optical andradar time series, their respective detected forest disturbance dates and active fire alerts(Figure 5). Every concept is presented alongside high-resolution optical PlanetScope images,an individual fire-related forest disturbance illustration and colored squares relating toselected phases of the respective fire-related forest disturbance.
Forests 2021, 12, 456 10 of 21
Figure 5. Cont.
Forests 2021, 12, 456 11 of 21
Figure 5. Concepts of prime examples for Archetype 1 (a), Archetype 2 (b), Archetype 3 (c), Archetype 4 (d), Archetype 5(e), Archetype 6 (f) and Archetype 7 (g).
Forests 2021, 12, 456 12 of 21
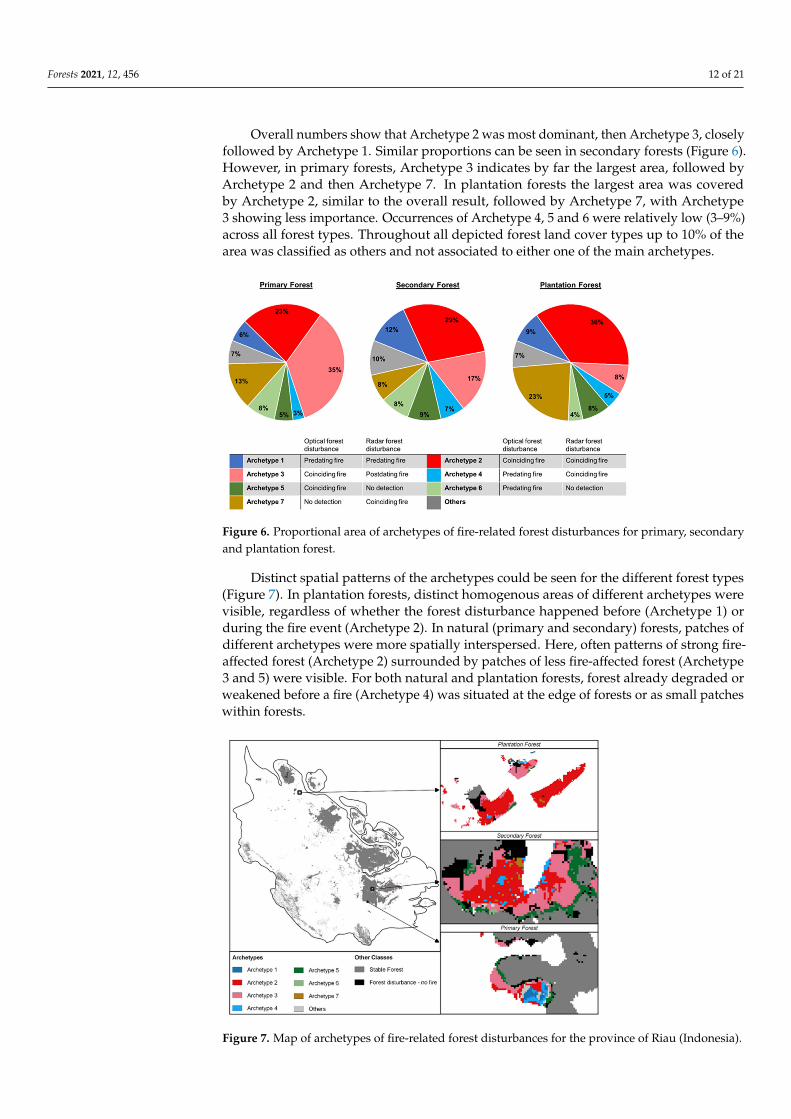
Overall numbers show that Archetype 2 was most dominant, then Archetype 3, closelyfollowed by Archetype 1. Similar proportions can be seen in secondary forests (Figure 6).However, in primary forests, Archetype 3 indicates by far the largest area, followed byArchetype 2 and then Archetype 7. In plantation forests the largest area was coveredby Archetype 2, similar to the overall result, followed by Archetype 7, with Archetype3 showing less importance. Occurrences of Archetype 4, 5 and 6 were relatively low (3–9%)across all forest types. Throughout all depicted forest land cover types up to 10% of thearea was classified as others and not associated to either one of the main archetypes.
Figure 6. Proportional area of archetypes of fire-related forest disturbances for primary, secondaryand plantation forest.
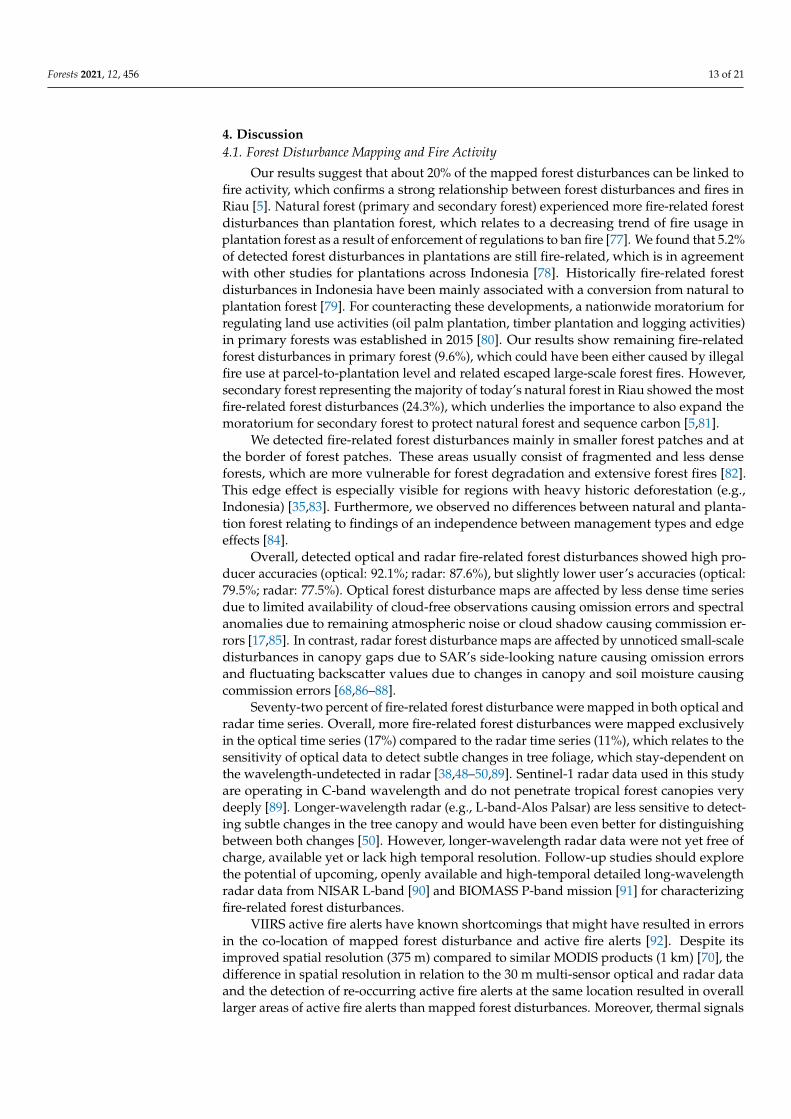
Distinct spatial patterns of the archetypes could be seen for the different forest types(Figure 7). In plantation forests, distinct homogenous areas of different archetypes werevisible, regardless of whether the forest disturbance happened before (Archetype 1) orduring the fire event (Archetype 2). In natural (primary and secondary) forests, patches ofdifferent archetypes were more spatially interspersed. Here, often patterns of strong fire-affected forest (Archetype 2) surrounded by patches of less fire-affected forest (Archetype3 and 5) were visible. For both natural and plantation forests, forest already degraded orweakened before a fire (Archetype 4) was situated at the edge of forests or as small patcheswithin forests.
Figure 7. Map of archetypes of fire-related forest disturbances for the province of Riau (Indonesia).
Forests 2021, 12, 456 13 of 21
4. Discussion4.1. Forest Disturbance Mapping and Fire Activity
Our results suggest that about 20% of the mapped forest disturbances can be linked tofire activity, which confirms a strong relationship between forest disturbances and fires inRiau [5]. Natural forest (primary and secondary forest) experienced more fire-related forestdisturbances than plantation forest, which relates to a decreasing trend of fire usage inplantation forest as a result of enforcement of regulations to ban fire [77]. We found that 5.2%of detected forest disturbances in plantations are still fire-related, which is in agreementwith other studies for plantations across Indonesia [78]. Historically fire-related forestdisturbances in Indonesia have been mainly associated with a conversion from natural toplantation forest [79]. For counteracting these developments, a nationwide moratorium forregulating land use activities (oil palm plantation, timber plantation and logging activities)in primary forests was established in 2015 [80]. Our results show remaining fire-relatedforest disturbances in primary forest (9.6%), which could have been either caused by illegalfire use at parcel-to-plantation level and related escaped large-scale forest fires. However,secondary forest representing the majority of today’s natural forest in Riau showed the mostfire-related forest disturbances (24.3%), which underlies the importance to also expand themoratorium for secondary forest to protect natural forest and sequence carbon [5,81].
We detected fire-related forest disturbances mainly in smaller forest patches and atthe border of forest patches. These areas usually consist of fragmented and less denseforests, which are more vulnerable for forest degradation and extensive forest fires [82].This edge effect is especially visible for regions with heavy historic deforestation (e.g.,Indonesia) [35,83]. Furthermore, we observed no differences between natural and planta-tion forest relating to findings of an independence between management types and edgeeffects [84].
Overall, detected optical and radar fire-related forest disturbances showed high pro-ducer accuracies (optical: 92.1%; radar: 87.6%), but slightly lower user’s accuracies (optical:79.5%; radar: 77.5%). Optical forest disturbance maps are affected by less dense time seriesdue to limited availability of cloud-free observations causing omission errors and spectralanomalies due to remaining atmospheric noise or cloud shadow causing commission er-rors [17,85]. In contrast, radar forest disturbance maps are affected by unnoticed small-scaledisturbances in canopy gaps due to SAR’s side-looking nature causing omission errorsand fluctuating backscatter values due to changes in canopy and soil moisture causingcommission errors [68,86–88].
Seventy-two percent of fire-related forest disturbance were mapped in both optical andradar time series. Overall, more fire-related forest disturbances were mapped exclusivelyin the optical time series (17%) compared to the radar time series (11%), which relates to thesensitivity of optical data to detect subtle changes in tree foliage, which stay-dependent onthe wavelength-undetected in radar [38,48–50,89]. Sentinel-1 radar data used in this studyare operating in C-band wavelength and do not penetrate tropical forest canopies verydeeply [89]. Longer-wavelength radar (e.g., L-band-Alos Palsar) are less sensitive to detect-ing subtle changes in the tree canopy and would have been even better for distinguishingbetween both changes [50]. However, longer-wavelength radar data were not yet free ofcharge, available yet or lack high temporal resolution. Follow-up studies should explorethe potential of upcoming, openly available and high-temporal detailed long-wavelengthradar data from NISAR L-band [90] and BIOMASS P-band mission [91] for characterizingfire-related forest disturbances.
VIIRS active fire alerts have known shortcomings that might have resulted in errorsin the co-location of mapped forest disturbance and active fire alerts [92]. Despite itsimproved spatial resolution (375 m) compared to similar MODIS products (1 km) [70], thedifference in spatial resolution in relation to the 30 m multi-sensor optical and radar dataand the detection of re-occurring active fire alerts at the same location resulted in overalllarger areas of active fire alerts than mapped forest disturbances. Moreover, thermal signals
Forests 2021, 12, 456 14 of 21
are very short-lived, which makes it impossible to detect past fires and also results in highomission errors of the active fire alerts [28].
4.2. Archetypes of Fire-Related Forest Disturbances
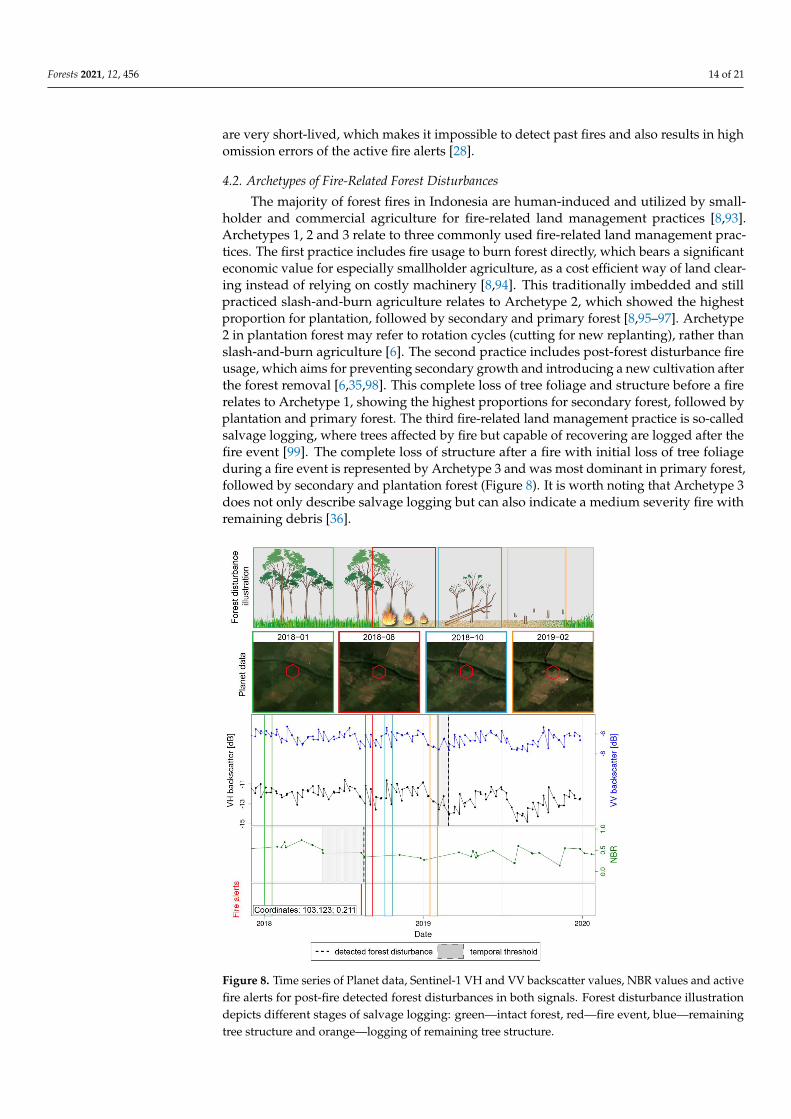
The majority of forest fires in Indonesia are human-induced and utilized by small-holder and commercial agriculture for fire-related land management practices [8,93].Archetypes 1, 2 and 3 relate to three commonly used fire-related land management prac-tices. The first practice includes fire usage to burn forest directly, which bears a significanteconomic value for especially smallholder agriculture, as a cost efficient way of land clear-ing instead of relying on costly machinery [8,94]. This traditionally imbedded and stillpracticed slash-and-burn agriculture relates to Archetype 2, which showed the highestproportion for plantation, followed by secondary and primary forest [8,95–97]. Archetype2 in plantation forest may refer to rotation cycles (cutting for new replanting), rather thanslash-and-burn agriculture [6]. The second practice includes post-forest disturbance fireusage, which aims for preventing secondary growth and introducing a new cultivation afterthe forest removal [6,35,98]. This complete loss of tree foliage and structure before a firerelates to Archetype 1, showing the highest proportions for secondary forest, followed byplantation and primary forest. The third fire-related land management practice is so-calledsalvage logging, where trees affected by fire but capable of recovering are logged after thefire event [99]. The complete loss of structure after a fire with initial loss of tree foliageduring a fire event is represented by Archetype 3 and was most dominant in primary forest,followed by secondary and plantation forest (Figure 8). It is worth noting that Archetype 3does not only describe salvage logging but can also indicate a medium severity fire withremaining debris [36].
9
Figure 8 Figure 8. Time series of Planet data, Sentinel-1 VH and VV backscatter values, NBR values and activefire alerts for post-fire detected forest disturbances in both signals. Forest disturbance illustrationdepicts different stages of salvage logging: green—intact forest, red—fire event, blue—remainingtree structure and orange—logging of remaining tree structure.
Forests 2021, 12, 456 15 of 21
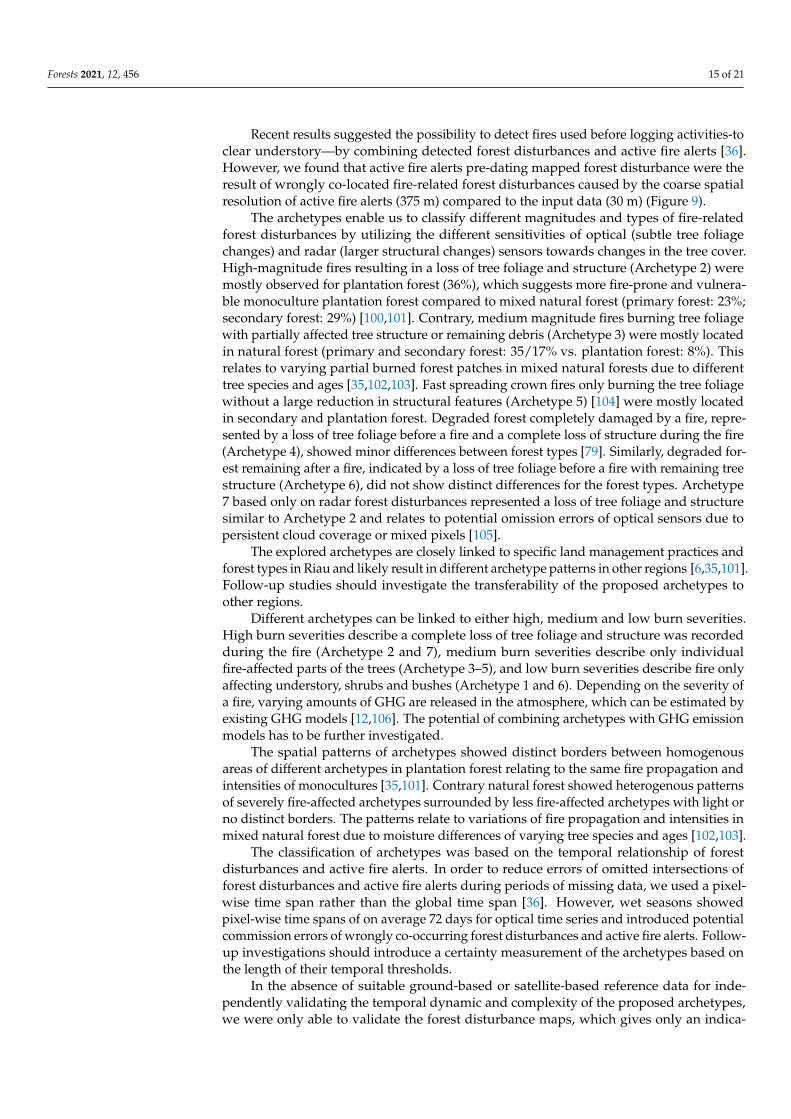
Recent results suggested the possibility to detect fires used before logging activities-toclear understory—by combining detected forest disturbances and active fire alerts [36].However, we found that active fire alerts pre-dating mapped forest disturbance were theresult of wrongly co-located fire-related forest disturbances caused by the coarse spatialresolution of active fire alerts (375 m) compared to the input data (30 m) (Figure 9).
The archetypes enable us to classify different magnitudes and types of fire-relatedforest disturbances by utilizing the different sensitivities of optical (subtle tree foliagechanges) and radar (larger structural changes) sensors towards changes in the tree cover.High-magnitude fires resulting in a loss of tree foliage and structure (Archetype 2) weremostly observed for plantation forest (36%), which suggests more fire-prone and vulnera-ble monoculture plantation forest compared to mixed natural forest (primary forest: 23%;secondary forest: 29%) [100,101]. Contrary, medium magnitude fires burning tree foliagewith partially affected tree structure or remaining debris (Archetype 3) were mostly locatedin natural forest (primary and secondary forest: 35/17% vs. plantation forest: 8%). Thisrelates to varying partial burned forest patches in mixed natural forests due to differenttree species and ages [35,102,103]. Fast spreading crown fires only burning the tree foliagewithout a large reduction in structural features (Archetype 5) [104] were mostly locatedin secondary and plantation forest. Degraded forest completely damaged by a fire, repre-sented by a loss of tree foliage before a fire and a complete loss of structure during the fire(Archetype 4), showed minor differences between forest types [79]. Similarly, degraded for-est remaining after a fire, indicated by a loss of tree foliage before a fire with remaining treestructure (Archetype 6), did not show distinct differences for the forest types. Archetype7 based only on radar forest disturbances represented a loss of tree foliage and structuresimilar to Archetype 2 and relates to potential omission errors of optical sensors due topersistent cloud coverage or mixed pixels [105].
The explored archetypes are closely linked to specific land management practices andforest types in Riau and likely result in different archetype patterns in other regions [6,35,101].Follow-up studies should investigate the transferability of the proposed archetypes toother regions.
Different archetypes can be linked to either high, medium and low burn severities.High burn severities describe a complete loss of tree foliage and structure was recordedduring the fire (Archetype 2 and 7), medium burn severities describe only individualfire-affected parts of the trees (Archetype 3–5), and low burn severities describe fire onlyaffecting understory, shrubs and bushes (Archetype 1 and 6). Depending on the severity ofa fire, varying amounts of GHG are released in the atmosphere, which can be estimated byexisting GHG models [12,106]. The potential of combining archetypes with GHG emissionmodels has to be further investigated.
The spatial patterns of archetypes showed distinct borders between homogenousareas of different archetypes in plantation forest relating to the same fire propagation andintensities of monocultures [35,101]. Contrary natural forest showed heterogenous patternsof severely fire-affected archetypes surrounded by less fire-affected archetypes with light orno distinct borders. The patterns relate to variations of fire propagation and intensities inmixed natural forest due to moisture differences of varying tree species and ages [102,103].
The classification of archetypes was based on the temporal relationship of forestdisturbances and active fire alerts. In order to reduce errors of omitted intersections offorest disturbances and active fire alerts during periods of missing data, we used a pixel-wise time span rather than the global time span [36]. However, wet seasons showedpixel-wise time spans of on average 72 days for optical time series and introduced potentialcommission errors of wrongly co-occurring forest disturbances and active fire alerts. Follow-up investigations should introduce a certainty measurement of the archetypes based onthe length of their temporal thresholds.
In the absence of suitable ground-based or satellite-based reference data for inde-pendently validating the temporal dynamic and complexity of the proposed archetypes,we were only able to validate the forest disturbance maps, which gives only an indica-
Forests 2021, 12, 456 16 of 21
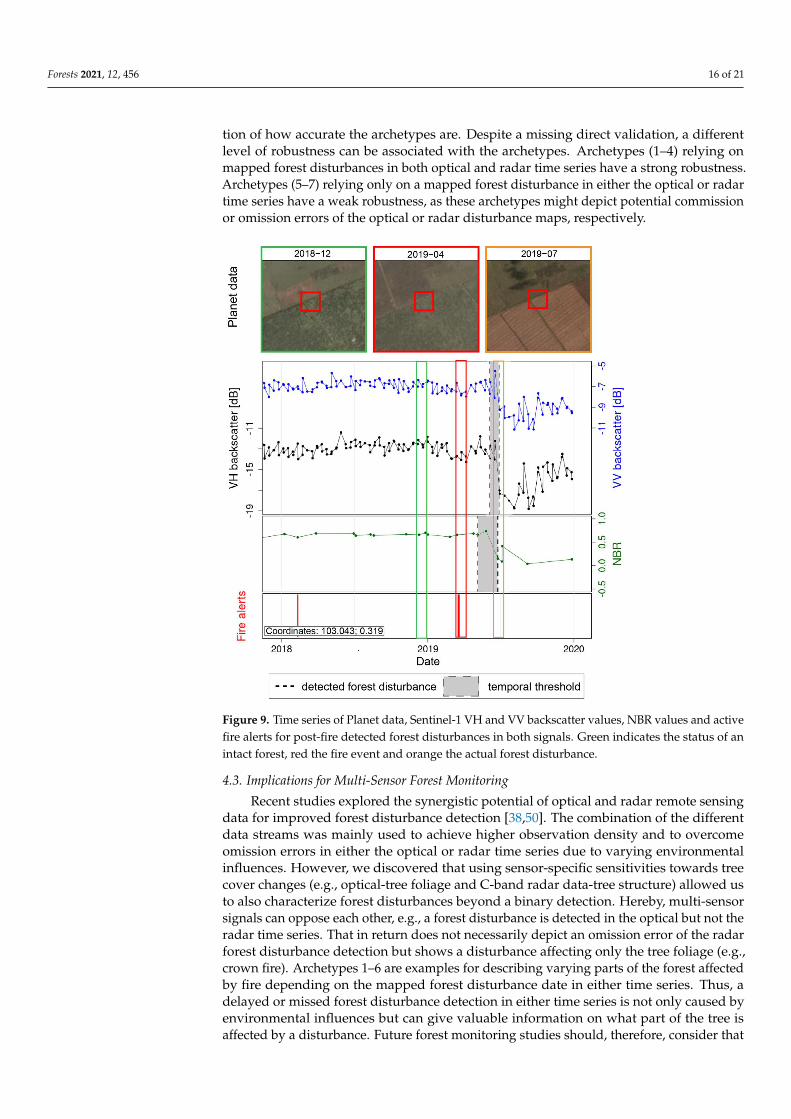
tion of how accurate the archetypes are. Despite a missing direct validation, a differentlevel of robustness can be associated with the archetypes. Archetypes (1–4) relying onmapped forest disturbances in both optical and radar time series have a strong robustness.Archetypes (5–7) relying only on a mapped forest disturbance in either the optical or radartime series have a weak robustness, as these archetypes might depict potential commissionor omission errors of the optical or radar disturbance maps, respectively.
10
Figure 9 Figure 9. Time series of Planet data, Sentinel-1 VH and VV backscatter values, NBR values and activefire alerts for post-fire detected forest disturbances in both signals. Green indicates the status of anintact forest, red the fire event and orange the actual forest disturbance.
4.3. Implications for Multi-Sensor Forest Monitoring
Recent studies explored the synergistic potential of optical and radar remote sensingdata for improved forest disturbance detection [38,50]. The combination of the differentdata streams was mainly used to achieve higher observation density and to overcomeomission errors in either the optical or radar time series due to varying environmentalinfluences. However, we discovered that using sensor-specific sensitivities towards treecover changes (e.g., optical-tree foliage and C-band radar data-tree structure) allowed usto also characterize forest disturbances beyond a binary detection. Hereby, multi-sensorsignals can oppose each other, e.g., a forest disturbance is detected in the optical but not theradar time series. That in return does not necessarily depict an omission error of the radarforest disturbance detection but shows a disturbance affecting only the tree foliage (e.g.,crown fire). Archetypes 1–6 are examples for describing varying parts of the forest affectedby fire depending on the mapped forest disturbance date in either time series. Thus, adelayed or missed forest disturbance detection in either time series is not only caused byenvironmental influences but can give valuable information on what part of the tree isaffected by a disturbance. Future forest monitoring studies should, therefore, consider that
Forests 2021, 12, 456 17 of 21
a straightforward combination of optical and radar observations on a data level potentiallyintroduces artefacts.
5. Conclusions
This study explored archetypes of fire-related forest disturbances derived from densemulti-sensor optical and radar satellite time series and active fire alerts. The archetypesrepresent the temporal relationship of detected optical and radar-based forest disturbanceswith active fire alerts and relate to fire-related forest and land use management practicesand constitute a novel approach for burn severity mapping. Archetype-based burn severi-ties might function as a proxy to improve existing GHG emission models. Archetypes cangive more temporally and spatially detailed insights into fire-related forest disturbances,which can support policy development, local and regional forest management and lawenforcement to reduce illegal fire usage in the tropics. This study emphasized the unprece-dented value of openly available dense Landsat/Sentinel-2 optical and Sentinel-1 radartime series for characterizing fire-related forest disturbances. The integration of denseoptical and radar satellite data with vertical forest structure information form GEDI, andupcoming long-wavelength radar missions (NISAR: L-band and Biomass mission: P-band)promises to further study how fire activities and forest disturbances are related.
Author Contributions: Conceptualization, J.B., J.R., J.V. and M.H.; methodology, J.B., J.R. and J.V.;validation, J.B.; investigation, J.B.; writing—original draft preparation, J.B.; writing—review andediting, J.R., V.D.S. and M.H.; visualization, J.B.; supervision, J.R., J.V., V.D.S. and M.H.; projectadministration, J.R. and J.V.; funding acquisition, J.V., J.R. and M.H. All authors have read and agreedto the published version of the manuscript.
Funding: This research was funded via the STW Big-EO-Analytics project funded by NederlandseOrganisatie voor Wetenschappelijk Onderzoek (NWO).
Data Availability Statement: The data and results of this study are available upon reasonable request.Please contact the main author of this publication.
Acknowledgments: Valuable feedback and input was given from the User Committee within theBig-EO-Analytics project, which helped improving and finalizing this research. This study containsmodified Copernicus Sentinel-1 and Sentinel-2 data [2015–2020]. Planet data were provided throughthe Planet ambassador program. We thank the two anonymous reviewers for their valuable com-ments.
Conflicts of Interest: The authors declare no conflict of interest. The funders had no role in the designof the study; in the collection, analyses or interpretation of data; in the writing of the manuscript orin the decision to publish the results.
References1. Harris, N.L.; Gibbs, D.A.; Baccini, A.; Birdsey, R.A.; de Bruin, S.; Farina, M.; Fatoyinbo, L.; Hansen, M.C.; Herold, M.; Houghton,
R.A.; et al. Global maps of twenty-first century forest carbon fluxes. Nat. Clim. Chang. 2021, 11, 234–240. [CrossRef]2. Henriques, S.T.; Borowiecki, K.J. The drivers of long-run CO2 emissions in Europe, North America and Japan since 1800. Energy
Policy 2017, 101, 537–549. [CrossRef]3. Margono, B.A.; Potapov, P.V.; Turubanova, S.; Stolle, F.; Hansen, M.C. Primary forest cover loss in Indonesia over 2000–2012. Nat.
Clim. Chang. 2014, 4, 730–735. [CrossRef]4. Pramudya, E.P.; Hospes, O.; Termeer, C.J.A.M. The disciplining of illegal palm oil plantations in Sumatra. Third World Q. 2018, 39,
920–940. [CrossRef]5. Adrianto, H.A.; Spracklen, D.V.; Arnold, S.R.; Sitanggang, I.S.; Syaufina, L. Forest and Land Fires Are Mainly Associated with
Deforestation in Riau Province, Indonesia. Remote Sens. 2019, 12, 3. [CrossRef]6. Dennis, R.A.; Mayer, J.; Applegate, G.; Chokkalingam, U.; Colfer, C.J.P.; Kurniawan, I.; Lachowski, H.; Maus, P.; Permana, R.P.;
Ruchiat, Y.; et al. Fire, People and Pixels: Linking Social Science and Remote Sensing to Understand Underlying Causes andImpacts of Fires in Indonesia. Hum. Ecol. 2005, 33, 465–504. [CrossRef]
7. Fernández-García, V.; Santamarta, M.; Fernández-Manso, A.; Quintano, C.; Marcos, E.; Calvo, L. Burn severity metrics infire-prone pine ecosystems along a climatic gradient using Landsat imagery. Remote Sens. Environ. 2018, 206, 205–217. [CrossRef]
8. Purnomo, H.; Shantiko, B.; Sitorus, S.; Gunawan, H.; Achdiawan, R.; Kartodihardjo, H.; Dewayani, A.A. Fire economy and actornetwork of forest and land fires in Indonesia. For. Policy Econ. 2017, 78, 21–31. [CrossRef]
Forests 2021, 12, 456 18 of 21
9. Lohberger, S.; Stängel, M.; Atwood, E.C.; Siegert, F. Spatial evaluation of Indonesia’s 2015 fire-affected area and estimated carbonemissions using Sentinel-1. Glob. Chang. Biol. 2017, 24, 644–654. [CrossRef]
10. Bär, A.; Michaletz, S.T.; Mayr, S. Fire effects on tree physiology. New Phytol. 2019, 223, 1728–1741. [CrossRef]11. Houghton, R.A.; House, J.I.; Pongratz, J.; Van Der Werf, G.R.; DeFries, R.S.; Hansen, M.C.; Le Quéré, C.; Ramankutty, N. Carbon
emissions from land use and land-cover change. Biogeosciences 2012, 9, 5125–5142. [CrossRef]12. Van Der Werf, G.R.; Randerson, J.T.; Giglio, L.; Van Leeuwen, T.T.; Chen, Y.; Rogers, B.M.; Mu, M.; Van Marle, M.J.E.; Morton,
D.C.; Collatz, G.J.; et al. Global fire emissions estimates during 1997–2016. Earth Syst. Sci. Data 2017, 9, 697–720. [CrossRef]13. Asner, G.P. Painting the world REDD: Addressing scientific barriers to monitoring emissions from tropical forests. Environ. Res.
Lett. 2011, 6, 024005. [CrossRef]14. United Nations. Adoption of the Paris Agreement; United Nations: New York, NY, USA, 2015.15. Margono, B.A.; Usman, A.B.; Sugardiman, R.A. Indonesia’s Forest Resource Monitoring. Indones. J. Geogr. 2016, 48, 7. [CrossRef]16. Liu, T.; Mickley, L.J.; Marlier, M.E.; DeFries, R.S.; Khan, M.F.; Latif, M.T.; Karambelas, A. Diagnosing spatial biases and
uncertainties in global fire emissions inventories: Indonesia as regional case study. Remote Sens. Environ. 2020, 237, 111557.[CrossRef]
17. De Sy, V.; Herold, M.; Achard, F.; Asner, G.P.; Held, A.; Kellndorfer, J.; Verbesselt, J. Synergies of multiple remote sensing datasources for REDD+ monitoring. Curr. Opin. Environ. Sustain. 2012, 4, 696–706. [CrossRef]
18. Hansen, M.C.; Loveland, T.R. A review of large area monitoring of land cover change using Landsat data. Remote Sens. Environ.2012, 122, 66–74. [CrossRef]
19. Nguyen, T.H.; Jones, S.D.; Soto-Berelov, M.; Haywood, A.; Hislop, S. A spatial and temporal analysis of forest dynamics usingLandsat time-series. Remote Sens. Environ. 2018, 217, 461–475. [CrossRef]
20. Verbesselt, J.; Zeileis, A.; Herold, M. Near real-time disturbance detection using satellite image time series. Remote Sens. Environ.2012, 123, 98–108. [CrossRef]
21. Zhu, Z.; Woodcock, C.E. Continuous change detection and classification of land cover using all available Landsat data. RemoteSens. Environ. 2014, 144, 152–171. [CrossRef]
22. Arnett, J.T.T.R.; Coops, N.C.; Daniels, L.D.; Falls, R.W. Detecting forest damage after a low-severity fire using remote sensing atmultiple scales. Int. J. Appl. Earth Obs. Geoinf. 2015, 35, 239–246. [CrossRef]
23. Griffiths, P.; Nendel, C.; Hostert, P. Intra-annual reflectance composites from Sentinel-2 and Landsat for national-scale crop andland cover mapping. Remote Sens. Environ. 2019, 220, 135–151. [CrossRef]
24. Parks, S.; Dillon, G.; Miller, C. A New Metric for Quantifying Burn Severity: The Relativized Burn Ratio. Remote Sens. 2014, 6,1827–1844. [CrossRef]
25. Roteta, E.; Bastarrika, A.; Padilla, M.; Storm, T.; Chuvieco, E. Development of a Sentinel-2 burned area algorithm: Generation of asmall fire database for sub-Saharan Africa. Remote Sens. Environ. 2019, 222, 1–17. [CrossRef]
26. Wittke, S.; Yu, X.; Karjalainen, M.; Hyyppä, J.; Puttonen, E. Comparison of two-dimensional multitemporal Sentinel-2 data withthree-dimensional remote sensing data sources for forest inventory parameter estimation over a boreal forest. Int. J. Appl. EarthObs. Geoinf. 2019, 76, 167–178. [CrossRef]
27. Blackett, M. An initial comparison of the thermal anomaly detection products of MODIS and VIIRS in their observation ofIndonesian volcanic activity. Remote Sens. Environ. 2015, 171, 75–82. [CrossRef]
28. Schroeder, W.; Giglio, L. Visible Infrared Imaging Radiometer Suite (VIIRS) 375 m & 750 m Active Fire Detection Data Sets Based onNASA VIIRS Land Science Investigator Processing System (SIPS) Reprocessed Data—Version 1 Product User’s Guide Version 1. 2017;NASA: Washington, DC, USA, 2017.
29. Franco, M.G.; Mundo, I.A.; Veblen, T.T. Field-Validated Burn-Severity Mapping in North Patagonian Forests. Remote Sens. 2020,12, 214. [CrossRef]
30. Gibson, R.; Danaher, T.; Hehir, W.; Collins, L. A remote sensing approach to mapping fire severity in south-eastern Australiausing sentinel 2 and random forest. Remote Sens. Environ. 2020, 240, 111702. [CrossRef]
31. Roy, D.P.; Huang, H.; Boschetti, L.; Giglio, L.; Yan, L.; Zhang, H.H.; Li, Z. Landsat-8 and Sentinel-2 burned area mapping—Acombined sensor multi-temporal change detection approach. Remote Sens. Environ. 2019, 231, 111254. [CrossRef]
32. Yin, C.; He, B.; Yebra, M.; Quan, X.; Edwards, A.C.; Liu, X.; Liao, Z. Improving burn severity retrieval by integrating tree canopycover into radiative transfer model simulation. Remote Sens. Environ. 2020, 236, 111454. [CrossRef]
33. Miettinen, J.; Shi, C.; Liew, S.C. Fire Distribution in Peninsular Malaysia, Sumatra and Borneo in 2015 with Special Emphasis onPeatland Fires. Environ. Manag. 2017, 60, 747–757. [CrossRef]
34. Schroeder, T.A.; Wulder, M.A.; Healey, S.P.; Moisen, G.G. Mapping wildfire and clearcut harvest disturbances in boreal forestswith Landsat time series data. Remote Sens. Environ. 2011, 115, 1421–1433. [CrossRef]
35. Nikonovas, T.; Spessa, A.; Doerr, S.H.; Clay, G.D.; Mezbahuddin, S. Near-complete loss of fire-resistant primary tropical forestcover in Sumatra and Kalimantan. Commun. Earth Environ. 2020, 1, 65. [CrossRef]
36. Reiche, J.; Verhoeven, R.; Verbesselt, J.; Hamunyela, E.; Wielaard, N.; Herold, M. Characterizing Tropical Forest Cover Loss UsingDense Sentinel-1 Data and Active Fire Alerts. Remote Sens. 2018, 10, 777. [CrossRef]
37. Baumann, M.; Levers, C.; Macchi, L.; Bluhm, H.; Waske, B.; Gasparri, N.I.; Kuemmerle, T. Mapping continuous fields of tree andshrub cover across the Gran Chaco using Landsat 8 and Sentinel-1 data. Remote Sens. Environ. 2018, 216, 201–211. [CrossRef]
Forests 2021, 12, 456 19 of 21
38. Reiche, J.; Hamunyela, E.; Verbesselt, J.; Hoekman, D.; Herold, M. Improving near-real time deforestation monitoring in tropicaldry forests by combining dense Sentinel-1 time series with Landsat and ALOS-2 PALSAR-2. Remote Sens. Environ. 2018, 204,147–161. [CrossRef]
39. Huang, W.; Sun, G.; Ni, W.; Zhang, Z.; Dubayah, R. Sensitivity of Multi-Source SAR Backscatter to Changes in Forest AbovegroundBiomass. Remote Sens. 2015, 7, 9587–9609. [CrossRef]
40. Carreiras, J.M.B.; Jones, J.; Lucas, R.M.; Shimabukuro, Y.E. Mapping major land cover types and retrieving the age of secondaryforests in the Brazilian Amazon by combining single-date optical and radar remote sensing data. Remote Sens. Environ. 2017, 194,16–32. [CrossRef]
41. Belenguer-Plomer, M.A.; Tanase, M.A.; Fernandez-Carrillo, A.; Chuvieco, E. Burned area detection and mapping using Sentinel-1backscatter coefficient and thermal anomalies. Remote Sens. Environ. 2019, 233, 111345. [CrossRef]
42. Heckel, K.; Urban, M.; Schratz, P.; Mahecha, M.; Schmullius, C. Predicting Forest Cover in Distinct Ecosystems: The Potential ofMulti-Source Sentinel-1 and -2 Data Fusion. Remote Sens. 2020, 12, 302. [CrossRef]
43. Lehmann, E.A.; Caccetta, P.; Lowell, K.; Mitchell, A.; Zhou, Z.-S.; Held, A.; Milne, T.; Tapley, I. SAR and optical remote sensing:Assessment of complementarity and interoperability in the context of a large-scale operational forest monitoring system. RemoteSens. Environ. 2015, 156, 335–348. [CrossRef]
44. Reiche, J.; Verbesselt, J.; Hoekman, D.; Herold, M. Fusing Landsat and SAR time series to detect deforestation in the tropics.Remote Sens. Environ. 2015, 156, 276–293. [CrossRef]
45. Reiche, J.; Lucas, R.; Mitchell, A.L.; Verbesselt, J.; Hoekman, D.H.; Haarpaintner, J.; Kellndorfer, J.M.; Rosenqvist, A.; Lehmann,E.A.; Woodcock, C.E.; et al. Combining satellite data for better tropical forest monitoring. Nat. Clim. Chang. 2016, 6, 120–122.[CrossRef]
46. Stroppiana, D.; Azar, R.; Calò, F.; Pepe, A.; Imperatore, P.; Boschetti, M.; Silva, J.; Brivio, P.; Lanari, R. Integration of Optical andSAR Data for Burned Area Mapping in Mediterranean Regions. Remote Sens. 2015, 7, 1320–1345. [CrossRef]
47. Tanase, M.A.; Belenguer-Plomer, M.A.; Roteta, E.; Bastarrika, A.; Wheeler, J.; Fernández-Carrillo, Á.; Tansey, K.; Wiedemann,W.; Navratil, P.; Lohberger, S.; et al. Burned Area Detection and Mapping: Intercomparison of Sentinel-1 and Sentinel-2 BasedAlgorithms over Tropical Africa. Remote Sens. 2020, 12, 334. [CrossRef]
48. Tanase, M.A.; Santoro, M.; De La Riva, J.; Prez-Cabello, F.; Le Toan, T. Sensitivity of X-, C-, and L-Band SAR Backscatter to BurnSeverity in Mediterranean Pine Forests. IEEE Trans. Geosci. Remote Sens. 2010, 48, 3663–3675. [CrossRef]
49. Pontius, J.; Schaberg, P.; Hanavan, R. Remote Sensing for Early, Detailed, and Accurate Detection of Forest Disturbance andDecline for Protection of Biodiversity. In Remote Sensing of Plant Biodiversity; Cavender-Bares, J., Gamon, J., Townsend, P., Eds.;Springer: Cham, Switzerland, 2020; ISBN 978-3-030-33156-6.
50. Hirschmugl, M.; Deutscher, J.; Sobe, C.; Bouvet, A.; Mermoz, S.; Schardt, M. Use of SAR and Optical Time Series for TropicalForest Disturbance Mapping. Remote Sens. 2020, 12, 727. [CrossRef]
51. Adrianto, H.A.; Spracklen, D.V.; Arnold, S.R. Relationship Between Fire and Forest Cover Loss in Riau Province, IndonesiaBetween 2001 and 2012. Forests 2019, 10, 889. [CrossRef]
52. Hansen, M.C.; Potapov, P.V.; Moore, R.; Hancher, M.; Turubanova, S.A.; Tyukavina, A.; Thau, D.; Stehman, S.V.; Goetz, S.J.;Loveland, T.R.; et al. High-resolution global maps of 21st-century forest cover change. Science 2013, 342, 850–853. [CrossRef]
53. Indonesian Ministry of Environment & Forestry Land Cover 2017 Indonesia. Available online: https://data.globalforestwatch.org/datasets/b1126d52d6c5416496339aeb250d9b39 (accessed on 10 May 2020).
54. European Space Agency (ESA). Sentinel-1: ESA’s Radar Observatory Mission for GMES Operational Services; ESA Communications:Noordwijk, The Netherlands, 2012.
55. European Space Agency (ESA). SENTINEL-2 User Handbook; 1.0.; European Space Agency: Paris, France, 2015.56. United States Geological Survey (USGS). Landsat 7 (L7) Data Users Handbook; 2.0.; U.S. Geological Survey: Reston, VA, USA, 2019.57. United States Geological Survey (USGS). Landsat 8 (L8) Data Users Handbook; 5.0.; U.S. Geological Survey: Reston, VA, USA, 2019.58. Planet Team Planet Application Program Interface: In Space for Life on Earth Online. Available online: https://api.planet.com
(accessed on 20 November 2020).59. White, J.C.; Wulder, M.A.; Hermosilla, T.; Coops, N.C.; Hobart, G.W. A nationwide annual characterization of 25 years of forest
disturbance and recovery for Canada using Landsat time series. Remote Sens. Environ. 2017, 194, 303–321. [CrossRef]60. Foga, S.; Scaramuzza, P.L.; Guo, S.; Zhu, Z.; Dilley, R.D.; Beckmann, T.; Schmidt, G.L.; Dwyer, J.L.; Joseph Hughes, M.; Laue, B.
Cloud detection algorithm comparison and validation for operational Landsat data products. Remote Sens. Environ. 2017, 194,379–390. [CrossRef]
61. United States Geological Survey (USGS). Landsat 4–7 Collection 1 (C1) Surface Reflectance (LEDAPS) Product Guide; 3.0.; U.S.Geological Survey: Reston, VA, USA, 2020.
62. Gorelick, N.; Hancher, M.; Dixon, M.; Ilyushchenko, S.; Thau, D.; Moore, R. Google Earth Engine: Planetary-scale geospatialanalysis for everyone. Remote Sens. Environ. 2017, 202, 18–27. [CrossRef]
63. Yin, F.; Lewis, P.; Gomez-Dans, J.; Wu, Q. A sensor-invariant atmospheric correction method: Application to Sentinel-2/MSI andLandsat 8/OLI. Prep 2021, 1–42. [CrossRef]
64. Schmitt, M.; Hughes, L.H.; Qiu, C.; Zhu, X.X. SEN12MS—A Curated Dataset of Georeferenced Multi-Spectral Sentinel-1/2Imahery for Deep Learning and Data Fusion. ISPRS Ann. Photogramm. Remote Sens. Spat. Inf. Sci. 2019, IV-2/W7, 153–160.[CrossRef]
Forests 2021, 12, 456 20 of 21
65. Hamunyela, E.; Verbesselt, J.; Herold, M. Using spatial context to improve early detection of deforestation from Landsat timeseries. Remote Sens. Environ. 2016, 172, 126–138. [CrossRef]
66. Reiche, J.; Mullissa, A.; Slagter, B.; Gou, Y.; Tsendbazar, N.-E.; Odongo-Braun, C.; Vollrath, A.; Weisse, M.J.; Stolle, F.; Pickens, A.;et al. Forest disturbance alerts for the Congo Basin using Sentinel-1. Environ. Res. Lett. 2021, 16, 024005. [CrossRef]
67. Google Earth Engine Team Sentinel-1 Algorithms: Sentinel-1 Preprocessing. Available online: https://developers.google.com/earth-engine/guides/sentinel1 (accessed on 29 January 2021).
68. Vollrath, A.; Mullissa, A.; Reiche, J. Angular-Based Radiometric Slope Correction for Sentinel-1 on Google Earth Engine. RemoteSens. 2020, 12, 1867. [CrossRef]
69. Quegan, S.; Yu, J.J. Filtering of multichannel SAR images. IEEE Trans. Geosci. Remote Sens. 2001, 39, 2373–2379. [CrossRef]70. Schroeder, W.; Oliva, P.; Giglio, L.; Csiszar, I.A. The New VIIRS 375m active fire detection data product: Algorithm description
and initial assessment. Remote Sens. Environ. 2014, 143, 85–96. [CrossRef]71. Giglio, L.; Loboda, T.; Roy, D.P.; Quayle, B.; Justice, C.O. An active-fire based burned area mapping algorithm for the MODIS
sensor. Remote Sens. Environ. 2009, 113, 408–420. [CrossRef]72. Olofsson, P.; Arévalo, P.; Espejo, A.B.; Green, C.; Lindquist, E.; McRoberts, R.E.; Sanz, M.J. Mitigating the effects of omission
errors on area and area change estimates. Remote Sens. Environ. 2020, 236, 111492. [CrossRef]73. Stehman, S.V.; Wickham, J.; Smith, J.H.; Yang, L. Thematic accuracy of the 1992 National Land-Cover Data for the eastern United
States: Statistical methodology and regional results. Remote Sens. Environ. 2003, 86, 500–516. [CrossRef]74. Olofsson, P.; Foody, G.M.; Herold, M.; Stehman, S.V.; Woodcock, C.E.; Wulder, M.A. Good practices for estimating area and
assessing accuracy of land change. Remote Sens. Environ. 2014, 148, 42–57. [CrossRef]75. Hansen, M.C.; Krylov, A.; Tyukavina, A.; Potapov, P.V.; Turubanova, S.; Zutta, B.; Ifo, S.; Margono, B.; Stolle, F.; Moore, R. Humid
tropical forest disturbance alerts using Landsat data. Environ. Res. Lett. 2016, 11, 034008. [CrossRef]76. Normile, D. Indonesia’s fires are bad, but new measures prevented them from becoming worse. Science 2019. [CrossRef]77. Noojipady, P.; Morton, D.C.; Schroeder, W.; Carlson, K.M.; Huang, C.; Gibbs, H.K.; Burns, D.; Walker, N.F.; Prince, S.D. Managing
fire risk during drought: The influence of certification and El Niño on fire-driven forest conversion for oil palm in Southeast Asia.Earth Syst. Dyn. 2017, 8, 749–771. [CrossRef]
78. Carlson, K.M.; Heilmayr, R.; Gibbs, H.K.; Noojipady, P.; Burns, D.N.; Morton, D.C.; Walker, N.F.; Paoli, G.D.; Kremen, C. Effectof oil palm sustainability certification on deforestation and fire in Indonesia. Proc. Natl. Acad. Sci. USA 2018, 115, 121–126.[CrossRef]
79. Sloan, S.; Locatelli, B.; Wooster, M.J.; Gaveau, D.L.A. Fire activity in Borneo driven by industrial land conversion and droughtduring El Niño periods, 1982–2010. Glob. Environ. Chang. 2017, 47, 95–109. [CrossRef]
80. Busch, J.; Ferretti-Gallon, K.; Engelmann, J.; Wright, M.; Austin, K.G.; Stolle, F.; Turubanova, S.; Potapov, P.V.; Margono, B.;Hansen, M.C.; et al. Reductions in emissions from deforestation from Indonesia’s moratorium on new oil palm, timber, andlogging concessions. Proc. Natl. Acad. Sci. USA 2015, 112, 1328–1333. [CrossRef] [PubMed]
81. Chazdon, R.L.; Broadbent, E.N.; Rozendaal, D.M.A.; Bongers, F.; Zambrano, A.M.A.; Aide, T.M.; Balvanera, P.; Becknell, J.M.;Boukili, V.; Brancalion, P.H.S.; et al. Carbon sequestration potential of second-growth forest regeneration in the Latin Americantropics. Sci. Adv. 2016, 2, e1501639. [CrossRef] [PubMed]
82. Numata, I.; Silva, S.S.; Cochrane, M.A.; D’Oliveira, M.V.N. Fire and edge effects in a fragmented tropical forest landscape in thesouthwestern Amazon. For. Ecol. Manag. 2017, 401, 135–146. [CrossRef]
83. Miettinen, J.; Hooijer, A.; Shi, C.; Tollenaar, D.; Vernimmen, R.; Liew, S.C.; Malins, C.; Page, S.E. Extent of industrial plantationson Southeast Asian peatlands in 2010 with analysis of historical expansion and future projections. GCB Bioenergy 2012, 4, 908–918.[CrossRef]
84. Armenteras, D.; González, T.M.; Retana, J. Forest fragmentation and edge influence on fire occurrence and intensity underdifferent management types in Amazon forests. Biol. Conserv. 2013, 159, 73–79. [CrossRef]
85. Hamunyela, E.; Reiche, J.; Verbesselt, J.; Herold, M. Using Space-Time Features to Improve Detection of Forest Disturbances fromLandsat Time Series. Remote Sens. 2017, 9, 515. [CrossRef]
86. Doblas, J.; Shimabukuro, Y.; Sant’Anna, S.; Carneiro, A.; Aragão, L.; Almeida, C. Optimizing Near Real-Time Detection ofDeforestation on Tropical Rainforests Using Sentinel-1 Data. Remote Sens. 2020, 12, 3922. [CrossRef]
87. Danklmayer, A.; Doring, B.J.; Schwerdt, M.; Chandra, M. Assessment of Atmospheric Propagation Effects in SAR Images. IEEETrans. Geosci. Remote Sens. 2009, 47, 3507–3518. [CrossRef]
88. Hoekman, D.; Kooij, B.; Quiñones, M.; Vellekoop, S.; Carolita, I.; Budhiman, S.; Arief, R.; Roswintiarti, O. Wide-Area Near-Real-Time Monitoring of Tropical Forest Degradation and Deforestation Using Sentinel-1. Remote Sens. 2020, 12, 3263. [CrossRef]
89. Bouvet, A.; Mermoz, S.; Ballère, M.; Koleck, T.; Le Toan, T. Use of the SAR Shadowing Effect for Deforestation Detection withSentinel-1 Time Series. Remote Sens. 2018, 10, 1250. [CrossRef]
90. NASA. NASA-ISRO SAR (NISAR) Mission Science Users’ Handbook; NASA: Washington, DC, USA, 2018.91. ESA. Biomass—Report for Mission Selection: An Earth Explorer to Observe Forest Biomass; ESA Communications: Oakville, ON,
Canada, 2012.92. Fanin, T.; Van Der Werf, G.R. Relationships between burned area, forest cover loss, and land cover change in the Brazilian
Amazon based on satellite data. Biogeosciences 2015, 12, 6033–6043. [CrossRef]
Forests 2021, 12, 456 21 of 21
93. Gaveau, D.L.A.; Sloan, S.; Molidena, E.; Yaen, H.; Sheil, D.; Abram, N.K.; Ancrenaz, M.; Nasi, R.; Quinones, M.; Wielaard, N.; et al.Four Decades of Forest Persistence, Clearance and Logging on Borneo. PLoS ONE 2014, 9, 1–11. [CrossRef]
94. Fernández-García, V.; Quintano, C.; Taboada, A.; Marcos, E.; Calvo, L.; Fernández-Manso, A. Remote Sensing Applied to theStudy of Fire Regime Attributes and Their Influence on Post-Fire Greenness Recovery in Pine Ecosystems. Remote Sens. 2018, 10,733. [CrossRef]
95. Page, S.E.; Hooijer, A. In the line of fire: The peatlands of Southeast Asia. Philos. Trans. R. Soc. B Biol. Sci. 2016, 371, 20150176.[CrossRef] [PubMed]
96. Suyanto, S.; Applegate, G.; Permana, R.P.; Khususiyah, N.; Kurniawan, I. The Role of Fire in Changing Land Use and Livelihoodsin Riau-Sumatra. Ecol. Soc. 2004, 9, art15. [CrossRef]
97. Varma, A. The economics of slash and burn: A case study of the 1997–1998 Indonesian forest fires. Ecol. Econ. 2003, 46, 159–171.[CrossRef]
98. Gaveau, D.L.A.; Salim, M.A.; Hergoualc’H, K.; Locatelli, B.; Sloan, S.; Wooster, M.; Marlier, M.E.; Molidena, E.; Yaen, H.;DeFries, R.; et al. Major atmospheric emissions from peat fires in Southeast Asia during non-drought years: Evidence from the2013 Sumatran fires. Sci. Rep. 2015, 4, 6112. [CrossRef]
99. Lewis, S.A.; Robichaud, P.R.; Hudak, A.T.; Austin, B.; Liebermann, R.J. Utility of Remotely Sensed Imagery for Assessing theImpact of Salvage Logging after Forest Fires. Remote Sens. 2012, 4, 2112–2132. [CrossRef]
100. Zald, H.S.J.; Dunn, C.J. Severe fire weather and intensive forest management increase fire severity in a multi-ownership landscape.Ecol. Appl. 2018, 28, 1068–1080. [CrossRef] [PubMed]
101. Liu, C.L.C.; Kuchma, O.; Krutovsky, K.V. Mixed-species versus monocultures in plantation forestry: Development, benefits,ecosystem services and perspectives for the future. Glob. Ecol. Conserv. 2018, 15, e00419. [CrossRef]
102. Saulino, L.; Rita, A.; Migliozzi, A.; Maffei, C.; Allevato, E.; Garonna, A.P.; Saracino, A. Detecting Burn Severity across MediterraneanForest Types by Coupling Medium-Spatial Resolution Satellite Imagery and Field Data. Remote Sens. 2020, 12, 741. [CrossRef]
103. DellaSala, D.A.; Hanson, C.T. The Ecological Importance of Mixed-Severity Fires: Nature’s Phoenix; Elsevier: New York, NY, USA, 2015.104. Arellano-Pérez, S.; Castedo-Dorado, F.; López-Sánchez, C.; González-Ferreiro, E.; Yang, Z.; Díaz-Varela, R.; Álvarez-González, J.;
Vega, J.; Ruiz-González, A. Potential of Sentinel-2A Data to Model Surface and Canopy Fuel Characteristics in Relation to CrownFire Hazard. Remote Sens. 2018, 10, 1645. [CrossRef]
105. Foschi, P.G. A geometric approach to a mixed pixel problem: Detecting subpixel woody vegetation. Remote Sens. Environ. 1994,50, 317–327. [CrossRef]
106. Prosperi, P.; Bloise, M.; Tubiello, F.N.; Conchedda, G.; Rossi, S.; Boschetti, L.; Salvatore, M.; Bernoux, M. New estimates ofgreenhouse gas emissions from biomass burning and peat fires using MODIS Collection 6 burned areas. Clim. Chang. 2020, 161,415–432. [CrossRef]