Logging in the Congo basin: a multi-country characterization of timber companies
16
Logging in the Congo Basin: A multi-country characterization of timber companies Manuel Ruiz Pe ´rez a, * , Driss Ezzine de Blas a,1 , Robert Nasi b,2 , Jeffrey A. Sayer c,3 , Marieke Sassen d,4 , Claudine Angoue ´ e,5 , Norbert Gami f,6 , Ousseynou Ndoye d,7 , Gre ´goire Ngono g,8 , Jean-Claude Nguinguiri h,9 , Donatien Nzala i,10 , Benjamin Toirambe j,11 , Yves Yalibanda k,12 a Dpt. Ecologia-Edificio Biologı ´a, Calle Darwin, 2, Universidad Auto ´noma de Madrid, 28049 Madrid, Spain b CIRAD/CIFOR, Campus International de Baillarguet, 34298 Montpellier, France c WWF International, Avenue du Mont Blanc, 1196 Gland, Switzerland d CIFOR Central and West Africa Regional Office, B.P. 2008, Messa, Yaounde ´, Cameroon e U.O.B. De ´partement de Sociologie, BP 17055, Libreville, Gabon f 100 rue Lampama, Talangaı ¨, Brazzaville, Congo g Coordonnateur Scientifique, Institut de Recherches Agronomiques pour le De ´veloppement (IRAD) BP 2163 Yaounde ´, Cameroon h ITTO Regional Officer for Africa, P.O. Box 329, Libreville, Gabon i Universite ´ Marien Ngouabi/IDR, BP 13647, Brazzaville, Congo j MINAF-ET, BP 12348 Kinshassa I, Congo k Directeur des Exploitations Forestie `res, Ministe `re des Eaux, Fore ˆts, Chasses, Pe ˆches, de L’Environnement et du Tourisme, BP 830, Bangui, Central African Republic Received 22 July 2004; received in revised form 28 February 2005; accepted 13 April 2005 Abstract Industrial logging has been the subject of strong debate, epitomised by the contentious positions around logging in the Congo Basin. Logging companies are often considered as homogeneous and rather static agents, which leads to sweeping general- isations about their performance and the subsequent technical and policy recommendations. This study covers 31 logging concessions in the five ITTO member countries of the Congo Basin. Based on a detailed questionnaire complemented by published statistics, the concessions are characterised by the country in which they operate, their legal status, age, size, origin of www.elsevier.com/locate/foreco Forest Ecology and Management 214 (2005) 221–236 * Corresponding author. Tel.: +34 91 497 8000; fax: +34 91 497 8001. E-mail addresses: [email protected] (M. Ruiz Pe ´rez), [email protected] (D. Ezzine de Blas), [email protected] (R. Nasi), jsayer@wwfint.org (J.A. Sayer), [email protected] (M. Sassen), [email protected] (C. Angoue ´), [email protected] (N. Gami), [email protected] (O. Ndoye), [email protected] (G. Ngono), [email protected] (J.-C. Nguinguiri), [email protected] (D. Nzala), [email protected] (B. Toirambe), [email protected] (Y. Yalibanda). 1 Tel.: +34 91 497 8000; fax: +34 91 497 8001. 2 Tel.: +33 4 67 59 3880; fax: +33 4 67 59 3733. 3 Tel: +41 22 364 9014. 4 Tel: +237 223 7434/7522; fax: +237 223 7437. 5 Tel: +241 261937/713068; fax: +241 732345. 6 Tel: +242 549 26 94; fax: +242 556 24 63. 7 Tel: +237 223 7434/7522; fax: +237 223 7437. 8 Tel.: +237 223 3538; fax: +237 223 3538. 9 Tel.: +241 76 91 44; fax: +241 76 91 44. 10 Tel.: +242 51 82 73. 11 Tel.: +32 486 90 66 54. 12 Fax: +236 61 80 53. 0378-1127/$ – see front matter # 2005 Elsevier B.V. All rights reserved. doi:10.1016/j.foreco.2005.04.020
-
Upload
independent -
Category
Documents
-
view
1 -
download
0
Transcript of Logging in the Congo basin: a multi-country characterization of timber companies
www.elsevier.com/locate/foreco
Forest Ecology and Management 214 (2005) 221–236
Logging in the Congo Basin: A multi-country
characterization of timber companies
Manuel Ruiz Perez a,*, Driss Ezzine de Blas a,1, Robert Nasi b,2, Jeffrey A. Sayer c,3,Marieke Sassen d,4, Claudine Angoue e,5, Norbert Gami f,6, Ousseynou Ndoye d,7,
Gregoire Ngono g,8, Jean-Claude Nguinguiri h,9, Donatien Nzala i,10,Benjamin Toirambe j,11, Yves Yalibanda k,12
a Dpt. Ecologia-Edificio Biologıa, Calle Darwin, 2, Universidad Autonoma de Madrid, 28049 Madrid, Spainb CIRAD/CIFOR, Campus International de Baillarguet, 34298 Montpellier, France
c WWF International, Avenue du Mont Blanc, 1196 Gland, Switzerlandd CIFOR Central and West Africa Regional Office, B.P. 2008, Messa, Yaounde, Cameroon
e U.O.B. Departement de Sociologie, BP 17055, Libreville, Gabonf 100 rue Lampama, Talangaı, Brazzaville, Congo
g Coordonnateur Scientifique, Institut de Recherches Agronomiques pour le Developpement (IRAD) BP 2163 Yaounde, Cameroonh ITTO Regional Officer for Africa, P.O. Box 329, Libreville, Gabon
i Universite Marien Ngouabi/IDR, BP 13647, Brazzaville, Congoj MINAF-ET, BP 12348 Kinshassa I, Congo
k Directeur des Exploitations Forestieres, Ministere des Eaux, Forets, Chasses, Peches, de L’Environnement et du Tourisme,
BP 830, Bangui, Central African Republic
Received 22 July 2004; received in revised form 28 February 2005; accepted 13 April 2005
Abstract
Industrial logging has been the subject of strong debate, epitomised by the contentious positions around logging in the Congo
Basin. Logging companies are often considered as homogeneous and rather static agents, which leads to sweeping general-
isations about their performance and the subsequent technical and policy recommendations. This study covers 31 logging
concessions in the five ITTO member countries of the Congo Basin. Based on a detailed questionnaire complemented by
published statistics, the concessions are characterised by the country in which they operate, their legal status, age, size, origin of
* Corresponding author. Tel.: +34 91 497 8000; fax: +34 91 497 8001.
E-mail addresses: [email protected] (M. Ruiz Perez), [email protected] (D. Ezzine de Blas), [email protected] (R. Nasi),
[email protected] (J.A. Sayer), [email protected] (M. Sassen), [email protected] (C. Angoue), [email protected] (N. Gami),
[email protected] (O. Ndoye), [email protected] (G. Ngono), [email protected] (J.-C. Nguinguiri), [email protected] (D. Nzala),
[email protected] (B. Toirambe), [email protected] (Y. Yalibanda).1 Tel.: +34 91 497 8000; fax: +34 91 497 8001. 2 Tel.: +33 4 67 59 3880; fax: +33 4 67 59 3733. 3 Tel: +41 22 364 9014. 4 Tel: +237 223 7434/7522;
fax: +237 223 7437. 5 Tel: +241 261937/713068; fax: +241 732345. 6 Tel: +242 549 26 94; fax: +242 556 24 63. 7 Tel: +237 223 7434/7522;
fax: +237 223 7437. 8 Tel.: +237 223 3538; fax: +237 223 3538. 9 Tel.: +241 76 91 44; fax: +241 76 91 44. 10 Tel.: +242 51 82 73.11 Tel.: +32 486 90 66 54. 12 Fax: +236 61 80 53.
0378-1127/$ – see front matter # 2005 Elsevier B.V. All rights reserved.
doi:10.1016/j.foreco.2005.04.020
M. Ruiz Perez et al. / Forest Ecology and Management 214 (2005) 221–236222
capital, and market focus. Concessions show patterns shaped by interactions between these factors, with different logging
strategies associated with the resulting groupings. Our results lend partial support to some of the common generalisations about
the performance of logging companies of different scales and geographic origin. For example, national concessions tend to have
higher processing rates and often create more employment. However, the data also suggest nuances that can contradict some of
the conventional views. Thus, some large concessions may well use better management tools than smaller ones while some
national concessions may exert a higher pressure on their allocated forests. Some key parameters related to concessions’
performance (like species logged, productivity per hectare, percent of the concession logged per year and employment) work
together in the specific environmental, economic and policy contexts of each country to produce a complex regional image that is
sometimes oversimplified when submitted to anecdotal or special interest advocacy analyses.
# 2005 Elsevier B.V. All rights reserved.
Keywords: Industrial logging; Timber concessions; Congo Basin; Forest management
1. Introduction
Few natural resource management issues have
elicited as much controversy as the logging of tropical
forests (Cannon et al., 1998a; Putz et al., 2000;
Gullison et al., 2001; Pearce et al., 2003). Some
environmental groups have argued that logging is
almost always associated with environmental pro-
blems and that the precautionary measures that would
be needed to ensure genuine broad-based sustain-
ability would be so expensive as to preclude economic
sustainability (Rice et al., 1997; Cannon et al., 1998b).
Others have argued that with the correct incentive
structures sustainability could be achieved (Richards,
2000; Pearce et al., 2003). Considerable research has
been conducted on approaches to alleviating the
biophysical impacts of logging (Sist, 2000a; Schwab
et al., 2001) as well as on the complex social issues
associated with forest exploitation (Colchester, 2001).
The Congo Basin13 is one of the areas that have
attracted world level attention. Industrial logging has
been a major activity in the Congo Basin countries for
over four decades. It is generally highly selective and
only a small number of trees (0.7–2) are extracted per
13 Central Africa is herein defined as composed of six countries:
the Republic of Cameroon (Cameroon), the Central African Repub-
lic (C.A.R.), the Republic of the Congo (Congo), the Democratic
Republic of the Congo (D.R.C.), the Republic of Equatorial Guinea
(Eq. Guinea) and the Republic of Gabon (Gabon). Sao-Tome &
Principe, Burundi and Rwanda are excluded, although they are
sometimes considered (FAO, 2003) as part of Central Africa
because they lack the common denominator shared by the other
countries: lowland rainforests subjected to logging operations.
These six countries are generally (though incorrectly, as Gabon is
not part of the Congo River catchments) considered as forming the
‘‘Congo Basin’’.
hectare (White, 1992; Durrieu de Madron et al., 2000;
Global Forest Watch, 2000a,b). Several studies (Sist,
2000b; Durrieu de Madron and Forni, 1998; Durrieu
de Madron et al., 2000) show that damage caused to
remaining stands by such a highly selective logging is
generally limited and affects 7–20% of the area for
0.8–4 trees harvested per hectare. When logging less
than 2 trees/ha, the case for the majority of operations,
damage is about 10% and vegetation recovery is fast
(Van Gemerden et al., 2003) though the forest will not
necessarily be similar to the one before exploitation.
Most of the large mammal species that are the
objective of much conservation interest often thrive in
such lightly disturbed forests (White, 1992 –
mammals; Barnes et al., 1997 – elephants; Matthews
and Matthews, 2004 – gorillas) except chimpanzees
that are apparently negatively affected by logging
(White, 1992; Matthews and Matthews, 2004).
In spite of this, industrial logging in the Congo
Basin is highly controversial. Some western media are
critical of the corruption linked with logging. The
bushmeat trade associated with logging infrastructure
has been portrayed as a major environmental concern
(Brown and Williams, 2003), and conservation
organisations have made sweeping generalisations
about the relative performance of logging companies
of differing geographic origins (Greenpeace Switzer-
land, 2004), portraying local as better than foreign and
Europe-based as better than Asia-based.
Certification and community forest management
are frequently considered as the way forward for
sustainable forestry. There has been considerable
interest in the use of independent certification to
assess forest industry performance in general and in
the region. This has also been controversial (Counsell
M. Ruiz Perez et al. / Forest Ecology and Management 214 (2005) 221–236 223
and Loraas, 2002) as some argue that the criteria for
certification are excessively influenced by western
environmental concerns and do not give adequate
recognition to local livelihoods. Others see certifica-
tion as a violation of national sovereignty, considering
certifiers as second-guessing national laws and
procedures.
Decentralisation of control of forests and various
forms of local and community management of forests
have been advocated on the grounds that they will
provide a basis for local accountability (Alden-Wily,
2003). Others have argued in favour of using centrally
controlled protected areas as the most effective way of
conserving forest values (Bruner et al., 2001). Despite
well documented both positive and negative experi-
ences, opposing parties tend to maintain their
positions. These tend to be based on partial or
anecdotal evidence and broad assumptions about the
relative importance of local livelihoods and large-
scale environmental values.
The origin of the present study lies in our concern
and that of the organisations for which we work that
measures to assess and potentially to improve logging
practices in the region have to be based on a more
critical understanding of the characteristics and
diversity of conditions. Collective professional experi-
ence (ours and others) has showed that there is a great
deal of variability in the performance of logging
companies, from those that cause considerable
environmental and social harm to others that operate
with high standards.
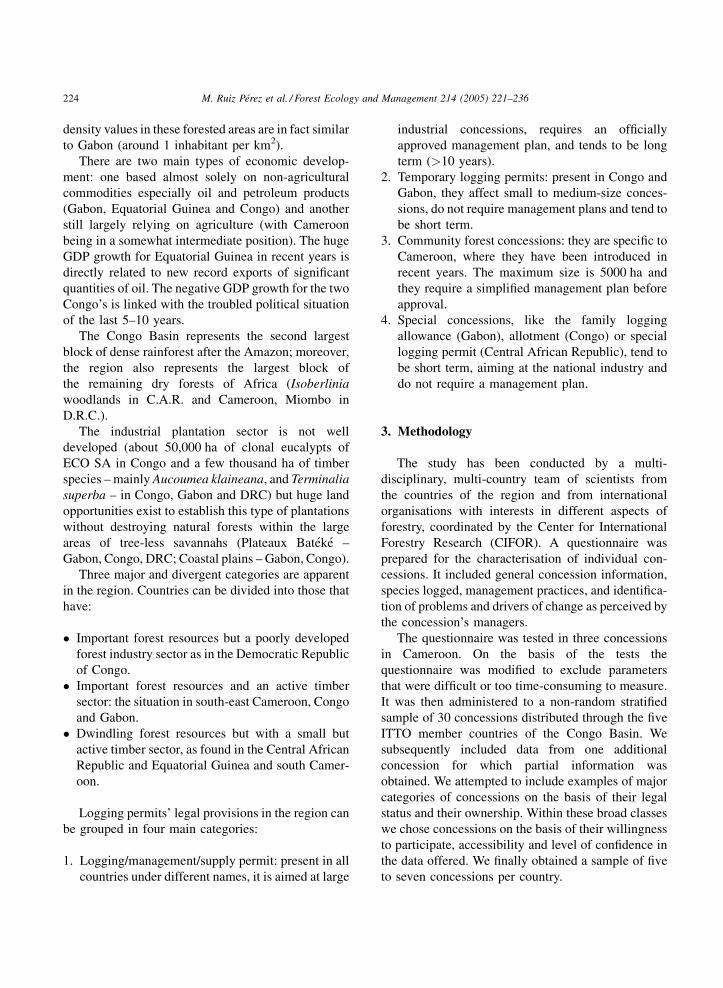
Table 1
Economic, demographic and geographical characteristics of the Congo B
Country Area (km2) Population
(millions)
GNP/Cap
(US$)
% rain
forest
Tota
prod
Cameroon 475,440 15.5 560 38 2,49
Central African
Republic
622,980 3.8 270 7 70
Congo 342,000 3.2 720 70 1,24
Democratic
Republic Congo
2,345,410 51.4 110 47 50
Equatorial Guineaa 28,050 0.5 1050 69 67
Gabon 267,670 1.1 3110 80 4,36
Source: World Bank Africa Database (2002); E. Forni (personal communa Wood export for the year 2000.
This study attempts to characterise key features of
logging concessions in the Congo Basin as a first step
to assess the economic, political or geographic
conditions that determine their performance. In spite
of some limitations (see methodology section below)
we hope through this analysis to provide a finer-scaled
assessment of where problems lie and what sorts of
solutions might be applied to them.
2. The context for logging in the Congo Basin
The region covers 4.1 million km2 and has 74
million people. DRC accounts for 57% of the total
area and 68% of the population. Table 1 presents the
basic economic, demographic and geographical
characteristics of the Congo Basin countries.
Population densities are generally low (less than 20
persons per km2, except in Cameroon and D.R.C.), and
the average regional population growth is 3.2% per
year. Annual income per capita ranged in 2002 from
US$ 110 in DRC to US$ 3110 in Gabon (World Bank
Africa Database, 2002).
Gabon obviously stands apart with a very high
percentage of the population residing in urban areas
but three countries could be considered as having no
real rural population pressure on forests (C.A.R.,
Congo and Gabon and continental Equatorial Guinea
as well as some forested areas in DRC (central
provinces) and Cameroon (south-east) because of
extremely low rural population densities. Population
asin countries
l
uction (m3)
Export s 2003 (m3) Main markets
8,000 1,639,203 (processed),
191,138 (logs)
Europe (85%),
Asia (6%), others (9%)
4,000 52,233 (processed),
234,617 (logs)
Europe
5,000 147,611 (processed),
712,292 (logs)
Europe, Asia
0,000 15,899 (processed),
37,064 (logs)
Europe?
6,265 676,265 (total) Asia (>60%), Europe
8,000 1,717,355 (total) Asia (63%),
Europe (31%), others (6%)
ication); ITTO (2003); ATIBT (2004).
M. Ruiz Perez et al. / Forest Ecology and Management 214 (2005) 221–236224
density values in these forested areas are in fact similar
to Gabon (around 1 inhabitant per km2).
There are two main types of economic develop-
ment: one based almost solely on non-agricultural
commodities especially oil and petroleum products
(Gabon, Equatorial Guinea and Congo) and another
still largely relying on agriculture (with Cameroon
being in a somewhat intermediate position). The huge
GDP growth for Equatorial Guinea in recent years is
directly related to new record exports of significant
quantities of oil. The negative GDP growth for the two
Congo’s is linked with the troubled political situation
of the last 5–10 years.
The Congo Basin represents the second largest
block of dense rainforest after the Amazon; moreover,
the region also represents the largest block of
the remaining dry forests of Africa (Isoberlinia
woodlands in C.A.R. and Cameroon, Miombo in
D.R.C.).
The industrial plantation sector is not well
developed (about 50,000 ha of clonal eucalypts of
ECO SA in Congo and a few thousand ha of timber
species – mainly Aucoumea klaineana, and Terminalia
superba – in Congo, Gabon and DRC) but huge land
opportunities exist to establish this type of plantations
without destroying natural forests within the large
areas of tree-less savannahs (Plateaux Bateke –
Gabon, Congo, DRC; Coastal plains – Gabon, Congo).
Three major and divergent categories are apparent
in the region. Countries can be divided into those that
have:
� I
mportant forest resources but a poorly developedforest industry sector as in the Democratic Republic
of Congo.
� I
mportant forest resources and an active timbersector: the situation in south-east Cameroon, Congo
and Gabon.
� D
windling forest resources but with a small butactive timber sector, as found in the Central African
Republic and Equatorial Guinea and south Camer-
oon.
Logging permits’ legal provisions in the region can
be grouped in four main categories:
1. L
ogging/management/supply permit: present in allcountries under different names, it is aimed at large
industrial concessions, requires an officially
approved management plan, and tends to be long
term (>10 years).
2. T
emporary logging permits: present in Congo andGabon, they affect small to medium-size conces-
sions, do not require management plans and tend to
be short term.
3. C
ommunity forest concessions: they are specific toCameroon, where they have been introduced in
recent years. The maximum size is 5000 ha and
they require a simplified management plan before
approval.
4. S
pecial concessions, like the family loggingallowance (Gabon), allotment (Congo) or special
logging permit (Central African Republic), tend to
be short term, aiming at the national industry and
do not require a management plan.
3. Methodology
The study has been conducted by a multi-
disciplinary, multi-country team of scientists from
the countries of the region and from international
organisations with interests in different aspects of
forestry, coordinated by the Center for International
Forestry Research (CIFOR). A questionnaire was
prepared for the characterisation of individual con-
cessions. It included general concession information,
species logged, management practices, and identifica-
tion of problems and drivers of change as perceived by
the concession’s managers.
The questionnaire was tested in three concessions
in Cameroon. On the basis of the tests the
questionnaire was modified to exclude parameters
that were difficult or too time-consuming to measure.
It was then administered to a non-random stratified
sample of 30 concessions distributed through the five
ITTO member countries of the Congo Basin. We
subsequently included data from one additional
concession for which partial information was
obtained. We attempted to include examples of major
categories of concessions on the basis of their legal
status and their ownership. Within these broad classes
we chose concessions on the basis of their willingness
to participate, accessibility and level of confidence in
the data offered. We finally obtained a sample of five
to seven concessions per country.
M. Ruiz Perez et al. / Forest Ecology and Management 214 (2005) 221–236 225
There is a large variation in the number of
officially declared concessions in each of the five
countries so our sample does not provide the same
intensity of sampling per country. This, together with
the relatively small size of the sample in some
countries and the fact that the cases were not selected
randomly, is a shortcoming of the study. Never-
theless, a number of significant trends and patterns
already emerge from the data and suggest that the
basic approach is valid.
The 31 concessions cover a total of 7.3 million ha.
The companies that operate the concessions have total
operations covering 14.8 million ha of forest in the
five countries. To facilitate categorical analysis,
concessions were divided into four groups according
to their size: small (<5000 ha), corresponding to the
established limit for community and artisan conces-
sions in the region; medium (5000 to 100,000 ha);
large (100,000–250,000 ha) and very large
(>250,000 ha). Additional variables that were con-
sidered relevant for categorizing the concessions were
origin of capital (local or foreign), and market
orientation (Local-African, European, Asian). The
questionnaires were codified to allow for statistical
analysis. Frequencies, cross tabulations and explora-
tory analysis were used to identify distributions and
associations.
We assessed the relative contribution to total
concession production of the five main tree species
exploited in each concession and we analysed
regional and within country patterns. We also
calculated the Shannon and Simpson indexes of
evenness of distribution for industrial and artisanal
concessions. For the purpose of this analysis we
identified four levels of development of a manage-
ment plan: absence; under preparation; available but
still not legally approved; available and approved.
The yearly ratio of logged surface to total
concession area was calculated based on data
provided by the concessionaires. We used 2002 as
reference year because this provided the most recent
and complete data available. Regression models
were used to interpret logging ratios and to
understand the variables that could be affecting
them. Productivity in m3 per hectare was estimated
based on total production and logged surface data
provided for 2002. Moreover, the data were checked
against productivity estimates provided during the
interviews for some concessions. Direct employ-
ment data were also gathered in the survey and we
calculated the employment per 1000 ha as well as
productivity (in m3 per worker). We also analysed
the local transformation rate (at any level, from
sawn timber to finished products) within the
concessions and the influence of the above men-
tioned variables.
ANOVA and other parametric tests were used to
check statistically significant differences between
categories for the relevant quantitative variables that
followed a normal distribution. Non-parametric tests
(Kruskal-Wallis x2) were applied to variables that did
not comply with normality assumptions.
Least square and logit regression models were used
to test relationships that contributed to define main
types of concessions. Finally, multidimensional analy-
sis (ordination and cluster) was used to characterise
concessions based on a joint set of attributes. All the
analyses were conducted using SPSS 12.0 and PC-Ord
4.0.
4. Results and discussion
4.1. Concession age, legal and ownership status
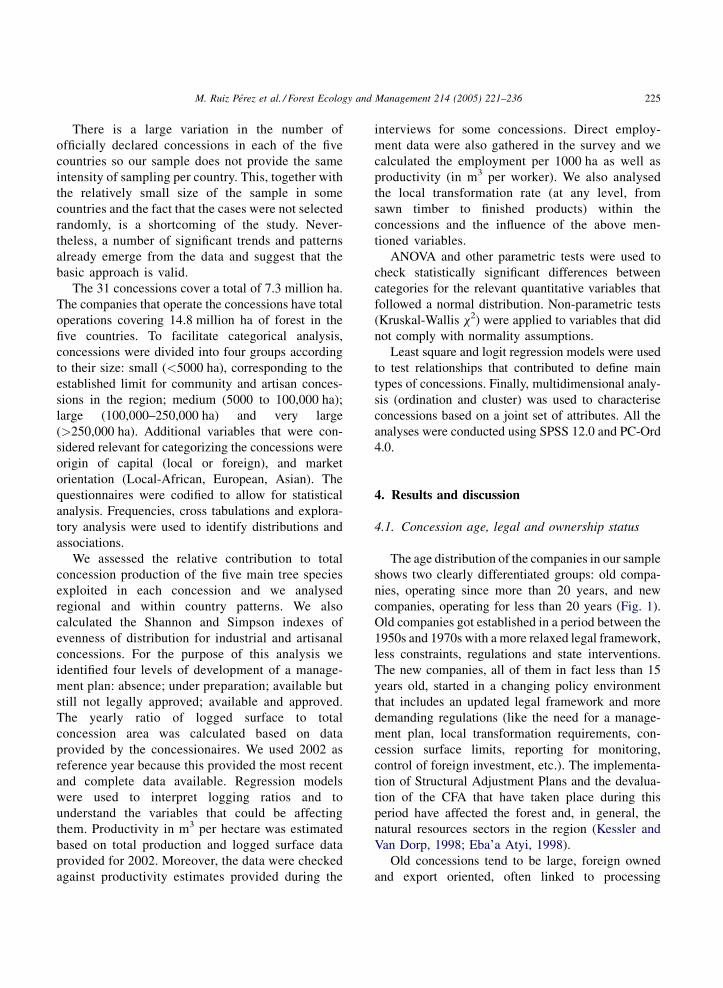
The age distribution of the companies in our sample
shows two clearly differentiated groups: old compa-
nies, operating since more than 20 years, and new
companies, operating for less than 20 years (Fig. 1).
Old companies got established in a period between the
1950s and 1970s with a more relaxed legal framework,
less constraints, regulations and state interventions.
The new companies, all of them in fact less than 15
years old, started in a changing policy environment
that includes an updated legal framework and more
demanding regulations (like the need for a manage-
ment plan, local transformation requirements, con-
cession surface limits, reporting for monitoring,
control of foreign investment, etc.). The implementa-
tion of Structural Adjustment Plans and the devalua-
tion of the CFA that have taken place during this
period have affected the forest and, in general, the
natural resources sectors in the region (Kessler and
Van Dorp, 1998; Eba’a Atyi, 1998).
Old concessions tend to be large, foreign owned
and export oriented, often linked to processing
M. Ruiz Perez et al. / Forest Ecology and Management 214 (2005) 221–236226
Fig. 1. Age of establishment of the company and total size of concessions held in the country.
facilities in Europe. Younger concessions are more
varied in size, ownership and markets, with significant
contribution of national capital. They also have greater
local processing capacity. This correlation of age with
several concessions’ variables is analysed more in
detail in the sections below.
4.2. Species
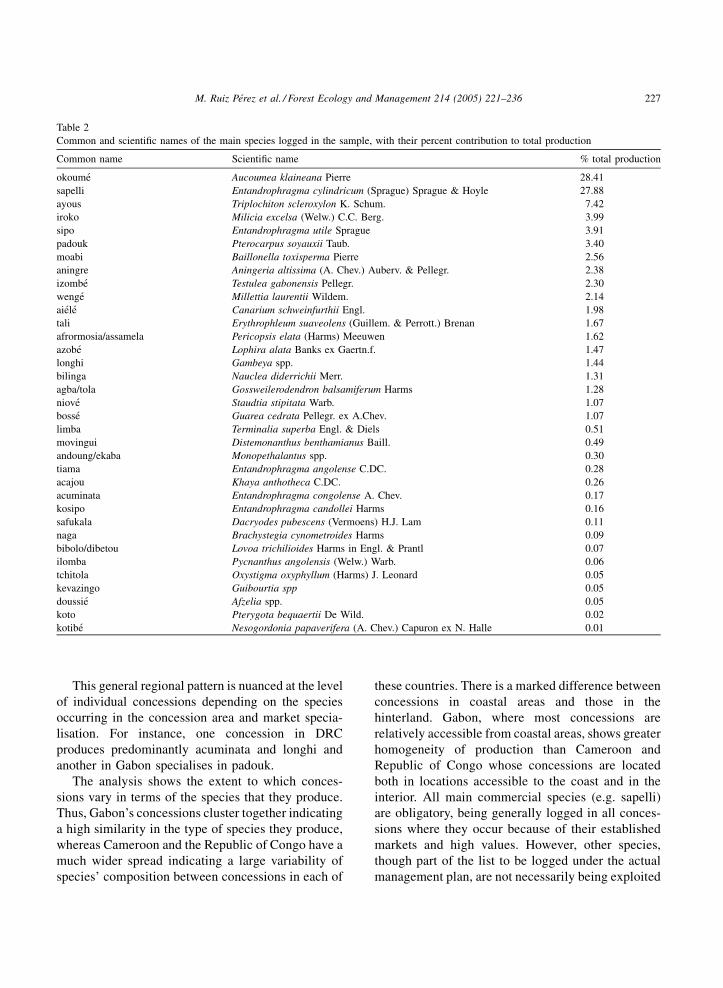
Thirty-five species amounted for 94.2% of the total
timber volume produced in the concessions sampled
(Table 2). The species logged by each concession
depend upon the combined effect of market demand
and species availability. The distribution of species,
the history of logging and differing market opportu-
nities result in differences between the countries. Two
species, okoume and sapelli, dominate the logging
industry representing 56.3% of total timber volume,
with these and four other species amounting to 3/4 of
total production.
The Republic of Congo (20 species) and
Cameroon (19 species) have the highest total number
of species logged (the sum of the first five species
logged by the concessions sampled in each country).
Sapelli and ayous are the most frequently logged in
these two countries, respectively. Concessions from
DRC produced a total of 14 species while CAR and
Gabon each produced a total of 10 species. These
two countries also show the highest dominance of
a single species. Gabon’s logging industry is
characterised by the production of okoume (74% of
total production), a species which is largely endemic
to this country with smaller populations in Republic
of Congo and Equatorial Guinea. CAR industry is
based on the production of sapelli (62% of total
production).
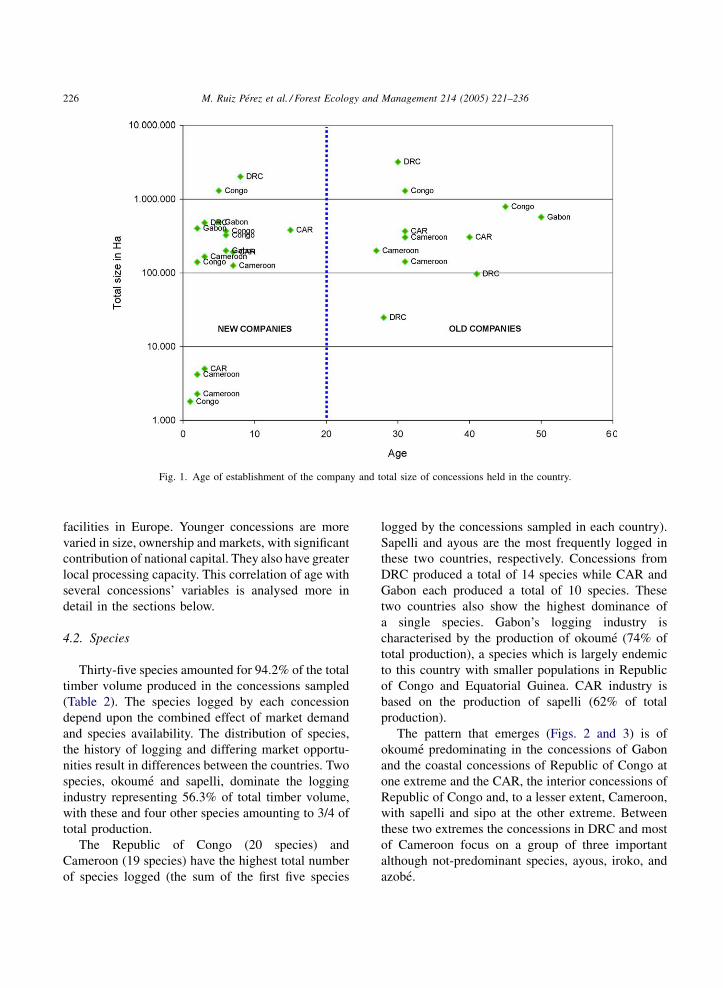
The pattern that emerges (Figs. 2 and 3) is of
okoume predominating in the concessions of Gabon
and the coastal concessions of Republic of Congo at
one extreme and the CAR, the interior concessions of
Republic of Congo and, to a lesser extent, Cameroon,
with sapelli and sipo at the other extreme. Between
these two extremes the concessions in DRC and most
of Cameroon focus on a group of three important
although not-predominant species, ayous, iroko, and
azobe.
M. Ruiz Perez et al. / Forest Ecology and Management 214 (2005) 221–236 227
Table 2
Common and scientific names of the main species logged in the sample, with their percent contribution to total production
Common name Scientific name % total production
okoume Aucoumea klaineana Pierre 28.41
sapelli Entandrophragma cylindricum (Sprague) Sprague & Hoyle 27.88
ayous Triplochiton scleroxylon K. Schum. 7.42
iroko Milicia excelsa (Welw.) C.C. Berg. 3.99
sipo Entandrophragma utile Sprague 3.91
padouk Pterocarpus soyauxii Taub. 3.40
moabi Baillonella toxisperma Pierre 2.56
aningre Aningeria altissima (A. Chev.) Auberv. & Pellegr. 2.38
izombe Testulea gabonensis Pellegr. 2.30
wenge Millettia laurentii Wildem. 2.14
aiele Canarium schweinfurthii Engl. 1.98
tali Erythrophleum suaveolens (Guillem. & Perrott.) Brenan 1.67
afrormosia/assamela Pericopsis elata (Harms) Meeuwen 1.62
azobe Lophira alata Banks ex Gaertn.f. 1.47
longhi Gambeya spp. 1.44
bilinga Nauclea diderrichii Merr. 1.31
agba/tola Gossweilerodendron balsamiferum Harms 1.28
niove Staudtia stipitata Warb. 1.07
bosse Guarea cedrata Pellegr. ex A.Chev. 1.07
limba Terminalia superba Engl. & Diels 0.51
movingui Distemonanthus benthamianus Baill. 0.49
andoung/ekaba Monopethalantus spp. 0.30
tiama Entandrophragma angolense C.DC. 0.28
acajou Khaya anthotheca C.DC. 0.26
acuminata Entandrophragma congolense A. Chev. 0.17
kosipo Entandrophragma candollei Harms 0.16
safukala Dacryodes pubescens (Vermoens) H.J. Lam 0.11
naga Brachystegia cynometroides Harms 0.09
bibolo/dibetou Lovoa trichilioides Harms in Engl. & Prantl 0.07
ilomba Pycnanthus angolensis (Welw.) Warb. 0.06
tchitola Oxystigma oxyphyllum (Harms) J. Leonard 0.05
kevazingo Guibourtia spp 0.05
doussie Afzelia spp. 0.05
koto Pterygota bequaertii De Wild. 0.02
kotibe Nesogordonia papaverifera (A. Chev.) Capuron ex N. Halle 0.01
This general regional pattern is nuanced at the level
of individual concessions depending on the species
occurring in the concession area and market specia-
lisation. For instance, one concession in DRC
produces predominantly acuminata and longhi and
another in Gabon specialises in padouk.
The analysis shows the extent to which conces-
sions vary in terms of the species that they produce.
Thus, Gabon’s concessions cluster together indicating
a high similarity in the type of species they produce,
whereas Cameroon and the Republic of Congo have a
much wider spread indicating a large variability of
species’ composition between concessions in each of
these countries. There is a marked difference between
concessions in coastal areas and those in the
hinterland. Gabon, where most concessions are
relatively accessible from coastal areas, shows greater
homogeneity of production than Cameroon and
Republic of Congo whose concessions are located
both in locations accessible to the coast and in the
interior. All main commercial species (e.g. sapelli)
are obligatory, being generally logged in all conces-
sions where they occur because of their established
markets and high values. However, other species,
though part of the list to be logged under the actual
management plan, are not necessarily being exploited
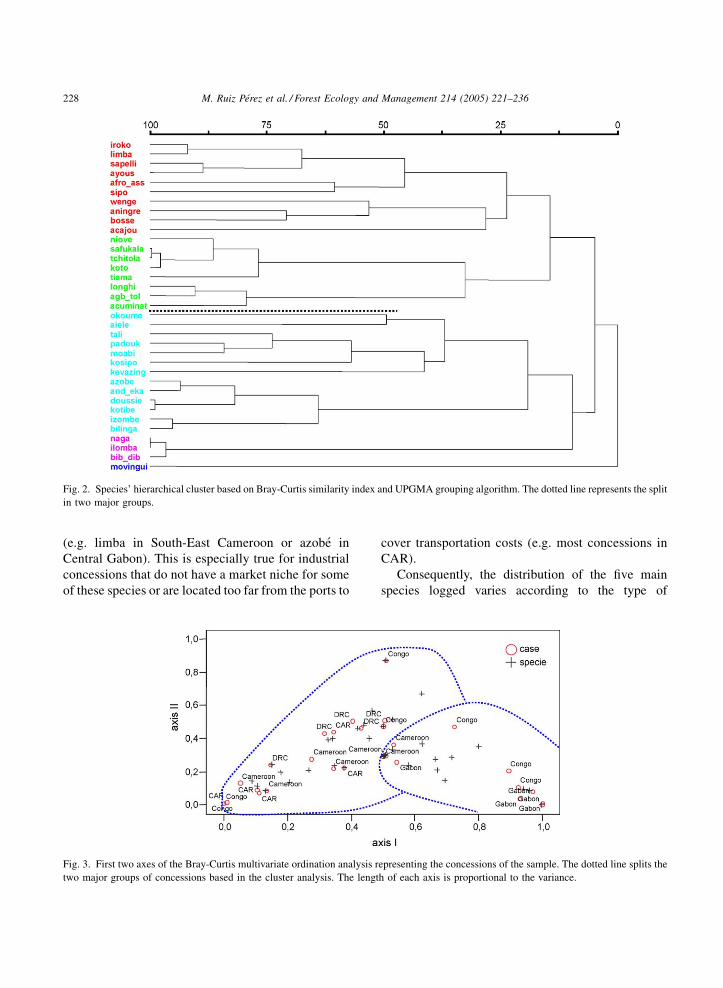
M. Ruiz Perez et al. / Forest Ecology and Management 214 (2005) 221–236228
Fig. 2. Species’ hierarchical cluster based on Bray-Curtis similarity index and UPGMA grouping algorithm. The dotted line represents the split
in two major groups.
(e.g. limba in South-East Cameroon or azobe in
Central Gabon). This is especially true for industrial
concessions that do not have a market niche for some
of these species or are located too far from the ports to
Fig. 3. First two axes of the Bray-Curtis multivariate ordination analysis r
two major groups of concessions based in the cluster analysis. The lengt
cover transportation costs (e.g. most concessions in
CAR).
Consequently, the distribution of the five main
species logged varies according to the type of
epresenting the concessions of the sample. The dotted line splits the
h of each axis is proportional to the variance.
M. Ruiz Perez et al. / Forest Ecology and Management 214 (2005) 221–236 229
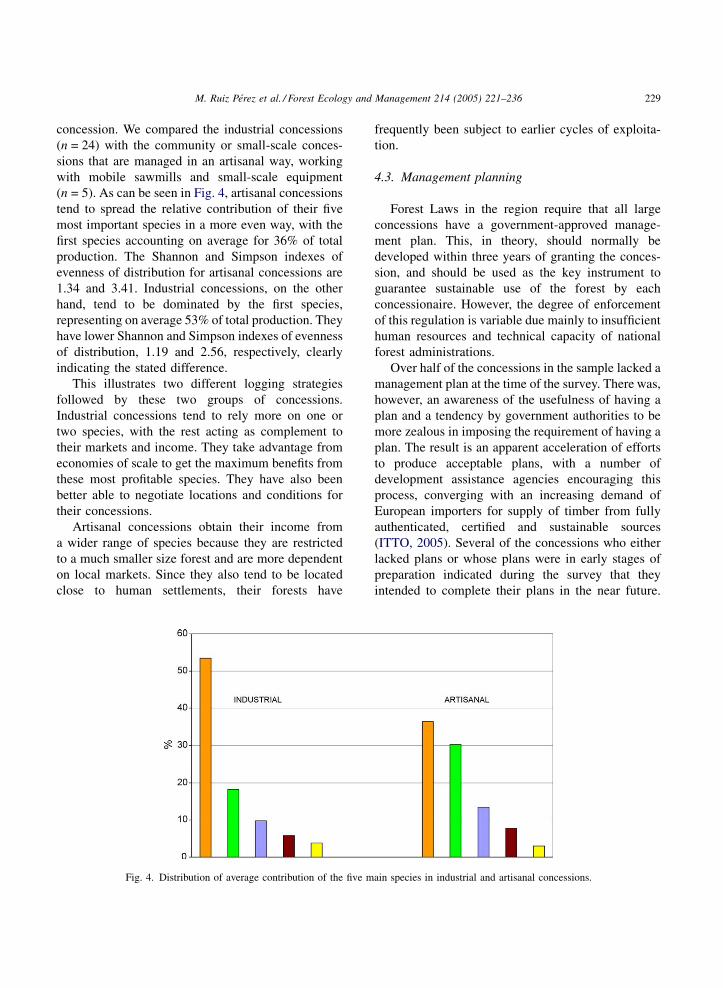
concession. We compared the industrial concessions
(n = 24) with the community or small-scale conces-
sions that are managed in an artisanal way, working
with mobile sawmills and small-scale equipment
(n = 5). As can be seen in Fig. 4, artisanal concessions
tend to spread the relative contribution of their five
most important species in a more even way, with the
first species accounting on average for 36% of total
production. The Shannon and Simpson indexes of
evenness of distribution for artisanal concessions are
1.34 and 3.41. Industrial concessions, on the other
hand, tend to be dominated by the first species,
representing on average 53% of total production. They
have lower Shannon and Simpson indexes of evenness
of distribution, 1.19 and 2.56, respectively, clearly
indicating the stated difference.
This illustrates two different logging strategies
followed by these two groups of concessions.
Industrial concessions tend to rely more on one or
two species, with the rest acting as complement to
their markets and income. They take advantage from
economies of scale to get the maximum benefits from
these most profitable species. They have also been
better able to negotiate locations and conditions for
their concessions.
Artisanal concessions obtain their income from
a wider range of species because they are restricted
to a much smaller size forest and are more dependent
on local markets. Since they also tend to be located
close to human settlements, their forests have
Fig. 4. Distribution of average contribution of the five m
frequently been subject to earlier cycles of exploita-
tion.
4.3. Management planning
Forest Laws in the region require that all large
concessions have a government-approved manage-
ment plan. This, in theory, should normally be
developed within three years of granting the conces-
sion, and should be used as the key instrument to
guarantee sustainable use of the forest by each
concessionaire. However, the degree of enforcement
of this regulation is variable due mainly to insufficient
human resources and technical capacity of national
forest administrations.
Over half of the concessions in the sample lacked a
management plan at the time of the survey. There was,
however, an awareness of the usefulness of having a
plan and a tendency by government authorities to be
more zealous in imposing the requirement of having a
plan. The result is an apparent acceleration of efforts
to produce acceptable plans, with a number of
development assistance agencies encouraging this
process, converging with an increasing demand of
European importers for supply of timber from fully
authenticated, certified and sustainable sources
(ITTO, 2005). Several of the concessions who either
lacked plans or whose plans were in early stages of
preparation indicated during the survey that they
intended to complete their plans in the near future.
ain species in industrial and artisanal concessions.
M. Ruiz Perez et al. / Forest Ecology and Management 214 (2005) 221–236230
Cameroon showed the highest level of compliance;
this again could be due in part to the composition of
the sample, since there are two community conces-
sions from this country (the only one having such type
of concessions) that require the existence of a
government approved management plan before
granting logging rights. Given the size and distribution
of the sample, differences between countries are not
statistically significant (x2 = 17.096; p = 0.15).
In addition to variations between countries, there
are correlations between lack of a management plan
and other concession features. The probability of
developing a management plan (functional or in
progress) increases with foreign owned companies
(x2 = 6.573; p = 0.09) as well as, to a lesser extent,
with age of concession (x2 = 5.179; p = 0.16).
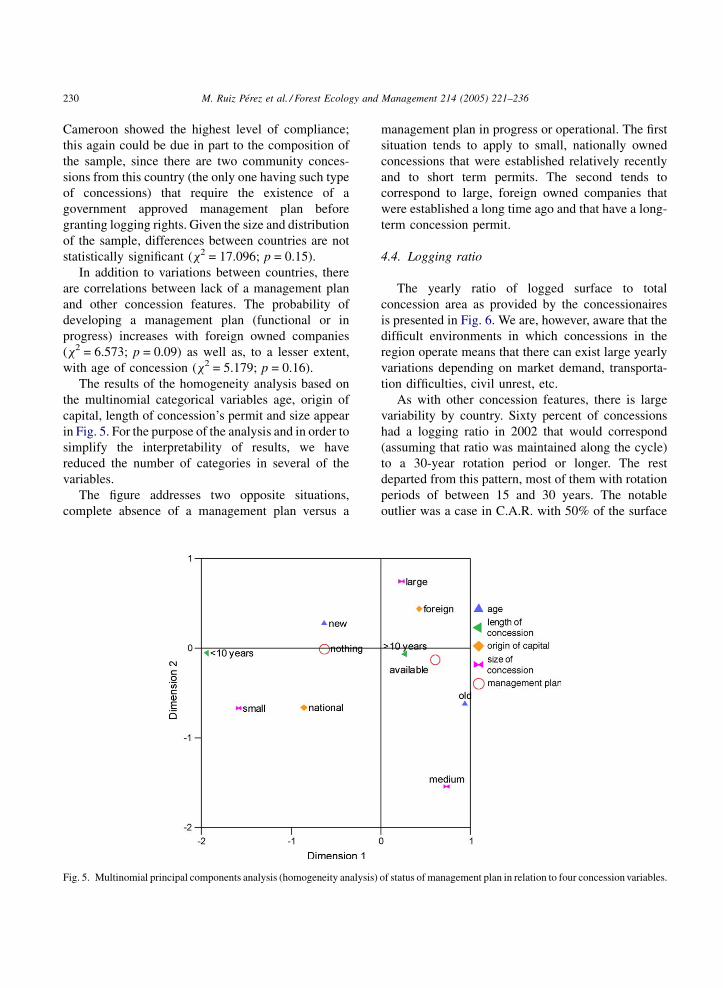
The results of the homogeneity analysis based on
the multinomial categorical variables age, origin of
capital, length of concession’s permit and size appear
in Fig. 5. For the purpose of the analysis and in order to
simplify the interpretability of results, we have
reduced the number of categories in several of the
variables.
The figure addresses two opposite situations,
complete absence of a management plan versus a
Fig. 5. Multinomial principal components analysis (homogeneity analysis)
management plan in progress or operational. The first
situation tends to apply to small, nationally owned
concessions that were established relatively recently
and to short term permits. The second tends to
correspond to large, foreign owned companies that
were established a long time ago and that have a long-
term concession permit.
4.4. Logging ratio
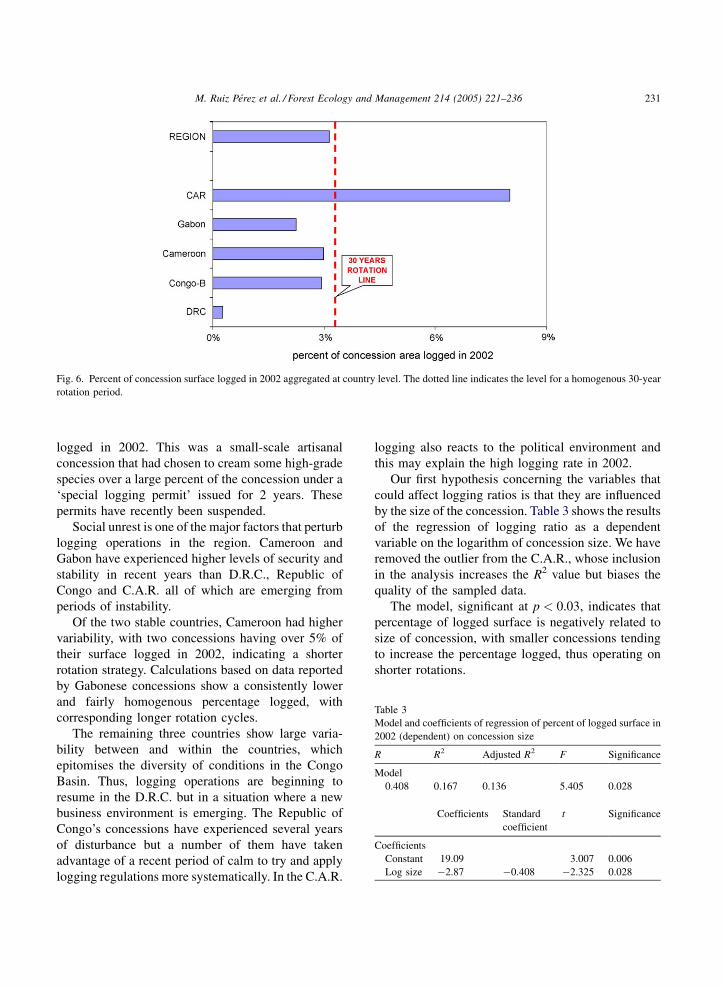
The yearly ratio of logged surface to total
concession area as provided by the concessionaires
is presented in Fig. 6. We are, however, aware that the
difficult environments in which concessions in the
region operate means that there can exist large yearly
variations depending on market demand, transporta-
tion difficulties, civil unrest, etc.
As with other concession features, there is large
variability by country. Sixty percent of concessions
had a logging ratio in 2002 that would correspond
(assuming that ratio was maintained along the cycle)
to a 30-year rotation period or longer. The rest
departed from this pattern, most of them with rotation
periods of between 15 and 30 years. The notable
outlier was a case in C.A.R. with 50% of the surface
of status of management plan in relation to four concession variables.
M. Ruiz Perez et al. / Forest Ecology and Management 214 (2005) 221–236 231
Fig. 6. Percent of concession surface logged in 2002 aggregated at country level. The dotted line indicates the level for a homogenous 30-year
rotation period.
Table 3
Model and coefficients of regression of percent of logged surface in
2002 (dependent) on concession size
R R2 Adjusted R2 F Significance
Model
0.408 0.167 0.136 5.405 0.028
Coefficients Standard
coefficient
t Significance
Coefficients
Constant 19.09 3.007 0.006
Log size �2.87 �0.408 �2.325 0.028
logged in 2002. This was a small-scale artisanal
concession that had chosen to cream some high-grade
species over a large percent of the concession under a
‘special logging permit’ issued for 2 years. These
permits have recently been suspended.
Social unrest is one of the major factors that perturb
logging operations in the region. Cameroon and
Gabon have experienced higher levels of security and
stability in recent years than D.R.C., Republic of
Congo and C.A.R. all of which are emerging from
periods of instability.
Of the two stable countries, Cameroon had higher
variability, with two concessions having over 5% of
their surface logged in 2002, indicating a shorter
rotation strategy. Calculations based on data reported
by Gabonese concessions show a consistently lower
and fairly homogenous percentage logged, with
corresponding longer rotation cycles.
The remaining three countries show large varia-
bility between and within the countries, which
epitomises the diversity of conditions in the Congo
Basin. Thus, logging operations are beginning to
resume in the D.R.C. but in a situation where a new
business environment is emerging. The Republic of
Congo’s concessions have experienced several years
of disturbance but a number of them have taken
advantage of a recent period of calm to try and apply
logging regulations more systematically. In the C.A.R.
logging also reacts to the political environment and
this may explain the high logging rate in 2002.
Our first hypothesis concerning the variables that
could affect logging ratios is that they are influenced
by the size of the concession. Table 3 shows the results
of the regression of logging ratio as a dependent
variable on the logarithm of concession size. We have
removed the outlier from the C.A.R., whose inclusion
in the analysis increases the R2 value but biases the
quality of the sampled data.
The model, significant at p < 0.03, indicates that
percentage of logged surface is negatively related to
size of concession, with smaller concessions tending
to increase the percentage logged, thus operating on
shorter rotations.
M. Ruiz Perez et al. / Forest Ecology and Management 214 (2005) 221–236232
Table 4
General Linear Regression model of percent of logged surface in
2002 (dependent) on concession size, country and market
MODEL
R2 Adjusted R2 F Significance
0,722 0,542 4,014 0,005
Coefficients Significance
Coefficients F
Constant 25,899 26,024 0,000
Log concession size �5,608 19,258 0,000
Country market 6,209 0,003
2,451 0,116
Country* market 0,996 0,437
We also examined other variables that could
influence logging ratios. Two potentially important
variables are country (where we have already noticed
significant differences) and market demand, repre-
sented by the regional market focus as a proxy
variable. The results of general linear regression
models for categorical variables are showed in Table 4.
The model, significant at p < 0.001, confirms the
dependence of logging ratio on concession size and
country and to a lesser extent market orientation,
whereas the interaction between country and market
does not contribute in a significant way to the new
model. This could lead to the formulation of a new
research hypothesis that would link logged surface (a
potential indicator of sustainability) to country context.
There are indications of a general trend for large-scale
concessions to respect cutting area rules whereas small
concessions may be less inclined to do so.
In line with the above, market orientation as a
categorical variable has been explored to analyse in
more detail the possible differences in logging ratios
according to the predominant destination market. Local
market oriented concessions tend to have lower logging
ratios than European or Asian markets oriented
concessions, although given the small size of the
sample the differences are statistically not significant.
4.5. Productivity
Estimates of productivity values fall between less
than 0.1 m3/ha (the outlier mentioned before, corre-
sponding to a small concession that logs a large
percent but extracts very few logs) and 13 m3/ha. The
average productivity of the sample is 6.1 m3/ha, which
falls within usual productivity estimates for the region
(Dupuy, 1998; Drouineau et Nasi, 1999; Durrieu de
Madron et al., 2000). Gabon, logging fewer species
and concentrating on okoume, shows a consistently
higher productivity than the other countries, while
C.A.R., also logging few species and specialising in
sapelli, shows the lowest productivity per hectare. The
differences are statistically significant (Kruskal-Wallis
p = 0.003) and largely explained by the nature of the
species (more gregarious in the case of okoume, more
dispersed for sapelli).
The validity of information on employment per
1000 ha as well as on productivity was limited by two
cases where forest-based employment was mixed with
total employment (including processing industry)
data. Nevertheless, we include country comparisons
to advance some working hypotheses.
Mean and median employment is 2.7 workers/
1000 ha and 1.2 workers/1000 ha, respectively, with
country differences that are not statistically signifi-
cant. Mean and median productivity is 146 m3/worker
and 131 m3/worker, respectively. Country variations
are more marked here, differentiating a group of three
countries (Republic of Congo, Cameroon and Gabon)
with high productivity per worker (that could indicate
a more modern and efficient industry) from D.R.C.
with very low productivity. This difference is
statistically significant. C.A.R. lies in an intermediate
position. Larger variations in productivity in Republic
of Congo and C.A.R. may indicate the co-existence of
both a modern and a less advanced industry in these
two countries.
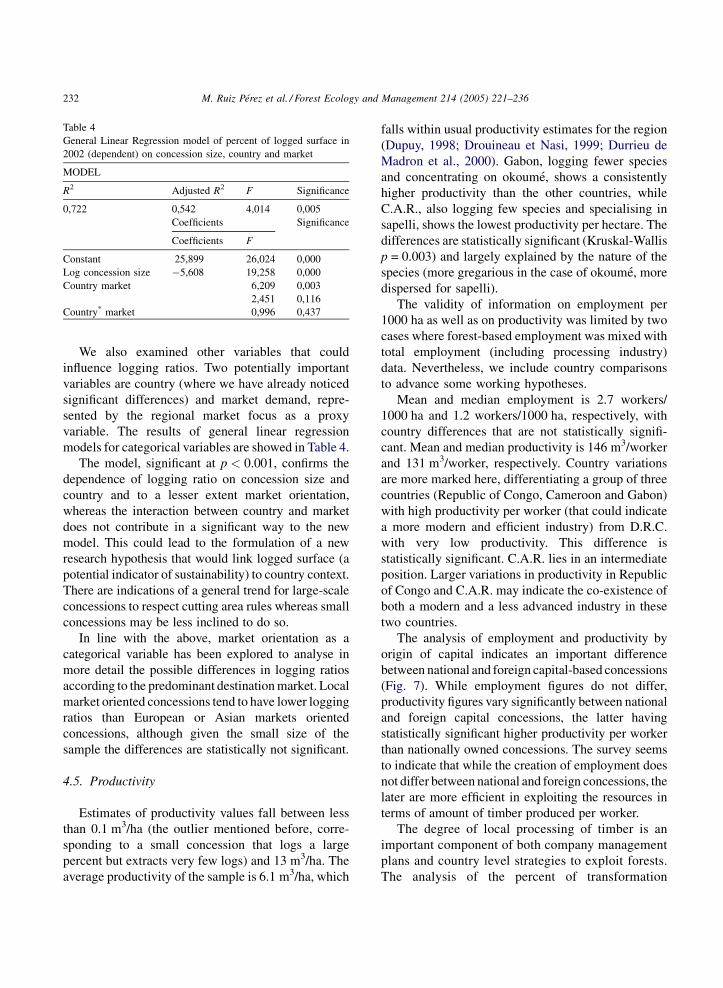
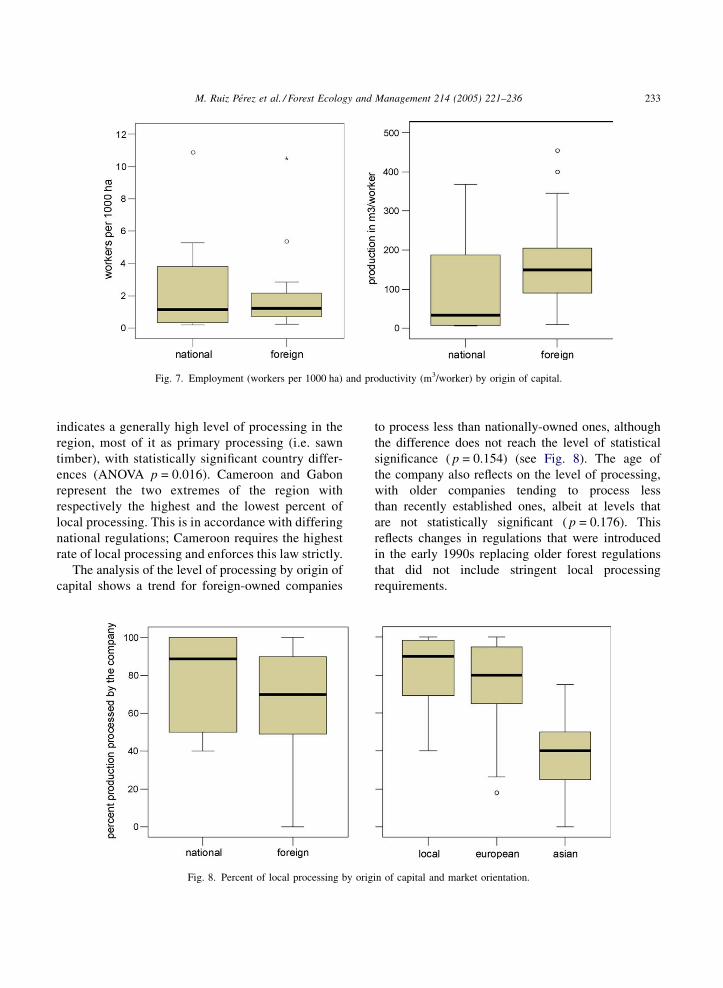
The analysis of employment and productivity by
origin of capital indicates an important difference
between national and foreign capital-based concessions
(Fig. 7). While employment figures do not differ,
productivity figures vary significantly between national
and foreign capital concessions, the latter having
statistically significant higher productivity per worker
than nationally owned concessions. The survey seems
to indicate that while the creation of employment does
not differ between national and foreign concessions, the
later are more efficient in exploiting the resources in
terms of amount of timber produced per worker.
The degree of local processing of timber is an
important component of both company management
plans and country level strategies to exploit forests.
The analysis of the percent of transformation
M. Ruiz Perez et al. / Forest Ecology and Management 214 (2005) 221–236 233
Fig. 7. Employment (workers per 1000 ha) and productivity (m3/worker) by origin of capital.
indicates a generally high level of processing in the
region, most of it as primary processing (i.e. sawn
timber), with statistically significant country differ-
ences (ANOVA p = 0.016). Cameroon and Gabon
represent the two extremes of the region with
respectively the highest and the lowest percent of
local processing. This is in accordance with differing
national regulations; Cameroon requires the highest
rate of local processing and enforces this law strictly.
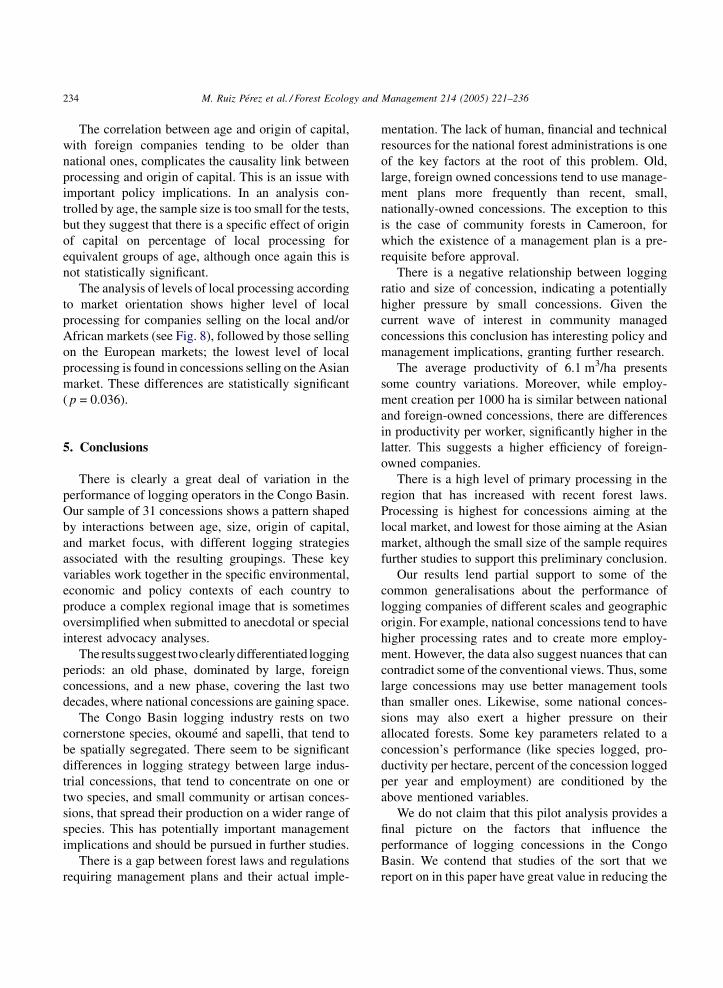
The analysis of the level of processing by origin of
capital shows a trend for foreign-owned companies
Fig. 8. Percent of local processing by orig
to process less than nationally-owned ones, although
the difference does not reach the level of statistical
significance ( p = 0.154) (see Fig. 8). The age of
the company also reflects on the level of processing,
with older companies tending to process less
than recently established ones, albeit at levels that
are not statistically significant ( p = 0.176). This
reflects changes in regulations that were introduced
in the early 1990s replacing older forest regulations
that did not include stringent local processing
requirements.
in of capital and market orientation.
M. Ruiz Perez et al. / Forest Ecology and Management 214 (2005) 221–236234
The correlation between age and origin of capital,
with foreign companies tending to be older than
national ones, complicates the causality link between
processing and origin of capital. This is an issue with
important policy implications. In an analysis con-
trolled by age, the sample size is too small for the tests,
but they suggest that there is a specific effect of origin
of capital on percentage of local processing for
equivalent groups of age, although once again this is
not statistically significant.
The analysis of levels of local processing according
to market orientation shows higher level of local
processing for companies selling on the local and/or
African markets (see Fig. 8), followed by those selling
on the European markets; the lowest level of local
processing is found in concessions selling on the Asian
market. These differences are statistically significant
( p = 0.036).
5. Conclusions
There is clearly a great deal of variation in the
performance of logging operators in the Congo Basin.
Our sample of 31 concessions shows a pattern shaped
by interactions between age, size, origin of capital,
and market focus, with different logging strategies
associated with the resulting groupings. These key
variables work together in the specific environmental,
economic and policy contexts of each country to
produce a complex regional image that is sometimes
oversimplified when submitted to anecdotal or special
interest advocacy analyses.
Theresults suggest twoclearlydifferentiated logging
periods: an old phase, dominated by large, foreign
concessions, and a new phase, covering the last two
decades, where national concessions are gaining space.
The Congo Basin logging industry rests on two
cornerstone species, okoume and sapelli, that tend to
be spatially segregated. There seem to be significant
differences in logging strategy between large indus-
trial concessions, that tend to concentrate on one or
two species, and small community or artisan conces-
sions, that spread their production on a wider range of
species. This has potentially important management
implications and should be pursued in further studies.
There is a gap between forest laws and regulations
requiring management plans and their actual imple-
mentation. The lack of human, financial and technical
resources for the national forest administrations is one
of the key factors at the root of this problem. Old,
large, foreign owned concessions tend to use manage-
ment plans more frequently than recent, small,
nationally-owned concessions. The exception to this
is the case of community forests in Cameroon, for
which the existence of a management plan is a pre-
requisite before approval.
There is a negative relationship between logging
ratio and size of concession, indicating a potentially
higher pressure by small concessions. Given the
current wave of interest in community managed
concessions this conclusion has interesting policy and
management implications, granting further research.
The average productivity of 6.1 m3/ha presents
some country variations. Moreover, while employ-
ment creation per 1000 ha is similar between national
and foreign-owned concessions, there are differences
in productivity per worker, significantly higher in the
latter. This suggests a higher efficiency of foreign-
owned companies.
There is a high level of primary processing in the
region that has increased with recent forest laws.
Processing is highest for concessions aiming at the
local market, and lowest for those aiming at the Asian
market, although the small size of the sample requires
further studies to support this preliminary conclusion.
Our results lend partial support to some of the
common generalisations about the performance of
logging companies of different scales and geographic
origin. For example, national concessions tend to have
higher processing rates and to create more employ-
ment. However, the data also suggest nuances that can
contradict some of the conventional views. Thus, some
large concessions may use better management tools
than smaller ones. Likewise, some national conces-
sions may also exert a higher pressure on their
allocated forests. Some key parameters related to a
concession’s performance (like species logged, pro-
ductivity per hectare, percent of the concession logged
per year and employment) are conditioned by the
above mentioned variables.
We do not claim that this pilot analysis provides a
final picture on the factors that influence the
performance of logging concessions in the Congo
Basin. We contend that studies of the sort that we
report on in this paper have great value in reducing the
M. Ruiz Perez et al. / Forest Ecology and Management 214 (2005) 221–236 235
level of uncertainty and value-based judgements in the
debates about the role of industrial logging in
supporting local economies and livelihoods and
conserving the environment. They can reveal patterns
in the performance of concessionaires that have major
policy significance.
Understanding the factors that tend to be associated
with or to drive bad logging practices is essential if
these practices are to be improved. This will require
further studies conducted by multi-disciplinary teams
in which nationals of the countries concerned are fully
involved. The paragraphs above have indicated some
of the key future lines of research.
Acknowledgements
We acknowledge ITTO support to conduct the pilot
study leading to this paper. We also would like to thank
the concession managers who collaborated by
responding to the questionnaire and clarifying all
the issues that were raised with them.
References
Alden-Wily, L., 2003. Participatory Forest Management in Africa:
An Overview of Progress and Issues. FAO, Rome.
ATIBT, 2004. Statistiques 2003. La lettre de l’ATIBT, ete 2004 no.
20. Association Technique Internationale des Bois Tropicaux.
Barnes, R.F.W., Beardsley, K., Michelmore, F., Barnes, K.L., Alers,
M.P.T., Blom, A., 1997. Estimating forest elephant numbers with
dung counts and a geographic information system. J. Wildl.
Manage. 61 (4), 1384–1393.
Brown, D., Williams, A., 2003. The case for bushmeat as a compo-
nent of development policy: issues and challenges. Int. Forestry
Rev. 5 (2), 148–155.
Bruner, A.G., Gullison, R.E., Rice, R.E., da Fonseca, G.A.B., 2001.
Effectiveness of parks in protecting tropical biodiversity.
Science 291, 125–128.
Cannon, C.H., Peart, D.R., Leighton, M., 1998a. Tree species
diversity in commercially logged Bornean rainforest. Science
281, 1366–1368.
Cannon, J., Gullison, R., Rice, R., 1998b. Conservation and Logging
in Tropical Forests. Conservation International, for the World
Bank, Washington, DC.
Colchester, M., 2001. Forest industries, indigenous peoples and
human rights. Thematic paper presented at a workshop on
Indigenous peoples, private sector natural resource, energy
and mining companies and human rights. UNCTAD, ILO and
WTO, Geneva, pp. 1–30.
Counsell, S., Loraas, K.T. (Eds.), 2002. Trading in Credibility: The
Myth and Reality About the Forest Stewardship Council. The
Rainforest Foundation, London and Oslo.
Drouineau, S., Nasi, R., en collaboration avec Legault F., Cazet M.,
1999. L’amenagement forestier au Gabon – historique, bilan, pers-
pectives. Cirad, Montpellier, France. Document Forafri, 19, 64 p.
Dupuy B., 1998. Bases pour une sylviculture en foret dense tropicale
humide africaine. Cirad, Montpellier, France. Document Forafri,
4, 328 p.
Durrieu de Madron, L., Forni, E., 1998. Les techniques d’exploita-
tion a impact reduit en foret dense humide africaine. Document
FORAFRI no. 17, Montpellier.
Durrieu de Madron, L., Fontez, B., Dipapounji, B., 2000. Degats
d’exploitation et de debardage en fonction de l’intensite
d’exploitation en foret dense humide d’Afrique Centrale. Bois
et Forets des Tropiques 264, 57–60.
Eba’a Atyi, R., 1998. Cameroon’s Logging Industry: Structure:
Economic Importance and Effects of Devaluation. Centre for
International Forestry Research, Yaounde.
FAO, 2003. African Forests, a view to 2020. Forestry Outlook Study
for Africa (FOSA). European Commission, African Develop-
ment Bank, FAO, Rome.
Van Gemerden, B.S., Shu, G.N., Olff, H., 2003. Recovery of
conservation values in Central African rain forest after logging
and shifting cultivation. Biodivers. Conserv. 12 (8), 1553–1570.
Global Forest Watch, 2000a. An Overview of Logging in Cameroon.
World Resource Institute, Washington, DC.
Global Forest Watch, 2000b. A First Look at Logging in Gabon.
World Resource Institute, Washington, DC.
Greenpeace Switzerland, 2004. Greenpeace Switzerland blockades
import of African timber. Available from: http://archive.green
peace.org/forests/africa/resources.htm.
Gullison, T., Melnyk, M., Wong, C., 2001. Logging Off: Mechan-
isms to Stop or Prevent Industrial Logging in Forests of High
Conservation Value. Union of Concerned Scientists and Smith-
sonian’s Center for Tropical Forest Science. UCS Publications,
Cambridge, USA.
ITTO, 2003. Annual Review and Assessment of the World Timber
Situation 2003. ITTO, Yokohama.
ITTO, 2005. Tropical Timber Market Report. ITTO, Yokohama.
Kessler, J.J., Van Dorp, M., 1998. Structural adjustment and the
environment: the need for an analytical methodology. Ecol.
Econ. 27 (3), 267–281.
Matthews, A., Matthews, A., 2004. Survey of gorillas (Gorilla
gorilla gorilla) and chimpanzees (Pan troglodytes troglodytes)
in Southwestern Cameroon. Primates 45 (1), 15–24.
Pearce, D., Putz, F.E., Vanclay, J.K., 2003. Sustainable forestry in
the tropics: Panacea or folly? For. Ecol. Manage. 172, 229–247.
Putz, F., Dykstra, D., Heinrich, R., 2000. Why poor logging prac-
tices persist in the tropics? Conserv. Biol. 14 (4), 951–958.
Rice, R.E., Gullison, R.E., Reid, J.W., 1997. Can sustainable
management save tropical rainforests? Sci. Am. 276, 34–39.
Richards, M., 2000. Can sustainable tropical forestry be made
profitable? The potential and limitations of innovative incentive
mechanisms. World Dev. 28 (6), 1001–1016.
Schwab, O., Pulkki, R., Bull, G.Q., 2001. Reduced Impact Logging
in Tropical Forests: Literature Synthesis, Analysis and Prototype
M. Ruiz Perez et al. / Forest Ecology and Management 214 (2005) 221–236236
Statistical Framework. FAO Forest Products Division, Working
Paper FOP/08. FAO, Rome.
Sist, P., 2000a. Reduced-impact logging in the tropics: objectives,
principles and impacts. Int. Forestry Rev. 2 (1), 3–10.
Sist, P., 2000b. Les techniques d’exploitation a faible impact. Bois et
Forets des Tropiques 265 (3), 31–41.
White, L.J.T., 1992. Vegetation history and logging disturbance.
Effects on rain forest mammals in the Lope Reserve, Gabon.
Unpublished Ph.D. thesis.
World Bank Africa Database, 2002. Available from: http://www.
worldbank.org/data/countrydata/aag.