Online Appendix Democracy and Trade Policy at the Product ...
Upload
khangminh22Category
view
1download
0
Timber Trade Policy and Illegality:A study of data discrepancies in Indonesia’s top trade relationships.
Micah Stanovsky
A thesis submitted in partial fulfillment of the requirements for the degree of:
Master of Science
University of Washington
2021
Committee:Indroneil GangulyJohn Hermanson
Kent WheilerDavid Layton
Program Authorized to Offer Degrees:Environmental and Forest Sciences
1

© Copyright 2021
Micah Stanovsky
2

University of Washington
Abstract
Timber Trade Policy and Illegality:A study of data discrepancies in Indonesia’s top trade relationships.
Micah Stanovsky
Chair of the Supervisory Committee:Dr. Indroneil Ganguly
School of Environmental and Forest Sciences
Illegal timber trade is tied to forest loss and degradation, and contributes to negative
impacts on social, economic, ecological, and climate systems. Despite growing
international awareness and policies designed to prevent illegal timber from entering
markets, the problem is persistent and difficult to detect. This study expands on
previous efforts to identify signs of illegality in national trade discrepancies through
analysis of imbalances between import and export data reported by Indonesia and its
largest national timber trade partners.
The goals of this research are to 1) Measure the effectiveness of national policies in
curbing trade of illegal timber products from Indonesia, 2) Identify Indonesia’s national
timber trade partners and products that exhibit a high risk of illegality, and 3) Evaluate
the efficacy and appropriateness of discrepancy analysis as a means to estimate and
pinpoint illegal timber trade. We analyzed trade data for logs, lumber and plywood, as
well as relevant policies in Indonesia and eleven of its most important timber trade
3

partners from the years 2000 - 2019. Through data visualization and statistical analysis,
we identify that Indonesian lumber exports are at the highest risk of illegality; that China
is Indonesia’s highest-risk trade partner; that specific national policies do contribute to
discrepancy reduction between specific nations; and that single-nation trade import
policies may drive leakage of illegal timber from regulated to less regulated markets.
Further work to more precisely quantify the extent and sources of “normality” in
discrepancies would enable a clearer parsing of illegal or risky discrepancies.
Understanding this data to be non-normally distributed, future application of
nonparametric statistical testing would be a valuable contribution. Additional research
on the presence and magnitude of leakage resulting from specific policies will be vital to
ongoing efforts to reduce tropical forest loss resulting from illegal trade.
4

Table of Contents
Abstract 4Table of Contents 5List of Figures 7List of Tables 8Section 1. Introduction 9
Global Forest Loss & Indonesia 10Illegal Logging & Wood Product Trade 10
Section 2. Indonesian Forest Policy Review 12Suharto & the New Order 13Reform Era to Present 16
Section 3. National Partner Policies 19Top Wood Products Trade Partners 19Australia 20China 21EU 28 22India 24Japan 25Malaysia 26Republic of Korea 26Singapore 27Taiwan 28Thailand 28United States 29
Section 4: Data Overview 30Data Source Reliability 30Custom HS Code Groupings into “Items” 31Visual Analysis of Preliminary Data 32
Section 5. Methods 37Challenges Using Trade Data to Identify Illegality 37Other Data Issues 43Data Preparation 44Data Non-Linearity 46Visualizations 52Policy Periods 53Statistical Test Series 54
Section 6. Analysis: Indonesian Timber Trade Discrepancies 2000 - 2019 55Discrepancies Visualization 56
View 1: Shares of Export Value Compared to Discrepancy Scores 57View 1 Summary Observations and Conclusions 59
View 2: Aggregated Discrepancy Scores 60
5

View 2 Summary Observations and Conclusions 60View 3: Products 61
View 3 Summary Observations and Conclusions 62View 4: Partners 63
View 4 Summary Observations and Conclusions 75Discrepancies Statistical Testing 76
Tests Series 1: ANOVA Tests on Effect of Time Period on Mean Discrepancy Scoresby Partner 77
Test Series 1 Summary Observations and Conclusions 78Test Series 2: ANOVA on Discrepancy Scores for Product Categories across TimePeriods 79
Test Series 2 Summary Observations and Conclusions 80Test Series 3: ANOVA test on Lumber Discrepancy Scores by Partner 82
Test Series 3 Summary Observations and Conclusions 83Test Series 4: T-Tests on Indonesia Policies, Lumber Only & All Partners 85
Test Series 3 Summary Observations and Conclusions 85Test Series 5: T-Tests on Partner Policies, Lumber Only 86
Test Series 3 Summary Observations and Conclusions 87Figure 44: Taiwan Lumber Discrepancy Scores Before & After 2009 LaceyImplementation 90
Test Series 6: T-Tests on No-Policy partners 90Section 7. Conclusion 93
How effective are national policies at curbing Indonesian illegal timber trade? 93Which specific Partners and Products exhibit the highest risk of illegal timber importsfrom Indonesia? 95How effective is Discrepancy Analysis for identifying illegality in timber supply chains? 95Further Research 96
Appendix 1: HS Code C4 Product Category Sorting 97
Appendix 2. Policy Dates for Analysis 98
Appendix 3. View 3, Product View 100
Citations 103
6

List of FiguresFigure 1: Indonesian Wood Exports History 13Figure 2: Indonesia’s Top Timber Trade Partners by Export Value 19Figure 3: GTA Data Source Validation 32Figure 4: Indonesia Timber Exports OVer Study Period 33Figure 5: Percent Value of Timber Export and Import by Product 34Figure 6: Export Value by Partner over Study Period 35Figure 7: Export-Import Value Comparison, Aggregated Products 36Figure 8: Export-Import Value Comparison, Separated by Product 37Figure 9: National Discrepancy Rates compared to Linear Model 47Figure 10: Product Discrepancy Rates compared to Linear Model 48Figure 11: Distribution of Discrepancy Rates 49Figure 12: Indonesian Log Discrepancy Rates 2000-2019 50Figure 13: Distribution of Discrepancy Scores 51Figure 14: Discrepancy Scores Compared to Linear Model 51Figure 15: Discrepancy Risk Zones Example 53Figure 16: Product Percent of Export Values and Discrepancy Scores 57Figure 17: Partner Percent of Export Values and Discrepancy Scores 59Figure 18: Mean Annual Discrepancy Scores of Aggregated Timber Products 61Figure 19: Mean Annual Discrepancy Scores of Logs, Lumber, and Plywood 63Figure 20: Australia Discrepancy Scores 64Figure 21: China Discrepancy Scores 66Figure 22: EU Discrepancy Scores 67Figure 23: India Discrepancy Scores 68Figure 24: Japan Discrepancy Scores 69Figure 25: Korea Discrepancy Scores 70Figure 26: Malaysia Discrepancy Scores 71Figure 27: Singapore Discrepancy Scores 72Figure 28: Taiwan Discrepancy Scores 73Figure 29: Thailand Discrepancy Scores 74Figure 30: United States Discrepancy Scores 75Figure 31: Tukey HSD Aggregated Product Policy Period Comparison 82Figure 32: Tukey HSD Lumber Time Periods Comparison 82Figure 33: Tukey HSD India Lumber Time Periods Comparison 85Figure 34: Discrepancy Score Ranges Before & After 2005 86Figure 35: Discrepancy Score Ranges Before & After 2013 86Figure 37: EU Lumber Discrepancy Scores Before & After 2014 VPA Implementation 89Figure 38 : Japan Lumber Discrepancy Scores Before & After 2006 Goho Wood 89
7
Figure 39: Japan Lumber Discrepancy Scores Before & After 2017 Clean Wood Act 89Figure 40: Korea Lumber Discrepancy Scores Before & After 2012 ASUT 90Figure 41: Korea Lumber Discrepancy Scores Before & After 2018 ASUT Amendment 90Figure 42: Malaysia Lumber Discrepancy Scores Before & After 2002-03 Bans 90Figure 43: Taiwan Lumber Discrepancy Scores Before & After 2010 FTA Amendment 90Figure 44: Taiwan Lumber Discrepancy Scores Before & After 2009 Lacey Implementation 91Figure 45: China Lumber Discrepancy Scores Before & After 2005 Enforcement Order 92Figure 46: China Lumber Discrepancy Scores Before & After 2013 SVLK Implementation 92Figure 47: India Lumber Discrepancy Scores Before & After 2005 Enforcement Order 93Figure 48: India Lumber Discrepancy Scores Before & After 2013 SVLK Implementation 93Figure 49: Singapore Lumber Discrepancy Scores Before & After 2005 Enforcement Order 93Figure 50: Singapore Lumber Discrepancy Scores Before & After 2013 SVLK Implementation 93Figure 51: Thailand Lumber Discrepancy Scores Before & After 2005 Enforcement Order 93Figure 52: Thailand Lumber Discrepancy Scores Before & After 2013 SVLK Implementation 93
List of TablesTable 1: Test Series 1 ANOVA Results 78Table 2: Test Series 1 Tukey HSD Results 79Table 3: Test Series 2 ANOVA Results 81Table 4: Test Series 2 Tukey HSD Results 81Table 5: Test Series 3 ANOVA Results 84Table 6: Test Series 3 Tukey HSD Results 84Table 7: Test Series 4 T-Test Results 86
8

Section 1. IntroductionForests are integral to life on earth, perhaps best illustrated by the common refrain thatforest ecosystems are the most biodiverse habitats (Wilson & Peter 1989; UN-REDDProgramme 2018; Rainforest Trust 2017) and the largest natural carbon stores (GlobalForest Atlas 2017). Defined as tree canopy loss with no natural or human-facilitatedregrowth, over 90% of global deforestation occurs in the Tropics and Sub-tropics (Curtiset al. 2018), where industrial agriculture, subsistence agriculture, and infrastructure arethe three dominant drivers globally, with a good deal of regional and location variation(UN FAO 2016). Thus, the tropics suffer the majority of global forest loss, but theproblem is global in nature. Demand for wood products from developing and forest-richtropical nations is driven largely by consumer demand in wealthier and more highlydeveloped nations. Therefore, national policies in all nations with a role in producing,transporting, manufacturing, and consuming tropical timber contribute to the dynamicsthat protect or threaten sustainable tropical forest management.
This thesis takes Indonesia as a case study for evaluating the effectiveness of recentnational and international efforts to reduce illegal timber trade, which contributes todeforestation, biodiversity loss, and threatens efforts at nature-based carbon storage.Through an examination of trade data discrepancies between Indonesia and its timbertrade partners, this research seeks to 1) Measure the effectiveness of national policiesin curbing trade of illegal timber products from Indonesia 2) Identify Indonesia’s nationaltimber trade partners and products that exhibit a high risk of illegality, and 3) Evaluatethe efficacy and appropriateness of discrepancy analysis as a means to estimate andpinpoint illegality.
Section 1 establishes the context, framing, and need for this research. Section 2 beginswith a qualitative history of Indonesian forest policy, coupled with summary analysis oftrade data back to 1960 from the UNFAO. This puts my further research into historicalcontext and provides the basic social and economic understanding necessary for laterdetailed analysis. Section 3 is an overview of Importer nations’ policy history since2000, providing the basic framework for analyzing the effectiveness of specific policies.Section 3 is a discussion of methods used in data collection, cleaning, manipulation,and analysis, including discussion of the in-process adjustments made to this researchdesign. Section 4 provides a preliminary investigation of the data prior to construction ofDiscrepancy Rates and Discrepancy Scores, establishing the relative magnitude oftrade Partner and Products, and identifying broad trends for further analysis. Section 5described the specific methods of data manipulation and analysis applied in analysis ofDiscrepancy Scores. Section 6 presents the full analysis of the Discrepancy Scoresdata in two phases: Forest, I emphasize visualizations as a means of identifying trends,policy influence, and risk of illegality in Indonesia's trade partnerships. Informed by thisvisual analysis, I then construct and run six series of tests for statistically significantdifferences in trends between policy time periods, partnerships, and product groups.Section 7 synthesizes analysis into a set of conclusions and discussion of valuablefurther research.
9

Global Forest Loss & IndonesiaTropical deforestation by humans poses a great risk to present biodiversity, futureclimate stability, and is connected to human rights problems in the developing world.Global forest cover has declined by 20% since 1900 as a direct result of humanbehavior and population growth (Khokar & Tabary 2016). Forest destruction andoveruse imperil three-quarters of the world’s threatened species (Maxwell et al. 2016).The tropics store 55% of global forest carbon (Pan et al. 2011) but have been destroyedat an alarming rate in recent years (Weiss & Goldman 2018), resulting in a transitionfrom net sink to a net source of atmospheric carbon for the first time (Baccini et al.2017).
Human systems subject forests to widely varying and often conflicting views, practices,demands from economic and governance systems. While currently a source of 8% ofglobal carbon emissions are due to tropical tree cover loss, forests could “provide 23%percent of the cost-effective climate mitigation needed before 2030” (Gibbs et al. 2018).Sustainable management of the world’s forests could secure 75% of fresh water supply(UN-REDD Programme 2017) and greater security for forest-dependent livelihoods of1.6 billion people (United Nations 2016). Despite agreement within high levelinternational governing bodies, tropical forest loss persists (Curtis et al. 2018).
Indonesia is second only to Brazil in tropical forest coverage, accounting for 73% ofregional rainforest coverage. Deforestation is a particularly important and ongoing threatin Indonesia (Margono 2014; Jong 2021a), which accounts for 75% of regionaldeforestation from 2002 - 2019 (Mongabay 2021). Illegal timber markets are an ongoingchallenge despite policy efforts to curb timber illegality (Wijaya et al. 2017) and decliningtrends of deforestation in recent years (Jong 2021b). Palm oil plantations and fires,which are often a precursor to palm or other agricultural use conversion, are the leadingcauses of Indonesian forest loss (Austin et al. 2019). Section 2 discusses in greaterdetail the modern history of forest governance and timber trade that make Indonesia aparticularly fascinating and globally influential case study.
Illegal Logging & Wood Product Trade49% of tropical deforestation between 2000 - 2012 “was due to illegal conversion forcommercial agriculture” (Lawson et al. 2014 p.2); Indonesian commodity agriculture,primarily palm oil, drives between 40% (Austin et al., n.d.) and 66% (Ritchie et al., n.d.)of forest loss; small-scale agriculture, also largely palm oil, accounts for 9-30%; andtimber products between 13-20% (Curtis et al. 2018). Much of this forest loss and landconversion is also fire-related, with conversion rates increasing after large forest burnyears and accounting for between 2 to 20% of forest loss (Austin et al., n.d.; Curtis et al.2018).
As illegal timber trade is largely made possible by ineffective, unenforced, nonexistent,or corrupt government systems, most interventions currently attempted or imagined relyon improved governance structures at local to global scales (Chatham House 2021).Often associated with illegal land conversion, harvest, or transport early in the supplychain, illegality may reside in downstream products of any form including round logs,
10

dimensional lumber, plywood and veneer, charcoal, pulp and paper, chips, and furniture,many of which can be very difficult to trace and identify with illegal origins or processing(Nellemann et al. 2014). This poses a large challenge to domestic and internationalmarket governance and law enforcement.
Nonprofit financial crime watchdog Global Financial Integrity put simply in a 2017 report,“Illegal Logging is the most profitable natural resource crime,” (May 2017 p.xiii). TheWorld Bank cites estimates of illegal timber market value at between $30 - $157 Billionannually (Montero et al. 2019). Most illegal timber trade is conducted by formalcompanies with fraudulent methods and accrues the majority of resulting profit tofinanciers and corporations rather than governments and local communities (Montero etal. 2019). Further, illegal timber has lower production costs and depresses globallegitimate market prices (Seneca Creek 2004; Gan et al. 2016) resulting in combinedrevenue losses on Indonesia timber from depressed prices and unpaid taxes totalingbetween $600 million and $5 billion annually through 2004 (Seneca Creek 2004). Whileestimates of precise quantity and value are inherently speculative given the unofficialand unaccountable nature of illegal markets, it is widely agreed that illegal timber tradehas a large negative impact on markets for legitimate timber products.
Though economic theory suggests that marginal cost would exceed market price astimber scarcity increases over time, preserving some baseline forest population, Gan etal. (2016) explain that the most valuable species are likely to be exceptional to suchsimple market behaviors and therefore not protected by market forces from extremeoverexploitation or extinction. Threats to tree species and forest ecosystems are likelyeven more tenuous than this would suggest, when taking into account the “tipping point”theory positing that irreversible ecosystem collapse may occur rapidly oncebiome-specific thresholds are exceeded (IPCC 2014). Human health costs andassociated economic costs are also likely to increase with deforestation and ecosystemdegradation, but these go largely unaccounted for as economic externalities (Myers etal. 2013; Garg 2014). While many attempts are made to shift economic incentives awayfrom illegal forest practices, these are greatly outweighed by the financial investments instatus-quo global forest practices (New York Declaration on Forests 2017), leaving alarge gap for forest governance systems to fill to achieve a “fair” global wood productsmarket.
Illegal Logging has long been an issue for Indonesia. 63% of Indonesia’s land area isdesignated Forest Area, of which 57% or 68.8 million hectares are designated asProduction Forest (Nurbaya 2018). National Forests and timber resources were anintegral component of nation building under President Suharto from the 1960s to the1990s. Despite international and domestic efforts to reduce forest loss and crack downon illegal timber trade, Indonesia’s forests face ongoing threats from policy and rightsdisagreements, inconsistent enforcement of illegality protections, growth in demandespecially for pulp and palm oil, and the difficulty of detecting illegality despite. Toillustrate the severity of the problem, Indonesia lost 24% of its forest cover between1990 - 2005 (Singer 2009); lost $70 billion in tax revenue to illegal trade between 2007 -2011 (Human Rights Watch 2013); and estimates that illegality in timber supply were at
11

40% in 2006 were a marked decrease from an estimated 75% in 1999 (Lawson &MacFaul 2014). While this study supports the literature in finding a decreased risk ofillegality in Indonesian timber supply over time, the pressure on natural forests remainshigh and the stakes increase as natural forested area continues to shrink (Wijaya et al.2019). Ongoing challenges surround Indonesia’s efforts to manage its forestssustainably while meeting simultaneous demands for carbon emissions reductions,habitat preservation, and commodity production (Tacconi & Muttaqin 2019; Jong2021b).
Timber-related law and regulation can be found at every level of government frominternational to local, forming a complex patchwork rather than a cohesive globalgovernance system. To further understand the national and legal systems which seek toaddress illegality in Indonesian timber trade, Section Two examines the modern historyof the Indonesian Forest Products industry, and Section Three reviews relevant nationalpolicies adopted, amended, and enforced between 2000 - 2019, a period during whichIndonesian wood products trade has seen a decline in illegal activity.
Section 2. Indonesian Forest Policy ReviewA review of Indonesian forest policy and wood products trade provides qualitativecontext and grounds for developing hypotheses of the impact of policy on forestcommodity trade, forest health, and illegal timber trade. Figure 1 provides a graphicalsupplement to the brief narrative history presented here.
12

Figure 1: Indonesian Wood Exports History
Suharto & the New OrderPrior to the Suharto presidency and his New Order regime, forest resources andgovernance were located at provincial and local levels (Ross 2001; Thee 2009;Obidzinski & Kusters 2015), a reflection of the dispersed nature of society in theIndonesian archipelago prior to and throughout Dutch colonial rule. As Dutch rule cameto an end, national integrity was far from guaranteed, giving rise to efforts towardnational unity and centralization to retain provincial membership. Most pertinent of thesepolicies was the 1960 Basic Agrarian Law, which nationalized adat land rights - at onceenshrining the patchwork system in national law and removing authority to enforce thislaw from the local to national scale. (Ross 2001; Bedner & Arizona 2019). This tensionbetween national and local control over forests is a defining characteristic of Indonesianforest policy and commodity production.
Suharto sought to leverage the mostly non-industrialized national timber resources tobankroll modernization and stabilization of the Indonesian nation. The 1967 BasicForestry Law centralized forest governance, claiming direct federal authority over anarea comprising about three-quarters of national land area (Bedner & Arizona 2019;Obidzinski & Kusters 2015), though for a time allowing provincial governments to assignconcessions up to 10,000 hectares (Ross 2001). This allowed provincial governmentsand local loggers to continue to benefit from smaller concessions, while the federalgovernment engaged in a concerted effort to attract foreign investment in timber
13

extraction and industry development “with the main aim being to increase revenues insupport of national development programs.” (Obidzinski & Kusters 2015 p.534). Furtherpolicies in the early 1970s adjusted the minimum concession size to 50,000 ha,effectively eliminating provincial and local rights; and gave preference to commercialover local concessions, eliminating all traditional adat rights (Ross 2001; Barr 2006). Italso enabled Suharto to build a system of patronage that directed revenues to thefederal government and maintained tight loyalty to Suharto among government officials,military leaders, and private companies (Ross 2001; Smith et al. 2003; Nurbaya 2018).These policies and structured patronage were highly preferential to private, mostlyinternational logging operations and were primarily responsible for the meteoric rise ofIndonesian log exports through the late 1970s (Singer 2009; Barr et al. 2006).
Figure 1 illustrates the economic results of centralizing forest governance andnationalizing the timber products industry. During Indonesia’s early years and throughthe 1980s, log exports were instrumental in constructing domestic political systems,international trade relationships, and financing Indonesia’s governmental and industrialsystems under Suharto (Ross 2001; Barr 2006; Singer 2009; Smith 2010). Given thewealth of natural forests and relatively low level of industrial development at thebeginning of this period, logs proved an abundant cash crop requiring minimalprocessing before going to market.
But the relatively low price for log exports led to dissatisfaction compared to the muchhigher revenues available for processed timber, which Indonesia largely lackedinfrastructure to produce (Thee 2009). Log export taxes were increased from 10% to20% in 1978 (Thee 2009); further tax increases, limits on log exports and restriction ofquotas to firms with processing facilities 1981 (Thee 2009; Ross 2001); and an outrightlog export ban took effect in 1982 (Thee 2009; Ross 2001; Barr 2006; Fry & Honnold,2010). The policies had the intent to build incentive for domestic processing andincrease revenue to Indonesian government which saw its share of profits from timberconcessions shrink from 25% to 5% between 1973-1986 (Ross 2001), and to socialelites who owned wood processing facilities (Prasetyo et al. 2012; Barr 2006). Barrexplains “The ban had two far-reaching effects on the structure of Indonesia’s timberindustry...it effectively concentrated control over the nation’s...timber concessions [and]it triggered a significant influx of investment into Indonesia’s wood processing industry.”(Barr 2006 p.26-27) The central government began collaborating with the IndonesianWood Panel Association, APKINDO, in 1976, giving it the mandate to control collectiveindustry marketing and granting oligopolistic control of plywood exports. Theseincentives to develop processing capacity to control markets drove the plywoodindustries to overtake log exports in value by 1982-1983.
1984 brought a new ban on foreign-owned timber concessions, requiring that foreigncompanies establish joint ventures with Indonesian timber companies, further enablingdomestic entities to retain revenues and funneling additional funds to federal agenciesthrough taxes and fees (Thee 2009). The aggregate effect of protectionist trade policiesboth enabled the rise of the Indonesian plywood industry and foreshadowed its eventual
14

decline after the Asian Financial Crisis exposed the Indonesian plywood market tointernational competition for which it was ill-prepared (Singer 2009).
Two decades of intensive primary forest harvest and systemic mismanagement of thefederal reforestation fund left vast tracts of cleared land (Ross 2001; Smith 2003). In1989, Indonesia began promoting timber plantations with the aim of establishing asustainable source of fiber for the nation’s rapidly growing pulp industry (Barr 2006).Incentives for pulp and paper plantations included zero-interest loans from theReforestation Fund, even while the early stages of pulp and paper industry growth reliedheavily on clearing of natural forest (Harwell 2003). Around the same time and into the1990s forest conversion to Palm oil and other estate crops were also incentivized. (Barr2006). This conversion laid the groundwork for the eventual predominance of pulp andpaper as direct wood products, and palm oil as the eventually dominant agriculturalcommodity.
The early 1990s saw the outright log export ban replaced with a high export tax (ForestLegality Initiative [FLI] n.d.b.), in large part an effort to stabilize the Indonesian woodmanufacture industry as it faced increasing international pressure and began toencounter limitations to sustainable supply (Singer 2009). 1993 saw the early entry oftimber certification programs in the governmental LEI Ekolabel and private ForestStewardship Council. These programs had the tricky role of seeking to balance scrutinyover forest practices with pressure on the timber industry to once again buoy an ailingnational economy (Wibowo & Giessen 2018). Despite increasing concern overconservation issues during this period, these nascent efforts to control rampantdeforestation were far from successful. Indonesia lost 24% of its natural forest coverfrom 1990 - 2005 (Singer 2009) amid increased global demand, over-investment indomestic manufacturing capacity, and often-contradictory policy agendas andenforcement.
The Asian Financial Crisis hit Indonesian markets in 1997, devaluing the Rupiah by32% and prompting bail out discussions with the IMF. Suharto was forced to agree todeep reforms, including dismantling APKINDO, before receiving a $43 Billion IMF loanin 1998. Among the reforms were an agreement to auditing and greater transparency inthe Reforestation fund and dismantling of APKINDO (Singer 2009; Barr 2006). Suhartowas eventually forced to resign amid riots and looting that began to take a racial turnagainst the ethnic Chinese population perceived as central to systemic corruption underSuharto. Vice President Habibie succeeded Suharto and the so-called Reform Era hadbegun.
The Financial Crisis drove a steep decline in Indonesian wood product export value thatdid not begin to rebound until 2001, a year which also saw the re-enactment of theoutright Log Export Ban (FLI n.d.b; Thee 2000). No longer bolstered by protectivedomestic policies, the plywood industry struggled to maintain its competitive advantage.Export value of the plywood industry was overtaken by paper and paperboard in 2005with the help of national promotion. Again without a concerted effort to guaranteesustainable supply commensurate with demand from manufacturing capacity that
15

became the main driver of Indonesian illegal logging in through the 1990s and early2000s (Obidzinski et al. 2007).
Reform Era to PresentUnder national and international pressure to restore local and regional authority afterthree decades of tight central control under Suharto, Habibie enacted Laws 22/1999and 25/1999. Law 22/1999 decentralized government generally and forest managementspecifically; Law 25 divided revenues between different levels of government (Barr2006). However, the struggle to define Indonesian forest governance is clear in policydissonance immediately following Suharto. Law 41/1999 runs counter to Laws 22 and25/1999, which sought to reassert the central role of the Ministry of Forestry inoverseeing the nation’s forests and did so in part by defining illegal logging asunpermitted forest product harvest. (Barr 2006; Wollenberg & Kartodihardjo 2002;Indrarto et al. 2012). Law 41 also establishes Sustainable Forest Management (SFM)as the principle of all forest governance (ADAWR & Indonesia 2018). This strugglebetween central & dispersed authority, and the simultaneous grappling with pressure toreduce forest destruction and illegal harvest (Prasetyo et al. 2010), are best understoodas latent throughout the Suharto years rather than entirely new upon his leaving power.However, it is clear that the Reform era was characterized by a significanthorizontalization of forest governance overall (Tacconi 2004; Indrarto et al. 2012;Siscawati et al. 2017; Smith et al. 2003; Prasetyo 2012). Describing this period oftransition, Barr et al. (2006 p.45) write,
“...legislative dissonance has allowed government policymakers at various levelsof the Indonesian state to claim legitimacy for policy positions that are oftendiametrically opposed to one another...Such competing claims have beensymptomatic of the intense political struggles that have framed thedecentralisation process in Indonesia’s forestry sector over the last severalyears.”
Steep log export taxes were removed in 1998 in an effort to increase local-level andsmall-holder revenue where timber producers lacked manufacturing capacity; a full logexport ban was then enacted in 2001 and implemented in 2002 as a result of lobbyingby the timber manufacture industry’s arguments that a ban would reduce illegal logtrade and benefit concession holders as well as manufacturers. Tacconi et al. (2004 p.13) argue the ban has been ineffective both because Indonesian export log volume wasinsufficient to affect market prices, and that enforcement was “ineffective in stopping theexport of logs.” Contrary to the widely held view that log export bans reduce illegaltrade, Resosudarmo & Arief (2006) argue that the Indonesian log export ban isinefficient both in reducing deforestation and in revenue and jobs creation. The ban wasexpanded to include sawnwood (lumber) in 2004 (FLI n.d.b).
The combination of growing international scrutiny over illegality (World Bank 2003;Environmental Investigation Agency [EIA] & Telepak 2005; Wibowo & Giessen 2018)and Presidential Instruction No 4 of 2005, led to crackdowns on illegal log trade byIndonesia’s Ministry of Forestry (Obidzinski et al. 2007; Prasetyo 2012). This contributed
16

to a decrease in cross-border timber smuggling by as much as 70% between2005-2007 (Obdiszinski et al. 2007) and a decrease in illegal trade by as much as 75%in the decade preceding 2009 (Lawson & Macfaul 2010). Obidzinski et al. (2007) argue,however, that over-border trade is peripheral to a fundamental lack of legal supply tosatisfy Indonesia’s domestic timber processing capacity; Lawson & Macfaul (2010) addto this that the majority of illegal timber is consumed in domestic manufacture andobscured by the time it leave the country.
The international context was also shifting contemporary to this era of change inIndonesian governance. The 1990s and early 2000s saw an increase in internationalefforts to reduce illegal logging and combat deforestation. Indonesia joined the UNConvention on Biological Diversity (“CBD”) and the Convention on International Trade inEndangered Species and Wild Fauna and Flora (“CITES”) and UN FrameworkConvention on Climate Change (“UNFCCC”) in the early 1990s; the UN Forum onForests in 2000; UN-led financing mechanisms for Reducing Emissions fromDeforestation and Forest Degradation (“REDD+”) in 2007; and the EU FLEGT processbeginning in the early 2000s. (Indrarto et al. 2012)
Each of these international mechanisms aims directly or secondarily to reduce naturalforest and other natural habitat loss; however, their efficacy is complicated byIndonesia’s persistent forest loss as the growth in Indonesia’s legal frameworks andregulatory policies is often contradictory or leaves significant loopholes that allows forfurther, often technically legal, forest loss. Indrarto et al. (2012 p.17) summarize,“...good intentions with regard to environmental management have not been supportedby adequate concerted efforts to improve the infrastructure, capacity and governanceneeded to realize [Indonesia’s] international commitments.”
Amid increased global concern and motivated also by the desire to protect diminishingtimber supply for value-added manufacturing industry (Singer 2009), Indonesia’sPresident Yudhoyano mandated an increase in scrutiny on timber supply chains andstricter enforcement of domestic illegality controls.
Despite ongoing efforts to build improved forest governance, the themes of policymisalignment or contradiction, underinvestment in regulatory systems and enforcement,and leaky implementation are repeated across our review (Barr et al. 2006; Ross 2008;Kartodihardjo et al. 2009; Santosa et al. 2010; SATGAS 2012; Indrarto 2012; Enrici &Hubacek 2016). The gap between policy intent and impact are perhaps most glaring inthe simultaneous reduction of illegal logging (Ministry of Environment and Forestry[MOEF], 2009; Lawson & MacFaul 2010) and the continuation of deforestation (Indrartoet al. 2012), indicating that timber from unsustainable forest products continues to findlegal entry into markets despite these frameworks. National and international efforts tocurb illegal logging and deforestation continue, and with incremental cause foroptimism.
This increased international scrutiny and domestic enforcement preceded theintroduction of REDD+ mechanisms in 2007 to reduce emissions from deforestation and
17

degradation (Machfudh 2011; Indrarto et al. 2012; SATGAS 2012; Santosa et al. 2013).This was backed by a $1Billion investment commitment from Norway and a nationalcommitment to reduce greenhouse gas emissions from deforestation by 26% - 41% by2020, while growing GDP (SATGAS 2006; Busch et al 2014). Government RegulationNo. 6 of 2007 sets explicit guidelines on legal subjects entitled to forest use, approveduses and permitting processes, and related rights and obligations of harvest and sale offorest products.
Since Regulation 6/2007, Indonesia’s Ministry of Forestry (which became the Ministry ofEnvironment and Forestry, “MOEF'' in 2014) has issued a number of implementingregulations establishing processes and use of timber from production forests (ADAWR& MOEF 2018). Among these, Regulation No. P.38/2009 established the government’stimber legality verification “SVLK'' (or “TLAS'' when translated to its English acronym)and Sustainable Forest Management Certificate “PHPL'' systems (Wibowo & Giessen2018). The SVLK scheme is a mandatory government certification applied in parallel topre-existing voluntary private certification scheme through Forest Stewardship Council(FSC) and Lembaga Ekolabel Indonesia (LEI), both founded in 2003 and issuing firstIndonesian concessions in 2008 (Wibowo & Giessen 2008). SVLK was simultaneouswith early discussions with EU FLEGT, and SVLK eventually became the “core unit” ofthe Voluntary Partnership Agreement (Wibowo & Giessen 2018 p.33; Nurkomariyah2015; ADAWR & MOEF 2018). The 2012 Forest Product Export Regulation put theSVLK into implementation, defining wood products into two groups (all of the productscontained in this study are included in “Group A”), and requiring that exportingcompanies complete specific legality assurance documents and independent monitoringand evaluation of both companies and the entire SVLK system (UN 2014; Obidzinski etal. 2014).
Indonesia’s challenges with leaky forest governance and contradictory policy areexemplified through one particular policy that arose amid the formation of REDD+,SVLK, and EU FLEGT processes. As part of the national REDD+ strategy, PresidentYudhoyano declared a 2-year moratorium on clearance and conversion of Indonesia’sprimary forests that took effect in May 2011 (Gingold 2011; Busch et al. 2014). This wasextended 3 times until 2019 when President Widodo made it permanent (Jong 2019).The moratorium, however, only contributed to forest sector emissions reductions of2.6-6.8% compared to the 26% pledged under Indonesia’s REDD+ commitment (Buschet al. 2014); and has not been successful in reducing logging permit issuance orpermanent conversion of forests primarily to establish palm oil plantations (Jong 2019;Mongabay & The Gecko Project 2017).
These shortcomings have their roots in the recurring challenges to design and enforcenational forest policy that is robust to differing demands and loopholes at the local level.These include political influence and inaccuracies in periodic forest remapping(Mongabay 2011), a rush to issue permits before the moratorium took effect, and thepractice of partially burning primary forest to downgrade its official designation and openit for permitting (Jong 2019). All of these practices have some degree of legal
18
application, highlighting the gap between efforts to combat illegal logging and to stopdeforestation and degradation.
The conversion moratorium remains an evolving case, and certain loopholes may havebeen addressed by a 3-year freeze on new palm oil leases signed by Widodo in 2018(Mongabay 2018; Jong 2019). In contradiction to tightening conversion policies,however, is an ongoing lack of enforcement of existing policy. Reporting by EIA (2021)uncovered illegal activity and spurred about one year of enforcement actions, but thatlegal process failed to confiscate timber, strip licenses, or stop operations by the guiltycompanies. Further illustration that Indonesian forest policy remains contentious andevolving, in 2020 the Ministry of Trade announced a regulation to end the SVLK legalitycertification applied to all forest products and underpinning EU FLEGT licensure (EUFLEGT 2017), only to reverse course as opposition mounted from uninformed elementswithin Indonesian government, NGOS, international governments and forest productindustry (Jong 2020b).
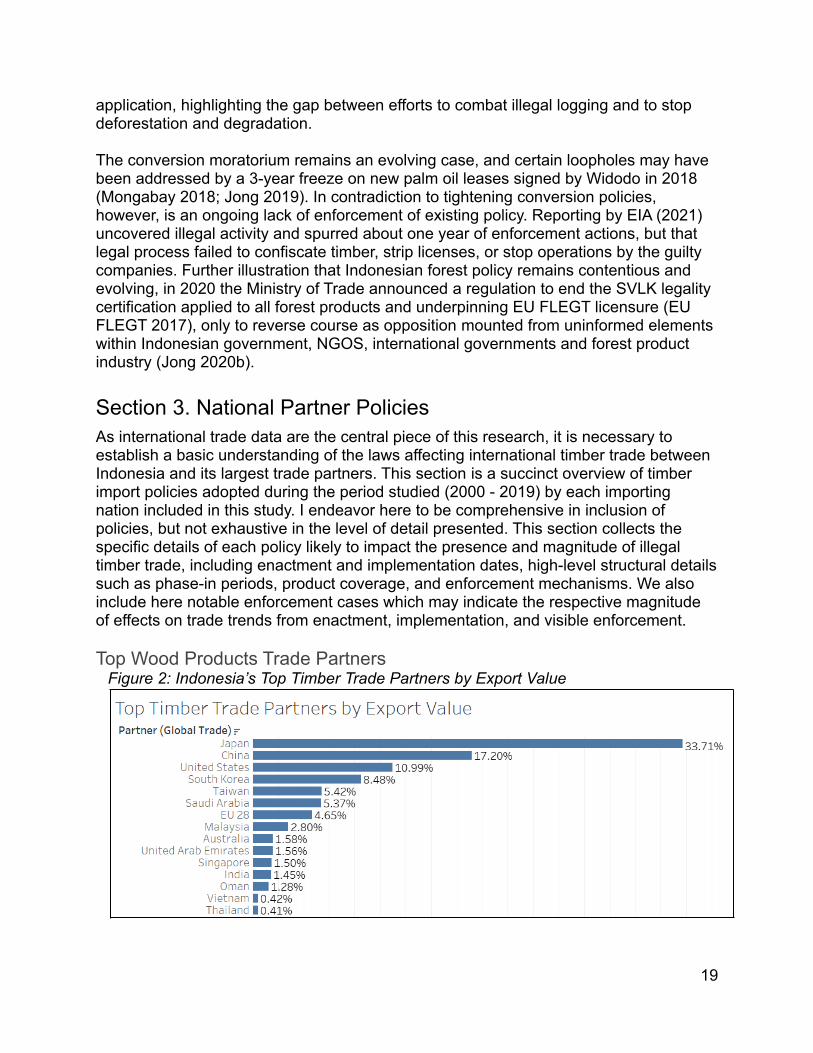
Section 3. National Partner PoliciesAs international trade data are the central piece of this research, it is necessary toestablish a basic understanding of the laws affecting international timber trade betweenIndonesia and its largest trade partners. This section is a succinct overview of timberimport policies adopted during the period studied (2000 - 2019) by each importingnation included in this study. I endeavor here to be comprehensive in inclusion ofpolicies, but not exhaustive in the level of detail presented. This section collects thespecific details of each policy likely to impact the presence and magnitude of illegaltimber trade, including enactment and implementation dates, high-level structural detailssuch as phase-in periods, product coverage, and enforcement mechanisms. We alsoinclude here notable enforcement cases which may indicate the respective magnitudeof effects on trade trends from enactment, implementation, and visible enforcement.
Top Wood Products Trade PartnersFigure 2: Indonesia’s Top Timber Trade Partners by Export Value
19

Figure 2 shows a summary of Indonesia’s top wood products trade partners by percentof total export value from 2000 to 2019. Smaller trade partners are not shown in Figure2, but percentages are of Indonesia’s total timber trade export. This study includes allpartners accounting for at least 1% of Indonesia’s reported exports, plus Thailand dueto its regional proximity and in case trade Discrepancy trends exhibit any regionallyspecific pattern.
National trade data for Oman, Saudi Arabia, United Arab Emirates, and Vietnam are notavailable through the Global Trade Atlas data source, Global Trade Atlas. It is thereforeimpossible to conduct a bilateral analysis between Indonesia and these four nations.Omitting from the list in Figure two these four nations for which no bilateral data exist,88.19% of Indonesia's external trade with 11 partners is included in this bilateralanalysis. As data for 2020 were not yet fully reported for all nations at the time of thisstudy, 2020 data are excluded from analysis. Sending the study in 2019 has thesecondary advantages of excluding the effects of Brexit and Coronavirus, both of whichare likely to have caused and to continue to significant market shifts. While theseanalyses would be highly informative, it is simply too soon to conduct this type ofretrospective analysis on such large and evolving processes.
Appendix 2 distills a collection of “Dates for Analysis” from the following national timberimport policy profiles. This is a discrete list of moments of enactment, implementation,or enforcement of key national policies with potential to shift bilateral trade andmultilateral wood product market dynamics. While these dates would enable a moregranular study of impact on trade systems, this research is limited to annual trade data,which will enable us to identify trends over a longer time period but not pinpointimmediate effects.
Australia
Policy:Illegal Logging Prohibition Act (ILPA) and Illegal Logging Prohibition Regulation
● Enacted 8 November 2012.● Implemented 30 November 2014 via the Illegal Logging Prohibition Regulation
Amendment (“ILPR”). In the two years between enactment and implementation,companies were legally responsible for importing illegal products, but were notrequired to demonstrate due diligence obligations. The Department of Agricultureand Water published implementation plans in 2014, which included an 18-monthsgrace period for companies to prepare for compliance This “soft-start” period waslater extended through January 1, 2018. (Australia Department of Agriculture andWater Resources [ADAWR] 2018; Ludwig 2012).
● Country-Specific Guidelines (CSG) developed with Indonesia beginning 2016,co-signed October 1, 2018 (ADAWR 2018).
● Failure to comply with the ILPA can result in civil fines up to $18,000 or criminalpenalties up to 5 years imprisonment (Rose 2017). This research finds nospecific record of high-profile enforcement actions with potential to shift marketbehavior.
20

Summary:Australia passed the ILPA and Illegal Logging Prohibition Regulation in 2012, housedwithin the Department of Agriculture. Prior to ILPA, CITES compliance was the extent oftimber import controls, and implementation was regarded as inadequate andinconsistent (Ludwig 2012). ILPA applies a broad definition of illegality, makingimporters responsible for meeting all legal restrictions of both Australia and the nation ofwood product origin.
“Under Australian law, illegal logging means ‘the harvesting of timber in contravention ofthe laws of the country where the timber is harvested’. This includes a wide range ofillegal activities, such as logging of protected species, logging in protected areas, loggingwith fake or illegal permits, [and] using illegal harvest methods.” (Australia Departmentof Agriculture, Water, and the Environment [ADAWE] 2018).
The ILPA was made effective upon adoption of the Illegal Logging ProhibitionRegulation Amendment in 2014, which provided an 18-month phase-in grace period forcompanies to prepare to be in compliance. The ILPA and ILPR together place a duediligence burden on importing companies, which must perform risk management effortson specific products. The Australian policy names FSC and PEFC wood productcertification as accepted to speed up due diligence processes. In the two years betweenenactment and implementation, companies were legally responsible for importing illegalproducts but were not required to demonstrate due diligence obligations. This“soft-start” period was later extended through January 1, 2018. (Australia Department ofAgriculture and Water Resources [ADAWR] 2018; Ludwig 2012).
ILPR includes HS Codes 44, 47, 48, and 94. This study is limited to severalsub-categories of HS Code 44. ADAWR (2018, p.18) conducted a statutory review ofILPR effectiveness in 2018, which concludes “...it is difficult to clearly attribute anysignificant impact on the value of imported timber products to the Act’s operation”(ADAWR, 2018, p19). Like ADAWR, the current research also encounters limitations towhat can be learned from trade data; however, there is evidence to suggest associationbetween ILPR and reduction in risk of illegality, discussed in Sections 5 and 6.
Australia also co-developed Country Specific Guidelines (“CSG”), developed in 2016and co-signed in 2018 to ensure compliance with the ILPA. This CSG prohibits import ofspecific HS Codes (4403, 4404, 4406, 4407), and requires documentation provinglegality and origin traceability. (ADAWR 2018 p. 5). Together with EU FLEGT policyinfluenced the establishment of Indonesia’s Sistem Verifikasi Legalitas Kayu (“SVLK”),or the Timber Legality Assurance System (“TLAS”) (ADAWR 2018, p. 5)
China
Policy:National Forest Protection Program (“NFPP”)
● Enacted 19998.● Implemented 1999.
21

Slope Land Conversion Program (“SLCP”)● Enacted 1998.● Implemented 1999.
Memorandum of Understanding Concerning Cooperation in Combating Illegal trade offorest Products.
● Signed December 2002.Domestic Natural Forest Logging Ban
● Enacted 2017.● Implemented 2017.
National Forest Law Amendment● Enacted 2019.● Implementation planned for 2020, but no action or further detail available.
Summary:China is a prominent importer, manufacturer, and re-exporter of wood products throughthe history of this study. Previously meeting the majority of domestic needs fromnational logging, the NFPP and SLCP were enacted with a combination ofenvironmental and economic goals and effectively ended logging in China’s naturalforests (Delang & Wang 2013; Ren et al. 2015) and drove massive increases in demandfor international supply (Forest Legality Initiative [FLI] 2014; Forest Trends 2020; UNEconomic Commission for Europe 2009).
Though Indonesia and China signed a shared Memorandum to combat illegal timbertrade, this was not followed with substantive regulation or enforcement (Tacconi et al.2012). An outright ban on logging China’s state-owned natural forests took effect in2017, solidifying the primacy of timber imports to supply China’s manufacturing andconsumer demand (Hui 2017). China maintains no specific due diligence requirementon imports but ratified the CITES convention in 1981 (FLI 2014). Article 65 of the 2019amendment to the Forest Law of the People’s Republic of China appears to placeresponsibility on all importers and exporters to eliminate illegal wood products (ChinaMinistry of Ecology and Environment 2019), but despite 2020 plans to developimplementing regulations and designate authority (Yin 2020; Norman & Saunders2017), I found no record that these key details had been adopted or implemented.
Norman & Saunders (2017 p.7) reported that “Administrative Measures forStrengthening the Legality of Imported Wood” were under development, and that theprivate sector and forest product industry associations are in the process of building duediligence capacity and legality verification standards expected to be in line withexpected legislation. Barua et al. (2016) find that the rate of potentially illegal Chinesetimber imports fell from 2007 - 2016 even while the volume continued to grow, indicatingthat current voluntary policy guidelines do not sufficiently address the problem duelargely to a lack of mandatory checks for illegality in imports.
22

EU 28
Policy:EU Forest Law Enforcement Action Plan (“Action Plan”)
● Action Planned published by EU (EUR-Lex, 2003).EU Forest Law Enforcement, Governance, and Trade Licensing Scheme (“LicensingScheme”)
● Enacted 20 December 2005 under Council Regulation 2173 / 2005 (EUR-Lex2005).
● Implementation measured adopted 17 October 2008 (EUR-Lex 2008)EU Timber Regulation (“EUTR”).
● Enacted 20 October 2010 under EU Regulation 995 / 2010 (EUR-Lex 2010)Voluntary Partnership Agreement with Indonesia (“VPA”).
● Entered agreement with Indonesia 30 September 2013 (EU FLEGT Facility [EuFLEGT] 2018).
● Implementation 15 November 2016 as Indonesia begins EU FLEGT licensing(EU FLEGT 2018).
Summary:The EU Forest Law Enforcement, Governance, and Trade (“EU FLEGT”) is founded ona 2003 Action Plan and agreement among EU members to “reduce illegal logging bystrengthening sustainable and legal forest management, improving governance andpromoting trade in legally produced timber.” (EU FLEGT 2020). The “Licensing Scheme”passed in 2005 and implemented in 2008 created a framework for Voluntary PartnershipAgreements or VPAs, which enables the EU FLEGT facility to enter negotiations withnations that wish to certify all timber product exports to Europe. VPAs begin withagreements with national partners to develop sector-wide diligence and supply chaintransparency, followed by full national licensure. Indonesia entered into VPA with the EUin 2014 and attained full licensure in 2016 (Wibowo et al. 2018; EU FLEGT 2017).
The EU FLEGT Action Plan also laid the groundwork for the 2010 EUTR, whichprohibits illegal timber and timber products from entering the European market throughlegally binding responsibilities on all member states. Member states are “responsible forlaying down effective, proportionate and dissuasive penalties and for enforcing theRegulation.” (European Commission [EC] n.d.) It also requires all importing companiesto adopt Due Diligence practices which include access to timber product information,risk assessment on operator supply chains, risk mitigation through additional productverification, and record keeping of all suppliers and customers (EC n.d.).
Enforcement of these policies is inherently distributed between EU nations, tradepartner nations, and the private sector on both sides of international trade. In particular,the VPA licensure process within the EU FLEGT facility aims to develop entiregovernance and oversight structures with trade partners, which may be linked to a largevariety and number of enforcement actions. For these reasons, this research does notattempt to isolate and cite individual enforcement cases for the purposes of this study.However, there is good evidence to suggest that VPA agreement with Indonesia has led
23

to an increase in forest law enforcement activities in Indonesia (Nurbaya 2018); and thatEurope’s VPAs with Indonesia and other trade partners contributed to progress towardVPA-related targets (Cerutti et al. 2020).
India
Policy:Plant Quarantine Order
● Enacted & Implemented 2003. Specifies which plants and plant products may beimported into India, designates actions required for import, and processes toseek approval for plants and products not specified. Overseen by the Directorateof Plant Protection, Quarantine and Storage.
Summary:India’s demand for primary wood products outstrips domestic supply and is growingquickly (USDA 2019). Imports doubled between 2013 (Fastmarkets RSI 2013) and inthe decade before 2020 (Norman & Canby 2020), driven by increasing consumer andmanufacturing demand and low levels of domestic timber resources. The PlantQuarantine Order of 2003 explicitly lists which plant species and products may beimported into India, and a process by which to seek to add species to this list(Directorate of Plant Protection 2015). Within this restriction, “wood and wood productscan be imported into India without quantitative restriction,” (Sood 2019 p.5). WhileIndia’s Plant Quarantine Order provides legal bases for timber import controls, noregulatory framework specific to ensuring wood product legality is in place and it is likelythat unrecorded timber enters and mixes with legal supply with little visibility. (EUFLEGT 2016; Norman & Canby 2020; The Timber Trade Portal [TTP] 2020). Thiscontext of growing demand with no timber import policy informs concern that the Indiandemand for timber, which is primarily sourced from Southeast Asia and Oceania, couldattract illegal products (Vanam 2019).
Wood product imports are also subject to compliance with the national Export Importpolicy (“EXIM”), but again no regulatory framework exists for timber imports. The EXIMpolicy was established by the Foreign Trade (Development and Regulation) Act of 1992(TTP 2020), is updated every 5 years and includes compliance with the CITES listingsand requires that importers and exporters obtain permits from relevant agencies forwood products traded internationally (FLI 2014). However, no wood products arerestricted by the 2017 update of Import Policy schedule (Director General of ForeignTrade 2015). Norman & Canby (2020 p.5) add, “Certification systems that could verifylegality and/or sustainability are also not used widely. Without such systems, there is noguarantee that India’s exports of manufactured timber products are verified as legal.”The combination of growing demand and limited insight of timber import or exportlegality may be cause for concern over the legality of both Indian timber imports andvalue-added wood product exports.
24

Japan
Policy:1) “Promotion of Procurement of Environmentally Friendly Goods” (“GreenProcurement”) number 100 of 2000.
● Enacted May 2000.● Implementation expanded to include criteria for wood products (Lopez-Casero
2008; Momii 2020).● The expansion to wood products is commonly referred to as “Goho Wood”,
meaning “legal wood” (Japan Council 2006).2) Act on Promoting of Distribution and Use of Legally Logged Wood Products.
● Enacted 20 May 2016 as Act no. 48 of 2016 - referred to as the “Clean WoodAct” (US Library of Congress 2016).
● Implementation expanded in May 2017 by adoption of “two ordinances detailingDue Diligence requirements for companies and an institutional framework andmandate for enforcement” Forest Trends (2017). Forest Trends (2017) estimatedat the time that “companies are unlikely to be able to register and startimplementing the requirements of the legislation until September 2017 at theearliest.”
● No enforcement cases, though the Clean Wood Act provides a mandate forrevoking voluntary registration and assessing fines (Li 2019).
Summary:Goho Wood, while binding, is of relatively narrow scope, pertaining only to publicprocurement which makes up a small part of total consumption (Japan Ministry ofEnvironment [MOE] 2000; MOE 2017). Goho Wood certification may also displace morerigorous independent sustainable harvest certifications (Momii 2014). The Clean WoodAct passed in 2016 is a more broad but voluntary program for importers to register withthe Japanese government for certification of their measures to trade only legallyproduced wood products. (US Library of Congress 2016). The policy applies to all ofthe significant wood product categories imported by Japan, includes a 5-year updateschedule, and includes penalties for companies making false claims of registration.Self-selection is a limitation of both policies, likely leaving large gaps in the market towhich neither Goho Wood nor the Clean Wood Act applies. Momii and Saunders (2020p.13) see evidence in this shortcoming: “only 397 of the estimated 20,000 businesseseligible for registration had volunteered to do so,” between enactment in 2016 and April2020.
Note: Indonesia’s history of unsustainable timber harvest is linked to the land clearingthat made way for palm oil and pulp and paper industries to arise. Japan is a largesource of finance for both timber and palm oil from Indonesia, and there is goodevidence the existing policy environment leaves room for ongoing unsustainablepractices and clearance of forest lands in supply chains of large companies (Drost et al.2021).
25

Malaysia
Policy:2002 Import ban on Indonesian logs (HS Code 4403)2003 Import ban on Indonesian square logs over 60 square inches.
Summary:Each of Malaysia’s 13 states creates its own forestry rules within the confines of theNational Forestry Act (Malaysia, 1984) and the National Forestry Policy (Malaysia1978), each of which were updated in the early 1990s (FLI 2013). Illegal timber trade viasmuggling, especially along the shared border on Kalimantan, is thought to have beenrampant through the early 2000s (Obidzinski et al. 2007; Tacconi et al. 2004; Smith etal. 2003). Obidzinski et al. (2007) find this practice is likely overestimated, and that thegreater share of illegality during that period originated in over-harvest on permits issuedlegally to private companies under poor enforcement of administration anddocumentation requirements. While timber crossing a border illegally is likely to bedetectable through comparing bilateral data between nations, such domestic forms ofillegality such as illegal harvest are likely embedded in timber traded but invisible innational trade data. Under international and NGO pressure, the Minister of PrimaryIndustries banned round log imports in 2002 (Chen 2008; Tacconi et al. 2012) andexpanded in 2003 to include square log imports larger than 60 square inches (Tacconiet al 2012). I find no further record of Malaysian trade or forestry policy aimed directly atIndonesian timber exports.
Republic of Korea
Policy:Act on the Sustainable Use of Timbers, No. 11429 (Republic of Korea [ROK] 2012).
● Enacted 21 March 2012.● No specific implementation timeline or regulatory framework put in place at time
of adoption (EU FLEGT 2018)Partial Amendment to the Act on the Sustainable Use of Timbers, No. 14657 (ROK2017).
● Enacted 23 May 2017● Introduced mandatory implementation regulations prohibiting sale of unverified
timber in Korea and came into implementation on October 1, 2018.● Literature review found no documented enforcement cases, though the Act
provides a mandate for revoking registration, assessing fines, and imprisonment.(Li 2019)
Summary:The 2017 amendment prohibits import, distribution, production, and sale of illegaltimber, but does not require importers to demonstrate due diligence. The KoreanGovernment introduced “Detailed Standards for Determining the Legality of ImportedTimber and Timber Products” (Saunders & Norman 2019 p.1) in August 2018, requiring
26

compliance by all companies beginning October 2018. The amendment applies to theentire supply chain and are mandatory for all importer of the following products (*denotes products not included in the current study):
○ Log (HS4403)○ Sawn timber (HS4407)○ Anti-decay wood (HS4407)○ Fire retardant treated wood (HS4407)○ Laminated wood (HS4407)○ Plywood (HS4412)○ Wood pellets (HS4401-31) *
Saunders & Norman (2019) note that fiberboard & particle board are not included in thislist, but that the Korean Forest Service is taking a phased approach to adding productcoverage and may be added in the future.
Further, the Korean 2017 amendment uses a more lenient definition of legality than theEUTR and Lacey Act, requiring only that imports comply with legal harvest laws ofKorea and the nation of origin, rather than consideration for rights to harvest, landtenure, chain of custody, and illegal sale. (Saunders & Norman 2019; EU FLEGT 2018).In effect, this definition limits possible enforcement actions to a narrower range ofissues, as compared with the US and EU policies.
Singapore
Policy:Singapore’s Revised Timber Industry Act of 1985.
Summary:Singapore’s Revised Timber Industry Act (1985) establishes a mandate for timber traderegulation, search and seizure, and prohibition of sales of all products covered in thisstudy. The Act goes into greater detail on timber production within and export out ofSingapore, providing little guidance on imports or illegal trade. Through the early 2000s,Singapore was a known hub for timber smuggling, and a key port for transshipment andobscuring timber origins ultimately destined for markets in timber consuming nations(Thornton et al. 2010). During a time of Free Trade proliferation, internationalagreements had the undesirable effect of obscuring timber supply chains(Environmental Investigation Agency [EIA] 2006), contributing to Singapore’s role inmaintaining opaque supply chains.
An EU FLEGT Facility (2014) study of ASEAN nations customs practices documentsthe controls and efforts as customs alignment in Singapore and between ASEANpartners. This study documents that CITES controls are written into Singapore law andthat customs agents “...wield extensive enforcement capacity to enforce customsregulations and to support provisions in other legislations, in relation to illegality intrade,” (EU FLEGT 2014 p.40). Time and resource constraints did not allow deepinvestigation into each Partner nation’s customs practices, but the power to enforcestandards of legality may prove informative for further analysis. Though a signatory of
27

CITES, Singapore has an inconsistent record of enforcing this commitment, mostnotable from the 2019 case of transshipment of a huge quality of protected rosewoodfrom Madagascar (EIA 2019). Overall, there is little record of official Singapore timberimport policy or coordinated efforts to control illegal logging.
Taiwan
Policy:Foreign Trade Act (Taiwan Ministry of Economic Affairs [TMEA] 1993)
● 2010 amendment to comply with CITES requirements.Wildlife Conservation Act (Taiwan Council of Agriculture [TCA] 2013)
● 2014 amended to remain current with updated CITES listings.
Summary:Because of its largely independent governance, this project treats Taiwan as its ownpartner in this study for the sake of identifying trade trend differences between Taiwanand mainland China. In the early 1990s, Taiwan outlawed nearly all domestic logging innatural forests (Aspinwall 2018) via The Forestry Act (TCA 2016). However, Taiwan’sexisting manufacturing capacity remained intact, with nearly all of Taiwan’s woodproduct supply driven to import markets which remain the dominant source of woodproducts in Taiwan (Huang & Chen 2019; Schloenhardt 2008; Aspinwall 2018).
Taiwan has no wood legality or chain of custody import regulation on record (USDAForeign Agricultural Service 2020). As a province of China, Taiwan is not a nationalmember of international governing bodies, and therefore is not qualified to sign onto theCITES convention. While in theory Taiwan would fall under China’s CITES commitment,in practice it operates more closely to an independent wood product importer without aCITES commitment; despite this ambiguity and potential as a legal trade loophole,Taiwan independently amended regulations to implement CITES listings (Shcloenhardt2019; Forestry Bureau 2016; TME 1993; TCA 1989). Despite the shift toward import ofmore processed products, Taiwan remains a large importer of tropical hardwood logsand plywood and Taiwanese companies remain heavily invested in manufacturingcompanies overseas, raising concern that this contributes to insufficient supply chainoversight (TCA 1989).
Thailand
Policy:Thailand has no domestic policy specifically regulating illegal timber trade outside of theVoluntary Partnership Agreement (VPA) through the EU FLEGT Facility.
● VPA signed, opening process with the EU September 2013; first negotiations in2017, second in 2018.
● By entering the VPA process, “Thailand committed to develop a system forassuring the legality of its timber from domestic and imported sources.” (EU
28

FLEGT 2017). However, the details of this system remain yet undetermined asthe process is in ongoing negotiations between the two governments.
Summary:Prior to the VPA, determining legality of Thailand’s timber imports consisted of multipleforms of documentation and was not always clear or consistent. Legality is establishedprimarily through customs documentation at the point of entry, often accompanied byCertificates of Origin, a copy of an operator’s license, less frequently Phytosanitarycertificates, and Bills of Lading for goods arriving overseas. A 2012 report explainedboth that “It is this combination of documents that means the timber has entered thecountry legally,” and, “However, there is no single unique identifier which enables thetimber to be tied unequivocally to the documentation…” (EU FLEGT 2012 p.23).
United States
Policy:Amendment to the United States Lacey Act Amendment, via the Food, Conservation,and Energy Act of 2008.
● Amended 22 May 2008 to reduce demand and market access for illegal timberand wood products. (USDA 2020b)
● Phased implementation began in 2009, adding specific HS Codes to theenforcement schedule with each phase. Chapter 44, which includes all productscovered in this study, was phased in partially in 2009, and expanded in 2015. Atthe time, USDA acknowledged that companies were unlikely to be able toregister and start implementing the requirements of the legislation untilSeptember 2017 at the earliest (USDA 2020a). Additional phases continue toadd products to the regulated list.
Summary:The Lacey Act Amendment prohibits “import, export, transport, sale, reception,acquisition, and purchase of any plant taken in violation of the laws of the US, a USState, or relevant foreign laws.” (FLI n.d.c p. 3). As of 2009, Lacey holds importersresponsible for declaring the sourcing of all wood product HS Codes and complying withall legality requirements applying to an import’s supply chain (FLI n.d.c), but notrequiring certification of legality. This sets Lacey (and Japan’s Goho Wood) apart fromthe EU Timber Regulation and Australia’s ILPR requirements, which further requireimporters to verify legality of imports (Nurkomariyah 2016). Lacey Amendment violatorsare subject to criminal and civil penalties regardless of if they are responsible for theentry of illegality into a given shipment of timber imports, and regardless of the importingindividual’s prior knowledge or 3rd-party certification. (FLI n.d.c). However, complianceis defined somewhat loosely as a “due care” requirement, only that importers show theyhave taken reasonable measures to identify and control for illegality, leaving thestandard for compliance and enforcement rather flexible (Saltzman 2010).
29

Since the 2008 amendment, the Lacey Act has been used to prosecute companies inseveral cases. The first Lacey Act enforcement came in a confiscation of three pallets ofPeruvian hardwoods imported with “stolen and forged documents” (Hanson 2010; Holt2010) A second enforcement came in 2012 with a case against Gibson Guitars for twoallegations that the company purchased hardwoods harvested illegally fromMadagascar and India (Clarke 2012; EU FLEGT Facility 2012b). Lacey was also usedto impose fines, a 3-year probation, and public announcement of wrongdoing by aChina-based baby furniture maker that imported a large amount of internationallyprotected hardwood (US Department of Justice [USDOJ] 2009). A final and the mostwidely known Lacey enforcement resulted in the Department of Justice requiringLumber Liquidators pay over $13 million in criminal fines for lumber illegally logged inRussia and manufactured into flooring in China (USDOJ 2016). Finally, 24 pallets ofillegally harvested Peruvian hardwoods were confiscated by the Department ofHomeland Security in 2015 and destroyed in 2017 (USDOJ 2017). These cases indicatethe ability and willingness of USDA to enforce compliance with the Lacey Act 2008Amendment. It may be possible in further analysis to measure the effect of Lacey Actamendment acceptance, implementation, and specific enforcements on trade trends. A2015 study by Union of Concerned Scientists (2015) found evidence that the Americanmarket for illegal wood had shrunk as a result of Lacey implementation, while alsofinding large quantities of illegal material still are traded and stronger enforcement mightlead to a further reduction.
Section 4: Data OverviewThe following charts provide a general summary of the data included in this study andhelp to illustrate several choices made in the process.
Data Source ReliabilityTrade data is inherently challenging, often containing gaps, inconsistencies, and errorswithin single-nation reporting, with problems multiplying across different nationalreporting regimes. Data are publicly available through a number of international bodies(Ortiz-Ospina & Beltekian 2018). Literature review shows that FAOSTAT (2020) and UNComtrade (2021) are the most common sources for data subjected to DiscrepancyAnalysis, but each of these sources has significant reliability issues. FAOSTAT relies onself-reporting by nations, and despite efforts to increase reliability (FAO 2014) isinevitably subject to great variation in reporting practices that result in large anomaliesand likely errors that pose limitations to reliability (Kallio & Solberg 2018). UN Comtradeis the most comprehensive trade database, but is considered less reliable than, forexample, OECD Balanced International Merchandise Trade Statistics (n.d.), which ismore limited in date range and national coverage (Miao & Fortanier 2017; Ortiz-Ospina& Beltekian 2018).
This research uses privately collected data from Global Trade Atlas (“GTA”) to buildside-by-side comparisons of Indonesia’s reported exports and the reported imports ofIndonesia’s top wood products trade partners identified in the previous section.
30

GTA purchases customs data directly from nations. Prior to analysis, I conducted asimple test to validate the Global Trade Atlas data used in this study. Trade DataMonitor (“TDM”) also purchases data directly from nations (with a shorter history, backto 2010), and should theoretically match GTA data perfectly. In theory, accessing thesame data from two separate sources should produce identical results, and indeed thisis the case. Figure 3 shows a side-by-side comparison of GTA and TDM data forIndonesia’s reported exports of Hardwood Plywood to China, with identical results from2010 through 2019. This supports the conclusion that GTA data are a validrepresentation of the figures supplied by reporting countries included in this story. Whilethis does not mean that data are an accurate representation of actual trade, it doesprovide a high level of confidence that the data used in this analysis are reliable forassessing real discrepancies in timber trade reporting.
Figure 3: GTA Data Source Validation
This analysis uses data from 2000 through 2019. This date range is in part a constraint:The University of Washington CINTRAFOR lab (2021) has access to GTA data reachingback only as far as 2000, and complete data for 2020 is not yet available for all nationsincluded in the study. Within that constraint, it is also a choice: With the goal to gaininsight into the effect of domestic and international trade policies on illegal timber tradeoriginating in Indonesia, this 20-year dataset provides ample baseline data prior toadoption of key trade and forestry policies identified in the National Policies section. Itmay be possible to add data for 2020 for specific nations if analysis reveals interestingtrends or additional country-specific questions.
Custom HS Code Groupings into “Items”Wood products studied here are aggregated into custom product categories used by theUW CINTRAFOR lab and based on selected groupings of 6-digit-level HarmonizedSystem (“HS Codes”). See Appendix 1 for detailed sorting of the HS Codes into product
31

categories used in this analysis. Custom categories are referred to here as “C4Categories”, or by more common names, such as “Hardwood Logs” or “SoftwoodPlywood”.
Visual Analysis of Preliminary DataAnalysis of the data prior to constructing Discrepancy Scores (discussed in Section 5and applied in Section 6) is useful to understand the general trends over time, betweenIndonesia and the eleven Partners studies, and gain an understanding of the magnitudeof trade within each Product. This section comprises a preliminary analysis which willinform further visual and statistical analysis. The structure of this “Simple DiscrepancyAnalysis” establishes the overall structure of analysis in Section 6: First is a view of thedata in aggregate, establishing relative importance of each partner and product, andidentifying the general trends that take shape over the study period. Secondvisualizations are developed showing the Simple Discrepancies by both product andpartner over the study period. Simple Discrepancies (the difference between pairedExport and Import reports of a given product, year, and partnership) are useful only froma high vantage point; the Methods section discusses limitations to analysis of SimpleDiscrepancies and the adjustments and transformations applied to create a moremeaningful metric.
Figure 4 shows the relative magnitude of trade within each product group over time. Inlater analysis, hardwood and softwood categories are combined into general productgroups (Logs, Lumber, Plywood) is dominated by Hardwood. While Lumber and Logsmake up a much smaller share of Indonesia’s exports than Plywood, these productgroups are important to analysis of timber legality risk as the less-processed productsmay be subject to less scrutiny and have been known to contain high levels of illegalityin Indonesian trade. The products are also inextricably linked, as logs and lumber formthe inputs for more highly processed exports such, most notable logs for plywood andlumber for furniture, which not included in this study, but an Indonesian industry ofsubstantial export value (Medyana & Ibadurrohman 2019).
32

Figure 4: Indonesia Timber Exports Over Study Period
Figure 5 shows the US Dollar value of Indonesia’s reported exports, sorted by productcategory. Hardwood plywood is the clearly dominant product exported. This generaltrend matches our historical review of Indonesia’s wood products industry from Section2. Lumber accounts for only 3.38% of export reports, but only 21.73% of imports,immediately pointing to large discrepancies and raising the question of what may causesuch a difference in reporting. Also notable are the differences in Export and Importreports for Softwood Plywood (1.77% and 6.95%), Hardwood Plywood (88.47% and72.8%), and Hardwood Logs (0% imports and 2.33% exports). Unfortunately, analysis ofthese data will not provide a clear-cut answer to the question of causes of suchdiscrepancies. Instead, this visualization provides greater insight into the risk of illegalityidentifiable in discrepancy trends over time and with specific partners. At this stage ofanalysis, it is sufficient to note the apparent discrepancy in preparation of furtheranalysis.
33

Figure 5: Percent Value of Timber Export and Import by Product
Figure 6 shows the aggregate value of Indonesian Timber Export reports, broken out byPartner. This complements Figure 1, which shows the total percent of exports attributedto each Partner studied, and adds a time dimension, enabling initial identification ofnotable trends. Most striking is the trend of exports to China, which exhibits a steep risein 2011-12 and steep fall in 2017-18. This visualization alone raises more questionsthan it answers, but it is useful to inform later analysis and conclusions. For now, it issufficient to note the obvious trend, and question whether there could be an associationbetween such events as this precipitous rise-and-fall of trade with China, and theSimple Discrepancies in product reporting identified from Figure 5.
34

Figure 6: Export Value by Partner over Study Period
Figure 7 provides a simple view of Indonesia’s import-export balance with a total of allpartners and wood products categories included in this study. Later analysis will identifymore detailed trends in specific bilateral relationships and product categories. At thisstage, it bears noting that import value exceeds export value for the entire study periodwith exceptions in 2008, and 2012-16. This general trend is to be expected, as exportreporting typically does not include cost of transportation beyond the exporting nation’sborders, while import reporting does account for these costs. Inversions of this trend areonly worth noting but not yet explainable. It can also be qualitatively observed that thetotal magnitude of value discrepancy between imports and exports decreases over theperiod of the study, but especially between 2000-2007.
35

Figure 7: Export-Import Value Comparison, Aggregated Products
Figure 8 breaks Figure 7 out by Product, revealing that simple discrepancies in Logsspiked through 2001, fell through 2003, and have remained constantly quite low since2004. Lumber imports are consistently higher than exports throughout the study, thoughthe gap appears to narrow slightly over the study period. Plywood simple discrepanciesappear to fluctuate more than either Logs or Lumber and is the only product in whichthe reported value of exports exceeds imports at any point, which occurs in 2007-08,2010, and 2012-2016. Most notably, the period from 2012-2016 coincides with themarket increase in reported exports to China identified in Figure 6. The Section 6analysis of Discrepancy Scores returns for further analysis of this observation.
36

Figure 8: Export-Import Value Comparison, Separated by Product
Now well acquainted with the general contours and patterns of this data, a discussion ofMethods follows which explains the challenges of working with trade data fordiscrepancy analysis, the adjustments applied (and did not apply) to mitigate the biaseslikely to occur in this data, the transformations made to arrive at a Discrepancy Scoreused for the full analysis presented here, and a discussion of the visualization andstatistical analysis tools applied to develop out analysis and conclusions.
Section 5. Methods
Challenges Using Trade Data to Identify IllegalityWhile the literature is in broad agreement that discrepancies in bilateral trade reportingmust be caused in part by illegal trade activities (McDonald 1985; Obidzinski et al. 2007;Lawson & MacFaul 2010; Fei et al. 2020), seeking insights into illegal trade is inherentlydifficult as supply chains lack visibility, illegal trade thrives on obscurity, and trade dataremain an imperfect measure of real trade (Rozanski & Yeats 1994; Jairo 2004; Chen2008; Kallio & Solberg 2018; Johnson 2002). No one method to identify and estimate
37

illegality can be said to provide the best or clearest approach; rather, each methodought to be well understood for its strengths and weaknesses, applied whereappropriate, improved whenever possible, and interpreted only within the limitationsinherent to the method as applied. Discrepancy analysis entails its own set of specificchallenges that can potentially hinder reliable results if misapplied or misunderstood. Tothat end, it is important to note that this trade data analysis can only possibly giveinsight into illegality that occurs within international trade, and inevitably does notcapture any illegal activity in the timber sector occurring only in domestic trade or notidentified somewhere along the supply chain for international trade (McDonald, 1985;Obidzinski et al., 2007; Lawson & MacFaul, 2010).
The following review establishes the range of challenges to employing this methodidentified in the literature, dividing these into “Sources of Discrepancy,” “Illegal TradeBaseline & Measurement,” and “Other Data Issues.” This included discussion of whichdiscrepancy sources this study does and does not seek to address, explaining here indetail the methodological adjustments and choices made in this study. This review is notexhaustive of all trade data discrepancy studies but is representative of the method asapplied primarily to timber trade and as it has developed over several decades. Thefollowing describes the transformations made to the data in this study in an effort tocontrol for normal sources of discrepancies. Equations corresponding to each datatransformation described here can be found in the Data Preparation section.
Sources of DiscrepancyMany sources contain typologies of discrepancy (see Goetzl 2005; Guo et al. 2009;Eastin & Perez 2003; Lawson & MacFaul 2014; Fei et al. 2020). Rather than attempt torepeat and compare all such lists, the following discusses specific instances in whicheach of the following challenges is discussed explicitly, or which informs the methodsused in this study.
Exchange Rates & Value estimatesGuo (2009), Marini (2018) and Chen (2008) identify exchange rates as a challenge toestimating discrepancy rates by value. Chen (2008) opts to conduct analysis based onvolume data because of the difficulty matching relative values between currencies overtime. However, Eastin and Perez-Garcia (2003) provide an empirical example thatJapanese Yen and US Dollar exchange rate fluctuation contributed only 0.2% of thelumber trade between those countries; and Jairo (2004) estimates that exchange ratefluctuation is unlikely to be a large factor, as nearly all imports & exports are reported inUSD; This is holds true for the GTA data used in this study: all value data are reportedin US Dollars. Further, the GTA data are less consistent in reporting quantity in cubicmeters, rather than kilograms or metric tons. This study assumes that using Dollar valuedata direct from the data source is preferable to applying exogenous conversion factors,as this may introduce yet another source of error, which runs against the goal of aimedat clarifying the error or variance between bilateral trade reports as far as possible, inorder to more accurately interpret illegality. Especially as unit conversion and volumeestimation are already sources of error in trade statistics arising directly from
38

governments, I believed dollar to be the more reliable metric despite the unavoidablecomplications.
Time / Shipping LagThe time lag between an export report and its corresponding import report presents achallenge for comparing data presumed to mirror exactly (Hamanaka 2012; Fei 2020). Ifcounty A reports an export in time period X, and country B makes an import report forthe same shipment in time period X+1, then discrepancy analysis of nations A and B intime period X will inevitably contain reports on different shipments and can therefore beassumed to contain discrepancies due to time lag. This problem is widely acknowledgedas a challenge to discrepancy analysis, but the literature is divergent on how to addressthe issue.
Marini (2018) highlights that improved promptness in reporting could significantlydecrease the lag by use of machine-based statistics record keeping. SeveralDiscrepancy studies acknowledge but do not attempt to resolve this particular problem(Eastin & Perez-Garcia, 2003; Vincent, 2004; Chen, 2008; Chang & Peng, 2015)McDonald (1985) applied a lag coefficient in analysis but removed it from the publishedresults after finding it had no significant effect on results. Chen (2008) cites twounpublished studies not located through literature review, Tachibana and Araya (2004),who estimate a 10% or greater lag influence in trade discrepancies; and Goetzl andWood Resources International (2003), who cite the US Census Bureau as estimatingbetween 0.5% and 1.5%. Both citations are included here; taken together, these twoestimates seem best as indications of a possible range and the presence of moreuncertainty than clarity on this point. Fei et al. (2020, p. 9) make the most sophisticatedattempt in this review to correct with an “adjustment factor” applied to export data.
The lag adjustment factor used in this study makes the same 1-month shipping timeassumption as Fei et al. (2020) with some notable changes. While Fei et al. (2020) usequarterly data, this research was limited to accessing annual data. The Fei et al. lagadjustment makes use of an exponential function that has the effect of discounting verylarge discrepancy values in the data used for this study. Applied to Indonesia trade data,which exhibits many cases of large discrepancies, this adjustment would distort thedata. Instead, this study applies a moving average adjustment, shifting Indonesia’sannual export data forward by one-twelfth to approximate a one-month correction inreporting periods.
FOB / CIFFOB stands for Freight on Board, the total cost of producing, transporting, and up toloading a commodity onto a ship bound for export. Most exporters pay and report usingFOB accounting. While exceptions exist, they are few. CIF stands for Cost, Insuranceand Freight, which includes the cost of insuring and delivering a shipment to its finalpurchaser. CIF is an expense added on top of FOB (the customer pays the full cost ofproduction, plus cost of overseas transport and insurance), and is commonly assumedas the standard method for reporting import data. Hiemstra and de Haan (2017)recommended to the UN Statistics Advisory Expert Group that the structure of reportingexports as FOB and imports as CIF be issued international guidance to improve related
39

data issues. Even in a world where export and import data were completely reliable andconsistent, this CIF / FOB difference introduces a predictable, if not perfectly quantifieddiscrepancy into values reported in trade data.
All of the timber trade discrepancy studies reviewed include acknowledgement of thispattern, but none makes an adjustment for FOB-CIF discrepancies. The World Bank(2010) estimates a 10-20% difference but offers no further information on this estimate.Marini et al (2019) explain that the IMF Difference of Trade Statistics (“DOTS”) databaseuses a 6 percent adjustment to estimate missing import values. Miao and Fortanier(2017, p. 23) conduct an analysis of explicit reports of CIF costs for the 16 nations forwhich data is available, confirming the 6 percent assumption behind the DOTSdatabase, and concluding “...the estimated trade-weighted average CIF-FOB margin in6.2% for all countries [included in the study] across the period of 1995 to 2014.” Giventhe close alignment between IMF and this empirical analysis, this study applies a 6.2%CIF adjustment to all import values included in the study.
Other Sources of DiscrepancyIn addition to the adjustments made to control for certain forms of normal discrepancies,other sources of both normal and possibly illegal discrepancies are widely understood toexist (Rozanksi & Yeats 1994; Goetzl 2005), which this study does not attempt toquantify or control for.
Product misclassification and misreporting varies in reporting at the national andcompany levels (Chen, 2008; Lawson & MacFaul, 2010; Eastin & Perez-Garcia; Fei etal., 2020). This can result from combined shipment with other products (Eastin &Perez-Garcia 2003); reporting beyond the 6-digit HS Code level at which internationalcodes are harmonized (Tachibana & Araya 2004; Chen 2008); non-reporting orintentional misclassification (Fung et al. 2010; Hamanaka 2012; Lawson & Macfaul2014); inadequate data collection and validation systems (Goetzl 2005);misclassification of country of origin or destination (McDonald 1985); and simple dataentry errors (Chang & Peng 2015)
Product measurement and conversion factors may vary between individual nations,companies, and data compilers (Eastin & Perez-Garcia 2003; Goetzl 2005; Jairo 2007;FAO et al. 2020). Forest product quantity data available through GTA were reportedlargely in cubic meters, but with a great deal of inconsistency that included metric tons,kilograms, and non-metric weights. In contrast, product values are reported by GTAconsistently in US Dollar values. Applying manual conversions to arrive at comparablevolume data was too large a risk of biasing already problematic trade data. Instead, thisanalysis is conducted on dollar values, which at least have been subject to the samestandard conversion by the data source.
Transshipment or triangle trade of timber exports through intermediate ports beforearriving in final destinations may add legitimate costs more properly understood asseparate export costs (Feenstra et al. 1999), administrative errors or poor monitoring, orintentionally fraudulent activity (Goetzl 2005; Jairo 2007). Of specific relevance to this
40

study, Taiwan, Hong Kong, and Singapore are the largest transshipment hubs inSoutheast Asia (Jairo 2007).
In addition to the sources of discrepancies detectable in bilateral trade statistics, avariety of forms of illegality may enter timber products trade, many of which may notever rise to the level of contributing to trade discrepancies.
Illegal Trade Baseline & Measurement
Illegal timber trade is notoriously difficult to identify, track, and measure, and it istherefore impossible to say how much of which timber products are illicit. Gan et al.(2016, p. 43) identify four general approaches to this problem as “data discrepancies,wood balance analyses, import source analyses, expert surveys and hybrid methods.”The following descriptions highlight the relative strengths and weaknesses of existingpractices by way of explaining the decision to conduct a study based on trade datadiscrepancy.
Expert SurveysThis entails developing estimates from the aggregated estimates in survey responsesby officials relevant to the trade relationship and product in question. This method is, onthe one hand, based in expert perspective and direct experience of perhaps the mostinformed individuals; and on the other, consists only of estimation and potentiallycontains bias originating in the very expertise that qualifies one’s responses.
Wood Balance Analysis:Wood balance analysis “compares timber inputs (the sum of production and imports)and outputs (the sum of exports and domestic consumption), comparing this to quantityexported” (Gan, 2016, p. 56); or “compares the legal supply of timber (officiallypermitted logging and legal imports) with actual consumption (domestic consumptionand exports).” (Lawson & MacFaul, 2010, p. 89). In simple form, this looks like:
G = (P+I) - (C+X)
Where G = quantity (value or volume) of illegal timber, P = domestic production, I =imports, C = domestic consumption, and X = exports. Lawson & MacFaul (2010) warnof limitations to wood balance analysis before undertaking their thorough attempt: Nostandard method exists, rendering comparison between analyses difficult (though thischallenge may be leveled at any of the methods in questions); the method is onlycapable if identifying illegality in excess of legal harvest, and may miss illegality inproduction that occurs “before” that threshold is reached; and does not account of illegaltimber smuggled out of a producer nation and escaping official reporting.
Import Source Estimation:Import source analysis entails making an informed estimate of percentage of illegality inproducer country timber supply chains, then multiplying total exports by that rate toarrive at a total quantity or value of illegal trade. Import source analysis take the basicform:
41

G = X*R
Where G = Illegal Quantity (Dollar or value), X = export quantity (volume or value), andR = estimated rate of illegality. This can be applied to all product trade, or morerealistically calculated for individual producer nations, products, trade partners, andpolicy environments as used by Lawson & MacFaul (2010), Lawson (2010), Hoare(2014), and Barua et al (2016). Lawson & MacFaul (2010) acknowledge both thepredominance of this method and its shortcomings, including being used simplisticallyresulting in attention-grabbing estimates of illegality, and of failing to identify changesover time unless R is thoroughly estimated and updated with regularity. Gan (2016, p.47) prefers Import Source, as it is anchored in quantifiable import data and “[makes]reference to widely-used illegal logging rates.” It must be noted, however, that thismethod can only be as reliable as the rate estimates themselves, which Gan (2016)also gives reason to question.
Hybrid Techniques:Hybrid techniques entail a combination of the estimation methods described above.Lawson & MacFaul (2010) provide an example of a thorough process of developingillegality estimates based on expert interviews, trade and enforcement data, policy andimplementation trends, and shifting economic dynamics. Hoare (2014) extends thisin-depth estimation technique to a broader range of producer, processor, and consumernations.
Trade Discrepancy Analysis:Trade data discrepancy analysis, which this study is an example of, entails comparingimport and export data to arrive at a discrepancy which may indicate illegal activitysomewhere in the trade relationship. A naive model of trade discrepancy would be:
G = I - X
Where G = quantity (volume or value) of illegality, I = Import quantity, and X = Exportquantity. From this, one may extrapolate to a ratio of illegality to imports:
Illegal Import Ratio: RI = 𝐺𝐼
Illegal Export Ratio: RX = 𝐺𝑋
The strengths of data discrepancies are that both import and export values can beobtained from official trade data sources and therefore no estimation is necessary toconstruct a simple discrepancy model. This enables analysis that is based on officiallyreported data and quantifiable differences between trade reports from importing andexporting nations. There are significant challenges inherent in trade data that must beovercome to ensure import and export data are comparable. Lawson & MacFaul (2010)also stress that trade data inevitably conceal illegality that takes place in domesticconsumption or goes undetected before entering official channels. This point is well
42

taken and requires that the interpretation of trade discrepancy analysis take intoaccount the likelihood that illegality likely exceeds what is visible in official data.Nevertheless, there is value in the method for its capacity to produce results less relianton estimation in the other methods. It also has the potential as a method to identifyillegality in trade even after specific illegal acts have gone undetected, shining light ontrade relationships and products especially susceptible to illegality. Specific challengesto discrepancy analysis are discussed in the following section, addressing also themeasures taken to improve the naive model by adjusting for known challenges.
Other Data Issues
Zeros in Trade DataBilateral trade data inevitably includes zeros, which can be problematic both forqualitative interpretation and when applying any mathematical manipulations to data forfurther analysis (Kareem and Kareem 2019). A zero in trade data may represent anactual figure of $0 or zero-volume or weight reported by a nation; or it could indicate ayear of non-reporting on a product. This presents a complex interpretive context inwhich a single zero-value reported has multiple viable, often exclusive, qualitativeinterpretations, while also posing a problem in quantitative data transformation. Theliterature is best developed around dealing with when applying logarithmictransformation to trade data containing zeros values (Kareem & Kareem 2019).
This study applies two methods to cope with the presence of zero values, which areplentiful in the raw dataset. First, the Time Lag Adjustment discussed in the previoussection applies a rolling average adjustment, which automatically moves one-twelfth ofa previous year’s export value into the following reporting year. This has the effect offilling in placeholder non-zero values for successive years of $0 reporting following ayear with non-zero reporting.
While this moving average renders the data analyzable, it may also be a poorrepresentation of actual trade. If trade occurred but went unreported, the movingaverage total is unlikely to accurately represent the magnitude of trade for the missingyear. If the actual trade reported was $0, the moving average risks masking this reportand distorting later analysis which estimates risk of illegality by the severity ofdiscrepancy between import and export. This study seeks to mitigate this bias bytruncating data - a method commonly applied even more crudely than that used here,by simply eliminating all observations with a zero value (Kareem & Kareem 2019). Afterapplying the lag adjustment, the 30% of all bilateral observations are truncated for whichthe sum of import and exporter reports is smallest. This essentially limits the rate of biasintroduced by the lag adjustment, which would account for at most 12% of each sum ofbilateral observation. It has the secondary advantage of eliminating any observationswhere both importer and exporter report $0 for a given year and product. Truncationinevitably leads to loss of meaningful information, but discrepancy analysis as a meansto identify risk of illegality is appropriately most concerned with larger discrepancieswithin trade partnerships of greater magnitude.
43

Data PreparationThis study begins with the raw data introduced above and applies several adjustmentsand manipulations to render it more meaningfully comparable between import andexport reports. The following explains each data manipulation applied to arrive at thisanalysis.
UnitsThis study began with both US Dollars (“USD” or “$”) and Cubic Meters (“M3”). Eachhas its advantages as a metric and can be used together to gain greater insights fromthe data than possible in isolation. However, analysis relies primarily on US Dollarshere, due to difficulties calculating reliable conversion factors for data in different woodproducts categories reported variously as kilograms, metric tons, and cubic meters.While using US Dollars does present the challenge of fluctuating exchange rates overtime, it will be possible to refer back to point-in-time exchange rates as necessary todevelop detailed analysis.
Elements and PartnersThis study develops analysis of the discrepancies between reported exports andreported imports. This is referred to in the data and charts as the “Element” and referredto here simply as “Import” or “Export”. This means that when exports are beingdiscussed for this analysis, this study refers to the data reported directly by the exporter,Indonesia; discussion of imports refers to the data reported by importing nations. Forthis reason, and somewhat confoundingly, the terms “Reporter” and “Partner” are usedas relative to the Element being analyzed. For example, when discussing exports, theReporter is Indonesia and all others are Partners; but when discussing imports, therelevant nation or group is the Reporter, and Indonesia the partner. This is due in part tothe nature of the study which aims to learn whether and what discrepant patterns existin Indonesia’s wood products data reporting as compared with that of its trade partners.This study compares two perspectives of a one-way trade flow. The study thereforeincludes export data for Indonesia and import data for all other included nations andnational groups.
ItemsThis study includes six categories of Indonesian primary timber products (See the “DataOverview” section and Appendix 1 for a discussion of these product groups):
● C4 Hardwood Logs● C4 Hardwood Lumber● C4 Hardwood Plywood● C4 Softwood Logs● C4 Softwood Lumber● C4 Softwood Plywood
Softwood and hardwood categories are combined into Logs, Lumber, and Plywood forAnalysis in Section 6.
44
Lag adjustmentA moving average is applied to shift import values by one month to more closely controlfor 1-month shipping time lag. This equation has the added benefit of interpolating atleast partial import data into years where importing nations had $0 reports, renderinglater discrepancy ratio calculations possible. The Lag Adjusted Value (LAV) equation is:
𝐿𝐴𝑉 = 𝑌𝑒𝑎𝑟 1 𝑣𝑎𝑙𝑢𝑒 × 1112( ) + 𝑌𝑒𝑎𝑟 2 𝑣𝑎𝑙𝑢𝑒 × 1
12( )CIF/FOB adjustmentLag-adjusted Import values are divided by a CIF adjustment factor of 1.062, asexplained in “FOB / CIF Adjustment” section. This decreases imports values by theestimated 6.2% discrepancy due to imports reporting of Cost, Insurance, and Freightrather than Freight on Board. The Adjusted Partner Value (APV) equation is:
𝐴𝑃𝑉 = 𝐿𝐴𝑉1.062
Simple DiscrepancyA Simple Discrepancy (SD) is derived by subtracting an APV from a Reporter Value(RV, or export) for a specific product, year, and partner, or finding the differencebetween exports and adjusted imports.
𝑆𝐷 =
𝑅𝑉 𝑜𝑓 𝑝𝑟𝑜𝑑𝑢𝑐𝑡 𝑋 𝑖𝑛 𝑦𝑒𝑎𝑟 𝑌 𝑡𝑜 𝑝𝑎𝑟𝑡𝑛𝑒𝑟 𝑍( )− 𝐴𝑃𝑉 𝑜𝑓 𝑝𝑟𝑜𝑑𝑢𝑐𝑡 𝑋 𝑖𝑛 𝑦𝑒𝑎𝑟 𝑌 𝑓𝑟𝑜𝑚 𝑟𝑒𝑝𝑜𝑟𝑡𝑒𝑟 𝑄( )
Discrepancy RatioThen a Discrepancy Rate (DR) is calculated by dividing the simple discrepancy by theaverage of import and export values. This has two important aspects. First, when aspecific instance of mirrored trade contains a zero-value reported by either a Reporteror a Partner, averaging the two effectively works around the zero-value challengediscussed previously. Second, dividing by the average of imports + exports reflects theassumption that a discrepancy constitutes an aggregate of errors in reporting, and thatthe “real” value of trade exists somewhere between the two reports. Having controlledwhere possible for import-side reporting discrepancies, this study assumes an averageof imports and exports is the best approximate of “real” trade with which to build adiscrepancy ratio. Third, this ratio returns a set of values, all between 2 and -2,rendering the widely variant Simple Discrepancy, more readily analyzable. This has theeffect of constraining further analysis to interpretations of rate rather than magnitude,enabling us to approach questions of discrepancy rates relative to volume of trade foreach product and partner. The equation for Discrepancy Rate is:
45

𝐷𝑅 = 𝑆𝐷𝑅𝑉+𝐴𝑃𝑉( )
2
Discrepancy ScoreDiscrepancy Rates are then weighted by sorting Simple Discrepancies into deciles andapplying a multiplication factor to the Discrepancy Rates to arrive at weightedDiscrepancy Scores (DS). This improves on the DR by weighting large valuediscrepancies more heavily than small value discrepancies. To create this score, theabsolute value of Simple Discrepancies is divided into ten deciles, each containing anequal number of observations and ranked 0-9 from smallest to largest absolute value(DEC). This is then multiplied the Discrepancy Rate of each observation by the Decile,resulting in a weighted Discrepancy Score.
𝐷𝑆 = 𝐷𝑅 ×𝐷𝐸𝐶
Data Non-Linearity
Initial testing for heteroskedasticity gave reason to question this assumption. Figure 6Charts each Discrepancy Rates for each Importer inclusive of all Items, compared to atheoretical linear model and shaded area denoting the 95% confidence range.Discrepancy data for each partner exhibit a similar roughly S-shaped pattern where thepreponderance of observations in the “middle” of the data lie relatively closer to thelinear model as compared to the tail ends of the data, indicating a very high density ofoutliers at the extremes of our discrepancy ratio values. This pattern appears sufficientlyand consistently divergent from the linear model to question whether the assumption oflinearity is appropriate. Quantile-Quantile plots (qq plot) are used to verify thisobservation. Figure 9 shows qqplots broken out by Partner, and Figure 10 shows thedata divided by Product. Discrepancy rates sorted by both Partner and Product exhibit asimilar pattern of deviation from linearity.
46

Figure 9: National Discrepancy Rates compared to Linear Model
47

Figure 10: Product Discrepancy Rates Compared to Linear Model
This pattern may be expected as a result of data cleaning and Discrepancy Ratioequation. Rows of data were removed where both exporter and importer recorded $0trade but kept all observations where at least the importer or exporter reported a tradevalue, as this data may provide meaningful insight. Applying a ratio equation thentransforms any instance of unilateral reporting into a -2 or +2 Discrepancy Ratio,concentrating all such observations toward the poles of this data. This is not altogetherundesirable for the purposes of this study, which aims to detect where national reportingis most extreme. This should enable clear identification in cases of systematicnon-reporting by specific partners or items, or a combination. It does, however, givecause to question how the “shape” (linearity) of our Discrepancy Ratio data pulls theraw data away from its assumed normality.
It is quite likely that some of this non-normality is due to outlier results, especiallyarising from instances where one trade partner reports a 0 value in the same productand year that the other partner reports any positive value. As noted above, this resultsin a discrepancy rate of -2 or +2, as can be seen in Figures 9 and 10. These outliers,however, cannot be presumed irrelevant or merely anomalous for this data. From a pure
48
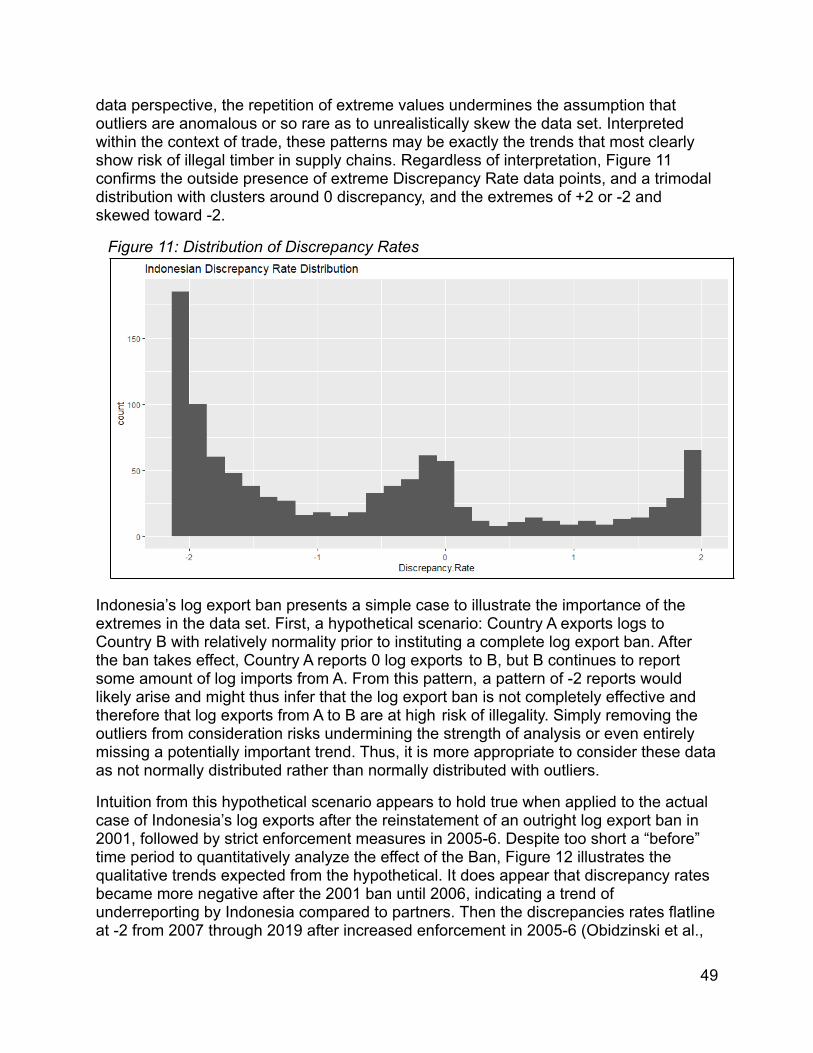
data perspective, the repetition of extreme values undermines the assumption thatoutliers are anomalous or so rare as to unrealistically skew the data set. Interpretedwithin the context of trade, these patterns may be exactly the trends that most clearlyshow risk of illegal timber in supply chains. Regardless of interpretation, Figure 11confirms the outside presence of extreme Discrepancy Rate data points, and a trimodaldistribution with clusters around 0 discrepancy, and the extremes of +2 or -2 andskewed toward -2.
Figure 11: Distribution of Discrepancy Rates
Indonesia’s log export ban presents a simple case to illustrate the importance of theextremes in the data set. First, a hypothetical scenario: Country A exports logs toCountry B with relatively normality prior to instituting a complete log export ban. Afterthe ban takes effect, Country A reports 0 log exports to B, but B continues to reportsome amount of log imports from A. From this pattern, a pattern of -2 reports wouldlikely arise and might thus infer that the log export ban is not completely effective andtherefore that log exports from A to B are at high risk of illegality. Simply removing theoutliers from consideration risks undermining the strength of analysis or even entirelymissing a potentially important trend. Thus, it is more appropriate to consider these dataas not normally distributed rather than normally distributed with outliers.
Intuition from this hypothetical scenario appears to hold true when applied to the actualcase of Indonesia’s log exports after the reinstatement of an outright log export ban in2001, followed by strict enforcement measures in 2005-6. Despite too short a “before”time period to quantitatively analyze the effect of the Ban, Figure 12 illustrates thequalitative trends expected from the hypothetical. It does appear that discrepancy ratesbecame more negative after the 2001 ban until 2006, indicating a trend ofunderreporting by Indonesia compared to partners. Then the discrepancies rates flatlineat -2 from 2007 through 2019 after increased enforcement in 2005-6 (Obidzinski et al.,
49

2007; Prasetyo, 2012), resulting from consistent 0 reports by Indonesia compared topositive reports by partners. The implication here is that Indonesia reports no logexports in accordance with the ban, but that these reports should be regarded withsuspicion given consistent reports that partners receive at least some log imports fromIndonesia.
Figure 12: Indonesian Log Discrepancy Rates 2000-2019
While Discrepancy Rates appear non-normally distributed, the Discrepancy Score data(a weighted Discrepancy Rate) appear closer to normal, as shown in Figure 13.However, Figure 14 contradicts the intuition from Figure 13, showing that DiscrepancyScore data are not normally distributed. Despite data non-normality, this study appliesANOVA and T-Tests, both of which are relatively robust to deviations from normality.
50

Figure 13: Distribution of Discrepancy Scores
Figure 14: Discrepancy Scores Compared to Linear Model
51

Visualizations
Four “Views” or grouped sets of visualizations are developed to enable deeper insightsinto the data. This begins at a general level of visual analysis, with each successiveseries drilling further into the detailed and specific relationship between DiscrepancyScores and Partners, Products, and Time Periods. View 1 is a relatively simplecomparison of Indonesia’s reported Exports compared to its Discrepancy Scores,indicating the importance a partner plays as a timber product exporter relative to theDiscrepancies in that partnership. View 2 is an “Aggregate View” of mean discrepancyscores across all Partner and products. View 3 is a “Product View”, showing meanDiscrepancy Scores broken out by Product. View 4 is a “Partner View”, which showsProduct-specific mean Discrepancy Scores for each Partner. View 4 also shows aselection of the policy events collected in Appendix 2, enabling the construction ofPolicy Periods described below and used in the Statistical Testing section.
Risk ZonesIn Discrepancy Score visualizations, we apply an approximate “risk level” indicator,which divides the entire Discrepancy Score range into three colored zones representingtheir magnitude of Discrepancy Score, or the distance from a score of 0. As Scoresdeviate further from 0, we regard them as of higher risk of illegality, regardless ofnegativity or positivity (which represent whether a given export report by Indonesia fallsabove or below its mirrored Partner import report). Therefore, the Zones are bestunderstood as indicating the range of absolute distance from Zero Discrepancy Scores.Zone 1 is colored green to indicate low risk of illegal activity and ranges from negativesix to positive six. Zone 2 is colored yellow to indicate moderate risk, and ranges fromnegative six to negative twelve and positive six to positive twelve. Zone 3 is colored red,indicating high risk and ranges from negative 12 to negative eighteen, and positivetwelve to positive eighteen. These zones are not scaled to the data, meaning that 33%of the data do not fall into each zone. Rather, the zones are based on the static range ofdiscrepancy scores and indicate the approximate density of scores within that zone.Figure 15 is a blank example of the Risk Zones as used in the Analysis section, Views 2and 3. For partner-specific visualizations used in View 4 and in the Statistical Testingsection, the same Zones are used but find it more illustrative to color the barsthemselves rather than background colors.
52

Figure 15: Discrepancy Risk Zones Example
Policy PeriodsOur statistical analysis primarily consists of comparing mean discrepancy scores acrosstime periods, trade partners, and product categories. The product categories andpartners are givens, while the time periods are constructed for the purposes of thisanalysis. In creating the time period Indonesia’s policy timeline is primary, which placessecondary importance on policy timelines for trade partners as well as visualinterpretation of the Discrepancy Scores trends. The policy timelines are inevitablycoarse, intended to enable analysis of larger trends, rather than pinpoint moments atwhich trends shift. The imprecision is due to a combination of factors: annual dataforces the decision of when to say a policy takes effect; in some cases, it was possibleto locate specific enforcement or implementation dates (see section 2), but even given aprecise date, the interaction between data reporting lags and policy timelines is difficultto estimate.
Given this ambiguity, this research makes several assumptions and apply them asconsistently as possible. I assume that Indonesia’s domestic and international policiesshould be considered as primary, and partners’ policies as secondary - this means thatthe policy periods are designed according to Indonesia’s policies as a firstconsideration. When statistical tests are run on importing nations’ policies, this is statedclearly in the accompanying analysis. Except where a specific implementation date isknown, the policy’s adoption or enactment date is used as the appropriate cutoff period.Implementation is considered more likely to result in a reduction of Discrepancy Scoresthan enactment or adoption. Take for example Australia’s Illegal Logging Prohibition Act(ILPA) passed in 2012 and the Illegal Logging Prohibition Regulation (ILPR) of 2014:because the ILPR puts the ILPA into effect, 2014 is taken a better cut-off for a policyperiod. Finally, literature and qualitative interpretation of Discrepancy Score trendsinform which policies appear most closely associated with notable shifts.
53

Period 1 runs from 2000-2005, informed primarily by then-Indonesian PresidentYudhoyano’s enforcement mandate discussed in Section 1. This is also somewhatcongruous with Malaysia’s import bans on logs and sawn wood in 2002 and 2003respectively and Japan’s Goho Wood addition to its sustainable procurement policy.
Period 2 runs from 2006-2008, the period of enforcement following Yudhoyano’smandate. There is a notable decline in Discrepancy Scores among many Importingnations during this period, most visible in the Lumber Discrepancy Scores figures inAppendix 3, followed by a rebound in discrepancy scores in the several years following2008. The global recession beginning in the USA and spreading globally in the followingyears provides further subjective reason to break this period in 2008. This timeline isalso roughly aligned with the US Lacey Act amendment passed in 2008 and updated toinclude wood HS Codes in 2009.
Period 3 runs from 2009 - 2013. Indonesia issued regulations enforcing its TimberLegality Assurance System (TLAS, or SVLK in Bahasa) in 2013 as part of its VPAagreement with the EU signed the same year and active in 2014. It is alsoapproximately synchronized with Korea’s 2012 Act on the Sustainable Use of Timbers,and Australia’s 2014 Illegal Logging Prohibition Regulation.
Period 4 runs from 2014 - 2019, given the absence of significant new timber trade policyin Indonesia. While trade partner nations do enact, implement, or amend policies duringthis period, those changes are mostly ancillary to existing policies (e.g., Korea’s 2018Partial Amendment to the Act on Sustainable Use of Timbers, which put in placemandatory implementing regulations). I judge that these importer-nation policies arebest addressed in nation-specific analysis.
Statistical Test Series
Building from the Views analysis of this Discrepancy Scores data, 6 statistical “TestSeries” are conducted in approximately the same fashion as the Views: beginning withgeneral tests at aggregate levels of Partners and Products and developing detailedtests at progressively finer levels of analysis. Each of these tests is constructed aroundthe Policy Periods described above, or around specific Partner policy events.
Test Series 1: Null Hypothesis “There is no difference in mean Discrepancy Scores witha given Partner across the four Periods.” and an Alternate Hypothesis: “MeanDiscrepancy Scores with Partners differ significantly between the four Periods.” To testthis, a One-Way ANOVA on the effect of Time Period on Mean Discrepancy Scores foreach Partner and with aggregated Products is conducted. A Tukey Honestly SignificantDifference Tests (“Tukey HSD” or “Tukey Test”) to identify the specific Periods whichhave a significantly different mean Discrepancy Score for a given partner is thenconducted for each Partner that shows a significant P-Value from the ANOVA test.
Test Series 2: Null Hypothesis: “There is no difference in Mean Discrepancy Score ineach product category and across all Periods.” The Alternate Hypothesis is: “Mean
54

Discrepancy Scores differ in each product category between Periods.” A one-wayANOVA test is used to compare mean Discrepancy Scores in each Period for eachProduct, keeping Partners aggregated. Finally, a Tukey Test is conducted to identifywhich specific periods return significantly different results.
Test Series 3: The Null Hypothesis is: “There is no difference in mean LumberDiscrepancy Scores with each Partner between Periods.” The Alternate Hypothesis is:“Mean Lumber Discrepancy Scores with each partner differ between Periods.” Thedataset is narrowed to Lumber, and test for differences between Periods for eachPartner using one-way ANOVA, followed by a Tukey Test to identify which periods aresignificantly different for given Partners.
Test Series 4: The Null Hypothesis is: “There is no difference in mean DiscrepancyScores for Indonesian Lumber exports before and after a given policy event.” TheAlternate Hypothesis is: “Indonesia’s mean Lumber Discrepancy Scores differsignificantly before and after a given policy.” Two-tailed t-tests are conducted onIndonesia’s mean Lumber Discrepancy Scores before and after both its 2005Enforcement Order, and 2013 implementation of the SVLK policy.
Test Series 5: The Null Hypothesis is: “There is no difference in mean LumberDiscrepancy Scores Between Indonesia and a Given Partner before and after thatPartner’s Policy Event.” The Alternate Hypothesis is: “Mean Lumber DiscrepancyScores between Indonesia and a given partner differ before and after that Partner’sPolicy Events.” Two-sided t-test with unequal variance on mean Discrepancy Scoresbetween Indonesia and each partner that has adopted a specific timber import policyduring the study period test this hypothesis. Two tests are run for Japan and Korea,each of which adopted two specific policies during the study period.
Test Series 6: The Null Hypothesis is: “There is no difference in mean LumberDiscrepancy Scores between Indonesia and a given Partner with no import policybefore and after Indonesian Policy Events.” The Alternate Hypothesis is: “Mean LumberDiscrepancy Scores between Indonesia and a given Partner with no import policy differsbefore and after Indonesian Policy Events.” Two-sided t-tests with unequal variance onmean Discrepancy Scores between Indonesia and each partner that does not have atimber import policy to test this hypothesis. The first tests for significant differencesbefore and after the 2005 Enforcement order; the second tests before and after SVLKimplementation.
Section 6. Analysis: Indonesian Timber Trade Discrepancies 2000- 2019
Two widely accepted assumptions, established in Section 1, frame the followinganalysis: That illegality in timber trade contributes to Import and Export reportingdiscrepancies between partner nations; and that Indonesian timber trade in particular
55

continues to include some amount of illegal product. The three research questions are:1) How effective are national policies at curbing Indonesian illegal timber trade? 2)Which specific nations exhibit the highest risk of illegal timber imports from Indonesia?3) How effective is Discrepancy Analysis for identifying illegality in timber supply chains?
To approach these questions, this analysis begins with a series of Discrepancy Scorevisualizations to identify the high-level trends in this data. These visualizations areconstructed prior to statistical analysis in order to inform testing hypotheses and identifyappropriate statistical tests. This entails the development of several “Views” of the data,which reveal Discrepancy Score dynamics in the entire system (View 1), within eachProduct category (View 3), and specific to each Partner (View 3). The Product-specificvisualizations include significant policy events for Indonesia, and the Partner-specificvisualizations include Policy events for both Indonesia and the relevant Partner. Theseviews inform hypotheses and statistical testing decisions including the Time Periodsused to compare periods of this study with one another. Following from the Views, sixstatistical “Test Series” are developed to evaluate the significance of trends identifiedfrom qualitative interpretation of the previous visualizations.
Discrepancies Visualization
This analysis of Discrepancy Scores visualization proceeds in four steps, each of whichenables intermediate observations and conclusions as well as informs statistical testingin the following section. View 1 compares Indonesia’s Export values for each Productand Partner, establishing grounds for a general intuition of the share of discrepanciescompared to the magnitude of trade and informing test Series 5 and 6. View 2 displaysmean Discrepancy Scores for the aggregate of all Partners and all Products, followedby average Discrepancy Scores in each Product category, informing Test Series 1 and2. View 3 provides Discrepancy Scores with Partners aggregated and Products brokenout separately, informing the decision to limit statistical testing to Lumber in Test Series3-6. View 4 shows each specific Partner’s Discrepancy Score data in all three Productcategories side-by-side and includes relevant Policy events for partners also detailed inAppendix 2 and the “National Partner Policies” section. Each nation’s Scores areobserved individually to enable detailed analysis of Partner dynamics within Productcategories, informing the Policy Periods used for statistical testing and enablinginterpretation of results from each Test Series.
In all of the following visualizations, the green, yellow, and red coloring of bars orshaded regions indicate respectively the lowest, middle, and highest 33% ranges of thefull Discrepancy Score scale, which is a weighted average with a range of negative 18to positive 18. Negative scores indicate underreporting by Indonesia compared to itsPartners; positive scores indicate Indonesian overreporting. Additional to thevisualizations discussed in detail here, Appendix 3 provides panels for eachcombination of Partner and Product with significant Indonesian Policy events annotatedas vertical bars.
56

View 1: Shares of Export Value Compared to Discrepancy ScoresFigure 16 is a side-by-side comparison of reported exports and reported imports, sortedby Item and with all Partners aggregated. It is important to note that the data arenarrowed here to include only Logs, Lumber, and Plywood categories, and combined allSoftwoods and Hardwoods for each of these categories. Several high-level trends standout: Hardwood plywood accounts for 84.5% of exports but 72.8% of imports; Hardwoodlumber accounts for 3.12% of exports but 21.7% of imports; and Hardwood logs accountfor 0% of exports but 2.33% imports. At this stage, it is only possible to note trends andpose questions to inform further analysis. As noted in the previous historical section,Indonesia has maintained some form of log export ban since 2001. While the 2.33%difference between export and import of hardwood logs may seem of trivial magnitude,the policy context gives reason to pay special attention to this product category for signsof underreporting of log exports, as this may indicate illegal trade.
Figure 16: Product Percent of Export Values and Discrepancy Scores
Figure 17 shows a comparison between the percent of timber exports Indonesia reportsto each of the Partners studied, alongside the percentage of Discrepancy Scores that
57

each of those trade partnerships represents. At a crude level, this comparison indicatesthe scale of discrepancy relative to the importance of a trade partnership.
Only three nations account for a larger percentage of export value than DiscrepancyScores, with Japan at 44.6% of trade and only 5.1% of Discrepancy Scores; the UnitedStates 11.7% trade and 6.6% Discrepancies; and Korea 8.4% of trade and 5.6% ofDiscrepancies. This may be reason to think that each of these partnerships is of littleconcern from a standpoint of illegal timber imports, especially as each has enacted andimplemented timber import policies and regulations. This intuition is supported by thereverse trend: Partners with no timber import policy that account for a larger share ofDiscrepancy Scores than of export value. Those nations include China (13.9% trade,20.8% discrepancy), India (1% trade, 8.3% Discrepancy), Malaysia (1.9% trade, 9.7%Discrepancy), Singapore (1.7% trade, 11.6% Discrepancy), Taiwan (5.9% trade, 10.2%Discrepancy), and Thailand (0.4% trade, 3.3% Discrepancy). The only exceptions to thistrend are Australia (1.7% trade, 7.9% Discrepancy) and the European Union (8.8%trade, 10.9% Discrepancy). However, these are two large exceptions as both Australiaand the EU have enacted robust policies with Indonesia-specific agreements.Therefore, this high-level comparison does not yet fully support the notion that thesimple existence of timber import policy leads to a reduction in Discrepancy Scores andillegality.
A regional pattern is observable: Each of the Partners for whom Discrepancy Scoresare out of proportion with Export Values is a regional neighbor, with the European Unionthe only exception. Though a clear explanation is not supported here, but it is plausiblethat this is due to bias in the uniform application of CIF/FOB adjustments discussed inthe Methods section. It may also be that the combination of less-regulated importers(China, India, Singapore, Thailand), and less-developed nations play a part in theeffectiveness of illegal timber trade controls (the EU and Australia are both exceptionsto this theory).
The following Views dissect the data more finely and enable discussion of trends overtime that lend greater nuance to the following analysis.
58

Figure 17: Partner Percent of Export Values and Discrepancy Scores
View 1 Summary Observations and ConclusionsShares of Discrepancy Scores are proportionately lower than shares of export valueamong several Partnerships where the importer has a timber import policy (Japan,United States, Korea). Two notable exceptions to this trend are Australia and the EU,each of which has a timber import policy but accounts for a proportionately greatershare of Discrepancies than export value.
Shares of Discrepancy Scores are proportionately higher than shares of export valueamong several Partnerships where the importer has no timber import policy (China,India, Malaysia, Singapore, Taiwan, and Thailand). There are no exceptions to this trendin the data.
Regional neighbors exhibit a share of Discrepancy Score disproportionate to their shareof Export Value.
Logs and Lumber each account for a disproportionately large share of DiscrepancyScores compared to their relative Export Value; the opposite is true for Plywood.
59

Therefore, Plywood trade appears of least concern, Logs of significant risk in thecontext of Indonesia’s export ban; and Lumber of greatest risk.
View 2: Aggregated Discrepancy ScoresFigure 18 presents the average discrepancy scores for each year in the study, with allPartners and Products aggregated. Most immediately obvious is the consistentlynegative Discrepancy Scores, which may range from -18 to 18, but at the aggregatedlevel are negative for the entire study period. Indonesia consistently underreports thevalue of its timber exports compared to Partners’ import reporting. While this patternmay be expected in simple differences between raw import and export reports (Goetzl2005; Ortiz-Ospina & Beltekian 2018), this trend of underreporting persists even afterthe adjustments applied to correct for shipping lag time and freight and insurance costs.The CIF cost is the only normal source of discrepancy which should be expected to biasdata toward the negative due to importers accounting for costs not typically included inexport declarations (Hiemstra & de Haan 2017; Marini et al. 2019). This indicates thatIndonesia’s underreporting compared to national Partners is due to factors other thanthis structural CIF / FOB imbalance.
Despite the consistently negative Discrepancy Scores, there is also a trend of scoresnormalizing over the study period: more extreme scores appear to be most commontoward the beginning of the study, peaking in 2005 and declining after that. This peakcorresponds to the year that Indonesia’s President Yudhoyano mandated stricterenforcement of illegality protections in domestic supply chains after several years ofincreased timber seizures, which Lawson & MacFaul (2014) conjecture may contributeto the decline following 2005. The 2005 “Enforcement Order” is included in furtheranalysis, using 2005 as a cutoff between Policy Periods to test for significancedifferences in Discrepancies in specific product groups and partnerships before andafter policy implementation.
A final trend of note at this aggregate level of visualization is that total level ofdiscrepancy does not appear particularly concerning, dipping into the yellow middle-riskthird of Discrepancy Scores only in 2004-05. As shown in View 3, product-specificDiscrepancy Score visualizations indicate the aggregate analysis may mask importanttrends and developments at the Product and Partner levels.
View 2 Summary Observations and ConclusionsThere is a decline in the extremity of Discrepancy Scores over time, but from this Viewalone are unable to draw conclusions as to the significance, magnitude, and possiblePolicy associations with this trend.
From the Aggregate View alone, it is clear that Indonesia routinely underreports Timberexports compared to import reports from its top timber trade partners.
60

Figure 18: Mean Annual Discrepancy Scores of Aggregated Timber Products
View 3: ProductsFigure 19 disaggregates products to present mean Discrepancy Scores for separateproduct categories. It is immediately clear that separating the products provides for amuch more nuanced interpretation. This pattern holds true for dissecting the data byPartners and each combination of Partners and Products.
Log Discrepancy Scores appear relatively constant over the study period, showing aconsistently negative but low risk mean Discrepancy Score between -3 to -6, indicatingconsistent underreporting of relatively low magnitude. A slight trend in normalizingdiscrepancy scores is visible, with a peak in 2003. Given Indonesia’s Log Export bansince 2001, one would expect both that log exports would be quite small and thereforeof little value, and that the Discrepancy Rate (see Methods section for this equation)would be at the extreme of -2, since a $0 report from Indonesia compared to anypositive dollar amount reported by a Partner would result in a 100% Discrepancy Rate.Therefore, Discrepancy Rates for Indonesian log exports, though extreme, are weightedrelatively lightly due to the small mean value of Logs traded, resulting in a consistentnegative but low risk trend in Discrepancy Scores. The case of log Discrepancy Scoresserves to inform the intuition in interpreting these trends and validates the broad
61

purpose of developing a Discrepancy Score: to identify those Products and Partners atgreatest risk of the greatest value of illegality.
Lumber exhibits the most extreme mean Discrepancy Scores at the aggregated Partnerlevel, informing an conclusion that the risk of illegality is greater in Indonesian LumberTrade than in either Logs or Plywood. The following Partner View section shows thatLumber trade exhibits the largest Discrepancy Scores with each individual partner. Thisinforms the decision to emphasize Lumber Discrepancy Scores more heavily than Logsor plywood in the following analysis.
The 2004 banning of lumber exports and 2005 enforcement crackdown appear to matchthe steep decline in Lumber discrepancy scores from 2005 through the end of the study.This Product View informs the decision to use the 2005 Enforcement Order as the cutoffbetween Policy Periods. 2005 is the most realistic turning point in Lumber DiscrepancyScores because the enforcement order was a broader order to improve implementationof the bans and timber illegality law enforcement prevention measures. This may bedebated since executive action may be shorter lived and more easily overturned bysuccessive orders. For this reason, further results around the Enforcement Order (andother policies) are interpreted loosely - as indicators rather than sole causes ofchanging trends. It would be nearly impossible to justify a more nuanced conclusionusing HS Code data, particularly aggregated at the annual level.
Plywood trade has the smallest average Discrepancy Score, and the least clear trend inmagnitude and direction of Discrepancy. Further analysis of specific DiscrepancyScores will provide some insight into the fluctuations around 0 in PlywoodDiscrepancies, in particular discussion of Plywood trade with China from 2012 - 2016and Malaysia from 2007-2008 in discussion of the Partner View. Despite the ability toidentify the partnerships responsible for these apparently irregular years, no clearconclusion is supported about the likely causes of such anomalous discrepancies andremain limited to interpreting and testing larger trends.
View 3 Summary Observations and Conclusions
Indonesian Lumber Discrepancies are considerably more extreme than either Logs orPlywood, and are predominantly negative, indicating consistent underreporting byIndonesia compared to its top trade partners.
Log Discrepancy Scores also are consistently underreported by Indonesia compared toits top trade partners.
Lumber Discrepancy Scores trend less extreme over the study period.
Plywood Discrepancy Scores appear less extreme than either Logs or Lumber and aresubject to more fluctuation between positive and negative Discrepancy Scores, orunder- and over-reporting by Indonesia compared to its top trade partners.
62
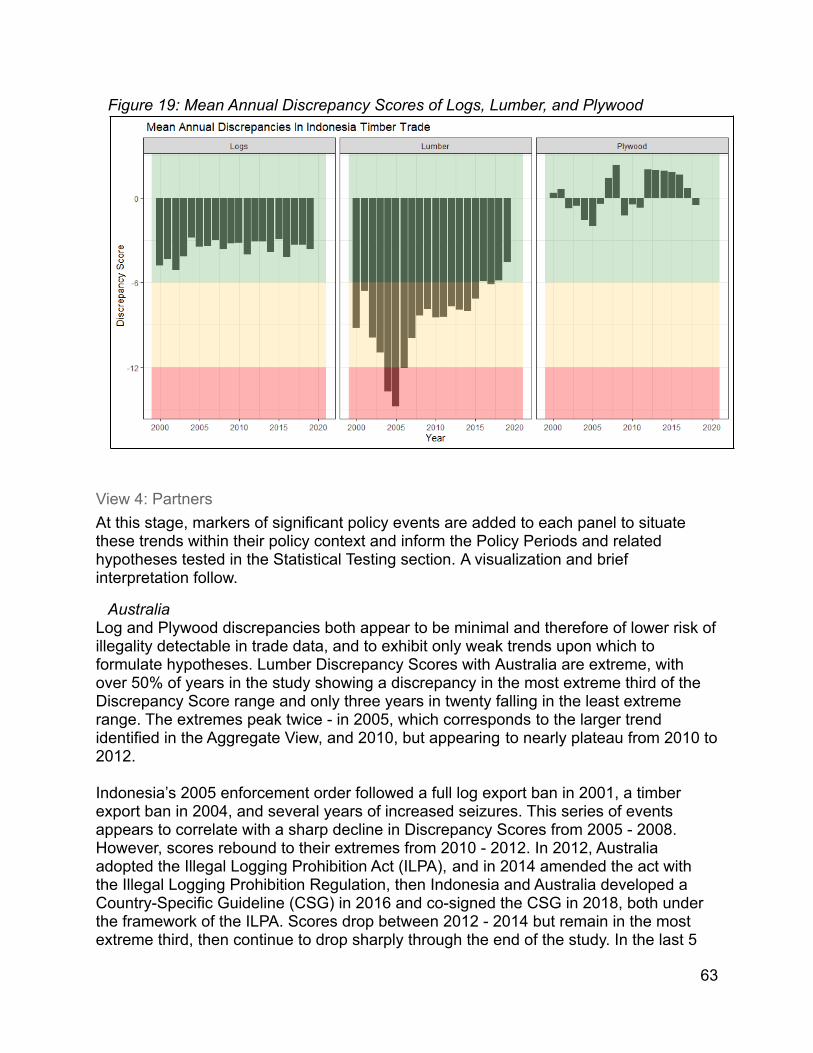
Figure 19: Mean Annual Discrepancy Scores of Logs, Lumber, and Plywood
View 4: PartnersAt this stage, markers of significant policy events are added to each panel to situatethese trends within their policy context and inform the Policy Periods and relatedhypotheses tested in the Statistical Testing section. A visualization and briefinterpretation follow.
AustraliaLog and Plywood discrepancies both appear to be minimal and therefore of lower risk ofillegality detectable in trade data, and to exhibit only weak trends upon which toformulate hypotheses. Lumber Discrepancy Scores with Australia are extreme, withover 50% of years in the study showing a discrepancy in the most extreme third of theDiscrepancy Score range and only three years in twenty falling in the least extremerange. The extremes peak twice - in 2005, which corresponds to the larger trendidentified in the Aggregate View, and 2010, but appearing to nearly plateau from 2010 to2012.
Indonesia’s 2005 enforcement order followed a full log export ban in 2001, a timberexport ban in 2004, and several years of increased seizures. This series of eventsappears to correlate with a sharp decline in Discrepancy Scores from 2005 - 2008.However, scores rebound to their extremes from 2010 - 2012. In 2012, Australiaadopted the Illegal Logging Prohibition Act (ILPA), and in 2014 amended the act withthe Illegal Logging Prohibition Regulation, then Indonesia and Australia developed aCountry-Specific Guideline (CSG) in 2016 and co-signed the CSG in 2018, both underthe framework of the ILPA. Scores drop between 2012 - 2014 but remain in the mostextreme third, then continue to drop sharply through the end of the study. In the last 5
63

years studied through 2019, Australia’s Lumber Discrepancy Scores are in the leastextreme third for three years, and in the moderate range for two. This pattern is alsovisible with several other Partners and referred to hereafter as a “W-shaped” trend,indicating the two periods of relatively extreme and negative Lumber DiscrepancyScores.
Despite that Lumber appears to be of high risk of illegality over the entire study period,the declining trend since 2012 appears to be a considerable and prolonged reduction inhigh-risk Discrepancy Scores. This declining trend appears to be associated with bothIndonesian and Australian policies, with declines in risk steeper and longer lasting underbilateral policy adoption. 2014 was selected as the most natural cutoff point to evaluatethe difference before and after the ILP Regulation. The two-year window between ILPAand ILPR is too narrow to expect meaningful test results and consider the Regulation asthe point of implementation of the Act. It would be quite valuable to conduct a similaranalysis around the CSG adoption, but given its 2018 adoption date, there is insufficientdata to construct an “after” comparison at this point in time.
Figure 20: Australia Discrepancy Scores
ChinaTimber trade with China exhibits the most consistent and extreme Discrepancy Scoresamong all of Indonesia's trade partners included in this study. Log Discrepancies Scoresremain moderate (eight years) or high (12 years) throughout years studied; LogDiscrepancy Scores are moderate in two years and high in 18; and Plywood scores arelow risk for 14 years but high risk for a seemingly anomalous 6-year period from2011-2016. Despite these extreme discrepancy scores, there is a several-year declinein extreme Discrepancies across all three Products following Indonesia’s 2005enforcement order before Scores become more extreme again in 2009 (Lumber), 2010(Logs), and 2011 (Plywood). This pattern of decline for several years after 2005
64

followed by a return of extreme scores mirror the pattern seen in Australia’s Lumbertrade from 2005-2009.
After 2010, Log and Plywood Discrepancy Scores continue to rise for several years,while Lumber scores hit a lower (but still high risk) plateau. Contrary to several. Scoresfor all three products drop at the end of the study, with Logs and Lumber in themoderate range for 2019 and Plywood in the low-risk range in 2018-2019. However,these 1-2 years declines in the final years studied resist confident analysis as thelonger-term trend is still taking shape. It is possible that China’s National Forest LawAmendment has begun to increase scrutiny of imports, but this is unlikely given thatimplementing measures have yet to be adopted (Norman & Saunders 2017). China alsoadopted a National Forest Logging Ban in 2017, which would be expected to increasedemand for timber imports to meet manufacturing and consumer demand no longer metby domestic production (Hui 2017). Without strong controls on imports yet in place, agrowth in demand for timber imports should be regarded as an increased risk ofillegality. Given these ambiguous policy signals around the end of the study, no testingwas conducted, or conjecture would be reliable, before additional years of data reveallonger-term trends.
Among Indonesia’s policies, the dynamics around the 2005 enforcement order continueto be intriguing, especially as scores drop after the order but also rebound within severalyears after. Equally interesting is the rise in Logs and Plywood Discrepancy Scoresaround the implementation of Indonesia’s SVLK system via the Forest Product ExportRegulation. While other nations demonstrate a drop in discrepancy scores around thistime, the opposite appears true in the case of China. It is possible that China’sincreased protections for domestic forests and lack of timber import legality regulationscombine to increase illegality in trade between China and Indonesia even whileDiscrepancy Scores and illegality fall in trade in more regulated markets. This can onlybe conjecture given data constraints. Test Series 6 provides greater insight intosignificant differences in Discrepancy Scores for partners with no import policy betweenPolicy Periods.
65
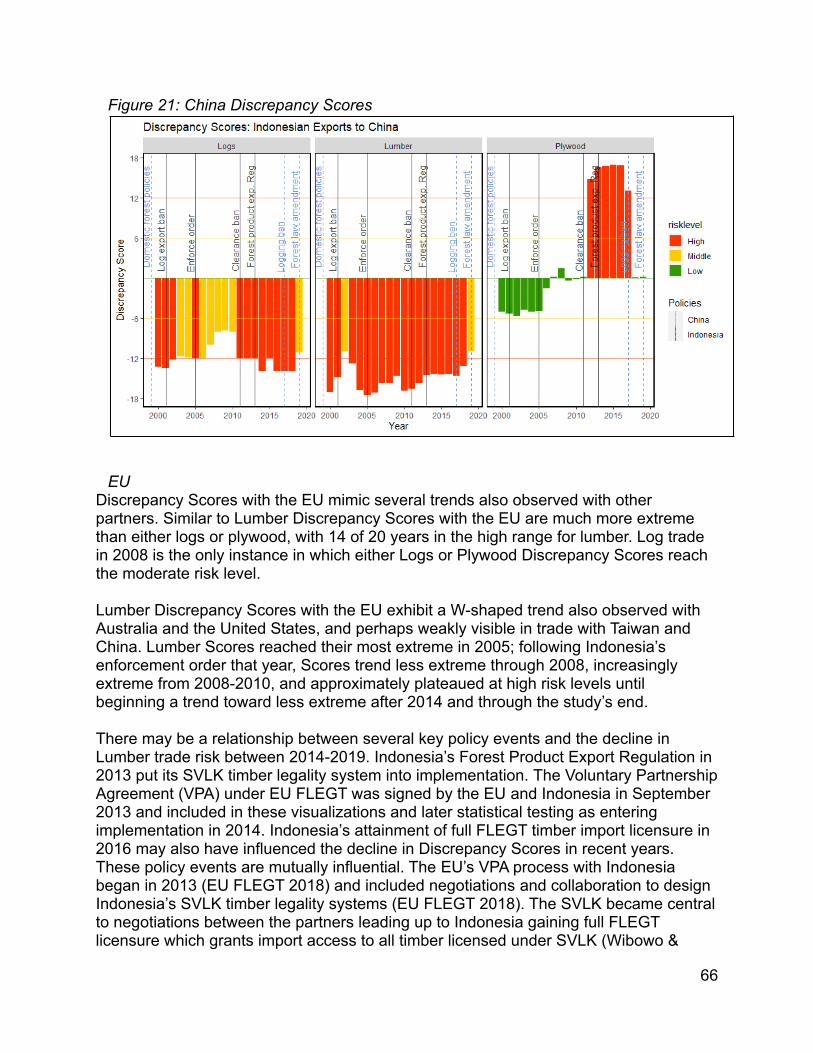
Figure 21: China Discrepancy Scores
EUDiscrepancy Scores with the EU mimic several trends also observed with otherpartners. Similar to Lumber Discrepancy Scores with the EU are much more extremethan either logs or plywood, with 14 of 20 years in the high range for lumber. Log tradein 2008 is the only instance in which either Logs or Plywood Discrepancy Scores reachthe moderate risk level.
Lumber Discrepancy Scores with the EU exhibit a W-shaped trend also observed withAustralia and the United States, and perhaps weakly visible in trade with Taiwan andChina. Lumber Scores reached their most extreme in 2005; following Indonesia’senforcement order that year, Scores trend less extreme through 2008, increasinglyextreme from 2008-2010, and approximately plateaued at high risk levels untilbeginning a trend toward less extreme after 2014 and through the study’s end.
There may be a relationship between several key policy events and the decline inLumber trade risk between 2014-2019. Indonesia’s Forest Product Export Regulation in2013 put its SVLK timber legality system into implementation. The Voluntary PartnershipAgreement (VPA) under EU FLEGT was signed by the EU and Indonesia in September2013 and included in these visualizations and later statistical testing as enteringimplementation in 2014. Indonesia’s attainment of full FLEGT timber import licensure in2016 may also have influenced the decline in Discrepancy Scores in recent years.These policy events are mutually influential. The EU’s VPA process with Indonesiabegan in 2013 (EU FLEGT 2018) and included negotiations and collaboration to designIndonesia’s SVLK timber legality systems (EU FLEGT 2018). The SVLK became centralto negotiations between the partners leading up to Indonesia gaining full FLEGTlicensure which grants import access to all timber licensed under SVLK (Wibowo &
66
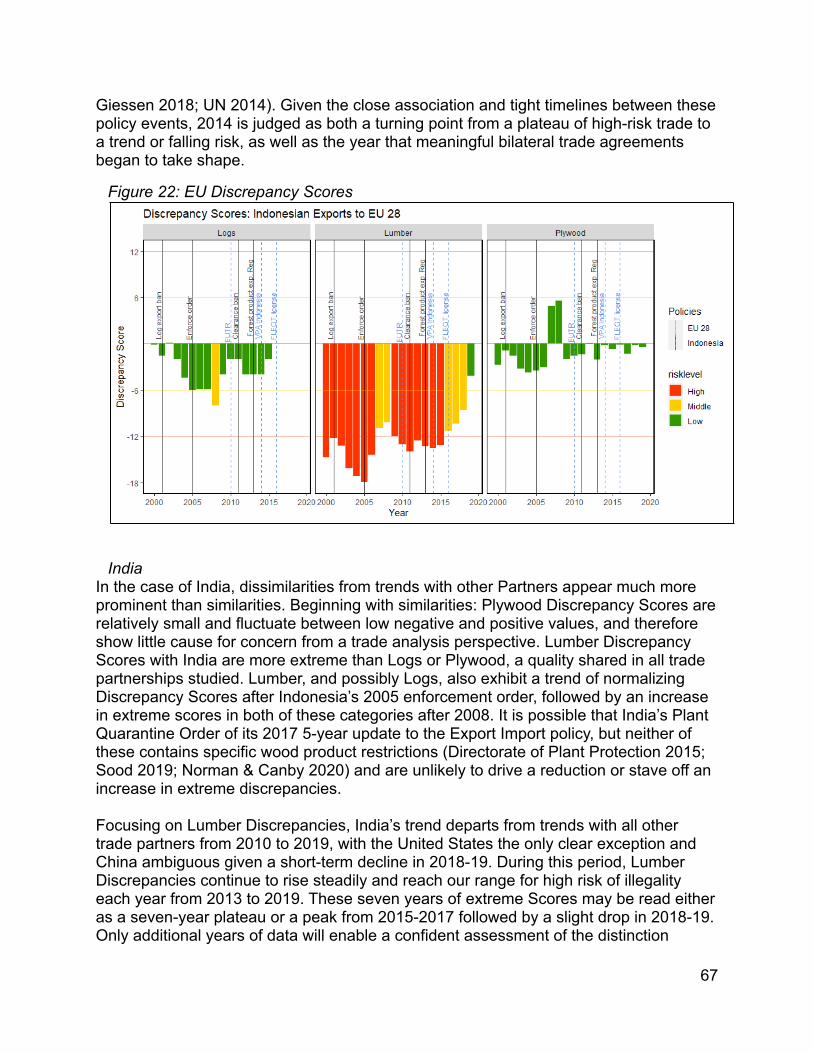
Giessen 2018; UN 2014). Given the close association and tight timelines between thesepolicy events, 2014 is judged as both a turning point from a plateau of high-risk trade toa trend or falling risk, as well as the year that meaningful bilateral trade agreementsbegan to take shape.
Figure 22: EU Discrepancy Scores
IndiaIn the case of India, dissimilarities from trends with other Partners appear much moreprominent than similarities. Beginning with similarities: Plywood Discrepancy Scores arerelatively small and fluctuate between low negative and positive values, and thereforeshow little cause for concern from a trade analysis perspective. Lumber DiscrepancyScores with India are more extreme than Logs or Plywood, a quality shared in all tradepartnerships studied. Lumber, and possibly Logs, also exhibit a trend of normalizingDiscrepancy Scores after Indonesia’s 2005 enforcement order, followed by an increasein extreme scores in both of these categories after 2008. It is possible that India’s PlantQuarantine Order of its 2017 5-year update to the Export Import policy, but neither ofthese contains specific wood product restrictions (Directorate of Plant Protection 2015;Sood 2019; Norman & Canby 2020) and are unlikely to drive a reduction or stave off anincrease in extreme discrepancies.
Focusing on Lumber Discrepancies, India’s trend departs from trends with all othertrade partners from 2010 to 2019, with the United States the only clear exception andChina ambiguous given a short-term decline in 2018-19. During this period, LumberDiscrepancies continue to rise steadily and reach our range for high risk of illegalityeach year from 2013 to 2019. These seven years of extreme Scores may be read eitheras a seven-year plateau or a peak from 2015-2017 followed by a slight drop in 2018-19.Only additional years of data will enable a confident assessment of the distinction
67

between these, but the overall trend is clear: while nearly every other Partnership saw adecline in Lumber Discrepancy Scores, trade with India exhibits a steep increase inextreme scores. Trends with India are included in Test Series 3 and 6, providingevidence for concern that India’s loosely regulated and quickly growing timber importsare susceptible to growing illegality as its other nations adopt more strict import andexport policies.
Figure 23: India Discrepancy Scores
JapanTrade with Japan exhibits perhaps the most precipitous decline in extreme LumberDiscrepancy Scores, which reached the top 33% high risk category each year from2000 to 2005. A steep decline begins in 2006 reaching the moderate risk level, followedby low-risk Scores from 2007 to 2019 and a trend that appears to fall closer to 0 overtime. Indonesia’s 2005 Enforcement Order and Japan’s “Goho Wood” expansion of itspublic procurement policy in 2006 coincide with this decline. The combination of TestSeries 1 which focuses on Indonesia’s Policy Periods, and Test Series 5 focusing onPartner policies and Lumber will enable us to comment on the significance ofdifferences in trends around these policy events.
Logs exhibit no clear trend over the study period, with the possible exception ofincreased Discrepancy toward the end of the study, but additional years of data wouldbe necessary in order to meaningfully interpret or test this observation. However, theremay be slight cause for concern given Indonesia’s log export ban and the small but notdeclining divergence from 0 Discrepancy Scores in logs. Plywood Discrepancies,though at no point during the study exceeding the low-risk level, appear to show a slighttrend of deviating less far from 0 Discrepancy Scores. The “Data Overview” Sectionabove shows that Japan is Indonesia’s largest timber trade partner (33% of export
68

value), and plywood is the most valuable timber export product (84.5% of export value).Given the outsize importance of plywood and Japan in Indonesia’s timber exports, thisvisualization indicates that little risk of timber illegality is detectable from trade data forthis partnership. Japan’s 2006 Goho Wood procurement expansion and 2017implementation of the Clean Wood Act analysis are included in Test Series 5.
Figure 24: Japan Discrepancy Scores
KoreaDiscrepancy Score trends appear remarkably similar between Korea and Japan. ForKorea, Logs and Plywood also do not exceed the low-risk Discrepancy Scoresthreshold; and each of these categories exhibits a slight decrease in extremity ofDiscrepancy Scores over the period of the study.
Plywood Discrepancy Scores were in the high-risk range for the first seven years of thestudy (compared to Japan’s first six), show a steady decline in extreme scores from2005 to 2011, and remain negative but in the low-risk range through the study end in2019. The declining trend following a 2005 peak is consistent across all partners,appears related to Indonesia’s 2005 Enforcement Order, but not associated with anyspecific Korean timber import policy during this period. Similar to Japan, policy eventsand adoptions after this steep decline are not visibly associated with clear DiscrepancyScore trends. Despite this, Test Series 1 and 3 look for significant differences inDiscrepancy Scores around Indonesia’s policy events, and Test Series 5 includesKorea’s policy events.
69

Figure 25: Korea Discrepancy Scores
MalaysiaDiscrepancy Scores with Malaysia in all three Products show a decrease in extremityover the study period. Logs Scores are in the high-risk range for the first three years ofthe study, and Lumber are high risk in seven of the first eight years. Plywood Scoresfollow a more ambiguous trend but do appear to fluctuate less var from zero frombeginning to end of the years studied. Log Scores fall into the low range for the final 5years of the study; Lumber and Plywood for the final 11 years. These high-level trends,enable the conclusion that Indonesia’s timber exports with Malaysia shifted frommoderate or high to low risk of illegality from 2000 to 2019.
Log Discrepancy scores decreased in extremity greatly after 2001 following Indonesia’sIn Lumber export ban in 2001 and Malaysia’s complementary Log Import ban in 2002.However, given the lack of annual data prior to these policy adoptions, statistical testingaround these dates is unreliable and therefore no specific tests are constructed aroundthem. Though the overall trend in Log trade with Malaysia is toward less extremeScores, several years of moderate risk scores peak in 20212 before decreasing andremaining in the low-risk range between 2015-2019.
In Lumber, there is a repetition of the decline in extreme Scores after 2005 andIndonesia’s Enforcement Order. Rather than exhibiting the rebound in DiscrepancyScores seen in some nations, Malaysia’s trend mirrors that of Japan and Korea incontinuing to decrease to low-risk and remain within the range through the end of thestudy period.
Plywood Scores with Malaysia are more difficult to interpret. Scores are consistentlypositive through 2008, and negative from 2009-2019. All years show low-risk
70

Discrepancy Scores, with the exception of 2007-2008 which are respectively high andmoderate risk, and apparently anomalous both within this partnership and the entiredataset (for an easy visual comparison to other Partners, see the visualization titled“Plywood Discrepancy Scores by Partner Country” in Appendix 3). Literature review andthe current analysis have not revealed an explanation for this observation, and ingeneral data in aggregated Product categories (see Appendix 1) are unlikely to provideinsight at this level of granularity.
Figure 26: Malaysia Discrepancy Scores
Singapore
Like India and China, Singapore has no specific timber import policy beyond itsadoption of CITES commitments, and at least in the early 2000s had a reputation as acentral shipment hub for enabling and obscuring illegal timber trade. During this study,Indonesian timber trade with Singapore exhibits a large decrease in extremeDiscrepancy Scores overall, with the most notable shift in Lumber trade.
Unique to this trade Partnership, Discrepancies were positive in each Product categoryfor 2000-2001 when Indonesia re-instituted its full log export ban, after which allDiscrepancies became negative for the remainder of the study. Given that this studybegins in 2000, it is not possible to examine this trend in greater detail but is worthy ofmention and future consideration.
Singapore Discrepancy Score appears to drop after a 2005 peak concurrent withIndonesia’s 2005 Enforcement Order, though the decline in extreme Scores after thisOrder appears small in all three Products. With the exception of years 2000-2001, in thehigh and moderate risk range respectively, Plywood Scores remain in the low-risk
71

range. These data and policy literature review are insufficient to inform a solidconjecture or test data at the far ends of the time series with any confidence.Log scores remain quite consistent and moderate or low from 2007 - 2017 beforedropping to low in 2018-19. Lumber scores follow a similar trend: consistently high from2007 - 2013, followed by declining extremity and low scores from 2015-2019. While thedecline in Lumber scores coincides with Indonesia's 2013 Forest Product ExportRegulation in 2013, the same is not true in Logs, which remain constant for severalyears after.
Figure 27: Singapore Discrepancy Scores
TaiwanTaiwan’s policy context is somewhat unique: given disputes over independence fromChina, Taiwan is not an official signatory to CITES, but instead voluntarily adoptednational laws to be in compliance with CITES standards through the Foreign Trade ActAmendment (TMEA 1993) and updated through the Wildlife Conservation Act (TCA2013). which may indicate a more active implementation of the CITES standards.Trends and levels of Discrepancy Scores in Indonesian trade with Taiwan are somethingof a middle ground of the nations studied.
The trends in each Product are somewhat ambiguous across the study period, andwhile each Product exhibits a pattern of moderate risk Discrepancies. Scores areconsistently negative in Logs and Lumber, and mostly positive in Plywood, and exceedthe high-risk threshold only in Lumber, only for three years, and all three before 2006.The trend of decreased extremity in Scores after 2005 is visible only in Lumber, afterwhich Scores rebound slightly but remain in the moderate range before fluctuatingbetween moderate and low risk from 2016-19; the overall trend in Lumber Scores istoward smaller Discrepancies over the study. The pattern after 2005 in Logs and
72

Plywood actually moved in the opposite direction, becoming more extreme for threeyears in Plywood and as many as nine in Logs (depending on how one reads thefluctuation during this period. Plywood appears to show larger Discrepancies later in thestudy, and Logs do not exhibit a clear rise or fall in Discrepancy extremity over thestudy.
The relative spike in Plywood discrepancies from 2012 - 2016 roughly correspond withhigh Discrepancies rates between Indonesia and China during the same period, aspossible indication that Taiwan’s timber markets are influenced by Chinese policy and /or trade. Taiwan has no more specific Import policy than the Foreign Trade ActAmendment (USDA 2020), and there is no observable clear shift in Discrepancy trendsin any Product. Nevertheless, FTA Amendment is included in Test Series 5 alongsideother nations with more explicit import policies.
Figure 28: Taiwan Discrepancy Scores
ThailandTrends in Discrepancy Scores with Thailand most nearly mimic those with Japan andKorea, though in a less extreme form. At the high level, Plywood appears to remainclose to zero Discrepancy for the entire study and appears of little concern for timberillegality risk detectable through trade discrepancies. Logs and Lumber each exhibitmoderate scores in multiple years in the earlier years of the study, shifting to very lowdiscrepancies in Lumber from 2008 to 2019, and 0 Discrepancy Score from 2004 -2019.
In Logs, the flatlining of Discrepancy Scores at zero in 2004 after its peak in 2000appears and may well be related to Indonesia’s 2001 Log Export Ban, but this cannotbe statistically validated given that the study begins in 2000. Lumber Discrepancy
73
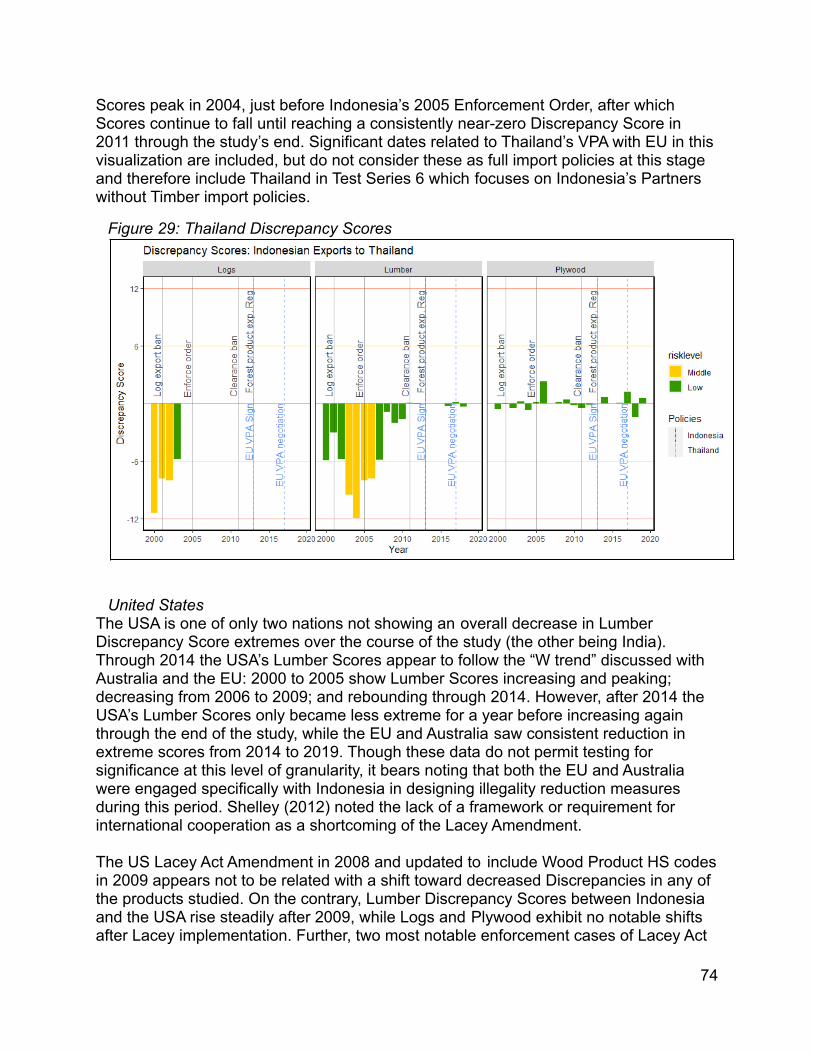
Scores peak in 2004, just before Indonesia’s 2005 Enforcement Order, after whichScores continue to fall until reaching a consistently near-zero Discrepancy Score in2011 through the study’s end. Significant dates related to Thailand’s VPA with EU in thisvisualization are included, but do not consider these as full import policies at this stageand therefore include Thailand in Test Series 6 which focuses on Indonesia’s Partnerswithout Timber import policies.
Figure 29: Thailand Discrepancy Scores
United StatesThe USA is one of only two nations not showing an overall decrease in LumberDiscrepancy Score extremes over the course of the study (the other being India).Through 2014 the USA’s Lumber Scores appear to follow the “W trend” discussed withAustralia and the EU: 2000 to 2005 show Lumber Scores increasing and peaking;decreasing from 2006 to 2009; and rebounding through 2014. However, after 2014 theUSA’s Lumber Scores only became less extreme for a year before increasing againthrough the end of the study, while the EU and Australia saw consistent reduction inextreme scores from 2014 to 2019. Though these data do not permit testing forsignificance at this level of granularity, it bears noting that both the EU and Australiawere engaged specifically with Indonesia in designing illegality reduction measuresduring this period. Shelley (2012) noted the lack of a framework or requirement forinternational cooperation as a shortcoming of the Lacey Amendment.
The US Lacey Act Amendment in 2008 and updated to include Wood Product HS codesin 2009 appears not to be related with a shift toward decreased Discrepancies in any ofthe products studied. On the contrary, Lumber Discrepancy Scores between Indonesiaand the USA rise steadily after 2009, while Logs and Plywood exhibit no notable shiftsafter Lacey implementation. Further, two most notable enforcement cases of Lacey Act
74

are include in the visualization below: Gibson Guitars (Clarke 2012; EU FLEGT 2012b)and Lumber Liquidators (USDOJ 2016) that resulted in penalties in 2012 and 2016,respectively. These enforcement events also appear to have no clear association withLog or Plywood Discrepancies Scores shifting; Gibson and Lumber Liquidators do bothoccur during times of increasing risk in Lumber Discrepancy Scores, but there is noreason to believe that these explain the trend in any way, given that the theory ofenforcement assumes an ensuing reduction in illegality, and neither enforcement casewas in any way specific to Indonesian imports.
The United States is included in all nation-specific rounds of testing focused onIndonesian Policy Periods (Test Series 1, 3, and 4). Lacey Act Amendmentimplementation in 2009 is selected for Test Series 5 which focuses on Partner withimport policies.
Figure 30: United States Discrepancy Scores
View 4 Summary Observations and ConclusionsIndonesia’s 2005 Enforcement Order and 2013 Forest Product Export Regulation arethe most pertinent policy events around which to construct Policy Periods in thefollowing Statistical Testing section.
There is a decreasing extremity in Lumber Discrepancy Scores among several partnersfrom 2005 to 2008. After this period, two trends are each repeated among multiple (butnot all) partners: One, a several-year rebound in extreme Scores (Strongly in Australia,China, EU, and weakly in India, Taiwan, and United States). Two, a continued decline inScores through the study period (Japan, Malaysia, Korea, and Thailand). This informsthe decision to further divide Policy Periods for Statistical Testing section after 2008.
75

There is a declining trend of extreme Discrepancy Scores among multiple Partners(Australia, EU, Singapore, Taiwan, and possibly China) as well as new import policyadoption (Australia, EU, Korea) in and around 2013 implementation of Indonesia’sForest Product Export Regulation. This informs the decision to further divide PolicyPeriods used in the Statistical Testing series after 2013.
The resulting four Policy Periods used for statistical testing are: 2000 - 2005,2006-2008, 2009 - 2013, and 2014 - 2019. These are discussed in greater detail in theMethods section.
A majority of trade Partnerships exhibit a trend of decreased extremity in LumberDiscrepancy Scores over the study period. India and the United States are the onlyclear exceptions, with China ambiguous given a short-term decline in 2018-19.
Among nations with no timber import policy (China, India, Singapore and Thailand),China and India are the only two Partners for which Discrepancy Scores appear tocontradict the general trend of decreasing extremity of Discrepancy Scores. Thisapplied to Log trade with China, Lumber trade with India and possibly China, andPlywood trade with China.
Discrepancies Statistical TestingThe previous section’s discussion of visualizations informs the intuition and hypothesesstatistically analyzed in this section. Given the many-dimensional space of this dataset,which includes eleven Partners, four Time Periods, three Product Categories, andmultiple Partner Policies, a series of statistical tests enable a more precise identificationof which Partners, Products, and Policies exhibit statistically significant changes overthe study period.
First is an ANOVA test comparing mean Discrepancy Scores for each Partner in all fourTime Periods, with Product categories aggregated into one. These are supplemented byTukey tests for Honestly Significant Differences between Policy Time Periods. Nullhypotheses for these tests: There is no difference in mean Discrepancy Scores with agiven Partner across the four Periods.
Second is an ANOVA test comparing mean Discrepancy Scores in each ProductCategory in all four Time Periods, again following with Tukey HSD tests to identifysignificant differences between Time Periods. Null hypotheses for these tests: There isno difference in mean Discrepancy Scores from a given Product Category in the fourPolicy Periods
Third is an ANOVA test comparing Lumber Discrepancy Scores in all flour Periods foreach Partner. This is followed by a TUKEY HSD test on India alone to provide greaterinsight into this Partnership with an anomalous trade. Null hypotheses for these tests:There is no difference in Lumber Discrepancy Scores for a Given Partner in the fourPolicy Periods.
76

Fourth are two-sided t-tests with unequal variance to test the “before-and-after” periodson Lumber Discrepancy Scores for each of two Indonesia policies. Null hypotheses forthese tests are: There is no difference in mean Lumber Discrepancy Scores before andafter a given Indonesian policy takes effect.
Fifth are two-sided t-tests with unequal variance to test the “before-and-after” periods onLumber Discrepancy Scores for each specific national trade policy. Null hypotheses forthese tests are: There is no difference in mean Lumber Discrepancy Scores betweenIndonesia and a given Partner before and after a given policy takes effect.
Sixth are two-sided t-tests with unequal variance to test for difference in LumberDiscrepancy Scores between Indonesia and trade partners lacking an import policy,before and after implementation of each of two Indonesian policy events. Nullhypotheses for these tests are: There is no difference in mean Lumber DiscrepancyScores between Indonesia and a given Partner before and after a given policy takeseffect.
Tests Series 1: ANOVA Tests on Effect of Time Period on Mean Discrepancy Scores byPartnerThe first series consist of One-Way ANOVA tests at the aggregated Product level,dividing the data into the four policy periods discussed in the Methods section. The NullHypothesis for each of these tests is: There is no difference in mean DiscrepancyScores with a given Partner across the four Periods. The Alternate Hypothesis is: MeanDiscrepancy Scores with Partners differ significantly between the four Periods. Resultsare shown in Table 1.
Only 3 nations showed a statistically significant change in Discrepancy Scores over allproduct groups and time periods at the 95% confidence level. Those were Japan (p =0.00062), Korea (p =0.00125) , and Thailand (p = 0.00011), each of which exhibited adeclining trend in Discrepancy Scores over the study period. Japan and Korea haveperhaps more meaningful results than Thailand. Japan ranks first, Korea fourth, andThailand fifteenth among Indonesia’s largest timber trade partners (see Figure 2 inSection 3). In each of these cases, the null hypothesis that there is no difference in themean discrepancy scores across the 4 times periods is rejected. Singapore (p =0.08189) tested as significant at the 90% level, but no comparison between specifictime periods using a Tukey test was significant, and therefore this result is notconsidered strong evidence.
Both Japan and Korea exhibit high risk discrepancies early in the study, put timberimport policies into place during the study period, and show a statistically significantdecrease in discrepancy risk. Thailand exhibited only moderate risk levels ofdiscrepancies, did not adopt specific timber import policies, and has nonetheless seen asignificant decline in discrepancy scores over the study period. Given this lack, itappears that Indonesia’s domestic policies and general concern over illegal trade in theglobal timber market contribute to the decline in discrepancy scores with Thailand.
77

Tukey tests enabled comparison between specific time periods contained in the ANOVAtests and shown in Table 2. Japan has significant p values between periods 1:2(0.0937762), 1:3 (0.0009365), and 1:4 (0.0037502); Korea between periods 1:3(0.0107458) and 1:4 (0.0026770); and Thailand between Periods 1:2 (0.0534566), 1:3(0.0006989), and 1:4 (0.0003268). These p-values indicate that President Yudhoyano’senforcement order in 2005 is associated with a steady decline in Discrepancy Scoresover the study period, indicating that indeed less illegal timber product is flowing fromIndonesia to at least these significant trade partners. This confirms the qualitativeinterpretation of Figures 24 (Japan), 25 (Korea) and 29 (Thailand), which show cleardeclines after 2005 (when Period 1 ends) in Lumber Discrepancy Scores in all three ofJapan, Korea, and Thailand, as well as a similar trend in Discrepancy Scores for Logstrade with Thailand.
Test Series 1 Summary Observations and ConclusionsThere are significant differences in Mean Discrepancy Scores for aggregated timberProducts exported from Indonesia to Japan, Korea, and Thailand. This corroboratesprevious interpretation of View 2, in which there is a slight decrease in DiscrepancyScores at the Aggregated Product level.
There is a decrease in risky Discrepancy Scores for aggregated Products whencomparing Policy Period 1 (2000-05) to both Period 3 (2009-13) and Period 4 (2014-19)for Indonesian timber Trade with all three or Japan, Korea and Thailand.
Table 1: Test Series 1 ANOVA ResultsTest Series 1: ANOVA on Effect of Time Period on Mean Discrepancy
Scores by Partner
Partner Df Sum Sq Mean Sq F value p value
Australia 3 66.23 22.08 0.6683 0.5751
China 3 301.60 100.52 1.1113 0.3522
EU 28 3 75.23 25.08 0.7305 0.5381
India 3 189.36 63.12 2.0388 0.1198
Japan 3 315.34 105.11 6.6749 0.0006
Korea 3 311.54 103.85 6.0249 0.0012
Malaysia 3 184.58 61.53 1.658 0.1865
Singapore 3 260.05 86.68 2.3527 0.0819
Taiwan 3 45.23 15.08 0.4806 0.6971
Thailand 3 202.44 67.48 8.4549 0.0001
United States 3 24.17 8.06 0.5968 0.6197
78
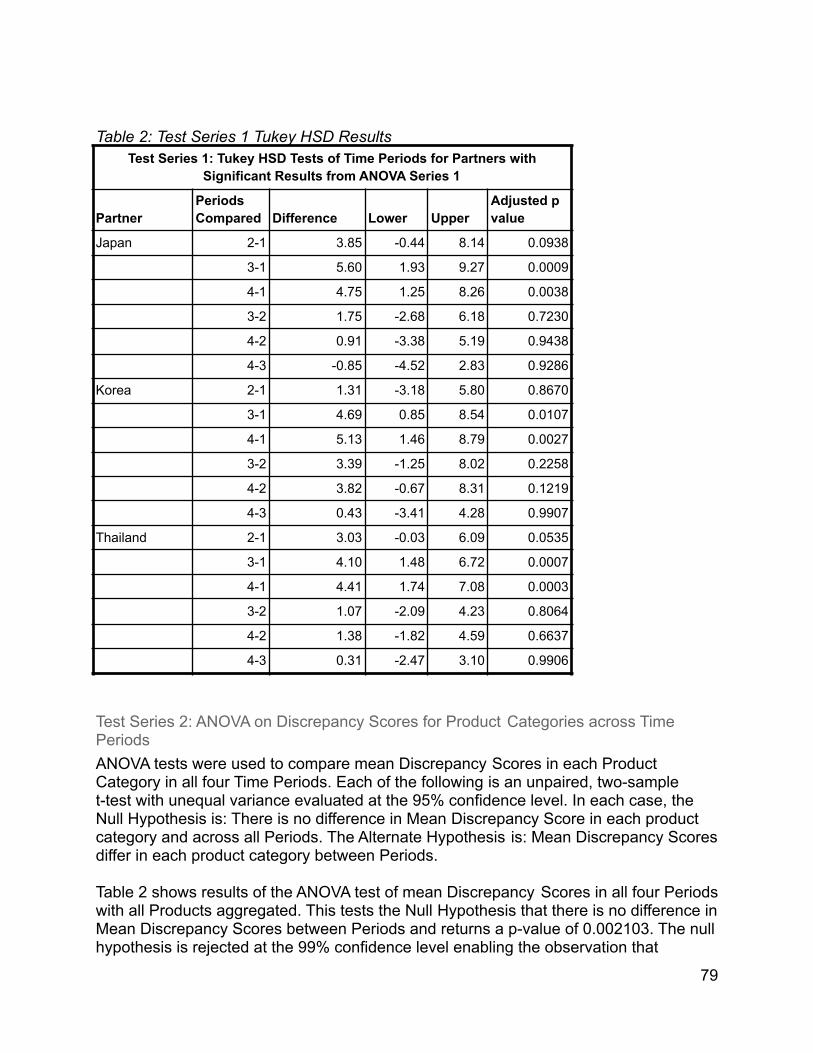
Table 2: Test Series 1 Tukey HSD ResultsTest Series 1: Tukey HSD Tests of Time Periods for Partners with
Significant Results from ANOVA Series 1
PartnerPeriodsCompared Difference Lower Upper
Adjusted pvalue
Japan 2-1 3.85 -0.44 8.14 0.0938
3-1 5.60 1.93 9.27 0.0009
4-1 4.75 1.25 8.26 0.0038
3-2 1.75 -2.68 6.18 0.7230
4-2 0.91 -3.38 5.19 0.9438
4-3 -0.85 -4.52 2.83 0.9286
Korea 2-1 1.31 -3.18 5.80 0.8670
3-1 4.69 0.85 8.54 0.0107
4-1 5.13 1.46 8.79 0.0027
3-2 3.39 -1.25 8.02 0.2258
4-2 3.82 -0.67 8.31 0.1219
4-3 0.43 -3.41 4.28 0.9907
Thailand 2-1 3.03 -0.03 6.09 0.0535
3-1 4.10 1.48 6.72 0.0007
4-1 4.41 1.74 7.08 0.0003
3-2 1.07 -2.09 4.23 0.8064
4-2 1.38 -1.82 4.59 0.6637
4-3 0.31 -2.47 3.10 0.9906
Test Series 2: ANOVA on Discrepancy Scores for Product Categories across TimePeriodsANOVA tests were used to compare mean Discrepancy Scores in each ProductCategory in all four Time Periods. Each of the following is an unpaired, two-samplet-test with unequal variance evaluated at the 95% confidence level. In each case, theNull Hypothesis is: There is no difference in Mean Discrepancy Score in each productcategory and across all Periods. The Alternate Hypothesis is: Mean Discrepancy Scoresdiffer in each product category between Periods.
Table 2 shows results of the ANOVA test of mean Discrepancy Scores in all four Periodswith all Products aggregated. This tests the Null Hypothesis that there is no difference inMean Discrepancy Scores between Periods and returns a p-value of 0.002103. The nullhypothesis is rejected at the 99% confidence level enabling the observation that
79

Discrepancy scores differ between time periods. Figure 31 and Table 4 show results ofa Tukey HSD test that identifies a significant difference between Discrepancy Scoresfrom Period 1:4 at the 95% confidence level (p = 0.0009901); and a difference betweenPeriods 1:3 significant at the 90% Confidence level (p = 0.0748170). Combining withintuition from View 2, this test shows that Indonesia’s mean trade Discrepancy Scoresfall from the beginning to the end of this study period. More specific insight into thisgeneral trend is gained by disaggregating Product Categories,
To this end, one ANOVA test of mean Discrepancy Scores is run in each Product acrossall for Periods. Results of these tests are also found in Table 3. The Null Hypothesis foreach of these tests is: There is no difference in mean Discrepancy Scores betweenPeriods for a given Product. For Lumber, the ANOVA test returns a p-value of1.703e-05, allowing us to reject the null hypothesis at the 99% Confidence Level andsay that there is a difference in Lumber Discrepancy Scores across the Periods studied.These tests combine with interpretation of View 3, Figure 19 to inform the conclude thatLumber Discrepancy Scores decreased in risk from beginning to end of the study.
Table 4 and Figure 32 shows results from a Tukey HSD test for significant differences inLumber Discrepancies in the four Policy Periods. There is significant difference whencomparing period 1:3 (p = 0.0294789), 1:4 (p = 0.0000161), and 2:4 (p = 0.0062705),enabling us to conclude a significant difference in Lumber Discrepancy Scores betweenthe beginning and end of this study. Logs (p = 0.7141) do not exhibit a significantdifference between periods, and plywood (p = 0.0694) exhibits a significant differenceonly at the 90% confidence interval. The Null Hypothesis that there is no difference inmean Discrepancy Scores for Logs and Plywood between Policy Periods cannot berejected. This Product-specific analysis in View 3 shows a trend toward decreasingdiscrepancies is clear in Lumber trade, but more ambiguous in either Logs or Plywood.
These initial two series of ANOVA tests begin to tell a clearer story about Indonesia’sTrade Discrepancies. Views 2 and 3 inform the intuition that Indonesian Lumber is ofmuch greater risk for illegality than either Logs or Plywood, and this is supported bytests finding Lumber to be significantly different from the beginning to the end of thestudy, while Discrepancy Scores for Plywood are only weakly significant, and Logs areno significant between Policy Periods. This informs the conclusion that Lumber is theProduct of chief concern in Indonesia’s illegal timber trade.
Test Series 2 Summary Observations and ConclusionsLumber exports from Indonesia exhibit the highest risk of illegality of Logs, Lumber andPlywood and Lumber is therefore the product of chief concern in Indonesia’s efforts toidentify and reduce trade in illegal timber.
Lumber Discrepancy Scores decreased in risk from beginning to end of the study.
80

Table 3: Test Series 2 ANOVA ResultsTest Series 2: ANOVA on Effect of Time Period on Mean Discrepancy
Scores by Product
Product Df Sum Sq Mean Sq F value p value
All products 3 513.9 171.31 4.9482 0.0021
Logs 3 23.1 76867 0.4549 0.7141
Lumber 3 779.7 259.915 8.7376 1.70E-05
Plywood 3 104.22 34.74 2.3934 0.0694
Table 4: Test Series 2 Tukey HSD ResultsTest Series 2: Tukey HSD Tests of Time Periods for Products with
Significant Results from ANOVA Series 1
ProductPeriodsCompared Difference Lower Upper
Adjustedp-value
All Products 2-1 1.0794 -0.7861 2.9449 0.4439
3-1 1.4993 -0.0982 3.0968 0.0748
4-1 2.2606 0.7194 3.8018 0.0010
3-2 0.4199 -1.5068 2.3465 0.9434
4-2 1.1811 -0.6991 3.0614 0.3691
4-3 0.7613 -0.8534 2.3760 0.6179
Lumber 2-1 0.7429 -2.2678 3.7535 0.9193
3-1 2.7738 0.1996 5.3520 0.0295
4-1 4.5749 2.1167 7.0331 0.0000
3-2 2.0309 -1.0785 5.1403 0.3309
4-2 3.8320 0.8213 6.8427 0.0063
4-3 1.8011 -0.7771 4.3793 0.2720
81

Figure 31: Tukey HSD Aggregated Product Policy Period Comparison
Figure 32: Tukey HSD Lumber Policy Periods Comparison
Test Series 3: ANOVA test on Lumber Discrepancy Scores by PartnerAnalysis is then narrowed to gain better insight into Lumber Discrepancy Scores witheach specific Partner. The Null Hypothesis is: There is no difference in mean LumberDiscrepancy Scores with each partner between Periods. The Alternate Hypothesis is:Mean Lumber Discrepancy Scores with each partner differ between Periods.
Table 3 presents partner-specific results of the test of significantly different LumberDiscrepancy Scores between Policy Periods. There is significant differences in
82

Discrepancy Scores between Policy Periods at the 95% confidence level with Australia,the European Union, India, Japan, Korea, Malaysia, Singapore, Taiwan, and Thailand.These findings are consistent with previous visual interpretation of Partner-specificDiscrepancy Scores Figures discussed in View 4.
Only China, India and the United States do not have a significant reduction inDiscrepancy risk levels during the period studied, which leaves the United States as theonly nation with a national timber import policy in place that did not see a significantreduction in extreme Discrepancy Scores.
Perhaps of greatest concern from a timber legality perspective are China and India.Both are very large nations with a growing consumer class and increasing demand forprimary timber products. China has a large manufacturing and re-export sector anddomestic harvest restrictions (Delang & Wang 2013; Ren 2015) and India faceslimitations in domestic timber supply (Norman & Canby 2020). Neither India nor Chinaimplements a timber import restriction. In China’s case, these test results coupled withFigure 21 from View 4 give no indication of decreasing risk in lumber imports fromIndonesia. Lumber Discrepancies with India is perhaps most concerning: Figure 23shows a steady rise in Lumber Discrepancy Scores with India since 2006 and a plateauin the high risk range from 2013-2019. This trend is unique among the Partners studied,becoming more extreme while the majority of Partners show a reduction in extremescores during the same period.
A Tukey HSD Test was conducted on Discrepancy Scores with India alone. Results arein Table 6 and Figure 33 presents 95% confidence intervals for each period comparison.There are significant differences in Discrepancy Scores between periods 1 and 3 (p =0.0005), 1 and 4 (p = 7.7 x 10⁻⁶), and 2 and 4 (p = 0.0167). Combining these results withinterpretation of Figure 23 leads to the conclusion that Lumber Discrepancies betweenIndonesia and India grew more extreme over the study period. This trends in theopposite direction from all other Partners accepting China and is cause for concern ofincreased illegality in this timber trade partnership..
Test Series 3 Summary Observations and Conclusions
The United States is the only nation with an import policy that has not seen astatistically significant reduction in Lumber Discrepancy Scores from 2000 - 2019.
The most concerning patterns in Lumber trade with India and China: China as aconsistent, high-risk Lumber trade Partner, and India as an emerging market for riskyLumber imports.
83

Table 5: Test Series 3 ANOVA ResultsTest Series 3: ANOVA Tests Effect of Time Period on Mean Lumber
Discrepancy Scores by Partner
Partner Df Sum Sq Mean Sq F value Pr(>F)
Australia 3 186.06 62.01 9.7525 0.0007
China 3 17.75 5.98 1.8521 0.1784
EU 28 3 79.69 26.56 4.3005 0.0210
India 3 611.21 203.74 19.8000 1.24E-05
Japan 3 707.15 235.72 87.2120 3.96E-10
Korea 3 670.56 223.52 86.2230 4.31E-10
Malaysia 3 493.70 164.57 7.0781 0.0030
Singapore 3 348.70 116.23 3.5025 0.0400
Taiwan 3 54.01 18.00 5.6499 0.0078
Thailand 3 200.70 66.90 13.5920 0.0001
USA 3 24.73 8.24 1.3568 0.2916
Table 6: Test Series 3 Tukey HSD ResultsTest Series 3: Tukey Results on Time Periods for Lumber
Discrepancies with India
PartnerPeriodsCompared Difference Lower Upper
Adjustedp-value
India 2-1 -6.023 -12.51 0.47 0.07372
3-1 -9.984 -15.54 -4.43 0.00051
4-1 -13.776 -19.07 -8.48 7.70E-06
3-2 -3.961 -10.66 2.74 0.3602
4-2 -7.753 -14.24 -1.26 0.01668
4-3 -3.792 -9.35 1.77 0.24646
84

Figure 33: Tukey HSD India Lumber Time Periods Comparison
Test Series 4: T-Tests on Indonesia Policies, Lumber Only & All PartnersTest Series 4 is a comparison of Lumber Discrepancy Scores with before and afterIndonesia's 2005 Enforcement Order and 2013 adoption of SVLK. Unlike the PolicyPeriods employed in Test Series 1-3, Series 4 applies a separate two-sample t-test withunequal variance with the null hypothesis for each of these policies: There is nodifference in mean Lumber Discrepancy Scores between Indonesia and the aggregatedsum of trade Partners before and after a given policy event. The Alternate Hypothesisis: Mean Lumber Discrepancy Scores differ before and after a given policy event.
Results from these t-tests are found Table 7, and Figures 34 and 35 display the rangesof Discrepancy Scores before and after the 2005 Enforcement Order and 2013 SVLKpolicies, respectively. Discrepancy Scores differ significantly before and after the 2005Order (p = 0.0004) and 2013 SVLK Implementation (3.79 x 10⁻⁵), and Figures 34 and 35indicate the direction of difference is toward less extreme Discrepancy Scores.Therefore, Indonesia’s Lumber Discrepancy Scores grew less risky after thesesignificant policy adoptions. While it cannot be said with certainty that these policiesdrive the risk reduction, the association is clear and supported the Test Series 2 resultswhich found that trade with all Partners, but India and China had significantly lessextreme Lumber Discrepancy Scores from the beginning to end of the study.
Test Series 4 Summary Observations and ConclusionsIndonesia's Lumber Discrepancy Scores are significantly less extreme after the 2005Enforcement Order and 2013 SVLK Implementation.
85

Table 7: Test Series 4 T-Test ResultsTest Series 4: t-tests on Effects of Indonesia Policies on Lumber Discrepancy
Scores Across All Partners
CountryPolicy / YearTested Df t score Lower Upper p-value
IndonesiaEnforce Order /
2005 113 -3.65 -4.8 -1.42 0.0004
Indonesia SVLK / 2013 127 -4,27 -5.01 -1.84 3.79E-05
Figure 34: Discrepancy Score RangesBefore & After 2005
Figure 35: Discrepancy Score RangesBefore & After 2013
Test Series 5: T-Tests on Partner Policies, Lumber OnlyTest Series 5 turns to specific import policies adopted by Indonesia's trade Partners.The one or two most relevant policies for each nation are included in this test series.These policies are noted with a “y” in Appendix 2 under the column labeled “t-test”.Each of the rows in Table 5 displays results of a distinct two-sample t-test with unequalvariance of Lumber Discrepancy Scores before and after a Partner’s specific policyevent. The Null Hypothesis for each test is: There is no difference in mean DiscrepancyScore before and after a given policy takes effect. The Alternate Hypothesis is: MeanDiscrepancy Scores differ before and after a given policy takes effect. Figures 36 - 44show Lumber Discrepancy Score ranges before and after each Partner’s policy event.
Except for Malaysia and the United States, each national timber import policy tested hasstatistically significant differences before and after implementation. Comparing these
86

test results with their corresponding Figures below, it is clear that each of thesesignificant test results corresponds with a decrease in extreme discrepancies.
As exceptions to the pattern of reduced Discrepancy extremes, Malaysia and the UnitedStates warrant further discussion. Referring to Figure 26, Malaysia’s LumberDiscrepancies do grow less extreme over the study period, but this trend does not beginuntil 2005, the year of Indonesia’s Enforcement Order on timber illegality. The dataclearly show this trend, but it cannot be concluded whether Malaysia policy wasineffective, or whether the combination of Import and Export policies were instrumentalin the risk reduction. However, this result does appear to concur with Obidzinski et al.(2007), who state that over-border smuggling of illegal timber was likely overestimated,and other forms of domestic illegality underestimated in the early 2000s in Indonesia.This interpretation is further supported by the fact that Indonesia’s log export ban in2001 and lumber export ban in 2004 are not obviously associated with reduction inextreme discrepancies until after the 2005 Enforcement Order. It stands to reason thatMalaysia’s ban on log and lumber imports from Indonesia could be effective only with ameaningful Indonesian enforcement regime. This case provides evidence that bilateralpolicies may be an effective way to reduce timber illegality risk between specific tradepartners.
The case of Lumber Discrepancies with the United States is unique in that extremeScores appear to grow from 2009 to 2019 despite the expansion of the Lacey Actamendment to include wood products in 2009, as seen in Figure 30. Therefore, USA’slumber imports from Indonesia remain a moderate and possibly growing risk, despitethe Lacey Act amendment.
Test Series 5 Summary Observations and ConclusionsRisk of illegality in Indonesian Lumber imports is reduced after adoption of nationaltimber import policies by Australia, the European Union, Japan, Korea, and Taiwan. Itcannot be concluded that any specific policy causes this risk reduction, and combinedwith results from Test Series 4, believe there is strong evidence suggesting that bilateraltimber legality policy may be the best, if not a perfect, predictor for reducing timber tradeillegality.
The US Lacey Act is not associated with a reduction in Lumber Discrepancy Scores,and the Lumber trade between the USA and Indonesia is of consistently moderate andpossibly growing risk since Lacey implementation.
Test Series 5: t-tests on Effects of Partner Policies on Lumber DiscrepancyScores with Indonesia
PartnerPolicy / YearTested Df t score Lower Upper p-value
Australia ILPR / 2014 5.65 -6.36 -10.54 -4.62 9.00E-04
87

EU 28 FLEGT / 2013 5.11 -2.59 -8.37 -0.05 0.0481
Japan Goho / 2006 7.16 -11.80 -14.80 -9.88 5.93E-06
Japan CWA / 2017 17.90 -3.63 -8.80 -2.34 0.00195
Korea ASUT / 2012 13.13 -5.01 -11.80 -4.68 2.31E-04
Korea ASUT amend / 2018 16.39 -4.34 -10.60 -3.66 4.81E-04
Malaysia Import Ban / 2003 3.72 -0.91 -17.96 9.31 0.419
Taiwan FTA / 2010 17.97 -2.35 -4.14 -0.23 0.0305
USA Lacey / 2009 13.22 -0.14 -2.81 2.46 0.889
Figure 36: Australia LumberDiscrepancy Scores Before & After2014 ILPR
Figure 37: EU Lumber DiscrepancyScores Before & After 2014 VPAImplementation
Figure 38 : Japan LumberDiscrepancy Scores Before & After2006 Goho Wood
Figure 39: Japan Lumber DiscrepancyScores Before & After 2017 CleanWood Act
88

Figure 40: Korea Lumber DiscrepancyScores Before & After 2012 ASUT
Figure 41: Korea Lumber DiscrepancyScores Before & After 2018 ASUTAmendment
Figure 42: Malaysia LumberDiscrepancy Scores Before & After2002-03 Bans
Figure 43: Taiwan Lumber DiscrepancyScores Before & After 2010 FTAAmendment
89

Figure 44: Taiwan LumberDiscrepancy Scores Before & After2009 Lacey Implementation
Test Series 6: T-Tests on No-Policy partnersThe final Test Series mirrors Series 4, which looked at Lumber Discrepancy Scoresbefore and after Indonesian policy events for the aggregate of all partners. Test Series 6applies t-tests around the same dates (2005 Enforcement Order and 2013 SVLKImplementation) to test for difference in Lumber Discrepancy Scores with Partnerslacking timber import policies, before and after Indonesia’s policy implementation. TheNull hypothesis for each of the following tests is: There is no difference in LumberDiscrepancy Scores between Indonesia and a given Partner before and after a givenPolicy. The Alternate Hypothesis is: Discrepancy Scores differ before and after a givenPolicy. Each row in Table 5 reports results from a separate two-sample t-test with
90

unequal variance, and Figures 45 - 52 chart the mean Lumber Discrepancy Scoreranges with each Partner before and after each policy.
Lumber Discrepancies with China do not differ significantly before and after the 2005Order but are significantly different before and after Indonesia's 2013 SVLKimplementation (p = 0.0299). Despite this significant result, visual interpretation ofFigure 21 makes clear that Lumber trade between Indonesia and China remains at amoderate to high risk level and must be considered as Indonesia's trade Partner withhighest risk of illegality.
Lumber Discrepancy Scores with India differ significantly before and after Indonesianpolicies in 2005 (p = .0023) and 2013 (p = 5.65 x 10⁻⁵). As identified through Test Series3 and Figure 23, the trend in India is toward increasingly extreme Lumber DiscrepancyScores, a trend which only the USA also exhibits as identified through analysis of TestSeries 5 and Figure 30.
Test Series 6: t-tests on Effects of Partner Policies on Lumber DiscrepancyScores with Indonesia
PartnerPolicy / YearTested Df t score Lower Upper p-value
ChinaEnforce Order /
2005 6.66 -0.08 -2.87 2.68 9.38E-01
China SVLK / 2013 12.36 -2.45 -3.52 -0.21 0.0299
IndiaEnforce Order /
2005 6.98 4.66 5.29 16.22 0.0023
India SVLK / 2013 15.13 5.52 5.48 12.40 5.65E-05
SingaporeEnforce Order /
2005 6.77 0.29 -8.56 10.95 0.7788
Singapore SVLK / 2013 13.79 -3.07 -12.99 -2.29 0.0085
ThailandEnforce Order /
2005 7.75 -4.19 -9.36 -2.69 0.0033
Thailand SVLK / 2013 13.13 -4.16 -6.63 -2.10 0.0011
Figure 45: China Lumber DiscrepancyScores Before & After 2005Enforcement Order
Figure 46: China Lumber DiscrepancyScores Before & After 2013 SVLKImplementation
91

Figure 47: India Lumber DiscrepancyScores Before & After 2005Enforcement Order
Figure 48: India Lumber DiscrepancyScores Before & After 2013 SVLKImplementation
Figure 49: Singapore LumberDiscrepancy Scores Before & After2005 Enforcement Order
Figure 50: Singapore LumberDiscrepancy Scores Before & After2013 SVLK Implementation
92

Figure 51: Thailand LumberDiscrepancy Scores Before & After2005 Enforcement Order
Figure 52: Thailand LumberDiscrepancy Scores Before & After2013 SVLK Implementation
Section 7. ConclusionThis study began with three research questions, which are now used to organizediscussion of findings and conclusions.
How effective are national policies at curbing Indonesian illegal timbertrade?This research does not permit us to isolate the effects of Indonesia’s policies versuspartner policies and other external factors. However, this research does provideevidence of association between both exporter and importer policies.
Indonesia’s 2005 Enforcement Order and 2013 SVLK policies each preceded significantdecreases in extreme Discrepancy Scores and therefore risk of illegal timber trade (Test
93

Series 4). Discrepancy Scores for trade of Lumber with all partners decreasedsignificantly over the study period (Test Series 2). There has been a lasting decline inextreme scores following the 2005 policy with Japan, Korea, Malaysia, Taiwan, andThailand (Test Series 3 and Appendix 3 “Lumber”). The decline in extreme scoresappears to have been short-lived in Australia (Lumber), China (Logs, Lumber), the EU(Lumber), and the United States (Lumber) (Appendix 3, “Lumber”). Following SVLKimplementation from 2014 to 2019, Lumber Discrepancy Scores grew less extreme inAustralia, the EU, and Singapore (Appendix 3, “Lumber”). During the same period,Scores with China remained high and scores with India and the United States grew(Test 3, Appendix 3). Despite these exceptions, Indonesia’s Discrepancy Scores growsignificantly less extreme over the course of the study (Test Series 1). As Discrepanciesare widely thought to contain illegality, this research provides evidence that Indonesia’snational efforts at reducing timber illegality have proven effective at reducing but noteradicating the problem.
Trade Partner Policies appear meaningfully linked to declines in Lumber DiscrepancyScores as well, and this research provides evidence to suggest that the combination ofImporter and Exporter policies may be most effective in driving a lasting reduction inDiscrepancies. Discrepancy Scores with Indonesia declined after timber import policyevents in Australia (2014), the EU (2013), Japan (2006 and 2017), Korea (2012 and2018), and Taiwan (2010) (Test Series 5). These results may be particularly relevant topolicy evaluation efforts and efficacy reviews from the European Union (EuropeanCommission 2020), Australia (ADAWR 2018), and United States (Prestemon 2015)governments and NGOs (EIA 2021; Logging Off 2021).
Notable exceptions to the pattern of declining discrepancies are Malaysia, which saw arise in Scores after its 2002 and 2003 bans on Indonesia Logs and Lumber; but this wasfollowed by a lasting decline following Indonesia's 2005 Enforcement Order, lendingsupport to the finding that bilateral policy appears to have a lasting effect of reducingDiscrepancies.
The USA is a second exception, where Lumber Scores rise steadily in the yearsfollowing the 2009 expansion of the Lacey Act Amendment to wood products. There isevidence that the Lacey Act is only national timber import policy not tied to a significantdecline in Discrepancy Scores (Test Series 5), though this data do not provide a muchinsight into the cause of this trend. The two most plausible (but not exclusive)explanations seem to be that either the Lacey Act has not been effective at reducingDiscrepancies related to illegal trade, or that Discrepancies in United States timberimports from Indonesia are driven by factors other than illegality. While this analysis isnot able to pinpoint the magnitude of risk reduction due to each given policy, it is likelythat separate and combined effects of export and import policies as important factors tothat risk reduction.
While total Lumber Discrepancies grow less extreme over the study, and most nationalpolicies are linked with this trend at the national level, this research also uncovers
94

reason for concern that national policies may drive leakage to unregulated timbermarkets.
Which specific Partners and Products exhibit the highest risk of illegaltimber imports from Indonesia?Views 1 and 3 clearly establish that Lumber is responsible for the most extremeDiscrepancy Scores in Indonesian timber trade. While most timber import policies arelinked with a trned of decline in total Lumber Discrepancies over the study period, thereis also evidence that national timber import regulations may drive leakage to lessregulated markets.
China’s Lumber Discrepancy Scores remain stubbornly high throughout the studyperiod and show a significant decline only from extreme to moderate risk afterIndonesia’s implementation of SVLK in 2013 (Test Series 6 and Appendix 3). LogDiscrepancies with China also appear more extreme than with any other nation, and2012 to 2016 saw a period of extreme Discrepancies in Chinese Plywood imports(Appendix 3). Given that China is the second largest import of Indonesian Timberproducts (Figure 2) and shows the most extreme Discrepancies in all three Productcategories studies, China is Indonesia’s timber trade partnership at highest risk ofillegality. There is hope that China will complete the effort of enacting long-awaitedtimber import regulations (Yin 2020; Norman & Saunders 2017) to reduce tradeDiscrepancies and reduce opportunities for leakage.
India, though only the twelfth largest export destination for Indonesia timber (Figure 2) isa growing market with increasing demand for timber imports (Norman & Canby 2020)with no timber import policy (Director general of Foreign Trade 2015; Norman & Canby2020 2020). The pattern of steadily increasing Lumber Discrepancies with India(Figures 47 and 48; Test Series 6) concurrent to steady decreases among Partners withimport regulations (Test Series 5) is reason to believe that India may be a growing riskas illegal trade leaks from regulated to unregulated markets.
The United States is the third largest export destination for Indonesia timber (Figure 2)and is an anomaly in this data for its increasing Lumber Discrepancy Scores since 2009despite Lacey Act expansion to include wood products in 2009 followed by high profileenforcement cases. This analysis does not permit greater insight into this dynamic, butthe trend identified is surely of interest to regulators, timber producers whose profitsmay be impacted by illegal timber products entering the USA, and consumers who wishto avoid negative environmental impacts.
How effective is Discrepancy Analysis for identifying illegality in timbersupply chains?Discrepancy Analysis of trade data reported in HS Codes is a valuable but coarse toolfor estimating presence and magnitude of illegal trade. This reesarch enabledidentification of broad trends but is not suited to gaining detailed insight intoshorter-term fluctuations and therefore only able to investigate approximate
95

relationships between effects of policy on timber trade discrepancies. Further,discrepancies, though widely agreed to contain legality, are inherently opaque andisolating illegality from other “normal” sources of difference between importer andexporter reporting is a matter of estimation and assumption. Further, this particularanalysis was limited to annual data, which rendered statistical tests and policy timelinessomewhat coarse; quarterly or monthly data would be an improvement. DiscrepancyAnalysis in search of illegality benefits from finer levels of details in the data whereverpossible. The ability to “slice” data by Partner and Product, to overlap policies andconstruct Policy periods, has greatly improved the information gleaned from otherwiserather blunt data.
Despite shortcomings, this research has successfully identified several trends notidentified in literature review. That lumber is a higher risk product that logs or plywoodhad not, to the author’s knowledge, been previously identified. This project alsoprovides evidence of illegal product leakage from more to less regulated markets in thecases of India and China. This is deserving of additional study, and if validated shouldconcern policymakers, timber producers, and environmental NGOs alike. This projecthas also shown that the United States has not seen a consistent reduction in extremeDiscrepancies for Indonesian timber imports, giving reason to question the efficacy ofLacey Act expansion on preventing illegal timber from interesting American markets.
Further ResearchFurther work to quantify sources of normality more precisely in discrepancies wouldenable a clearer parsing of illegal or risky discrepancies.
Understanding this data to be non-normally distributed, future application ofnonparametric statistical testing would be a valuable contribution and may increase theconfidence in conclusions about legality risk.
Additional research on the presence and magnitude of leakage resulting from specificpolicies will be vital to ongoing efforts to reduce tropical forest loss resulting from illegaltrade. This research might focus on India and China as of particular risk for illegal timberimports.
Analysis of a broader range of products linked to forest loss, especially pulp and paperand palm oil in the case of Indonesia, would be very valuable to assess the level ofillegality across a complete set of forest-dependent commodities. This could alsoexpand on the leakage issues identified here, adding to the discussion the dimension ofleakage across commodities.
Additional research could seek to understand the cause of disproportionate shares ofDiscrepancy Scores among regional partners compared to shares of export value (asdiscussed in View 1).
96

Appendix 1: HS Code C4 Product Category Sorting
HardwoodLogs
HardwoodLumber
HardwoodPlywood
OSB andWaferboard Particleboard
SoftwoodLogs
440312 440721 441210 441012 441011 440310
440331 440722 441213 441019 441031 440311
440332 440723 441214 441021 441032 440320
440333 440724 441222 441029 441033 440321
440334 440725 441223 441039 440322
440335 440726 441224 440323
440341 440727 441229 440324
440349 440728 441231 440325
440391 440729 441232 440326
440392 440790 441233
440393 440791 441234
440394 440792 441292
440395 440793 441293
440396 440794 441299
440397 440795
440398 440796
440399 440797
440798
440799
SoftwoodLumber
SoftwoodPlywood
Temperate HardwoodLumber
Tropical HardwoodLumber
WoodFurniture
440710 441219 440790 440721 940161
440711 441239 440791 440722 940169
440712 440792 440723 940330
440719 440793 440724 940340
440794 440725 940350
440795 440726 940360
440796 440727
440797 440728
440799 440729
97

Appendix 2. Policy Dates for Analysis
Country Year Policy Name t-tests? Notes
Australia 2012 ILPA nIllegal Logging Prohibition Act obligation that importersmeet legal restrictions
Australia 2014 ILPR y Illegal Logging Prohibition Regulation implements ILPA
Australia 2018 CSG n Country-Specific guidelines co-signed by both nations
China 1999 Domestic forest policies n
1. Natural Forest Protection Program: reducesstate-owned natural forest logging (w/ exceptions). 2.Slope land conversion program: market incentives forprivate sustainable management
China 2017 Logging ban nFull ban of domestic logging in state-owned naturalforests.
China 2019 Forest law amendment n Enacts responsibility on importers to identify illegal product
EU 28 2010 EUTR nEuropean trade Regulation enacts importer responsibilityto eliminate illegal timber
EU 28 2014 VPA Indonesia y VPA implemented with Indonesia
EU 28 2016 FLEGT license y
EU Forest Law Enforcement, Governance and TradeLicensure. Licensing began Nov.2016 so analysis uses2017 for before/after.
India 2003 Plant Quarantine Order nSpecifies plant species and products may be imported intoIndia
Indonesia 2001 Log export ban n Covers all roundwood exports
Indonesia 2005 Enforce order y Yudhoyano mandates strict enforcement of timber laws
Indonesia 2013 Forest prod. exp. reg. yRegulations to enforce implementation of TLAS / SVLK(from 2009)
98

Appendix 2. Policy Dates for Analysis
Japan 2000 Sustainable Procurement n Does not yet include wood products
Japan 2006 Goho Wood y Wood products added to public procurement requirement
Japan 2017 Clean Wood Act yVoluntary sustainable timber standards enacted 2016,implemented 2017
Malaysia 2002 Log import ban y Ban on Indonesian roundwood imports
Malaysia 2003 Sawnwood import ban y Adds squared logs >60 in sq to import ban
South Korea 2012 Sustainable timber act y Enacted, no timeline or regulatory framework
South Korea 2018 Sustainable timber amend y
Mandatory implementation regs for Act on SustainableUse of Timbers. Prohibits sale of unverified timber inKorea.
Taiwan 2010 Foreign trade act amend y Enacts & Implements standards to meet CITES
Taiwan 2014 Wildlife conservation act n Updates new CITES listings
Thailand 2013 EU VPA Sign y VPA signed 2013
Thailand 2017 EU VPA negotiation n VPA negotiations begin
UnitedStates 2009 Lacey Act y Lacey act amendment 2008, Wood HS codes added 2009
UnitedStates 2012 Gibson Guitars n
Gibson: $350K cash & comm. service, complianceprogram, forfeit illegal assets
UnitedStates 2016 Lumber Liquidators n
Lumber liquidators $13M criminal fines & comm. service,forfeit illegal assets
99
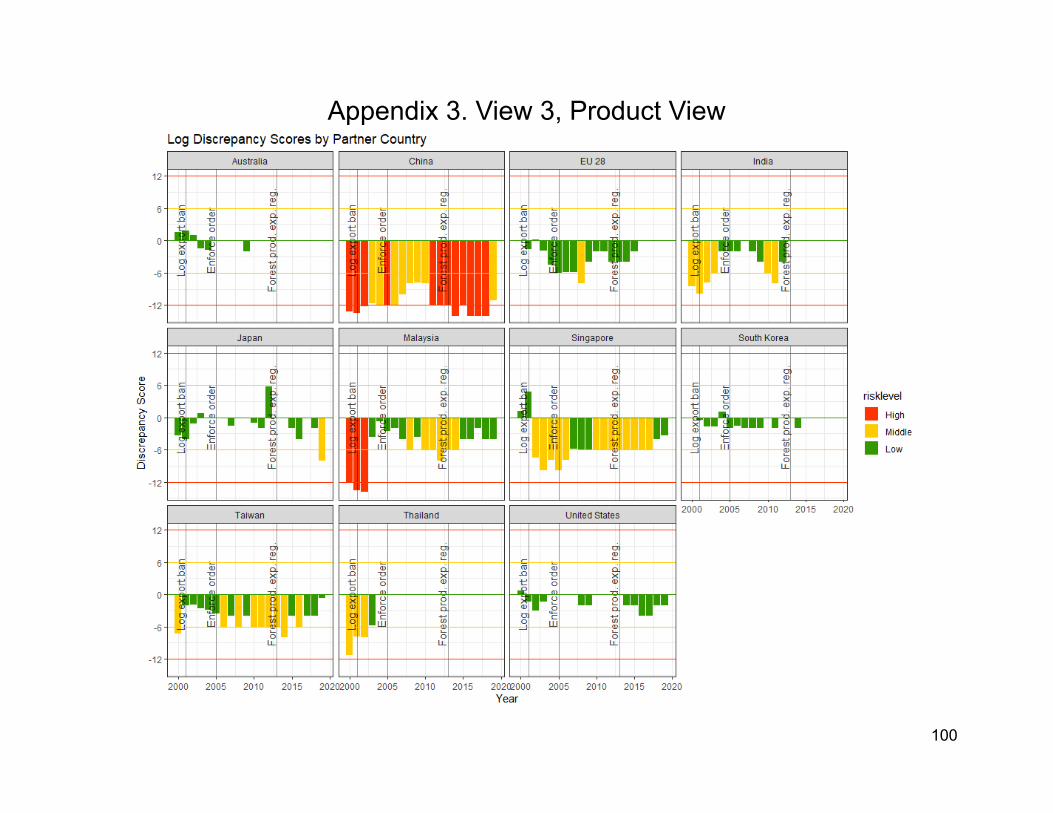
Appendix 3. View 3, Product View
100

101

102

Citations
Aspinwall, N. (2018, April 4). Can Taiwan’s Forestry Bureau Reform the Timber Supply Chain? The News Lens.https://international.thenewslens.com/article/92872
Austin, K. G., Amanda, S., Gu, Y., & Prasad, K. (n.d.). What causes deforestation in Indonesia? EnvironmentalResearch Letters, 14(2). https://iopscience.iop.org/article/10.1088/1748-9326/aaf6db
Australia Department of Agriculture and Water Resources. (2018). Statutory review of the Illegal Logging Prohibition act2012 [Review Report].https://www.agriculture.gov.au/sites/default/files/sitecollectiondocuments/forestry/illegal-logging-statutory-review-report.pdf
Australia Department of Agriculture and Water Resources & Indonesia Ministry of Environment and Forestry. (2018).Country Specific Guidelines for Indonesia (Revision 1.1; pp. 1–24).https://www.agriculture.gov.au/sites/default/files/sitecollectiondocuments/forestry/australias-forest-policies/illegal-logging/indonesia-country-specific-guideline.pdf
Australia Department of Agriculture, Water and the Environment. (2019, November 4). Illegal Logging.https://www.agriculture.gov.au/forestry/policies/illegal-logging
Baccini, A., Walker, W., Carvalho, L., Farina, M., Sulla-Menashe, D., & Houghton, R. A. (2017). Tropical forests are anet carbon source based on aboveground measurements of gain and loss. Science, 358(6360), 230–234.https://science.sciencemag.org/content/358/6360/230
Barr, C., Resosudarmo, I., Dermawan, A., & McCarthy, J. (2006). Decentralization of Forest Administration in Indonesia:Implications for Forest Sustainability, Economic Development and Community Livelihoods (p. 195). Center forInternational Forestry Research.
103

Barua, S., Penttila, J., & Miika, M. (2016). China as a Timber Consumer and Processing Country: An Analysis ofChina’s Import and Export Statistics with in-depth Focus on Trade with the EU. Indufor.
Bedner, A., & Arizona, Y. (2019). Adat in Indonesian Land Law: A promise for the Future or a Dead End? The AsianPacific Journal of Anthropology, 20(5), 416–434.
Busch, J., Ferretti-Gallon, K., Engelmann, J., Wright, M., Austin, K., Stolle, F., Turubanova, S., Potapov, P., Margono, B.,Hansen, M., & Baccini, A. (2015). Reductions in emissions from deforestation from Indonesia’s moratorium on new oilpalm, timber, and logging concessions. PNAS, 112(5), 1328–1333.
Cerutti, P. O., Goetghebuer, T., Leszcynska, N., Newberry, J., Breyne, J., Dermawan, A., Mauquoy, C., Tabi, P. P.,Tsanga, R., Der Ploeg, L. V., & Wathelet, J.-M. (2020). Collecting Evidence of FLEGT-VPA Impacts for Improved FLEGTCommunication. Center for international Forestry Research. https://www.cifor.org/knowledge/publication/7566/
Chatham House. (2021). Forest Governance and Legality. https://forestgovernance.chathamhouse.org/
Chen, H. K. (2008). Lost in Transit: Export and Import Protocols as Contributors to Discrepancies in International TimberTrade Data. TRAFFIC International.
China Ministry of Ecology and Environment, Forest Law of the People’s Republic ofChina, Article 65 (2019). http://english.mee.gov.cn/Resources/laws/envir_elatedlaws/202102/t20210207_820735.shtml
CINTRAFOR. (2021, April 22). University of Washington Center for International Trade in Forest Products.https://www.cintrafor.org/
Clarke, C. (2012, October 8). Forest Legality Initiative. Gibson Guitar Logging Bust Demonstrates Lacey Act’sEffectiveness.https://forestlegality.org/blog/gibson-guitar-logging-bust-demonstrates-lacey-act%E2%80%99s-effectiveness
Curtis, P., Slay, C., Harris, N., Tyukavina, A., & Hansen, M. (2018). Classifying drivers of global forest loss. Science,361, 1108–1111. https://science.sciencemag.org/content/361/6407/1108.editor-summary
Delang, C. O., & Wang, W. (2013). Chinese forest policy reforms after 1998: the case of the Natural Forest ProtectionProgram and the Slope Land Conversion Program. International Forestry Review, 15(3), 290–304.https://www-jstor-org.offcampus.lib.washington.edu/stable/42609450?seq=1#metadata_info_tab_contents
104

Director General of Foreign Trade. (2015). Import Policy 2017 Update.http://dgftcom.nic.in/exim/2000/itchs2017/chap01.pdf
Directorate of Plant Protection, Quarantine and Storage. (2015). Plant Quarantine (Regulation of Import into India) Order,2003. https://plantquarantineindia.nic.in/PQISPub/pdffiles/pqorder2015.pdf
Drost, S., Kaynar, E., & Piotrowski, M. (2021). Japan: Major Financier and Buyer of Leakage Palm Oil and Plywood.Chain Reaction Research.https://chainreactionresearch.com/wp-content/uploads/2021/04/Japan-Major-Financier-and-Buyer-of-Leakage-Palm-Oil-and-Plywood-1.pdf
Durst, P. (2019). Thailand Country Report on Forest Product Legality Requirements and Risks (pp. 1–48) [GovernmentAgency Report]. Ministry of Agriculture, Forestry and Fisheries.https://www.rinya.maff.go.jp/j/riyou/goho/jouhou/pdf/h30/H30report_nettaib_6.pdf
Eastin, I., & Perez-Garcia, J. (2003). Discrepancies in forest products trade statistics. The Forestry Chronicle, 79(6),1084–1093.
Egas, A., Peng, R., Zhang, J., Junior, E., Bila, N., & Sitoe, E. (2018). Tackling discrepancies in timber trade data:Comparing China and Mozambique. International Institute for Environment and Development.http://www.jstor.com/stable/resrep16633
EIA. (2006). America’s Free Trade for Illegal Timber. https://eia-global.org/reports/americas-free-trade-for-illegal-lumber
EIA. (2019, April 24). Singapore Court Returns Nearly 30,000 Illegal Madagascar Rosewood Logs to Trafficker.https://eia-global.org/blog-posts/20190424-singapore-court-returns-nearly-30000-illegal-madagascar-rosewood-logs-to-trafficker
EIA. (2021). Does Well Could Do Better - EUTR Fitness Check.https://eia-international.org/report/does-well-could-do-better-eias-recommendations-for-the-eu-timber-regulation-fitness-check/
105

EIA & Telepak. (2005). The Last Frontier: Illegal Logging in Papua and China’s Massive Timber Theft.https://content.eia-global.org/posts/documents/000/000/413/original/The_Last_Frontier.pdf?1468421007
EIA & Telepak. (2021). Criminal Neglect: Failings in enforcement undermine efforts to stop illegal logging in Indonesia.https://eia-international.org/wp-content/uploads/Criminal-Neglect-FINAL-SPREADS.pdf
Enrici, A., & Hubacek, K. (2016). Business as usual in Indonesia: governance factors affecting the acceleration of thedeforestation rate after the introduction of REDD+. Energy, Ecology, and Environment, 1(4), 183–196.
EU FLEGT Facility. (2012). Timber Flows and Their Control in Thailand. EU FLEGT Facility.https://www.euflegt.efi.int/documents/10180/23308/Timber+Flows+and+their+Control+in+Thailand/89cd6bcf-9a41-411b-915a-d7bee45f310d
EU FLEGT Facility. (2012b, August 16). US enforces the Lacey Act in Gibson Guitar case. News.https://www.euflegt.efi.int/news/-/asset_publisher/VoA92AEdZlro/content/us-enforces-the-lacey-act-in-gibson-guitar-case?inheritRedirect=false
EU FLEGT Facility. (2014). ASEAN timber trade, customs and timber legality scoping study.https://www.euflegt.efi.int/documents/10180/124766/ASEAN+timber+trade,%20customs+and+timber+legality/f272e7c1-22e3-4bfc-8f7c-c1c2e6fe2a11?version=1.0
EU FLEGT Facility. (2016). Cross-border timber trade in the South Asian Association for Regional Cooperation area(pp. 1–8) [Briefing].https://www.euflegt.efi.int/documents/10180/392680/Cross-border+timber+trade+in+the+SAARC+area/0f6312b7-145b-b1b4-12e5-374f4b591210
EU FLEGT Facility. (2017, November 8). The Indonesia-EU Voluntary Partnership Agreement.https://www.euflegt.efi.int/background-indonesia
EU FLEGT Facility. (2018, November 6). Briefing: Comparing South Korea’s Act on the Sustainable Use of Timbers andthe EUTR.https://www.euflegt.efi.int/publications/comparing-south-korea-s-act-on-the-sustainable-use-of-timbers-and-the-eutr
106

EU FLEGT Facility. (2020). What is EU FLEGT? https://www.euflegt.efi.int/what-is-flegt
EU, Regulation laying down the obligations of operators who place timber and timber products on the market., 995/2010(2010). https://eur-lex.europa.eu/legal-content/EN/TXT/?uri=CELEX%3A32010R0995
European Commission, Regulation laying down detailed measures for the implementation of Council Regulation (EC)No 2173/2005 on the establishment of a FLEGT licensing scheme for imports of timber into the European Community",1024/2008 (2008). https://eur-lex.europa.eu/legal-content/EN/TXT/?uri=CELEX:32008R1024
European Commission, Communication from the Commission to the Council and the European Parliament - Forest LawEnforcement, Governance and Trade (FLEGT) - Proposal for an EU Action Plan., 52003DC0251 (2003).https://eur-lex.europa.eu/legal-content/EN/TXT/?uri=CELEX%3A52003DC0251
European Commission. (n.d.). EU Timber Regulation Summary [Gov].https://ec.europa.eu/environment/forests/timber_regulation.htm
European Commission. (2020). Illegal logging – evaluation of EU rules (fitness check). Retrieved July 23, 2021, fromhttps://ec.europa.eu/info/law/better-regulation/have-your-say/initiatives/11630-Illegal-logging-evaluation-of-EU-rules-fitness-check-_en
European Council, Regulation on the establishment of a FLEGT licensing scheme for imports of timber into theEuropean Community., (2005) (testimony of EUR-Lex).https://eur-lex.europa.eu/legal-content/EN/TXT/?qid=1584107319512&uri=CELEX:02005R2173-20200101
FAO. (2014). The FAO Statistics Quality Assurance Framework. http://www.fao.org/3/i3664e/i3664e.pdf
FAO, ITTO, & United Nations. (2020). Forest Product Conversion Factors.
http://www.fao.org/3/ca7952en/CA7952EN.pdf
FAOSTAT. (2020, August 3). Forestry Database. http://www.fao.org/forestry/statistics/84922/en/
Fastmarkets RSI. (2013). India’s Forest Product Industry Outlook 2013.https://www.risiinfo.com/product/2013-indias-forest-products-industry-outlook/?source=EM1304ST
107

Fei, L., Wheiler, K., Ganguly, I., & Hu, M. (2020). Sustainable Timber Trade: A Study on Discrepancies in Chinese Logsand Lumber Trade Statistics. Forests, 205(11).
Forest Legality Initiative. (n.d.a.). All you need to know about the US Lacey Act, the EU Timber Regulation, and theAustralian Illegal Logging Prohibition Bill (International Developments in Trade in Legal Timber).https://forestlegality.org/sites/default/files/Booklet%20-%20International%20Developments%20in%20Trade%20in%20Legal%20Timber%20%28web%29%20%282%29.pdf
Forest Legality initiative. (n.d.b.). Logging and Export Bans. https://forestlegality.org/content/logging-and-export-bans
Forest Legality Initiative. (n.d.c.). U.S. Lacey Act. https://forestlegality.org/policy/us-lacey-act
Forest Trends. (2020). Analysis of China’s trade with the EU and VPA countries 2010-2019. European Forestry Institute.https://www.euflegt.efi.int/publications/analysis-of-china-s-trade-with-the-eu-and-vpa-countries-2010-2019
Forestry Agency of Japan. (2006). Guideline for Verification on Legality and Sustainability of Wood and Wood Products(Provisional Translation). Wood Products Division. https://www.rinya.maff.go.jp/j/boutai/ihoubatu/pdf/gaido1_e.pdf
Forestry Agency of Japan. (2017). The Guide to the Act on Promotion of Use and Distribution of Legally-HarvestedWood and Wood Products. https://www.rinya.maff.go.jp/j/riyou/goho/english/pdf/01essence-aop.pdf
Fry, J., & Honnold, V. (2010). ASEAN: Regional Trends in Economic Integration, Export Competitiveness, and InboundInvestment for Selected Industries (Publication 4176). United States International Trade Commission.
Fung, H.-G., Yau, J., & Zhang, G. (2010). Reported trade figure discrepancy, regulatory arbitrage, and round-tripping:Evidence from the China–Hong Kong trade data. Journal of International Business Studies, 42, 152–176.https://link.springer.com/article/10.1057%2Fjibs.2010.35
Gan, J., Paolo Omar Cerutti, Mauro Masiero, Davide Pattenella, Nicola Anrighetto, & Tim Dawson. (2016). Chapter 3:Quantifying Illegal logging and Related Timber Trade. In Illegal Logging and Related Timber Trade - Dimensions,Drivers, Impacts and Responses (pp. 37–60). International Union of Forest Research Organizations.
108
Garg, T. (2014). Public Health Effects of Ecosystem Degradation: Evidence from Deforestation in Indonesia [Cornell].http://health21initiative.org/wp-content/uploads/2017/08/2014-Cornell-Public-Health-Effects-of-Ecosystem-Degradation.pdf
Gibbs, D., Harris, N., & Seymour, F. (2018, October 4). By the Numbers: The Value of Tropical Forests in the ClimateChange Equation. World Resources Institute.https://www.wri.org/insights/numbers-value-tropical-forests-climate-change-equation
Gingold, B. (2011, June 17). Indonesia’s Forest Moratorium. Mongabay.https://news.mongabay.com/2011/06/indonesias-forest-moratorium/
Global Forest Atlas. (2017). Climate Change and Tropical Forests.https://globalforestatlas.yale.edu/climate-change/climate-change-and-tropical-forests
Global Forest Atlas. (2019). Illegal Logging. Global Forest Atlas.https://globalforestatlas.yale.edu/forest-use-logging/logging/illegal-logging
Goetzl, A. (2005). Why don’t trade numbers add up? (No. 15/1; Tropical Forest Update). ITTO.
Hamanaka, S. (2012). Whose trade statistics are correct? Multiple mirror comparison techniques: a test case ofCambodia. Journal of Economic Policy Reform, 15(1), 33–56.https://www.tandfonline.com/doi/abs/10.1080/17487870.2012.657827
Hanson, C. (2010, October 5). Forest Legalist Initiative. Declaration and Due Care: Insights from Another Lacey Case.https://forestlegality.org/blog/declarations-and-due-care-insights-another-lacey-case
Harwell, E. (2003, January). Without Remedy: Human Rights Abuses and Indonesia’s Pulp and Paper Industry. HumanRights Watch. https://www.hrw.org/reports/2003/indon0103/
109

Hiemstra, L., & de Haan, M. (2017, December 5). CIF/FOB recording of imports and exports in the national accountsand the balance of payments. 11th Meeting of the Advisory Expert Group on National Accounts.https://unstats.un.org/unsd/nationalaccount/aeg/2017/M11_9_2_CIF_FOB_Recording.pdf
Hoare, A. (2014). Methodology for Estimating Levels of Illegal Timber- and Paper-sector Imports Estimates for China,France, Japan, the Netherlands, the UK, the US and Vietnam. Chatham House.
Holt, N. J. (2010). Department of the Interior vs. Three Pallets of Tropical Hardwood.https://launderingmachine.files.wordpress.com/2012/04/us-vs-three-pallets-of-tropical-hardwood-june-2010.pdf
Huang, L., & Chen, S.-F. (2019). What makes tree poachers give up? A case study of forestry law enforcement inTaiwan. Environmental Conservation, 47, 67–73.https://www.cambridge.org/core/services/aop-cambridge-core/content/view/4460A7B3AF50F60625A8458555638B6C/S0376892919000377a.pdf/div-class-title-what-makes-tree-poachers-give-up-a-case-study-of-forestry-law-enforcement-in-taiwan-div.pdf
Hui, L. (2017, January 6). Full coverage of state-owned natural forest protection. China State Forestry and GrasslandAdministration Government Website. http://www.forestry.gov.cn/main/424/content-937359.html
Human Rights Watch. (2013). The Dark Side of Green Growth: Human Rights Impacts of Weak Governance inIndonesia’s Forestry Sector.https://www.hrw.org/report/2013/07/15/dark-side-green-growth/human-rights-impacts-weak-governance-indonesias-forestry
Import Policy 2017 Update, Export Import Policy (2015). http://dgftcom.nic.in/exim/2000/itchs2017/chap01.pdf
Indonesia Ministry of Trade. (2012). Regulation Concerning Provisions on the Export of Forestry Industry Products.http://www.flevin.com/id/lgso/translations/JICA%20Mirror/english/4874_64_M-DAG_PER_10_2012_e.html
Indrarto, G., Murharjanti, P., Khatarina, J., Pulungan, I., Ivalerina, F., Rahman, J., Prana, M., Resosudarmo, I., &Muharrom, E. (2012). The context of REDD+ in Indonesia: Drivers, agents and institutions. CIFOR.
110

IPCC, 2014: Climate Change 2014: Synthesis Report. Contribution of Working Groups I, II and III to the FifthAssessment Report of the Intergovernmental Panel on Climate Change [Core Writing Team, R.K. Pachauri and L.A.Meyer (eds.)]. IPCC, Geneva, Switzerland, 151 pp.https://www.ipcc.ch/site/assets/uploads/2018/02/SYR_AR5_FINAL_full.pdf
IPCC, 2019: Climate Change and Land: an IPCC special report on climate change, desertification, land degradation,sustainable land management, food security, and greenhouse gas fluxes in terrestrial ecosystems [P.R. Shukla, J. Skea,E. Calvo Buendia, V. Masson-Delmotte, H.-O. Pörtner, D. C. Roberts, P. Zhai, R. Slade, S. Connors, R. van Diemen, M.Ferrat, E. Haughey, S. Luz, S. Neogi, M. Pathak, J. Petzold, J. Portugal Pereira, P. Vyas, E. Huntley, K. Kissick, M.Belkacemi, J. Malley, (eds.)]. In press.
Jairo, C. (2007). Sustainable Timber Trade: are Discrepancies in Trade Data Reliable Indicators of Illegal Activities?FAO Regional Office for Asia and the Pacific.http://www.stats.gov.cn/english/icas/papers/p020071017551924698201.pdf
Japan Council for Tracking Illegal Logging and Promotion of Goho-Wood. (2006). “Goho-wood” Japan’s measuresagainst illegal logging. Outline of Goho-Wood. https://www.goho-wood.jp/world/outline/
Japan Ministry of Environment. (2000, May 31). Act on Promotion of Procurement of Eco-Friendly Goods and Servicesby the State and Other Entities (Act on Promoting Green Procurement).http://www.env.go.jp/en/laws/policy/green/index.html
Japan Ministry of Environment. (2017). Act on Promoting Green Procurement.https://www.env.go.jp/policy/hozen/green/attach/gpp%20pamphlet_eng.pdf
Johnson, S. (2002). Documenting the Undocumented. ITTO Tropical Forest Update, 12(1), 6–9.https://www.yumpu.com/en/document/read/8031784/tfu-e-12-1in-itto
Jong, H. N. (2019, August 14). Indonesia forest-clearing ban is made permanent, but labeled ‘propaganda.’ Mongabay.https://news.mongabay.com/2019/08/indonesia-forest-clearing-ban-is-made-permanent-but-labeled-propaganda/
Jong, H.N. (2020a, March 26). Indonesia ends timber legality rule, stoking fears of illegal logging boom. Mongabay.https://news.mongabay.com/2020/03/indonesia-timber-illegal-logging-legality-license-svlk/
111

Jong, H. N. (2020b, May 27). Indonesia drops panned plan to scrap legality license for wood exports. Mongabay.https://news.mongabay.com/2020/05/indonesia-svlk-legal-timber-license-eu-vlegal-export/
Jong, H. N. (2020c, July 29). Upgrade of Indonesian palm oil certification falls short, observers say. Mongabay.https://news.mongabay.com/2020/07/ispo-indonesia-update-palm-oil-sustainable-certification-review/
Jong, H. N. (2021a, March 9). Deforestation in Indonesia hits record low, but experts fear a rebound. Mongabay.https://news.mongabay.com/2021/03/2021-deforestation-in-indonesia-hits-record-low-but-experts-fear-a-rebound/
Jong, H. N. (2021b, April 22). Indonesia’s bid to control deforestation wildly off-target, experts say. Mongabay.https://news.mongabay.com/2021/04/indonesia-net-zero-emission-deforestation-target/
Kallio, A. M., & Solberg, B. (2018). On the Reliability of International Forest Sector Statistics: Problems and Needs forImprovements. Forests, 9(7). https://www.mdpi.com/1999-4907/9/7/407
Kareem, F., & Kareem, O. (2019). The Issues of Zero Values in Trade Data and Modelling. Macro Management andPublic Policies, 1(10), 36–50. https://core.ac.uk/download/pdf/233120484.pdf
Kartodihardjo, H., Jhamanti, H., Djogo, T., & Harvard, M. (n.d.). Environmental politics and power in Indonesia. EquinoxPublishing.
Khokhar, T., & Tabary, M. (2016, March 21). Five forest figures for the International Day of Forests. World Bank Blogs.https://blogs.worldbank.org/opendata/five-forest-figures-international-day-forests
Kirpop, J. (2017, July 14). 5 Countries With The Largest Rainforest Coverage. World Atlas.https://www.worldatlas.com/articles/5-countries-with-the-largest-rainforest-area.html
Korea, Act on the Sustainable Use of Timbers, no. 11429 (2012).https://www.law.go.kr/LSW/eng/engLsSc.do?menuId=2§ion=lawNm&query=act+on+the+sustainable+use+of+timbers&x=0&y=0#liBgcolor3
Korea, Act on the Sustainable Use of Timbers (Partial Amendment), no. 14657 (2017).https://www.law.go.kr/LSW/eng/engLsSc.do?menuId=2§ion=lawNm&query=act+on+the+sustainable+use+of+timbers&x=0&y=0#liBgcolor1
112

Lawson, Sam. (2014). Methodology for Import-source Estimates of Illegally Sourced Wood Imports: Thailand, SouthKorea and India. Chatham House.
Lawson, S., Blundell, A., Cabarle, B., Basik, N., Jenkins, M., & Canby, K. (2014). Consumer Goods and Deforestation:An Analysis of the Extent and Nature of Illegality in Forest Conversion for Agriculture and Timber Plantations. ForestTrends.https://www.forest-trends.org/wp-content/uploads/imported/for168-consumer-goods-and-deforestation-letter-14-0916-hr-no-crops_web-pdf.pdf
Lawson, S., & MacFaul, L. (2010). Illegal Logging and Related Trade: Indicators of the Global Response. ChathamHouse. http://awsassets.panda.org/downloads/chatham_house_illegallogging_2010.pdf
Li, B. (2019, May 23). Overview of the Lacey Act and Legality Policy Development in East Asia [Slide deck]. GTTNRegional Workshop Asia.https://globaltimbertrackingnetwork.org/wp-content/uploads/2019/07/Lacey-Act-Legality-Legislations-in-East-Asia-Bo-Li.pdf
Lopez-Casero, F. (2008, December 6). Laws, regulations and policy measures governing forest products trade in Japan.International Workshop on Responsible Practices for Trade in Timber Products, Beijing.https://www.forest-trends.org/wp-content/uploads/imported/F_Lopez-Casero_EN.pdf
Margono, B., Potapov, P., Turubanova, S., Stolle, F., & Hansen, M. (2014). Primary forest cover loss in Indonesia over2000–2012. Nature Climate Change, 4, 730–735. https://www.nature.com/articles/nclimate2277?page=3
Machfudh. (2011). Design Roadmap of Indonesia REDD+ Funding and Compliant Benefit / Incentives DistributionSystem. UN-REDD Program Indonesia.Concerning Standard and Guidelines of Assessment of Performance ofSustainable Production Forest Management and Verification of Timber Legality Fore License Holders or in PrivateForests, Regulation Number: P. 38/Menhut - II/2009 (2009).
Marini, M., Dippelsman, R., & Stanger, M. (2018). IMF Working Paper: New Estimates for Direction of Trade Statistics.1–37. https://www.imf.org/~/media/Files/Publications/WP/2018/wp1816.ashx
113

Maxwell, S., Fuller, R., Brooks, T., & Watson, J. (2016). Biodiversity: The ravages of guns, nets and bulldozers. Nature,536(7615), 143–145. https://www.nature.com/news/biodiversity-the-ravages-of-guns-nets-and-bulldozers-1.20381
May, C. (2017). Transnational Crime and the Developing World. Global Financial Integrity.https://secureservercdn.net/45.40.149.159/34n.8bd.myftpupload.com/wp-content/uploads/2017/03/Transnational_Crime-final.pdf
McDonald, D. (1985). Trade Data Discrepancies and the Incentive to Smuggle: An Empirical Analysis. Staff Papers(International Monetary Fund), 32(4), 668–692.
Medyana, M., & Ibadurrohman, R. (2019, March 10). Indonesia Furniture Export Reaches US$ 1.69 Billion. Office ofAssistant to Deputy Cabinet Secretary for State Documents and Translation.https://setkab.go.id/en/indonesia-furniture-export-reaches-us-1-69-billion/
Miao, G., & Fortanier, F. (2017). Estimating Transport and Insurance Costs of International Trade. 80, 1–34.https://www.oecd-ilibrary.org/docserver/8267bb0f-en.pdf?expires=1616515602&id=id&accname=guest&checksum=265B78D36F2AA02B463696631C0C85D7
Momii, M. (2014, November). Trade in Illegal Timber The Response in Japan: A Chatham House Assessment .https://chathamhouse.soutron.net/Portal/DownloadImageFile.ashx?objectId=4128
Momii, M., & Saunders, J. (2020). The Japanese Clean Wood Act: Effectively Cleaning Up? (Forest Policy Trade andFinance Initiative). Forest Trends. https://www.forest-trends.org/wp-content/uploads/2020/06/Japan-CWA-Revised.pdf
Mongabay. (2011, June 3). Indonesia’s moratorium map has errors, says government. Mongabay.https://news.mongabay.com/2011/06/indonesias-moratorium-map-has-errors-says-government/
Mongabay. (2018, September 20). Indonesian president signs 3-year freeze on new oil palm licenses. Mongabay.https://news.mongabay.com/2018/09/indonesian-president-signs-3-year-freeze-on-new-oil-palm-licenses/
Mongabay. (2021, June 22). Top 10 Greatest Rainforests. Earth.Org.https://earth.org/world-rainforest-day-worlds-great-rainforests/
114

Mongabay & The Gecko Project. (2017, October 10). The Palm Oil Fiefdom. Mongabay.https://news.mongabay.com/2017/10/the-palm-oil-fiefdom/
Montero, J. J. M., Elisson Wright, & Muhammad Najeeb Khan. (2019). Illegal Logging, Fishing, and Wildlife Trade: TheCosts and How to Combat It. International Bank for Reconstruction and Development / The World Bank.
Myers, S., Gaffikin, L., Golden, C., Ostefeld, R., Redford, K., Ricketts, T., Turner, W., & Osofsky, S. (2013). Humanhealth impacts of ecosystem alteration. PNAS, 110(47), 18753–18760. https://www.pnas.org/content/110/47/18753
Nellemann, C., Henriksen, R., Raxter, P., Ash, N., & Mrema, E. (2014). The Environmental Crime Crisis: Threats toSustainable Development from Illegal Exploitation and Trade in Wildlife and Forest Resources. UNEP and Interpol.https://www.cbd.int/financial/monterreytradetech/unep-illegaltrade.pdf
New York Declaration on Forests. (2017). Finance for Forests. Executive Summary - Goals 8 and 9 Assessment Report.New York Declaration on Forests.https://forestdeclaration.org/images/uploads/resource/2017_NYDF_Goal8-9-Assessment_ExecSum.pdf
Norman, M., & Canby, K. (2020). India’s Wooden Furniture and Wooden Handicrafts: Risk of Trade in IllegallyHarvested Wood (Forest Policy Trade and Finance Initiative).https://www.forest-trends.org/publications/indias-imports-of-illegally-harvested-wood/
Norman, M., & Saunders, J. (2017). Regulating the trade in Illegal Timber: Asian Approaches Compared - State of PlayJune 2017. Forest Trends. https://www.forest-trends.org/wp-content/uploads/2017/08/doc_5634.pdf
Norman, M., & Saunders, J. (2019). Towards Timber Import Provisions in Thailand (Forest Policy Trade and FinanceInitiative, pp. 1–11). Forest Trends.https://www.forest-trends.org/wp-content/uploads/2019/06/FT4307D_ThaiShortReport_R5_PRINT071119_UPDATED-9.3.2019.pdf
Nurbaya, S. (2018). The State of Indonesia’s Forests 2018. Ministry of Environment and Forestry, Republic ofIndonesia.
115

Nurkomariyah, S., Firdaus, M., Nurrochmat, D. R., & Erbaugh, J. T. (2016). Questioning the competitiveness ofIndonesian wooden furniture in the global market. IOP Conference Series: Earth and Environmental Science,285(2019). https://iopscience.iop.org/article/10.1088/1755-1315/285/1/012015/meta
Obidzinski, K., Dermawan, A., Andrianto, A., Komarudin, H., Hernawan, D., & Fripp, E. (2014). Working Paper: Timberlegality verification system and the Voluntary Partnership Agreement in Indonesia.https://www.cifor.org/publications/pdf_files/WPapers/WP164Obidzinski.pdf
Obidzinski, K., & Kusters, K. (2015). Formalizing the Logging Sector in Indonesia: Historical Dynamics and Lessons forCurrent Policy Initiatives. Society & Natural Resources, 28(5), 530–542.https://www.tandfonline.com/doi/pdf/10.1080/08941920.2015.1014605?needAccess=true
Obidzinski, K., Wijaya, C., & Andrianto, A. (2007). Cross-Border Timber Trade in Indonesia: Critical or OverstatedProblem? Forest Governance Lessons from Kalimantan. International Forestry Review, 9(1).
OECD. (2017, December 14). Statistical Insights: Merchandise trade statistics without asymmetries. OECD InternationalTrade and Balance of Payment Statistics.http://www.oecd.org/sdd/its/statistical-insights-merchandise-trade-statistics-without-asymmetries.htm
OECD. (n.d.). Balanced International Merchandise Trade Statistics. OECD.Stat.https://stats.oecd.org/Index.aspx?DataSetCode=BIMTS_CPA
Ortiz-Ospina, E., & Beltekian, D. (2018, June 5). International trade data: why doesn’t it add up? Our World In Data.https://ourworldindata.org/trade-data-sources-discrepancies
Pan, Y., Birdsey, R., Fang, J., Houghton, R., Kauppi, P., Kurz, W., Phillips, O., Shvidenko, A., Lewis, S., Canadell, J.,Ciais, P., Jackson, R., Pacala, S., McGuire, A. D., Piao, S., Rautiainen, A., Sitch, S., & Hayes, D. (2011). A Large andPersistent Carbon Sink in the World’s Forests. Science, 333(6045), 988–993.
Plant Quarantine (Regulation of Import into India) Order, 2003, S.O.1322(E) (2015).https://plantquarantineindia.nic.in/PQISPub/pdffiles/pqorder2015.pdf
116

Prasetyo, A., Hewitt, J., & Chen, H. K. (2012). INDONESIA: Scoping Baseline Information for Forest Law Enforcement,Governance and Trade (Baseline Study 7). EU FLEGT Facility.
Prestemon, J. P. (2015). The impacts of the Lacey Act Amendment of 2008 on U.S. hardwood lumber and hardwoodplywood imports. Forest Policy and Economics, 50, 31–44.https://www.srs.fs.usda.gov/pubs/ja/2014/ja_2014_prestemon_002.pdf
Rainforest Trust. (2017, September 1). Climate Change Series Part 1 – Rainforests Absorb, Store Large Quantities ofCarbon Dioxide [NonProfit]. News.https://www.rainforesttrust.org/climate-change-series-part-1-rainforests-absorb-store-large-quantities-carbon-dioxide/
Ren, G., Young, S., Wang, L., Wang, W., Long, Y., Wu, R., Li, J., Zhu, J., & Yu, D. (2015). Effectiveness of China’sNational Forest Protection Program and Nature Reserves. Conservation Biology, 29(5), 1368–1377.https://conbio.onlinelibrary.wiley.com/doi/epdf/10.1111/cobi.12561
Resosudarmo, B., & Yusuf, A. (2006). Is the Log Export Ban an Efficient Instrument for Economic Development andEnvironmental Protection? The Case of Indonesia. Asian Economic Papers, 5(2).
Ritchie, H. (n.d.). Deforestation and Forest Loss. Our World In Data.https://ourworldindata.org/deforestation#not-all-forest-loss-is-equal-what-is-the-difference-between-deforestation-and-forest-degradation
Rose, G. (2017). Australian Law to Combat Illegal Logging in Indonesia: A Gossamer Chain for TransnationalEnforcement of Environmental Law. RECIEL, 26(2), 128–138.https://onlinelibrary-wiley-com.offcampus.lib.washington.edu/doi/full/10.1111/reel.12206
Ross, M. L. (2001). Indonesia: Putting the Forest to “Better Use.” In Timber Booms and Institutional Breakdown inSoutheast Asia (pp. 157–189). Cambridge University Press.
Rozanski, J., & Yeats, A. (1994). On the (in)accuracy of economic observations: An assessment of trends in thereliability of international trade statistics. Journal of Development Economics, 44, 103–130.
Saltzman, R. (2010). Establishing a “Due Care” Standard Under the Lacey Act Amendments of 2008. Michigan LawReview First Impressions, 109(1). https://repository.law.umich.edu/cgi/viewcontent.cgi?article=1020&context=mlr_fi
117

Santosa, M., Khatarina, J., & Suwana, A. (2013). The Progress on Governing REDD+ in Indonesia. InternationalJournal of Rural Law and Policy, 2013 Special Edition.
SATGAS. (2006). Indonesia’s National REDD+ Strategy - Carbon and Beyond. Indonesian REDD+ Taskforce.https://openjicareport.jica.go.jp/pdf/12114286_06.pdf
SATGAS. (2012). REDD+ National Strategy. Indonesia REDD+ Task Force.https://www.unredd.net/documents/un-redd-partner-countries-181/asia-the-pacific-333/a-p-partner-countries/indonesia-187/15078-indonesia-redd-national-strategy.html
Saunders, J., & Norman, M. (2019). Regulating the Trade in Illegal Timber: Republic of Korea Update (pp. 1–13). ForestTrends. https://www.forest-trends.org/wp-content/uploads/2019/01/Forest-Trends-Korea-Brief-Final-2019.pdf
Schloenhardt, A. (2008). The illegal trade in timber and timber products in the Asia–Pacific region (No. 89; Researchand Public Policy Series). Australian Institute of Criminology. https://core.ac.uk/download/pdf/30687625.pdf
Seneca Creek Associates, LLC, & Wood Resources International, LLC. (2014). “Illegal” Logging and Global WoodMarkets: The Competitive Impacts on the U.S. Wood Products Industry. American Forest & Paper Association.http://www.unece.lsu.edu/responsible_trade/documents/2003-2006/rt03_036.pdf
Shelley, W. R. (2012). Setting the Tone: The Lacey act’s Attempt to Combat the International Trade of Illegally ObtainedPlant and Wildlife and Its Effect on Musical Instrument Manufacturing. Environmental Law, 42, 549–575.https://www.jstor.org/stable/43267305?seq=1
Singapore, Revised Timber Industry Act, no. 64 of 1973 (1987).https://sso.agc.gov.sg/Act-Rev/325/Published/19870330?DocDate=19870330#pr21-
Singer, B. (2009). Indonesian Forest-Related Policies: A multisectoral overview of public policies in Indonesia’s forestssince 1965 [Draft PhD Dissertation].
Siscawati, M., Banjade, M., Liswanti, N., Herawati, T., Mwangi, E., Wulandari, C., Tjoa, M., & Silaya, T. (2017). Overviewof forest tenure reforms in Indonesia (Working Paper 223). CIFOR.
118

Smith, J., Obidzinski, K., & Suramenggala, I. (2003). Illegal logging, collusive corruption and fragmented governments inKalimantan, Indonesia. International Forestry Review, 5(3), 293–302.
Sood, D. (2019). GAIN Report: Wood and Wood Products Update 2019 (Global Agricultural Information Network ReportNo. IN9033). USDA.https://apps.fas.usda.gov/newgainapi/api/report/downloadreportbyfilename?filename=Wood%20and%20Wood%20Products%20Update%202019_New%20Delhi_India_4-17-2019.pdf
Tacconi, L., & Muttaqin, M. (2019). Reducing emissions from land use change in Indonesia: An overview. Forest Policyand Economics, 108(Special Issue: Reducing Emissions from Land Use Change in Indonesia).https://www.sciencedirect.com/science/article/pii/S138993411830460X
Tacconi, L., Obidzinski, K., & Agung, ferdinandus. (2004). Learning Lessons to Promote Forest Certification and ControlIllegal Logging in Indonesia. CIFOR.
Tachibana, S. and Araya, A. (2004). Study on Discrepancies in the Tropical Wood Trade Statistics between Japan andMajor Exporting Countries. September 2004. ITTO, Yokohama. Unpublished report.
Taiwan Council of Agriculture, Wildlife Conservation Act, (1989) (testimony of Taiwan Council of Agriculture).https://law.moj.gov.tw/ENG/LawClass/LawAll.aspx?pcode=M0120001
Taiwan Council of Agriculture, The Forestry Act, (2016) (testimony of Taiwan Council of Agriculture).https://law.moj.gov.tw/ENG/LawClass/LawAll.aspx?pcode=M0040001
Taiwan Council of Agriculture, Wildlife Conservation Act, (2013) (testimony of TaiwanCouncil of Agriculture). https://law.moj.gov.tw/ENG/LawClass/LawAll.aspx?pcode=M0120001
Taiwan Council of Agriculture, The Forestry Act, (2016) (testimony of Taiwan Council of Agriculture).https://law.moj.gov.tw/ENG/LawClass/LawAll.aspx?pcode=M0040001
Taiwan Forestry Bureau. (2016, July 13). International Participation. Nature Conservation.https://conservation.forest.gov.tw/EN/000163
119

Taiwan Ministry of Economic Affairs, Foreign Trade Act, (1993) (testimony of Ministry of Economic Affairs).https://law.moj.gov.tw/ENG/LawClass/LawHistory.aspx?pcode=J0090004
Teevrat Garg. (2014). Public Health Effects of Ecosystem Degradation: Evidence from Deforestation in Indonesia[Cornell].http://health21initiative.org/wp-content/uploads/2017/08/2014-Cornell-Public-Health-Effects-of-Ecosystem-Degradation.pdf
Thee, K. W. (2000). The Impact of the Economic Crisis on Indonesia’s Manufacturing Sector. The DevelopingEconomies, XXXVIII(4), 420–453. https://onlinelibrary.wiley.com/doi/pdf/10.1111/j.1746-1049.2000.tb00886.x
Thee, K. W. (2009). The Indonesian Wood Products Industry. Journal of the Asian Pacific Economy, 14(2), 138–149.
The Timber Trade Portal. (2020, July 30). India Legality Profile. Gateway to International Timber Trade.https://www.timbertradeportal.com/countries/india/#legality-profile
Thornton, A., von Bismarck, A., Wick, A., Lawson, S., & Newman, J. (n.d.). Singapore’s Illegal Timber Trade & TheUS-Singapore Free-Trade Agreements. EIA & Telepak.https://www.telapak.org/wp-content/uploads/2013/09/Sing_illegal_timber_trade.pdf
Union of Concerned Scientists. (2015). The Lacey Act’s Effectiveness in Reducing Illegal Wood Imports.https://www.ucsusa.org/sites/default/files/attach/2015/10/ucs-lacey-report-2015.pdf
United Nations. (2014). IMPORTERS INFORMATION NOTE: Indonesia’s Timber Legality Assurance SystemINDO-TLAS / SVLK / V-Legal Documents & FLEGT Licensing.https://publicadministration.un.org/unpsa/Portals/0/UNPSA_Submitted_Docs/2019/4E138C85-FA8B-43F4-82A0-1E53660548AF/IMPORTERS%20INFORMATION%20NOTE_Australia.pdf?ver=2018-11-30-211652-267
UN-REDD Programme. (2017). A Brighter Future for Forests. UN-REDD Programme.http://docs.wixstatic.com/ugd/5c7380_7848954ca2e94b18883ba6c11f593003.pdf
UN Economic Commission for Europe. (2009). The Importance of China’s Forest Products Markets to the UNECERegion. Geneva Timber and Forest Discussion, Paper 57. https://unece.org/DAM/timber/publications/dp-57.pdf
UN Comtrade. (2021). UN Comtrade Database. https://comtrade.un.org/data/
120

UN FAO. (2016). State of the World’s Forests 2016. UN FAO. http://www.fao.org/publications/sofo/2016/en/
UN FAO. (n.d.). Forests and Climate Change. http://www.fao.org/3/ac836e/AC836E03.htm
United Nations. (2016). Life On Land: Why It Matters (United Nations Sustainable Development Goals, Number 15).https://www.un.org/sustainabledevelopment/wp-content/uploads/2016/08/15_Why-it-Matters_Goal15__Life-on-Land_3p.pdf
US Code, Control of Illegally Taken fish and Wildlife, no. Title 16 USC Ch. 54 (2008).https://uscode.house.gov/view.xhtml?path=/prelim@title16/chapter53&edition=prelim
US Library of Congress. (2016, July 26). Library of Congress Law. Global Legal Monitor.https://www.loc.gov/law/foreign-news/article/japan-act-aims-to-promote-trade-in-legally-produced-timber/
USDA. (2019). Gain Report: India Wood and Wood products Update 2019.https://apps.fas.usda.gov/newgainapi/api/report/downloadreportbyfilename?filename=Wood%20and%20Wood%20Products%20Update%202019_New%20Delhi_India_4-17-2019.pd
US Department of Agriculture. (2020a, October 28). Lacey Act Declaration Implementation Schedule. Animal and PlantHealth Inspection Service.https://www.aphis.usda.gov/aphis/ourfocus/planthealth/import-information/lacey-act/implementaton-schedule/hts
US Department of Agriculture. (2020b, November 3). Lacey Act. Animal and Plant Health Inspection Service.https://www.aphis.usda.gov/aphis/ourfocus/planthealth/import-information/lacey-act
US Department of Agriculture, Foreign Agricultural Service. (2020). Food and Agricultural Import Regulations andStandards Country Report [FAIRS Annual Country Report]. USDA & GAINS.https://apps.fas.usda.gov/newgainapi/api/Report/DownloadReportByFileName?fileName=Food%20and%20Agricultural%20Import%20Regulations%20and%20Standards%20Country%20Report_Taipei_Taiwan_12-31-2020
121

US Department of Justice. (2009, May 1). Chinese Baby Furniture Company Pleads Guilty to Smuggling InternationallyProtected Wood. United Stated Department of Justice.https://www.justice.gov/opa/pr/chinese-baby-furniture-company-pleads-guilty-smuggling-internationally-protected-wood
US Department of Justice. (2016, February 1). Lumber Liquidators Inc. Sentenced for Illegal Importation of Hardwoodand Related Environmental Crimes. United Stated Department of Justice.https://www.justice.gov/opa/pr/lumber-liquidators-inc-sentenced-illegal-importation-hardwood-and-related-environmental
Vanam, Dr. B. (2019). Timber Trade in India - Challenges and Policies. EPRA International Journal of MultidisciplinaryResearch, 5(12), 119–122. https://eprajournals.com/jpanel/upload/1214pm_25.EPRA%20JOURNALS-3867.pdf
Weisse, M., & Goldman, E. (2018, June 26). 2017 Was the Second-Worst Year on Record for Tropical Tree Cover Loss.World Resources Institute. https://www.wri.org/insights/2017-was-second-worst-year-record-tropical-tree-cover-loss
Wibowo, A., & Giessen, L. (2018). From voluntary private to mandatory state governance in Indonesian forestcertification: Reclaiming authority by bureaucracies. Forest and Society, 2(1), 28–46.https://pdfs.semanticscholar.org/19be/fdc43e902e535c434a6e99cfcc57cd4d714d.pdf
Wijaya, A., Samadhi, T., & Juliane, R. (2019, July 24). Indonesia Is Reducing Deforestation, but Problem Areas Remain.World Resources Institute. https://www.wri.org/insights/indonesia-reducing-deforestation-problem-areas-remain
Wijaya, A., Reidinar, J., Firmansyah, R., Samadhi, T., & Hamzah, H. (2017, July 19). Drivers of Deforestation inIndonesia, Inside and Outside Concessions Areas. World Resources Institute.https://www.wri.org/insights/drivers-deforestation-indonesia-inside-and-outside-concessions-areas
Wilson, E. O., & Peter, F. M. (1989). Biodiversity. National Academy Press.
Wollenberg, E., & Kartodihardjo, H. (2002). Devolution and Indonesia’s New Forestry Law. In Which Way Forward?People, forests, and policymaking in Indonesia. Resources For The Future.
World Bank. (2003). Combating Corruption In Indonesia: Enhancing Accountability For Development. World Bank.https://openknowledge.worldbank.org/handle/10986/14652
122

World Bank. (2010). Imports, Exports and Mirror Data with UN COMTRADE. WTIS Online Help.https://wits.worldbank.org/wits/wits/witshelp/content/data_retrieval/T/Intro/B2.Imports_Exports_and_Mirror.htm
Yin, B. (2020, August 6). How to tackle the illegal timber trade? New rules on implementing China’s Forest Law couldhold the key.https://www.globalwitness.org/en/blog/how-to-tackle-the-illegal-timber-trade-new-rules-on-implementing-chinas-forest-law-could-hold-the-key/
123

124
Copyright © 2022 FDOKUMEN