Modernizing Trade in Pakistan: - A Policy Roadmap
164
Modernizing Trade in Pakistan: A Policy Roadmap Public Disclosure Authorized Public Disclosure Authorized Public Disclosure Authorized Public Disclosure Authorized
-
Upload
khangminh22 -
Category
Documents
-
view
2 -
download
0
Transcript of Modernizing Trade in Pakistan: - A Policy Roadmap

Modernizing Trade in Pakistan: A Policy Roadmap
Pub
lic D
iscl
osur
e A
utho
rized
Pub
lic D
iscl
osur
e A
utho
rized
Pub
lic D
iscl
osur
e A
utho
rized
Pub
lic D
iscl
osur
e A
utho
rized

PakistanTrade Strategy DevelopmentModernizing Trade in Pakistan: A Policy Roadmap
Report No: AUS0001114
Document of the World Bank
January 2020

© 2020 The World Bank1818 H Street NW, Washington DC 20433Telephone: 202-473-1000; Internet: www.worldbank.org
Some rights reserved
This work is a product of the staff of The World Bank. The findings, interpretations, and conclusions expressed in this work do not necessarily reflect the views of the Executive Directors of The World Bank or the governments they represent. The World Bank does not guarantee the accuracy of the data included in this work. The boundaries, colors, denominations, and other information shown on any map in this work do not imply any judgment on the part of The World Bank concerning the legal status of any territory or the endorsement or acceptance of such boundaries.
Rights and Permissions
The material in this work is subject to copyright. Because The World Bank encourages dissemination of its knowledge, this work may be reproduced, in whole or in part, for noncommercial purposes as long as full attribution to this work is given.
Attribution—Please cite the work as follows: “World Bank. 2020. Modernizing Trade in Pakistan: A Policy Roadmap. © World Bank.”
All queries on rights and licenses, including subsidiary rights, should be addressed to World Bank Publications, The World Bank Group, 1818 H Street NW, Washington, DC 20433, USA; fax: 202-522-2625; e-mail: [email protected].

Acknowledgments
About the authors
Welcome
Executive summary
Overview
PART I. TRADE COMPETITIVENESS
Chapter 1 – HOW TO: Boost trade competitiveness
PART II. TRADE IN GOODS
Chapter 2 – HOW TO: Reduce the time and cost to trade
Chapter 3 – HOW TO: Maximize the benefits of integration with China through trade agreements
Chapter 4 – HOW TO: Boost trade, revenues, and growth through trade reforms
Chapter 5 – HOW TO: Upgrade in the textiles and apparel global value chain
Chapter 6 – HOW TO: Boost agricultural exports
PART III. TRADE IN SERVICES
Chapter 7 – HOW TO: Use services to support diversification
Chapter 8 – HOW TO: Scale up knowledge-intensive exports
PART IV. IMPACTS ON POVERTY AND INCLUSION
Chapter 9 – HOW TO: Ensure that trade policy reforms disrupt elite capture
Chapter 10 – HOW TO: Leverage trade for women’s empowerment
TOOLS: Critical data
TOOLS: Additional resources
Abbreviations
ii
iii
iv
vi
viii
1
2
18
19
33
43
53
69
79
80
96
106
107
115
127
135
147
Getty Images
MODERNIZING TRADE IN PAKISTAN: A POLICY ROADMAP
CON
TEN
TS
i

This report was prepared by a team led by Nadia Rocha, Senior Economist in the Trade and Regional Integration unit of the Macroeconomics, Trade and Investment (MTI) Global Practice. The team included Aarre Laakso (Consultant), Miles McKenna (Analyst, MTI Trade and Regional Integration) and Gonzalo Varela (Senior Economist, MTI South Asia). Background notes and contributions for the different questions were provided by Reshma Aftab (Private Sector Specialist), Guillermo Arenas (Economist), Cristina Constantinescu (Economist), Vivian Couto (Duke Global Value Chains Center), James Crittle (Consultant), Sarur Chaudhary (Consultant), Vicky Chemutai (Consultant), Jack Daly (Duke Global Value Chains Center), Alvaro Espitia (Consultant), Karina Fernandez-Stark (Duke Global Value Chains Center), Ernesto Fernandez Monge (Consultant), Michael Ferrantino (Lead Economist), Stacey Frederick (Duke Global Value Chains Center), Adnan Ghumman (Economist), Rakesh Gupta N. Ramasubbaiah (Consultant), Sugandha Huria (Consultant), Rafay Khan (Economist), Csilla Lakatos (Senior Economist), Maria Liungman (Senior Economist), Maryla Maliszewska (Senior Economist), Alen Mulabdic (Analyst), Mondher Mimouni (International Trade Center), Martín Molinuevo (Senior Private Sector Specialist), Jose Ramon Perea (European Commission), Katrin Pfister (Consultant), Satya Prasad Sahu (Senior Trade Facilitation Specialist), Michele Ruta (Lead Economist), Sebastian Saez (Lead Economist), Heba Shamseldin (Lead Private Sector Specialist), Samidh Shrestha (International Trade Center), Pierre Sauvé (Senior Private Sector Specialist) and Erik van der Marel (Consultant).
We also thank Illango Patchamuthu (Country Director, Pakistan), Manuela do Rosario Francisco (Practice Manager, MTI South Asia), Esperanza Lasagabaster (Practice Manager, FCI South Asia), Antonio Nucifora (Practice Manager, MTI Trade and Regional Integration), Enrique Blanco Armas (Lead Country Economist, MTI South Asia), Shabih Ali Mohib (Program Leader, Equitable Growth, Finance and Institutions Vice Presidency, Pakistan), Melinda Good (Operations Manager, Pakistan Country Management Unit), and the peer reviewers Gabi Afram (Lead Financial Sector Economist) and Mariana Iootty (Senior Economist) for their valuable suggestions and comments. The report was edited by Aarre Laakso. Graphic design by SlideBrand. www.slidebrand.com
ii MODERNIZING TRADE IN PAKISTAN: A POLICY ROADMAPAC
KN
OW
LED
GM
ENTS

Nadia Rocha is a Senior Economist in the MTI Global Practice. Prior to joining the World Bank Group in 2016, Nadia worked for five years in the Economic Research and Statistics division of the World Trade Organization. She was seconded to serve as a Senior Advisor on trade to the Colombian Ministry of Trade during 2015. Nadia holds a Ph.D. in International Trade from the Graduate Institute of Geneva, MA in Economics from Pompeu Fabra University of Barcelona, and a BA in Economics from Bocconi University in Milan. Her current work focuses on regionalism, trade costs, global value chains, and trade and gender.
Gonzalo Varela is a Senior Economist in the MTI Global Practice. He leads the World Bank’s trade engagement with the governments of Pakistan and Nepal. His work focuses on issues of trade policy and trade competitiveness, specifically, on links between policy decisions and firm performance dynamics. He draws on more than fifteen years of experience with the public and private sectors in Latin America and the Caribbean, North Africa, and East and South Asia. Prior to joining the World Bank Group, Gonzalo lectured at the University of Sussex, the University of Pisa and Scuola Sant’Anna, and worked for the Ministry of Industry in Uruguay. He holds a Ph.D. in Economics and a Master in International Economics from the University of Sussex.
Miles McKenna is an Associate Economist with the International Finance Corporation. He previously worked as an Analyst in the MTI Global Practice, where he provided assessments of opportunities for economic growth and integration through global value chains, trade facilitation, the role of standards in trade, and mainstreaming sustainability into private sector development. Prior to joining the World Bank Group, he lectured at the University of Xiamen. He holds an MSc in Global Energy and Climate Policy from the University of London, SOAS.
MODERNIZING TRADE IN PAKISTAN: A POLICY ROADMAP iii
ABO
UT
THE
AUTH
OR
S

We intend this handbook to be a resource for those interested in trade policy reform, in Pakistan and elsewhere. It arose from the Pakistan Trade and Investment Policy Program (PTIPP),
which was designed to work on trade, competitiveness, and gender in Pakistan. The overarching program objective was to support Pakistan’s efforts to increase regional trade and investment, with a special focus on strengthening links to other countries in the region.
This handbook focuses on two pillars of the PTIPP: trade policy and trade facilitation. The objective of the trade policy pillar was to develop a comprehensive medium-term regional trade strategy underpinned by high-quality analysis, in line with international good practice. The objective of the trade facilitation pillar was to reduce the time, cost, and documentation required to process exports and imports through key border posts, leading to a substantial increase in the volume of goods traded.
To achieve these objectives, the PTIPP engaged with policy-making institutions, the private sector, including female entrepreneurs, and government to promote international trade, investment, gender equality, and regional integration. The PTIPP raised the profile of the trade agenda in politics, motivated policymaking institutions and the private sector to move toward an environment in which international trade could flourish, and articulated clear policy actions to tackle Pakistan’s international trade problems. The PTIPP sought to make international trade more politically relevant so that decision makers acknowledged the trade crisis, prioritized trade reforms, and took meaningful actions to see them implemented.
Along the way, the PTIPP produced an enormous amount of technical analysis of the many variables that affect Pakistan’s competitiveness. The team quickly realized the importance of thinking about all these analyses holistically. Only by doing so could one get a comprehensive sense of the status of Pakistan’s competitiveness. We recognized a need to consolidate all the material the project had produced to show how each piece of the competitiveness puzzle fit together and how the recommendations needed to be implemented in parallel to effectively increase competitiveness.
iv MODERNIZING TRADE IN PAKISTAN: A POLICY ROADMAPW
ELCO
ME

This task, of course, was more complicated than just stapling all the papers into one long book that nobody would read. In creating the consolidated, holistic document we envisioned, we organized the analyses and recommendations of the experts around questions that policy makers and development practitioners often ask. We then focused on producing a document that not only lists results and recommendations but also guides the reader through how the analysis was conducted and how the recommendations were reached.
This handbook also reflects two levels of generality. The reader may think of it as offering both a specific set of examples particular to Pakistan and a general set of suggestions applicable to a wide variety of economies.
On the one hand, we report details of World Bank Group analysis under the PTIPP. Most of the recommendations reported here have now been integrated into new World Bank Group operational programs designed to boost Pakistan’s competitiveness. They will also add value to the initiative Pakistan@100 by providing a roadmap of reform for the country in the area of trade competitiveness. This handbook will therefore help ensure that the Government of Pakistan owns the analysis we have done, understands the recommendations we have made, and has the data and tools necessary to reproduce them if it wants to do so.
On the other hand, this handbook also provides a set of guidelines for analyzing competitiveness in any country and shows how the lessons learned in Pakistan could apply to other economies. It will therefore be useful for teams conducting competitiveness analyses in other countries and regions. In fact, we hope that this handbook will become a new model of producing material for World Bank Group client governments.
Producing a handbook in this form takes time and resources, but we believe that effectively communicating what needs to be done is a worthwhile investment. We hope you will agree.
Nadia Rocha Gonzalo Varela Miles McKenna
vMODERNIZING TRADE IN PAKISTAN: A POLICY ROADMAP
WEL
COM
E

Increasing Pakistan’s competitiveness requires increasing both its competitiveness in trading goods and its competitiveness in trading services. In today’s world, the two are complementary. Increasing the competitiveness of trade in goods may require—or lead to—increases in the competitiveness of trade in services, and vice versa.
Boosting the competitiveness of Pakistan’s trade in goods requires attention to both horizontal (cross-cutting) and vertical (sector-specific) factors. Among the horizontal factors are trade facilitation, trade agreements (particularly Pakistan’s trade agreement with China), and trade policy. The most important sectors for increasing Pakistan’s competitiveness in trade in goods are textiles, apparel, and agriculture.
Services can also play a horizontal role in boosting trade in goods. Strengthening backbone services in enabling sectors such as transport, energy, logistics, and financial services can contribute to diversifying Pakistan’s basket of export goods. But exports of knowledge-intensive services are also especially important for Pakistan’s competitiveness.
Trade policy reforms to boost Pakistan’s competitiveness will have repercussions beyond trade in goods and services. A country must carefully design trade policy reforms to ensure that they are inclusive. In Pakistan, such reforms could be especially impactful by offering new opportunities to empower women through trade.
Five years of data analyses and consultation under the PTIPP have convinced us that the most important trade reforms are:
• minimizing the time, cost, and documentation required to process imports and exports at Pakistan’s borders,
• negotiating changes to the China–Pakistan Free Trade Agreement to secure increased preferences for high-potential products from Pakistan in sectors such as textiles, vegetable products, and raw hides and skins,
• rationalizing tariff policy through comprehensive tariff reforms,
• redesigning import duty suspension and refund programs to provide apparel exporters with access to high-quality inputs—particularly synthetic fibers—at world prices,
vi MODERNIZING TRADE IN PAKISTAN: A POLICY ROADMAPEX
ECU
TIV
E SU
MM
ARY
• reducing tariffs and para-tariffs for intermediate and capital goods in agriculture while lowering restrictions on services trade and foreign investment in enabling services,
• promoting trade and investment in services more aggressively,
• establishing specialized infrastructure and tax treatment in the form of technology parks or special economic zones (SEZs) for firms exporting knowledge-intensive services, and
• broadening and deepening women’s role in Pakistan’s new Strategic Trade Policy Framework (STPF).
This handbook unpacks these recommendations, detailing the approaches, data, and rationale behind the findings.
Indeed, none of these reforms is sufficient in isolation for Pakistan to meet its development objectives. Prioritizing and sequencing can help to overcome political economy constraints, but what is truly needed in Pakistan is comprehensive trade reform. Tackling these challenges simultaneously, keeping in mind the interconnected nature of trade, would provide the greatest impact.
viiMODERNIZING TRADE IN PAKISTAN: A POLICY ROADMAP
EXEC
UTI
VE
SUM
MA
RY

PART I. TRADE COMPETITIVENESS
Chapter 1. HOW TO: Boost trade competitiveness examines Pakistan’s export performance overall.
PART II. TRADE IN GOODS
Chapter 2. HOW TO: Reduce the time and cost to trade examines Pakistan’s performance on trade facilitation.
Chapter 3. HOW TO: Maximize the benefits of integration with China through trade agreements explores how Pakistan could take full advantage of its proximity to China.
Chapter 4. HOW TO: Boost trade, revenues, and growth through trade reforms examines the role of tariffs in Pakistan’s trade performance.
Chapter 5. HOW TO: Upgrade in the textiles and apparel global value chain explores how Pakistan could fully realize its potential in the textiles and apparel global value chain.
Chapter 6. HOW TO: Boost agricultural exports examines how Pakistan could boost agricultural exports as a powerful platform for growth and poverty reduction.
PART III. TRADE IN SERVICES
Chapter 7. HOW TO: Use services to support diversification explores how Pakistan can optimize the backbone services that add value to its manufacturing exports.
Chapter 8. HOW TO: Scale up knowledge-intensive exports examines Pakistan’s direct exports of services.
PART IV. IMPACTS ON POVERTY AND INCLUSIONChapter 9. HOW TO: Ensure that trade policy reforms disrupt elite capture focuses on the distributional aspects of trade policy, specifically the impact of trade liberalization on poverty and gender.
Chapter 10. HOW TO: Leverage trade for women’s empowerment examines how trade and trade policy can allow women to contribute to economic and social development.
This handbook is organized into four parts. Each part consists of one or more “how to” chapters. Each chapter covers an objective related to trade policy and competitiveness reform, describing how to achieve that objective using the available data, methods, and other resources.
Each chapter of the handbook has two sections: a brief “Quick start” section and a longer “In depth” section.
The “Quick start” sections provide a high-level overview of the World Bank Group work. Readers who want to understand the details need to refer to the “In depth” sections.
viii MODERNIZING TRADE IN PAKISTAN: A POLICY ROADMAPO
VER
VIE
W

Main Messages
Key Questions
Actions
QUICK START
IN DEPTH
Snapshot
Critical data
Forward Look
Methodology
Additional resources
Each “Quick start” section includes a summarized mix of the outcomes and the determinants relevant to the question at hand. It covers three topics:
The “In depth” sections are written for technical experts, including technical staff within client institutions, academics, World Bank Group staff, and others with a need for a deeper understanding of the determinants and outcomes of policy changes in an area. Each “In depth” subsection covers these topics:
This subsection provides descriptive analysis of the context based upon the main findings of the World Bank Group work. It provides a concise list of points in a style similar a brief or a talking points memo for senior decision makers. Each point is explained in a manner suitable for a broader, non-technical audience.
This subsection summarizes policy recommendations, potential scenarios based on the implications of the findings, or suggestions for further areas for intervention and analysis.
What were the major policy questions that acted as the impetus for this analysis? Which questions does this analysis answer for the client?
This subsection includes a list of key indicators, types of data one needs to compile, and the sources for such data. It provides short descriptions of publicly available datasets or other sources. The appendix “TOOLS: Critical data” provides a more detailed description of each data source.
This subsection includes a very brief description of the methodological frameworks used in the World Bank Group analysis, with links to relevant seminal works and other methodological resources.
This subsection summarizes activities the World Bank Group completed under the PTIPP project. In doing so, it provides a rough guide to how someone could duplicate the PTIPP analysis to answer similar questions in another country or region. The objective is not only to summarize what was done but also to explain why and how each activity helped answer the key policy questions in this chapter of the handbook. The description therefore includes the main results of the analysis where applicable.
This subsection provides references to additional resources that are relevant to the chapter topic. These may include World Bank Group toolkits, handbooks, and diagnostics as well as important papers from the economics literature. They may be works cited in the text, examples of similar analyses carried out in other countries or contexts, or additional guidelines that could also inform similar analyses but may not have been employed in this project. The appendix “TOOLS: Additional resources” provides a more detailed description of each resource.
This subsection summarizes 3-5 main messages for decision makers. These are high-level messages explaining the context or which actions are most needed.
ixMODERNIZING TRADE IN PAKISTAN: A POLICY ROADMAP
OV
ERV
IEW

DESCRIPTION
ANALYSIS
RECOMMENDATIONS
REFORM
IMPACT
The overarching methodological framework for this approach corresponds to the theory of change depicted in Figure 1 below. There are five phases:
1. Description—The work begins by describing the country’s current performance along the four margins of trade performance: growth, diversification, quality, and persistence.
2. Analysis—The second step is to identify the determinants of the country’s trade and investment competitiveness. Starting with the description of outcomes, identify these drivers and determine which may be most amenable to policy changes. The determinants will include the context, current policies, and other external, non-policy-related determinants.
3. Recommendations—The third step is to make recommendations. In doing so, the World Bank Group considers a number of questions, including: What would it take to move the country’s trade policy forward toward tangible impact? What is feasible given the political economy? What would it take to make the infeasible, feasible?
4. Reforms—Solid, empirically-based comprehensive analysis can lead to a well-informed program of reform. The analytical work produced by the PTIPP is the foundation of the World Bank Group’s ongoing support to Pakistan’s Ministry of Commerce and other trade-related entities under the program Pakistan Goes Global (PGG). The PGG program aims at changing the growth model from consumption toward investment, innovation and trade. It starts with the premise that integration into global markets through trade and investment plays a crucial role in achieving that objective. Specifically, the program focuses on three mutually reinforcing objectives: (a) institutional strengthening for effective service delivery, (b) stable and clear rules of the game for firms to grow and succeed, and (c) time-bound support to firms to boost internationalization and innovation.
5. Impact—Well-designed reforms, stemming from a solid analysis and properly implemented, will impact trade outcomes. To understand and optimize the use of these policy levers, it is essential to carefully measure the impact of each intervention.
Figure 1. Theory of change
We are at the third step in the process—recommendations—now and moving toward the fourth—reform. The intent behind organizing the handbook the way we have is to provide—in a concise, clear and holistic way—the necessary tools to operationalize the reforms we recommend and maximize their impact. We hope you will find it useful.
x MODERNIZING TRADE IN PAKISTAN: A POLICY ROADMAPO
VER
VIE
W

PART I. TRADE COMPETITIVENESS

HOW TO: Boost trade competitiveness
1
Aleem_khan / iStock Editorial / Getty Images Plus via Getty Images
This chapter was prepared by Nadia Rocha (Senior Economist) and Gonzalo Varela (Senior Economist), drawing on technical analyses and a policy note produced in collaboration with Rafay Khan (Economist), and additional inputs from Guillermo Arenas (Economist), Sarur Chaudhary (Consultant), Michael Ferrantino (Lead Economist), Adnan Ghumman (Economist), and Miles McKenna (Analyst).

• Pakistan is not keeping pace with the needs of its population in the areas of job creation and income growth.
• The anti-export bias of Pakistan’s trade policies is a contributing factor.
• High duties on imports constrain competition, exports, and access to high-quality inputs.
• Pakistan could take a number of steps to improve its export competitiveness. Among them are: making trade a centerpiece of its national development strategy, rationalizing tariffs, continuing to implement major logistics and regional connectivity initiatives, redesigning import duty suspension and refund programs for exporters, and developing policies to boost the competitiveness of the services sector.
Main Messages
This chapter provides an overview of Pakistan’s competitiveness and how to improve it. Later chapters treat many specific aspects of competitiveness (including trade policy, services, trade agreements, and integration with GVCs) in more detail. In the broader context, it is essential to keep in mind that:
• Improving trade competitiveness is a long-term undertaking.
• The reforms that are proposed in this handbook should not be taken in isolation. The recommendations are synergistic, and the changes must be undertaken in parallel to achieve the best outcomes.
• The full realization of Pakistan’s export potential will only be achieved if complementary reforms improve firm productivity. The reforms proposed in this handbook must be accompanied by efforts to improve the domestic business environment, leading to improvements in firm productivity and capabilities.
3CHAPTER 1 – HOW TO: BOOST TRADE COMPETITIVENESS
QU
ICK
STA
RT
Modernizing Trade in Pakistan: A Policy Roadmap

• Pakistan is growing slowly. Between 2008 and 2017, South Asian countries’ GDP grew by 6.6 percent a year, on average, while Pakistan’s GDP grew at 3.7 percent (Figure 2).
• Pakistan’s export performance is weak compared to competitors. Between 2005 and 2017, South Asia’s total exports of goods and services increased by 165 percent, Thailand’s by 136 percent, and Vietnam’s by 519 percent. In comparison, Pakistan’s exports increased by only 50 percent, from USD 19.1 billion to USD 28.7 billion (Figure 3).
• Pakistan’s poor trade performance in recent years is the outcome of diminishing export competitiveness. Pakistan has lost
1.45 percent in export market share annually over the past decade, while market shares of peer economies such as Malaysia, Mexico, and Thailand have doubled. Between 2014 and 2017, Pakistan only increased its export share in 11 of its 20 biggest export markets. The country’s weak export performance compared to competitors’ points to barriers to trade.
• Foreign direct investment (FDI) is falling. Total FDI as a percentage of GDP declined from 3.7 in 2007 to 0.9 percent in 2017.
• Pakistan’s export composition is static. Pakistan’s three largest exports—textiles (mainly cotton products), leather, and rice—have accounted for over 70 percent of total exports for the last decade.
South Asia
100
120
140
160
180
200
2007 2008 2009 2010 2011 2012 2013 2014 2015 2016 2017
Perc
enta
ge
Pakistan Vietnam Thailand
Figure 2. GDP evolution compared to peers, 2007–17
Source: World Development Indicators, World Bank. Note: GDP figures are relative to each country’s GDP in 2007.
Snapshot
4 CHAPTER 1 – HOW TO: BOOST TRADE COMPETITIVENESSQ
UIC
K S
TART
Modernizing Trade in Pakistan: A Policy Roadmap

Forward Look
Figure 3. Pakistan’s exports compared to peers, 2005–2017
0
100
200
300
400
500
600
700
800
2005 2006 2007 2008 2009 2010 2011 2012 2013 2014 2015 2016 2017
USD
bill
ion
Pakistan South Asia Thailand Vietnam
Source: United Nations Conference on Trade and Development (UNCTAD).
Pakistan could boost its export competitiveness by taking a number of actions:
• Make trade a centerpiece of the national development strategy. The aim is to stimulate Pakistan’s economic performance through increased trade and investment competitiveness. Enhanced interagency coordination will be necessary to develop and implement a coherent pro-export trade policy.
• Rationalize tariffs. Pakistan could rationalize tariff policy by committing to a transparent tariff structure with low average tariffs, minimal dispersion and less discretion. Gradually reducing duties
on imports would enhance competition, encourage domestic firms to export, and increase access to inputs at world prices. It would also promote transparency, reduce complexity, reverse the anti-export bias, and deepen regional integration. Specific actions include:
» Appoint a National Council for Competitiveness, to coordinate trade and investment competitiveness reforms, and approve a tariff reform plan in line with the tariff reform proposed in the Strategic Trade Policy Framework .
» Start by reducing import tariffs on intermediate inputs and machinery in priority sectors. Targeted tariff
5CHAPTER 1 – HOW TO: BOOST TRADE COMPETITIVENESS
QU
ICK
STA
RT
Modernizing Trade in Pakistan: A Policy Roadmap

South AsiaRegion
Compared South/Southeast Asian Countries
Thailand
Vietnam
Pakistan
IBRD 44545 | JULY 2019
concessions under the China–Pakistan Free Trade Agreement have allowed Pakistan to import inputs and machinery at lower costs than available on the domestic market, increasing value added for products later exported. Pakistan could extend this effort in critical sectors. Doing so is especially important for tariffs on synthetic fibers, which apparel manufacturers need to import at world prices. Reducing import tariffs could also help Pakistan maximize the benefits of duty-free access to the EU market under the Generalized Scheme of Preferences Plus (GSP+).
» Implement a well-functioning import duty suspension and refund program for exporters.
» End temporary regulatory and other duties that impede trade.
» Commit to not add ad-hoc duties on imports.
• Continue to implement major regional connectivity initiatives. Leveraging the China–Pakistan Economic Corridor project and the China-Pakistan FTA would improve logistics performance, improve regional connectivity, and expand participation in regional value chains. With complementary trade facilitation reforms to reduce the time and cost of importing and exporting, it could install Pakistan as an economic corridor between Central Asia and South Asia.
• Redesign import duty suspension and refund programs for exporters. Well-designed programs accessible to all firms regardless of size would facilitate access to high-quality inputs at world prices.
• Develop policies to boost the competitiveness of the services sector. Doing so could increase services exports and simultaneously help manufacturers that rely on backbone services, creating a virtuous cycle of economic upgrading and value addition. A national services export promotion strategy is critical.
• Improve the investment climate and the regulatory environment. This would help attract investment in more sophisticated goods and services.
• Continue to address the supply-side challenges that affect Pakistan’s trade competitiveness. Doing so would help attract higher-quality FDI until the overall business environment improves.
6 CHAPTER 1 – HOW TO: BOOST TRADE COMPETITIVENESSQ
UIC
K S
TART
Modernizing Trade in Pakistan: A Policy Roadmap

• Where does Pakistan stand in terms of various aspects of export performance—growth patterns, diversification, the quality of its exports, and the persistence of its trading relationships?
• How can Pakistan support regional and global market integration to boost economic growth and development?
• How can Pakistan boost export competitiveness and reduce external imbalances to reduce long-term vulnerabilities?
• How can Pakistan re-energize and reinvigorate critical economic sectors to ensure that it can grow at the 6 to 7 percent annual rate required to promote socioeconomic development and generate jobs for a growing population?
• How can Pakistan improve its business environment?
Import and export statistics provided by United Nations Commodity Trade Statistics Database (UN Comtrade) or the World Bank Group’s World Integrated Trade Solutions (WITS) database
Data and rankings from the World Bank Group’s Ease of Doing Business (DB) report, especially the “Trading Across Borders” (TAB) indicators
IMF national data, such as exchange rate data and national FDI data from balance of payments reports
Data on trade control measures, including tariffs, para-tariffs, non-tariff measures, etc., provided in the Trade Analysis Information System (TRAINS) database from the United Nations Conference on Trade and Development (UNCTAD)
Bilateral FDI statistics from UNCTADAdditional FDI data and estimates from sources such as fDi Markets from the Financial Times
Key Questions
Critical data
7CHAPTER 1 – HOW TO: BOOST TRADE COMPETITIVENESS
Modernizing Trade in Pakistan: A Policy Roadmap
7
IN D
EPTH

Firm-level data on importing and exporting performance, productivity, etc., which can be obtained from customs or national statistical agencies
World Development Indicators (WDI) provided by the World Bank Group
Data and rankings from the World Bank Group’s Logistics Performance Index (LPI)
Calculations from the World Bank Group’s Export Value Added Database (EVAD)
Competitiveness indicators from Global Competitiveness Report from the World Economic Forum (WEF)
TRADE COMPETITIVENESS DIAGNOSTIC TOOLKIT
Most of the analysis in this chapter is based on the Trade Competitiveness Diagnostic analytical framework developed by the World Bank (2012) as described in Box 1 and illustrated in Figure 4 below. (See the “Additional resources” section for bibliographic details.)
The Trade Competitiveness Diagnostic (TCD) toolkit provides a framework, guidelines, and practical tools needed to analyze trade competitiveness. The toolkit can be used to assess the competitiveness of a country’s overall basket of exports or specific traded sectors. It helps identify not only the main constraints on trade competitiveness but also policy responses to overcome them.
José Guilherme Reis • Thomas Farole
Trade Competitiveness Diagnostic Toolkit
Publ
ic D
iscl
osur
e Au
thor
ized
Publ
ic D
iscl
osur
e Au
thor
ized
Publ
ic D
iscl
osur
e Au
thor
ized
Publ
ic D
iscl
osur
e Au
thor
ized
Methodology
Box 1. The Trade Competitiveness Diagnostic Toolkit
See “TOOLS: Critical data” starting on page 127 for more information about each of these critical data sources.
8 CHAPTER 1 – HOW TO: BOOST TRADE COMPETITIVENESS
Modernizing Trade in Pakistan: A Policy Roadmap
8IN
DEP
TH
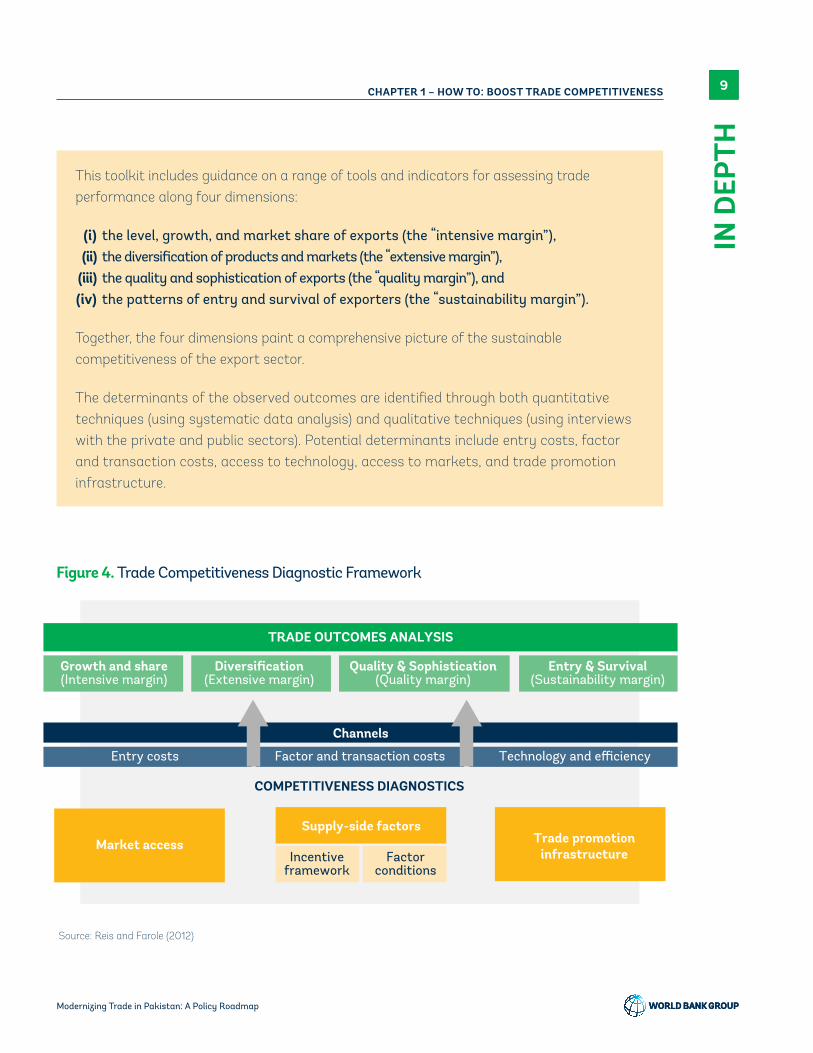
This toolkit includes guidance on a range of tools and indicators for assessing trade performance along four dimensions:
(i) the level, growth, and market share of exports (the “intensive margin”), (ii) the diversification of products and markets (the “extensive margin”), (iii) the quality and sophistication of exports (the “quality margin”), and (iv) the patterns of entry and survival of exporters (the “sustainability margin”).
Together, the four dimensions paint a comprehensive picture of the sustainable competitiveness of the export sector.
The determinants of the observed outcomes are identified through both quantitative techniques (using systematic data analysis) and qualitative techniques (using interviews with the private and public sectors). Potential determinants include entry costs, factor and transaction costs, access to technology, access to markets, and trade promotion infrastructure.
TRADE OUTCOMES ANALYSIS
COMPETITIVENESS DIAGNOSTICS
Growth and share(Intensive margin)
Diversification(Extensive margin)
Quality & Sophistication(Quality margin)
Channels
Entry costs Technology and efficiency
Trade promotioninfrastructure
Supply-side factors
Incentiveframework
Factor conditions
Market access
Factor and transaction costs
Entry & Survival(Sustainability margin)
Figure 4. Trade Competitiveness Diagnostic Framework
Source: Reis and Farole (2012)
9CHAPTER 1 – HOW TO: BOOST TRADE COMPETITIVENESS
Modernizing Trade in Pakistan: A Policy Roadmap
9
IN D
EPTH

GRAVITY MODELS
Some observations in this chapter derive from gravity analysis. Gravity analysis uses econometric techniques to evaluate thousands of individual observations on trade and investment between countries over time against the gravitational ‘mass’ of explanatory variables that describe the characteristics of bilateral trade and investment partners. Two familiar explanatory variables are the joint real GDP levels of partners and the distance between them. Numerous other explanatory variables are frequently specified, including geographic, political, and institutional factors that augment or diminish the gravitational forces shaping commerce between countries. Recent gravity models incorporate indicators for bilateral and regional free trade agreements (FTAs), enabling the models to assess the contribution of FTAs to international commerce. This is a partial equilibrium approach, which does not account for the effects of infrastructure on the economy but allows including all connected economies and highly disaggregated sectors in the analysis. The results reported here are from Kathuria (2018).
Actions
ANALYSIS
The World Bank Group began by evaluating Pakistan’s competitiveness along five dimensions: (1) growth, (2) diversification of exports, (3) quality, and (4) survival (persistence) of trading relationships, and (5) participation in global value chains (GVCs). This evaluation yielded these observations:
Growth
• Pakistan’s export performance has been worsening. FY2017 exports of goods and services were USD 28 billion, well below the USD 31.5 billion achieved in FY2011. Imports increased from USD 37.6 billion in 2007 to USD 62.6 billion in 2017 (approximately 67 percent), while exports increased by only 31 percent. The growth differential between
imports and exports over the past decade has widened the trade deficit to approximately USD 25 billion. In 2017, the deficit was the highest it has been since 1976. It is even higher than in 2008, the year of the global financial crisis. Also, Pakistan has been losing export competitiveness in world markets for more than a decade. While China’s share in world trade has doubled since 2005, and Vietnam’s has more than tripled, Pakistan’s share dropped from 0.15 percent in 2005 to 0.12 percent in 2018.
Diversification of exports
• Pakistan’s export bundle is concentrated in terms of both products and markets, leaving the country exposed to product- and partner-specific shocks. A single product category,
10 CHAPTER 1 – HOW TO: BOOST TRADE COMPETITIVENESS
Modernizing Trade in Pakistan: A Policy Roadmap
10IN
DEP
TH

textiles and clothing, has accounted for approximately 55 percent of Pakistan’s export basket over the past decade. While Pakistan has a revealed comparative advantage in the export of textiles and clothing, it has not leveraged this advantage. The Market Penetration Index, which measures the extent to which a country’s exports reach established markets, is low for Pakistan, with a value of 14.68 in 2017. By comparison, India had a Market Penetration Index of 27.8 in 2017. Pakistan’s export market base and penetration, much like its product base, have remained stagnant over the past decade. Six markets have historically accounted for over 60 percent of Pakistan’s exports. This export market base has remained concentrated despite opportunities to diversify and expand exports.
Quality
• Pakistan’s exports reflect an overall lack of sophistication and dynamism. The technological content of Pakistan’s exports is low; high-tech exports constituted less than 1 percent of all exports during 2010–17, while low-tech exports constituted over 60 percent of exports during the same period. The shares of low- and high-tech exports in Pakistan’s total exports have mostly remained unchanged over the past 25 years. Comparable countries (including China, India, and Malaysia), have had much more success in not only diversifying their export baskets, but diversifying them toward high-tech, high-value-added products. Lack of sophistication is evident in Pakistan’s dominant textiles sector, where production is primarily cotton-based, despite the global shift toward apparel made of synthetic material. Cotton constitutes 84 percent of Pakistan’s apparel exports, whereas cotton apparel accounted for only 46 percent of global apparel exports.
Survival (persistence) of trading relationships
• Exporters in Pakistan have had difficulty retaining export relationships. Globally, the persistence of trading relationships is a recognized sign of economic maturity and dynamism. However, Pakistan has struggled in this respect. Between 2010 and 2015, exporters in Pakistan maintained only 34.8 percent of export relationships. (Of 419 new relationships established in 2010, only 166 remained in 2015.) India and Vietnam maintained 45.7 and 50.3 percent of their relationships, respectively, over the same period.
Integration with global value chains (GVCs)
• The emergence of GVCs as a main paradigm of global business has shed new light on the important role of services in economic growth and trade competitiveness. Pakistan has been slow to tap into GVCs to boost its exports and is not as integrated as its peers into GVCs as a buyer (that is, a backward participant) of foreign inputs. Peer countries such as Malaysia and Vietnam use around 40 percent of foreign value in their gross exports—an indicator of how well integrated they are with international production networks—while Pakistan uses only 7.6 percent.
DIAGNOSIS
Underwhelming trade and investment performance may have structural underpinnings in five determinants: (1) relative prices, (2) trade policy, (3) business environment, (4) services trade policy, and (5) trade facilitation, logistics, and infrastructure. In Pakistan:
11CHAPTER 1 – HOW TO: BOOST TRADE COMPETITIVENESS
Modernizing Trade in Pakistan: A Policy Roadmap
11
IN D
EPTH
Relative prices
• International experience shows that real currency depreciations boost export competitiveness. The rupee has been depreciating nominally since September 2018. Estimates suggest that, between 1998 and 2016, exports contracted by 5.7 percent, on average, for every 10 percent of real appreciation of the rupee.
• International experience also suggests that a key determinant for success of export-led growth strategies has been preserving competitive exchange rates and a stable macroeconomic environment.
Trade policy
• A protectionist trade policy manifest in high tariffs has contributed to an anti-export bias, throttling growth in Pakistan.
• Textiles is a key export sector in which high tariffs are coupled with imperfectly functioning import duty suspension and refund schemes for exporters that source inputs from abroad (Figure 5). Most synthetic fibers are subject to import duties of 10 to 25 percent, and it can take two to four months to import them. Consequently, the production of low-value, cotton-based garments dominates the Pakistani apparel industry; Pakistan is foregoing the opportunity to export garments made of synthetic fibers, for which global demand is booming. (World production of synthetic fibers was estimated at 60 million tons in 2017, more than twice the production of cotton. It is expected to be responsible for up to 98 percent of future production increases, which would drive production of synthetic fibers up to 75 million tons and their share of fiber production from 60 percent in 2017 to 65
percent in 2025. See “HOW TO: Upgrade in the textiles and apparel global value chain” starting on page 53 for more information about the textiles and apparel value chain in Pakistan.)
• High protection also decreases firms’ incentives to export in other sectors, such as the auto sector (including motorcycles), which could play an important role in enhancing trade. Pakistan is one of the world’s largest manufacturers of motorcycles by production volume—production has increased tenfold since 2001, reaching 2 million units in 2014. Despite a thriving auto sector, however, key players choose not to reach out to export markets, where competition is tough. They focus instead on domestic markets, where high import tariffs mean high protection against efficient international auto makers.
• Restrictions on regional trade make it difficult for Pakistan and other South Asian countries to use the region as a platform for export growth and regional integration. Gravity models show that total goods trade within South Asia could be worth USD 67 billion rather than the actual trade of only USD 23 billion. Formal trade between India and Pakistan could, for instance, be 15-fold more than current levels (Kathuria 2018).
• Pakistan has yet to take full advantage of its proximity to China, a trade powerhouse with which it has an FTA.
Business environment
• Business environment constraints continue to impede trade and competitiveness in Pakistan. Pakistan ranked 147th of 190 economies in Doing Business 2018, 71 places lower than in 2008. Similarly, Pakistan’s ranking on the World
12 CHAPTER 1 – HOW TO: BOOST TRADE COMPETITIVENESS
Modernizing Trade in Pakistan: A Policy Roadmap
12IN
DEP
TH

Economic Forum’s Global Competitiveness Index dropped from 92nd in 2008 to 115th in 2018.
• The increasing cost of doing business in Pakistan—as measured along the three core dimensions of cost, time, and steps to start a business—highlights the growing competitive disadvantage of Pakistani businesses. It takes 17.5 days to start a business in Pakistan, compared to the South Asian average of 15.4 days and the OECD country average of 8.5 days.
• Partly because of Pakistan’s inadequate business environment, private investment, accounting for two-thirds of total investment in Pakistan, is low (around 10 percent of GDP).
• Pakistan’s security environment drives up the risk premium and deters risk-averse investors, contributing to Pakistan’s inability to attract meaningful, long-term, and stable FDI. FDI to Pakistan is volatile (Figure 6). FDI inflows to Pakistan increased between 2004 and 2007,
posting a record of 5.6 USD billion in 2006. Then, FDI inflows registered a marked decrease on the back of increased political and security risks and an unstable exchange rate. Average annual FDI accrual decreased between 2011 and 2016. Pakistan drew USD 2.8 billion of FDI in 2017, equivalent to 0.91 percent of GDP. This level of FDI is comparable to Bangladesh at 0.88 but considerably lower than Vietnam at 6.31 percent in the same year. A substantial portion of FDI is in energy projects that receive price guarantees, constituting a contingent liability for the economy. Pakistan’s low and variable FDI is concerning because FDI is becoming increasingly critical to the economies of developing countries, in part due to a major expansion in global value chains (GVCs), whereby lead firms outsource parts of their production and services activities across complex international networks. FDI delivers several important direct contributions in terms of investment, employment, and foreign exchange. Moreover, its spillover effects—
Figure 5. Redesigning import and export incentives could help Pakistan upgrade in the textiles and apparel industry.
Source: Getty Images
13CHAPTER 1 – HOW TO: BOOST TRADE COMPETITIVENESS
Modernizing Trade in Pakistan: A Policy Roadmap
13
IN D
EPTH

productivity gains resulting from the diffusion of knowledge and technology from foreign investors to local firms and workers—are its most valuable contributions to long-term growth and development.
Services trade policy
• Openness to trade in services is strongly associated with openness to FDI and matters crucially for productivity growth. Yet Pakistan exports and imports services to a much lower degree in per capita terms than most peers with equal levels of trade restrictions.
• Regulatory restrictions on services trade prevail in crucial areas for trade integration—insurance and financial services, professional services, and transport services. See the chapter “HOW TO: Scale up knowledge-intensive exports” starting on page 96 for more information on trade in services.
Trade facilitation, logistics and infrastructure
• In principle, trade facilitation is simple: implement measures to reduce the cost of trading across borders by improving infrastructure, institutions, services, policies, procedures, and market-oriented regulatory systems. The returns can be huge, even with modest resources and limited capacity. Moreover, everyone can share in the dividends of trade facilitation.
• Despite recent improvements in logistics, poor trade facilitation and infrastructure continue to inhibit export competitiveness and trade growth in Pakistan. For example, the typical container dwell time at ports in Karachi (95 percent of Pakistan’s international trade goes through one of the two ports in Karachi) is seven days, three times longer than that of developed countries and East Asia. As of 2018, border and documentary compliance to import
Net
FD
I Infl
ows
(BoP
, Cur
rent
USD
bill
ion)
1990 1995 2000 2005 2010 2015
1
2
3
4
5
Figure 6. Pakistan: FDI Inflows (USD billion; 1990-2017)
Source: WDI
14 CHAPTER 1 – HOW TO: BOOST TRADE COMPETITIVENESS
Modernizing Trade in Pakistan: A Policy Roadmap
14IN
DEP
TH

into Pakistan takes 263 hours, compared to 11.9 hours in OECD countries.
• However, reforms carried out by the government in logistics, customs, timelines, infrastructure, and tracking and tracing have not yet resulted in the necessary improvements. Pakistan’s ranking on the Logistics Performance Index (LPI) fell from 110th in 2010 to 122nd in 2018. Pakistan’s poor logistics performance continues to be a constraint for trade, and in particular for integration into GVCs.
RECOMMENDATIONS
Recommendations to Pakistan include:
Create a National Council for Competitiveness
A National Council for Competitiveness chaired by the Prime Minister would reduce institutional fragmentation around trade and investment policymaking. A Secretariat would have a mandate to design a roadmap for competitiveness reforms, ensure its implementation, promote federal and provincial interagency coordination, and collect feedback from the private sector.
Reduce tariffs and eliminate para-tariffs
An argument against streamlining the import regime is the dependence of fiscal revenue on customs duties. However, Pakistan’s fiscal revenue is much less dependent on customs duties than in the past; in 2017, customs duties amounted to 10.4 percent of total revenue, down from 17.8 percent in 2005. In Pakistan, the recommended steps are to:
• form an inter-ministerial task force for tariff reform under the leadership of the Minister
of Commerce and the guidance of a National Council of Competitiveness,
• prepare a roadmap for tariff reform,
• commit to a simple and transparent tariff structure with low average tariffs and minimum dispersion, and
• tackle para-tariffs (such as regulatory and additional duties), not just statutory regulatory orders (SROs).
Enhance the role of services in trade performance
To increase competitiveness, move up the value chain in the manufacturing and agriculture sectors, boost attractiveness to investors, and promote services exports, Pakistan could take several actions:
• Conduct a diagnostic to: » assess the restrictiveness of domestic
regulations and propose critical reforms in key backbone services and
» assess the level of competition in key services sectors.
• Engage in specific actions to improve services exports and sophistication. Efforts could include: » developing a legal framework for
e-commerce development, » establishing services knowledge platforms
(SKPs), and » promoting religious and ancestral tourism
services.
• Modernize trade policy and the services regulatory framework, including in the areas of: » cross-border trade in services, » strategic coordination between the Ministry
of Trade and other services regulatory entities, and
» data protection and consumer protection.
15CHAPTER 1 – HOW TO: BOOST TRADE COMPETITIVENESS
Modernizing Trade in Pakistan: A Policy Roadmap
15
IN D
EPTH

• Define a national services export promotion strategy. Formulating this strategy would involve: » identifying the sectors where opportunities
exist for Pakistan, based on high-quality statistics and services trade data,
» formulating a strategy for negotiating with major partners,
» identifying opportunities to move up value chains and increase the benefits of participation in GVCs, and
» improving the coordination, consistency, and coherence of trade policy.
Continue addressing supply-side challenges
Pakistan needs to improve its overall business environment to attract high-quality FDI. Actions include:
• creating and enhancing existing high-priority economic zones, using public-private partnerships where possible, to allow investors to access basic industrial infrastructure and inputs at world prices and operate in a secure environment while the rest of the economy is catching up;
• addressing problems related to energy accessibility and costs and access to finance, enhancing skills, including managerial skills, and enhancing the quality of business regulations; and
• consolidating all business regulations and bringing them into the public domain through an accessible platform, reviewing the regulations, and assessing their impact on business.
Enhance macroeconomic stability
Macroeconomic stability is fundamental to ensure that policies aiming at improving Pakistan’s competitiveness are effective. Allowing greater
exchange rate flexibility by moving to a market-based exchange rate would improve Pakistan’s macroeconomic stability. Allowing the currency to depreciate could boost firms’ export competitiveness, helping to close the external imbalance at the macro level. Such a depreciation will most benefit firms with higher shares of domestic value added. Moving to a market-based exchange rate would enable Pakistan to reduce the external imbalance in the short term. Eventually, it would give Pakistan a buffer to better weather external shocks.
Prepare for deeper integration into regional and global markets
To leverage its proximity to both regional and global trade leaders, Pakistan needs to improve integration with neighboring countries and regions. This will require several things:
• Making the Pakistan-Afghanistan Joint Economic Commission (JEC) effective.
• Revising and fully implementing the Afghanistan–Pakistan Transit Trade Agreement (APTTA) in light of recent international and regional developments.
• The implementation of the second phase of the China-Pakistan Free Trade Agreement is an opportunity to strengthen Pakistan’s competitiveness, diversify its economy, foster trade, and exploit the opportunities available in the world economy.
• Fully normalizing trade relations with India to facilitate trade integration. The recent renegotiation that adds preferences for Pakistan in 313 new products is a step in the right direction. Integration is necessary to benefit from India’s fast growth and promote complementarities, including value chain activities and investment potential. Integration
16 CHAPTER 1 – HOW TO: BOOST TRADE COMPETITIVENESS
Modernizing Trade in Pakistan: A Policy Roadmap
16IN
DEP
TH

entails not only ensuring market access but also building upon signed agreements regarding mutual recognition and visas; and improving infrastructure, institutions, services, policies, procedures, and market-oriented regulatory systems. In the medium to long term, to better benefit from GVC participation, Pakistan should aim at signing agreements with greater depth.
Importance of complementary reforms
Improving a country’s trade and investment competitiveness is a long-term undertaking. The full realization of export potential can only be
achieved if trade policy reforms are implemented along with complementary reforms aimed at improving firms’ productivity and capabilities, which makes the coordinating role of the proposed National Council of Competitiveness paramount. The reforms proposed should not be taken in isolation. Rather, they require complementary efforts to improve the domestic business environment, including privatizing inefficient state-owned enterprises, removing energy bottlenecks, and simplifying tax laws. Policies should also focus on reforming institutions, developing financial markets, increasing technological readiness and market size, and facilitating business sophistication to encourage entrepreneurial activity and increased investment in the country.
Additional resources
De, Prabir, Selim Raihan, and Ejaz Ghani. 2013. “What Does MFN Trade Mean for India and Pakistan? Can MFN Be a Panacea?” Policy Research Working Paper No. 6483. Washington, DC: World Bank.
Farole, Thomas, and Deborah Winkler. 2014. Making Foreign Direct Investment Work for Sub-Saharan Africa: Local Spillovers and Competitiveness in Global Value Chains. Directions in Development—Trade. Washington, DC: World Bank.
Kathuria, Sanjay. 2018. A Glass Half Full : The Promise of Regional Trade in South Asia. South Asia Development Forum. Washington, DC: World Bank.
Lopez-Acevedo, Gladys, Denis Medvedev, and Vincent Palmade. 2016. South Asia’s Turn: Policies to Boost Competitiveness and Create the Next Export Powerhouse. Washington, DC: World Bank.
Lopez-Acevedo, Gladys, and Raymond Robertson, eds. 2016. Stitches to Riches? Apparel Employment, Trade, and Economic Development in South Asia. Washington, DC: World Bank.
Portugal, Alberto, José-Daniel Reyes, and Gonzalo Varela. 2015. “Uruguay: Trade Competitiveness Diagnostic.” World Bank, Washington, DC.
Reis, Jose Guilherme and Thomas Farole. 2012. Trade Competitiveness Diagnostic Toolkit. Washington, DC: World Bank.
Taglioni, Daria, and Deborah Winkler. 2016. Making Global Value Chains Work for Development. Washington, DC: World Bank.
World Bank. 2015. How to Sustain Export Dynamism by Reducing Duality in the Dominican Republic. Washington, DC: World Bank.
See “TOOLS: Additional resources” starting on page 135 for more information about each of these publications and toolkits.
17CHAPTER 1 – HOW TO: BOOST TRADE COMPETITIVENESS
Modernizing Trade in Pakistan: A Policy Roadmap
17
IN D
EPTH

PART II. TRADE IN GOODS

HOW TO: Reduce the time and cost to trade2
This chapter was prepared by Miles McKenna (Analyst), drawing on technical analyses, notes, and additional inputs from Cristina Constantinescu (Economist), Alen Mulabdic (Analyst), Michele Ruta (Lead Economist), Nadia Rocha (Senior Economist), Reshma Aftab (Private Sector Specialist), and Satya Prasad Sahu (Senior Trade Facilitation Specialist).
Getty Images

• To boost competitiveness and spur growth, Pakistan needs to minimize the time, cost, and documentation required to process imports and exports at its borders.
• The full implementation of a National Single Window (NSW), together with streamlining trade procedures, would help Pakistan reduce transaction costs and improve connectivity between domestic and foreign markets.
• Without improving the “soft” infrastructure of trade facilitation frameworks, Pakistan will not realize the full benefits of the China–Pakistan Economic Corridor (a component of the Belt and Road Initiative).
Main Messages
• Pakistan will benefit from more efficient trade facilitation policies, stronger logistics services and infrastructure and increased efforts to reduce trade costs.
Figure 7. Inefficient trade in South Asia
Source: World Bank
T R A D E I N S O U T H A S I AA DISCONNECTED REGION
WHY?
Trading within South Asia costs more than trading outside the region – even thousands of miles away.
20% It’s 20% cheaper for India to trade with Brazil than with its neighbor Pakistan.
Circuitous routes to markets
Congested border
crossings
Inadequate implementation of trade agreements
Lack of transportantion Infrastructure
IBRD 44546 | JULY 2019
20 CHAPTER 2 – HOW TO: REDUCE THE TIME AND COST TO TRADEQ
UIC
K S
TART
Modernizing Trade in Pakistan: A Policy Roadmap

• Investments in trade facilitation have not yet paid off. The Government of Pakistan has been investing in trade facilitation reforms, improving logistics policies, and enhancing infrastructure, but these efforts have not yet resulted in substantial improvements in international performance benchmarks. Pakistan’s ranking on the LPI slid from 110th in 2010 to 122nd in 2018.
• Imports and exports are slow. Pakistan performs better at facilitating trade than Bangladesh but worse than India, Sri Lanka, and East Asian countries such as Malaysia, Thailand, and Vietnam (Figure 8). Pakistan reduced the time required to comply with border regulations for imports from 141 hours in 2015 to 120 hours in 2018. The reduction in the time required to comply with regulation for export was marginal from 78.9 hours to 75 hours between 2015 and 2018.
• Pakistan is making progress on implementing its commitments under the WTO Trade Facilitation Agreement (TFA). The WTO TFA requires members to align trade procedures with global good practices (Figure 9). Once fully implemented by all signatories, the agreement is expected to reduce total trade costs by over 14 percent for low-income countries and over 13 percent for upper-middle-income countries.
Figure 8. Time to import and export, 2018
Bangladesh
Pakistan
India
Sri Lanka
Vietnam
Thailand
Malaysia
South Asia
12075
0 100
Border compliance (hours)
Time to import Time to export
200 300
Snapshot
Figure 9. Pakistan’s progress toward alignment with the WTO TFA.
Rate of implementation commitments
Rate of implementation commitments to date across categories
Rate of implementation commitments by June 2023 without capacity building support
Rate of implementation commitments from June 2020 to June 2022 upon receipt of capacity building support
86.1%
2.5%
11.3%
Source: https://www.tfadatabase.org/members/pakistan
21CHAPTER 2 – HOW TO: REDUCE THE TIME AND COST TO TRADE
QU
ICK
STA
RT
Modernizing Trade in Pakistan: A Policy Roadmap
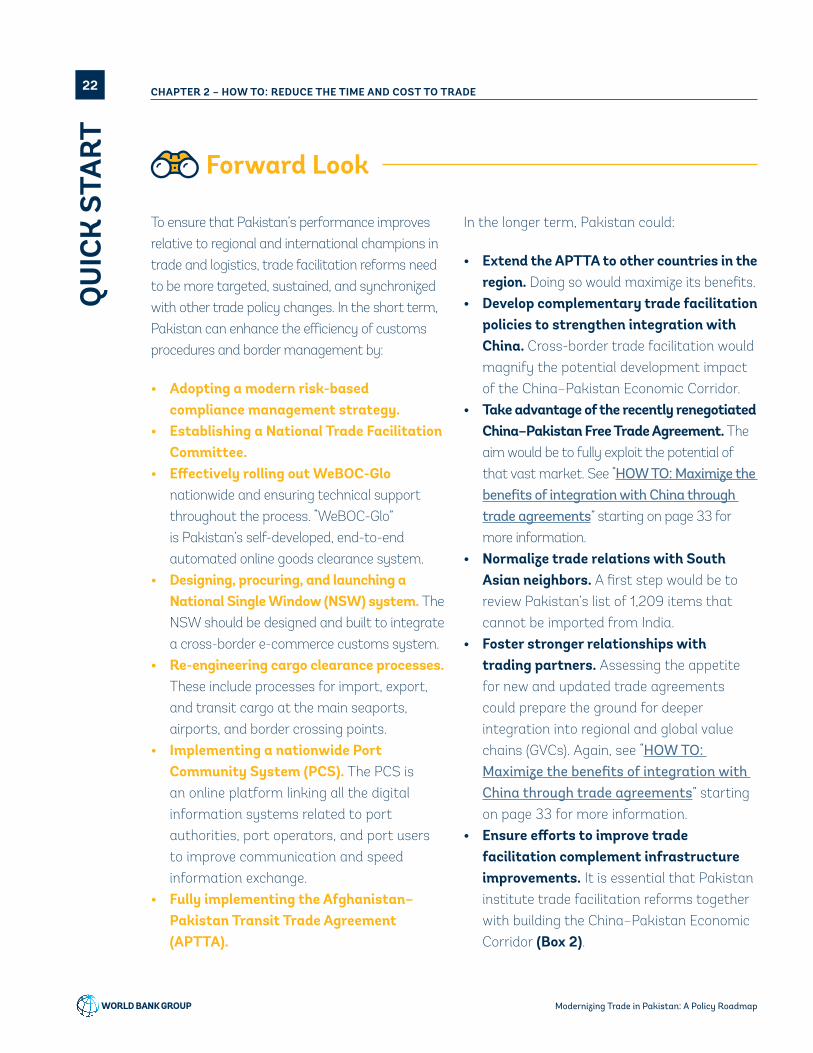
To ensure that Pakistan’s performance improves relative to regional and international champions in trade and logistics, trade facilitation reforms need to be more targeted, sustained, and synchronized with other trade policy changes. In the short term, Pakistan can enhance the efficiency of customs procedures and border management by:
• Adopting a modern risk-based compliance management strategy.
• Establishing a National Trade Facilitation Committee.
• Effectively rolling out WeBOC-Glo nationwide and ensuring technical support throughout the process. “WeBOC-Glo” is Pakistan’s self-developed, end-to-end automated online goods clearance system.
• Designing, procuring, and launching a National Single Window (NSW) system. The NSW should be designed and built to integrate a cross-border e-commerce customs system.
• Re-engineering cargo clearance processes. These include processes for import, export, and transit cargo at the main seaports, airports, and border crossing points.
• Implementing a nationwide Port Community System (PCS). The PCS is an online platform linking all the digital information systems related to port authorities, port operators, and port users to improve communication and speed information exchange.
• Fully implementing the Afghanistan–Pakistan Transit Trade Agreement (APTTA).
In the longer term, Pakistan could:
• Extend the APTTA to other countries in the region. Doing so would maximize its benefits.
• Develop complementary trade facilitation policies to strengthen integration with China. Cross-border trade facilitation would magnify the potential development impact of the China–Pakistan Economic Corridor.
• Take advantage of the recently renegotiated China–Pakistan Free Trade Agreement. The aim would be to fully exploit the potential of that vast market. See “HOW TO: Maximize the benefits of integration with China through trade agreements” starting on page 33 for more information.
• Normalize trade relations with South Asian neighbors. A first step would be to review Pakistan’s list of 1,209 items that cannot be imported from India.
• Foster stronger relationships with trading partners. Assessing the appetite for new and updated trade agreements could prepare the ground for deeper integration into regional and global value chains (GVCs). Again, see “HOW TO: Maximize the benefits of integration with China through trade agreements” starting on page 33 for more information.
• Ensure efforts to improve trade facilitation complement infrastructure improvements. It is essential that Pakistan institute trade facilitation reforms together with building the China–Pakistan Economic Corridor (Box 2).
Forward Look
22 CHAPTER 2 – HOW TO: REDUCE THE TIME AND COST TO TRADEQ
UIC
K S
TART
Modernizing Trade in Pakistan: A Policy Roadmap

Box 2. The China–Pakistan Economic Corridor and the Complementarity of Trade Facilitation and Infrastructure Improvements
The Belt and Road Initiative
The Belt and Road Initiative is an ambitious effort to improve regional cooperation and connectivity on a trans-continental scale. The initiative aims to strengthen infrastructure, trade, and investment between China and some 65 other countries that account collectively for over 30 percent of global GDP, 62 percent of population, and 75 percent of known energy reserves. The Belt and Road Initiative consists primarily of the Silk Road Economic Belt, linking China to Central and South Asia and onward to Europe, and the New Maritime Silk Road, linking China to the nations of Southeast Asia, the Gulf Countries, North Africa, and on to Europe. Six other economic corridors have been identified to link other countries to the Belt and Road.
The China–Pakistan Economic Corridor, one of the Belt and Road Initiative’s six overland economic corridors, aims at increasing the connectivity of Pakistan with China and other Belt and Road Initiative economies, as well as connectivity within Pakistan (Figure 11). As part of the China–Pakistan Economic Corridor, Pakistan is expected to develop 2,813
kilometers of new rail and to modernize around 3,098 kilometers of the existing rail network. In addition to an improved rail network, the expansion of the Gwadar deep sea port is expected to improve maritime connectivity.
As of December 2018, fewer than half of the Belt and Road Initiative transportation projects in Pakistan had moved beyond the proposal or planning stage. Based on computable general equilibrium (CGE), structural general equilibrium (SGE), and gravity models (see the section on Methodology starting on page 8), the World Bank Group estimates that completing the infrastructure projects under the Belt and Road Initiative could reduce Pakistan’s export weighted trade costs by 3.75 percent, increase Pakistan’s exports of goods by 4.2 percent, increase FDI flows to Pakistan by 6.3 percent, and (if complemented by reduced border delays and reduced tariffs) increase Pakistan’s combined exports of goods and services by as much as 20.7 percent, increase real income by as much as 10.9 percent, and increase GDP by as much as 13 percent. These estimates are based on the entire Belt and Road Initiative, not just the impact of infrastructure improvements of the China–Pakistan Economic Corridor.
Reduce Pakistan’s export weighted trade costs by
3.75%
Increase Pakistan’s exports of goods by
4.2%
Increase FDI flows to Pakistan by
6.3%
Increase Pakistan’s combined exports of goods and services by
20.7%
Increase real income by
10.9%
IncreaseGDP by
13%
23CHAPTER 2 – HOW TO: REDUCE THE TIME AND COST TO TRADE
QU
ICK
STA
RT
Modernizing Trade in Pakistan: A Policy Roadmap

North routeCentral routeEastern routeWestern route
China-PakistanEconomic Corridor Map
PAKISTAN
CHINA
Islamabad
Islamabad
North routeCentral routeEastern routeWestern route
China-PakistanEconomic Corridor Map
CHINA
PAKISTAN
IBRD 44547 | JULY 2019
Figure 10. The China–Pakistan Economic Corridor
Source: Government of Pakistan
• How can government policy help reduce time and cost to trade?
• How can improving trade facilitation help a country such as Pakistan meet strategic development objectives?
• How can a country measure trade facilitation and benchmark itself against comparators and aspirational peers?
• What reforms do Pakistan—or similar countries—need to implement to align with the WTO TFA?
• How can Pakistan maximize the benefits from improvements in infrastructure through the Belt and Road Initiative?
Key Questions
24 CHAPTER 2 – HOW TO: REDUCE THE TIME AND COST TO TRADEQ
UIC
K S
TART
Modernizing Trade in Pakistan: A Policy Roadmap

Critical data
Data and rankings from the World Bank Group's Ease of Doing Business (DB) report, especially the “Trading Across Borders” (TAB) indicators
Data and rankings from the World Bank Group's Logistics Performance Index (LPI)
Import and export statistics provided by United Nations Commodity Trade Statistics Database (UN Comtrade) or the World Bank Group's World Integrated Trade Solutions (WITS) database
Firm-level surveys on trade facilitation-related issues, as found in the World Bank Group's Enterprise Surveys
Data on formal and informal fees collected at border crossings and from customs authorities, other regulatory agencies, surveys of traders, etc.
Data on the implementation of WTO TFA commitments, as provided by the Trade Facilitation Agreement Database
Bilateral trade cost data from UN ESCAP-World Bank Trade Cost Database
See “TOOLS: Critical data” starting on page 127 for more information about each of these critical data sources.
Methodology
DOING BUSINESS
The DB Trading Across Borders (TAB) indicator measures the time and cost (excluding tariffs) associated with the overall process of exporting or importing a shipment of goods. The data on trading across borders are gathered through a questionnaire administered to local freight forwarders,
customs brokers, port authorities and traders. The ranking of economies is determined by sorting the simple average of a country’s scores for the time and cost for documentary compliance and border compliance to both export and import. A full description of the methodology and the assumptions used to make data comparable across economies can be found online: here.
25CHAPTER 2 – HOW TO: REDUCE THE TIME AND COST TO TRADE
Modernizing Trade in Pakistan: A Policy Roadmap
25
IN D
EPTH
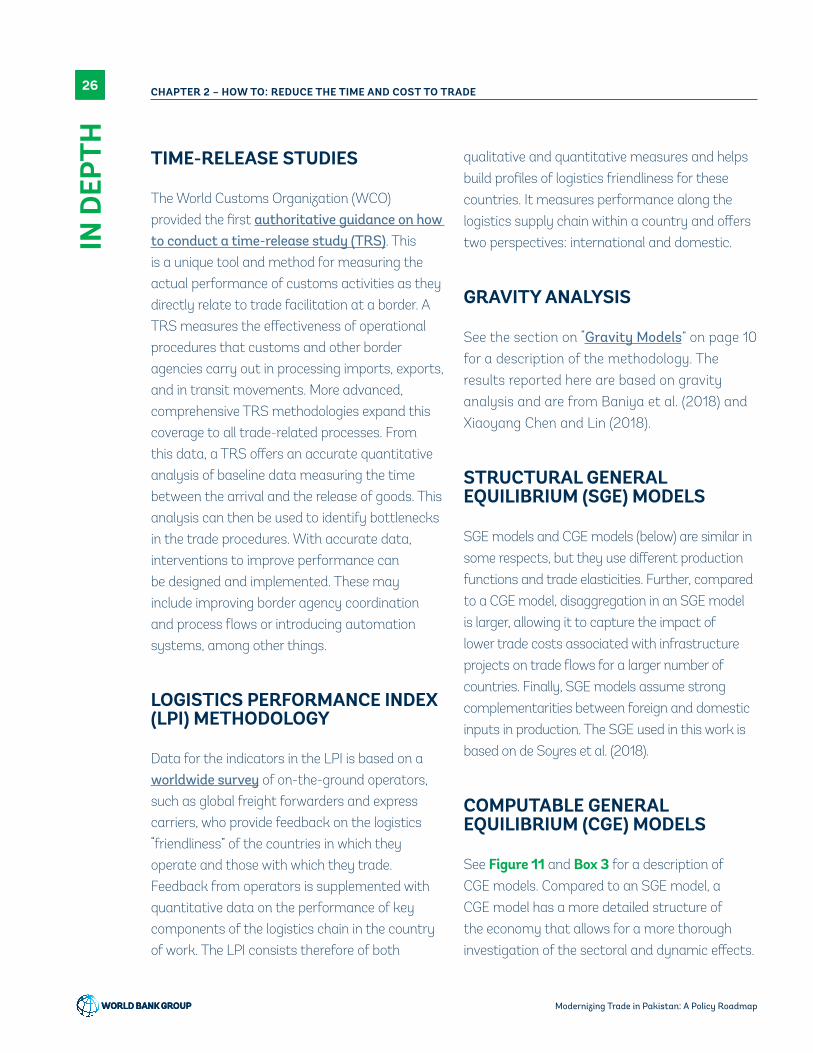
TIME-RELEASE STUDIES
The World Customs Organization (WCO) provided the first authoritative guidance on how to conduct a time-release study (TRS). This is a unique tool and method for measuring the actual performance of customs activities as they directly relate to trade facilitation at a border. A TRS measures the effectiveness of operational procedures that customs and other border agencies carry out in processing imports, exports, and in transit movements. More advanced, comprehensive TRS methodologies expand this coverage to all trade-related processes. From this data, a TRS offers an accurate quantitative analysis of baseline data measuring the time between the arrival and the release of goods. This analysis can then be used to identify bottlenecks in the trade procedures. With accurate data, interventions to improve performance can be designed and implemented. These may include improving border agency coordination and process flows or introducing automation systems, among other things.
LOGISTICS PERFORMANCE INDEX (LPI) METHODOLOGY
Data for the indicators in the LPI is based on a worldwide survey of on-the-ground operators, such as global freight forwarders and express carriers, who provide feedback on the logistics “friendliness” of the countries in which they operate and those with which they trade. Feedback from operators is supplemented with quantitative data on the performance of key components of the logistics chain in the country of work. The LPI consists therefore of both
qualitative and quantitative measures and helps build profiles of logistics friendliness for these countries. It measures performance along the logistics supply chain within a country and offers two perspectives: international and domestic.
GRAVITY ANALYSIS
See the section on “Gravity Models” on page 10 for a description of the methodology. The results reported here are based on gravity analysis and are from Baniya et al. (2018) and Xiaoyang Chen and Lin (2018).
STRUCTURAL GENERAL EQUILIBRIUM (SGE) MODELS
SGE models and CGE models (below) are similar in some respects, but they use different production functions and trade elasticities. Further, compared to a CGE model, disaggregation in an SGE model is larger, allowing it to capture the impact of lower trade costs associated with infrastructure projects on trade flows for a larger number of countries. Finally, SGE models assume strong complementarities between foreign and domestic inputs in production. The SGE used in this work is based on de Soyres et al. (2018).
COMPUTABLE GENERAL EQUILIBRIUM (CGE) MODELS
See Figure 11 and Box 3 for a description of CGE models. Compared to an SGE model, a CGE model has a more detailed structure of the economy that allows for a more thorough investigation of the sectoral and dynamic effects.
26 CHAPTER 2 – HOW TO: REDUCE THE TIME AND COST TO TRADE
Modernizing Trade in Pakistan: A Policy Roadmap
26IN
DEP
TH

Households
Producers
ProductMarkets
Value added
Factor TaxesOutputTaxes
PrivateSavings
Foreign Savings
Investment Demand
Government Savings
IncomeTaxes
Transfer
ImportsExports
GovernmentConsumption
Priv
ate
Cons
umpt
ion
Fore
ign
Rem
itta
nce
Fact
orIn
com
e
Publ
icBo
rrow
ing
Inte
rmed
iate
Inpu
t D
eman
d
Dom
esti
c Sa
les
CapitalMarkets
FactorMarkets
ROW
Government
Figure 11. A simplified representation of economic flows in CGE models
Note: RoW = Rest of the World
Box 3. Computable general equilibrium (CGE) models
CGE models combine micro- and macroeconomic theory with data to estimate the economy-wide impacts of policy reforms. They are ideal for analyzing the impact of trade policy changes because they consider not only the response of importers and exporters but also the interaction between consumers, producers, government, inter- and intra- industry linkages, domestic and foreign markets, and supply, demand and resource constraints. (See Figure 12.)
CGE models are called “computable” because they can quantify the ex-ante effect of a policy reform (such as tariff cuts). They are called “general” because they explicitly represent the economic activities of all agents in an economy (producers, consumers, government, workers, capital owners, exporters and importers, and so on). CGE models employ “equilibrium” assumptions to capture the behavior of these agents. That is, supply and demand decisions determine the equilibrium values of endogenous variables.
27CHAPTER 2 – HOW TO: REDUCE THE TIME AND COST TO TRADE
Modernizing Trade in Pakistan: A Policy Roadmap
27
IN D
EPTH

In practice, CGE models simultaneously solve thousands of equations. Advances in data availability, analytical techniques, and computer processing power have enhanced their appeal, and they are used not only in academic circles but also in informing policy decisions.
Due to their general equilibrium nature, CGE models offer a rigorous and theoretically consistent framework for quantifying the potential effects of reforms. While some of the direct effects of policy changes could be easily hypothesized, the complex interactions between economic forces can lead to results that are surprising or counterintuitive.
CGE models are data intensive because they require information on virtually all flows in an economy, and data on international trade and investment flows combined with estimates of different parameters such as elasticities of substitution. The data underlying most CGE models comes in a Social Accounting Matrix (SAM), which is a square matrix where rows correspond to income/receipts and columns to outlays/expenditures across agents and industries in an economy. A SAM is usually
constructed using data from national accounts, input-output tables, balance of payments and trade statistics. A global database covering 144 countries/regions, among which Pakistan, and 57 sectors is available from the Global Trade Analysis Project (GTAP) and is used to calibrate most global CGE models.
A wide range of tools is available for decision makers that will help inform decisions about the ex-ante impact of policy changes, but their use should be tailored to these tools’ strengths and limitations. CGE models are ideal for considering the ex-ante impact of policy changes that will likely have widespread, economy-wide or global implications. However, they have limitations in terms of the level of detail they can provide.
Alternatives include partial equilibrium (PE) modeling and gravity analysis. PE modeling may be appropriate when there is need for very detailed analysis focused on a specific market with the implicit assumption that policy changes will not spill over to other sectors or markets and vice versa. Gravity models of trade can provide useful insights into the ex-post impact of trade policy changes based on historical data.
Actions
ANALYSIS
Time release studies (TRS)
The World Bank Group conducted a series of TRS to assess trade facilitation at Pakistan’s Wagah, Charman, Torkham, and Karachi border crossings. At the Wagah border with India, a first TRS was
carried out in 2014, with a follow-up TRS to measure changes in performance in 2018. The final study found the clearance of imports had slowed dramatically since 2014. The average release time had more than doubled, from slightly more than 3 days to more than 6 days and 19 hours. Exports took 7 hours longer to clear from entry to exit, although the customs-specific part of the process had improved by nearly two hours.
28 CHAPTER 2 – HOW TO: REDUCE THE TIME AND COST TO TRADE
Modernizing Trade in Pakistan: A Policy Roadmap
28IN
DEP
TH

The study also identified bottlenecks and pointed out immediate actions to address clearance issues. Some additional recommendations:
• Re-engineer the clearance process to allow for integration and coordination of each regulatory and security agency.
• Ensure uninterrupted power supply and high-speed internet to allow WeBOC-GLO to operate at all times.
• Publish a manual describing clearance processes for the use of all stakeholders.
• Use WeBOC-GLO as the automation tool for the entire clearance process of all regulatory agencies, replacing other legacy automation systems.
Beyond collecting the data for a TRS, it is essential to validate the data with the main stakeholders, conduct follow-up consultations with public and private sector stakeholders, and propose changes to improve clearance times. The World Bank Group has developed and proposed a re-engineered model for import, export, and transit cargo clearance processes and submitted it to Pakistan Customs for consideration.
Trading Across Borders (TAB) indicator surveys
The World Bank Group conducted a Doing Business TAB survey for the Karachi and Bin Qasim seaports and submitted the report to Pakistan Customs. The survey measured time and cost for three sets of procedures, for both import and export: (a) documentary compliance, (b) border compliance, and (c) domestic transport. The report highlighted areas that needed action to substantially improve Pakistan’s ranking. Both private sector and customs officials endorsed the
findings of the report. Private sector stakeholders pointed out that, although customs regulatory activities normally take 3-4 days, some traders take advantage of a free warehousing facility, which may not be accurately reflected in the final clearance time. Free storage at the ports is usually up to 5 days, but for some premium clients, terminal operators offer free storage for 10-12 days. This observation illustrates the need for private sector engagement and validation throughout these interventions.
E-commerce
FBR is carrying out a detailed analysis of cross-border e-commerce in Pakistan and how it can be integrated into the National Single Window (NSW). The assignment will include review of the overall e-commerce legislative framework, and regulations by customs and other government authorities (OGAs) that impact or have the potential to impact cross-border e-commerce. It will also study and analyze the procedures for clearance of goods arriving through mail/courier systems by air or any other modes of transport and will propose workflows for handling e-Commerce transactions in the NSW.
Complementarity of trade facilitation and regional integration
The World Bank Group modeled the impact of the Belt and Road Initiative on Pakistan’s economy to identify complementary policy actions that could maximize the potential benefits of the regional initiative and its infrastructure improvements. The models focused on how specific trade and trade facilitation reforms could best complement hard infrastructure improvements.
The World Bank Group team used three complementary models: a computable general
29CHAPTER 2 – HOW TO: REDUCE THE TIME AND COST TO TRADE
Modernizing Trade in Pakistan: A Policy Roadmap
29
IN D
EPTH

equilibrium (CGE) model, a structural general equilibrium (SGE) model,1 and a gravity model. The three models differed in scope and underlying assumptions. The diverse approaches were useful in that they provided different perspectives on the effects of the Belt and Road Initiative, thus offering a more robust quantification of the outcomes.
Three scenarios were examined: only railway and port infrastructure improvements under the Belt and Road Initiative (Scenario A), infrastructure improvements plus reduced border delays through trade facilitation (Scenario B), and infrastructure improvements plus reduced border delays and lower preferential tariffs through trade policy (Scenario C). Results were clear: outcomes under Scenario B were better than those under Scenario A, and outcomes under Scenario C were better than those under Scenario B. Under Scenario C, exports of goods and services could rise by as much as 20.7 percent, imports of goods and services could rise by as much as 18.8 percent, GDP could increase by as much as 13 percent. In summary, comprehensive reform— infrastructure improvements plus reduced border delays and lower preferential tariffs through trade policy—would lead to substantial benefits for Pakistan.
RECOMMENDATIONS
The purpose of collecting data is to design effective changes. The World Bank Group has delivered a variety of recommendations and support for reforms.
Trade facilitation measures complementary to the Belt and Road Initiative
The Belt and Road Initiative analysis shows that
1 Caliendo, Lorenzo, and Fernando Parro. 2015. "Estimates of the Trade and Welfare Effects of NAFTA.” The Review of Economic Studies 82 (1): 1–44. This is the work underlying the de Soyres et al. (2018) SGE results used here. It specifies a comparative advantage model with sectoral linkages, trade in intermediate goods and sectoral heterogeneity, which allows including 107 countries and regions.
reducing border delays is necessary to achieve the greatest gains from the infrastructure improvements under the Belt and Road Initiative. Indeed, if Pakistan does not take measures to facilitate trade across its borders, then the potential gains from regional integration efforts will not be maximized.
Expediting work on connectivity infrastructure and trade corridors
To benefit from the WTO TFA and the Belt and Road Initiative, Pakistan needs to expedite its work on connectivity infrastructure and trade corridors.
Implementing the Pakistan National Single Window (NSW) to reduce trade costs and improve connectivity
Pakistan’s NSW—currently in design with assistance from the World Bank Group—will integrate all relevant regulatory policies, standards, and procedural requirements for importing, exporting, and transiting products onto a single digital platform, where traders can easily fulfill requirements. It will make it possible to amend existing legislation, regulations, decrees, etc., to address the identified legal issues and gaps. The activity will use international standards, international legal instruments, and soft law instruments, where available, throughout the entire process of creating a legally enabling environment for an international trade single window. Launching the NSW will involve directly linking certificate-, license-, and permit-issuing agencies to the NSW.
Implementing WeBOC-Glo
The government launched the 1.0 version of WeBOC-Glo in May, and promised a soon-to-follow
30 CHAPTER 2 – HOW TO: REDUCE THE TIME AND COST TO TRADE
Modernizing Trade in Pakistan: A Policy Roadmap
30IN
DEP
TH

2.0 version with additional functionality. Maximizing the potential benefits of the new system will require extensive communication and engagement with the trade community, as well as dedicated technical support to troubleshoot deployment issues and continuously improve the system.
Fully implementing the Afghanistan–Pakistan Transit Trade Agreement (APTTA)
Pakistan would benefit from fully implementing the Afghanistan–Pakistan Transit Trade Agreement (APTTA) in light of recent international and regional developments. Three related reforms would help. One is to enforce measures aimed at minimizing the incidence of customs fraud and avoidance. This needs to be complemented with monitoring and curbing informal trade. The second reform is
to include updated provisions related to visa and transit facilitation, harmonization and simplification of custom procedures, banking channels, and dispute resolution. The third reform is to extend the APTTA to other countries in the region such as Tajikistan, to maximize its benefits and create a gateway for integration with Central Asia.
Instituting risk-based compliance management
Pakistan would benefit from adopting a modern, risk-based compliance management strategy with simplified, transparent business practices and procedures. Risk-based regulatory frameworks can help address security concerns while also supporting progress on trade and transit facilitation. It will help if Post Clearance Audit, which is so far a neglected area, is strengthened under this initiative.
Additional resources
Baniya, Suprabha; Rocha Gaffurri, Nadia Patrizia; Ruta, Michele. 2019. Trade Effects of the New Silk Road: A Gravity Analysis (English). Policy Research Working Paper No. 8694. Washington, DC: World Bank Group.
De Soyres, Francois, Alen Mulabdic, Siobhan Murray, Nadia Rocha, and Michele Ruta. 2018. “How Much Will the Belt and Road Initiative Reduce Trade Costs?” Policy Research Working Paper No. 8614. Washington, DC: World Bank.
De Soyres, F., A. Mulabdic and M. Ruta. 2018. “The Belt and Road Initiative: A Structural Analysis.” Mimeo. This paper is one of the main sources for the structural general equilibrium (SGE) model. This model, in turn, is based on Caliendo and Parro (2015).
DeRosa, Dean A. 2008. “Prospects for Greater Global and Regional Integration in the Maghreb: Gravity Model Analysis.” Washington, DC: Peterson Institute for International Economics.
Higgins, Kate. 2012. Gender Dimensions of Trade Facilitation and Logistics: A Guidance Note. Washington, DC: World Bank.
Laget, Edith, Alberto Osnago, Nadia Rocha, and Michele Ruta. 2018. Deep trade agreements and global value chains (English). Policy Research Working Paper No. 8491. Washington, DC: World Bank Group.
Standards and Trade Development Facility
Trade Facilitation Agreement Facility
See “TOOLS: Additional resources” starting on page 135 for more information about each of these publications and toolkits.
31CHAPTER 2 – HOW TO: REDUCE THE TIME AND COST TO TRADE
Modernizing Trade in Pakistan: A Policy Roadmap
31
IN D
EPTH

Trade Facilitation Agreement Home
Trade Facilitation Support Program (TFSP)
United Nations Trade Facilitation Implementation Guide
World Bank. 2012. Developing a Trade Information Portal. Washington, DC: World Bank.
World Bank. 2012. Risk-Based Compliance Management: Making it Work in Border Management Agencies. Washington, DC: World Bank.
World Bank. 2013. Post Clearance Audit: Reference and Implementation Guide. Washington, DC: World Bank.
Xiaoyang Chen, Maggie, and Chuanhao Lin. 2018. “Foreign Investment across the Belt and Road: Patterns, Determinants, and Effects.” Policy Research Working Paper No. 8607. Washington, DC: The World Bank.
32 CHAPTER 2 – HOW TO: REDUCE THE TIME AND COST TO TRADE
Modernizing Trade in Pakistan: A Policy Roadmap
32IN
DEP
TH
HOW TO: Maximize the benefits of integration with China through trade agreements
3
This chapter synthesizes analyses and findings from reports and notes prepared by Alvaro Espitia (Consultant), Adnan Ghumman (Economist), Martín Molinuevo (Senior Private Sector Specialist), Nadia Rocha (Senior Economist), Sebastian Saez (Lead Economist), and Pierre Sauvé (Senior Private Sector Specialist).
Getty Images

Main Messages
• Pakistan has yet to take full advantage of its proximity to China, a trade powerhouse with which it has a free trade agreement. The China–Pakistan Free Trade Agreement could be improved to better reflect the level of liberalization that existed when it was first signed, capture additional liberalization that has taken place in both markets since it was signed, and include additional rules in new areas related to how trade takes place today. The recent renegotiation takes a step in the right direction by adding Chinese preferences to Pakistan in relevant exportable products.
• To date, the impact of the China–Pakistan FTA on overall trade with China has been modest. Since the agreement was signed,12 Pakistan’s imports from China have grown more quickly than its exports to China.
In fact, Pakistan’s gross imports from China are now substantially higher than its gross exports to China. Even Bangladesh, which does not have a free trade agreement with China, has seen its exports to China grow much more quickly than Pakistan’s. Essentially, Chinese exports to the world—including to Pakistan—have grown quickly, while Pakistan’s exports to the world—including to China—have grown more slowly.
• The implementation of the second phase of the China–Pakistan Free Trade Agreement is an opportunity to strengthen Pakistan’s competitiveness, diversify its economy, foster trade, and exploit the markets available in the world economy.
• The renegotiated agreement reflects, to some extent, Pakistan’s economic priorities. It adopts strong commitments in areas where the agreement obligations are in line with the country’s growth strategy and uses the agreement’s flexibilities where regulatory approaches are not yet defined or social policies may limit market competition.
11 The China-Pakistan agreement on trade in goods was signed in 2007, while the agreement on trade in services was signed in 2009.
Getty Images
34 CHAPTER 3 – HOW TO: MAXIMIZE THE BENEFITS OF INTEGRATION WITH CHINA THROUGH TRADE AGREEMENTSQ
UIC
K S
TART
Modernizing Trade in Pakistan: A Policy Roadmap

31-44
21-30
11-20
6-10
2-5
0-1
• Pakistan has only four PTAs in place compared to a global average of 13
(Figure 12). The EU participates in the
largest number of agreements (44), followed
by EFTA members (between 31 and 29), Chile
(22), Singapore (21), Turkey (18), and Mexico
(10). Other emerging economies, such as
China (11) and India (8), are not far behind.
• Pakistan has deeper trade agreements—measured as the number of disciplines
included in an agreement—than other South Asian Free Trade Area members. However, Pakistan’s agreements are not as deep as those between the more integrated East Asian countries. Pakistan has eight enforceable provisions. Bangladesh and Nepal have only two enforceable provisions within the South Asian Free Trade Area. In comparison, Malaysia, Thailand, India and Vietnam have agreements that cover more than ten provisions on average.
Snapshot
Figure 12. Number of PTAs in force (2015)
Source: Authors’ calculations using World Bank PTA dataset (2016)
IBRD 44548 | JULY 2019
35CHAPTER 3 – HOW TO: MAXIMIZE THE BENEFITS OF INTEGRATION WITH CHINA THROUGH TRADE AGREEMENTS
QU
ICK
STA
RT
Modernizing Trade in Pakistan: A Policy Roadmap

0
2
4
6
8
10
12
14
16
2003 2004 2005 2006 2007 2008 2009 2010 2011 2012 2013 2014 2015 2016 2017 2018
USD
bill
ion
Pakistan’s Imports from China Pakistan’s Exports to China
China–Pakistan FTA
• The growth of Pakistan’s exports to China since the original China–Pakistan Free Trade Agreement (11.2 percent) is low compared to the growth of its imports from China over the same period (13.6 percent). Moreover, both growth rates are low compared to markets without free trade agreements with China. For example, China’s exports to Bangladesh (which does not have a free trade agreement with China) grew by 17.6 percent over the same period.
• In gross terms, Pakistan’s exports to China increased from USD 0.3 billion in 2003 to USD 1.8 billion in 2018, an 11.2 percent growth rate. Over the same period, Pakistan’s imports from China increased from USD 0.9 billion to USD 14.5 billion, a 15 percent growth rate (Figure 13).
• Compared to China, Pakistan has committed to less liberalization in services sectors under the China–Pakistan Free Trade Agreement. For certain services (such as business, communication, and tourism services), Pakistan has more restrictive commitments in the China–Pakistan Free Trade Agreement than under the WTO TFA.
• Pakistan is relying on protectionist measures within its trade agreements to keep out foreign competition. In both the WTO TFA and the China–Pakistan Free Trade Agreement, Pakistan introduced horizontal limitations on the form of establishment (representative offices of foreign firms can only have limited operations) and land ownership. Even as a WTO member, Pakistan maintains a
Figure 13. Pakistan trade with China (USD billion)
Source: WITS, World Bank
36 CHAPTER 3 – HOW TO: MAXIMIZE THE BENEFITS OF INTEGRATION WITH CHINA THROUGH TRADE AGREEMENTSQ
UIC
K S
TART
Modernizing Trade in Pakistan: A Policy Roadmap

horizontal restriction on foreign equity participation. The 2009 China–Pakistan Free Trade Agreement in services did not include such a horizontal restriction, but almost every sectoral entry included such a restriction.
• Pakistan’s international commitments to reform the services sector are limited. Under Pakistan’s WTO obligations, 80 percent of the sectors under investment in services are “unbound” (that is, excluded from market access and national treatment obligations) and only 9 percent are liberalized. (In trade agreements, the term “unbound” means that a signatory is not obligated—or bound—by the agreement to liberalize
trade in that sector. That is, “unbound” sectors are the least constraining on the signatory and therefore tend to feature the greatest restrictions on trade. By contrast, sectors with “no restrictions” are those in which a signatory is obligated under the agreement to fully liberalized trade, having committed not to place restrictions on trade in that sector. Sectors with “partial restrictions” lie in the middle—the signatory is committed to some liberalization but retains the freedom to place some restrictions on trade within the sector.) Under the first China–Pakistan Free Trade Agreement, 53 percent of the investment services sectors were unbound, and the rest were subject only to partial commitments (Figure 14).
Figure 14. Level of sectoral commitments in services agreements
Source: Services Sectoral Classification List (WTO document MTN.GNS/W/120)
Unbound Partial Restrictions No Restictions
Cross-borderServices
China
WTO ChPFTA WTO ChPFTACHAFTA
Pakistan
Investment
47%
34%
19%
43%
37%
20%
69%
29%
80%53%
47%
11%9%
2%5%
66%
5%
93%
20%
11%
62%64%
4%
41%3%
32%
56%
37%
1%
37CHAPTER 3 – HOW TO: MAXIMIZE THE BENEFITS OF INTEGRATION WITH CHINA THROUGH TRADE AGREEMENTS
QU
ICK
STA
RT
Modernizing Trade in Pakistan: A Policy Roadmap

The World Bank Group analysis of Pakistan’s situation led to these recommendations:
• Negotiate changes to the China–Pakistan Free Trade Agreement to secure increased preferences for high-potential products from Pakistan in sectors such as textiles, vegetable products, and raw hides and skins. The recent renegotiation provides increased preferences for products in which Pakistan
competes with ASEAN in Chinese markets, which is a step forward.
• Address four specific barriers that have constrained regional integration within South Asia: (i) tariff and para-tariff barriers, (ii) non-tariff barriers, (iii) the high costs of connectivity, and (iv) the trust deficit among South Asian countries.
• Add new cross-border services to the China–Pakistan Free Trade Agreement.
Forward Look
Figure 15. CPEC has the potential to transform Pakistan’s trade relationship with China.
Source: willyseto / iStock Unreleased via Getty Images
38 CHAPTER 3 – HOW TO: MAXIMIZE THE BENEFITS OF INTEGRATION WITH CHINA THROUGH TRADE AGREEMENTSQ
UIC
K S
TART
Modernizing Trade in Pakistan: A Policy Roadmap
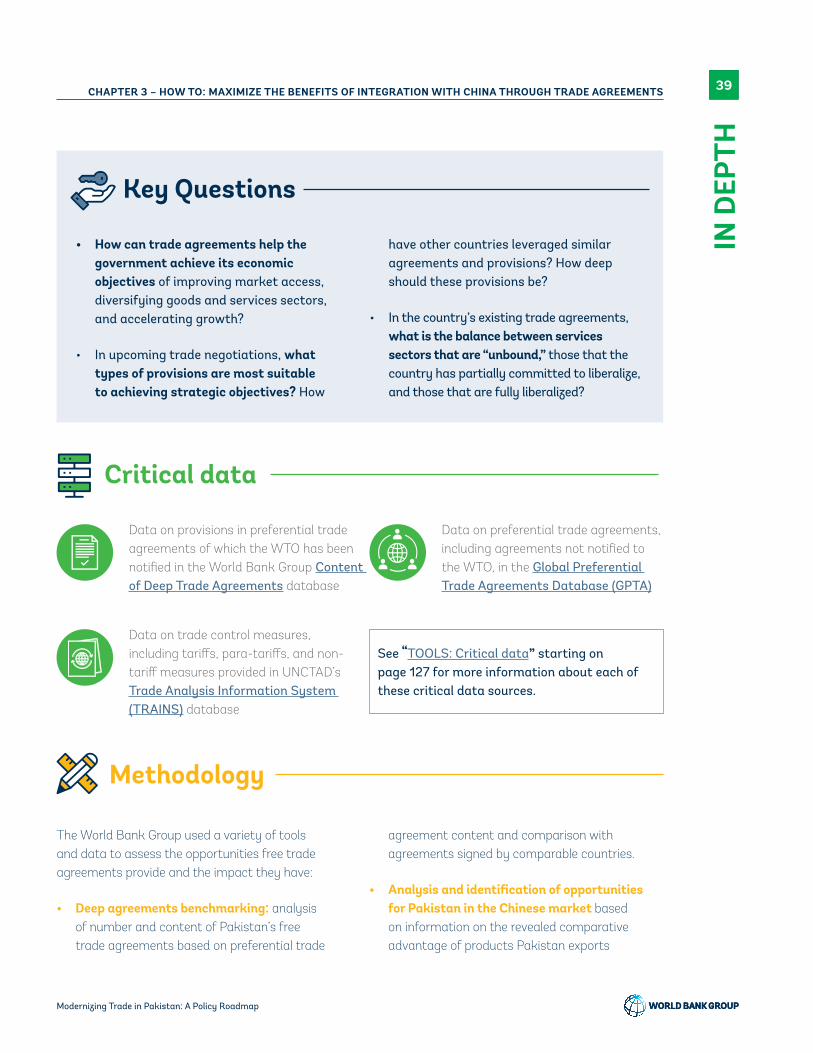
Critical data
See “TOOLS: Critical data” starting on page 127 for more information about each of these critical data sources.
Data on provisions in preferential trade agreements of which the WTO has been notified in the World Bank Group Content of Deep Trade Agreements database
Data on preferential trade agreements, including agreements not notified to the WTO, in the Global Preferential Trade Agreements Database (GPTA)
Data on trade control measures, including tariffs, para-tariffs, and non-tariff measures provided in UNCTAD’s Trade Analysis Information System (TRAINS) database
Methodology
• How can trade agreements help the government achieve its economic objectives of improving market access, diversifying goods and services sectors, and accelerating growth?
• In upcoming trade negotiations, what types of provisions are most suitable to achieving strategic objectives? How
have other countries leveraged similar agreements and provisions? How deep should these provisions be?
• In the country’s existing trade agreements, what is the balance between services sectors that are “unbound,” those that the country has partially committed to liberalize, and those that are fully liberalized?
Key Questions
The World Bank Group used a variety of tools and data to assess the opportunities free trade agreements provide and the impact they have:
• Deep agreements benchmarking: analysis of number and content of Pakistan’s free trade agreements based on preferential trade
agreement content and comparison with agreements signed by comparable countries.
• Analysis and identification of opportunities for Pakistan in the Chinese market based on information on the revealed comparative advantage of products Pakistan exports
39CHAPTER 3 – HOW TO: MAXIMIZE THE BENEFITS OF INTEGRATION WITH CHINA THROUGH TRADE AGREEMENTS
Modernizing Trade in Pakistan: A Policy Roadmap
39
IN D
EPTH

Actions
The World Bank Group analysis shows that the first China–Pakistan Free Trade Agreement in goods has had only a modest impact on Pakistan–China trade. Since 2007, Pakistan’s imports from China increased by 68 percent overall, but only 4.6 percent of this is attributable to the FTA. Similarly, only 3.6 percent of the increase in exports to China (mainly cotton yarn and woven fabric, bed linen, leather, marble, and surgical instruments) can be attributed to the FTA.
Key Pakistani exports remain at no or partial concessions under the FTA. While China has granted concessions on tariff lines amounting to 83 percent of export volume, about 70 percent of exports are in tariff lines at less than 50 percent or no concession. The recent renegotiation of the China–Pakistan FTA that resulted in increased preferences for Pakistani products in 313 product lines is a step in the right direction. It matches to some extent the preferences granted by China to ASEAN.
Despite China granting concessions to 72 percent of Pakistan’s exports, findings show there is considerable export potential that could still be exploited. Only 30 percent of Chinese tariffs under the agreement have been fully liberalized. Important Pakistani exports receiving no or only partial concessions under the current FTA include cotton yarn (with ≥ 85 percent cotton), semi-milled or wholly milled rice, leather further prepared after
tanning or crusting, and fresh or dried nuts.
In sum, the China–Pakistan Free Trade Agreement has room for expansion in both sectoral scope and depth of commitments.
TRADE IN GOODS
Analysis
World Bank Group benchmarking of deep agreements and analysis of market access status and opportunities gave rise to the following observations with respect to trade in goods:
• Implementing the China–Pakistan Economic Corridor has led to an increase in FDI from China to Pakistan, which has been concentrated in energy and infrastructure. Pakistan received FDI of USD 1.2 billion from China during 2017. However, this was less than 1 percent of global FDI from China during 2017 and is expected to decrease as China–Pakistan Economic Corridor projects approach completion.
• In addition, the growth of most imports from China of products not included in the China–Pakistan Free Trade Agreement has been faster than the growth of products covered under the agreement.
combined with information on agreement tariff schedules and bilateral trade flows.
• Review of the sectoral services commitments in the first China–Pakistan Free Trade Agreement and comparison with practices in other trade agreements. The analysis focused on (i) the commitments made at the WTO under the
GATS agreements—obligations adopted in 1994 for Pakistan and 2001 for China, (ii) the chapter of the first China–Pakistan Free Trade Agreement on trade in services, concluded in 2009, and (iii) the China–Australia Free Trade Agreement, concluded in 2014. The latter agreement is a benchmark for the level of commitments that China may adopt in present-day negotiations.
40 CHAPTER 3 – HOW TO: MAXIMIZE THE BENEFITS OF INTEGRATION WITH CHINA THROUGH TRADE AGREEMENTS
Modernizing Trade in Pakistan: A Policy Roadmap
40IN
DEP
TH
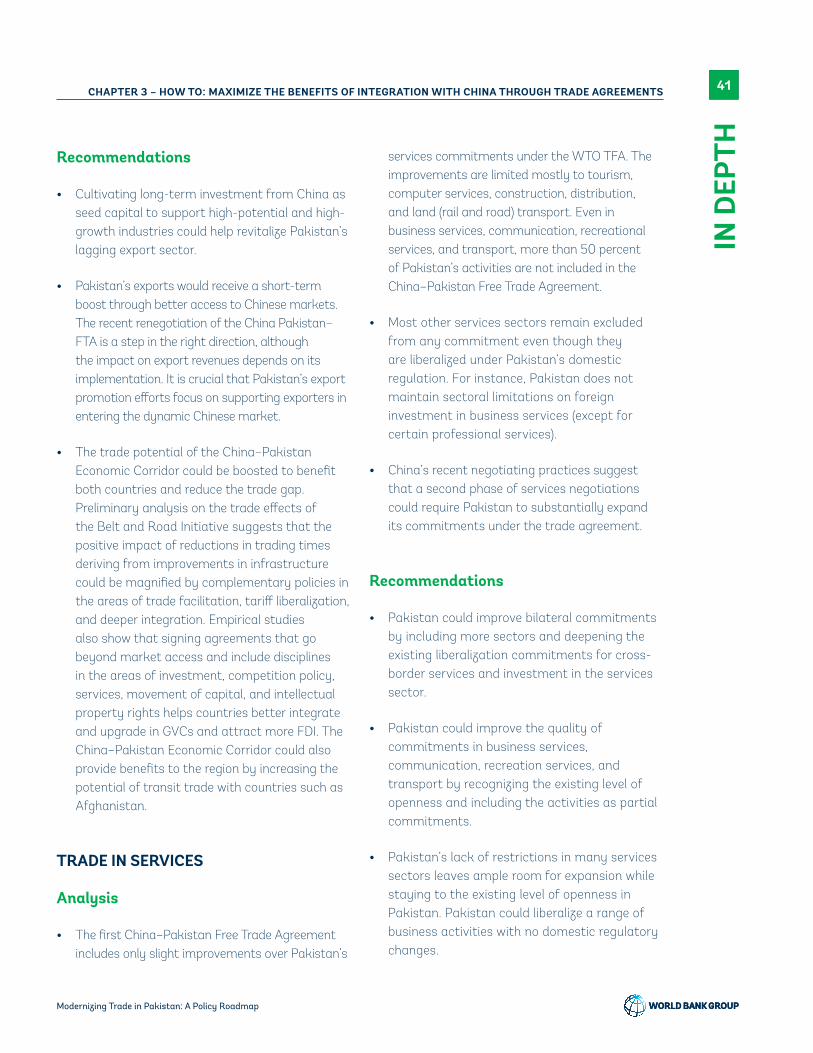
Recommendations
• Cultivating long-term investment from China as seed capital to support high-potential and high-growth industries could help revitalize Pakistan’s lagging export sector.
• Pakistan’s exports would receive a short-term boost through better access to Chinese markets. The recent renegotiation of the China Pakistan–FTA is a step in the right direction, although the impact on export revenues depends on its implementation. It is crucial that Pakistan’s export promotion efforts focus on supporting exporters in entering the dynamic Chinese market.
• The trade potential of the China–Pakistan Economic Corridor could be boosted to benefit both countries and reduce the trade gap. Preliminary analysis on the trade effects of the Belt and Road Initiative suggests that the positive impact of reductions in trading times deriving from improvements in infrastructure could be magnified by complementary policies in the areas of trade facilitation, tariff liberalization, and deeper integration. Empirical studies also show that signing agreements that go beyond market access and include disciplines in the areas of investment, competition policy, services, movement of capital, and intellectual property rights helps countries better integrate and upgrade in GVCs and attract more FDI. The China–Pakistan Economic Corridor could also provide benefits to the region by increasing the potential of transit trade with countries such as Afghanistan.
TRADE IN SERVICES
Analysis
• The first China–Pakistan Free Trade Agreement includes only slight improvements over Pakistan’s
services commitments under the WTO TFA. The improvements are limited mostly to tourism, computer services, construction, distribution, and land (rail and road) transport. Even in business services, communication, recreational services, and transport, more than 50 percent of Pakistan’s activities are not included in the China–Pakistan Free Trade Agreement.
• Most other services sectors remain excluded from any commitment even though they are liberalized under Pakistan’s domestic regulation. For instance, Pakistan does not maintain sectoral limitations on foreign investment in business services (except for certain professional services).
• China’s recent negotiating practices suggest that a second phase of services negotiations could require Pakistan to substantially expand its commitments under the trade agreement.
Recommendations
• Pakistan could improve bilateral commitments by including more sectors and deepening the existing liberalization commitments for cross-border services and investment in the services sector.
• Pakistan could improve the quality of commitments in business services, communication, recreation services, and transport by recognizing the existing level of openness and including the activities as partial commitments.
• Pakistan’s lack of restrictions in many services sectors leaves ample room for expansion while staying to the existing level of openness in Pakistan. Pakistan could liberalize a range of business activities with no domestic regulatory changes.
41CHAPTER 3 – HOW TO: MAXIMIZE THE BENEFITS OF INTEGRATION WITH CHINA THROUGH TRADE AGREEMENTS
Modernizing Trade in Pakistan: A Policy Roadmap
41
IN D
EPTH
Additional resources
Antràs, Pol, and Elhanan Helpman. 2008. “Contractual Frictions and Global Sourcing.” In The Organization of Firms in a Global Economy, edited by Elhanan Helpman, D. Marin, and T. Verdier, 9–54. Cambridge, MA: Harvard University Press.
Espitia, Alvaro, Aaditya Mattoo, Mondher Mimouni, Xavier Pichot, and Nadia Rocha. 2018. “How Preferential Is Preferential Trade?” Policy Research Working Paper. World Bank, Washington, DC.
Hofmann, Claudia, Alberto Osnago, and Michele Ruta. Horizontal Depth: A New Database on the Content of Preferential Trade Agreements. Policy Research Working Paper No. 7981. Washington, DC: World Bank.
Hollweg, Claire H., and Nadia Rocha. 2018. GVC Participation and Deep Integration in Brazil. Policy Research Working Paper No. 8646. Washington, DC: World Bank.
Laget, Edith, Alberto Osnago, Nadia Rocha, and Michele Ruta. 2018. Deep trade agreements and global value chains (English). Policy Research Working Paper No. 8491. Washington, DC: World Bank Group.
Osnago, Alberto, Nadia Rocha, and Michele Ruta. 2015. Deep Trade Agreements and Vertical FDI: The Devil Is in the Details. Policy Research Working Paper No. 7464. Washington, DC: World Bank.
See “TOOLS: Additional resources” starting on page 135 for more information about each of these publications and toolkits.
42 CHAPTER 3 – HOW TO: MAXIMIZE THE BENEFITS OF INTEGRATION WITH CHINA THROUGH TRADE AGREEMENTS
Modernizing Trade in Pakistan: A Policy Roadmap
42IN
DEP
TH
HOW TO: Boost trade, revenues, and growth through trade reforms4
This chapter synthesizes analyses and findings from reports and notes prepared by Guillermo Arenas (Economist), Sarur Chaudhary (Consultant), Adnan Ghumman (Economist), Csilla Lakatos (Senior Economist), Michael Ferrantino (Lead Economist), Miles McKenna (Analyst), Nadia Rocha (Senior Economist) and Gonzalo Varela (Senior Economist).
Getty Images
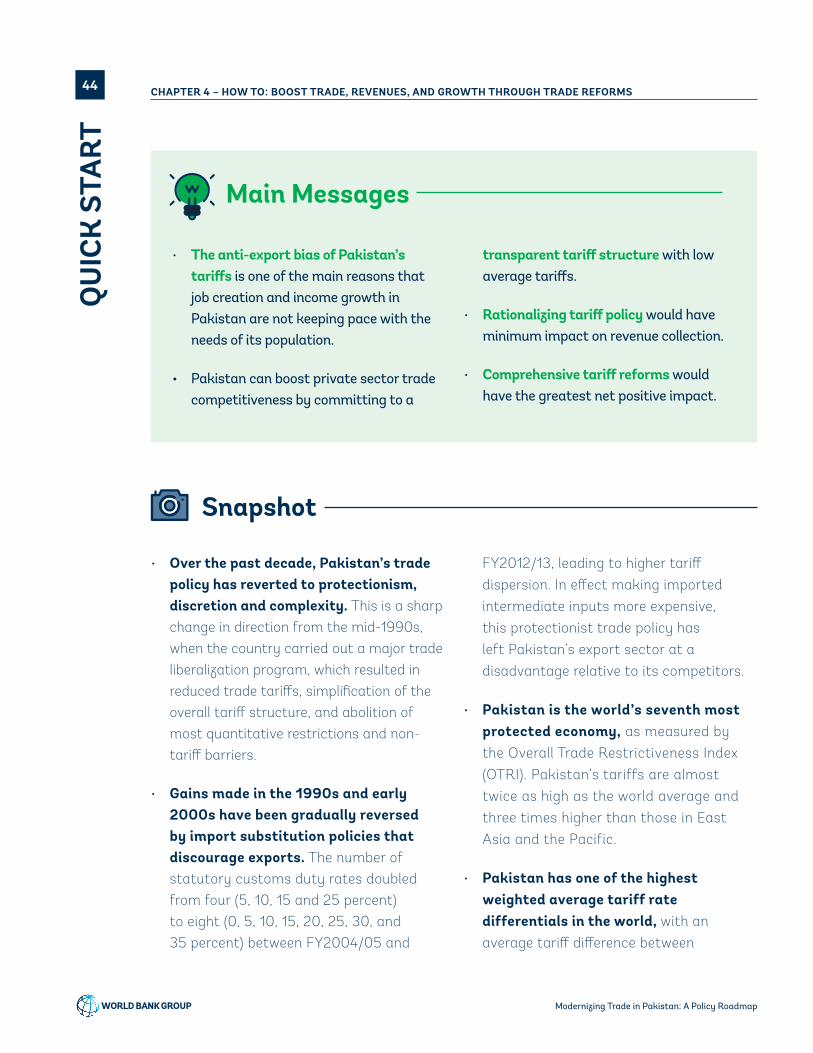
Main Messages
• The anti-export bias of Pakistan’s tariffs is one of the main reasons that job creation and income growth in Pakistan are not keeping pace with the needs of its population.
• Pakistan can boost private sector trade competitiveness by committing to a
transparent tariff structure with low average tariffs.
• Rationalizing tariff policy would have minimum impact on revenue collection.
• Comprehensive tariff reforms would have the greatest net positive impact.
Snapshot
• Over the past decade, Pakistan’s trade policy has reverted to protectionism, discretion and complexity. This is a sharp change in direction from the mid-1990s, when the country carried out a major trade liberalization program, which resulted in reduced trade tariffs, simplification of the overall tariff structure, and abolition of most quantitative restrictions and non-tariff barriers.
• Gains made in the 1990s and early 2000s have been gradually reversed by import substitution policies that discourage exports. The number of statutory customs duty rates doubled from four (5, 10, 15 and 25 percent) to eight (0, 5, 10, 15, 20, 25, 30, and 35 percent) between FY2004/05 and
FY2012/13, leading to higher tariff dispersion. In effect making imported intermediate inputs more expensive, this protectionist trade policy has left Pakistan’s export sector at a disadvantage relative to its competitors.
• Pakistan is the world’s seventh most protected economy, as measured by the Overall Trade Restrictiveness Index (OTRI). Pakistan’s tariffs are almost twice as high as the world average and three times higher than those in East Asia and the Pacific.
• Pakistan has one of the highest weighted average tariff rate differentials in the world, with an average tariff difference between
44 CHAPTER 4 – HOW TO: BOOST TRADE, REVENUES, AND GROWTH THROUGH TRADE REFORMSQ
UIC
K S
TART
Modernizing Trade in Pakistan: A Policy Roadmap
Figure 16. Implementing the WTO Trade Facilitation Agreement can help Pakistan boost exports.
Source: Getty Images
consumer goods and raw materials of 10.39 percentage points in 2016, and between intermediate goods and raw materials of 2.21 percentage points.
• In Pakistan (as elsewhere), there is more tariff evasion (through under-invoicing) when importing products with high tariffs. Rather than helping increase revenues, Pakistan’s high tariffs may be doing the opposite.
• Pakistan’s trade costs, both within and outside the region, are much higher than those of comparator countries in South Asia and East Asia. Tariffs contribute to higher trade costs in the country.
• Pakistan’s high tariffs and complex regime relative to its competitors discourage exports. Peers, by contrast, have expanded their exports through trade policy reforms geared toward enhancing
45CHAPTER 4 – HOW TO: BOOST TRADE, REVENUES, AND GROWTH THROUGH TRADE REFORMS
QU
ICK
STA
RT
Modernizing Trade in Pakistan: A Policy Roadmap

export competitiveness. Pakistan had a simple average tariff of 10.19 percent on intermediate goods in 2016; this was 6.26 percentage points higher than Vietnam’s (which stood at 3.93 percent in 2016), and 4.47 percentage points higher than Malaysia’s (at 5.72 percent in 2016).
• Tariff rates in Pakistan are higher than in other countries in South Asia. Pakistan’s simple average tariff was 12.55 percent in 2016, compared to an average of 11.16 percent in South Asia. Government efforts to reduce tariffs have lagged regional trends. Pakistan’s simple average tariff declined 2.31 percentage points between 2006 and 2016. By comparison, South Asia’s simple average tariff over the same period declined by 3.28 percent, from
14.44 to 11.16; and East Asia’s average tariff declined by 0.94 percent, from an already low rate of 6.04 percent in 2006 to 5.1 percent in 2016 (Figure 17).
• Introducing alternative protection instruments such as regulatory duties (RDs) and firm-specific statutory regulatory orders (SROs) have offset efforts to reduce tariffs in Pakistan. Sometimes, the aim of high tariffs, along with RDs and SROs, has been to protect domestic production.
• Despite all this protection, Pakistan’s firms have not become competitive. In practice, the protections have sheltered firms from competition, resulting in lower productivity and inefficient allocation of resources.
Figure 17. Simple average tariff, Pakistan compared to South Asia and East Asia & Pacific, 2006–16
Source: World Integrated Trade Solutions (WITS) dataset.
4
6
8
10
12
14
16
2006 2007 2008 2009 2010 2011 2012 2013 2014 2015 2016
Tariff
Rat
e, %
Pakistan South Asia East Asia & Pacific
46 CHAPTER 4 – HOW TO: BOOST TRADE, REVENUES, AND GROWTH THROUGH TRADE REFORMSQ
UIC
K S
TART
Modernizing Trade in Pakistan: A Policy Roadmap

The following actions would have the greatest effects on revenues and economic growth in Pakistan:
• Over the long run, revenue decreases would be outweighed by GDP increases of as much as 3.8 percent. In the short term, tax revenues from imports could decline by as little as 10.8 percent and as much as 18.1 percent depending on the depth of the reforms.
• The liberalization of non-tariff measures (NTMs) could yield significant benefits for Pakistan, even more pronounced than those from the most ambitious tariff liberalizations. A 25 percent decline in NTMs could boost Pakistan’s GDP by 1.3 percent, exports by 12.5 percent and imports by 14.3 percent, contributing to price reductions at home.
• Trade facilitation enhancements to the efficiency of customs as Pakistan implements its commitments for the WTO TFA could translate into an increase of Pakistan’s GDP by 0.4 percent, exports by 4.4 percent and imports by 4.9 percent. (See “HOW TO: Reduce the time and cost to trade” starting on page 19 for more information about trade facilitation.)
• Comprehensive reform could have a much larger positive effect than the individual unilateral trade liberalization scenarios. Comprehensive reform would entail the ambitious liberalization of tariffs, a 25 percent reduction in NTMs, improvements in trade facilitation, and productivity gains from increased openness. Comprehensive reform could boost GDP by 3.8 percent, exports by 41.1 percent, and imports by 34.6 percent.
Forward Look
Getty Images
47CHAPTER 4 – HOW TO: BOOST TRADE, REVENUES, AND GROWTH THROUGH TRADE REFORMS
QU
ICK
STA
RT
Modernizing Trade in Pakistan: A Policy Roadmap

Methodology
PARTIAL EQUILIBRIUM (PE) MODEL
The Tariff Reform Impact Simulation Tool (TRIST) (Brenton et al. 2009) is a simple, easy to use
tool to assess the implications of trade reforms. It is an Excel-based program that simulates the impact of tariff reforms on imports and tax revenues based on a simple partial equilibrium
• What is the country’s tariff structure, and what are its implications for competitiveness?
• What are the potential impacts of tariff reforms on revenues, trade and growth?
Key Questions
Critical data
Data on bilateral trade from the Global Trade Analysis Project (GTAP) database
Estimates of the effects of potential tariff changes from the Overall Trade Restrictiveness Index (OTRI)
Data on trade control measures, including tariffs, para-tariffs, and non-tariff measures from UNCTAD (United Nations Conference on Trade and Development) Trade Analysis Information System (TRAINS)
Data on customs duties, imports, and commitments on goods from the WTO Tariff Analysis Online (TAO) facility
See “TOOLS: Critical data” starting on page 127 for more information about each of these critical data sources.
Tariff statistics, tariff, and non-tariff measure data from the World Integrated Trade Solutions (WITS) database from the World Bank Group
48 CHAPTER 4 – HOW TO: BOOST TRADE, REVENUES, AND GROWTH THROUGH TRADE REFORMS
Modernizing Trade in Pakistan: A Policy Roadmap
48IN
DEP
TH

Actions
(PE) model. Import responses to tariff changes are modeled as changes in relative import prices that result in substitution of imports between countries and an increase in import demand due to lower import prices. TRIST treats demand for each product in isolation from the rest of the economy and does not consider inter- and intra-sectoral linkages. Projections are based on revenues collected at the tariff line level rather than simply applying statutory rates. TRIST projects the impact of tariff reform on total fiscal revenue, including value-added tax (VAT) and excise tax, and disaggregates results to the product level to facilitate identifying sensitive products or sectors. It can incorporate tariff liberalization scenarios involving any group of trading partners and any schedules of products. TRIST is relevant for analysis of short-term impacts of trade reforms on imports and tax revenues, but it is ill-suited to assess economy-wide impacts over the medium and long term.
The World Bank Group used two types of models to estimate the economic impacts of tariff rate changes in Pakistan. First, we used a partial equilibrium (PE) model to estimate the short-term impact of unilateral tariff liberalization on imports and tax revenues. Second, a computable general equilibrium (CGE) model was used to estimate the medium- to long-term impacts of potential reform scenarios on several macroeconomic indicators (imports, exports, tax revenues, and production/output) and industries.
The World Bank Group used these tools to evaluate the potential economic impacts of three types of trade reform scenarios in Pakistan:
• Scenario 1: Unilateral liberalization of tariffs and other charges on imports
• Scenario 2: Liberalization of NTMs
• Scenario 3: Improvements in trade facilitation
The unilateral tariff liberalization scenario analyzed in this work (Scenario 1) consists of five sub-scenarios (Figure 18). They assume progressively more ambitious liberalization of tariffs and other charges affecting imports in Pakistan, declining from the current 8 percent to 4.8 percent, 3.2 percent, 3.7 percent, 1.6 percent and 4.2 percent in the five sub-scenarios, respectively:
COMPUTABLE GENERAL EQUILIBRIUM (CGE) MODEL
The model underlying the medium- to long-term simulations is LINKAGE, a dynamic, multi-region, multi-sector and multi-factor CGE model documented in van der Mensbrugghe (2011, 2013). The LINKAGE model relies on the GTAP-10 database representing the global economy in 2014. The core specification of the LINKAGE model broadly replicates a standard global dynamic CGE model. Production is specified as a series of nested constant elasticity of substitution (CES) functions using various inputs—unskilled and skilled labor, capital, land, sector-specific natural resources, energy, and other material inputs. The labor market is characterized by full employment and allows for rural-urban migration. Demand by each agent is specified in terms of a bundle of domestically produced and imported goods. Demand is aggregated across all agents and allocated at the national level between domestic production and imports by region of origin.
49CHAPTER 4 – HOW TO: BOOST TRADE, REVENUES, AND GROWTH THROUGH TRADE REFORMS
Modernizing Trade in Pakistan: A Policy Roadmap
49
IN D
EPTH

Figure 18. Impact on imports by scenario
Source: World Bank simulations.Note: Changes in the volume of exports relative to the baseline in 2023.
• Scenario 1.1: Maximum 5 percent customs duty. In the short term, this scenario could result in a 4.2 percent increase in imports and a 12.8 percent decline in tax revenues from imports (PE model). In the medium to long term, imports could to increase by 5.7 percent, exports by 10.2 percent and GDP by 0.5 percent. In the long term, these increases would exceed the short-term loss in tax revenue.
• Scenario 1.2: Maximum 5 percent customs duty and elimination of regulatory and additional duties. In the short term, this scenario could result in a 6 percent increase in imports and a 16 percent decline in tax revenues from imports. In the medium to long term, imports could increase by 8.6 percent, exports by 15.2 percent and GDP by 0.7 percent. In the long term, these increases also would more than make up for the short-term decrease in tax revenue.
• Scenario 1.3: Maximum 5 percent customs duty, elimination of regulatory and additional duties, and elimination of non-FTA import duty suspension and refund programs. In the short term, this scenario could result in a 5.3 percent increase in imports and a 14.2 percent decline in tax revenues from imports. In the medium to long term, imports could increase by 7.6 percent, exports by 13.5 percent and GDP by 0.7 percent. Again, these increases would exceed the short-term drop in tax revenue over time.
• Scenario 1.4: Zero customs duties for raw materials, intermediates, and capital goods; 10 percent customs duties for consumption goods, and elimination of regulatory and additional duties. In the short term, this scenario could result in a 5.5 percent increase in imports and an 18.1 percent decline in tax revenues from imports. In the medium to long term, imports could increase by 11.3 percent, exports by 20.1 percent and GDP by 0.9 percent. In the long run, these increases would outweigh the short-term reduction in tax revenue.
4,267
6,3755,677
8,420
4,469
18,866
Scenario 1.1 Scenario 1.2 Scenario 1.3 Scenario 1.4 Scenario 1.5 Comprehensive
USD
bill
ion
50 CHAPTER 4 – HOW TO: BOOST TRADE, REVENUES, AND GROWTH THROUGH TRADE REFORMS
Modernizing Trade in Pakistan: A Policy Roadmap
50IN
DEP
TH

Figure 19. Tariff rates and misreporting
Source: World Bank
1
2
4
8
16
32
64
128
-1 -0.8 -0.6 -0.4 -0.2 0 0.2 0.4 0.6 0.8 1
Mea
n im
port
dut
y (%
)
Mean discrepancy indexUnder-reporting of imports
Over-reportingof imports
• Scenario 1.5: Elimination of customs duties on inputs for 19 priority sectors identified by the Ministry of Commerce, and elimination of regulatory and additional duties. In the short term, this scenario could result in a 5.6 percent increase in imports and a 10.8 percent decline in tax revenues from imports. In the medium to long term, imports could to increase by 6 percent, exports by 10.6 percent and GDP by 0.2 percent. In time, these increases would more than offset the short-term decline in tax revenue.
A reduction in misreporting could also increase revenue. Importers have an incentive to understate the value of imports to evade tariffs. More intense enforcement decreases the incentive (Ferrantino et al. 2012). Figure 19 illustrates the negative correlation between tariff rates and under-reporting in Pakistan. A general decrease
in tariff rates can be expected to lead to a reduction in misreporting leading to an increase in revenues. (The discrepancy index depicted in the figure is a measure of the level of misreporting. It is calculated as the difference between import values reported by importers in Pakistan and exported values reported from the country where the merchandise originates, normalized by the total amount that is reported by the importers and the exporters. A value of the discrepancy index equal to zero means no under-reporting—the import values reported by both the exporters and the importers coincide. Negative values of the index suggest under-reporting—the imported values reported by importers are smaller than those reported by exporters, with the extreme case of zero reporting from the importer. Positive values of the index suggest reported exports smaller than reported imports, that is, over-reporting.)
51CHAPTER 4 – HOW TO: BOOST TRADE, REVENUES, AND GROWTH THROUGH TRADE REFORMS
Modernizing Trade in Pakistan: A Policy Roadmap
51
IN D
EPTH
Additional resources
Aguiar, Angel, Badri Narayanan, and Robert McDougall. 2016. “An Overview of the GTAP 9 Data Base.” Journal of Global Economic Analysis 1 (1): 181–208.
Brenton, Paul, Christian Saborowski, Cornelia Staritz, and Erik von Uexkull. 2009. “Assessing the adjustment implications of trade policy changes using TRIST (tariff reform impact simulation tool).” Policy Research Working Paper No. 5045. Washington, DC: World Bank.
Ferrantino, Michael J., Xuepeng Liu, and Zhi Wang. 2012. “Evasion Behaviors of Exporters and Importers: Evidence from the U.S.–China Trade Data Discrepancy.” Journal of International Economics 86 (1): 141–57.
Kee, Hiau Looi, Alessandro Nicita, and Marcelo Olarreaga. 2008. “Import Demand Elasticities and Trade Distortions.” The Review of Economics and Statistics 90 (4): 666–82.
Kee, Hiau Looi, Alessandro Nicita, and Marcelo Olarreaga. 2009. “Estimating Trade Restrictiveness Indices.” The Economic Journal 119 (534): 172–99.
Van der Mensbrugghe, Dominique. 2011. “LINKAGE Technical Reference Document.” Washington, DC: World Bank.
Van der Mensbrugghe, Dominique. 2013. “Modeling the Global Economy: Forward-Looking Scenarios for Agriculture.” In Handbook of Computable General Equilibrium Modeling, edited by Peter B. Dixon and Dale W. Jorgenson, 1:933–94. Elsevier.
See “TOOLS: Additional resources” starting on page 135 for more information about each of these publications and toolkits.
52 CHAPTER 4 – HOW TO: BOOST TRADE, REVENUES, AND GROWTH THROUGH TRADE REFORMS
Modernizing Trade in Pakistan: A Policy Roadmap
52IN
DEP
TH

HOW TO: Upgrade in the textiles and apparel global value chain
5
This chapter synthesizes analyses and findings from reports and notes prepared by James Crittle (Consultant), Jack Daly (Duke Global Value Chains Center), Stacey Frederick (Duke Global Value Chains Center), Nadia Rocha (Senior Economist) and Gonzalo Varela (Senior Economist).
Getty Images

Main Messages
• Pakistan has untapped potential in the textiles and apparel global value chain (GVC). Although Pakistan is a top-five producer of cotton worldwide, its textiles and apparel industry has a low share of the global apparel, synthetic fibers, and fine cotton markets. Moreover, its textiles and apparel exports fetch low prices in international markets.
• To upgrade in the textiles and apparel GVC, Pakistan needs to provide exporters with access to high-quality inputs—particularly synthetic fibers, for which demand is booming—at world prices.
• However, Pakistan’s current policy environment prevents exporters from accessing imported inputs at world prices and in time to fulfill foreign orders.
• Complex administrative procedures, heavy documentary requirements, customs officers’ discretionary powers, “unofficial fees,” and undue delays in processing duty suspensions or refunds contribute to the problem.
• These issues are all squeezing Pakistani exporters’ profit margins and responsiveness, reducing their competitiveness in the global markets for high-value synthetic fibers and fine cotton.
• The short-term solution is to reform Pakistan’s import duty suspension and refund programs, so they work for exporters.
Snapshot
• Pakistan has a revealed comparative advantage (RCA) in the export of textiles and apparel. (The RCA is an index used to calculate the relative advantage or disadvantage of a certain country in a certain class of goods or services, as evidenced by trade flows.)
• However, Pakistan has not fully leveraged its advantage. Production in Pakistan’s textiles sector is primarily cotton-based, leveraging the country’s domestic supply of cotton. Some 84 percent of Pakistan’s apparel exports are also cotton-based. In comparison, cotton
54 CHAPTER 5 – HOW TO: UPGRADE IN THE TEXTILES AND APPAREL GLOBAL VALUE CHAINQ
UIC
K S
TART
Modernizing Trade in Pakistan: A Policy Roadmap

apparel accounted for only 46 percent of global apparel exports. Globally, the market has been shifting toward apparel made of synthetic materials. Creating and using synthetic fibers, increasingly in demand for high-performance apparel such as athletic wear, requires more technological sophistication than producing apparel from traditional fibers.
• Global textile and apparel trade grew at a compound annual growth rate of 3.6 percent between 2005 and 2017 to reach a value of approximately USD 780 billion in 2017 (Figure 20). Apparel accounts for nearly 60 percent of global textiles and apparel trade by value.
• All told, Pakistan’s textiles and apparel sectors directly employ roughly 2.5 million people. Textiles and apparel accounted for 60.5 percent of Pakistan’s exports in 2017 and an average of 55 percent of Pakistan’s exports over the past decade (Figure 21).
• In 2017, the world value of apparel trade alone was approximately USD 464 billion. Although there has been some fluctuation in the value of global exports, the apparel industry’s growth rates for the seven years between 2010 and 2017 was 4.2 percent. Pakistan’s apparel exports were USD 4.98 billion in 2017, a 5.4 percent annualized increase over 2010 that has positioned the country as the world’s eighth leading apparel exporter.
267 348444 464
114
129
148 143
41
52
53 50
32
43
50 49
27
42
52 51
21
27
29 27
502
641
776 784
0
100
200
300
400
500
600
700
800
900
1000
2005 2010 2015 2017
USD
Bill
ions
Apparel Fabric Fibre Home Textiles Other Yarn Total
Figure 20. World textiles and apparel trade (USD billions)
Source: UN Comtrade, Wazir Advisors and World Bank Analysis
55CHAPTER 5 – HOW TO: UPGRADE IN THE TEXTILES AND APPAREL GLOBAL VALUE CHAIN
QU
ICK
STA
RT
Modernizing Trade in Pakistan: A Policy Roadmap

53.4
55.7
55.3
54.0
52.8
54.6
56.2
59.0
60.9
60.5
46.6
44.3
44.7
46.0
47.2
45.4
43.8
41.0
39.1
39.5
0 10 20 30 40 50 60 70 80 90 100
2008
2009
2010
2011
2012
2013
2014
2015
2016
2017
Percent (%)
Textiles and Apparel Other
Figure 21. Percentage of export value by product, Pakistan, 2008–2017
Source: World Integrated Trade Solutions (WITS) dataset.
• Pakistan’s Market Penetration Index, which measures the extent to which a country’s exports reach proven markets (countries that report having imported the product during the year), is low, with a value of 14.68 in 2017. By comparison, India had a Market Penetration Index of 27.8 in 2017. The results allude to both barriers to trade and to a lack of dynamism.
• In Pakistan’s textiles sector, high tariffs are coupled with ineffective import duty suspension and refund schemes. Most synthetic fibers are subject to import duties of 10 to 25 percent. Manufacturers that import these fibers to produce exportable goods can request a rebate for the duties paid via Pakistan’s duty and tax remission for export (DTRE) program. However,
56 CHAPTER 5 – HOW TO: UPGRADE IN THE TEXTILES AND APPAREL GLOBAL VALUE CHAINQ
UIC
K S
TART
Modernizing Trade in Pakistan: A Policy Roadmap

exporters claim the program has not been as effective as expected. Exporters report that it can take two to four months to import synthetic fibers, which imposes delays and uncertainties in production that are not acceptable to global buyers.
• As a result, the Pakistani apparel industry is dominated by the production of low-value, cotton-based apparel, using poor-quality textiles sourced domestically (Lopez-Acevedo and Robertson 2016). There is one notable exception: denim. Pakistan has been relatively successful in using its rugged cotton to produce globally competitive denim products, particularly trousers.
• While some baseline metrics are encouraging, the industry has been held back by entrenched challenges that have prevented Pakistan from matching the growth of countries such as Vietnam, Bangladesh, and Cambodia. Upstream, there are gaps in
the supply chain that are exacerbated by
a complicated tariff regime (Figure 23). Downstream, apparel producers are
limited by unstable and insufficient
access to energy. Across the entire chain,
institutions fail to engage meaningfully
with one another. Aggregated, these
factors have left foreign investors with
little reason to invest in the country.
80
70
60
50
40
30
20
10
01980 1990 2000 2010 2020 2030
Cotton Polyester
Figure 22. Total fiber demand (million tons)
Source: Textile World (2015)
57CHAPTER 5 – HOW TO: UPGRADE IN THE TEXTILES AND APPAREL GLOBAL VALUE CHAIN
QU
ICK
STA
RT
Modernizing Trade in Pakistan: A Policy Roadmap
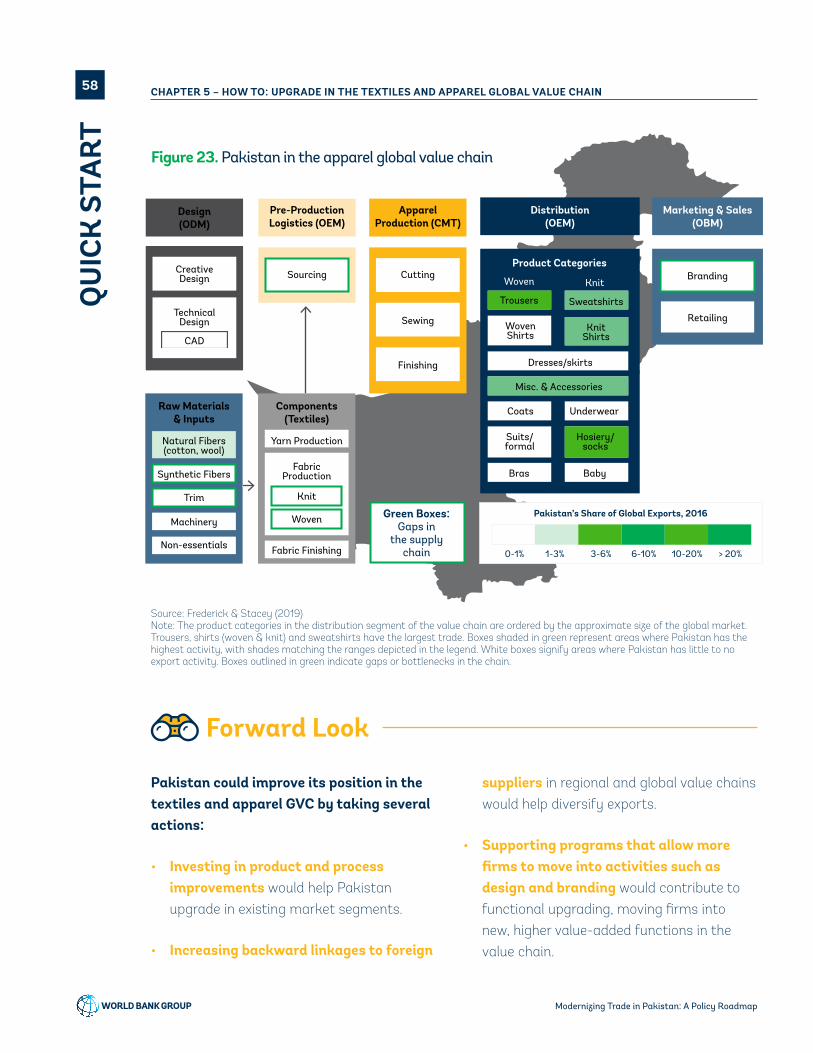
Marketing & Sales(OBM)
Distribution(OEM)
ApparelProduction (CMT)
Pre-ProductionLogistics (OEM)
Sourcing Cutting
Sewing
Yarn Production
FabricProduction
Finishing
Knit
Woven
Fabric FinishingNon-essentials
Machinery
Trim
Synthetic Fibers
Natural Fibers(cotton, wool)
Woven Knit
Sweatshirts
Dresses/skirts
Misc. & Accessories
Coats
Bras Baby
Underwear
Suits/formal
WovenShirts
KnitShirts
Product CategoriesCreativeDesign
TechnicalDesign
CAD
Design(ODM)
Raw Materials& Inputs
Components(Textiles)
Branding
Retailing
Pakistan’s Share of Global Exports, 2016
0-1% 1-3% 3-6% 6-10% 10-20% > 20%
Green Boxes:Gaps in
the supply chain
Trousers
Hosiery/socks
Figure 23. Pakistan in the apparel global value chain
Source: Frederick & Stacey (2019)Note: The product categories in the distribution segment of the value chain are ordered by the approximate size of the global market. Trousers, shirts (woven & knit) and sweatshirts have the largest trade. Boxes shaded in green represent areas where Pakistan has the highest activity, with shades matching the ranges depicted in the legend. White boxes signify areas where Pakistan has little to no export activity. Boxes outlined in green indicate gaps or bottlenecks in the chain.
Forward Look
Pakistan could improve its position in the textiles and apparel GVC by taking several actions:
• Investing in product and process improvements would help Pakistan upgrade in existing market segments.
• Increasing backward linkages to foreign
suppliers in regional and global value chains would help diversify exports.
• Supporting programs that allow more firms to move into activities such as design and branding would contribute to functional upgrading, moving firms into new, higher value-added functions in the value chain.
58 CHAPTER 5 – HOW TO: UPGRADE IN THE TEXTILES AND APPAREL GLOBAL VALUE CHAINQ
UIC
K S
TART
Modernizing Trade in Pakistan: A Policy Roadmap
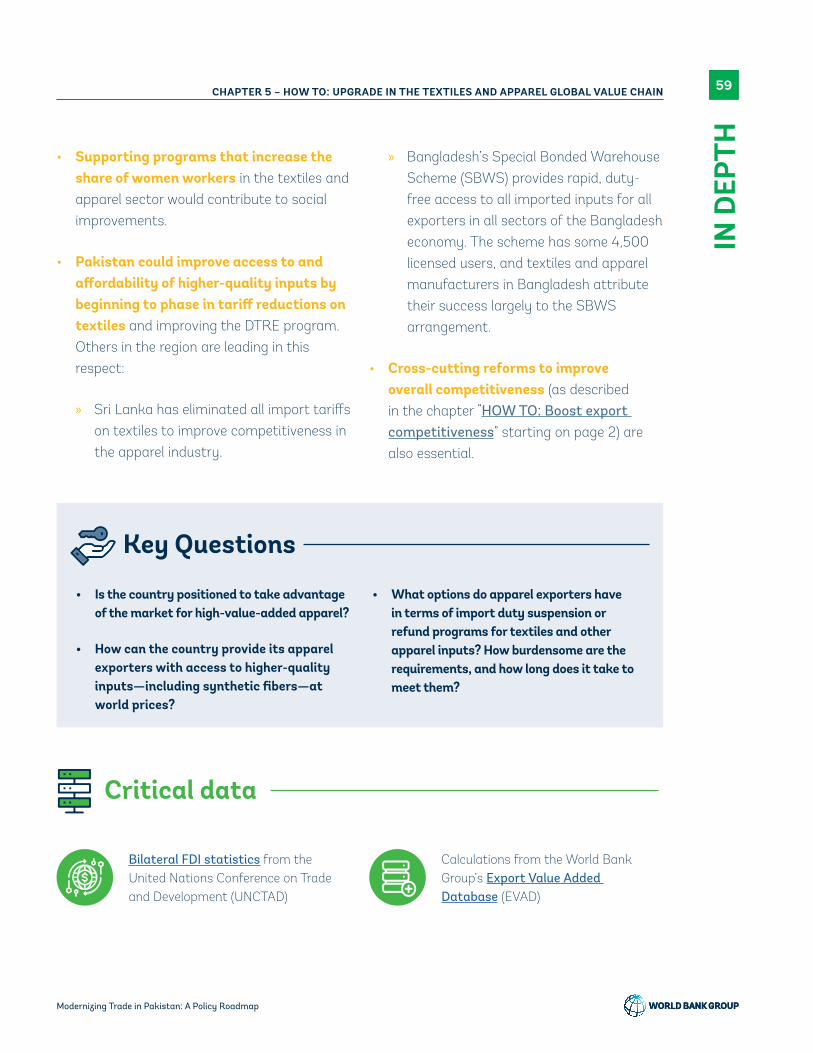
• Supporting programs that increase the share of women workers in the textiles and apparel sector would contribute to social improvements.
• Pakistan could improve access to and affordability of higher-quality inputs by beginning to phase in tariff reductions on textiles and improving the DTRE program. Others in the region are leading in this respect:
» Sri Lanka has eliminated all import tariffs on textiles to improve competitiveness in the apparel industry.
» Bangladesh’s Special Bonded Warehouse Scheme (SBWS) provides rapid, duty-free access to all imported inputs for all exporters in all sectors of the Bangladesh economy. The scheme has some 4,500 licensed users, and textiles and apparel manufacturers in Bangladesh attribute their success largely to the SBWS arrangement.
• Cross-cutting reforms to improve overall competitiveness (as described in the chapter “HOW TO: Boost export competitiveness” starting on page 2) are also essential.
• Is the country positioned to take advantage of the market for high-value-added apparel?
• How can the country provide its apparel exporters with access to higher-quality inputs—including synthetic fibers—at world prices?
• What options do apparel exporters have in terms of import duty suspension or refund programs for textiles and other apparel inputs? How burdensome are the requirements, and how long does it take to meet them?
Key Questions
Critical data
Bilateral FDI statistics from the United Nations Conference on Trade and Development (UNCTAD)
Calculations from the World Bank Group’s Export Value Added Database (EVAD)
59CHAPTER 5 – HOW TO: UPGRADE IN THE TEXTILES AND APPAREL GLOBAL VALUE CHAIN
Modernizing Trade in Pakistan: A Policy Roadmap
59
IN D
EPTH

National FDI data obtained from the IMF’s balance of payments database
See “TOOLS: Critical data” starting on page 127 for more information about each of these critical data sources.
Additional FDI data and estimates from sources such as fDi Markets from the Financial Times
Firm-level data on export transactions from customs
Data on trade control measures, including tariffs, para-tariffs, non-tariff measures, etc., provided in UNCTAD’s Trade Analysis Information System (TRAINS) database
Import and export statistics provided by United Nations Commodity Trade Statistics Database (UN Comtrade) or the World Bank Group’s World Integrated Trade Solutions (WITS) database
Methodology
• See the section “Global Value Chain (GVC) Analysis” on page 101 for a summary of the GVC methodology used in this work. The GVC analysis included benchmarking performance against comparators and understanding trends in the global market.
• To gain an understanding of the import duty suspension and refund programs, the World Bank Group team took several steps:
» The World Bank Group used its own templates to diagnose administrative barriers for a set of the available import duty suspension and refund programs. The World Bank Group has used these templates for similar purposes in several countries. Customs officers familiar with each of the programs completed the templates.
» The diagnosis covered the DTRE program, the duty drawback (DD) program, and the manufacturing under bond (MUB) program. Under the DTRE program, exporters may
import inputs to be used in the production of exports duty-free, paying duties only if the final sale is to a buyer inside the customs territory. Under the DD program, customs repays a portion of import duties if the manufactured goods are exported within 2 years. Under the MUB program, exporters may import duty-free inputs that customs releases only into licensed, clearly defined private warehouses from which exports are manufactured.
» In addition, to learn how exporters perceive the operation of the various import duty suspension and refund programs, the World Bank Group conducted a survey of 80 exporters.
» Further, the World Bank Group conducted six focus groups to enable the team to validate the survey results. The team met with four groups in Karachi and two groups in Lahore. All focus group participants represented textile and apparel exporters who were importing inputs. In all, the team met with some 30 representatives of exporters.
60 CHAPTER 5 – HOW TO: UPGRADE IN THE TEXTILES AND APPAREL GLOBAL VALUE CHAIN
Modernizing Trade in Pakistan: A Policy Roadmap
60IN
DEP
TH

Actions
The World Bank Group analysis of Pakistan’s textiles and apparel value chain led to observations about Pakistan’s performance, strengths, impediments, and options for improvement. In summary, although Pakistan has certain strengths in the textile and apparel industry (primarily low labor costs and competitiveness in the market for trousers), it is underperforming in the global market. Pakistan’s low competitiveness can be attributed mainly to its reliance on low-quality domestic cotton to the exclusion of the synthetic fabrics and high-quality cotton from which high-value-added apparel is made. Pakistan’s dependence on low-quality cotton can be traced to its domestic cotton industry and the difficulty that its exporters have in importing high-quality cotton and synthetic fibers at world prices. Pakistan can improve its competitiveness by upgrading its position in the apparel value chain and redesigning import duty suspension and refund programs for exporters.
PAKISTAN’S PERFORMANCE
Pakistan lags competitors and comparators
• Pakistan’s textiles and apparel exports, at USD 10.6 billion in 2006, grew to only 12.8 billion by 2015, a growth rate of 2.1 percent (Figure 24). By contrast, Bangladesh’s textiles and apparel exports grew from USD 9.9 billion in 2006 to USD 28.3 billion in 2015, a growth rate of 12.3 percent. Because of its slow growth in the industry, Pakistan is losing ground to its competitors. In 2006, Pakistan was exporting more textiles and apparel than Bangladesh and Vietnam. By 2015, both Bangladesh and Vietnam had surpassed Pakistan.
5
10
15
20
25
30
35
2006 2010 2015
Year
Billi
ons
Country
BangladeshCambodiaIndiaPakistanTurkeyVietnam
Figure 24. Textiles and apparel exports, USD billions
Source: UN Comtrade
61CHAPTER 5 – HOW TO: UPGRADE IN THE TEXTILES AND APPAREL GLOBAL VALUE CHAIN
Modernizing Trade in Pakistan: A Policy Roadmap
61
IN D
EPTH
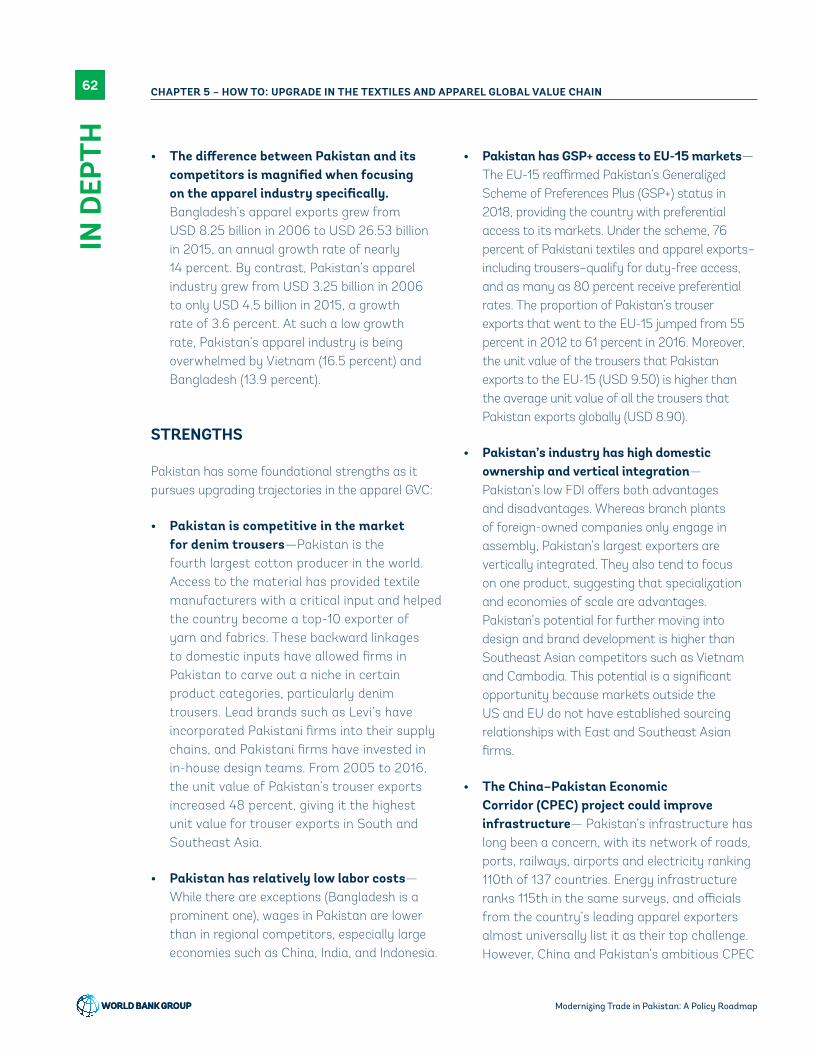
• The difference between Pakistan and its competitors is magnified when focusing on the apparel industry specifically. Bangladesh’s apparel exports grew from USD 8.25 billion in 2006 to USD 26.53 billion in 2015, an annual growth rate of nearly 14 percent. By contrast, Pakistan’s apparel industry grew from USD 3.25 billion in 2006 to only USD 4.5 billion in 2015, a growth rate of 3.6 percent. At such a low growth rate, Pakistan’s apparel industry is being overwhelmed by Vietnam (16.5 percent) and Bangladesh (13.9 percent).
STRENGTHS
Pakistan has some foundational strengths as it pursues upgrading trajectories in the apparel GVC:
• Pakistan is competitive in the market for denim trousers—Pakistan is the fourth largest cotton producer in the world. Access to the material has provided textile manufacturers with a critical input and helped the country become a top-10 exporter of yarn and fabrics. These backward linkages to domestic inputs have allowed firms in Pakistan to carve out a niche in certain product categories, particularly denim trousers. Lead brands such as Levi’s have incorporated Pakistani firms into their supply chains, and Pakistani firms have invested in in-house design teams. From 2005 to 2016, the unit value of Pakistan’s trouser exports increased 48 percent, giving it the highest unit value for trouser exports in South and Southeast Asia.
• Pakistan has relatively low labor costs—While there are exceptions (Bangladesh is a prominent one), wages in Pakistan are lower than in regional competitors, especially large economies such as China, India, and Indonesia.
• Pakistan has GSP+ access to EU-15 markets—The EU-15 reaffirmed Pakistan’s Generalized Scheme of Preferences Plus (GSP+) status in 2018, providing the country with preferential access to its markets. Under the scheme, 76 percent of Pakistani textiles and apparel exports–including trousers–qualify for duty-free access, and as many as 80 percent receive preferential rates. The proportion of Pakistan’s trouser exports that went to the EU-15 jumped from 55 percent in 2012 to 61 percent in 2016. Moreover, the unit value of the trousers that Pakistan exports to the EU-15 (USD 9.50) is higher than the average unit value of all the trousers that Pakistan exports globally (USD 8.90).
• Pakistan’s industry has high domestic ownership and vertical integration—Pakistan’s low FDI offers both advantages and disadvantages. Whereas branch plants of foreign-owned companies only engage in assembly, Pakistan’s largest exporters are vertically integrated. They also tend to focus on one product, suggesting that specialization and economies of scale are advantages. Pakistan’s potential for further moving into design and brand development is higher than Southeast Asian competitors such as Vietnam and Cambodia. This potential is a significant opportunity because markets outside the US and EU do not have established sourcing relationships with East and Southeast Asian firms.
• The China–Pakistan Economic Corridor (CPEC) project could improve infrastructure— Pakistan’s infrastructure has long been a concern, with its network of roads, ports, railways, airports and electricity ranking 110th of 137 countries. Energy infrastructure ranks 115th in the same surveys, and officials from the country’s leading apparel exporters almost universally list it as their top challenge. However, China and Pakistan’s ambitious CPEC
62 CHAPTER 5 – HOW TO: UPGRADE IN THE TEXTILES AND APPAREL GLOBAL VALUE CHAIN
Modernizing Trade in Pakistan: A Policy Roadmap
62IN
DEP
TH

project is slated to improve infrastructure throughout Pakistan, especially in areas that have textile and apparel production. Improved roads and electric utilities are potential benefits from the engagement, and Chinese officials are reportedly interested in investing in Pakistani yarn and cloth production. See Box 2 on page 23 for more information about the CPEC.
CHALLENGES
The World Bank Group analysis reveals that, despite its strengths, Pakistan must overcome certain challenges to increase its competitiveness in the textiles and apparel industry:
• Pakistan has not diversified into higher-value-added apparel—In the global textiles and apparel industry, apparel is the highest value-adding product group. However, apparel accounted for only 35 percent of Pakistan’s textiles and apparel exports in 2015. By contrast, apparel accounted for more than 90 percent of the textiles and apparel exports of
both Cambodia and Bangladesh and about 80 percent of Vietnam’s textiles and apparel exports (Figure 25). Moreover, even within the apparel product group specifically, Pakistan produces primarily low-priced products (Figure 26).
• Higher-value apparel uses synthetic fibers and high-quality cotton—The global apparel market is moving toward the production of technical and high-fashion apparel. These high-value-added products are based on high-quality cotton and synthetic fibers. Apparel made from synthetic fibers, in particular, has higher unit values compared to cotton: USD 7.30 per unit compared with USD 5.20 in 2015. Synthetic fibers’ share of global apparel exports increased from 26 percent in 2005 to 35 percent in 2016.
• Pakistan’s textiles and apparel industry exports little synthetic fiber—Synthetic fibers contribute to the production of only 12 percent of Pakistan’s textiles and apparel exports (Figure 26). By comparison, synthetic fibers contribute to more than 50 percent of India’s exports and more than 40 percent
98% 94%
79%
61% 60%
48%
35%
0102030
405060
708090
100
Cambodia Bangladesh Vietnam Turkey China India Pakistan
Perc
ent
(%)
Figure 25. Apparel share in exports by Pakistan and its competitors in 2015
Source: UN Comtrade and World Bank Analysis
63CHAPTER 5 – HOW TO: UPGRADE IN THE TEXTILES AND APPAREL GLOBAL VALUE CHAIN
Modernizing Trade in Pakistan: A Policy Roadmap
63
IN D
EPTH

0 5 10 15 20 25 30 35
Knitted Socks etc
Bed Linen etc
Knitted T-Shirts
Men's Apparel
Women's Apparel
Knitted Men's Apparel
Knitted Women's Apparel
Women's Coats
Men's Shirts
Jerseys, Pullovers etc
Women's Shirts
USD
Bangladesh Turkey Pakistan
Figure 26. Average price per unit fetched by products over 2009–2011 (USD/unit)
Source: UN Comtrade and World Bank Analysis
of the exports of both Vietnam and China. Although Bangladesh has the lowest reliance on synthetic fibers among its competitors, at only 18 percent, that share is one and a half times Pakistan’s share.
• Few exporters are importing synthetic fibers—Synthetic fibers for export were only a third of the value of all inputs imported by Pakistan’s apparel and textiles exporters and only some 40 percent of the total value of synthetic fiber imports into Pakistan. This implies that synthetic fiber products are mainly being imported as inputs into the domestic market.
• Instead, Pakistan relies heavily on its own low-quality cotton—Pakistan produces only
short staple fiber raw cotton with a very high trash content (9 percent as opposed to a global average of 3 to 4 percent) and a very high moisture content. High fashion, high price, high-value-added yarns, cloths, and apparel require long staple, clean dry raw cotton. Pakistan’s poor-quality raw cotton results in defects and low-quality fabrics that are usually not printed or dyed, and that cannot be used in higher-quality apparel. Yet, the majority of Pakistan’s textiles and apparel manufacturers still rely on the extensive use of domestically sourced cotton and material inputs. (Approximately 85 percent of the inputs into Pakistan’s textiles and apparel industry are sourced domestically.) Thus, Pakistan’s apparel exports have largely concentrated on low-quality cotton outputs, running against the grain in the global industry.
64 CHAPTER 5 – HOW TO: UPGRADE IN THE TEXTILES AND APPAREL GLOBAL VALUE CHAIN
Modernizing Trade in Pakistan: A Policy Roadmap
64IN
DEP
TH

• High-value apparel exporters must import high-quality cotton—The low quality of Pakistan’s domestic cotton has pushed exporters to import higher-quality cotton from other countries to blend for textile production and eventual use in apparel manufacturing. Although Pakistan is the fourth largest producer of cotton globally, it is also the sixth largest importer.
• Import lead times are not competitive—Pakistan’s textile and apparel production centers are more inland than competitors’ and not clustered in SEZs. For Pakistan to significantly grow exports, improving lead times will be critical for competitiveness.
• Inefficient import duty suspension and refund programs contribute to Pakistan’s inability to import high-value fabrics at world prices—For manufacturers importing synthetic fabric and high-quality cotton for use in apparel, imported inputs can be 50
percent to 75 percent of their total production costs, but these imported inputs are expensive in Pakistan. Moreover, studies have grouped Pakistan with South Asia’s least competitive countries in terms of lead times and reliability due to trade logistics, placing it well below countries such as Sri Lanka, China, and Vietnam. Efficient import duty suspension and refund programs could speed the process and lower the cost of imports. However, Pakistan’s programs are slow and costly. Some of the issues perceived by the private sector:
» The process is opaque. There is almost no public information to help a new user navigate the application process. Only a select few know exactly how an application is approved.
» Administration is complex. The programs require submitting between 11 and 20 documents for each new product. They require review or signature by at least four and as many as six people. Independent
Figure 27. Textiles and apparel exports by material, 2016 (percent total)
Source: UN Comtrade and World Bank Analysis
52% 45% 43% 39% 38% 32% 28% 23% 18% 12%
32% 35%26% 39% 46% 47%
41% 57% 71% 77%
16% 19% 30%22% 16% 22% 31%
20%11% 11%
0102030405060708090
100
Indonesia
Vietnam
China
Morocco
Cambodia
Turkey
Sri Lanka
India
Bangladesh
Pakistan
Perc
ent
(%)
Synthetic fiber Cotton Other
65CHAPTER 5 – HOW TO: UPGRADE IN THE TEXTILES AND APPAREL GLOBAL VALUE CHAIN
Modernizing Trade in Pakistan: A Policy Roadmap
65
IN D
EPTH

analysis and inspection may be required. Any of the reviews may result in a rejection or indefinite delay of the application.
» There are undue delays. Processing an application takes 75 days on average, far longer than the 15-30 days stipulated by law. Receiving the benefits can take four months.
» The result insufficiently compensates exporters for the import duties they pay. More than 75 percent of duty drawback claimants recover less than half of the duties they pay. Such underpayment reduces the profit margin of apparel exporters and deters them from using imported inputs that they increasingly need if they are to successfully respond to global demands.
• The supporting environment is fragmented—Pakistan has numerous industry associations specific to the textiles and apparel industry. However, each puts its own objectives and interests first, occasionally to the detriment of the value chain as a whole. While the Ministry of Textiles could provide a holistic direction for the industry—setting strategies and policies for the entire sector—that does not appear to be its focus. It provides resources to each stage but not an overall direction.
• Labor shortages limit the sector’s potential—Pakistan’s textiles and apparel industry has asked the government to pay for very basic training that would be exceptional globally. In addition, many textiles and apparel factories are located far from urban areas. The lack of public transportation and gender-based restrictions on mobility make it difficult to attract workers.
• Safety is another concern—Pakistan’s reputation and the travel advisories that have been instituted by the United States government and others limit networking opportunities for Pakistan exporters.
• Textile and apparel exporters in Pakistan have difficulty retaining export relationships—Between 2010 and 2015, Pakistan maintained only 17 of 53 textile export relationships. The significant rate at which Pakistan’s trade relationships fail to survive reflects the inability of Pakistan’s exporters to adjust to changing global trade dynamics.
• Limited FDI leaves parts of Pakistan’s domestic sector disconnected from the global industry—Although there are benefits associated with limited foreign ownership, there are also costs. Pakistan’s low FDI in the textiles and apparel industry deprives it of access to new markets and inputs that could facilitate product diversification. Moreover, it prevents Pakistani firms from distinguishing themselves in existing markets such as the US.
• Regimes for trade, investment, taxes and tariffs are complicated and inefficient—One of the reasons for the low FDI in the apparel industry is the assortment of taxes, duties and tariffs on a wide range of goods. Pakistan has SEZ programs, but most apparel companies that export from Pakistan do not take advantage of them.
RECOMMENDATIONS
• Based on the World Bank Group analysis, Pakistan could improve competitiveness in the textiles and apparel value chain by taking a variety of actions in two areas: (1) upgrading in the apparel value chain and (2) improving access to high-quality inputs at world prices. We discuss these areas in turn.
Upgrading in the apparel value chain
Pakistan’s strengths in the textile and apparel sector revolve around its integrated industry with
66 CHAPTER 5 – HOW TO: UPGRADE IN THE TEXTILES AND APPAREL GLOBAL VALUE CHAIN
Modernizing Trade in Pakistan: A Policy Roadmap
66IN
DEP
TH
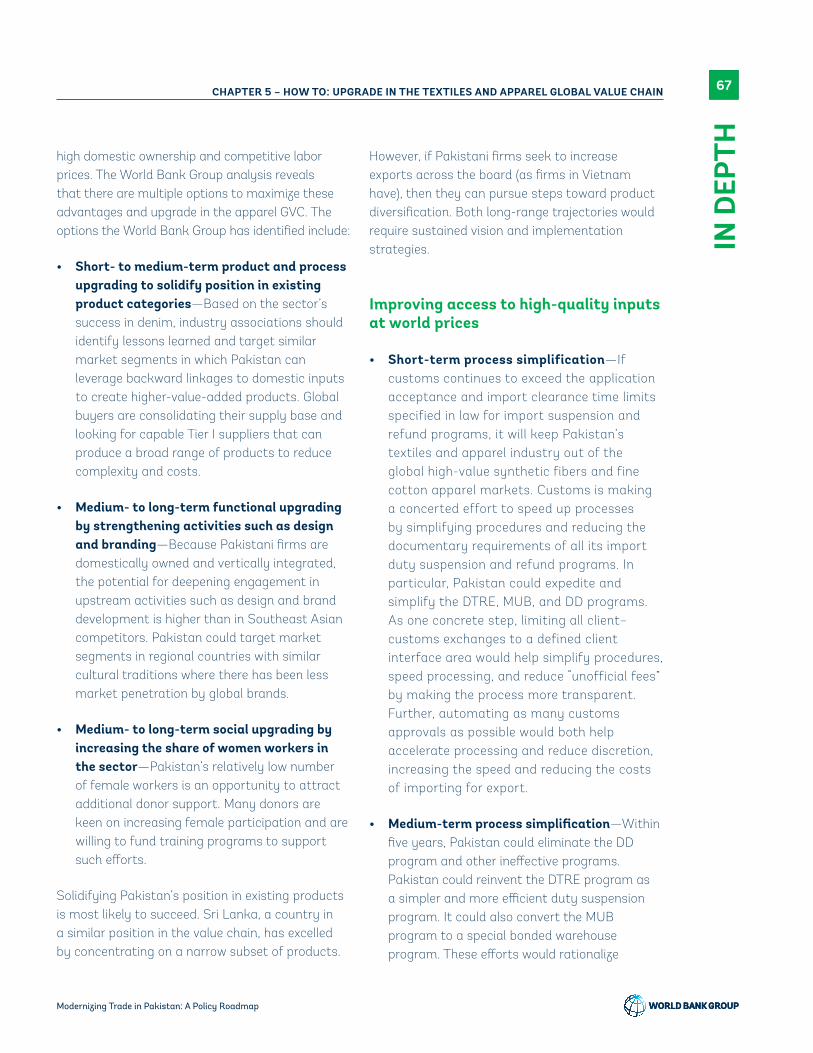
high domestic ownership and competitive labor prices. The World Bank Group analysis reveals that there are multiple options to maximize these advantages and upgrade in the apparel GVC. The options the World Bank Group has identified include:
• Short- to medium-term product and process upgrading to solidify position in existing product categories—Based on the sector’s success in denim, industry associations should identify lessons learned and target similar market segments in which Pakistan can leverage backward linkages to domestic inputs to create higher-value-added products. Global buyers are consolidating their supply base and looking for capable Tier I suppliers that can produce a broad range of products to reduce complexity and costs.
• Medium- to long-term functional upgrading by strengthening activities such as design and branding—Because Pakistani firms are domestically owned and vertically integrated, the potential for deepening engagement in upstream activities such as design and brand development is higher than in Southeast Asian competitors. Pakistan could target market segments in regional countries with similar cultural traditions where there has been less market penetration by global brands.
• Medium- to long-term social upgrading by increasing the share of women workers in the sector—Pakistan’s relatively low number of female workers is an opportunity to attract additional donor support. Many donors are keen on increasing female participation and are willing to fund training programs to support such efforts.
Solidifying Pakistan’s position in existing products is most likely to succeed. Sri Lanka, a country in a similar position in the value chain, has excelled by concentrating on a narrow subset of products.
However, if Pakistani firms seek to increase exports across the board (as firms in Vietnam have), then they can pursue steps toward product diversification. Both long-range trajectories would require sustained vision and implementation strategies.
Improving access to high-quality inputs at world prices
• Short-term process simplification—If customs continues to exceed the application acceptance and import clearance time limits specified in law for import suspension and refund programs, it will keep Pakistan’s textiles and apparel industry out of the global high-value synthetic fibers and fine cotton apparel markets. Customs is making a concerted effort to speed up processes by simplifying procedures and reducing the documentary requirements of all its import duty suspension and refund programs. In particular, Pakistan could expedite and simplify the DTRE, MUB, and DD programs. As one concrete step, limiting all client–customs exchanges to a defined client interface area would help simplify procedures, speed processing, and reduce “unofficial fees” by making the process more transparent. Further, automating as many customs approvals as possible would both help accelerate processing and reduce discretion, increasing the speed and reducing the costs of importing for export.
• Medium-term process simplification—Within five years, Pakistan could eliminate the DD program and other ineffective programs. Pakistan could reinvent the DTRE program as a simpler and more efficient duty suspension program. It could also convert the MUB program to a special bonded warehouse program. These efforts would rationalize
67CHAPTER 5 – HOW TO: UPGRADE IN THE TEXTILES AND APPAREL GLOBAL VALUE CHAIN
Modernizing Trade in Pakistan: A Policy Roadmap
67
IN D
EPTH

Additional resources
Frederick, Stacey, and Jack Daly. 2019. “Pakistan in the Apparel Global Value Chain.” Duke University: Duke Global Value Chains Center.
Gereffi, Gary, and Karina Fernandez-Stark. 2011. “Global Value Chain Analysis: A Primer.” Duke University: Center on Globalization, Governance & Competitiveness (CGGC).
Lopez-Acevedo, Gladys, and Raymond Robertson, eds. 2016. Stitches to Riches? Apparel Employment, Trade, and Economic Development in South Asia. Washington, DC: World Bank.
Porter, Michael E. 1980. Competitive Strategy. New York: The Free Press/Macmillan.
Portugal, Alberto, José-Daniel Reyes, and Gonzalo Varela. 2015. “Uruguay: Trade Competitiveness Diagnostic.” Report. World Bank, Washington, DC.
Reis, Jose Guilherme and Thomas Farole. 2012. Trade Competitiveness Diagnostic Toolkit. Washington, DC: World Bank.
Shah, Fatima. 2006. “Pakistan: Value Chain Analysis.” Foreign Investment Advisory Service Rep. No. 37528. Washington, DC: World Bank.
Shaikh, Hina. 2015. “Moving Pakistan up the Value Chain: Opportunities in Textiles and Garments.” London: International Growth Centre (IGC). July 29, 2015.
Taglioni, Daria, and Deborah Winkler. 2016. Making Global Value Chains Work for Development. Washington, DC: World Bank.
Textile World. 2015. “Man-Made Fibers Continue To Grow.” February 4, 2015. Summarizes the history of, and forecasts, demand for synthetic fibers.
World Bank. 2015. “How to Sustain Export Dynamism by Reducing Duality in the Dominican Republic.” Report. Washington, DC.
See “TOOLS: Additional resources” starting on page 135 for more information about each of these publications and toolkits.
Pakistan’s import duty suspension and refund programs, making it faster and cheaper for exporters to import the inputs they need to be competitive.
• Long-term process simplification—Within 10 years, Pakistan could rationalize tariffs by applying
a uniform low rate to all items at the HS Code 8-digit level, abolish regulatory duties on relevant products, and set the value-added tax on domestic sales to a rate that maintains revenue neutrality. Together with the previous reforms, these changes would give exporters the opportunity to import high-quality imports at world prices.
68 CHAPTER 5 – HOW TO: UPGRADE IN THE TEXTILES AND APPAREL GLOBAL VALUE CHAIN
Modernizing Trade in Pakistan: A Policy Roadmap
68IN
DEP
TH

HOW TO: Boost agricultural exports6
This chapter synthesizes analyses and findings from reports and notes prepared by Samidh Shrestha (International Trade Center), Gonzalo Varela (Senior Economist) and Mondher Mimouni (International Trade Center).
Getty Images
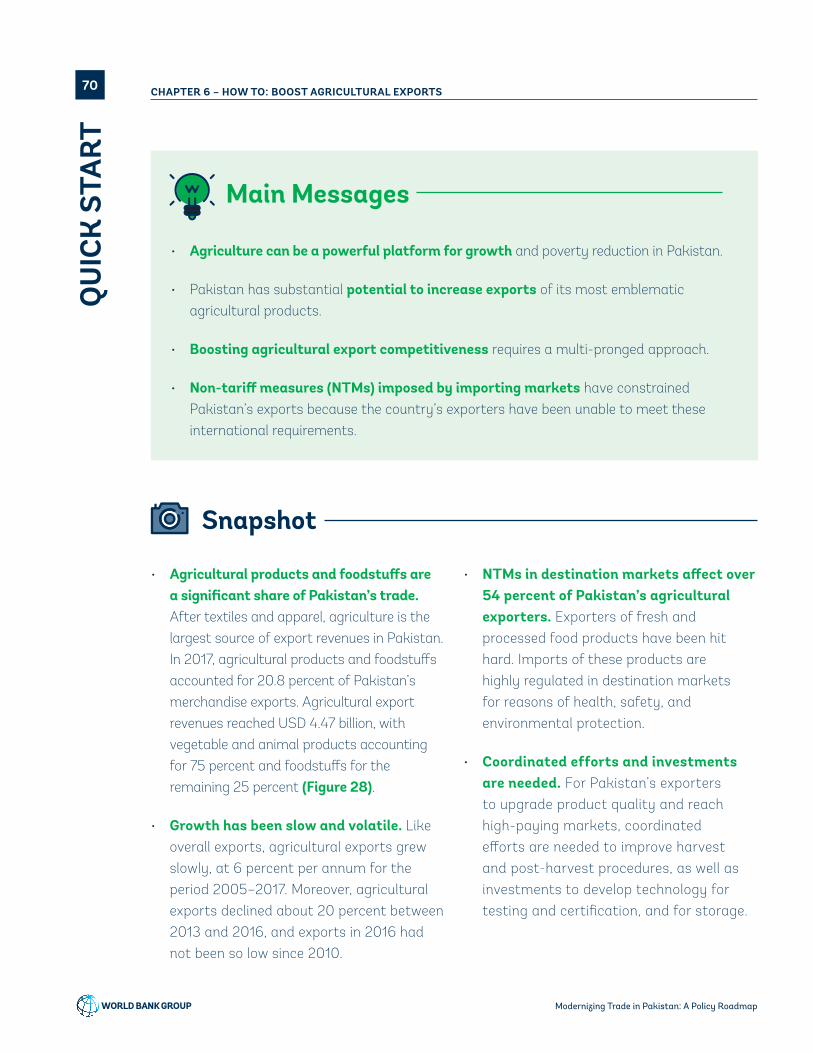
Main Messages
• Agriculture can be a powerful platform for growth and poverty reduction in Pakistan.
• Pakistan has substantial potential to increase exports of its most emblematic agricultural products.
• Boosting agricultural export competitiveness requires a multi-pronged approach.
• Non-tariff measures (NTMs) imposed by importing markets have constrained Pakistan’s exports because the country’s exporters have been unable to meet these international requirements.
Snapshot
• Agricultural products and foodstuffs are a significant share of Pakistan’s trade. After textiles and apparel, agriculture is the largest source of export revenues in Pakistan. In 2017, agricultural products and foodstuffs accounted for 20.8 percent of Pakistan’s merchandise exports. Agricultural export revenues reached USD 4.47 billion, with vegetable and animal products accounting for 75 percent and foodstuffs for the remaining 25 percent (Figure 28).
• Growth has been slow and volatile. Like overall exports, agricultural exports grew slowly, at 6 percent per annum for the period 2005–2017. Moreover, agricultural exports declined about 20 percent between 2013 and 2016, and exports in 2016 had not been so low since 2010.
• NTMs in destination markets affect over 54 percent of Pakistan’s agricultural exporters. Exporters of fresh and processed food products have been hit hard. Imports of these products are highly regulated in destination markets for reasons of health, safety, and environmental protection.
• Coordinated efforts and investments are needed. For Pakistan’s exporters to upgrade product quality and reach high-paying markets, coordinated efforts are needed to improve harvest and post-harvest procedures, as well as investments to develop technology for testing and certification, and for storage.
70 CHAPTER 6 – HOW TO: BOOST AGRICULTURAL EXPORTSQ
UIC
K S
TART
Modernizing Trade in Pakistan: A Policy Roadmap

0
1
2
3
4
5
6
2005 2006 2007 2008 2009 2010 2011 2012 2013 2014 2015 2016 2017
Agriculture Foodstuffs Total
Forward Look
Figure 28. Pakistan’s exports of agricultural products and foodstuffs, 2005-2017
Source: Authors’ calculations based on UN Comtrade
The following actions would help boost growth in agricultural exports:
• Reducing tariffs and para-tariffs for intermediates and capital goods to boost productivity.
• Increasing efficiency of enabling services to reduce production costs.
• Improving quality infrastructure to help producers meet the import requirements of
high-end and fast-growing markets.
• Strengthening connectivity with the region and the world to boost trade.
• Providing incentives for upgrading knowledge and technologies in the sector to increase productivity.
• Intensifying export promotion in high-potential markets.
71CHAPTER 6 – HOW TO: BOOST AGRICULTURAL EXPORTS
QU
ICK
STA
RT
Modernizing Trade in Pakistan: A Policy Roadmap

• How much potential does the country have to increase agricultural exports?
• What actions can a government take to boost growth of agricultural exports?
• To what extent are NTMs restraining growth of agricultural exports?
Key Questions
Critical data
Agricultural data from FAOSTAT
Import and export statistics provided by United Nations Commodity Trade Statistics Database (UN Comtrade) or the World Bank Group’s World Integrated Trade Solutions (WITS) database
Data on NTMs from the UNCTAD NTM Hub
Data on agriculture and agribusiness from the World Bank Group’s Enabling the Business of Agriculture
See “TOOLS: Critical data” starting on page 127 for more information about each of these critical data sources.
Methodology
• Much of the analysis described here was based on the Trade Competitiveness Diagnostic Toolkit. See Box 1 and Figure 4 on page 8 for more information about this essential toolkit.
• The ITC NTM business surveys are based on a global methodology adjusted to country-specific requirements. Their aim is to assist countries in understanding the non-tariff barriers to trade that their business sectors
72 CHAPTER 6 – HOW TO: BOOST AGRICULTURAL EXPORTS
Modernizing Trade in Pakistan: A Policy Roadmap
72IN
DEP
TH

face. The core part of the NTM survey is identical in all surveyed countries, enabling cross-country analyses and comparison. The country-specific part allows flexibility in addressing the requirements and needs of each participating country. The NTM surveys cover legally registered companies, of all sizes and types of ownership, exporting and importing goods. Companies trading services are excluded because a survey on NTMs in services would require a different approach and methodology. The objective of the NTM surveys requires a representative sample allowing for the extrapolation of the survey results to the country level. To achieve this objective, the NTM survey covers at least 90 percent of the total export value of each participating country (excluding minerals and arms).
• The representatives of the surveyed companies are generally export/import specialists or senior-level managers. They are asked to report trade-related problems that were serious impediments for their companies in the previous year. To identify companies that experience burdensome NTMs, the survey process consists of telephone interviews with all companies in the sample (Step 1) and face-to-face interviews undertaken with the companies that reported difficulties with NTMs during the telephone interviews (Step 2). In addition, open-ended discussions are held with national experts and stakeholders, for example trade support institutions and sector/export associations. These discussions provide further insights, quality checks and validation of the NTM survey results.
Actions
OBSERVATIONS
World Bank Group analysis led to these observations:
• Pakistan’s agricultural exports are concentrated in a few products. Rice exports account for the bulk of agricultural exports. Semi- or wholly-milled rice has decreased in importance recently, while alcohol, sugars, and fruits—in particular, citrus (mandarins)—have increased. Bovine meat featured among the top ten agricultural export products in 2017.
• Pakistan’s agricultural exports are mainly directed to low- and middle-income countries. Afghanistan absorbs 15 percent of Pakistan’s agricultural exports; Arab countries absorb 19 percent of them. China, Thailand and
Vietnam have become important buyers for Pakistan recently, reflecting their increasing importance in the global economy, and pointing to trade opportunities given their growth prospects.
• Short-lived export relationships are a challenge to agricultural export growth. Of 100 new export relationships starting in 2005, 80 remained active after one year, and only 42 after 5 years. For relationships starting in 2010, prospects worsened. Only 78 remained active after one year, and 38 after 5 years (Figure 29). With volatile international prices, exporters of agricultural products face substantial risks affecting their profit margins, making it difficult to survive and consolidate export growth.
73CHAPTER 6 – HOW TO: BOOST AGRICULTURAL EXPORTS
Modernizing Trade in Pakistan: A Policy Roadmap
73
IN D
EPTH
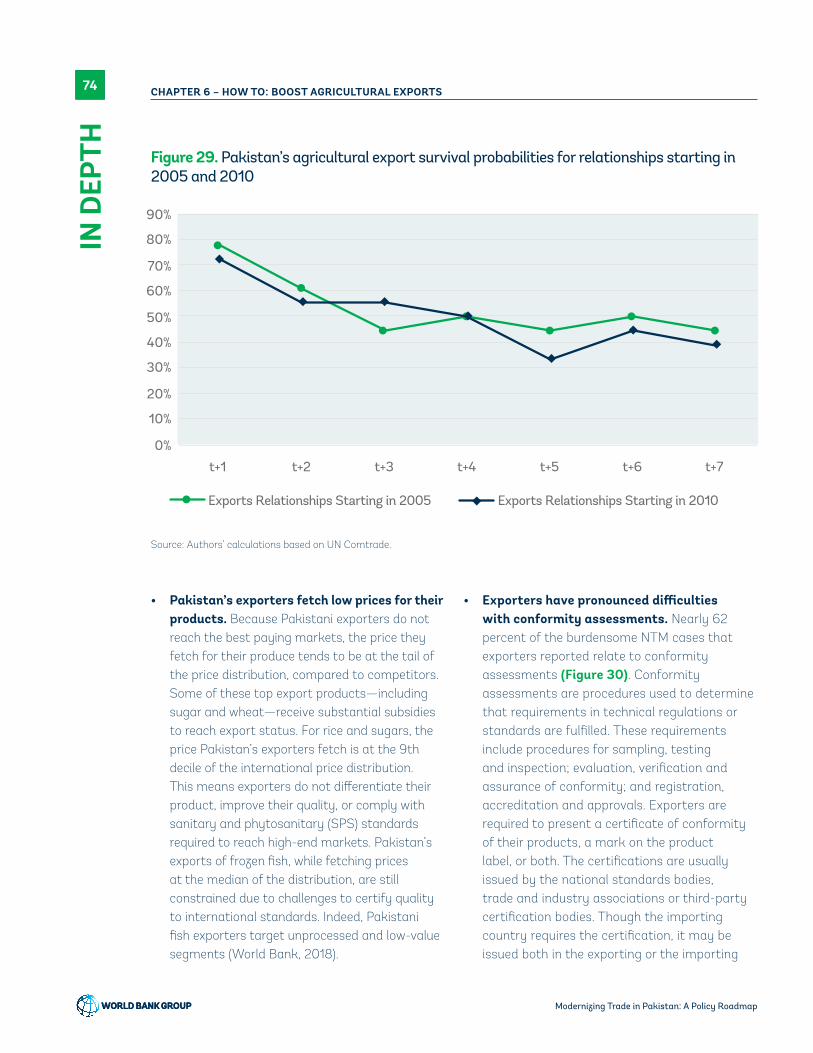
Figure 29. Pakistan’s agricultural export survival probabilities for relationships starting in 2005 and 2010
0%
10%
20%
30%
40%
50%
60%
70%
80%
90%
t+1 t+2 t+3 t+4 t+5 t+6 t+7
Exports Relationships Starting in 2005 Exports Relationships Starting in 2010
Source: Authors’ calculations based on UN Comtrade.
• Pakistan’s exporters fetch low prices for their products. Because Pakistani exporters do not reach the best paying markets, the price they fetch for their produce tends to be at the tail of the price distribution, compared to competitors. Some of these top export products—including sugar and wheat—receive substantial subsidies to reach export status. For rice and sugars, the price Pakistan’s exporters fetch is at the 9th decile of the international price distribution. This means exporters do not differentiate their product, improve their quality, or comply with sanitary and phytosanitary (SPS) standards required to reach high-end markets. Pakistan’s exports of frozen fish, while fetching prices at the median of the distribution, are still constrained due to challenges to certify quality to international standards. Indeed, Pakistani fish exporters target unprocessed and low-value segments (World Bank, 2018).
• Exporters have pronounced difficulties with conformity assessments. Nearly 62 percent of the burdensome NTM cases that exporters reported relate to conformity assessments (Figure 30). Conformity assessments are procedures used to determine that requirements in technical regulations or standards are fulfilled. These requirements include procedures for sampling, testing and inspection; evaluation, verification and assurance of conformity; and registration, accreditation and approvals. Exporters are required to present a certificate of conformity of their products, a mark on the product label, or both. The certifications are usually issued by the national standards bodies, trade and industry associations or third-party certification bodies. Though the importing country requires the certification, it may be issued both in the exporting or the importing
74 CHAPTER 6 – HOW TO: BOOST AGRICULTURAL EXPORTS
Modernizing Trade in Pakistan: A Policy Roadmap
74IN
DEP
TH
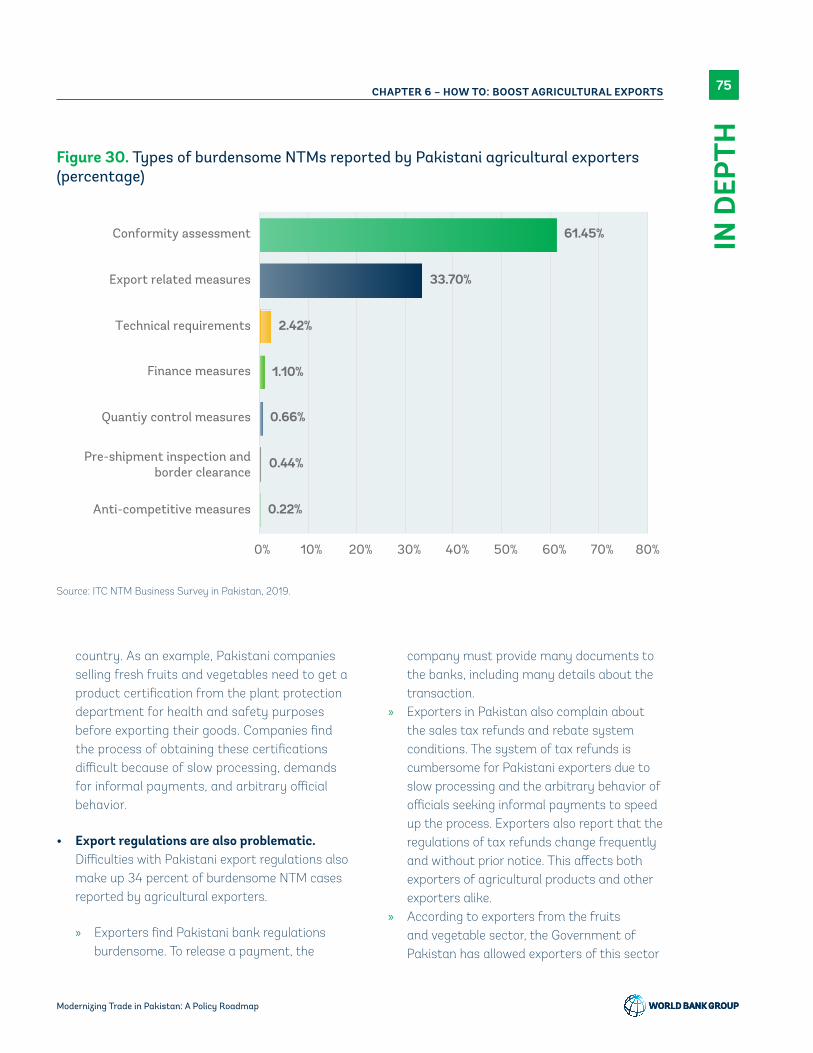
Figure 30. Types of burdensome NTMs reported by Pakistani agricultural exporters (percentage)
Source: ITC NTM Business Survey in Pakistan, 2019.
country. As an example, Pakistani companies selling fresh fruits and vegetables need to get a product certification from the plant protection department for health and safety purposes before exporting their goods. Companies find the process of obtaining these certifications difficult because of slow processing, demands for informal payments, and arbitrary official behavior.
• Export regulations are also problematic. Difficulties with Pakistani export regulations also make up 34 percent of burdensome NTM cases reported by agricultural exporters.
» Exporters find Pakistani bank regulations burdensome. To release a payment, the
company must provide many documents to the banks, including many details about the transaction.
» Exporters in Pakistan also complain about the sales tax refunds and rebate system conditions. The system of tax refunds is cumbersome for Pakistani exporters due to slow processing and the arbitrary behavior of officials seeking informal payments to speed up the process. Exporters also report that the regulations of tax refunds change frequently and without prior notice. This affects both exporters of agricultural products and other exporters alike.
» According to exporters from the fruits and vegetable sector, the Government of Pakistan has allowed exporters of this sector
0.22%
0.44%
0.66%
1.10%
2.42%
33.70%
61.45%
Anti-competitive measures
Pre-shipment inspection andborder clearance
Quantiy control measures
Finance measures
Technical requirements
Export related measures
Conformity assessment
0% 10% 20% 30% 40% 50% 60% 70% 80%
75CHAPTER 6 – HOW TO: BOOST AGRICULTURAL EXPORTS
Modernizing Trade in Pakistan: A Policy Roadmap
75
IN D
EPTH

to import corrugated boxes without any duty and taxes on the condition that they must be used within 12 months. A penalty is applicable to companies that fail to meet this requirement. However, because the seasons of kinnow (a high-yield mandarin hybrid grown extensively in Pakistan) and mango are short, the boxes are not fully used, resulting in fines (or the full payment of import duties). It has been suggested that this period of 12 months be extended to 24 months to ensure that the boxes are fully used and exporters avoid penalties.
RECOMMENDATIONS
• Making the agricultural sector internationally competitive would have a large effect on export revenues and poverty in Pakistan, where two-thirds of the population lives in rural areas. Several policy levers can help increase agricultural competitiveness. The following are a set of suggestions based on World Bank Group analysis, including interviews with exporters and experiences in other countries.
• Reducing tariffs and para-tariffs for intermediates and capital goods would allow agricultural producers to access fertilizers and machinery at world prices, improving yields and reducing costs. Estimates suggest that in Pakistan, fruit producers, for example, face additional input costs of up to 17.3 percent due to tariffs on intermediates and capital goods needed for fruit farming. In addition, with many of these producers being small, access to duty suspension mechanisms is cumbersome.
• Lowering restrictions on services trade and foreign investment in enabling services would likely lead to increases in export competitiveness. Enabling services, such as
transport and logistics, are key in the cost structure of agricultural producers. In primary agriculture, services can account for 20 percent of all the value created; in foodstuffs, the share reaches 40 percent.
• Improving product quality as well as the quality infrastructure to certify it are necessary conditions to reach high-end markets. In Pakistan, fisheries’ limited capacity for certified high-quality processing inhibits access to lucrative export markets. Poor SPS conditions led the EU to impose an import ban for several years, and others to partially restrict access. Opportunities for exporting bovine meats to the Chinese market are enormous. Chinese imports have increased eleven-fold in the last five years. Yet, tapping into these opportunities requires investments in quality and sanitary certifications to set up zones that are free from foot-and-mouth disease, for example. To export kinnows to Europe, voluntary export restrictions could be lifted with adequate treatment of the fruit fly problem and of several diseases affecting the orchards. A first step in the right direction would be to identify NTMs that are limiting Pakistan’s exporters in key markets, as well as diagnosing the gaps in the quality infrastructure.
• Strengthening the traceability system in Pakistan across all districts is crucial to prevent the spread of infectious diseases. Pakistan could establish a traceability center in Pakistan to ensure that all food products are safe. Tracking food products through all stages of production would help exporters in Pakistan comply with partner countries’ traceability regulations, the EU regulations in particular, given that Europe is one of the main destinations for Pakistani meat.
• Establishing a single halal certification authority in Pakistan with several offices across different provinces would reduce the time and
76 CHAPTER 6 – HOW TO: BOOST AGRICULTURAL EXPORTS
Modernizing Trade in Pakistan: A Policy Roadmap
76IN
DEP
TH

money Pakistani exporters need to spend to get the required certificate showing compliance with Islamic law.
• Fostering export growth also requires tapping into the opportunities that trade with the region provides, which requires continued investments in trade facilitation and connectivity—road infrastructure is crucial for agricultural’s competitiveness—as well as market access negotiations with India. In addition, connectivity with the world is essential. In this area, allowing private airlines (national and international) to fly directly to secondary airports, is a way of reducing cargo costs for highly perishable products that require air transport such as flowers and some high value fruits.
• For the agricultural sector to prosper, investment in knowledge and technologies is imperative. Evidence suggests that the growth of agriculture in Pakistan has been driven by increases in input uses rather than in productivity (Malik et al. 2016). Information and communication technology (ICT) investments for smart irrigation systems, for example, could help alleviate the problem of water scarcity.
• Pakistan would benefit from developing a business process guide for its trade information portal. The first step would be to
document administrative procedures related to compliance with NTMs (e.g., certification of origin, export and import registration) for different products together with other necessary details such as cost and waiting time. Based on this information, Pakistan could develop an online business process guide integrated with the trade information portal. This tool would be most useful if it provided necessary guidance to exporters that are not familiar with the processes involved, especially newer companies.
• To help increase awareness of current technical requirements, Pakistan could also implement an alert mechanism whereby SMEs can subscribe to receive alerts (e.g., by email or SMS) with information updates for markets and products of their interest, including WTO notifications on future changes in technical measures. This would involve building a customized local interface to a new global notifications alert system. In addition to notifying entrepreneurs on new technical regulations, this mechanism would allow them to send their feedback on the proposed regulations back to the WTO via the national focal point.
• Export promotion can help reduce information costs through matching buyers with sellers or providing ‘export intelligence’ to exporters.
77CHAPTER 6 – HOW TO: BOOST AGRICULTURAL EXPORTS
Modernizing Trade in Pakistan: A Policy Roadmap
77
IN D
EPTH
Additional resources
Cadot, Olivier, Mariem Malouche, and Sebastián Sáez. 2012. Streamlining Non-Tariff Measures: A Toolkit for Policy Makers. Washington, DC: World Bank.
Cadot, Olivier, Michael J. Ferrantino, Julien Gourdon, and José-Daniel Reyes. 2018. Reforming Non-Tariff Measures. Washington, DC: World Bank.
International Finance Corporation (IFC). 2016. “Food Safety Toolkit.” Washington, DC: International Finance Corporation (IFC).
Malik, Sohail Jehangir, Ali Shujat, Khalid Riaz, Edward Whitney, Mehrab Malek, and Ahmad Waqas. 2016. “Agriculture, Land, and Productivity in Pakistan.” Chapter 2 in Agriculture and the Rural Economy in Pakistan: Issues, Outlooks, and Policy Priorities,
edited by David J. Speilman, Sohail Jehangir Malik, Paul A. Dorosh, and Nuzhat Ahmad, 41–80. Philadelphia, PA: University of Pennsylvania Press on behalf of the International Food Policy Research Institute (IFPRI).
Riaz, Khalid, and Hans G. P. Jansen. 2012. “Spatial Patterns of Revealed Comparative Advantage of Pakistan’s Agricultural Exports.” Pakistan Economic and Social Review 50 (2): 97–120.
World Bank Group. 2014. “A Guide to Investor Targeting in Agribusiness.” Washington, DC: World Bank.
World Bank Group. 2018. “Revitalizing Pakistan’s Fisheries: Options for Sustainable Development.” Washington, DC: World Bank.
See “TOOLS: Additional resources” starting on page 135 for more information about each of these publications and toolkits.
78 CHAPTER 6 – HOW TO: BOOST AGRICULTURAL EXPORTS
Modernizing Trade in Pakistan: A Policy Roadmap
78IN
DEP
TH
PART III. TRADE IN SERVICES
HOW TO: Use services to support diversification
7
This chapter synthesizes analyses and findings from reports and notes prepared by Sebastian Saez (Lead Economist), Martín Molinuevo (Senior Private Sector Specialist), Sugandha Huria (Consultant), Erik van der Marel (Consultant), Ernesto Fernandez Monge (Consultant), Katrin Pfister (Consultant), Jose Ramon Perea (European Commission), and Heba Shamseldin (Lead Private Sector Specialist).
Getty Images
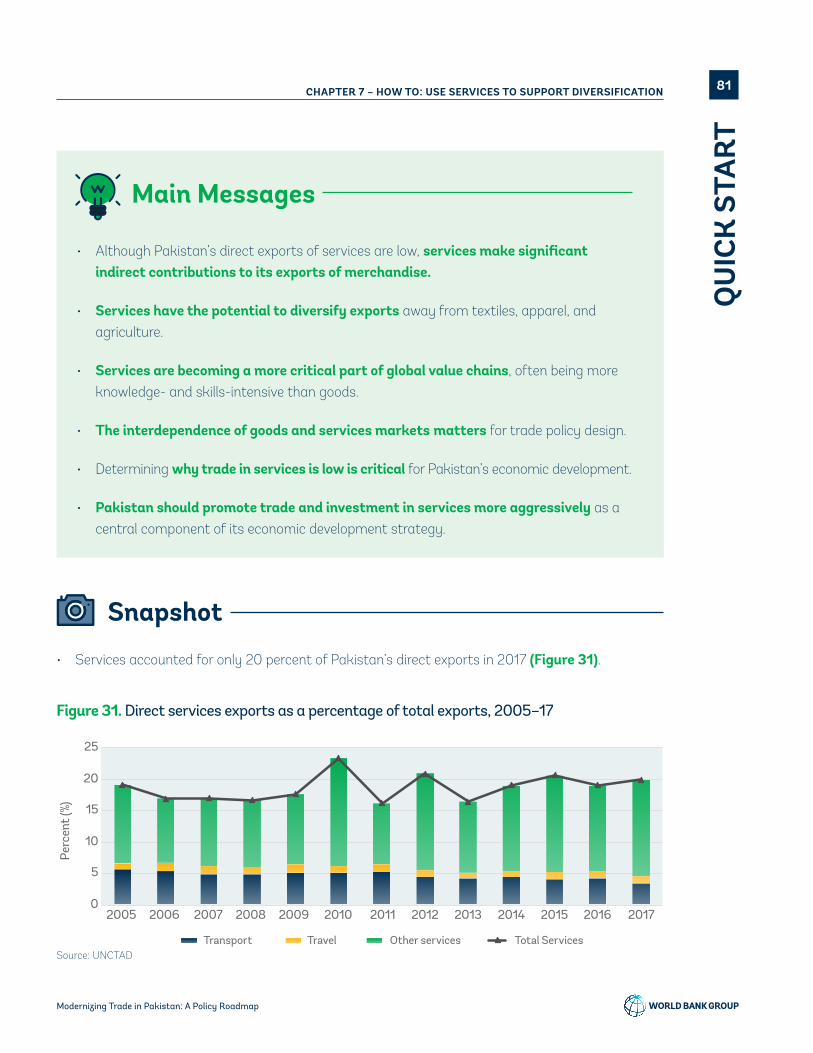
Main Messages
• Although Pakistan’s direct exports of services are low, services make significant indirect contributions to its exports of merchandise.
• Services have the potential to diversify exports away from textiles, apparel, and agriculture.
• Services are becoming a more critical part of global value chains, often being more knowledge- and skills-intensive than goods.
• The interdependence of goods and services markets matters for trade policy design.
• Determining why trade in services is low is critical for Pakistan’s economic development.
• Pakistan should promote trade and investment in services more aggressively as a central component of its economic development strategy.
Snapshot
• Services accounted for only 20 percent of Pakistan’s direct exports in 2017 (Figure 31).
0
5
10
15
20
25
2005 2006 2007 2008 2009 2010 2011 2012 2013 2014 2015 2016 2017
Perc
ent (
%)
Transport Travel Other services Total Services
Figure 31. Direct services exports as a percentage of total exports, 2005–17
Source: UNCTAD
81CHAPTER 7 – HOW TO: USE SERVICES TO SUPPORT DIVERSIFICATION
QU
ICK
STA
RT
Modernizing Trade in Pakistan: A Policy Roadmap

Forward LookIn this chapter, we focus on how to ensure that backbone services for production are working properly in Pakistan. For more information on how to increase direct exports of knowledge-intensive sectors, see the chapter “HOW TO: Scale up knowledge-intensive exports” starting on page 96.
• To implement critical reforms in key backbone services such as transport, energy, logistics, and financial services, Pakistan could begin by defining a national services export promotion strategy, including conducting a diagnostic to assess the restrictiveness of domestic regulations.
• Improving the business environment would facilitate the growth of services firms and Pakistan’s appeal as a destination for FDI in services.
• Harmonizing the taxation regime across the federal government and provincial governments would help eliminate uncertainty, prevent double taxation, and avoid market fragmentation while efficiently generating the required revenues.
• Strengthening coordination in policymaking and improving regulation would increase clarity and certainty for services firms and investors.
• However, services account for 59.8 percent of Pakistan’s overall exports when measured in terms of value added and considering
the contribution of services to exports both directly and indirectly (as inputs into goods that are exported).
• How can we assess the role of services as inputs in the export sector of an economy?
• How can services support export diversification?
Key Questions
Critical data
Data on bilateral trade from the Global Trade Analysis Project (GTAP) database
Data on regulations affecting trade in services from the Services Trade Restrictiveness Index (STRI)
82 CHAPTER 7 – HOW TO: USE SERVICES TO SUPPORT DIVERSIFICATIONQ
UIC
K S
TART
Modernizing Trade in Pakistan: A Policy Roadmap

Methodology
REGULATORY ASSESSMENT TOOLKIT (RASTI)
RASTI provides guidance on how to assess and reform the regulatory policies of service trade industries. The toolkit can help government officials evaluate whether their regulatory frameworks address market failures, achieve public interest goals, and promote the development of efficient domestic services markets. Depending on the circumstances and the needs of the authorities, the toolkit can serve different purposes, including supporting regulatory reform, improving regulatory governance, negotiating and implementing trade agreements, and streamlining regulations to attract foreign investment. RASTI is of particular interest to decision makers and government officials from regulatory bodies, experts at development banks and donor agencies, and academics and researchers in the field of economic regulation.
SERVICE TRADE COMPETITIVENESS DIAGNOSTIC (STCD) TOOLKIT
The STCD Toolkit (“Valuing Services in Trade”) provides a framework, guidelines, and a set of practical tools to conduct a thorough analysis and diagnostic of trade competitiveness in the services sector. The methodology sheds light on a country’s ability to both export services and improve its export performance through policy change. The toolkit is modular. Either a full country diagnostic can be undertaken or various parts of the toolkit can be used to address specific questions of interest, whether they pertain to existing services performance, the potential for expansion and growth in services trade, or policy options to increase competitiveness in services trade. The output of an STCD can be used to assess either the performance of a country’s services sector overall or the performance of individual subsectors. This toolkit complements the analytical framework for trade in goods provided by the Trade Competitiveness Diagnostic Toolkit (Reis and Farole 2012) and allows decision makers and experts in developing countries to better integrate services into their overall trade strategies.
Data on the value of services trade from the OECD Trade in Services database
Import and export statistics provided by United Nations Commodity Trade Statistics Database (UN Comtrade) or the World Bank Group’s World Integrated Trade Solutions (WITS) database
See “TOOLS: Critical data” starting on page 127 for more information about each of these critical data sources.
83CHAPTER 7 – HOW TO: USE SERVICES TO SUPPORT DIVERSIFICATION
Modernizing Trade in Pakistan: A Policy Roadmap
83
IN D
EPTH
Actions
ACTIVITIES
The World Bank Group assessed Pakistan’s services trade performance, analyzed the factors behind this performance, and provided policy recommendations to enhance the role of services in Pakistan’s economic development and competitiveness. The assessment followed the methodology in the STCD toolkit. This framework provides an integrated set of services trade competitiveness analyses and diagnostics using a wide range of indicators, including value-added measures of services exports.
Cross-country and time comparisons were based on the GTAP database. This database contains data on Pakistan and many of its most interesting comparator countries and forms an advanced and up-to-date source for value-added production and exports generally.
This analysis focused on measuring services performance by considering the linkages between services and manufacturing. Moreover, analysis showed how these linkages affect the overall competitiveness of the country and services trade performance. The analysis included three activities:
Activity #1 – Assessing the legal framework
The World Bank Group assessed Pakistan’s current trade outcomes in services along various dimensions to gain a comprehensive picture of its trade competitiveness.
Activity #2 – Assessing the direct and indirect contribution of services to exports
The World Bank Group assessed Pakistan’s services competitiveness through backward and forward linkages, considering the direct and indirect value-added contribution of services to Pakistan’s exports. When export linkages are measured based on the value they add, it is possible to split the contribution of a sector into its direct and indirect contributions. Moreover, an analysis of the indirect value-added contribution of services to exports can be undertaken in two directions—through forward and backward linkages—that yield complementary insights.
Activity #3 – Assessing policy barriers to services performance
The World Bank Group assessed the determinants and channels of trade growth, and the policy barriers that constrain services’ effect on productivity growth in Pakistan. The services sector is an important factor behind cross-country differences in total factor productivity (TFP). This is partly explained by the regulatory policies and frameworks in different countries.
OUTCOMES
The need for diversification
• Pakistan’s exports are highly specialized. Textile industries alone accounted for 60 percent of merchandise export value and 48
84 CHAPTER 7 – HOW TO: USE SERVICES TO SUPPORT DIVERSIFICATION
Modernizing Trade in Pakistan: A Policy Roadmap
84IN
DEP
TH
percent of total exports in 2017. Agriculture products, both vegetable- and animal-related, accounted for an additional 20 percent of merchandise exports and 16 percent of the total. Other exports include marginal shares in advanced manufacturing (for example, medical instruments), metals, chemicals, and plastics.
• The emergence of global value chains has shed new light on the important role services play in economic growth and trade competitiveness. The relative dynamism of the global services sector, its growth in recent years, and its resilience to downturns all demonstrate the sector’s potential to enhance participation in trade, especially for developing countries. Services are trade enablers: not only are services major inputs into agricultural and industrial exports but efficient and reliable services such as transport and logistics are critical for connectivity, competitiveness, and attracting FDI. Some services—from travel and tourism to business and professional services—are also potential stand-alone exports. Pakistan, however, has failed to use services as a catalyst for export revival; its services exports have been low and volatile.
• Growth in Pakistan’s services exports has been grounded primarily in an expansion of financial and telecommunication services. Exports of telecom services increased by 300 percent over the past decade—from USD 252 million in 2007 to USD 1 billion in 2017. Exports of financial services increased by 143 percent over the same period—from USD 67 million in 2007 to USD 163 million in 2017. Transport services lagged most other services, contracting by 8.7 percent from 2007 to 2017, likely due to the sluggish growth of merchandise exports. In Vietnam, by comparison, exports of transport services grew by nearly 40 percent between 2007 and 2017 and now account for 20 percent of its total services exports.
The importance of services
• Services account for about 60 percent of the Pakistani economy and employ more than a third of the country’s labor force. This share is approximately what would be expected according to the country’s level of development. Yet, there is potential for more services sector development in Pakistan. Compared to peer countries, Pakistan has a relatively larger agricultural base, although its industrial sector has been decreasing over the years.
• Services are an engine for Pakistan’s growth. GDP in the services sector grew by 6 percent in 2017, the highest growth rate in a decade. Wholesale and retail trade (which grew by 6.8 percent) and finance and insurance (which grew by 11 percent in 2017 compared to 6 percent in 2016) drove the sector’s recent growth. Transportation, communication, and storage suffered a reduction from 4.8 to 4 percent.
• There is room to accelerate services growth. Pakistan’s average growth rate of services value added since 2000 is in line with that of Russia but lags substantially behind those of China, Indonesia, and India. The size of services sector value added as a portion of the total economy is nearly the same in Pakistan as in India.
• Expanding trade in services is a major opportunity. More services trade (both exports and imports) can help diversify exports, improve the overall competitiveness of the economy, and promote inclusive growth. International trade is no longer exclusively about goods crossing. Services such as professional and business services, financial services, transport, tourism, and IT-enabled services have become increasingly tradable, allowing for the emergence of new and improved export activities.
• Services play a dual role. Services not only constitute direct exports, creating foreign
85CHAPTER 7 – HOW TO: USE SERVICES TO SUPPORT DIVERSIFICATION
Modernizing Trade in Pakistan: A Policy Roadmap
85
IN D
EPTH

exchange, but also serve as inputs into manufacturing value chains. Services can be exported as final services or as intermediate services through other goods and services. In fact, much of the value in manufactured goods today comes from inputs of services industries.
• Services are critical for countries’ participation in GVCs. Services include a wide variety of activities that serve as inputs into GVCs. The inputs include direct services, such as design, marketing, distribution, and customer support. They also include services incorporated into production. This means that services and services policies matter for countries’ relative position in GVCs (that is, where countries are located vis-à-vis final demand).
• The World Bank Group analysis uses value-added terms rather than gross values because the value-added approach better represents the value that the services sector really adds. Goods and services often cross borders several times. Using a value-added approach sheds light on the true domestic content of production and trade, that is, that part for which value is added by the domestic economy. Gross exports capture both the value added embodied in the production of exports as well as all domestic and imported intermediate inputs. Direct value added of exports is a sector’s domestic value added embodied in its own exports, measured as gross exports less domestic and foreign inputs. This measure captures the true sector-specific value added of exports. This is increasingly important in an environment where global production is fragmented across production sharing networks. Total value added of exports includes both the direct value added as well as indirect value added into the exports of other sectors.
• Services are well connected to other economic activities in Pakistan. Figure 32 depicts the backward linkages to services in the manufacturing exports of Pakistan and
comparators. Backward linkages measure the contribution of all upstream sectors to a downstream sector’s production and exports. Examining backward linkages allows comparing services’ contribution to exports measured in terms of value added. If a sector has strong backward linkages, an increase in the final demand for output of the sector will have a strong impact on industries (or services) that intensively supply inputs to it. The backward linkages between the services and manufacturing sectors are a proxy for “servicification,” that is, how much services are demanded, incorporated into value added, and transformed by manufacturing activities. Pakistan’s exported manufacturing sector demands a much larger share of inputs from services than any of its comparators. It is even larger than in Malaysia, Thailand, and Vietnam, countries that have larger manufacturing exports.
• Services contribute significantly to other economic activities. Measured on a value-added basis, services make significant contributions to other goods’ exports through forward linkages. Forward linkages indicate the contribution of an upstream sector as an input into all downstream sectors’ production and exports. If a sector has strong forward linkages, an increase in the final demand of other industries in the economy will have a relatively strong impact on that upstream sector. The true value-added contribution of services to total exports emerges when trade is measured in terms of value added and linkages to other export activities are considered. Measured this way, services account for 59.8 percent of Pakistan’s total exports.
• Trade, road transport, and business services are the most important inputs for Pakistan’s export manufacturing sector. They account for 25, 36, and 21.4 percent of services inputs respectively (Figure 33). In comparison to other countries, road transport weighs heavily in creating value for manufacturing exports in Pakistan. Among
86 CHAPTER 7 – HOW TO: USE SERVICES TO SUPPORT DIVERSIFICATION
Modernizing Trade in Pakistan: A Policy Roadmap
86IN
DEP
TH

comparators, only Malaysia depends more heavily on road transport for adding value in export manufacturing. Business services value creation in export manufacturing in Pakistan is also more important than in many peer countries.
• The interdependence between goods and services feeds back into the development of services. Diversifying Pakistan’s manufacturing (including food processing) industries and increasing its manufacturing exports will raise the demand for other services, and hence, the latter’s indirect value added—both domestic and exported.
• Although direct services exports are comparatively low in Pakistan, services contribute heavily as inputs to goods exports through forward linkages. Considering the forward linkages from services to
other export activities, services exports account for 59.8 percent of Pakistan’s total exports. Of this, 40.94 percentage points (68 percent of the 59.8 percent) represents the role of services in exports of manufactured goods (Figure 34). Moreover, the role of services as inputs into manufacturing exports in Pakistan is higher than in India, the Philippines, Brazil, Malaysia, Thailand, and Vietnam, and similar to Bangladesh.
• The disaggregation of this share also provides important information: transport services together with trade, distribution, and hotels are the main sectors linked to manufacturing exports, representing 14.7 percent and 10.1 percent, respectively. Other activities that are highly demanded by manufacturing are other business services (8.8 percent) and finance
0%
10
20
30
40
50
60
70
80
90
100
Pakistan
China
Indonesia
India
Philippines
Russia
Brazil
South Afri
ca
Banglad
esh
Sri Lan
kaNep
al
Malaysia
Thailand
Vietnam
Inputs from Services Inputs from Manufacturing Inputs from Primary Production
Direct Value Added Inputs from Utilities Inputs from Construction
Perc
ent (
%)
Figure 32. Composition of backward linkages of manufacturing exports
Source: GTAP Database (2014), World Bank Staff Calculations
87CHAPTER 7 – HOW TO: USE SERVICES TO SUPPORT DIVERSIFICATION
Modernizing Trade in Pakistan: A Policy Roadmap
87
IN D
EPTH

0
10
20
30
40
50
60
70
80
90
100
Trade Air transportSea transport Road transportCommunication InsuranceFinancial services (not elsewhere classified) Business services (not elsewhere classified)PubAdmin/defences/health/education Recreation and other servicesDwellings
Pakistan
China
Indonesia
India
Philippines
Russia
Brazil
South Afri
ca
Banglad
esh
Sri Lan
kaNep
al
Malaysia
Thailand
Vietnam
Perc
ent (
%)Figure 33. Composition of service inputs in manufacturing for exports, Pakistan and comparators
Source: GTAP Database, World Bank Staff Calculations
(4.3 percent). The textiles, apparel, and food-processing industries especially are using transport services. Note, however, that little value added in telecommunication is exported through other goods exports, suggesting that this sector mainly functions as a final service to end consumers.
• Technology will be a determinant of how well Pakistan can capitalize on the increasing importance of services. Many services are produced with the help of digital technologies such as advanced software tools. Indeed, some services (such as finance, publishing, communications, business services, and even
retail services) are very software intense. Moreover, services trade between countries often occurs through the internet. Pakistan’s services traded over the internet, however, has been in decline since 2010. Services traded over the internet currently amount to only 16 percent of Pakistan’s total trade in goods and services. The world average is 20 percent.
• In summary, the manufacturing sector in Pakistan is relatively intensive in its use of services inputs in production and exports. Moreover, services are embedded in other economic activities, and most exports of services occur through their inputs into manufacturing
88 CHAPTER 7 – HOW TO: USE SERVICES TO SUPPORT DIVERSIFICATION
Modernizing Trade in Pakistan: A Policy Roadmap
88IN
DEP
TH

activities. This has important policy implications. First, there is potential for significantly increasing direct services exports for many services but especially business services; there are untapped opportunities for direct services exports, which could be developed by the private sector in collaboration with government policy initiatives. Second, with the importance of services as inputs into manufacturing and agriculture activities, providing low-cost, high-quality
services should be a priority for Pakistan’s diversification and competitiveness strategy. Third, when designing an export diversification strategy, services activities should be examined in connection with other economic activities and not in isolation. Finally, assessing and understanding Pakistan’s constraints on services development is a key to their contribution to economic diversification and competitiveness in manufacturing industries.
0
10
20
30
40
50
60
70
80
90
100
Pakistan
China
Indonesia
India
Philippines
Russia
Brazil
South Afri
ca
Banglad
esh
Sri Lan
kaNep
al
Malaysia
Thailand
Vietnam
Inputs into Services Inputs into Manufacturing Inputs into Primary Production
Direct Value Added Inputs into Utilities Inputs into Construction
Perc
ent (
%)
Figure 34. Composition of services forward linkages into export sectors (2014)
Source: GTAP Database, World Bank Staff Calculations
89CHAPTER 7 – HOW TO: USE SERVICES TO SUPPORT DIVERSIFICATION
Modernizing Trade in Pakistan: A Policy Roadmap
89
IN D
EPTH

Box 4. FDI in Services
FDI is a form of trade in services, specifically, a form of imports of services. Services activities are associated with a significant part of the FDI that Pakistan receives. Energy industries account for more than half of FDI into Pakistan. The cumulative value of coal, oil, and gas project announcements in Pakistan between 2003 and 2015 was 36 percent of total FDI project value (Figure 41). Renewable energy accounted for an additional 19 percent. Nevertheless, a heterogeneous array of services—communications (8 percent), finance (6 percent), transportation (5 percent), and telecommunications (5 percent)—accounted for a total of 24 percent of FDI.
However, Pakistan receives little efficiency-seeking FDI. The low levels of efficiency-seeking investment received in Pakistan (Figure 35) raise several concerns. First, the type of FDI that Pakistan receives has a limited ability to foster trade and productive diversification. Compared to other types of FDI, efficiency-seeking investments have a greater ability to create jobs intensive in knowledge and technology. Knowledge-intensive FDI can play an instrumental role in fostering diversification. The very low levels of efficiency-seeking FDI in Pakistan suggest that FDI is not playing a significant role toward its goals of diversification and upgrading. Second, they also indicate significant limitations in competitiveness. The competitiveness of the host economy is the key determinant for efficiency-seeking investments. Thus, the low levels of efficiency-seeking FDI in Pakistan suggest the country lacks key determinants of competitiveness across a wide range of sectors usually associated with efficiency-seeking investments.
The concentration of Pakistan’s exports and FDI justify diversifying into sectors and activities intensive in knowledge and technology. There is a strong relationship between the structure of an economy and its ability to generate sustained growth. Most developed countries have undergone productive transitions that prioritize complex goods and services. By contrast, countries that maintain high concentrations of their economic activity in natural resources face limitations on their development.
Coal, Oil and Natural Gas
Alternative/Renewable Energy
Communications
Financial Services
Transportantion
Telecommunications
Food & Tobacco
Other
36%
19%8%
6%
5%
5%
18%
Figure 35. Pakistan: Cumulative FDI value by sector (2003–15)
Sources: fDi Markets; Thomson Reuters
90 CHAPTER 7 – HOW TO: USE SERVICES TO SUPPORT DIVERSIFICATION
Modernizing Trade in Pakistan: A Policy Roadmap
90IN
DEP
TH

0
20
40
60
80
100
Pakist
an
TurkeyEAP
SAR
Philippines
Banglad
esh
Malays
ia
Vietnam
Strategic asset-seeking
Market-seeking Efficiency-seeking
Natural resource-seeking
Perc
ent (
%)
Figure 36. Pakistan vs. benchmarks: FDI types (2005–2016)
Sources: World Bank Group estimations based on COMTRADE and fDi MarketsNote: EAP = East Asia and the Pacific; SAR = South Asia Region
The characteristics of goods are more important than the sectors to which they belong. The productive specialization of a country is indicative of its state of economic development. Most advanced economies specialize in goods and services intensive in knowledge and technology. The sophistication of a country’s export basket may predict future growth. Producing complex and sophisticated goods is therefore an important part of a successful structural transformation.
Box 4. FDI in Services (continuation)
DETERMINANTS
Determining the reasons behind Pakistan’s performance is critical for Pakistan’s economic development. Pakistan has low regulatory restrictions in the services sectors, suggesting that other factors are affecting the performance and development of the services sector. Many services are more skill intensive than some manufacturing activities. Endowments of human capital can, therefore, be a critical determinant of export of services, especially modern services, and consequently, economic output. Some supply-side factors revealed by the World Bank Group analysis include:
Trade policy
Good regulatory policies are important to facilitate well-functioning and competitive services markets. Pakistan’s service trade policy environment is comparatively open. Horizontal regulations that affect many sectors include few limitations. However, there is significant scope for improvement and fine tuning. The 18th Amendment of 2010 of the Constitution of Pakistan creates additional challenges that may inadvertently create more burdens and uncertainties for services providers. Although services sectors face both provincial and
91CHAPTER 7 – HOW TO: USE SERVICES TO SUPPORT DIVERSIFICATION
Modernizing Trade in Pakistan: A Policy Roadmap
91
IN D
EPTH

federal regulatory requirements, regulation of trade (cross-border transactions, temporary movement of people) and foreign investment policies are federal responsibilities.
Regulatory environment
The most important horizontal challenge faced by service providers is the absence of a modern, efficient, and effective regulatory environment due to the multiplicity of agencies and levels of government involved. There are no proper regulatory procedures in place in many sectors except for financial and telecommunication services. There are also significant capacity gaps among agencies responsible for regulatory matters.
The 2010 constitutional amendment transferred more legislative powers to the provinces and put matters related to trade in services under both federal and provincial governments and legislators. The division of powers that the amendment established affects the regulation of all services sectors. In fact, because of the amendment, no services sector is solely regulated at the federal level or the provincial level. In all cases, the regulation is mixed (Figure 37).
Sectoral regulations
Sectoral regulations focus largely on operational constraints rather than restrictions on establishment. However, some restrictions remain. Professional services are regulated at the federal level and have licensing requirements including residency and reciprocity requirements. Legal services face double licensing procedures and requirements at both the federal and provincial levels.
Moreover, to increase trade in services, Pakistan would need to continue to adapt its digital policy environment. Pakistan has already largely liberalized its telecommunication infrastructure. And, on the
World Bank’s Services Trade Restrictiveness Index (STRI), Pakistan scores 0.25 on a scale from 0 (least restrictive) to 1 (most restrictive). However, some software-intensive services—such as retail and finance—still suffer from unnecessary policy restrictions. Pakistan also has policy restrictions on digital technologies themselves. The Digital Trade Restrictiveness Index (DTRI) from the European Center for International Political Economy (ECIPE), for example, indicates that the country is more restrictive than average with regard to the use of data and other trading restrictions, such as strict standards applied to some telecommunication equipment.
Business environment
Addressing trade restrictiveness is a necessary but not sufficient condition for increasing competitiveness. There is a complementary role for domestic institutions that assist in creating competitive markets.
Human capital
Many services are more skill intensive than some manufacturing activities. Human capital can, therefore, be a critical determinant of services exports. Pakistan’s low performance may be due in part to the failure of the education system to develop skills needed by the labor market, particularly in IT and IT-enabling services. While tertiary enrollment has expanded significantly in past decades, with increased gender parity, education quality remains uneven, including at technical and vocational schools. There are significant skill gaps in computer science engineers in Pakistan, including: (a) inability to code on contemporary technology platforms; (b) weak English skills; (c) poor comprehension of foreign clients’ concerns; (d) inadequate soft skills, namely communication and teamwork; and (e) poor knowledge of corporate culture, for example, reporting, compliance, escalations, e-mail etiquette, and protocols.
92 CHAPTER 7 – HOW TO: USE SERVICES TO SUPPORT DIVERSIFICATION
Modernizing Trade in Pakistan: A Policy Roadmap
92IN
DEP
TH

Figure 37. Services Sectors Under the 18th Constitutional Amendment Legislative List
Banking
Teleco
ms
IT serv
ices
Profes
sional
Distrib
ution
Road
Transp
ort
Other
serv
ices
Zoning
Taxation
Licensing
Fees
Federal
Trade policy
Company registration
Advertisement
Transfer of funds
Labor issues
Land ownership
Equity restrictions
Nationality/residency
Limitations on pricing
Provincial Mixed
Source: Consultations and researcher own legal and regulatory review
Infrastructure
There is a critical need for services-related infrastructure. While current regulations are not restrictive, the development of the services sector will depend on putting in place more proactive policies to attract investment in telecom and internet infrastructure. Pakistan’s future services trade expansion, particularly in IT and IT-enabling services, including offshore services, will depend critically on policies affecting telecom and internet infrastructure. Pakistan’s regulations affecting investment in telecom services are low. As such, they are likely to support the development of services value added as part of the economy. However, the telecommunications sector in Pakistan is one of the least developed in the region. It ranks 31st among 34 Asia-Pacific countries in the 2017 ICT Development Index of the International Telecommunication Union (ITU).
Taxation
Services providers face significant challenges regarding the taxation regime. Pakistan has struggled for several years to set up a modern and efficient taxation regime. The private sector has identified this issue as the most crucial problem it faces. Services and services providers are taxed at the provincial level, introducing significant distortion due to differences among tax rates. A service may be taxed in one province and not in another. Different provinces have different rules about when taxes are due. Finally, there are overlaps between the provincial and central governments on certain taxes, creating an unnecessarily high taxation burden, a complex administration system, and greater uncertainty for service providers. Together, these factors fragment domestic markets among provinces.
93CHAPTER 7 – HOW TO: USE SERVICES TO SUPPORT DIVERSIFICATION
Modernizing Trade in Pakistan: A Policy Roadmap
93
IN D
EPTH
Informality
Pakistan has a large informal sector, employing 72.6 percent of its labor force. Some studies have estimated the size of the informal economy between 25 and 35 percent of total economic activity. Many informal firms operate in the services sector. Informality implies that firms remain small, their productivity and job creation are low, and they do not reach the scale required for global competitiveness. Even in the promising IT and IT-enabling sectors, there are few large firms that can compete globally.
RECOMMENDATIONS
The interdependence of goods and services markets matters for trade policy design, which requires an integrated approach that factors in the unintended consequences of trade and regulatory policies on goods and services performance. In general, policies that boost the competitiveness of the services sector would help increase services exports and simultaneously help manufacturers that rely on backbone services. Actions aimed at increasing the relative share of domestic services used by exporters would help create a virtuous cycle of economic upgrading and value addition. The World Bank Group recommends the following specific actions to help Pakistan increase its competitiveness, move up the value chain in the manufacturing and agricultural sectors (by capturing more value added in GVCs through the domestic sourcing of services), boost its attractiveness to investors, and promote services exports.
• Define a national services export promotion strategy. The strategy would include such actions as (a) improving services trade statistics; (b) undertaking a regulatory diagnostic for services trade and investment; (c) undertaking a competitiveness assessment for key services sectors; and (d) developing a strategy for negotiating with major partners. The strategy could build on the diagnostic to identify the sectors
where opportunities exist for Pakistan, based on high-quality statistics and services trade data. It would then formulate a strategy for negotiating with major partners. This would require coordination among ministries and between the public and private sectors. Finally, it would identify ways to move up value chains and increase the benefits of participating in GVCs. The first step would be to analyze the share of domestic services embedded in the exports of specific sectors and Pakistan’s position in GVCs. Pakistan could then identify missed opportunities for services supply, obstacles to local sourcing of services, and solutions to increasing the relative share of domestic services in goods exports.
• Conduct a diagnostic to assess the restrictiveness of domestic regulations (including restrictions on FDI) and propose critical reforms in key backbone services such as transport, energy, logistics, and financial services. The diagnostic should also assess the level of competition in key services sectors to address distortions that might harm the contestability and competitiveness of those services in the export market.
• Improve the business environment. Services, especially complex modern, services, require many contracts as part of their production processes. Government policies should aim at reducing business transaction costs and providing a more predictable legal and regulatory environment. Doing so would foster the relationship between services firms and manufacturing and agriculture activities. It would also provide a more enabling environment for young innovators, creative entrepreneurs, and seasoned companies willing to develop these services and foster their partnership by increasing trust. It would facilitate the growth of firms, allowing them to scale up their production to reach global markets. Business reforms require a continuous and sustained effort before they produce tangible and lasting results. They will need to go beyond Doing Business ranking reforms and be tailored to the services sector.
94 CHAPTER 7 – HOW TO: USE SERVICES TO SUPPORT DIVERSIFICATION
Modernizing Trade in Pakistan: A Policy Roadmap
94IN
DEP
TH

• Strengthen agency coordination. The services sector would benefit from an effective mechanism for regulatory coordination between the provinces and the central government, as well as among the different regulators in the central government. Pakistan could improve existing arrangements for strengthening coordination in policymaking and the regulation of services sectors at the central and provincial levels. Taxation and trade negotiations are most in need of effective coordination.
• Modernize trade policy and the services regulatory framework. Gradually adopt internationally recognized regulatory principles and strengthen the capacity of both national and provincial regulatory agencies. Improve the coordination, consistency, and coherence of trade policy. Areas of particular importance include (a) cross-border trade in services, (b) strategic coordination between the Ministry of Trade and other federal and provincial services regulatory institutions, and (c) data protection and consumer protection, particularly in online transactions.
• Clarify investment policy. To attract foreign investors, promote domestic investment, and reduce risks, the Government of Pakistan could enact a consolidated legal instrument. The consolidated instrument would correctly reflect Pakistan’s open investment policies and clarify the conditions on investment in Pakistan, including critical provisions on national treatment, fair and equitable treatment, and dispute resolution.
• Rationalize taxation. Create a harmonized taxation regime that will eliminate uncertainty, avoid market fragmentation, and efficiently generate the required revenues. The first step would be for authorities to agree on a common understanding about where taxes are due to reduce uncertainty and avoid potential double taxation.
• Build a stronger public-private sector dialogue. All this requires a strong partnership between public sector entities and private sector stakeholders to address the challenges and create the appropriate business environment to achieve success.
Additional resources
Borchert, Ingo, Batshur Gootiiz, and Aaditya Mattoo. 2012. “Policy Barriers to International Trade in Services: Evidence from a New Database.” Policy Research Working Paper No. 6109. Washington, DC: World Bank.
Molinuevo, Martín and Sebastián Sáez. 2014. Regulatory Assessment Toolkit: A Practical Methodology for Assessing Regulation on Trade and Investment in Services. Trade and Development. Washington, DC: World Bank.
Sáez, Sebastián, Daria Taglioni, Erik van der Marel, Claire H. Hollweg, and Veronika Zavacka. 2014. Valuing
Services in Trade: A Toolkit for Competitiveness Diagnostics. Washington, DC: World Bank.
Sáez, Sebastián. 2010. Trade in Services Negotiations: A Guide for Developing Countries. Washington, DC: World Bank.
World Bank Group. 2014. Cambodia Services Trade: Performance and Regulatory Framework Assessment. Phnom Penh: World Bank.
See “TOOLS: Additional resources” starting on page 135 for more information about each of these publications and toolkits.
95CHAPTER 7 – HOW TO: USE SERVICES TO SUPPORT DIVERSIFICATION
Modernizing Trade in Pakistan: A Policy Roadmap
95
IN D
EPTH

HOW TO: Scale up knowledge-intensive exports8
This chapter synthesizes analyses and findings from reports and notes prepared by Vivian Couto (Duke Global Value Chains Center), Ernesto Fernandez Monge (Consultant), Karina Fernandez-Stark (Duke Global Value Chains Center), Sugandha Huria (Consultant), Martín Molinuevo (Senior Private Sector Specialist), Katrin Pfister (Consultant), Sebastian Saez (Lead Economist) and Erik van der Marel (Consultant).
Getty Images

Main Messages
• Services are a key input in trade competitiveness, as well as a source of trade diversification, making it critical to understand what factors and constraints matter most for services competitiveness.
• Pakistani individuals and firms have developed global competitiveness in a subset of emerging services sectors, positioning themselves as potential leaders in technology fields.
• Upgrading trajectories are constrained by limitations in skills development, infrastructure, and the business environment.
• Policy reforms (such as establishing specialized infrastructure and tax treatment in the form of technology parks, developing programs to build human capital for the industry, and strong industry coordination) are required to unleash Pakistan’s potential.
Snapshot
• Investors perceive Pakistan as a cost-effective but high-risk provider in the offshore services GVC. Pakistan had USD 655 million in exports in 2017 and a 15 percent annual growth rate over the last ten years (Figure 38). By 2017, Pakistan accounted for 0.1 percent of services exports in the world, ranking 74th among services exporters globally.
• Pakistan is active primarily in information technology outsourcing (ITO) and business process outsourcing (BPO). These account for 87 percent and 13 percent of Pakistan’s total services exports, respectively.
• Pakistan has several competitive advantages in the offshore services industry. Its advantages include its sizeable labor pool (about 95 million English speakers, the world’s third-largest English-speaking population), satisfactory price-quality relationship, decent telecommunications infrastructure, and favorable positioning in the global freelance market (the 4th most popular country for freelancing in the 2017 Online Labor Index).
• Yet services exports are lagging. Trade in services as a percentage of GDP lags peers
97CHAPTER 8 – HOW TO: SCALE UP KNOWLEDGE-INTENSIVE EXPORTS
QU
ICK
STA
RT
Modernizing Trade in Pakistan: A Policy Roadmap

0
100
200
300
400
500
700
600
2006 2007 2008 2009 2010 2011
Expe
rts
(USD
mill
ion)
2012 2013 2014 2015 2016 2017
15% CAGR
ITO BPO
71103
27
3740
6173
83
151 181 186 214 246293 330
459487
572
in the region and beyond. It accounted for 5.3 percent of Pakistan’s total GDP in 2017, compared to 11.27 percent in India and 26.68 percent in Thailand.
• Restrictions in Pakistan’s free trade agreements offset its favorable regulatory
framework. Pakistan’s regulatory framework for services trade and investment is generally open and non-discriminatory. However, Pakistan’s commitments in services under the China–Pakistan Free Trade Agreement feature an array of restrictions on trade and investment in services.
Source: Couto & Fernandez-Stark (2019) elaboration based on State Bank of Pakistan data.
Figure 38. Pakistan’s ITO and BPO Exports, 2006 – 2017
The most pressing challenges Pakistan should address to make the country a more attractive investment destination for knowledge-intensive exports include:
• Improving the investment regulatory framework. The Investment Law of 1976 is protectionist. The Investment Policy of 2013, by contrast, is more market friendly, although without the status of a ‘law.’ The
inconsistency creates uncertainty among foreign investors, reducing their incentives to incur substantial and largely irreversible investments. Other improvements to the business environment are also necessary.
• Alleviating the mismatch between skills provided at the tertiary level and private sector needs. High-value-added information technology (IT) firms consider
Forward Look
98 CHAPTER 8 – HOW TO: SCALE UP KNOWLEDGE-INTENSIVE EXPORTSQ
UIC
K S
TART
Modernizing Trade in Pakistan: A Policy Roadmap

only 10 percent of IT graduates employable. Improving public-private coordination more generally is also important.
• Increasing the collection of relevant data. Reliable data (for example, on the number of IT graduates) could improve international marketing and branding, helping position Pakistan’s industry in the global market. Articulating clear metrics in the national
offshore services strategy would allow tracking and improving Pakistan’s efforts to increase FDI in this sector.
• Making it easier for foreign investors and clients to visit Pakistan. The government needs a more proactive strategy to strategically reduce visa requirements. It should also work closely with the private sector to ease visitors’ concerns about security.
General Business Activities
Information Technology Outsourcing (ITO)
HIGH
LOW
Software
Infrastructure
Software R&D
IT Consulting
Valu
e A
dded
Industry-Specific Activities a-b
Banking, Financial Services and
Insurance (BFSI)Ex. Investment research, private
equity research, and risk management analysis
ManufacturingEx. Industrial engineeringand sourcing and vendor
management
TelecommunicationsEx. IP transformation,
Interoperability testing and DSP and multimedia
EnergyEx. Energy trading and risk
management, and digital oil field solutions
Travel & TransportationEx. Revenue management systems, customer loyalty
solutions
Health / PharmaEx. R&D, clinical trials, medical
transcript
RetailEx. eCommerce and planning merchandising and demand
intelligence
Others
Applications Management
Network Management
Infrastructure Management
Desktop Management
Applications Integration
Applications Development
ERP (Enterprise Resource Planning)manufacturing/operations, supply chain
management, financials & project management
Knowledge Process Outsourcing (KPO)
Business ConsultingBusiness AnalyticsMarket Intelligence
Legal Services
Business Process Outsourcing (BPO)
Marketing & Sales
Contact Centers /
Call Centers
Training
Talent Management
Payroll
Recruiting
Finance & Accounting
Procurement, Logistics and Supply Chain Management
Content / Document
Management
Enterprise Resource
Management(ERM)
Human Resource
Management(HRM)
Customer Relationship Management
(CRM)
Figure 39. Pakistan’s Participation in the Offshore Services GVC, 2017
Notes: Colored subsegments indicate active participation; Gray-colored subsegments indicate no participation.a Industry specific: Each industry has its own value chain. Within each of these chains, there are associated services that can be offshored. This diagram captures the industries with the highest demand for offshore services.b This graphical depiction of industry-specific services does not imply value levels. Each industry may include ITO, BPO and advanced activities.
99CHAPTER 8 – HOW TO: SCALE UP KNOWLEDGE-INTENSIVE EXPORTS
QU
ICK
STA
RT
Modernizing Trade in Pakistan: A Policy Roadmap

Figure 40. Pakistan’s large, English-speaking IT workforce is a competitive advantage for growing services exports.
Source: Getty Images
• How can Pakistan attract foreign investors and clients in the offshore services GVC?
• How can Pakistan adapt its national offshore services strategy, improve its regulatory environment, enhance its business environment, and increase public-private coordination to compete with the global expansion and increasing sophistication of other services providers?
• How can Pakistan improve quality of education to leverage its current position
into worldwide recognition as a cost-effective and qualified hub for higher-value-added IT services?
• How can Pakistan determine the areas in which the country’s knowledge, experience, and other competitive advantages can be leveraged in specific industries?
• How can companies in Pakistan remain active in terms of upskilling and incorporating the most up-to-date technologies?
Key Questions
100 CHAPTER 8 – HOW TO: SCALE UP KNOWLEDGE-INTENSIVE EXPORTS
Modernizing Trade in Pakistan: A Policy Roadmap
100IN
DEP
TH

Critical data
Data and rankings from the World Bank Group’s Ease of Doing Business (DB) report, especially the “Trading Across Borders” (TAB) indicators
Survey data and rankings on perception-based indexes such as AT Kearney’s Global Services Location Index and the WEF’s Global Competitiveness Report
Data and rankings from the World Bank Group’s Logistics Performance Index (LPI)
See “TOOLS: Critical data” starting on page 127 for more information about each of these critical data sources.
Import and export statistics provided by United Nations Commodity Trade Statistics Database (UN Comtrade) or the World Bank Group’s World Integrated Trade Solutions (WITS) database
Trade in Value Added (TiVA) data from the OECD
Trade in Services data from the OECD
Bilateral FDI statistics from the United Nations Conference on Trade and Development (UNCTAD) and additional FDI data and estimates from sources such as fDi Markets from the Financial Times
Data on trade control measures, including tariffs, para-tariffs, non-tariff measures, etc., provided in UNCTAD’s Trade Analysis Information System (TRAINS) database
Firm-level data on importing and exporting performance, productivity, etc., which can be obtained from customs or national statistical agencies
Methodology
GLOBAL VALUE CHAIN (GVC) ANALYSIS
While there are several methodologies associated with value chain analysis, the approach outlined by Gereffi and Fernandez-Stark (2011) covers four critical dimensions: (1) the input-output structure of production, which describes the process of
transforming raw materials into final products; (2) geographical considerations; (3) the governance structure, which explains how the value chain is controlled; and (4) the institutional context in which the value chain is embedded. In the GVC literature, value is generally determined by examining the transformation of inputs to outputs
101CHAPTER 8 – HOW TO: SCALE UP KNOWLEDGE-INTENSIVE EXPORTS
Modernizing Trade in Pakistan: A Policy Roadmap
101
IN D
EPTH

at each stage. An additional element of analysis, referred to as “upgrading,” describes the dynamic process of improving the value at one stage of production or shifting into additional value-adding activities. GVC analysis has been adopted by a range of institutions and governments, who have commissioned GVC studies to understand global industries and to guide the formulation of new programs and policies to promote economic development.
REGULATORY ASSESSMENT TOOLKIT (RASTI)
RASTI (Molinuevo and Saez 2014) provides guidance on how to assess and reform the regulatory policies of service trade industries. The toolkit can help government officials evaluate whether their regulatory framework addresses
market failures, achieves public interest goals in an efficient manner, and promotes the development of an efficient domestic services market. Depending on the circumstances and the needs of the authorities, the toolkit can serve different purposes, including supporting regulatory reform, improving regulatory governance, negotiating and implementing trade agreements, and streamlining regulations to attract foreign investment. RASTI is of particular interest to decision makers and government officials from regulatory bodies, experts at development banks and donor agencies, and academics and researchers in the field of economic regulation.
SERVICE TRADE COMPETITIVENESS DIAGNOSTIC (STCD) TOOLKIT
The STCD Toolkit (Saez et al. 2014) provides a framework, guidelines, and a set of practical tools to conduct a thorough analysis and diagnostic of trade competitiveness in the services sector with a methodology that sheds light on a country’s ability both to export services and improve its export performance through policy change. The toolkit is designed to be used in a modular way. Either a full country diagnostic can be undertaken or various parts of the toolkit can be used to address specific questions of interest, whether they pertain to existing services performance, the potential for expansion and growth in services trade, or policy options to increase competitiveness in services trade. The output of an STCD can be used to assess either the overall performance of a country’s services sector or the performance of individual subsectors. This toolkit complements the analytical framework for trade in goods provided by the Trade Competitiveness Diagnostic Toolkit (Reis and Farole 2012), and allows decision makers and experts in developing countries to better integrate services into their overall trade strategies.
102 CHAPTER 8 – HOW TO: SCALE UP KNOWLEDGE-INTENSIVE EXPORTS
Modernizing Trade in Pakistan: A Policy Roadmap
102IN
DEP
TH
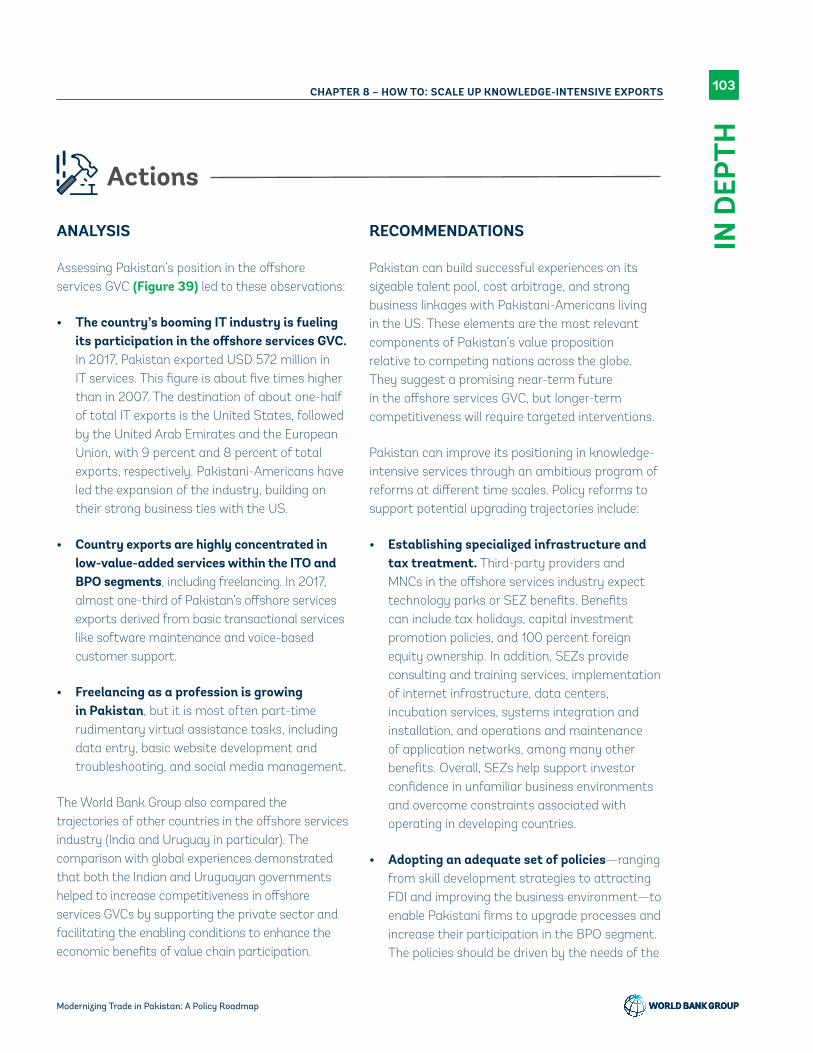
ANALYSIS
Assessing Pakistan’s position in the offshore services GVC (Figure 39) led to these observations:
• The country’s booming IT industry is fueling its participation in the offshore services GVC. In 2017, Pakistan exported USD 572 million in IT services. This figure is about five times higher than in 2007. The destination of about one-half of total IT exports is the United States, followed by the United Arab Emirates and the European Union, with 9 percent and 8 percent of total exports, respectively. Pakistani-Americans have led the expansion of the industry, building on their strong business ties with the US.
• Country exports are highly concentrated in low-value-added services within the ITO and BPO segments, including freelancing. In 2017, almost one-third of Pakistan’s offshore services exports derived from basic transactional services like software maintenance and voice-based customer support.
• Freelancing as a profession is growing in Pakistan, but it is most often part-time rudimentary virtual assistance tasks, including data entry, basic website development and troubleshooting, and social media management.
The World Bank Group also compared the trajectories of other countries in the offshore services industry (India and Uruguay in particular). The comparison with global experiences demonstrated that both the Indian and Uruguayan governments helped to increase competitiveness in offshore services GVCs by supporting the private sector and facilitating the enabling conditions to enhance the economic benefits of value chain participation.
RECOMMENDATIONS
Pakistan can build successful experiences on its sizeable talent pool, cost arbitrage, and strong business linkages with Pakistani-Americans living in the US. These elements are the most relevant components of Pakistan’s value proposition relative to competing nations across the globe. They suggest a promising near-term future in the offshore services GVC, but longer-term competitiveness will require targeted interventions.
Pakistan can improve its positioning in knowledge-intensive services through an ambitious program of reforms at different time scales. Policy reforms to support potential upgrading trajectories include:
• Establishing specialized infrastructure and tax treatment. Third-party providers and MNCs in the offshore services industry expect technology parks or SEZ benefits. Benefits can include tax holidays, capital investment promotion policies, and 100 percent foreign equity ownership. In addition, SEZs provide consulting and training services, implementation of internet infrastructure, data centers, incubation services, systems integration and installation, and operations and maintenance of application networks, among many other benefits. Overall, SEZs help support investor confidence in unfamiliar business environments and overcome constraints associated with operating in developing countries.
• Adopting an adequate set of policies—ranging from skill development strategies to attracting FDI and improving the business environment—to enable Pakistani firms to upgrade processes and increase their participation in the BPO segment. The policies should be driven by the needs of the
Actions
103CHAPTER 8 – HOW TO: SCALE UP KNOWLEDGE-INTENSIVE EXPORTS
Modernizing Trade in Pakistan: A Policy Roadmap
103
IN D
EPTH

private sector, which should be highly involved in skill development. In addition, instruments to facilitate training within companies should avoid excessive bureaucracy and be agile.
• Promoting strong industry coordination and public-private dialogue to articulate an industry growth strategy and skill development strategies. Continuous private sector dialogue with the government—namely, Ministries of IT, Finance, and Commerce—can have tremendous impact on developing effective and sustainable skill development strategies. These have also been critical for national branding initiatives and consistent messaging. This is very relevant for offshore services because the value proposition of the country should be consistent across all stakeholders.
• Attracting FDI. FDI is critical to demonstrate credibility and to upgrade, especially in economies with little or negative visibility in the offshore services industry. Solid and prosperous entry in the offshore services GVC usually happens after an international third-party establishes in one country, indicating the importance of the demonstration effect for other investors. Because services (and human skills) are intangible, and production and consumption happen simultaneously, location choices of MNCs largely depend on the experiences of other global companies. Attracting investment in this sector will require a well-functioning and well-resourced investment promotion function at federal and provincial level, a strong investor aftercare regime, a modernized investment law, and a simplified regulatory framework that allows investors to operate in a predictable policy environment. Shifting the perception of the country risk through a targeted country branding campaign is also necessary for a sector that relies on security of data and stabile connectivity.
• Improving quality of education is key in supporting firms’ efforts to provide higher-end solutions. By revisiting tertiary education shortfalls, collecting accurate data on the industry and ensuring adequate and affordable 24/7 office space is available, Pakistan can leverage its organic development and expect to develop worldwide recognition as a cost-effective and qualified hub for higher-value-added IT processes.
• Better aligning Pakistan’s commitments in services under the China–Pakistan Free Trade Agreement with the country’s regulatory framework for services trade and investment (which is generally open and non-discriminatory) would help reduce uncertainty and increase confidence in Pakistan’s open framework.
• Providing investor after care. This is a key factor in economic upgrading. Companies are more prone to establish value-added operations in countries that focus on improving the overall business climate for an MNC, such as reducing bureaucratic hurdles, easing migration restrictions, and guaranteeing property rights.
In 2017, Pakistan exportedUSD 572 millionin IT services
Getty Images
104 CHAPTER 8 – HOW TO: SCALE UP KNOWLEDGE-INTENSIVE EXPORTS
Modernizing Trade in Pakistan: A Policy Roadmap
104IN
DEP
TH

Additional resources
Couto, Vivian, and Karina Fernandez-Stark. 2019. “Pakistan in the Offshore Services Global Value Chain.” Duke Global Value Chains Center: Duke University.
Gereffi, Gary, and Karina Fernandez-Stark. 2010. “The Offshore Services Value Chain: Developing Countries and the Crisis.” Policy Research Working Paper No. 5262. Washington, DC: World Bank.
Gereffi, Gary, and Karina Fernandez-Stark. 2011. Global Value Chain Analysis: A Primer. Duke University: Center on Globalization, Governance & Competitiveness (CGGC).
Molinuevo, Martín and Sebastián Sáez. Regulatory Assessment Toolkit: A Practical Methodology for Assessing Regulation on Trade and Investment in Services. Trade and Development. Washington, DC: World Bank.
Online Labour Index of the University of Oxford
Reis, Jose Guilherme and Thomas Farole. 2012. Trade Competitiveness Diagnostic Toolkit. Washington, DC: World Bank.
Sáez, Sebastián, Daria Taglioni, Erik van der Marel, Claire H. Hollweg, and Veronika Zavacka. 2014. Valuing Services in Trade: A Toolkit for Competitiveness Diagnostics. Washington, DC: World Bank.
Winkler, Deborah. 2010. “Services Offshoring and Its Impact on Productivity and Employment: Evidence from Germany, 1995–2006.” The World Economy 33 (12): 1672–1701.
World Bank Group. 2014. Cambodia Services Trade: Performance and Regulatory Framework Assessment. Phnom Penh: World Bank.
See “TOOLS: Additional resources” starting on page 135 for more information about each of these publications and toolkits.
105CHAPTER 8 – HOW TO: SCALE UP KNOWLEDGE-INTENSIVE EXPORTS
Modernizing Trade in Pakistan: A Policy Roadmap
105
IN D
EPTH

PART IV. IMPACTS ON POVERTY AND INCLUSION

HOW TO: Ensure that trade policy reforms disrupt elite capture
9
This chapter synthesizes analyses and findings from reports and notes prepared by Rakesh Gupta (Consultant) and Maryla Maliszewska (Senior Economist).
Getty Images

Main Messages
• Comprehensive trade reform would both reduce poverty and increase women’s participation in the labor force.
Snapshot
• As of 2015, 67.1 million Pakistanis—more than a third of the total population—were living below the USD 3.20 per day lower-middle-income poverty line. Of those, 7.6 million people were living on less than USD 1.90 per day, the international poverty line.
• Pakistan ranks among the lowest 10 percent of countries in the world in female participation in the labor force. In 2018,
women constituted just 17 percent of the labor force (Figure 41). This is the lowest ratio in the region, far behind Sri Lanka, the highest, at 45 percent.
• Agriculture employs the majority of working women in Pakistan. Manufacturing—particularly in the textiles and apparel industries—also employs a significant proportion.
0% 10% 20% 30% 40% 50%
Sri Lanka
Nepal
India
Bangladesh
Pakistan 17%
26%
29%
34%
45%
Figure 41. Female participation in the labor force, ratio, 2018
Data: World Economic Forum Global Competitiveness Index 4.0Note: Female participation in the labor force is the ratio of the percentage of women aged 15–64 participating in the labor force as wage and salaried workers to the percentage of men aged 15–64 participating in the labor force as wage and salaried workers.
108 CHAPTER 9 – HOW TO: ENSURE THAT TRADE POLICY REFORMS DISRUPT ELITE CAPTUREQ
UIC
K S
TART
Modernizing Trade in Pakistan: A Policy Roadmap
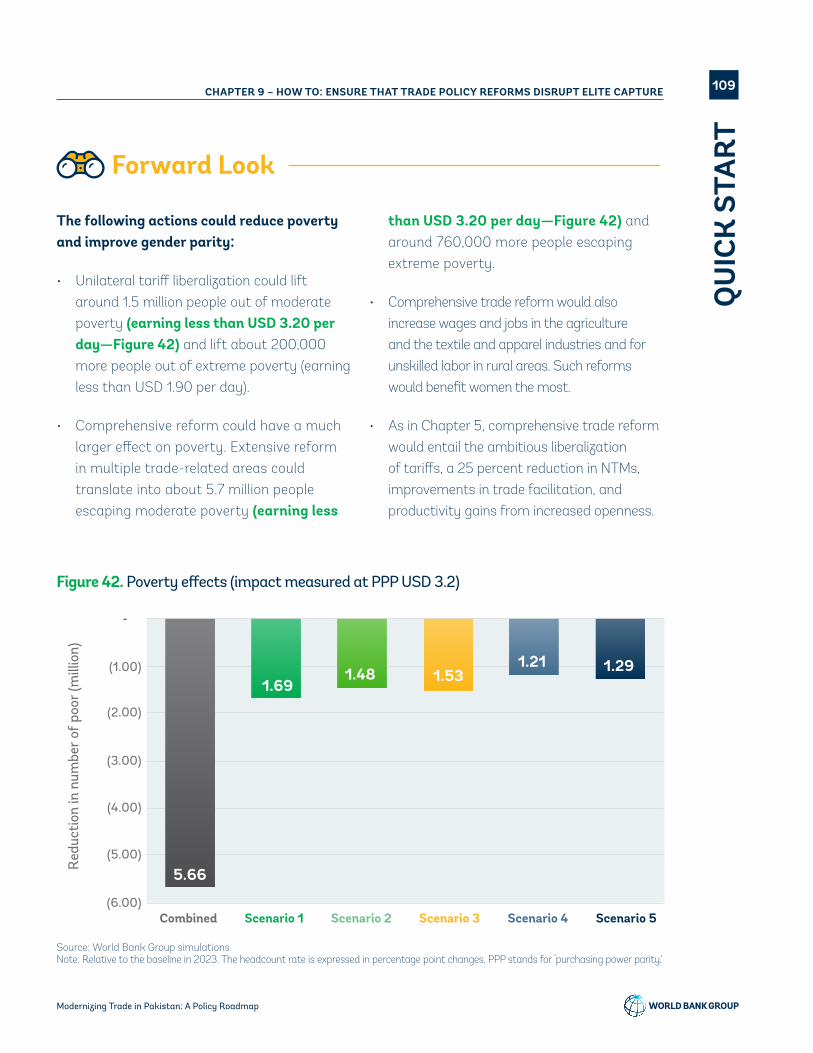
Source: World Bank Group simulationsNote: Relative to the baseline in 2023. The headcount rate is expressed in percentage point changes. PPP stands for ‘purchasing power parity.’
The following actions could reduce poverty and improve gender parity:
• Unilateral tariff liberalization could lift around 1.5 million people out of moderate poverty (earning less than USD 3.20 per day—Figure 42) and lift about 200,000 more people out of extreme poverty (earning less than USD 1.90 per day).
• Comprehensive reform could have a much larger effect on poverty. Extensive reform in multiple trade-related areas could translate into about 5.7 million people escaping moderate poverty (earning less
than USD 3.20 per day—Figure 42) and around 760,000 more people escaping extreme poverty.
• Comprehensive trade reform would also increase wages and jobs in the agriculture and the textile and apparel industries and for unskilled labor in rural areas. Such reforms would benefit women the most.
• As in Chapter 5, comprehensive trade reform would entail the ambitious liberalization of tariffs, a 25 percent reduction in NTMs, improvements in trade facilitation, and productivity gains from increased openness.
Forward Look
Figure 42. Poverty effects (impact measured at PPP USD 3.2)
(6.00)
(5.00)
(4.00)
(3.00)
(2.00)
(1.00)
-
Combined Scenario 1 Scenario 2 Scenario 3 Scenario 4 Scenario 5
Red
ucti
on in
num
ber o
f poo
r (m
illio
n)
5.66
1.691.48 1.53
1.21 1.29
109CHAPTER 9 – HOW TO: ENSURE THAT TRADE POLICY REFORMS DISRUPT ELITE CAPTURE
QU
ICK
STA
RT
Modernizing Trade in Pakistan: A Policy Roadmap
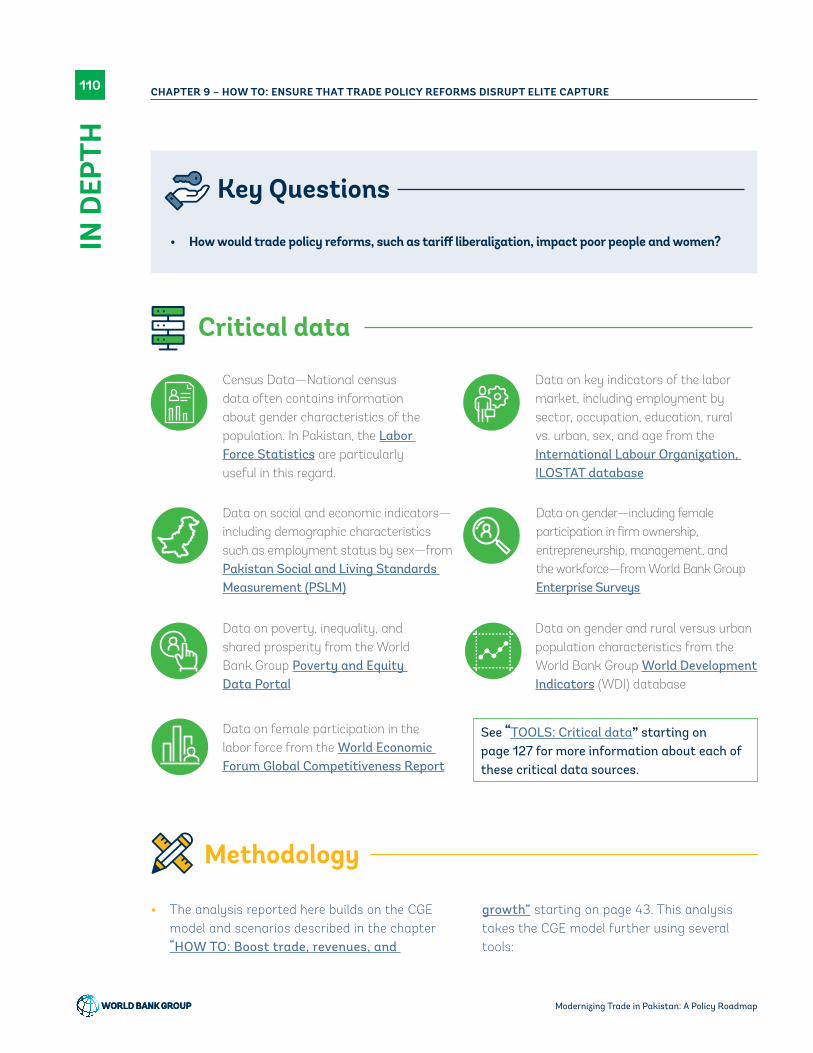
Methodology
• How would trade policy reforms, such as tariff liberalization, impact poor people and women?
Key Questions
Critical data
Census Data—National census data often contains information about gender characteristics of the population. In Pakistan, the Labor Force Statistics are particularly useful in this regard.
Data on poverty, inequality, and shared prosperity from the World Bank Group Poverty and Equity Data Portal
Data on key indicators of the labor market, including employment by sector, occupation, education, rural vs. urban, sex, and age from the International Labour Organization, ILOSTAT database
Data on gender and rural versus urban population characteristics from the World Bank Group World Development Indicators (WDI) database
Data on gender—including female participation in firm ownership, entrepreneurship, management, and the workforce—from World Bank Group Enterprise Surveys
Data on social and economic indicators—including demographic characteristics such as employment status by sex—from Pakistan Social and Living Standards Measurement (PSLM)
Data on female participation in the labor force from the World Economic Forum Global Competitiveness Report
See “TOOLS: Critical data” starting on page 127 for more information about each of these critical data sources.
• The analysis reported here builds on the CGE model and scenarios described in the chapter “HOW TO: Boost trade, revenues, and
growth” starting on page 43. This analysis takes the CGE model further using several tools:
110 CHAPTER 9 – HOW TO: ENSURE THAT TRADE POLICY REFORMS DISRUPT ELITE CAPTURE
Modernizing Trade in Pakistan: A Policy Roadmap
110IN
DEP
TH

• Global Income Distribution Dynamics (GIDD) model — The World Bank Group carried out the analysis of the poverty effects of different reform scenarios using the GIDD (Bussolo, de Hoyos, and Medvedev, 2010). The GIDD is a top-down macro-micro simulation framework. It links the CGE model with information from household surveys.
• PovcalNet — an interactive computational tool that allows one to replicate the calculations made by the World Bank Group’s researchers in estimating the extent of absolute poverty in the world. PovcalNet also allows one to calculate poverty measures under different assumptions and to assemble the estimates using alternative economy groupings or for any set of individual economies. PovcalNet is self-contained; it has reliable built-in software that quickly does the relevant calculations from the built-in database. PovcalNet is the source of, and allows users to replicate, the World Bank Group’s official global, regional,
and internationally comparable economy-level poverty estimates published in the World Development Indicators (WDI) and the Poverty and Shared Prosperity report (World Bank 2018). It also provides crucial inputs to the Poverty and Equity Data Portal. New survey data are added to PovcalNet in regular updates. In March 2019, the World Bank released revised estimates of global poverty from 1981 to 2015 based on 2011 purchasing power parity (PPP). The new poverty estimates combine PPP exchange rates for household consumption from the 2011 International Comparison Program with data from more than 1,500 household surveys across 164 economies, including 26 high income economies not included in PovcalNet’s geographic regions. Over two million randomly sampled households were interviewed for the 2015 estimate, representing 65 percent of the world population. Staff of over 100 governmental statistics offices collected the primary household and price survey data.
Actions
POVERTY
The World Bank Group used the GIDD model to estimate poverty effects by applying changes in real household consumption estimated using the CGE model to the initial distribution observed in the household level data. The analysis applied the growth in real household consumption to the poverty estimates from 2015. The analysis assumed that the growth accrued equally (in proportionate terms) to all households regardless of individual income level (distributional-neutral growth).
The analysis led to two main observations about trade policy reform and poverty:
i. Comprehensive reform would have the greatest effect on poverty. The effect of comprehensive reform would be more than three times bigger than in the individual unilateral trade liberalization scenarios. Such extensive reform could translate into more than 760,000 additional people escaping extreme poverty and 5.66 million people escaping moderate poverty. The estimated effects on poverty could be even larger considering the effects of lower food prices and higher wages for the poor, effects not explicitly accounted for in the distribution-neutral simulations here.
111CHAPTER 9 – HOW TO: ENSURE THAT TRADE POLICY REFORMS DISRUPT ELITE CAPTURE
Modernizing Trade in Pakistan: A Policy Roadmap
111
IN D
EPTH

Figure 43. Gender distribution of employment across sectors
Mining
Public Utilities
Transport & Communications
Construction
Public Administration
Financial & Business Services
Commerce
Manufacturing
Other Services (unspecified)
Agriculture
0.2%
0.8%
6.9%
11.6%
3.1%
3.2%
19.1%
13.3%
9.7%
32.3%
0.0%
0.1%
0.1%
0.2%
0.3%
0.5%
1.3%
12.3%
20.8%
64.5%
0% 10% 20% 30% 40% 50% 60%
Women Men
Source: PSLM 2015Note: The figure shows the percentage of total employees of each gender who are employed in each sector. For example, agriculture employs 64.5 percent of all women working in Pakistan.
ii. Unilateral tariff liberalization combined with productivity gains associated with more openness would have a moderate effect on poverty in Pakistan. The combination could lift 170,000–230,000 people out of extreme poverty (living on PPP USD 1.90 a day or less) and 1.21–1.69 million more people out of moderate poverty (living on PPP USD 3.20 a day or less). Short of comprehensive reform, Scenario 1.1 results in the most pronounced decrease in poverty, with approximately 56,000 more people escaping poverty than in the other scenarios. Scenario 1.1, which assumes the least ambitious liberalization, also implies the least pronounced decline in revenues, which in turn benefits poor households. Interestingly, this is the opposite of the supply-side effects: GDP gains are least pronounced in Scenario 1.1 but increase progressively as trade is liberalized. The other scenarios result in a comparable decline of 170,000–180,000 in the number of extremely poor people.
GENDER
Description
The World Bank Group focused on profiling workers according to their industry of employment, the province in which they live, median wage, and skill level (using educational attainment as a proxy).
The main findings were:
• Agriculture is the biggest employer of women in Pakistan. Nearly 65 percent of women in Pakistan were employed in agriculture in 2015 (Figure 43).
• The manufacturing sector employs 12 percent of women. Close to 80 percent of jobs for women in the manufacturing sector are in textile– and apparel–related subsectors or industries.
112 CHAPTER 9 – HOW TO: ENSURE THAT TRADE POLICY REFORMS DISRUPT ELITE CAPTURE
Modernizing Trade in Pakistan: A Policy Roadmap
112IN
DEP
TH

• Other services (or unspecified) sectors employ 21 percent of women. This category includes education, healthcare, and personal service activities. Personal service activities employ 42 percent of women in this category. Education and health subsectors employ a little over 36 percent and 7 percent respectively. Another important subsector in this category is domestic personnel employment, which employs close to 9 percent.
• Job opportunities for women are unequal across the country and concentrated in a few
locations. Most women with jobs are in urban areas (80 percent) as compared to rural areas. In fact, more than 80 percent of the jobs are found in Punjab and Sindh provinces. Approximately 90 percent of women in employment are found in these provinces.
• Wage gaps (median wages) tend to be significantly lower for women with higher educational attainments and especially in certain sectors like finance and business services, public administration, and commerce.
Figure 44. Cumulative expected employment changes by sector
-30% -25% -20% -15% -10% -5% 0%
0%
5%
5%
10%
10%
15%
15%
20%
20%
25%
30%
35%
40%
Labor Variation (%, 2023): Combined scenario w.r.t baseline
Shar
e of
fem
ale
empl
oym
ent (
%, L
FS 2
014)
Textiles
Social services
Chemical, rubber, plastic
Trade & transport Finance & other business
Energy
ConstructionMetalsTransport equip.
Electronic & machinery equip.
Other manufacturing
Food, beverages, tobacco
Wearing apparel & leather
Agriculture
1,000,0005,000,00010,000,000≥15,000,000
Excluded sectors: Communications and UtilitiesNote 1: Approximately 98% of sectors/workers (LFS 2014) representedNote 2: Bubbles represent total estimated workers in each sector (LFS 2014)
113CHAPTER 9 – HOW TO: ENSURE THAT TRADE POLICY REFORMS DISRUPT ELITE CAPTURE
Modernizing Trade in Pakistan: A Policy Roadmap
113
IN D
EPTH

Additional resources
Aguayo-Tellez, Ernesto. 2012. “The Impact of Trade Liberalization Policies and FDI on Gender Inequalities: A Literature Review.” Washington, DC: World Bank.
Artuc, Erhan, Gladys Lopez-Acevedo, Raymond Robertson, and Daniel Samaan. 2019. Exports to Jobs. Washington, DC: World Bank.
Bussolo, Maurizio, Rafael E. De Hoyos, and Denis Medvedev. 2010. “Economic Growth and Income Distribution: Linking Macro-economic Models with Household Survey Data at the Global Level.” International Journal of Microsimulation 3(1): 92-103.
Cusolito, Ana Paula, Raed Safadi, and Daria Taglioni. 2016. Inclusive Global Value Chains: Policy Options for Small and Medium Enterprises and Low-Income Countries. Washington, DC: The World Bank.
Higgins, Kate. 2012. “Gender Dimensions of Trade Facilitation and Logistics: A Guidance Note.” Washington, DC: World Bank.
World Bank. 2018. Poverty and Shared Prosperity 2018: Piecing Together the Poverty Puzzle. World Bank, Washington, DC.
See “TOOLS: Additional resources” starting on page 135 for more information about each of these publications and toolkits.
• Increasing labor force participation rates and focusing on formation of human capital (while avoiding school versus work tradeoffs) for women are some of the policy considerations.
Analysis
• The World Bank Group also analyzed the impact of comprehensive trade reform on female employment in Pakistan. The results of effects on employment were estimated using the GIDD model and are best-impact estimates of the proposed reforms on labor demand until 2023. As previously, comprehensive reform would entail the ambitious liberalization of tariffs, a 25 percent reduction in non-tariff measures (NTMs), improvements in trade facilitation, and productivity gains from increased openness. Average tariffs are assumed to decline. The comprehensive reform scenario assumes
zero customs duties for raw materials, intermediates, and capital goods; 10 percent customs duties for consumption goods; and elimination of regulatory and additional duties.
• The simulations suggest that comprehensive trade reform would significantly expand the textiles and apparel industries in Pakistan. Compared to the baseline, comprehensive reform would increase jobs in textiles by 20 percent and jobs in apparel by 12 percent by 2023 (Figure 44). Trade liberalization would benefit textiles and apparel through access to cheaper imported inputs, resulting in gains in competitiveness and increased exports. Women, in particular, would benefit because these sectors employ many women in Pakistan.
• Agriculture is also important for women in terms of its size and the share of women it employs. Its expansion in the comprehensive reform scenarios is welcome—it will create more jobs for women by 2023.
114 CHAPTER 9 – HOW TO: ENSURE THAT TRADE POLICY REFORMS DISRUPT ELITE CAPTURE
Modernizing Trade in Pakistan: A Policy Roadmap
114IN
DEP
TH

HOW TO: Leverage trade for women’s empowerment10
This chapter synthesizes analyses and findings from reports and notes prepared by Reshma Aftab (Private Sector Specialist), Vicky Chemutai (consultant) and Maria Liungman (Senior Economist).
Getty Images
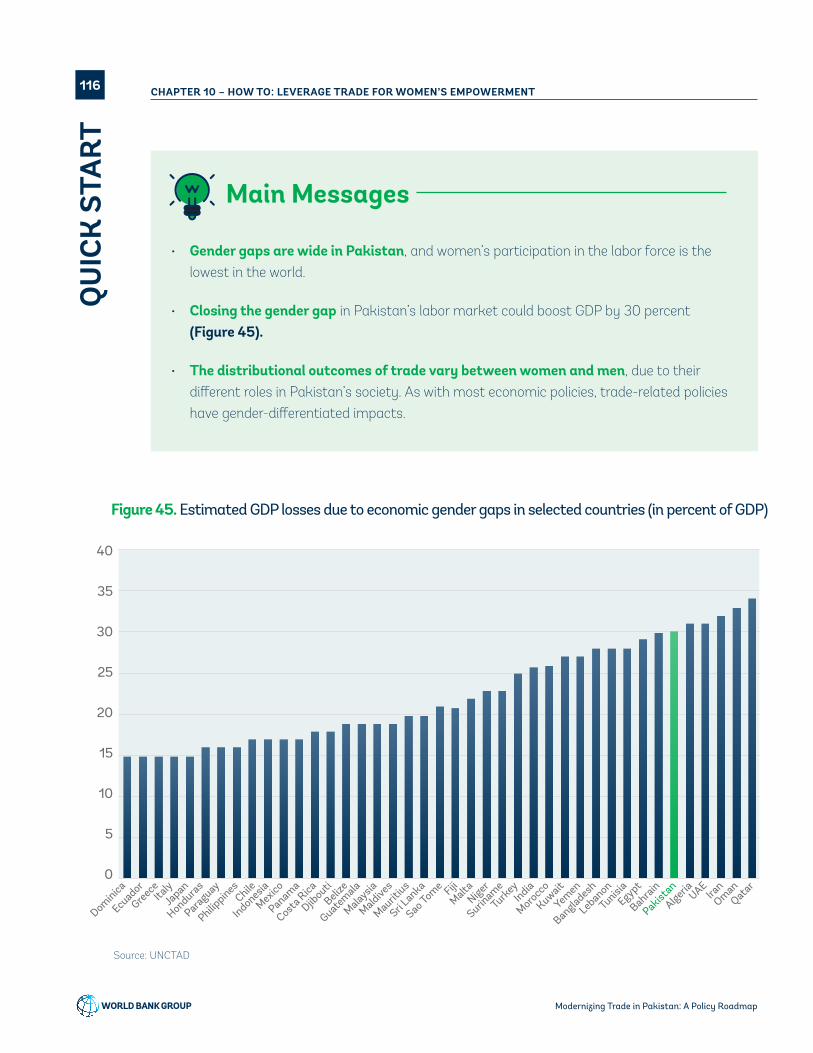
Main Messages
• Gender gaps are wide in Pakistan, and women’s participation in the labor force is the lowest in the world.
• Closing the gender gap in Pakistan’s labor market could boost GDP by 30 percent (Figure 45).
• The distributional outcomes of trade vary between women and men, due to their different roles in Pakistan’s society. As with most economic policies, trade-related policies have gender-differentiated impacts.
Figure 45. Estimated GDP losses due to economic gender gaps in selected countries (in percent of GDP)
Source: UNCTAD
40
35
30
25
20
15
10
5
0
Dominica
Ecuador
Greece
ItalyJa
pan
Honduras
Paraguay
Philippines
Chile
Indonesia
Mexico
Panama
Costa R
ica
Djibouti
Belize
Guatem
ala
Malaysia
Maldives
Mauritius
Sri Lanka Fiji
Sao Tome
MaltaNiger
Suriname
Turkey
India
Morocc
o
Kuwait
Yemen
Bangladesh
Lebanon
TunisiaEgypt
Bahrain
Pakistan
Algeria
UAEIra
nOman
Qatar
116 CHAPTER 10 – HOW TO: LEVERAGE TRADE FOR WOMEN’S EMPOWERMENTQ
UIC
K S
TART
Modernizing Trade in Pakistan: A Policy Roadmap

Snapshot
• As entrepreneurs and firm owners, women in Pakistan tend to have higher participation in the textile sector, larger firms, and firms engaged in exporting.
• Women traders in Pakistan face a range of barriers. For example, export clearance procedures require many visits to customs and a number of interactions with customs authorities, some of which often involve paying bribes. (See
the chapter “HOW TO: Upgrade in the textiles and apparel global value chain” starting on page 53 for more information about the issues with customs processes in Pakistan.) These obstacles are present for men as well as women. However, women entrepreneurs are usually more pressed for time due to dual homemaking responsibilities, have greater restrictions on mobility, may fear more for their safety, and face cultural and even legal restrictions on the
TariffRationalisation
LeveragingCPEC
Technology Upgrading
Economiesof Scale
Integrationinto GVCs
Labour & Enterprise Productivity
Reducing Cost of Doing Business
ValueAddition
InstitutionalStrengthening
Ease of DoingBusiness
PolicySynergyDiversification
INCLUSIVE GROWTH GENDER MAINSTREAMING COMPLIANCE
Pillars of STPF 2018-23
ENTREPRENEURSHIP DEVELOPMENT
Competitiveness Trade-RelatedInvestment
ProductSophistication
& Diversification
TradeFacilitation
Source: Pakistan Ministry of Commerce
Figure 46. The pillars of Pakistan’s Strategic Trade Policy Framework, 2019–24
117CHAPTER 10 – HOW TO: LEVERAGE TRADE FOR WOMEN’S EMPOWERMENT
QU
ICK
STA
RT
Modernizing Trade in Pakistan: A Policy Roadmap

jobs they can do. ln that context, many women entrepreneurs prefer to concentrate on their businesses’ core activities and, if possible, rely on their male employees to deal with customs. Doing so reduces their knowledge of customs processes and may make them reluctant to increase exports.
• The Government of Pakistan understands the challenges and opportunities for women to play a stronger role in the country’s export sectors, and there is interest in dealing with underlying discriminatory practices and procedures. The government recognizes that women’s deeper engagement in the economy
and trade will produce economic gains and enhance productivity across the economy.
• In particular, Pakistan has committed through its development roadmap to enhancing international trade and making exports an engine of growth. This is crucial if Pakistan is to become an upper-middle income country by its 100th anniversary.
• In addition, Pakistan’s Strategic Trade Policy Framework (STPF) reflects the importance of trade. Moreover, the illustration in Figure 46 shows that gender is one of the fundamental building blocks for Pakistan’s current STPF.
Forward Look
• Pakistan could achieve significant economic gains by adding more women to its work force and involving women in international trade.
• Efficiently using the untapped female labor force, especially in the context of trade, could not only deliver large gains for Pakistan’s economy but also strengthen the productivity and competitiveness of female workers.
• Gender-sensitive trade policies that promote and develop the sectors where women work, or potentially will work, can lead to broad-based employment generation for women in Pakistan, while simultaneously encouraging women entrepreneurs to engage in national and international trade.
• What specific obstacles do women entrepreneurs and exporters face in Pakistan?
• What legal, policy, and social measures can be taken to ensure that women are included and not discriminated against in the trading
environment and to improve the trade and investment environment for women?
• How can Pakistan’s Strategic Trade Policy Framework (STPF) ensure that both men and women benefit from gains in trade?
Key Questions
118 CHAPTER 10 – HOW TO: LEVERAGE TRADE FOR WOMEN’S EMPOWERMENT
Modernizing Trade in Pakistan: A Policy Roadmap
118IN
DEP
TH

Methodology
Actions
Governments and industry associations often do not systematically capture gender-disaggregated economic data. Thus, analyses may require collecting new data. These tend to be based on qualitative and perception-based instruments gathered from representative
samples of the private sector. The main methodologies that the World Bank Group used to assess the potential for using trade to empower women were surveys, private sector consultation, public-private dialogue, and reviews of the law, policies, and regulations.
Critical data
ACTIVITIES
The World Bank Group carried out several activities to assess women’s role in trade:
Trade facilitation study on women’s barriers to trade
To identify the challenges and obstacles women entrepreneurs face in Pakistan, the World Bank Group held consultative sessions in Lahore, Karachi,
and Islamabad on women’s barriers to trade. The participants included market leaders and emerging businesses.
Analysis of gender integration in trade policies and trade agreements
Recognizing the importance of mainstreaming gender in trade policies, this desk-study sought to identify best practices in national trade policies
Information about gender characteristics of the population from national census data
Gender-disaggregated sectoral and firm-level data, such as data for e-commerce, which was used as a case study under the PTIPP
Measures on gender inequality from Women, Business and the Law (WBL).
Data on female participation in firm ownership, entrepreneurship, management, and the workforce from World Bank Group Enterprise Surveys
Data on gender equality can be found at the World Bank Group Gender Data Portal.
See “TOOLS: Critical data” starting on page 127 for more information about each of these critical data sources.
119CHAPTER 10 – HOW TO: LEVERAGE TRADE FOR WOMEN’S EMPOWERMENT
Modernizing Trade in Pakistan: A Policy Roadmap
119
IN D
EPTH

and regional trade agreements around the world. The World Bank Group reviewed a total of about 90 policy documents and trade agreements.
Analysis of e-commerce and the potential for women entrepreneurs in Pakistan
The World Bank Group, in partnership with NexTrade Group, carried out a survey in 2018 on e-commerce engagement and constraints. In South Asia, the survey covered 1,688 merchants in nine major sectors, and 539 e-commerce firms serving merchants across Afghanistan, Bangladesh, Bhutan, India, Nepal, Pakistan, and Sri Lanka.
Creation of Pakistan Women Entrepreneurs Network for Trade (WE-NET)
With support from the PTIPP program, Pakistan Women Entrepreneurs Network for Trade (WE-NET) was launched in 2017 as a nation-wide network to engage women entrepreneurs. Its mission is to establish an inclusive and sustainable platform across Pakistan that represents women entrepreneurs trading of goods and services, with the goal of promoting women’s economic empowerment by developing women’s SME entrepreneurship. WE-NET will promote and partner with global and national organizations for the betterment of the nation and the next generation of Pakistani women entrepreneurs. The network’s objectives are to: (a) serve as an advocacy platform for Pakistan’s women entrepreneurs; (b) represent Pakistan’s women-led SMEs globally by developing linkages with regional and international trade networks for women entrepreneurs; (c) highlight best practices for women-led businesses; and develop a database of women-led SMEs to be used for trade policy and cross-sector partnerships.
Conference on gender and trade
In March 2018, WE-NET organized Pakistan’s first conference on gender and trade titled “Closing the Gender Gap – A Tool for Economic and Trade Development in Pakistan.” The conference was co-hosted by the World Bank Group and the Ministry of Commerce, with support from the Australian Government. The aim of the conference was to create a platform for discussions on the impact of trade policies and entrepreneurship on women and men in Pakistan as well as internationally, and to connect with decision makers from ministries and industries around the world. The full 2-day summit of inspirational speakers, group discussions and private-public dialogue was a unique opportunity to come together to share, learn and explore the importance of promoting gender equality within trade and business.
FINDINGS
World Bank Group activities to assess trade-related gender issues in Pakistan found that the factors limiting women’s access to trade included low female labor force participation in general, specific barriers to trade, and an undeveloped e-commerce industry.
Female labor force participation
• In Pakistan, most of the female labor force is in the agriculture sector. In 2017, 67 percent of the female workforce was employed in agriculture, which is a major export industry for Pakistan (Figure 47). Most of these women work 16 hours a day and are heavily burdened by their double roles as paid or unpaid workers and family care providers. The other major industrial sectors for the female workforce are manufacturing (16 percent) and education (7 percent). (See Figure 43 on page 112.)
120 CHAPTER 10 – HOW TO: LEVERAGE TRADE FOR WOMEN’S EMPOWERMENT
Modernizing Trade in Pakistan: A Policy Roadmap
120IN
DEP
TH

• Despite increases in recent years, female labor force participation in Pakistan is well below rates for countries with similar income levels. Labor force participation lags even among women with higher education; around 25 percent of women with university degrees in Pakistan are working. Only 1 percent of women are entrepreneurs, compared to 21 percent of men (ILO 2013). Even when women have jobs, the gender gaps in job quality are large. Women tend to work in low-quality jobs in vulnerable conditions.
• International trade of and using digital technologies remains a small fraction of global trade, but it is growing much faster than traditional trade. The digital economy is opening up new opportunities for women in trade. Yet, the percentage of women-owned e-commerce firms in Pakistan is significantly smaller than that of men, and Pakistan does not have an e-commerce policy.
• Education, marital status and motherhood roles as well as gendered social norms are major determinants of female labor force
Figure 47. Better trade policies can promote women’s entrepreneurship, creating opportunities beyond agriculture.
Source: Getty Images
121CHAPTER 10 – HOW TO: LEVERAGE TRADE FOR WOMEN’S EMPOWERMENT
Modernizing Trade in Pakistan: A Policy Roadmap
121
IN D
EPTH

participation. Other reasons for low female labor force participation are restrictions on physical mobility outside the home, lack of safety, scarce affordable transport services, and a paucity of accessible day care.
• Women entrepreneurs face numerous challenges to financing, owning, and growing a business. Limited access to capital and technology and legal and policy obstacles to business ownership and development are some of them. Lack of networks, knowledge, and links to high value markets are others. Men have more social and professional connections, role models, and mentorship opportunities, granting them greater access to business prospects, information, and contacts.
Barriers to trade
• Some barriers are common for both men and women. But even though men face similar barriers in some cases, the intensity of the barriers may differ between men and women. Women, for example, have less time due to family obligations, less mobility, and lower literacy than men. Barriers that especially affect women, preventing them from fully benefitting from trade liberalization and the global economy, include:
» Unclear certification requirements and export procedures—This lack of knowledge may be more cumbersome for SMEs and women traders because they have less access to business networks, education, and ICT.
» Lack of a working relationship with customs—Customs officials particularly lack knowledge of non-traditional items often traded by women and are wary of clearing
such consignments, resulting in time delays and damage to goods.
» Non-tariff measures in destination markets—For example, the Indian Customs Authority has been dissatisfied with certifications obtained from Pakistan in jewelry and textiles. This delays delivery to clients because consignments are redirected for certification within India.
» Access to capital—Fewer than 25 percent of businesswomen in Pakistan borrow from microfinance institutions, partially due to limited availability of collateral.
» Lack of business management skills—Restricted interaction of female entrepreneurs with male members of society limit the opportunities to acquire business management and technical skills.
» Legal and regulatory restrictions—Regulatory and legal barriers are one of the main reasons for the lower integration of women-owned SMEs in international markets. To register a business, married women need to provide their husband’s name, nationality, and address in the presence of a witness. To apply for a passport and national identity card, a married woman must provide her marriage contract and her husband’s ID card or an electronic confirmation by her husband.
» Sector discrimination—There are laws prohibiting women from working in jobs deemed hazardous, arduous or morally inappropriate.
E-commerce
• E-commerce is developing rapidly around the world, enabling countries to unlock latent
122 CHAPTER 10 – HOW TO: LEVERAGE TRADE FOR WOMEN’S EMPOWERMENT
Modernizing Trade in Pakistan: A Policy Roadmap
122IN
DEP
TH

sources of growth. Companies can now sell and buy goods and services with greater ease across borders; and consumers can access a wider variety of goods and services at lower cost. E-commerce helps developing countries spur exports, entrepreneurship, and inclusive economic growth. Pakistan’s e-commerce firms are a strong example of this and they expect significant growth in exports (by 23 percent), employment (by 20 percent), and productivity as the sector continues to grow and as barriers to exporting are removed.
• Women play a particularly important role in e-commerce:
» Firms with female CEOs are 17.1 percent more engaged in buying and selling online in comparison to firms with male CEOs.
» Female-led firms export more. Specifically, firms with female CEOs reported 4.5–6 percent higher e-commerce export sales over total sales in 2016-17 than firms with male CEOs.
• Yet women experience greater difficulty in e-commerce trade:
» Small firms (under 50 employees) with female CEOs suffered more from inefficiencies in IT connectivity and infrastructure and digital regulations.
» For cross-border e-commerce, medium firms (51-500 employees) with female CEOs experience gaps in connectivity and IT infrastructure, e-commerce related logistics, online payments and shortages in the team’s capacity to engage in e-commerce as the major constraints.
RECOMMENDATIONS
Overall recommendations
• A country’s GDP improves when women join the labor force. Inequality slows economic growth by decreasing the pool of talent in the labor force, which leads to lower human capital and total factor productivity losses. Bringing women into Pakistan’s labor force—through closing gender gaps and reducing barriers such as tax distortions, discrimination, and social and cultural factors—would have an economic benefit over and above the benefit from simply having more workers. Women bring new skills to the workplace. In Pakistan, welfare gains by removal of barriers to female labor force participation could exceed 20 percent.2
• Because women and men are engaged in different sectors in Pakistan’s economy, they will be affected differently by changes in trade patterns and trade policies. The benefits of trade must be assessed against this asymmetry to enable the design of appropriate strategies and policies that favor the whole economy.
• Establishing clear links between trade policy and overarching goals, including gender equality, would contribute to making trade a tool for sustainable development. Gender analysis and perspectives should be systematically integrated into Pakistan’s trade policies and programs. Formulating and implementing gender responsive trade policies is also important for the special incentive arrangement within the EU Generalized System of Preference (GSP+) from which Pakistan benefits. Two of the 27 Conventions in the GSP+ explicitly focus on gender equity.
2 Welfare gains are measured in terms of home goods consumption.
123CHAPTER 10 – HOW TO: LEVERAGE TRADE FOR WOMEN’S EMPOWERMENT
Modernizing Trade in Pakistan: A Policy Roadmap
123
IN D
EPTH

• With a gender focus, the new 2019–24 STPF can foster a virtuous cycle of prosperity (Figure 48) and assist in creating a foundation for gender responsive policy measures in Pakistan.
• Gender-related reforms need to be more targeted, sustained, and synchronized with other trade policy reforms to ensure that Pakistan’s trade and logistics performance improves relative to regional and international peers. To overcome obstacles to their participation in the workforce, women need access to finance, trade-related information, and skills, business operation, and management training. Removing obstacles to women’s economic engagement will help women consumers, workers, entrepreneurs, and exporters experience the gains from trade.
Specific recommendations
• The World Bank Group recommends that the Government of Pakistan include the following specific reforms in the STPF:
» Adopt gender principles of nondiscriminatory treatment of women, inclusion of women, and a safe and secure transit environment for women to guide institutional and administrative procedures and trade initiatives. This would include adhering to international conventions on gender-related issues.
» Identify and eliminate discriminatory rules, regulations, and administrative procedures that inhibit women’s access to capital, credit, finance, business registration, and customs procedures.
Increase income
& saving
Expand consumption in the local
marketplace
Gain exposure to competition and
innovation
Create role models for
other women
Succesfulwomen traders
Figure 48. Cycle of prosperity
124 CHAPTER 10 – HOW TO: LEVERAGE TRADE FOR WOMEN’S EMPOWERMENT
Modernizing Trade in Pakistan: A Policy Roadmap
124IN
DEP
TH
The Ministry of Commerce could work with private sector institutions to identify and eliminate discriminatory business practices. This would include improving women’s access to resources in general, and specifically promoting merit-based access to financial resources. It would also involve increasing awareness and transparency and enhancing capacity building on gender sensitivity.
» Integrate women in trade policymaking to ensure women’s voices and entrepreneurial interests are taken into account. This would include: (a) undertaking diagnostic studies and analyses on the impact of trade liberalization on women; (b) working internally, with trade-related institutions, the private sector, and civil society to improve the investment environment for women entrepreneurs and traders; (c) formalizing the engagement of women’s organizations, women entrepreneurs, and women exporters in the trade policymaking process; (d) integrating Pakistan’s economic institutes with gender expertise into the trade policymaking process; and (e) adopting an analytical methodology with regard to gender in evaluating trade policy initiatives.
» Increase participation of women in trade-related programs and institutions. This would involve: (a) including women entrepreneurs and exporters in export development initiatives in Pakistan and abroad; (b) increasing women’s awareness of and access to public trade benefit programs, such as technology subsidies and grants, matching grants for plant and machinery upgrades, and local tax and levy drawbacks; (c) mandating
that Pakistan’s 11 training and product development institutes integrate qualified women into their leadership, as providers of training, and as students; (d) maintaining senior leadership positions for professionally qualified women in trade-related institutions; (e) delivering a certain proportion of trade-related services to women; (f) introducing a code of conduct that provides for inclusion and nondiscriminatory treatment of women as employees and clients; (g) addressing other labor-related issues and conditions of employment; (h) creating institutions and networks specifically for women’s issues; and (i) developing cooperation programs to further the participation of women.
» Strengthen women’s skills in agricultural production. This would include (a) ensuring that agricultural extension programs include women as agents and recipients; (b) linking agricultural extension agents with women working in agriculture to improve their knowledge of production, handling of fertilizers and pesticides, and adherence to international standards to improve the export potential of Pakistan’s agricultural producers; and (c) mandating that agricultural extension programs provide training to women working in agriculture in value-added production and processing for export.
• In addition, it is important to recognize the impact and potential of e-commerce on earnings of female-led firms. Proactively levelling the playing field for women to participate in e-commerce will be essential for maximizing the economic and development potential of the sector.
125CHAPTER 10 – HOW TO: LEVERAGE TRADE FOR WOMEN’S EMPOWERMENT
Modernizing Trade in Pakistan: A Policy Roadmap
125
IN D
EPTH

Additional resources
Australia Department of Foreign Affairs and Trade. 2017. “Independent Review of the Pakistan Trade and Investment Policy Program (PTIPP).”
International Labour Organization (ILO). 2013. “Pakistan Labour Market Update.”
International Labour Organization (ILO), and Asian Development Bank (ADB). 2011. Women and Labour Markets in Asia: Rebalancing for Gender Equality. ILO Regional Office for Asia and the Pacific; Asian Development Bank.
McKinsey Global Institute. 2015. “The Power of Parity: How Advancing Women’s Equality Can Add $12 Trillion to Global Growth.” McKinsey & Company.
Ostry, Jonathan David, Jorge Alvarez, Raphael A. Espinoza, and Chris Papageorgiou. 2018. “Economic Gains from Gender Inclusion: New Mechanisms,
New Evidence.” Staff Discussion Note No. 18/06. International Monetary Fund (IMF).
Teignier, Marc, and David Cuberes. 2014. “Aggregate Costs of Gender Gaps in the Labor Market: A Quantitative Estimate.” UB Economics Working Paper 2014/308. Universitat de Barcelona, Facultat d’Economia i Empresa, UB Economics.
Wodon, Quentin T., and Bénédicte de la Brière. 2018. “Unrealized Potential.” Washington, DC: World Bank.
The Women Entrepreneurs Finance Initiative is a collaborative partnership among governments, multilateral development banks, and other stakeholders. It seeks to unlock billions of dollars in financing for women-owned and women-led small- and medium-size enterprises in developing countries to address financial and non-financial barriers and create a better ecosystem for women entrepreneurs.
See “TOOLS: Additional resources” starting on page 135 for more information about each of these publications and toolkits.
126 CHAPTER 10 – HOW TO: LEVERAGE TRADE FOR WOMEN’S EMPOWERMENT
Modernizing Trade in Pakistan: A Policy Roadmap
126IN
DEP
TH

TOOLS: Critical data
Getty Images
This appendix collects the data sources that we have highlighted throughout the handbook. For each data source, we provide a link to the source and a brief description of the data and how it may be used.
Bilateral FDI Statistics from the United Nations Conference on Trade and Development (UNCTAD)—Systematic FDI data for 206 economies around the world. The data cover inflows, outflows, inward stock, and outward stock by region and economy. Data are from national sources where possible. Where data are not available from national sources, data from partner countries (mirror data) and from other international organizations are also used.
Content of Deep Trade Agreements—This World Bank dataset maps 52 provisions in 279 PTAs notified at the WTO signed between 1958 and 2015. It also includes information about legal enforceability of each provision.
Data on formal and informal fees collected at border crossings. This data can come from customs authorities, other regulatory agencies, surveys of traders, and so on.
Doing Business (DB) indicators. Objective measures of business regulations for local firms in 190 national economies and selected cities produced by the World Bank Group. The “Trading Across Borders” (TAB) module is especially useful in this context. For an example of how to improve a country’s score on TAB measures, see the case study on training and communication in trade facilitation in the Doing Business 2019 report.
Enabling the Business of Agriculture from the World Bank—Provides globally comparable data and indicators that can enable countries, decision makers, and stakeholders to identify barriers that impede the growth of agriculture and agribusinesses, share experiences, and develop strategies to improve the policy and legal environment. The third report in the series, Enabling the Business of Agriculture 2017, presents data for 62 countries across 12 topics: seed, fertilizer, machinery, finance, markets, transport, information and communication technology, water, livestock, and land. Two overarching themes—gender and environmental sustainability—are also included in the report’s analysis to ensure that the messages developed by Enabling the Business of Agriculture encourage inclusive and sustainable practices.
Enterprise Surveys from the World Bank Group. An Enterprise Survey is a firm-level survey of a representative sample of an economy’s private sector. All told, Enterprise Surveys offer an expansive array of economic data on 135,000 firms in 139 countries. The surveys cover a broad range of
128
Modernizing Trade in Pakistan: A Policy Roadmap
128CR
ITIC
AL
DATA
TOOLS – CRITICAL DATA

business environment topics including access to finance, corruption, infrastructure, crime, competition, and performance measures. Of particular relevance in this context are data on trade-related measures, (such as the number of days to clear imports from customs) and gender (such as female entrepreneurship, participation in firm ownership, management, and the workforce). A database query tool is available to gauge gender participation differences across various firm subgroups. You can also generate graphs to compare countries.
Export Value Added Database (EVAD)—Measures the domestic value-added content of domestic output and exports for 118 countries across 27 sectors of the economy, including nine commercial services sectors, 3 primary sectors, and 14 manufacturing sectors, spanning intermittent years between 1997 and 2011. Most other sources measure trade in terms of gross transaction values or value added plus domestic and foreign intermediate inputs. These measures may undervalue the contribution of a sector to trade if value added from the sector is embedded as inputs in other sectors’ exports. Because manufacturing exports often embed value added by services, gross exports often undervalue the contributions of services. For the same reason, gross exports often overvalue the contributions of manufacturing. Measuring trade on a value-added basis overcomes this shortcoming. It makes explicit the value a sector adds to domestic production, exports, and other sectors of the economy. This includes both forward linkages (the contribution of a sector to other sectors’ exports) and backward linkages (the contribution of other sectors to a sector’s exports).
FAOSTAT—Provides free access to food and agriculture data for over 245 countries, territories, and regions from 1961 to the most recent year available.
fDi Markets from the Financial Times—A database of cross-border investments covering all countries and sectors worldwide. It provides access to real time monitoring of investment projects, capital investment and job creation. Users can track and profile companies investing overseas and conduct detailed analyses to uncover trends.
Firm-level data on firms’ performance—When focusing on export transactions, it can be obtained from customs. When focusing on firms’ characteristics (such as output, employment, and so on), it is often obtained from national statistical agencies that conduct periodic industrial censuses or surveys.
Gender Data Portal—The World Bank Group Gender Data Portal links to data and resources relating to gender equality from the World Bank Group and other agencies.
Global Competitiveness Report from the World Economic Forum—Rates 140 economies on 98 indicators across 12 pillars of competitiveness. The ratings derive from a combination of data from international organizations and executive opinion surveys. The indicators reflect the extent
129
Modernizing Trade in Pakistan: A Policy Roadmap
129
CRIT
ICA
L DA
TA
TOOLS – CRITICAL DATA

and complexity of the drivers of productivity and the competitiveness ecosystem. The pillars are: institutions, infrastructure, information and communications technology (ICT) adoption, macroeconomic stability, health, skills, product market, labor market, financial system, market size, business dynamism, and innovation capability. Among many other things, it provides data on female participation in the labor force.
Global Preferential Trade Agreements Database (GPTA)—provides information on PTAs around the world, including agreements not notified to the WTO. It helps trade decision makers, scholars, and business operators better understand and navigate the world of PTAs. The database was developed jointly by the World Bank and the Center for International Business.
Global Services Location Index. (GSLI)—Identifies the countries with the strongest underlying fundamentals to potentially deliver IT and BPO services by evaluating 55 countries against 38 measurements across three major categories: financial attractiveness, people skills and availability, and business environment. Financial factors constitute 40 percent of the total weight in the GSLI. The two remaining categories – people skills and availability and business environment – constitute 60 percent of the total weight (A.T.Kearney, 2017).
Global Trade Analysis Project (GTAP) database—a fully documented, publicly available global data base describing bilateral trade patterns, production, consumption and intermediate use of commodities and services. It contains complete bilateral trade information, transport and protection linkages. The GTAP Data Base represents the world economy and is utilized by thousands worldwide as a key input into contemporary applied general equilibrium (AGE) analysis of global economic issues. The current release, the GTAP 9 Data Base, features 2004, 2007 and 2011 reference years as well as 140 regions for 57 commodities.
IMF national data—Provides exchange rate data and national FDI data from balance of payments reports.
International Labour Organization, ILOSTAT database—provides data on key indicators of the labor market, including employment by sector, occupation, education, rural vs. urban, sex, and age.
International Trade Centre statistics—Offers data on the trade performance and potential of economies around the globe. Statistics collected by the International Trade Centre (ITC) are useful for comparability. Categories include computer services and other business services. Computer services consist of hardware and software-related services and data-processing services; they exclude non-customized packaged software (systems and applications) and video and audio recordings on physical media; computer-training courses not designed for a specific user; and leasing of computers without an operator. Other business services cover research and development, professional, and management consulting, and technical, trade-related, and other business services.
130
Modernizing Trade in Pakistan: A Policy Roadmap
130CR
ITIC
AL
DATA
TOOLS – CRITICAL DATA

Logistics Performance Index (LPI) indicators from the World Bank—An interactive benchmarking tool to help countries identify challenges and opportunities in trade logistics. It is a helpful start for finding data on trade facilitation. The LPI 2018 allows for comparisons across 160 countries.
NTM Hub—The NTM Hub from UNCTAD serves as a gateway to understanding the uses and implications of non-tariff measures (NTMs). It provides information on classification, data, research and analysis, and policy support. Increasing transparency and understanding of NTMs can build capacity of decision makers, trade negotiators and researchers to strike the delicate balance between the reduction of trade costs and the preservation of public objectives.
Online Labour Index of the University of Oxford—The first economic indicator providing an online gig economy equivalent of conventional labor market statistics. It measures the supply and demand of online freelance labor across countries and occupations by tracking the number of projects and tasks across platforms in real time.
Overall Trade Restrictiveness Index (OTRI)—summarizes the trade policy stance of a country by calculating the uniform tariff that will keep its overall imports at the current level when the country in fact has different tariffs for different goods. In other words, the OTRI quantifies the uniform tariff that, if imposed on imports instead of the existing heterogeneous structure of protection, would leave aggregate imports at their current level. In a nutshell, the OTRI is a more sophisticated way to calculate the weighted average tariff of a given country, with the weights reflecting the composition of import volume and import demand elasticities of each imported product. The empirical methodology of the OTRI was developed in Kee, Nicita and Olarreaga (2008, 2009).
Pakistan Social and Living Standards Measurement (PSLM)—provides social and economic indicators in alternate years at provincial and district levels. The data generated through surveys is used to assist the government in formulating the poverty reduction strategy as well as development plans at district level for the rapid assessment of programs in the overall context of Millennium Development Goals (MDGs) and, now, the Sustainable Development Goals (SDGs). The sample size of PSLM surveys district level was approximately 80,000 households and approximately 26,000 provinces. Reports and micro data sets are available on the website. The PSLM provides indicators on demographic characteristics, education, health, employment, household assets, household amenities, population welfare, and water supply & sanitation. In particular, it includes data on household composition by sex and percentage distribution of employed persons by industry divisions, employment status, sex, and area.
Poverty and Equity Data Portal—the World Bank Group’s comprehensive source for the latest data on poverty, inequality, and shared prosperity. The portal allows you to explore poverty and inequality indicators for countries and regions, explore countries by income, and access poverty and inequality data various country groupings.
131
Modernizing Trade in Pakistan: A Policy Roadmap
131
CRIT
ICA
L DA
TA
TOOLS – CRITICAL DATA

Services Trade Restrictiveness Index (STRI) from the OECD is a unique, evidence-based tool that provides information on regulations affecting trade in services in 22 sectors across all OECD member countries and Brazil, the People’s Republic of China, Costa Rica, India, Indonesia, Malaysia, the Russian Federation, and South Africa. These countries and sectors represent over 80% of global trade in services. The STRI database of laws and regulations in force is updated, verified and peer-reviewed by regulators and trade officials annually. Composite STRI indices for each country and sector in the STRI quantify restrictions on foreign entry and the movement of people, barriers to competition, regulatory transparency and other discriminatory measures that impact the business environment. Indices of regulatory heterogeneity measure regulatory differences by country pair, sector and year. Empirical analyses assess the impact of services trade policies on economic performance and trade costs. The STRI toolkit can help decision makers scope out reform options, benchmark them relative to global best practice, and assess their likely effects; for trade negotiators to clarify restrictions that most impede trade, and for businesses to shed light on the requirements that traders must comply with when entering foreign markets.
Tariff Analysis Online (TAO) facility provided by WTO—Provides access to the WTO’s Integrated Data Base (IDB) and Consolidated Tariff Schedules (CTS) database online, allowing the user to select markets and products, compile reports, and download data. The two databases contain applied customs duties at the tariff line level, import statistics by country of origin and WTO members’ commitments on goods (bound tariffs and specific commitments in agriculture).
Trade Facilitation Agreement Database. The TFA Database is a tool to track the implementation of WTO members’ commitments under the WTO TFA.
Trade in Services data from the OECD—Records the value of services exchanged between residents and non-residents of an economy, including services provided through foreign affiliates established abroad. Services include transport (both freight and passengers), travel, communications services (postal, telephone, satellite, etc.), construction services, insurance and financial services, computer and information services, royalties and license fees, other business services (merchanting, operational leasing, technical and professional services, etc.), cultural and recreational services, and government services not included in the list above. Trade in services drives the exchange of ideas, know-how and technology, although it is often restricted by barriers such as domestic regulations.
Trade in Value Added (TiVA) data from the OECD—The goods and services we buy are composed of inputs from various countries around the world. However, the flows of goods and services within these global production chains are not always reflected in conventional measures of international trade. TiVA addresses this issue by considering the value added by each country in the production of goods and services that are consumed worldwide. TiVA indicators are designed to better inform decision makers by providing new insights into the commercial relations between nations. Data presented in the TiVA database provide insights into: domestic and foreign value added of gross exports by exporting industry; services content of gross exports
132
Modernizing Trade in Pakistan: A Policy Roadmap
132CR
ITIC
AL
DATA
TOOLS – CRITICAL DATA

by exporting industry, type of service, and origin of value added; participation in global value chains (GVCs) via intermediate imports embodied in exports (backward linkages) and domestic value added in partners’ exports and final demand (forward linkages); ‘global orientation’ of industrial activity, that is, the share of industry valued added that meets foreign final demand; country and industry origins of value added in final demand, including the origin of value added in final consumption (by households and government) and in investment by businesses; bilateral trade relationships based on flows of value added embodied in domestic final demand; inter-regional and intra-regional relationships; and domestic value added content of imports. The 2018 edition of the TiVA database provides indicators for 64 economies including all OECD, EU28 and G20 countries, most East and Southeast Asian economies, and a selection of South American countries. Some 36 unique industrial sectors are represented within a hierarchy, including aggregates for total manufactures and total services. This edition covers the period 2005 to 2015, with preliminary projections to 2016 for some indicators.
UN ESCAP-World Bank Trade Cost Database. Provides estimates of bilateral trade costs in agriculture and manufactured goods for the period 1995-2015. It is built on trade and production data collected in 178 countries. Symmetric bilateral trade costs are computed using the Inverse Gravity Framework, which estimates trade costs for each country pair using bilateral trade and gross national output. Trade costs are available for two sectors: trade in manufactured goods, and agriculture. Energy is excluded.
UNCTAD (United Nations Conference on Trade and Development) Trade Analysis Information System (TRAINS)—A comprehensive computerized trade control and market access information system. It combines data drawn from UN TARMAC—a joint primary data collection with the International Trade Centre, UNCTAD/WTO (ITC)—and the World Integrated Trade Solutions (WITS) software. The database provides data on trade control measures, including tariffs, para-tariffs, non-tariff measures, and imports by suppliers. TRAINS is both a data depository and an analytical tool designed for decision makers and economic operators engaged in international merchandise trade. It is also a powerful tool for multilateral or bilateral trade negotiations and research on international merchandise trade. It further provides a single market, partial equilibrium trade simulation model with which users may simulate trade, revenue, and welfare effects of tariff changes by a single market country. TRAINS contains data covering tariffs, non-tariff measures, and import flows by origin for over 160 countries and years since 1988. For tariffs, TRAINS contains not only general applied tariff data but also information on applied preferential tariffs including the Generalized System of Preferences (GSP) and many regional and bilateral preferences. The TRAINS data is accessible via WITS (see below).
UN Comtrade (United Nations Commodity Trade Statistics Database)—Contains detailed goods imports and exports statistics reported by statistical authorities of close to 200 countries or areas. It has annual trade data from 1962 to the most recent year. UN Comtrade is the most comprehensive trade database available with over 3 billion records. UN Comtrade data covers trade in goods only, compiled on a customs basis. The website provides facilities for downloading data and accessing innovative visualizations.
133
Modernizing Trade in Pakistan: A Policy Roadmap
133
CRIT
ICA
L DA
TA
TOOLS – CRITICAL DATA

Women, Business and the Law (WBL)—Measures gender inequality in the law.
World Bank in Pakistan—The World Bank in Pakistan provides an overview of World Bank activities in Pakistan and links to essential data about the country.
World Development Indicators (WDI) from the World Bank—The primary World Bank collection of development indicators, compiled from officially-recognized international sources. It presents the most current and accurate global development data available, and includes national, regional and global estimates. Topics include economic growth, macroeconomic vulnerability, private sector development, and trade. Among other things, it provides data on both gender and rural versus urban population characteristics.
World Economic Forum Global Competitiveness Report—includes data on female participation in the labor force.
World Integrated Trade Solutions (WITS) Database from the World Bank—Provides access to international merchandise trade, tariff, and non-tariff measure (NTM) data. Users can obtain countries’ exports, imports and tariff statistics along with development data. Registered users can perform custom analysis, using standard and derived product classifications. WITS provides tools to help assess the impact of tariff cuts and assess the competitiveness of countries by calculating and visualizing indicators. WITS provides access to TRAINS, among other data.
134
Modernizing Trade in Pakistan: A Policy Roadmap
134CR
ITIC
AL
DATA
TOOLS – CRITICAL DATA

TOOLS: Additional resources
Getty Images

This appendix collects the additional resources that we have highlighted throughout the handbook. For each resource, we provide a link to the full text and a brief description of the resource and how it may be used.
Aguayo-Tellez, Ernesto. 2012. “The Impact of Trade Liberalization Policies and FDI on Gender Inequalities: A Literature Review.” Washington, DC: World Bank. This paper reviews the recent literature on the impact of trade liberalization and foreign direct investment (FDI) on gender inequality in employment, wages, education, health, and other dimensions of welfare.
Aguiar, Angel, Badri Narayanan, and Robert McDougall. 2016. “An Overview of the GTAP 9 Data Base.” Journal of Global Economic Analysis 1 (1): 181–208. Provides an overview of the latest release of the Global Trade Analysis Project (GTAP) data base.
Antràs, Pol, and Elhanan Helpman. 2008. “Contractual Frictions and Global Sourcing.” In The Organization of Firms in a Global Economy, edited by Elhanen Helpman, D. Marin, and T. Verdier, 9–54. Cambridge, MA: Harvard University Press. Describes a model of the international organization of production in which firms with different levels of productivity decide whether to integrate or outsource the production of intermediate inputs, and from which country.
Artuc, Erhan, Gladys Lopez-Acevedo, Raymond Robertson, and Daniel Samaan. 2019. Exports to Jobs. Washington, DC: World Bank. Posits that increasing exports per worker could bring higher wages and better jobs to South Asia. Spreading the benefits from higher exports widely requires policies to raise skills and provide certain groups, such as women and youth, with more and better jobs.
Australia Department of Foreign Affairs and Trade. 2017. “Independent Review of the Pakistan Trade and Investment Policy Program (PTIPP).” Reviews the effectiveness of the PTIPP’s gender component as of 2017. Includes information about women’s participation in the labor force in Pakistan. Describes not only of PTIPP activities related to gender but also external activities related to gender. Suggests further activities to improve gender equality in the labor force.
Baniya, Suprabha; Rocha Gaffurri, Nadia Patrizia; Ruta, Michele. 2019. Trade Effects of the New Silk Road: A Gravity Analysis (English). Policy Research Working Paper No. 8694. Washington, DC: World Bank Group. Finds that increases in trade for countries participating in China’s Belt and Road Initiative would be three times as large on average if trade reforms complemented the improvements in transport infrastructure. This paper is the main source for the gravity analysis described in the text.
136
Modernizing Trade in Pakistan: A Policy Roadmap
136A
DD
ITIO
NA
L R
ESO
UR
CES
TOOLS – ADDITIONAL RESOURCES

Borchert, Ingo, Batshur Gootiiz, and Aaditya Mattoo. 2012. “Policy Barriers to International Trade in Services: Evidence from a New Database.” Policy Research Working Paper No. 6109. Washington, DC: World Bank. Based on a collection of comparable information on services trade policies for 103 countries across a range of service sectors, determines that restrictions on foreign acquisitions, discrimination in licensing, restrictions on the repatriation of earnings, and lack of legal recourse together reduce the expected value of foreign investment by USD 2.2 billion over a 7-year period.
Brenton, Paul, Christian Saborowski, Cornelia Staritz, and Erik von Uexkull. 2009. “Assessing the adjustment implications of trade policy changes using TRIST (tariff reform impact simulation tool).” Policy Research Working Paper No. 5045. Washington, DC: World Bank. This paper describes the TRIST tool and provides a range of examples that demonstrate the insights that the tool can provide to policymakers on the adjustment impacts of reducing tariffs.
Cadot, Olivier, Mariem Malouche, and Sebastián Sáez. 2012. Streamlining Non-Tariff Measures: A Toolkit for Policy Makers. Washington, DC: World Bank. Discusses the non-tariff measure (NTM) classification system, the data collection, and the key characteristics of the data. Highlights the private sector view that NTMs should support domestic firms’ competitiveness across countries. Describes an NTM analysis step by step, including the questions to ask, how to answer them, and how to quantify the answers when possible. Focuses on the institutional setup and key principles required to streamline regulations and provides practical examples.
Cadot, Olivier, Michael J. Ferrantino, Julien Gourdon, and José-Daniel Reyes. 2018. Reforming Non-Tariff Measures. Washington, DC: World Bank. Discusses the rationale for improving NTMs; illustrates how to quantify NTMs and their effects; discusses the effects of NTMs on household expenditures, poverty, and firm competitiveness; and shows how empirical analysis of NTMs can inform policy advice.
Caliendo, Lorenzo, and Fernando Parro. 2015. “Estimates of the Trade and Welfare Effects of NAFTA.” The Review of Economic Studies 82 (1): 1–44. This is the work underlying the de Soyres et al. (2018) structural general equilibrium (SGE) results used in the text. It specifies a comparative advantage model with sectoral linkages, trade in intermediate goods, and sectoral heterogeneity that includes 107 countries and regions.
Couto, Vivian, and Karina Fernandez-Stark. 2019. “Pakistan in the Offshore Services Global Value Chain.” Duke Global Value Chains Center: Duke University. Analyzes the offshore services industry in Pakistan, detailing the country’s position in the global market, the internal organization of the industry, and the human capital status. Examines India and Uruguay as comparative case studies, detailing the lessons learned for Pakistan. Concludes by outlining potential upgrading strategies to enhance the country’s competitiveness in the global market.
137
Modernizing Trade in Pakistan: A Policy Roadmap
137
AD
DIT
ION
AL
RES
OU
RCE
S
TOOLS – ADDITIONAL RESOURCES

Cusolito, Ana Paula, Raed Safadi, and Daria Taglioni. 2016. Inclusive Global Value Chains: Policy Options for Small and Medium Enterprises and Low-Income Countries. Washington, DC: The World Bank. Focuses on making global value chains (GVCs) more inclusive by overcoming constraints on small- and medium-sized enterprises (SMEs) and low-income developing countries (LIDCs). National and multilateral policy action can make GVCs more inclusive by taking a holistic approach to reform (spanning trade, investment, and domestic policies), investing in expanding the statistical base and analyzing GVCs, and sharing knowledge on best practices.
De Soyres, Francois, Alen Mulabdic, and Michele Ruta. 2018. “The Belt and Road Initiative: A Structural Analysis.” Mimeo. This paper is one of the main sources for the SGE model. This model, in turn, is based on Caliendo and Parro (2015).
De Soyres, Francois, Alen Mulabdic, Siobhan Murray, Nadia Rocha, and Michele Ruta. 2018. “How Much Will the Belt and Road Initiative Reduce Trade Costs?” Policy Research Working Paper No. 8614. Washington, DC: World Bank.
De, Prabir, Selim Raihan, and Ejaz Ghani. 2013. “What Does MFN Trade Mean for India and Pakistan? Can MFN Be a Panacea?” Policy Research Working Paper No. 6483. Washington, DC: World Bank. Argues that Pakistan’s most-favored nation (MFN) status to India would generate larger benefits if it were supported by improved connectivity and trade facilitation. Gains from trade would be small absent improved connectivity and trade facilitation.
DeRosa, Dean A. 2008. “Prospects for Greater Global and Regional Integration in the Maghreb: Gravity Model Analysis.” Washington, DC: Peterson Institute for International Economics.
Espitia, Alvaro, Aaditya Mattoo, Mondher Mimouni, Xavier Pichot, and Nadia Rocha. 2018. “How Preferential Is Preferential Trade?” Policy Research Working Paper. World Bank, Washington, DC. Assesses a central dimension of preferential trade agreements, the significance of tariff preferences, using a new data set on preferential and non-preferential or MFN applied tariffs, constructed by the International Trade Centre and the World Bank. The data set covers 5,203 products, 199 reporters, and 239 partners, representing approximately 97 percent of world imports in 2016. There are two main findings. First, PTAs have increased tariff-free trade. Second, the extent of preferential liberalization varies significantly across countries and sectors.
Farole, Thomas, and Deborah Winkler. 2014. Making Foreign Direct Investment Work for Sub-Saharan Africa: Local Spillovers and Competitiveness in Global Value Chains. Directions in Development—Trade. Washington, DC: World Bank. Presents the results of analytical work to investigate the dynamics of FDI spillovers in low-
138
Modernizing Trade in Pakistan: A Policy Roadmap
138A
DD
ITIO
NA
L R
ESO
UR
CES
TOOLS – ADDITIONAL RESOURCES

income countries, in resource-based sectors outside of manufacturing (agribusiness, apparel, and mining), and in GVCs.
Ferrantino, Michael J., Xuepeng Liu, and Zhi Wang. 2012. “Evasion Behaviors of Exporters and Importers: Evidence from the U.S.–China Trade Data Discrepancy.” Journal of International Economics 86 (1): 141–57. Using a model that allows for simultaneous misreporting to two authorities, finds strong statistical evidence of under-reporting exports at the Chinese border to avoid paying value-added tax (VAT).
Frederick, Stacey, and Jack Daly. 2019. “Pakistan in the Apparel Global Value Chain.” Duke University: Duke Global Value Chains Center. The World Bank sponsored this study on Pakistan’s apparel industry to understand potential upgrading strategies to enhance the country’s competitiveness in the apparel GVC. It analyzes the industry within Pakistan, first detailing the country’s position in the chain by looking at its firm profile, backward linkages, product profile, and end markets. It then outlines the internal organization of the industry, recent examples of upgrading, and the factors that influence the labor environment. It provides short case studies on Vietnam and Sri Lanka and concludes with potential upgrading strategies for the Pakistan.
Gereffi, Gary, and Karina Fernandez-Stark. 2010. “The Offshore Services Value Chain: Developing Countries and the Crisis.” Policy Research Working Paper No. 5262. Washington, DC: World Bank.
Gereffi, Gary, and Karina Fernandez-Stark. 2011. “Global Value Chain Analysis: A Primer.” Duke University: Center on Globalization, Governance & Competitiveness (CGGC). Describes the methodology for analyzing GVCs used in the text. (See the section “Global value chain (GVC) analysis” on page 101 for a summary.)
Higgins, Kate. 2012. Gender Dimensions of Trade Facilitation and Logistics: A Guidance Note. Washington, DC: World Bank. Demonstrates that, in interventions related to trade facilitation and logistics, considering gender equality not only spurs country competitiveness, but also helps obtain better outcomes. Explores how gender can be integrated into trade facilitation and logistics initiatives through trade-related policy dialogue and the design, implementation, and monitoring and evaluation of trade facilitation and logistics initiatives.
Hofmann, Claudia, Alberto Osnago, and Michele Ruta. Horizontal Depth: A New Database on the Content of Preferential Trade Agreements. Policy Research Working Paper No. 7981. Washington, DC: World Bank. Presents a new database examining the coverage and legal enforceability of provisions in preferential trade agreements. The database covers 279 agreements signed by 189 countries between 1958 and 2015. Argues that accounting for the changing breadth of preferential trade agreements is essential to gain a complete and accurate understanding of where the global trading system is going and how its governance can be improved.
139
Modernizing Trade in Pakistan: A Policy Roadmap
139
AD
DIT
ION
AL
RES
OU
RCE
S
TOOLS – ADDITIONAL RESOURCES
Hollweg, Claire H., and Nadia Rocha. 2018. GVC Participation and Deep Integration in Brazil. Policy Research Working Paper No. 8646. Washington, DC: World Bank. Uses a structural gravity model and the Organization for Economic Co-operation and Development/World Trade Organization’s Trade in Value Added Database to analyze the scope for Brazil to increase global value chain–related trade. One avenue to raise participation in GVCs is through deeper preferential trade agreements. A deep integration agenda focusing not only on border measures but also on beyond-the-border measures, would help Brazil maximize the benefits of participation in GVCs.
International Finance Corporation (IFC). 2016. “Food Safety Toolkit.” Washington, DC: IFC. Designed to help companies in developing markets reduce risk in growing a sustainable food business while meeting the ever-increasing demands, needs, expectations, and trust of customers, wholesalers, retailers, government food safety regulators, and consumers.
International Labour Organization (ILO). 2013. “Pakistan Labour Market Update.” Describes and provides data on the labor market in Pakistan as of 2013.
International Labour Organization (ILO), and Asian Development Bank (ADB). 2011. Women and Labour Markets in Asia: Rebalancing for Gender Equality. ILO Regional Office for Asia and the Pacific; ADB. Provides an overview and trend analysis of where and how women worked in Asia, and under what conditions, before, during, and after the 2008 financial crisis and in the subsequent recovery.
Kathuria, Sanjay. 2018. A Glass Half Full: The Promise of Regional Trade in South Asia. South Asia Development Forum. Washington, DC: World Bank. Documents the gaps between current and potential trade in South Asia and addresses specific barriers that have held trade back: tariffs and para tariffs, real and perceived non-tariff barriers, connectivity costs, and the broader trust deficit. Concrete incremental steps aimed at tapping the potential of deeper integration are appropriate, and the report offers precise, actionable policy recommendations that increase trade and improve integration.
Kearney, A. T. 2019. “Digital Resonance: The New Factor Impacting Location Attractiveness.” This report, which accompanies the 2019 Global Services Location Index (GSLI), argues that automation and cybersecurity are becoming major factors in outsourcing decisions.
Kee, Hiau Looi, Alessandro Nicita, and Marcelo Olarreaga. 2008. “Import Demand Elasticities and Trade Distortions.” The Review of Economics and Statistics 90 (4): 666–82. Systematically estimates import demand elasticities for a broad group of countries at a very disaggregated level of product detail.
140
Modernizing Trade in Pakistan: A Policy Roadmap
140A
DD
ITIO
NA
L R
ESO
UR
CES
TOOLS – ADDITIONAL RESOURCES
Kee, Hiau Looi, Alessandro Nicita, and Marcelo Olarreaga. 2009. “Estimating Trade Restrictiveness Indices.” The Economic Journal 119 (534): 172–99. Provides, for 78 developing and developed countries, clearly defined indicators of trade restrictiveness grounded in trade theory. Results suggest that poor countries both have more restrictive trade policies and face higher trade barriers on their exports.
Laget, Edith, Alberto Osnago, Nadia Rocha, and Michele Ruta. 2018. Deep trade agreements and global value chains (English). Policy Research Working Paper No. 8491. Washington, DC: World Bank Group. Exploits a new data set on the content of trade agreements and data on trade in value added and in parts and components to quantify the impact of the depth of trade agreements on bilateral cross-border production linkages. The positive impact of deep trade agreements is higher for higher-value-added industries, suggesting that deep agreements help countries integrate in industries with higher value added.
Lopez-Acevedo, Gladys, and Raymond Robertson, eds. 2016. Stitches to Riches? Apparel Employment, Trade, and Economic Development in South Asia. Washington, DC: World Bank. The apparel sector in South Asia has not reached its full potential because of inefficiencies that affect its competitiveness. Apparel creates jobs that are good for development but is subject to distortions that stifle productivity in light manufacturing in South Asia. This report estimates the potential gains in exports and jobs (including for women) in apparel manufacturing and identifies policies that can unleash South Asia’s export and job potential.
Lopez-Acevedo, Gladys, Denis Medvedev, and Vincent Palmade. 2016. South Asia’s Turn: Policies to Boost Competitiveness and Create the Next Export Powerhouse. Washington, DC: World Bank. South Asia has great untapped competitiveness potential in apparel, automotive, electronics, and agribusiness. Realizing this potential would require governments in the region to pursue second-generation trade policy reforms (such as facilitating imports for exporters), develop industrial clusters in secondary cities, and deploy policies to improve the capabilities of firms.
Malik, Sohail Jehangir, Ali Shujat, Khalid Riaz, Edward Whitney, Mehrab Malek, and Ahmad Waqas. 2016. “Agriculture, Land, and Productivity in Pakistan.” Chapter 2 in Agriculture and the Rural Economy in Pakistan: Issues, Outlooks, and Policy Priorities, edited by David J. Speilman, Sohail Jehangir Malik, Paul A. Dorosh, and Nuzhat Ahmad, 41–80. Philadelphia, PA: University of Pennsylvania Press on behalf of the International Food Policy Research Institute (IFPRI). Looks beyond aggregate statistics to provide a more nuanced understanding of the diversity of agriculture in Pakistan, its contribution to the country’s economic growth and development, and the underlying constraints on accelerating its growth.
Maliszewska, M. and D. van der Mensbrugghe. 2018. “The Belt and Road Initiative: Macro and Sectoral Impacts.” Mimeo. This paper is one of the main sources for the computable general equilibrium (CGE) results reported in the text. They are based on the ENVISAGE model, which is a global, recursive dynamic CGE model developed
141
Modernizing Trade in Pakistan: A Policy Roadmap
141
AD
DIT
ION
AL
RES
OU
RCE
S
TOOLS – ADDITIONAL RESOURCES

at the World Bank. The model incorporates five production factors, includes 28 sectors, and comprises 34 countries and regions.
McKinsey Global Institute. 2015. “The Power of Parity: How Advancing Women’s Equality Can Add $12 Trillion to Global Growth.” McKinsey & Company. Finds that narrowing the global gender gap in work would not only be equitable in the broadest sense but could double the contribution of women to the growth of global gross domestic product (GDP) between 2014 and 2025, adding USD 12 trillion to global GDP by 2025.
Molinuevo, Martín; and Sebastián Sáez. 2014. Regulatory Assessment Toolkit: A Practical Methodology for Assessing Regulation on Trade and Investment in Services. Trade and Development. Washington, DC: World Bank. Provides guidance on how to assess and reform the regulatory policies of service trade industries. The toolkit can help government officials evaluate whether their regulatory framework addresses market failures, achieves public interest goals in an efficient manner, and promotes the development of an efficient domestic services market. It can support regulatory reform, guide improvements to regulatory governance, help negotiate and implement trade agreements, and assist with streamlining regulations to attract foreign investment.
Osnago, Alberto, Nadia Rocha, and Michele Ruta. 2015. Deep Trade Agreements and Vertical FDI: The Devil Is in the Details. Policy Research Working Paper No. 7464. Washington, DC: World Bank. Employs the Antràs and Helpman (2008) model of contractual frictions and global sourcing to study how deep trade agreements affect the international organization of production. Finds evidence that the depth of trade agreements is correlated with vertical FDI, and this is driven by the provisions that improve the contractibility of inputs provided by suppliers, such as regulatory provisions.
Ostry, Jonathan David, Jorge Alvarez, Raphael A. Espinoza, and Chris Papageorgiou. 2018. “Economic Gains from Gender Inclusion: New Mechanisms, New Evidence.” Staff Discussion Note No. 18/06. International Monetary Fund (IMF). Finds that gender diversity brings benefits all its own because women bring new skills to the workplace. Narrowing gender gaps benefits both men and women, because of a boost to male wages from higher female labor force participation. Because female labor force participation is high in services, sectoral reallocation along development paths boosts gender parity and productivity.
Porter, Michael E. 1980. Competitive Strategy. New York: The Free Press/Macmillan. Provides a framework for analyzing competitive advantage in the service of business strategy. According to Porter’s framework, competitive advantage is a function of either low cost (providing comparable buyer value more efficiently than competitors) or differentiation (performing activities at comparable cost but in unique ways that customers perceive as better or more relevant, creating more buyer value than competitors and, hence, command a premium price). You win by being cheaper or by being different. There are no other ways.
142
Modernizing Trade in Pakistan: A Policy Roadmap
142A
DD
ITIO
NA
L R
ESO
UR
CES
TOOLS – ADDITIONAL RESOURCES

Portugal, Alberto, José-Daniel Reyes, and Gonzalo Varela. 2015. “Uruguay: Trade Competitiveness Diagnostic.” World Bank, Washington, DC. Analyzes export dynamics in Uruguay over the period 2000–2013, benchmarking them against relevant comparator countries. It looks at export outcomes along four dimensions: (1) the evolution, composition, and growth orientation of the country’s export basket, (2) diversification across products and markets, (3) sophistication and quality, and (4) the survival of export relationships. The report offers several hypotheses for a detailed competitiveness diagnostic of Uruguay’s external sector and policy recommendations to increase integration and gain from it.
Reis, Jose Guilherme and Thomas Farole. 2012. Trade Competitiveness Diagnostic Toolkit. Washington, DC: World Bank. Describes the Trade Competitiveness Diagnostic analytical framework as described in Box 1 and illustrated in Figure 4 on page 9.
Riaz, Khalid, and Hans G. P. Jansen. 2012. “Spatial Patterns of Revealed Comparative Advantage of Pakistan’s Agricultural Exports.” Pakistan Economic and Social Review 50 (2): 97–120. Presents revealed comparative advantage (RCA) indices for a wide range of Pakistan’s agricultural exports to regional and country markets. Identifies several product and region combinations where Pakistan has comparative advantage despite not enjoying such advantage at the world level, highlights opportunities in bilateral trade, especially in trade with neighbors, identifies top export markets for Pakistan’s main exports, and sheds light on the agricultural products from Pakistan that have the potential to penetrate markets in developed countries.
Sáez, Sebastián, Daria Taglioni, Erik van der Marel, Claire H. Hollweg, and Veronika Zavacka. 2014. Valuing Services in Trade: A Toolkit for Competitiveness Diagnostics. Washington, DC: World Bank. The source for the Service Trade Competitiveness Diagnostic (STCD) Toolkit.
Sáez, Sebastián. 2010. Trade in Services Negotiations: A Guide for Developing Countries. Washington, DC: World Bank. Provides a conceptual framework to help policymakers in the least-developed countries (LDCs) address trade policymaking and negotiation. Complements the conceptual framework with practical recommendations and tools to guide negotiations on policies that affect trade and investment in services. Provides practical examples and negotiation exercises that aim to enhance understanding of ways to use the conceptual framework and related tools.
Shah, Fatima. 2006. “Pakistan: Value Chain Analysis.” Foreign Investment Advisory Service Rep. No. 37528. Washington, DC: World Bank. Uses the value chain analysis methodology to quantify the full costs of four representative products (including a standard pair of denim jeans) in Pakistan’s economy to understand and help alleviate any critical policy bottlenecks to their competitiveness.
143
Modernizing Trade in Pakistan: A Policy Roadmap
143
AD
DIT
ION
AL
RES
OU
RCE
S
TOOLS – ADDITIONAL RESOURCES

Shaikh, Hina. 2015. “Moving Pakistan up the Value Chain: Opportunities in Textiles and Garments.” London: International Growth Centre (IGC). July 29, 2015. This blog post outlines challenges and promising policy ideas facing Pakistan’s textiles and apparel sector. Improving policy and industry incentives for the apparel sector has the potential to act as an engine of growth through both jobs and improved trade balances.
Soyres, Francois de, Alen Mulabdic, Siobhan Murray, Nadia Rocha, and Michele Ruta. 2018. “How Much Will the Belt and Road Initiative Reduce Trade Costs?” Policy Research Working Paper No. 8614. Washington, DC: World Bank. Finds that the transport infrastructure projects of the Belt and Road Initiative will reduce shipment times and trade costs and that policy reforms that reduce border delays and improve corridor management will magnify these effects.
Taglioni, Daria, and Deborah Winkler. 2016. Making Global Value Chains Work for Development. Washington, DC: World Bank. Offers a strategic framework, analytical tools, and policy options to address the challenges of improving living standards and social conditions while internationalizing production processes. The book conceptualizes GVCs and makes it easier for policymakers and practitioners to discuss them and their implications for development. It shows why GVCs require fresh thinking, it serves as a repository of analytical tools, and it proposes a strategic framework to guide policymakers in identifying the key objectives of GVC participation and selecting suitable economic strategies to achieve them.
Teignier, Marc, and David Cuberes. 2014. “Aggregate Costs of Gender Gaps in the Labor Market: A Quantitative Estimate.” UB Economics Working Paper 2014/308. Universitat de Barcelona, Facultat d’Economia i Empresa, UB Economics. Examines the quantitative effects of gender gaps in entrepreneurship and labor force participation on aggregate productivity and income per capita. Gender gaps in entrepreneurship and in female workers’ pay affect aggregate productivity negatively, while gender gaps in labor force participation reduce income per capita.
Van der Mensbrugghe, Dominique. 2011. “LINKAGE Technical Reference Document.” Washington, DC: World Bank. Provides the complete specification of the LINKAGE model.
Van der Mensbrugghe, Dominique. 2013. “Modeling the Global Economy: Forward-Looking Scenarios for Agriculture.” In Handbook of Computable General Equilibrium Modeling, edited by Peter B. Dixon and Dale W. Jorgenson, 1:933–94. Elsevier. Describes the history of global CGE models and the World Bank’s recent work undertaken work using the ENVISAGE model focusing on long-run dynamics, impacts on agriculture, and interactions with climate change.
Winkler, Deborah. 2010. “Services Offshoring and Its Impact on Productivity and Employment: Evidence from Germany, 1995–2006.” The World Economy 33 (12): 1672–1701.
144
Modernizing Trade in Pakistan: A Policy Roadmap
144A
DD
ITIO
NA
L R
ESO
UR
CES
TOOLS – ADDITIONAL RESOURCES

Wodon, Quentin T., and Bénédicte de la Brière. 2018. “Unrealized Potential.” Washington, DC: World Bank. Focuses on the losses in national wealth due to gender inequality in earnings. If gender equality in earnings were achieved, countries could increase their human capital wealth—and their total wealth.
World Bank Group. 2014. Cambodia Services Trade: Performance and Regulatory Framework Assessment. Phnom Penh: World Bank. Describes the experience of Cambodia in diversifying exports into services, finding that Cambodia’s impressive economic growth since 2004 owes much of its driving force to the boom in services trade. FDI, particularly in tourism, construction, infrastructure, agricultural processing, and telecommunications also supported the expansion of services trade, not only by attracting foreign capital and expanding employment into Cambodia, but also by improving domestic technology and enhancing domestic skills.
World Bank. 2010. Trade and Transport Facilitation Assessment: A Practical Toolkit for Country Implementation. Washington, DC: World Bank. Describes the Trade and Transport Facilitation Assessment (TTFA), a practical tool to identify constraints on trade supply chains. The toolkit helps design action plans to improve logistics performance among its three main dimensions: infrastructure, services, and procedures and processes.
World Bank. 2012. Developing a Trade Information Portal. Washington, DC: World Bank. Discusses the issues and challenges that developing nations are likely to face when implementing a trade information portal and provides a checklist of practical guidelines for the steps needed for effective implementation.
World Bank. 2012. Risk-Based Compliance Management: Making it Work in Border Management Agencies. Washington, DC: World Bank. Provides an introduction to the key issues associated with the practical implementation of a modern risk-based compliance management regime in border management agencies; a step-by-step method of establishing a compliance management approach in a border management agency; practical examples covering a range of border management activities to illustrate the methodology; and useful tips to help identify and rationalize or eliminate resource intensive, time consuming, and ineffective regulatory processes.
World Bank. 2013. Post Clearance Audit: Reference and Implementation Guide. Washington, DC: World Bank. Focuses on post-clearance audit (PCA), which is one of the most effective trade facilitation strategies available to border agencies because it enables the immediate release of imported cargo through the subsequent use of audit-based regulatory controls. Provides border management officials and development professionals with a thorough introduction to the key issues associated with implementing a PCA regime.
145
Modernizing Trade in Pakistan: A Policy Roadmap
145
AD
DIT
ION
AL
RES
OU
RCE
S
TOOLS – ADDITIONAL RESOURCES

World Bank Group. 2014. “A Guide to Investor Targeting in Agribusiness.” Washington, DC: World Bank. This toolkit serves as a guide to help project leaders work with client governments to attract concrete agribusiness investments that create jobs, reduce poverty, and develop value chains in an environmentally and socially sustainable way. The toolkit can also be used by anyone working to attract sustainable private investment for developing a country’s agribusiness sector.
World Bank. 2015. How to Sustain Export Dynamism by Reducing Duality in the Dominican Republic. Washington, DC: World Bank. Analyzes export competitiveness in the Dominican Republic using the Trade Competitiveness Diagnostic methodology (Farole and Reis, 2012). Dominican exports fare well in terms of performance, sophistication, and survival in special economic zones (SEZs). Three main challenges are identified: (1) quality issues and rejection of agro exports at the United States border, (2) the role of SEZs in the new decade and the lack of backward linkages, and (3) excessive market concentration not addressed by a fragmented institutional setup.
World Bank. 2018. Poverty and Shared Prosperity 2018: Piecing Together the Poverty Puzzle. World Bank, Washington, DC. The Poverty and Shared Prosperity series provides a global audience with the latest and most accurate estimates on trends in global poverty and shared prosperity. The 2018 edition—Piecing Together the Poverty Puzzle—broadens the ways we define and measure poverty. It introduces a multi-dimensional societal poverty measure anchored on household consumption and the international poverty line of USD 1.90 per person per day but broadens the measure by including information on access to education and basic infrastructure. Finally, it investigates differences in poverty within households, including by age and gender.
World Bank Group. 2018. “Revitalizing Pakistan’s Fisheries: Options for Sustainable Development.” Washington, DC: World Bank. Provides an overview of the state of fisheries in Pakistan, Pakistan’s related governance arrangements, the potential benefits that could be realized through revitalizing Pakistan’s fishery sector, and the challenges to realizing these benefits. Describes specific activities necessary to overcome the challenges, including policy recommendations.
Xiaoyang Chen, Maggie, and Chuanhao Lin. 2018. “Foreign Investment across the Belt and Road: Patterns, Determinants, and Effects.” Policy Research Working Paper No. 8607. Washington, DC: The World Bank. Examines the patterns and economic effects of FDI across the Belt and Road Initiative (BRI) countries. The analysis shows that, by reducing overall travel times and transportation costs, the proposed BRI transportation network can pave the way for additional FDI. The increase in FDI can exert positive effects on GDP, trade, and employment, especially for lower-income countries.
146
Modernizing Trade in Pakistan: A Policy Roadmap
146A
DD
ITIO
NA
L R
ESO
UR
CES
TOOLS – ADDITIONAL RESOURCES
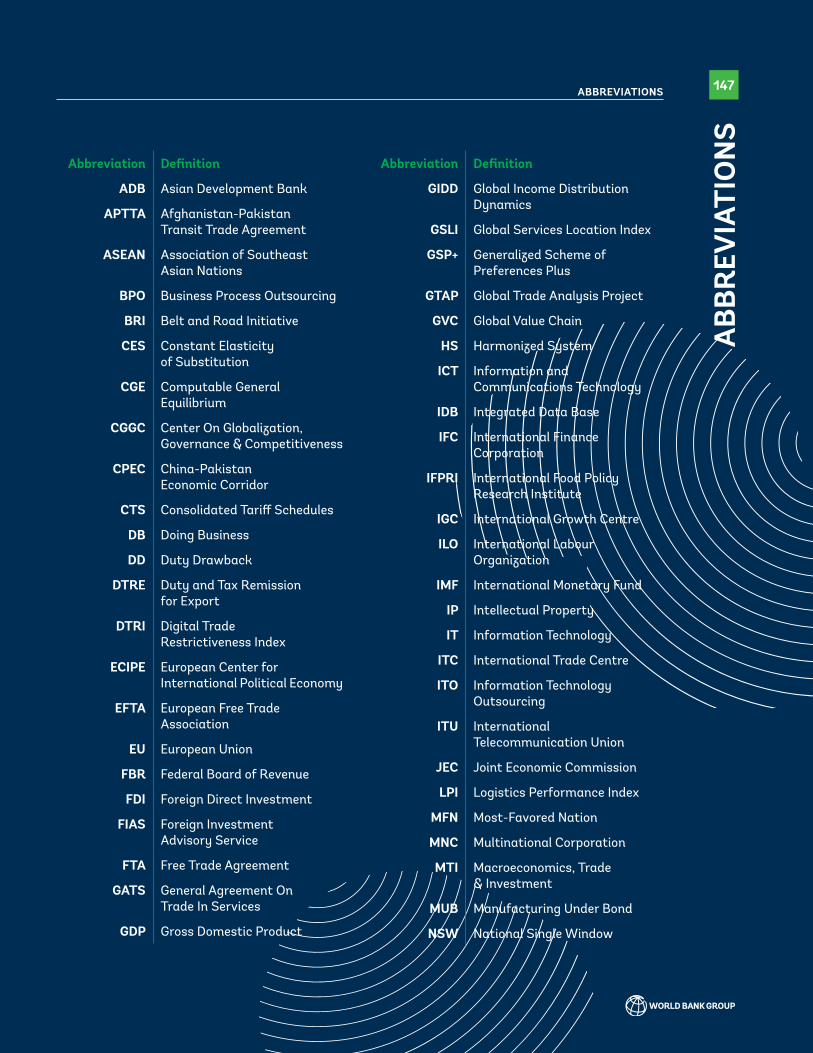
Abbreviation Definition
ADB Asian Development Bank
APTTA Afghanistan-Pakistan Transit Trade Agreement
ASEAN Association of Southeast Asian Nations
BPO Business Process Outsourcing
BRI Belt and Road Initiative
CES Constant Elasticity of Substitution
CGE Computable General Equilibrium
CGGC Center On Globalization, Governance & Competitiveness
CPEC China-Pakistan Economic Corridor
CTS Consolidated Tariff Schedules
DB Doing Business
DD Duty Drawback
DTRE Duty and Tax Remission for Export
DTRI Digital Trade Restrictiveness Index
ECIPE European Center for International Political Economy
EFTA European Free Trade Association
EU European Union
FBR Federal Board of Revenue
FDI Foreign Direct Investment
FIAS Foreign Investment Advisory Service
FTA Free Trade Agreement
GATS General Agreement On Trade In Services
GDP Gross Domestic Product
Abbreviation Definition
GIDD Global Income Distribution Dynamics
GSLI Global Services Location Index
GSP+ Generalized Scheme of Preferences Plus
GTAP Global Trade Analysis Project
GVC Global Value Chain
HS Harmonized System
ICT Information and Communications Technology
IDB Integrated Data Base
IFC International Finance Corporation
IFPRI International Food Policy Research Institute
IGC International Growth Centre
ILO International Labour Organization
IMF International Monetary Fund
IP Intellectual Property
IT Information Technology
ITC International Trade Centre
ITO Information Technology Outsourcing
ITU International Telecommunication Union
JEC Joint Economic Commission
LPI Logistics Performance Index
MFN Most-Favored Nation
MNC Multinational Corporation
MTI Macroeconomics, Trade & Investment
MUB Manufacturing Under Bond
NSW National Single Window
147ABBREVIATIONS
ABB
REV
IATI
ON
S
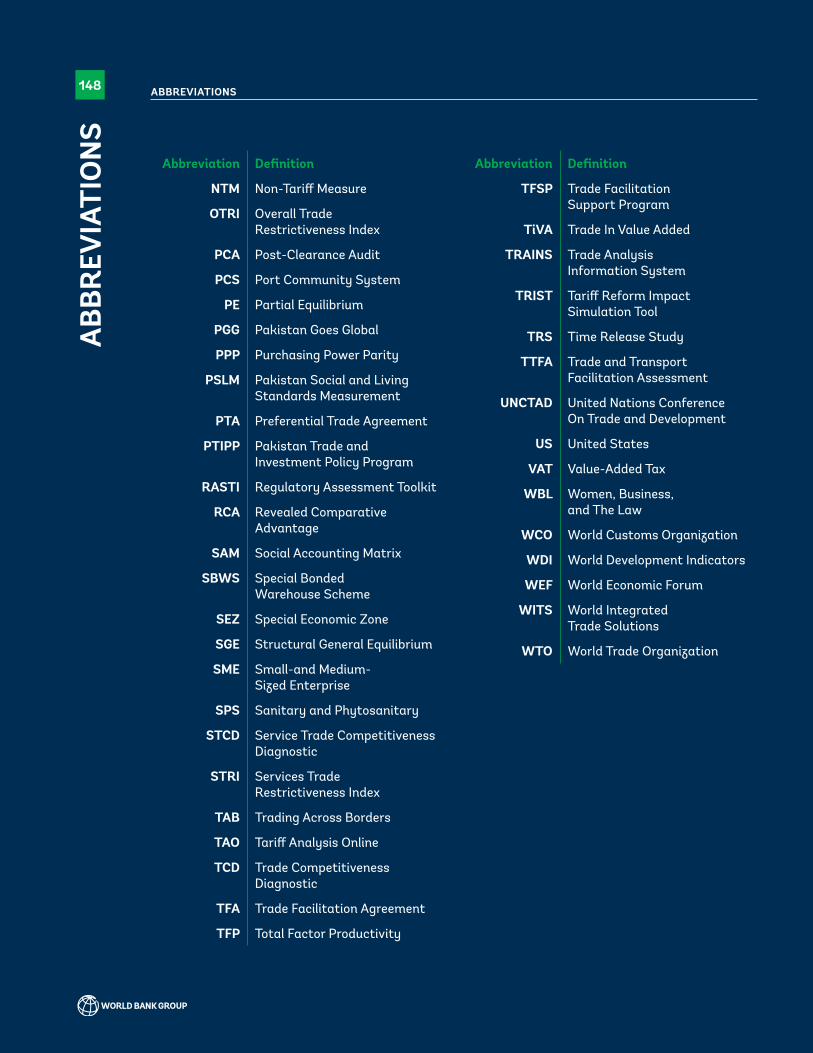
Abbreviation Definition
NTM Non-Tariff Measure
OTRI Overall Trade Restrictiveness Index
PCA Post-Clearance Audit
PCS Port Community System
PE Partial Equilibrium
PGG Pakistan Goes Global
PPP Purchasing Power Parity
PSLM Pakistan Social and Living Standards Measurement
PTA Preferential Trade Agreement
PTIPP Pakistan Trade and Investment Policy Program
RASTI Regulatory Assessment Toolkit
RCA Revealed Comparative Advantage
SAM Social Accounting Matrix
SBWS Special Bonded Warehouse Scheme
SEZ Special Economic Zone
SGE Structural General Equilibrium
SME Small-and Medium-Sized Enterprise
SPS Sanitary and Phytosanitary
STCD Service Trade Competitiveness Diagnostic
STRI Services Trade Restrictiveness Index
TAB Trading Across Borders
TAO Tariff Analysis Online
TCD Trade Competitiveness Diagnostic
TFA Trade Facilitation Agreement
TFP Total Factor Productivity
Abbreviation Definition
TFSP Trade Facilitation Support Program
TiVA Trade In Value Added
TRAINS Trade Analysis Information System
TRIST Tariff Reform Impact Simulation Tool
TRS Time Release Study
TTFA Trade and Transport Facilitation Assessment
UNCTAD United Nations Conference On Trade and Development
US United States
VAT Value-Added Tax
WBL Women, Business, and The Law
WCO World Customs Organization
WDI World Development Indicators
WEF World Economic Forum
WITS World Integrated Trade Solutions
WTO World Trade Organization
148 ABBREVIATIONSA
BBR
EVIA
TIO
NS


World Bank Office
www.worldbank.org/en/country/pakistanJanuary 2020Editor: Aarre LaaksoDesign: SlideBrand (www.slidebrand.com)Image credits: Getty Images, World Bank Group ArchivesIcons: NounProject
Getty Images