DATA ROADMAP - City of Philadelphia
62
PHILADELPHIA'S TRANSPORTATION DATA ROADMAP
-
Upload
khangminh22 -
Category
Documents
-
view
1 -
download
0
Transcript of DATA ROADMAP - City of Philadelphia
PHILADELPHIA'S TRANSPORTATION DATA ROADMAP

2

3
Information contained in this document is for planning purposes and should not be used for the final design of any project. All results, recommendations, concept drawings, cost opinions, and commentary contained herein are based on limited data and information and on existing conditions that are subject to change. Further analysis and engineering design are necessary before implementing any of the recommendations contained herein.
4
CONTENTS
EXECUTIVE SUMMARY .......................................................................................... 6
Overview ....................................................................................................................................6
Key Findings .............................................................................................................................6
Pilot Projects ............................................................................................................................7
INTRODUCTION..................................................................................................... 8
Partnership ...............................................................................................................................8
Frequently Used Terms ........................................................................................................8
Data as Transportation Infrastructure ............................................................................9
User Experience ................................................................................................................... 10
Other Ongoing Efforts ...................................................................................................... 11
Process & Product .............................................................................................................. 11
DATA INVENTORY ............................................................................................... 14
Overview ................................................................................................................................. 14
Survey ...................................................................................................................................... 14
Assessment ............................................................................................................................ 16
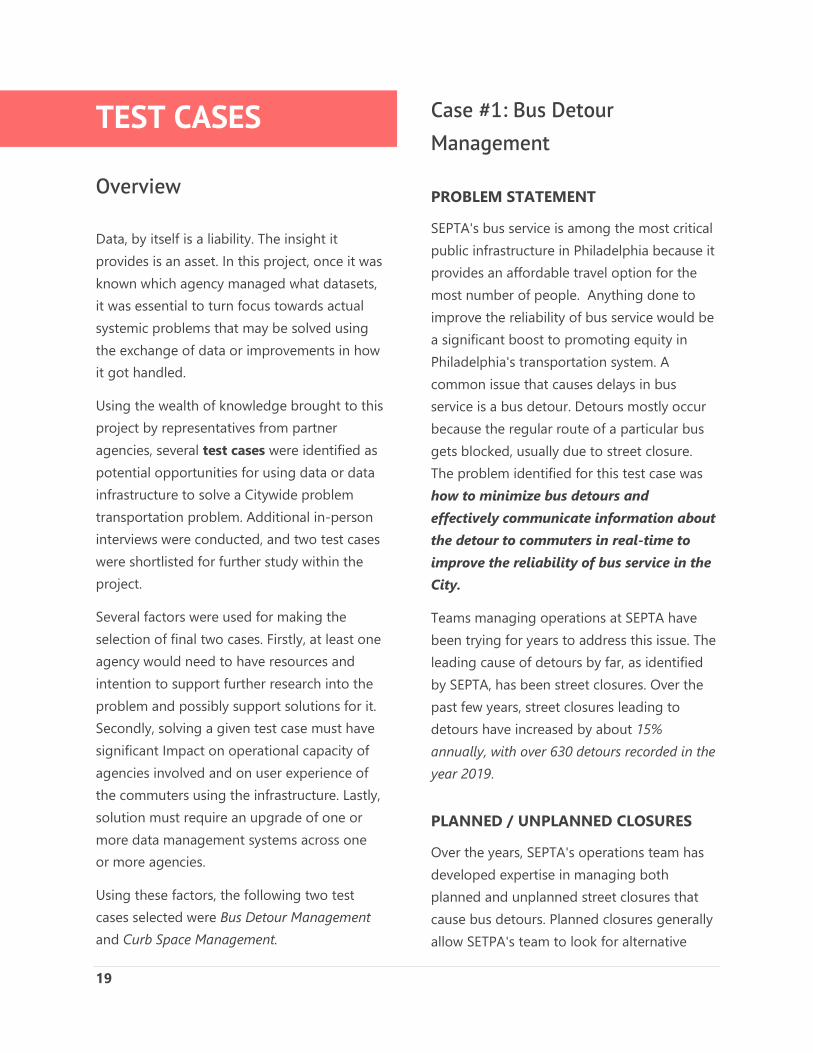
TEST CASES .......................................................................................................... 19
Overview ................................................................................................................................. 19
Case #1: Bus Detour Management .............................................................................. 19
Case #2: Curb space Management .............................................................................. 21
PROPOSED PILOT PROJECTS .............................................................................. 22
#1: Bus Detour Management ......................................................................................... 22
#2: Curb Space Management ........................................................................................ 28
NEXT STEPS .......................................................................................................... 32
APPENDICES ........................................................................................................ 33
Appendix A ............................................................................................................................ 33
Appendix B ............................................................................................................................ 46
Appendix C ............................................................................................................................ 51
5
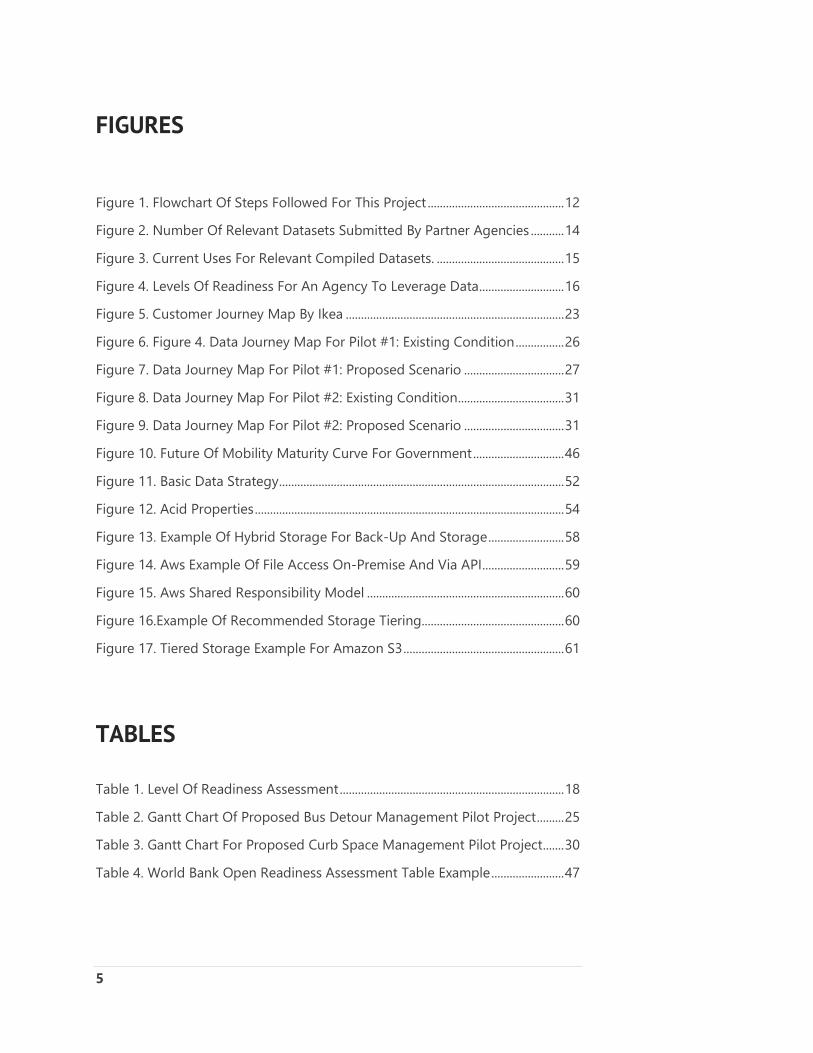
FIGURES
Figure 1. Flowchart Of Steps Followed For This Project ............................................. 12
Figure 2. Number Of Relevant Datasets Submitted By Partner Agencies ........... 14
Figure 3. Current Uses For Relevant Compiled Datasets. .......................................... 15
Figure 4. Levels Of Readiness For An Agency To Leverage Data ............................ 16
Figure 5. Customer Journey Map By Ikea ........................................................................ 23
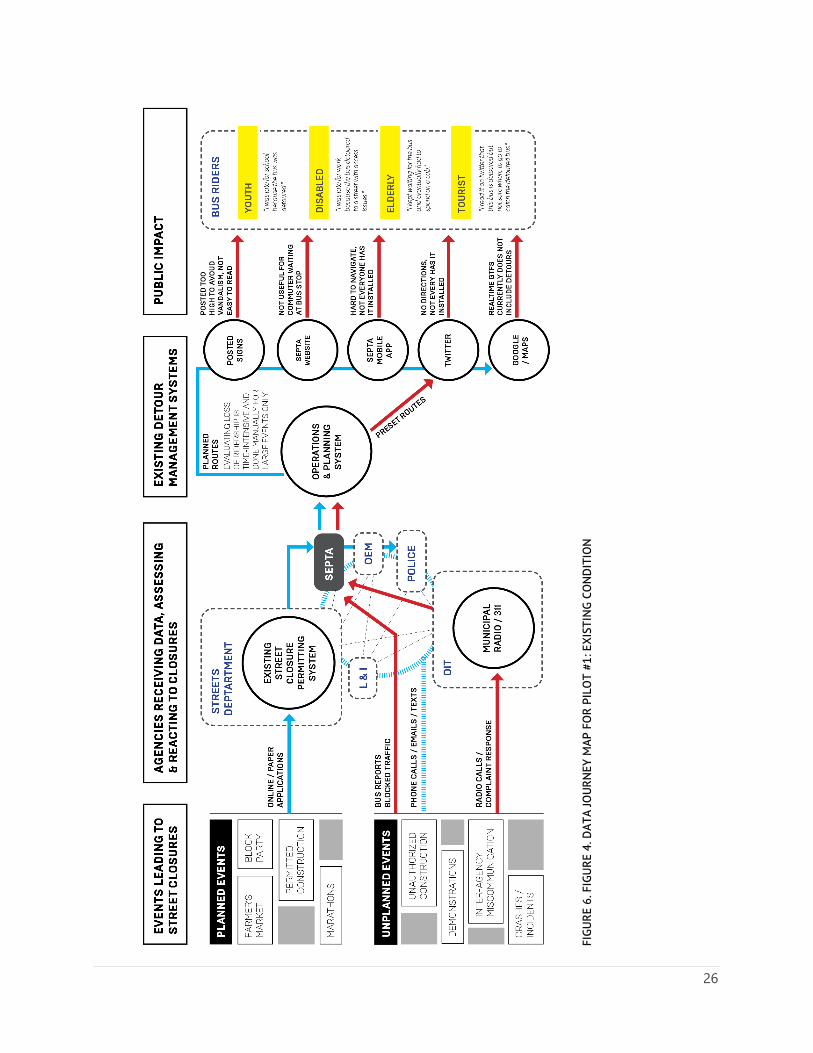
Figure 6. Figure 4. Data Journey Map For Pilot #1: Existing Condition ................ 26
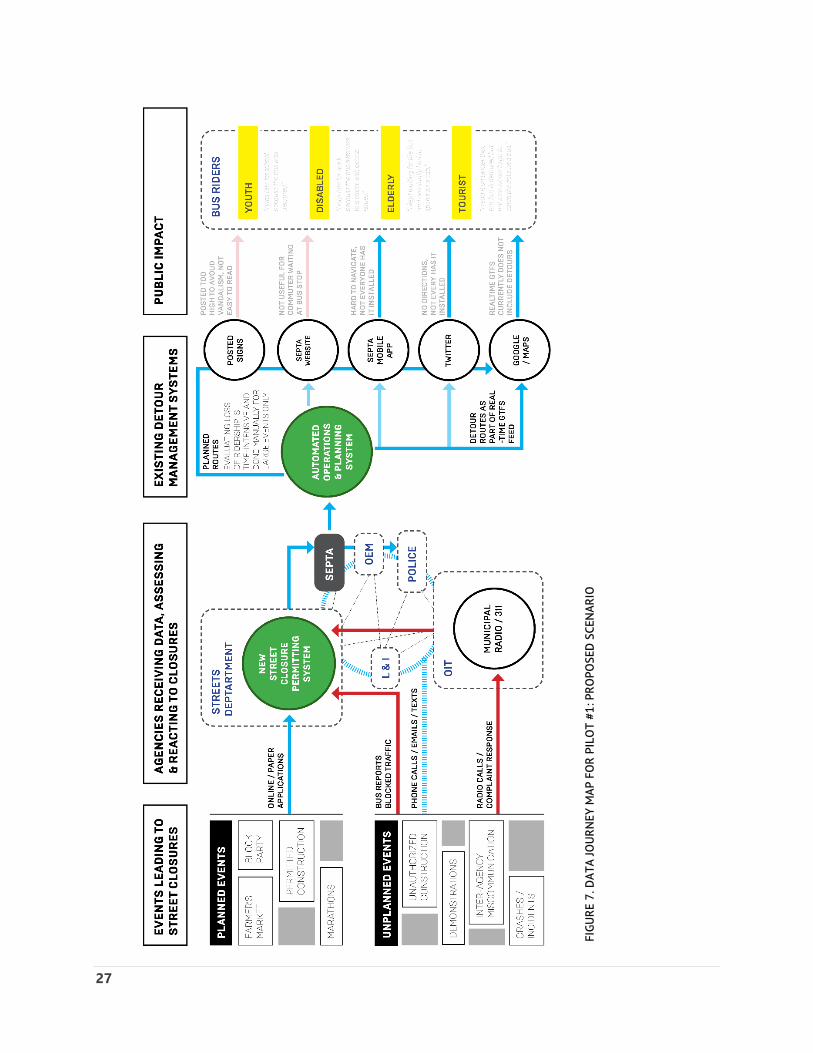
Figure 7. Data Journey Map For Pilot #1: Proposed Scenario ................................. 27
Figure 8. Data Journey Map For Pilot #2: Existing Condition ................................... 31
Figure 9. Data Journey Map For Pilot #2: Proposed Scenario ................................. 31
Figure 10. Future Of Mobility Maturity Curve For Government .............................. 46
Figure 11. Basic Data Strategy .............................................................................................. 52
Figure 12. Acid Properties ...................................................................................................... 54
Figure 13. Example Of Hybrid Storage For Back-Up And Storage ......................... 58
Figure 14. Aws Example Of File Access On-Premise And Via API ........................... 59
Figure 15. Aws Shared Responsibility Model ................................................................. 60
Figure 16.Example Of Recommended Storage Tiering............................................... 60
Figure 17. Tiered Storage Example For Amazon S3 ..................................................... 61
TABLES
Table 1. Level Of Readiness Assessment .......................................................................... 18
Table 2. Gantt Chart Of Proposed Bus Detour Management Pilot Project ......... 25
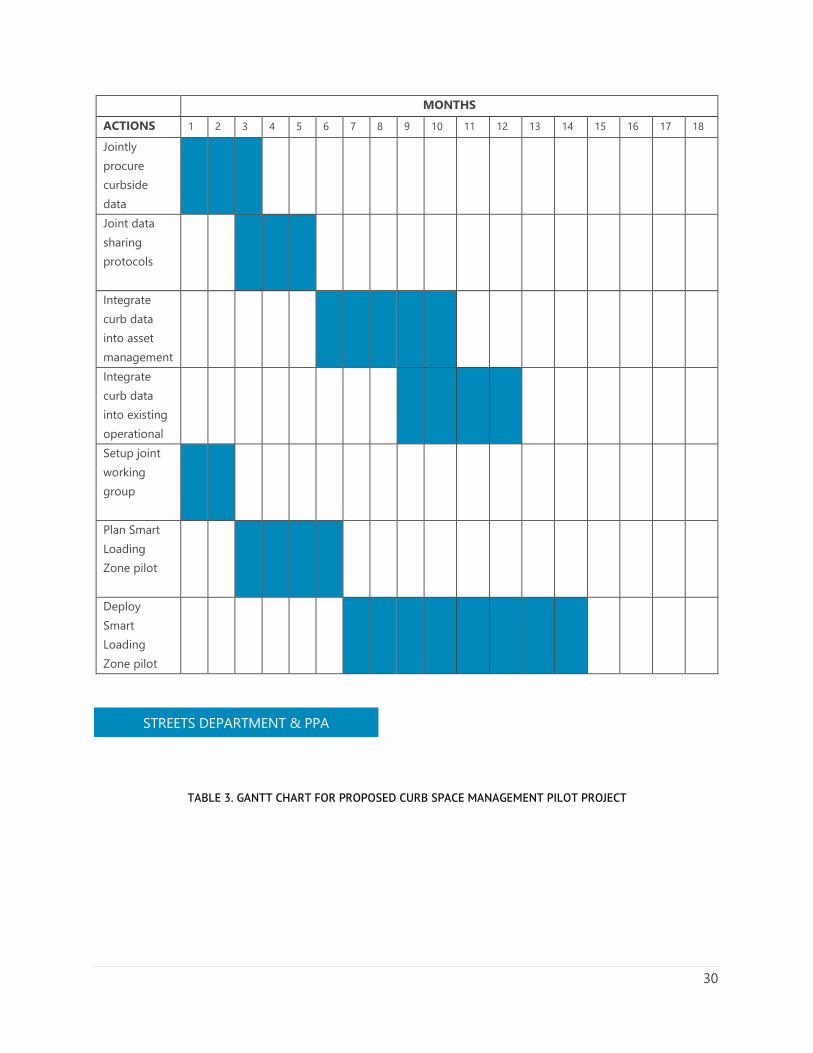
Table 3. Gantt Chart For Proposed Curb Space Management Pilot Project ....... 30
Table 4. World Bank Open Readiness Assessment Table Example ........................ 47
6
EXECUTIVE SUMMARY
Overview
A revolution in mobility around the world has brought new travel options for people to move around cities. One key to the high adoption of new options has been the effective use of data. This has supported near real-time matching between customers and suppliers of mobility and travel information, as it establishes a potentially continuous feedback loop between user desires and changes in service for both private and public providers of transportation services. This revolution prompted cities all over the world to rethink their policies around the use of data, not only to make existing travel options more resilient but also to support better use of public infrastructure for all transportation needs. But leveraging this potential fully means satisfying important prerequisites.
This project takes a first pass at assessing, aligning, and developing the capability of the City and its partners to collect and use data in support of multimodal transportation. The roadmap clarifies the type and level of effort required by all partners to support the goals and objectives of Connect: Philadelphia's
Strategic Transportation Plan and the elements described under the goal 'a Competitive City.'
This project is the first step towards three overarching goals:
1. Encourage and improve processes for data-driven decisions.
2. Expand interagency coordination by sharing data infrastructures across agencies.
3. Prepare a foundation for tools to improve user experience.
Key Findings
• Partner agencies manage a wide variety of datasets related to transportation infrastructure in Philadelphia. The project team compiled metadata for 85 datasets that were relevant to operations and planning efforts in the City.
• Several partner agencies are unable to draw insights from historical data for
What is Transportation Data Infrastructure?
It is the hardware, datasets, applications and especially the intuitions required to analyze the City’s diverse transportation system as a coherent network and chart out steps to transform it by improving information flows across agencies and systems involved in managing it.
7
operational purposes, especially for real-time uses.
• Many partner agencies are unable to initiate planning efforts to upgrade their data infrastructure due to resource constraints.
• A high degree of variation in data infrastructure management across partner agencies hinders the planning and implementation of standard data sharing protocols.
• Since many partner agencies do not fall within a common administrative umbrella, there is a need for structured formal agreements among partner agencies to encourage data sharing more frequently.
• Currently, there are only a limited number of established protocols for managing the flow of critical information from one agency to another. These cater mostly to specific predefined purposes.
• Often an unstructured exchange of information is used for addressing planning and incident response efforts.
• There is no standard data sharing or meta-data management system across all partner agencies. Only those agencies that fall under the City of Philadelphia administration share a common data infrastructure that is managed by OIT. Currently, other agencies cannot access this infrastructure due to security reasons.
• The project team mapped the flow of information and identified several
opportunities for improving service delivery that not only has the potential to support existing transportation infrastructure but also allow efficient regulation of new travel options reaching Philadelphia’s right-of-way.
Pilot Projects
An important goal of the project was to identify tangible actions to maintain momentum towards a more robust use of data.
Several discussions and interviews with partner agencies and research by the project team helped identify two pilot projects that could improve the City’s transportation infrastructure in a significant way while also highlighting the benefit of sustained focus on upgrading data infrastructure. The two pilot projects proposed here are as follows:
1. BUS DETOUR MANAGEMENT The proposal identifies gaps in the current flow of information across the Streets Department, SEPTA, and several other agencies. It proposes changes in City’s Street Closure Permitting System to ensure better bus service for commuters in the City.
2. CURB-SPACE MANAGEMENT This proposal aims to make curbside data digitally available on smartphones and test smart loading zones in the City to capitalize on high growth in demand for curb space by delivery and rider-share companies.
8
INTRODUCTION
Partnership
This project is a collaborative effort, bringing together resources from several agencies operating or managing or supporting Philadelphia's transportation infrastructure in different ways. Organizationally, not all these agencies fall within the same administrative umbrella, hence explaining the significance and complexity of such a collaboration. The list of participating agencies is as follows:
1. Center City District (CCD) 2. Delaware Valley Regional Planning
Commission (DVRPC) 3. Office of Emergency Management
(OEM) 4. Office of Innovation & Technology (OIT) 5. Office of Transportation & Infrastructure
Systems (OTIS) 6. Philadelphia City Planning Commission
(PCPC) 7. Philadelphia Parking Authority (PPA) 8. Philadelphia Police Department (PPD) 9. Philadelphia Streets Department (Streets
Department) 10. Philly311 11. Southeastern Pennsylvania
Transportation Authority (SEPTA) 12. University City District (UCD)
Frequently Used Terms
Several frequently used terms in merit description in the context of data management. These descriptions provide a baseline understanding and contextual reference to some of the capabilities discussed later in the document.
• API (Application Programming Interface) – This is a way of communication defined for interacting with a given computer system. In more straightforward language, this can be considered a hyperlink (similar to a web address, such as www.google.com) that is used to send and/or receive information from a computer or system located remotely, over the internet.
• AUTHENTICATION – This technology allows validation of a system's identity over the internet. Since a computer is linked to a given user, this technology ensures that only an authorized user can access services or data made available through an API. The computer may be a phone, a laptop, or a car.
• CLOUD / DISTRIBUTED / PARALLEL COMPUTING – A group of several computers being used together and connected over a network to store or process information. This capability allows large volumes of data to be collected, stored, and analyzed at very high speeds.
• DATASET – a collection of data or information.
• DE-IDENTIFICATION / ANNONYMIZATION – processes to change the data to ensure a person cannot be identified through the manipulation of the data.
9
• DIGITAL TWIN – It is a near-real-time virtual map of the physical system that allows real-time monitoring and response to the changes in a complex system.
• LOCATION OR SPATIAL DATA – data or information showing GPS based location of a device or an event associated with that device.
• OPEN DATA – Data that is freely available and accessible to anyone without restrictions of copyright or other mechanisms of control.
• PII (Personally Identifiable Information) – This is information that allows personal identification of an individual or agency. Traditionally, data such as SSN and other vital details fall under PII and are protected by State laws. Today, smartphones collect locational data that has been proven to identify individuals personally but is yet to receive protection through State or Federal legislation.1
• PREDICTIVE ANALYSIS – Using a large amount of data about an event to predict future occurrences. Techniques such as "machine learning" are tools used to perform such an analysis.
• REAL-TIME (or NEAR REAL-TIME) SYSTEM – System that processes and shares information within seconds, allowing virtually immediate access to and collection of information through user interaction. For instance, online airline bookings or credit card payments.
• TRAFFIC OPERATIONS CENTER (TOC) – A place where traffic information can be collected from and distributed to multiple resources for effective traffic management,
1https://www.nytimes.com/2018/06/22/us/politics/supreme-court-warrants-cell-phone-privacy.html
usually using advanced data sharing techniques.
Data as Transportation Infrastructure
Transportation infrastructure is no longer restricted to physical facilities but extends to our smartphones and cards as well. Relationship between the physical space, where people move, and the information space, where data moves, complicates, and enriches how we look at our travel options. Consider driving your car, driving someone else's car, be driven by someone else in their car, or take a taxi, are all four different travel options. Each option registers as merely a 'car on the road' in a strictly physical sense. But, because of varying ownership arrangements, and more importantly, underlying data infrastructures, new problems, and possibilities arise in terms of regulating, managing, and linking these types of car-based travel options to with other traditional travel options in the City.
The data infrastructure, for the context of this study, encompasses technologies allowing underlying information from one type of travel option to be made available to people or agencies who may want to use that information to make a travel or operations/policy decision. Establishing such interdependence between decision making
10
processes and data flows demands three capabilities from each agency to be developed internally.
1. First, the data needs to be stored. This storage must allow an agency to edit/manage the information while allowing others within and outside the agency to read or copy it for their purposes through role-based access.
2. Second, once an agency gets access to data located in storage, the right software/data tools must be used to perform analysis to support efficient decision making.
3. Lastly, the analysis needs to be presented or visualized in a way that agency leadership, as well as other stakeholders, can comprehend the proposal and its data-driven reasoning without having to deal with the complexity of how information was stored and processes to make the presentation.
User Experience
A central goal for this project is to shift the conventional emphasis from a system-wide focus towards support for a variety range of traveler's perspectives. This is because when someone wants to travel to, or get around Central Philadelphia, ideally, the journey can be planned considering the full range options available at that time and place. People want to get from point A to B, and the traveler's perspective recognizes that the job of the 'transportation system' is to coordinate the
movement of buses, trains, pedestrians, bikes, and cars and the availability of streets, sidewalks, trails and other facilities to help people move around.
The fact is vehicles and facilities don't experience congestion or other transportation issues; people do. All else equal, anything that supports more and better-informed choices have significant potential to increase people's satisfaction with the transportation system. A key focus of transportation management needs to be providing timely and reliable information about travel options. For example, if there is some deviation from expected availability or schedule, the user is given real-time information to reevaluate choices and make the best decision. The better the standard of information is for end-users, the more useful it is to peer agencies as well, thus yielding improvement for system management.
The low hanging fruit in Philadelphia transportation rests in finding better ways to leverage data to enhance coordination across modes and to make people's interaction with the different elements in our system more robust and seamless. This approach should make the traveler's perspective and the system manager's perspective mutually supportive, and it justifies efforts to 'up' our collective game on the collection, management, and effective use of data.
11
Other Ongoing Efforts
This project complements several other ongoing local, national, and international efforts that aim to transform public services, in some cases, transportation services, using innovative use of data.
Philadelphia’s Office of Innovation and Technology (OIT) released the SmartCityPHL Roadmap in early 2019 that describes three key strategies to thoughtfully develop and deploy smart city technology solutions in a way that will best support Philadelphia’s diverse communities.2 Pitch & Pilot, a SmartCityPHL initiative, solicits ideas to improve government services through technological innovation. From a transportation perspective, a data-driven solution for a “Pavement Repair Prioritization Tool” is being procured through this initiative. Another parallel initiative led by Streets Department, called StreetSmartPHL, connects residents and stakeholders to real-time information related to street closure permits, street paving, snow plowing, and daily trash and recycling collections.
SEPTA initiated a multi-year comprehensive bus network redesign that requires upgrading several internal data reporting systems. Automated passenger counters capable of providing real-time crowding information have been installed on some vehicles. SEPTA has accelerated the timeline to bring this
2 https://www.phila.gov/documents/smartcityphl-roadmap/ 3 https://www.openmobilityfoundation.org/ 4 Tools for Systems Thinkers: The 6 Fundamental Concepts of Systems Thinking:
technology to all surface vehicles soon. SEPTA has also procured software technologies to improve the accuracy of real-time information, including more accurate stop arrival predictions. These technologies have brought significant improvements to how SEPTA manages surface operations.
Lastly, the City of Philadelphia is a founding board member of an open foundation called the Open Mobility Foundation3 (OMF). This agency boasts a diverse membership ranging from several large US cities to big and small private companies providing mobility services across the US. Governed by cities, the Open Mobility Foundation develops and promotes technology used in commercial products that either use the right-of-way or that help government entity manage the public right-of-way.
Process & Product
To analyze the complexity of how information is generated and exchanged across various stakeholders of the transportation infrastructure, a systems-thinking4 approach was used to parse out broader issues and then target smaller but more impactful upgrades in data infrastructure. The process began with a data inventory survey that asks six questions to help gauge who has what data and how they are managing it. The results of the survey revealed detailed metadata about 572
Leyla Acaroglu (https://medium.com/disruptive-design/tools-for-systems-thinkers-the-6-fundamental-concepts-of-systems-thinking-379cdac3dc6a)
12
datasets, of which 85 relevant datasets being managed by eight agencies were analyzed in detail. For a detailed list of questions and responses, please refer to Appendix A.
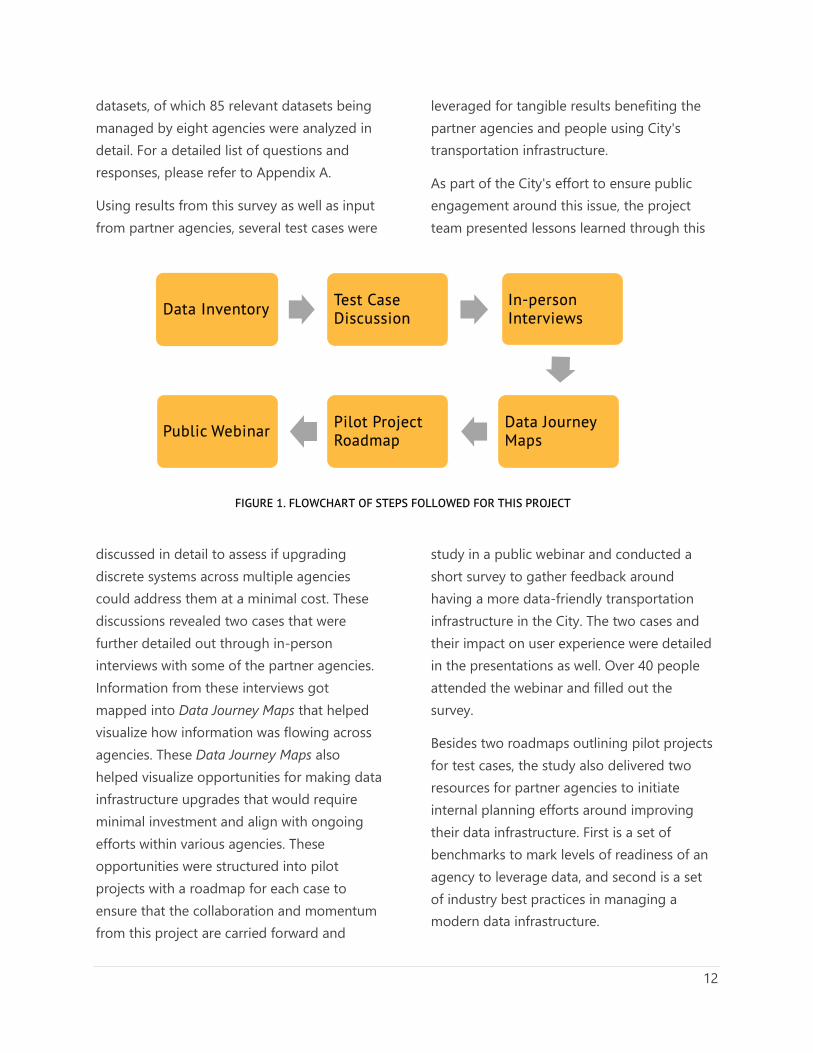
Using results from this survey as well as input from partner agencies, several test cases were
discussed in detail to assess if upgrading discrete systems across multiple agencies could address them at a minimal cost. These discussions revealed two cases that were further detailed out through in-person interviews with some of the partner agencies. Information from these interviews got mapped into Data Journey Maps that helped visualize how information was flowing across agencies. These Data Journey Maps also helped visualize opportunities for making data infrastructure upgrades that would require minimal investment and align with ongoing efforts within various agencies. These opportunities were structured into pilot projects with a roadmap for each case to ensure that the collaboration and momentum from this project are carried forward and
leveraged for tangible results benefiting the partner agencies and people using City's transportation infrastructure.
As part of the City's effort to ensure public engagement around this issue, the project team presented lessons learned through this
study in a public webinar and conducted a short survey to gather feedback around having a more data-friendly transportation infrastructure in the City. The two cases and their impact on user experience were detailed in the presentations as well. Over 40 people attended the webinar and filled out the survey.
Besides two roadmaps outlining pilot projects for test cases, the study also delivered two resources for partner agencies to initiate internal planning efforts around improving their data infrastructure. First is a set of benchmarks to mark levels of readiness of an agency to leverage data, and second is a set of industry best practices in managing a modern data infrastructure.
Data Inventory Test Case Discussion
In-person Interviews
Data Journey Maps
Pilot Project RoadmapPublic Webinar
FIGURE 1. FLOWCHART OF STEPS FOLLOWED FOR THIS PROJECT
13
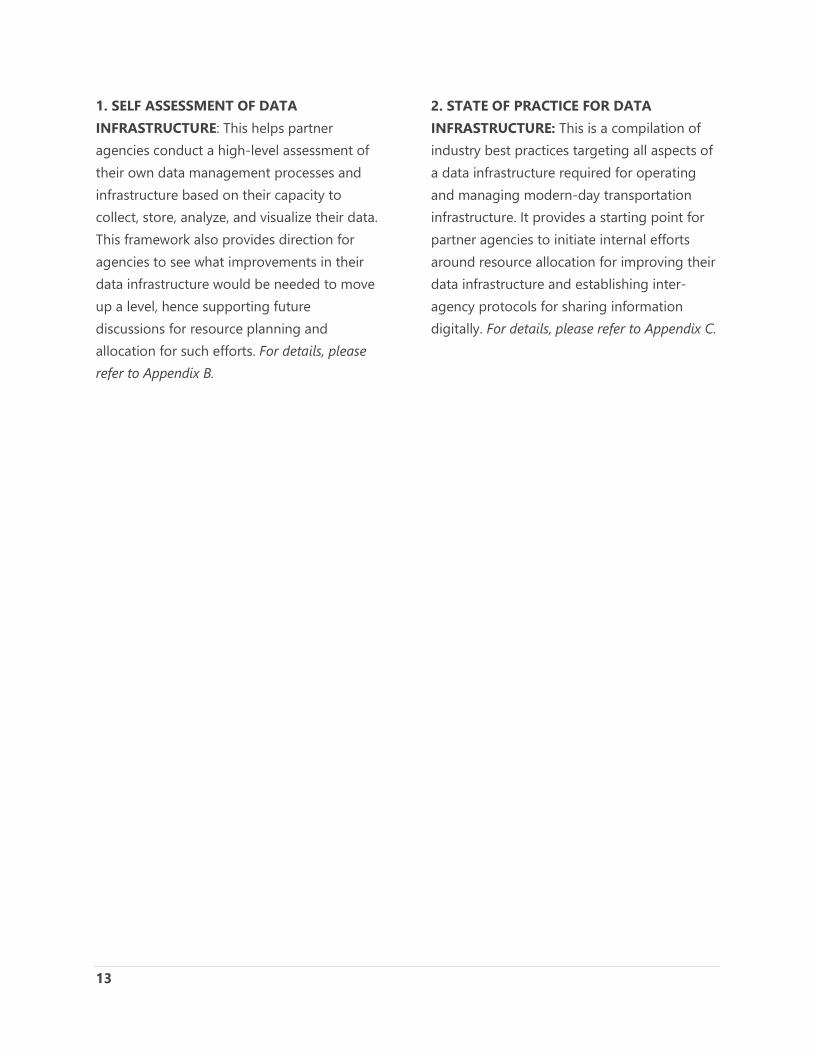
1. SELF ASSESSMENT OF DATA INFRASTRUCTURE: This helps partner agencies conduct a high-level assessment of their own data management processes and infrastructure based on their capacity to collect, store, analyze, and visualize their data. This framework also provides direction for agencies to see what improvements in their data infrastructure would be needed to move up a level, hence supporting future discussions for resource planning and allocation for such efforts. For details, please refer to Appendix B.
2. STATE OF PRACTICE FOR DATA INFRASTRUCTURE: This is a compilation of industry best practices targeting all aspects of a data infrastructure required for operating and managing modern-day transportation infrastructure. It provides a starting point for partner agencies to initiate internal efforts around resource allocation for improving their data infrastructure and establishing inter-agency protocols for sharing information digitally. For details, please refer to Appendix C.
14
DATA INVENTORY
Overview
As a first step, to gauge the scale and complexity of data management practices across all partner agencies, a survey was conducted to ask each agency what datasets they own and how they manage and use it. This survey formed the foundation for the rest of the work in this project as it informed what type of test cases may addressed using available data and what systems across agencies would benefit from having some form of automated digital communication.
Each partner agency designated a member of their executive leadership to participate in this survey and discussions through committee meetings. This helped establish a single point of communication with each partner agency, allowing for efficient communication and coordination for all tasks within this project. It also helped set up a small but effective coalition for similar efforts in the future.
Survey
The online survey asked the following six questions for each dataset managed by any agency:
1. Please describe a dataset that your organization relies upon for real-time, operational, and/or planning tasks.
5 Metadata is simply data about data. It is a description and context of the dataset. It helps to organize, find and
Name of the dataset. 2. Describe what this dataset is used for? Is it
used for planning, operations, or real-time management?
3. Describe the format of the dataset. Is it stored digitally? If yes, what format: Excel spreadsheet, shapefiles, etc.
4. Describe any software or web-based services that your organization uses for analyzing this dataset (such as ArcGIS, Excel, Vissum, Synchro).
5. Where is the dataset stored? 6. How is the meta-data5 for this dataset
managed?
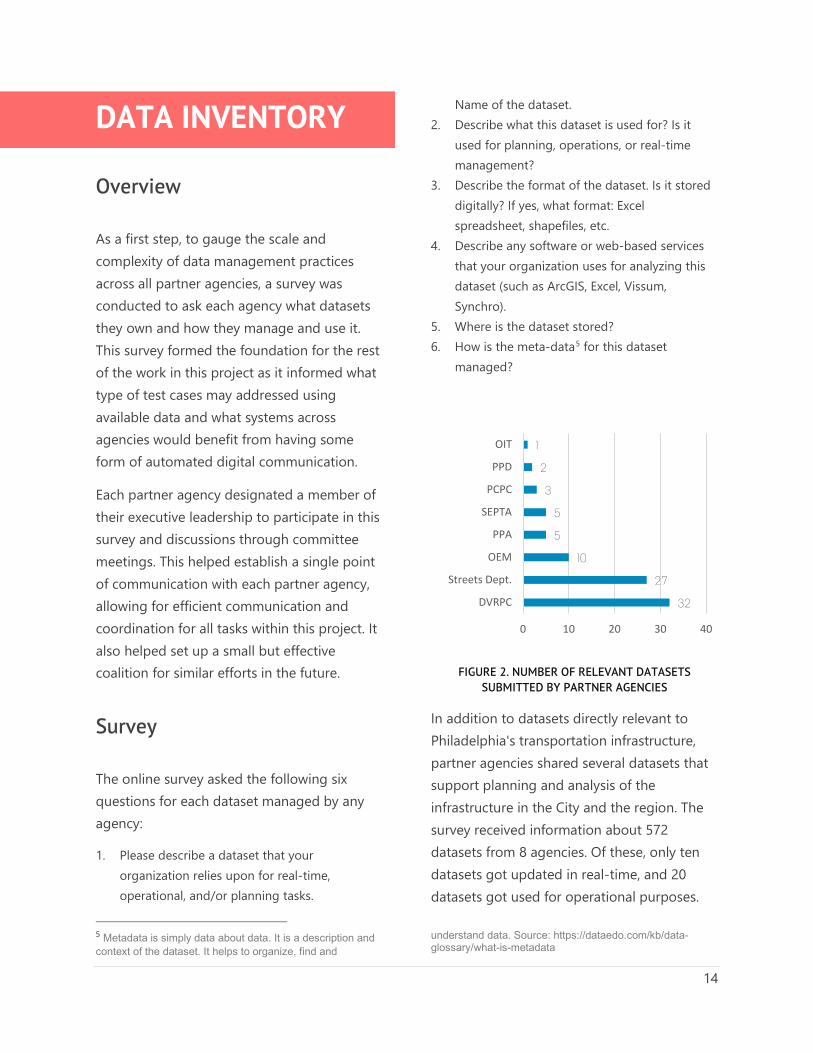
FIGURE 2. NUMBER OF RELEVANT DATASETS SUBMITTED BY PARTNER AGENCIES
In addition to datasets directly relevant to Philadelphia's transportation infrastructure, partner agencies shared several datasets that support planning and analysis of the infrastructure in the City and the region. The survey received information about 572 datasets from 8 agencies. Of these, only ten datasets got updated in real-time, and 20 datasets got used for operational purposes.
understand data. Source: https://dataedo.com/kb/data-glossary/what-is-metadata
32
27
10
5
5
3
2
1
0 10 20 30 40
DVRPC
Streets Dept.
OEM
PPA
SEPTA
PCPC
PPD
OIT
15
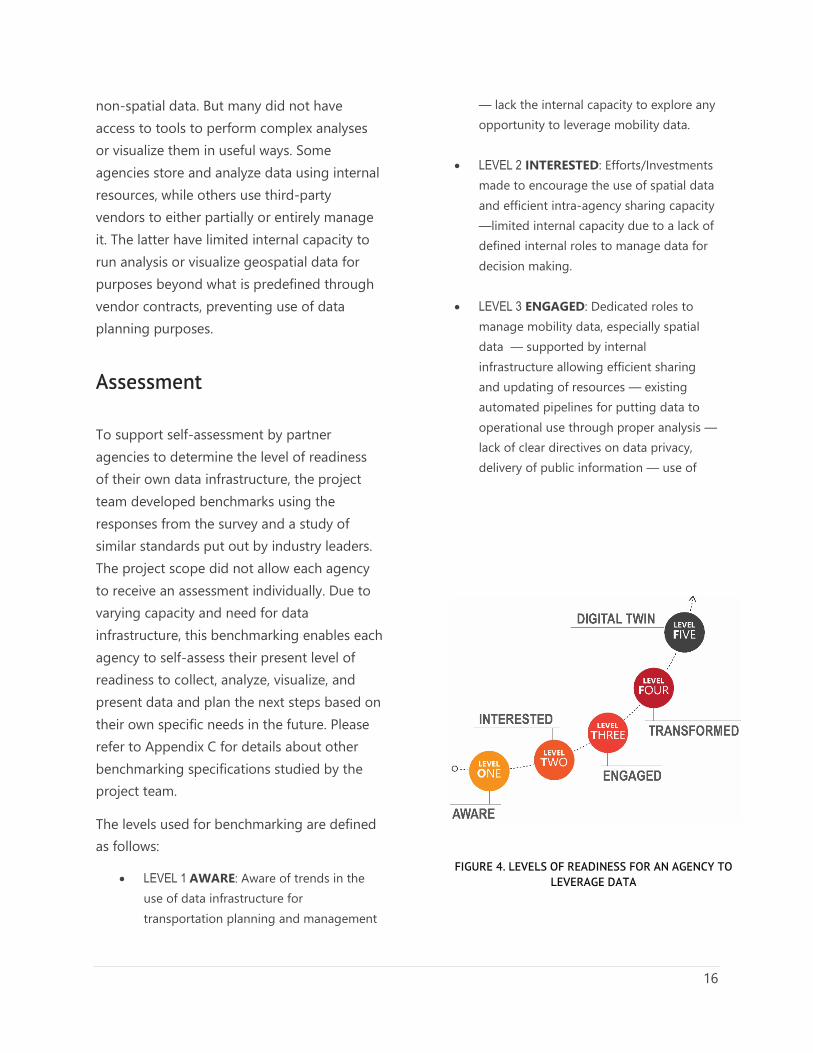
Hence, a majority got used only for planning purposes. Each dataset was tagged based on the type of information it provided and rated for its relevance to this project. Out of the total 572 datasets submitted, only 85 datasets were deemed relevant and rated as potentially useful. For a complete list of datasets, please refer to Appendix C.
FIGURE 3. CURRENT USES FOR RELEVANT COMPILED DATASETS.
Further analysis revealed significant variation in data management capabilities across agencies. Mostly those agencies had well-managed data protocols that came under the City of Philadelphia's administration and used a central data warehousing system called Data Bridge. This system, managed by the Office of Innovation and Technology (OIT), has established and well-enforced protocols in place, hence allowing agencies using it to keep their data streamlined and structured for sharing seamlessly with other departments as well as on open data platforms. But, due to safety concerns, this system is not accessible to any agency outside the City of Philadelphia's administration.
A significant portion of transportation-related data is geospatial data. Almost all agencies that submitted responses to the survey are aware of the differences between spatial and
81%
2%
17%Planning
Operations
Planning &Operations
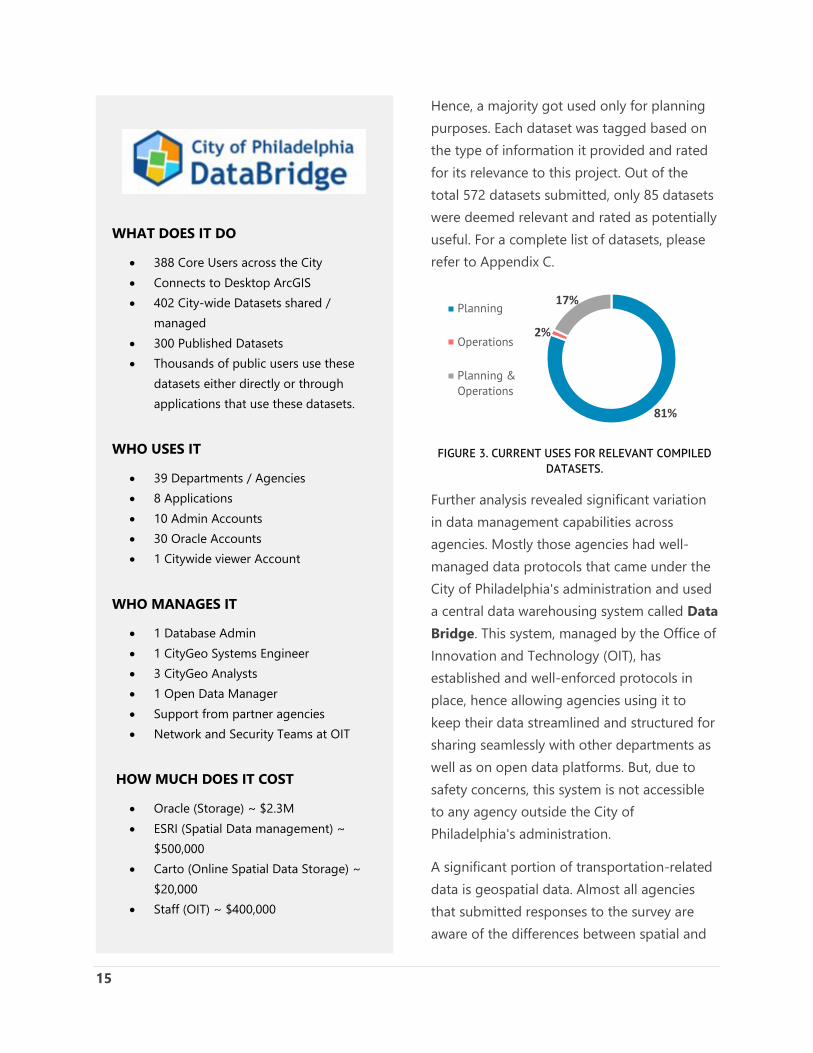
WHAT DOES IT DO
• 388 Core Users across the City • Connects to Desktop ArcGIS • 402 City-wide Datasets shared /
managed • 300 Published Datasets • Thousands of public users use these
datasets either directly or through applications that use these datasets.
WHO USES IT
• 39 Departments / Agencies • 8 Applications • 10 Admin Accounts • 30 Oracle Accounts • 1 Citywide viewer Account
WHO MANAGES IT
• 1 Database Admin • 1 CityGeo Systems Engineer • 3 CityGeo Analysts • 1 Open Data Manager • Support from partner agencies • Network and Security Teams at OIT
HOW MUCH DOES IT COST
• Oracle (Storage) ~ $2.3M • ESRI (Spatial Data management) ~
$500,000 • Carto (Online Spatial Data Storage) ~
$20,000 • Staff (OIT) ~ $400,000
16
non-spatial data. But many did not have access to tools to perform complex analyses or visualize them in useful ways. Some agencies store and analyze data using internal resources, while others use third-party vendors to either partially or entirely manage it. The latter have limited internal capacity to run analysis or visualize geospatial data for purposes beyond what is predefined through vendor contracts, preventing use of data planning purposes.
Assessment
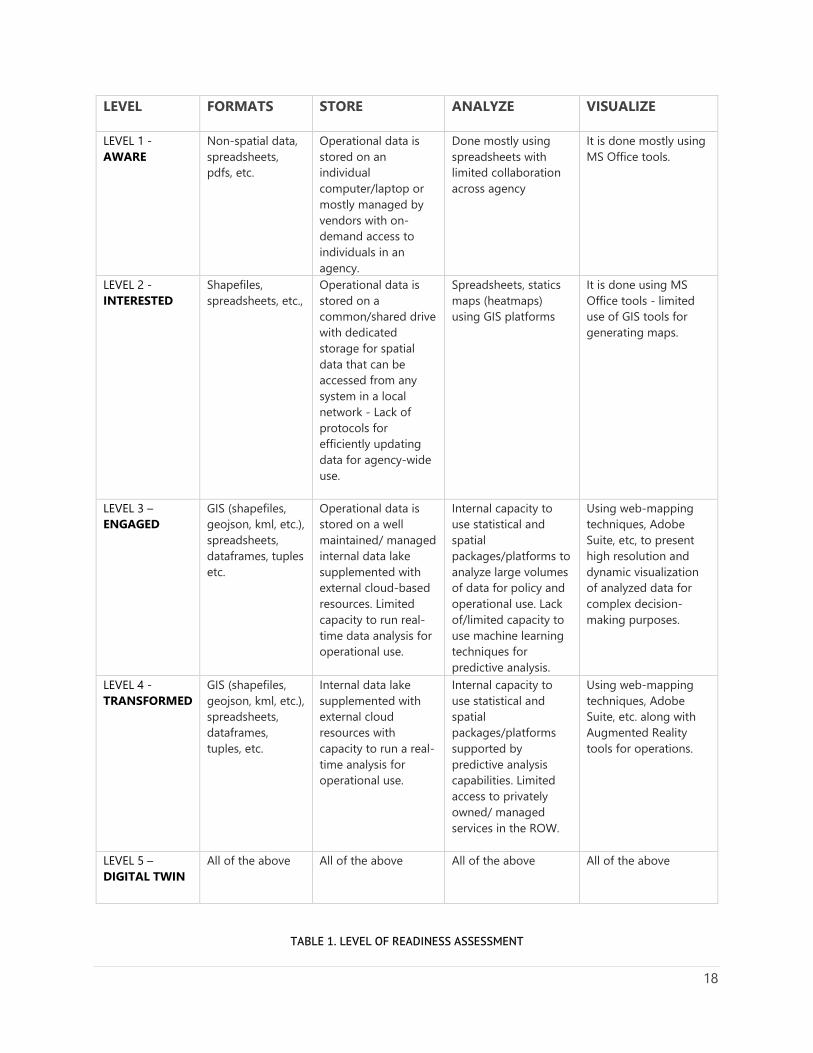
To support self-assessment by partner agencies to determine the level of readiness of their own data infrastructure, the project team developed benchmarks using the responses from the survey and a study of similar standards put out by industry leaders. The project scope did not allow each agency to receive an assessment individually. Due to varying capacity and need for data infrastructure, this benchmarking enables each agency to self-assess their present level of readiness to collect, analyze, visualize, and present data and plan the next steps based on their own specific needs in the future. Please refer to Appendix C for details about other benchmarking specifications studied by the project team.
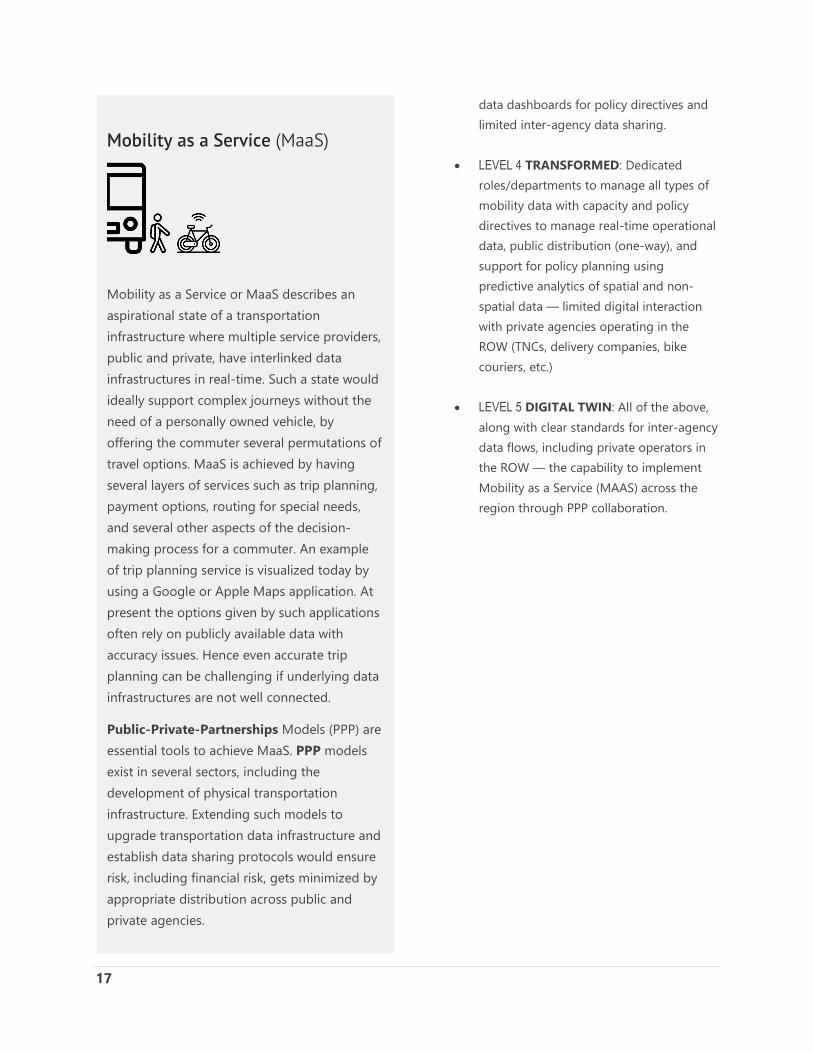
The levels used for benchmarking are defined as follows:
• LEVEL 1 AWARE: Aware of trends in the use of data infrastructure for transportation planning and management
— lack the internal capacity to explore any opportunity to leverage mobility data.
• LEVEL 2 INTERESTED: Efforts/Investments
made to encourage the use of spatial data and efficient intra-agency sharing capacity —limited internal capacity due to a lack of defined internal roles to manage data for decision making.
• LEVEL 3 ENGAGED: Dedicated roles to
manage mobility data, especially spatial data — supported by internal infrastructure allowing efficient sharing and updating of resources — existing automated pipelines for putting data to operational use through proper analysis —lack of clear directives on data privacy, delivery of public information — use of
FIGURE 4. LEVELS OF READINESS FOR AN AGENCY TO LEVERAGE DATA
17
data dashboards for policy directives and limited inter-agency data sharing.
• LEVEL 4 TRANSFORMED: Dedicated
roles/departments to manage all types of mobility data with capacity and policy directives to manage real-time operational data, public distribution (one-way), and support for policy planning using predictive analytics of spatial and non-spatial data — limited digital interaction with private agencies operating in the ROW (TNCs, delivery companies, bike couriers, etc.)
• LEVEL 5 DIGITAL TWIN: All of the above,
along with clear standards for inter-agency data flows, including private operators in the ROW — the capability to implement Mobility as a Service (MAAS) across the region through PPP collaboration.
Mobility as a Service (MaaS)
Mobility as a Service or MaaS describes an aspirational state of a transportation infrastructure where multiple service providers, public and private, have interlinked data infrastructures in real-time. Such a state would ideally support complex journeys without the need of a personally owned vehicle, by offering the commuter several permutations of travel options. MaaS is achieved by having several layers of services such as trip planning, payment options, routing for special needs, and several other aspects of the decision-making process for a commuter. An example of trip planning service is visualized today by using a Google or Apple Maps application. At present the options given by such applications often rely on publicly available data with accuracy issues. Hence even accurate trip planning can be challenging if underlying data infrastructures are not well connected.
Public-Private-Partnerships Models (PPP) are essential tools to achieve MaaS. PPP models exist in several sectors, including the development of physical transportation infrastructure. Extending such models to upgrade transportation data infrastructure and establish data sharing protocols would ensure risk, including financial risk, gets minimized by appropriate distribution across public and private agencies.
18
LEVEL FORMATS STORE ANALYZE VISUALIZE
LEVEL 1 - AWARE
Non-spatial data, spreadsheets, pdfs, etc.
Operational data is stored on an individual computer/laptop or mostly managed by vendors with on-demand access to individuals in an agency.
Done mostly using spreadsheets with limited collaboration across agency
It is done mostly using MS Office tools.
LEVEL 2 - INTERESTED
Shapefiles, spreadsheets, etc.,
Operational data is stored on a common/shared drive with dedicated storage for spatial data that can be accessed from any system in a local network - Lack of protocols for efficiently updating data for agency-wide use.
Spreadsheets, statics maps (heatmaps) using GIS platforms
It is done using MS Office tools - limited use of GIS tools for generating maps.
LEVEL 3 – ENGAGED
GIS (shapefiles, geojson, kml, etc.), spreadsheets, dataframes, tuples etc.
Operational data is stored on a well maintained/ managed internal data lake supplemented with external cloud-based resources. Limited capacity to run real-time data analysis for operational use.
Internal capacity to use statistical and spatial packages/platforms to analyze large volumes of data for policy and operational use. Lack of/limited capacity to use machine learning techniques for predictive analysis.
Using web-mapping techniques, Adobe Suite, etc, to present high resolution and dynamic visualization of analyzed data for complex decision-making purposes.
LEVEL 4 - TRANSFORMED
GIS (shapefiles, geojson, kml, etc.), spreadsheets, dataframes, tuples, etc.
Internal data lake supplemented with external cloud resources with capacity to run a real-time analysis for operational use.
Internal capacity to use statistical and spatial packages/platforms supported by predictive analysis capabilities. Limited access to privately owned/ managed services in the ROW.
Using web-mapping techniques, Adobe Suite, etc. along with Augmented Reality tools for operations.
LEVEL 5 – DIGITAL TWIN
All of the above All of the above All of the above All of the above
TABLE 1. LEVEL OF READINESS ASSESSMENT
19
TEST CASES
Overview
Data, by itself is a liability. The insight it provides is an asset. In this project, once it was known which agency managed what datasets, it was essential to turn focus towards actual systemic problems that may be solved using the exchange of data or improvements in how it got handled.
Using the wealth of knowledge brought to this project by representatives from partner agencies, several test cases were identified as potential opportunities for using data or data infrastructure to solve a Citywide problem transportation problem. Additional in-person interviews were conducted, and two test cases were shortlisted for further study within the project.
Several factors were used for making the selection of final two cases. Firstly, at least one agency would need to have resources and intention to support further research into the problem and possibly support solutions for it. Secondly, solving a given test case must have significant Impact on operational capacity of agencies involved and on user experience of the commuters using the infrastructure. Lastly, solution must require an upgrade of one or more data management systems across one or more agencies.
Using these factors, the following two test cases selected were Bus Detour Management and Curb Space Management.
Case #1: Bus Detour Management
PROBLEM STATEMENT
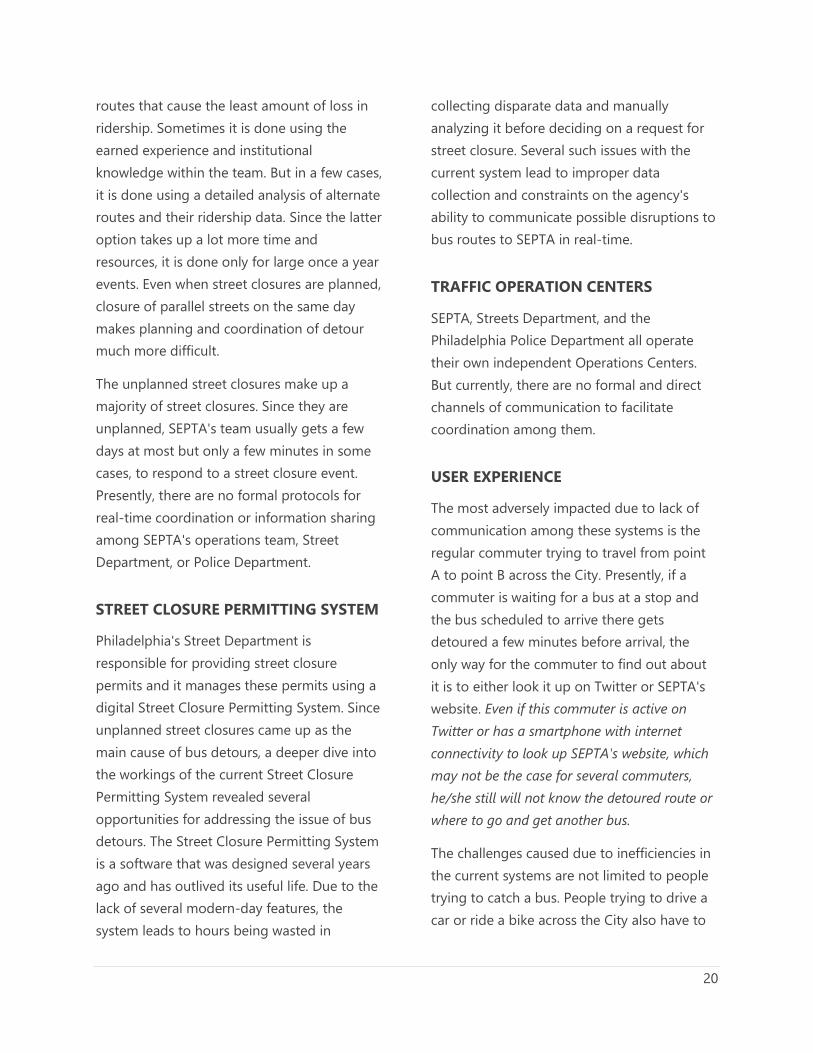
SEPTA's bus service is among the most critical public infrastructure in Philadelphia because it provides an affordable travel option for the most number of people. Anything done to improve the reliability of bus service would be a significant boost to promoting equity in Philadelphia's transportation system. A common issue that causes delays in bus service is a bus detour. Detours mostly occur because the regular route of a particular bus gets blocked, usually due to street closure. The problem identified for this test case was how to minimize bus detours and effectively communicate information about the detour to commuters in real-time to improve the reliability of bus service in the City.
Teams managing operations at SEPTA have been trying for years to address this issue. The leading cause of detours by far, as identified by SEPTA, has been street closures. Over the past few years, street closures leading to detours have increased by about 15% annually, with over 630 detours recorded in the year 2019.
PLANNED / UNPLANNED CLOSURES
Over the years, SEPTA's operations team has developed expertise in managing both planned and unplanned street closures that cause bus detours. Planned closures generally allow SETPA's team to look for alternative
20
routes that cause the least amount of loss in ridership. Sometimes it is done using the earned experience and institutional knowledge within the team. But in a few cases, it is done using a detailed analysis of alternate routes and their ridership data. Since the latter option takes up a lot more time and resources, it is done only for large once a year events. Even when street closures are planned, closure of parallel streets on the same day makes planning and coordination of detour much more difficult.
The unplanned street closures make up a majority of street closures. Since they are unplanned, SEPTA's team usually gets a few days at most but only a few minutes in some cases, to respond to a street closure event. Presently, there are no formal protocols for real-time coordination or information sharing among SEPTA's operations team, Street Department, or Police Department.
STREET CLOSURE PERMITTING SYSTEM
Philadelphia's Street Department is responsible for providing street closure permits and it manages these permits using a digital Street Closure Permitting System. Since unplanned street closures came up as the main cause of bus detours, a deeper dive into the workings of the current Street Closure Permitting System revealed several opportunities for addressing the issue of bus detours. The Street Closure Permitting System is a software that was designed several years ago and has outlived its useful life. Due to the lack of several modern-day features, the system leads to hours being wasted in
collecting disparate data and manually analyzing it before deciding on a request for street closure. Several such issues with the current system lead to improper data collection and constraints on the agency's ability to communicate possible disruptions to bus routes to SEPTA in real-time.
TRAFFIC OPERATION CENTERS
SEPTA, Streets Department, and the Philadelphia Police Department all operate their own independent Operations Centers. But currently, there are no formal and direct channels of communication to facilitate coordination among them.
USER EXPERIENCE
The most adversely impacted due to lack of communication among these systems is the regular commuter trying to travel from point A to point B across the City. Presently, if a commuter is waiting for a bus at a stop and the bus scheduled to arrive there gets detoured a few minutes before arrival, the only way for the commuter to find out about it is to either look it up on Twitter or SEPTA's website. Even if this commuter is active on Twitter or has a smartphone with internet connectivity to look up SEPTA's website, which may not be the case for several commuters, he/she still will not know the detoured route or where to go and get another bus.
The challenges caused due to inefficiencies in the current systems are not limited to people trying to catch a bus. People trying to drive a car or ride a bike across the City also have to
21
reroute or get stuck in traffic due to unplanned street closures.
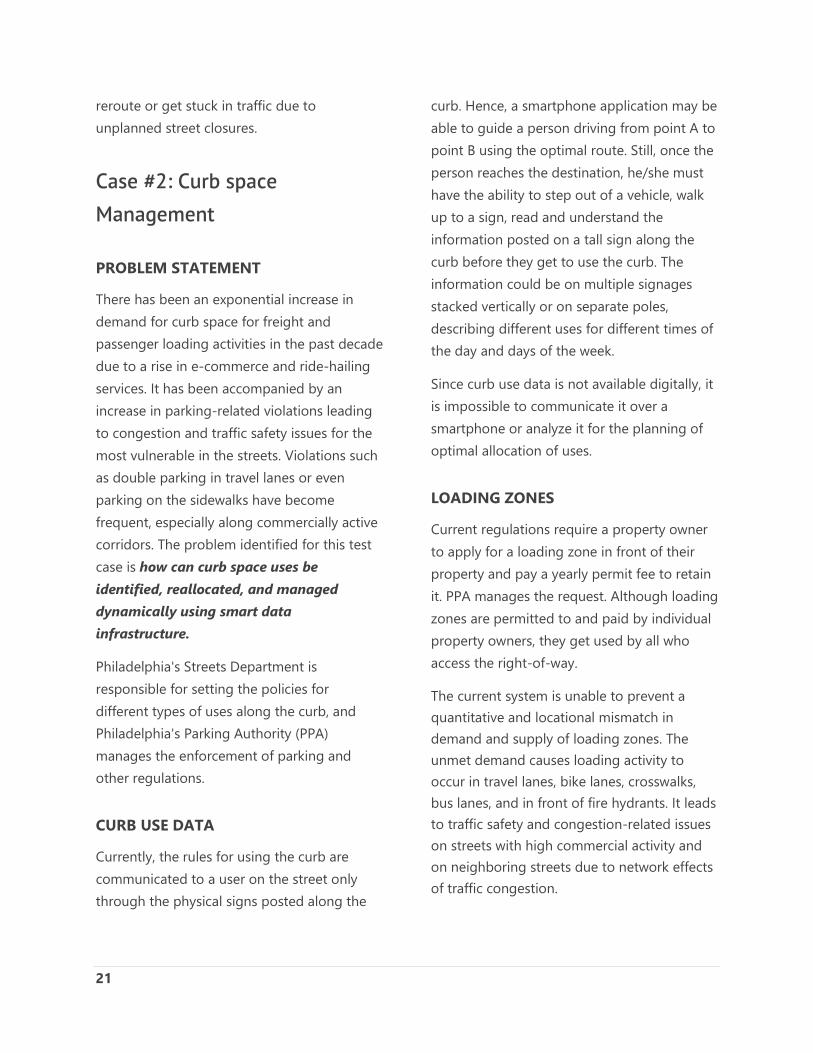
Case #2: Curb space Management
PROBLEM STATEMENT
There has been an exponential increase in demand for curb space for freight and passenger loading activities in the past decade due to a rise in e-commerce and ride-hailing services. It has been accompanied by an increase in parking-related violations leading to congestion and traffic safety issues for the most vulnerable in the streets. Violations such as double parking in travel lanes or even parking on the sidewalks have become frequent, especially along commercially active corridors. The problem identified for this test case is how can curb space uses be identified, reallocated, and managed dynamically using smart data infrastructure.
Philadelphia's Streets Department is responsible for setting the policies for different types of uses along the curb, and Philadelphia's Parking Authority (PPA) manages the enforcement of parking and other regulations.
CURB USE DATA
Currently, the rules for using the curb are communicated to a user on the street only through the physical signs posted along the
curb. Hence, a smartphone application may be able to guide a person driving from point A to point B using the optimal route. Still, once the person reaches the destination, he/she must have the ability to step out of a vehicle, walk up to a sign, read and understand the information posted on a tall sign along the curb before they get to use the curb. The information could be on multiple signages stacked vertically or on separate poles, describing different uses for different times of the day and days of the week.
Since curb use data is not available digitally, it is impossible to communicate it over a smartphone or analyze it for the planning of optimal allocation of uses.
LOADING ZONES
Current regulations require a property owner to apply for a loading zone in front of their property and pay a yearly permit fee to retain it. PPA manages the request. Although loading zones are permitted to and paid by individual property owners, they get used by all who access the right-of-way.
The current system is unable to prevent a quantitative and locational mismatch in demand and supply of loading zones. The unmet demand causes loading activity to occur in travel lanes, bike lanes, crosswalks, bus lanes, and in front of fire hydrants. It leads to traffic safety and congestion-related issues on streets with high commercial activity and on neighboring streets due to network effects of traffic congestion.
22
PROPOSED PILOT PROJECTS
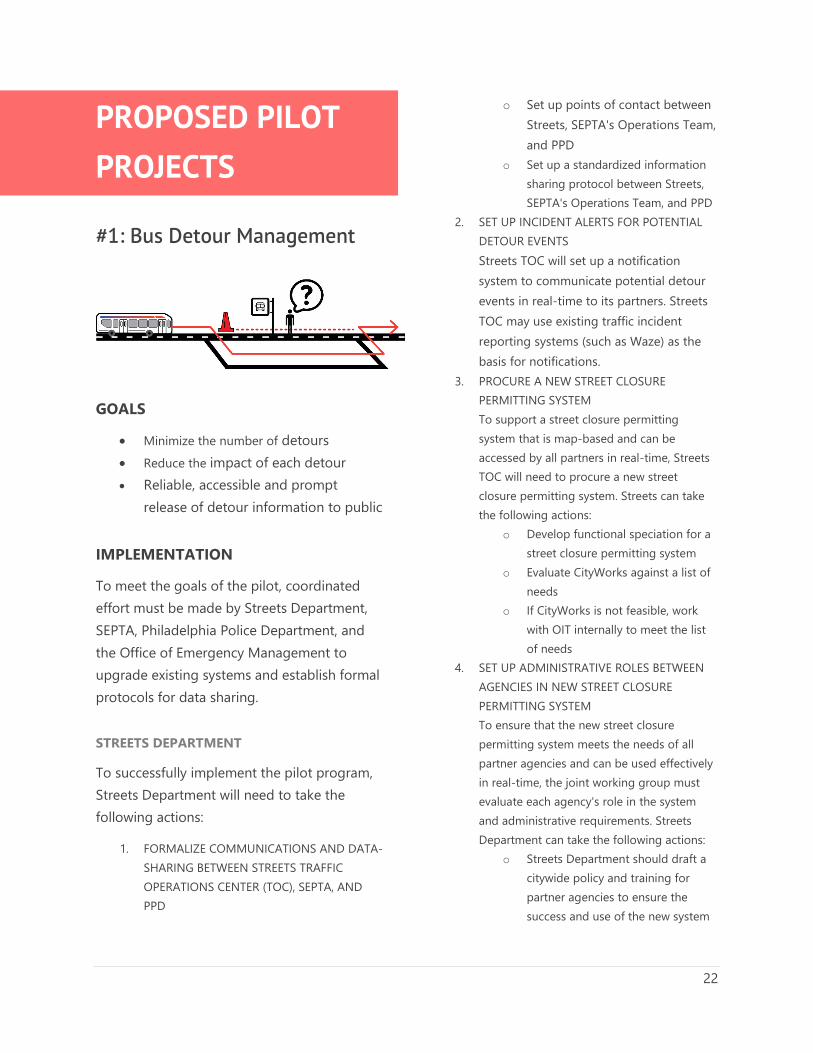
#1: Bus Detour Management
GOALS
• Minimize the number of detours • Reduce the impact of each detour • Reliable, accessible and prompt
release of detour information to public
IMPLEMENTATION
To meet the goals of the pilot, coordinated effort must be made by Streets Department, SEPTA, Philadelphia Police Department, and the Office of Emergency Management to upgrade existing systems and establish formal protocols for data sharing.
STREETS DEPARTMENT
To successfully implement the pilot program, Streets Department will need to take the following actions:
1. FORMALIZE COMMUNICATIONS AND DATA-SHARING BETWEEN STREETS TRAFFIC OPERATIONS CENTER (TOC), SEPTA, AND PPD
o Set up points of contact between Streets, SEPTA's Operations Team, and PPD
o Set up a standardized information sharing protocol between Streets, SEPTA's Operations Team, and PPD
2. SET UP INCIDENT ALERTS FOR POTENTIAL DETOUR EVENTS Streets TOC will set up a notification system to communicate potential detour events in real-time to its partners. Streets TOC may use existing traffic incident reporting systems (such as Waze) as the basis for notifications.
3. PROCURE A NEW STREET CLOSURE PERMITTING SYSTEM To support a street closure permitting system that is map-based and can be accessed by all partners in real-time, Streets TOC will need to procure a new street closure permitting system. Streets can take the following actions:
o Develop functional speciation for a street closure permitting system
o Evaluate CityWorks against a list of needs
o If CityWorks is not feasible, work with OIT internally to meet the list of needs
4. SET UP ADMINISTRATIVE ROLES BETWEEN AGENCIES IN NEW STREET CLOSURE PERMITTING SYSTEM To ensure that the new street closure permitting system meets the needs of all partner agencies and can be used effectively in real-time, the joint working group must evaluate each agency's role in the system and administrative requirements. Streets Department can take the following actions:
o Streets Department should draft a citywide policy and training for partner agencies to ensure the success and use of the new system
23
Data Journey Map
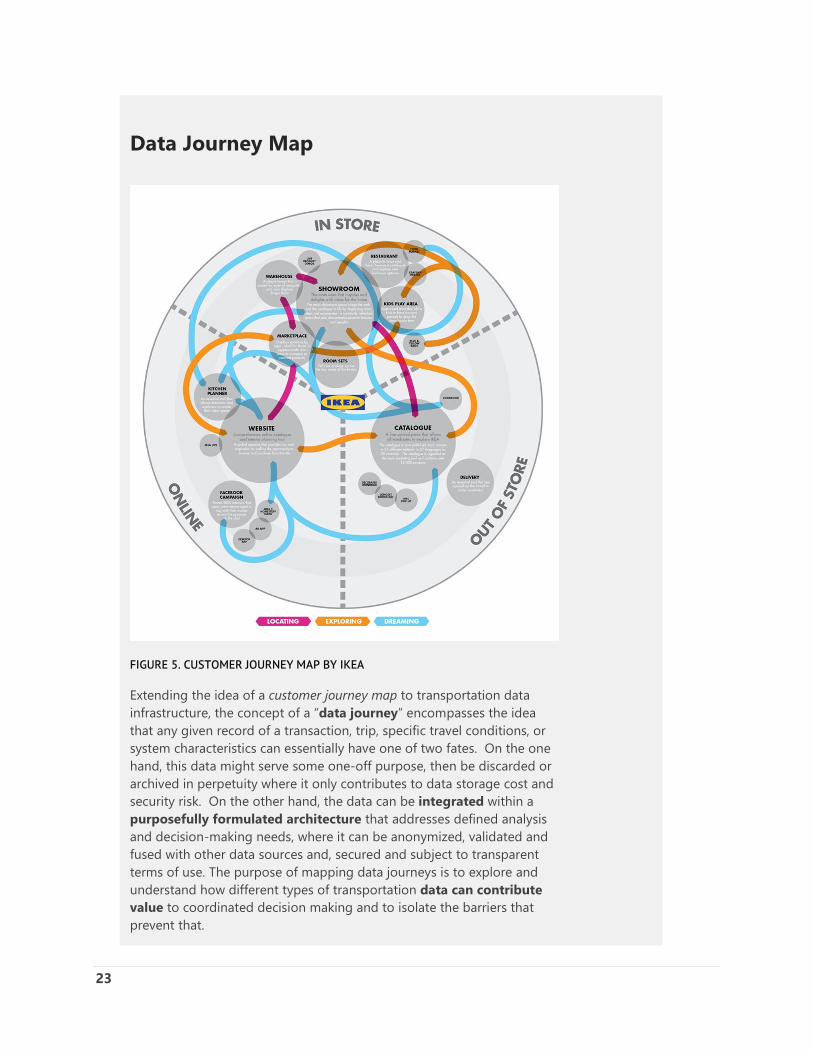
FIGURE 5. CUSTOMER JOURNEY MAP BY IKEA
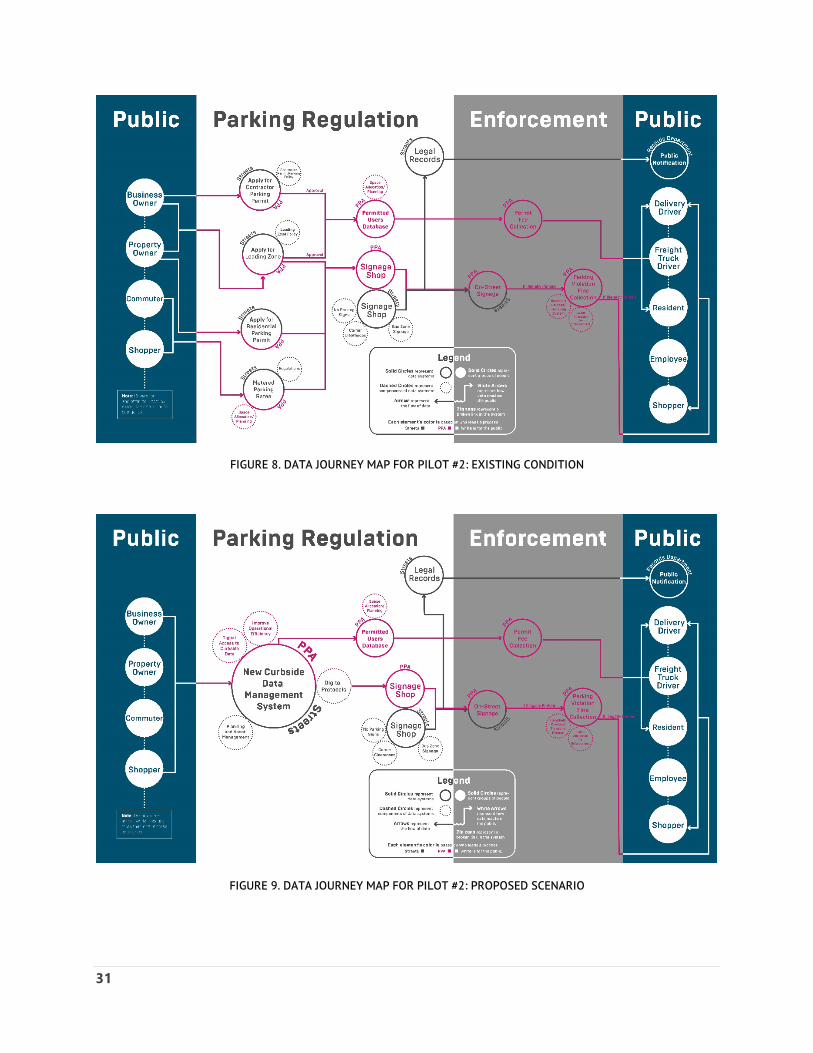
Extending the idea of a customer journey map to transportation data infrastructure, the concept of a “data journey” encompasses the idea that any given record of a transaction, trip, specific travel conditions, or system characteristics can essentially have one of two fates. On the one hand, this data might serve some one-off purpose, then be discarded or archived in perpetuity where it only contributes to data storage cost and security risk. On the other hand, the data can be integrated within a purposefully formulated architecture that addresses defined analysis and decision-making needs, where it can be anonymized, validated and fused with other data sources and, secured and subject to transparent terms of use. The purpose of mapping data journeys is to explore and understand how different types of transportation data can contribute value to coordinated decision making and to isolate the barriers that prevent that.
24
SEPTA
To successfully implement the pilot program, SEPTA will need to take the following actions:
1. PROCURE TECHNOLOGY FOR REAL-TIME ARRIVAL INFORMATION FOR BUSSES To meet the goal of reliable, accessible, and prompt public notification of detours, SEPTA will need to procure technology that can provide real-time arrival information for buses.
2. IMPROVE USE OF GTFS INFRASTRUCTURE 3. CREATE A SYSTEM TO EVALUATE THE
IMPACT OF DETOURS ON RIDERSHIP To meet the goal of reducing the Impact of detours on ridership, SEPTA will need to create a method to evalute changes in ridership as a consequence of detours. This can utilize the existing scorecard system and should integrate geospatial information captured by the new, map-based street closure permitting system.
4. IMPROVE DISTRIBUTION OF DETOUR INFORMATION TO THE PUBLIC To meet the goal of reliable, accessible, and prompt public notification of detours, SEPTA will need to review and implement a more user-focused strategy to communicate detour information to the public.
5. FORMALIZE COMMUNICATIONS AND DATA-SHARING BETWEEN STREETS TRAFFIC OPERATIONS CENTER (TOC), SEPTA, AND PPD To ensure citywide coordination of transportation data, Streets' existing TOC needs to become the City's data hub. SEPTA can take the following actions to allow multi-channel communication between Streets, SEPTA, and PPD:
o Set up points of contact between SEPTA's Operations Team, Streets, and PPD
o Set up a standardized information sharing protocol between SEPTA's Operations Team, Streets, and PPD
TO SET UP ADMINISTRATIVE ROLES WITHIN SETPA TO USE THE NEW STREET CLOSURE PERMITTING SYSTEM SEPTA CAN TAKE THE FOLLOWING ACTIONS:
o SEPTA must create a workflow that promptly approves and denies street closure permits (through the new street closure permitting system) based on assigned roles decided by joint working group
o SEPTA can use the status of street closure permit applications to inform their detour planning process
OTHER PARTNER AGENCIES
Other partnering agencies who are involved in street closures and detours – including Philadelphia Police Department (PPD), Streets' ROW unit, the Office of Emergency Management's Special Events Unit – will also need to participate and implement smaller parts of the pilot program.
To successfully implement the pilot program, PPD will need to take the following actions:
1. FORMALIZE COMMUNICATIONS AND DATA-SHARING BETWEEN STREETS TRAFFIC OPERATIONS CENTER (TOC), SEPTA, AND PPD To ensure citywide coordination of transportation data, Streets' existing TOC needs to become the City's data hub. PPD can take the following actions to allow multi-channel communication between Streets, SEPTA, and PPD:
o Set up points of contact between SEPTA's Operations Team, Streets, and PPD
25
o Set up a standardized information sharing protocol between SEPTA's Operations Team, Streets, and PPD
2. SET UP ADMINISTRATIVE ROLES BETWEEN AGENCIES IN NEW STREET CLOSURE PERMITTING SYSTEM To ensure that the new street closure permitting system meets the needs of all partner agencies and can be used effectively in real-time, each agency's role in the system and administrative requirements should be
evaluated. PPD can take the following actions:
o PPD must create a workflow that promptly approves and denies street closure permits (through the new street closure permitting system)
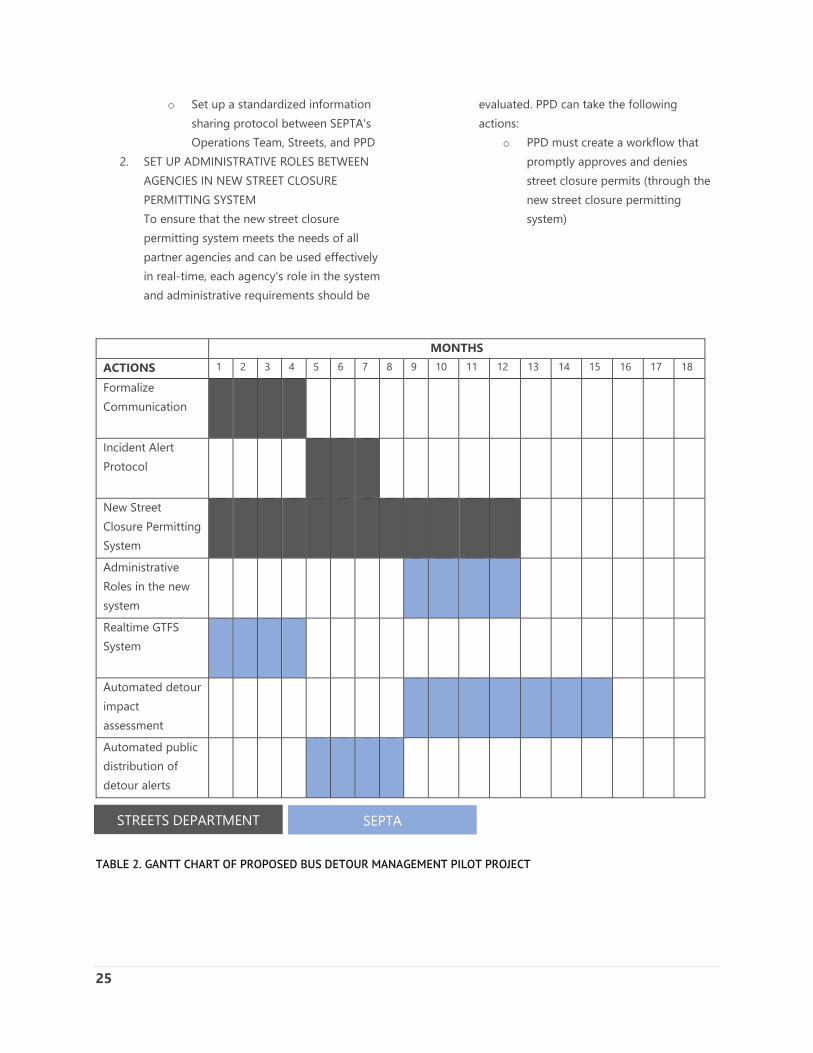
MONTHS
ACTIONS 1 2 3 4 5 6 7 8 9 10 11 12 13 14 15 16 17 18
Formalize Communication
Incident Alert Protocol
New Street Closure Permitting System
Administrative Roles in the new system
Realtime GTFS System
Automated detour impact assessment
Automated public distribution of detour alerts
TABLE 2. GANTT CHART OF PROPOSED BUS DETOUR MANAGEMENT PILOT PROJECT
STREETS DEPARTMENT SEPTA
26
FIGU
RE 6
. FIG
URE
4. D
ATA
JOUR
NEY
MAP
FO
R PI
LOT
#1: E
XIST
ING
CON
DIT
ION
27
FIGU
RE 7
. DAT
A JO
URN
EY M
AP F
OR
PILO
T #1
: PRO
POSE
D S
CEN
ARIO

28
#2: Curb Space Management
GOALS
The goals of the curbside management pilot program are to:
• Digitized, citywide database of curbside regulations and make it available to public through an API;
• Integrate digital curbside data into existing operations
• Install a Smart loading zone
IMPLEMENTATION
To meet the goals of the pilot, the Streets Department, and the Philadelphia Parking Authority (PPA) would need to upgrade existing systems and establish new protocols for sharing information.
STREETS & PPA
To successfully implement the pilot program, Streets and PPA will need to take the following actions:
1. JOINTLY PROCURE CURBSIDE DATA MANAGEMENT SYSTEM To ensure digitized, citywide curbside data, Streets and PPA need to procure a curbside data management system. Streets can take the following actions:
o Develop a functional specification for a curbside data management system
o Evaluate potential software options against list of needs
2. DEVELOP JOINT DATA SHARING AND USE PROTOCOLS
To ensure ongoing coordinated public management of curbside space, Streets and PPA will need to jointly develop digital sharing protocols, create communication channels, and use policies. Both can take the following actions:
o Set up a standardized data sharing and usage protocols between Streets and PPA
o Set up points of contact between Streets and PPA
3. INTEGRATE DIGITAL CURBSIDE DATA WITH EXISTING INTERNAL ASSET MANAGEMENT PROCESSES To integrate digital curbside data into existing operations, Streets will need to determine how digital curbside data can improve existing asset management processes.
4. SET UP JOINT IMPLEMENTATION WORKING GROUP TO EXPLORE POTENTIAL FUTURE APPLICATIONS To enable potential future applications of the pilot program, Streets and PPA will need to create a joint working group to explore and recommend next steps.
29
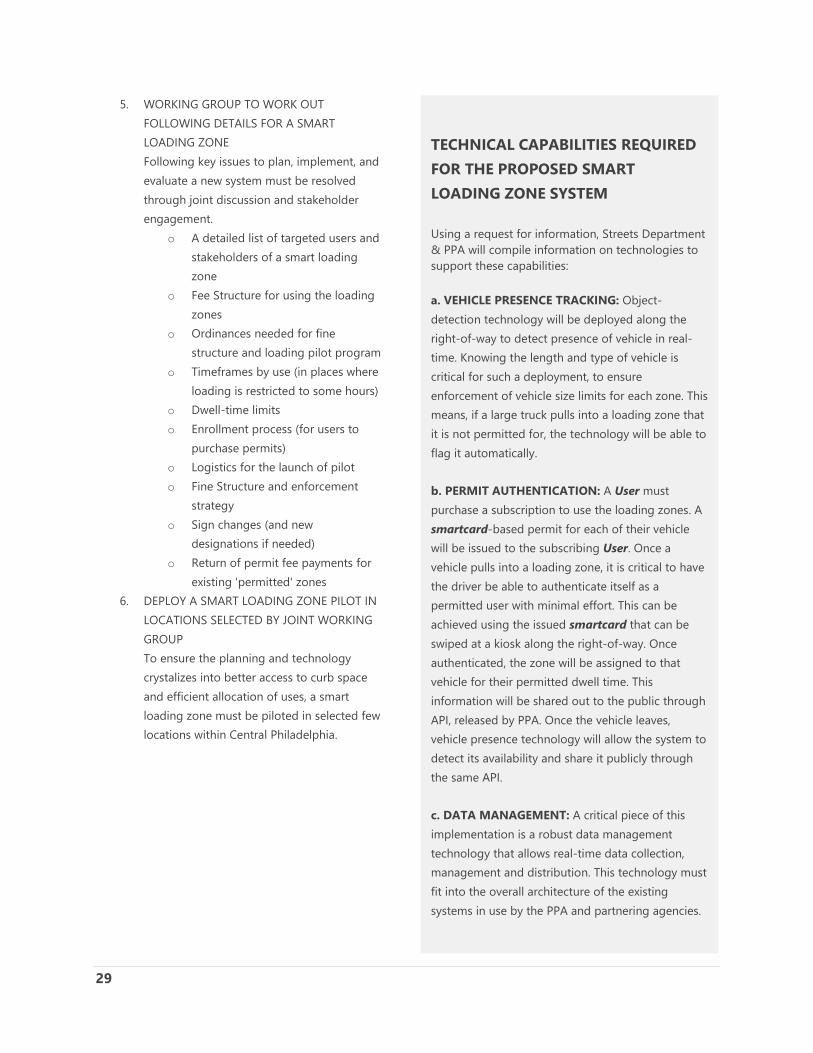
5. WORKING GROUP TO WORK OUT FOLLOWING DETAILS FOR A SMART LOADING ZONE Following key issues to plan, implement, and evaluate a new system must be resolved through joint discussion and stakeholder engagement.
o A detailed list of targeted users and stakeholders of a smart loading zone
o Fee Structure for using the loading zones
o Ordinances needed for fine structure and loading pilot program
o Timeframes by use (in places where loading is restricted to some hours)
o Dwell-time limits o Enrollment process (for users to
purchase permits) o Logistics for the launch of pilot o Fine Structure and enforcement
strategy o Sign changes (and new
designations if needed) o Return of permit fee payments for
existing 'permitted' zones 6. DEPLOY A SMART LOADING ZONE PILOT IN
LOCATIONS SELECTED BY JOINT WORKING GROUP To ensure the planning and technology crystalizes into better access to curb space and efficient allocation of uses, a smart loading zone must be piloted in selected few locations within Central Philadelphia.
TECHNICAL CAPABILITIES REQUIRED FOR THE PROPOSED SMART LOADING ZONE SYSTEM
Using a request for information, Streets Department & PPA will compile information on technologies to support these capabilities:
a. VEHICLE PRESENCE TRACKING: Object-detection technology will be deployed along the right-of-way to detect presence of vehicle in real-time. Knowing the length and type of vehicle is critical for such a deployment, to ensure enforcement of vehicle size limits for each zone. This means, if a large truck pulls into a loading zone that it is not permitted for, the technology will be able to flag it automatically.
b. PERMIT AUTHENTICATION: A User must purchase a subscription to use the loading zones. A smartcard-based permit for each of their vehicle will be issued to the subscribing User. Once a vehicle pulls into a loading zone, it is critical to have the driver be able to authenticate itself as a permitted user with minimal effort. This can be achieved using the issued smartcard that can be swiped at a kiosk along the right-of-way. Once authenticated, the zone will be assigned to that vehicle for their permitted dwell time. This information will be shared out to the public through API, released by PPA. Once the vehicle leaves, vehicle presence technology will allow the system to detect its availability and share it publicly through the same API.
c. DATA MANAGEMENT: A critical piece of this implementation is a robust data management technology that allows real-time data collection, management and distribution. This technology must fit into the overall architecture of the existing systems in use by the PPA and partnering agencies.
30
MONTHS
ACTIONS 1 2 3 4 5 6 7 8 9 10 11 12 13 14 15 16 17 18
Jointly procure curbside data
Joint data sharing protocols
Integrate curb data into asset management
Integrate curb data into existing operational
Setup joint working group
Plan Smart Loading Zone pilot
Deploy Smart Loading Zone pilot
TABLE 3. GANTT CHART FOR PROPOSED CURB SPACE MANAGEMENT PILOT PROJECT
STREETS DEPARTMENT & PPA
31
FIGURE 8. DATA JOURNEY MAP FOR PILOT #2: EXISTING CONDITION
FIGURE 9. DATA JOURNEY MAP FOR PILOT #2: PROPOSED SCENARIO
32
NEXT STEPS
This document provides a first pass at analyzing the present state of City's transportation infrastructure through the lens of readiness to use mobility data. At a high-level, the proposed changes do account of ongoing work in each of the partner agencies and attempts to complement them. The timeline and system upgrades detailed here are based on very limited information collected through interviews by the project team. The implementation for either of these pilot projects would require setting up joint working groups among partner agencies and having extensive stakeholder engagement to ensure implementation is able to provide the best user experience to commuters and operators. Furthermore, MoUs to allow sharing of data would need to be put in place before protocols for doing so are established. Such agreements would take legal experts from all partners to weigh in and support the effort.
Besides the proposed steps, there are a few policy and technical efforts that will help make these pilot projects a success. Here is a list of some of them.
CITY-WIDE DATA PRIVACY POLICY
Data privacy is a very challenging topic for public and private agencies at all scales of operation. Presently, none of the partner agencies have a detailed data privacy policy, especially one that addressed the private nature of transportation
6 https://www.openmobilityfoundation.org/faq/
data. There is an ongoing effort being led by the Office of Innovation and Technology, that would provide resolution to this issue soon.
DATA SPECIFICATIONS TO COMMUNICATE BETWEEN PUBLIC AND PRIVATE AGENCIES
There are ongoing efforts to establish national and international standards governing data sharing protocols between an agency managing right-of-way and a private operator trying to use it. Open Mobility Foundation is helping set standards for cities to digitally communicate with dockless bike-share companies, delivery companies, and on-demand ride-share companies. It is also working to establish specifications to define curbside regulations and operations. 6
FUNDING AND PROCUREMENT STRATEGIES
Many tasks described in the proposal above require partner agencies to test innovative strategies in securing funding for new technologies and support faster procurement processes. A program called Pitch & Pilot managed by the SmartCityPHL team at the Office of Innovation and Technology is a step in this direction. It solicits ideas to improve government services through technological innovation. The program offers funding to test promising solutions in partnership with the private sector.7
7 https://www.phila.gov/programs/pitch-and-pilot/
33
APPENDICES
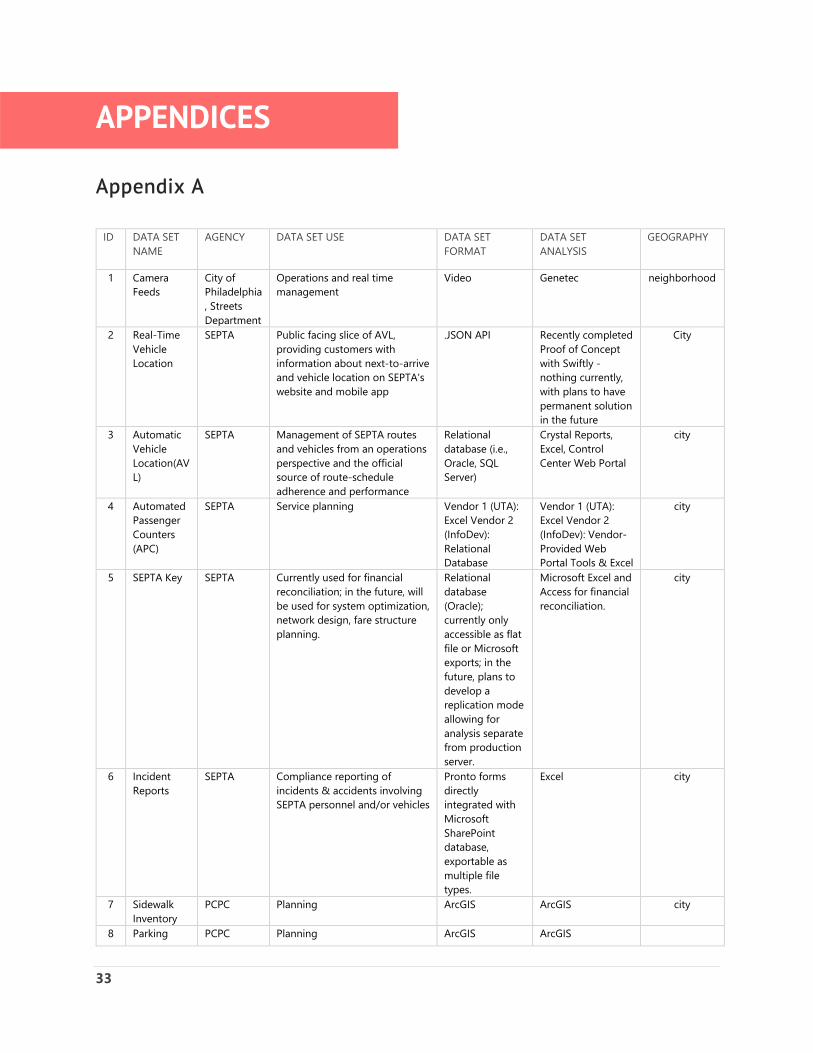
Appendix A
ID DATA SET NAME
AGENCY DATA SET USE DATA SET FORMAT
DATA SET ANALYSIS
GEOGRAPHY
1 Camera Feeds
City of Philadelphia, Streets Department
Operations and real time management
Video Genetec neighborhood
2 Real-Time Vehicle Location
SEPTA Public facing slice of AVL, providing customers with information about next-to-arrive and vehicle location on SEPTA's website and mobile app
.JSON API Recently completed Proof of Concept with Swiftly - nothing currently, with plans to have permanent solution in the future
City
3 Automatic Vehicle Location(AVL)
SEPTA Management of SEPTA routes and vehicles from an operations perspective and the official source of route-schedule adherence and performance
Relational database (i.e., Oracle, SQL Server)
Crystal Reports, Excel, Control Center Web Portal
city
4 Automated Passenger Counters (APC)
SEPTA Service planning Vendor 1 (UTA): Excel Vendor 2 (InfoDev): Relational Database
Vendor 1 (UTA): Excel Vendor 2 (InfoDev): Vendor-Provided Web Portal Tools & Excel
city
5 SEPTA Key SEPTA Currently used for financial reconciliation; in the future, will be used for system optimization, network design, fare structure planning.
Relational database (Oracle); currently only accessible as flat file or Microsoft exports; in the future, plans to develop a replication mode allowing for analysis separate from production server.
Microsoft Excel and Access for financial reconciliation.
city
6 Incident Reports
SEPTA Compliance reporting of incidents & accidents involving SEPTA personnel and/or vehicles
Pronto forms directly integrated with Microsoft SharePoint database, exportable as multiple file types.
Excel city
7 Sidewalk Inventory
PCPC Planning ArcGIS ArcGIS city
8 Parking PCPC Planning ArcGIS ArcGIS
34
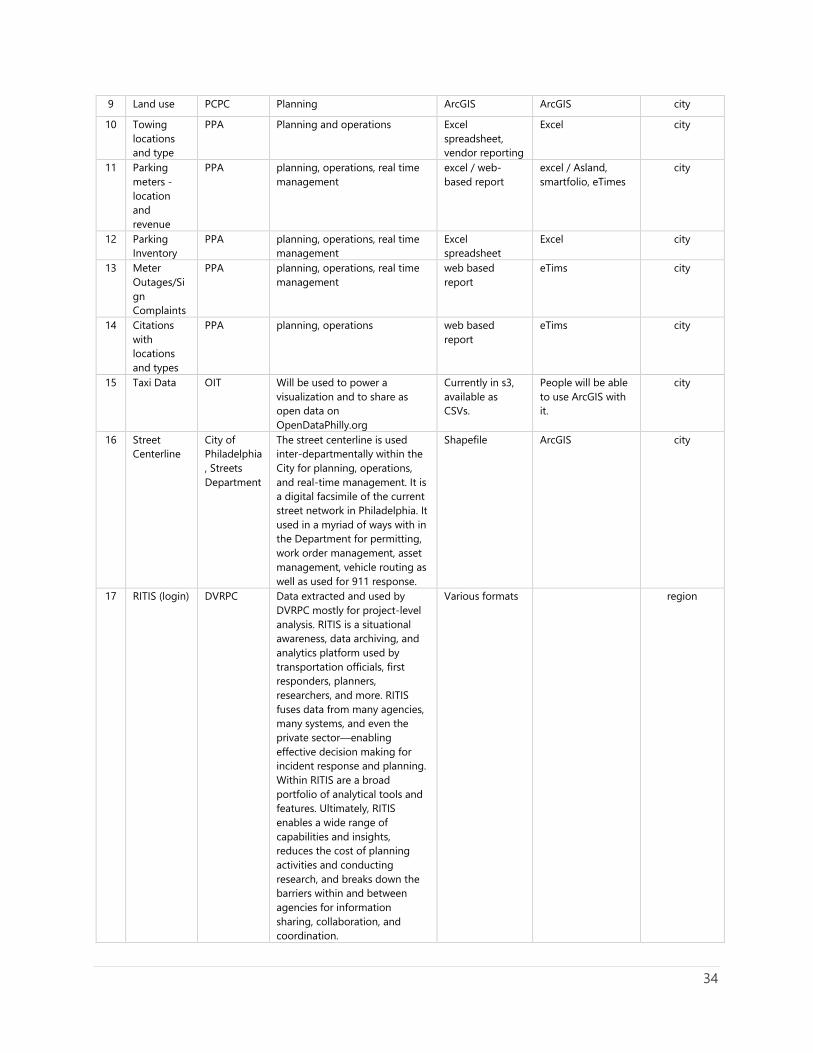
9 Land use PCPC Planning ArcGIS ArcGIS city
10 Towing locations and type
PPA Planning and operations Excel spreadsheet, vendor reporting
Excel city
11 Parking meters - location and revenue
PPA planning, operations, real time management
excel / web-based report
excel / Asland, smartfolio, eTimes
city
12 Parking Inventory
PPA planning, operations, real time management
Excel spreadsheet
Excel city
13 Meter Outages/Sign Complaints
PPA planning, operations, real time management
web based report
eTims city
14 Citations with locations and types
PPA planning, operations web based report
eTims city
15 Taxi Data OIT Will be used to power a visualization and to share as open data on OpenDataPhilly.org
Currently in s3, available as CSVs.
People will be able to use ArcGIS with it.
city
16 Street Centerline
City of Philadelphia, Streets Department
The street centerline is used inter-departmentally within the City for planning, operations, and real-time management. It is a digital facsimile of the current street network in Philadelphia. It used in a myriad of ways with in the Department for permitting, work order management, asset management, vehicle routing as well as used for 911 response.
Shapefile ArcGIS city
17 RITIS (login) DVRPC Data extracted and used by DVRPC mostly for project-level analysis. RITIS is a situational awareness, data archiving, and analytics platform used by transportation officials, first responders, planners, researchers, and more. RITIS fuses data from many agencies, many systems, and even the private sector—enabling effective decision making for incident response and planning. Within RITIS are a broad portfolio of analytical tools and features. Ultimately, RITIS enables a wide range of capabilities and insights, reduces the cost of planning activities and conducting research, and breaks down the barriers within and between agencies for information sharing, collaboration, and coordination.
Various formats
region
35
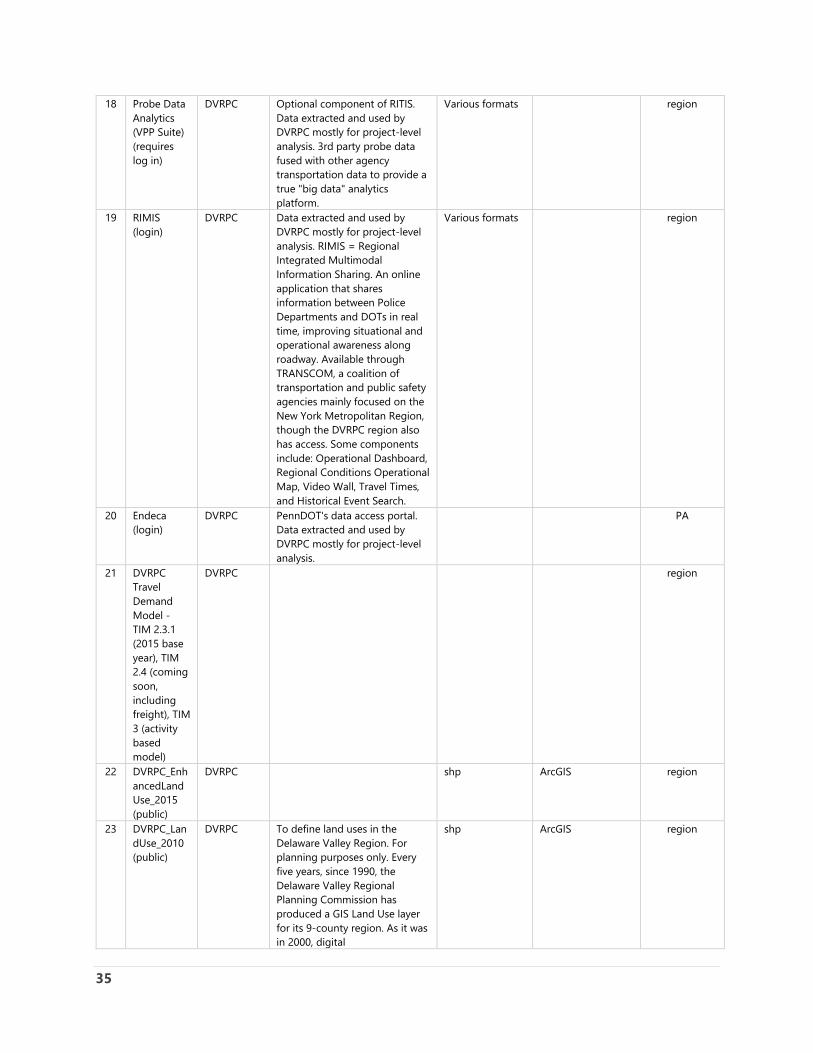
18 Probe Data Analytics (VPP Suite) (requires log in)
DVRPC Optional component of RITIS. Data extracted and used by DVRPC mostly for project-level analysis. 3rd party probe data fused with other agency transportation data to provide a true "big data" analytics platform.
Various formats
region
19 RIMIS (login)
DVRPC Data extracted and used by DVRPC mostly for project-level analysis. RIMIS = Regional Integrated Multimodal Information Sharing. An online application that shares information between Police Departments and DOTs in real time, improving situational and operational awareness along roadway. Available through TRANSCOM, a coalition of transportation and public safety agencies mainly focused on the New York Metropolitan Region, though the DVRPC region also has access. Some components include: Operational Dashboard, Regional Conditions Operational Map, Video Wall, Travel Times, and Historical Event Search.
Various formats
region
20 Endeca (login)
DVRPC PennDOT's data access portal. Data extracted and used by DVRPC mostly for project-level analysis.
PA
21 DVRPC Travel Demand Model - TIM 2.3.1 (2015 base year), TIM 2.4 (coming soon, including freight), TIM 3 (activity based model)
DVRPC
region
22 DVRPC_EnhancedLandUse_2015 (public)
DVRPC shp ArcGIS region
23 DVRPC_LandUse_2010 (public)
DVRPC To define land uses in the Delaware Valley Region. For planning purposes only. Every five years, since 1990, the Delaware Valley Regional Planning Commission has produced a GIS Land Use layer for its 9-county region. As it was in 2000, digital
shp ArcGIS region
36
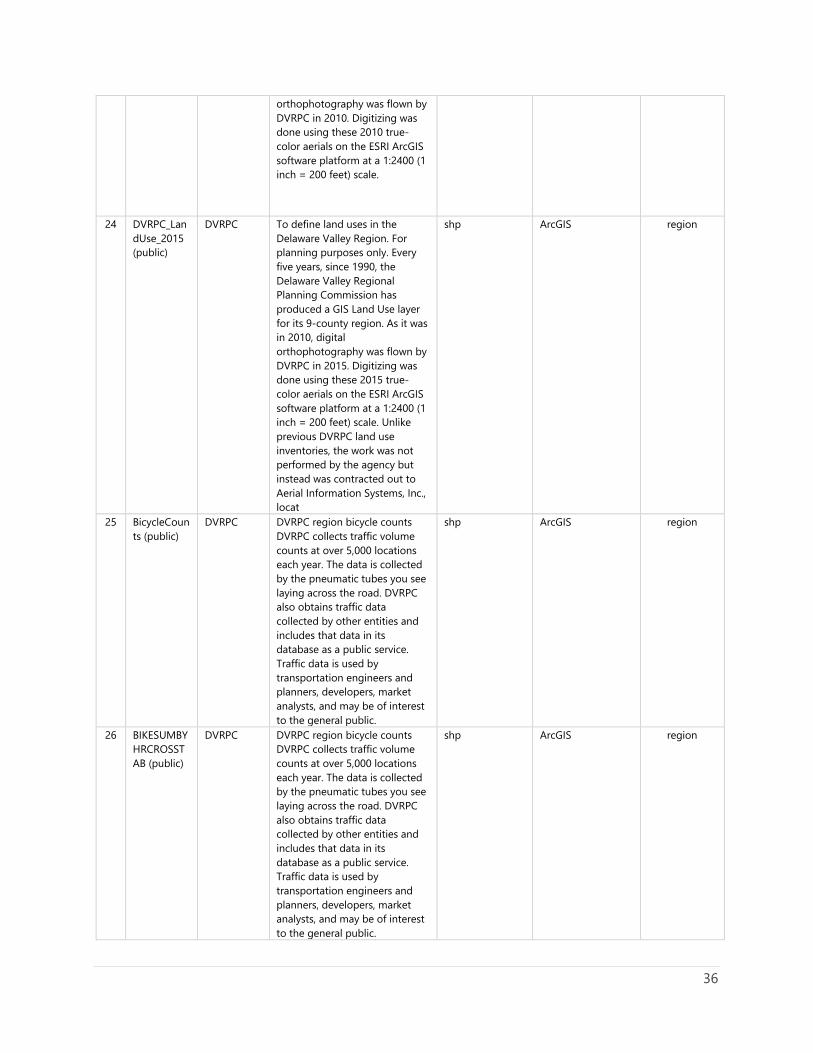
orthophotography was flown by DVRPC in 2010. Digitizing was done using these 2010 true-color aerials on the ESRI ArcGIS software platform at a 1:2400 (1 inch = 200 feet) scale.
24 DVRPC_LandUse_2015 (public)
DVRPC To define land uses in the Delaware Valley Region. For planning purposes only. Every five years, since 1990, the Delaware Valley Regional Planning Commission has produced a GIS Land Use layer for its 9-county region. As it was in 2010, digital orthophotography was flown by DVRPC in 2015. Digitizing was done using these 2015 true-color aerials on the ESRI ArcGIS software platform at a 1:2400 (1 inch = 200 feet) scale. Unlike previous DVRPC land use inventories, the work was not performed by the agency but instead was contracted out to Aerial Information Systems, Inc., locat
shp ArcGIS region
25 BicycleCounts (public)
DVRPC DVRPC region bicycle counts DVRPC collects traffic volume counts at over 5,000 locations each year. The data is collected by the pneumatic tubes you see laying across the road. DVRPC also obtains traffic data collected by other entities and includes that data in its database as a public service. Traffic data is used by transportation engineers and planners, developers, market analysts, and may be of interest to the general public.
shp ArcGIS region
26 BIKESUMBYHRCROSSTAB (public)
DVRPC DVRPC region bicycle counts DVRPC collects traffic volume counts at over 5,000 locations each year. The data is collected by the pneumatic tubes you see laying across the road. DVRPC also obtains traffic data collected by other entities and includes that data in its database as a public service. Traffic data is used by transportation engineers and planners, developers, market analysts, and may be of interest to the general public.
shp ArcGIS region
37
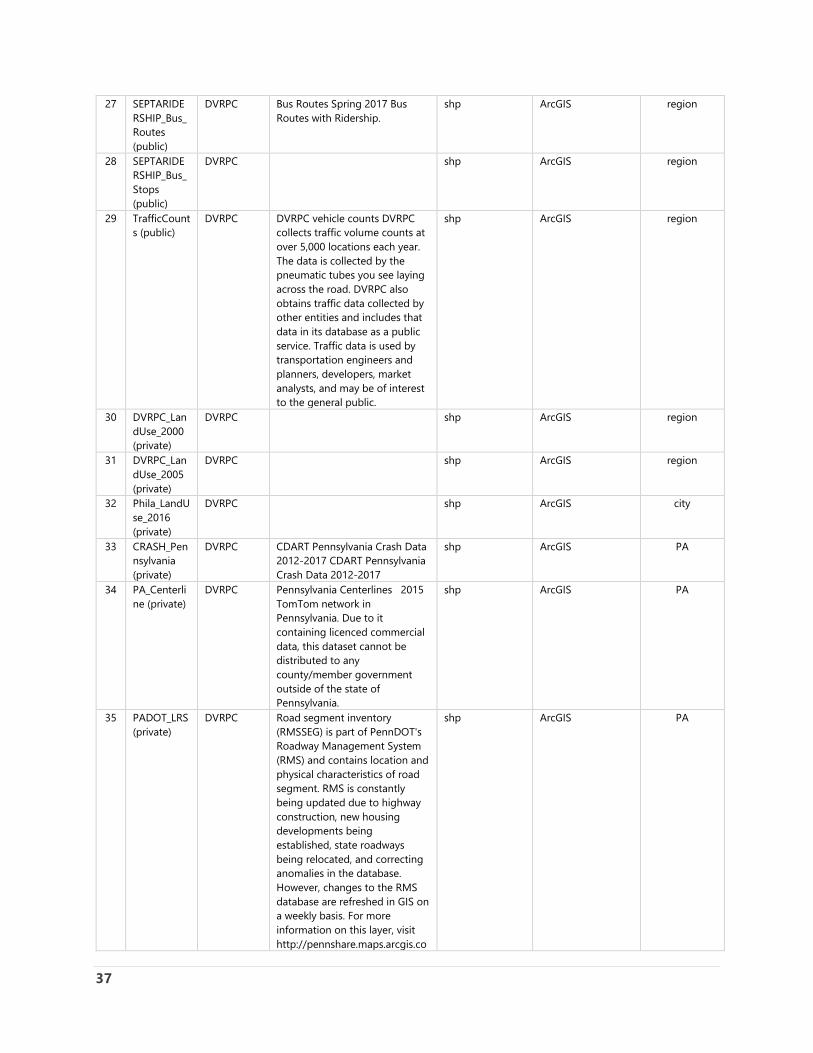
27 SEPTARIDERSHIP_Bus_Routes (public)
DVRPC Bus Routes Spring 2017 Bus Routes with Ridership.
shp ArcGIS region
28 SEPTARIDERSHIP_Bus_Stops (public)
DVRPC shp ArcGIS region
29 TrafficCounts (public)
DVRPC DVRPC vehicle counts DVRPC collects traffic volume counts at over 5,000 locations each year. The data is collected by the pneumatic tubes you see laying across the road. DVRPC also obtains traffic data collected by other entities and includes that data in its database as a public service. Traffic data is used by transportation engineers and planners, developers, market analysts, and may be of interest to the general public.
shp ArcGIS region
30 DVRPC_LandUse_2000 (private)
DVRPC shp ArcGIS region
31 DVRPC_LandUse_2005 (private)
DVRPC shp ArcGIS region
32 Phila_LandUse_2016 (private)
DVRPC shp ArcGIS city
33 CRASH_Pennsylvania (private)
DVRPC CDART Pennsylvania Crash Data 2012-2017 CDART Pennsylvania Crash Data 2012-2017
shp ArcGIS PA
34 PA_Centerline (private)
DVRPC Pennsylvania Centerlines 2015 TomTom network in Pennsylvania. Due to it containing licenced commercial data, this dataset cannot be distributed to any county/member government outside of the state of Pennsylvania.
shp ArcGIS PA
35 PADOT_LRS (private)
DVRPC Road segment inventory (RMSSEG) is part of PennDOT's Roadway Management System (RMS) and contains location and physical characteristics of road segment. RMS is constantly being updated due to highway construction, new housing developments being established, state roadways being relocated, and correcting anomalies in the database. However, changes to the RMS database are refreshed in GIS on a weekly basis. For more information on this layer, visit http://pennshare.maps.arcgis.co
shp ArcGIS PA
38
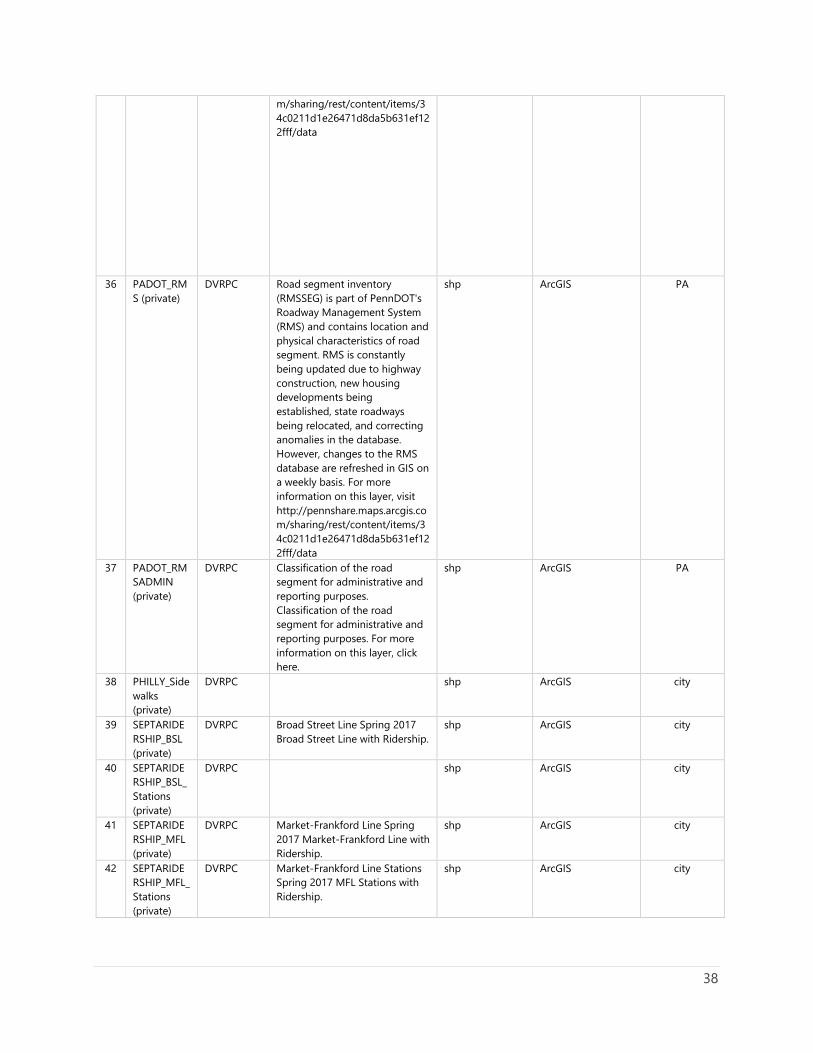
m/sharing/rest/content/items/34c0211d1e26471d8da5b631ef122fff/data
36 PADOT_RMS (private)
DVRPC Road segment inventory (RMSSEG) is part of PennDOT's Roadway Management System (RMS) and contains location and physical characteristics of road segment. RMS is constantly being updated due to highway construction, new housing developments being established, state roadways being relocated, and correcting anomalies in the database. However, changes to the RMS database are refreshed in GIS on a weekly basis. For more information on this layer, visit http://pennshare.maps.arcgis.com/sharing/rest/content/items/34c0211d1e26471d8da5b631ef122fff/data
shp ArcGIS PA
37 PADOT_RMSADMIN (private)
DVRPC Classification of the road segment for administrative and reporting purposes. Classification of the road segment for administrative and reporting purposes. For more information on this layer, click here.
shp ArcGIS PA
38 PHILLY_Sidewalks (private)
DVRPC shp ArcGIS city
39 SEPTARIDERSHIP_BSL (private)
DVRPC Broad Street Line Spring 2017 Broad Street Line with Ridership.
shp ArcGIS city
40 SEPTARIDERSHIP_BSL_Stations (private)
DVRPC shp ArcGIS city
41 SEPTARIDERSHIP_MFL (private)
DVRPC Market-Frankford Line Spring 2017 Market-Frankford Line with Ridership.
shp ArcGIS city
42 SEPTARIDERSHIP_MFL_Stations (private)
DVRPC Market-Frankford Line Stations Spring 2017 MFL Stations with Ridership.
shp ArcGIS city
39
43 SEPTARIDERSHIP_NHSL (private)
DVRPC Norristown Highspeed Line Spring 2017 Norristown Highspeed Line with Ridership.
shp ArcGIS city
44 SEPTARIDERSHIP_NHSL_Stations (private)
DVRPC shp ArcGIS city
45 SEPTARIDERSHIP_Rail_Station (private)
DVRPC Regional Rail Stations Spring 2017 Regional Rail Stations with Ridership.
shp ArcGIS city
46 SEPTARIDERSHIP_Regional_Rail (private)
DVRPC Regional Rail Lines Spring 2017 Regional Rail Lines with Ridership.
shp ArcGIS city
47 SEPTARIDERSHIP_Trolley_Routes (private)
DVRPC Trolley Routes Spring 2017 Trolley Routes with Ridership.
shp ArcGIS city
48 SEPTARIDERSHIP_Trolley_Stops (private)
DVRPC shp ArcGIS city
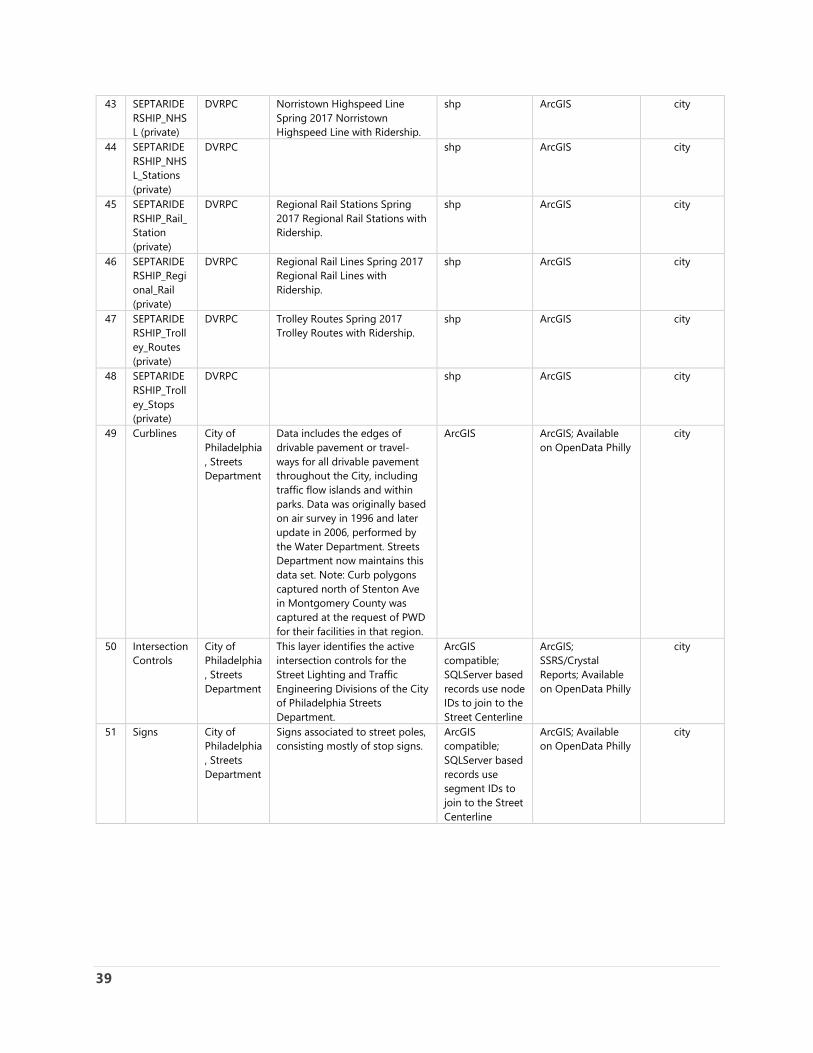
49 Curblines City of Philadelphia, Streets Department
Data includes the edges of drivable pavement or travel-ways for all drivable pavement throughout the City, including traffic flow islands and within parks. Data was originally based on air survey in 1996 and later update in 2006, performed by the Water Department. Streets Department now maintains this data set. Note: Curb polygons captured north of Stenton Ave in Montgomery County was captured at the request of PWD for their facilities in that region.
ArcGIS ArcGIS; Available on OpenData Philly
city
50 Intersection Controls
City of Philadelphia, Streets Department
This layer identifies the active intersection controls for the Street Lighting and Traffic Engineering Divisions of the City of Philadelphia Streets Department.
ArcGIS compatible; SQLServer based records use node IDs to join to the Street Centerline
ArcGIS; SSRS/Crystal Reports; Available on OpenData Philly
city
51 Signs City of Philadelphia, Streets Department
Signs associated to street poles, consisting mostly of stop signs.
ArcGIS compatible; SQLServer based records use segment IDs to join to the Street Centerline
ArcGIS; Available on OpenData Philly
city
40
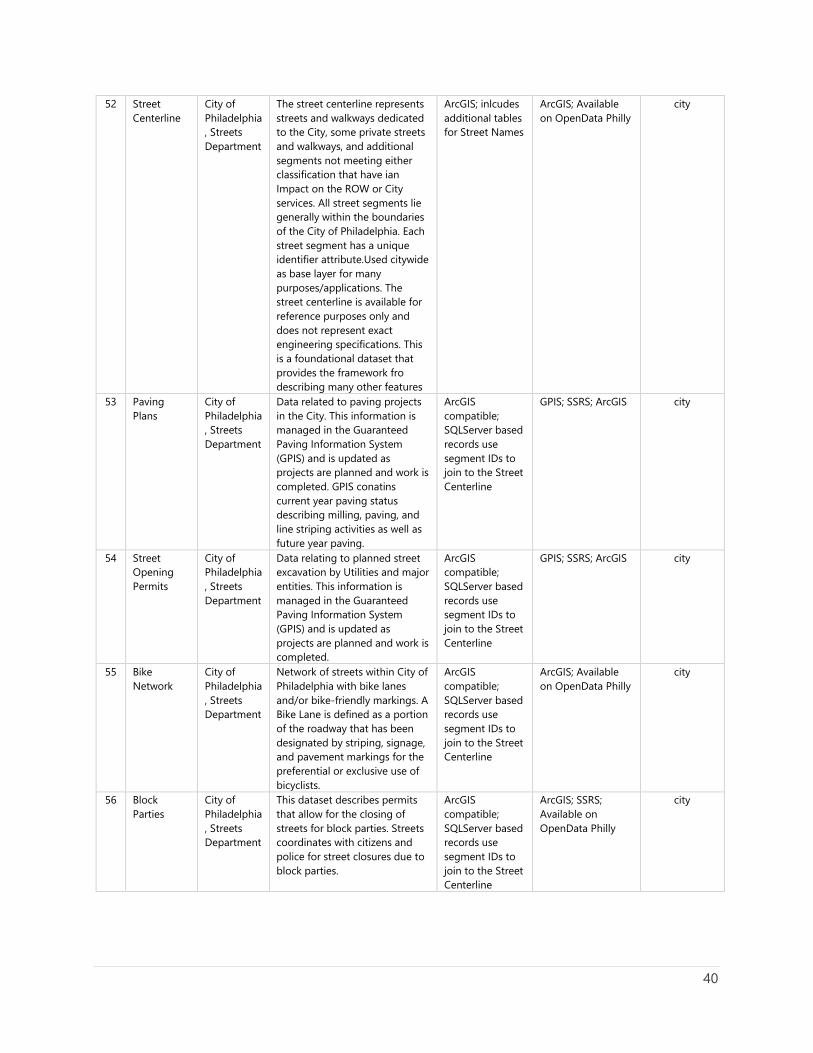
52 Street Centerline
City of Philadelphia, Streets Department
The street centerline represents streets and walkways dedicated to the City, some private streets and walkways, and additional segments not meeting either classification that have ian Impact on the ROW or City services. All street segments lie generally within the boundaries of the City of Philadelphia. Each street segment has a unique identifier attribute.Used citywide as base layer for many purposes/applications. The street centerline is available for reference purposes only and does not represent exact engineering specifications. This is a foundational dataset that provides the framework fro describing many other features
ArcGIS; inlcudes additional tables for Street Names
ArcGIS; Available on OpenData Philly
city
53 Paving Plans
City of Philadelphia, Streets Department
Data related to paving projects in the City. This information is managed in the Guaranteed Paving Information System (GPIS) and is updated as projects are planned and work is completed. GPIS conatins current year paving status describing milling, paving, and line striping activities as well as future year paving.
ArcGIS compatible; SQLServer based records use segment IDs to join to the Street Centerline
GPIS; SSRS; ArcGIS city
54 Street Opening Permits
City of Philadelphia, Streets Department
Data relating to planned street excavation by Utilities and major entities. This information is managed in the Guaranteed Paving Information System (GPIS) and is updated as projects are planned and work is completed.
ArcGIS compatible; SQLServer based records use segment IDs to join to the Street Centerline
GPIS; SSRS; ArcGIS city
55 Bike Network
City of Philadelphia, Streets Department
Network of streets within City of Philadelphia with bike lanes and/or bike-friendly markings. A Bike Lane is defined as a portion of the roadway that has been designated by striping, signage, and pavement markings for the preferential or exclusive use of bicyclists.
ArcGIS compatible; SQLServer based records use segment IDs to join to the Street Centerline
ArcGIS; Available on OpenData Philly
city
56 Block Parties
City of Philadelphia, Streets Department
This dataset describes permits that allow for the closing of streets for block parties. Streets coordinates with citizens and police for street closures due to block parties.
ArcGIS compatible; SQLServer based records use segment IDs to join to the Street Centerline
ArcGIS; SSRS; Available on OpenData Philly
city
41
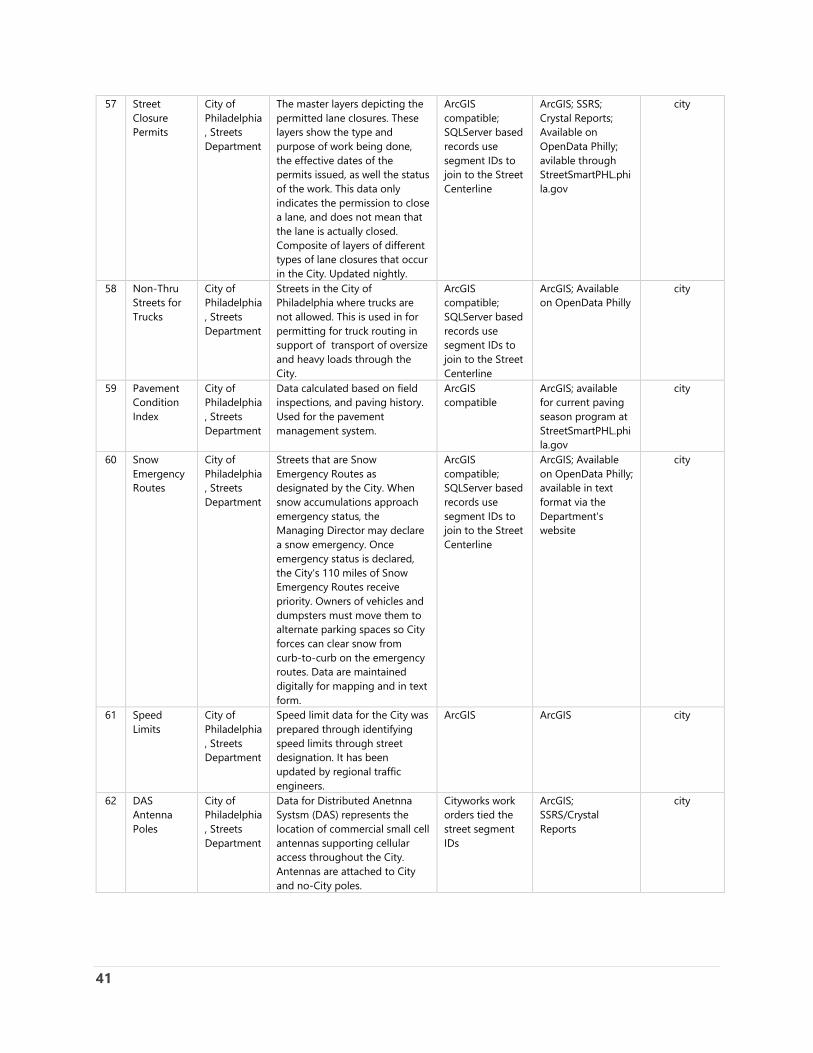
57 Street Closure Permits
City of Philadelphia, Streets Department
The master layers depicting the permitted lane closures. These layers show the type and purpose of work being done, the effective dates of the permits issued, as well the status of the work. This data only indicates the permission to close a lane, and does not mean that the lane is actually closed. Composite of layers of different types of lane closures that occur in the City. Updated nightly.
ArcGIS compatible; SQLServer based records use segment IDs to join to the Street Centerline
ArcGIS; SSRS; Crystal Reports; Available on OpenData Philly; avilable through StreetSmartPHL.phila.gov
city
58 Non-Thru Streets for Trucks
City of Philadelphia, Streets Department
Streets in the City of Philadelphia where trucks are not allowed. This is used in for permitting for truck routing in support of transport of oversize and heavy loads through the City.
ArcGIS compatible; SQLServer based records use segment IDs to join to the Street Centerline
ArcGIS; Available on OpenData Philly
city
59 Pavement Condition Index
City of Philadelphia, Streets Department
Data calculated based on field inspections, and paving history. Used for the pavement management system.
ArcGIS compatible
ArcGIS; available for current paving season program at StreetSmartPHL.phila.gov
city
60 Snow Emergency Routes
City of Philadelphia, Streets Department
Streets that are Snow Emergency Routes as designated by the City. When snow accumulations approach emergency status, the Managing Director may declare a snow emergency. Once emergency status is declared, the City's 110 miles of Snow Emergency Routes receive priority. Owners of vehicles and dumpsters must move them to alternate parking spaces so City forces can clear snow from curb-to-curb on the emergency routes. Data are maintained digitally for mapping and in text form.
ArcGIS compatible; SQLServer based records use segment IDs to join to the Street Centerline
ArcGIS; Available on OpenData Philly; available in text format via the Department's website
city
61 Speed Limits
City of Philadelphia, Streets Department
Speed limit data for the City was prepared through identifying speed limits through street designation. It has been updated by regional traffic engineers.
ArcGIS ArcGIS city
62 DAS Antenna Poles
City of Philadelphia, Streets Department
Data for Distributed Anetnna Systsm (DAS) represents the location of commercial small cell antennas supporting cellular access throughout the City. Antennas are attached to City and no-City poles.
Cityworks work orders tied the street segment IDs
ArcGIS; SSRS/Crystal Reports
city
42
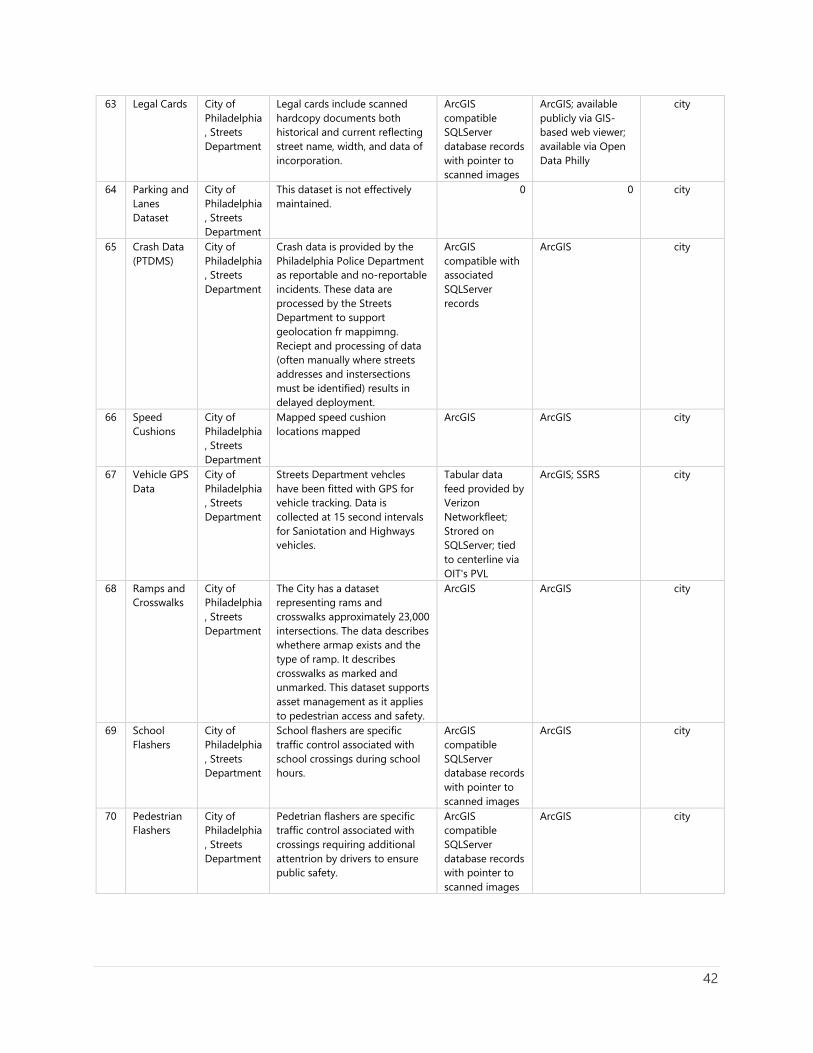
63 Legal Cards City of Philadelphia, Streets Department
Legal cards include scanned hardcopy documents both historical and current reflecting street name, width, and data of incorporation.
ArcGIS compatible SQLServer database records with pointer to scanned images
ArcGIS; available publicly via GIS-based web viewer; available via Open Data Philly
city
64 Parking and Lanes Dataset
City of Philadelphia, Streets Department
This dataset is not effectively maintained.
0 0 city
65 Crash Data (PTDMS)
City of Philadelphia, Streets Department
Crash data is provided by the Philadelphia Police Department as reportable and no-reportable incidents. These data are processed by the Streets Department to support geolocation fr mappimng. Reciept and processing of data (often manually where streets addresses and instersections must be identified) results in delayed deployment.
ArcGIS compatible with associated SQLServer records
ArcGIS city
66 Speed Cushions
City of Philadelphia, Streets Department
Mapped speed cushion locations mapped
ArcGIS ArcGIS city
67 Vehicle GPS Data
City of Philadelphia, Streets Department
Streets Department vehcles have been fitted with GPS for vehicle tracking. Data is collected at 15 second intervals for Saniotation and Highways vehicles.
Tabular data feed provided by Verizon Networkfleet; Strored on SQLServer; tied to centerline via OIT's PVL
ArcGIS; SSRS city
68 Ramps and Crosswalks
City of Philadelphia, Streets Department
The City has a dataset representing rams and crosswalks approximately 23,000 intersections. The data describes whethere armap exists and the type of ramp. It describes crosswalks as marked and unmarked. This dataset supports asset management as it applies to pedestrian access and safety.
ArcGIS ArcGIS city
69 School Flashers
City of Philadelphia, Streets Department
School flashers are specific traffic control associated with school crossings during school hours.
ArcGIS compatible SQLServer database records with pointer to scanned images
ArcGIS city
70 Pedestrian Flashers
City of Philadelphia, Streets Department
Pedetrian flashers are specific traffic control associated with crossings requiring additional attentrion by drivers to ensure public safety.
ArcGIS compatible SQLServer database records with pointer to scanned images
ArcGIS city
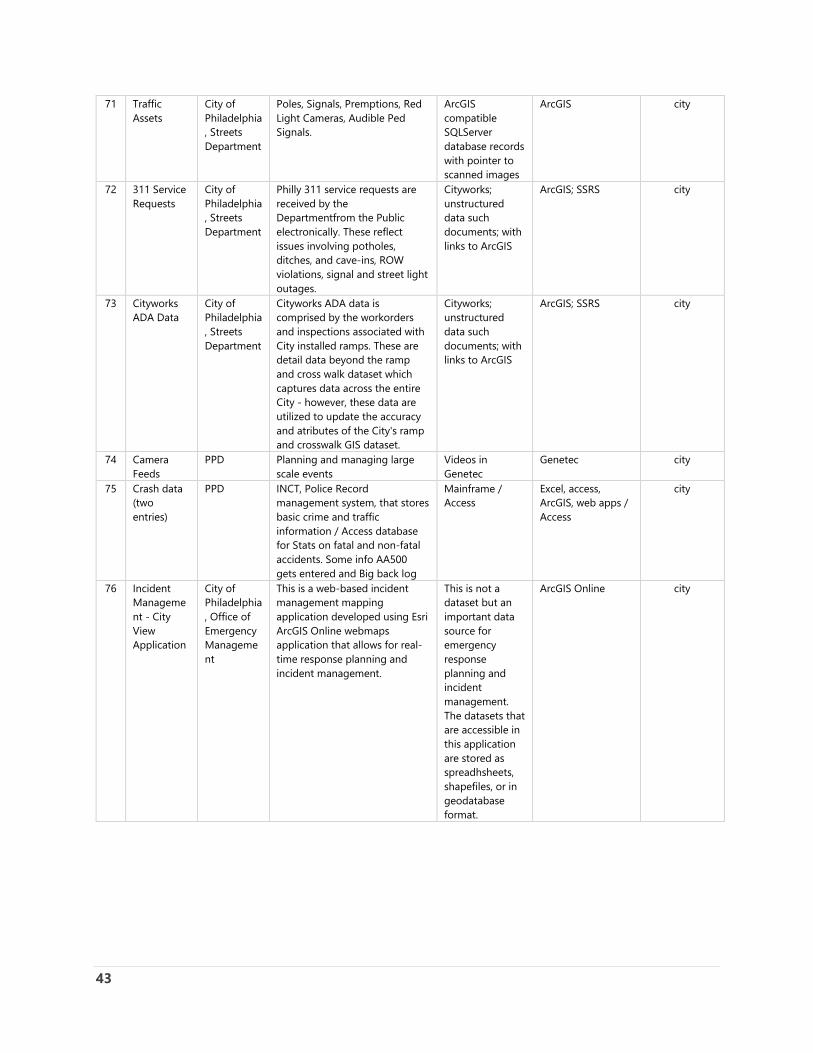
43
71 Traffic Assets
City of Philadelphia, Streets Department
Poles, Signals, Premptions, Red Light Cameras, Audible Ped Signals.
ArcGIS compatible SQLServer database records with pointer to scanned images
ArcGIS city
72 311 Service Requests
City of Philadelphia, Streets Department
Philly 311 service requests are received by the Departmentfrom the Public electronically. These reflect issues involving potholes, ditches, and cave-ins, ROW violations, signal and street light outages.
Cityworks; unstructured data such documents; with links to ArcGIS
ArcGIS; SSRS city
73 Cityworks ADA Data
City of Philadelphia, Streets Department
Cityworks ADA data is comprised by the workorders and inspections associated with City installed ramps. These are detail data beyond the ramp and cross walk dataset which captures data across the entire City - however, these data are utilized to update the accuracy and atributes of the City's ramp and crosswalk GIS dataset.
Cityworks; unstructured data such documents; with links to ArcGIS
ArcGIS; SSRS city
74 Camera Feeds
PPD Planning and managing large scale events
Videos in Genetec
Genetec city
75 Crash data (two entries)
PPD INCT, Police Record management system, that stores basic crime and traffic information / Access database for Stats on fatal and non-fatal accidents. Some info AA500 gets entered and Big back log
Mainframe / Access
Excel, access, ArcGIS, web apps / Access
city
76 Incident Management - City View Application
City of Philadelphia, Office of Emergency Management
This is a web-based incident management mapping application developed using Esri ArcGIS Online webmaps application that allows for real-time response planning and incident management.
This is not a dataset but an important data source for emergency response planning and incident management. The datasets that are accessible in this application are stored as spreadhsheets, shapefiles, or in geodatabase format.
ArcGIS Online city
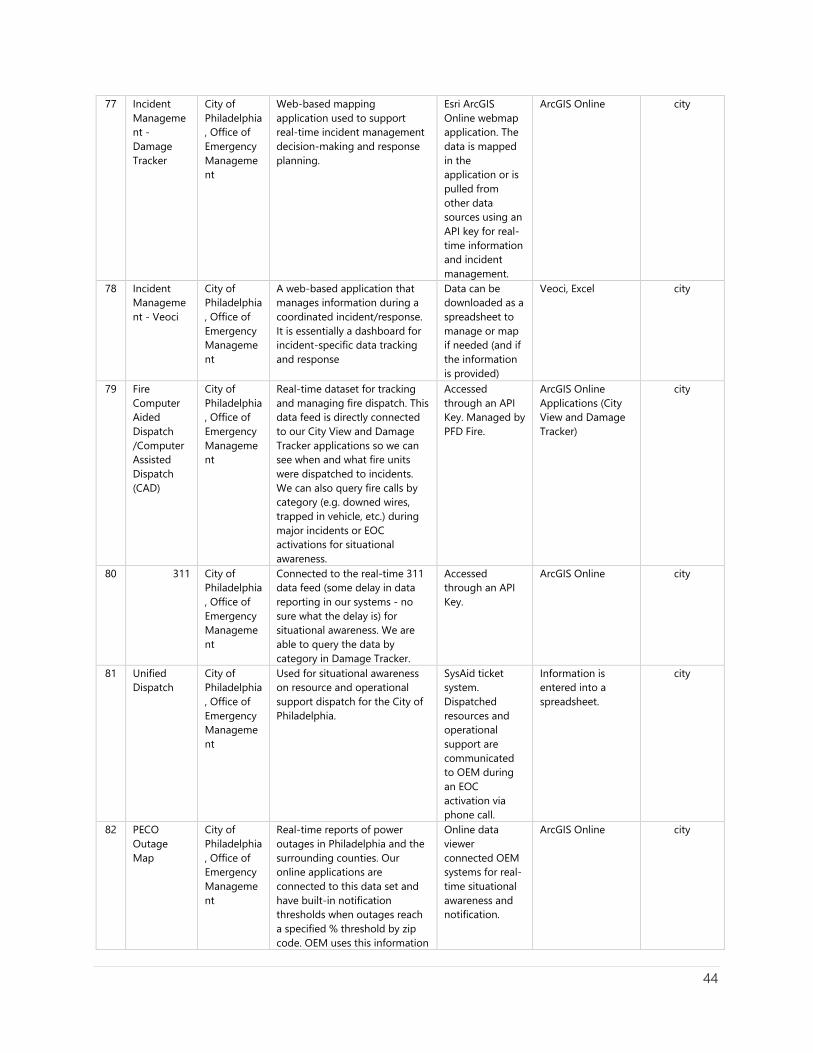
44
77 Incident Management - Damage Tracker
City of Philadelphia, Office of Emergency Management
Web-based mapping application used to support real-time incident management decision-making and response planning.
Esri ArcGIS Online webmap application. The data is mapped in the application or is pulled from other data sources using an API key for real-time information and incident management.
ArcGIS Online city
78 Incident Management - Veoci
City of Philadelphia, Office of Emergency Management
A web-based application that manages information during a coordinated incident/response. It is essentially a dashboard for incident-specific data tracking and response
Data can be downloaded as a spreadsheet to manage or map if needed (and if the information is provided)
Veoci, Excel city
79 Fire Computer Aided Dispatch /Computer Assisted Dispatch (CAD)
City of Philadelphia, Office of Emergency Management
Real-time dataset for tracking and managing fire dispatch. This data feed is directly connected to our City View and Damage Tracker applications so we can see when and what fire units were dispatched to incidents. We can also query fire calls by category (e.g. downed wires, trapped in vehicle, etc.) during major incidents or EOC activations for situational awareness.
Accessed through an API Key. Managed by PFD Fire.
ArcGIS Online Applications (City View and Damage Tracker)
city
80 311 City of Philadelphia, Office of Emergency Management
Connected to the real-time 311 data feed (some delay in data reporting in our systems - no sure what the delay is) for situational awareness. We are able to query the data by category in Damage Tracker.
Accessed through an API Key.
ArcGIS Online city
81 Unified Dispatch
City of Philadelphia, Office of Emergency Management
Used for situational awareness on resource and operational support dispatch for the City of Philadelphia.
SysAid ticket system. Dispatched resources and operational support are communicated to OEM during an EOC activation via phone call.
Information is entered into a spreadsheet.
city
82 PECO Outage Map
City of Philadelphia, Office of Emergency Management
Real-time reports of power outages in Philadelphia and the surrounding counties. Our online applications are connected to this data set and have built-in notification thresholds when outages reach a specified % threshold by zip code. OEM uses this information
Online data viewer connected OEM systems for real-time situational awareness and notification.
ArcGIS Online city
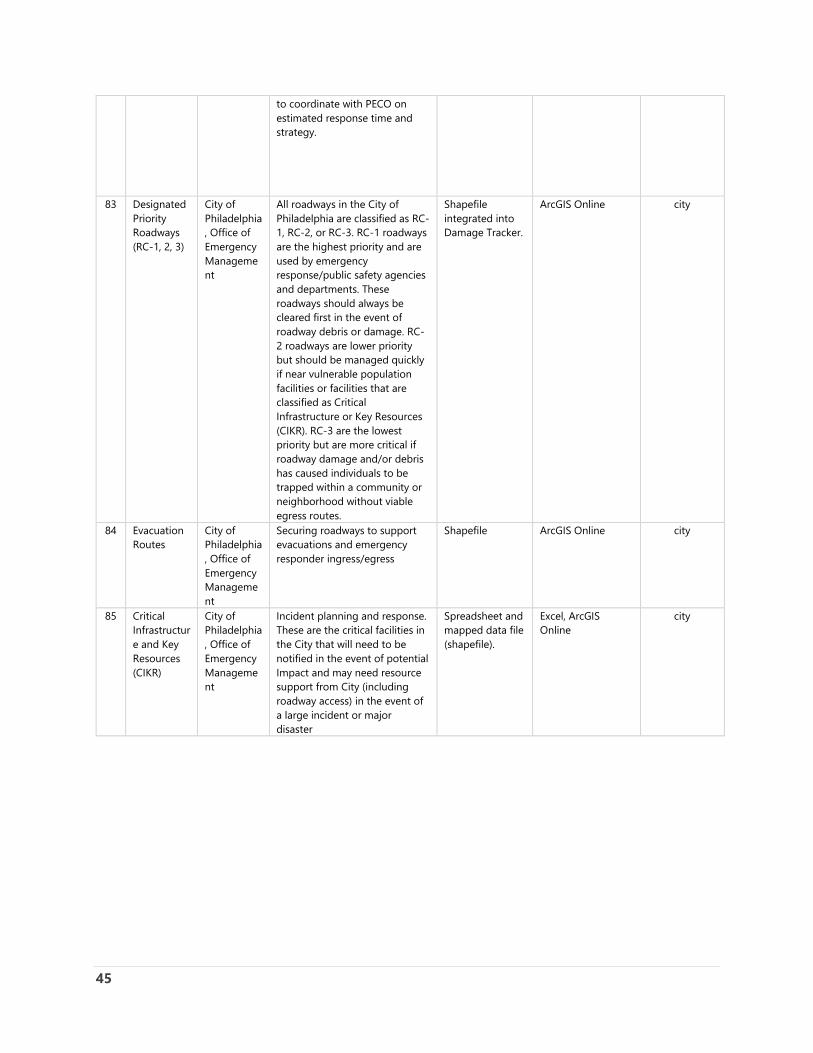
45
to coordinate with PECO on estimated response time and strategy.
83 Designated Priority Roadways (RC-1, 2, 3)
City of Philadelphia, Office of Emergency Management
All roadways in the City of Philadelphia are classified as RC-1, RC-2, or RC-3. RC-1 roadways are the highest priority and are used by emergency response/public safety agencies and departments. These roadways should always be cleared first in the event of roadway debris or damage. RC-2 roadways are lower priority but should be managed quickly if near vulnerable population facilities or facilities that are classified as Critical Infrastructure or Key Resources (CIKR). RC-3 are the lowest priority but are more critical if roadway damage and/or debris has caused individuals to be trapped within a community or neighborhood without viable egress routes.
Shapefile integrated into Damage Tracker.
ArcGIS Online city
84 Evacuation Routes
City of Philadelphia, Office of Emergency Management
Securing roadways to support evacuations and emergency responder ingress/egress
Shapefile ArcGIS Online city
85 Critical Infrastructure and Key Resources (CIKR)
City of Philadelphia, Office of Emergency Management
Incident planning and response. These are the critical facilities in the City that will need to be notified in the event of potential Impact and may need resource support from City (including roadway access) in the event of a large incident or major disaster
Spreadsheet and mapped data file (shapefile).
Excel, ArcGIS Online
city
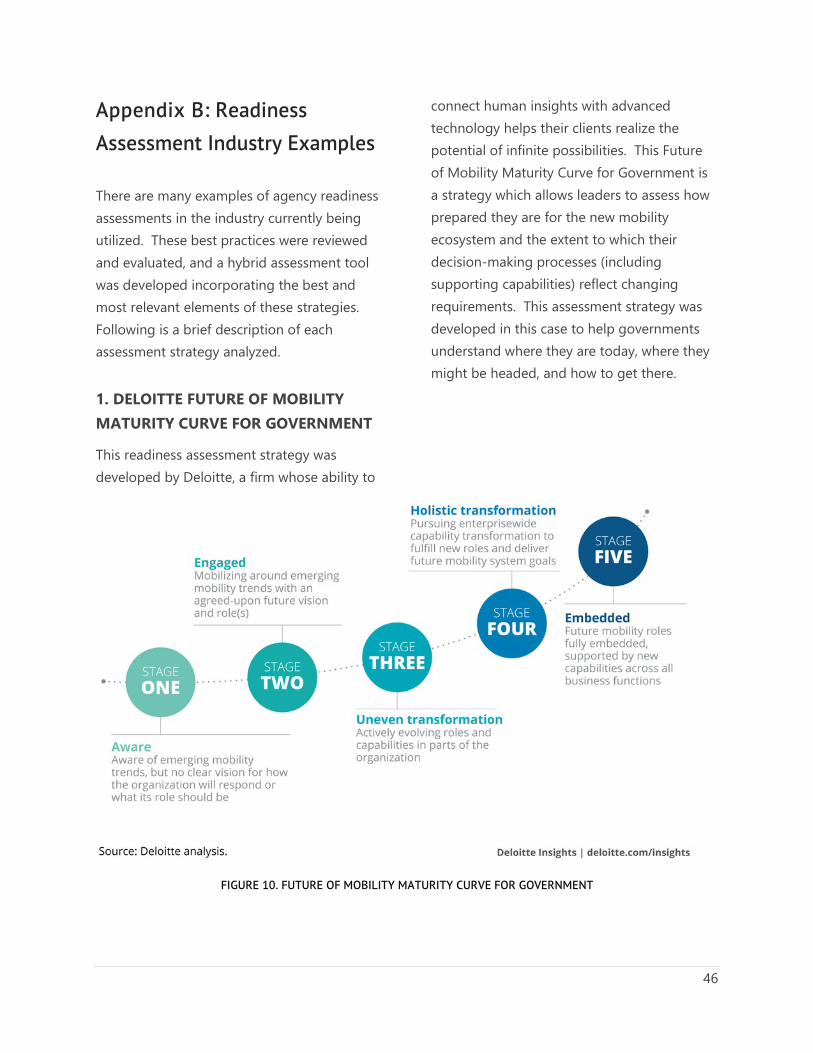
46
Appendix B: Readiness Assessment Industry Examples
There are many examples of agency readiness assessments in the industry currently being utilized. These best practices were reviewed and evaluated, and a hybrid assessment tool was developed incorporating the best and most relevant elements of these strategies. Following is a brief description of each assessment strategy analyzed.
1. DELOITTE FUTURE OF MOBILITY MATURITY CURVE FOR GOVERNMENT
This readiness assessment strategy was developed by Deloitte, a firm whose ability to
connect human insights with advanced technology helps their clients realize the potential of infinite possibilities. This Future of Mobility Maturity Curve for Government is a strategy which allows leaders to assess how prepared they are for the new mobility ecosystem and the extent to which their decision-making processes (including supporting capabilities) reflect changing requirements. This assessment strategy was developed in this case to help governments understand where they are today, where they might be headed, and how to get there.
FIGURE 10. FUTURE OF MOBILITY MATURITY CURVE FOR GOVERNMENT
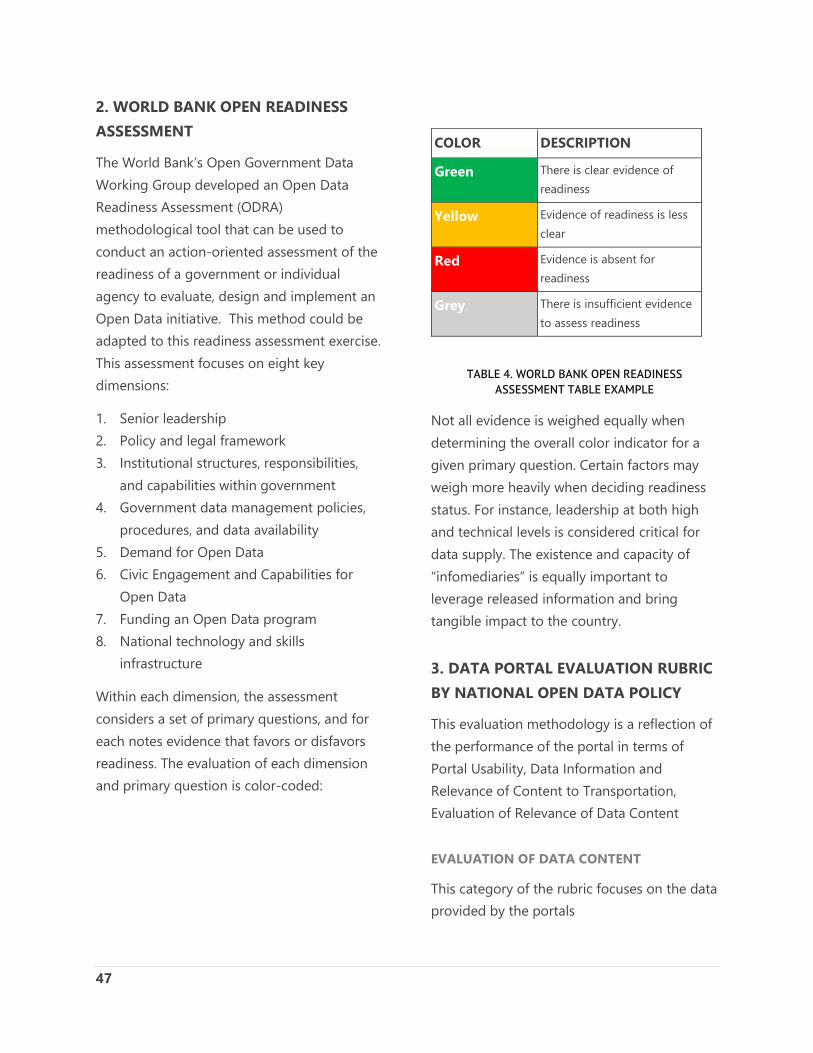
47
2. WORLD BANK OPEN READINESS ASSESSMENT
The World Bank’s Open Government Data Working Group developed an Open Data Readiness Assessment (ODRA) methodological tool that can be used to conduct an action-oriented assessment of the readiness of a government or individual agency to evaluate, design and implement an Open Data initiative. This method could be adapted to this readiness assessment exercise. This assessment focuses on eight key dimensions:
1. Senior leadership 2. Policy and legal framework 3. Institutional structures, responsibilities,
and capabilities within government 4. Government data management policies,
procedures, and data availability 5. Demand for Open Data 6. Civic Engagement and Capabilities for
Open Data 7. Funding an Open Data program 8. National technology and skills
infrastructure
Within each dimension, the assessment considers a set of primary questions, and for each notes evidence that favors or disfavors readiness. The evaluation of each dimension and primary question is color-coded:
COLOR DESCRIPTION
Green There is clear evidence of readiness
Yellow Evidence of readiness is less clear
Red Evidence is absent for readiness
Grey There is insufficient evidence to assess readiness
TABLE 4. WORLD BANK OPEN READINESS ASSESSMENT TABLE EXAMPLE
Not all evidence is weighed equally when determining the overall color indicator for a given primary question. Certain factors may weigh more heavily when deciding readiness status. For instance, leadership at both high and technical levels is considered critical for data supply. The existence and capacity of “infomediaries” is equally important to leverage released information and bring tangible impact to the country.
3. DATA PORTAL EVALUATION RUBRIC BY NATIONAL OPEN DATA POLICY
This evaluation methodology is a reflection of the performance of the portal in terms of Portal Usability, Data Information and Relevance of Content to Transportation, Evaluation of Relevance of Data Content
EVALUATION OF DATA CONTENT
This category of the rubric focuses on the data provided by the portals
48
• DATA FORMATS: Data must be published publicly without any restrictions and should be available in accessible and non-proprietary formats such as CSV, KML, SHP, XML, PDF, XLS etc
• DATA DESCRIPTION: Data should be described clearly in terms of the attributes, metadata and details of data owner or publisher. Data dictionary clearly defines the attributes and the values it can assume. This specific information must be provided uniformly for every dataset in the portal to provide a clear understanding to the userData Characteristics
• DATA CHARACTERISTICS: Information about the data in terms of update frequency, temporal and spatial characteristics are essential for cleaning and analyzing the data. Update frequency informs the user about how frequently the data is updated. Temporal Coverage is defined as the time period in which the data was collected or is applicable. Temporal resolution provides the smallest time interval in which the data was collected. Spatial Coverage is defined as the geographical area covered in the dataset, this can be at city, county or state level. Spatial Resolution is the smallest geographic unit used for data collected.
• DATA PERFORMANCE: Provision of good quality data is highly essential for its effective use. To evaluate this we designed features, Views or Downloads of dataset, Accuracy report of data and Completeness of data.
• LEGAL PROVISIONS: Although the data is provided openly, it is imperative to comply with certain terms and conditions. These
are referred to in the terms of a license. Creative Commons is a popular license used by open data publishers which protects the copyrights of the owner of the data. It allows for openness in distribution and reuse, on the condition that the owners are attributed for in such acts.
EVALUATION OF DATA PORTAL
• EASE OF USAGE: This category aims to evaluate the convenience of using the data portal. Search bars are an important tool which enables a user-friendly data portal by saving time and helping the user easily find data.
• ACCESSIBILITY: This refers to the different forms by which data can be accessed. Data can be previewed at the website or downloaded in various formats. Some portals also provide tools to filter datasets with some including an additional feature to download filtered datasets which will include only the required data.
• INTERACTIVE VISUALIZATION: Data visualization is an important aspect of analyzing data. This can be achieved through visualization tools such as maps, bar charts, pie charts or line charts
• STATISTICAL TOOLS: The option to filter the data helps the user focus on specific data attributes that suits their interest.
• APPLICATION DEVELOPERS TOOL: The biggest advantage of the open data portals is for developers, researchers and others who use this data to foster innovation. An important tool for this is a
49
well-documented portal which has Application Program Interface (API) guide as well as an API Query tool which provides a platform to raise queries, filter and aggregate data.
• THE NUMBER OF TRANSPORTATION DATASETS: The use of this parameter is to highlight the need for more transportation datasets which would drive the publishers to provide more transportation data
• FEEDBACK: Active participation is encouraged and providing the ability to give feedback or comment sections will allow users to critique the datasets or suggest additional categories of datasets.
FUNDAMENTAL PRINCIPLES FOR OPEN GOVERNMENT DATA SEBASTOPOL, CALIFORNIA
30 open government advocates gathered to develop a set of principles of open government data. The meeting, held in Sebastopol, California, was designed to develop a more robust understanding of why open government data is essential to democracy.
The Internet is the public space of the modern world, and through it governments now have the opportunity to better understand the needs of their citizens and citizens may participate more fully in their government. Information becomes more valuable as it is shared, less valuable as it is hoarded. Open data promotes increased civil discourse,
improved public welfare, and a more efficient use of public resources.
The group is offering a set of fundamental principles for open government data. By embracing the eight principles, governments of the world can become more effective, transparent, and relevant to our lives.
OPEN GOVERNMENT DATA PRINCIPLES
Government data shall be considered open if it is made public in a way that complies with the principles below:
1. COMPLETE
All public data is made available. Public data is data that is not subject to valid privacy, security or privilege limitations.
2. PRIMARY
Data is as collected at the source, with the highest possible level of granularity, not in aggregate or modified forms.
3. TIMELY
Data is made available as quickly as necessary to preserve the value of the data.
4. ACCESSIBLE
Data is available to the widest range of users for the widest range of purposes.
5. MACHINE PROCESSABLE
Data is reasonably structured to allow automated processing.
6. NON-DISCRIMINATORY
Data is available to anyone, with no requirement of registration.
7. NON-PROPRIETARY
50
Data is available in a format over which no entity has exclusive control.
8. LICENSE-FREE
Data is not subject to any copyright, patent, trademark or trade secret regulation. Reasonable privacy, security and privilege restrictions may be allowed.
WORLD WIDE WEB FOUNDATION
The World Wide Web Foundation and The Governance Lab at NYU, a group of open data assessment experts, explored the development of common methods and frameworks for the study of open data
THE FRAMEWORK AT A GLANCE
In assessing open data activities, projects may look at:
1. CONTEXT/ENVIRONMENT
The context within which open data is being provided. This might be the national context in the case of central Open Government Data, or might be the context in a particular sector. Important aspects of the environment to assess include the legal and regulatory environment; organizational context; political will & leadership; technical capacity; the wider social environment, in terms of civil society and political freedoms; and the commercial environment and capacity of firms to engage with open data.
2. DATA
The nature and qualities of open datasets. Including the legal, technical, practical and social openness of data, and issues of data relevance and quality. The framework also looks to identify core categories of data which might be evaluated in assessments.
3. USE
The context of use of the open dataset. Includes the category of users accessing (or providing) the dataset, the purposes for which the data will be used, and the activities being undertaken. This part of the framework addresses the who, what and why of open data programs.
4. IMPACT
The benefits to be gained from using the open dataset. Potential benefits can be studied according to social, environmental, political/governance, and economic/commercial dimensions.
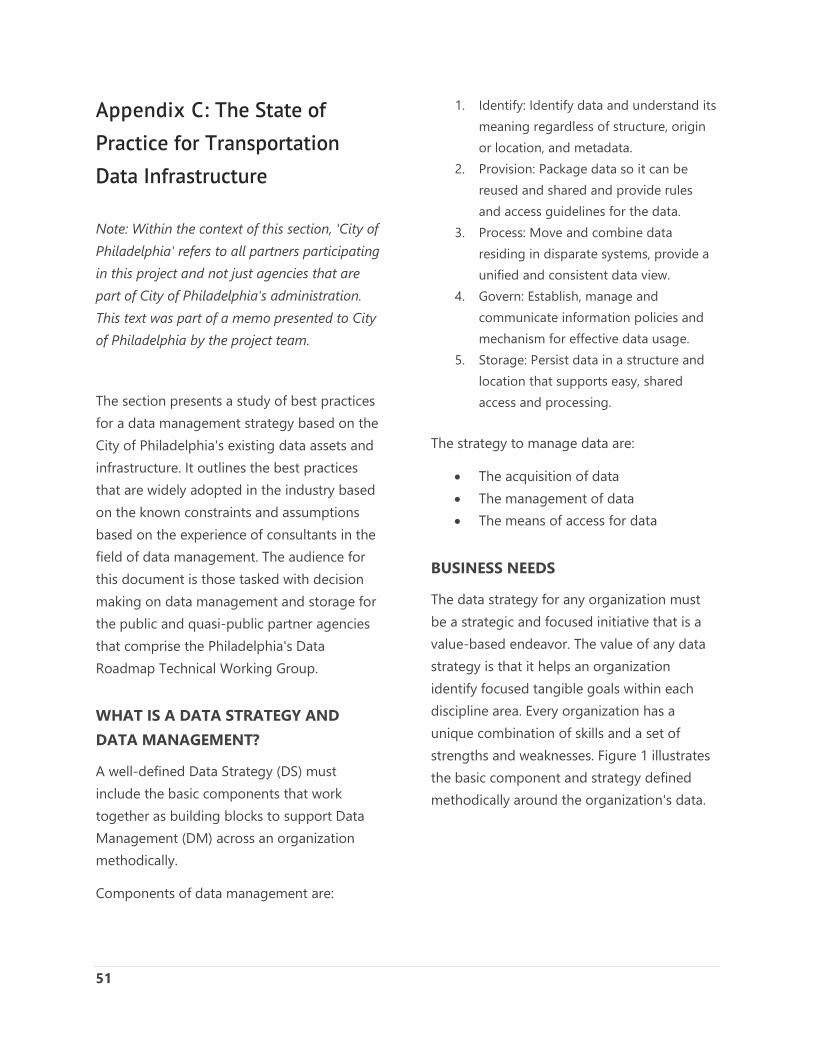
51
Appendix C: The State of Practice for Transportation Data Infrastructure
Note: Within the context of this section, 'City of Philadelphia' refers to all partners participating in this project and not just agencies that are part of City of Philadelphia's administration. This text was part of a memo presented to City of Philadelphia by the project team.
The section presents a study of best practices for a data management strategy based on the City of Philadelphia's existing data assets and infrastructure. It outlines the best practices that are widely adopted in the industry based on the known constraints and assumptions based on the experience of consultants in the field of data management. The audience for this document is those tasked with decision making on data management and storage for the public and quasi-public partner agencies that comprise the Philadelphia's Data Roadmap Technical Working Group.
WHAT IS A DATA STRATEGY AND DATA MANAGEMENT?
A well-defined Data Strategy (DS) must include the basic components that work together as building blocks to support Data Management (DM) across an organization methodically.
Components of data management are:
1. Identify: Identify data and understand its meaning regardless of structure, origin or location, and metadata.
2. Provision: Package data so it can be reused and shared and provide rules and access guidelines for the data.
3. Process: Move and combine data residing in disparate systems, provide a unified and consistent data view.
4. Govern: Establish, manage and communicate information policies and mechanism for effective data usage.
5. Storage: Persist data in a structure and location that supports easy, shared access and processing.
The strategy to manage data are:
• The acquisition of data • The management of data • The means of access for data
BUSINESS NEEDS
The data strategy for any organization must be a strategic and focused initiative that is a value-based endeavor. The value of any data strategy is that it helps an organization identify focused tangible goals within each discipline area. Every organization has a unique combination of skills and a set of strengths and weaknesses. Figure 1 illustrates the basic component and strategy defined methodically around the organization's data.
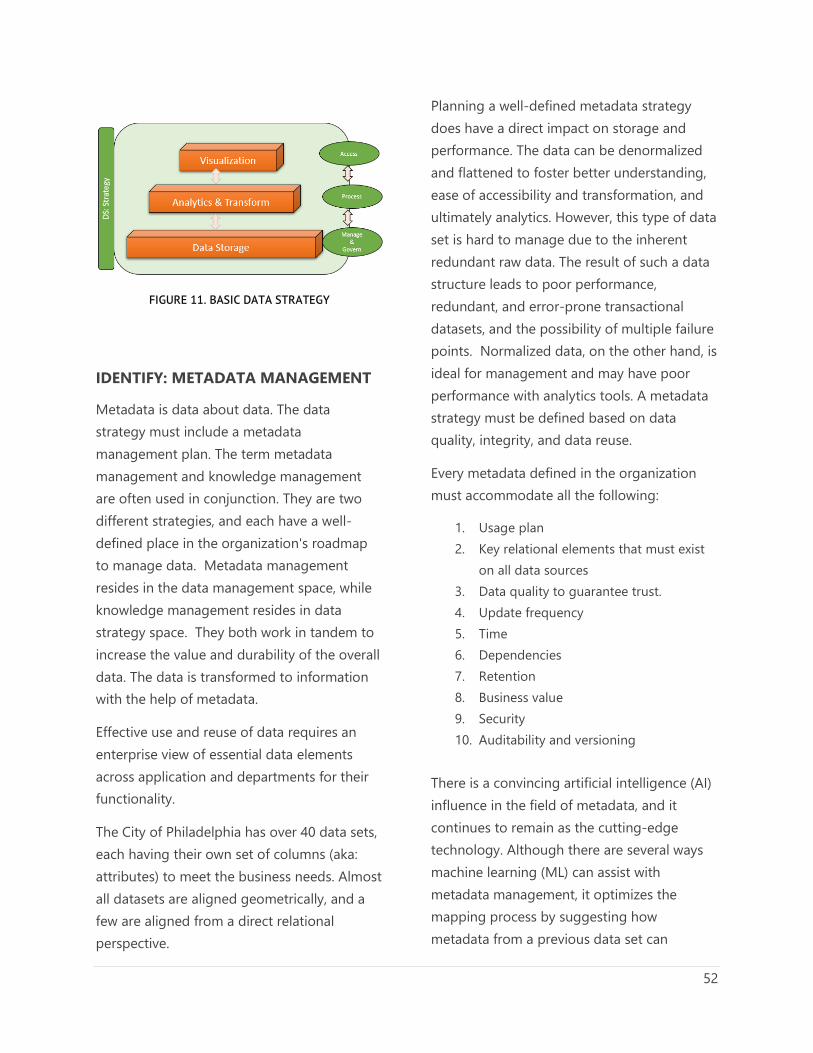
52
FIGURE 11. BASIC DATA STRATEGY
IDENTIFY: METADATA MANAGEMENT
Metadata is data about data. The data strategy must include a metadata management plan. The term metadata management and knowledge management are often used in conjunction. They are two different strategies, and each have a well-defined place in the organization's roadmap to manage data. Metadata management resides in the data management space, while knowledge management resides in data strategy space. They both work in tandem to increase the value and durability of the overall data. The data is transformed to information with the help of metadata.
Effective use and reuse of data requires an enterprise view of essential data elements across application and departments for their functionality.
The City of Philadelphia has over 40 data sets, each having their own set of columns (aka: attributes) to meet the business needs. Almost all datasets are aligned geometrically, and a few are aligned from a direct relational perspective.
Planning a well-defined metadata strategy does have a direct impact on storage and performance. The data can be denormalized and flattened to foster better understanding, ease of accessibility and transformation, and ultimately analytics. However, this type of data set is hard to manage due to the inherent redundant raw data. The result of such a data structure leads to poor performance, redundant, and error-prone transactional datasets, and the possibility of multiple failure points. Normalized data, on the other hand, is ideal for management and may have poor performance with analytics tools. A metadata strategy must be defined based on data quality, integrity, and data reuse.
Every metadata defined in the organization must accommodate all the following:
1. Usage plan 2. Key relational elements that must exist
on all data sources 3. Data quality to guarantee trust. 4. Update frequency 5. Time 6. Dependencies 7. Retention 8. Business value 9. Security 10. Auditability and versioning
There is a convincing artificial intelligence (AI) influence in the field of metadata, and it continues to remain as the cutting-edge technology. Although there are several ways machine learning (ML) can assist with metadata management, it optimizes the mapping process by suggesting how metadata from a previous data set can
53
streamline efforts for similar ones. The City can employ an optimized machine learning strategy as part of the data management plan to identify and recommend for the business owner's decision. There are several knowledge management products available in the industry with ML and AI capabilities. The need for ML / AI-based product for Metadata management is not well established based on the City's data topology and volume. We recommend implementing metadata through well-defined governance along with engaging business owners and continue to monitor the industry for the next two years for products with AI and ML capabilities.
PROVISION: DATA ACCESSIBILITY
Data accessibility involves packaging the data so it can be reused and shared as well as providing rules and access guidelines for the data. The accessibility of the data directly affects the organization's overall efficiency and collaboration. Data Provisioning is the critical aspect of Data Strategy and Data Management.
The ability to manage a high volume of data is critical to any company or government agency's success. Data is one of the most important assets for a company that does not show in any financial statement. Even with the emergence of data management functions and chief data officers (CDOs), most organizations continue to remain behind the curve. Studies show that on an average, less than half of an organization's structured data is actively used in decision making – and less than 1% of its unstructured data is analyzed or
used at all. More than half the organization may have access to data they should not, and 90% of analysts' time is spent simply discovering and preparing data. Unmanaged data sets propagate in silos, and the company's infrastructure and technology framework is not efficiently leveraged to meet the demand.
The most simple and effective way to manage data accessibility is through application programing interface (API). Recent developments in data management has reopened the need for middle-ware technologies to provision a secure data access API with a less code requirement. The zero-code approach accommodates change rapidly allowing businesses to scale without any technology constraint. Implementing a middleware technology framework does introduce a higher long-term maintenance cost and short-term configuration, build, and licensing cost.
The City of Philadelphia has more than 40 (forty) distinct data sets. Most of the datasets includes a spatial aspect. Each dataset is independent of other. The data ownership is managed as a collection or as a separate file (shape, geo database, Excel etc.,). Any organization with diverse disconnected data must start by creating a data access policy to include accessibility and classify the data by value and priority. Datasets with a high value and priority must have a restricted access control without compromising the ease of access for internal and external consumption.
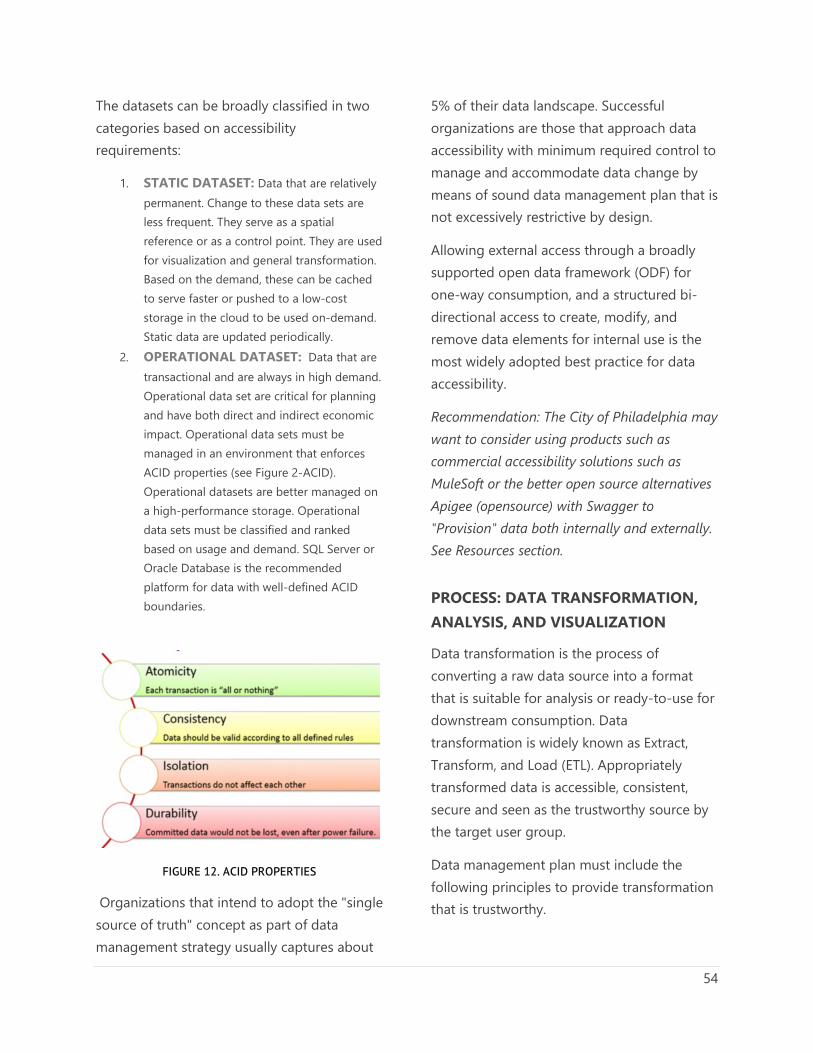
54
The datasets can be broadly classified in two categories based on accessibility requirements:
1. STATIC DATASET: Data that are relatively permanent. Change to these data sets are less frequent. They serve as a spatial reference or as a control point. They are used for visualization and general transformation. Based on the demand, these can be cached to serve faster or pushed to a low-cost storage in the cloud to be used on-demand. Static data are updated periodically.
2. OPERATIONAL DATASET: Data that are transactional and are always in high demand. Operational data set are critical for planning and have both direct and indirect economic impact. Operational data sets must be managed in an environment that enforces ACID properties (see Figure 2-ACID). Operational datasets are better managed on a high-performance storage. Operational data sets must be classified and ranked based on usage and demand. SQL Server or Oracle Database is the recommended platform for data with well-defined ACID boundaries.
FIGURE 12. ACID PROPERTIES
Organizations that intend to adopt the "single source of truth" concept as part of data management strategy usually captures about
5% of their data landscape. Successful organizations are those that approach data accessibility with minimum required control to manage and accommodate data change by means of sound data management plan that is not excessively restrictive by design.
Allowing external access through a broadly supported open data framework (ODF) for one-way consumption, and a structured bi-directional access to create, modify, and remove data elements for internal use is the most widely adopted best practice for data accessibility.
Recommendation: The City of Philadelphia may want to consider using products such as commercial accessibility solutions such as MuleSoft or the better open source alternatives Apigee (opensource) with Swagger to "Provision" data both internally and externally. See Resources section.
PROCESS: DATA TRANSFORMATION, ANALYSIS, AND VISUALIZATION
Data transformation is the process of converting a raw data source into a format that is suitable for analysis or ready-to-use for downstream consumption. Data transformation is widely known as Extract, Transform, and Load (ETL). Appropriately transformed data is accessible, consistent, secure and seen as the trustworthy source by the target user group.
Data management plan must include the following principles to provide transformation that is trustworthy.
55
• Data must be temporal. Every data set and every item in the data set must accommodate a timestamp.
• All data must be pre-processed to support seamless transformation. Any dataset that require more than one step to transform to accommodate the intended visualization is considered insufficient data set. Such datasets must be simplified.
• Auditability to ensure the datasets are versioned to track changes.
• Continually engage the user community to validate the usability of data.
• The data set must not loose its principle value when transformed from one form to another.
An example of data transformation is the mapping and conversion of data from one format to another. For example, extensible markup language (XML) format data can be transformed as is to a JavaScript object notation format (JSON), to a comma separated values (CSV) to a database or Microsoft Excel spreadsheet without losing any attributes. The data can be styled and visualized, and the business value and facts must not degenerate.
There are several data visualization solutions available in the industry today such as Power BI, RedShift, Sisense, Spotfire, and Tableau to name a few. A well-defined data management plan will accommodate all visualization products. It is in the organization's best interest to not define their data management and transformation objectives based on a predefined visualization platform.
Data that is prepared for transformation does not have to conform to ACID properties and therefore must not be transactional. They are periodically updated by the underlying engine to provide a consolidated view for user consumption. Data prepared for visualization must be isolated from operational data. These are static datasets (see section static dataset).
Static datasets are not transactional. They need to be viable, sustainable, and most importantly; flexible. Static datasets must fit the business needs and is not a cookie cutter one solution fits all. They support bulk-operations and are defined to have a simple recovery mode as part of the business continuity plan. The operational datasets depend on static datasets to supplement the context.
Recommendation: The most effective way to manage data transformation is to provide a self-service data analytics platform that can process the data within the boundaries of the enterprise data management plan. Products that can prep, blend, enrich, mashup, and analyze data, manage and deploy with predictive constraints induced modelling will foster better control over the organization's data asset. Commercially available products such as Alteryx or its opensource equivalent Rapidminer or SpagoBI in combination with R processing power will aid in better data transformation experience. See Resources section.
56
GOVERNANCE
Data Governance is all about how the data is handled within the enterprise from a business and systemic point of view. The governance plan ensures high quality throughout the lifecycle of the data. Data governance in an enterprise will dictate the outcome of a successful data management plan.
The process of managing the availability, accessibility, referential integrity and the overall access controls (security) of the data in the enterprise system that are based on internal data standards and policies to control the usage. Effective data governance guarantees that the data is consistent and trustworthy. Governance must be defined and implemented in a phased approach with a goal to attain a specific maturity level to foster continuous improvement.
The most effective way to define and implement data governance in an organization is to start with the most commonly accepted practice and formalize as a standardized approach. Implementing commercially off-the-shelf product to manage the governance is not the way to start or enforce data governance.
The City of Philadelphia must start with tagging data that is trustworthy. Any data originating from transactional enterprise system must be categorized as high-value-high-trust (hVhT) asset. A well-defined governance plan incorporates compliance and regulatory requirements to avoid penalty. The governance plan must include disconnected data set with mutually agreed integrity
constraints along with security and ownership boundaries. Assign data quality responsibilities to measure the data quality indicators (DQI) metrics. Data owners must collaborate with business units and infrastructure team to plan better by not having to clean and redefine the structure for each planning purposes. The governance must discourage re-work/duplication of trusted data assets by designing to serve multiple purposes.
STORAGE
While the storage may be cheaper, the cost of high-performance storage is measured by the efficiency of storage and information systems design. The latest innovation in storage technology has paved the way for storage to be designed as On-Premise and On-Cloud allowing the storage to be elastic, and movable in real-time with little or no downtime to normal business operations.
ON PREMISE DATA STORAGE
On-premise data storage consists of physical storage devices that are installed, configured, maintained, and administered by the customer.
Industry standard technologies include all-flash arrays, SSD arrays, and traditional HDD storage arrays.
SSD is rapidly becoming the 'standard' for data storage due to the speed and performance relative to traditional hard drive storage. In recent years, SSD costs have been
57
reduced greatly, assisting in adoption by enterprises.
All-flash arrays are a high-performance storage solution suitable for mission critical infrastructure where performance is key.
Traditional HDD storage can be utilized for long term storage and archival of data that does not require the higher performance of SSD or all-flash storage. For example, database backups, image archives, etc.
Physical security is controlled according to each customer's requirements, including regulatory or compliance requirements.
Benefits of on-premise storage arrays include:
• On-premise workloads requiring low latency to storage benefit from local storage arrays
• Costs can be lower based on flexible purchase or lease options
• Customers maintain physical control over the hardware
Challenges for enterprises related to on-premise storage hardware can include:
1. Maintaining firmware versions can introduce additional overhead in order to maintain security compliance
2. Forecasting storage needs can result in over-provisioning or under-provisioning, leading to ramifications for application delivery or budgets
3. Costs require capital expenditure
CLOUD DATA STORAGE
Please note: many references to AWS cloud products are provided as examples only. The major cloud providers all provide similar
functionality, and the cloud solution should be selected based on customers' specific requirements.
Cloud data storage is provided as a consumable service by cloud providers such as AWS, Azure, and Google Cloud, to name a few. Data is accessed via APIs or connection via direct connections to the cloud provider. Examples of this could be proprietary connections or VPN connections maintained by the customer or the cloud provider, depending on the solution adopted.
Storage classes include hot storage, cool storage, and archival storage.
Use cases for hot storage can include website hosting, content distribution, and data analytics.
Use cases for cool storage can include backups, disaster recovery, and other cases where data would not be used frequently.
Archival storage use cases can include long-term archival storage required for compliance or legal reasons. Archival storage is usually based on the need for multi-year archival at a low cost.
Benefits of cloud storage include:
1. Cloud storage scales to meet customer needs, and is consumed as needed
2. No forecasting of storage needs is required, as capacity is managed by the cloud provider
3. Data lifecycle management can be simplified, including storage tiering and expiration
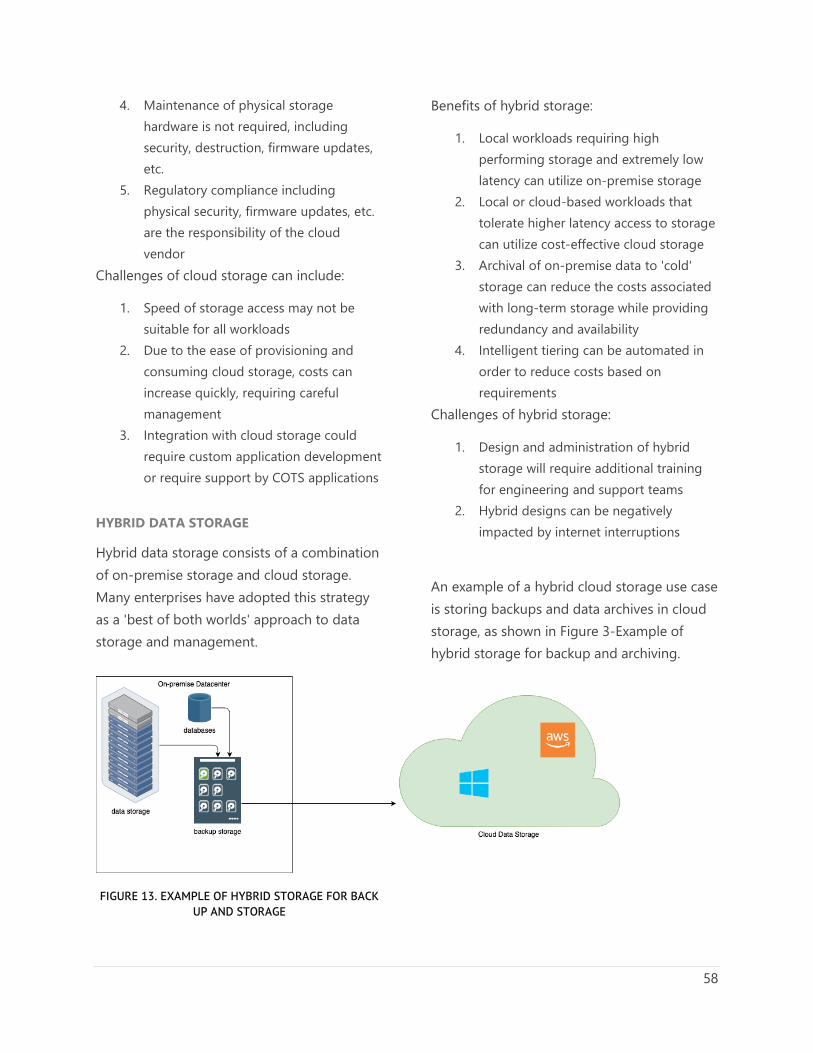
58
4. Maintenance of physical storage hardware is not required, including security, destruction, firmware updates, etc.
5. Regulatory compliance including physical security, firmware updates, etc. are the responsibility of the cloud vendor
Challenges of cloud storage can include:
1. Speed of storage access may not be suitable for all workloads
2. Due to the ease of provisioning and consuming cloud storage, costs can increase quickly, requiring careful management
3. Integration with cloud storage could require custom application development or require support by COTS applications
HYBRID DATA STORAGE
Hybrid data storage consists of a combination of on-premise storage and cloud storage. Many enterprises have adopted this strategy as a 'best of both worlds' approach to data storage and management.
Benefits of hybrid storage:
1. Local workloads requiring high performing storage and extremely low latency can utilize on-premise storage
2. Local or cloud-based workloads that tolerate higher latency access to storage can utilize cost-effective cloud storage
3. Archival of on-premise data to 'cold' storage can reduce the costs associated with long-term storage while providing redundancy and availability
4. Intelligent tiering can be automated in order to reduce costs based on requirements
Challenges of hybrid storage:
1. Design and administration of hybrid storage will require additional training for engineering and support teams
2. Hybrid designs can be negatively impacted by internet interruptions
An example of a hybrid cloud storage use case is storing backups and data archives in cloud storage, as shown in Figure 3-Example of hybrid storage for backup and archiving.
FIGURE 13. EXAMPLE OF HYBRID STORAGE FOR BACK UP AND STORAGE
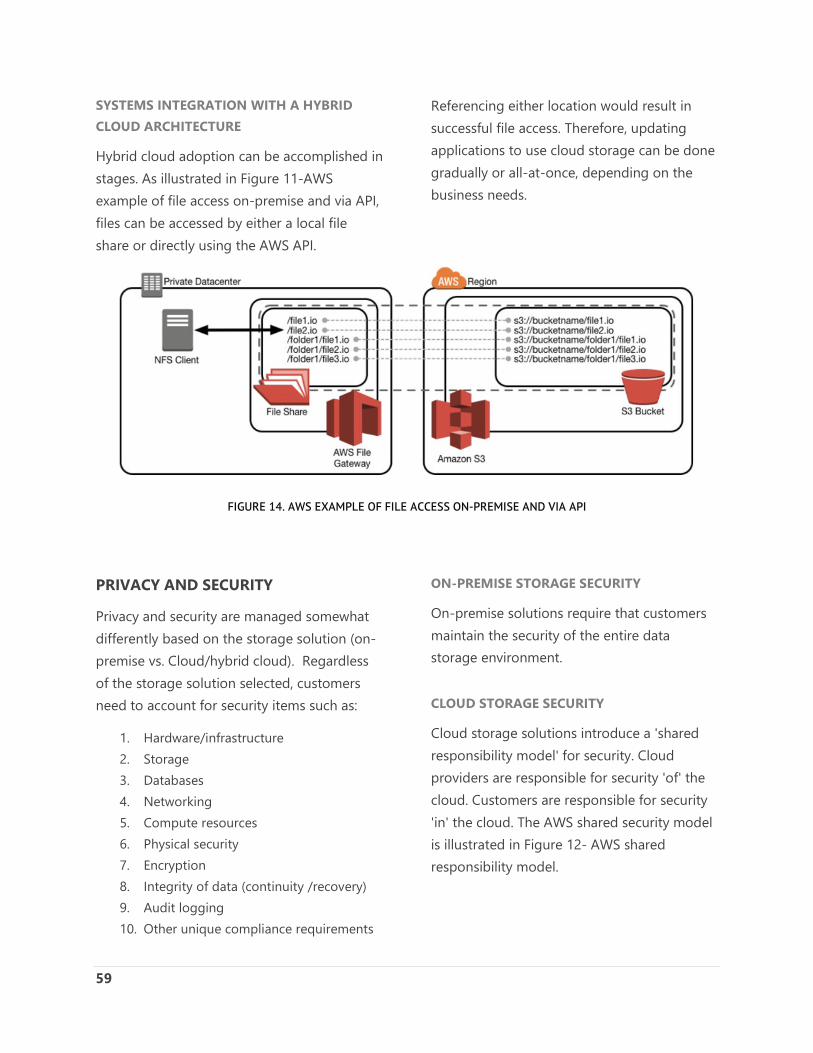
59
SYSTEMS INTEGRATION WITH A HYBRID CLOUD ARCHITECTURE
Hybrid cloud adoption can be accomplished in stages. As illustrated in Figure 11-AWS example of file access on-premise and via API, files can be accessed by either a local file share or directly using the AWS API.
Referencing either location would result in successful file access. Therefore, updating applications to use cloud storage can be done gradually or all-at-once, depending on the business needs.
FIGURE 14. AWS EXAMPLE OF FILE ACCESS ON-PREMISE AND VIA API
PRIVACY AND SECURITY
Privacy and security are managed somewhat differently based on the storage solution (on-premise vs. Cloud/hybrid cloud). Regardless of the storage solution selected, customers need to account for security items such as:
1. Hardware/infrastructure 2. Storage 3. Databases 4. Networking 5. Compute resources 6. Physical security 7. Encryption 8. Integrity of data (continuity /recovery) 9. Audit logging 10. Other unique compliance requirements
ON-PREMISE STORAGE SECURITY
On-premise solutions require that customers maintain the security of the entire data storage environment.
CLOUD STORAGE SECURITY
Cloud storage solutions introduce a 'shared responsibility model' for security. Cloud providers are responsible for security 'of' the cloud. Customers are responsible for security 'in' the cloud. The AWS shared security model is illustrated in Figure 12- AWS shared responsibility model.
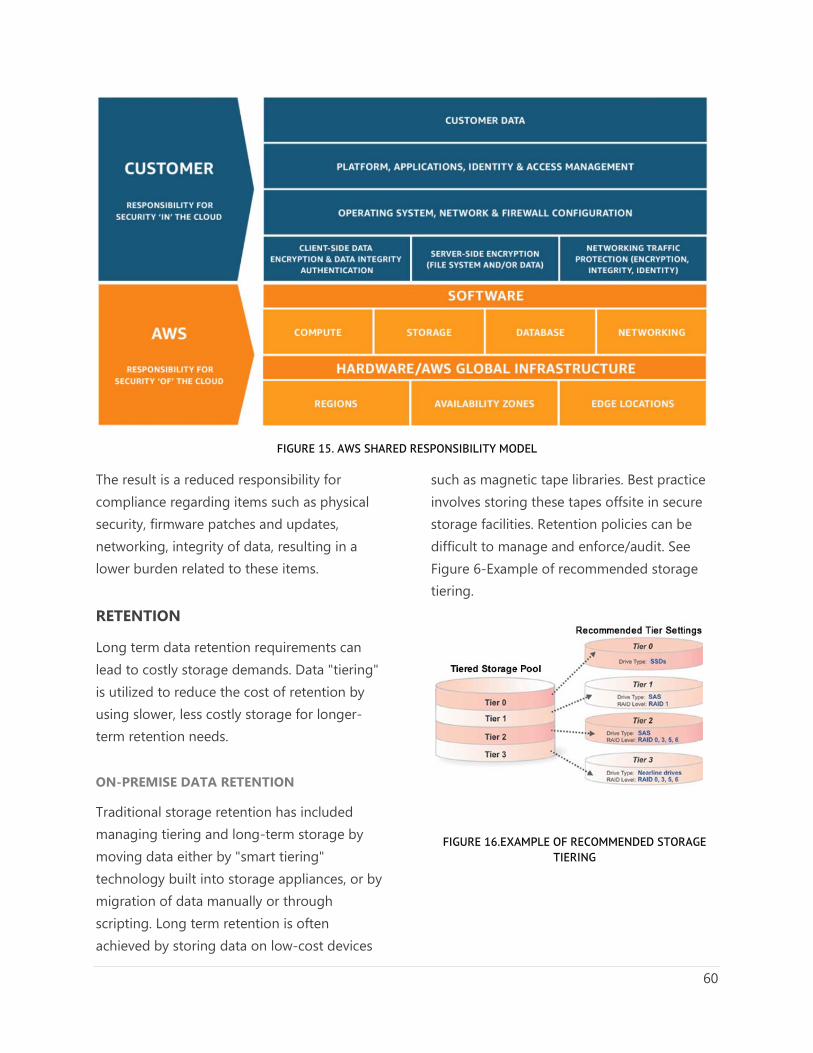
60
FIGURE 15. AWS SHARED RESPONSIBILITY MODEL
The result is a reduced responsibility for compliance regarding items such as physical security, firmware patches and updates, networking, integrity of data, resulting in a lower burden related to these items.
RETENTION
Long term data retention requirements can lead to costly storage demands. Data "tiering" is utilized to reduce the cost of retention by using slower, less costly storage for longer-term retention needs.
ON-PREMISE DATA RETENTION
Traditional storage retention has included managing tiering and long-term storage by moving data either by "smart tiering" technology built into storage appliances, or by migration of data manually or through scripting. Long term retention is often achieved by storing data on low-cost devices
such as magnetic tape libraries. Best practice involves storing these tapes offsite in secure storage facilities. Retention policies can be difficult to manage and enforce/audit. See Figure 6-Example of recommended storage tiering.
FIGURE 16.EXAMPLE OF RECOMMENDED STORAGE TIERING
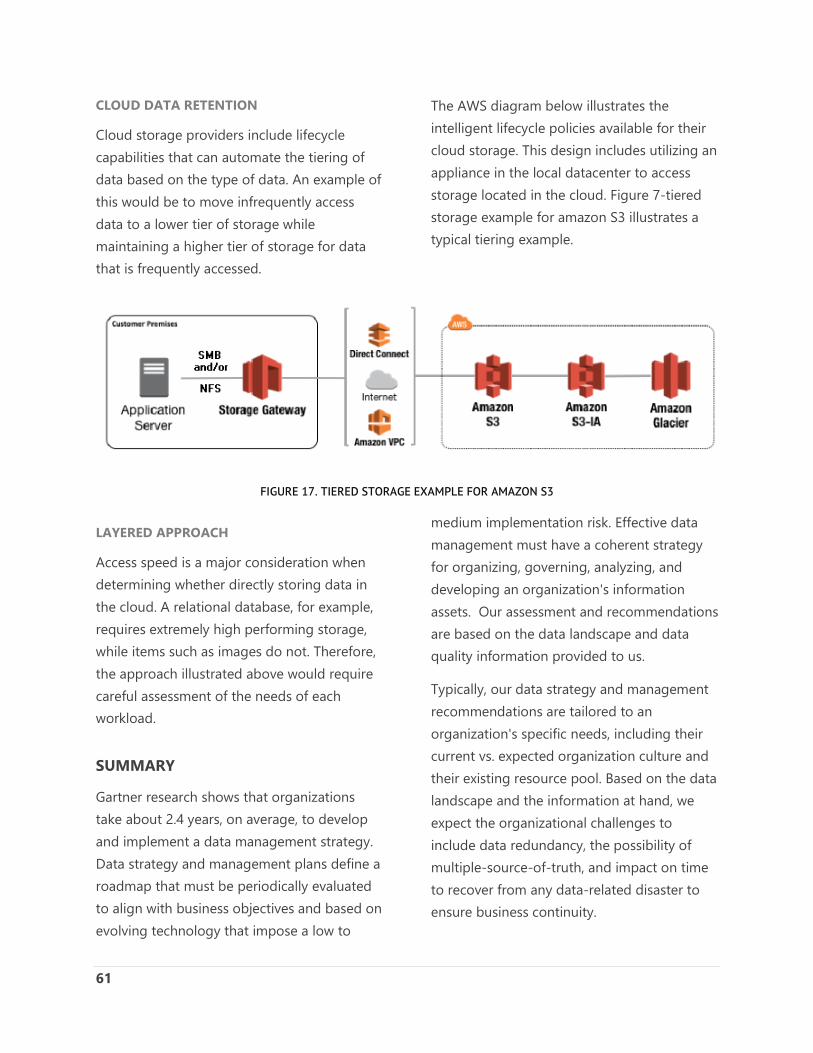
61
CLOUD DATA RETENTION
Cloud storage providers include lifecycle capabilities that can automate the tiering of data based on the type of data. An example of this would be to move infrequently access data to a lower tier of storage while maintaining a higher tier of storage for data that is frequently accessed.
The AWS diagram below illustrates the intelligent lifecycle policies available for their cloud storage. This design includes utilizing an appliance in the local datacenter to access storage located in the cloud. Figure 7-tiered storage example for amazon S3 illustrates a typical tiering example.
FIGURE 17. TIERED STORAGE EXAMPLE FOR AMAZON S3
LAYERED APPROACH
Access speed is a major consideration when determining whether directly storing data in the cloud. A relational database, for example, requires extremely high performing storage, while items such as images do not. Therefore, the approach illustrated above would require careful assessment of the needs of each workload.
SUMMARY
Gartner research shows that organizations take about 2.4 years, on average, to develop and implement a data management strategy. Data strategy and management plans define a roadmap that must be periodically evaluated to align with business objectives and based on evolving technology that impose a low to
medium implementation risk. Effective data management must have a coherent strategy for organizing, governing, analyzing, and developing an organization's information assets. Our assessment and recommendations are based on the data landscape and data quality information provided to us.
Typically, our data strategy and management recommendations are tailored to an organization's specific needs, including their current vs. expected organization culture and their existing resource pool. Based on the data landscape and the information at hand, we expect the organizational challenges to include data redundancy, the possibility of multiple-source-of-truth, and impact on time to recover from any data-related disaster to ensure business continuity.

62
The current data landscape needs to be governed and optimized. The best next actionable step to consider is to establish a governance team that includes the right mix of subject matter experts and business executives to create a strategic alignment. We have suggested a set of third-party products for consideration, and those need to be revisited based on existing and ongoing in-depth data analysis.